NRG ENERGY, INC.
10-Ks and 10-Qs
|
|
|
|
|
|
|
|
|
|
|
|
|
|
|
|
|
|
|
|
|
|
|
|
|
|
|
|
|
|
|
|
|
|
|
|
|
|
|
|
|
|
|
|
|
|
|
|
|
|
|
|
|
|
|
|
UNITED STATES SECURITIES AND EXCHANGE COMMISSION
Washington, D.C. 20549
FORM 10-Q
|
x
|
|
Quarterly report pursuant to Section 13 or 15(d) of the Securities Exchange Act of 1934
|
|
For the Quarterly Period Ended: September 30, 2015
|
||
|
o
|
Transition report pursuant to Section 13 or 15(d) of the Securities Exchange Act of 1934
|
|
Commission File Number: 001-15891
NRG Energy, Inc.
(Exact name of registrant as specified in its charter)
|
Delaware
(State or other jurisdiction
of incorporation or organization)
|
41-1724239
(I.R.S. Employer
Identification No.)
|
|
|
|
|
|
|
211 Carnegie Center, Princeton, New Jersey
(Address of principal executive offices)
|
08540
(Zip Code)
|
|
(609) 524-4500
(Registrant’s telephone number, including area code)
Indicate by check mark whether the registrant (1) has filed all reports required to be filed by Section 13 or 15(d) of the Securities Exchange Act of 1934 during the preceding 12 months (or for such shorter period that the registrant was required to file such reports), and (2) has been subject to such filing requirements for the past 90 days.
Yes
x
No
o
Indicate by check mark whether the registrant has submitted electronically and posted on its corporate Web site, if any, every Interactive Data File required to be submitted and posted pursuant to Rule 405 of Regulation S-T (§232.405 of this chapter) during the preceding 12 months (or for such shorter period that the registrant was required to submit and post such files).
Yes
x
No
o
Indicate by check mark whether the registrant is a large accelerated filer, an accelerated filer, a non-accelerated filer, or a smaller reporting company. See the definitions of “large accelerated filer,” “accelerated filer,” and “smaller reporting company” in Rule 12b-2 of the Exchange Act.
|
Large accelerated filer
x
|
Accelerated filer
o
|
Non-accelerated filer
o
|
Smaller reporting company
o
|
|||
|
(Do not check if a smaller reporting company)
|
||||||
Indicate by check mark whether the registrant is a shell company (as defined in Rule 12b-2 of the Exchange Act).
Yes
o
No
x
As of October 31, 2015, there were
314,176,328
shares of common stock outstanding, par value $0.01 per share.
1
TABLE OF CONTENTS
Index
2
CAUTIONARY STATEMENT REGARDING FORWARD-LOOKING INFORMATION
This Quarterly Report on Form 10-Q of NRG Energy, Inc., or NRG or the Company, includes forward-looking statements within the meaning of Section 27A of the Securities Act of 1933, as amended, or Securities Act, and Section 21E of the Securities Exchange Act of 1934, as amended, or Exchange Act. The words "believes," "projects," "anticipates," "plans," "expects," "intends," "estimates" and similar expressions are intended to identify forward-looking statements. These forward-looking statements involve known and unknown risks, uncertainties and other factors that may cause NRG's actual results, performance and achievements, or industry results, to be materially different from any future results, performance or achievements expressed or implied by such forward-looking statements. These factors, risks and uncertainties include the factors described under Item 1A —
Risk Factors Related to NRG Energy, Inc.
, in Part I, Item 1A of the Company's Annual Report on Form 10-K for the year ended
December 31, 2014
, and the following:
|
•
|
General economic conditions, changes in the wholesale power markets and fluctuations in the cost of fuel;
|
|
•
|
Volatile power supply costs and demand for power;
|
|
•
|
Hazards customary to the power production industry and power generation operations such as fuel and electricity price volatility, unusual weather conditions, catastrophic weather-related or other damage to facilities, unscheduled generation outages, maintenance or repairs, unanticipated changes to fuel supply costs or availability due to higher demand, shortages, transportation problems or other developments, environmental incidents, or electric transmission or gas pipeline system constraints and the possibility that NRG may not have adequate insurance to cover losses as a result of such hazards;
|
|
•
|
The effectiveness of NRG's risk management policies and procedures, and the ability of NRG's counterparties to satisfy their financial commitments;
|
|
•
|
Counterparties' collateral demands and other factors affecting NRG's liquidity position and financial condition;
|
|
•
|
NRG's ability to operate its businesses efficiently, manage capital expenditures and costs tightly, and generate earnings and cash flows from its asset-based businesses in relation to its debt and other obligations;
|
|
•
|
NRG's ability to enter into contracts to sell power and procure fuel on acceptable terms and prices;
|
|
•
|
The liquidity and competitiveness of commodities markets;
|
|
•
|
Government regulation, including compliance with regulatory requirements and changes in market rules, rates, tariffs and environmental laws and increased regulation of carbon dioxide and other GHG emissions;
|
|
•
|
Price mitigation strategies and other market structures employed by ISOs or RTOs that result in a failure to adequately compensate NRG's generation units for all of their costs;
|
|
•
|
NRG's ability to borrow additional funds and access capital markets, as well as NRG's substantial indebtedness and the possibility that NRG may incur additional indebtedness going forward;
|
|
•
|
NRG's ability to receive loan guarantees or cash grants to support development projects;
|
|
•
|
Operating and financial restrictions placed on NRG and its subsidiaries that are contained in the indentures governing NRG's outstanding notes, in NRG's Senior Credit Facility, and in debt and other agreements of certain of NRG subsidiaries and project affiliates generally;
|
|
•
|
Cyber terrorism and inadequate cybersecurity, or the occurrence of a catastrophic loss and the possibility that NRG may not have adequate insurance to cover losses resulting from such hazards or the inability of NRG's insurers to provide agreed upon coverage;
|
|
•
|
NRG's ability to develop and build new power generation facilities, including new renewable projects;
|
|
•
|
NRG's ability to implement its strategy;
|
|
•
|
NRG's ability to sell assets to NRG Yield, Inc. and to close drop-down transactions;
|
|
•
|
NRG's ability to achieve its strategy of regularly returning capital to stockholders;
|
|
•
|
NRG's ability to obtain and maintain retail market share;
|
|
•
|
NRG's ability to successfully evaluate investments and achieve intended financial results in new business and growth initiatives;
|
|
•
|
NRG's ability to successfully integrate, realize cost savings and manage any acquired businesses; and
|
|
•
|
NRG's ability to develop and maintain successful partnership relationships.
|
Forward-looking statements speak only as of the date they were made, and NRG undertakes no obligation to publicly update or revise any forward-looking statements, whether as a result of new information, future events or otherwise. The foregoing review of factors that could cause NRG's actual results to differ materially from those contemplated in any forward-looking statements included in this Quarterly Report on Form 10-Q should not be construed as exhaustive.
3
GLOSSARY OF TERMS
When the following terms and abbreviations appear in the text of this report, they have the meanings indicated below:
|
2014 Form 10-K
|
NRG’s Annual Report on Form 10-K for the year ended December 31, 2014
|
|
|
Alta Wind Assets
|
Seven wind facilities that total 947 MWs located in Tehachapi, California and a portfolio of land leases
|
|
|
ASC
|
The FASB Accounting Standards Codification, which the FASB established as the source of authoritative U.S. GAAP
|
|
|
ASU
|
Accounting Standards Updates, which reflect updates to the ASC
|
|
|
Average realized prices
|
Volume-weighted average power prices, net of average fuel costs and reflecting the impact of settled hedges
|
|
|
B2B
|
Business-to-business, which includes demand response, commodity sales, energy efficiency and energy management services
|
|
|
BACT
|
Best Available Control Technology
|
|
|
BTU
|
British Thermal Unit
|
|
|
Buffalo Bear
|
Buffalo Bear, LLC, the operating subsidiary of Tapestry Wind LLC, which owns the Buffalo Bear project
|
|
|
CAA
|
Clean Air Act
|
|
|
CAIR
|
Clean Air Interstate Rule
|
|
|
CAISO
|
California Independent System Operator
|
|
|
Capital Allocation Program
|
NRG's plan of allocating capital
between debt reduction, reinvestment
in the business, investment in acquisition opportunities, share
repurchases and shareholder dividends
|
|
|
CCF
|
Carbon Capture Facility
|
|
|
CCPI
|
Clean Coal Power Initiative
|
|
|
CDD
|
Cooling Degree Day
|
|
|
CDFW
|
California Department of Fish and Wildlife
|
|
|
CEC
|
California Energy Commission
|
|
|
CenterPoint
|
CenterPoint Energy, Inc. and its subsidiaries, on and after August 31, 2002, and Reliant Energy, Incorporated and its subsidiaries prior to August 31, 2002
|
|
|
CFTC
|
U.S. Commodity Futures Trading Commission
|
|
|
C&I
|
Commercial, Industrial and Governmental/Institutional
|
|
|
COD
|
Commercial Operation Date
|
|
|
ComEd
|
Commonwealth Edison
|
|
|
CPS
|
Combined Pollutant Standard
|
|
|
CPUC
|
California Public Utilities Commission
|
|
|
CSAPR
|
Cross-State Air Pollution Rule
|
|
|
CVSR
|
California Solar Valley Ranch
|
|
|
CWA
|
Clean Water Act
|
|
|
D.C. Circuit
|
U.S. Court of Appeals for the District of Columbia Circuit
|
|
|
DGPV Holdco
|
NRG DGPV Holdco 1 LLC
|
|
|
Direct Energy
|
Direct Energy Business Marketing, LLC
|
|
|
Discrete Customers
|
Customers measured by unit sales of one-time products or services, such as connected home thermostats, portable solar products and portable battery solutions
|
|
|
Distributed Solar
|
Solar power projects that primarily sell power produced to customers for usage on site, or are interconnected to sell power into the local distribution grid
|
|
|
Dominion
|
Dominion Resources, Inc.
|
|
|
Drop Down Assets
|
Collectively, the June 2014 Drop Down Assets and the January 2015 Drop Down Assets
|
|
|
DSI
|
Dry Sorbent Injection with Trona
|
|
4
|
Economic gross margin
|
Sum of energy revenue, capacity revenue, retail revenue and other revenue, less cost of sales
|
|
|
EME
|
Edison Mission Energy
|
|
|
Energy Plus Holdings
|
Energy Plus Holdings LLC and Energy Plus Natural Gas LLC
|
|
|
EPA
|
U.S. Environmental Protection Agency
|
|
|
ERCOT
|
Electric Reliability Council of Texas, the Independent System Operator and the regional reliability coordinator of the various electricity systems within Texas
|
|
|
ESP
|
Electrostatic Precipitator
|
|
|
ESPP
|
NRG Energy, Inc. Amended and Restated Employee Stock Purchase Plan
|
|
|
Exchange Act
|
The Securities Exchange Act of 1934, as amended
|
|
|
FASB
|
Financial Accounting Standards Board
|
|
|
FCM
|
Forward Capacity Market
|
|
|
FERC
|
Federal Energy Regulatory Commission
|
|
|
FPA
|
Federal Power Act
|
|
|
FTRs
|
Financial Transmission Rights
|
|
|
GenConn
|
GenConn Energy LLC
|
|
|
GenOn
|
GenOn Energy, Inc.
|
|
|
GenOn Americas Generation
|
GenOn Americas Generation, LLC
|
|
|
GenOn Americas Generation Senior Notes
|
GenOn Americas Generation's $850 million outstanding unsecured senior notes consisting of $450 million of 8.50% senior notes due 2021 and $400 million of 9.125% senior notes due 2031
|
|
|
GenOn Mid-Atlantic
|
GenOn Mid-Atlantic, LLC and, except where the context indicates otherwise, its subsidiaries, which include the coal generation units at the Dickerson and Morgantown generating facilities under operating leases
|
|
|
GenOn Senior Notes
|
GenOn's $2.0 billion outstanding unsecured senior notes consisting of $725 million of 7.875% senior notes due 2017, $675 million of 9.5% senior notes due 2018, and $550 million of 9.875% senior notes due 2020
|
|
|
GHG
|
Greenhouse Gases
|
|
|
GWh
|
Gigawatt Hour
|
|
|
HAPs
|
Hazardous Air Pollutants
|
|
|
HDD
|
Heating Degree Day
|
|
|
Heat Rate
|
A measure of thermal efficiency computed by dividing the total BTU content of the fuel burned by the resulting kWhs generated. Heat rates can be expressed as either gross or net heat rates, depending whether the electricity output measured is gross or net generation and is generally expressed as BTU per net kWh
|
|
|
High Desert
|
TA - High Desert, LLC, which owns the High Desert project
|
|
|
IASB
|
Independent Accounting Standards Board
|
|
|
ICAP
|
New York Installed Capacity
|
|
|
IFRS
|
International Financial Reporting Standards
|
|
|
IL CPS
|
Illinois Combined Pollutant Standard
|
|
|
ILU
|
Illinois Union Insurance Company
|
|
|
IPPNY
|
Independent Power Producers of New York
|
|
|
ISO
|
Independent System Operator
|
|
|
January 2015 Drop Down Assets
|
The Laredo Ridge, Tapestry and Walnut Creek projects, which were sold to NRG Yield, Inc. on January 2, 2015
|
|
|
June 2014 Drop Down Assets
|
The High Desert, Kansas South and El Segundo projects, which were sold to NRG Yield, Inc. on June 30, 2014
|
|
|
JX Nippon
|
JX Nippon Oil Exploration (EOR) Limited
|
|
|
Kansas South
|
NRG Solar Kansas South LLC, which owns the Kansas South project
|
|
|
kV
|
Kilovolts
|
|
|
kWh
|
Kilowatt-hours
|
|
5
|
LA DEQ
|
Louisiana Department of Environmental Quality
|
|
|
LaGen
|
Louisiana Generating LLC
|
|
|
Laredo Ridge
|
Laredo Ridge Wind, LLC, the operating subsidiary of Mission Wind Laredo, LLC, which owns the Laredo Ridge project
|
|
|
LIBOR
|
London Inter-Bank Offered Rate
|
|
|
LTIPs
|
Collectively, the NRG Long-Term Incentive Plan and the NRG GenOn Long-Term Incentive Plan
|
|
|
Mass
|
Residential and Small Business
|
|
|
MATS
|
Mercury and Air Toxics Standards promulgated by the EPA
|
|
|
MDE
|
Maryland Department of the Environment
|
|
|
Midwest Generation
|
Midwest Generation, LLC
|
|
|
MISO
|
Midcontinent Independent System Operator, Inc.
|
|
|
MMBtu
|
Million British Thermal Units
|
|
|
MW
|
Megawatt
|
|
|
MWh
|
Saleable megawatt hours, net of internal/parasitic load megawatt-hours
|
|
|
MWt
|
Megawatts Thermal Equivalent
|
|
|
NAAQS
|
National Ambient Air Quality Standards
|
|
|
NEPOOL
|
New England Power Pool
|
|
|
NERC
|
North American Electric Reliability Corporation
|
|
|
Net Exposure
|
Counterparty credit exposure to NRG, net of collateral
|
|
|
NextEra
|
NextEra Energy Resources, LLC
|
|
|
NOL
|
Net Operating Loss
|
|
|
NO
x
|
Nitrogen Oxide
|
|
|
NPDES
|
National Pollutant Discharge Elimination System
|
|
|
NPNS
|
Normal Purchase Normal Sale
|
|
|
NRC
|
U.S. Nuclear Regulatory Commission
|
|
|
NRG
|
NRG Energy, Inc.
|
|
|
NRG Marsh Landing
|
NRG Marsh Landing, LLC
|
|
|
NRG Wind TE Holdco
|
NRG Wind TE Holdco LLC
|
|
|
NRG Yield
|
Reporting segment that includes the projects held by NRG Yield, Inc.
|
|
|
NRG Yield, Inc.
|
NRG Yield, Inc., the owner of 53.3% of NRG Yield LLC with a controlling interest, and issuer of publicly held shares of Class A and Class C common stock
|
|
|
NSR
|
New Source Review
|
|
|
Nuclear Decommissioning Trust Fund
|
NRG's nuclear decommissioning trust fund assets, which are for the Company's portion of the decommissioning of the STP, units 1 & 2
|
|
|
NYAG
|
State of New York Office of Attorney General
|
|
|
NYISO
|
New York Independent System Operator
|
|
|
NYPA
|
New York Power Authority
|
|
|
NYSPSC
|
New York State Public Service Commission
|
|
|
OCI
|
Other Comprehensive Income/(Loss)
|
|
|
Peaking
|
Units expected to satisfy demand requirements during the periods of greatest or peak load on the system
|
|
|
PG&E
|
Pacific Gas and Electric Company
|
|
|
Pinnacle
|
Pinnacle Wind, LLC, the operating subsidiary of Tapestry Wind LLC, which owns the Pinnacle project
|
|
|
PJM
|
PJM Interconnection, LLC
|
|
|
PM
|
Particulate Matter
|
|
|
POJO
|
Powerton and Joliet, of which the Company leases 100% interests in Unit 7 and Unit 8 of the Joliet generating facility and the Powerton generating facility, through Midwest Generation
|
|
6
|
PPA
|
Power Purchase Agreement
|
|
|
PPTA
|
Power Purchase Tolling Agreement
|
|
|
PSCs
|
Public Service Commissions
|
|
|
PSD
|
Prevention of Significant Deterioration
|
|
|
PUCT
|
Public Utility Commission of Texas
|
|
|
RCRA
|
Resource Conservation and Recovery Act of 1976
|
|
|
RDS
|
Roof Diagnostics Solar
|
|
|
Recurring Customers
|
Customers that subscribe to one or more recurring services, such as electricity, natural gas and protection products, the majority of which are retail electricity customers in Texas and the Northeast
|
|
|
REMA
|
NRG REMA LLC, which leases a 100% interest in the Shawville generating facility and 16.7% and 16.5% interests in the Keystone and Conemaugh generating facilities, respectively
|
|
|
Repowering
|
Technologies utilized to replace, rebuild, or redevelop major portions of an existing electrical generating facility, generally to achieve a substantial emissions reduction, increase facility capacity, and improve system efficiency
|
|
|
Revolving Credit Facility
|
The Company's $2.5 billion revolving credit facility due 2018, a component of the Senior Credit Facility
|
|
|
RFP
|
Request For Proposal
|
|
|
RGGI
|
Regional Greenhouse Gas Initiative
|
|
|
Right of First Offer Agreement
|
Amended and Restated Right of First Offer Agreement by and between NRG Energy, Inc. and NRG Yield, Inc.
|
|
|
RMR
|
Reliability Must-Run
|
|
|
RPM
|
Reliability Pricing Model
|
|
|
RPV Holdco
|
NRG RPV Holdco 1 LLC
|
|
|
RSSA
|
Reliability Support Services Agreement
|
|
|
RTO
|
Regional Transmission Organization
|
|
|
Sabine
|
Sabine Cogen, L.P.
|
|
|
SCE
|
Southern California Edison
|
|
|
SCR
|
Selective Catalytic Reduction Control System
|
|
|
SDG&E
|
San Diego Gas & Electric
|
|
|
SEC
|
U.S. Securities and Exchange Commission
|
|
|
Senior Credit Facility
|
NRG's senior secured facility, comprised of the Term Loan Facility and the Revolving Credit Facility
|
|
|
Senior Notes
|
The Company’s $6.4 billion outstanding unsecured senior notes, consisting of $1.1 billion of 7.625% senior notes due 2018, $1.1 billion of 8.25% senior notes due 2020, $1.1 billion of 7.875% senior notes due 2021, $1.1 billion of 6.25% senior notes due 2022, $990 million of 6.625% senior notes due 2023, and $1.0 billion of 6.25% senior notes due 2024
|
|
|
SF6
|
Sulfur Hexafluoride
|
|
|
SO
2
|
Sulfur Dioxide
|
|
|
STP
|
South Texas Project — nuclear generating facility located near Bay City, Texas in which NRG owns a 44% interest
|
|
|
SunPower
|
SunPower Corporation, Systems
|
|
|
Taloga
|
Taloga Wind, LLC, the operating subsidiary of Tapestry Wind LLC, which owns the Taloga project
|
|
|
TCPA
|
Telephone Consumer Protection Act
|
|
|
Term Loan Facility
|
The Company's $2.0 billion term loan facility due 2018, a component of the Senior Credit Facility
|
|
|
U.S.
|
United States of America
|
|
|
U.S. DOE
|
U.S. Department of Energy
|
|
|
U.S. GAAP
|
Accounting principles generally accepted in the U.S.
|
|
7
|
Utility Scale Solar
|
Solar power projects, typically 20 MW or greater in size (on an alternating current basis), that are interconnected into the transmission or distribution grid to sell power at a wholesale level
|
|
|
VaR
|
Value at Risk
|
|
|
VIE
|
Variable Interest Entity
|
|
|
Walnut Creek
|
NRG Walnut Creek, LLC, the operating subsidiary of WCEP Holdings, LLC, which owns the Walnut Creek project
|
|
|
Yield Operating
|
NRG Yield Operating LLC
|
|
8
NRG ENERGY, INC. AND SUBSIDIARIES
(Unaudited)
|
Three months ended September 30,
|
Nine months ended September 30,
|
||||||||||||||
|
(In millions, except for per share amounts)
|
2015
|
2014
|
2015
|
2014
|
|||||||||||
|
Operating Revenues
|
|||||||||||||||
|
Total operating revenues
|
$
|
4,431
|
|
$
|
4,569
|
|
$
|
11,654
|
|
$
|
11,676
|
|
|||
|
Operating Costs and Expenses
|
|||||||||||||||
|
Cost of operations
|
3,034
|
|
3,278
|
|
8,530
|
|
8,843
|
|
|||||||
|
Depreciation and amortization
|
382
|
|
375
|
|
1,173
|
|
1,096
|
|
|||||||
|
Impairment losses
|
263
|
|
|
70
|
|
263
|
|
|
70
|
|
|||||
|
Selling, general and administrative
|
332
|
|
258
|
|
886
|
|
737
|
|
|||||||
|
Acquisition-related transaction and integration costs
|
3
|
|
17
|
|
16
|
|
69
|
|
|||||||
|
Development activity expenses
|
38
|
|
22
|
|
113
|
|
62
|
|
|||||||
|
Total operating costs and expenses
|
4,052
|
|
4,020
|
|
10,981
|
|
10,877
|
|
|||||||
|
Gain on postretirement benefits curtailment and sale of assets
|
—
|
|
|
—
|
|
14
|
|
|
19
|
|
|||||
|
Operating Income
|
379
|
|
549
|
|
687
|
|
818
|
|
|||||||
|
Other Income/(Expense)
|
|||||||||||||||
|
Equity in earnings of unconsolidated affiliates
|
24
|
|
|
18
|
|
29
|
|
|
39
|
|
|||||
|
Other income/(expense), net
|
4
|
|
|
(3
|
)
|
27
|
|
|
13
|
|
|||||
|
Loss on debt extinguishment
|
(2
|
)
|
|
(13
|
)
|
(9
|
)
|
|
(94
|
)
|
|||||
|
Interest expense
|
(291
|
)
|
|
(280
|
)
|
(855
|
)
|
|
(809
|
)
|
|||||
|
Total other expense
|
(265
|
)
|
(278
|
)
|
(808
|
)
|
(851
|
)
|
|||||||
|
Income/(Loss) Before Income Taxes
|
114
|
|
271
|
|
(121
|
)
|
(33
|
)
|
|||||||
|
Income tax expense/(benefit)
|
47
|
|
|
89
|
|
|
(43
|
)
|
|
(68
|
)
|
||||
|
Net Income/(Loss)
|
67
|
|
182
|
|
(78
|
)
|
35
|
|
|||||||
|
Less: Net income/(loss) attributable to noncontrolling interest and redeemable noncontrolling interests
|
1
|
|
|
14
|
|
(10
|
)
|
|
20
|
|
|||||
|
Net Income/(Loss) Attributable to NRG Energy, Inc.
|
66
|
|
168
|
|
(68
|
)
|
15
|
|
|||||||
|
Dividends for preferred shares
|
5
|
|
2
|
|
15
|
|
7
|
|
|||||||
|
Income/(Loss) Available for Common Stockholders
|
$
|
61
|
|
$
|
166
|
|
$
|
(83
|
)
|
$
|
8
|
|
|||
|
Earnings/(Loss) per Share Attributable to NRG Energy, Inc. Common Stockholders
|
|||||||||||||||
|
Weighted average number of common shares outstanding — basic
|
331
|
|
338
|
|
334
|
|
333
|
|
|||||||
|
Earnings/(Loss) per Weighted Average Common Share — Basic
|
$
|
0.18
|
|
$
|
0.49
|
|
$
|
(0.25
|
)
|
$
|
0.02
|
|
|||
|
Weighted average number of common shares outstanding — diluted
|
332
|
|
343
|
|
334
|
|
338
|
|
|||||||
|
Earnings/(Loss) per Weighted Average Common Share — Diluted
|
$
|
0.18
|
|
$
|
0.48
|
|
$
|
(0.25
|
)
|
$
|
0.02
|
|
|||
|
Dividends Per Common Share
|
$
|
0.15
|
|
$
|
0.14
|
|
$
|
0.44
|
|
$
|
0.40
|
|
|||
See accompanying notes to condensed consolidated financial statements.
9
NRG ENERGY, INC. AND SUBSIDIARIES
CONDENSED CONSOLIDATED STATEMENTS OF COMPREHENSIVE INCOME/(LOSS)
(Unaudited)
|
Three months ended September 30,
|
Nine months ended September 30,
|
||||||||||||||
|
2015
|
2014
|
2015
|
2014
|
||||||||||||
|
(In millions)
|
|||||||||||||||
|
Net Income/(Loss)
|
$
|
67
|
|
$
|
182
|
|
$
|
(78
|
)
|
$
|
35
|
|
|||
|
Other Comprehensive Income/(Loss), net of tax
|
|||||||||||||||
|
Unrealized (loss)/gain on derivatives, net of income tax (benefit)/expense of $(12), $4, $(6) and $(11)
|
(6
|
)
|
|
4
|
|
(2
|
)
|
(24
|
)
|
||||||
|
Foreign currency translation adjustments, net of income tax benefit of $(5), $(6), $(6) and $(2)
|
(8
|
)
|
(6
|
)
|
(10
|
)
|
(3
|
)
|
|||||||
|
Available-for-sale securities, net of income tax expense/(benefit) of $6, $(1), $1 and $0
|
(7
|
)
|
(2
|
)
|
(11
|
)
|
2
|
|
|||||||
|
Defined benefit plans, net of tax expense/(benefit) of $2, $0, $6 and $(7)
|
3
|
|
(3
|
)
|
9
|
|
9
|
|
|||||||
|
Other comprehensive loss
|
(18
|
)
|
(7
|
)
|
(14
|
)
|
(16
|
)
|
|||||||
|
Comprehensive Income/(Loss)
|
49
|
|
175
|
|
(92
|
)
|
19
|
|
|||||||
|
Less: Comprehensive (loss)/income attributable to noncontrolling interest and redeemable noncontrolling interests
|
(17
|
)
|
17
|
|
(34
|
)
|
14
|
|
|||||||
|
Comprehensive Income/(Loss) Attributable to NRG Energy, Inc.
|
66
|
|
158
|
|
(58
|
)
|
5
|
|
|||||||
|
Dividends for preferred shares
|
5
|
|
2
|
|
15
|
|
7
|
|
|||||||
|
Comprehensive Income/(Loss) Available for Common Stockholders
|
$
|
61
|
|
$
|
156
|
|
$
|
(73
|
)
|
$
|
(2
|
)
|
|||
See accompanying notes to condensed consolidated financial statements.
10
NRG ENERGY, INC. AND SUBSIDIARIES
|
September 30, 2015
|
December 31, 2014
|
||||||
|
(In millions, except shares)
|
(unaudited)
|
|
|||||
|
ASSETS
|
|
|
|||||
|
Current Assets
|
|
|
|||||
|
Cash and cash equivalents
|
$
|
2,265
|
|
|
$
|
2,116
|
|
|
Funds deposited by counterparties
|
68
|
|
72
|
|
|||
|
Restricted cash
|
497
|
|
|
457
|
|
||
|
Accounts receivable — trade, less allowance for doubtful accounts of $26 and $23
|
1,492
|
|
1,322
|
|
|||
|
Inventory
|
1,149
|
|
1,247
|
|
|||
|
Derivative instruments
|
1,580
|
|
2,425
|
|
|||
|
Cash collateral paid in support of energy risk management activities
|
367
|
|
187
|
|
|||
|
Deferred income taxes
|
169
|
|
174
|
|
|||
|
Renewable energy grant receivable, net
|
26
|
|
135
|
|
|||
|
Prepayments and other current assets
|
460
|
|
447
|
|
|||
|
Total current assets
|
8,073
|
|
8,582
|
|
|||
|
Property, plant and equipment, net of accumulated depreciation of $8,969 and $7,890
|
21,985
|
|
22,367
|
|
|||
|
Other Assets
|
|
|
|||||
|
Equity investments in affiliates
|
1,068
|
|
771
|
|
|||
|
Notes receivable, less current portion
|
62
|
|
72
|
|
|||
|
Goodwill
|
2,503
|
|
2,574
|
|
|||
|
Intangible assets, net of accumulated amortization of $1,590 and $1,402
|
2,371
|
|
2,567
|
|
|||
|
Nuclear decommissioning trust fund
|
551
|
|
585
|
|
|||
|
Derivative instruments
|
522
|
|
|
480
|
|
||
|
Deferred income taxes
|
1,427
|
|
1,406
|
|
|||
|
Other non-current assets
|
1,426
|
|
1,261
|
|
|||
|
Total other assets
|
9,930
|
|
9,716
|
|
|||
|
Total Assets
|
$
|
39,988
|
|
$
|
40,665
|
|
|
|
LIABILITIES AND STOCKHOLDERS’ EQUITY
|
|
|
|||||
|
Current Liabilities
|
|
|
|||||
|
Current portion of long-term debt and capital leases
|
$
|
457
|
|
|
$
|
474
|
|
|
Accounts payable
|
1,173
|
|
1,060
|
|
|||
|
Derivative instruments
|
1,416
|
|
|
2,054
|
|
||
|
Cash collateral received in support of energy risk management activities
|
68
|
|
72
|
|
|||
|
Accrued expenses and other current liabilities
|
1,222
|
|
1,199
|
|
|||
|
Total current liabilities
|
4,336
|
|
4,859
|
|
|||
|
Other Liabilities
|
|
|
|||||
|
Long-term debt and capital leases
|
19,598
|
|
|
19,900
|
|
||
|
Nuclear decommissioning reserve
|
322
|
|
310
|
|
|||
|
Nuclear decommissioning trust liability
|
280
|
|
333
|
|
|||
|
Deferred income taxes
|
20
|
|
21
|
|
|||
|
Derivative instruments
|
619
|
|
|
438
|
|
||
|
Out-of-market contracts, net of accumulated amortization of $639 and $562
|
1,168
|
|
1,244
|
|
|||
|
Other non-current liabilities
|
1,478
|
|
1,574
|
|
|||
|
Total non-current liabilities
|
23,485
|
|
|
23,820
|
|
||
|
Total Liabilities
|
27,821
|
|
28,679
|
|
|||
|
2.822% convertible perpetual preferred stock
|
299
|
|
291
|
|
|||
|
Redeemable noncontrolling interest in subsidiaries
|
29
|
|
19
|
|
|||
|
Commitments and Contingencies
|
|||||||
|
Stockholders’ Equity
|
|
||||||
|
Common stock
|
4
|
|
4
|
|
|||
|
Additional paid-in capital
|
8,382
|
|
8,327
|
|
|||
|
Retained earnings
|
3,358
|
|
3,588
|
|
|||
|
Less treasury stock, at cost — 97,190,988 and 78,843,552 shares, respectively
|
(2,330
|
)
|
(1,983
|
)
|
|||
|
Accumulated other comprehensive loss
|
(188
|
)
|
(174
|
)
|
|||
|
Noncontrolling interest
|
2,613
|
|
1,914
|
|
|||
|
Total Stockholders’ Equity
|
11,839
|
|
11,676
|
|
|||
|
Total Liabilities and Stockholders’ Equity
|
$
|
39,988
|
|
$
|
40,665
|
|
|
See accompanying notes to condensed consolidated financial statements.
11
NRG ENERGY, INC. AND SUBSIDIARIES
(Unaudited)
|
Nine months ended September 30,
|
|||||||
|
2015
|
2014
|
||||||
|
(In millions)
|
|||||||
|
Cash Flows from Operating Activities
|
|||||||
|
Net (Loss)/Income
|
$
|
(78
|
)
|
$
|
35
|
|
|
|
Adjustments to reconcile net loss to net cash provided by operating activities:
|
|
||||||
|
Distributions and equity in earnings of unconsolidated affiliates
|
28
|
|
32
|
|
|||
|
Depreciation and amortization
|
1,173
|
|
1,096
|
|
|||
|
Provision for bad debts
|
49
|
|
49
|
|
|||
|
Amortization of nuclear fuel
|
36
|
|
33
|
|
|||
|
Amortization of financing costs and debt discount/premiums
|
(9
|
)
|
(9
|
)
|
|||
|
Adjustment for debt extinguishment
|
9
|
|
24
|
|
|||
|
Amortization of intangibles and out-of-market contracts
|
68
|
|
52
|
|
|||
|
Amortization of unearned equity compensation
|
37
|
|
32
|
|
|||
|
Changes in deferred income taxes and liability for uncertain tax benefits
|
(72
|
)
|
(75
|
)
|
|||
|
Changes in nuclear decommissioning trust liability
|
1
|
|
12
|
|
|||
|
Changes in derivative instruments
|
180
|
|
248
|
|
|||
|
Changes in collateral deposits supporting energy risk management activities
|
(180
|
)
|
(100
|
)
|
|||
|
Loss on sale of emission allowances
|
(6
|
)
|
2
|
|
|||
|
Gain on postretirement benefits curtailment and sale of assets
|
(14
|
)
|
(26
|
)
|
|||
|
Impairment losses
|
263
|
|
70
|
|
|||
|
Cash used by changes in other working capital
|
(93
|
)
|
(361
|
)
|
|||
|
Net Cash Provided by Operating Activities
|
1,392
|
|
|
1,114
|
|
||
|
Cash Flows from Investing Activities
|
|
|
|||||
|
Acquisitions of businesses, net of cash acquired
|
(31
|
)
|
(2,832
|
)
|
|||
|
Capital expenditures
|
(889
|
)
|
(675
|
)
|
|||
|
Increase in restricted cash, net
|
(41
|
)
|
(52
|
)
|
|||
|
Decrease in restricted cash to support equity requirements for U.S. DOE funded projects
|
1
|
|
21
|
|
|||
|
Decrease in notes receivable
|
10
|
|
21
|
|
|||
|
Investments in nuclear decommissioning trust fund securities
|
(500
|
)
|
(475
|
)
|
|||
|
Proceeds from the sale of nuclear decommissioning trust fund securities
|
499
|
|
|
463
|
|
||
|
Proceeds from renewable energy grants and state rebates
|
62
|
|
431
|
|
|||
|
Proceeds from sale of assets, net of cash disposed of
|
1
|
|
153
|
|
|||
|
Cash proceeds to fund cash grant bridge loan payment
|
—
|
|
57
|
|
|||
|
Investments in unconsolidated affiliates
|
(357
|
)
|
(87
|
)
|
|||
|
Other
|
13
|
|
17
|
|
|||
|
Net Cash Used by Investing Activities
|
(1,232
|
)
|
|
(2,958
|
)
|
||
|
Cash Flows from Financing Activities
|
|
|
|||||
|
Payment of dividends to common and preferred stockholders
|
(152
|
)
|
(140
|
)
|
|||
|
Payment for treasury stock
|
(353
|
)
|
—
|
|
|||
|
Net receipts from/(payments for) settlement of acquired derivatives that include financing elements
|
138
|
|
(64
|
)
|
|||
|
Proceeds from issuance of long-term debt
|
679
|
|
4,456
|
|
|||
|
Distributions from, net of contributions to, noncontrolling interest in subsidiaries
|
651
|
|
639
|
|
|||
|
Proceeds from issuance of common stock
|
1
|
|
15
|
|
|||
|
Payment of debt issuance costs
|
(14
|
)
|
(57
|
)
|
|||
|
Payments for short and long-term debt
|
(954
|
)
|
(3,308
|
)
|
|||
|
Other
|
(22
|
)
|
—
|
|
|||
|
Net Cash (Used)/Provided by Financing Activities
|
(26
|
)
|
|
1,541
|
|
||
|
Effect of exchange rate changes on cash and cash equivalents
|
15
|
|
2
|
|
|||
|
Net Increase/ (Decrease) in Cash and Cash Equivalents
|
149
|
|
(301
|
)
|
|||
|
Cash and Cash Equivalents at Beginning of Period
|
2,116
|
|
2,254
|
|
|||
|
Cash and Cash Equivalents at End of Period
|
$
|
2,265
|
|
$
|
1,953
|
|
|
See accompanying notes to condensed consolidated financial statements.
12
NRG ENERGY, INC. AND SUBSIDIARIES
NOTES TO CONDENSED CONSOLIDATED FINANCIAL STATEMENTS
(Unaudited)
Note 1
—
Basis of Presentation
NRG Energy, Inc., or NRG or the Company, is a competitive power company, which produces, sells and delivers energy and energy products and services in major competitive power markets primarily in the U.S. while positioning itself as a leader in the way residential, industrial and commercial consumers think about and use energy products and services. NRG has one of the nation's largest and most diverse competitive power generation portfolios balanced with one of the nation's largest retail energy providers. The Company owns and operates approximately
50,000
MWs of generation; engages in the trading of wholesale energy, capacity and related products; transacts in and trades fuel and transportation services; and directly sells energy, services, and innovative, sustainable products and services to retail customers under the name “NRG” and various other retail brand names owned by NRG.
On June 29, 2015, NRG Yield, Inc. closed on its offering of
28,198,000
shares of Class C common stock at a price of
$22
per share, which included
3,678,000
shares of Class C common stock purchased by the underwriters through an over-allotment option. Net proceeds to NRG Yield, Inc. from the sale of the Class C common stock were
$599 million
, net of underwriting discounts and commissions of
$21 million
. The additional equity offering reduced the Company's economic interest in NRG Yield, Inc. to
46.7%
and its voting interest to
55.1%
. The Company continues to consolidate NRG Yield, Inc. through its controlling interest.
The accompanying unaudited interim condensed consolidated financial statements have been prepared in accordance with the SEC's regulations for interim financial information and with the instructions to Form 10-Q. Accordingly, they do not include all of the information and notes required by generally accepted accounting principles for complete financial statements. The following notes should be read in conjunction with the accounting policies and other disclosures as set forth in the notes to the consolidated financial statements in the Company's
2014
Form 10-K. Interim results are not necessarily indicative of results for a full year.
In the opinion of management, the accompanying unaudited interim condensed consolidated financial statements contain all material adjustments consisting of normal and recurring accruals necessary to present fairly the Company's consolidated financial position as of
September 30, 2015
, and the results of operations, comprehensive income/(loss) and cash flows for the
nine
months ended
September 30, 2015
, and
2014
.
Use of Estimates
The preparation of financial statements in conformity with U.S. GAAP requires management to make estimates and assumptions that affect the reported amounts of assets and liabilities at the date of the financial statements, disclosure of contingent assets and liabilities at the date of the financial statements, and the reported amounts of revenues and expenses during the reporting period. Actual results could differ from these estimates.
Reclassifications
Certain prior year amounts have been reclassified for comparative purposes. The reclassifications did not affect results from operations, net assets or cash flows.
13
Note 2
—
Summary of Significant Accounting Policies
Other Cash Flow Information
NRG’s investing activities exclude capital expenditures of
$69 million
which were accrued and unpaid at
September 30, 2015
.
Noncontrolling Interest
The following table reflects the changes in NRG's noncontrolling interest balance:
|
(In millions)
|
|||
|
Balance as of December 31, 2014
|
$
|
1,914
|
|
|
Sale of assets to NRG Yield, Inc.
|
(27
|
)
|
|
|
Distributions to noncontrolling interest
|
(115
|
)
|
|
|
Contributions from noncontrolling interest
|
153
|
|
|
|
Increase to noncontrolling interest due to NRG Yield, Inc. acquisitions
|
74
|
|
|
|
Proceeds received from NRG Yield, Inc. public offering
|
599
|
|
|
|
Non-cash adjustments for equity component of NRG Yield, Inc. convertible notes
|
23
|
|
|
|
Non-cash increase to noncontrolling interest
|
19
|
|
|
|
Comprehensive loss attributable to noncontrolling interest
|
(27
|
)
|
|
|
Balance as of September 30, 2015
|
$
|
2,613
|
|
NRG DGPV Holdco 1 LLC
On May 8, 2015, NRG Yield DGPV Holding LLC, a subsidiary of NRG Yield, Inc., and NRG Renew LLC, a subsidiary of the Company, entered into a partnership by forming NRG DGPV Holdco 1 LLC, or DGPV Holdco, the purpose of which is to own or purchase solar power generation projects and other ancillary related assets from NRG Renew LLC, via intermediate funds, including: (i) a tax equity-financed portfolio of
11
recently completed community solar projects representing approximately
11
MW with a weighted average remaining PPA term of
20 years
; and (ii) a tax equity-financed portfolio of approximately
29
commercial photovoltaic systems representing approximately
89
MW. As of September 30, 2015, NRG Yield, Inc.'s investment in DGPV Holdco related to the recently completed community solar projects was
$17 million
. Additionally, as of September 30, 2015, NRG Yield, Inc.'s investment related to commercial photovoltaic systems was
$2 million
. The following illustrates the structure of DGPV Holdco:

14
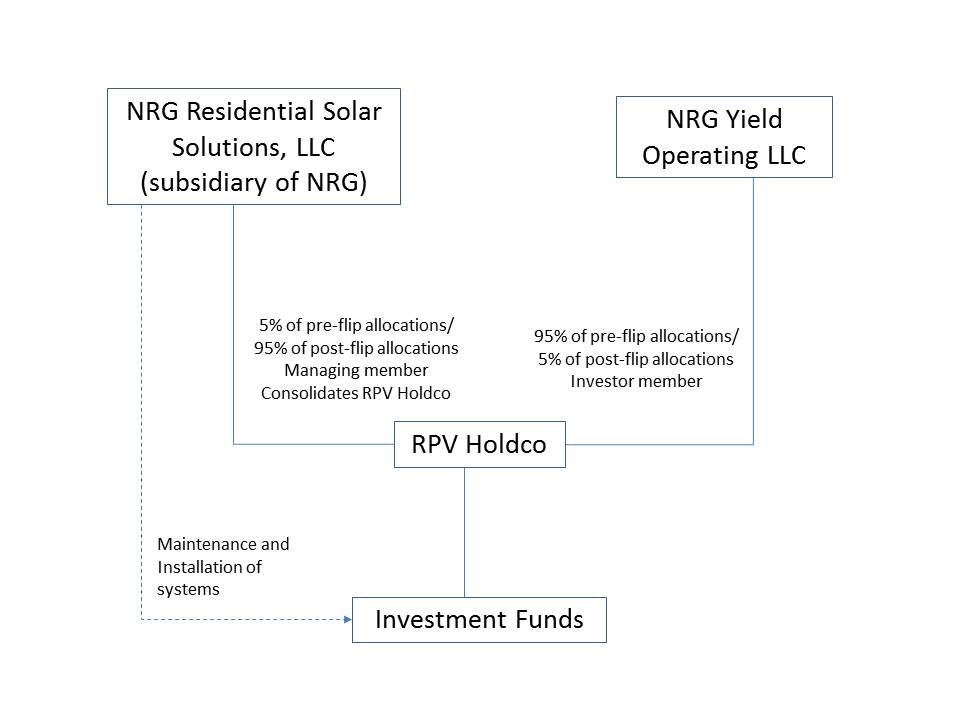
NRG RPV Holdco 1 LLC
On April 9, 2015, NRG Yield RPV Holding LLC, a subsidiary of NRG Yield, Inc. and NRG Residential Solar Solutions LLC, a subsidiary of the Company, entered into a partnership, through their ownership of NRG RPV Holdco 1 LLC, or RPV Holdco, that will invest in and hold operating portfolios of residential solar assets developed by NRG Home Solar, including: (i) an existing, unlevered portfolio of over
2,200
leases across nine states representing approximately
17
MW with a weighted average remaining lease term of approximately
17 years
, in which NRG Yield, Inc. invested
$26 million
in April 2015; and (ii) tax equity-financed portfolios of approximately
13,000
leases representing approximately
90
MW with an average lease term for the existing and new leases of approximately
17
to
20 years
. NRG Yield, Inc. has committed to invest up to an additional
$150 million
of cash contributions into the partnership over time, excluding the
$26 million
noted above. As of
September 30, 2015
, NRG Yield, Inc. has contributed
$21 million
of the
$150 million
committed contributions. The following illustrates the structure of RPV Holdco:
Alta Wind X-XI TE Holdco, LLC
On
June 30, 2015
, NRG Yield Operating LLC, a subsidiary of NRG Yield, Inc., sold an economic interest in Alta Wind X-XI TE Holdco LLC, or Alta TE Holdco, holder of the Alta Wind X and Alta Wind XI projects, to a financial institution in order to monetize cash and tax attributes, primarily production tax credits. The net proceeds of
$119 million
are reflected as noncontrolling interest in the Company's balance sheet.
NRG Yield, Inc. Issuance of Class C Common Stock and Convertible Notes
On June 29, 2015, NRG Yield, Inc. issued
28,198,000
shares of Class C common stock for net proceeds of
$599 million
, as described in Note 1,
Basis of Presentation
, and issued
$287.5 million
in aggregate principal amount of
3.25%
Convertible Senior Notes, due 2020, as described in Note 8,
Debt and Capital Leases
. The value of the conversion option of
$23 million
is reflected in the NRG Yield, Inc. noncontrolling interest balance.
Redeemable Noncontrolling Interest in Subsidiaries
Redeemable noncontrolling interest in subsidiaries represents third-party interests in the net assets under certain arrangements that the Company has entered into to finance the cost of certain projects, including solar energy systems under operating leases and wind facilities eligible for certain tax credits. To the extent that the third party has the right to redeem its interests for cash or other assets, the Company has included the noncontrolling interest attributable to the third party as a component of temporary equity in the mezzanine section of the consolidated balance sheet. The following table reflects the changes in the Company's redeemable noncontrolling interest balance for the
nine
months ended
September 30, 2015
:
|
(In millions)
|
|||
|
Balance as of December 31, 2014
|
$
|
19
|
|
|
Cash contributions from noncontrolling interest
|
17
|
|
|
|
Comprehensive loss attributable to noncontrolling interest
|
(7
|
)
|
|
|
Balance as of September 30, 2015
|
$
|
29
|
|
15
Gain on Postretirement Benefits Curtailment
During the first quarter of 2015, the Company recognized a gain of
$14 million
related to the curtailment of certain of the Company's postretirement plans.
Recent Accounting Developments
ASU 2015-16
— In September 2015, the FASB issued ASU No. 2015-16,
Business Combinations (Topic 805): Simplifying the Accounting for Measurement-Period Adjustments
, or ASU No. 2015-16. The amendments of ASU No. 2015-16 require that an acquirer recognize measurement period adjustments to the provisional amounts recognized in a business combination in the reporting period during which the adjustments are determined. Additionally, the amendments of ASU No. 2015-16 require the acquirer to record in the same period's financial statements the effect on earnings of changes in depreciation, amortization or other income effects, if any, as a result of the measurement period adjustment, calculated as if the accounting had been completed at the acquisition date as well as disclosing either on the face of the income statement or in the notes the portion of the amount recorded in current period earnings that would have been recorded in previous reporting periods. The guidance in ASU No. 2015-16 is effective for financial statements issued for fiscal years beginning after December 15, 2015, and interim periods within those fiscal years. The amendments should be applied prospectively. The adoption of this standard is not expected to have a material impact on the Company's results of operations, cash flows or financial position.
ASU 2015-03 and ASU 2015-15
— In April 2015, the FASB issued ASU No. 2015-03,
Interest - Imputation of Interest (Subtopic 835-30): Simplifying the Presentation of Debt Issuance Costs
, or ASU No. 2015-03. The amendments of ASU No. 2015-03 were issued to reduce complexity in the balance sheet presentation of debt issuance costs. ASU No. 2015-03 requires that debt issuance costs be presented in the balance sheet as a direct deduction from the carrying amount of debt liability, consistent with debt discounts or premiums. The recognition and measurement guidance for debt issuance costs are not affected by the amendments in this standard. Additionally, in August 2015, the FASB issued ASU No. 2015-15,
Interest - Imputation of Interest (Subtopic 835-30): Presentation and Subsequent Measurement of Debt Issuance Costs Associated with Line-of-Credit Arrangements,
or ASU No. 2015-15, as ASU No. 2015-03 did not specifically address presentation or subsequent measurement of debt issuance costs related to line-of-credit arrangements. ASU No. 2015-15 allows an entity to continue to defer and present debt issuance costs ratably over the term of the line-of-credit arrangement, regardless of whether there are any outstanding borrowings on the line-of-credit arrangement. The guidance in ASU No. 2015-03 and ASU No. 2015-15 is effective for financial statements issued for fiscal years beginning after December 15, 2015, and interim periods within those fiscal years. Early adoption is permitted for financial statements that have not been previously issued. The adoption of ASU No. 2015-03 is not expected to have a material impact on the Company's balance sheets on a gross basis and will have no impact on net assets.
ASU 2015-02
— In February 2015, the FASB issued ASU No. 2015-02,
Consolidation (Topic 810): Amendments to the Consolidation Analysis
, or ASU No. 2015-02. The amendments of ASU No. 2015-02 were issued in an effort to minimize situations under previously existing guidance in which a reporting entity was required to consolidate another legal entity in which that reporting entity did not have: (1) the ability through contractual rights to act primarily on its own behalf; (2) ownership of the majority of the legal entity's voting rights; or (3) the exposure to a majority of the legal entity's economic benefits. ASU No. 2015-02 affects reporting entities that are required to evaluate whether they should consolidate certain legal entities. All legal entities are subject to reevaluation under the revised consolidation model. The guidance in ASU No. 2015-02 is effective for periods beginning after December 15, 2015. Early adoption is permitted. The Company adopted the standard effective January 1, 2015 and the adoption of this standard did not impact the Company's results of operations, cash flows or financial position.
ASU 2014-16
— In November 2014, the FASB issued ASU No. 2014-16,
Derivatives and Hedging (Topic 815): Determining Whether the Host Contract in a Hybrid Financial Instrument Issued in the Form of a Share Is More Akin to Debt or to Equity
, or ASU No. 2014-16. The amendments of ASU No. 2014-16 clarify how U.S. GAAP should be applied in determining whether the nature of a host contract is more akin to debt or equity and in evaluating whether the economic characteristics and risks of an embedded feature are "clearly and closely related" to its host contract. The guidance in ASU No. 2014-16 is effective for fiscal years, and interim periods within those fiscal years, beginning after December 15, 2015. Early adoption is permitted. The Company adopted the standard effective January 1, 2015 and the adoption of this standard did not impact the Company's results of operations, cash flows or financial position.
16
ASU 2014-09
— In May 2014, the FASB issued ASU No. 2014-09,
Revenue from Contracts with Customers (Topic 606)
, or ASU No. 2014-09. The amendments of ASU No. 2014-09 complete the joint effort between the FASB and the International Accounting Standards Board, or IASB, to develop a common revenue standard for U.S. GAAP and International Financial Reporting Standards, or IFRS, and to improve financial reporting. The guidance in ASU No. 2014-09 provides that an entity should recognize revenue to depict the transfer of goods or services to customers in an amount that reflects the consideration to which the entity expects to be entitled to in exchange for the goods or services provided and establishes the following steps to be applied by an entity: (1) identify the contract with a customer; (2) identify the performance obligations in the contract; (3) determine the transaction price; (4) allocate the transaction price to the performance obligations in the contract; and (5) recognize revenue when (or as) the entity satisfies the performance obligation. In August 2015, the FASB issued ASU 2015-14, which formally deferred the effective date by one year to make the guidance of ASU No. 2014-09 effective for annual reporting periods beginning after December 15, 2017, including interim periods therein. Early adoption is permitted, but not prior to the original effective date, which was for annual reporting periods beginning after December 15, 2016. The Company is currently evaluating the impact of the standard on the Company's results of operations, cash flows and financial position.
Note 3
—
Business Acquisitions and Dispositions
The Company has completed the following business acquisitions and dispositions that are material to the Company's financial statements:
NRG Yield Acquisitions
2015 Acquisition of Desert Sunlight
On June 29, 2015, NRG Yield, Inc., through its subsidiary Yield Operating, acquired
25%
of the membership interest in Desert Sunlight Investment Holdings, LLC, which owns two solar photovoltaic facilities that total
550
MWs located in Desert Center, California from EFS Desert Sun, LLC, an affiliate of GE Energy Financial Services, for a purchase price of
$285 million
. The Company accounts for its
25%
investment as an equity method investment.
2014 Acquisition of Alta Wind
On August 12, 2014, NRG Yield, Inc., through its subsidiary Yield Operating, completed the acquisition of
100%
of the membership interests of Alta Wind Asset Management Holdings, LLC, Alta Wind Company, LLC, Alta Wind X Holding Company, LLC, and Alta Wind XI Holding Company, LLC, which collectively own seven wind facilities that total
947
MWs located in Tehachapi, California and a portfolio of land leases, or the Alta Wind Assets. Power generated by the Alta Wind facilities is sold to Southern California Edison under long-term power purchase agreements, with
21 years
of remaining contract life for Alta I-V. The Alta X and XI power purchase agreements begin in 2016 with terms of
22 years
and currently sell energy and renewable energy credits on a merchant basis.
The purchase price of the Alta Wind Assets was
$923 million
, which was comprised of a purchase price of
$870 million
and
$53 million
paid for working capital balances. In order to fund the purchase price of the acquisition, NRG Yield, Inc. issued
12,075,000
shares of its Class A common stock on July 29, 2014, for net proceeds of
$630 million
. In addition, on August 5, 2014, Yield Operating issued
$500 million
in aggregate principal amount at par of
5.375%
senior notes due August 2024. Interest on the notes is payable semi-annually on February 15 and August 15 of each year and commenced on February 15, 2015. The notes are senior unsecured obligations of Yield Operating and are guaranteed by NRG Yield LLC, Yield Operating’s parent company, and by certain of Yield Operating’s wholly-owned subsidiaries.
17
The acquisition was recorded as a business combination under ASC 805, with identifiable assets acquired and liabilities assumed provisionally recorded at their estimated fair values on the acquisition date. The accounting for the business combination was completed as of August 11, 2015, at which point the fair values became final. The following table summarizes the provisional amounts recognized for assets acquired and liabilities assumed as of December 31, 2014, as well as adjustments made through August 11, 2015, when the allocation became final. The purchase price of
$923 million
was allocated as follows:
|
Acquisition Date Fair Value at December 31, 2014
|
Measurement period adjustments
|
Revised Acquisition Date
|
|||||||||
|
(In millions)
|
|||||||||||
|
Assets
|
|||||||||||
|
Cash
|
$
|
22
|
|
$
|
—
|
|
$
|
22
|
|
||
|
Current and non-current assets
|
49
|
|
(2
|
)
|
47
|
|
|||||
|
Property, plant and equipment
|
1,304
|
|
6
|
|
1,310
|
|
|||||
|
Intangible assets
|
1,177
|
|
(6
|
)
|
1,171
|
|
|||||
|
Total assets acquired
|
2,552
|
|
(2
|
)
|
2,550
|
|
|||||
|
Liabilities
|
|||||||||||
|
Debt
|
1,591
|
|
—
|
|
1,591
|
|
|||||
|
Current and non-current liabilities
|
38
|
|
(2
|
)
|
36
|
|
|||||
|
Total liabilities assumed
|
1,629
|
|
(2
|
)
|
1,627
|
|
|||||
|
Net assets acquired
|
$
|
923
|
|
$
|
—
|
|
$
|
923
|
|
||
Acquisitions of Assets from NRG
On November 3, 2015, the Company sold
75%
of the Class B interests of NRG Wind TE Holdco, which owns a portfolio of
12
wind facilities totaling
814
net MW, to NRG Yield, Inc. NRG Yield Inc., paid total cash consideration of
$210 million
, subject to working capital adjustments. NRG Yield, Inc. will be responsible for its pro-rata share of non-recourse project debt of
$193 million
and noncontrolling interest associated with a tax equity structure of
$165 million
(as of September 30, 2015).
On January 2, 2015, the Company sold the following facilities to NRG Yield, Inc.: Walnut Creek, the Tapestry projects (Buffalo Bear, Pinnacle and Taloga) and Laredo Ridge. NRG Yield, Inc. paid total cash consideration of
$489 million
, including
$9 million
of working capital adjustments, plus assumed project level debt of
$737 million
. The sale was recorded as a transfer of entities under common control and the related assets were transferred at their carrying value of
$405 million
.
On June 30, 2014, the Company sold the following facilities to NRG Yield, Inc.: High Desert, Kansas South, and El Segundo Energy Center. NRG Yield, Inc. paid total cash consideration of
$357 million
, which represents a base purchase price of
$349 million
and
$8 million
of working capital adjustments, plus assumed project level debt of approximately
$612 million
. The sale was recorded as a transfer of entities under common control and the related assets were transferred at their carrying value of
$236 million
.
18
NRG Dispositions
Sale of Sabine
On December 2, 2014, the Company, through its subsidiaries GenOn Sabine (Delaware), Inc. and GenOn Sabine (Texas), Inc., completed the sale of its
50%
interest in Sabine to Bayou Power, LLC, an affiliate of Rockland Capital, LLC. Sabine owns a
105
MW natural gas-fired cogeneration facility located in Texas. The Company received cash consideration of
$35 million
at closing. A gain of
$18 million
was recognized as a result of the transaction and recorded as a gain on sale of equity-method investments within the Company's consolidated statements of operations.
Disposition of 50% Interest in Petra Nova Parish Holdings LLC
On July 3, 2014, the Company, through its wholly owned subsidiary Petra Nova Holdings LLC, sold
50%
of its interest in Petra Nova Parish Holdings LLC to JX Nippon, a wholly owned subsidiary of JX Nippon Oil & Gas Exploration Corporation. As a result of the sale, the Company no longer has a controlling interest in and has deconsolidated Petra Nova Parish Holdings LLC as of the date of the sale. On July 7, 2014, the Company made its initial capital contribution into the partnership of
$35 million
, which was funded with a portion of the sale proceeds of
$76 million
. On March 3, 2014, Petra Nova CCS I LLC, a wholly owned subsidiary of Petra Nova Parish Holdings LLC, entered into a fixed-price agreement to build and operate a CCF at the W.A. Parish facility with a consortium of Mitsubishi Heavy Industries America, Inc. and TIC - The Industrial Company. Notice to proceed for the construction on the CCF was issued on July 15, 2014, and commercial operation is expected in late 2016.
Petra Nova Parish Holdings LLC also owns a
75
MW peaking unit at W.A. Parish, which achieved commercial operations on June 26, 2013. The peaking unit will be converted into a cogeneration facility to provide power and steam to the CCF. The project is being financed by: (i) up to
$167 million
from a U.S. DOE CCPI grant, (ii)
$250 million
in loans provided by the Japan Bank for International Cooperation and Mizuho Bank, Ltd., and (iii) approximately
$300 million
in equity contributions from each of the Company and JX Nippon. NRG’s contribution will include investments already made during the development of the project.
NRG Acquisitions
Acquisition of Dominion's Competitive Electric Retail Business
On March 31, 2014, the Company acquired the competitive retail electricity business of Dominion. The acquisition of Dominion's competitive retail electricity business increased NRG’s retail portfolio by approximately
540,000
customers in the aggregate by the end of 2014. The acquisition supports NRG's ongoing efforts to expand the Company's retail footprint in the Northeast and to grow its retail position in Texas. The Company paid approximately
$192 million
as cash consideration for the acquisition, including
$165 million
of purchase price and
$27 million
paid for working capital balances, which was funded by cash on hand. The purchase price was allocated to the following:
$40 million
to accounts receivable-trade,
$64 million
to customer relationships,
$9 million
to trade names,
$14 million
to current assets,
$21 million
to derivative assets,
$47 million
to current and non-current liabilities, and goodwill of
$91 million
, of which
$8 million
is deductible for U.S. income tax purposes in future periods. The factors that resulted in goodwill arising from the acquisition include the revenues associated with new customers in new regions and through the synergies associated with combining a new retail business with the Company's existing retail and generation assets. The assets acquired and liabilities assumed are included within the NRG Home Retail segment. The accounting for the Dominion acquisition was completed as of March 30, 2015, at which point the provisional fair values became final with no material changes.
EME Acquisition
On April 1, 2014, the Company acquired substantially all of the assets of EME. EME, through its subsidiaries and affiliates, owned or leased and operated a portfolio of approximately
8,000
MW consisting of wind energy facilities and coal- and gas-fired generating facilities. The Company paid an aggregate purchase price of
$3.5 billion
, which was funded through the issuance of
12,671,977
shares of NRG common stock on April 1, 2014, the issuance of
$700 million
in newly-issued corporate debt and cash on hand. The Company also assumed non-recourse debt of approximately
$1.2 billion
.
In connection with the transaction, NRG agreed to certain conditions with the parties to the POJO sale-leaseback transaction subject to which an NRG subsidiary assumed the POJO leveraged leases and NRG guaranteed the remaining payments under each lease, which total
$405 million
through 2034. In connection with this agreement, NRG has committed to fund up to
$350 million
in capital expenditures for plant modifications at Powerton and Joliet to comply with environmental regulations
.
19
The acquisition was recorded as a business combination under ASC 805, with identifiable assets acquired and liabilities assumed provisionally recorded at their estimated fair values on the acquisition date. The accounting for the EME acquisition was completed as of March 31, 2015, at which point the fair values became final. The following table summarizes the provisional amounts recognized for assets acquired and liabilities assumed as of December 31, 2014, as well as adjustments made through March 31, 2015, when the allocation became final. Measurement period adjustments primarily reflect the tax impact of the acquisition date fair values and final estimates for asset retirement obligations.
The purchase price of
$3.5 billion
was allocated as follows:
|
Acquisition Date Fair Value at December 31, 2014
|
Measurement period adjustments
|
Revised Acquisition Date
|
|||||||||
|
(In millions)
|
|||||||||||
|
Assets
|
|||||||||||
|
Cash
|
$
|
1,422
|
|
$
|
—
|
|
$
|
1,422
|
|
||
|
Current assets
|
724
|
|
72
|
|
796
|
|
|||||
|
Property, plant and equipment
|
2,438
|
|
(3
|
)
|
2,435
|
|
|||||
|
Intangible assets
|
172
|
|
—
|
|
172
|
|
|||||
|
Goodwill
|
334
|
|
(56
|
)
|
278
|
|
|||||
|
Non-current assets
|
773
|
|
—
|
|
773
|
|
|||||
|
Total assets acquired
|
5,863
|
|
13
|
|
5,876
|
|
|||||
|
Liabilities
|
|||||||||||
|
Current and non-current liabilities
|
629
|
|
13
|
|
642
|
|
|||||
|
Out-of-market contracts and leases
|
159
|
|
—
|
|
159
|
|
|||||
|
Long-term debt
|
1,249
|
|
—
|
|
1,249
|
|
|||||
|
Total liabilities assumed
|
2,037
|
|
13
|
|
2,050
|
|
|||||
|
Less: noncontrolling interest
|
352
|
|
—
|
|
352
|
|
|||||
|
Net assets acquired
|
$
|
3,474
|
|
$
|
—
|
|
$
|
3,474
|
|
||
Note 4
—
Fair Value of Financial Instruments
This footnote should be read in conjunction with the complete description under
Note 4
,
Fair Value of Financial Instruments
, to the Company's
2014
Form 10-K.
For cash and cash equivalents, funds deposited by counterparties, accounts and other receivables, accounts payable, restricted cash, and cash collateral paid and received in support of energy risk management activities, the carrying amount approximates fair value because of the short-term maturity of those instruments and are classified as Level 1 within the fair value hierarchy.
The estimated carrying amounts and fair values of NRG's recorded financial instruments not carried at fair market value are as follows:
|
As of September 30, 2015
|
As of December 31, 2014
|
||||||||||||||
|
Carrying Amount
|
Fair Value
|
Carrying Amount
|
Fair Value
|
||||||||||||
|
|
(In millions)
|
||||||||||||||
|
Assets:
|
|
|
|
|
|||||||||||
|
Notes receivable
(a)
|
$
|
82
|
|
$
|
82
|
|
$
|
91
|
|
$
|
91
|
|
|||
|
Liabilities:
|
|||||||||||||||
|
Long-term debt, including current portion
|
$
|
20,041
|
|
$
|
19,163
|
|
$
|
20,366
|
|
$
|
20,361
|
|
|||
(a) Includes the current portion of notes receivable which is recorded in prepayments and other current assets on the Company's consolidated balance sheets.
The fair value of the Company's publicly-traded long-term debt is based on quoted market prices and is classified as Level 2 within the fair value hierarchy. The fair value of debt securities, non-publicly-traded long-term debt and certain notes receivable of the Company are based on expected future cash flows discounted at market interest rates, or current interest rates for similar instruments with equivalent credit quality and are classified as Level 3 within the fair value hierarchy.
20
Recurring Fair Value Measurements
Debt securities, equity securities, and trust fund investments, which are comprised of various U.S. debt and equity securities, and derivative assets and liabilities, are carried at fair market value.
The following tables present assets and liabilities measured and recorded at fair value on the Company's condensed consolidated balance sheets on a recurring basis and their level within the fair value hierarchy:
|
As of September 30, 2015
|
|||||||||||||||
|
Fair Value
|
|||||||||||||||
|
(In millions)
|
Level 1
|
Level 2
|
Level 3
|
Total
|
|||||||||||
|
Investment in available-for-sale securities (classified within other
non-current assets):
|
|
||||||||||||||
|
Debt securities
|
$
|
—
|
|
$
|
—
|
|
$
|
18
|
|
$
|
18
|
|
|||
|
Available-for-sale securities
|
15
|
|
—
|
|
—
|
|
15
|
|
|||||||
|
Other
(a)
|
14
|
|
—
|
|
—
|
|
14
|
|
|||||||
|
Nuclear trust fund investments:
|
|
||||||||||||||
|
Cash and cash equivalents
|
4
|
|
—
|
|
—
|
|
4
|
|
|||||||
|
U.S. government and federal agency obligations
|
58
|
|
2
|
|
—
|
|
60
|
|
|||||||
|
Federal agency mortgage-backed securities
|
—
|
|
60
|
|
—
|
|
60
|
|
|||||||
|
Commercial mortgage-backed securities
|
—
|
|
25
|
|
—
|
|
25
|
|
|||||||
|
Corporate debt securities
|
—
|
|
83
|
|
—
|
|
83
|
|
|||||||
|
Equity securities
|
269
|
|
—
|
|
49
|
|
318
|
|
|||||||
|
Foreign government fixed income securities
|
—
|
|
1
|
|
—
|
|
1
|
|
|||||||
|
Other trust fund investments:
|
|||||||||||||||
|
U.S. government and federal agency obligations
|
1
|
|
—
|
|
—
|
|
1
|
|
|||||||
|
Derivative assets:
|
|
||||||||||||||
|
Commodity contracts
|
720
|
|
1,161
|
|
221
|
|
2,102
|
|
|||||||
|
Interest rate contracts
|
—
|
|
—
|
|
—
|
|
—
|
|
|||||||
|
Total assets
|
$
|
1,081
|
|
$
|
1,332
|
|
$
|
288
|
|
$
|
2,701
|
|
|||
|
Derivative liabilities:
|
|
||||||||||||||
|
Commodity contracts
|
$
|
815
|
|
$
|
866
|
|
$
|
188
|
|
$
|
1,869
|
|
|||
|
Interest rate contracts
|
—
|
|
166
|
|
—
|
|
166
|
|
|||||||
|
Total liabilities
|
$
|
815
|
|
$
|
1,032
|
|
$
|
188
|
|
$
|
2,035
|
|
|||
(a) Consists primarily of mutual funds held in a Rabbi Trust for non-qualified deferred compensation plans for certain former employees.
21
|
As of December 31, 2014
|
|||||||||||||||
|
Fair Value
|
|||||||||||||||
|
(In millions)
|
Level 1
|
Level 2
|
Level 3
|
Total
|
|||||||||||
|
Investment in available-for-sale securities (classified within other
non-current assets):
|
|
||||||||||||||
|
Debt securities
|
$
|
—
|
|
$
|
—
|
|
$
|
18
|
|
$
|
18
|
|
|||
|
Available-for-sale securities
|
30
|
|
—
|
|
—
|
|
30
|
|
|||||||
|
Other
(a)
|
21
|
|
—
|
|
11
|
|
32
|
|
|||||||
|
Nuclear trust fund investments:
|
|||||||||||||||
|
Cash and cash equivalents
|
14
|
|
—
|
|
—
|
|
14
|
|
|||||||
|
U.S. government and federal agency obligations
|
44
|
|
3
|
|
—
|
|
47
|
|
|||||||
|
Federal agency mortgage-backed securities
|
—
|
|
74
|
|
—
|
|
74
|
|
|||||||
|
Commercial mortgage-backed securities
|
—
|
|
25
|
|
—
|
|
25
|
|
|||||||
|
Corporate debt securities
|
—
|
|
78
|
|
—
|
|
78
|
|
|||||||
|
Equity securities
|
292
|
|
—
|
|
52
|
|
344
|
|
|||||||
|
Foreign government fixed income securities
|
—
|
|
3
|
|
—
|
|
3
|
|
|||||||
|
Other trust fund investments:
|
|||||||||||||||
|
U.S. government and federal agency obligations
|
1
|
|
—
|
|
—
|
|
1
|
|
|||||||
|
Derivative assets:
|
|
||||||||||||||
|
Commodity contracts
|
1,078
|
|
1,515
|
|
309
|
|
2,902
|
|
|||||||
|
Interest rate contracts
|
—
|
|
2
|
|
—
|
|
2
|
|
|||||||
|
Equity contracts
|
—
|
|
—
|
|
1
|
|
1
|
|
|||||||
|
Total assets
|
$
|
1,480
|
|
$
|
1,700
|
|
$
|
391
|
|
$
|
3,571
|
|
|||
|
Derivative liabilities:
|
|
||||||||||||||
|
Commodity contracts
|
$
|
1,004
|
|
$
|
1,093
|
|
$
|
230
|
|
$
|
2,327
|
|
|||
|
Interest rate contracts
|
—
|
|
165
|
|
—
|
|
165
|
|
|||||||
|
Total liabilities
|
$
|
1,004
|
|
$
|
1,258
|
|
$
|
230
|
|
$
|
2,492
|
|
|||
(a) Primarily consists of mutual funds held in rabbi trusts for non-qualified deferred compensation plans for certain former employees and a total return swap that does not meet the definition of a derivative.
22
There were
no
transfers during the
three
and
nine
months ended
September 30, 2015
, and
2014
between Levels 1 and 2. The following tables reconcile, for the
three
and
nine
months ended
September 30, 2015
, and
2014
, the beginning and ending balances for financial instruments that are recognized at fair value in the consolidated financial statements, at least annually, using significant unobservable inputs:
|
Fair Value Measurement Using Significant Unobservable Inputs (Level 3)
|
|||||||||||||||||||||||||||||||||||||||
|
Three months ended September 30, 2015
|
Nine months ended September 30, 2015
|
||||||||||||||||||||||||||||||||||||||
|
(In millions)
|
Debt Securities
|
Other
|
Trust Fund Investments
|
Derivatives
(a)
|
Total
|
Debt Securities
|
Other
|
Trust Fund Investments
|
Derivatives
(a)
|
Total
|
|||||||||||||||||||||||||||||
|
Beginning balance
|
$
|
18
|
|
$
|
—
|
|
$
|
55
|
|
$
|
49
|
|
$
|
122
|
|
$
|
18
|
|
$
|
11
|
|
$
|
52
|
|
$
|
80
|
|
$
|
161
|
|
|||||||||
|
Total gains/(losses) — realized/unrealized:
|
|
|
|
|
|||||||||||||||||||||||||||||||||||
|
Included in earnings
|
—
|
|
—
|
|
—
|
|
(17
|
)
|
(17
|
)
|
—
|
|
(11
|
)
|
—
|
|
(95
|
)
|
(106
|
)
|
|||||||||||||||||||
|
Included in nuclear decommissioning obligation
|
—
|
|
—
|
|
(6
|
)
|
—
|
|
(6
|
)
|
—
|
|
—
|
|
(4
|
)
|
—
|
|
(4
|
)
|
|||||||||||||||||||
|
Purchases
|
—
|
|
—
|
|
—
|
|
9
|
|
9
|
|
—
|
|
—
|
|
1
|
|
44
|
|
45
|
|
|||||||||||||||||||
|
Transfers into Level 3
(b)
|
—
|
|
—
|
|
—
|
|
(10
|
)
|
(10
|
)
|
—
|
|
—
|
|
—
|
|
1
|
|
1
|
|
|||||||||||||||||||
|
Transfers out of Level 3
(b)
|
—
|
|
—
|
|
—
|
|
2
|
|
2
|
|
—
|
|
—
|
|
—
|
|
3
|
|
3
|
|
|||||||||||||||||||
|
Ending balance as of September 30, 2015
|
$
|
18
|
|
$
|
—
|
|
$
|
49
|
|
$
|
33
|
|
$
|
100
|
|
$
|
18
|
|
$
|
—
|
|
$
|
49
|
|
$
|
33
|
|
$
|
100
|
|
|||||||||
|
Losses for the period included in earnings attributable to the change in unrealized gains or losses relating to assets or liabilities still held as of September 30, 2015
|
$
|
—
|
|
$
|
—
|
|
$
|
—
|
|
$
|
(9
|
)
|
$
|
(9
|
)
|
$
|
—
|
|
$
|
—
|
|
$
|
—
|
|
$
|
(37
|
)
|
$
|
(37
|
)
|
|||||||||
|
(a)
|
Consists of derivative assets and liabilities, net.
|
|
(b)
|
Transfers into/out of Level 3 are related to the availability of external broker quotes and are valued as of the end of the reporting period. All transfers in/out are with Level 2.
|
23
|
Fair Value Measurement Using Significant Unobservable Inputs (Level 3)
|
|||||||||||||||||||||||||||||||||||||||
|
Three months ended September 30, 2014
|
Nine months ended September 30, 2014
|
||||||||||||||||||||||||||||||||||||||
|
(In millions)
|
Debt Securities
|
Other
|
Trust Fund Investments
|
Derivatives
(a)
|
Total
|
Debt Securities
|
Other
|
Trust Fund Investments
|
Derivatives
(a)
|
Total
|
|||||||||||||||||||||||||||||
|
Beginning balance
|
$
|
18
|
|
$
|
11
|
|
$
|
58
|
|
$
|
(12
|
)
|
$
|
75
|
|
$
|
16
|
|
$
|
10
|
|
$
|
56
|
|
$
|
13
|
|
$
|
95
|
|
|||||||||
|
Total gains/(losses) — realized/unrealized:
|
|
|
|
|
|
||||||||||||||||||||||||||||||||||
|
Included in earnings
|
—
|
|
—
|
|
—
|
|
(22
|
)
|
(22
|
)
|
—
|
|
1
|
|
—
|
|
(18
|
)
|
(17
|
)
|
|||||||||||||||||||
|
Included in OCI
|
—
|
|
—
|
|
—
|
|
—
|
|
—
|
|
2
|
|
—
|
|
—
|
|
—
|
|
2
|
|
|||||||||||||||||||
|
Included in nuclear decommissioning obligations
|
—
|
|
—
|
|
(4
|
)
|
—
|
|
(4
|
)
|
—
|
|
—
|
|
(3
|
)
|
—
|
|
(3
|
)
|
|||||||||||||||||||
|
Purchases
|
—
|
|
—
|
|
—
|
|
63
|
|
63
|
|
—
|
|
—
|
|
1
|
|
(21
|
)
|
(20
|
)
|
|||||||||||||||||||
|
Contracts acquired in Dominion and EME acquisition
|
—
|
|
—
|
|
—
|
|
—
|
|
—
|
|
—
|
|
—
|
|
—
|
|
39
|
|
39
|
|
|||||||||||||||||||
|
Transfers into Level 3
(b)
|
—
|
|
—
|
|
—
|
|
(1
|
)
|
(1
|
)
|
—
|
|
—
|
|
—
|
|
17
|
|
17
|
|
|||||||||||||||||||
|
Transfers out of Level 3
(b)
|
—
|
|
—
|
|
—
|
|
1
|
|
1
|
|
—
|
|
—
|
|
—
|
|
(1
|
)
|
(1
|
)
|
|||||||||||||||||||
|
Ending balance as of September 30, 2014
|
$
|
18
|
|
$
|
11
|
|
$
|
54
|
|
$
|
29
|
|
$
|
112
|
|
$
|
18
|
|
$
|
11
|
|
$
|
54
|
|
$
|
29
|
|
$
|
112
|
|
|||||||||
|
Gains for the period included in earnings attributable to the change in unrealized gains or losses relating to assets or liabilities still held as of September 30, 2014
|
$
|
—
|
|
$
|
—
|
|
$
|
—
|
|
$
|
5
|
|
$
|
5
|
|
$
|
—
|
|
$
|
—
|
|
$
|
—
|
|
$
|
26
|
|
$
|
26
|
|
|||||||||
|
(a)
|
Consists of derivative assets and liabilities, net.
|
|
(b)
|
Transfers into/out of Level 3 are related to the availability of external broker quotes and are valued as of the end of the reporting period. All transfers in/out are with Level 2.
|
Derivative Fair Value Measurements
A portion of NRG's contracts are exchange-traded contracts with readily available quoted market prices. A majority of NRG's contracts are non-exchange-traded contracts valued using prices provided by external sources, primarily price quotations available through brokers or over-the-counter and on-line exchanges. The remainder of the assets and liabilities represent contracts for which external sources or observable market quotes are not available for the whole term or for certain delivery months or the contracts are retail and load following power contracts. These contracts are valued using various valuation techniques including but not limited to internal models that apply fundamental analysis of the market and corroboration with similar markets. As of
September 30, 2015
, contracts valued with prices provided by models and other valuation techniques make up
11%
of the total derivative assets and
9%
of the total derivative liabilities.
NRG's significant positions classified as Level 3 include physical and financial power and physical coal executed in illiquid markets as well as financial transmission rights, or FTRs. The significant unobservable inputs used in developing fair value include illiquid power and coal location pricing which is derived as a basis to liquid locations. The basis spread is based on observable market data when available or derived from historic prices and forward market prices from similar observable markets when not available. For FTRs, NRG uses the most recent auction prices to derive the fair value.
24
The following tables quantify the significant unobservable inputs used in developing the fair value of the Company's Level 3 positions as of
September 30, 2015
and
December 31, 2014
:
|
Significant Unobservable Inputs
|
|||||||||||||||||||||||
|
September 30, 2015
|
|||||||||||||||||||||||
|
Fair Value
|
Input/Range
|
||||||||||||||||||||||
|
Assets
|
Liabilities
|
Valuation Technique
|
Significant Unobservable Input
|
Low
|
High
|
Weighted Average
|
|||||||||||||||||
|
(In millions)
|
|||||||||||||||||||||||
|
Power Contracts
|
$
|
136
|
|
$
|
116
|
|
Discounted Cash Flow
|
Forward Market Price (per MWh)
|
$
|
9
|
|
$
|
78
|
|
$
|
34
|
|
||||||
|
Coal Contracts
|
—
|
|
9
|
|
Discounted Cash Flow
|
Forward Market Price (per ton)
|
46
|
|
49
|
|
47
|
|
|||||||||||
|
FTRs
|
85
|
|
63
|
|
Discounted Cash Flow
|
Auction Prices (per MWh)
|
(93
|
)
|
64
|
|
—
|
|
|||||||||||
|
$
|
221
|
|
$
|
188
|
|
||||||||||||||||||
|
Significant Unobservable Inputs
|
|||||||||||||||||||||||
|
December 31, 2014
|
|||||||||||||||||||||||
|
Fair Value
|
Input/Range
|
||||||||||||||||||||||
|
Assets
|
Liabilities
|
Valuation Technique
|
Significant Unobservable Input
|
Low
|
High
|
Weighted Average
|
|||||||||||||||||
|
(In millions)
|
|||||||||||||||||||||||
|
Power Contracts
|
$
|
195
|
|
$
|
154
|
|
Discounted Cash Flow
|
Forward Market Price (per MWh)
|
$
|
15
|
|
$
|
92
|
|
$
|
47
|
|
||||||
|
Coal Contracts
|
3
|
|
1
|
|
Discounted Cash Flow
|
Forward Market Price (per ton)
|
53
|
|
56
|
|
54
|
|
|||||||||||
|
FTRs
|
111
|
|
75
|
|
Discounted Cash Flow
|
Auction Prices (per MWh)
|
(29
|
)
|
30
|
|
—
|
|
|||||||||||
|
$
|
309
|
|
$
|
230
|
|
||||||||||||||||||
The following table provides sensitivity of fair value measurements to increases/(decreases) in significant unobservable inputs as of
September 30, 2015
and December 31, 2014:
|
Significant Unobservable Input
|
Position
|
Change In Input
|
Impact on Fair Value Measurement
|
|||
|
Forward Market Price Power/Coal
|
Buy
|
Increase/(Decrease)
|
Higher/(Lower)
|
|||
|
Forward Market Price Power/Coal
|
Sell
|
Increase/(Decrease)
|
Lower/(Higher)
|
|||
|
FTR Prices
|
Buy
|
Increase/(Decrease)
|
Higher/(Lower)
|
|||
|
FTR Prices
|
Sell
|
Increase/(Decrease)
|
Lower/(Higher)
|
|||
The fair value of each contract is discounted using a risk-free interest rate. In addition, the Company applies a credit reserve to reflect credit risk, which is calculated based on published default probabilities. As of
September 30, 2015
, the credit reserve resulted in a
$7 million
increase in fair value, which is composed of a
$4 million
gain in OCI and a
$3 million
gain in operating revenue and cost of operations. As of
September 30, 2014
, the credit reserve resulted in a
$1 million
increase in fair value, which is a gain in OCI.
Concentration of Credit Risk
In addition to the credit risk discussion as disclosed in
Note 2
,
Summary of Significant Accounting Policies
, to the Company's
2014
Form 10-K, the following is a discussion of the concentration of credit risk for the Company's contractual obligations. Credit risk relates to the risk of loss resulting from non-performance or non-payment by counterparties pursuant to the terms of their contractual obligations. NRG is exposed to counterparty credit risk through various activities including wholesale sales, fuel purchases and retail supply arrangements, and retail customer credit risk through its retail load activities.
25
Counterparty Credit Risk
The Company's counterparty credit risk policies are disclosed in its
2014
Form 10-K. As of
September 30, 2015
, counterparty credit exposure, excluding credit risk exposure under certain long term agreements, was
$942 million
and NRG held collateral (cash and letters of credit) against those positions of
$111 million
, resulting in a net exposure of
$800 million
. Approximately
81%
of the Company's exposure before collateral is expected to roll off by the end of
2016
. Counterparty credit exposure is valued through observable market quotes and discounted at a risk free interest rate. The following tables highlight net counterparty credit exposure by industry sector and by counterparty credit quality. Net counterparty credit exposure is defined as the aggregate net asset position for NRG with counterparties where netting is permitted under the enabling agreement and includes all cash flow, mark-to-market and NPNS, and non-derivative transactions. The exposure is shown net of collateral held, and includes amounts net of receivables or payables.
|
|
Net Exposure
(a)
|
|
|
Category
|
(% of Total)
|
|
|
Financial institutions
|
44
|
%
|
|
Utilities, energy merchants, marketers and other
|
32
|
|
|
ISOs
|
24
|
|
|
Total as of September 30, 2015
|
100
|
%
|
|
|
Net Exposure
(a)
|
|
|
Category
|
(% of Total)
|
|
|
Investment grade
|
99
|
%
|
|
Non-rated
(b)
|
1
|
|
|
Total as of September 30, 2015
|
100
|
%
|
|
(a)
|
Counterparty credit exposure excludes uranium and coal transportation contracts because of the unavailability of market prices.
|
|
(b)
|
For non-rated counterparties, a significant portion are related to ISO and municipal public power entities, which are considered investment grade equivalent ratings based on NRG's internal credit ratings.
|
NRG has counterparty credit risk exposure to certain counterparties, each of which represent more than
10%
of total net exposure discussed above. The aggregate of such counterparties' exposure was
$279 million
as of
September 30, 2015
. Changes in hedge positions and market prices will affect credit exposure and counterparty concentration. Given the credit quality, diversification and term of the exposure in the portfolio, NRG does not anticipate a material impact on the Company's financial position or results of operations from nonperformance by any of NRG's counterparties.
Counterparty credit exposure described above excludes credit risk exposure under certain long term agreements, including California tolling agreements, Gulf Coast load obligations, wind and solar PPAs, and a coal supply agreement. As external sources or observable market quotes are not available to estimate such exposure, the Company estimates its credit exposure for these contracts based on various techniques including, but not limited to, internal models based on a fundamental analysis of the market and extrapolation of observable market data with similar characteristics. Based on these valuation techniques, as of
September 30, 2015
, aggregate credit risk exposure managed by NRG to these counterparties was approximately
$4.2 billion
, including
$2.9 billion
related to assets of NRG Yield, Inc., for the next
five
years. This amount excludes potential credit exposures for projects with long-term PPAs that have not reached commercial operations. The majority of these power contracts are with utilities or public power entities with strong credit quality and public utility commission or other regulatory support. However, such regulated utility counterparties can be impacted by changes in government regulations and other technology and market factors, which NRG is unable to predict. In the case of the coal supply agreement, NRG holds a lien against the underlying asset, which significantly reduces the risk of loss.
Retail Customer Credit Risk
NRG is exposed to retail credit risk through the Company's retail electricity providers, which serve commercial, industrial and governmental/institutional customers and the Mass market. Retail credit risk results when a customer fails to pay for products or services rendered. The losses may result from both nonpayment of customer accounts receivable and the loss of in-the-money forward value. NRG manages retail credit risk through the use of established credit policies that include monitoring of the portfolio, and the use of credit mitigation measures such as deposits or prepayment arrangements.
As of
September 30, 2015
, the Company believes its retail customer credit exposure was diversified across many customers and various industries, as well as government entities.
26
Note 5
—
Nuclear Decommissioning Trust Fund
This footnote should be read in conjunction with the complete description under
Note 6
,
Nuclear Decommissioning Trust Fund
, to the Company's
2014
Form 10-K.
NRG's Nuclear Decommissioning Trust Fund assets are comprised of securities classified as available-for-sale and recorded at fair value based on actively quoted market prices. NRG accounts for the Nuclear Decommissioning Trust Fund in accordance with ASC 980,
Regulated Operations
, because the Company's nuclear decommissioning activities are subject to approval by the PUCT with regulated rates that are designed to recover all decommissioning costs and that can be charged to and collected from the ratepayers per PUCT mandate. Since the Company is in compliance with PUCT rules and regulations regarding decommissioning trusts and the cost of decommissioning is the responsibility of the Texas ratepayers, not NRG, all realized and unrealized gains or losses (including other-than-temporary impairments) related to the Nuclear Decommissioning Trust Fund are recorded to nuclear decommissioning trust liability and are not included in net income or accumulated OCI, consistent with regulatory treatment.
The following table summarizes the aggregate fair values and unrealized gains and losses (including other-than-temporary impairments) for the securities held in the trust funds, as well as information about the contractual maturities of those securities.
|
|
As of September 30, 2015
|
As of December 31, 2014
|
|||||||||||||||||||||||||||
|
(In millions, except otherwise noted)
|
Fair Value
|
Unrealized Gains
|
Unrealized Losses
|
Weighted-average Maturities (In years)
|
Fair Value
|
Unrealized Gains
|
Unrealized Losses
|
Weighted-average Maturities (In years)
|
|||||||||||||||||||||
|
Cash and cash equivalents
|
$
|
4
|
|
$
|
—
|
|
$
|
—
|
|
—
|
|
$
|
14
|
|
$
|
—
|
|
$
|
—
|
|
—
|
|
|||||||
|
U.S. government and federal agency obligations
|
60
|
|
2
|
|
—
|
|
10
|
|
47
|
|
2
|
|
—
|
|
11
|
|
|||||||||||||
|
Federal agency mortgage-backed securities
|
60
|
|
1
|
|
—
|
|
25
|
|
74
|
|
2
|
|
—
|
|
25
|
|
|||||||||||||
|
Commercial mortgage-backed securities
|
25
|
|
—
|
|
1
|
|
28
|
|
25
|
|
—
|
|
1
|
|
30
|
|
|||||||||||||
|
Corporate debt securities
|
83
|
|
1
|
|
1
|
|
10
|
|
78
|
|
2
|
|
1
|
|
11
|
|
|||||||||||||
|
Equity securities
|
318
|
|
185
|
|
—
|
|
—
|
|
344
|
|
211
|
|
—
|
|
—
|
|
|||||||||||||
|
Foreign government fixed income securities
|
1
|
|
—
|
|
—
|
|
15
|
|
3
|
|
1
|
|
—
|
|
16
|
|
|||||||||||||
|
Total
|
$
|
551
|
|
$
|
189
|
|
$
|
2
|
|
$
|
585
|
|
$
|
218
|
|
$
|
2
|
|
|||||||||||
The following table summarizes proceeds from sales of available-for-sale securities and the related realized gains and losses from these sales. The cost of securities sold is determined on the specific identification method.
|
|
Nine months ended September 30,
|
||||||
|
2015
|
2014
|
||||||
|
(In millions)
|
|||||||
|
Realized gains
|
$
|
14
|
|
$
|
15
|
|
|
|
Realized losses
|
10
|
|
5
|
|
|||
|
Proceeds from sale of securities
|
499
|
|
|
463
|
|
||
27
Note 6
—
Accounting for Derivative Instruments and Hedging Activities
This footnote should be read in conjunction with the complete description under
Note 5
,
Accounting for Derivative Instruments and Hedging Activities
, to the Company's
2014
Form 10-K.
Energy-Related Commodities
As of
September 30, 2015
, NRG had energy-related derivative instruments extending through 2024. The Company voluntarily de-designated all remaining commodity cash flow hedges as of January 1, 2014, and prospectively marked these derivatives to market through the income statement.
Interest Rate Swaps
NRG is exposed to changes in interest rates through the Company's issuance of variable rate debt. In order to manage the Company's interest rate risk, NRG enters into interest rate swap agreements. As of
September 30, 2015
, the Company had interest rate derivative instruments on non-recourse debt extending through 2032, most of which are designated as cash flow hedges.
Volumetric Underlying Derivative Transactions
The following table summarizes the net notional volume buy/(sell) of NRG's open derivative transactions broken out by category, excluding those derivatives that qualified for the NPNS exception, as of
September 30, 2015
, and
December 31, 2014
. Option contracts are reflected using delta volume. Delta volume equals the notional volume of an option adjusted for the probability that the option will be in-the-money at its expiration date.
|
|
|
Total Volume
|
||||||
|
September 30, 2015
|
December 31, 2014
|
|||||||
|
Category
|
Units
|
(In millions)
|
||||||
|
Emissions
|
Short Ton
|
6
|
|
2
|
|
|||
|
Coal
|
Short Ton
|
34
|
|
57
|
|
|||
|
Natural Gas
|
MMBtu
|
82
|
|
(58
|
)
|
|||
|
Oil
|
Barrel
|
1
|
|
1
|
|
|||
|
Power
|
MWh
|
(67
|
)
|
(56
|
)
|
|||
|
Capacity
|
MW/Day
|
(1
|
)
|
—
|
|
|||
|
Interest
|
Dollars
|
$
|
2,394
|
|
$
|
3,440
|
|
|
|
Equity
|
Shares
|
2
|
|
2
|
|
|||
The increase in the natural gas position was primarily the result of additional retail hedges, as well as settlement of generation hedge positions. The decrease in the interest rate position was primarily the result of settling the Alta X and Alta XI interest rate swaps in connection with the repayment of the project-level debt, as described in
Note 8
,
Debt and Capital Leases
.
Fair Value of Derivative Instruments
The following table summarizes the fair value within the derivative instrument valuation on the balance sheets:
|
|
Fair Value
|
||||||||||||||
|
|
Derivative Assets
|
Derivative Liabilities
|
|||||||||||||
|
September 30, 2015
|
December 31, 2014
|
September 30, 2015
|
December 31, 2014
|
||||||||||||
|
(In millions)
|
|||||||||||||||
|
Derivatives designated as cash flow hedges:
|
|
|
|
|
|
||||||||||
|
Interest rate contracts current
|
$
|
—
|
|
$
|
—
|
|
$
|
45
|
|
|
$
|
55
|
|
||
|
Interest rate contracts long-term
|
—
|
|
2
|
|
98
|
|
|
74
|
|
||||||
|
Total derivatives designated as cash flow hedges
|
—
|
|
2
|
|
143
|
|
|
129
|
|
||||||
|
Derivatives not designated as cash flow hedges
:
|
|
|
|
|
|
||||||||||
|
Interest rate contracts current
|
—
|
|
—
|
|
6
|
|
|
8
|
|
||||||
|
Interest rate contracts long-term
|
—
|
|
—
|
|
17
|
|
|
28
|
|
||||||
|
Commodity contracts current
|
1,580
|
|
2,425
|
|
1,365
|
|
|
1,991
|
|
||||||
|
Commodity contracts long-term
|
522
|
|
477
|
|
504
|
|
|
336
|
|
||||||
|
Equity contracts long-term
|
—
|
|
1
|
|
—
|
|
|
—
|
|
||||||
|
Total derivatives not designated as cash flow hedges
|
2,102
|
|
2,903
|
|
1,892
|
|
|
2,363
|
|
||||||
|
Total derivatives
|
$
|
2,102
|
|
|
$
|
2,905
|
|
$
|
2,035
|
|
|
$
|
2,492
|
|
|
28
The Company has elected to present derivative assets and liabilities on the balance sheet on a trade-by-trade basis and does not offset amounts at the counterparty master agreement level. In addition, collateral received or paid on the Company's derivative assets or liabilities are recorded on a separate line item on the balance sheet. The following table summarizes the offsetting of derivatives by counterparty master agreement level and collateral received or paid:
|
Gross Amounts Not Offset in the Statement of Financial Position
|
||||||||||||||||
|
Gross Amounts of Recognized Assets / Liabilities
|
Derivative Instruments
|
Cash Collateral (Held) / Posted
|
Net Amount
|
|||||||||||||
|
As of September 30, 2015
|
(In millions)
|
|||||||||||||||
|
Commodity contracts:
|
||||||||||||||||
|
Derivative assets
|
$
|
2,102
|
|
$
|
(1,544
|
)
|
$
|
(71
|
)
|
$
|
487
|
|
||||
|
Derivative liabilities
|
(1,869
|
)
|
1,544
|
|
112
|
|
(213
|
)
|
||||||||
|
Total commodity contracts
|
233
|
|
—
|
|
41
|
|
274
|
|
||||||||
|
Interest rate contracts:
|
||||||||||||||||
|
Derivative assets
|
—
|
|
—
|
|
—
|
|
—
|
|
||||||||
|
Derivative liabilities
|
(166
|
)
|
—
|
|
—
|
|
(166
|
)
|
||||||||
|
Total interest rate contracts
|
(166
|
)
|
—
|
|
—
|
|
(166
|
)
|
||||||||
|
Total derivative instruments
|
$
|
67
|
|
$
|
—
|
|
$
|
41
|
|
$
|
108
|
|
||||
|
Gross Amounts Not Offset in the Statement of Financial Position
|
||||||||||||||||
|
Gross Amounts of Recognized Assets / Liabilities
|
Derivative Instruments
|
Cash Collateral (Held) / Posted
|
Net Amount
|
|||||||||||||
|
As of December 31, 2014
|
(In millions)
|
|||||||||||||||
|
Commodity contracts:
|
|
|||||||||||||||
|
Derivative assets
|
$
|
2,902
|
|
$
|
(2,155
|
)
|
$
|
(72
|
)
|
$
|
675
|
|
||||
|
Derivative liabilities
|
(2,327
|
)
|
2,155
|
|
27
|
|
(145
|
)
|
||||||||
|
Total commodity contracts
|
575
|
|
—
|
|
(45
|
)
|
530
|
|
||||||||
|
Interest rate contracts:
|
|
|||||||||||||||
|
Derivative assets
|
2
|
|
(2
|
)
|
—
|
|
—
|
|
||||||||
|
Derivative liabilities
|
(165
|
)
|
2
|
|
—
|
|
(163
|
)
|
||||||||
|
Total interest rate contracts
|
(163
|
)
|
—
|
|
—
|
|
(163
|
)
|
||||||||
|
Equity contracts:
|
||||||||||||||||
|
Derivative assets
|
1
|
|
—
|
|
—
|
|
1
|
|
||||||||
|
Total derivative instruments
|
$
|
413
|
|
$
|
—
|
|
$
|
(45
|
)
|
|
$
|
368
|
|
|||
Accumulated Other Comprehensive Loss
The following table summarizes the effects of ASC 815 on the Company's accumulated OCI balance attributable to cash flow hedge derivatives, net of tax:
|
Three months ended September 30, 2015
|
Nine months ended September 30, 2015
|
||||||||||||||||||||||
|
Energy Commodities
|
Interest Rate
|
Total
|
Energy Commodities
|
Interest Rate
|
Total
|
||||||||||||||||||
|
(In millions)
|
|||||||||||||||||||||||
|
Accumulated OCI beginning balance
|
$
|
(1
|
)
|
$
|
(62
|
)
|
$
|
(63
|
)
|
$
|
(1
|
)
|
$
|
(67
|
)
|
$
|
(68
|
)
|
|||||
|
Reclassified from accumulated OCI to income:
|
|||||||||||||||||||||||
|
Due to realization of previously deferred amounts
|
1
|
|
3
|
|
4
|
|
1
|
|
7
|
|
8
|
|
|||||||||||
|
Mark-to-market of cash flow hedge accounting contracts
|
—
|
|
(33
|
)
|
(33
|
)
|
—
|
|
(32
|
)
|
(32
|
)
|
|||||||||||
|
Accumulated OCI ending balance, net of $54 tax
|
$
|
—
|
|
$
|
(92
|
)
|
$
|
(92
|
)
|
|
$
|
—
|
|
|
$
|
(92
|
)
|
$
|
(92
|
)
|
|||
|
Losses expected to be realized from OCI during the next 12 months, net of $7 tax
|
$
|
—
|
|
$
|
(13
|
)
|
$
|
(13
|
)
|
$
|
—
|
|
$
|
(13
|
)
|
$
|
(13
|
)
|
|||||
29
|
Three months ended September 30, 2014
|
Nine months ended September 30, 2014
|
||||||||||||||||||||||
|
Energy Commodities
|
Interest Rate
|
Total
|
Energy Commodities
|
Interest Rate
|
Total
|
||||||||||||||||||
|
(In millions)
|
|||||||||||||||||||||||
|
Accumulated OCI beginning balance
|
$
|
(1
|
)
|
$
|
(50
|
)
|
$
|
(51
|
)
|
$
|
(1
|
)
|
$
|
(22
|
)
|
$
|
(23
|
)
|
|||||
|
Reclassified from accumulated OCI to income:
|
|||||||||||||||||||||||
|
Due to realization of previously deferred amounts
|
—
|
|
11
|
|
11
|
|
—
|
|
3
|
|
3
|
|
|||||||||||
|
Mark-to-market of cash flow hedge accounting contracts
|
—
|
|
(7
|
)
|
(7
|
)
|
—
|
|
(27
|
)
|
(27
|
)
|
|||||||||||
|
Accumulated OCI ending balance, net of $25 tax
|
$
|
(1
|
)
|
$
|
(46
|
)
|
$
|
(47
|
)
|
|
$
|
(1
|
)
|
|
$
|
(46
|
)
|
$
|
(47
|
)
|
|||
Amounts reclassified from accumulated OCI into income and amounts recognized in income from the ineffective portion of cash flow hedges are recorded to operating revenue for commodity contracts and interest expense for interest rate contracts. There was
no
ineffectiveness for the
three
and
nine
months ended
September 30, 2015
, and 2014.
Impact of Derivative Instruments on the Statements of Operations
Unrealized gains and losses associated with changes in the fair value of derivative instruments not accounted for as cash flow hedges and ineffectiveness of hedge derivatives are reflected in current period earnings.
The following table summarizes the pre-tax effects of economic hedges that have not been designated as cash flow hedges, ineffectiveness on cash flow hedges and trading activity on the Company's statement of operations. The effect of energy commodity contracts is included within operating revenues and cost of operations and the effect of interest rate contracts is included in interest expense.
|
Three months ended September 30,
|
Nine months ended September 30,
|
||||||||||||||
|
2015
|
2014
|
2015
|
2014
|
||||||||||||
|
Unrealized mark-to-market results
|
(In millions)
|
||||||||||||||
|
Reversal of previously recognized unrealized gains on settled positions related to economic hedges
|
$
|
(29
|
)
|
$
|
(1
|
)
|
$
|
(179
|
)
|
$
|
(3
|
)
|
|||
|
Reversal of acquired gain positions related to economic hedges
|
(33
|
)
|
(87
|
)
|
(83
|
)
|
(249
|
)
|
|||||||
|
Net unrealized gains/(losses) on open positions related to economic hedges
|
55
|
|
162
|
|
(26
|
)
|
(61
|
)
|
|||||||
|
Total unrealized mark-to-market (losses)/gains for economic hedging activities
|
(7
|
)
|
74
|
|
(288
|
)
|
(313
|
)
|
|||||||
|
Reversal of previously recognized unrealized losses/(gains) on settled positions related to trading activity
|
2
|
|
(1
|
)
|
(34
|
)
|
4
|
|
|||||||
|
Reversal of acquired gain positions related to trading activity
|
(1
|
)
|
(8
|
)
|
(13
|
)
|
(28
|
)
|
|||||||
|
Net unrealized (losses)/gains on open positions related to trading activity
|
(2
|
)
|
15
|
|
—
|
|
45
|
|
|||||||
|
Total unrealized mark-to-market (losses)/gains for trading activity
|
(1
|
)
|
6
|
|
(47
|
)
|
21
|
|
|||||||
|
Total unrealized (losses)/gains
|
$
|
(8
|
)
|
$
|
80
|
|
$
|
(335
|
)
|
$
|
(292
|
)
|
|||
|
Three months ended September 30,
|
Nine months ended September 30,
|
||||||||||||||
|
2015
|
2014
|
2015
|
2014
|
||||||||||||
|
(In millions)
|
|||||||||||||||
|
Unrealized gains/(losses) included in operating revenues
|
$
|
34
|
|
$
|
159
|
|
$
|
(212
|
)
|
$
|
(205
|
)
|
|||
|
Unrealized losses included in cost of operations
|
(42
|
)
|
(79
|
)
|
(123
|
)
|
(87
|
)
|
|||||||
|
Total impact to statement of operations — energy commodities
|
$
|
(8
|
)
|
$
|
80
|
|
$
|
(335
|
)
|
$
|
(292
|
)
|
|||
|
Total impact to statement of operations — interest rate contracts
|
$
|
(9
|
)
|
$
|
1
|
|
$
|
12
|
|
$
|
(6
|
)
|
|||
The reversals of acquired gain or loss positions were valued based upon the forward prices on the acquisition date. The roll-off amounts were offset by realized gains or losses at the settled prices and are reflected in revenue or cost of operations during the same period.
30
For the
nine
months ended
September 30, 2015
, the
$26 million
unrealized loss from open economic hedge positions was primarily the result of a decrease in value of forward purchases of ERCOT electricity and coal due to decreases in ERCOT power and coal prices partially offset by an increase in value of forward sales of PJM electricity due to decreases in PJM power prices.
For the
nine
months ended
September 30, 2014
, the
$61 million
unrealized loss from open economic hedge positions was primarily the result of a decrease in value of forward sales of electricity due to increases in power prices and ERCOT heat rates.
Credit Risk Related Contingent Features
Certain of the Company's hedging agreements contain provisions that require the Company to post additional collateral if the counterparty determines that there has been deterioration in credit quality, generally termed “adequate assurance” under the agreements, or requires the Company to post additional collateral if there were a one notch downgrade in the Company's credit rating. The collateral required for contracts with adequate assurance clauses that are in a net liability position as of
September 30, 2015
, was
$137 million
. The collateral required for contracts with credit rating contingent features as of
September 30, 2015
, was
$41 million
. The Company is also a party to certain marginable agreements where NRG has a net liability position, but the counterparty has not called for the collateral due, which was approximately
$11 million
as of
September 30, 2015
.
See
Note 4
,
Fair Value of Financial Instruments
, to this Form 10-Q for discussion regarding concentration of credit risk.
Note 7
—
Impairments
2015 Impairment Losses
Huntley
—
During the three months ended September 30, 2015, the Company filed a notice with the NYSPSC of its intent to retire Huntley's operating units on March 1, 2016. The Company considered this to be an indicator of impairment and performed an impairment test for these assets under ASC 360,
Property, Plant and Equipment
. On October 14, 2015, the Company filed a cost-of-service filing at FERC in anticipation that the Huntley operating units would be needed for reliability purposes, proposing a reliability must run service agreement for a four-year period beginning on March 1, 2016. On October 30, 2015, NYISO released the results of its reliability study, indicating that the Huntley operating units are not needed for bulk system reliability, but could be needed for short-term local system reliability in 2016. The Company considered the impact of the reliability study conducted and evaluated the estimated cash flows associated with the facility, including the impact of a potential short-term reliability agreement with NYISO and National Grid. Accordingly, the Company determined that the carrying amount of the assets was higher than the estimated future net cash flows expected to be generated by the assets and that the assets were impaired. The fair value of the Huntley operating units was determined using a weighting of the income approach and the market approach. The income approach utilized estimates of discounted future cash flows, which were Level 3 fair value measurements, and include key inputs such as forecasted contract prices, forecasted operating expenses and discount rates. The Company recorded an impairment loss of
$106 million
during the quarter ended September 30, 2015.
Dunkirk
—
The Company had previously signed a ten year agreement in November 2014 with National Grid to add natural gas-burning capabilities at the Dunkirk facility. On August 25, 2015, NRG announced that Dunkirk Unit 2 will be mothballed on January 1, 2016 at the expiration of its reliability support services agreement. The project to add natural gas-burning capabilities has been suspended, pending the outcome of litigation with respect to the gas addition contract and its validity. On October 30, 2015, NYISO released the results of its reliability study, indicating that the Dunkirk facility is not needed for system reliability. In connection with the planned mothball of the facility, the pending litigation and the latest reliability assessment completed by NYISO, the Company evaluated whether the related fixed assets were impaired as of September 30, 2015. The Company determined that the carrying amount of the assets was higher than the estimated future net cash flows expected to be generated by the assets and that the assets were impaired. The fair value of the Dunkirk facility was determined using a weighting of the income approach and the market approach. The income approach utilized estimates of discounted future cash flows, which were Level 3 fair value measurements, and include key inputs such as forecasted contract prices, forecasted operating and capital expenditures and discount rates. The Company recorded an impairment loss of
$116 million
during the quarter ended September 30, 2015.
Goal Zero
—
During the three months ended September 30, 2015, the Company agreed to relieve the Goal Zero seller of all known and unknown claims in return for the seller's agreement to forego all contingent consideration. Concurrently, the Company determined that there was an indication of goodwill impairment and performed an impairment test under ASC 350,
Intangibles - Goodwill and Other.
The carrying amount of the reporting unit was higher than the fair value, and accordingly, the Company recognized an impairment loss of
$36 million
to reduce the carrying value of the goodwill that was recognized in connection with the acquisition.
2014 Impairment Losses
Osceola
— During the three months ended September 30, 2014, the Company determined that it would mothball the
463
MW natural gas-fired Osceola facility in Saint Cloud, Florida. The Company considered this to be an indicator of impairment and performed an impairment test for these assets under ASC 360,
Property, Plant and Equipment
. The carrying amount of the assets was higher than the future net cash flows expected to be generated by the assets and, as a result, the assets were considered to be impaired. The Company measured the impairment loss as the difference between the carrying amount and the fair value of the assets. Due to the location of the facility, it was determined that the best indicator of fair value is the market value of the combustion turbines. The Company recorded an impairment loss of approximately
$60 million
during the three months ended September 30, 2014, which represents the excess of the carrying value over the fair market value, and mothballed the facility effective January 1, 2015.
Solar Panels
—
During the three months ended September 30, 2014, the Company recorded an impairment loss of
$10 million
to reduce the carrying value of certain solar panels to their approximate fair value.
31
Note 8
—
Debt and Capital Leases
This footnote should be read in conjunction with the complete description under
Note 12
,
Debt and Capital Leases
, to the Company's
2014
Form 10-K. Long-term debt and capital leases consisted of the following:
|
(In millions, except rates)
|
September 30, 2015
|
December 31, 2014
|
September 30, 2015 interest rate %
(a)
|
|||||||
|
Recourse debt:
|
||||||||||
|
Senior notes, due 2018
|
$
|
1,130
|
|
$
|
1,130
|
|
7.625
|
|||
|
Senior notes, due 2020
|
1,063
|
|
1,063
|
|
8.250
|
|||||
|
Senior notes, due 2021
|
1,128
|
|
1,128
|
|
7.875
|
|||||
|
Senior notes, due 2022
|
1,100
|
|
1,100
|
|
6.250
|
|||||
|
Senior notes, due 2023
|
990
|
|
990
|
|
6.625
|
|||||
|
Senior notes, due 2024
|
1,000
|
|
1,000
|
|
6.250
|
|||||
|
Term loan facility, due 2018
|
1,968
|
|
1,983
|
|
L+2.00
|
|||||
|
Tax-exempt bonds
|
451
|
|
406
|
|
4.125 - 6.00
|
|||||
|
Subtotal NRG recourse debt
|
8,830
|
|
8,800
|
|
|
|||||
|
Non-recourse debt:
|
||||||||||
|
GenOn senior notes
|
2,097
|
|
2,133
|
|
7.875 - 9.875
|
|||||
|
GenOn Americas Generation senior notes
|
922
|
|
929
|
|
8.500 - 9.125
|
|||||
|
GenOn Other
|
57
|
|
60
|
|
various
|
|||||
|
Subtotal GenOn debt (non-recourse to NRG)
|
3,076
|
|
3,122
|
|
||||||
|
NRG Yield Operating LLC Senior Notes, due 2024
|
500
|
|
500
|
|
5.375
|
|||||
|
NRG Yield LLC and NRG Yield Operating LLC Revolving Credit Facility, due 2019
|
92
|
|
—
|
|
L+2.75
|
|||||
|
NRG Yield, Inc. Convertible Senior Notes, due 2019
|
329
|
|
326
|
|
3.500
|
|||||
|
NRG Yield, Inc. Convertible Senior Notes, due 2020
|
266
|
|
—
|
|
3.250
|
|||||
|
NRG West Holdings LLC, due 2023 (El Segundo Energy Center)
|
485
|
|
506
|
|
L+1.625 - L+2.25
|
|||||
|
NRG Marsh Landing, due 2017 and 2023
|
431
|
|
464
|
|
L+1.75 - L+1.875
|
|||||
|
Alta Wind I - V lease financing arrangements, due 2034 and 2035
|
1,013
|
|
1,036
|
|
5.696 - 7.015
|
|||||
|
Alta Wind X, due 2021
|
—
|
|
300
|
|
L+2.00
|
|||||
|
Alta Wind XI, due 2021
|
—
|
|
191
|
|
L+2.00
|
|||||
|
Walnut Creek, term loans due 2023
|
363
|
|
391
|
|
L+1.625
|
|||||
|
Tapestry Wind LLC, due 2021
|
184
|
|
192
|
|
L+1.625
|
|||||
|
Laredo Ridge Wind LLC, due 2028
|
105
|
|
108
|
|
L+1.875
|
|||||
|
NRG Solar Alpine LLC, due 2022
|
156
|
|
163
|
|
L+1.750
|
|||||
|
NRG Energy Center Minneapolis LLC, due 2017 and 2025
|
110
|
|
121
|
|
5.95 - 7.25
|
|||||
|
NRG Yield - other
|
475
|
|
489
|
|
various
|
|||||
|
Subtotal NRG Yield debt (non-recourse to NRG)
|
4,509
|
|
4,787
|
|
||||||
|
Ivanpah Financing, due 2033 and 2038
|
1,175
|
|
1,187
|
|
2.285 - 4.256
|
|||||
|
Agua Caliente Solar LLC, due 2037
|
894
|
|
898
|
|
2.395 - 3.633
|
|||||
|
CVSR High Plains Ranch II LLC, due 2037
|
794
|
|
815
|
|
2.339 - 3.775
|
|||||
|
Viento Funding II LLC, due 2023
|
193
|
|
196
|
|
L+2.75
|
|||||
|
NRG Peaker Finance Co. LLC, bonds due 2019
|
102
|
|
100
|
|
L+1.07
|
|||||
|
Cedro Hill Wind LLC, due 2025
|
104
|
|
111
|
|
L+3.125
|
|||||
|
NRG - other
|
364
|
|
350
|
|
various
|
|||||
|
Subtotal other NRG non-recourse debt
|
3,626
|
|
3,657
|
|
||||||
|
Subtotal all non-recourse debt
|
11,211
|
|
11,566
|
|
||||||
|
Subtotal long-term debt (including current maturities)
|
20,041
|
|
|
20,366
|
|
|||||
|
Capital leases:
|
||||||||||
|
Home Solar capital leases
|
10
|
|
5
|
|
various
|
|||||
|
Chalk Point capital lease, due 2015
|
1
|
|
—
|
|
8.190
|
|||||
|
Other
|
3
|
|
3
|
|
various
|
|||||
|
Subtotal long-term debt and capital leases (including current maturities)
|
20,055
|
|
|
20,374
|
|
|||||
|
Less current maturities
|
457
|
|
|
474
|
|
|||||
|
Total long-term debt and capital leases
|
$
|
19,598
|
|
|
$
|
19,900
|
|
|||
(a) As of
September 30, 2015
, L+ equals
3 month LIBOR
plus x%, with the exception of the Viento Funding II term loan, which is 6 month LIBOR plus x%, and the NRG Marsh Landing term loan, Walnut Creek term loan, and NRG Yield Operating LLC Revolving Credit facility, which are
1 month LIBOR
plus x%.
32
NRG Recourse Debt
Senior Notes
Issuance of 2022 Senior Notes
On January 27, 2014, NRG issued
$1.1 billion
in aggregate principal amount at par of
6.25%
senior notes due 2022. The notes are senior unsecured obligations of NRG and are guaranteed by certain of its subsidiaries. Interest is payable semi-annually beginning on July 15, 2014, until the maturity date of July 15, 2022. The proceeds were utilized to redeem the
8.5%
and
7.625%
2019 Senior Notes, as discussed below, and to fund the acquisition of EME.
Issuance of 2024 Senior Notes
On April 21, 2014, NRG issued
$1.0 billion
in aggregate principal amount at par of
6.25%
senior notes due 2024. The notes are senior unsecured obligations of NRG and are guaranteed by certain of its subsidiaries. Interest is payable semi-annually beginning on November 1, 2014, until the maturity date of November 1, 2024. A portion of the cash proceeds were used to redeem all remaining of its
7.625%
2019 Senior Notes, as discussed below, and the rest of the proceeds were used to redeem all remaining
$225 million
of its
8.5%
2019 Senior Notes in September 2014.
Redemptions of 8.5% and 7.625% 2019 Senior Notes
On February 10, 2014, the Company redeemed
$308 million
of its
8.5%
2019 Senior Notes and
$91 million
of its
7.625%
2019 Senior Notes through a tender offer, at an average early redemption percentage of
106.992%
and
105.500%
, respectively. A
$33 million
loss on debt extinguishment of the
8.5%
and
7.625%
2019 Senior Notes was recorded during the three months ended March 31, 2014, primarily consisting of the premiums paid on the redemption and the write-off of previously deferred financing costs.
On April 21, 2014, the Company redeemed
$74 million
of its
8.5%
2019 Senior Notes and
$337 million
of its
7.625%
2019 Senior Notes through a tender offer and call, at an average early redemption percentage of
105.250%
and
104.200%
, respectively. A
$22 million
loss on debt extinguishment of the
8.5%
and
7.625%
2019 Senior Notes was recorded during the three months ended June 30, 2014, primarily consisting of the premiums paid on the redemption and the write-off of previously deferred financing costs.
On May 21, 2014, the Company redeemed for cash all of its remaining
7.625%
2019 Senior Notes at an average early redemption percentage of
103.813%
. An
$18 million
loss on debt extinguishment of the
7.625%
2019 Senior Notes was recorded during the three months ended June 30, 2014, primarily consisting of the premiums paid on the redemption and the write-off of previously deferred financing costs.
On September 3, 2014, the Company redeemed for cash all of its remaining
8.5%
2019 Senior Notes at an average early redemption percentage of
104.25%
. A
$13 million
loss on debt extinguishment of the
8.5%
2019 Senior Notes was recorded during the three months ended September 30, 2014, primarily consisting of the premiums paid on the redemption and the write-off of previously deferred financing costs.
NRG Non-Recourse Debt
The Company has non-recourse debt that is secured by acquired or developed projects that are held in several of its subsidiaries. In the event of a bankruptcy, receivership, liquidation or similar event involving a subsidiary, the assets of such subsidiary would be used to satisfy claims of creditors of the subsidiary, including liabilities under the non-recourse debt associated with such subsidiaries, rather than the creditors of NRG. As described in Note 3,
Business Acquisitions and Dispositions,
through the Company's acquisitions of EME on April 1, 2014 and Alta Wind on August 12, 2014, the Company acquired approximately
$1.2 billion
and
$1.6 billion
, respectively, of non-recourse debt.
Alta Wind X and Alta Wind XI due 2021
On June 30, 2015, the Company entered into a tax equity financing arrangement through which Yield Operating, a subsidiary of NRG Yield, Inc., received
$119 million
in net proceeds, as described in Note 2,
Summary of Significant Accounting Policies
. These proceeds, as well as proceeds obtained from the June 29, 2015, NRG Yield, Inc. common stock issuance and the 2020 Convertible Notes issuance, were utilized to repay all of the outstanding project indebtedness associated with Alta Wind X and Alta Wind XI facilities. The Company also settled interest rate swaps associated with the project level debt for Alta Wind X and Alta Wind XI and incurred a fee of
$17 million
.
33
NRG Yield, Inc. Convertible Notes
On June 29, 2015, NRG Yield, Inc. closed on its offering of
$287.5 million
aggregate principal amount of
3.25%
Convertible Senior Notes due 2020, or the 2020 Convertible Notes. The 2020 Convertible Notes are convertible, under certain circumstances, into NRG Yield, Inc. Class C common stock, cash or a combination thereof at an initial conversion price of
$27.50
per Class C common share, which is equivalent to an initial conversion rate of approximately
36.3636
shares of Class C common stock per
$1,000
principal amount of notes. Interest on the 2020 Convertible Notes is payable semi-annually in arrears on June 1 and December 1 of each year, commencing on December 1, 2015. The 2020 Convertible Notes mature on June 1, 2020, unless earlier repurchased or converted in accordance with their terms. Prior to the close of business on the business day immediately preceding December 1, 2019, the 2020 Convertible Notes will be convertible only upon the occurrence of certain events and during certain periods, and thereafter, at any time until the close of business on the second scheduled trading day immediately preceding the maturity date. The 2020 Convertible Notes are accounted for in accordance with ASC 470-20. Under ASC 470-20, issuers of convertible debt instruments that may be settled in cash upon conversion, including partial cash settlement, are required to separately account for the liability (debt) and equity (conversion option) components. The equity component, the
$23 million
conversion option value, was recorded to NRG's noncontrolling interest for NRG Yield, Inc. with the offset to debt discount. The debt discount will be amortized to interest expense over the term of the notes.
During the first quarter of 2014, NRG Yield, Inc. closed on its offering of
$345 million
aggregate principal amount of
3.50%
Convertible Senior Notes due 2019, or the 2019 Convertible Notes. The 2019 Convertible Notes were convertible, under certain circumstances, into NRG Yield, Inc. Class A common stock, cash or a combination thereof at an initial conversion rate of approximately
21.4822
shares of Class A common stock per
$1,000
principal amount of 2019 Convertible Notes. Effective May 15, 2015, the conversion rate was adjusted to
42.9644
shares of Class A common stock per
$1,000
principal amount of 2019 Convertible Notes in accordance with the terms of the related indenture. Interest on the 2019 Convertible Notes is payable semi-annually in arrears on February 1 and August 1 of each year, commencing on August 1, 2014. The 2019 Convertible Notes mature on February 1, 2019, unless earlier repurchased or converted in accordance with their terms. Prior to the close of business on the business day immediately preceding August 1, 2018, the 2019 Convertible Notes will be convertible only upon the occurrence of certain events and during certain periods, and thereafter, at any time until the close of business on the second scheduled trading day immediately preceding the maturity date. The notes are accounted for in accordance with ASC 470-20. The equity component, the
$23 million
conversion option value, was recorded to NRG's noncontrolling interest for NRG Yield, Inc. with the offset to debt discount. The debt discount will be amortized to interest expense over the term of the notes.
NRG Yield LLC and NRG Yield Operating LLC Revolving Credit Facility
On June 26, 2015, the Company amended the revolving credit facility to, among other things, increase the availability from
$450 million
to
$495 million
. As of September 30, 2015,
$92 million
of borrowings and
$25 million
of letters of credit were outstanding.
NRG West Holdings LLC
On May 29, 2015, NRG West Holdings LLC amended its financing agreement to increase borrowings under the Tranche A facility by
$5 million
and to reduce the related interest rate to
LIBOR
plus an applicable margin of
1.625%
from May 29, 2015, to August 31, 2017,
LIBOR
plus an applicable margin of
1.75%
from September 1, 2017, to August 31, 2020, and
LIBOR
plus
1.875%
from September 1, 2020, through the maturity date; and to reduce Tranche B loan interest rate to
LIBOR
plus an applicable margin of
2.25%
from May 29, 2015, to August 31, 2017,
LIBOR
plus
2.375%
from September 1, 2017, to August 31, 2020, and
LIBOR
plus an applicable margin of
2.50%
from September 1, 2020, through the maturity date and to reduce the working capital facility by
$9 million
. The proceeds of the increased borrowing were used to pay costs associated with the refinancing. Further, the amendment resulted in a
$7 million
loss on debt extinguishment.
Peakers
On February 21, 2014, NRG Peaker Finance Company LLC elected to redeem approximately
$30 million
of the outstanding bonds at a redemption price equal to the principal amount plus a redemption premium, accrued and unpaid interest, swap breakage, and other fees, totaling approximately
$35 million
in connection with the removal of Bayou Cove Peaking Power LLC from the Peaker financing collateral package, which also involved limited commitments for certain repairs on other assets that were funded concurrently with the December 10, 2013, debt service payment. On March 3, 2014, Bayou Cove Peaking Power LLC sold Bayou Cove Unit 1, which the Company continues to manage and operate.
34
High Lonesome Mesa Facility
Prior to the Company's acquisition of EME, an intercompany tax credit agreement related to the High Lonesome Mesa facility was terminated. The termination resulted in an event of default under the project financing arrangement. The Company received additional default notices for various items. As a result of the default, the balance under the project financing arrangement is classified as current. On November 3, 2015, the lender sent a notice of acceleration of such amount and indicated that it will accept the Company's interest in the assets in lieu of repayment. The Company is currently evaluating its options with respect to this notification.
Note 9
—
Variable Interest Entities, or VIEs
Entities that are not Consolidated
NRG has interests in entities that are considered VIEs under ASC 810,
Consolidation
, but NRG is not considered the primary beneficiary. NRG accounts for its interests in these entities under the equity method of accounting.
GenConn Energy LLC
—
Through its consolidated subsidiary, Yield Operating, the Company owns a
50%
interest in GCE Holding LLC, the owner of GenConn, which owns and operates
two
190
MW peaking generation facilities in Connecticut at NRG's Devon and Middletown sites. NRG's maximum exposure to loss is limited to its equity investment, which was
$110 million
as of
September 30, 2015
.
Sherbino I Wind Farm LLC
—
NRG owns a
50%
interest in Sherbino, a joint venture with BP Wind Energy North America Inc. NRG's maximum exposure to loss is limited to its equity investment, which was
$80 million
as of
September 30, 2015
.
Entities that are Consolidated
Capistrano Wind Partners
—
Through the acquisition of EME, the Company has a controlling financial interest in Capistrano Wind Partners, whose Class B preferred equity interests are held by outside investors. Capistrano Wind Partners holds
100%
ownership in
five
projects generating
411
MW of wind capacity. The
five
wind projects include Cedro Hill located in Texas, Mountain Wind Power I located in Wyoming, Mountain Wind Power II located in Wyoming, Crofton Bluffs located in Nebraska, and Broken Bow I located in Nebraska.
Under the terms of the Capistrano Wind Partners formation documents, the holders of the Class B preferred equity interests receive
100%
of the cash available for distribution, up to a scheduled amount to target a certain return and thereafter cash distributions are shared. The Company retains indirect beneficial ownership of the wind projects and retains responsibilities for managing the operations of Capistrano Wind Partners. Accordingly, the Company consolidates these projects. The Company does not consolidate Capistrano Wind Partners for tax purposes.
The summarized financial information for Capistrano Wind Holdings, the parent company of Capistrano Wind Partners, consisted of the following:
|
(In millions)
|
September 30, 2015
|
||
|
Current assets
|
$
|
23
|
|
|
Net property, plant and equipment
|
563
|
|
|
|
Other long-term assets
|
127
|
|
|
|
Total assets
|
713
|
|
|
|
Current liabilities
|
38
|
|
|
|
Long-term debt
|
175
|
|
|
|
Other long-term liabilities
|
154
|
|
|
|
Total liabilities
|
367
|
|
|
|
Noncontrolling interests
|
336
|
|
|
|
Net assets less noncontrolling interests
|
$
|
10
|
|
35
Note 10
—
Changes in Capital Structure
As of
September 30, 2015
, and
December 31, 2014
, the Company had
500,000,000
shares of common stock authorized. The following table reflects the changes in NRG's common stock issued and outstanding:
|
Issued
|
Treasury
|
Outstanding
|
||||||
|
Balance as of December 31, 2014
|
415,506,176
|
|
(78,843,552
|
)
|
336,662,624
|
|
||
|
Shares issued under LTIPs
|
1,419,704
|
|
—
|
|
1,419,704
|
|
||
|
Shares issued under ESPP
|
—
|
|
283,139
|
|
283,139
|
|
||
|
Shares repurchased under Capital Allocation Program
|
—
|
|
(18,630,575
|
)
|
(18,630,575
|
)
|
||
|
Balance as of September 30, 2015
|
416,925,880
|
|
(97,190,988
|
)
|
319,734,892
|
|
||
Employee Stock Purchase Plan
As of
September 30, 2015
, there were
1,276,913
shares of treasury stock available for issuance under the ESPP.
NRG Common Stock Dividends
The following table lists the dividends paid during the
nine
months ended
September 30, 2015
:
|
Third Quarter 2015
|
Second Quarter 2015
|
|
First Quarter 2015
|
||||||||
|
Dividends per Common Share
|
$
|
0.145
|
|
$
|
0.145
|
|
|
$
|
0.145
|
|
|
On
October 12, 2015
, NRG declared a quarterly dividend on the Company's common stock of
$0.145
per share, payable
November 16, 2015
, to stockholders of record as of November 2, 2015, representing
$0.58
per share on an annualized basis.
The Company's common stock dividends are subject to available capital, market conditions, and compliance with associated laws, regulations and other contractual obligations.
2015 Capital Allocation Program
Beginning December 2014 through September 2015, the Company's board of directors authorized share repurchases of
$481 million
of its common stock under the 2015 Capital Allocation Program.
The following table reflects the repurchases made under the 2015 Capital Allocation Program:
|
Total number of shares purchased
|
Average price paid per share
(a)
|
Amounts paid for shares purchased
(in millions)
(a)
|
|||||||||
|
2015 Capital Allocation Program
|
|||||||||||
|
Fourth Quarter 2014
|
1,624,360
|
|
$
|
26.95
|
|
$
|
44
|
|
|||
|
First Quarter 2015
|
3,146,484
|
|
25.15
|
|
79
|
|
|||||
|
Second Quarter 2015
|
4,379,907
|
|
24.53
|
|
107
|
|
|||||
|
Third Quarter 2015
|
11,104,184
|
|
15.06
|
|
167
|
|
|||||
|
Fourth Quarter 2015
|
5,558,920
|
|
15.03
|
|
84
|
|
|||||
|
Total Repurchases under 2015 Capital Allocation Program
|
25,813,855
|
|
$
|
481
|
|
||||||
(a) The average price paid per share and amounts paid for shares purchased exclude the commissions of
$0.015
per share paid in connection with the share repurchase.
36
Note 11
—
Earnings/(Loss) Per Share
Basic earnings/(loss) per common share is computed by dividing net income/(loss) less accumulated preferred stock dividends by the weighted average number of common shares outstanding. Shares issued and treasury shares repurchased during the year are weighted for the portion of the year that they were outstanding. Diluted earnings/(loss) per share is computed in a manner consistent with that of basic earnings/(loss) per share while giving effect to all potentially dilutive common shares that were outstanding during the period. The reconciliation of NRG's basic and diluted earnings/(loss) per share is shown in the following table:
|
Three months ended September 30,
|
Nine months ended September 30,
|
||||||||||||||
|
(In millions, except per share data)
|
2015
|
2014
|
2015
|
2014
|
|||||||||||
|
Basic earnings/(loss) per share attributable to NRG Energy, Inc. common stockholders
|
|||||||||||||||
|
Net income/(loss) attributable to NRG Energy, Inc.
|
$
|
66
|
|
$
|
168
|
|
$
|
(68
|
)
|
$
|
15
|
|
|||
|
Dividends for preferred shares
|
5
|
|
2
|
|
15
|
|
7
|
|
|||||||
|
Income/(loss) available for common stockholders
|
$
|
61
|
|
|
$
|
166
|
|
|
$
|
(83
|
)
|
|
$
|
8
|
|
|
Weighted average number of common shares outstanding - basic
|
331
|
|
338
|
|
|
334
|
|
333
|
|
||||||
|
Earnings/(loss) per weighted average common share — basic
|
$
|
0.18
|
|
$
|
0.49
|
|
$
|
(0.25
|
)
|
$
|
0.02
|
|
|||
|
Diluted earnings/(loss) per share attributable to NRG Energy, Inc. common stockholders
|
|||||||||||||||
|
Weighted average number of common shares outstanding
|
331
|
|
338
|
|
334
|
|
333
|
|
|||||||
|
Incremental shares attributable to the issuance of equity compensation (treasury stock method)
|
1
|
|
5
|
|
—
|
|
5
|
|
|||||||
|
Total dilutive shares
|
332
|
|
343
|
|
334
|
|
338
|
|
|||||||
|
Earnings/(loss) per weighted average common share — diluted
|
$
|
0.18
|
|
$
|
0.48
|
|
$
|
(0.25
|
)
|
$
|
0.02
|
|
|||
The following table summarizes NRG’s outstanding equity instruments that are anti-dilutive and were not included in the computation of the Company’s diluted earnings/(loss) per share:
|
Three months ended September 30,
|
Nine months ended September 30,
|
||||||||||
|
(In millions of shares)
|
2015
|
2014
|
2015
|
2014
|
|||||||
|
Equity compensation plans
|
3
|
|
1
|
|
6
|
|
1
|
|
|||
|
Embedded derivative of 2.822% redeemable perpetual preferred stock
(a)
|
16
|
|
16
|
|
16
|
|
16
|
|
|||
|
Total
|
19
|
|
17
|
|
22
|
|
17
|
|
|||
(a)
As of
September 30, 2014
, the redeemable perpetual preferred stock had an interest rate of
3.625%
.
37
Note 12
—
Segment Reporting
Effective in December 2014, the Company's segment structure and its allocation of corporate expenses were updated to reflect how management currently makes financial decisions and allocates resources. The Company has recast data from prior periods to reflect this change in reportable segments to conform to the current year presentation. The Company's businesses are segregated as follows: NRG Business, which includes conventional power generation and the carbon capture business; NRG Home, which includes NRG Home Retail, consisting of Mass market retail products and services, and NRG Home Solar, which includes the installation and leasing of residential solar systems and the sale of solar energy services; NRG Renew, which includes solar and wind assets, excluding those in the NRG Yield segment; NRG Yield; and corporate activities. NRG Yield includes certain of the Company's contracted generation assets. On January 2, 2015, NRG Yield, Inc. acquired three projects from the Company: Walnut Creek formerly in the NRG Business segment, the Tapestry projects (Buffalo Bear, Pinnacle and Taloga) and Laredo Ridge, both formerly in the NRG Renew segment. As the transaction was accounted for as a transfer of entities under common control, all historical periods have been recast to reflect this change. The Company's corporate segment includes international business and electric vehicle services. Intersegment sales are accounted for at market.
NRG’s chief operating decision maker, its chief executive officer, evaluates the performance of its segments based on operational measures including adjusted earnings before interest, taxes, depreciation and amortization, or Adjusted EBITDA, free cash flow and capital for allocation, as well as net income/(loss) and net income/(loss) attributable to NRG Energy, Inc.
|
|
|
NRG Home
|
|
|
|||||||||||||||||||||||||||
|
NRG Business
(a)
|
Retail
(a)
|
Solar
|
NRG Renew
(a)
|
NRG Yield
(b)
|
Corporate
(a)
|
Eliminations
|
Total
|
||||||||||||||||||||||||
|
Three months ended September 30, 2015
|
(in millions)
|
||||||||||||||||||||||||||||||
|
Operating revenues
(a)
|
$
|
2,723
|
|
$
|
1,699
|
|
$
|
4
|
|
$
|
168
|
|
$
|
209
|
|
$
|
(3
|
)
|
$
|
(369
|
)
|
$
|
4,431
|
|
|||||||
|
Depreciation and amortization
|
220
|
|
30
|
|
8
|
|
65
|
|
50
|
|
9
|
|
—
|
|
382
|
|
|||||||||||||||
|
Impairment charges
|
222
|
|
36
|
|
—
|
|
5
|
|
—
|
|
—
|
|
—
|
|
263
|
|
|||||||||||||||
|
Equity in earnings of unconsolidated affiliates
|
7
|
|
—
|
|
—
|
|
—
|
|
19
|
|
3
|
|
(5
|
)
|
24
|
|
|||||||||||||||
|
Income/(Loss) before income taxes
|
165
|
|
196
|
|
(50
|
)
|
(14
|
)
|
42
|
|
(222
|
)
|
(3
|
)
|
114
|
|
|||||||||||||||
|
Net Income/(Loss)
|
164
|
|
196
|
|
(50
|
)
|
(10
|
)
|
34
|
|
(264
|
)
|
(3
|
)
|
67
|
|
|||||||||||||||
|
Net Income/(Loss) attributable to NRG Energy, Inc.
|
$
|
164
|
|
$
|
196
|
|
$
|
(45
|
)
|
$
|
(27
|
)
|
$
|
22
|
|
$
|
(266
|
)
|
$
|
22
|
|
$
|
66
|
|
|||||||
|
Total assets as of September 30, 2015
|
$
|
25,609
|
|
$
|
7,092
|
|
$
|
197
|
|
$
|
6,981
|
|
$
|
6,989
|
|
$
|
28,145
|
|
$
|
(35,025
|
)
|
$
|
39,988
|
|
|||||||
|
(a) Operating revenues include inter-segment sales and net derivative gains and losses of:
|
$
|
309
|
|
$
|
1
|
|
$
|
—
|
|
$
|
9
|
|
$
|
—
|
|
$
|
50
|
|
$
|
—
|
|
$
|
369
|
|
|||||||
|
(b) Includes loss on debt extinguishment of:
|
$
|
—
|
|
$
|
—
|
|
$
|
—
|
|
$
|
—
|
|
$
|
2
|
|
$
|
—
|
|
$
|
—
|
|
$
|
2
|
|
|||||||
|
|
|
NRG Home
|
|
|
|||||||||||||||||||||||||||
|
NRG Business
(c)
|
Retail
(c)
|
Solar
|
NRG Renew
(c)
|
NRG Yield
|
Corporate
(c)(d)
|
Eliminations
|
Total
|
||||||||||||||||||||||||
|
Three months ended September 30, 2014
|
(in millions)
|
||||||||||||||||||||||||||||||
|
Operating revenues
(c)
|
$
|
3,093
|
|
$
|
1,775
|
|
$
|
13
|
|
$
|
154
|
|
$
|
184
|
|
$
|
14
|
|
$
|
(664
|
)
|
$
|
4,569
|
|
|||||||
|
Depreciation and amortization
|
238
|
|
31
|
|
2
|
|
61
|
|
34
|
|
9
|
|
—
|
|
375
|
|
|||||||||||||||
|
Impairment charges
|
60
|
|
—
|
|
—
|
|
10
|
|
—
|
|
—
|
|
—
|
|
70
|
|
|||||||||||||||
|
Equity in earnings/(loss) of unconsolidated affiliates
|
13
|
|
—
|
|
—
|
|
(2
|
)
|
11
|
|
—
|
|
(4
|
)
|
18
|
|
|||||||||||||||
|
Income/(Loss) before income taxes
|
392
|
|
121
|
|
(27
|
)
|
(22
|
)
|
49
|
|
(254
|
)
|
12
|
|
271
|
|
|||||||||||||||
|
Net Income/(Loss)
|
392
|
|
121
|
|
(27
|
)
|
(22
|
)
|
39
|
|
(333
|
)
|
12
|
|
182
|
|
|||||||||||||||
|
Net Income/(Loss) attributable to NRG Energy, Inc.
|
$
|
392
|
|
$
|
121
|
|
$
|
(27
|
)
|
$
|
(34
|
)
|
$
|
33
|
|
$
|
(339
|
)
|
$
|
22
|
|
$
|
168
|
|
|||||||
|
(c) Operating revenues include inter-segment sales and net derivative gains and losses of:
|
$
|
595
|
|
$
|
1
|
|
$
|
—
|
|
$
|
6
|
|
$
|
—
|
|
$
|
62
|
|
$
|
—
|
|
$
|
664
|
|
|||||||
|
(d) Includes loss on debt extinguishment of:
|
$
|
—
|
|
$
|
—
|
|
$
|
—
|
|
$
|
—
|
|
$
|
—
|
|
$
|
13
|
|
$
|
—
|
|
$
|
13
|
|
|||||||
38
|
|
|
NRG Home
|
|
|
|||||||||||||||||||||||||||
|
NRG Business
(e)
|
Retail
(e)
|
Solar
|
NRG Renew
(e)
|
NRG Yield
(e)(f)
|
Corporate
(e)
|
Eliminations
|
Total
|
||||||||||||||||||||||||
|
Nine months ended September 30, 2015
|
(in millions)
|
||||||||||||||||||||||||||||||
|
Operating revenues
(e)
|
$
|
7,334
|
|
$
|
4,308
|
|
$
|
19
|
|
$
|
423
|
|
$
|
606
|
|
$
|
(9
|
)
|
$
|
(1,027
|
)
|
$
|
11,654
|
|
|||||||
|
Depreciation and amortization
|
682
|
|
93
|
|
18
|
|
193
|
|
163
|
|
24
|
|
—
|
|
1,173
|
|
|||||||||||||||
|
Impairment charges
|
222
|
|
36
|
|
—
|
|
5
|
|
—
|
|
—
|
|
—
|
|
263
|
|
|||||||||||||||
|
Equity in earnings/(loss) of unconsolidated affiliates
|
7
|
|
—
|
|
—
|
|
(2
|
)
|
29
|
|
3
|
|
(8
|
)
|
29
|
|
|||||||||||||||
|
Income/(Loss) before income taxes
|
193
|
|
512
|
|
(149
|
)
|
(96
|
)
|
67
|
|
(640
|
)
|
(8
|
)
|
(121
|
)
|
|||||||||||||||
|
Net Income/(Loss)
|
192
|
|
512
|
|
(149
|
)
|
(83
|
)
|
59
|
|
(601
|
)
|
(8
|
)
|
(78
|
)
|
|||||||||||||||
|
Net Income/(loss) attributable to NRG Energy, Inc.
|
$
|
192
|
|
$
|
512
|
|
$
|
(143
|
)
|
$
|
(109
|
)
|
$
|
35
|
|
$
|
(579
|
)
|
$
|
24
|
|
$
|
(68
|
)
|
|||||||
|
(e) Operating revenues include inter-segment sales and net derivative gains and losses of:
|
$
|
850
|
|
$
|
5
|
|
$
|
—
|
|
$
|
32
|
|
$
|
9
|
|
$
|
131
|
|
$
|
—
|
|
$
|
1,027
|
|
|||||||
|
(f) Includes loss on debt extinguishment of:
|
$
|
—
|
|
$
|
—
|
|
$
|
—
|
|
$
|
—
|
|
$
|
9
|
|
$
|
—
|
|
$
|
—
|
|
$
|
9
|
|
|||||||
|
|
|
NRG Home
|
|
|
|||||||||||||||||||||||||||
|
NRG Business
(g)
|
Retail
(g)
|
Solar
|
NRG Renew
(g)(h)
|
NRG Yield
|
Corporate
(g)(h)
|
Eliminations
|
Total
|
||||||||||||||||||||||||
|
Nine months ended September 30, 2014
|
(in millions)
|
||||||||||||||||||||||||||||||
|
Operating revenues
(g)
|
$
|
7,974
|
|
$
|
4,260
|
|
$
|
38
|
|
$
|
360
|
|
$
|
497
|
|
$
|
38
|
|
$
|
(1,491
|
)
|
$
|
11,676
|
|
|||||||
|
Depreciation and amortization
|
702
|
|
92
|
|
4
|
|
161
|
|
112
|
|
25
|
|
—
|
|
1,096
|
|
|||||||||||||||
|
Impairment charges
|
60
|
|
—
|
|
—
|
|
10
|
|
—
|
|
—
|
|
—
|
|
70
|
|
|||||||||||||||
|
Equity in earnings/(loss) of unconsolidated affiliates
|
29
|
|
—
|
|
—
|
|
(8
|
)
|
26
|
|
3
|
|
(11
|
)
|
39
|
|
|||||||||||||||
|
Income/(Loss) before income taxes
|
486
|
|
256
|
|
(36
|
)
|
(85
|
)
|
122
|
|
(778
|
)
|
2
|
|
(33
|
)
|
|||||||||||||||
|
Net Income/(Loss)
|
$
|
485
|
|
$
|
256
|
|
$
|
(36
|
)
|
$
|
(85
|
)
|
$
|
107
|
|
$
|
(694
|
)
|
$
|
2
|
|
35
|
|
||||||||
|
Net Income/(Loss) attributable to NRG Energy, Inc.
|
$
|
485
|
|
$
|
256
|
|
$
|
(36
|
)
|
$
|
(100
|
)
|
$
|
91
|
|
$
|
(709
|
)
|
$
|
28
|
|
$
|
15
|
|
|||||||
|
(g) Operating revenues include inter-segment sales and net derivative gains and losses of:
|
$
|
1,420
|
|
$
|
5
|
|
$
|
—
|
|
$
|
21
|
|
$
|
—
|
|
$
|
45
|
|
|
$
|
1,491
|
|
|||||||
|
(h) Includes loss on debt extinguishment of:
|
$
|
—
|
|
$
|
—
|
|
$
|
—
|
|
$
|
1
|
|
$
|
—
|
|
$
|
93
|
|
|
$
|
94
|
|
|||||||
Note 13
—
Income Taxes
Effective Tax Rate
The income tax provision consisted of the following:
|
|
Three months ended September 30,
|
Nine months ended September 30,
|
|||||||||||||
|
(In millions except otherwise noted)
|
2015
|
2014
|
2015
|
2014
|
|||||||||||
|
Income/(loss) before income taxes
|
$
|
114
|
|
$
|
271
|
|
$
|
(121
|
)
|
$
|
(33
|
)
|
|||
|
Income tax expense/(benefit)
|
47
|
|
89
|
|
(43
|
)
|
(68
|
)
|
|||||||
|
Effective tax rate
|
41.2
|
%
|
32.8
|
%
|
35.5
|
%
|
206.1
|
%
|
|||||||
For the
three
months ended
September 30, 2015
, NRG's overall effective tax rate was different than the statutory rate of
35%
primarily due to non deductible impairment of goodwill, partially offset by production tax credits generated from the Company's wind assets.
39
For the
nine
month ended
September 30, 2015
, NRG's overall effective tax rate was different than the statutory rate of
35%
primarily due to the impact of production tax credits generated from the Company's wind assets, partially offset by tax expense attributable to consolidated partnerships.
For the
three
and
nine
months ended
September 30, 2014
, NRG's overall effective tax rate was different than the statutory rate of
35%
primarily due to the impact of production tax credits generated from the Company's wind assets and a benefit resulting from the recognition of previously uncertain tax benefits that were settled upon IRS audit during the second quarter of 2014.
Uncertain Tax Benefits
As of
September 30, 2015
, NRG has recorded a non-current tax liability of
$57 million
for uncertain tax benefits from positions taken on various state income tax returns, including accrued interest. For the
nine
months ended
September 30, 2015
, NRG accrued
$1 million
of interest relating to the uncertain tax benefits. As of
September 30, 2015
, NRG had cumulative interest and penalties related to these uncertain tax benefits of
$7 million
. The Company recognizes interest and penalties related to uncertain tax benefits in income tax expense.
NRG is subject to examination by taxing authorities for income tax returns filed in the U.S. federal jurisdiction and various state and foreign jurisdictions including operations located in Australia. The Company is not subject to U.S. federal income tax examinations for years prior to 2011. With few exceptions, state and local income tax examinations are no longer open for years before 2009. The Company's primary foreign operations are also no longer subject to examination by local jurisdictions for years prior to 2010.
Note 14
—
Commitments and Contingencies
This footnote should be read in conjunction with the complete description under
Note 22
,
Commitments and Contingencies
, to the Company's
2014
Form 10-K.
Commitments
First Lien Structure
— NRG has granted first liens to certain counterparties on a substantial portion of the Company's assets, excluding assets acquired in the GenOn and EME (including Midwest Generation) acquisitions, assets held by NRG Yield, Inc. and NRG's assets that have project-level financing, to reduce the amount of cash collateral and letters of credit that it would otherwise be required to post from time to time to support its obligations under out-of-the-money hedge agreements for forward sales of power or MWh equivalents. The Company's lien counterparties may have a claim on NRG's assets to the extent market prices exceed the hedged price. As of
September 30, 2015
, hedges under the first liens were
in-the-money
for NRG on a counterparty aggregate basis.
Nuclear Insurance
— STP maintains required insurance coverage for liability claims arising from nuclear incidents pursuant to the Price-Anderson Act. As a result of one reactor obtaining its Nuclear Regulatory Operating License in the U.S., the current per reactor liability limits under the Price-Anderson Act have changed. Effective October 22, 2015, the current liability limit per incident is
$13.5 billion
, subject to change to account for the effects of inflation and the number of licensed reactors. An inflation adjustment must be made at least once every five years with the most recent adjustment effective September 2013. Under the Price-Anderson Act, owners of nuclear power plants in the U.S. are required to purchase primary insurance limits of
$375 million
for each operating site. In addition, the Price-Anderson Act requires an additional layer of protection through mandatory participation in a retrospective rating plan for power reactors resulting in an additional
$13.5 billion
in funds available for public liability claims. The current maximum assessment per incident, per reactor, is approximately
$127 million
, taking into account a
5%
adjustment for administrative fees, payable at approximately
$19 million
per year, per reactor. NRG would be responsible for
44%
of the maximum assessment, or
$8 million
per year, per reactor, and a maximum of
$112 million
per incident. In addition, the U.S. Congress retains the ability to impose additional financial requirements on the nuclear industry to pay liability claims that exceed
$13.5 billion
for a single incident. The liabilities of the co-owners of STP with respect to the retrospective premium assessments for nuclear liability insurance are joint and several.
Ivanpah Energy Production Guarantee
— The Company's PPAs with PG&E with respect to the Ivanpah project contain provisions for contract quantity and guaranteed energy production, which require that Ivanpah units 1 and 3 deliver to PG&E no less than the guaranteed energy production amount specified in the PPAs in any period of twenty-four consecutive months, or performance measurement period, during the term of the PPAs. If either of Ivanpah units 1 and 3 deliver less than the guaranteed energy production amount in any performance measurement period, PG&E may, at its option, declare an event of default. Based on the energy production amount since January 2014, the Company expects that the units will not meet their guaranteed energy production amount for the initial performance measurement period. The Company is exploring options to mitigate this risk or its consequences.
Contingencies
The Company's material legal proceedings are described below. The Company believes that it has valid defenses to these legal proceedings and intends to defend them vigorously. NRG records reserves for estimated losses from contingencies when information available indicates that a loss is probable and the amount of the loss, or range of loss, can be reasonably estimated. In addition, legal costs are expensed as incurred. Management has assessed each of the following matters based on current information and made a judgment concerning its potential outcome, considering the nature of the claim, the amount and nature of damages sought, and the probability of success. Unless specified below, the Company is unable to predict the outcome of these legal proceedings or reasonably estimate the scope or amount of any associated costs and potential liabilities. As additional information becomes available, management adjusts its assessment and estimates of such contingencies accordingly. Because litigation is subject to inherent uncertainties and unfavorable rulings or developments, it is possible that the ultimate resolution of the Company's liabilities and contingencies could be at amounts that are different from its currently recorded reserves and that such difference could be material.
In addition to the legal proceedings noted below, NRG and its subsidiaries are party to other litigation or legal proceedings arising in the ordinary course of business. In management's opinion, the disposition of these ordinary course matters will not materially adversely affect NRG's consolidated financial position, results of operations, or cash flows.
Midwest Generation Asbestos Liabilities
— The Company, through its subsidiary, Midwest Generation, may be subject to potential asbestos liabilities as a result of its acquisition of EME. The Company is currently analyzing the scope of potential liability as it may relate to Midwest Generation. The Company believes that it has established an adequate reserve to deal with these cases.
Actions Pursued by MC Asset Recovery
— With Mirant Corporation's emergence from bankruptcy protection in 2006, certain actions filed by GenOn Energy Holdings and some of its subsidiaries against third parties were transferred to MC Asset Recovery, a wholly owned subsidiary of GenOn Energy Holdings. MC Asset Recovery is governed by a manager who is independent of NRG and GenOn. MC Asset Recovery is a disregarded entity for income tax purposes. Under the remaining action transferred to MC Asset Recovery, MC Asset Recovery seeks to recover damages from Commerzbank AG and various other banks, or the Commerzbank Defendants, for alleged fraudulent transfers that occurred prior to Mirant's bankruptcy proceedings. In December 2010, the U.S. District Court for the Northern District of Texas dismissed MC Asset Recovery's complaint against the Commerzbank Defendants. In January 2011, MC Asset Recovery appealed the District Court's dismissal of its complaint against the Commerzbank Defendants to the U.S. Court of Appeals for the Fifth Circuit. In March 2012, the Court of Appeals reversed the District Court's dismissal and reinstated MC Asset Recovery's amended complaint against the Commerzbank Defendants. If MC Asset Recovery succeeds in obtaining any recoveries from the Commerzbank Defendants, the Commerzbank Defendants have asserted that they will seek to file claims in Mirant's bankruptcy proceedings for the amount of those recoveries. GenOn Energy Holdings would vigorously contest the allowance of any such claims. If the Commerzbank Defendants were to receive an allowed claim as a result of a recovery by MC Asset Recovery on its claims against them, GenOn Energy Holdings would retain from the net amount recovered by MC Asset Recovery an amount equal to the dollar amount of the resulting allowed claim.
Natural Gas Litigation
—
GenOn is party to several lawsuits, certain of which are class action lawsuits, in state and federal courts in Kansas, Missouri, Nevada and Wisconsin. These lawsuits were filed in the aftermath of the California energy crisis in 2000 and 2001 and the resulting FERC investigations and relate to alleged conduct to increase natural gas prices in violation of state antitrust law and similar laws. The lawsuits seek treble or punitive damages, restitution and/or expenses. The lawsuits also name as parties a number of energy companies unaffiliated with NRG. In July 2011, the U.S. District Court for the District of Nevada, which was handling four of the five cases, granted the defendants' motion for summary judgment and dismissed all claims against GenOn in those cases. The plaintiffs appealed to the U.S. Court of Appeals for the Ninth Circuit which reversed the decision of the District Court. GenOn along with the other defendants in the lawsuit filed a petition for a writ of certiorari to the U.S. Supreme Court challenging the Court of Appeals' decision, and the U.S. Supreme Court granted the petition. On April 21, 2015, the U.S. Supreme Court affirmed the Ninth Circuit’s holding that plaintiffs’ state antitrust law claims are not field-preempted by the federal Natural Gas Act and the Supremacy Clause of the U.S. Constitution. The U.S. Supreme Court left open whether the claims were preempted on the basis of conflict preemption. The U.S. Supreme Court directed that the case be remanded to the U.S. District Court for the District of Nevada for further proceedings. GenOn has agreed to indemnify CenterPoint against certain losses relating to these lawsuits.
In September 2012, the State of Nevada Supreme Court, which was handling the remaining case, affirmed dismissal by the Eighth Judicial District Court for Clark County, Nevada of all plaintiffs' claims against GenOn. In February 2013, the plaintiffs in the Nevada case filed a petition for a writ of certiorari to the U.S. Supreme Court. In June 2013, the U.S. Supreme Court denied the petition for a writ of certiorari, thereby ending one of the five lawsuits.
40
Energy Plus Holdings
—
On August 7, 2012, Energy Plus Holdings received a subpoena from the NYAG which generally sought information and business records related to Energy Plus Holdings' sales, marketing and business practices. Energy Plus Holdings provided documents and information to the NYAG. On June 22, 2015, the NYAG issued another subpoena seeking additional information. The parties are engaged in discussions regarding the scope of the second subpoena. The Company does not expect the resolution of this matter to have a material impact on the Company's consolidated financial position, results of operations, or cash flows.
Maryland Department of the Environment v. GenOn Chalk Point and GenOn Mid-Atlantic
— On January 25, 2013, Food & Water Watch, the Patuxent Riverkeeper and the Potomac Riverkeeper (together, the Citizens Group) sent GenOn Mid-Atlantic a letter alleging that the Chalk Point, Dickerson and Morgantown generating facilities were violating the terms of the three National Pollution Discharge Elimination System permits by discharging nitrogen and phosphorous in excess of the limits in each permit. On March 21, 2013, the MDE sent GenOn Mid-Atlantic a similar letter with respect to the Chalk Point and Dickerson generating facilities, threatening to sue within 60 days if the generating facilities were not brought into compliance. On June 11, 2013, the Maryland Attorney General on behalf of the MDE filed a complaint in the U.S. District Court for the District of Maryland alleging violations of the CWA and Maryland environmental laws related to water. The lawsuit is ongoing and seeks injunctive relief and civil penalties in excess of
$100,000
. The Company does not expect the resolution of this matter to have a material impact on the Company's consolidated financial position, results of operations, or cash flows.
Midwest Generation New Source Review Litigation
— In August 2009, the EPA and the Illinois Attorney General, or the Government Plaintiffs, filed a complaint, or the Governments’ Complaint, in the U.S. District Court for the Northern District of Illinois alleging violations of CAA PSD requirements by Midwest Generation arising from maintenance, repair or replacement projects at six Illinois coal-fired electric generating stations performed by Midwest Generation or ComEd, a prior owner of the stations, including alleged failures to obtain PSD construction permits and to comply with BACT requirements. The Government Plaintiffs also alleged violations of opacity and PM standards at the Midwest Generation plants. Finally, the Government Plaintiffs alleged that Midwest Generation violated certain operating permit requirements under Title V of the CAA allegedly arising from such claimed PSD, opacity and PM emission violations. In addition to seeking penalties of up to
$37,500
per violation, per day, the complaint seeks an injunction ordering Midwest Generation to install controls sufficient to meet BACT emission rates at the units subject to the complaint and other remedies, which could go well beyond the requirements of the CPS. Several environmental groups intervened as plaintiffs in this litigation and filed a complaint, or the Intervenors’ Complaint, which alleged opacity, PM and related Title V violations. Midwest Generation filed a motion to dismiss nine of the ten PSD counts in the Governments’ Complaint, and to dismiss the tenth PSD count to the extent the Governments’ Complaint sought civil penalties for that count. The trial court granted the motion in March 2010.
In June 2010, the Government Plaintiffs and Intervenors each filed an amended complaint. The Governments’ Amended Complaint again alleged that Midwest Generation violated PSD (based upon the same projects as alleged in their original complaint, but adding allegations that the Company was liable as the “successor” to ComEd), Title V and opacity and PM standards. It named EME and ComEd as additional defendants and alleged PSD violations (again, premised on the same projects) against them. The Intervenors’ Amended Complaint named only Midwest Generation as a defendant and alleged Title V and opacity/PM violations, as well as one of the ten PSD violations alleged in the Governments’ Amended Complaint. Midwest Generation again moved to dismiss all but one of the Government Plaintiffs’ PSD claims and the related Title V claims. Midwest Generation also filed a motion to dismiss the PSD claim in the Intervenors’ Amended Complaint and the related Title V claims. In March 2011, the trial court granted Midwest Generation’s partial motion to dismiss the Government Plaintiffs’ PSD claims. The trial court denied Midwest Generation’s motion to dismiss the PSD claim asserted in the Intervenors’ Amended Complaint, but noted that the plaintiffs would be required to convince the court that the statute of limitations should be equitably tolled. The trial court did not address other counts in the amended complaints that allege violations of opacity and PM emission limitations under the Illinois State Implementation Plan and related Title V claims. The trial court also granted the motions to dismiss the PSD claims asserted against EME and ComEd.
Following the trial court ruling, the Government Plaintiffs appealed the trial court’s dismissals of their PSD claims, including the dismissal of nine of the ten PSD claims against Midwest Generation and of the PSD claims against the other defendants. Those PSD claim dismissals were affirmed by the U.S. Court of Appeals for the Seventh Circuit in July 2013. In addition, in 2012, all but one of the environmental groups that had intervened in the case dismissed their claims without prejudice. As a result, only one environmental group remains a plaintiff intervenor in the case. The Company does not expect the resolution of this matter to have a material impact on the Company’s consolidated financial position, results of operations or cash flows.
41
Telephone Consumer Protection Act Purported Class Actions
—
Two purported class action lawsuits have been filed against NRG and NRG Residential Solar Solutions, LLC in California and New Jersey. The plaintiffs generally allege misrepresentation by the call agents and violations of the TCPA, claiming that the defendants engaged in a telemarketing campaign placing unsolicited calls to individuals on the “Do Not Call List.” The plaintiffs generally seek statutory damages of up to
$1,500
per plaintiff, actual damages and equitable relief. The Company intends to vigorously defend against these lawsuits. On September 25, 2015, plaintiffs dismissed NRG Energy, Inc. from the New Jersey lawsuit. The remaining NRG parties have requested a stay of both cases pending decisions of unrelated cases by the U.S. Supreme Court, the results of which could materially affect these lawsuits. On October 21, 2015, the court in the California case granted NRG's request for a stay.
El Segundo Environmental Liability
—
During the maintenance of breakers in 2012, the Company’s El Segundo plant exceeded California’s limit regarding SF6 losses. SF6 is an electrical insulator and GHG. The Company is in settlement discussions with the California Air Resources Board to resolve the matter and expects to pay a penalty in excess of
$100,000
. The Company does not expect the resolution of this matter to have a material impact on the Company’s consolidated financial position, results of operations or cash flows.
Note 15
—
Regulatory Matters
This footnote should be read in conjunction with the complete description under
Note 23
,
Regulatory Matters
, to the Company's
2014
Form 10-K.
NRG operates in a highly regulated industry and is subject to regulation by various federal and state agencies. As such, NRG is affected by regulatory developments at both the federal and state levels and in the regions in which NRG operates. In addition, NRG is subject to the market rules, procedures, and protocols of the various ISO and RTO markets in which NRG participates. These power markets are subject to ongoing legislative and regulatory changes that may impact NRG's wholesale and retail businesses.
In addition to the regulatory proceedings noted below, NRG and its subsidiaries are a party to other regulatory proceedings arising in the ordinary course of business or have other regulatory exposure. In management's opinion, the disposition of these ordinary course matters will not materially adversely affect NRG's consolidated financial position, results of operations, or cash flows.
National
Court Rejects FERC's Jurisdiction Over Demand Response
— On May 23, 2014, the D.C. Circuit vacated FERC’s rules (known as Order No. 745) that allowed demand response resources to participate in FERC-jurisdictional energy markets. The Court of Appeals held that the FPA does not authorize FERC to exercise jurisdiction over demand response and that instead demand response is part of the retail market over which the states have jurisdiction. The specific order being challenged related to energy market compensation, but this ruling also calls into question whether demand response will be permitted to participate in the capacity markets in the future. Parties including the U.S. Solicitor General filed petitions for a writ of certiorari with the U.S. Supreme Court. On May 4, 2015, the U.S. Supreme Court granted certiorari on two questions: first, on whether the FPA gives FERC jurisdiction over demand response, and second, whether FERC was arbitrary and capricious when it established in Order No. 745 the level of compensation to be paid to demand response resources participating in the wholesale energy markets. On July 16, 2015, the Company filed an amicus brief with the U.S. Supreme Court. The U.S. Supreme Court heard oral argument on October 14, 2015. The eventual outcome of this proceeding could result in refunds of payments made for non-jurisdictional services and resettlement of wholesale markets, but it is not possible to predict the outcome or estimate the impact on the Company at this time.
42
East Region
Montgomery County Station Power Tax
—
On December 20, 2013, the Company received a letter from Montgomery County, Maryland requesting payment of an energy tax for the consumption of station power at the Dickerson Facility over the previous three years. Montgomery County seeks payment in the amount of
$22 million
, which includes tax, interest and penalties. The Company is disputing the applicability of the tax. On December 17, 2014, the Maryland Tax Court heard oral arguments from the parties. Subsequently, post hearing briefs were filed. The decision is pending.
Note 16
—
Environmental Matters
This footnote should be read in conjunction with the complete description under
Note 24
,
Environmental Matters
, to the Company's
2014
Form 10-K.
NRG is subject to a wide range of environmental laws in the development, construction, ownership and operation of projects. These laws generally require that governmental permits and approvals be obtained before construction and during operation of power plants. NRG is also subject to laws and regulations surrounding the protection of wildlife, including migratory birds, eagles and threatened and endangered species. Environmental laws have become increasingly stringent and NRG expects this trend to continue. The electric generation industry is facing new requirements to address various emissions, including GHG, as well as combustion byproducts, water discharge and use, and threatened and endangered species. In general, future laws are expected to require the addition of emissions controls or other environmental controls or to impose certain restrictions on the operations of the Company's facilities, which could have a material effect on the Company's operations.
The EPA finalized CSAPR in 2011, which was intended to replace CAIR in January 2012, to address each state's obligation to reduce emissions so that downwind states can achieve federal air quality standards. In December 2011, the D.C. Circuit stayed the implementation of CSAPR and then vacated CSAPR in August 2012 but kept CAIR in place until the EPA could replace it. In April 2014, the U.S. Supreme Court reversed and remanded the D.C. Circuit's decision. In October 2014, the D.C. Circuit lifted the stay of CSAPR. In response, the EPA in November 2014 amended the CSAPR compliance dates. Accordingly, CSAPR replaced CAIR on January 1, 2015. On July 28, 2015, the D.C. Circuit held that the EPA had exceeded its authority by requiring certain reductions that were not necessary for downwind states to achieve federal standards. Although the D.C. Circuit kept the rule in place, the D.C. Circuit ordered the EPA to revise the Phase 2 (or 2017) (i) SO
2
budgets for four states including Texas and (ii) ozone-season NO
x
budgets for 11 states including Maryland, New Jersey, New York, Ohio, Pennsylvania and Texas. While NRG cannot predict the final outcome of this rulemaking, the Company believes its investment in pollution controls and cleaner technologies coupled with planned plant retirements leave the fleet well positioned for compliance.
In February 2012, the EPA promulgated standards (the MATS rule) to control emissions of HAPs from coal and oil-fired electric generating units. The rule established limits for mercury, non-mercury metals, certain organics and acid gases, which limits must be met beginning in April 2015 (with some units getting a 1-year extension). In June 2015, the U.S. Supreme Court issued a decision in the case of
Michigan v. EPA
, and held that the EPA unreasonably refused to consider costs when it determined that it was "appropriate and necessary" to regulate HAPs emitted by electric generating units. The U.S. Supreme Court did not vacate the MATS rule but rather remanded it to the D.C. Circuit for further proceedings.
Water
In August 2014, the EPA finalized the regulation regarding the use of water for once through cooling at existing facilities to address impingement and entrainment concerns. NRG anticipates that more stringent requirements will be incorporated into some of its water discharge permits over the next several years as NPDES permits are renewed.
Byproducts, Wastes, Hazardous Materials and Contamination
In April 2015, the EPA finalized the rule regulating byproducts of coal combustion (e.g., ash and gypsum) as solid wastes under the RCRA. These byproducts will be regulated as solid wastes. The Company is evaluating the impact of the new rule on its results of operations, financial condition and cash flows and has accrued its environmental and asset retirement obligations under the rule based on current estimates as of September 30, 2015.
43
East Region
Maryland Environmental Regulations
— In December 2014, MDE proposed a regulation regarding NO
x
emissions from coal-fired electric generating units, which if finalized would have required by 2020 the Company (at each of the three Dickerson coal-fired units and the Chalk Point coal-fired unit that does not have an SCR) to either (1) install and operate an SCR; (2) retire the unit; or (3) convert the fuel source from coal to natural gas. In early 2015, a new gubernatorial administration in Maryland decided not to finalize the regulation as proposed. In September 2015, MDE proposed revised regulations to address future NO
x
reductions, which when finalized may negatively affect certain of the Company’s coal-fired units in Maryland.
Environmental Capital Expenditures
NRG estimates that environmental capital expenditures from
2015
through
2019
required to comply with environmental laws will be approximately
$629 million
, which includes
$98 million
for GenOn and
$430 million
for Midwest Generation. These costs, the majority of which will be expended by the end of 2016, are primarily associated with (i) DSI/ESP upgrades at the Powerton and Waukegan facilities and the Joliet gas conversion to satisfy the IL CPS; (ii) controls to satisfy MATS and the NSR settlement at the Big Cajun II facility; (iii) controls to satisfy MATS at the Avon Lake facility; (iv) mercury controls at the W.A. Parish facility; and (v) NO
x
controls for the Sayreville and Gilbert facilities. The increase in environmental capital expenditures for GenOn relates to the Avon Lake Unit 9 MATS compliance project.
44
Note 17
—
Condensed Consolidating Financial Information
As of
September 30, 2015
, the Company had outstanding
$6.4 billion
of Senior Notes due from 2018 - 2024, as shown in
Note 8
,
Debt and Capital Leases
. These Senior Notes are guaranteed by certain of NRG's current and future 100% owned domestic subsidiaries, or guarantor subsidiaries. These guarantees are both joint and several. The non-guarantor subsidiaries include all of NRG's foreign subsidiaries and certain domestic subsidiaries, including GenOn and its subsidiaries and NRG Yield, Inc. and its subsidiaries.
Unless otherwise noted below, each of the following guarantor subsidiaries fully and unconditionally guaranteed the Senior Notes as of
September 30, 2015
:
|
Ace Energy, Inc.
|
NEO Power Services Inc.
|
NRG Operating Services, Inc.
|
|
Allied Warranty LLC
|
New Genco GP, LLC
|
NRG Oswego Harbor Power Operations Inc.
|
|
Arthur Kill Power LLC
|
Norwalk Power LLC
|
NRG PacGen Inc.
|
|
Astoria Gas Turbine Power LLC
|
NRG Advisory Services LLC
|
NRG Portable Power LLC
|
|
Bayou Cove Peaking Power, LLC
|
NRG Affiliate Services Inc.
|
NRG Power Marketing LLC
|
|
BidURenergy, Inc.
|
NRG Artesian Energy LLC
|
NRG Reliability Solutions LLC
|
|
Cabrillo Power I LLC
|
NRG Arthur Kill Operations Inc.
|
NRG Renter's Protection LLC
|
|
Cabrillo Power II LLC
|
NRG Astoria Gas Turbine Operations Inc.
|
NRG Retail LLC
|
|
Carbon Management Solutions LLC
|
NRG Bayou Cove LLC
|
NRG Retail Northeast LLC
|
|
Cirro Group, Inc.
|
NRG Business Services LLC
|
NRG Rockford Acquisition LLC
|
|
Cirro Energy Services, Inc.
|
NRG Business Solutions LLC
|
NRG Saguaro Operations Inc.
|
|
Clean Edge Energy LLC
|
NRG Cabrillo Power Operations Inc.
|
NRG Security LLC
|
|
Conemaugh Power LLC
|
NRG California Peaker Operations LLC
|
NRG Services Corporation
|
|
Connecticut Jet Power LLC
|
NRG Cedar Bayou Development Company, LLC
|
NRG SimplySmart Solutions LLC
|
|
Cottonwood Development LLC
|
NRG Connected Home LLC
|
NRG SPV #1 LLC
|
|
Cottonwood Energy Company LP
|
NRG Connecticut Affiliate Services Inc.
|
NRG South Central Affiliate Services Inc.
|
|
Cottonwood Generating Partners I LLC
|
NRG Construction LLC
|
NRG South Central Generating LLC
|
|
Cottonwood Generating Partners II LLC
|
NRG Curtailment Solutions LLC
|
NRG South Central Operations Inc.
|
|
Cottonwood Generating Partners III LLC
|
NRG Development Company Inc.
|
NRG South Texas LP
|
|
Cottonwood Technology Partners LP
|
NRG Devon Operations Inc.
|
NRG Texas C&I Supply LLC
|
|
Devon Power LLC
|
NRG Dispatch Services LLC
|
NRG Texas Gregory LLC
|
|
Dunkirk Power LLC
|
NRG Distributed Generation PR LLC
|
NRG Texas Holding Inc.
|
|
Eastern Sierra Energy Company LLC
|
NRG Dunkirk Operations Inc.
|
NRG Texas LLC
|
|
El Segundo Power, LLC
|
NRG El Segundo Operations Inc.
|
NRG Texas Power LLC
|
|
El Segundo Power II LLC
|
NRG Energy Efficiency-L LLC
|
NRG Warranty Services LLC
|
|
Energy Alternatives Wholesale, LLC
|
NRG Energy Efficiency-P LLC
|
NRG West Coast LLC
|
|
Energy Curtailment Specialists, Inc.
|
NRG Energy Labor Services LLC
|
NRG Western Affiliate Services Inc.
|
|
Energy Plus Holdings LLC
|
NRG Energy Services Group LLC
|
O'Brien Cogeneration, Inc. II
|
|
Energy Plus Natural Gas LLC
|
NRG Energy Services International Inc.
|
ONSITE Energy, Inc.
|
|
Energy Protection Insurance Company
|
NRG Energy Services LLC
|
Oswego Harbor Power LLC
|
|
Everything Energy LLC
|
NRG Generation Holdings, Inc.
|
RE Retail Receivables, LLC
|
|
Forward Home Security LLC
|
NRG Home & Business Solutions LLC
|
Reliant Energy Northeast LLC
|
|
GCP Funding Company, LLC
|
NRG Home Services LLC
|
Reliant Energy Power Supply, LLC
|
|
Green Mountain Energy
|
NRG Home Solutions LLC
|
Reliant Energy Retail Holdings, LLC
|
|
Green Mountain Energy Company
|
NRG Home Solutions Product LLC
|
Reliant Energy Retail Services, LLC
|
|
Gregory Partners, LLC
|
NRG Homer City Services LLC
|
RERH Holdings LLC
|
|
Gregory Power Partners LLC
|
NRG Huntley Operations Inc.
|
Saguaro Power LLC
|
|
Huntley Power LLC
|
NRG HQ DC LLC
|
Somerset Operations Inc.
|
|
Independence Energy Alliance LLC
|
NRG Identity Protect LLC
|
Somerset Power LLC
|
|
Independence Energy Group LLC
|
NRG Ilion Limited Partnership
|
Texas Genco Financing Corp.
|
|
Independence Energy Natural Gas LLC
|
NRG Ilion LP LLC
|
Texas Genco GP, LLC
|
|
Indian River Operations Inc.
|
NRG International LLC
|
Texas Genco Holdings, Inc.
|
|
Indian River Power LLC
|
NRG Maintenance Services LLC
|
Texas Genco LP, LLC
|
|
Keystone Power LLC
|
NRG Mextrans Inc.
|
Texas Genco Operating Services, LLC
|
|
Langford Wind Power, LLC
|
NRG MidAtlantic Affiliate Services Inc.
|
Texas Genco Services, LP
|
|
Louisiana Generating LLC
|
NRG Middletown Operations Inc.
|
US Retailers LLC
|
|
Meriden Gas Turbines LLC
|
NRG Montville Operations Inc.
|
Vienna Operations Inc.
|
|
Middletown Power LLC
|
NRG New Roads Holdings LLC
|
Vienna Power LLC
|
|
Montville Power LLC
|
NRG North Central Operations Inc.
|
WCP (Generation) Holdings LLC
|
|
NEO Corporation
|
NRG Northeast Affiliate Services Inc.
|
West Coast Power LLC
|
|
NEO Freehold-Gen LLC
|
NRG Norwalk Harbor Operations Inc.
|
|
45
NRG conducts much of its business through and derives much of its income from its subsidiaries. Therefore, the Company's ability to make required payments with respect to its indebtedness and other obligations depends on the financial results and condition of its subsidiaries and NRG's ability to receive funds from its subsidiaries. There are no restrictions on the ability of any of the guarantor subsidiaries to transfer funds to NRG. However, there may be restrictions for certain non-guarantor subsidiaries.
The following condensed consolidating financial information presents the financial information of NRG Energy, Inc., the guarantor subsidiaries and the non-guarantor subsidiaries in accordance with Rule 3-10 under the SEC Regulation S-X. The financial information may not necessarily be indicative of results of operations or financial position had the guarantor subsidiaries or non-guarantor subsidiaries operated as independent entities.
In this presentation, NRG Energy, Inc. consists of parent company operations. Guarantor subsidiaries and non-guarantor subsidiaries of NRG are reported on an equity basis. For companies acquired, the fair values of the assets and liabilities acquired have been presented on a push-down accounting basis.
46
NRG ENERGY, INC. AND SUBSIDIARIES
CONDENSED CONSOLIDATING STATEMENTS OF OPERATIONS
For the Three Months Ended September 30, 2015
(Unaudited)
|
Guarantor Subsidiaries
|
Non-Guarantor Subsidiaries
|
NRG Energy, Inc.
(Note Issuer)
|
Eliminations
(a)
|
Consolidated
|
|||||||||||||||
|
(In millions)
|
|||||||||||||||||||
|
Operating Revenues
|
|
|
|
|
|
||||||||||||||
|
Total operating revenues
|
$
|
3,132
|
|
$
|
1,328
|
|
$
|
—
|
|
$
|
(29
|
)
|
$
|
4,431
|
|
||||
|
Operating Costs and Expenses
|
|
||||||||||||||||||
|
Cost of operations
|
2,276
|
|
784
|
|
14
|
|
(40
|
)
|
3,034
|
|
|||||||||
|
Depreciation and amortization
|
190
|
|
187
|
|
5
|
|
—
|
|
382
|
|
|||||||||
|
Impairment losses
|
222
|
|
41
|
|
—
|
|
—
|
|
263
|
|
|||||||||
|
Selling, general and administrative
|
136
|
|
96
|
|
100
|
|
—
|
|
332
|
|
|||||||||
|
Acquisition-related transaction and integration costs
|
—
|
|
2
|
|
1
|
|
—
|
|
3
|
|
|||||||||
|
Development activity expenses
|
—
|
|
17
|
|
21
|
|
—
|
|
38
|
|
|||||||||
|
Total operating costs and expenses
|
2,824
|
|
1,127
|
|
141
|
|
(40
|
)
|
4,052
|
|
|||||||||
|
Operating Income/(Loss)
|
308
|
|
201
|
|
(141
|
)
|
11
|
|
379
|
|
|||||||||
|
Other Income/(Expense)
|
|
||||||||||||||||||
|
Equity in earnings/(loss) of consolidated subsidiaries
|
—
|
|
42
|
|
228
|
|
(270
|
)
|
—
|
|
|||||||||
|
Equity in earnings of unconsolidated affiliates
|
3
|
|
27
|
|
1
|
|
(7
|
)
|
24
|
|
|||||||||
|
Other income, net
|
2
|
|
3
|
|
1
|
|
(2
|
)
|
4
|
|
|||||||||
|
Loss on debt extinguishment
|
—
|
|
(2
|
)
|
—
|
|
—
|
|
(2
|
)
|
|||||||||
|
Interest expense
|
(4
|
)
|
(151
|
)
|
(136
|
)
|
—
|
|
(291
|
)
|
|||||||||
|
Total other income/(expense)
|
1
|
|
(81
|
)
|
94
|
|
(279
|
)
|
(265
|
)
|
|||||||||
|
Income/(Loss) Before Income Taxes
|
309
|
|
120
|
|
(47
|
)
|
(268
|
)
|
114
|
|
|||||||||
|
Income tax expense/(benefit)
|
88
|
|
56
|
|
(130
|
)
|
33
|
|
47
|
|
|||||||||
|
Net Income
|
221
|
|
64
|
|
83
|
|
(301
|
)
|
67
|
|
|||||||||
|
Less: Net income attributable to noncontrolling interest and redeemable noncontrolling interests
|
—
|
|
15
|
|
17
|
|
(31
|
)
|
1
|
|
|||||||||
|
Net Income Attributable to
NRG Energy, Inc.
|
$
|
221
|
|
$
|
49
|
|
$
|
66
|
|
$
|
(270
|
)
|
$
|
66
|
|
||||
|
(a)
|
All significant intercompany transactions have been eliminated in consolidation.
|
47
NRG ENERGY, INC. AND SUBSIDIARIES
CONDENSED CONSOLIDATING STATEMENTS OF OPERATIONS
For the Nine Months Ended September 30, 2015
(Unaudited)
|
Guarantor Subsidiaries
|
Non-Guarantor Subsidiaries
|
NRG Energy, Inc.
(Note Issuer)
|
Eliminations
(a)
|
Consolidated
|
|||||||||||||||
|
(In millions)
|
|||||||||||||||||||
|
Operating Revenues
|
|
|
|
|
|
||||||||||||||
|
Total operating revenues
|
$
|
7,959
|
|
$
|
3,792
|
|
$
|
—
|
|
$
|
(97
|
)
|
$
|
11,654
|
|
||||
|
Operating Costs and Expenses
|
|
||||||||||||||||||
|
Cost of operations
|
6,083
|
|
2,533
|
|
10
|
|
(96
|
)
|
8,530
|
|
|||||||||
|
Depreciation and amortization
|
590
|
|
568
|
|
15
|
|
—
|
|
1,173
|
|
|||||||||
|
Impairment losses
|
222
|
|
41
|
|
—
|
|
—
|
|
263
|
|
|||||||||
|
Selling, general and administrative
|
351
|
|
288
|
|
247
|
|
—
|
|
886
|
|
|||||||||
|
Acquisition-related transaction and integration costs
|
—
|
|
3
|
|
13
|
|
—
|
|
16
|
|
|||||||||
|
Development activity expenses
|
—
|
|
47
|
|
66
|
|
—
|
|
113
|
|
|||||||||
|
Total operating costs and expenses
|
7,246
|
|
3,480
|
|
351
|
|
(96
|
)
|
10,981
|
|
|||||||||
|
Gain on postretirement benefits curtailment
|
—
|
|
14
|
|
—
|
|
—
|
|
14
|
|
|||||||||
|
Operating Income/(Loss)
|
713
|
|
326
|
|
(351
|
)
|
(1
|
)
|
687
|
|
|||||||||
|
Other Income/(Expense)
|
|
||||||||||||||||||
|
Equity in (loss)/earnings of consolidated subsidiaries
|
(35
|
)
|
(15
|
)
|
432
|
|
(382
|
)
|
—
|
|
|||||||||
|
Equity in earnings of unconsolidated affiliates
|
6
|
|
33
|
|
—
|
|
(10
|
)
|
29
|
|
|||||||||
|
Other income, net
|
3
|
|
23
|
|
3
|
|
(2
|
)
|
27
|
|
|||||||||
|
Loss on debt extinguishment
|
—
|
|
(9
|
)
|
—
|
|
—
|
|
(9
|
)
|
|||||||||
|
Interest expense
|
(13
|
)
|
(430
|
)
|
(412
|
)
|
—
|
|
(855
|
)
|
|||||||||
|
Total other expense
|
(39
|
)
|
(398
|
)
|
23
|
|
(394
|
)
|
(808
|
)
|
|||||||||
|
Income/(Loss) Before Income Taxes
|
674
|
|
(72
|
)
|
(328
|
)
|
(395
|
)
|
(121
|
)
|
|||||||||
|
Income tax expense/(benefit)
|
225
|
|
(20
|
)
|
(281
|
)
|
33
|
|
(43
|
)
|
|||||||||
|
Net Income/(Loss)
|
449
|
|
|
(52
|
)
|
|
(47
|
)
|
|
(428
|
)
|
|
(78
|
)
|
|||||
|
Less: Net income/(loss) attributable to noncontrolling interest and redeemable noncontrolling interests
|
—
|
|
15
|
|
21
|
|
(46
|
)
|
(10
|
)
|
|||||||||
|
Net Income/(Loss) Attributable to
NRG Energy, Inc.
|
$
|
449
|
|
$
|
(67
|
)
|
$
|
(68
|
)
|
$
|
(382
|
)
|
$
|
(68
|
)
|
||||
|
(a)
|
All significant intercompany transactions have been eliminated in consolidation.
|
48
NRG ENERGY, INC. AND SUBSIDIARIES
CONDENSED CONSOLIDATING STATEMENTS OF COMPREHENSIVE INCOME
For the Three Months Ended September 30, 2015
(Unaudited)
|
Guarantor Subsidiaries
|
Non-Guarantor Subsidiaries
|
NRG Energy, Inc.
(Note Issuer)
|
Eliminations
(a)
|
Consolidated
|
|||||||||||||||
|
(In millions)
|
|||||||||||||||||||
|
Net Income
|
$
|
221
|
|
$
|
64
|
|
$
|
83
|
|
$
|
(301
|
)
|
$
|
67
|
|
||||
|
Other Comprehensive Income/(Loss), net of tax
|
|||||||||||||||||||
|
Unrealized gain/(loss) on derivatives, net
|
46
|
|
189
|
|
169
|
|
(410
|
)
|
(6
|
)
|
|||||||||
|
Foreign currency translation adjustments, net
|
—
|
|
4
|
|
2
|
|
(14
|
)
|
(8
|
)
|
|||||||||
|
Available-for-sale securities, net
|
—
|
|
14
|
|
(10
|
)
|
(11
|
)
|
(7
|
)
|
|||||||||
|
Defined benefit plans, net
|
139
|
|
4
|
|
(105
|
)
|
(35
|
)
|
3
|
|
|||||||||
|
Other comprehensive income/(loss)
|
185
|
|
211
|
|
56
|
|
(470
|
)
|
(18
|
)
|
|||||||||
|
Comprehensive Income
|
406
|
|
275
|
|
139
|
|
(771
|
)
|
49
|
|
|||||||||
|
Less: Comprehensive (loss)/income attributable to noncontrolling interest and redeemable noncontrolling interest
|
—
|
|
(3
|
)
|
17
|
|
(31
|
)
|
(17
|
)
|
|||||||||
|
Comprehensive Income Attributable to NRG Energy, Inc.
|
406
|
|
278
|
|
122
|
|
(740
|
)
|
66
|
|
|||||||||
|
Dividends for preferred shares
|
—
|
|
—
|
|
5
|
|
—
|
|
5
|
|
|||||||||
|
Comprehensive Income Available for Common Stockholders
|
$
|
406
|
|
$
|
278
|
|
$
|
117
|
|
$
|
(740
|
)
|
$
|
61
|
|
||||
|
(a)
|
All significant intercompany transactions have been eliminated in consolidation.
|
49
NRG ENERGY, INC. AND SUBSIDIARIES
CONDENSED CONSOLIDATING STATEMENTS OF COMPREHENSIVE INCOME
For the Nine Months Ended September 30, 2015
(Unaudited)
|
Guarantor Subsidiaries
|
Non-Guarantor Subsidiaries
|
NRG Energy, Inc.
(Note Issuer)
|
Eliminations
(a)
|
Consolidated
|
|||||||||||||||
|
(In millions)
|
|||||||||||||||||||
|
Net Income/(Loss)
|
$
|
449
|
|
$
|
(52
|
)
|
$
|
(47
|
)
|
$
|
(428
|
)
|
$
|
(78
|
)
|
||||
|
Other Comprehensive Income/(Loss), net of tax
|
|||||||||||||||||||
|
Unrealized gain/(loss) on derivatives, net
|
41
|
|
204
|
|
178
|
|
(425
|
)
|
(2
|
)
|
|||||||||
|
Foreign currency translation adjustments, net
|
—
|
|
4
|
|
—
|
|
(14
|
)
|
(10
|
)
|
|||||||||
|
Available-for-sale securities, net
|
—
|
|
13
|
|
(13
|
)
|
(11
|
)
|
(11
|
)
|
|||||||||
|
Defined benefit plans, net
|
136
|
|
3
|
|
(95
|
)
|
(35
|
)
|
9
|
|
|||||||||
|
Other comprehensive income/(loss)
|
177
|
|
224
|
|
70
|
|
(485
|
)
|
(14
|
)
|
|||||||||
|
Comprehensive Income/(Loss)
|
626
|
|
172
|
|
23
|
|
(913
|
)
|
(92
|
)
|
|||||||||
|
Less: Comprehensive (loss)/income attributable to noncontrolling interest and redeemable noncontrolling interest
|
—
|
|
(9
|
)
|
21
|
|
(46
|
)
|
(34
|
)
|
|||||||||
|
Comprehensive Income/(Loss) Attributable to NRG Energy, Inc.
|
626
|
|
181
|
|
2
|
|
(867
|
)
|
(58
|
)
|
|||||||||
|
Dividends for preferred shares
|
—
|
|
—
|
|
15
|
|
—
|
|
15
|
|
|||||||||
|
Comprehensive Income/(Loss) Available for Common Stockholders
|
$
|
626
|
|
$
|
181
|
|
$
|
(13
|
)
|
$
|
(867
|
)
|
$
|
(73
|
)
|
||||
|
(a)
|
All significant intercompany transactions have been eliminated in consolidation.
|
50
NRG ENERGY, INC. AND SUBSIDIARIES
CONDENSED CONSOLIDATING BALANCE SHEETS
September 30, 2015
(Unaudited)
|
Guarantor Subsidiaries
|
Non-Guarantor Subsidiaries
|
NRG Energy, Inc.
(Note Issuer)
|
Eliminations
(a)
|
Consolidated
|
|||||||||||||||
|
ASSETS
|
(In millions)
|
||||||||||||||||||
|
Current Assets
|
|
||||||||||||||||||
|
Cash and cash equivalents
|
$
|
—
|
|
$
|
1,310
|
|
$
|
955
|
|
$
|
—
|
|
$
|
2,265
|
|
||||
|
Funds deposited by counterparties
|
27
|
|
41
|
|
—
|
|
—
|
|
68
|
|
|||||||||
|
Restricted cash
|
8
|
|
488
|
|
1
|
|
—
|
|
497
|
|
|||||||||
|
Accounts receivable - trade, net
|
1,173
|
|
318
|
|
1
|
|
—
|
|
1,492
|
|
|||||||||
|
Accounts receivable - affiliate
|
9,804
|
|
1,410
|
|
(8,271
|
)
|
(2,936
|
)
|
7
|
|
|||||||||
|
Inventory
|
521
|
|
628
|
|
—
|
|
—
|
|
1,149
|
|
|||||||||
|
Derivative instruments
|
1,107
|
|
703
|
|
—
|
|
(230
|
)
|
1,580
|
|
|||||||||
|
Cash collateral paid in support of energy risk management activities
|
255
|
|
112
|
|
—
|
|
—
|
|
367
|
|
|||||||||
|
Deferred income taxes
|
—
|
|
88
|
|
81
|
|
—
|
|
169
|
|
|||||||||
|
Renewable energy grant receivable, net
|
—
|
|
25
|
|
1
|
|
—
|
|
26
|
|
|||||||||
|
Prepayments and other current assets
|
116
|
|
260
|
|
77
|
|
—
|
|
453
|
|
|||||||||
|
Total current assets
|
13,011
|
|
5,383
|
|
(7,155
|
)
|
|
(3,166
|
)
|
8,073
|
|
||||||||
|
Net property, plant and equipment
|
7,839
|
|
13,982
|
|
191
|
|
(27
|
)
|
21,985
|
|
|||||||||
|
Other Assets
|
|
|
|
|
|
||||||||||||||
|
Investment in subsidiaries
|
416
|
|
2,500
|
|
24,474
|
|
(27,390
|
)
|
—
|
|
|||||||||
|
Equity investments in affiliates
|
(15
|
)
|
1,143
|
|
42
|
|
(102
|
)
|
1,068
|
|
|||||||||
|
Notes receivable, less current portion
|
—
|
|
49
|
|
264
|
|
(251
|
)
|
62
|
|
|||||||||
|
Goodwill
|
2,072
|
|
423
|
|
8
|
|
|
|
2,503
|
|
|||||||||
|
Intangible assets, net
|
789
|
|
1,587
|
|
1
|
|
(6
|
)
|
2,371
|
|
|||||||||
|
Nuclear decommissioning trust fund
|
551
|
|
—
|
|
—
|
|
—
|
|
551
|
|
|||||||||
|
Derivative instruments
|
277
|
|
311
|
|
—
|
|
(66
|
)
|
522
|
|
|||||||||
|
Deferred income tax
|
23
|
|
620
|
|
784
|
|
—
|
|
1,427
|
|
|||||||||
|
Other non-current assets
|
97
|
|
831
|
|
498
|
|
—
|
|
1,426
|
|
|||||||||
|
Total other assets
|
4,210
|
|
7,464
|
|
26,071
|
|
(27,815
|
)
|
9,930
|
|
|||||||||
|
Total Assets
|
$
|
25,060
|
|
$
|
26,829
|
|
$
|
19,107
|
|
$
|
(31,008
|
)
|
$
|
39,988
|
|
||||
|
LIABILITIES AND STOCKHOLDERS’ EQUITY
|
|||||||||||||||||||
|
Current Liabilities
|
|
||||||||||||||||||
|
Current portion of long-term debt and capital leases
|
$
|
2
|
|
$
|
435
|
|
$
|
271
|
|
$
|
(251
|
)
|
$
|
457
|
|
||||
|
Accounts payable
|
710
|
|
340
|
|
123
|
|
—
|
|
1,173
|
|
|||||||||
|
Accounts payable — affiliate
|
1,602
|
|
2,166
|
|
(833
|
)
|
(2,935
|
)
|
—
|
|
|||||||||
|
Derivative instruments
|
1,025
|
|
621
|
|
—
|
|
(230
|
)
|
1,416
|
|
|||||||||
|
Cash collateral received in support of energy risk management activities
|
27
|
|
41
|
|
—
|
|
|
|
68
|
|
|||||||||
|
Accrued expenses and other current liabilities
|
339
|
|
530
|
|
353
|
|
—
|
|
1,222
|
|
|||||||||
|
Total current liabilities
|
3,705
|
|
4,133
|
|
(86
|
)
|
(3,416
|
)
|
4,336
|
|
|||||||||
|
Other Liabilities
|
|
|
|
|
|
||||||||||||||
|
Long-term debt and capital leases
|
306
|
|
11,039
|
|
8,253
|
|
—
|
|
19,598
|
|
|||||||||
|
Nuclear decommissioning reserve
|
322
|
|
—
|
|
—
|
|
—
|
|
322
|
|
|||||||||
|
Nuclear decommissioning trust liability
|
280
|
|
—
|
|
—
|
|
—
|
|
280
|
|
|||||||||
|
Deferred income taxes
|
1,540
|
|
(1,040
|
)
|
(513
|
)
|
33
|
|
20
|
|
|||||||||
|
Derivative instruments
|
375
|
|
310
|
|
—
|
|
(66
|
)
|
619
|
|
|||||||||
|
Out-of-market contracts, net
|
99
|
|
1,069
|
|
—
|
|
—
|
|
1,168
|
|
|||||||||
|
Other non-current liabilities
|
471
|
|
735
|
|
272
|
|
—
|
|
1,478
|
|
|||||||||
|
Total non-current liabilities
|
3,393
|
|
12,113
|
|
8,012
|
|
(33
|
)
|
23,485
|
|
|||||||||
|
Total liabilities
|
7,098
|
|
16,246
|
|
7,926
|
|
(3,449
|
)
|
27,821
|
|
|||||||||
|
2.822% convertible perpetual preferred stock
|
—
|
|
—
|
|
299
|
|
—
|
|
299
|
|
|||||||||
|
Redeemable noncontrolling interest in subsidiaries
|
—
|
|
29
|
|
—
|
|
—
|
|
29
|
|
|||||||||
|
Stockholders’ Equity
|
17,962
|
|
10,554
|
|
10,882
|
|
(27,559
|
)
|
11,839
|
|
|||||||||
|
Total Liabilities and Stockholders’ Equity
|
$
|
25,060
|
|
$
|
26,829
|
|
$
|
19,107
|
|
$
|
(31,008
|
)
|
$
|
39,988
|
|
||||
|
(a)
|
All significant intercompany transactions have been eliminated in consolidation.
|
51
NRG ENERGY, INC. AND SUBSIDIARIES CONDENSED
CONSOLIDATING STATEMENTS OF CASH FLOWS
For the Nine Months Ended September 30, 2015
(Unaudited)
|
Guarantor Subsidiaries
|
Non-Guarantor Subsidiaries
|
NRG Energy, Inc.
(Note Issuer)
|
Eliminations
(a)
|
Consolidated
|
|||||||||||||||
|
(In millions)
|
|||||||||||||||||||
|
Cash Flows from Operating Activities
|
|
|
|
|
|
||||||||||||||
|
Net Income
|
$
|
449
|
|
$
|
(52
|
)
|
$
|
(47
|
)
|
$
|
(428
|
)
|
$
|
(78
|
)
|
||||
|
Adjustments to reconcile net loss to net cash provided by operating activities:
|
|
||||||||||||||||||
|
Distributions from unconsolidated affiliates
|
—
|
|
77
|
|
—
|
|
(20
|
)
|
57
|
|
|||||||||
|
Equity in losses of unconsolidated affiliates
|
(6
|
)
|
(33
|
)
|
—
|
|
10
|
|
(29
|
)
|
|||||||||
|
Depreciation and amortization
|
590
|
|
568
|
|
15
|
|
—
|
|
1,173
|
|
|||||||||
|
Provision for bad debts
|
46
|
|
—
|
|
3
|
|
—
|
|
49
|
|
|||||||||
|
Amortization of nuclear fuel
|
36
|
|
—
|
|
—
|
|
—
|
|
36
|
|
|||||||||
|
Amortization of financing costs and debt discount/premiums
|
—
|
|
(29
|
)
|
20
|
|
—
|
|
(9
|
)
|
|||||||||
|
Adjustment for debt extinguishment
|
—
|
|
9
|
|
—
|
|
—
|
|
9
|
|
|||||||||
|
Amortization of intangibles and out-of-market contracts
|
43
|
|
25
|
|
—
|
|
—
|
|
68
|
|
|||||||||
|
Amortization of unearned equity compensation
|
—
|
|
—
|
|
37
|
|
—
|
|
37
|
|
|||||||||
|
Changes in deferred income taxes and liability for uncertain tax benefits
|
218
|
|
(77
|
)
|
(213
|
)
|
—
|
|
(72
|
)
|
|||||||||
|
Changes in nuclear decommissioning trust liability
|
1
|
|
—
|
|
—
|
|
—
|
|
1
|
|
|||||||||
|
Changes in derivative instruments
|
135
|
|
89
|
|
(44
|
)
|
—
|
|
180
|
|
|||||||||
|
Changes in collateral deposits supporting energy risk management activities
|
(141
|
)
|
(39
|
)
|
—
|
|
—
|
|
(180
|
)
|
|||||||||
|
Gain on sale of emission allowances
|
(6
|
)
|
—
|
|
—
|
|
—
|
|
(6
|
)
|
|||||||||
|
Gain on postretirement benefits curtailment
|
—
|
|
(14
|
)
|
—
|
|
—
|
|
(14
|
)
|
|||||||||
|
Impairment losses
|
222
|
|
41
|
|
—
|
|
—
|
|
263
|
|
|||||||||
|
Cash used by changes in other working capital
|
1,048
|
|
(879
|
)
|
(702
|
)
|
440
|
|
(93
|
)
|
|||||||||
|
Net Cash Provided/(Used) by Operating Activities
|
$
|
2,635
|
|
$
|
(314
|
)
|
$
|
(931
|
)
|
$
|
2
|
|
$
|
1,392
|
|
||||
|
Cash Flows from Investing Activities
|
|
|
|||||||||||||||||
|
(Payments for)/proceeds from intercompany loans to subsidiaries
|
(2,391
|
)
|
1,093
|
|
—
|
|
1,298
|
|
—
|
|
|||||||||
|
Acquisition of January 2015 Drop Down Assets, net of cash acquired
|
—
|
|
(489
|
)
|
—
|
|
489
|
|
—
|
|
|||||||||
|
Acquisition of businesses, net of cash acquired
|
—
|
|
(31
|
)
|
—
|
|
—
|
|
(31
|
)
|
|||||||||
|
Capital expenditures
|
(264
|
)
|
(595
|
)
|
(30
|
)
|
—
|
|
(889
|
)
|
|||||||||
|
Increase in restricted cash, net
|
(3
|
)
|
(38
|
)
|
—
|
|
—
|
|
(41
|
)
|
|||||||||
|
Decrease in restricted cash — U.S. DOE funded projects
|
—
|
|
1
|
|
—
|
|
—
|
|
1
|
|
|||||||||
|
Decrease in notes receivable
|
—
|
|
10
|
|
—
|
|
—
|
|
10
|
|
|||||||||
|
Investments in nuclear decommissioning trust fund securities
|
(500
|
)
|
—
|
|
—
|
|
—
|
|
(500
|
)
|
|||||||||
|
Proceeds from sales of nuclear decommissioning trust fund securities
|
499
|
|
—
|
|
—
|
|
—
|
|
499
|
|
|||||||||
|
Proceeds from renewable energy grants and state rebates
|
—
|
|
62
|
|
—
|
|
—
|
|
62
|
|
|||||||||
|
Proceeds from sale of assets, net of cash disposed of
|
—
|
|
—
|
|
1
|
|
—
|
|
1
|
|
|||||||||
|
Investments in unconsolidated affiliates
|
—
|
|
(356
|
)
|
(39
|
)
|
—
|
|
(395
|
)
|
|||||||||
|
Return of capital from unconsolidated affiliates
|
1
|
|
39
|
|
—
|
|
(2
|
)
|
38
|
|
|||||||||
|
Other
|
5
|
|
8
|
|
—
|
|
—
|
|
13
|
|
|||||||||
|
Net Cash (Used)/Provided by Investing Activities
|
(2,653
|
)
|
(296
|
)
|
(68
|
)
|
1,785
|
|
(1,232
|
)
|
|||||||||
|
Cash Flows from Financing Activities
|
|
|
|
|
|
|
|
||||||||||||
|
Proceeds from intercompany loans
|
—
|
|
—
|
|
1,298
|
|
(1,298
|
)
|
—
|
|
|||||||||
|
Acquisition of January 2015 Drop Down Assets, net of cash acquired
|
—
|
|
—
|
|
489
|
|
(489
|
)
|
—
|
|
|||||||||
|
Payment of dividends to common and preferred stockholders
|
—
|
|
—
|
|
(152
|
)
|
—
|
|
(152
|
)
|
|||||||||
|
Payment for treasury stock
|
—
|
|
—
|
|
(353
|
)
|
—
|
|
(353
|
)
|
|||||||||
|
Net receipts from settlement of acquired derivatives that include financing elements
|
—
|
|
138
|
|
—
|
|
—
|
|
138
|
|
|||||||||
|
Proceeds from issuance of long-term debt
|
—
|
|
635
|
|
44
|
|
—
|
|
679
|
|
|||||||||
|
Distributions from, net of contributions to, noncontrolling interest in subsidiaries
|
—
|
|
651
|
|
—
|
|
—
|
|
651
|
|
|||||||||
|
Proceeds from issuance of common stock
|
—
|
|
—
|
|
1
|
|
—
|
|
1
|
|
|||||||||
|
Payment of debt issuance costs
|
—
|
|
(14
|
)
|
—
|
|
—
|
|
(14
|
)
|
|||||||||
|
Payments for short and long-term debt
|
—
|
|
(938
|
)
|
(16
|
)
|
—
|
|
(954
|
)
|
|||||||||
|
Other
|
—
|
|
(22
|
)
|
—
|
|
—
|
|
(22
|
)
|
|||||||||
|
Net Cash Provided/(Used) by Financing Activities
|
—
|
|
450
|
|
1,311
|
|
(1,787
|
)
|
(26
|
)
|
|||||||||
|
Effect of exchange rate changes on cash and cash equivalents
|
—
|
|
15
|
|
—
|
|
—
|
|
15
|
|
|||||||||
|
Net (Decrease)/Increase in Cash and Cash Equivalents
|
(18
|
)
|
(145
|
)
|
312
|
|
—
|
|
149
|
|
|||||||||
|
Cash and Cash Equivalents at Beginning of Period
|
18
|
|
1,455
|
|
643
|
|
—
|
|
2,116
|
|
|||||||||
|
Cash and Cash Equivalents at End of Period
|
$
|
—
|
|
|
$
|
1,310
|
|
|
$
|
955
|
|
|
$
|
—
|
|
$
|
2,265
|
|
|
|
(a)
|
All significant intercompany transactions have been eliminated in consolidation.
|
52
NRG ENERGY, INC. AND SUBSIDIARIES
CONDENSED CONSOLIDATING STATEMENTS OF OPERATIONS
For the Three Months Ended September 30, 2014
(Unaudited)
|
Guarantor Subsidiaries
|
Non-Guarantor Subsidiaries
|
NRG Energy, Inc.
(Note Issuer)
|
Eliminations
(a)
|
Consolidated
|
|||||||||||||||
|
(In millions)
|
|||||||||||||||||||
|
Operating Revenues
|
|
|
|
|
|
||||||||||||||
|
Total operating revenues
|
$
|
3,216
|
|
$
|
1,375
|
|
$
|
—
|
|
$
|
(22
|
)
|
$
|
4,569
|
|
||||
|
Operating Costs and Expenses
|
|
||||||||||||||||||
|
Cost of operations
|
2,506
|
|
761
|
|
(5
|
)
|
16
|
|
3,278
|
|
|||||||||
|
Depreciation and amortization
|
216
|
|
154
|
|
5
|
|
—
|
|
375
|
|
|||||||||
|
Selling, general and administrative
|
110
|
|
82
|
|
66
|
|
—
|
|
258
|
|
|||||||||
|
Impairment losses
|
—
|
|
70
|
|
—
|
|
—
|
|
70
|
|
|||||||||
|
Acquisition-related transaction and integration costs
|
1
|
|
4
|
|
12
|
|
—
|
|
17
|
|
|||||||||
|
Development activity expenses
|
—
|
|
8
|
|
14
|
|
—
|
|
22
|
|
|||||||||
|
Total operating costs and expenses
|
2,833
|
|
1,079
|
|
92
|
|
16
|
|
4,020
|
|
|||||||||
|
Operating Income/(Loss)
|
383
|
|
296
|
|
(92
|
)
|
(38
|
)
|
549
|
|
|||||||||
|
Other Income/(Expense)
|
|
|
|
|
|
|
|||||||||||||
|
Equity in earnings of consolidated subsidiaries
|
186
|
|
15
|
|
319
|
|
(520
|
)
|
—
|
|
|||||||||
|
Equity in earnings of unconsolidated affiliates
|
3
|
|
19
|
|
—
|
|
(4
|
)
|
18
|
|
|||||||||
|
Other income/(expense), net
|
1
|
|
1
|
|
(19
|
)
|
14
|
|
(3
|
)
|
|||||||||
|
Loss on debt extinguishment
|
—
|
|
—
|
|
(13
|
)
|
—
|
|
(13
|
)
|
|||||||||
|
Interest expense
|
(4
|
)
|
(132
|
)
|
(143
|
)
|
(1
|
)
|
(280
|
)
|
|||||||||
|
Total other income/(expense)
|
186
|
|
(97
|
)
|
144
|
|
(511
|
)
|
(278
|
)
|
|||||||||
|
Income Before Income Taxes
|
569
|
|
199
|
|
52
|
|
(549
|
)
|
271
|
|
|||||||||
|
Income tax expense/(benefit)
|
169
|
|
42
|
|
(122
|
)
|
—
|
|
89
|
|
|||||||||
|
Net Income
|
400
|
|
157
|
|
174
|
|
(549
|
)
|
182
|
|
|||||||||
|
Less: Net income attributable to noncontrolling interest and redeemable noncontrolling interest
|
—
|
|
37
|
|
6
|
|
(29
|
)
|
14
|
|
|||||||||
|
Net Income Attributable to NRG Energy, Inc.
|
$
|
400
|
|
$
|
120
|
|
$
|
168
|
|
$
|
(520
|
)
|
$
|
168
|
|
||||
|
(a)
|
All significant intercompany transactions have been eliminated in consolidation.
|
53
NRG ENERGY, INC. AND SUBSIDIARIES
CONDENSED CONSOLIDATING STATEMENTS OF OPERATIONS
For the Nine Months Ended September 30, 2014
(Unaudited)
|
Guarantor Subsidiaries
|
Non-Guarantor Subsidiaries
|
NRG Energy, Inc.
(Note Issuer)
|
Eliminations
(a)
|
Consolidated
|
|||||||||||||||
|
(In millions)
|
|||||||||||||||||||
|
Operating Revenues
|
|
|
|
|
|
||||||||||||||
|
Total operating revenues
|
$
|
8,009
|
|
$
|
3,755
|
|
$
|
—
|
|
$
|
(88
|
)
|
$
|
11,676
|
|
||||
|
Operating Costs and Expenses
|
|
||||||||||||||||||
|
Cost of operations
|
6,351
|
|
2,508
|
|
2
|
|
(18
|
)
|
8,843
|
|
|||||||||
|
Depreciation and amortization
|
625
|
|
458
|
|
13
|
|
—
|
|
1,096
|
|
|||||||||
|
Selling, general and administrative
|
317
|
|
210
|
|
210
|
|
—
|
|
737
|
|
|||||||||
|
Impairment losses
|
—
|
|
70
|
|
—
|
|
—
|
|
70
|
|
|||||||||
|
Acquisition-related transaction and integration costs
|
1
|
|
12
|
|
56
|
|
—
|
|
69
|
|
|||||||||
|
Development activity expenses
|
—
|
|
25
|
|
37
|
|
—
|
|
62
|
|
|||||||||
|
Total operating costs and expenses
|
7,294
|
|
3,283
|
|
318
|
|
(18
|
)
|
10,877
|
|
|||||||||
|
Gain on sale of assets
|
—
|
|
19
|
|
—
|
|
—
|
|
19
|
|
|||||||||
|
Operating Income/(Loss)
|
715
|
|
491
|
|
(318
|
)
|
(70
|
)
|
818
|
|
|||||||||
|
Other Income/(Expense)
|
|
|
|
|
|
|
|||||||||||||
|
Equity in earnings of consolidated subsidiaries
|
287
|
|
9
|
|
499
|
|
(795
|
)
|
—
|
|
|||||||||
|
Equity in earnings of unconsolidated affiliates
|
13
|
|
37
|
|
—
|
|
(11
|
)
|
39
|
|
|||||||||
|
Other income/(expense), net
|
5
|
|
9
|
|
(14
|
)
|
13
|
|
13
|
|
|||||||||
|
Loss on debt extinguishment
|
—
|
|
(9
|
)
|
(85
|
)
|
—
|
|
(94
|
)
|
|||||||||
|
Interest expense
|
(15
|
)
|
(359
|
)
|
(435
|
)
|
—
|
|
(809
|
)
|
|||||||||
|
Total other income/(expense)
|
290
|
|
(313
|
)
|
(35
|
)
|
(793
|
)
|
(851
|
)
|
|||||||||
|
Income/(Loss) Before Income Taxes
|
1,005
|
|
178
|
|
(353
|
)
|
(863
|
)
|
(33
|
)
|
|||||||||
|
Income tax expense/(benefit)
|
279
|
|
36
|
|
(383
|
)
|
—
|
|
(68
|
)
|
|||||||||
|
Net Income
|
726
|
|
142
|
|
30
|
|
(863
|
)
|
35
|
|
|||||||||
|
Less: Net income attributable to noncontrolling interest and redeemable noncontrolling interest
|
—
|
|
73
|
|
15
|
|
(68
|
)
|
20
|
|
|||||||||
|
Net Income Attributable to NRG Energy, Inc.
|
$
|
726
|
|
$
|
69
|
|
$
|
15
|
|
$
|
(795
|
)
|
$
|
15
|
|
||||
|
(a)
|
All significant intercompany transactions have been eliminated in consolidation.
|
54
NRG ENERGY, INC. AND SUBSIDIARIES
CONDENSED CONSOLIDATING STATEMENTS OF COMPREHENSIVE INCOME/(LOSS)
For the Three Months Ended September 30, 2014
(Unaudited)
|
Guarantor Subsidiaries
|
Non-Guarantor Subsidiaries
|
NRG Energy, Inc.
(Note Issuer)
|
Eliminations
(a)
|
Consolidated
|
|||||||||||||||
|
(In millions)
|
|||||||||||||||||||
|
Net Income
|
$
|
400
|
|
$
|
157
|
|
$
|
174
|
|
$
|
(549
|
)
|
$
|
182
|
|
||||
|
Other Comprehensive Income/(Loss), net of tax
|
|||||||||||||||||||
|
Unrealized (loss)/gain on derivatives, net
|
(7
|
)
|
2
|
|
3
|
|
6
|
|
4
|
|
|||||||||
|
Foreign currency translation adjustments, net
|
—
|
|
(9
|
)
|
3
|
|
—
|
|
(6
|
)
|
|||||||||
|
Available-for-sale securities, net
|
—
|
|
(21
|
)
|
19
|
|
—
|
|
(2
|
)
|
|||||||||
|
Defined benefit plans, net
|
—
|
|
55
|
|
(58
|
)
|
—
|
|
(3
|
)
|
|||||||||
|
Other comprehensive (loss)/income
|
(7
|
)
|
27
|
|
(33
|
)
|
6
|
|
(7
|
)
|
|||||||||
|
Comprehensive Income
|
393
|
|
184
|
|
141
|
|
(543
|
)
|
175
|
|
|||||||||
|
Less: Comprehensive income/(loss) attributable to noncontrolling interest and redeemable noncontrolling interest
|
—
|
|
17
|
|
(17
|
)
|
17
|
|
17
|
|
|||||||||
|
Comprehensive Income Attributable to NRG Energy, Inc.
|
393
|
|
167
|
|
158
|
|
(560
|
)
|
158
|
|
|||||||||
|
Dividends for preferred shares
|
—
|
|
—
|
|
2
|
|
—
|
|
2
|
|
|||||||||
|
Comprehensive Income Available for Common Stockholders
|
$
|
393
|
|
$
|
167
|
|
$
|
156
|
|
$
|
(560
|
)
|
$
|
156
|
|
||||
|
(a)
|
All significant intercompany transactions have been eliminated in consolidation.
|
55
NRG ENERGY, INC. AND SUBSIDIARIES
CONDENSED CONSOLIDATING STATEMENTS OF COMPREHENSIVE INCOME/(LOSS)
For the Nine Months Ended September 30, 2014
(Unaudited)
|
Guarantor Subsidiaries
|
Non-Guarantor Subsidiaries
|
NRG Energy, Inc.
(Note Issuer)
|
Eliminations
(a)
|
Consolidated
|
|||||||||||||||
|
(In millions)
|
|||||||||||||||||||
|
Net Income
|
$
|
726
|
|
$
|
142
|
|
$
|
30
|
|
$
|
(863
|
)
|
$
|
35
|
|
||||
|
Other Comprehensive Income/(Loss), net of tax
|
|||||||||||||||||||
|
Unrealized gain/(loss) on derivatives, net
|
1
|
|
(24
|
)
|
—
|
|
(1
|
)
|
(24
|
)
|
|||||||||
|
Foreign currency translation adjustments, net
|
—
|
|
(4
|
)
|
1
|
|
—
|
|
(3
|
)
|
|||||||||
|
Available-for-sale securities, net
|
—
|
|
3
|
|
(1
|
)
|
—
|
|
2
|
|
|||||||||
|
Defined benefit plans, net
|
—
|
|
42
|
|
(33
|
)
|
—
|
|
9
|
|
|||||||||
|
Other comprehensive income/(loss)
|
1
|
|
17
|
|
(33
|
)
|
(1
|
)
|
(16
|
)
|
|||||||||
|
Comprehensive Income/(Loss)
|
727
|
|
159
|
|
(3
|
)
|
(864
|
)
|
19
|
|
|||||||||
|
Less: Comprehensive income/(loss) attributable to noncontrolling interest and redeemable noncontrolling interest
|
—
|
|
10
|
|
(8
|
)
|
12
|
|
14
|
|
|||||||||
|
Comprehensive Income Attributable to NRG Energy, Inc.
|
727
|
|
149
|
|
5
|
|
(876
|
)
|
5
|
|
|||||||||
|
Dividends for preferred shares
|
—
|
|
—
|
|
7
|
|
—
|
|
7
|
|
|||||||||
|
Comprehensive Income/(Loss) Available for Common Stockholders
|
$
|
727
|
|
$
|
149
|
|
$
|
(2
|
)
|
$
|
(876
|
)
|
$
|
(2
|
)
|
||||
|
(a)
|
All significant intercompany transactions have been eliminated in consolidation.
|
56
NRG ENERGY, INC. AND SUBSIDIARIES
CONDENSED CONSOLIDATING BALANCE SHEETS
December 31, 2014
|
Guarantor Subsidiaries
|
Non-Guarantor Subsidiaries
|
NRG Energy, Inc.
(Note Issuer)
|
Eliminations
(a)
|
Consolidated
|
|||||||||||||||
|
ASSETS
|
(In millions)
|
||||||||||||||||||
|
Current Assets
|
|
|
|
|
|
||||||||||||||
|
Cash and cash equivalents
|
$
|
18
|
|
$
|
1,455
|
|
$
|
643
|
|
$
|
—
|
|
$
|
2,116
|
|
||||
|
Funds deposited by counterparties
|
9
|
|
63
|
|
—
|
|
—
|
|
72
|
|
|||||||||
|
Restricted cash
|
5
|
|
451
|
|
1
|
|
—
|
|
457
|
|
|||||||||
|
Accounts receivable - trade, net
|
924
|
|
392
|
|
6
|
|
—
|
|
1,322
|
|
|||||||||
|
Accounts receivable - affiliate
|
7,449
|
|
1,988
|
|
(5,991
|
)
|
(3,437
|
)
|
9
|
|
|||||||||
|
Inventory
|
537
|
|
710
|
|
—
|
|
—
|
|
1,247
|
|
|||||||||
|
Derivative instruments
|
1,657
|
|
1,209
|
|
—
|
|
(441
|
)
|
2,425
|
|
|||||||||
|
Cash collateral paid in support of energy risk management activities
|
114
|
|
73
|
|
—
|
|
—
|
|
187
|
|
|||||||||
|
Deferred income taxes
|
41
|
|
96
|
|
37
|
|
—
|
|
174
|
|
|||||||||
|
Renewable energy grant receivable, net
|
—
|
|
134
|
|
1
|
|
—
|
|
135
|
|
|||||||||
|
Prepayments and other current assets
|
53
|
|
79
|
|
306
|
|
—
|
|
438
|
|
|||||||||
|
Total current assets
|
10,807
|
|
6,650
|
|
(4,997
|
)
|
(3,878
|
)
|
8,582
|
|
|||||||||
|
Net Property, Plant and Equipment
|
8,344
|
|
13,877
|
|
171
|
|
(25
|
)
|
22,367
|
|
|||||||||
|
Other Assets
|
|
|
|
|
|
||||||||||||||
|
Investment in subsidiaries
|
140
|
|
2,293
|
|
23,410
|
|
(25,843
|
)
|
—
|
|
|||||||||
|
Equity investments in affiliates
|
(18
|
)
|
891
|
|
—
|
|
(102
|
)
|
771
|
|
|||||||||
|
Notes receivable, less current portion
|
1
|
|
60
|
|
109
|
|
(98
|
)
|
72
|
|
|||||||||
|
Goodwill
|
1,921
|
|
653
|
|
—
|
|
—
|
|
2,574
|
|
|||||||||
|
Intangible assets, net
|
765
|
|
1,806
|
|
2
|
|
(6
|
)
|
2,567
|
|
|||||||||
|
Nuclear decommissioning trust fund
|
585
|
|
—
|
|
—
|
|
—
|
|
585
|
|
|||||||||
|
Derivative instruments
|
242
|
|
288
|
|
1
|
|
(51
|
)
|
480
|
|
|||||||||
|
Deferred income taxes
|
(247
|
)
|
816
|
|
837
|
|
—
|
|
1,406
|
|
|||||||||
|
Other non-current assets
|
113
|
|
640
|
|
508
|
|
—
|
|
1,261
|
|
|||||||||
|
Total other assets
|
3,502
|
|
7,447
|
|
24,867
|
|
(26,100
|
)
|
9,716
|
|
|||||||||
|
Total Assets
|
$
|
22,653
|
|
$
|
27,974
|
|
$
|
20,041
|
|
$
|
(30,003
|
)
|
$
|
40,665
|
|
||||
|
LIABILITIES AND STOCKHOLDERS’ EQUITY
|
|||||||||||||||||||
|
Current Liabilities
|
|
|
|
|
|
||||||||||||||
|
Current portion of long-term debt and capital leases
|
$
|
1
|
|
$
|
444
|
|
$
|
127
|
|
$
|
(98
|
)
|
$
|
474
|
|
||||
|
Accounts payable
|
598
|
|
416
|
|
46
|
|
—
|
|
1,060
|
|
|||||||||
|
Accounts payable — affiliate
|
1,588
|
|
2,447
|
|
(598
|
)
|
(3,437
|
)
|
—
|
|
|||||||||
|
Deferred Income Taxes
|
7
|
|
—
|
|
(7
|
)
|
—
|
|
—
|
|
|||||||||
|
Derivative instruments
|
1,532
|
|
963
|
|
—
|
|
(441
|
)
|
2,054
|
|
|||||||||
|
Cash collateral received in support of energy risk management activities
|
9
|
|
63
|
|
—
|
|
—
|
|
72
|
|
|||||||||
|
Accrued expenses and other current liabilities
|
283
|
|
498
|
|
418
|
|
—
|
|
1,199
|
|
|||||||||
|
Total current liabilities
|
4,018
|
|
4,831
|
|
(14
|
)
|
(3,976
|
)
|
4,859
|
|
|||||||||
|
Other Liabilities
|
|
|
|
|
|
||||||||||||||
|
Long-term debt and capital leases
|
307
|
|
11,226
|
|
8,367
|
|
—
|
|
19,900
|
|
|||||||||
|
Nuclear decommissioning reserve
|
310
|
|
—
|
|
—
|
|
—
|
|
310
|
|
|||||||||
|
Nuclear decommissioning trust liability
|
333
|
|
—
|
|
—
|
|
—
|
|
333
|
|
|||||||||
|
Deferred income taxes
|
1,036
|
|
(1,012
|
)
|
(3
|
)
|
—
|
|
21
|
|
|||||||||
|
Derivative instruments
|
248
|
|
241
|
|
—
|
|
(51
|
)
|
438
|
|
|||||||||
|
Out-of-market contracts, net
|
111
|
|
1,133
|
|
—
|
|
—
|
|
1,244
|
|
|||||||||
|
Other non-current liabilities
|
465
|
|
795
|
|
314
|
|
—
|
|
1,574
|
|
|||||||||
|
Total non-current liabilities
|
2,810
|
|
12,383
|
|
8,678
|
|
(51
|
)
|
23,820
|
|
|||||||||
|
Total Liabilities
|
6,828
|
|
17,214
|
|
8,664
|
|
(4,027
|
)
|
28,679
|
|
|||||||||
|
2.822% Preferred Stock
|
—
|
|
—
|
|
291
|
|
—
|
|
291
|
|
|||||||||
|
Redeemable noncontrolling interest in subsidiaries
|
—
|
|
19
|
|
—
|
|
—
|
|
19
|
|
|||||||||
|
Stockholders’ Equity
|
15,825
|
|
10,741
|
|
11,086
|
|
(25,976
|
)
|
11,676
|
|
|||||||||
|
Total Liabilities and Stockholders’ Equity
|
$
|
22,653
|
|
$
|
27,974
|
|
$
|
20,041
|
|
$
|
(30,003
|
)
|
$
|
40,665
|
|
||||
|
(a)
|
All significant intercompany transactions have been eliminated in consolidation.
|
57
NRG ENERGY, INC. AND SUBSIDIARIES
CONDENSED CONSOLIDATING STATEMENTS OF CASH FLOWS
For the Nine Months Ended September 30, 2014
(Unaudited)
|
Guarantor Subsidiaries
|
Non-Guarantor Subsidiaries
|
NRG Energy, Inc.
(Note Issuer)
|
Eliminations
(a)
|
Consolidated
|
|||||||||||||||
|
(In millions)
|
|||||||||||||||||||
|
Cash Flows from Operating Activities
|
|
|
|
|
|
||||||||||||||
|
Net Income
|
$
|
726
|
|
$
|
142
|
|
$
|
30
|
|
$
|
(863
|
)
|
$
|
35
|
|
||||
|
Adjustments to reconcile net loss to net cash provided by operating activities:
|
|
||||||||||||||||||
|
Distributions from /(to) unconsolidated affiliates
|
—
|
|
103
|
|
—
|
|
(32
|
)
|
71
|
|
|||||||||
|
Equity in (losses)/earnings of unconsolidated affiliates
|
(13
|
)
|
(37
|
)
|
—
|
|
11
|
|
(39
|
)
|
|||||||||
|
Depreciation and amortization
|
625
|
|
458
|
|
13
|
|
—
|
|
1,096
|
|
|||||||||
|
Provision for bad debts
|
49
|
|
—
|
|
—
|
|
—
|
|
49
|
|
|||||||||
|
Amortization of nuclear fuel
|
33
|
|
—
|
|
—
|
|
—
|
|
33
|
|
|||||||||
|
Amortization of financing costs and debt discount/premiums
|
—
|
|
(19
|
)
|
10
|
|
—
|
|
(9
|
)
|
|||||||||
|
Adjustment for debt extinguishment
|
—
|
|
7
|
|
17
|
|
—
|
|
24
|
|
|||||||||
|
Amortization of intangibles and out-of-market contracts
|
52
|
|
—
|
|
—
|
|
—
|
|
52
|
|
|||||||||
|
Amortization of unearned equity compensation
|
—
|
|
—
|
|
32
|
|
—
|
|
32
|
|
|||||||||
|
Changes in deferred income taxes and liability for uncertain tax benefits
|
281
|
|
136
|
|
(492
|
)
|
—
|
|
(75
|
)
|
|||||||||
|
Changes in nuclear decommissioning trust liability
|
12
|
|
—
|
|
—
|
|
—
|
|
12
|
|
|||||||||
|
Changes in derivative instruments
|
(62
|
)
|
313
|
|
(3
|
)
|
—
|
|
248
|
|
|||||||||
|
Changes in collateral deposits supporting energy risk management activities
|
42
|
|
(142
|
)
|
—
|
|
—
|
|
(100
|
)
|
|||||||||
|
Loss on sale of emission allowances
|
2
|
|
—
|
|
—
|
|
—
|
|
2
|
|
|||||||||
|
Gain on sale of assets
|
—
|
|
(26
|
)
|
—
|
|
—
|
|
(26
|
)
|
|||||||||
|
Impairment losses
|
—
|
|
70
|
|
—
|
|
—
|
|
70
|
|
|||||||||
|
Cash used by changes in other working capital
|
(369
|
)
|
(1,082
|
)
|
206
|
|
884
|
|
(361
|
)
|
|||||||||
|
Net Cash Provided/(Used) by Operating Activities
|
1,378
|
|
(77
|
)
|
|
(187
|
)
|
|
—
|
|
1,114
|
|
|||||||
|
Cash Flows from Investing Activities
|
|
||||||||||||||||||
|
Intercompany loans (to)/from subsidiaries
|
(1,382
|
)
|
(114
|
)
|
—
|
|
1,496
|
|
—
|
|
|||||||||
|
Acquisition of June 2014 Drop Down Assets, net of cash acquired
|
—
|
|
(336
|
)
|
—
|
|
336
|
|
—
|
|
|||||||||
|
Acquisition of businesses, net of cash acquired
|
—
|
|
(25
|
)
|
(2,807
|
)
|
—
|
|
(2,832
|
)
|
|||||||||
|
Capital expenditures
|
(16
|
)
|
(180
|
)
|
(479
|
)
|
—
|
|
(675
|
)
|
|||||||||
|
Increase in restricted cash, net
|
—
|
|
(52
|
)
|
—
|
|
—
|
|
(52
|
)
|
|||||||||
|
Decrease/(increase) in restricted cash — U.S. DOE projects
|
—
|
|
24
|
|
(3
|
)
|
—
|
|
21
|
|
|||||||||
|
Decrease in notes receivable
|
—
|
|
21
|
|
—
|
|
—
|
|
21
|
|
|||||||||
|
Investments in nuclear decommissioning trust fund securities
|
(475
|
)
|
—
|
|
—
|
|
—
|
|
(475
|
)
|
|||||||||
|
Proceeds from sales of nuclear decommissioning trust fund securities
|
463
|
|
—
|
|
—
|
|
—
|
|
463
|
|
|||||||||
|
Proceeds from renewable energy grants
|
—
|
|
431
|
|
—
|
|
—
|
|
431
|
|
|||||||||
|
Proceeds from sale of assets, net of cash disposed of
|
—
|
|
—
|
|
153
|
|
—
|
|
153
|
|
|||||||||
|
Cash proceeds to fund cash grant bridge loan payment
|
—
|
|
57
|
|
—
|
|
—
|
|
57
|
|
|||||||||
|
Investments in unconsolidated affiliates
|
—
|
|
(28
|
)
|
(59
|
)
|
—
|
|
(87
|
)
|
|||||||||
|
Other
|
(6
|
)
|
12
|
|
11
|
|
—
|
|
17
|
|
|||||||||
|
Net Cash Used by Investing Activities
|
(1,416
|
)
|
(190
|
)
|
(3,184
|
)
|
1,832
|
|
(2,958
|
)
|
|||||||||
|
Cash Flows from Financing Activities
|
|
|
|
|
|
||||||||||||||
|
Proceeds from intercompany loans
|
—
|
|
—
|
|
1,496
|
|
(1,496
|
)
|
—
|
|
|||||||||
|
Acquisition of June 2014 Drop Down Assets, net of cash acquired
|
—
|
|
—
|
|
336
|
|
(336
|
)
|
—
|
|
|||||||||
|
Payment of dividends to common and preferred stockholders
|
—
|
|
—
|
|
(140
|
)
|
—
|
|
(140
|
)
|
|||||||||
|
Net payment for settlement of acquired derivatives that include financing elements
|
—
|
|
(64
|
)
|
—
|
|
—
|
|
(64
|
)
|
|||||||||
|
Distributions from noncontrolling interest in subsidiaries
|
—
|
|
639
|
|
—
|
|
—
|
|
639
|
|
|||||||||
|
Proceeds from issuance of long-term debt
|
—
|
|
1,121
|
|
3,335
|
|
—
|
|
4,456
|
|
|||||||||
|
Proceeds from issuance of common stock
|
—
|
|
—
|
|
15
|
|
—
|
|
15
|
|
|||||||||
|
Payment of debt issuance costs
|
—
|
|
(28
|
)
|
(29
|
)
|
—
|
|
(57
|
)
|
|||||||||
|
Payments for short and long-term debt
|
—
|
|
(649
|
)
|
(2,659
|
)
|
—
|
|
(3,308
|
)
|
|||||||||
|
Net Cash Provided by Financing Activities
|
—
|
|
1,019
|
|
2,354
|
|
(1,832
|
)
|
1,541
|
|
|||||||||
|
Effect of exchange rate changes on cash and cash equivalents
|
—
|
|
2
|
|
—
|
|
—
|
|
2
|
|
|||||||||
|
Net (Decrease)/Increase in Cash and Cash Equivalents
|
(38
|
)
|
754
|
|
(1,017
|
)
|
—
|
|
(301
|
)
|
|||||||||
|
Cash and Cash Equivalents at Beginning of Period
|
56
|
|
870
|
|
1,328
|
|
—
|
|
2,254
|
|
|||||||||
|
Cash and Cash Equivalents at End of Period
|
$
|
18
|
|
$
|
1,624
|
|
$
|
311
|
|
$
|
—
|
|
$
|
1,953
|
|
||||
|
(a)
|
All significant intercompany transactions have been eliminated in consolidation.
|
58
As you read this discussion and analysis, refer to NRG's Condensed Consolidated Statements of Operations to this Form 10-Q, which present the results of operations for the
three
and
nine
months ended
September 30, 2015
, and
2014
. Also refer to NRG's
2014
Form 10-K, which includes detailed discussions of various items impacting the Company's business, results of operations and financial condition, including: Introduction and Overview section; NRG's Business Strategy section; Business section, including how regulation, weather, and other factors affect NRG's business; and Critical Accounting Policies and Estimates section.
The discussion and analysis below has been organized as follows:
|
•
|
Executive summary, including introduction and overview, business strategy, and changes to the business environment during the period, including environmental and regulatory matters;
|
|
•
|
Results of operations;
|
|
•
|
Financial condition, addressing liquidity position, sources and uses of liquidity, capital resources and requirements, commitments, and off-balance sheet arrangements; and
|
|
•
|
Known trends that may affect NRG's results of operations and financial condition in the future.
|
59
Executive Summary
Introduction and Overview
NRG Energy, Inc., or NRG or the Company, is a competitive power company, which produces, sells and delivers energy and energy products and services in major competitive power markets primarily in the U.S. while positioning itself as a leader in the way residential, industrial and commercial consumers think about and use energy products and services. NRG has one of the nation's largest and most diverse competitive power generation portfolios balanced with one of the nation's largest retail energy providers. The Company owns and operates approximately 50,000 MWs of generation; engages in the trading of wholesale energy, capacity and related products; transacts in and trades fuel and transportation services; and directly sells energy, services, and innovative, sustainable products and services to retail customers under the name “NRG” and various other retail brand names owned by NRG.
The following table summarizes NRG's global generation portfolio as of
September 30, 2015
, by operating segment:
|
Global Generation Portfolio by Operating Segment
(a)
|
||||||||||||||||||||||||||
|
(In MW)
|
||||||||||||||||||||||||||
|
NRG Business
|
||||||||||||||||||||||||||
|
Gulf Coast
|
East
|
West
|
NRG Home Solar
(b)
|
NRG Renew
(c)
|
NRG Yield
(d)
|
Total Domestic
|
Other(Inter-national)
|
Total Global
|
||||||||||||||||||
|
Primary Fuel-type
|
||||||||||||||||||||||||||
|
Natural gas
(e)
|
8,624
|
|
7,875
|
|
6,496
|
|
—
|
|
—
|
|
1,879
|
|
24,874
|
|
144
|
|
25,018
|
|
||||||||
|
Coal
(f)
|
5,114
|
|
10,197
|
|
—
|
|
—
|
|
—
|
|
—
|
|
15,311
|
|
605
|
|
15,916
|
|
||||||||
|
Oil
(g)
|
—
|
|
5,606
|
|
—
|
|
—
|
|
—
|
|
190
|
|
5,796
|
|
—
|
|
5,796
|
|
||||||||
|
Nuclear
|
1,176
|
|
—
|
|
—
|
|
—
|
|
—
|
|
—
|
|
1,176
|
|
—
|
|
1,176
|
|
||||||||
|
Wind
|
—
|
|
—
|
|
—
|
|
—
|
|
1,672
|
|
1,389
|
|
3,061
|
|
—
|
|
3,061
|
|
||||||||
|
Utility Scale Solar
|
—
|
|
—
|
|
—
|
|
—
|
|
807
|
|
481
|
|
1,288
|
|
—
|
|
1,288
|
|
||||||||
|
Distributed Solar
|
—
|
|
—
|
|
—
|
|
78
|
|
49
|
|
9
|
|
136
|
|
—
|
|
136
|
|
||||||||
|
Total generation capacity
|
14,914
|
|
23,678
|
|
6,496
|
|
78
|
|
2,528
|
|
3,948
|
|
51,642
|
|
749
|
|
52,391
|
|
||||||||
|
Capacity attributable to noncontrolling interest
|
—
|
|
—
|
|
—
|
|
—
|
|
(630
|
)
|
(1,773
|
)
|
(2,403
|
)
|
—
|
|
(2,403
|
)
|
||||||||
|
Total net generation capacity
|
14,914
|
|
23,678
|
|
6,496
|
|
78
|
|
1,898
|
|
2,175
|
|
49,239
|
|
749
|
|
49,988
|
|
||||||||
(a) Includes 92 active fossil fuel and nuclear plants, 15 Utility Scale Solar facilities (including Guam, which reached COD on October 16, 2015), 36 wind farms and multiple Distributed Solar facilities. All Utility Scale Solar and Distributed Solar facilities are described in MWs on an alternating current basis. MW figures provided represent nominal summer net MW capacity of power generated as adjusted for the Company's owned or leased interest excluding capacity from inactive/mothballed units.
(b) Includes the aggregate production capacity of installed and activated residential solar energy systems. Also includes capacity from operating portfolios of residential solar assets held by RPV Holdco, a partnership between NRG Home Solar and NRG Yield, Inc.
(c) Includes Distributed Solar capacity from assets held by DGPV Holdco, a partnership between NRG Renew and NRG Yield, Inc.
(d) Does not include NRG Yield, Inc.'s thermal converted (MWt) capacity, which is part of the NRG Yield operating segment.
(e) Natural gas generation portfolio does not include 463 MW related to Osceola, which was mothballed on January 1, 2015; 636 MW related to Coolwater, which was retired on January 1, 2015; 160 MW related to Glen Gardner, which was retired on May 1, 2015; and 98 MW related to Gilbert, which was retired on May 1, 2015. Natural gas generation portfolio increased 389 MW as Bowline Unit 2 was restored to full capacity on June 23, 2015, following a boiler restoration.
(f) Coal generation portfolio does not include 251 MW related to Will County, which was retired April 15, 2015; and 597 MW related to Shawville, which was mothballed on May 31, 2015.
(g) Oil generation portfolio does not include 212 MW related to Werner, which was retired on May 1, 2015.
NRG's Business Strategy
NRG's business strategy, summarized in “Enhance Generation, Expand Retail and Go Green while engaging in Smart Capital Allocation” is to maximize stockholder value through the production and sale of safe, reliable and affordable power to its customers in the markets served by the Company, while aggressively positioning the Company to meet the market's increasing demand for sustainable, low carbon and portable energy solutions individualized for the benefit of the end use energy consumer. This strategy is intended to enable the Company to achieve substantial sustainable growth at reasonable margins while de-risking the Company in terms of reduced and mitigated exposure both to environmental risk and cyclical commodity price risk. At the same time, the Company's relentless commitment to safety for its employees, customers and partners continues unabated.
60
To effectuate the Company’s strategy, NRG is focused on: (i) excellence in operating performance of its existing assets including repowering its power generation assets at premium sites and optimal hedging of generation assets and retail load operations; (ii) engaging in a proactive capital allocation plan focused on achieving the regular return of and on stockholder capital within the dictates of prudent balance sheet management; including pursuing selective acquisitions, joint ventures, divestitures and investments; (iii) serving the energy needs of end-use residential, commercial and industrial customers in competitive markets through multiple brands and channels with a variety of retail energy products and services differentiated by innovative features, premium service, sustainability, and loyalty/affinity programs; and (iv) investing in, and deploying, alternative energy technologies both in its wholesale portfolio through its wind and solar portfolio and, particularly, in and around its retail businesses and its customers as it transforms this part of its business into a technology-driven provider of retail energy services. The Company's progress in each of these areas is more fully described in Item 1,
Business
of the Company's 2014 Form 10-K, and this Form 10-Q.
The Company believes that societal, sector and technology trends continue to support increased consumer-driven demand for solar and other distributed clean technologies that will both compete and coexist with the traditional centralized grid-based power system. Moreover, the Company believes the information technology driven revolution, increasingly wireless and thus portable, has enabled greater and easier personal choice in other sectors of the consumer economy and will do the same in the U.S. energy sector over the years to come. These trends towards sustainability and personal energy choice create high growth opportunities, but are still small relative to the Company’s conventional generation and retail businesses.
The Company announced it is reorganizing its current structure, to be effective January 1, 2016, by forming a new entity ("GreenCo") that will own certain NRG businesses, including, but not limited to, NRG Home Solar and business-to-business distributed solar. The Company believes that GreenCo will provide (i) a simplified approach to measure the value of the Company, (ii) better visibility of the capital allocated to the businesses within GreenCo and (iii) a platform that better aligns the different parts of the Company’s business with existing investors while enabling potential third-party investors at GreenCo.
The Company also announced several key updates including: (i) planned annual cost savings of $150 million through the streamlining of operations in 2016; (ii) an additional $100 million annual cost reduction initiative associated with the Company's operations and maintenance spend in 2016; (iii) the introduction, commencing January 1, 2016, of an intercompany revolver providing maximum liquidity support of $125 million to NRG Home Solar, business-to-business distributed solar and NRG EVgo; (iv) a reduction in NRG's capital expenditure program of approximately $100 million through the elimination of certain fuel conversion projects at GenOn plants; and (v) a comprehensive capital allocation strategy aimed at utilizing an additional $1.6 billion over the balance of 2015 and 2016 to reduce debt and repurchase shares. This capital allocation strategy is dependent upon the receipt of funds through the sale of assets to NRG Yield, Inc., cost reductions, asset sales and repowering efforts and non-recourse financings.
Significant Events
The following significant events have occurred since the filing of the Company's last quarterly report:
|
•
|
On September 21, 2015, the Company announced the authorization to repurchase an additional $200 million of the Company's common stock under the 2015 Capital Allocation Program, resulting in an increase in the total amount authorized for repurchase under the 2015 Capital Allocation Program to $481 million. Through September 30, 2015, the Company completed $397 million of share repurchases and during October 2015 completed the remaining $84 million of repurchases available under the 2015 Capital Allocation Program.
|
|
•
|
On November 3, 2015, the Company sold 75% of the Class B interests of NRG Wind TE Holdco, which owns a portfolio of twelve wind facilities totaling 814 net MW, to NRG Yield, Inc. for total cash consideration of $210 million, subject to working capital adjustments. NRG Yield, Inc. will be responsible for its pro-rata share of non-recourse project debt of $193 million and noncontrolling interest associated with a tax equity structure of $165 million (as of September 30, 2015).
|
61
Regulatory Matters
The Company’s regulatory matters are described in the Company’s 2014 Form 10-K in Item 1, Business —
Regulatory Matters.
These matters have been updated below and in
Note 15
,
Regulatory Matters
,
to the Condensed Consolidated Financial Statements of this Form 10-Q as found in Item 1.
As owners of power plants and participants in wholesale and retail energy markets, certain NRG entities are subject to regulation by various federal and state government agencies. These include the CFTC, FERC, NRC, and the PUCT, as well as other public utility commissions in certain states where NRG's generating, thermal, or distributed generation assets are located. In addition, NRG is subject to the market rules, procedures and protocols of the various ISO and RTO markets in which it participates. Likewise, certain NRG entities participating in the retail markets are subject to rules and regulations established by the states in which NRG entities are licensed to sell at retail. NRG must also comply with the mandatory reliability requirements imposed by NERC and the regional reliability entities in the regions where the Company operates.
NRG's operations within the ERCOT footprint are not subject to rate regulation by FERC, as they are deemed to operate solely within the ERCOT market and not in interstate commerce. These operations are subject to regulation by the PUCT, as well as to regulation by the NRC with respect to the Company's ownership interest in STP.
East Region
PJM
PJM Auction Results
— On August 21, 2015, PJM announced the results of its 2018/2019 Base Residual Auction, officially integrating the new Capacity Performance product into the market. NRG cleared approximately 13,388 MWs of Capacity Performance product and 784 MWs of Base Capacity product in the 2018/2019 Base Residual Auction. NRG’s expected capacity revenues from the 2018/2019 Base Residual Auction are approximately $900 million. PJM announced the results of its Transitional Capacity Auctions for the 2016/2017 and 2017/2018 delivery years, respectively, on August 31, 2015, and September 9, 2015. NRG cleared approximately 3,900 MWs of Capacity Performance product in the 2016/2017 Transactional Capacity Auction, and 9,700 MWs of Capacity Performance product in the 2017/2018 Transitional Capacity Auction. NRG expects an approximately $425 million increase in PJM capacity revenue from 2016/2017 to 2018/2019 due to the Capacity Performance product.
The table below provides a detailed description of NRG’s 2018/2019 Base Residual Auction results:
|
|
|
Base Capacity Product
|
|
Capacity Performance Product
|
||||
|
Zone
|
|
Cleared Capacity (MW)
(1)
|
|
Price
($/MW-day)
|
|
Cleared Capacity (MW)
(1)
|
|
Price
($/MW-day)
|
|
COMED
|
|
221
|
|
$200.21
|
|
4,088
|
|
$215.00
|
|
EMAAC
|
|
189
|
|
$210.63
|
|
981
|
|
$225.42
|
|
MAAC
|
|
68
|
|
$149.98
|
|
6,618
|
|
$164.77
|
|
RTO
|
306
|
$149.98
|
1,701
|
$164.77
|
||||
|
Total
|
|
784
|
|
|
|
13,388
|
|
|
(1) Includes imports. Does not include capacity sold by Energy Curtailment Specialists.
Capacity Performance Rehearings
— On June 9, 2015, FERC approved a substantial revamp to PJM’s capacity market. Major elements of the approved changes to the Capacity Performance framework include the calculation of the bid cap, elimination of the 2.5% holdback for short lead-time resources, and substantial new performance penalties on Capacity Performance resources that do not perform in real time during specific periods of high demand. The new rules mandate that underperformance penalties be paid to units that over perform during those periods of high demand. NRG’s actual revenues will be the combination of the revenues based on the cleared auction MWs plus the net of any over and under performance of NRG's fleet. On July 9, 2015, multiple parties, including NRG, filed requests for rehearings at FERC regarding the framework of the new annual capacity auctions. Rehearing is pending.
In addition, multiple parties sought clarification on whether Demand Resources could participate in the Capacity Performance Transition Auctions. On July 22, 2015, FERC issued an Order allowing demand response and energy efficiency resources to participate in the upcoming Capacity Performance Transition Auctions. Rehearing is pending.
62
New Jersey and Maryland's Generator Contracting Programs
— The New Jersey Board of Public Utilities and the Maryland Public Service Commission awarded long-term power purchase contracts to generation developers to encourage the construction of new generation capacity in the respective states. The constitutionality of the long-term contracts was challenged and the U.S. District Court for the District of New Jersey (in an October 25, 2013, decision) and the U.S. District Court for the District of Maryland (in an October 24, 2013, decision) found that the respective contracts violated the Supremacy Clause of the U.S. Constitution and were preempted. On June 30, 2014, the U.S. Court of Appeals for the Fourth Circuit affirmed the Maryland District Court's decision. On September 11, 2014, the U.S. Court of Appeals for the Third Circuit affirmed the New Jersey District Court's decision. Various parties filed petitions for a writ of certiorari seeking U.S. Supreme Court review of both cases. On October 19, 2015, the U.S. Supreme Court granted certiorari in the Fourth Circuit case. The outcome of this litigation and the validity of the contracts may affect future capacity prices in PJM.
NextEra/Direct Energy Complaint Against PJM on Capacity Performance Transition Auctions
— On August 6, 2015, NextEra and Direct Energy filed a complaint challenging PJM’s methodology for conducting its transitional capacity auction. NRG protested the complaint. On August 25, 2015, FERC denied the NextEra/Direct Energy complaint finding that the complainants did not demonstrate that PJM’s clearing methodology failed to follow its tariff, or is unjust and unreasonable.
Complaint Against PJM on RPM Load Forecasts
— On June 30, 2015, a group of consumer advocates and state PSCs filed a complaint against PJM alleging that PJM has violated Section 206 of the FPA by failing to update its methodology for defining load forecast for purposes of the upcoming annual Base Residual Auction and the Transition Auctions. Briefing is underway. Any change to the load forecast of the underlying models could affect capacity prices going forward.
MOPR Revisions
— On May 2, 2013, FERC accepted PJM's proposal to substantially revise its Minimum Offer Price Rule. Among other things, FERC approved the portions of the PJM proposal that exempt many new entrants from demonstrating that their proposed projects are economic, as well as providing a similar exemption from public power entities and certain self-supply entities. This exemption is subject to certain conditions designed to limit the financial incentive of such entities to suppress market prices. On June 3, 2013, the Company filed a request for rehearing of the FERC order and subsequently protested the manner in which PJM proposed to implement the FERC order. On October 15, 2015, FERC denied the requests for rehearing and accepted PJM’s compliance filing. The Company is now considering appealing FERC’s decision.
New York
Dunkirk Power Reliability Service and Natural Gas Addition
—
Dunkirk Power has been operating one unit (Unit 2) under a reliability services agreement with National Grid, or RSSA, through May 31, 2015. On May 18, 2015, the NYSPSC approved National Grid's request for a seven-month extension of the RSSA with Dunkirk to December 31, 2015. Subsequently, National Grid confirmed that Dunkirk would not be needed for reliability past December 31, 2015.
In addition, On February 13, 2014, Dunkirk Power LLC and National Grid agreed to a term sheet for a 10-year agreement to govern the addition of natural gas-burning capabilities to the Dunkirk facility. This term sheet, known as the DNG Agreement Term Sheet, was approved by the NYSPSC on June 13, 2014. On February 27, 2015, Entergy filed a complaint in the U.S. District Court for the Northern District of New York alleging that the NYSPSC’s approval of the DNG Agreement Term Sheet represents an impermissible interference with FERC’s exclusive jurisdiction over the wholesale markets. On April 20, 2015, Dunkirk Power LLC filed an unopposed motion to become a party to the proceeding. On September 15, 2015, Dunkirk Power LLC filed a brief in support of the NYSPSC's motion to dismiss the matter. The U.S. District Court has stayed further discovery until the case goes through summary judgment procedures. On August 25, 2015, NRG announced that Dunkirk Unit 2 will be mothballed on January 1, 2016. On October 30, 2015, NYISO released the results of its reliability study, indicating that the Dunkirk facility is not needed for bulk system reliability. In connection with the planned mothball of the facility, the pending litigation and the latest reliability assessment completed by NYISO, the Company evaluated the related assets for impairment and recorded an impairment loss of $116 during the three months ended September 30, 2015, as further described in Note 7,
Impairments
.
FERC Investigation of NYISO RMR Practices
— On February 19, 2015, pursuant to Section 206 of the FPA, FERC found NYISO’s tariff to be unjust and unreasonable because it did not contain provisions governing the retention of and compensation to generating units for reliability. FERC ordered NYISO to adopt tariff provisions containing a proposed RMR rate schedule and pro forma RMR agreement within 120 days of the date of FERC’s order. However, FERC clarified that NYISO’s RMR proposal will not require Dunkirk to enter into new pro forma agreements for the 2012 and 2013 RSSAs. On March 23, 2015, the NYSPSC filed a request for rehearing and a group of New York transmission owners filed a request for clarification, which is still pending. On October 19, 2015, NYISO filed its tariff revisions at FERC.
63
Huntley Power Reliability Service
— On August 25, 2015, Huntley Power filed a notice with the NYSPSC of its intent to retire Huntley's operating units on March 1, 2016. On October 14, 2015, Huntley Power filed a cost-of-service filing at FERC in anticipation that its operating units would be needed for reliability purposes, proposing a reliability must run service agreement for a four-year period beginning on March 1, 2016. On October 30, 2015, NYISO released the results of its reliability study, indicating that the Huntley operating units are not needed for bulk system reliability, but could be needed for short-term local system reliability in 2016. The Company continues to discuss the possibility of a short-term reliability agreement with NYISO and National Grid and expects the operating units will be retired in March 2016 or at the end of the short-term reliability requirement. In connection with the discussions of a short-term agreement and the planned retirement of the units, the Company evaluated the related assets for impairment and recorded an impairment loss of $106 million, during the three months ended September 30, 2015, as further described in Note 7,
Impairments
.
Competitive Entry Exemption to Buyer-Side Mitigation Rules
— On December 4, 2014, pursuant to Section 206 of the FPA, a group of New York transmission owners filed a complaint seeking a competitive entry exemption to the current NYISO buyer-side mitigation rules. On December 16, 2014, TDI USA Holdings Corporation filed a complaint under Section 206 of the FPA against the NYISO claiming that the NYISO’s application of the Mitigation Exemption Test under the buyer-side mitigation rules to TDI’s Champlain Hudson 1,000 MW transmission line project is unjust and unreasonable and seeks an exemption from the Mitigation Exemption Test. On February 26, 2015, FERC granted the complaint filed by the New York transmission owners and directed the NYISO to adopt a competitive entry exemption into its tariff within 30 days. In a companion order issued on the same day, FERC rejected the TDI complaint on the grounds that TDI’s concerns were adequately addressed by FERC’s first order. On March 30, 2015, NRG filed a request for rehearing. On August 4, 2015, FERC granted in part and denied in part the rehearing requests and conditionally accepted NYISO's compliance filing subject to revisions clarifying that the competitive entry exemption is not available for generator or unforced capacity deliverability rights projects that are members of the completed class years.
Revisions to the Buyer-Side Mitigation Rules
— On May 8, 2015, several New York entities, including the NYSPSC, filed a complaint against the NYISO under Section 206 of the FPA seeking revisions to the buyer-side market power mitigation measures of the NYISO tariff. The parties requested FERC to find that the current buyer-side mitigation rules are unjust and unreasonable because they prevent the ICAP market from functioning properly and that the rules should apply only to a limited subset of generation facilities. NRG protested the complaint. On October 9, 2015, FERC held that certain renewables and self-supply resources should be exempt from buyer-side mitigation rules. Vast amounts of uneconomic resources could enter the market and harm current and future investments.
Gulf Coast Region
ERCOT
Houston Import Project
— At its April 8, 2014, meeting, the ERCOT Board endorsed a new 345 kV transmission line project designed to address purported reliability challenges related to congestion between north Texas into the Houston region. On November 14, 2014, the PUCT denied a challenge by the Company and Calpine Corp. regarding ERCOT's endorsement of the project. On April 24, 2015, the transmission owners filed for approval to amend their certificates of convenience and necessity with the PUCT to obtain the authorization to move forward with the project. On October 28, 2015, the Administrative Law Judges presiding over the hearing filed a recommendation that the PUCT grant approval to build the project. A final decision by the PUCT is expected by the end of the year.
MISO
Complaints regarding the 2015/2016 Planning Resource Auction
— In May 2015, the Illinois Attorney General, Public Citizen, Inc., and Southwestern Electric Cooperative, Inc. filed complaints against MISO on the grounds that the results of the MISO 2015/2016 Planning Resource Auction resulted in unjust and unreasonable prices, specifically the auction clearing price in Zone 4. NRG, on behalf of itself and GenOn, filed comments providing its view on the rationale for the market outcome. On October 20, 2015, FERC held a technical conference on MISO's Planning Resource Auction, which in part addressed whether 2015/2016 delivery year prices were valid. The matter remains pending at FERC.
Consumer Group Complaint Seeking Reforms
— On June 30, 2015, the Illinois Energy Consumers filed at FERC a complaint under Section 206 of the FPA regarding MISO’s Planning Resource Auction tariff provisions, stating that the current MISO tariff does not produce just and reasonable results. The complaint suggests specific tariff modifications to address these alleged deficiencies, particularly as to the initial reference level price and the failure of the MISO tariff to count capacity sold in neighboring capacity markets toward meeting Local Clearing Requirements in effect for the zones where capacity is physically located. On October 20, 2015, FERC held a technical conference on MISO's Planning Resource Auction, which in part addressed possible changes to MISO's auction design. The matter remains pending at FERC.
64
West Region
CAISO
Carlsbad Energy Center
— On May 21, 2015, the CPUC approved the Carlsbad Energy Center PPTA for a 500 MW five unit natural gas peaking plant. Several parties filed administrative applications for rehearing of the CPUC's decision, which remain pending. Additionally, on July 30, 2015, the CEC approved an amendment to the design of the Carlsbad Energy Center. On September 22, 2015, the CEC granted rehearing of its decision approving the amendment to permit the California Department of Fish and Wildlife, or CDFW, to file comments on the proposed decision. In comments dated October 19, 2015, CDFW recommended that the CEC gather additional information regarding the impact on bird and bat life of thermal plumes emanating from the plant’s stacks. The CEC must now decide how to respond to the comments submitted by CDFW.
Environmental Matters
NRG is subject to a wide range of environmental laws in the development, construction, ownership and operation of projects. These laws generally require governmental authorizations to build and operate power plants. NRG is also subject to laws and regulations surrounding the protection of wildlife, including migratory birds, eagles and threatened and endangered species. Environmental laws have become increasingly stringent and NRG expects this trend to continue. The Company’s environmental matters are described in the Company’s 2014 Form 10-K in Item 1, Business —
Environmental Matters
and Item 1A, Risk Factors. These matters have been updated in
Note 16
,
Environmental Matters
,
to the Condensed Consolidated Financial Statements of this Form 10-Q as found in Item 1 and as follows.
On October 23, 2015, the EPA promulgated the final GHG emissions rules for new and existing fossil-fuel-fired electric generating units. The Company is evaluating the potential impacts of these rules regarding existing units. The Company expects that it will take several years for the impacts of these rules to be fully known and to take effect because of the likely legal challenges and because it may take several years for states to develop and put in place plans that will be required to implement these rules and to achieve state-specific goals.
On October 26, 2015, the EPA promulgated a rule that reduces the ozone NAAQS to 0.070 ppm. This more stringent NAAQS will obligate the states to develop plans to reduce NO
x
(an ozone precursor), which could affect some of the Company's units.
On November 3, 2015, the EPA promulgated a rule revising the Effluent Limitations Guidelines for Steam Electric Generating Facilities, which will result in more stringent requirements for wastewater streams from flue gas desulfurization, fly ash, bottom ash, flue gas mercury control and gasification of fuels such as coal. The Company will be reviewing this rule in concert with the Coal Combustion Byproducts rule to evaluate the impact on operations.
Illinois Union Insurance Company Litigation
— On October 2, 2015, the U.S. District Court for the Middle District of Louisiana issued an order granting LaGen’s motion for summary judgment on its claims for declaratory judgment and breach of contract against ILU for its failure to indemnify LaGen for the costs LaGen paid pursuant to the consent decree that resolved the NSR lawsuit which was brought by the U.S. EPA and LA DEQ against LaGen related to Big Cajun II. The court entered judgment in favor of LaGen for approximately $27 million. In addition, the court ruled that LaGen is entitled to approximately $7 million for future consent decree costs as they are incurred. On October 14, 2015, ILU filed a motion to stay execution of the judgment which was granted on October 19, 2015. Also, on October 14, 2015, ILU filed a notice to appeal the judgment.
Changes in Accounting Standards
See
Note 2
,
Summary of Significant Accounting Policies
, to this Form 10-Q as found in Item 1 for a discussion of recent accounting developments.
65
Consolidated Results of Operations
The following table provides selected financial information for the Company:
|
|
Three months ended September 30,
|
Nine months ended September 30,
|
|||||||||||||||||||
|
(In millions except otherwise noted)
|
2015
|
2014
|
Change %
|
2015
|
2014
|
Change %
|
|||||||||||||||
|
Operating Revenues
|
|||||||||||||||||||||
|
Energy revenue
(a)
|
$
|
1,542
|
|
$
|
1,462
|
|
5
|
%
|
$
|
4,449
|
|
$
|
4,194
|
|
6
|
%
|
|||||
|
Capacity revenue
(a)
|
614
|
|
533
|
|
15
|
|
1,626
|
|
1,597
|
|
2
|
|
|||||||||
|
Retail revenue
|
2,137
|
|
|
2,324
|
|
(8
|
)
|
5,484
|
|
5,728
|
|
(4
|
)
|
||||||||
|
Mark-to-market for economic hedging activities
|
35
|
|
|
153
|
|
(77
|
)
|
(165
|
)
|
(226
|
)
|
27
|
|
||||||||
|
Contract amortization
|
(8
|
)
|
(11
|
)
|
27
|
|
(28
|
)
|
(5
|
)
|
(460
|
)
|
|||||||||
|
Other revenues
(b)
|
111
|
|
108
|
|
3
|
|
288
|
|
388
|
|
(26
|
)
|
|||||||||
|
Total operating revenues
|
4,431
|
|
4,569
|
|
(3
|
)
|
11,654
|
|
11,676
|
|
—
|
|
|||||||||
|
Operating Costs and Expenses
|
|||||||||||||||||||||
|
Cost of sales
(c)
|
2,354
|
|
2,527
|
|
(7
|
)
|
6,281
|
|
6,773
|
|
(7
|
)
|
|||||||||
|
Mark-to-market for economic hedging activities
|
42
|
|
79
|
|
(47
|
)
|
123
|
|
87
|
|
41
|
|
|||||||||
|
Contract and emissions credit amortization
(c)
|
7
|
|
6
|
|
17
|
|
11
|
|
27
|
|
(59
|
)
|
|||||||||
|
Operations and maintenance
|
507
|
|
535
|
|
(5
|
)
|
1,760
|
|
1,645
|
|
7
|
|
|||||||||
|
Other cost of operations
|
124
|
|
131
|
|
(5
|
)
|
355
|
|
311
|
|
14
|
|
|||||||||
|
Total cost of operations
|
3,034
|
|
3,278
|
|
(7
|
)
|
8,530
|
|
8,843
|
|
(4
|
)
|
|||||||||
|
Depreciation and amortization
|
382
|
|
375
|
|
2
|
|
1,173
|
|
1,096
|
|
7
|
|
|||||||||
|
Impairment losses
|
263
|
|
70
|
|
276
|
|
263
|
|
70
|
|
276
|
|
|||||||||
|
Selling and marketing
|
142
|
|
100
|
|
42
|
|
379
|
|
252
|
|
50
|
|
|||||||||
|
General and administrative
|
190
|
|
158
|
|
20
|
|
507
|
|
485
|
|
5
|
|
|||||||||
|
Acquisition-related transaction and integration costs
|
3
|
|
17
|
|
(82
|
)
|
16
|
|
69
|
|
(77
|
)
|
|||||||||
|
Development activity expenses
|
38
|
|
22
|
|
73
|
|
113
|
|
62
|
|
82
|
|
|||||||||
|
Total operating costs and expenses
|
4,052
|
|
4,020
|
|
1
|
|
10,981
|
|
|
10,877
|
|
1
|
|
||||||||
|
Gain on postretirement benefits curtailment and sale of assets
|
—
|
|
—
|
|
—
|
|
14
|
|
19
|
|
(26
|
)
|
|||||||||
|
Operating Income
|
379
|
|
549
|
|
(31
|
)
|
687
|
|
818
|
|
(16
|
)
|
|||||||||
|
Other Income/(Expense)
|
|||||||||||||||||||||
|
Equity in earnings of unconsolidated affiliates
|
24
|
|
18
|
|
(33
|
)
|
29
|
|
39
|
|
(26
|
)
|
|||||||||
|
Other income/(expense), net
|
4
|
|
(3
|
)
|
(233
|
)
|
27
|
|
13
|
|
108
|
|
|||||||||
|
Loss on debt extinguishment
|
(2
|
)
|
(13
|
)
|
(85
|
)
|
(9
|
)
|
(94
|
)
|
(90
|
)
|
|||||||||
|
Interest expense
|
(291
|
)
|
(280
|
)
|
4
|
|
(855
|
)
|
(809
|
)
|
6
|
|
|||||||||
|
Total other expense
|
(265
|
)
|
(278
|
)
|
(5
|
)
|
(808
|
)
|
(851
|
)
|
(5
|
)
|
|||||||||
|
Income/(Loss) before Income Taxes
|
114
|
|
271
|
|
(58
|
)
|
(121
|
)
|
(33
|
)
|
(267
|
)
|
|||||||||
|
Income tax expense/(benefit)
|
47
|
|
89
|
|
(47
|
)
|
(43
|
)
|
(68
|
)
|
37
|
|
|||||||||
|
Net Income/(Loss)
|
67
|
|
182
|
|
(63
|
)
|
(78
|
)
|
35
|
|
(323
|
)
|
|||||||||
|
Less: Net income/(loss) attributable to noncontrolling interest and redeemable noncontrolling interest
|
1
|
|
14
|
|
(93
|
)
|
(10
|
)
|
20
|
|
(150
|
)
|
|||||||||
|
Net Income/(Loss) Attributable to NRG Energy, Inc.
|
$
|
66
|
|
$
|
168
|
|
(61
|
)
|
$
|
(68
|
)
|
$
|
15
|
|
N/M
|
|
|||||
|
Business Metrics
|
|
|
|||||||||||||||||||
|
Average natural gas price — Henry Hub ($/MMBtu)
|
$
|
2.77
|
|
$
|
4.06
|
|
(32
|
)%
|
$
|
2.80
|
|
$
|
4.55
|
|
(38
|
)%
|
|||||
(a) Includes realized gains and losses from financially settled transactions.
(b) Includes unrealized trading gains and losses.
(c) Includes amortization of SO
2
and NO
x
credits and excludes amortization of RGGI credits.
N/M - Not meaningful.
66
Management’s discussion of the results of operations for the three months ended
September 30, 2015
, and
2014
Income before income taxes
— The pre-tax income of $114 million for the three months ended
September 30, 2015
, compared to pre-tax income of $271 million for the three months ended
September 30, 2014
, primarily reflects:
|
•
|
an increase in economic gross margin of $172 million comprised primarily of an increase in NRG Home Retail economic gross margin of $90 million, an increase in NRG Yield economic gross margin of $23 million, an increase in NRG Business economic gross margin of $32 million, an increase in NRG Home Solar economic gross margin of $4 million, and an increase in NRG Renew economic gross margin of $23 million; partially offset by
|
|
•
|
an increase of $193 million in impairment loses;
|
|
•
|
an increase of $90 million in general and administrative expense, selling and marketing expense and development costs, and
|
|
•
|
a decrease in net mark to market results for economic hedges activity of $81 million
|
Net income
— The decrease in net income of $115 million primarily reflects the drivers discussed above, including an income tax expense for the three months ended
September 30, 2015
, of $47 million, compared to an income tax expense of $89 million in the comparable period in 2014.
Wind Resource Availability
The Company's results continue to be impacted by lower than normal wind resource availability. While the Company's wind facilities were available, adverse weather had a negative impact on wind resources. The Company cannot predict wind resource availability or its impact on future results.
Electricity Prices
The following table summarizes average on-peak power prices for each of the major markets in which NRG operates for the three months ended
September 30, 2015
, and
2014
. Average on-peak power prices decreased primarily due to the decrease in natural gas prices for the three months ended September 30, 2015 as compared to the same period in 2014.
|
|
Average on Peak Power Price ($/MWh)
(a)
|
||||||
|
Three months ended September 30,
|
|||||||
|
Region
|
2015
|
2014
|
|||||
|
Gulf Coast
(b)
|
|||||||
|
ERCOT - Houston
|
$
|
34.87
|
|
$
|
38.58
|
|
|
|
ERCOT - North
|
35.22
|
|
37.96
|
|
|||
|
MISO - Louisiana Hub
|
35.03
|
|
39.15
|
|
|||
|
East
|
|||||||
|
NY J/NYC
|
41.32
|
|
41.19
|
|
|||
|
NY A/West NY
|
40.68
|
|
43.02
|
|
|||
|
NEPOOL
|
42.68
|
|
41.28
|
|
|||
|
PEPCO (PJM)
|
42.62
|
|
45.25
|
|
|||
|
PJM West Hub
|
39.35
|
|
41.34
|
|
|||
|
West
|
|||||||
|
CAISO - NP15
|
37.20
|
|
48.47
|
|
|||
|
CAISO - SP15
|
38.20
|
|
49.16
|
|
|||
(a) Average on peak power prices based on real time settlement prices as published by the respective ISOs.
(b) Gulf Coast region also transacts in PJM - West Hub.
67
Economic gross margin
The Company evaluates its operating performance using the measure of economic gross margin, which is not a GAAP measure and may not be comparable to other companies’ presentations or deemed more useful than the GAAP information provided elsewhere in this report. Economic gross margin is defined as the sum of energy revenue, capacity revenue, retail revenue and other revenue, less cost of sales.
Economic gross margin excludes the following elements from gross margin: mark-to-market gains or losses on economic hedging activities, contract amortization and emission credit amortization.
The following tables presents the composition of economic gross margin for the three months ended September 30, 2015 and 2014:
|
Three months ended September 30, 2015
|
|||||||||||||||||||||||||||||||||||||||||||||||
|
NRG Business
|
NRG Home
|
||||||||||||||||||||||||||||||||||||||||||||||
|
(In millions)
|
Gulf Coast
|
East
|
West
|
B2B
|
Elim-inations
|
Subtotal
|
Retail
|
Solar
|
NRG Renew
|
NRG Yield
|
Eliminations/Corporate
|
Total
|
|||||||||||||||||||||||||||||||||||
|
Energy revenue
|
$
|
765
|
|
$
|
791
|
|
$
|
126
|
|
$
|
—
|
|
$
|
—
|
|
$
|
1,682
|
|
$
|
—
|
|
$
|
—
|
|
$
|
161
|
|
$
|
91
|
|
$
|
(392
|
)
|
$
|
1,542
|
|
|||||||||||
|
Capacity revenue
|
88
|
|
364
|
|
73
|
|
3
|
|
—
|
|
528
|
|
—
|
|
—
|
|
—
|
|
89
|
|
(3
|
)
|
614
|
|
|||||||||||||||||||||||
|
Retail revenue
|
—
|
|
—
|
|
—
|
|
437
|
|
—
|
|
437
|
|
1,698
|
|
4
|
|
—
|
|
—
|
|
(2
|
)
|
2,137
|
|
|||||||||||||||||||||||
|
Other revenue
|
18
|
|
16
|
|
2
|
|
47
|
|
(12
|
)
|
71
|
|
—
|
|
—
|
|
8
|
|
45
|
|
(13
|
)
|
111
|
|
|||||||||||||||||||||||
|
Operating revenue
|
871
|
|
1,171
|
|
201
|
|
487
|
|
(12
|
)
|
2,718
|
|
1,698
|
|
4
|
|
169
|
|
225
|
|
(410
|
)
|
4,404
|
|
|||||||||||||||||||||||
|
Cost of sales
|
(436
|
)
|
(546
|
)
|
(90
|
)
|
(407
|
)
|
—
|
|
(1,479
|
)
|
(1,255
|
)
|
(4
|
)
|
3
|
|
(19
|
)
|
400
|
|
(2,354
|
)
|
|||||||||||||||||||||||
|
Economic gross margin
|
$
|
435
|
|
$
|
625
|
|
$
|
111
|
|
$
|
80
|
|
$
|
(12
|
)
|
$
|
1,239
|
|
$
|
443
|
|
$
|
—
|
|
$
|
172
|
|
$
|
206
|
|
$
|
(10
|
)
|
$
|
2,050
|
|
|||||||||||
|
Three months ended September 30, 2014
|
|||||||||||||||||||||||||||||||||||||||||||||||
|
NRG Business
|
NRG Home
|
||||||||||||||||||||||||||||||||||||||||||||||
|
(In millions)
|
Gulf Coast
|
East
|
West
|
B2B
|
Elim-inations
|
Subtotal
|
Retail
|
Solar
|
NRG Renew
|
NRG Yield
|
Eliminations/Corporate
|
Total
|
|||||||||||||||||||||||||||||||||||
|
Energy revenue
|
$
|
788
|
|
$
|
890
|
|
$
|
113
|
|
$
|
—
|
|
$
|
—
|
|
$
|
1,791
|
|
$
|
—
|
|
$
|
—
|
|
$
|
171
|
|
$
|
74
|
|
$
|
(574
|
)
|
$
|
1,462
|
|
|||||||||||
|
Capacity revenue
|
76
|
|
327
|
|
84
|
|
—
|
|
—
|
|
487
|
|
—
|
|
—
|
|
(26
|
)
|
80
|
|
(8
|
)
|
533
|
|
|||||||||||||||||||||||
|
Retail revenue
|
—
|
|
—
|
|
—
|
|
566
|
|
—
|
|
566
|
|
1,783
|
|
6
|
|
—
|
|
—
|
|
(31
|
)
|
2,324
|
|
|||||||||||||||||||||||
|
Other revenue
|
28
|
|
24
|
|
1
|
|
34
|
|
(9
|
)
|
78
|
|
(12
|
)
|
7
|
|
9
|
|
49
|
|
(23
|
)
|
108
|
|
|||||||||||||||||||||||
|
Operating revenue
|
892
|
|
1,241
|
|
198
|
|
600
|
|
(9
|
)
|
2,922
|
|
1,771
|
|
13
|
|
154
|
|
203
|
|
(636
|
)
|
4,427
|
|
|||||||||||||||||||||||
|
Cost of sales
|
(523
|
)
|
(574
|
)
|
(85
|
)
|
(530
|
)
|
—
|
|
(1,712
|
)
|
(1,418
|
)
|
(17
|
)
|
(5
|
)
|
(20
|
)
|
645
|
|
(2,527
|
)
|
|||||||||||||||||||||||
|
Economic gross margin
|
$
|
369
|
|
$
|
667
|
|
$
|
113
|
|
$
|
70
|
|
$
|
(9
|
)
|
$
|
1,210
|
|
$
|
353
|
|
$
|
(4
|
)
|
$
|
149
|
|
$
|
183
|
|
$
|
9
|
|
$
|
1,900
|
|
|||||||||||
68
NRG Business economic gross margin
The following is a discussion of economic gross margin for NRG Business, adjusted to eliminate intersegment activity, primarily with NRG Home.
|
Three months ended September 30, 2015
|
|||||||||||||||||||||||||||
|
(In millions except otherwise noted)
|
Gulf Coast
|
East
|
West
|
B2B
|
Subtotal
|
Eliminations
|
Total
|
||||||||||||||||||||
|
Energy revenue
|
$
|
765
|
|
$
|
791
|
|
$
|
126
|
|
$
|
—
|
|
$
|
1,682
|
|
$
|
—
|
|
$
|
1,682
|
|
||||||
|
Capacity revenue
|
88
|
|
364
|
|
73
|
|
3
|
|
528
|
|
—
|
|
528
|
|
|||||||||||||
|
Retail revenue
|
—
|
|
—
|
|
—
|
|
437
|
|
437
|
|
—
|
|
437
|
|
|||||||||||||
|
Other revenue
|
18
|
|
16
|
|
2
|
|
47
|
|
83
|
|
(12
|
)
|
71
|
|
|||||||||||||
|
Operating revenue
|
871
|
|
|
1,171
|
|
|
201
|
|
|
487
|
|
|
2,730
|
|
|
(12
|
)
|
|
2,718
|
|
|||||||
|
Cost of sales
|
(436
|
)
|
(546
|
)
|
(90
|
)
|
(407
|
)
|
(1,479
|
)
|
—
|
|
(1,479
|
)
|
|||||||||||||
|
Economic gross margin
|
$
|
435
|
|
$
|
625
|
|
$
|
111
|
|
$
|
80
|
|
$
|
1,251
|
|
|
$
|
(12
|
)
|
|
$
|
1,239
|
|
||||
|
Business Metrics
|
|||||||||||||||||||||||||||
|
MWh sold (in thousands)
(a)
|
17,936
|
|
14,543
|
|
2,779
|
|
|
|
|
|
|
||||||||||||||||
|
MWh generated (in thousands)
|
17,283
|
|
14,118
|
|
1,964
|
|
|||||||||||||||||||||
|
Electricity sales volume — GWh
|
5.289
|
|
|||||||||||||||||||||||||
|
Average customer count (in thousands, metered locations)
|
81
|
|
|||||||||||||||||||||||||
|
(a) MWh sold excludes generation at facilities that generate revenue under capacity agreements.
|
|||||||||||||||||||||||||||
|
|
Three months ended September 30, 2014
|
||||||||||||||||||||||||||
|
(In millions except otherwise noted)
|
Gulf Coast
|
East
|
West
|
B2B
|
Subtotal
|
Eliminations
|
Total
|
||||||||||||||||||||
|
Energy revenue
|
$
|
788
|
|
$
|
890
|
|
$
|
113
|
|
$
|
—
|
|
$
|
1,791
|
|
$
|
—
|
|
$
|
1,791
|
|
||||||
|
Capacity revenue
|
76
|
|
327
|
|
84
|
|
—
|
|
487
|
|
—
|
|
487
|
|
|||||||||||||
|
Retail revenue
|
—
|
|
—
|
|
—
|
|
566
|
|
566
|
|
—
|
|
566
|
|
|||||||||||||
|
Other revenue
|
28
|
|
24
|
|
1
|
|
34
|
|
87
|
|
(9
|
)
|
78
|
|
|||||||||||||
|
Operating revenue
|
892
|
|
|
1,241
|
|
|
198
|
|
|
600
|
|
|
2,931
|
|
|
(9
|
)
|
|
2,922
|
|
|||||||
|
Cost of sales
|
(523
|
)
|
(574
|
)
|
(85
|
)
|
(530
|
)
|
(1,712
|
)
|
—
|
|
(1,712
|
)
|
|||||||||||||
|
Economic gross margin
|
$
|
369
|
|
|
$
|
667
|
|
|
$
|
113
|
|
|
$
|
70
|
|
|
$
|
1,219
|
|
|
$
|
(9
|
)
|
|
$
|
1,210
|
|
|
Business Metrics
|
|
||||||||||||||||||||||||||
|
MWh sold (in thousands)
(a)
|
17,932
|
|
12,154
|
|
1,872
|
|
|
|
|
||||||||||||||||||
|
MWh generated (in thousands)
|
16,857
|
|
14,123
|
|
1,514
|
|
|
|
|||||||||||||||||||
|
Electricity sales volume — GWh
|
5,724
|
|
|||||||||||||||||||||||||
|
Average customer count (in thousands, metered locations)
|
84
|
|
|||||||||||||||||||||||||
|
(a) MWh sold excludes generation at facilities that generate revenue under capacity agreements.
|
|||||||||||||||||||||||||||
|
|
Three months ended September 30,
|
||||||||||||||||||||||||||
|
Weather Metrics
|
Gulf Coast
|
East
|
West
|
||||||||||||||||||||||||
|
2015
|
|
|
|
||||||||||||||||||||||||
|
CDDs
(a)
|
3,304
|
|
2,394
|
|
772
|
|
|||||||||||||||||||||
|
HDDs
(a)
|
—
|
|
101
|
|
7
|
|
|||||||||||||||||||||
|
2014
|
|||||||||||||||||||||||||||
|
CDDs
|
3,118
|
|
1,987
|
|
803
|
|
|||||||||||||||||||||
|
HDDs
|
6
|
|
239
|
|
3
|
|
|||||||||||||||||||||
|
10 year average
|
|||||||||||||||||||||||||||
|
CDDs
|
3,195
|
|
2,192
|
|
611
|
|
|||||||||||||||||||||
|
HDDs
|
8
|
|
260
|
|
25
|
|
|||||||||||||||||||||
|
(a)
|
National Oceanic and Atmospheric Administration-Climate Prediction Center - A Cooling Degree Day, or CDD, represents the number of degrees that the mean temperature for a particular day is above 65 degrees Fahrenheit in each region. A Heating Degree Day, or HDD, represents the number of degrees that the mean temperature for a particular day is below 65 degrees Fahrenheit in each region. The CDDs/HDDs for a period of time are calculated by adding the CDDs/HDDs for each day during the period.
|
69
NRG Business economic gross margin
—
increased by $32 million, including intercompany sales, during the three months ended
September 30, 2015
, compared to the same period in
2014
, due to:
|
(In millions)
|
|||
|
Increase in Gulf Coast region
|
$
|
66
|
|
|
Decrease in East region
|
(42
|
)
|
|
|
Decrease in West region
|
(2
|
)
|
|
|
Increase in B2B
|
10
|
|
|
|
$
|
32
|
|
|
The increase in economic gross margin in the Gulf Coast region was driven by:
|
(In millions)
|
|||
|
Higher gross margin due to an 18% increase in average realized prices driven by the impact of beneficial hedges, primarily in ERCOT
|
$
|
60
|
|
|
Higher gross margin due to an increase in capacity revenue from higher pricing for South Central facilities
|
34
|
|
|
|
Lower capacity revenue due to the expiration of contracts in Texas
|
(22
|
)
|
|
|
Lower gross margin due to lower coal generation, primarily in South Central, which was driven by lower natural gas prices
|
(6
|
)
|
|
|
$
|
66
|
|
|
The decrease in economic gross margin in the East region was driven by:
|
(In millions)
|
|||
|
Lower gross margin due to an 11% decrease in average realized energy prices
|
$
|
(30
|
)
|
|
Lower gross margin due to decreased coal generation as a result of a decrease in natural gas prices
|
(17
|
)
|
|
|
Lower gross margin due to higher purchased capacity to meet capacity supply obligations for deactivated units
|
(16
|
)
|
|
|
Lower gross margin due to certain load contracts rolling off in the second quarter of 2015
|
(9
|
)
|
|
|
Higher gross margin driven primarily by a 26% increase in PJM cleared auction capacity prices
|
23
|
|
|
|
Higher gross margin driven by a 10% increase primarily in New York and New England hedged capacity prices
|
12
|
|
|
|
Other
|
(5
|
)
|
|
|
$
|
(42
|
)
|
|
The decrease in economic gross margin in the West region was driven by:
|
(In millions)
|
|||
|
Higher energy gross margin due to a 55% increase in generation and a 36% decrease in gas prices, partially offset by 24% decrease in energy prices
|
$
|
10
|
|
|
Lower gross margin due to the retirement of Coolwater
|
(10
|
)
|
|
|
Other
|
(2
|
)
|
|
|
$
|
(2
|
)
|
|
The increase in B2B economic gross margin was driven by:
|
(In millions)
|
|||
|
Higher margin due to lower supply costs for the C&I business
|
$
|
5
|
|
|
Higher margin for the demand response business due to increased activity in PJM and Texas
|
3
|
|
|
|
Higher margin for the energy services business due to new contracts and new business
|
2
|
|
|
|
$
|
10
|
|
|
70
NRG Home Retail economic gross margin
The following is a discussion of economic gross margin for NRG Home Retail.
|
Three months ended September 30,
|
|||||||
|
(In millions except otherwise noted)
|
2015
|
2014
|
|||||
|
Home Retail revenue
|
$
|
1,649
|
|
$
|
1,700
|
|
|
|
Supply management revenue
|
49
|
|
71
|
|
|||
|
Operating revenue
(a)
|
$
|
1,698
|
|
$
|
1,771
|
|
|
|
Cost of sales
(b)
|
(1,255
|
)
|
(1,418
|
)
|
|||
|
Economic Gross Margin
|
$
|
443
|
|
$
|
353
|
|
|
|
Business Metrics
|
|
|
|||||
|
Electricity sales volume — GWh - Gulf Coast
|
11,585
|
|
11,056
|
|
|||
|
Electricity sales volume — GWh - All other regions
|
2,099
|
|
2,573
|
|
|||
|
Average NRG Home Retail customer count (in thousands)
(c)
|
2,775
|
|
2,884
|
|
|||
|
Ending NRG Home Retail customer count (in thousands)
(c)
|
2,771
|
|
2,885
|
|
|||
|
(a)
|
Includes intercompany sales of $2 million and $2 million in 2015 and 2014, respectively, representing sales from Retail to the Gulf Coast region.
|
|
(b)
|
Includes intercompany purchases of $348 million and $583 million in 2015 and 2014.
|
|
(c)
|
Excludes Discrete Customers.
|
NRG Home Retail economic gross margin increased $90 million for the three months ended
September 30, 2015
, compared to the same period in
2014
, due to:
|
(In millions)
|
|||
|
Increase in margins due to lower supply costs driven by a decrease in natural gas prices along with increased sales to Discrete Customers and Recurring Customers
|
$
|
44
|
|
|
Increased margins from the acquisition of Dominion's competitive retail electric business in March 2014 driven by higher renew rates and lower supply costs partially offset by lower customer counts due to expected attrition
|
23
|
|
|
|
Favorable impact from increased customer usage due to customer mix and weather
|
22
|
|
|
|
Other
|
1
|
|
|
|
$
|
90
|
|
|
NRG Renew economic gross margin
The following is a discussion of economic gross margin for NRG Renew.
|
Three months ended September 30,
|
|||||||
|
2015
|
2014
|
||||||
|
(In millions except otherwise noted)
|
|||||||
|
Operating revenue
|
$
|
169
|
|
$
|
154
|
|
|
|
Cost of sales
|
3
|
|
(5
|
)
|
|||
|
Economic gross margin
|
$
|
172
|
|
$
|
149
|
|
|
|
Business Metrics
|
|||||||
|
MWh sold (in thousands)
|
1,572
|
|
1,477
|
|
|||
|
MWh generated (in thousands)
|
1,572
|
|
1,477
|
|
|||
NRG Renew economic gross margin increased $23 million for the three months ended
September 30, 2015
, compared to the same period in
2014
, primarily as a result of improved performance at the Ivanpah project, as it continues towards full production capabilities, as well as additional distributed solar projects in service, in 2015.
71
NRG Yield economic gross margin
The following is a discussion of economic gross margin for NRG Yield.
|
Three months ended September 30,
|
|||||||
|
2015
|
2014
|
||||||
|
(In millions except otherwise noted)
|
|||||||
|
Operating revenue
|
$
|
225
|
|
$
|
203
|
|
|
|
Cost of sales
|
(19
|
)
|
(20
|
)
|
|||
|
Economic gross margin
|
$
|
206
|
|
$
|
183
|
|
|
|
Business Metrics
|
|||||||
|
MWh sold (in thousands)
|
1,046
|
|
745
|
|
|||
|
MWht sold (in thousands)
|
468
|
|
467
|
|
|||
NRG Yield economic gross margin increased $23 million for the three months ended
September 30, 2015
, compared the same period in
2014
, primarily related to the acquisition of the Alta Wind Assets in August 2014.
Mark-to-market for Economic Hedging Activities
Mark-to-market for economic hedging activities includes asset-backed hedges that have not been designated as cash flow hedges and ineffectiveness on cash flow hedges. Total net mark-to-market results decreased by $81 million during the three months ended
September 30, 2015
, compared to the same period in
2014
.
The breakdown of gains and losses included in operating revenues and operating costs and expenses by region was as follows:
|
Three months ended September 30, 2015
|
|||||||||||||||||||||||||||||||||||
|
NRG Business
|
|||||||||||||||||||||||||||||||||||
|
NRG Home
|
Gulf Coast
|
East
|
West
|
B2B
|
NRG Renew
|
NRG Yield
|
Elimination
(a)
|
Total
|
|||||||||||||||||||||||||||
|
|
(In millions)
|
||||||||||||||||||||||||||||||||||
|
Mark-to-market results in operating revenues
|
|
|
|
|
|
|
|||||||||||||||||||||||||||||
|
Reversal of previously recognized unrealized (gains)/losses on settled positions related to economic hedges
|
$
|
—
|
|
$
|
(1
|
)
|
$
|
(24
|
)
|
$
|
3
|
|
$
|
—
|
|
$
|
(1
|
)
|
$
|
—
|
|
$
|
74
|
|
$
|
51
|
|
||||||||
|
Reversal of acquired gain positions related to economic hedges
|
—
|
|
—
|
|
(19
|
)
|
—
|
|
—
|
|
—
|
|
—
|
|
—
|
|
(19
|
)
|
|||||||||||||||||
|
Net unrealized gains/(losses) on open positions related to economic hedges
|
—
|
|
19
|
|
8
|
|
12
|
|
1
|
|
—
|
|
(1
|
)
|
(36
|
)
|
3
|
|
|||||||||||||||||
|
Total mark-to-market gains/(losses) in operating revenues
|
$
|
—
|
|
$
|
18
|
|
|
$
|
(35
|
)
|
$
|
15
|
|
$
|
1
|
|
$
|
(1
|
)
|
|
$
|
(1
|
)
|
$
|
38
|
|
$
|
35
|
|
||||||
|
Mark-to-market results in operating costs and expenses
|
|
|
|
|
|
|
|||||||||||||||||||||||||||||
|
Reversal of previously recognized unrealized (gains)/losses on settled positions related to economic hedges
|
$
|
(15
|
)
|
$
|
9
|
|
$
|
4
|
|
$
|
—
|
|
$
|
(4
|
)
|
$
|
—
|
|
$
|
—
|
|
$
|
(74
|
)
|
$
|
(80
|
)
|
||||||||
|
Reversal of acquired gain positions related to economic hedges
|
(4
|
)
|
—
|
|
—
|
|
(8
|
)
|
(2
|
)
|
—
|
|
—
|
|
—
|
|
(14
|
)
|
|||||||||||||||||
|
Net unrealized gains/(losses) on open positions related to economic hedges
|
43
|
|
4
|
|
—
|
|
1
|
|
(32
|
)
|
—
|
|
—
|
|
36
|
|
52
|
|
|||||||||||||||||
|
Total mark-to-market gains/(losses) in operating costs and expenses
|
$
|
24
|
|
$
|
13
|
|
$
|
4
|
|
$
|
(7
|
)
|
$
|
(38
|
)
|
$
|
—
|
|
$
|
—
|
|
$
|
(38
|
)
|
$
|
(42
|
)
|
||||||||
|
(a)
|
Represents the elimination of the intercompany activity between NRG Home, NRG Business and NRG Yield.
|
72
|
|
Three months ended September 30, 2014
|
||||||||||||||||||||||||||||||||||
|
NRG Business
|
|||||||||||||||||||||||||||||||||||
|
NRG Home
|
Gulf Coast
|
East
|
West
|
B2B
|
NRG Renew
|
NRG Yield
|
Elimination
(a)
|
Total
|
|||||||||||||||||||||||||||
|
|
(In millions)
|
||||||||||||||||||||||||||||||||||
|
Mark-to-market results in operating revenues
|
|
|
|
|
|
|
|||||||||||||||||||||||||||||
|
Reversal of previously recognized unrealized losses/(gains) on settled positions related to economic hedges
|
$
|
—
|
|
$
|
126
|
|
$
|
11
|
|
$
|
(3
|
)
|
$
|
—
|
|
$
|
1
|
|
$
|
—
|
|
$
|
122
|
|
$
|
257
|
|
||||||||
|
Reversal of acquired (gain)/loss positions related to economic hedges
|
—
|
|
—
|
|
(70
|
)
|
2
|
|
—
|
|
—
|
|
—
|
|
—
|
|
(68
|
)
|
|||||||||||||||||
|
Net unrealized gains/(losses) on open positions related to economic hedges
|
—
|
|
9
|
|
93
|
|
(2
|
)
|
1
|
|
(1
|
)
|
—
|
|
(136
|
)
|
(36
|
)
|
|||||||||||||||||
|
Total mark-to-market gains/(losses) in operating revenues
|
$
|
—
|
|
$
|
135
|
|
$
|
34
|
|
|
$
|
(3
|
)
|
$
|
1
|
|
$
|
—
|
|
$
|
—
|
|
$
|
(14
|
)
|
$
|
153
|
|
|||||||
|
Mark-to-market results in operating costs and expenses
|
|
|
|
|
|
|
|||||||||||||||||||||||||||||
|
Reversal of previously recognized unrealized (gains)/losses on settled positions related to economic hedges
|
$
|
(87
|
)
|
$
|
1
|
|
$
|
1
|
|
$
|
—
|
|
$
|
(51
|
)
|
$
|
—
|
|
$
|
—
|
|
$
|
(122
|
)
|
$
|
(258
|
)
|
||||||||
|
Reversal of acquired (gain)/loss positions related to economic hedges
|
(19
|
)
|
—
|
|
3
|
|
—
|
|
(3
|
)
|
—
|
|
—
|
|
—
|
|
(19
|
)
|
|||||||||||||||||
|
Net unrealized gains/(losses) on open positions related to economic hedges
|
89
|
|
2
|
|
(24
|
)
|
—
|
|
(5
|
)
|
—
|
|
—
|
|
136
|
|
198
|
|
|||||||||||||||||
|
Total mark-to-market (losses)/gains in operating costs and expenses
|
$
|
(17
|
)
|
$
|
3
|
|
$
|
(20
|
)
|
|
$
|
—
|
|
$
|
(59
|
)
|
$
|
—
|
|
$
|
—
|
|
$
|
14
|
|
$
|
(79
|
)
|
|||||||
|
(a)
|
Represents the elimination of the intercompany activity between NRG Home, NRG Business, and NRG Renew.
|
Mark-to-market results consist of unrealized gains and losses. The settlement of these transactions is reflected in the same caption as the items being hedged.
The reversals of acquired gain or loss positions were valued based upon the forward prices on the acquisition date.
For the three months ended
September 30, 2015
, the $35 million gain in operating revenues from economic hedge positions was driven primarily by the reversal of previously recognized unrealized losses on contracts that settled during the period, partially offset by the reversal of acquired contracts. The $42 million loss in operating costs and expenses from economic hedge positions was driven primarily by the reversal of previously recognized unrealized gains on contracts that settled during the period and the reversal of acquired contracts, partially offset by an increase in value of open positions as a result of increases in ERCOT heat rate.
For the three months ended
September 30, 2014
, the $153 million gain in operating revenues from economic hedge positions was driven primarily by the reversal of previously recognized unrealized losses on contracts that settled during the period, partially offset by the reversal of acquired contracts and a decrease in value of open positions as a result of increases in power prices. The $79 million loss in operating costs and expenses from economic hedge positions was driven primarily by the reversal of previously recognized unrealized gains on contracts that settled during the period and the reversal of acquired contracts, largely offset by an increase in the value of open positions as a result of increases in ERCOT heat rates, partially offset by decreases in coal prices.
In accordance with ASC 815, the following table represents the results of the Company's financial and physical trading of energy commodities for the three months ended
September 30, 2015
, and
2014
. The realized and unrealized financial and physical trading results are included in operating revenue. The Company's trading activities are subject to limits within the Company's Risk Management Policy.
|
|
Three months ended September 30,
|
||||||
|
(In millions)
|
2015
|
2014
|
|||||
|
Trading (losses)/gains
|
|||||||
|
Realized
|
$
|
(1
|
)
|
$
|
33
|
|
|
|
Unrealized
|
(1
|
)
|
6
|
|
|||
|
Total trading (losses)/gains
|
$
|
(2
|
)
|
$
|
39
|
|
|
In addition, trading activities reflect a decrease in gross margin of $17 million, reflected in the Corporate segment, for the
three
months ended
September 30, 2015
, as compared to the
three
months ended
September 30, 2014
.
Operations and maintenance expense
|
NRG Business
|
NRG Home Retail
|
NRG Home Solar
|
NRG Renew
|
NRG Yield
|
Eliminations
|
||||||||||||||||||||||||||||||||||
|
Gulf Coast
|
East
|
West
|
B2B
|
Total
|
|||||||||||||||||||||||||||||||||||
|
(In millions)
|
|||||||||||||||||||||||||||||||||||||||
|
Three months ended September 30, 2015
|
$
|
127
|
|
$
|
225
|
|
$
|
30
|
|
$
|
16
|
|
$
|
52
|
|
$
|
(8
|
)
|
$
|
48
|
|
$
|
33
|
|
$
|
(16
|
)
|
$
|
507
|
|
|||||||||
|
Three months ended September 30, 2014
|
135
|
|
252
|
|
27
|
|
19
|
|
48
|
|
1
|
|
41
|
|
27
|
|
(15
|
)
|
535
|
|
|||||||||||||||||||
Operations and maintenance expense decreased by $28 million for the three months ended
September 30, 2015
, compared to the same period in
2014
, due to the following:
|
(In millions)
|
|||
|
Decrease in variable costs in the East region due to lower generation and the timing of planned and unplanned outages at Morgantown, Bowline, Canal, and Waukegan
|
$
|
(20
|
)
|
|
Decrease due to the retirement of Will County unit 3 in 2015 and the sale of American Bituminous Power Partners, LP in 2014
|
(9
|
)
|
|
|
Increase in maintenance expense for NRG Renew and NRG Yield due primarily to the acquisition of the Alta Wind Assets and increased expense at Ivanpah
|
13
|
|
|
|
Decrease in expense for the Gulf Coast region due to timing of maintenance and fixed asset disposals
|
(10
|
)
|
|
|
Other
|
(2
|
)
|
|
|
$
|
(28
|
)
|
|
Depreciation and Amortization
Depreciation and amortization increased by $7 million for the three months ended
September 30, 2015
, compared to the same period in
2014
, primarily due to additional depreciation expense from the acquisition of the Alta Wind Assets as well as various other assets placed in service.
Impairment Losses
For the three months ended September 30, 2015, the Company recorded impairment losses primarily related to the write-down of the Huntley and Dunkirk facilities of $222 million and the impairment of Goal Zero goodwill of $36 million, as described in
Note 7
,
Impairments
.
For the three months ended September 30, 2014, the Company recorded impairment losses of $60 million related to the Osceola facility and $10 million related to certain solar panels, as described in
Note 7
,
Impairments
.
Selling, Marketing, General and Administrative Expenses
Selling, marketing, general and administrative expenses are comprised of the following:
|
Three months ended September 30,
|
|||||||
|
(In millions)
|
2015
|
2014
|
|||||
|
Selling and marketing expenses
|
$
|
142
|
|
$
|
100
|
|
|
|
General and administrative expenses
|
190
|
|
158
|
|
|||
|
$
|
332
|
|
|
$
|
258
|
|
|
Selling and marketing expense increased by $42 million for the three months ended September 30, 2015, compared to the same period in 2014, due primarily to an increase in expense related to retail acquisitions as well as channel and product expansions in the core retail business, which also contributed to margin expansion during the same time period.
General and administrative expenses increased by $32 million for the three months ended
September 30, 2015
, compared to the same period in
2014
, due primarily to the impact of additional headcount from acquisitions.
Development Activity Expenses
Development activity expenses increased by $16 million for the three months ended
September 30, 2015
, compared to the same period in
2014
, due to an increase in development activities, primarily for Utility Scale Solar, Distributed Solar and NRG EVgo activities.
73
Equity in Earnings of Unconsolidated Affiliates
NRG's equity in earnings of unconsolidated affiliates increased by $6 million for the three months ended
September 30, 2015
, as compared to the same period in
2014
, due primarily to NRG Yield, Inc.'s acquisition of Desert Sunlight in June 2015.
Interest Expense
NRG's interest expense increased by $11 million for the three months ended
September 30, 2015
, compared to the same period in
2014
due to the following:
|
|
(In millions)
|
||
|
Increase in derivative interest expense due to changes in the fair value of interest rate swaps
|
$
|
10
|
|
|
Increase due to the acquisition of Alta Wind in August 2014
|
5
|
|
|
|
Other
|
(4
|
)
|
|
|
$
|
11
|
|
|
Income Tax Expense
For the three months ended
September 30, 2015
, NRG recorded an income tax expense of $47 million on pre-tax income of $114 million. For the same period in
2014
, NRG recorded an income tax expense of $89 million on pre-tax income of $271 million. The effective tax rate was 41.2% and 32.8% for the three months ended
September 30, 2015
, and
2014
, respectively.
For the three months ended
September 30, 2015
, NRG's overall effective tax rate was different than the statutory rate of 35% primarily due to non deductible impairment of goodwill, partially offset by production tax credits generated from our wind assets.
For the three months ended
September 30, 2014
, NRG's overall effective tax rate was different than the statutory rate of 35% primarily due to the impact of production tax credits from our wind assets.
Net income attributable to noncontrolling interests and redeemable noncontrolling interests
For the three months ended
September 30, 2015
, and
2014
, net income attributable to noncontrolling interests primarily reflects NRG Yield, Inc.'s share of net income offset by net losses allocated to tax equity investors in tax equity arrangements using the hypothetical liquidation at book value, or HLBV, method.
74
Management’s discussion of the results of operations for the
nine
months ended
September 30, 2015
, and
2014
Loss before income taxes
— The pre-tax loss of $121 million for the
nine
months ended
September 30, 2015
, compared to the pre-tax loss of $33 million for the
nine
months ended
September 30, 2014
, primarily reflects:
|
•
|
an increase of $200 million in general and administrative expense, selling and marketing expense and development costs; and
|
|
•
|
an increase of $193 million in impairment loses; partially offset by
|
|
•
|
an increase in economic gross margin of $481 million comprised of an increase in NRG Business economic gross margin of $36 million, an increase in NRG Home Retail economic gross margin of $233 million, a decrease in NRG Home Solar economic gross margin of $1 million, an increase in NRG Yield economic gross margin of $144 million and an increase in NRG Renew economic gross margin of $69 million
|
Net (loss)/income
— The decrease in net income of $113 million primarily reflects the drivers discussed above, including an income tax benefit for the
nine
months ended
September 30, 2015
, of $43 million, compared to an income tax benefit of $68 million in the comparable period in 2014.
Wind Resource Availability
The Company's results continue to be impacted by lower than normal wind resource availability. While the Company's wind facilities were available, adverse weather had a negative impact on wind resources. The Company cannot predict wind resource availability and its related impact on future results.
Electricity Prices
The following table summarizes average on-peak power prices for each of the major markets in which NRG operates for the
nine
months ended
September 30, 2015
, and
2014
. Average on-peak power prices decreased primarily due to the decrease in natural gas prices for the nine months ended September 30, 2015 as compared to the same period in 2014.
|
|
Average on Peak Power Price ($/MWh)
(a)
|
||||||
|
Nine months ended September 30,
|
|||||||
|
Region
|
2015
|
2014
|
|||||
|
Gulf Coast
(b)
|
|||||||
|
ERCOT - Houston
|
$
|
29.77
|
|
$
|
47.01
|
|
|
|
ERCOT - North
|
29.85
|
|
46.23
|
|
|||
|
MISO - Louisiana Hub
|
37.14
|
|
52.36
|
|
|||
|
East
|
|||||||
|
NY J/NYC
|
52.51
|
|
81.43
|
|
|||
|
NY A/West NY
|
44.46
|
|
64.43
|
|
|||
|
NEPOOL
|
53.31
|
|
84.26
|
|
|||
|
PEPCO (PJM)
|
49.52
|
|
77.48
|
|
|||
|
PJM West Hub
|
45.33
|
|
68.08
|
|
|||
|
West
|
|||||||
|
CAISO - NP15
|
37.01
|
|
51.41
|
|
|||
|
CAISO - SP15
|
32.86
|
|
50.11
|
|
|||
(a) Average on peak power prices based on real time settlement prices as published by the respective ISOs.
(b) Gulf Coast region also transacts in PJM - West Hub.
Economic gross margin
75
The Company evaluates its operating performance using the measure of economic gross margin, which is not a GAAP measure and may not be comparable to other companies’ presentations or deemed more useful than the GAAP information provided elsewhere in this report. Economic gross margin is defined as the sum of energy revenue, capacity revenue, retail revenue and other revenue, less cost of sales.
Economic gross margin excludes the following elements from gross margin: mark-to-market gains or losses on economic hedging activities, contract amortization and emission credit amortization.
The following tables presents the composition of economic gross margin for the nine months ended September 30, 2015 and 2014:
|
Nine months ended September 30, 2015
|
|||||||||||||||||||||||||||||||||||||||||||||||
|
NRG Business
|
NRG Home
|
||||||||||||||||||||||||||||||||||||||||||||||
|
(In millions)
|
Gulf Coast
|
East
|
West
|
B2B
|
Elim-inations
|
Subtotal
|
Retail
|
Solar
|
NRG Renew
|
NRG Yield
|
Eliminations/Corporate
|
Total
|
|||||||||||||||||||||||||||||||||||
|
Energy revenue
|
$
|
2,015
|
|
$
|
2,468
|
|
$
|
196
|
|
$
|
—
|
|
$
|
—
|
|
$
|
4,679
|
|
$
|
—
|
|
$
|
—
|
|
$
|
401
|
|
$
|
261
|
|
$
|
(892
|
)
|
$
|
4,449
|
|
|||||||||||
|
Capacity revenue
|
209
|
|
1,009
|
|
162
|
|
4
|
|
—
|
|
1,384
|
|
—
|
|
—
|
|
—
|
|
252
|
|
(10
|
)
|
1,626
|
|
|||||||||||||||||||||||
|
Retail revenue
|
—
|
|
—
|
|
—
|
|
1,163
|
|
—
|
|
1,163
|
|
4,308
|
|
19
|
|
—
|
|
—
|
|
(6
|
)
|
5,484
|
|
|||||||||||||||||||||||
|
Other revenue
|
57
|
|
52
|
|
8
|
|
151
|
|
(44
|
)
|
224
|
|
—
|
|
—
|
|
25
|
|
132
|
|
(93
|
)
|
288
|
|
|||||||||||||||||||||||
|
Operating revenue
|
2,281
|
|
3,529
|
|
366
|
|
1,318
|
|
(44
|
)
|
7,450
|
|
4,308
|
|
19
|
|
426
|
|
645
|
|
(1,001
|
)
|
11,847
|
|
|||||||||||||||||||||||
|
Cost of sales
|
(1,152
|
)
|
(1,621
|
)
|
(142
|
)
|
(1,127
|
)
|
—
|
|
(4,042
|
)
|
(3,136
|
)
|
(13
|
)
|
(6
|
)
|
(57
|
)
|
973
|
|
(6,281
|
)
|
|||||||||||||||||||||||
|
Economic gross margin
|
$
|
1,129
|
|
$
|
1,908
|
|
$
|
224
|
|
$
|
191
|
|
$
|
(44
|
)
|
$
|
3,408
|
|
|
$
|
1,172
|
|
$
|
6
|
|
$
|
420
|
|
$
|
588
|
|
$
|
(28
|
)
|
$
|
5,566
|
|
||||||||||
|
Nine months ended September 30, 2014
|
|||||||||||||||||||||||||||||||||||||||||||||||
|
NRG Business
|
NRG Home
|
||||||||||||||||||||||||||||||||||||||||||||||
|
(In millions)
|
Gulf Coast
|
East
|
West
|
B2B
|
Elim-inations
|
Subtotal
|
Retail
|
Solar
|
NRG Renew
|
NRG Yield
|
Eliminations/Corporate
|
Total
|
|||||||||||||||||||||||||||||||||||
|
Energy revenue
|
$
|
2,115
|
|
$
|
2,737
|
|
$
|
228
|
|
$
|
—
|
|
$
|
—
|
|
$
|
5,080
|
|
$
|
—
|
|
$
|
—
|
|
$
|
334
|
|
$
|
142
|
|
$
|
(1,362
|
)
|
$
|
4,194
|
|
|||||||||||
|
Capacity revenue
|
204
|
|
956
|
|
216
|
|
1
|
|
—
|
|
1,377
|
|
—
|
|
—
|
|
1
|
|
236
|
|
(17
|
)
|
1,597
|
|
|||||||||||||||||||||||
|
Retail revenue
|
—
|
|
—
|
|
—
|
|
1,475
|
|
—
|
|
1,475
|
|
4,256
|
|
1
|
|
—
|
|
—
|
|
(4
|
)
|
5,728
|
|
|||||||||||||||||||||||
|
Other revenue
|
74
|
|
91
|
|
5
|
|
133
|
|
(35
|
)
|
268
|
|
1
|
|
7
|
|
25
|
|
139
|
|
(52
|
)
|
388
|
|
|||||||||||||||||||||||
|
Operating revenue
|
2,393
|
|
3,784
|
|
449
|
|
1,609
|
|
(35
|
)
|
8,200
|
|
4,257
|
|
8
|
|
360
|
|
517
|
|
(1,435
|
)
|
11,907
|
|
|||||||||||||||||||||||
|
Cost of sales
|
(1,401
|
)
|
(1,791
|
)
|
(188
|
)
|
(1,439
|
)
|
—
|
|
(4,819
|
)
|
(3,318
|
)
|
(1
|
)
|
(9
|
)
|
(73
|
)
|
1,447
|
|
(6,773
|
)
|
|||||||||||||||||||||||
|
Economic gross margin
|
$
|
992
|
|
$
|
1,993
|
|
$
|
261
|
|
$
|
170
|
|
$
|
(35
|
)
|
$
|
3,381
|
|
$
|
939
|
|
$
|
7
|
|
$
|
351
|
|
$
|
444
|
|
$
|
12
|
|
$
|
5,134
|
|
|||||||||||
76
NRG Business economic gross margin
The following is a discussion of economic gross margin for NRG Business, adjusted to eliminate intersegment activity, primarily with NRG Home.
|
Nine months ended September 30, 2015
|
|||||||||||||||||||||||||||
|
(In millions except otherwise noted)
|
Gulf Coast
|
East
|
West
|
B2B
|
Subtotal
|
Eliminations
|
Total
|
||||||||||||||||||||
|
Energy revenue
|
$
|
2,015
|
|
$
|
2,468
|
|
$
|
196
|
|
$
|
—
|
|
$
|
4,679
|
|
$
|
—
|
|
$
|
4,679
|
|
||||||
|
Capacity revenue
|
209
|
|
1,009
|
|
162
|
|
4
|
|
1,384
|
|
—
|
|
1,384
|
|
|||||||||||||
|
Retail revenue
|
—
|
|
—
|
|
—
|
|
1,163
|
|
1,163
|
|
—
|
|
1,163
|
|
|||||||||||||
|
Other revenue
|
57
|
|
52
|
|
8
|
|
151
|
|
268
|
|
(44
|
)
|
224
|
|
|||||||||||||
|
Operating revenue
|
2,281
|
|
3,529
|
|
366
|
|
1,318
|
|
7,494
|
|
(44
|
)
|
7,450
|
|
|||||||||||||
|
Cost of sales
|
(1,152
|
)
|
(1,621
|
)
|
(142
|
)
|
(1,127
|
)
|
(4,042
|
)
|
—
|
|
(4,042
|
)
|
|||||||||||||
|
Economic Gross Margin
|
$
|
1,129
|
|
$
|
1,908
|
|
$
|
224
|
|
$
|
191
|
|
$
|
3,452
|
|
$
|
(44
|
)
|
$
|
3,408
|
|
||||||
|
Business Metrics
|
|||||||||||||||||||||||||||
|
MWh sold (in thousands)
(a)
|
48,473
|
|
40,027
|
|
4,425
|
|
|||||||||||||||||||||
|
MWh generated (in thousands)
|
46,214
|
|
39,760
|
|
3,194
|
|
|||||||||||||||||||||
|
Electricity sales volume — GWh
|
14.771
|
|
|||||||||||||||||||||||||
|
Average customer count (in thousands, metered locations)
|
82
|
|
|||||||||||||||||||||||||
|
(a) MWh sold excludes generation at facilities that generate revenue under capacity agreements.
|
|||||||||||||||||||||||||||
|
|
Nine months ended September 30, 2014
|
||||||||||||||||||||||||||
|
(In millions except otherwise noted)
|
Gulf Coast
|
East
|
West
|
B2B
|
Subtotal
|
Eliminations
|
Total
|
||||||||||||||||||||
|
Energy revenue
|
$
|
2,115
|
|
$
|
2,737
|
|
$
|
228
|
|
$
|
—
|
|
$
|
5,080
|
|
$
|
—
|
|
$
|
5,080
|
|
||||||
|
Capacity revenue
|
204
|
|
956
|
|
216
|
|
1
|
|
1,377
|
|
—
|
|
1,377
|
|
|||||||||||||
|
Retail revenue
|
—
|
|
—
|
|
—
|
|
1,475
|
|
1,475
|
|
—
|
|
1,475
|
|
|||||||||||||
|
Other revenue
|
74
|
|
91
|
|
5
|
|
133
|
|
303
|
|
(35
|
)
|
268
|
|
|||||||||||||
|
Operating revenue
|
2,393
|
|
3,784
|
|
449
|
|
1,609
|
|
8,235
|
|
(35
|
)
|
8,200
|
|
|||||||||||||
|
Cost of sales
|
(1,401
|
)
|
(1,791
|
)
|
(188
|
)
|
(1,439
|
)
|
(4,819
|
)
|
—
|
|
(4,819
|
)
|
|||||||||||||
|
Economic Gross Margin
|
$
|
992
|
|
$
|
1,993
|
|
$
|
261
|
|
$
|
170
|
|
$
|
3,416
|
|
$
|
(35
|
)
|
$
|
3,381
|
|
||||||
|
Business Metrics
|
|
||||||||||||||||||||||||||
|
MWh sold (in thousands)
(a)
|
48,867
|
|
37,088
|
|
2,859
|
|
|||||||||||||||||||||
|
MWh generated (in thousands)
|
45,669
|
|
38,914
|
|
2,800
|
|
|||||||||||||||||||||
|
Electricity sales volume — GWh
|
16,769
|
|
|||||||||||||||||||||||||
|
Average customer count (in thousands, metered locations)
|
82
|
|
|||||||||||||||||||||||||
|
(a) MWh sold excludes generation at facilities that generate revenue under capacity agreements.
|
|||||||||||||||||||||||||||
|
|
Nine months ended September 30,
|
||||||||||||||||||||||||||
|
Weather Metrics
|
Gulf Coast
|
East
|
West
|
||||||||||||||||||||||||
|
2015
|
|
|
|||||||||||||||||||||||||
|
CDDs
(a)
|
5,170
|
|
3,661
|
|
984
|
|
|||||||||||||||||||||
|
HDDs
(a)
|
2,663
|
|
10,480
|
|
1,135
|
|
|||||||||||||||||||||
|
2014
|
|||||||||||||||||||||||||||
|
CDDs
|
4,982
|
|
3,011
|
|
1,054
|
|
|||||||||||||||||||||
|
HDDs
|
2,819
|
|
10,401
|
|
1,102
|
|
|||||||||||||||||||||
|
10 year average
|
|||||||||||||||||||||||||||
|
CDDs
|
5,309
|
|
3,288
|
|
773
|
|
|||||||||||||||||||||
|
HDDs
|
2,276
|
|
9,300
|
|
1,576
|
|
|||||||||||||||||||||
|
(a)
|
National Oceanic and Atmospheric Administration-Climate Prediction Center - A Cooling Degree Day, or CDD, represents the number of degrees that the mean temperature for a particular day is above 65 degrees Fahrenheit in each region. A Heating Degree Day, or HDD, represents the number of degrees that the mean temperature for a particular day is below 65 degrees Fahrenheit in each region. The CDDs/HDDs for a period of time are calculated by adding the CDDs/HDDs for each day during the period.
|
77
NRG Business economic gross margin
—
increased by $36 million, including intercompany sales, during the
nine
months ended
September 30, 2015
, compared to the same period in
2014
, due to:
|
(In millions)
|
|||
|
Increase in Gulf Coast region
|
$
|
137
|
|
|
Decrease in East region
|
(85
|
)
|
|
|
Decrease in West region
|
(37
|
)
|
|
|
Increase in B2B
|
21
|
|
|
|
$
|
36
|
|
|
The increase in economic gross margin in the Gulf Coast region was driven by:
|
(In millions)
|
|||
|
Higher gross margin due to an increase in capacity revenue from higher pricing for certain South Central facilities as well as a 16% increase in average realized prices
|
$
|
92
|
|
|
Higher gross margin due to higher average realized prices driven by the impact of beneficial hedges in ERCOT
|
83
|
|
|
|
Higher gross margin from an increase in gas generation in Texas, which reflects lower supply costs from lower natural gas prices
|
26
|
|
|
|
Higher gross margin from an increase in nuclear generation driven by reduced planned outages
|
19
|
|
|
|
Lower gross margin due to the expiration of capacity contracts in Texas and South Central
|
(47
|
)
|
|
|
Lower gross margin due to lower coal generation, primarily for South Central facilities, which was driven by lower natural gas prices
|
(46
|
)
|
|
|
Other
|
10
|
|
|
|
$
|
137
|
|
|
The decrease in economic gross margin in the East region was driven by:
|
(In millions)
|
|||
|
Lower gross margin due to a 12% decrease in coal generation as a result of prior year winter weather conditions and plant deactivations
|
$
|
(369
|
)
|
|
Lower gross margin from a 6% decrease in PJM cleared auction capacity volumes primarily from unit deactivations
|
(48
|
)
|
|
|
Lower gross margin due to higher purchased capacity to meet capacity supply obligations for deactivated units
|
(23
|
)
|
|
|
Changes in commercial optimization activities
|
(26
|
)
|
|
|
Lower gross margin due to market adjustments for fuel oil inventory
|
(15
|
)
|
|
|
Higher gross margin due to a decrease in natural gas prices, partially offset by a 12% decrease in average realized energy prices
|
200
|
|
|
|
Higher gross margin due to the EME acquisition in April 2014
|
121
|
|
|
|
Higher gross margin due to new load contracts starting in June 2014 and lower supply cost
|
39
|
|
|
|
Higher gross margin primarily from a 21% increase in New York and New England hedged capacity prices
|
37
|
|
|
|
Other
|
(1
|
)
|
|
|
$
|
(85
|
)
|
|
The decrease in economic gross margin in the West region was driven by:
|
(In millions)
|
|||
|
Lower capacity gross margin due to a 4% decrease in contracted capacity volume and a 15% decrease in price due to higher reserve margins driven by more competition in certain areas and the expiration of certain tolling arrangements, which were replaced with lower priced agreements
|
$
|
(35
|
)
|
|
Lower gross margin due to the retirement of Coolwater
|
(21
|
)
|
|
|
Higher energy gross margin due to a 25% increase in volume driven by more available capacity resulting from the expiration of certain tolling arrangements and a 40% decrease in gas prices, partially offset by a 29% decrease in energy prices
|
10
|
|
|
|
Higher gross margin due to the EME acquisition
|
9
|
|
|
|
$
|
(37
|
)
|
|
78
The increase in B2B economic gross margin was driven by:
|
(In millions)
|
|||
|
Higher gross margin for the C&I business in 2015 due to higher supply costs incurred in early 2014 as a result of prior year winter weather conditions and lower supply costs in 2015 driven by lower natural gas prices
|
$
|
16
|
|
|
Higher margin for the energy services business due to new contracts and new business
|
4
|
|
|
|
Higher margin for the demand response business due to increased activity in PJM and Texas
|
3
|
|
|
|
Lower gross margin from a decrease in customer usage due to customer mix
|
(2
|
)
|
|
|
$
|
21
|
|
|
NRG Home Retail economic gross margin
The following is a discussion of economic gross margin for NRG Home Retail.
|
Nine months ended September 30,
|
|||||||
|
(In millions except otherwise noted)
|
2015
|
2014
|
|||||
|
Home Retail revenue
|
$
|
4,198
|
|
$
|
4,052
|
|
|
|
Supply management revenue
|
110
|
|
205
|
|
|||
|
Operating revenue
(a)
|
$
|
4,308
|
|
$
|
4,257
|
|
|
|
Cost of sales
(b)
|
(3,136
|
)
|
(3,318
|
)
|
|||
|
Economic Gross Margin
|
$
|
1,172
|
|
$
|
939
|
|
|
|
Business Metrics
|
|
|
|||||
|
Electricity sales volume — GWh - Gulf Coast
|
27,534
|
|
26,080
|
|
|||
|
Electricity sales volume — GWh - All other regions
|
6,492
|
|
6,031
|
|
|||
|
Average NRG Home Retail customer count (in thousands)
(c)
|
2,791
|
|
2,670
|
|
|||
|
Ending NRG Home Retail customer count (in thousands)
(c)
|
2,771
|
|
2,885
|
|
|||
|
(a)
|
Includes intercompany sales of $4 million and $5 million in 2015 and 2014, respectively, representing sales from Retail to the Gulf Coast region.
|
|
(b)
|
Includes intercompany purchases of $877 million and $1,479 million in 2015 and 2014.
|
|
(c)
|
Excludes Discrete Customers.
|
NRG Home Retail economic gross margin increased $233 million for the
nine
months ended
September 30, 2015
, compared to the same period in
2014
, due to:
|
(In millions)
|
|||
|
Higher gross margin due to lower supply costs and increased sales to Discrete Customers and Recurring Customers, partially offset by lower rates to customers driven by a decrease in natural gas prices
|
$
|
115
|
|
|
Higher gross margin as a result of having nine months of customers from the March 2014 acquisition of Dominion's competitive retail electric business in 2015 compared to six months in 2014
|
64
|
|
|
|
Higher gross margin due to lower supply costs on the higher sales volumes resulting from weather in 2015
|
54
|
|
|
|
$
|
233
|
|
|
79
NRG Renew economic gross margin
The following is a discussion of economic
gross margin for NRG Renew.
|
Nine months ended September 30,
|
|||||||
|
2015
|
2014
|
||||||
|
(In millions except otherwise noted)
|
|||||||
|
Operating revenue
|
$
|
426
|
|
$
|
360
|
|
|
|
Cost of sales
|
(6
|
)
|
(9
|
)
|
|||
|
Economic Gross margin
|
$
|
420
|
|
$
|
351
|
|
|
|
Business Metrics
|
|||||||
|
MWh sold (in thousands)
|
4,692
|
|
4,015
|
|
|||
|
MWh generated (in thousands)
|
4,745
|
|
4,015
|
|
|||
NRG Renew economic gross margin increased $69 million for the
nine
months ended
September 30, 2015
, compared to the same period in
2014
. The increase in gross margin was the result of the EME acquisition in April 2014 and improved performance at the Ivanpah project, as it continues towards full production capabilities.
NRG Yield economic gross margin
The following is a discussion of economic gross margin for NRG Yield.
|
Nine months ended September 30,
|
|||||||
|
2015
|
2014
|
||||||
|
(In millions except otherwise noted)
|
|||||||
|
Operating revenue
|
$
|
645
|
|
$
|
517
|
|
|
|
Cost of sales
|
(57
|
)
|
(73
|
)
|
|||
|
Economic Gross margin
|
$
|
588
|
|
$
|
444
|
|
|
|
Business Metrics
|
|||||||
|
MWh sold (in thousands)
|
3,077
|
|
1,643
|
|
|||
|
MWht sold (in thousands)
|
1,519
|
|
1,576
|
|
|||
NRG Yield economic gross margin increased $144 million for the
nine
months ended
September 30, 2015
, compared to the same period in
2014
. The increase in gross margin was primarily related to the acquisition of the Alta Wind Assets in August 2014 as well as the acquisition of the Walnut Creek, Tapestry Wind and Laredo Ridge projects from NRG, which were acquired in April 2014.
80
Mark-to-market for Economic Hedging Activities
Mark-to-market for economic hedging activities includes asset-backed hedges that have not been designated as cash flow hedges and ineffectiveness on cash flow hedges. Total net mark-to-market results increased by $25 million during the
nine
months ended
September 30, 2015
, compared to the same period in
2014
.
The breakdown of gains and losses included in operating revenues and operating costs and expenses by region was as follows:
|
Nine months ended September 30, 2015
|
|||||||||||||||||||||||||||||||||||
|
NRG Business
|
|||||||||||||||||||||||||||||||||||
|
NRG Home
|
Gulf Coast
|
East
|
West
|
B2B
|
NRG Renew
|
NRG Yield
|
Elimination
(a)
|
Total
|
|||||||||||||||||||||||||||
|
|
(In millions)
|
||||||||||||||||||||||||||||||||||
|
Mark-to-market results in operating revenues
|
|
|
|
|
|
|
|||||||||||||||||||||||||||||
|
Reversal of previously recognized unrealized (gains)/losses on settled positions related to economic hedges
|
$
|
—
|
|
$
|
(276
|
)
|
$
|
(225
|
)
|
$
|
5
|
|
$
|
(1
|
)
|
$
|
(5
|
)
|
$
|
—
|
|
$
|
(11
|
)
|
$
|
(513
|
)
|
||||||||
|
Reversal of acquired gain positions related to economic hedges
|
—
|
|
—
|
|
(62
|
)
|
—
|
|
—
|
|
—
|
|
—
|
|
—
|
|
(62
|
)
|
|||||||||||||||||
|
Net unrealized gains/(losses) on open positions related to economic hedges
|
—
|
|
307
|
|
113
|
|
5
|
|
5
|
|
2
|
|
2
|
|
(24
|
)
|
410
|
|
|||||||||||||||||
|
Total mark-to-market gains/(losses) in operating revenues
|
$
|
—
|
|
$
|
31
|
|
$
|
(174
|
)
|
$
|
10
|
|
$
|
4
|
|
$
|
(3
|
)
|
$
|
2
|
|
$
|
(35
|
)
|
$
|
(165
|
)
|
||||||||
|
Mark-to-market results in operating costs and expenses
|
|
|
|
|
|
|
|||||||||||||||||||||||||||||
|
Reversal of previously recognized unrealized losses/(gains) on settled positions related to economic hedges
|
$
|
200
|
|
$
|
30
|
|
$
|
14
|
|
$
|
(1
|
)
|
$
|
80
|
|
$
|
—
|
|
$
|
—
|
|
$
|
11
|
|
$
|
334
|
|
||||||||
|
Reversal of acquired gain positions related to economic hedges
|
(4
|
)
|
—
|
|
—
|
|
(15
|
)
|
(2
|
)
|
—
|
|
—
|
|
—
|
|
(21
|
)
|
|||||||||||||||||
|
Net unrealized (losses)/gains on open positions related to economic hedges
|
(162
|
)
|
(41
|
)
|
(93
|
)
|
1
|
|
(165
|
)
|
—
|
|
—
|
|
24
|
|
(436
|
)
|
|||||||||||||||||
|
Total mark-to-market gains/(losses) in operating costs and expenses
|
$
|
34
|
|
$
|
(11
|
)
|
$
|
(79
|
)
|
$
|
(15
|
)
|
$
|
(87
|
)
|
$
|
—
|
|
$
|
—
|
|
$
|
35
|
|
$
|
(123
|
)
|
||||||||
|
(a)
|
Represents the elimination of the intercompany activity between NRG Home, NRG Business and NRG Yield.
|
|
|
Nine months ended September 30, 2014
|
||||||||||||||||||||||||||||||||||
|
NRG Business
|
|||||||||||||||||||||||||||||||||||
|
NRG Home
|
Gulf Coast
|
East
|
West
|
B2B
|
NRG Renew
|
NRG Yield
|
Elimination
(a)
|
Total
|
|||||||||||||||||||||||||||
|
|
(In millions)
|
||||||||||||||||||||||||||||||||||
|
Mark-to-market results in operating revenues
|
|
|
|
|
|
|
|||||||||||||||||||||||||||||
|
Reversal of previously recognized unrealized losses/(gains) on settled positions related to economic hedges
|
$
|
—
|
|
$
|
36
|
|
$
|
27
|
|
$
|
(4
|
)
|
$
|
—
|
|
$
|
1
|
|
$
|
—
|
|
$
|
47
|
|
$
|
107
|
|
||||||||
|
Reversal of acquired (gain)/loss positions related to economic hedges
|
—
|
|
—
|
|
(238
|
)
|
1
|
|
—
|
|
—
|
|
—
|
|
—
|
|
(237
|
)
|
|||||||||||||||||
|
Net unrealized gains/(losses) on open positions related to economic hedges
|
—
|
|
72
|
|
(131
|
)
|
(1
|
)
|
—
|
|
(1
|
)
|
—
|
|
(35
|
)
|
(96
|
)
|
|||||||||||||||||
|
Total mark-to-market gains/(losses) in operating revenues
|
$
|
—
|
|
$
|
108
|
|
$
|
(342
|
)
|
$
|
(4
|
)
|
$
|
—
|
|
$
|
—
|
|
$
|
—
|
|
$
|
12
|
|
$
|
(226
|
)
|
||||||||
|
Mark-to-market results in operating costs and expenses
|
|
|
|
|
|
|
|||||||||||||||||||||||||||||
|
Reversal of previously recognized unrealized (gains)/losses on settled positions related to economic hedges
|
$
|
(51
|
)
|
$
|
2
|
|
$
|
9
|
|
$
|
—
|
|
$
|
(23
|
)
|
$
|
—
|
|
$
|
—
|
|
$
|
(47
|
)
|
$
|
(110
|
)
|
||||||||
|
Reversal of acquired (gain)/loss positions related to economic hedges
|
(19
|
)
|
—
|
|
10
|
|
—
|
|
(3
|
)
|
—
|
|
—
|
|
—
|
|
(12
|
)
|
|||||||||||||||||
|
Net unrealized (losses)/gains on open positions related to economic hedges
|
(18
|
)
|
(1
|
)
|
7
|
|
—
|
|
12
|
|
—
|
|
—
|
|
35
|
|
35
|
|
|||||||||||||||||
|
Total mark-to-market (losses)/gains in operating costs and expenses
|
$
|
(88
|
)
|
$
|
1
|
|
$
|
26
|
|
$
|
—
|
|
$
|
(14
|
)
|
$
|
—
|
|
$
|
—
|
|
$
|
(12
|
)
|
$
|
(87
|
)
|
||||||||
|
(a)
|
Represents the elimination of the intercompany activity between NRG Home, NRG Business, and NRG Renew.
|
81
Mark-to-market results consist of unrealized gains and losses. The settlement of these transactions is reflected in the same caption as the items being hedged.
The reversals of acquired gain or loss positions were valued based upon the forward prices on the acquisition date.
For the
nine
months ended
September 30, 2015
, the $165 million loss in operating revenues from economic hedge positions was driven primarily by the reversal of previously recognized unrealized gains on contracts that settled during the period and the reversal of acquired contracts, largely offset by an increase in value of open positions as a result of decreases in ERCOT and PJM electricity and natural gas prices. The $123 million loss in operating costs and expenses from economic hedge positions was driven primarily by a decrease in value of open positions as a result of decreases in ERCOT electricity and coal prices and the reversal of acquired contracts, largely offset by the reversal of previously recognized unrealized losses on contracts that settled during the period.
For the
nine
months ended
September 30, 2014
, the $226 million loss in operating revenues from economic hedge positions was driven primarily by the reversal of acquired contracts and a decrease in value of open positions as a result of increases in power prices, despite decreases in natural gas prices, partially offset by the reversal of previously recognized unrealized losses on contracts that settled during the period. The $87 million loss in operating costs and expenses from economic hedge positions was driven primarily by the reversal of previously recognized unrealized gains on contracts that settled during the period partially offset by an increase in value of open positions as a result of increases in ERCOT heat rates, partially offset by decreases in coal prices.
In accordance with ASC 815, the following table represents the results of the Company's financial and physical trading of energy commodities for the
nine
months ended
September 30, 2015
, and
2014
. The realized and unrealized financial and physical trading results are included in operating revenue. The Company's trading activities are subject to limits within the Company's Risk Management Policy.
|
|
Nine months ended September 30,
|
||||||
|
(In millions)
|
2015
|
2014
|
|||||
|
Trading gains/(losses)
|
|||||||
|
Realized
|
$
|
49
|
|
$
|
95
|
|
|
|
Unrealized
|
(47
|
)
|
21
|
|
|||
|
Total trading gains
|
$
|
2
|
|
$
|
116
|
|
|
In addition, trading activities reflect a decrease in gross margin of $46 million, reflected in the Corporate segment, for the
nine
months ended
September 30, 2015
, as compared to the
nine
months ended
September 30, 2014
.
82
Operations and maintenance expense
|
NRG Business
|
NRG Home Retail
|
NRG Home Solar
|
NRG Renew
|
NRG Yield
|
Eliminations
|
||||||||||||||||||||||||||||||||||
|
Gulf Coast
|
East
|
West
|
B2B
|
Total
|
|||||||||||||||||||||||||||||||||||
|
(In millions)
|
|||||||||||||||||||||||||||||||||||||||
|
Nine months ended September 30, 2015
|
$
|
478
|
|
$
|
791
|
|
$
|
108
|
|
$
|
62
|
|
$
|
152
|
|
$
|
8
|
|
$
|
120
|
|
$
|
106
|
|
$
|
(65
|
)
|
$
|
1,760
|
|
|||||||||
|
Nine months ended September 30, 2014
|
475
|
|
747
|
|
100
|
|
63
|
|
138
|
|
10
|
|
98
|
|
73
|
|
(59
|
)
|
1,645
|
|
|||||||||||||||||||
Operations and maintenance expense increased by $115 million for the nine months ended
September 30, 2015
, compared to the same period in
2014
, due to the following:
|
(In millions)
|
|||
|
Increase due to the acquisition of EME in April 2014 and the Alta Wind Assets in August 2014
|
$
|
116
|
|
|
Increase in operations and maintenance expense related to planned outages at Cottonwood and Big Cajun
|
22
|
|
|
|
Increase due to acquisitions in NRG Home Retail
|
9
|
|
|
|
Increase in operations and maintenance expense related to Ivanpah reaching commercial operations in early 2014
|
7
|
|
|
|
Increase in operations and maintenance expense related to El Segundo Energy Center's forced outage in 2015
|
6
|
|
|
|
Decrease in variable costs in the East region due to lower generation and the timing of planned and unplanned outages at Morgantown, Bowline, Canal, and Waukegan
|
(20
|
)
|
|
|
Decrease in operations and maintenance expense related to Texas facilities due to timing of outages
|
(18
|
)
|
|
|
Decrease due to the retirement of Will County unit 3 in 2015 and the sale of American Bituminous Power Partners, LP in 2014
|
(9
|
)
|
|
|
Other
|
2
|
|
|
|
$
|
115
|
|
|
Other cost of operations
Other cost of operations, comprised of asset retirement expense, insurance expense and property tax expense, increased by $44 million for the
nine
months ended
September 30, 2015
, compared to the same period in
2014
, primarily due to an increase in property tax expense related to the acquisition of EME in April 2014 and the Alta Wind Assets in August 2014.
Depreciation and Amortization
Depreciation and amortization increased by $77 million for the
nine
months ended
September 30, 2015
, compared to the same period in
2014
, primarily due to an increase of $19 million due to the acquisition of EME, an increase of $40 million due to the acquisition of the Alta Wind Assets and an increase from various other assets placed in service.
Impairment Losses
For the three months ended September 30, 2015, the Company recorded impairment losses primarily related to the write-down of the Huntley and Dunkirk facilities of $222 million and the impairment of Goal Zero goodwill of $36 million, as described in
Note 7
,
Impairments
.
For the nine months ended September 30, 2014, the Company recorded impairment losses of $60 million related to the Osceola facility and $10 million related to certain solar panels, as described in
Note 7
,
Impairments
.
83
Selling, Marketing, General and Administrative Expenses
Selling, marketing, general and administrative expenses is comprised of the following:
|
Nine months ended September 30,
|
|||||||
|
(In millions)
|
2015
|
2014
|
|||||
|
Selling and marketing expenses
|
$
|
379
|
|
$
|
252
|
|
|
|
General and administrative expenses
|
507
|
|
485
|
|
|||
|
$
|
886
|
|
$
|
737
|
|
||
Selling and marketing expense increased by $127 million for the nine months ended September 30, 2015, compared to the same period in 2014, due primarily to an increase in expense related to retail acquisitions as well as channel and product expansions in the core retail business, which also contributed to margin expansion during the same time period.
General and administrative expenses increased by $22 million for the
nine
months ended
September 30, 2015
, compared to the same period in
2014
, due primarily to expansion of the Home Solar business partially offset by continued integration and cost management efforts.
Development Activity Expenses
Development activity expenses increased by $51 million for the
nine
months ended
September 30, 2015
, compared to the same period in
2014
, due to increased development activities, primarily for Utility Scale Solar and Distributed Solar and NRG EVgo.
Equity in Earnings of Unconsolidated Affiliates
NRG's equity in earnings of unconsolidated affiliates decreased by $10 million for the
nine
months ended
September 30, 2015
, as compared to the same period in
2014
, due primarily to lower income at Watson and Midway Sunset and higher losses from the Company's investment in Petra Nova Parish Holdings, partially offset by NRG Yield's acquisition of Desert Sunlight.
Interest Expense
NRG's interest expense increased by $46 million for the
nine
months ended
September 30, 2015
, compared to the same period in
2014
due to the following:
|
(In millions)
|
|||
|
Increase due to the acquisition of EME in April 2014 and Alta Wind in August 2014
|
$
|
57
|
|
|
Increase for the 2022 Senior Notes issued in January 2014 and 2024 Senior Notes issued in April 2014
|
24
|
|
|
|
Increase due to issuance of NRG Yield Operating LLC 2024 Senior Notes issued in 2014
|
17
|
|
|
|
Decrease due to the redemption of 7.625% and 8.5% Senior Notes due 2019
|
(38
|
)
|
|
|
Decrease in derivative interest expense primarily from changes in fair value of interest rate swaps
|
(9
|
)
|
|
|
Other
|
(5
|
)
|
|
|
$
|
46
|
|
|
Income Tax Benefit
For the
nine
months ended
September 30, 2015
, NRG recorded an income tax benefit of $43 million on a pre-tax loss of $121 million. For the same period in
2014
, NRG recorded an income tax benefit of $68 million on a pre-tax loss of $33 million. The effective tax rate was 35.5% and 206.1% for the
nine
months ended
September 30, 2015
, and
2014
, respectively.
For the
nine
months ended
September 30, 2015
, NRG's overall effective tax rate was different than the statutory rate of 35% primarily due to the impact of production tax credits generated from our wind assets, partially offset by tax expense attributable to consolidated partnerships.
For the
nine
months ended
September 30, 2014
, NRG's overall effective tax rate was different than the statutory rate of 35% primarily due to the impact of production tax credits generated from our wind assets and a benefit resulting from the recognition of previously uncertain tax benefits that were settled upon IRS audit during the second quarter of 2014.
84
Net losses/income attributable to noncontrolling interests and redeemable noncontrolling interests
For the
nine
months ended
September 30, 2015
, net losses attributable to noncontrolling interests primarily reflect losses allocated to tax equity investors using the HLBV method, offset in part by NRG Yield, Inc.'s share of net income for the period and for the nine months ended September 30,
2014
, net income attributable to noncontrolling interests primarily reflects NRG Yield, Inc.'s share of net income for the period offset in part by net losses allocated to tax equity investors in tax equity arrangements using the HLBV method.
Liquidity and Capital Resources
Liquidity Position
As of
September 30, 2015
, and
December 31, 2014
, NRG's liquidity, excluding collateral received, was approximately
$4.2 billion
and
$3.9 billion
, respectively, comprised of the following:
|
(In millions)
|
September 30, 2015
|
December 31, 2014
|
|||||
|
Cash and cash equivalents:
|
|||||||
|
NRG excluding NRG Yield and GenOn
|
$
|
1,047
|
|
$
|
790
|
|
|
|
NRG Yield and subsidiaries
|
125
|
|
406
|
|
|||
|
GenOn and subsidiaries
|
1,093
|
|
920
|
|
|||
|
Restricted cash
|
497
|
|
457
|
|
|||
|
Total
|
2,762
|
|
2,573
|
|
|||
|
Total credit facility availability
|
1,449
|
|
1,367
|
|
|||
|
Total liquidity, excluding collateral received
|
$
|
4,211
|
|
$
|
3,940
|
|
|
For the
nine
months ended
September 30, 2015
, total liquidity, excluding collateral received, increased by
$271 million
. Changes in cash and cash equivalents balances are further discussed hereinafter under the heading
Cash
Flow Discussion
. Cash and cash equivalents at
September 30, 2015
, were predominantly held in money market mutual funds and bank deposits.
NRG Yield cash and cash equivalents decreased primarily due to the acquisition of the January 2015 Drop Down Assets from NRG and the acquisition of 25% of Desert Sunlight, offset in part by cash from operating activities and cash from the issuance of NRG Yield's Class C shares. GenOn cash and cash equivalents increased primarily due to operating activities during the nine months ended September 30, 2015.
Management believes that the Company's liquidity position and cash flows from operations will be adequate to finance operating and maintenance capital expenditures, to fund dividends to NRG's common and preferred stockholders, and to fund other liquidity commitments, both in the near and longer term. Management continues to regularly monitor the Company's ability to finance the needs of its operating, financing and investing activity within the dictates of prudent balance sheet management.
Restricted Payments Tests
Of the
$2.3 billion
of cash and cash equivalents of the Company as of
September 30, 2015
,
$291 million
and
$226 million
were held by GenOn Mid-Atlantic and REMA, respectively. The ability of certain of GenOn’s and GenOn Americas Generation’s subsidiaries to pay dividends and make distributions is restricted under the terms of certain agreements, including the GenOn Mid-Atlantic and REMA operating leases. Under their respective operating leases, GenOn Mid-Atlantic and REMA are not permitted to make any distributions and other restricted payments unless: (a) they satisfy the fixed charge coverage ratio for the most recently ended period of four fiscal quarters; (b) they are projected to satisfy the fixed charge coverage ratio for each of the two following periods of four fiscal quarters, commencing with the fiscal quarter in which such payment is proposed to be made; and (c) no significant lease default or event of default has occurred and is continuing. In addition, prior to making a dividend or other restricted payment, REMA must be in compliance with the requirement to provide credit support to the owner lessors securing its obligation to pay scheduled rent under its leases. Based on GenOn Mid-Atlantic’s and REMA’s most recent calculations of these tests, GenOn Mid-Atlantic and REMA did not satisfy the restricted payments tests. As a result, as of
September 30, 2015
, GenOn Mid-Atlantic and REMA could not make distributions of cash and certain other restricted payments. Each of GenOn Mid-Atlantic and REMA may recalculate its fixed charge coverage ratios from time to time and, subject to compliance with the restricted payments test described above, make dividends or other restricted payments.
85
The GenOn Senior Notes due 2018 and 2020 and the related indentures also restrict the ability of GenOn to incur additional liens and make certain restricted payments, including dividends. In the event of a default or if restricted payment tests are not satisfied, GenOn would not be able to distribute cash to its parent, NRG. At
September 30, 2015
, GenOn did not meet the consolidated debt ratio component of the restricted payments test.
Credit Ratings
On October 2, 2015, Standard & Poor's lowered its corporate credit ratings on GenOn, GenOn Mid-Atlantic, REMA and GenOn Americas Generation to CCC+ from B-. The ratings outlook for GenOn, GenOn Mid-Atlantic, REMA and GenOn Americas Generation is stable. Standard & Poor's also lowered the issue ratings on the GenOn senior notes, the pass-through certificates at GenOn Mid-Atlantic and the GenOn Americas Generation senior notes to B- from B. The issue rating on the pass-through certificates of REMA was lowered by Standard & Poor's to B from B+.
On September 18, 2015, S&P reaffirmed its corporate credit ratings on NRG Yield, Inc. and the Senior Notes due 2024. The rating outlook is stable. On October 6, 2015, Moody's lowered its corporate credit ratings on NRG Yield, Inc. and the NRG Yield Operating LLC Senior Notes due 2024 to Ba2 from Ba1, respectively. The rating outlook is stable.
On October 21, 2015, S&P reaffirmed its corporate credit ratings on NRG Energy, Inc. and its secured and unsecured debt.
The following table summarizes the Company's credit ratings as of November 4, 2015:
|
|
S&P
|
Moody's
|
|
|
NRG Energy, Inc.
|
BB- Stable
|
Ba3 Stable
|
|
|
7.625% Senior Notes, due 2018
|
BB-
|
B1
|
|
|
8.25% Senior Notes, due 2020
|
BB-
|
B1
|
|
|
7.875% Senior Notes, due 2021
|
BB-
|
B1
|
|
|
6.25% Senior Notes, due 2022
|
BB-
|
B1
|
|
|
6.625% Senior Notes, due 2023
|
BB-
|
B1
|
|
|
6.25% Senior Notes, due 2024
|
BB-
|
B1
|
|
|
Term Loan Facility, due 2018
|
BB+
|
Baa3
|
|
|
GenOn 7.875% Senior Notes, due 2017
|
B-
|
B3
|
|
|
GenOn 9.500% Senior Notes, due 2018
|
B-
|
B3
|
|
|
GenOn 9.875% Senior Notes, due 2020
|
B-
|
B3
|
|
|
GenOn Americas Generation 8.500% Senior Notes, due 2021
|
B-
|
Caa1
|
|
|
GenOn Americas Generation 9.125% Senior Notes, due 2031
|
B-
|
Caa1
|
|
|
NRG Yield, Inc.
|
BB+ Stable
|
Ba2 Stable
|
|
|
5.375% NRG Yield Operating LLC Senior Notes, due 2024
|
BB+
|
Ba2
|
|
Sources of Liquidity
The principal sources of liquidity for NRG's future operating and capital expenditures are expected to be derived from new and existing financing arrangements, existing cash on hand and cash flows from operations. As described in
Note 8
,
Debt and Capital Leases
, to this Form 10-Q and
Note 12
,
Debt and Capital Leases
, to the Company's
2014
Form 10-K, the Company's financing arrangements consist mainly of the Senior Credit Facility, the Senior Notes, the GenOn Senior Notes, the GenOn Americas Generation Senior Notes, and project-related financings.
Cash Proceeds from Sale of Assets to NRG Yield, Inc.
On January 2, 2015, the Company sold the following facilities to NRG Yield, Inc.: (i) Walnut Creek, a 485 MW natural gas facility located in City of Industry, California; (ii) the Tapestry projects, which include Buffalo Bear, a 19 MW wind facility in Buffalo, Oklahoma; Pinnacle, a 55 MW wind facility in Keyser, West Virginia; and Taloga, a 130 MW wind facility in Putnam, Oklahoma; and (iii) Laredo Ridge, an 80 MW wind facility located in Petersburg, Nebraska. NRG Yield, Inc. paid total cash consideration of
$489 million
, including
$9 million
of working capital adjustments, plus assumed project level debt of
$737 million
. The sale was recorded as a transfer of entities under common control and the related assets were transferred at carrying value. NRG Yield, Inc. utilized cash on hand and borrowings under its revolving credit facility of
$210 million
to fund the acquisition.
On November 3, 2015, the Company sold
75%
of the Class B interests of NRG Wind TE Holdco, which owns a portfolio of twelve wind facilities totaling 814 net MW, to NRG Yield, Inc. for total cash consideration of $210 million, subject to working
86
capital adjustments. NRG Yield, Inc. will be responsible for its pro-rata share of non-recourse project debt of $193 million and noncontrolling interest associated with a tax equity structure of $165 million (as of September 30, 2015).
Cash Grants
As of September 30, 2015
, the Company had a net renewable energy grant receivable of
$26 million
, net of sequestration. The receivable balance reflects a reduction as compared to the December 31, 2014 balance of $135 million, net of sequestration, due primarily to a cash grant of approximately
$51 million
, awarded by the U.S. Treasury Department to the Company for the Ivanpah project in June 2015 as well as the establishment of an indemnity receivable in the amount of $75 million relating to the agreement the Company has with SunPower relating to the CVSR project in the first quarter of 2015.
Indemnity Receivable
The Company has a receivable of $75 million pursuant to an indemnity agreement the Company has with SunPower relating to the CVSR project. Pursuant to the purchase and sale agreement for the CVSR project between NRG and SunPower, SunPower agreed to indemnify NRG up to $75 million if the U.S. Treasury Department made certain determinations and awarded a reduced 1603 cash grant for the project. SunPower has refused to honor its contractual indemnification obligation. As a result, on March 19, 2014, NRG filed a lawsuit against SunPower in California state court, alleging breach of contract and also seeking a declaratory judgment that SunPower has breached its indemnification obligation. NRG is seeking $75 million in damages from SunPower. On April 2, 2015, SunPower filed its answer to the lawsuit and also a cross-complaint alleging that NRG owes SunPower $7.5 million as a result of SunPower having paid more than its required share to cover the repayment of the DOE cash grant bridge loans. On or around July 27, 2015, NRG filed its answer to the cross-complaint.
First Lien Structure
NRG has granted first liens to certain counterparties on a substantial portion of the Company's assets, excluding assets acquired through GenOn and EME (including Midwest Generation), assets held by NRG Yield, Inc., and NRG's assets that have project-level financing. NRG uses the first lien structure to reduce the amount of cash collateral and letters of credit that it would otherwise be required to post from time to time to support its obligations under out-of-the-money hedge agreements for forward sales of power or gas used as a proxy for power. To the extent that the underlying hedge positions for a counterparty are out-of-the-money to NRG, the counterparty would have claim under the lien program. The lien program limits the volume that can be hedged, not the value of underlying out-of-the-money positions. The first lien program does not require NRG to post collateral above any threshold amount of exposure. Within the first lien structure, the Company can hedge up to 80% of its coal and nuclear capacity, excluding GenOn and Midwest Generation's coal capacity, and 10% of its other assets, excluding GenOn's and Midwest Generation's other assets and NRG Yield, Inc.'s assets, with these counterparties for the first 60 months and then declining thereafter. Net exposure to a counterparty on all trades must be positively correlated to the price of the relevant commodity for the first lien to be available to that counterparty. The first lien structure is not subject to unwind or termination upon a ratings downgrade of a counterparty and has no stated maturity date.
The Company's lien counterparties may have a claim on its assets to the extent market prices exceed the hedged prices. As of
September 30, 2015
, all hedges under the first liens were
in-the-money
on a counterparty aggregate basis.
The following table summarizes the amount of MWs hedged against the Company's coal and nuclear assets and as a percentage relative to the Company's coal and nuclear capacity under the first lien structure as of
September 30, 2015
:
|
Equivalent Net Sales Secured by First Lien Structure
(a)
|
2015
|
2016
|
2017
|
2018
|
2019
|
|||||||||
|
In MW
|
778
|
|
3,004
|
|
1,066
|
|
118
|
|
—
|
|
||||
|
As a percentage of total net coal and nuclear capacity
(b)
|
13
|
%
|
52
|
%
|
18
|
%
|
2
|
%
|
—
|
%
|
||||
|
(a)
|
Equivalent net sales include natural gas swaps converted using a weighted average heat rate by region.
|
|
(b)
|
Net coal and nuclear capacity represents 80% of the Company’s total coal and nuclear assets eligible under the first lien which excludes coal assets acquired in the GenOn and EME (Midwest Generation) acquisitions, assets in NRG Yield, Inc. and NRG's assets that have project level financing.
|
Uses of Liquidity
The Company's requirements for liquidity and capital resources, other than for operating its facilities, can generally be categorized by the following: (i) commercial operations activities; (ii) debt service obligations; (iii) capital expenditures, including repowering and renewable development, and environmental; and (iv) allocations in connection with the Capital Allocation Program including acquisition opportunities, debt repayments, return of capital and dividend payments to stockholders.
The Company may offer certain assets to NRG Yield, Inc. pursuant to the Right of First Offer Agreement. Should NRG Yield, Inc. purchase the assets offered, the Company intends to allocate cash in an amount approximately equal to the proceeds received from the sale of assets to NRG Yield, Inc. equally among common share repurchases, corporate debt reduction and investment in contracted assets that could be considered for future sale to NRG Yield, Inc.
Commercial Operations
NRG's commercial operations activities require a significant amount of liquidity and capital resources. These liquidity requirements are primarily driven by: (i) margin and collateral posted with counterparties; (ii) margin and collateral required to participate in physical markets and commodity exchanges; (iii) timing of disbursements and receipts (i.e. buying fuel before receiving energy revenues); (iv) initial collateral for large structured transactions; and (v) collateral for project development. As of
September 30, 2015
, commercial operations had total cash collateral outstanding of
$367 million
, and
$758 million
outstanding in letters of credit to third parties primarily to support its commercial activities for both wholesale and retail transactions. As of
September 30, 2015
, total collateral held from counterparties was
$28 million
in cash and
$151 million
in letters of credit.
Future liquidity requirements may change based on the Company's hedging activities and structures, fuel purchases, and future market conditions, including forward prices for energy and fuel and market volatility. In addition, liquidity requirements are dependent on NRG's credit ratings and general perception of its creditworthiness.
87
Capital Expenditures
The following tables and descriptions summarize the Company's capital expenditures for maintenance, environmental, and growth investments for the
nine
months ended
September 30, 2015
, and the currently estimated capital expenditure and growth investments forecast for the remainder of
2015
.
|
Maintenance
|
Environmental
|
Growth Investments
|
Total
|
||||||||||||
|
|
(In millions)
|
||||||||||||||
|
NRG Business
|
|||||||||||||||
|
Gulf Coast
|
$
|
169
|
|
$
|
62
|
|
$
|
10
|
|
$
|
241
|
|
|||
|
East
|
109
|
|
131
|
|
51
|
|
291
|
|
|||||||
|
West
|
5
|
|
—
|
|
16
|
|
21
|
|
|||||||
|
B2B
|
4
|
|
—
|
|
1
|
|
5
|
|
|||||||
|
NRG Home Retail
|
20
|
|
—
|
|
—
|
|
20
|
|
|||||||
|
NRG Home Solar
|
2
|
|
—
|
|
106
|
|
108
|
|
|||||||
|
NRG Renew
|
9
|
|
—
|
|
126
|
|
135
|
|
|||||||
|
NRG Yield
|
7
|
|
—
|
|
9
|
|
16
|
|
|||||||
|
Corporate
|
24
|
|
—
|
|
28
|
|
52
|
|
|||||||
|
Total cash capital expenditures for the nine months ended September 30, 2015
|
349
|
|
193
|
|
347
|
|
889
|
|
|||||||
|
Other investments
(a)
|
—
|
|
—
|
|
449
|
|
449
|
|
|||||||
|
Funding from debt financing and NRG Yield equity issuance, net of fees
|
—
|
|
(36
|
)
|
(330
|
)
|
(366
|
)
|
|||||||
|
Funding from third party equity partners
|
(24
|
)
|
—
|
|
(129
|
)
|
(153
|
)
|
|||||||
|
Total capital expenditures and investments, net of financings
|
325
|
|
157
|
|
337
|
|
819
|
|
|||||||
|
Estimated capital expenditures for the remainder of 2015
|
130
|
|
156
|
|
498
|
|
784
|
|
|||||||
|
Other investments
(a)
|
—
|
|
—
|
|
40
|
|
40
|
|
|||||||
|
Funding from debt financing, net of fees
|
—
|
|
(2
|
)
|
(94
|
)
|
(96
|
)
|
|||||||
|
Funding from third party equity partners and cash grants
|
(1
|
)
|
—
|
|
(243
|
)
|
(244
|
)
|
|||||||
|
NRG estimated capital expenditures for the remainder of 2015, net of financings
|
$
|
129
|
|
$
|
154
|
|
$
|
201
|
|
$
|
484
|
|
|||
|
(a)
|
Other investments include restricted cash activity and $285 million for the acquisition of a 25% interest in the Desert Sunlight Solar Farm.
|
|
•
|
Environmental capital expenditures
— For the
nine
months ended
September 30, 2015
, the Company's environmental capital expenditures included DSI/ESP upgrades at the Powerton and Waukegan facilities and the Joliet gas conversion to satisfy the IL CPS; controls to satisfy MATS and the NSR settlement at the Big Cajun II facility; controls to satisfy MATS at the Avon Lake facility; mercury controls at the W.A. Parish facility; and NO
x
controls for the Sayreville and Gilbert facilities.
|
|
•
|
Growth Investments capital expenditures
— For the
nine
months ended
September 30, 2015
, the Company's growth investment capital expenditures included
$232 million
for solar projects,
$51 million
for fuel conversions,
$26 million
for repowering projects, $9 million for thermal projects and
$29 million
for the Company's other growth projects. The Company's planned growth investment capital expenditures reflect a decrease related to the Avon Lake Unit 9 MATS compliance project.
|
Environmental Capital Expenditures
NRG estimates that environmental capital expenditures from
2015
through
2019
required to comply with environmental laws will be approximately
$629 million
which includes
$98 million
for GenOn and
$430 million
for Midwest Generation. The majority of these costs will be expended by the end of 2016. The increase in environmental capital expenditures for GenOn relates to the Avon Lake Unit 9 MATS compliance project.
In connection with the acquisition of EME, as further described in
Note 3
,
Business Acquisitions and Dispositions
, of this Form 10-Q, NRG committed to fund up to
$350 million
in capital expenditures for plant modifications at Powerton and Joliet to comply with environmental regulations.
2015 Capital Allocation Program
During the second quarter of 2015, the Company established a capital allocation program that will apportion cash in an amount equal to the drop down proceeds received from NRG Yield, Inc. equally among share repurchases, corporate debt reduction and future NRG Yield, Inc. eligible projects.
88
Dividends
The following table lists the dividends paid during the
nine
months ended
September 30, 2015
:
|
Third Quarter 2015
|
Second Quarter 2015
|
First Quarter 2015
|
|||||||||
|
Dividends per Common Share
|
$
|
0.145
|
|
$
|
0.145
|
|
$
|
0.145
|
|
||
On
October 12, 2015
, NRG declared a quarterly dividend on the Company's common stock of
$0.145
per share, payable
November 16, 2015
, to stockholders of record as of November 2, 2015, representing
$0.58
per share on an annualized basis.
The Company's common stock dividends are subject to available capital, market conditions, and compliance with associated laws, regulations and other contractual obligations. The Company expects that, based on current circumstances, comparable cash dividends will continue to be paid in the foreseeable future.
Share Repurchases
The following table shows the Company's activity under the 2015 Capital Allocation Program. The purchases of common stock were made using cash on hand.
|
Board Authorized Share Repurchases
|
Amount
|
Repurchases
|
Total Repurchases through November 4, 2015
|
||||||||||||||||||
|
(in millions, except share and per share data)
|
Authorized
|
Q4 2014
|
Q1 2015
|
Q2 2015
|
Q3 2015
|
Q4 2015
|
|||||||||||||||
|
Initial Phase (authorized Q4 2014)
|
$
|
100
|
|
$
|
44
|
|
$
|
56
|
|
$
|
—
|
|
$
|
—
|
|
$
|
—
|
|
$
|
100
|
|
|
Second Phase (authorized Q1 2015)
|
100
|
|
—
|
|
23
|
|
77
|
|
—
|
|
—
|
|
100
|
|
|||||||
|
Supplemental (authorized Q2 2015)
|
81
|
|
—
|
|
—
|
|
30
|
|
51
|
|
—
|
|
81
|
|
|||||||
|
Reset (authorized Q3 2015)
|
200
|
|
—
|
|
—
|
|
—
|
|
116
|
|
84
|
|
200
|
|
|||||||
|
Total
|
$
|
481
|
|
$
|
44
|
|
$
|
79
|
|
$
|
107
|
|
$
|
167
|
|
$
|
84
|
|
$
|
481
|
|
|
Average price per share
|
$
|
26.95
|
|
$
|
25.15
|
|
$
|
24.53
|
|
$
|
15.06
|
|
$
|
15.03
|
|
$
|
18.64
|
|
|||
|
Shares repurchased
|
1,624,360
|
|
3,146,484
|
|
4,379,907
|
|
11,104,184
|
|
5,558,920
|
|
25,813,855
|
|
|||||||||
|
Quarterly Dividends
|
$
|
47
|
|
$
|
49
|
|
$
|
48
|
|
$
|
48
|
|
$
|
—
|
|
$
|
192
|
|
|||
|
Total Capital Returned to Shareholders
|
$
|
91
|
|
$
|
128
|
|
$
|
155
|
|
$
|
215
|
|
$
|
84
|
|
$
|
673
|
|
|||
89
Fuel Repowerings and Conversions
The table below lists the currently projected repowering and conversion projects at certain NRG Business facilities. With respect to facilities that are currently operating, the timing of the projects listed above could adversely impact our operating revenues, gross margin and other operating costs during the period prior to the targeted commercial operations date.
|
Facility
|
Net Generation Capacity (MW)
|
Project Type
|
Fuel Type
|
Targeted COD
|
|||||
|
Fuel Conversions - Regulatory Compliance
(a)
|
|||||||||
|
Joliet Units 6, 7 and 8
|
1,326
|
|
Natural Gas Conversion
|
Natural Gas
|
Summer 2016
|
||||
|
Total
|
1,326
|
|
|||||||
|
Repowering and Fuel Conversions - Growth Investments
(b)
|
|||||||||
|
Carlsbad Peakers (formerly Encina) Units 1, 2, 3, 4, 5 and GT
(c)
|
500
|
|
Repowering
|
Natural Gas
|
Fall 2017
|
||||
|
Puente (formerly Mandalay) Units 1 and 2
(c)
|
262
|
|
Repowering
|
Natural Gas
|
Summer 2020
|
||||
|
New Castle Units 3, 4 and 5
|
325
|
|
Natural Gas Conversion
|
Natural Gas
|
Summer 2016
|
||||
|
P.H. Robinson Peakers 1-6
|
360
|
|
Repowering
|
Natural Gas
|
Spring 2016
|
||||
|
Shawville Units 1, 2, 3 and 4
|
597
|
|
Natural Gas Conversion
|
Natural Gas
|
Summer 2016
|
||||
|
Total
|
2,044
|
|
|||||||
|
Total Fuel Repowerings and Conversions
|
3,370
|
|
|||||||
(a) The Company plans to incur environmental capital expenditures associated with controls to satisfy MATS. These expenditures are included in the Company's environmental capital expenditures estimate noted above.
(b) Expenditures incurred for these projects are included in the Company's growth investments capital expenditures. Does not include the natural gas conversions of Dunkirk Units 2, 3 and 4, which are on hold pending the outcome of outstanding litigation.
(c) Projects are subject to applicable regulatory approvals and permits.
90
Cash Flow Discussion
The following table reflects the changes in cash flows for the comparative
nine
month periods:
|
Nine months ended September 30,
|
||||||||||
|
2015
|
2014
|
Change
|
||||||||
|
(In millions)
|
||||||||||
|
Net cash provided by operating activities
|
1,392
|
|
$
|
1,114
|
|
$
|
278
|
|
||
|
Net cash used in investing activities
|
(1,232
|
)
|
(2,958
|
)
|
1,726
|
|
||||
|
Net cash (used)/provided by financing activities
|
(26
|
)
|
1,541
|
|
(1,567
|
)
|
||||
Net Cash Provided By Operating Activities
Changes to net cash provided by operating activities were driven by:
|
(In millions)
|
|||
|
Changes in working capital
|
$
|
262
|
|
|
Increase in operating income adjusted for non-cash items
|
96
|
|
|
|
Change in cash collateral in support of risk management activities
|
(80
|
)
|
|
|
$
|
278
|
|
|
Net Cash Used In Investing Activities
Changes to net cash used in investing activities were driven by:
|
(In millions)
|
|||
|
Decrease in cash paid for acquisitions, due primarily to the acquisitions of EME and Dominion in 2014
|
$
|
2,801
|
|
|
Decrease in cash grant receipts, primarily reflecting the 2014 receipt of the CVSR cash grant
|
(369
|
)
|
|
|
Increase in equity investments, primarily related to 25% investment in Desert Sunlight in 2015
|
(270
|
)
|
|
|
Increase in capital expenditures related to maintenance and environmental projects
|
(214
|
)
|
|
|
Decrease in proceeds from sale of assets, due primarily due to the sales of Kendall, Bayou Cove and 50% of the Company's interest in Petra Nova, in 2014
|
(152
|
)
|
|
|
Cash proceeds to fund cash grant bridge loan payment in 2014
|
(57
|
)
|
|
|
Increase in restricted cash
|
(9
|
)
|
|
|
Other
|
(4
|
)
|
|
|
$
|
1,726
|
|
|
Net Cash (Used)/Provided By Financing Activities
Changes to net cash (used)/provided by financing activities were driven by:
|
(In millions)
|
|||
|
Net decrease in borrowing, offset by debt payments, which primarily reflects the issuance of the 2021 and 2024 Senior Notes in 2014
|
(1,423
|
)
|
|
|
Increase in repurchase of treasury stock
|
(353
|
)
|
|
|
Contingent consideration payments
|
(22
|
)
|
|
|
Decrease in proceeds from issuance of common stock
|
(14
|
)
|
|
|
Increase in payments of dividends
|
(12
|
)
|
|
|
Increase in financing element of acquired derivatives
|
202
|
|
|
|
Decrease in cash paid for deferred financing costs
|
43
|
|
|
|
Increase in cash contributions from noncontrolling interest
|
12
|
|
|
|
$
|
(1,567
|
)
|
|
91
NOLs, Deferred Tax Assets and Uncertain Tax Position Implications, under ASC 740
For the
nine
months ended
September 30, 2015
, the Company had a total domestic pre-tax book loss of $131 million and foreign pre-tax book income of $10 million. As of
September 30, 2015
, the Company has cumulative domestic NOL carryforwards of $4.0 billion and cumulative state NOL carryforwards of $3.3 billion for financial statement purposes. In addition, NRG has cumulative foreign NOL carryforwards of $207 million, which do not have an expiration date.
In addition to these amounts, the Company has $74 million of tax effected uncertain tax benefits. As a result of the Company's tax position, and based on current forecasts, NRG anticipates income tax payments, primarily to state and local jurisdictions, of up to $35 million in 2015.
However, as the position remains uncertain for the $74 million of tax effected uncertain tax benefits, the Company has recorded a non-current tax liability of $57 million and may accrue the remaining balance as an increase to non-current liabilities until final resolution with the related taxing authority. The $57 million non-current tax liability for uncertain tax benefits is from positions taken on various state income tax returns, including accrued interest.
NRG is subject to examination by taxing authorities for income tax returns filed in the U.S. federal jurisdiction and various state and foreign jurisdictions including operations located in Australia. The Company is not subject to U.S. federal income tax examinations for years prior to 2011. With few exceptions, state and local income tax examinations are no longer open for years before 2009. The Company's primary foreign operations are also no longer subject to examination by local jurisdictions for years prior to 2010.
As of
September 30, 2015
, NRG has net deferred tax assets of $1.6 billion, which the Company believes is realizable primarily through the generation of future income before income taxes. In order to be able to consider future earnings in the assessment of the realizability of deferred tax assets, general accepted accounting principles indicate the Company should not have cumulative losses in the recent past. Should NRG determine it cannot utilize estimates of future earnings in its assessment, NRG could be required to establish a valuation allowance for up to the full amount of its deferred tax asset.
Off-Balance Sheet Arrangements
Obligations under Certain Guarantee Contracts
NRG and certain of its subsidiaries enter into guarantee arrangements in the normal course of business to facilitate commercial transactions with third parties. These arrangements include financial and performance guarantees, stand-by letters of credit, debt guarantees, surety bonds and indemnifications.
Retained or Contingent Interests
NRG does not have any material retained or contingent interests in assets transferred to an unconsolidated entity.
Derivative Instrument Obligations
The Company's 2.822% Preferred Stock includes a feature which is considered an embedded derivative in accordance with ASC 815. Although it is considered an embedded derivative, it is exempt from derivative accounting as it is excluded from the scope pursuant to ASC 815. As of
September 30, 2015
, based on the Company's stock price, the embedded derivative was out-of-the-money and had no redemption value.
Obligations Arising Out of a Variable Interest in an Unconsolidated Entity
Variable interest in equity investments
— As of
September 30, 2015
, NRG has several investments with an ownership interest percentage of 50% or less in energy and energy-related entities that are accounted for under the equity method of accounting. Several of these investments are variable interest entities for which NRG is not the primary beneficiary. See also
Note 9
,
Variable Interest Entities, or VIEs
,
to this Form 10-Q.
NRG's pro-rata share of non-recourse debt held by unconsolidated affiliates was approximately
$629 million
as of
September 30, 2015
. This indebtedness may restrict the ability of these subsidiaries to issue dividends or distributions to NRG. See also
Note 16
,
Investments Accounted for by the Equity Method and Variable Interest Entities
,
to the Company's
2014
Form 10-K.
92
Contractual Obligations and Commercial Commitments
NRG has a variety of contractual obligations and other commercial commitments that represent prospective cash requirements in addition to the Company's capital expenditure programs, as disclosed in the Company's
2014
Form 10-K. See also
Note 8
,
Debt and Capital Leases
, and
Note 14
,
Commitments and Contingencies
, to this Form 10-Q for a discussion of new commitments and contingencies that also include contractual obligations and commercial commitments that occurred during the
nine
months ended
September 30, 2015
.
Fair Value of Derivative Instruments
NRG may enter into power purchase and sales contracts, fuel purchase contracts and other energy-related financial instruments to mitigate variability in earnings due to fluctuations in spot market prices and to hedge fuel requirements at generation facilities or retail load obligations. In addition, in order to mitigate interest rate risk associated with the issuance of the Company's variable rate and fixed rate debt, NRG enters into interest rate swap agreements. The following disclosures about fair value of derivative instruments provide an update to, and should be read in conjunction with,
Fair Value of Derivative Instruments
in Item 7 —
Management's Discussion and Analysis of Financial Condition and Results of Operations,
of the Company's
2014
Form 10‑K.
The tables below disclose the activities that include both exchange and non-exchange traded contracts accounted for at fair value in accordance with ASC 820,
Fair Value Measurements and Disclosures
, or ASC 820. Specifically, these tables disaggregate realized and unrealized changes in fair value; disaggregate estimated fair values at
September 30, 2015
, based on their level within the fair value hierarchy defined in ASC 820; and indicate the maturities of contracts at
September 30, 2015
.
|
Derivative Activity Gains/(Losses)
|
(In millions)
|
||
|
Fair value of contracts as of December 31, 2014
|
$
|
413
|
|
|
Contracts realized or otherwise settled during the period
|
(253
|
)
|
|
|
Changes in fair value
|
(93
|
)
|
|
|
Fair Value of Contracts as of September 30, 2015
|
$
|
67
|
|
|
Fair Value of Contracts as of September 30, 2015
|
|||||||||||||||||||
|
Maturity
|
|||||||||||||||||||
|
Fair value hierarchy Gains/(Losses)
|
1 Year or Less
|
Greater than 1 Year to 3 Years
|
Greater than 3 Years to 5 Years
|
Greater than 5 Years
|
Total Fair
Value
|
||||||||||||||
|
(In millions)
|
|||||||||||||||||||
|
Level 1
|
$
|
(8
|
)
|
$
|
(64
|
)
|
$
|
(23
|
)
|
$
|
—
|
|
$
|
(95
|
)
|
||||
|
Level 2
|
144
|
|
26
|
|
(24
|
)
|
(17
|
)
|
129
|
|
|||||||||
|
Level 3
|
28
|
|
9
|
|
(1
|
)
|
(3
|
)
|
33
|
|
|||||||||
|
Total
|
$
|
164
|
|
$
|
(29
|
)
|
$
|
(48
|
)
|
$
|
(20
|
)
|
$
|
67
|
|
||||
The Company has elected to present derivative assets and liabilities on a trade-by-trade basis and does not offset amounts at the counterparty master agreement level. Also, collateral received or paid on the Company's derivative assets or liabilities are recorded on a separate line item on the balance sheet. Consequently, the magnitude of the changes in individual current and non-current derivative assets or liabilities is higher than the underlying credit and market risk of the Company's portfolio. As discussed in Item 3
—
Quantitative and Qualitative Disclosures About Market Risk, Commodity Price Risk
, to this Form 10-Q, NRG measures the sensitivity of the Company's portfolio to potential changes in market prices using VaR, a statistical model which attempts to predict risk of loss based on market price and volatility. NRG's risk management policy places a limit on one-day holding period VaR, which limits the Company's net open position. As the Company's trade-by-trade derivative accounting results in a gross-up of the Company's derivative assets and liabilities, the net derivative asset and liability position is a better indicator of NRG's hedging activity. As of
September 30, 2015
, NRG's net derivative asset was
$67 million
, a decrease to total fair value of
$346 million
as compared to
December 31, 2014
. This decrease was driven by the roll-off of trades that settled during the period and losses in fair value.
Based on a sensitivity analysis using simplified assumptions, the impact of a $0.50 per MMBtu increase in natural gas prices across the term of the derivative contracts would result in a decrease of approximately
$482 million
in the net value of derivatives as of
September 30, 2015
. The impact of a $0.50 per MMBtu decrease in natural gas prices across the term of derivative contracts would result in an increase of approximately
$428 million
in the net value of derivatives as of
September 30, 2015
.
93
Critical Accounting Policies and Estimates
NRG's discussion and analysis of the financial condition and results of operations are based upon the consolidated financial statements, which have been prepared in accordance with U.S. GAAP. The preparation of these financial statements and related disclosures in compliance with U.S. GAAP requires the application of appropriate technical accounting rules and guidance as well as the use of estimates and judgments that affect the reported amounts of assets, liabilities, revenues and expenses, and related disclosures of contingent assets and liabilities. The application of these policies necessarily involves judgments regarding future events, including the likelihood of success of particular projects, legal and regulatory challenges, and the fair value of certain assets and liabilities. These judgments, in and of themselves, could materially affect the financial statements and disclosures based on varying assumptions, which may be appropriate to use. In addition, the financial and operating environment may also have a significant effect, not only on the operation of the business, but on the results reported through the application of accounting measures used in preparing the financial statements and related disclosures, even if the nature of the accounting policies has not changed.
On an ongoing basis, NRG evaluates these estimates, utilizing historic experience, consultation with experts and other methods the Company considers reasonable. In any event, actual results may differ substantially from the Company's estimates. Any effects on the Company's business, financial position or results of operations resulting from revisions to these estimates are recorded in the period in which the information that gives rise to the revision becomes known.
The Company identifies its most critical accounting policies as those that are the most pervasive and important to the portrayal of the Company's financial position and results of operations, and that require the most difficult, subjective and/or complex judgments by management regarding estimates about matters that are inherently uncertain. NRG's critical accounting policies include derivative instruments, income taxes and valuation allowance for deferred tax assets, impairment of long lived assets, goodwill and other intangible assets, and contingencies.
The Company performs its annual test of goodwill impairment during the fourth quarter. The Company tests its long-lived assets for impairment whenever indicators of impairment exist. The Company notes that if natural gas prices continue to decrease, this could have a negative impact on the fair value of the reporting units that have goodwill balances. Additionally, continued decreases in natural gas prices could result in an adverse change in the manner that long-lived assets are used, or result in the Company selling an asset before the end of its previously estimated useful life, at a price that is lower than its carrying amount. Accordingly, if these decreases continue, it is possible that the Company's goodwill or long-lived assets will be impaired.
94
NRG is exposed to several market risks in the Company's normal business activities. Market risk is the potential loss that may result from market changes associated with the Company's merchant power generation or with an existing or forecasted financial or commodity transaction. The types of market risks the Company is exposed to are commodity price risk, interest rate risk, liquidity risk, credit risk and currency exchange risk. The following disclosures about market risk provide an update to, and should be read in conjunction with, Item 7A —
Quantitative and Qualitative Disclosures About Market Risk,
of the Company's
2014
Form 10-K.
Commodity Price Risk
Commodity price risks result from exposures to changes in spot prices, forward prices, volatilities and correlations between various commodities, such as natural gas, electricity, coal, oil and emissions credits. NRG manages the commodity price risk of the Company's merchant generation operations and load serving obligations by entering into various derivative or non-derivative instruments to hedge the variability in future cash flows from forecasted sales and purchases of electricity and fuel. NRG measures the risk of the Company's portfolio using several analytical methods, including sensitivity tests, scenario tests, stress tests, position reports and VaR. NRG uses a Monte Carlo simulation based VaR model to estimate the potential loss in the fair value of its energy assets and liabilities, which includes generation assets, load obligations and bilateral physical and financial transactions.
The following table summarizes average, maximum and minimum VaR for NRG's commodity portfolio, including generation assets, load obligations and bilateral physical and financial transactions, calculated using the VaR model for the
nine
months ending
September 30, 2015
, and
2014
:
|
(In millions)
|
2015
|
2014
|
|||||
|
VaR as of September 30,
|
$
|
36
|
|
$
|
85
|
|
|
|
Three months ended September 30,
|
|||||||
|
Average
|
$
|
39
|
|
$
|
86
|
|
|
|
Maximum
|
44
|
|
104
|
|
|||
|
Minimum
|
34
|
|
77
|
|
|||
|
Nine months ended September 30,
|
|||||||
|
Average
|
$
|
42
|
|
$
|
95
|
|
|
|
Maximum
|
54
|
|
142
|
|
|||
|
Minimum
|
34
|
|
73
|
|
|||
In order to provide additional information for comparative purposes to NRG's peers, the Company also uses VaR to estimate the potential loss of derivative financial instruments that are subject to mark-to-market accounting. These derivative instruments include transactions that were entered into for both asset management and trading purposes. The VaR for the derivative financial instruments calculated using the diversified VaR model as of
September 30, 2015
, for the entire term of these instruments entered into for both asset management and trading was $40 million, primarily driven by asset-backed transactions.
Interest Rate Risk
NRG is exposed to fluctuations in interest rates through its issuance of variable rate debt. Exposures to interest rate fluctuations may be mitigated by entering into derivative instruments known as interest rate swaps, caps, collars and put or call options. These contracts reduce exposure to interest rate volatility and result in primarily fixed rate debt obligations when taking into account the combination of the variable rate debt and the interest rate derivative instrument. NRG's risk management policies allow the Company to reduce interest rate exposure from variable rate debt obligations.
The Company's project subsidiaries enter into interest rate swaps, intended to hedge the risks associated with interest rates on non-recourse project level debt. See
Note 12
,
Debt and Capital Leases
,
of the Company's
2014
Form 10-K, as well as
Note 8
,
Debt and Capital Leases
of this Form 10-Q, for more information on the Company's interest rate swaps.
If all of the above swaps had been discontinued on
September 30, 2015
, the Company would have owed the counterparties
$171 million
. Based on the investment grade rating of the counterparties, NRG believes its exposure to credit risk due to nonperformance by counterparties to its hedge contracts to be insignificant.
NRG has both long and short-term debt instruments that subject the Company to the risk of loss associated with movements in market interest rates. As of
September 30, 2015
, a 1% change in variable interest rates would result in a
$23 million
change in interest expense on a rolling twelve month basis.
95
As of
September 30, 2015
, the fair value and related carrying value of the Company's debt was $19.2 billion and $20.0 billion, respectively. NRG estimates that a 1% decrease in market interest rates would have increased the fair value of the Company's long-term debt by
$1.6 billion
.
Liquidity Risk
Liquidity risk arises from the general funding needs of NRG's activities and in the management of the Company's assets and liabilities. The Company is currently exposed to additional collateral posting if natural gas prices decline primarily due to the long natural gas equivalent position at various exchanges used to hedge NRG's retail supply load obligations.
Based on a sensitivity analysis for power and gas positions under marginable contracts, a $0.50 per MMBtu change in natural gas prices across the term of the marginable contracts would cause a change in margin collateral posted of approximately
$311 million
as of
September 30, 2015
, and a 1 MMBtu/MWh change in heat rates for heat rate positions would result in a change in margin collateral posted of approximately
$257 million
as of
September 30, 2015
. This analysis uses simplified assumptions and is calculated based on portfolio composition and margin-related contract provisions as of
September 30, 2015
.
Credit Risk
Credit risk relates to the risk of loss resulting from non-performance or non-payment by counterparties pursuant to the terms of their contractual obligations. NRG is exposed to counterparty credit risk through various activities including wholesale sales, fuel purchases and retail supply arrangements, and retail customer credit risk through its retail load activities. See
Note 4
,
Fair Value of Financial Instruments
, to this Form 10-Q for discussions regarding counterparty credit risk and retail customer credit risk, and
Note 6
,
Accounting for Derivative Instruments and Hedging Activities
, to this Form 10-Q for discussion regarding credit risk contingent features.
Currency Exchange Risk
NRG's foreign earnings and investments may be subject to foreign currency exchange risk, which NRG generally does not hedge. As these earnings and investments are not material to NRG's consolidated results, the Company's foreign currency exposure is limited.
96
Conclusion Regarding the Effectiveness of Disclosure Controls
and
Procedures
Under the supervision and with the participation of NRG's management, including its principal executive officer, principal financial officer and principal accounting officer, NRG conducted an evaluation of the effectiveness of the design and operation of its disclosure controls and procedures, as such term is defined in Rules 13a-15(e) or 15d-15(e) of the Exchange Act. Based on this evaluation, the Company's principal executive officer, principal financial officer and principal accounting officer concluded that the disclosure controls and procedures were effective as of the end of the period covered by this Quarterly Report on Form 10-Q.
Changes in Internal Control over Financial Reporting
There were no changes in NRG’s internal control over financial reporting (as such term is defined in Rule 13a-15(f) under the Exchange Act) that occurred in the third quarter of 2015 that materially affected, or are reasonably likely to materially affect, NRG’s internal control over financial reporting.
97
For a discussion of material legal proceedings in which NRG was involved through
September 30, 2015
, see
Note 14
,
Commitments and Contingencies
, to this Form 10-Q.
Information regarding risk factors appears in Part I, Item 1A,
Risk
Factors Related to NRG Energy, Inc.,
in the Company's
2014
Form 10-K. There have been no material changes in the Company's risk factors since those reported in its
2014
Form 10‑K.
On May 8, 2015, the Company announced that its board of directors authorized the Company to repurchase $81 million of its common stock under the Company's 2015 Capital Allocation Plan resulting in an increase in the total amount authorized for repurchase under the 2015 Capital Allocation Plan to $281 million. On September 21, 2015, the Company announced that its board of directors authorized the Company to repurchase $251 million of its common stock, comprised of $51 million remaining from the amount previously approved for repurchase under the 2015 Capital Allocation Plan and an additional $200 million.
The table below sets forth the information with respect to purchases made by or on behalf of the Company or any "affiliated purchaser" (as defined in Rule 10b-18(a)(3) under the Exchange Act), of the Company's common stock during the quarter ended
September 30, 2015
.
|
For the Three Months Ended September 30, 2015
|
Total Number of Shares Purchased
|
Average Price Paid per Share
(a)
|
Total Number of Shares Purchased as Part of Publicly Announced Plans or Programs
|
Approximate Dollar Value of Shares that May Yet Be Purchased Under the Plans or Programs
(b)
|
||||||||||
|
Month #1
|
||||||||||||||
|
(July 1, 2015 to July 31, 2015)
|
—
|
|
$
|
—
|
|
—
|
|
$
|
—
|
|
||||
|
Month #2
|
||||||||||||||
|
(August 1, 2015 to August 31, 2015)
|
—
|
|
$
|
—
|
|
—
|
|
$
|
—
|
|
||||
|
Month #3
|
||||||||||||||
|
(September 1, 2015 to September 30, 2015)
|
11,104,184
|
|
$
|
15.06
|
|
11,104,184
|
|
$
|
83,122,712
|
|
||||
|
Total
|
11,104,184
|
|
$
|
15.06
|
|
11,104,184
|
|
|
||||||
(a) The average price paid per share excludes commissions of $0.015 per share paid in connection with the share repurchases.
(b) Includes commissions of $0.015 per share paid in connection with the share repurchases.
None.
Not applicable.
None.
98
|
Number
|
Description
|
Method of Filing
|
||
|
4.1
|
One Hundred-Eighteenth Supplemental Indenture, dated as of October 28, 2015, among NRG Energy, Inc., the guarantors named therein and Law Debenture Trust Company of New York.
|
Incorporated herein by reference to Exhibit 4.1 to the Company's Current Report on Form 8-K filed on November 2, 2015.
|
||
|
4.2
|
Eighth Supplemental Indenture, dated as of October 28, 2015, among NRG Energy, Inc., the guarantors named therein and Law Debenture Trust Company of New York.
|
Incorporated herein by reference to Exhibit 4.2 to the Company's Current Report on Form 8-K filed on November 2, 2015.
|
||
|
31.1
|
Rule 13a-14(a)/15d-14(a) certification of David Crane.
|
Filed herewith.
|
||
|
31.2
|
Rule 13a-14(a)/15d-14(a) certification of Kirkland B. Andrews.
|
Filed herewith.
|
||
|
31.3
|
Rule 13a-14(a)/15d-14(a) certification of David Callen.
|
Filed herewith.
|
||
|
32
|
Section 1350 Certification.
|
Filed herewith.
|
||
|
101 INS
|
XBRL Instance Document.
|
Filed herewith.
|
||
|
101 SCH
|
XBRL Taxonomy Extension Schema.
|
Filed herewith.
|
||
|
101 CAL
|
XBRL Taxonomy Extension Calculation Linkbase.
|
Filed herewith.
|
||
|
101 DEF
|
XBRL Taxonomy Extension Definition Linkbase.
|
Filed herewith.
|
||
|
101 LAB
|
XBRL Taxonomy Extension Label Linkbase.
|
Filed herewith.
|
||
|
101 PRE
|
XBRL Taxonomy Extension Presentation Linkbase.
|
Filed herewith.
|
||
99
SIGNATURES
Pursuant to the requirements of the Securities Exchange Act of 1934, the registrant has duly caused this report to be signed on its behalf by the undersigned thereunto duly authorized.
|
|
NRG ENERGY, INC.
(Registrant)
|
|
||
|
|
/s/ DAVID CRANE
|
|
||
|
|
David Crane
|
|
||
|
|
Chief Executive Officer
(Principal Executive Officer)
|
|
||
|
|
||||
|
|
|
|
||
|
|
/s/ KIRKLAND B. ANDREWS
|
|
||
|
|
Kirkland B. Andrews
|
|
||
|
|
Chief Financial Officer
(Principal Financial Officer)
|
|
||
|
|
||||
|
|
|
|
||
|
|
/s/ DAVID CALLEN
|
|
||
|
|
David Callen
|
|
||
|
Date: November 4, 2015
|
Chief Accounting Officer
(Principal Accounting Officer)
|
|
||
|
|
||||
100
TABLE OF CONTENTS
Part I Financial InformationItem 1 Condensed Consolidated Financial Statements and NotesNote 1 Basis Of PresentationNote 2 Summary Of Significant Accounting PoliciesNote 3 Business Acquisitions and DispositionsNote 4 Fair Value Of Financial InstrumentsNote 5 Nuclear Decommissioning Trust FundNote 6 Accounting For Derivative Instruments and Hedging ActivitiesNote 7 ImpairmentsNote 8 Debt and Capital LeasesNote 9 Variable Interest Entities, Or ViesNote 10 Changes in Capital StructureNote 11 Earnings/(loss) Per ShareNote 12 Segment ReportingNote 13 Income TaxesNote 14 Commitments and ContingenciesNote 15 Regulatory MattersNote 16 Environmental MattersNote 17 Condensed Consolidating Financial InformationItem 2 Management S Discussion and Analysis Of Financial Condition and Results Of OperationsItem 3 Quantitative and Qualitative Disclosures About Market RiskItem 4 Controls and ProceduresPart II Other InformationItem 1 Legal ProceedingsItem 1A Risk FactorsItem 2 Unregistered Sales Of Equity Securities and Use Of ProceedsItem 3 Defaults Upon Senior SecuritiesItem 4 Mine Safety DisclosuresItem 5 Other InformationItem 6 Exhibits