NATURAL RESOURCE PARTNERS LP
10-Ks and 10-Qs
UNITED STATES SECURITIES AND EXCHANGE COMMISSION
Washington, D.C. 20549
FORM 10-K
|
ý
|
ANNUAL REPORT PURSUANT TO SECTION 13 OR 15(d) OF THE SECURITIES EXCHANGE ACT OF 1934
|
For the fiscal year ended
December 31, 2017
or
|
¨
|
TRANSITION REPORT PURSUANT TO SECTION 13 OR 15(d) OF THE SECURITIES EXCHANGE ACT OF 1934
|
For the transition period from to
Commission file number: 1-31465

NATURAL RESOURCE PARTNERS L.P.
(Exact name of registrant as specified in its charter)
|
Delaware
|
|
35-2164875
|
|
(State or other jurisdiction of incorporation or organization)
|
|
(I.R.S. Employer Identification Number)
|
|
1201 Louisiana Street, Suite 3400, Houston, Texas 77002
(Address of principal executive offices)
|
||
Registrant's telephone number, including area code
(713) 751-7507
Securities registered pursuant to Section 12(b) of the Act:
|
Title of each class
|
|
Name of each exchange on which registered
|
|
Common Units representing limited partner interests
|
|
New York Stock Exchange
|
Securities registered pursuant to Section 12(g) of the Act:
None
Indicate by check mark if the registrant is a well-known seasoned issuer, as defined in Rule 405 of the Securities Act. Yes
¨
No
ý
Indicate by check mark if the registrant is not required to file reports pursuant to Section 13 or Section 15(d) of the Act. Yes
¨
No
ý
Indicate by check mark whether the registrant: (1) has filed all reports required to be filed by Section 13 or 15(d) of the Securities Exchange Act of 1934 during the preceding 12 months (or for such shorter period that the registrant was required to file such reports), and (2) has been subject to such filing requirements for the past 90 days. Yes
ý
No
¨
Indicate by check mark whether the registrant has submitted electronically and posted on its corporate Web site, if any, every Interactive Data File required to be submitted and posted pursuant to Rule 405 of Regulation S-T (§232.405 of this chapter) during the preceding 12 months (or for such shorter period that the registrant was required to submit and post such files). Yes
ý
No
¨
Indicate by check mark if disclosure of delinquent filers pursuant to Item 405 of Regulation S-K (§229.405 of this chapter) is not contained herein, and will not be contained, to the best of registrant’s knowledge, in definitive proxy or information statements incorporated by reference in Part III of this Form 10-K or any amendment to this Form 10-K.
¨
Indicate by check mark whether the registrant is a large accelerated filer, an accelerated filer, a non-accelerated filer, smaller reporting company, or an emerging growth company. See definition of "accelerated filer", "large accelerated filer", "smaller reporting company," and "emerging growth company" in Rule 12b-2 of the Exchange Act.
|
Large Accelerated Filer
|
¨
|
Accelerated Filer
|
|
ý
|
|
Non-accelerated Filer
|
¨
(Do not check if a smaller reporting company)
|
Smaller Reporting Company
|
|
¨
|
|
Emerging Growth Company
|
|
¨
|
||
If an emerging growth company, indicate by check mark if the registrant has elected not to use the extended transition period for complying with any new or revised financial accounting standards provided pursuant to Section 13(a) of the Exchange Act.
¨
Indicate by check mark whether the registrant is a shell company (as defined in Exchange Act Rule 12b-2) Yes
¨
No
ý
The aggregate market value of the common units held by non-affiliates of the registrant on
June 30, 2017
, was
$218.0 million
based on a closing price on that date of $27.55 per unit as reported on the New York Stock Exchange.
As of
February 23, 2018
, there were 12,241,602 common units outstanding.
Documents incorporated by reference:
None.
TABLE OF CONTENTS
i
CAUTIONARY STATEMENT
REGARDING FORWARD-LOOKING STATEMENTS
Statements included in this 10-K may constitute forward-looking statements. In addition, we and our representatives may from time to time make other oral or written statements which are also forward-looking statements. Such forward-looking statements include, among other things, statements regarding: our business strategy; our liquidity and access to capital and financing sources; our financial strategy; prices of and demand for coal, trona and soda ash, construction aggregates and other natural resources; estimated revenues, expenses and results of operations; the amount, nature and timing of capital expenditures; projected production levels by our lessees and our construction aggregates business; Ciner Wyoming LLC’s ("Ciner Wyoming") trona mining and soda ash refinery operations; the impact of governmental policies, laws and regulations, as well as regulatory and legal proceedings involving us, and of scheduled or potential regulatory or legal changes; and global and U.S. economic conditions.
These forward-looking statements speak only as of the date hereof and are made based upon our current plans, expectations, estimates, assumptions and beliefs concerning future events impacting us and involve a number of risks and uncertainties. We caution that forward-looking statements are not guarantees and that actual results could differ materially from those expressed or implied in the forward-looking statements. You should not put undue reliance on any forward-looking statements. See "Item 1A. Risk Factors" in this Annual Report on Form 10-K for important factors that could cause our actual results of operations or our actual financial condition to differ.
ii
As used in this Part I, unless the context otherwise requires: "we," "our," "us" and the "Partnership" refer to Natural Resource Partners L.P. and, where the context requires, our subsidiaries. References to "NRP" and "Natural Resource Partners" refer to Natural Resource Partners L.P. only, and not to NRP (Operating) LLC or any of Natural Resource Partners L.P.’s subsidiaries. References to "Opco" refer to NRP (Operating) LLC, a wholly owned subsidiary of NRP, and its subsidiaries. NRP Finance Corporation ("NRP Finance") is a wholly owned subsidiary of NRP and a co-issuer with NRP on the 10.50% senior notes due 2022 (the "2022 Notes").
ITEMS 1. AND 2. BUSINESS AND PROPERTIES
Partnership Structure and Management
We are a publicly traded Delaware limited partnership formed in 2002. We own, operate, manage and lease a diversified portfolio of mineral properties in the United States, including interests in coal, trona and soda ash, construction aggregates and other natural resources. Our business is organized into three operating segments:
Coal Royalty and Other
—consists primarily of coal royalty properties and coal-related transportation and processing assets. Other assets include aggregates royalty, industrial mineral royalty, oil and gas royalty and timber. Our coal reserves are primarily located in Appalachia, the Illinois Basin and the Western United States. Our aggregates and industrial minerals properties are located in a number of states across the United States. Our oil and gas royalty assets are primarily located in Louisiana.
Soda Ash
—consists of our 49% non-controlling equity interest in a trona ore mining operation and soda ash refinery in the Green River Basin, Wyoming. We recognize our portion of equity earnings and receive regular quarterly distributions from this business.
Construction Aggregates
—consists of our construction materials business that operates hard rock quarries, an underground limestone mine, sand and gravel plants, asphalt plants and marine terminals. Our construction aggregates business
operates in Pennsylvania, West Virginia, Tennessee, Kentucky and Louisiana.
Our operations are conducted through Opco, and our operating assets are owned by our subsidiaries. NRP (GP) LP, our general partner, has sole responsibility for conducting our business and for managing our operations. Because our general partner is a limited partnership, its general partner, GP Natural Resource Partners LLC, conducts its business and operations, and the Board of Directors and officers of GP Natural Resource Partners LLC make decisions on our behalf. Robertson Coal Management LLC, a limited liability company wholly owned by Corbin J. Robertson, Jr., owns all of the membership interest in GP Natural Resource Partners LLC. Subject to the Board Representation and Observation Rights Agreement with certain entities controlled by funds affiliated with The Blackstone Group, L.P. (collectively referred to as "Blackstone") and affiliates of GoldenTree Asset Management LP (collectively referred to as "GoldenTree"), Mr. Robertson, Jr. is entitled to appoint the members of the Board of Directors of GP Natural Resource Partners LLC. Mr. Robertson, Jr. has delegated the right to appoint one director to Blackstone.
The senior executives and other officers who manage NRP are employees of Western Pocahontas Properties Limited Partnership and Quintana Minerals Corporation, companies controlled by Mr. Robertson, Jr., and they allocate varying percentages of their time to managing our operations. Neither our general partner, GP Natural Resource Partners LLC, nor any of their affiliates receive any management fee or other compensation in connection with the management of our business, but they are entitled to be reimbursed for all direct and indirect expenses incurred on our behalf.
We have regional offices through which we conduct our operations, the largest of which is located at 5260 Irwin Road, Huntington, West Virginia 25705 and the telephone number is (304) 522-5757. Our principal executive office is located at 1201 Louisiana Street, Suite 3400, Houston, Texas 77002 and our telephone number is (713) 751-7507.
1
During the first quarter of 2017, we completed recapitalization transactions that improved our liquidity and strengthened our balance sheet. These recapitalization transactions included the issuance of $250 million of Class A Preferred Units and Warrants to purchase Common Units, and the extension of the majority of our 2018 debt maturities to 2020 and 2022. For more information on these transactions, see
Note 3. Class A Convertible Preferred Units and Warrants
and
Note 13. Debt
in the Notes to Consolidated Financial Statements under Item 8 in this Annual Report on Form 10-K, which is incorporated herein by reference.
During 2017, we reduced our debt by
$311.1 million
. See "Liquidity and Capital Resources" below for additional information on our debt reduction. We remain focused on further reducing our debt and improving our credit metrics and creating long-term value for our stakeholders.
Segment and Geographic Information
The amount of
2017
revenue and net income from continuing operations for each of our operating business segments is shown below. These amounts exclude corporate and finance activities. For additional operating segment information, please see
Note 6. Segment Information
in the Notes to Consolidated Financial Statements under Item 8 in this Annual Report on Form 10-K and "
Management's Discussion and Analysis of Financial Condition and Results of Operations—Results of Operations
" under Item 7 in this Annual Report on Form 10-K, which are both incorporated herein by reference.
|
2017 Revenues
|
2017 Net income from
Continuing Operations
|
|||||||||||
|
Operating Segment (In thousands)
|
Amount
|
% of Total
|
Amount
|
% of Total
|
||||||||
|
Coal Royalty and Other
|
$
|
205,868
|
|
54%
|
$
|
154,899
|
|
77%
|
||||
|
Soda Ash
|
40,457
|
|
11%
|
40,457
|
|
20%
|
||||||
|
Construction Aggregates
|
131,692
|
|
35%
|
6,428
|
|
3%
|
||||||
|
Total
|
$
|
378,017
|
|
100%
|
$
|
201,784
|
|
100%
|
||||
Coal Royalty and Other
Segment
We own coal reserves in the three major producing regions of the United States: the Appalachia Basin, the Illinois Basin, the Powder River Basin and the Gulf Coast. We do not operate any coal mines, but lease our reserves to experienced mine operators under long-term leases that grant the operators the right to mine and sell our reserves in exchange for royalty payments. Approximately two-thirds of our leases have a term between five to forty years, with many leases having an option by the operators to extend the lease for additional terms. Leases may include the right to renegotiate rents and royalties for the extended term. We also own and manage coal-related infrastructure assets that generate additional revenues in the Illinois Basin. In addition, we own aggregates and industrial mineral reserves located in a number of states across the country. As described in the "Other Assets" section below, we also own natural gas, aggregate and industrial mineral reserves that generate a small portion of coal royalty and other segment revenues.
Under our standard lease, lessees calculate royalty payments due to us and are required to report tons of minerals removed as well as the sales prices of the extracted minerals. Therefore, to a great extent, amounts reported as royalty revenue are based upon the reports of our lessees. We periodically audit this information by examining certain records and internal reports of our lessees, and we perform periodic mine inspections to verify that the information that our lessees have submitted to us is accurate. Our audit and inspection processes are designed to identify material variances from lease terms as well as differences between the information reported to us and the actual results from each property.
In addition to their royalty obligations, our lessees are often subject to pre-established minimum quarterly or annual payments. These minimum rentals reflect amounts we are entitled to receive even if no mining activity occurred during the period. Minimum rentals are usually credited against future royalties that are earned as minerals are produced. Typically, the lessee is time limited on the period available for recouping minimum rentals.
2
Because we do not operate any coal mines, our coal royalty business does not bear ordinary operating costs and has limited direct exposure to environmental, permitting and labor risks. Our lessees, as operators, are subject to environmental laws, permitting requirements and other regulations adopted by various governmental authorities. In addition, the lessees generally bear all labor-related risks, including retiree health care legacy costs, black lung benefits and workers’ compensation costs associated with operating the mines on our coal and aggregates properties. We typically pay property taxes on our properties, which are largely reimbursed by our lessees pursuant to the terms of the various lease agreements.
Coal Production and Reserves Information
The following table presents coal production for the year ended
December 31, 2017
and coal reserves information as of
December 31, 2017
for the properties that we own by major coal region:
|
Proven and Probable Reserves
(1)
|
||||||||||||
|
(Tons in thousands)
|
Production
|
Underground
|
Surface
|
Total
|
||||||||
|
Appalachia Basin
|
||||||||||||
|
Northern
|
2,136
|
|
375,220
|
|
2,934
|
|
378,154
|
|
||||
|
Central
|
14,735
|
|
741,983
|
|
240,865
|
|
982,848
|
|
||||
|
Southern
|
2,256
|
|
72,541
|
|
20,020
|
|
92,561
|
|
||||
|
Total Appalachia Basin
|
19,127
|
|
|
1,189,744
|
|
|
263,819
|
|
|
1,453,563
|
|
|
|
Illinois Basin
|
4,373
|
|
304,590
|
|
5,211
|
|
309,801
|
|
||||
|
Northern Powder River Basin
|
4,386
|
|
—
|
|
170,904
|
|
170,904
|
|
||||
|
Gulf Coast
|
—
|
|
—
|
|
1,957
|
|
1,957
|
|
||||
|
Total
|
27,886
|
|
|
1,494,334
|
|
|
441,891
|
|
|
1,936,225
|
|
|
|
(1)
|
In excess of 96% of the reserves presented in this table are currently leased to third parties.
|
The following table presents the type of coal reserves by major coal region as of
December 31, 2017
:
|
|
Type of Coal
|
||||||||
|
(Tons in thousands)
|
Thermal
|
Metallurgical
(1)
|
Total
|
||||||
|
Appalachia Basin
|
|||||||||
|
Northern
|
316,031
|
|
62,123
|
|
378,154
|
|
|||
|
Central
|
546,517
|
|
436,331
|
|
982,848
|
|
|||
|
Southern
|
70,801
|
|
21,760
|
|
92,561
|
|
|||
|
Total Appalachia Basin
|
933,349
|
|
520,214
|
|
1,453,563
|
|
|||
|
Illinois Basin
|
309,801
|
|
—
|
|
309,801
|
|
|||
|
Northern Powder River Basin
|
170,904
|
|
—
|
|
170,904
|
|
|||
|
Gulf Coast
|
1,875
|
|
82
|
|
1,957
|
|
|||
|
Total
|
1,415,929
|
|
520,296
|
|
1,936,225
|
|
|||
|
(1)
|
For purposes of this table, we have defined metallurgical coal reserves as reserves located in seams that historically have been of sufficient quality and characteristics to be able to be used in the steel making process. Some of the reserves in the metallurgical category can also be used as thermal coal. In
2017
, approximately
58%
of our coal royalty revenues and approximately
45%
of the related production came from production of metallurgical coal.
|
3
The following table presents the sulfur content and the typical quality of our coal reserves by major coal region as of
December 31, 2017
:
|
|
|
Sulfur Content
|
Typical Quality
(1)
|
||||||||||||||||||
|
(Tons in thousands)
|
Compliance Coal
(2)
|
Low
(<1.0%)
|
Medium
(1.0%
to
1.5%)
|
High
(>1.5%)
|
Total
|
Heat
Content
(Btu per
pound)
|
Sulfur
(%)
|
||||||||||||||
|
Appalachia Basin
|
|||||||||||||||||||||
|
Northern
|
47,010
|
|
47,210
|
|
905
|
|
330,039
|
|
378,154
|
|
12,871
|
|
2.90
|
|
|||||||
|
Central
|
464,840
|
|
681,784
|
|
254,374
|
|
46,690
|
|
982,848
|
|
13,235
|
|
0.90
|
|
|||||||
|
Southern
|
58,632
|
|
71,370
|
|
16,557
|
|
4,634
|
|
92,561
|
|
13,345
|
|
0.85
|
|
|||||||
|
Total Appalachia Basin
|
570,482
|
|
|
800,364
|
|
|
271,836
|
|
|
381,363
|
|
|
1,453,563
|
|
13,147
|
|
1.42
|
|
|||
|
Illinois Basin
|
—
|
|
—
|
|
2,152
|
|
307,649
|
|
309,801
|
|
11,472
|
|
3.29
|
|
|||||||
|
Northern Powder River Basin
|
—
|
|
170,904
|
|
—
|
|
—
|
|
170,904
|
|
8,800
|
|
0.65
|
|
|||||||
|
Gulf Coast
|
82
|
|
1,957
|
|
—
|
|
—
|
|
1,957
|
|
6,964
|
|
0.69
|
|
|||||||
|
Total
|
570,564
|
|
|
973,225
|
|
|
273,988
|
|
|
689,012
|
|
|
1,936,225
|
|
|||||||
|
(1)
|
Unless otherwise indicated, the coal quality information in this Annual Report and on the Form 10-K is reported on an as-received basis with an assumed moisture of 6% for Appalachian reserves, and site specific moisture values for Illinois (typically 12% moisture) and Northern Powder River Basin (typically 25% moisture).
|
|
(2)
|
Compliance coal, when burned, emits less than 1.2 pounds of sulfur dioxide per million Btu and meets the sulfur dioxide emission standards imposed by Phase II of the Clean Air Act without blending with other coals or using sulfur dioxide reduction technologies. Compliance coal is a subset of low sulfur coal and is, therefore, also reported within the amounts for low sulfur coal.
|
Methodologies Used in Mineral Reserve Estimation
All of the reserves reported above are recoverable proven or probable reserves as determined by the SEC’s Industry Guide 7 and are estimated by our internal reserve geologist. The technologies and economic data used by our internal reserve geologist in the estimation of our proven or probable reserves include, but are not limited to, drill logs, geophysical logs, geologic maps including isopach, mine, and coal quality, cross sections, statistical analysis, and available public production data. There are numerous uncertainties inherent in estimating the quantities and qualities of recoverable reserves, including many factors beyond our control. Estimates of economically recoverable coal reserves depend upon a number of variable factors and assumptions, any one of which may, if incorrect, result in an estimate that varies considerably from actual results. See "Item 1A. Risk Factors—Risks Related to Our Business—Our reserve estimates depend on many assumptions that may be inaccurate, which could materially adversely affect the quantities and value of our reserves."
4
Major Coal Producing Properties
The following table provides a summary of our major coal royalty properties and is followed by additional information for each property or lease name:
|
Region
|
Property/Lease Name
|
Operator
|
Coal Type
|
2017 Production (Millions of Tons)
|
||||
|
Appalachia Basin
|
||||||||
|
Northern
|
Hibbs Run
|
Murray Energy Corporation
|
Thermal
|
1.3
|
||||
|
Northern
|
Carter Roag
|
Metinvest
|
Met
|
0.3
|
||||
|
Central
|
Contura-CAPP
|
Contura Energy, Inc.
|
Met
|
3.3
|
||||
|
Central
|
Resource Development
|
Blackjewel LLC
|
Met/Thermal
|
2.6
|
||||
|
Central
|
Aracoma
|
Alpha Natural Resources
|
Met/Thermal
|
1.6
|
||||
|
Central
|
Pinnacle
|
Seneca Resources, LLC
|
Met
|
1.1
|
||||
|
Central
|
Coal Mountain
|
CM Energy Properties, LP
|
Met/Thermal
|
0.7
|
||||
|
Central
|
National Mines Corp.
|
Alpha Natural Resources
|
Met
|
0.7
|
||||
|
Central
|
South Fork Coal
|
Xinergy Corp.
|
Met
|
0.3
|
||||
|
Southern
|
Oak Grove
|
Seneca Resources, LLC
|
Met
|
1.3
|
||||
|
Illinois Basin
|
Macoupin
|
Foresight Energy LP
|
Thermal
|
2.1
|
||||
|
Illinois Basin
|
Williamson
|
Foresight Energy LP
|
Thermal
|
1.7
|
||||
|
Illinois Basin
|
Hillsboro
|
Foresight Energy LP
|
Thermal
|
—
|
||||
|
Powder River Basin
|
Western Energy
|
Westmoreland Coal Company
|
Thermal
|
4.4
|
||||
5
Appalachia Basin—Northern Appalachia
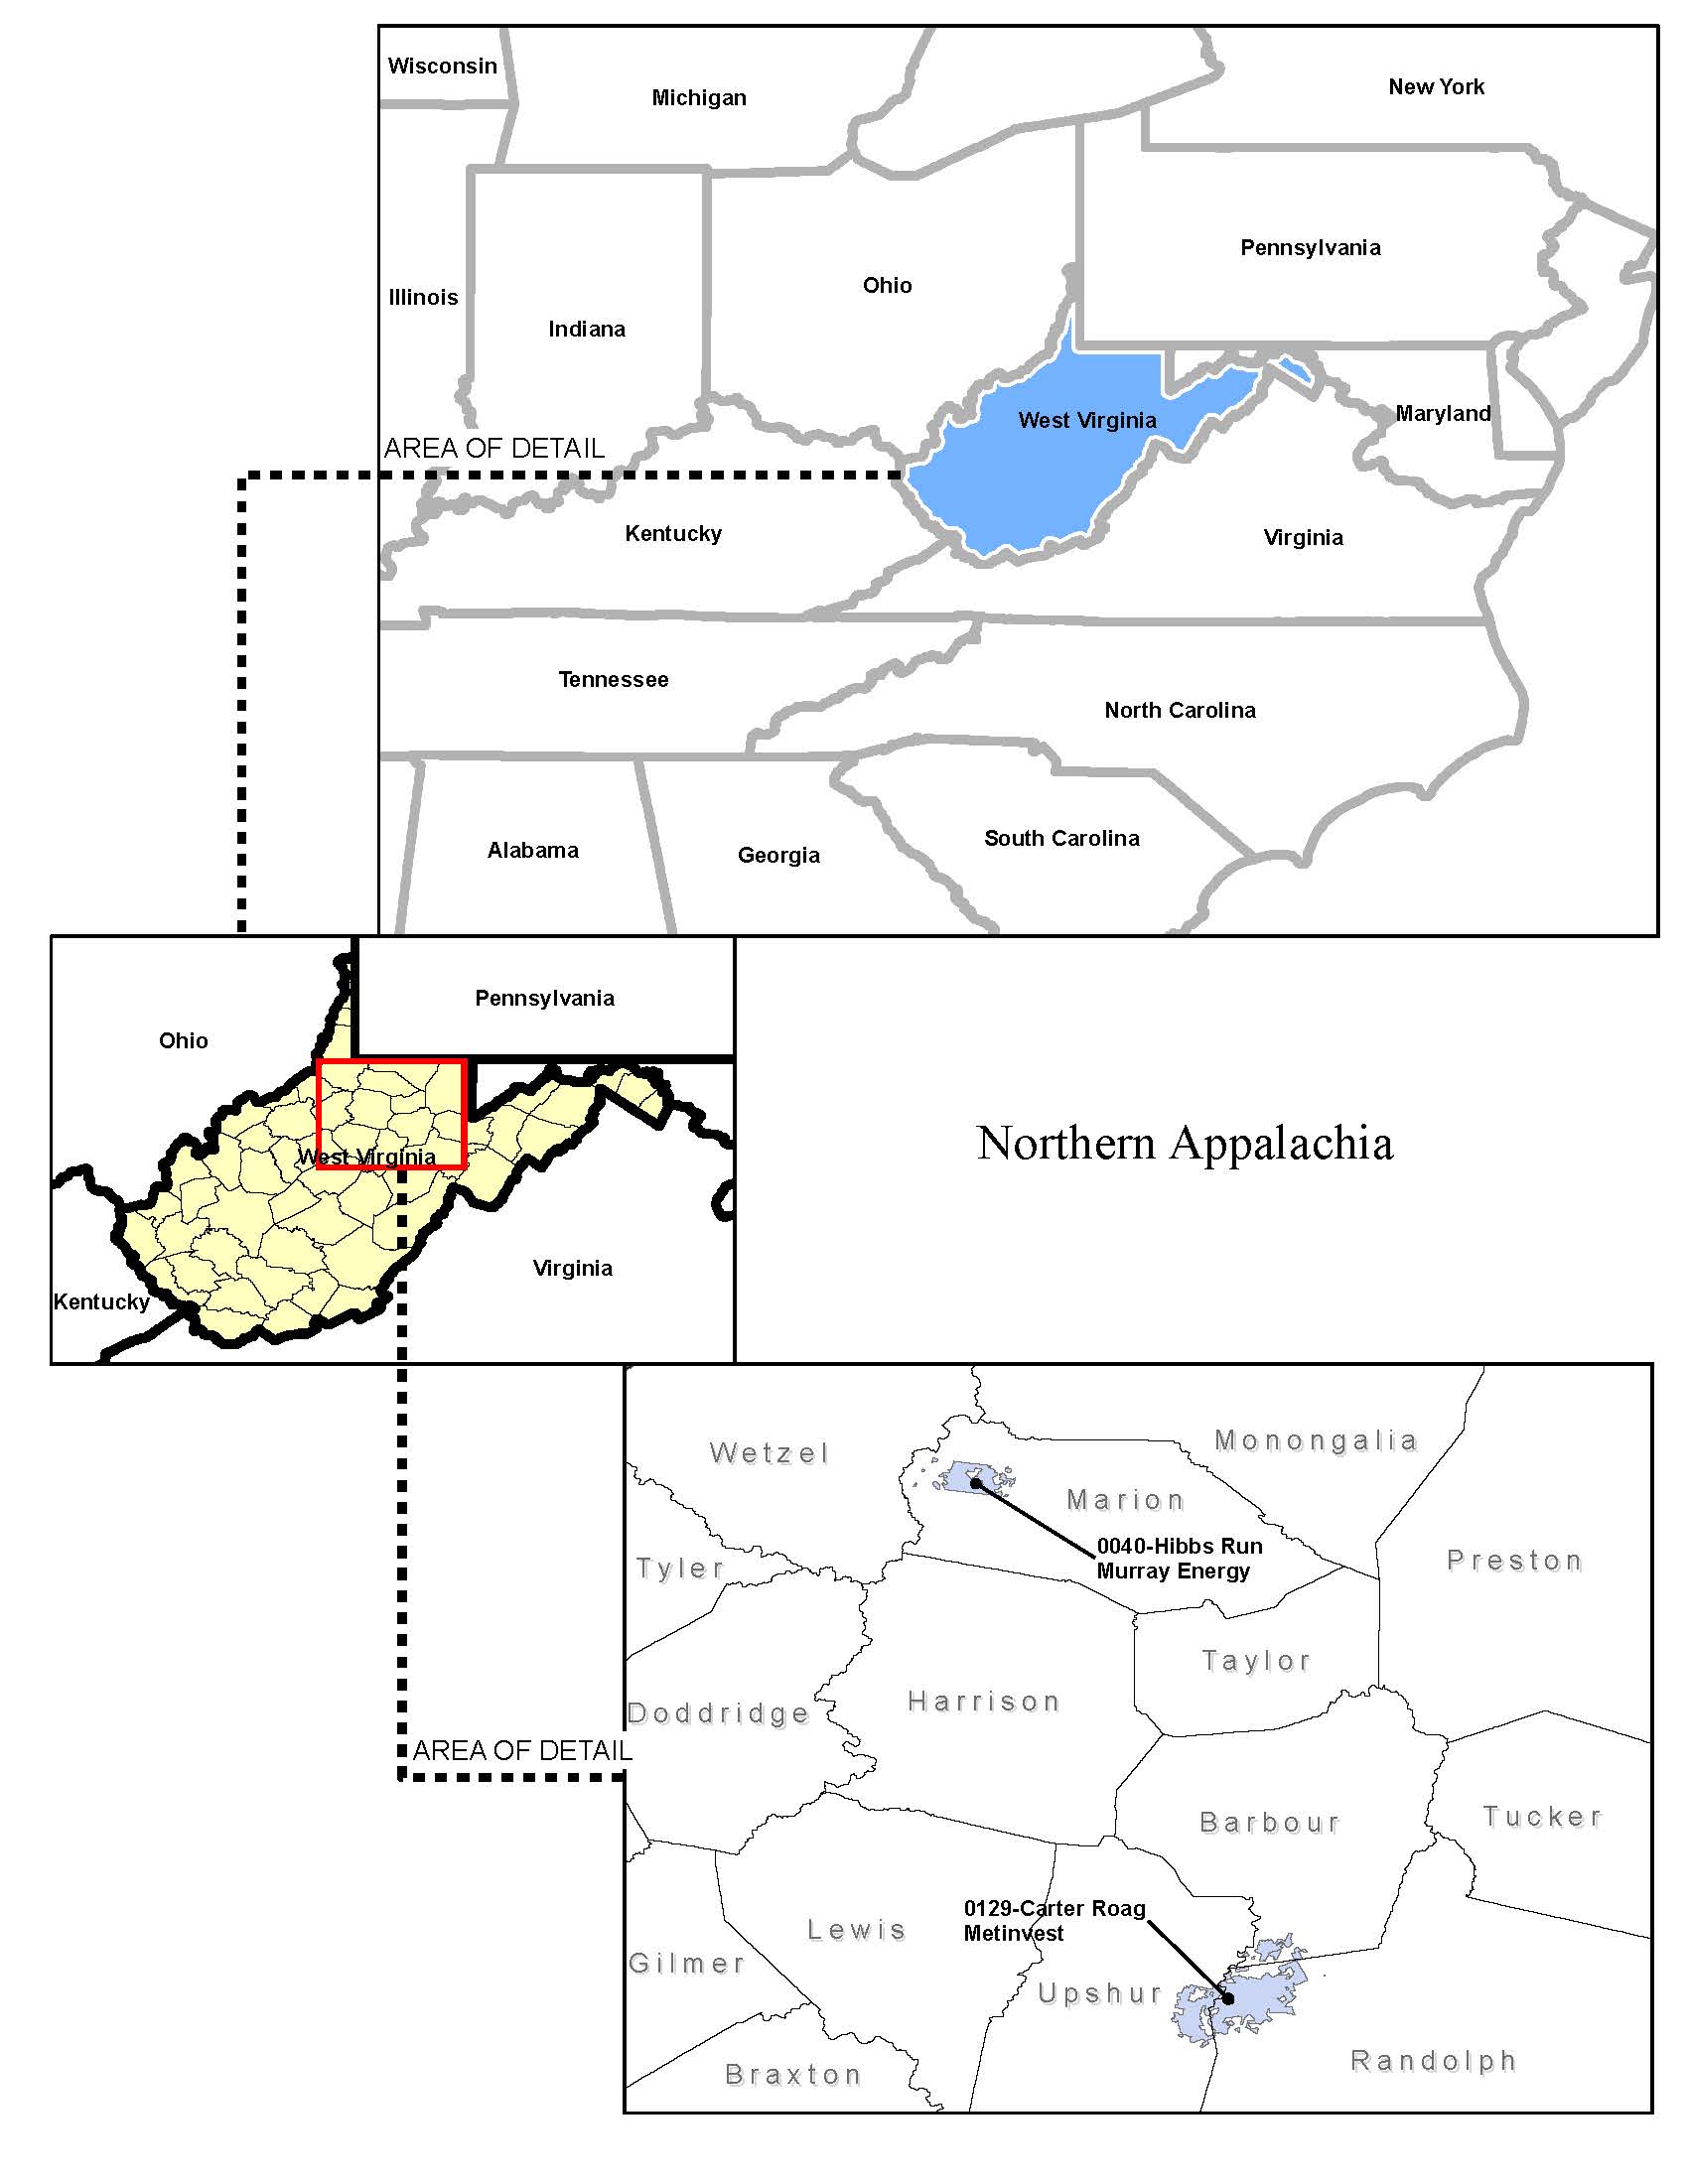
Hibbs Run.
The Hibbs Run property is located in Marion County, West Virginia. In
2017
, approximately
1.3 million
tons were produced from this property. We lease this property to Ohio Valley Resources, Inc., a subsidiary of Murray Energy Corporation. Coal from this property is produced from longwall mines. The royalty rate for this property is a low fixed rate per ton and has a significant effect on the per ton revenue for the region. The coal from this property is shipped by rail to utility customers.
Carter Roag.
The Carter Roag property is located in Randolph and Upshur Counties, West Virginia. In
2017
, approximately
0.3 million
tons were produced from this metallurgical coal property. We lease this property to Carter Roag Coal Company, a subsidiary of United Coal Company, LLC (owned by Metinvest). Production comes from the Morgan Camp and Pleasant Hill deep mines and is trucked to Carter Roag’s preparation plant situated at Star Bridge, West Virginia. The coal produced from this property is shipped via the CSX railroad to Baltimore and then by ocean vessel to Metinvest's steel mills in the Ukraine.
The map below shows the location of our major properties in Northern Appalachia:
6
Appalachia Basin—Central Appalachia
Contura-CAPP.
The Contura-CAPP property is located in Wise, Dickenson, Russell and Buchanan Counties, Virginia. In
2017
, approximately
3.3 million
tons were produced from this property, substantially all of which was metallurgical coal. We lease this property to subsidiaries of Contura Energy, Inc. Production comes from both underground and surface mines and is trucked to one of two preparation plants. Coal is shipped via both the CSX and Norfolk Southern railroads to utility and metallurgical customers.
Resource Development.
The Resource Development property is located in Harlan and Letcher Counties, Kentucky and Wise County, Virginia. In September 2017, the operator acquired the adjacent Lone Mountain and Cumberland River operations from Arch Coal, Inc. In
2017
, approximately
2.6 million
tons were produced from this property. We lease this property to Blackjewel, LLC. Production comes from both underground and surface mines. This property has the ability to ship coal on both the CSX and Norfolk Southern railroads to utility and metallurgical customers.
Aracoma.
The Aracoma property is located in Logan County, West Virginia. This property is leased to subsidiaries of Alpha Natural Resources, Inc. In
2017
, approximately
1.6 million
tons of metallurgical coal were produced from the property. Both thermal and metallurgical coal are produced from underground mines and transported by belt or truck to the preparation plant on the property. Coal is shipped via the CSX railroad to utility customers and to various domestic and export metallurgical customers.
Pinnacle.
The Pinnacle property is located in Wyoming and McDowell Counties, West Virginia. In
2017
, approximately
1.1 million
tons of metallurgical coal were produced from our reserves on this property. We also own an overriding royalty interest on coal produced from the reserves that we do not own at this property, from which we derive additional revenues. We lease the property to a subsidiary of Seneca Resources, LLC. Production comes from a longwall mine and is transported by beltline to a preparation plant on the property and is then shipped via Norfolk Southern railroad to both domestic and export customers.
Coal Mountain.
The Coal Mountain property is located in Wyoming County, West Virginia. In 2017, approximately
0.7 million
tons were produced from the property. We lease this property to CM Energy Properties, LP. Metallurgical coal is produced using the surface mining method and is transported by truck to a preparation plant on the property. Coal is shipped via the Norfolk Southern railroad to various utility and domestic or export metallurgical customers.
National Mines Corp.
The National Mines Corp. property is located in Wyoming County, West Virginia. In
2017
, approximately
0.7 million
tons were produced from the property. We lease this property to a subsidiary of Alpha Natural Resources, Inc. Metallurgical coal is produced from two underground mines that is transported by belt and truck to a preparation plant on the property. Coal is shipped via the Norfolk Southern railroad to various metallurgical customers.
South Fork Coal.
The South Fork Coal property is located in Greenbrier County, West Virginia. In
2017
, approximately
0.3 million
tons were produced from the property. This property is leased to South Fork Coal Company, LLC, a subsidiary of Xinergy Corp. Metallurgical coal is produced from surface mines and transported by truck to a preparation plant. Coal is shipped via the CSX railroad to various export metallurgical customers.
7
The map below shows the location of our major properties in Central Appalachia:

8
Appalachia Basin—Southern Appalachia
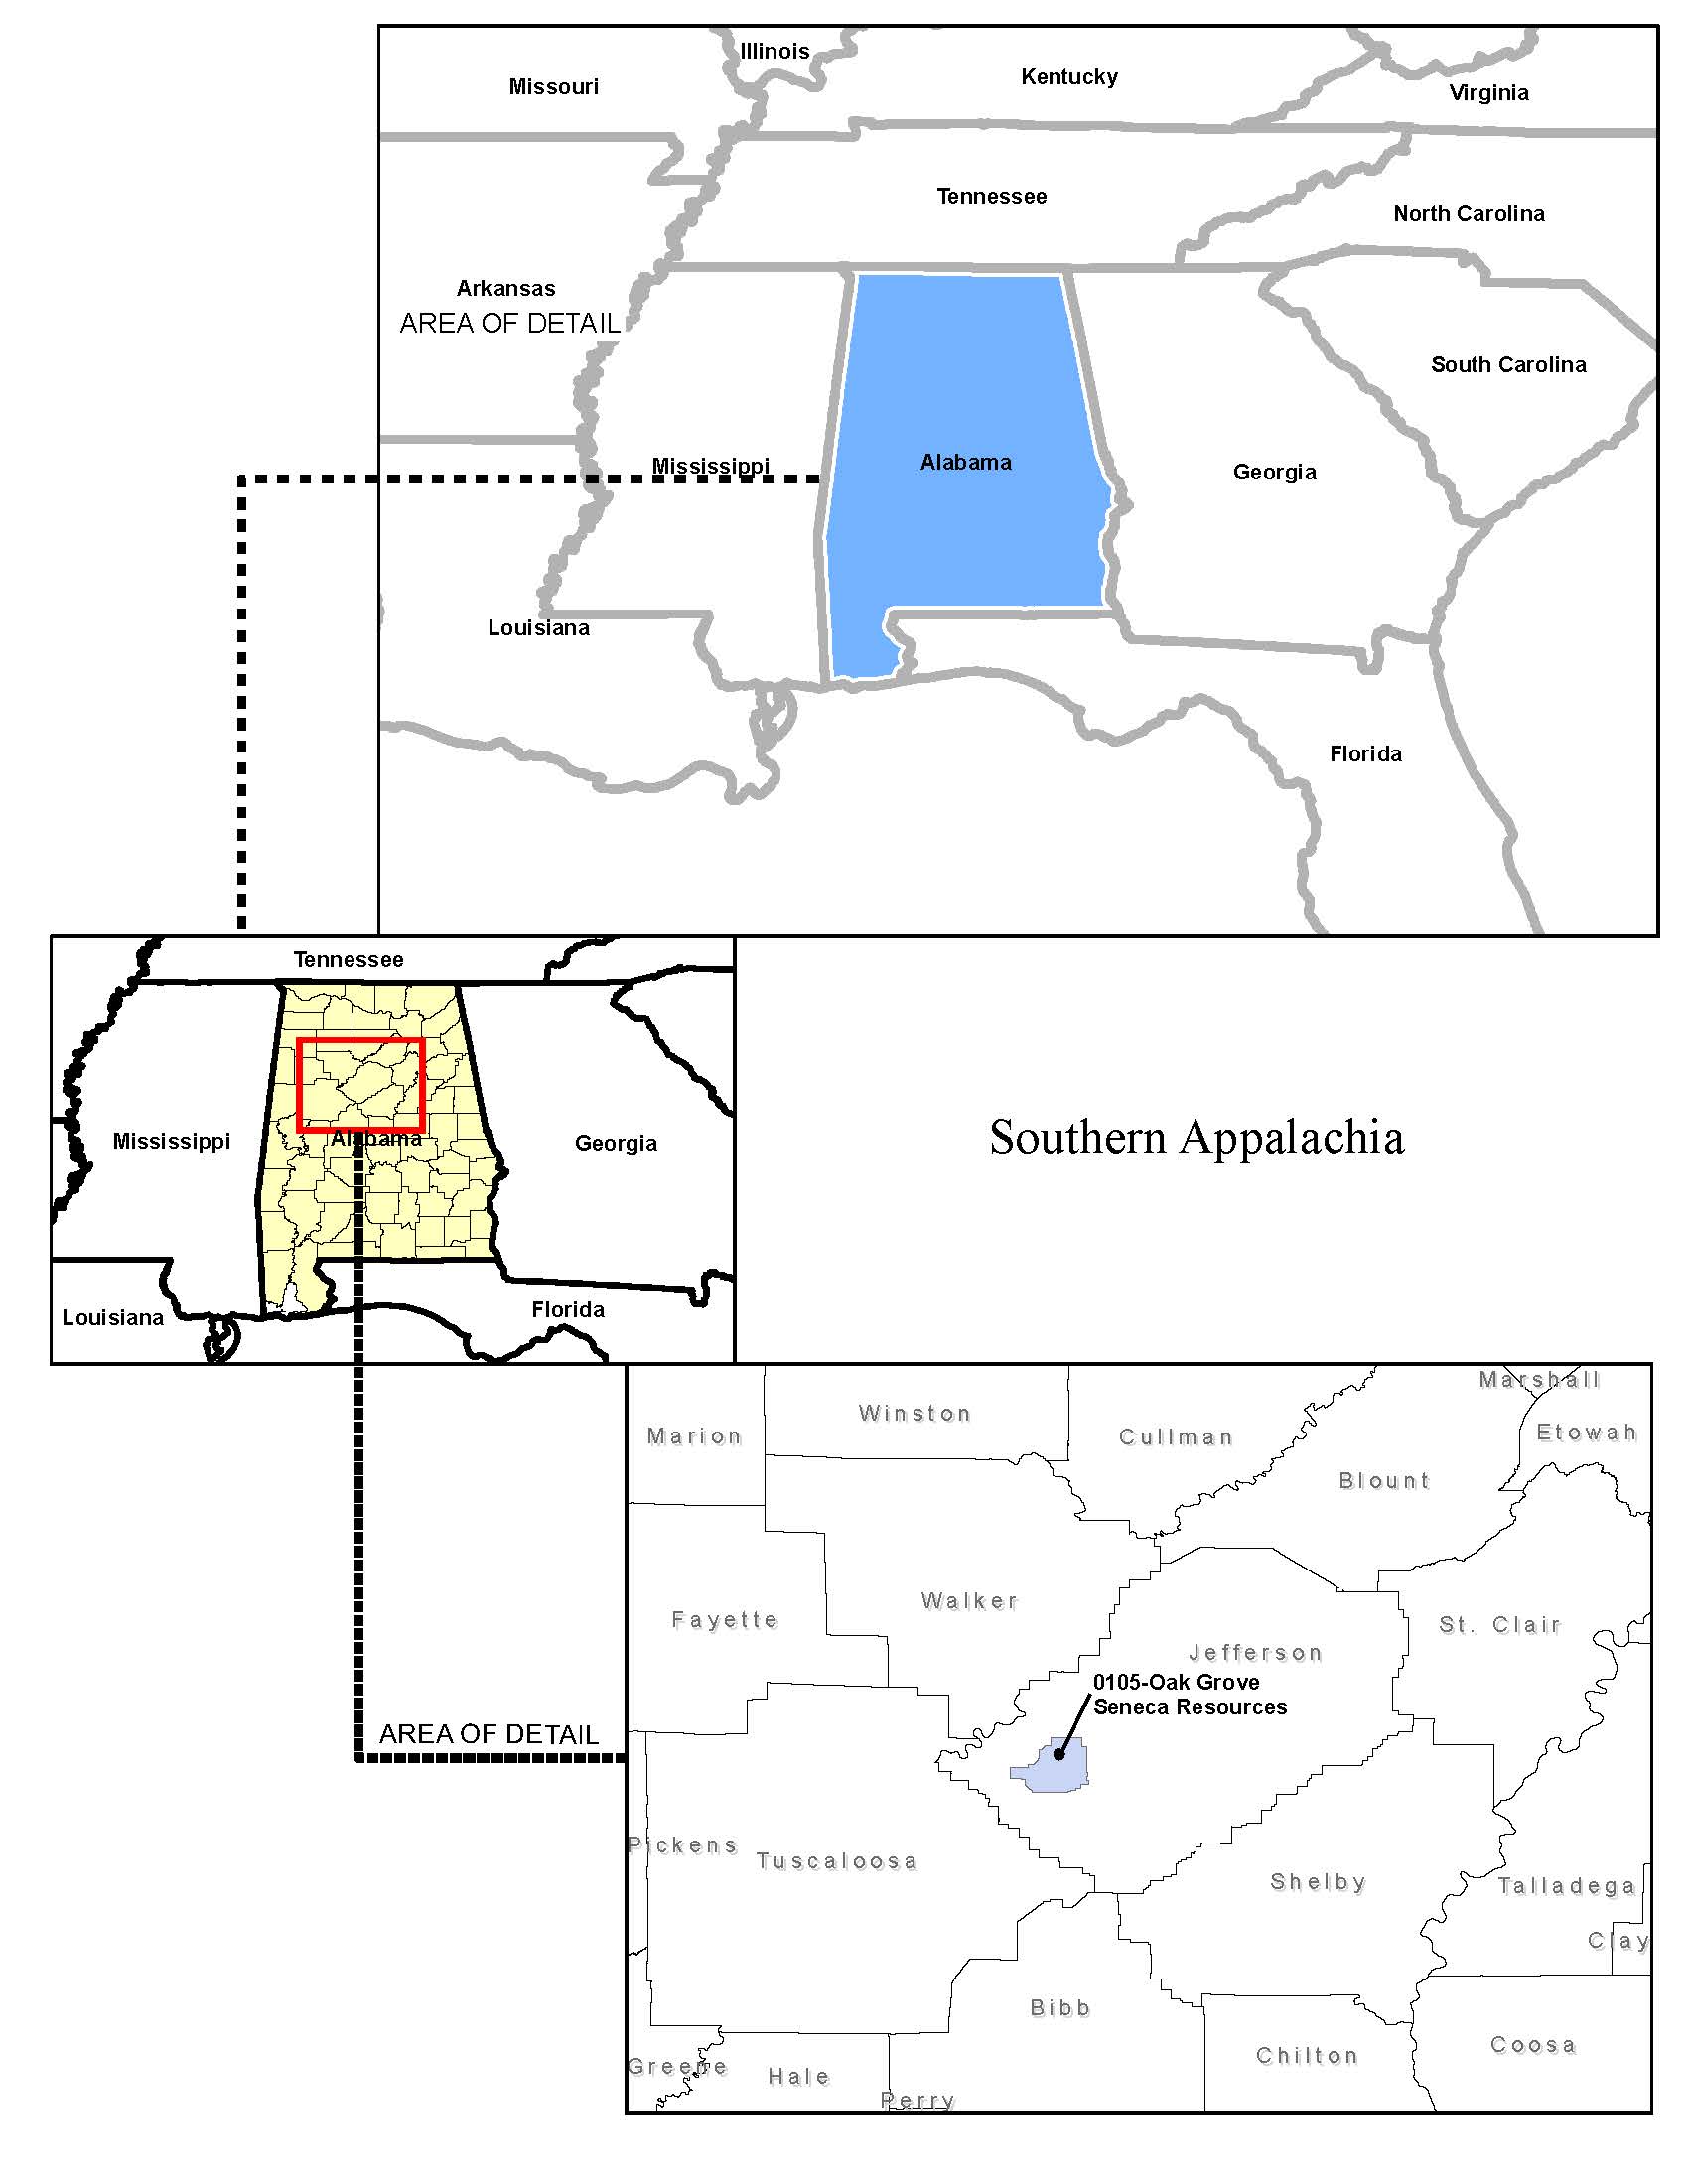
Oak Grove
. The Oak Grove property is located in Jefferson County, Alabama. In
2017
, approximately
1.3 million
tons of metallurgical coal were produced from this property. We lease the property to a subsidiary of Seneca Coal Resources, LLC. Production comes from an underground longwall mine and is transported primarily by beltline to a preparation plant. Metallurgical products are then shipped via railroad and barge to both domestic and export customers.
The map below shows the location of our major property in Southern Appalachia:
9
Illinois Basin
Macoupin
. The Macoupin property is located in Macoupin County, Illinois. The property is under lease to a subsidiary of Foresight Energy LP ("Foresight Energy"). In
2017
, approximately
2.1 million
tons were sold from the property. Production is from an underground mine and is shipped via the Norfolk Southern or Union Pacific railroads or by barge to utility customers or loaded into barges for shipment to export customers.
Williamson.
The Williamson property is located in Franklin and Williamson Counties, Illinois. The property is under lease to a subsidiary of Foresight Energy. In
2017
, approximately
1.7 million
tons were sold from the property. This production uses longwall mining methods and is shipped primarily via the Canadian National railroad to domestic utility customers and to various export customers.
Hillsboro.
The Hillsboro property is located in Montgomery and Bond Counties, Illinois. The property is under lease to Hillsboro Energy, a subsidiary of Foresight Energy and has been idled since March 2015. When active, production at the Deer Run mine on our Hillsboro property is from an underground longwall mine and is shipped via either the Union Pacific, Norfolk Southern or Canadian National railroads, or by barges to domestic utilities or export customers. We are currently in a lawsuit against Hillsboro Energy as well as Foresight Energy and certain of its other subsidiaries related to the Deer Run mine. For more information, see "Item 3. Legal Proceedings" included elsewhere in this Annual Report on Form 10-K.
In addition to these properties, we own loadout and other transportation assets at the Williamson, Macoupin and at the Sugar Camp mines, which are mines operated by Foresight Energy. See "Coal Processing and Transportation Assets" below for additional information on these assets.
The map below shows the location of our major properties in the Illinois Basin:
10

11
Northern Powder River Basin
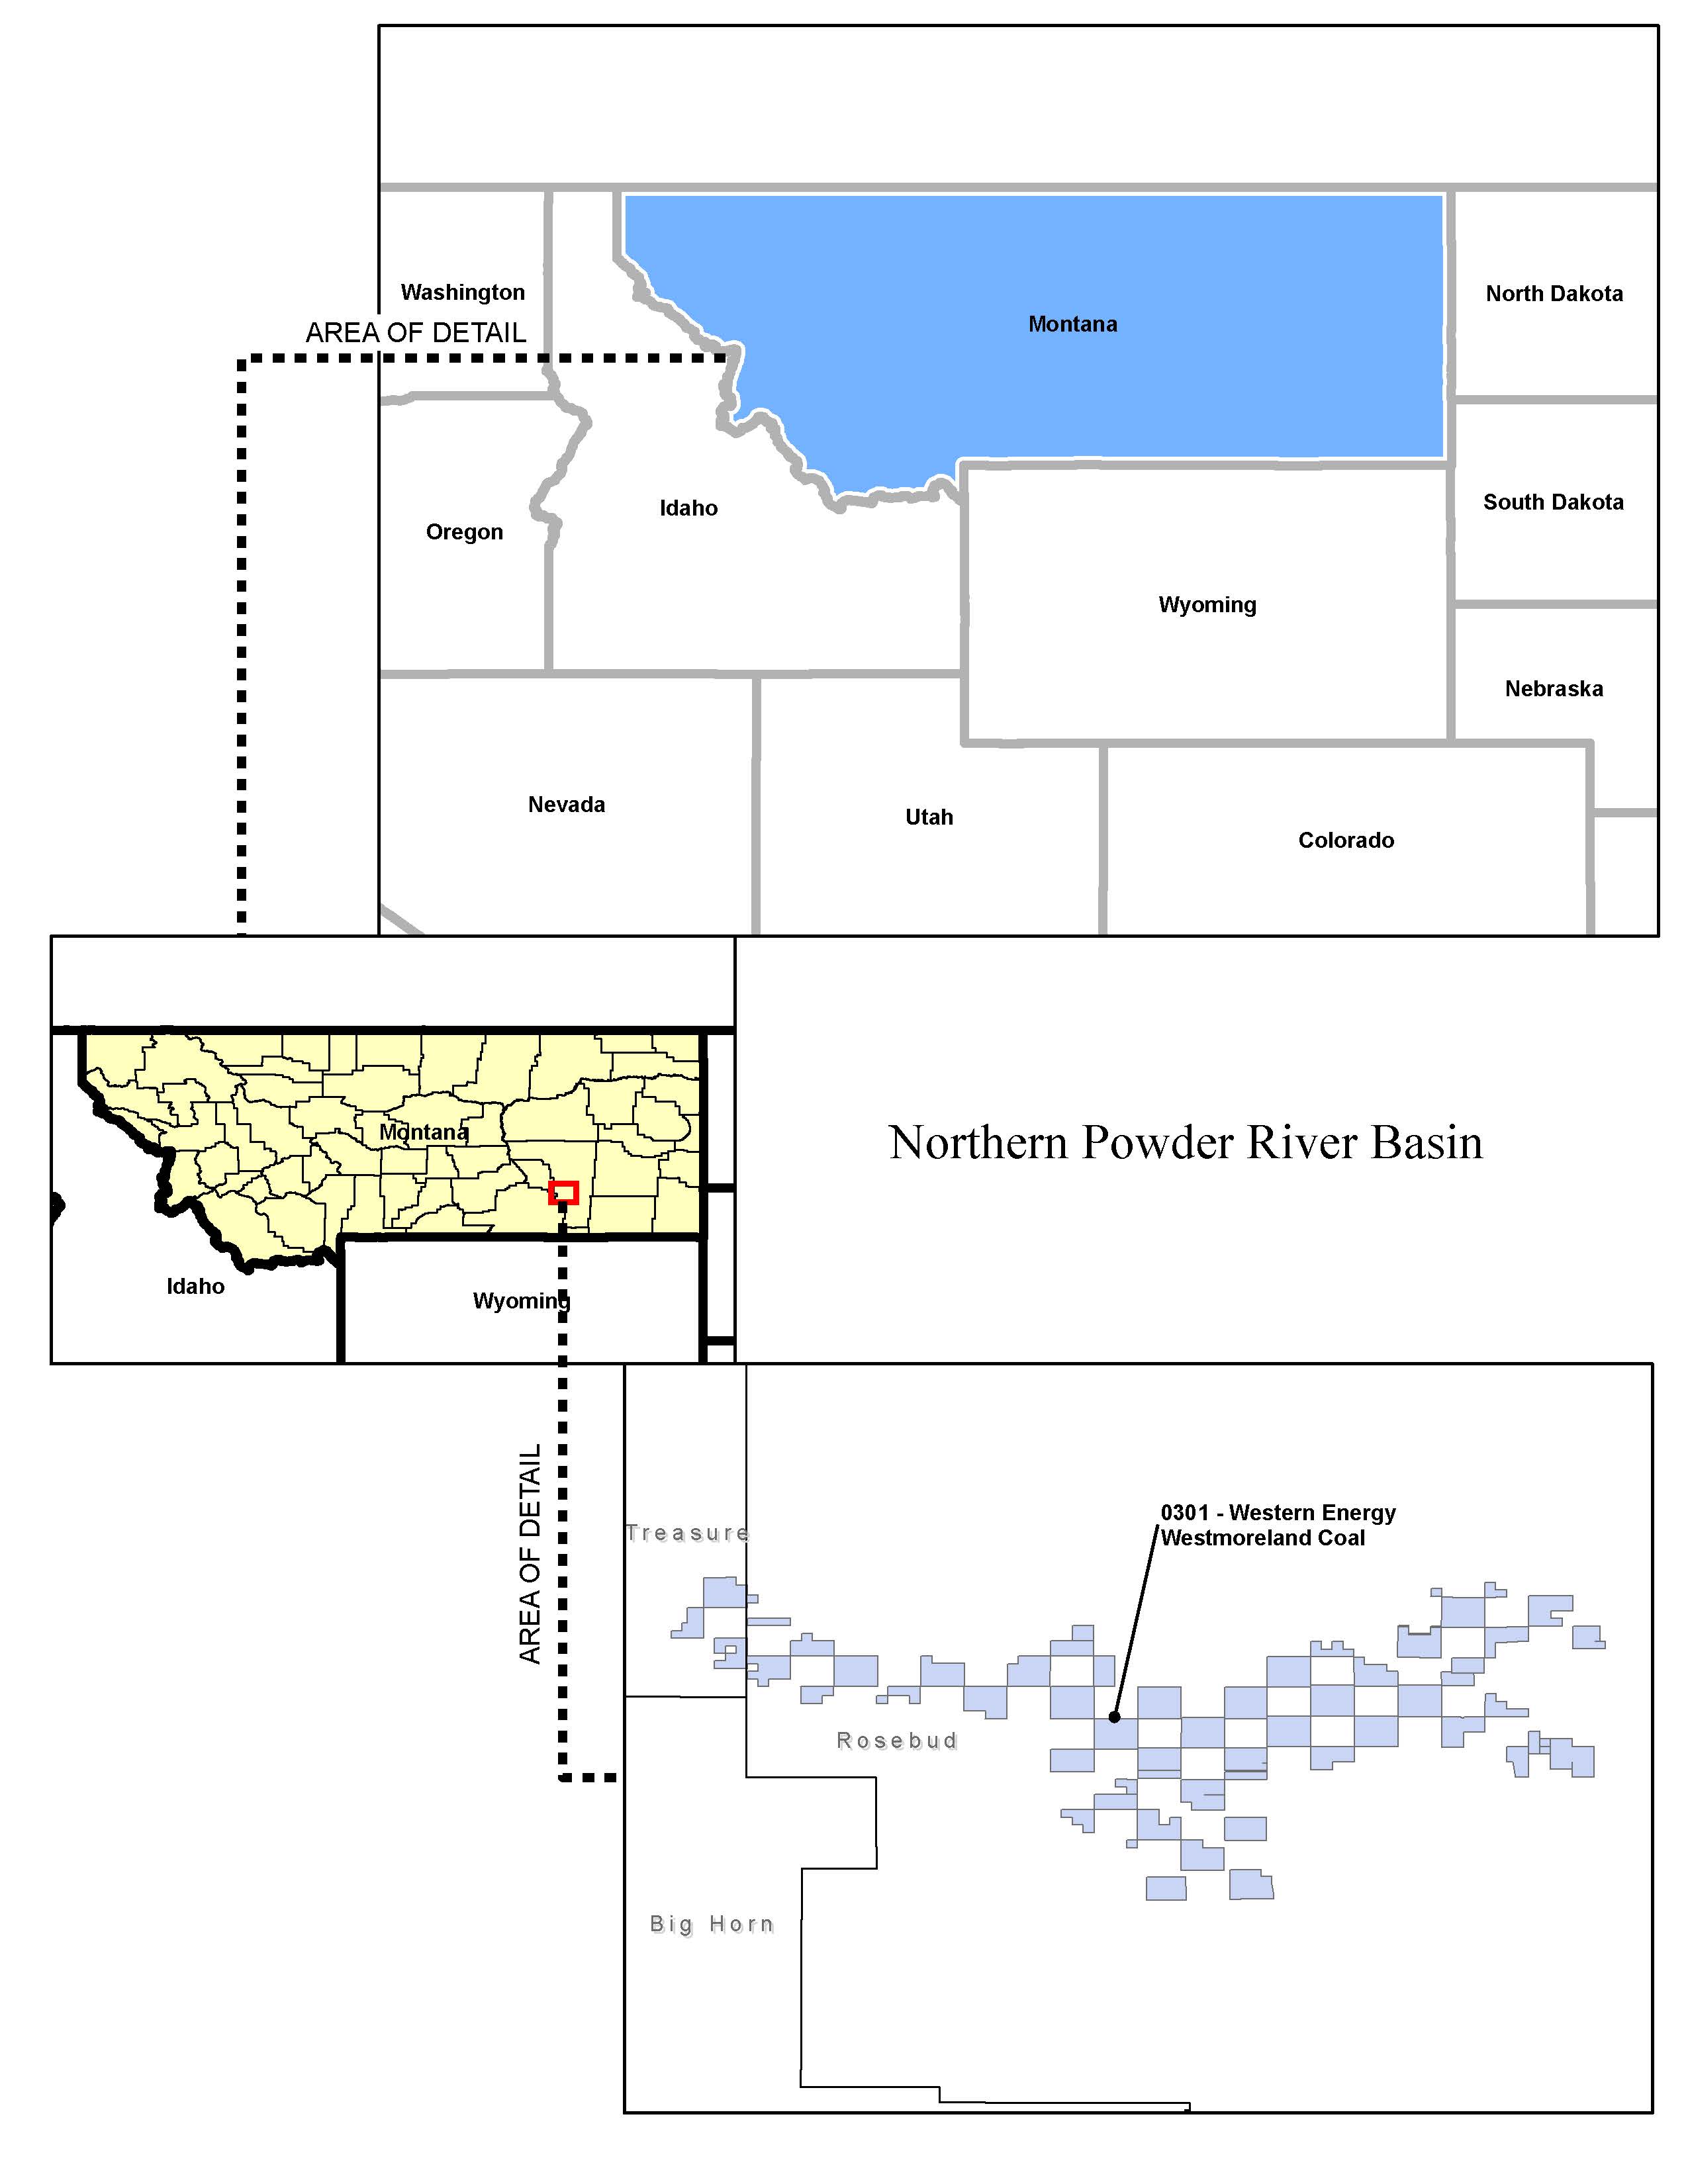
Western Energy.
The Western Energy property is located in Rosebud and Treasure Counties, Montana. In
2017
, approximately
4.4 million
tons were produced from our property by a subsidiary of Westmoreland Coal Company. Coal is produced by surface dragline mining, and the coal is transported by either truck or beltline to the four-unit 2,200-megawatt Colstrip generation station located at the mine mouth.
The map below shows the location of our property in the Northern Powder River Basin:
12
Coal Transportation and Processing Assets
We own transportation and processing infrastructure related to certain of our coal properties and recorded
$20.5 million
in revenue related to these assets during the year ended December 31, 2017. We own loadout and other transportation assets at the Williamson and Macoupin mines in the Illinois Basin. In addition, we own rail loadout and associated infrastructure at the Sugar Camp mine, an Illinois Basin mine also operated by a subsidiary of Foresight Energy. While we own coal reserves at the Williamson and Macoupin mines, we do not own coal reserves at the Sugar Camp mine. We typically lease this infrastructure to third parties and collect throughput fees; however, at the loadout facility at the Williamson mine, we operate the coal handling and transportation infrastructure and have subcontracted out that responsibility to a third party.
Other Assets
As of December 31,
2017
, we owned an estimated 174 million tons of aggregates reserves primarily located in Kentucky and Indiana. We lease a portion of these reserves to third parties in exchange for royalty payments. Of the 174 million tons owned, we lease approximately 108 million tons of these reserves to our Construction Aggregates Grand Rivers operation. In addition, we hold an override royalty interest in frac sand opportunities in Wisconsin and Texas and an override royalty interest in sand and gravel in Washington. The override royalty interests total approximately 101 million tons. The structure of these leases is similar to our coal leases, and these leases typically also require minimum rental payments in addition to royalties. During
2017
, our aggregates lessees produced 4.4 million tons of aggregates from these properties and we received
$4.2 million
in aggregates royalty revenues, including overriding royalty revenues.
Through our 51% ownership of BRP LLC ("BRP"), a joint venture with International Paper Company, we own approximately 10 million mineral acres in 31 states that include the following assets:
|
•
|
approximately 300,000 gross acres of oil and natural gas mineral rights in Louisiana, of which over 53,000 acres were leased as of
December 31, 2017
;
|
|
•
|
approximately 50 million tons of aggregate reserves primarily located in Arkansas, North Carolina and South Carolina and approximately 16 million tons of override royalty interest in North Carolina and Georgia;
|
|
•
|
approximately 95,000 net mineral acres of coal rights (primarily lignite and some bituminous coal) in the Gulf Coast region, of which approximately 5,600 acres are leased in Louisiana, Mississippi and Texas;
|
|
•
|
an overriding royalty interest of 1% on approximately 25,000 mineral acres in Louisiana;
|
|
•
|
copper rights in Michigan’s Upper Peninsula that are subject to a development agreement with a copper development company; and
|
|
•
|
various other mineral rights including coalbed methane, metals, aggregates, water and geothermal, in several states throughout the United States.
|
While the vast majority of the 10 million acres remain largely undeveloped, BRP has an ongoing program to identify additional opportunities to lease its minerals to operating parties.
13
Soda Ash Segment
We own a 49% non-controlling equity interest in Ciner Wyoming. Ciner Resources LP, our operating partner, controls and operates Ciner Wyoming. Ciner Resources LP mines the trona, processes it into soda ash, and distributes the soda ash both domestically and internationally into the glass and chemicals industries. Ciner Resources LP is a publicly traded master limited partnership that depends on distributions from Ciner Wyoming in order to make distributions to its public unitholders.
Ciner Wyoming is one of the largest and lowest cost producers of soda ash in the world, serving a global market from its facility located in the Green River Basin of Wyoming. The Green River Basin geological formation holds the largest, and one of the highest purity, known deposits of trona ore in the world. Trona, a naturally occurring soft mineral, is also known as sodium sesquicarbonate and consists primarily of sodium carbonate, or soda ash, sodium bicarbonate and water. Ciner Wyoming processes trona ore into soda ash, which is an essential raw material in flat glass, container glass, detergents, chemicals, paper and other consumer and industrial products. The vast majority of the world’s accessible trona reserves are located in the Green River Basin. According to historical production statistics, approximately one-quarter of global soda ash is produced by processing trona, with the remainder being produced synthetically through chemical processes. The costs associated with procuring the materials needed for synthetic production are greater than the costs associated with mining trona for trona-based production. In addition, trona-based production consumes less energy and produces fewer undesirable by-products than synthetic production.
Ciner Wyoming’s Green River Basin surface operations are situated on approximately 880 acres in Wyoming, and its mining operations consist of approximately 23,500 acres of leased and licensed subsurface mining area. The facility is accessible by both road and rail. Ciner Wyoming uses seven large continuous mining machines and 14 underground shuttle cars in its mining operations. Its processing assets consist of material sizing units, conveyors, calciners, dissolver circuits, thickener tanks, drum filters, evaporators and rotary dryers. The following map provides an aerial overview of Ciner Wyoming’s surface operations:
14

In trona ore processing, insoluble materials and other impurities are removed by thickening and filtering the liquor, a solution consisting of sodium carbonate dissolved in water. Ciner Wyoming then adds activated carbon to filters to remove organic impurities, which can cause color contamination in the final product. The resulting clear liquid is then crystallized in evaporators, producing sodium carbonate monohydrate. The crystals are then drawn off and passed through a centrifuge to remove excess water. The resulting material is dried in a product dryer to form anhydrous sodium carbonate, or soda ash. The resulting processed soda ash is then stored in on-site storage silos to await shipment by bulk rail or truck to distributors and end customers. Ciner Wyoming’s storage silos can hold up to 65,000 short tons of processed soda ash at any given time. The facility is in good working condition and has been in service for over 50 years.
Deca Rehydration.
The evaporation stage of trona ore processing produces a precipitate and natural by-product called deca. "Deca," short for sodium carbonate decahydrate, is one part soda ash and ten parts water. Solar evaporation causes deca to crystallize and precipitate to the bottom of the four main surface ponds at the Green River Basin facility. The deca rehydration process enables Ciner Wyoming to recover soda ash from the deca-rich purged liquor as a by-product of the refining process. The soda ash contained in deca is captured by allowing the deca crystals to evaporate in the sun and separating the dehydrated crystals from the soda ash.
15
The separated deca crystals are then blended with partially processed trona ore in the dissolving stage of the production process. This process enables Ciner Wyoming to reduce waste storage needs and convert what is typically a waste product into a usable raw material. As a result of this process, Ciner Wyoming has been able to reduce the amount of short tons of trona ore it takes to produce one short ton of soda ash.
Shipping and Logistics.
All of the soda ash produced is shipped by rail or truck from the Green River Basin facility. Ciner Wyoming leases a fleet of more than 2,000 hopper cars that serve as dedicated modes of shipment to its domestic customers. For export, Ciner Wyoming ships soda ash on unit trains consisting of approximately 100 cars to two primary ports: Port Arthur, Texas and Portland, Oregon. From these ports, the soda ash is loaded onto ships for delivery to ports all over the world. American Natural Soda Ash Corporation ("ANSAC") provides logistics and support services for all of Ciner Wyoming’s export sales. For domestic sales, Ciner Resources Corporation provides similar services.
Customers
. Ciner Wyoming’s largest customer is ANSAC, which buys soda ash (through Ciner Wyoming’s sales agent) and other of its member companies for further export to its customers. ANSAC accounted for approximately 45% of Ciner Wyoming’s net sales in
2017
. ANSAC takes soda ash orders directly from its overseas customers and then purchases soda ash for resale from its member companies pro rata based on each member’s production volumes. ANSAC is the exclusive distributor for its members to the markets it serves. However, Ciner Resources Corporation, on Ciner Wyoming’s behalf, negotiates directly with, and Ciner Wyoming exports to, customers in markets not served by ANSAC. During 2017, approximately 27% of Ciner Wyoming’s net sales were to an affiliate of Ciner Resources Corporation that sold soda ash into international markets not served by ANSAC. During 2017, Ciner Wyoming had approximately 70 domestic customers.
Leases and License.
Ciner Wyoming is party to several mining leases and one license for its subsurface mining rights. Some of the leases are renewable at Ciner Wyoming’s option upon expiration. Ciner Wyoming pays royalties to the State of Wyoming, the U.S. Bureau of Land Management and Rock Springs Royalty Company, an affiliate of Anadarko Petroleum, which are calculated based upon a percentage of the quantity or gross value of soda ash and related products at a certain stage in the mining process, or a certain sum per ton of such products. These royalty payments are typically subject to a minimum domestic production volume from the Green River Basin facility, although Ciner Wyoming is obligated to pay minimum royalties or annual rentals to its lessors and licensor regardless of actual sales. The royalty rates paid to Ciner Wyoming’s lessors and licensor may change upon renewal of such leases and license. Under the license with Rock Springs, the applicable royalty rate may vary based on a most favored nation clause in the license which is currently the subject of litigation in Wyoming.
As a minority interest owner in Ciner Wyoming, we do not operate and are not involved in the day-to-day operation of the trona ore mine or soda ash production plant. Our partner, Ciner Resources LP manages the mining and plant operations. We appoint three of the seven members of the Board of Managers of Ciner Wyoming and have certain limited negative controls relating to the company.
Construction Aggregates Segment
Our Construction Aggregates segment consists of our construction materials business that was acquired on October 1, 2014. The business operates four limestone quarries, one underground limestone mine, five sand and gravel plants, two asphalt plants and two marine terminals. As of December 31,
2017
, Construction Aggregates controlled approximately 400 million tons of estimated aggregates reserves, including approximately 108 million tons of reserves leased at the Grand Rivers operation from the Coal Royalty and Other segment. The reserve estimates for each of Construction Aggregates’ properties were prepared internally and audited by an independent third party advisor. During the year ended December 31,
2017
, Construction Aggregates sold approximately
6.3 million
tons of crushed stone and gravel, including brokered stone,
1.3 million
tons of sand and
0.3 million
tons of asphalt. Our Construction Aggregates business is seasonal, with production typically lower in the first quarter of each year due to winter weather.
16
Construction Aggregates’ four operating businesses are Laurel Aggregates, located in Lake Lynn, Pennsylvania, Winn Materials/McIntosh Construction, located in Clarksville, Tennessee, Grand Rivers, located in Grand Rivers, Kentucky and Southern Aggregates, located near Baton Rouge, Louisiana. The following map shows the locations of each of Construction Aggregates’ operations:

Laurel Aggregates
Laurel Aggregates ("Laurel") is a limestone mining company located in Lake Lynn, Pennsylvania. Its operations consist of a surface and underground mines and use conventional drilling, blasting and crushing methods. The surface mine is located on approximately 100 acres of owned property, and the underground reserves are located on approximately 670 acres of leased property. Laurel Aggregates pays royalties for material mined and sold from its leased property. Laurel also brokers stone for third party quarries located in Ohio and Pennsylvania. Crushed stone is loaded into third party trucks for delivery to customers located in southwestern Pennsylvania, northeastern West Virginia and eastern Ohio. Laurel’s customers consist of oilfield service companies, natural gas exploration and production companies and construction and contracting companies.
Winn Materials/McIntosh Construction
Winn Materials’ ("Winn") operations consist of two crushed stone quarries and a river terminal, while McIntosh Construction ("McIntosh") is a complementary asphalt producer and paving company. Together, the two companies function as a vertically integrated unit. The operations of Winn/McIntosh are located in Clarksville, Tennessee, which is located approximately 45 miles northwest of Nashville.
Winn mines and produces hard rock limestone using conventional drilling, blasting and crushing methods. Winn primarily leases its properties at its two quarries located in Clarksville and in Trenton, Kentucky and pays royalties for material produced and sold from the leased properties. Winn’s marine terminal business is located on the Cumberland River, adjacent to Winn’s Clarksville quarry. Its dock transloads various materials by barge. Through the river terminal, Winn loads out crushed stone and also imports products such as river and granite sand, fertilizer, and agricultural products for the local and regional markets. The river terminal is currently being expanded to meet growing demand for additional imported product into these markets. Crushed stone produced at Winn’s quarries and products imported from the river terminal are loaded onto third party trucks for delivery to Winn’s customers.
17
McIntosh sells asphalt to third parties and also operates its own paving business. Winn supplies most of McIntosh’s crushed stone and sand used for both its asphalt production and construction needs. The Winn/McIntosh businesses sell to and provide services for residential, commercial and industrial customers. These businesses also supply and provide construction services for infrastructure and highway construction projects primarily within Montgomery County, Tennessee, including for Fort Campbell, one of the largest Army bases in the United States.
Southern Aggregates
Southern Aggregates ("Southern") is a sand and gravel mining company based in Denham Springs, Louisiana, approximately 25 miles northeast of Baton Rouge, Louisiana. Southern operates six sand and gravel operations. Suction dredges extract sand and gravel, and the mined material is processed at plants generally located at each site. The plants separate gravel and saleable sand from waste sand and clays, with the waste returned to mined-out sections of pits. The saleable sand and gravel material is loaded onto third party trucks for delivery to Southern’s customers. Southern leases its mineral reserves and pays royalties for material produced and sold from the leased properties. Southern’s markets extend approximately 100 miles west and south from its operating locations, including to the cities of Baton Rouge, Lafayette and New Orleans. Southern’s customers consist primarily of ready mix concrete companies, asphalt producers and contractors.
Grand Rivers
The Construction Aggregates segment purchased a 514 acre hard rock quarry operation located on the Tennessee River near Grand Rivers, Kentucky from one of NRP’s aggregates lessees that had previously idled the operation. This operation continues to lease reserves from NRP and sell its limestone aggregates in both the local market, loaded onto third party trucks, and to river-based markets through a barge load out terminal.
The Grand Rivers quarry produces various grades of crushed limestone products mined through its open pit using conventional drilling, blasting and crushing methods performed by a third party mining contractor. Grand Rivers pays royalties for material produced and sold from the leased property to a subsidiary of NRP. Crushed stone is loaded into third party trucks for delivery to customers in Kentucky and barges for delivery to customers along the Mississippi River Basin and related waterways. Grand Rivers customers currently consist primarily of ready mix concrete companies and construction and contracting companies.
Significant Customers
We have a significant concentration of revenues with Foresight Energy and its subsidiaries, with total revenues of
$70.5 million
in
2017
from three different mining operations. For additional information on significant customers, refer to
Note 16. Major Customers
in the Notes to Consolidated Financial Statements under "Item 8. Financial Statements and Supplementary Data."
We have a lawsuit pending against Foresight Energy and certain of its subsidiaries, including Hillsboro Energy, relating to the wrongful declaration of force majeure at the Deer Run mine. We also have a lawsuit pending against Macoupin Energy for breach of contract for wrongful recoupment of previously paid minimum royalties. For additional information on these lawsuits, see
Note 17. Commitments and Contingencies
in the Notes to Consolidated Financial Statements under "Item 8. Financial Statements and Supplementary Data" and "Item 3. Legal Proceedings" included elsewhere in this Annual Report on Form 10-K.
Competition
We face competition from land companies, coal producers, international steel companies and private equity firms in purchasing coal reserves and royalty producing properties. Numerous producers in the coal industry make coal marketing intensely competitive. Our lessees compete among themselves and with coal producers in various regions of the United States for domestic sales. Lessees compete with both large and small producers nationwide on the basis of coal price at the mine, coal quality, transportation cost from the mine to the customer and the reliability of supply. Continued demand for our coal and the prices that our lessees obtain are also affected by demand for electricity and steel, as well as government regulations, technological developments and the availability and the cost of generating power from alternative fuel sources, including nuclear, natural gas and hydroelectric power.
Ciner Wyoming's trona mining and soda ash refinery business faces competition from a number of soda ash producers in the United States, Europe and Asia, some of which have greater market share and greater financial, production and other resources than Ciner Wyoming does. Some of Ciner Wyoming’s competitors are diversified global corporations that have many lines of
18
business and some have greater capital resources and may be in a better position to withstand a long-term deterioration in the soda ash market. Other competitors, even if smaller in size, may have greater experience and stronger relationships in their local markets. Competitive pressures could make it more difficult for Ciner Wyoming to retain its existing customers and attract new customers, and could also intensify the negative impact of factors that decrease demand for soda ash in the markets it serves, such as adverse economic conditions, weather, higher fuel costs and taxes or other governmental or regulatory actions that directly or indirectly increase the cost or limit the use of soda ash.
The construction aggregates industry is highly competitive and fragmented with a large number of independent local producers operating in the local markets we serve. Additionally, our construction aggregates business also competes against large private and public companies, some of which are significantly vertically integrated. This significant competition could lead to lower prices and lower sales volumes in some markets, negatively affecting our earnings and cash flows.
Title to Property
We own a significant percentage of our coal and aggregates reserves in fee as of December 31,
2017
. We lease the remainder from unaffiliated third parties, including leasing aggregates reserves for Construction Aggregates' construction materials business. Ciner Wyoming also leases or licenses its trona reserves. We believe that we have satisfactory title to all of our mineral properties, but we have not had a qualified title company confirm this belief. Although title to these properties is subject to encumbrances in certain cases, such as customary easements, rights-of-way, interests generally retained in connection with the acquisition of real property, licenses, prior reservations, leases, liens, restrictions and other encumbrances, we believe that none of these burdens will materially detract from the value of our properties or from our interest in them or will materially interfere with their use in the operation of our business.
For most of our properties, the surface, oil and gas and mineral or coal estates are not owned by the same entities. Some of those entities are our affiliates. State law and regulations in most of the states where we do business require the oil and gas owner to coordinate the location of wells so as to minimize the impact on the intervening coal seams. We do not anticipate that the existence of the severed estates will materially impede development of the minerals on our properties.
Regulation and Environmental Matters
General
Operations on our properties must be conducted in compliance with all applicable federal, state and local laws and regulations. These laws and regulations include matters involving the discharge of materials into the environment, employee health and safety, mine permits and other licensing requirements, reclamation and restoration of mining properties after mining is completed, management of materials generated by mining operations, surface subsidence from underground mining, water pollution, legislatively mandated benefits for current and retired coal miners, air quality standards, protection of wetlands, plant and wildlife protection, limitations on land use, storage of petroleum products and substances which are regarded as hazardous under applicable laws and management of electrical equipment containing polychlorinated biphenyls (PCBs). Because of extensive, comprehensive and often ambiguous regulatory requirements, violations during natural resource extraction operations are not unusual and, notwithstanding compliance efforts, we do not believe violations can be eliminated entirely.
While it is not possible to quantify the costs of compliance with all applicable federal, state and local laws and regulations, those costs have been and are expected to continue to be significant. Our lessees in our coal and aggregates royalty businesses are required to post performance bonds pursuant to federal and state mining laws and regulations for the estimated costs of reclamation and mine closures, including the cost of treating mine water discharge when necessary. In many states our lessees also pay taxes into reclamation funds that states use to achieve reclamation where site specific performance bonds are inadequate to do so. Determinations by federal or state agencies that site specific bonds or state reclamation funds are inadequate could result in increased bonding costs for our lessees or even a cessation of operations if adequate levels of bonding cannot be maintained. We do not accrue for reclamation costs because our lessees are both contractually liable and liable under the permits they hold for all costs relating to their mining operations, including the costs of reclamation and mine closures. Although the lessees typically accrue adequate amounts for these costs, their future operating results would be adversely affected if they later determined these accruals to be insufficient. In recent years, compliance with these laws and regulations has substantially increased the cost of coal mining for all domestic coal producers.
19
In addition, the electric utility industry, which is the most significant end-user of thermal coal, is subject to extensive regulation regarding the environmental impact of its power generation activities, which has affected and is expected to continue to affect demand for coal mined from our properties. Current and future proposed legislation and regulations could be adopted that will have a significant additional impact on the mining operations of our lessees or their customers’ ability to use coal and may require our lessees or their customers to change operations significantly or incur additional substantial costs that would negatively impact the coal industry.
Many of the statutes discussed below also apply to our Construction Aggregates mining and production operations and Ciner Wyoming’s trona mining and soda ash production operations, and therefore we do not present a separate discussion of statutes related to those activities, except where appropriate.
Air Emissions
The Clean Air Act and corresponding state and local laws and regulations affect all aspects of our business. The Clean Air Act directly impacts our lessees’ coal mining and processing operations by imposing permitting requirements and, in some cases, requirements to install certain emissions control equipment, on sources that emit various hazardous and non-hazardous air pollutants. The Clean Air Act also indirectly affects coal mining operations by extensively regulating the air emissions of coal-fired electric power generating plants. There have been a series of federal rulemakings that are focused on emissions from coal-fired electric generating facilities, including the Cross-State Air Pollution Rule (CSAPR), regulating emissions of nitrogen oxide and sulfur dioxide, and the Mercury and Air Toxics Rule (MATS), regulating emissions of hazardous air pollutants. Installation of additional emissions control technologies and other measures required under these and other U.S. Environmental Protection Agency (EPA) regulations, including EPA’s proposed rules to regulate greenhouse gas (GHG) emissions from new and existing fossil fuel-fired power plants, will make it more costly to operate coal-fired power plants and could make coal a less attractive or even effectively prohibited fuel source in the planning, building and operation of power plants in the future. These rules and regulations have resulted in a reduction in coal’s share of power generating capacity, which has negatively impacted our lessees’ ability to sell coal and our coal-related revenues. Further reductions in coal’s share of power generating capacity as a result of compliance with existing or proposed rules and regulations would have a material adverse effect on our coal-related revenues.
Carbon Dioxide and Greenhouse Gas Emissions
In December 2009, EPA determined that emissions of carbon dioxide, methane, and other GHGs present an endangerment to public health and welfare because emissions of such gases are, according to EPA, contributing to warming of the Earth’s atmosphere and other climatic changes. Based on its findings, EPA began adopting and implementing regulations to restrict emissions of GHGs under various provisions of the Clean Air Act.
In August 2015, EPA published its final Clean Power Plan Rule, a multi-factor plan designed to cut carbon pollution from existing power plants, including coal-fired power plants. The rule requires improving the heat rate of existing coal-fired power plants and substituting lower carbon-emission sources like natural gas and renewables in place of coal. As promulgated, the rule would force many existing coal-fired power plants to incur substantial costs in order to comply or alternatively result in the closure of some of these plants, likely resulting in a material adverse effect on the demand for coal by electric power generators. The rule is being challenged by several states, industry participants and other parties in the United States Court of Appeals for the District of Columbia Circuit. In February 2016, the Supreme Court of the United States stayed the Clean Power Plan Rule pending a decision by the District of Columbia Circuit as well as any subsequent review by the Supreme Court. In April 2017, the United States Court of Appeals for the District of Columbia Circuit granted EPA’s motion to hold the litigation in abeyance. In December 2017, EPA issued a proposed rule repealing the Clean Power Plan Rule and issued an Advance Notice of Proposed Rulemaking soliciting information regarding a potential replacement rule to the Clean Power Plan Rule.
In October 2015, EPA published its final rule on performance standards for greenhouse gas emissions from new, modified, and reconstructed electric generating units. The final rule requires new steam generating units to use highly efficient supercritical pulverized coal boilers that use partial post-combustion carbon capture and storage technology. The final emission standard is less stringent than EPA had originally proposed due to updated cost assumptions, but could still have a material adverse effect on new coal-fired power plants. The final rule has been challenged by several states, industry participants and other parties in the United States Court of Appeals for the District of Columbia Circuit, but is not subject to a stay. In April 2017, the court granted EPA’s motion to hold the litigation in abeyance while EPA reviews the rule.
20
President Obama also announced an emission reduction agreement with China’s President Xi Jinping in November 2014. The United States pledged that by 2025 it would cut climate pollution by 26 to 28% from 2005 levels. China pledged it would reach its peak carbon dioxide emissions around 2030 or earlier, and increase its non-fossil fuel share of energy to around 20% by 2030. In December 2015, the United States was one of 196 countries that participated in the Paris Climate Conference, at which the participants agreed to limit their emissions in order to limit global warming to 2°C above pre-industrial levels, with an aspirational goal of 1.5°C. While there is no way to estimate the impact of these climate pledges and agreements, they could ultimately have an adverse effect on the demand for coal, both nationally and internationally, if implemented. President Trump has expressed a desire for the United States to withdraw from the Paris Climate Agreement or to re-negotiate its terms.
EPA has also adopted rules requiring the reporting of GHG emissions from specified large GHG emission sources in the United States, including coal-fired electric power plants, on an annual basis.
Hazardous Materials and Waste
The Federal Comprehensive Environmental Response, Compensation and Liability Act (CERCLA or the Superfund law) and analogous state laws impose liability, without regard to fault or the legality of the original conduct, on certain classes of persons that are considered to have contributed to the release of a “hazardous substance” into the environment. We could become liable under federal and state Superfund and waste management statutes if our lessees are unable to pay environmental cleanup costs relating to hazardous substances. In addition, we may have liability for environmental clean-up costs in connection with our Construction Aggregates and Ciner Wyoming soda ash businesses.
Water Discharges
Operations conducted on our properties can result in discharges of pollutants into waters. The Clean Water Act and analogous state laws and regulations create two permitting programs for mining operations. The National Pollutant Discharge Elimination System (NPDES) program under Section 402 of the statute is administered by the states or EPA and regulates the concentrations of pollutants in discharges of waste and storm water from a mine site. The Section 404 program is administered by the Army Corps of Engineers and regulates the placement of overburden and fill material into channels, streams and wetlands that comprise “waters of the United States.” The scope of waters that may fall within the jurisdictional reach of the Clean Water Act is expansive and may include land features not commonly understood to be a stream or wetlands. In June 2015, EPA issued a new rule defining the scope of “Waters of the United States” (WOTUS) that are subject to regulation. The WOTUS rule was challenged by a number of states and private parties in federal district and circuit courts, and the rule was stayed on a nationwide basis by the Sixth Circuit Court of Appeals in October 2015. In January 2018, the United States Supreme Court ruled that challenges to the WOTUS rule are properly within the jurisdiction of the federal district courts rather than the Sixth Circuit or other federal appellate courts. In light of the Supreme Court's ruling, the nationwide stay will likely be lifted, which could result in further district court litigation regarding stays of the rule in districts where challenges to the rule have been filed. A challenge to the Sixth Circuit’s determination that it has exclusive jurisdiction over the matter is currently before the Supreme Court of the United States. In December 2017, EPA and the Corps proposed a rule to repeal the WOTUS rule and are scheduled to propose a replacement to the WOTUS rule in May 2018. The Clean Water Act and its regulations prohibit the unpermitted discharge of pollutants into such waters, including those from a spill or leak. Similarly, Section 404 also prohibits discharges of fill material and certain other activities in waters unless authorized by the issued permit.
In connection with its review of permits, EPA has at times sought to reduce the size of fills and to impose limits on specific conductance (conductivity) and sulfate at levels that can be unachievable absent treatment at many mines. Such actions by EPA could make it more difficult or expensive to obtain or comply with such permits, which could, in turn, have an adverse effect on our coal-related revenues.
In addition to government action, private citizens’ groups have continued to be active in bringing lawsuits against operators and landowners. Since 2012, several citizen group lawsuits have been filed against mine operators for allegedly violating conditions in their National Pollutant Discharge Elimination System (“NPDES”) permits requiring compliance with West Virginia’s water quality standards. Some of the lawsuits allege violations of water quality standards for selenium, whereas others allege that discharges of conductivity and sulfate are causing violations of West Virginia’s narrative water quality standards, which generally prohibit adverse effects to aquatic life. The citizen suit groups have sought penalties as well as injunctive relief that would limit future discharges of selenium, conductivity or sulfate. The federal district court for the Southern District of West Virginia has ruled in favor of the citizen suit groups in multiple suits alleging violations of the water quality standard for selenium and in two suits alleging violations of water quality standards due to discharges of conductivity (one of which was upheld on appeal by the United
21
States Court of Appeals for the Fourth Circuit in January 2017). Additional rulings requiring operators to reduce their discharges of selenium, conductivity or sulfate could result in large treatment expenses for our lessees.
Since 2013, several citizen group lawsuits have been filed against landowners alleging ongoing discharges of pollutants, including selenium and conductivity, from valley fills located at reclaimed mountaintop removal mining sites in West Virginia. In each case, the mine on the subject property has been closed, the property has been reclaimed, and the state reclamation bond has been released. Any determination that a landowner or lessee has liability for discharges from a previously reclaimed mine site could result in substantial compliance costs or fines and would result in uncertainty as to continuing liability for completed and reclaimed coal mine operations.
Other Regulations Affecting the Mining Industry
Mine Health and Safety Laws
The operations of our coal lessees, our Construction Aggregates business, and Ciner Wyoming are subject to stringent health and safety standards that have been imposed by federal legislation since the adoption of the Mine Health and Safety Act of 1969. The Mine Health and Safety Act of 1969 resulted in increased operating costs and reduced productivity. The Mine Safety and Health Act of 1977, which significantly expanded the enforcement of health and safety standards of the Mine Health and Safety Act of 1969, imposes comprehensive health and safety standards on all mining operations. In addition, the Black Lung Acts require payments of benefits by all businesses conducting current mining operations to coal miners with black lung or pneumoconiosis and to some beneficiaries of miners who have died from this disease.
Mining accidents in recent years have received national attention and instigated responses at the state and national level that have resulted in increased scrutiny of current safety practices and procedures at all mining operations, particularly underground mining operations. Since 2006, heightened scrutiny has been applied to the safe operations of both underground and surface mines. This increased level of review has resulted in an increase in the civil penalties that mine operators have been assessed for non-compliance. Operating companies and their supervisory employees have also been subject to criminal convictions. The Mine Safety and Health Administration (MSHA) has also advised mine operators that it will be more aggressive in placing mines in the Pattern of Violations program, if a mine’s rate of injuries or significant and substantial citations exceed a certain threshold. A mine that is placed in a Pattern of Violations program will receive additional scrutiny from MSHA.
Surface Mining Control and Reclamation Act of 1977
The Surface Mining Control and Reclamation Act of 1977 (SMCRA) and similar statutes enacted and enforced by the states impose on mine operators the responsibility of reclaiming the land and compensating the landowner for types of damages occurring as a result of mining operations. To ensure compliance with any reclamation obligations, mine operators are required to post performance bonds. Our coal lessees are contractually obligated under the terms of our leases to comply with all federal, state and local laws, including SMCRA. Upon completion of the mining, reclamation generally is completed by seeding with grasses or planting trees for use as pasture or timberland, as specified in the reclamation plan approved by the state regulatory authority. In addition, higher and better uses of the reclaimed property are encouraged.
Mining Permits and Approvals
Numerous governmental permits or approvals such as those required by SMCRA and the Clean Water Act are required for mining operations. In connection with obtaining these permits and approvals, our lessees may be required to prepare and present to federal, state or local authorities data pertaining to the effect or impact that any proposed production of coal may have upon the environment. The requirements imposed by any of these authorities may be costly and time consuming and may delay commencement or continuation of mining operations.
In order to obtain mining permits and approvals from state regulatory authorities, mine operators, including our lessees, must submit a reclamation plan for reclaiming the mined property upon the completion of mining operations. Our lessees have obtained or applied for permits to mine a majority of the reserves that are currently planned to be mined over the next five years. Our lessees are also in the planning phase for obtaining permits for the additional reserves planned to be mined over the following five years. However, given the imposition of new requirements in the permits in the form of policies and the increased oversight review that has been exercised by EPA, there are no assurances that they will not experience difficulty and delays in obtaining mining permits
22
in the future. In addition, EPA has used its authority to create significant delays in the issuance of new permits and the modification of existing permits, which has led to substantial delays and increased costs for coal operators.
Regulations under SMCRA include a “stream buffer zone” rule that prohibits certain mining activities near streams. In 2008, the federal Office of Surface Mining (OSM), which implements SMCRA, revised the stream buffer zone rule, making it more clear that valley fills are not prohibited by the rule. Environmental groups challenged the revision to the buffer zone rule in federal court. In February 2014, the federal court vacated the 2008 rule and in December 2014, OSM reinstated the previous version of the rule, without clarifying whether the previous version of the rule impacts the ability to construct excess fills. In December 2016, OSM finalized the “Stream Protection Rule,” a re-written version of the stream buffer zone rule which requires coal operators to restrict mining within 100 feet of waterways. The rule also requires states to impose additional information gathering and monitoring at and around coal mining sites and mandates new financial assurance and reclamation requirements. The rule was repealed by Congress in February 2017; however, to the extent the rule is ever reinstated, it could restrict our lessees’ ability to develop new mines, or could require our lessees to modify existing operations, which could have an adverse effect on our coal-related revenues.
Employees and Labor Relations
As of December 31, 2017, affiliates of our general partner employed 64 people who directly supported our operations. None of these employees were subject to a collective bargaining agreement. We employed 243 people who supported the construction aggregates mining and production operations. None of these employees were subject to a collective bargaining agreement.
Website Access to Partnership Reports
Our Internet address is www.nrplp.com. We make available free of charge on or through our Internet website our Annual Report on Form 10-K, Quarterly Reports on Form 10-Q, Current Reports on Form 8-K and amendments to those reports filed or furnished pursuant to Section 13(a) or 15(d) of the Securities Exchange Act of 1934 as soon as reasonably practicable after we electronically file such material with, or furnish it to, the Securities and Exchange Commission. Information on our website is not a part of this report. In addition, the SEC maintains an Internet site at www.sec.gov that contains reports, proxy and information statements and other information filed by us. The public may read and copy materials that we file with the SEC at the SEC’s Public Reference Room located at 100 F Street, NE, Washington, DC 20549. Information regarding the operation of the Public Reference Room can be obtained by calling the SEC at 1‑800‑SEC‑0330.
Corporate Governance Matters
Our Code of Business Conduct and Ethics, our Disclosure Controls and Procedures Policy and our Corporate Governance Guidelines adopted by our Board of Directors, as well as the charter for our Audit Committee are available on our website at www.nrplp.com. Copies of our annual report, our Code of Business Conduct and Ethics, our Disclosure Controls and Procedures Policy, our Corporate Governance Guidelines and our committee charters will be made available upon written request to our principal executive office at 1201 Louisiana St., Suite 3400, Houston, Texas 77002.
23
Risks Related to Our Business
To the extent our board of directors deems appropriate, it may determine to decrease the amount of our quarterly distribution or suspend or eliminate the distribution altogether. In addition, our debt agreements and our partnership agreement place restrictions on our ability to pay the quarterly distribution under certain circumstances.
Because distributions on the common units are dependent on the amount of cash we generate, distributions fluctuate based on our performance. The actual amount of cash that is available to be distributed each quarter depends on numerous factors, some of which are beyond our control and the control of the general partner. Cash distributions are dependent primarily on cash flow, and not solely on profitability, which is affected by non-cash items. Therefore, cash distributions might be made during periods when we record losses and might not be made during periods when we record profits. The actual amount of cash we have to distribute each quarter is reduced by payments in respect of debt service and other contractual obligations, including distributions on the preferred units, fixed charges, maintenance capital expenditures and reserves for future operating or capital needs that the board of directors may determine are appropriate. We still have significant debt service obligations and obligations to pay cash distributions on our preferred units. To the extent our board of directors deems appropriate, it may determine to decrease the amount of the quarterly distribution on our common units or suspend or eliminate the distribution on our common units altogether. In addition, because our unitholders are required to pay income taxes on their respective shares of our taxable income, our unitholders may be required to pay taxes in excess of any future distributions we make. Our unitholders' share of our portfolio income may be taxable to them even though they receive other losses from our activities. See "—Tax Risks to Our Unitholders—Our unitholders are required to pay taxes on their share of our income even if they do not receive any cash distributions from us. Our unitholders' share of our portfolio income may be taxable to them even though they receive other losses from our activities."
The agreements governing our indebtedness and preferred units restrict our ability to raise, and in some cases continue to pay, distributions on our common units. Opco’s revolving credit agreement, the indenture governing our 2022 Notes and our partnership agreement each require that we meet certain consolidated leverage tests in order to raise our quarterly distribution on the common units above the current level of $0.45 per quarter. The maximum leverage covenant under Opco’s revolving credit facility will step down permanently from 4.0x to 3.0x if we increase the common unit distribution above the current level. In addition, under our partnership agreement, to the extent we have paid any distributions on the preferred units in kind ("PIK units"), and such PIK units are still outstanding at any time after January 1, 2022, we will be prohibited from making any distributions with respect to our common units until we have redeemed all such PIK units in cash. For more information on restrictions on our ability to make distributions on our common units, see "Management’s Discussion and Analysis of Financial Condition and Results of Operations—Liquidity and Capital Resources" and "Item 8. Financial Statements and Supplementary Data—
Note 13. Debt
."
Our leverage and debt service obligations may adversely affect our financial condition, results of operations and business prospects.
As of December 31,
2017
, we and our subsidiaries had approximately
$827.8 million
of total indebtedness. The terms and conditions governing the indenture for NRP’s 2022 Notes and Opco’s revolving credit facility and senior notes:
|
•
|
require us to meet certain leverage and interest coverage ratios;
|
|
•
|
require us to dedicate a substantial portion of our cash flow from operations to service our existing debt, thereby reducing the cash available to finance our operations and other business activities and could limit our flexibility in planning for or reacting to changes in our business and the industries in which we operate;
|
|
•
|
increase our vulnerability to economic downturns and adverse developments in our business;
|
|
•
|
limit our ability to access the bank and capital markets to raise capital on favorable terms or to obtain additional financing for working capital, capital expenditures or acquisitions or to refinance existing indebtedness;
|
|
•
|
place restrictions on our ability to obtain additional financing, make investments, lease equipment, sell assets and engage in business combinations;
|
24
|
•
|
place us at a competitive disadvantage relative to competitors with lower levels of indebtedness in relation to their overall size or less restrictive terms governing their indebtedness;
|
|
•
|
make it more difficult for us to satisfy our obligations under our debt agreements and increase the risk that we may default on our debt obligations; and
|
|
•
|
limit management’s discretion in operating our business.
|
Our ability to meet our expenses and debt obligations will depend on our future performance, which will be affected by financial, business, economic, regulatory and other factors. We will not be able to control many of these factors, such as economic conditions and governmental regulation. We cannot be certain that our cash flow will be sufficient to allow us to pay the principal and interest on our debt and meet our other obligations, including payment of distributions on the preferred units. If we do not have sufficient funds, we may be required to refinance all or part of our existing debt, borrow more money, or sell assets or raise equity at unattractive prices. We are required to make substantial principal repayments each year in connection with Opco’s senior notes, with approximately $81 million due thereunder during 2018. To the extent we borrow to make some of these payments, we may not be able to refinance these amounts on terms acceptable to us, if at all. We may not be able to refinance our debt, sell assets, borrow more money or access the bank and capital markets on terms acceptable to us, if at all. Our ability to comply with the financial and other restrictive covenants in our debt agreements will be affected by the levels of cash flow from our operations and future events and circumstances beyond our control. Failure to comply with these covenants would result in an event of default under our indebtedness, and such an event of default could adversely affect our business, financial condition and results of operations.
Ongoing disputes with Foresight Energy could have an adverse effect on our financial condition and results of operations. In addition, if the Deer Run mine remains idled for an extended period or does not resume operations, our financial condition and results of operations could be adversely affected.
Foresight Energy is our largest lessee, and in 2017, we derived approximately
19%
of our revenues from them. We are currently in disputes with them with respect to two of their four mining operations in which we have an interest. Foresight Energy’s Deer Run mine (which we also refer to as our Hillsboro property) has been idled for almost three years. Foresight Energy has declared a force majeure event at the Deer Run mine and failed to make
$76.0 million
in required minimum deficiency payments to us as of the date hereof. Such amount is expected to increase by $7.5 million for each quarter with respect to which Foresight Energy fails to make the required minimum payment. We have a lawsuit pending against Foresight Energy and Hillsboro Energy to recover the amounts owed to us and compel them to make the required minimum deficiency payments under the lease. We do not currently have an estimate as to when the mine will resume coal production. If the mine remains idled for an extended period, if the mine is permanently closed or if Hillsboro continues to fail to pay its required contractual minimums, our financial condition could be adversely affected.
In addition, we have also filed a lawsuit against Foresight Energy’s Macoupin subsidiary, which has failed to comply with the terms of the coal mining, rail loadout and rail loop leases at the Macoupin mine by incorrectly recouping previously paid minimum royalties. The amount owed to us by Macoupin through December 31, 2017 is approximately
$9.5 million
. See "Item 3. Legal Proceedings" included elsewhere in this Annual Report on Form 10-K for more information on our lawsuits against Foresight Energy. These ongoing disputes and further deterioration of our relationship with our largest lessee could have a material adverse effect on our financial condition and results of operations.
Prices for both metallurgical and thermal coal are volatile and depend on a number of factors beyond our control. Declines in prices could have a material adverse effect on our business and results of operations.
Coal prices remain at relatively low levels and continue to be volatile. Although metallurgical coal prices have improved since 2016 lows, the current pricing environment may not be sustained, and prices could decline substantially. Thermal coal prices remain relatively steady, but production by some of our lessees may not be economic if the prices decline further or remain at current levels. The prices our lessees receive for their coal depend upon factors beyond their or our control, including:
|
•
|
the supply of and demand for domestic and foreign coal;
|
|
•
|
domestic and foreign governmental regulations and taxes;
|
|
•
|
changes in fuel consumption patterns of electric power generators;
|
|
•
|
the price and availability of alternative fuels, especially natural gas;
|
25
|
•
|
global economic conditions, including the strength of the U.S. dollar relative to other currencies and the demand for steel;
|
|
•
|
the proximity to and capacity of transportation facilities;
|
|
•
|
weather conditions; and
|
|
•
|
the effect of worldwide energy conservation measures.
|
Natural gas is the primary fuel that competes with thermal coal for power generation. Relatively low natural gas prices have resulted in a number of utilities switching from thermal coal to natural gas to the extent that it is practical to do so. This switching has resulted in a decline in thermal coal prices, and to the extent that natural gas prices remain low, thermal coal prices will also remain low. The closure of coal-fired power plants as a result of increased governmental regulations or the inability to comply with such regulations has also resulted in a decrease in the demand for thermal coal.
Our lessees produce a significant amount of the metallurgical coal that is used in both the U.S. and foreign steel industries. Since the amount of steel that is produced is tied to global economic conditions, declines in those conditions could result in the decline of steel, coke and metallurgical coal production. Since metallurgical coal is priced higher than thermal coal, some mines on our properties may only operate profitably if all or a portion of their production is sold as metallurgical coal. If these mines are unable to sell metallurgical coal, they may not be economically viable and may be temporarily idled or closed. Any potential future lessee bankruptcy filings could create additional uncertainty as to the future of operations on our properties and could have a material adverse effect on our business and results of operations.
To the extent our lessees are unable to economically produce coal over the long term, the carrying value of our reserves could be adversely affected. A long term asset generally is deemed impaired when the future expected cash flow from its use and disposition is less than its book value. Future impairment analyses could result in additional downward adjustments to the carrying value of our assets.
Mining operations are subject to operating risks that could result in lower revenues to us.
Our revenues are largely dependent on the level of production of minerals from our properties, and any interruptions to the production from our properties would reduce our revenues. The level of production is subject to operating conditions or events beyond our or our lessees’ control including:
|
•
|
the inability to acquire necessary permits or mining or surface rights;
|
|
•
|
changes or variations in geologic conditions, such as the thickness of the mineral deposits and, in the case of coal, the amount of rock embedded in or overlying the coal deposit;
|
|
•
|
mining and processing equipment failures and unexpected maintenance problems;
|
|
•
|
the availability of equipment or parts and increased costs related thereto;
|
|
•
|
the availability of transportation facilities and interruptions due to transportation delays;
|
|
•
|
adverse weather and natural disasters, such as heavy rains and flooding;
|
|
•
|
labor-related interruptions; and
|
|
•
|
unexpected mine safety accidents, including fires and explosions.
|
Under the current regulatory environment, there is substantial uncertainty relating to the ability of our coal lessees to be issued permits necessary to conduct mining operations. The non-issuance of permits has limited the ability of our coal lessees to open new operations, expand existing operations, and may preclude new acquisitions in which we might otherwise be involved. We and our lessees may also incur costs and liabilities resulting from claims for damages to property or injury to persons arising from our or their operations. If we or our lessees are pursued for these sanctions, costs and liabilities, mining operations and, as a result, our revenues could be adversely affected.
The Construction Aggregates segment currently operates four hard rock quarries, one underground limestone mine, six sand and gravel plants, two asphalt plants and two marine terminals. As an operator of these assets, we are exposed to risks that we have not historically been exposed to in our mineral rights and royalties business. Such risks include, but are not limited to, prices and demand for construction aggregates, capital and operating expenses necessary to maintain operations, production levels, general
26
economic conditions, conditions in the local markets that we serve, inclement or hazardous weather conditions and typically lower production levels in the winter months, permitting risk, fire, explosions or other accidents, and unanticipated geologic conditions. Any of these risks could result in damage to, or destruction of, our construction aggregates mining properties or production facilities, personal injury, environmental damage, delays in mining or processing, reduced revenue or losses or possible legal liability. In addition, not all of these risks are reasonably insurable, and our insurance coverage contains limits, deductibles, exclusions and endorsements. Our insurance coverage may not be sufficient to meet our needs in the event of loss. Any prolonged downtime or shutdowns at our construction aggregates mining properties or production facilities or material loss could have an adverse effect on our results of operations.
Changes in fuel consumption patterns by electric power generators resulting in a decrease in the use of coal have resulted in and will continue to result in lower coal production by our lessees and reduced coal-related revenues.
The amount of coal consumed for domestic electric power generation is affected primarily by the overall demand for electricity, the price and availability of competing fuels for power plants and environmental and other governmental regulations. We expect that substantially all newly constructed power plants in the United States will be fired by natural gas because of lower construction and compliance costs compared to coal-fired plants and because natural gas is a cleaner burning fuel. The increasingly stringent requirements of rules and regulations promulgated under the federal Clean Air Act have resulted in more electric power generators shifting from coal to natural-gas-fired power plants, or to other alternative energy sources such as solar and wind. In addition, the proposed rules promulgated by the EPA on greenhouse gas emissions from new and existing power plants are expected to further limit the construction of new coal-fired generation plants in favor of alternative sources of energy and negatively affect the viability of coal-fired power generation. These changes have resulted in reduced coal consumption and the production of coal from our properties and are expected to continue to have an adverse effect on our coal-related revenues.
The adoption of climate change legislation or regulations restricting emissions of "greenhouse gases" and other hazardous air pollutants have resulted in and will continue to result in reduced demand for our coal, oil and natural gas.
In December 2009, EPA determined that emissions of carbon dioxide, methane, and other GHGs, present an endangerment to public health and welfare because emissions of such gases are, according to EPA, contributing to warming of the Earth’s atmosphere and other climatic changes. Based on its findings, EPA has begun adopting and implementing regulations to restrict emissions of GHGs under various provisions of the Clean Air Act.
In August 2015, EPA published its final Clean Power Plan Rule, a multi-factor plan designed to cut carbon pollution from existing power plants, including coal-fired power plants. The rule requires improving the heat rate of existing coal-fired power plants and substituting lower carbon-emission sources like natural gas and renewables in place of coal. The rule will force many existing coal-fired power plants to incur substantial costs in order to comply or alternatively result in the closure of some of these plants. This rule is being challenged by industry participants and other parties. In February, 2016, the Supreme Court of the United States stayed the Clean Power Plan Rule pending a decision by the District of Columbia Circuit as well as any subsequent review by the Supreme Court.
In October 2015, EPA published its final rule on performance standards for greenhouse gas emissions from new, modified, and reconstructed electric generating units. The final rule requires new steam generating units to use highly efficient supercritical pulverized coal boilers that use partial post-combustion carbon capture and storage technology. The final emission standard is less stringent than EPA had originally proposed due to updated cost assumptions, but could still have a material adverse effect on new coal-fired power plants. The final rule has been challenged by several states, industry participants and other parties in the United States Court of Appeals for the District of Columbia Circuit, but is not subject to a stay. Oral arguments are currently scheduled for April 2017.
In addition to EPA’s GHG initiatives, there are several other federal rulemakings that are focused on emissions from coal-fired electric generating facilities, including the Cross-State Air Pollution Rule (CSAPR), regulating emissions of nitrogen oxide and sulfur dioxide, and the Mercury and Air Toxics Rule (MATS), regulating emissions of hazardous air pollutants. Installation of additional emissions control technologies and other measures required under these and other EPA regulations have made it more costly to operate many coal-fired power plants and have resulted in and are expected to continue to result in plant closures. Further reductions in coal’s share of power generating capacity as a result of compliance with existing or proposed rules and regulations would have a material adverse effect on our coal-related revenues.
27
In addition to climate change and other Clean Air Act legislation, our businesses are subject to numerous other federal, state and local laws and regulations that may limit production from our properties and our profitability.
The operations of our lessees, our Construction Aggregates business and Ciner Wyoming are subject to stringent health and safety standards under increasingly strict federal, state and local environmental, health and safety laws, including mine safety regulations and governmental enforcement policies. The oil and gas industry is also subject to numerous laws and regulations. Failure to comply with these laws and regulations may result in the assessment of administrative, civil and criminal penalties, the imposition of cleanup and site restoration costs and liens, the issuance of injunctions to limit or cease operations, the suspension or revocation of permits and other enforcement measures that could have the effect of limiting production from our properties.
New environmental legislation, new regulations and new interpretations of existing environmental laws, including regulations governing permitting requirements, could further regulate or tax the mining and oil and gas industries and may also require significant changes to operations, the incurrence of increased costs or the requirement to obtain new or different permits, any of which could decrease our revenues and have a material adverse effect on our financial condition or results of operations. Under SMCRA, our coal lessees have substantial reclamation obligations on properties where mining operations have been completed and are required to post performance bonds for their reclamation obligations. To the extent an operator is unable to satisfy its reclamation obligations or the performance bonds posted are not sufficient to cover those obligations, regulatory authorities or citizens groups could attempt to shift reclamation liability onto the ultimate landowner, which if successful, could have a material adverse effect on our financial condition.
In addition to governmental regulation, private citizens’ groups have continued to be active in bringing lawsuits against coal mine operators and land owners that allege violations of water quality standards resulting from ongoing discharges of pollutants from reclaimed mining operations, including selenium and conductivity. Any determination that a landowner or lessee has liability for discharges from a previously reclaimed mine site would result in uncertainty as to continuing liability for completed and reclaimed coal mine operations and could result in substantial compliance costs or fines.
Prices for soda ash are volatile. Any substantial or extended decline in soda ash prices could have an adverse effect on our results of operations.
The market price of soda ash directly affects the profitability of Ciner Wyoming’s soda ash production operations. If the market price for soda ash declines, Ciner Wyoming’s sales will decrease. Historically, the global market and, to a lesser extent, the domestic market for soda ash have been volatile, and those markets are likely to remain volatile in the future. The prices Ciner Wyoming receives for its soda ash depend on numerous factors beyond Ciner Wyoming’s control, including worldwide and regional economic and political conditions impacting supply and demand. Glass manufacturers and other industrial customers drive most of the demand for soda ash, and these customers experience significant fluctuations in demand and production costs. Competition from increased use of glass substitutes, such as plastic and recycled glass, has had a negative effect on demand for soda ash. Substantial or extended declines in prices for soda ash could have a material adverse effect on our results of operations. In addition, Ciner Wyoming relies on natural gas as the main energy source in its soda ash production process. Accordingly, high natural gas prices increase Ciner Wyoming’s cost of production and affect its competitive cost position when compared to other foreign and domestic soda ash producers.
An adverse outcome in our contingent consideration payment dispute with Anadarko could have an adverse effect on our business and liquidity.
In July 2017, Anadarko Holding Company and its subsidiary, Big Island Trona Company (together, “Anadarko”) filed a lawsuit against Opco and NRP Trona LLC alleging that a July 2013 simplification of OCI Wyoming’s ownership structure triggered an acceleration of an obligation under the purchase agreement with Anadarko to pay additional contingent consideration in full and demanded immediate payment of such amount, together with interest, court costs and attorneys’ fees. While this matter is in the very early stages, we would be required to pay up to $40 million, plus interest, court costs and attorneys’ fees if Anadarko prevails and is awarded the full damages it seeks. Any such payment could have a material adverse effect on our financial condition. For more information, see “Item 3. Legal Proceedings—Anadarko Contingent Consideration Payment Dispute.”
28
The Construction Aggregates segment operates in a highly competitive and fragmented industry, which may negatively impact prices, volumes and costs. In addition, both commercial and residential construction are dependent upon the overall U.S. economy.
The construction aggregates industry is highly fragmented with a large number of independent local producers operating in local markets. Additionally, our construction aggregates business also competes against large private and public companies, some of which are significantly vertically integrated. Therefore, there is intense competition in a number of markets in which the construction aggregates business operates. This significant competition could lead to lower prices and lower sales volumes in some markets, negatively affecting our earnings and cash flows.
In addition, commercial and residential construction levels generally move with economic cycles. When the economy is strong, construction levels rise and when the economy is weak, construction levels fall. The U.S. economy is recovering from the 2008-2009 recession, but the pace of recovery is slow. Since construction activity generally lags the recovery after down cycles, construction projects have not returned to their pre-recession levels.
If our lessees do not manage their operations well, their production volumes and our royalty revenues could decrease.
We depend on our lessees to effectively manage their operations on our properties. Our lessees make their own business decisions with respect to their operations within the constraints of their leases, including decisions relating to:
|
•
|
the payment of minimum royalties;
|
|
•
|
marketing of the minerals mined;
|
|
•
|
mine plans, including the amount to be mined and the method of mining;
|
|
•
|
processing and blending minerals;
|
|
•
|
expansion plans and capital expenditures;
|
|
•
|
credit risk of their customers;
|
|
•
|
permitting;
|
|
•
|
insurance and surety bonding;
|
|
•
|
acquisition of surface rights and other mineral estates;
|
|
•
|
employee wages;
|
|
•
|
transportation arrangements;
|
|
•
|
compliance with applicable laws, including environmental laws; and
|
|
•
|
mine closure and reclamation.
|
A failure on the part of one of our lessees to make royalty payments, including minimum royalty payments, could give us the right to terminate the lease, repossess the property and enforce payment obligations under the lease. If we repossessed any of our properties, we would seek a replacement lessee. We might not be able to find a replacement lessee and, if we did, we might not be able to enter into a new lease on favorable terms within a reasonable period of time. In addition, the existing lessee could be subject to bankruptcy proceedings that could further delay the execution of a new lease or the assignment of the existing lease to another operator. If we enter into a new lease, the replacement operator might not achieve the same levels of production or sell minerals at the same price as the lessee it replaced. In addition, it may be difficult for us to secure new or replacement lessees for small or isolated mineral reserves.
29
We have limited control over the activities on our properties that we do not operate and are exposed to operating risks that we do not experience in the royalty business.
We do not have control over the operations of Ciner Wyoming. We have limited approval rights with respect to Ciner Wyoming, and our partner controls most business decisions, including decisions with respect to distributions and capital expenditures. Adverse developments in Ciner Wyoming’s business would result in decreased distributions to NRP. In addition, we are ultimately responsible for operating the transportation infrastructure at Foresight Energy’s Williamson mine, and have assumed the capital and operating risks associated with that business. As a result of these investments, we could experience increased costs as well as increased liability exposure associated with operating these facilities.
Fluctuations in transportation costs and the availability or reliability of transportation could reduce the production of coal, soda ash, construction aggregates, and other minerals from our properties.
Transportation costs represent a significant portion of the total delivered cost for the customers of our lessees. Increases in transportation costs could make coal a less competitive source of energy or could make minerals produced by some or all of our lessees less competitive than coal produced from other sources. On the other hand, significant decreases in transportation costs could result in increased competition for our lessees from producers in other parts of the country.
Our lessees depend upon railroads, barges, trucks and beltlines to deliver minerals to their customers. Disruption of those transportation services due to weather-related problems, mechanical difficulties, strikes, lockouts, bottlenecks and other events could temporarily impair the ability of our lessees to supply minerals to their customers. Our lessees’ transportation providers may face difficulties in the future that may impair the ability of our lessees to supply minerals to their customers, resulting in decreased royalty revenues to us.
In addition, Ciner Wyoming transports its soda ash by rail or truck and ocean vessel. As a result, its business and financial results are sensitive to increases in rail freight, trucking and ocean vessel rates. Increases in transportation costs, including increases resulting from emission control requirements, port taxes and fluctuations in the price of fuel, could make soda ash a less competitive product for glass manufacturers when compared to glass substitutes or recycled glass, or could make Ciner Wyoming’s soda ash less competitive than soda ash produced by competitors that have other means of transportation or are located closer to their customers. Ciner Wyoming may be unable to pass on its freight and other transportation costs in full because market prices for soda ash are generally determined by supply and demand forces. In addition, rail operations are subject to various risks that may result in a delay or lack of service at Ciner Wyoming’s facility, and alternative methods of transportation are impracticable or cost-prohibitive. Any substantial interruption in or increased costs related to the transportation of Ciner Wyoming’s soda ash or the failure to renew the rail contract on favorable terms could have a material adverse effect on our financial condition and results of operations.
Our reserve estimates depend on many assumptions that may be inaccurate, which could materially adversely affect the quantities and value of our reserves.
Coal, aggregates and industrial minerals, reserve engineering requires subjective estimates of underground accumulations of coal, aggregates and industrial minerals, and assumptions and are by nature imprecise. Our reserve estimates may vary substantially from the actual amounts of coal, aggregates and industrial minerals recovered from our reserves. There are numerous uncertainties inherent in estimating quantities of reserves, including many factors beyond our control. Estimates of reserves necessarily depend upon a number of variables and assumptions, any one of which may, if incorrect, result in an estimate that varies considerably from actual results. These factors and assumptions relate to:
|
•
|
future prices, operating costs, capital expenditures, severance and excise taxes, and development and reclamation costs;
|
|
•
|
production levels;
|
|
•
|
future technology improvements;
|
|
•
|
the effects of regulation by governmental agencies; and
|
|
•
|
geologic and mining conditions, which may not be fully identified by available exploration data.
|
Actual production, revenue and expenditures with respect to our reserves will likely vary from estimates, and these variations may be material. As a result, undue reliance should not be placed on our reserve data that is included in this report.
30
Our lessees could satisfy obligations to their customers with minerals from properties other than ours, depriving us of the ability to receive amounts in excess of minimum royalty payments.
Mineral supply contracts generally do not require operators to satisfy their obligations to their customers with resources mined from specific reserves. Several factors may influence a lessee’s decision to supply its customers with minerals mined from properties we do not own or lease, including the royalty rates under the lessee’s lease with us, mining conditions, mine operating costs, cost and availability of transportation, and customer specifications. In addition, lessees move on and off of our properties over the course of any given year in accordance with their mine plans. If a lessee satisfies its obligations to its customers with minerals from properties we do not own or lease, production on our properties will decrease, and we will receive lower royalty revenues.
A lessee may incorrectly report royalty revenues, which might not be identified by our lessee audit process or our mine inspection process or, if identified, might be identified in a subsequent period.
We depend on our lessees to correctly report production and royalty revenues on a monthly basis. Our regular lessee audits and mine inspections may not discover any irregularities in these reports or, if we do discover errors, we might not identify them in the reporting period in which they occurred. Any undiscovered reporting errors could result in a loss of royalty revenues and errors identified in subsequent periods could lead to accounting disputes as well as disputes with our lessees.
Risks Related to Our Structure
Unitholders may not be able to remove our general partner even if they wish to do so.
Our general partner manages and operates NRP. Unlike the holders of common stock in a corporation, unitholders have only limited voting rights on matters affecting our business. Unitholders have no right to elect the general partner or the directors of the general partner on an annual or any other basis.
Furthermore, if unitholders are dissatisfied with the performance of our general partner, they currently have little practical ability to remove our general partner or otherwise change its management. Our general partner may not be removed except upon the vote of the holders of at least 66 2/3% of our outstanding common units (including common units held by our general partner and its affiliates and including common units deemed to be held by the holders of the preferred units who vote along with the common unitholders on an as-converted basis). Because of their substantial ownership in us, the removal of our general partner would be difficult without the consent of both our general partner and its affiliates and the holders of the preferred units
In addition, the following provisions of our partnership agreement may discourage a person or group from attempting to remove our general partner or otherwise change our management:
|
•
|
generally, if a person (other than the holders of preferred units) acquires 20% or more of any class of units then outstanding other than from our general partner or its affiliates, the units owned by such person cannot be voted on any matter; and
|
|
•
|
our partnership agreement contains limitations upon the ability of unitholders to call meetings or to acquire information about our operations, as well as other limitations upon the unitholders’ ability to influence the manner or direction of management.
|
As a result of these provisions, the price at which the common units will trade may be lower because of the absence or reduction of a takeover premium in the trading price.
The preferred units are senior in right of distributions and liquidation and upon conversion, would result in the issuance of additional common units in the future, which could result in substantial dilution of our common unitholders’ ownership interests.
The preferred units rank senior to our common units with respect to distribution rights and rights upon liquidation. We are required to pay quarterly distributions on the preferred units (plus any PIK Units issued in lieu of preferred units) in an amount equal to 12.0% per year prior to paying any distributions on our common units. The preferred units also rank senior to the common units in right of liquidation, and will be entitled to receive a liquidation preference in any such case.
31
The preferred units may also be converted into common units under certain circumstances. The number of common units issued in any conversion will be based on the then-current trading price of the common units at the time of conversion. Accordingly, the lower the trading price of our common units at the time of conversion, the greater the number of common units that will be issued upon conversion of the preferred units, which would result in greater dilution to our existing common unitholders. Dilution has the following effects on our common unitholders:
|
•
|
an existing unitholder’s proportionate ownership interest in NRP will decrease;
|
|
•
|
the amount of cash available for distribution on each unit may decrease; and
|
|
•
|
the relative voting strength of each previously outstanding unit may be diminished; and the market price of the common units may decline.
|
In addition, to the extent the preferred units are converted into more than 66 2/3% of our common units, the holders of the preferred will have the right to remove our general partner.
We may issue additional common units or preferred units without common unitholder approval, which would dilute a unitholder’s existing ownership interests.
Our general partner may cause us to issue an unlimited number of common units, without common unitholder approval (subject to applicable New York Stock Exchange (NYSE) rules). We may also issue at any time an unlimited number of equity securities ranking junior or senior to the common units (including additional preferred units) without common unitholder approval (subject to applicable NYSE rules). In addition, we may issue additional common units upon the exercise of the outstanding warrants held by Blackstone and Goldentree. The issuance of additional common units or other equity securities of equal or senior rank will have the following effects:
|
•
|
an existing unitholder’s proportionate ownership interest in NRP will decrease;
|
|
•
|
the amount of cash available for distribution on each unit may decrease; and
|
|
•
|
the relative voting strength of each previously outstanding unit may be diminished; and the market price of the common units may decline.
|
Our general partner has a limited call right that may require unitholders to sell their units at an undesirable time or price.
If at any time our general partner and its affiliates own 80% or more of the common units, the general partner will have the right, but not the obligation, which it may assign to any of its affiliates, to acquire all, but not less than all, of the remaining common units held by unaffiliated persons at a price generally equal to the then current market price of the common units. As a result, unitholders may be required to sell their common units at a time when they may not desire to sell them or at a price that is less than the price they would like to receive. They may also incur a tax liability upon a sale of their common units.
Cost reimbursements due to our general partner may be substantial and will reduce our cash available for distribution to unitholders.
Prior to making any distribution on the common units, we reimburse our general partner and its affiliates, including officers and directors of the general partner, for all expenses incurred on our behalf. The reimbursement of expenses and the payment of fees could adversely affect our ability to make distributions. The general partner has sole discretion to determine the amount of these expenses. In addition, our general partner and its affiliates may provide us services for which we will be charged reasonable fees as determined by the general partner.
Unitholders may not have limited liability if a court finds that unitholder actions constitute control of our business.
Our general partner generally has unlimited liability for our obligations, such as our debts and environmental liabilities, except for those contractual obligations that are expressly made without recourse to our general partner. Under Delaware law, however, a unitholder could be held liable for our obligations to the same extent as a general partner if a court determined that the right of unitholders to remove our general partner or to take other action under our partnership agreement constituted participation in the "control" of our business. In addition, Section 17-607 of the Delaware Revised Uniform Limited Partnership Act provides that under some circumstances, a unitholder may be liable to us for the amount of a distribution for a period of three years from the date of the distribution.
32
Conflicts of interest could arise among our general partner and us or the unitholders.
These conflicts may include the following:
|
•
|
Excluding our construction aggregates business, we do not have any employees and we rely solely on employees of affiliates of the general partner;
|
|
•
|
under our partnership agreement, we reimburse the general partner for the costs of managing and for operating the partnership;
|
|
•
|
the amount of cash expenditures, borrowings and reserves in any quarter may affect cash available to pay quarterly distributions to unitholders;
|
|
•
|
the general partner tries to avoid being liable for partnership obligations. The general partner is permitted to protect its assets in this manner by our partnership agreement. Under our partnership agreement the general partner would not breach its fiduciary duty by avoiding liability for partnership obligations even if we can obtain more favorable terms without limiting the general partner’s liability;
|
|
•
|
under our partnership agreement, the general partner may pay its affiliates for any services rendered on terms fair and reasonable to us. The general partner may also enter into additional contracts with any of its affiliates on behalf of us. Agreements or contracts between us and our general partner (and its affiliates) are not necessarily the result of arm’s-length negotiations; and
|
|
•
|
the general partner would not breach our partnership agreement by exercising its call rights to purchase limited partnership interests or by assigning its call rights to one of its affiliates or to us.
|
In addition, as a result of the purchase of the Preferred Units, Blackstone has certain consent rights and board appointment and observation rights. GoldenTree also has more limited consent rights. In the exercise of their applicable consent rights and/or board rights, conflicts of interest could arise between us and our general partner on the one hand, and Blackstone or GoldenTree on the other hand.
The control of our general partner may be transferred to a third party without unitholder consent. A change of control may result in defaults under certain of our debt instruments and the triggering of payment obligations under compensation arrangements.
Our general partner may transfer its general partner interest to a third party in a merger or in a sale of all or substantially all of its assets without the consent of our unitholders. Furthermore, there is no restriction in our partnership agreement on the ability of the general partner of our general partner from transferring its general partnership interest in our general partner to a third party. The new owner of our general partner would then be in a position to replace the Board of Directors and officers with its own choices and to control their decisions and actions.
In addition, a change of control would constitute an event of default under our debt agreements. During the continuance of an event of default under our debt agreements, the administrative agent may terminate any outstanding commitments of the lenders to extend credit to us and/or declare all amounts payable by us immediately due and payable. In addition, upon a change of control, the holders of the preferred units would have the right to require us to redeem the preferred units at the liquidation preference or convert all of their preferred units into common units. A change of control also may trigger payment obligations under various compensation arrangements with our officers.
Tax Risks to Our Unitholders
Our tax treatment depends on our status as a partnership for U.S. federal income tax purposes as well as our not being subject to a material amount of entity-level taxation by individual states. If the Internal Revenue Service ("IRS") were to treat us as a corporation for federal income tax purposes or we were to become subject to material additional amounts of entity-level taxation for state tax purposes, then our cash available for distribution to unitholders would be substantially reduced.
The anticipated after-tax economic benefit of an investment in our units depends largely on our being treated as a partnership for U.S. federal income tax purposes. Despite the fact that we are organized as a limited partnership under Delaware law, we would be treated as a corporation for U.S. federal income tax purposes unless we satisfy a "qualifying income" requirement. Based on our current operations, we believe we satisfy the qualifying income requirement. However, we have not requested, and do not plan to request, a ruling from the IRS on this or any other matter affecting us. Failing to meet the qualifying income requirement or a
33
change in current law could cause us to be treated as a corporation for U.S. federal income tax purposes or otherwise subject us to taxation as an entity.
If we were treated as a corporation for U.S. federal income tax purposes, we would pay federal income tax on our taxable income at the corporate tax rate and would likely be liable for state income tax at varying rates. Distributions to our unitholders would generally be taxed again as corporate distributions, and no income, gains, losses, deductions or credits would flow through to our unitholders. Because tax would be imposed upon us as a corporation, our cash available for distribution to our unitholders would be substantially reduced. Therefore, treatment of us as a corporation would result in a material reduction in the anticipated cash flow and after-tax return to our unitholders, likely causing a substantial reduction in the value of our units.
At the state level, several states have been evaluating ways to subject partnerships to entity-level taxation through the imposition of state income, franchise and other forms of taxation. Imposition of a similar tax on us in a jurisdiction in which we operate or in other jurisdictions to which we may expand could substantially reduce the cash available for distribution to our unitholders.
The tax treatment of publicly traded partnerships or an investment in our units could be subject to potential legislative, judicial or administrative changes or differing interpretations, possibly applied on a retroactive basis.
The present U.S. federal income tax treatment of publicly traded partnerships, including us, or an investment in our units may be modified by administrative, legislative or judicial changes or differing interpretations at any time. From time to time, members of Congress propose and consider substantive changes to the existing U.S. federal income tax laws that affect publicly traded partnerships. Although there is no current legislative proposal, a prior legislative proposal would have eliminated the qualifying income exception to the treatment of all publicly traded partnerships as corporations upon which we rely for our treatment as a partnership for U.S. federal income tax purposes.
In addition, on January 24, 2017, final regulations regarding which activities give rise to qualifying income within the meaning of Section 7704 of the Internal Revenue Code of 1986, as amended (the "Final Regulations") were published in the Federal Register. The Final Regulations are effective as of January 19, 2017, and apply to taxable years beginning on or after January 19, 2017. We anticipate that we will continue to meet the qualifying income exception for publicly traded partnership under the Final Regulations.
However, any interpretation of or modification to the U.S. federal income tax laws may be applied retroactively and could make it more difficult or impossible for us to meet the exception for certain publicly traded partnerships to be treated as partnerships for U.S. federal income tax purposes. We are unable to predict whether any of these changes or other proposals will ultimately be enacted. Any similar or future legislative changes could negatively impact the value of an investment in our units.
Certain federal income tax preferences currently available with respect to coal exploration and development may be eliminated as a result of future legislation.
Changes to U.S. federal income tax laws have been proposed in a prior session of Congress that would eliminate certain key U.S. federal income tax preferences relating to coal exploration and development. These changes include, but are not limited to (i) repealing capital gains treatment of coal and lignite royalties, (ii) eliminating current deductions and 60-month amortization for exploration and development costs relating to coal and other hard mineral fossil fuels, and (iii) repealing the percentage depletion allowance with respect to coal properties. If enacted, these changes would limit or eliminate certain tax deductions that are currently available with respect to coal exploration and development, and any such change could increase the taxable income allocable to our unitholders and negatively impact the value of an investment in our units. We are not aware of any current proposals with regard to these changes.
Our unitholders are required to pay taxes on their share of our income even if they do not receive any cash distributions from us. Our unitholders' share of our portfolio income may be taxable to them even though they receive other losses from our activities.
Because our unitholders are treated as partners to whom we allocate taxable income that could be different in amount than the cash we distribute, our unitholders are required to pay any federal income taxes and, in some cases, state and local income taxes on their share of our taxable income even if they receive no cash distributions from us. Our unitholders may not receive cash distributions from us equal to their share of our taxable income or even equal to the actual tax due from them with respect to that
34
income.
For our unitholders subject to the passive loss rules, our current operations include portfolio activities (such as our coal and mineral royalties business) and passive activities (such as our soda ash and aggregates businesses). Any passive losses we generate will only be available to offset our passive income generated in the future and will not be available to offset (i) our portfolio income, including income related to our coal and mineral royalties business, (ii) a unitholder’s income from other passive activities or investments, including investments in other publicly traded partnerships, or (iii) a unitholder’s salary or active business income. Thus, our unitholders' share of our portfolio income may be subject to federal income tax, regardless of other losses they may receive from us.
We may engage in transactions to reduce our indebtedness and manage our liquidity that generate taxable income (including income and gain from the sale of properties and cancellation of indebtedness income) allocable to our unitholders, and income tax liabilities arising therefrom may exceed any distributions made with respect to their units.
In response to current market conditions, we may engage in transactions to reduce our leverage and manage our liquidity that would result in income and gain to our unitholders without a corresponding cash distribution. For example, we may sell assets and use the proceeds to repay existing debt, in which case, our unitholders could be allocated taxable income and gain resulting from the sale without receiving a cash distribution. Further, we may pursue opportunities to reduce our existing debt, such as debt exchanges, debt repurchases, or modifications of our existing debt that would result in “cancellation of indebtedness income” (also referred to as “COD income”) being allocated to our unitholders as ordinary taxable income. Our unitholders may be allocated income and gain from these transactions, and income tax liabilities arising therefrom may exceed any distributions we make to our unitholders. The ultimate tax effect of any such income allocations will depend on the unitholder's individual tax position, including, for example, the availability of any suspended passive losses that may offset some portion of the allocable income. Our unitholders may, however, be allocated substantial amounts of ordinary income subject to taxation, without any ability to offset such allocated income against any capital losses attributable to the unitholder’s ultimate disposition of its units. Our unitholders are encouraged to consult their tax advisors with respect to the consequences to them
If the IRS contests the federal income tax positions we take, the market for our units may be adversely impacted and the cost of any IRS contest will reduce our cash available for distribution to our unitholders.
We have not requested a ruling from the IRS with respect to our treatment as a partnership for federal income tax purposes or any other matter affecting us. The IRS may adopt positions that differ from the positions we take. It may be necessary to resort to administrative or court proceedings to sustain some or all of the positions we take. A court may not agree with some or all of the positions we take. Any contest by the IRS may materially and adversely impact the market for our units and the price at which they trade. In addition, our costs of any contest by the IRS will be borne indirectly by our unitholders and our general partner because the costs will reduce our cash available for distribution.
If the IRS makes audit adjustments to our income tax returns for tax years beginning after December 31, 2017, it (and some states) may assess and collect any taxes (including any applicable penalties and interest) resulting from such audit adjustment directly from us, in which case our cash available for distribution to our unitholders might be substantially reduced and our current and former unitholders may be required to indemnify us for any taxes (including applicable penalties and interest) resulting from such audit adjustments that were paid on such unitholders’ behalf.
Pursuant to the Bipartisan Budget Act of 2015, for tax years beginning after December 31, 2017, if the IRS makes audit adjustments to our income tax returns, it (and some states) may assess and collect any taxes (including any applicable penalties and interest) resulting from such audit adjustment directly from us. To the extent possible under the new rules, our general partner may elect to either pay the taxes (including any applicable penalties and interest) directly to the IRS or, if we are eligible, issue a revised information statement to each unitholder with respect to an audited and adjusted return. Although our general partner may elect to have our unitholders take such audit adjustment into account in accordance with their interests in us during the tax year under audit, there can be no assurance that such election will be practical, permissible or effective in all circumstances. As a result, our current unitholders may bear some or all of the tax liability resulting from such audit adjustment, even if such unitholders did not own units in us during the tax year under audit. If, as a result of any such audit adjustment, we are required to make payments of taxes, penalties and interest, our cash available for distribution to our unitholders might be substantially reduced and our current and former unitholders may be required to indemnify us for any taxes (including any applicable penalties and interest) resulting from such audit adjustments that were paid on such unitholders’ behalf. These rules are not applicable for tax years beginning on or prior to December 31, 2017.
35
Tax gain or loss on the disposition of our common units could be more or less than expected.
If our unitholders sell their common units, they will recognize a gain or loss equal to the difference between the amount realized and their tax basis in those common units. Because distributions in excess of our common unitholder's allocable share of our net taxable income result in a decrease in their tax basis in unitholder's common units, the amount, if any, of such prior excess distributions with respect to the common units they sell will, in effect, become taxable income to our common unitholders if they sell such common units at a price greater than their tax basis in those common units, even if the price they receive is less than their original cost. Furthermore, a substantial portion of the amount realized, whether or not representing gain, may be taxed as ordinary income due to potential recapture items, including depletion and depreciation recapture. In addition, because the amount realized includes a unitholder’s share of our nonrecourse liabilities, if our unitholders sell their common units, they may incur a tax liability in excess of the amount of cash they receive from the sale.
Our unitholders may be subject to limitation on their ability to deduct interest expense incurred by us.
In general, we are entitled to a deduction for interest paid or accrued on indebtedness properly allocable to our trade or business during our taxable year. However, under the Tax Cuts and Jobs Act, for taxable years beginning after December 31, 2017, our deduction for “business interest” is limited to the sum of our business interest income and 30% of our “adjusted taxable income.” For the purposes of this limitation, our adjusted taxable income is computed without regard to any business interest expense or business interest income, and in the case of taxable years beginning before January 1, 2022, any deduction allowable for depreciation, amortization, or depletion.
Tax-exempt entities face unique tax issues from owning our units that may result in adverse tax consequences to them.
Investment in our units by tax-exempt entities, such as employee benefit plans and individual retirement accounts (known as IRAs) raises issues unique to them. For example, virtually all of our income allocated to organizations that are exempt from U.S. federal income tax, including IRAs and other retirement plans, will be unrelated business taxable income and will be taxable to them. Further, under the Tax Cuts and Jobs Act, for taxable years beginning after December 31, 2017, a tax-exempt entity with more than one unrelated trade or business (including by attribution from investment in a partnership such as ours that is engaged in one or more unrelated trade or business) is required to compute the unrelated business taxable income of such tax-exempt entity separately with respect to each such trade or business (including for purposes of determining any net operating loss deduction). As a result, for years beginning after December 31, 2017, it may not be possible for tax-exempt entities to utilize losses from an investment in our partnership to offset unrelated business taxable income from another unrelated trade or business and vice versa. Tax-exempt entities should consult a tax advisor before investing in our units.
Non-U.S. Unitholders will be subject to U.S. taxes and withholding with respect to their income and gain from owning our units.
Non-U.S. unitholders are generally taxed and subject to income tax filing requirements by the United States on income effectively connected with a U.S. trade or business (“effectively connected income”). Income allocated to our unitholders and any gain from the sale of our units will generally be considered to be “effectively connected” with a U.S. trade or business. As a result, distributions to a Non-U.S. unitholder will be subject to withholding at the highest applicable effective tax rate and a Non-U.S. unitholder who sells or otherwise disposes of a unit will also be subject to U.S. federal income tax on the gain realized from the sale or disposition of that unit.
The Tax Cuts and Jobs Act imposes a withholding obligation of 10% of the amount realized upon a Non-U.S. unitholder’s sale or exchange of an interest in a partnership that is engaged in a U.S. trade or business. However, due to challenges of administering a withholding obligation applicable to open market trading and other complications, the IRS has temporarily suspended the application of this withholding rule to open market transfers of interests in publicly traded partnerships pending promulgation of regulations or other guidance that resolves the challenges. It is not clear if or when such regulations or other guidance will be issued. Non-U.S. unitholders should consult a tax advisor before investing in our units.
We will treat each purchaser of our common units as having the same tax benefits without regard to the actual common units purchased. The IRS may challenge this treatment, which could adversely affect the value of the common units.
Because we cannot match transferors and transferees of our common units and for other reasons, we have adopted depreciation and amortization positions that may not conform to all aspects of existing Treasury Regulations. A successful IRS challenge to
36
those positions could adversely affect the amount of tax benefits available to our unitholders. It also could affect the timing of these tax benefits or the amount of gain from the sale of common units and could have a negative impact on the value of our common units or result in audit adjustments to our unitholders' tax returns.
We prorate our items of income, gain, loss and deduction between transferors and transferees of our common units each month based upon the ownership of our common units on the first day of each month, instead of on the basis of the date a particular unit is transferred. The IRS may challenge this treatment, which could change the allocation of items of income, gain, loss and deduction among our unitholders.
We generally prorate our items of income, gain, loss and deduction between transferors and transferees of our common units each month based upon the ownership of our common units on the first day of each month (the "Allocation Date"), instead of on the basis of the date a particular unit is transferred. Similarly, we generally allocate certain deductions for depreciation of capital additions, gain or loss realized on a sale or other disposition of our assets and, in the discretion of the general partner, any other extraordinary item of income, gain, loss or deduction based upon ownership on the Allocation Date. Treasury Regulations allow a similar monthly simplifying convention, but such regulations do not specifically authorize the use of the proration method we have adopted. If the IRS were to challenge our proration method, we may be required to change the allocation of items of income, gain, loss and deduction among our unitholders.
A unitholder whose units are the subject of a securities loan (e.g., a loan to a "short seller" to cover a short sale of units) may be considered as having disposed of those units. If so, he would no longer be treated for tax purposes as a partner with respect to those units during the period of the loan and may recognize gain or loss from the disposition.
Because there are no specific rules governing the U.S. federal income tax consequences of loaning a partnership interest, a unitholder whose units are the subject of a securities loan may be considered as having disposed of the loaned units. In that case, the unitholder may no longer be treated for tax purposes as a partner with respect to those units during the period of the loan and the unitholder may recognize gain or loss from such disposition. Moreover, during the period of the loan, any of our income, gain, loss or deduction with respect to those units may not be reportable by the unitholder and any cash distributions received by the unitholder as to those units could be fully taxable as ordinary income. Our unitholders desiring to assure their status as partners and avoid the risk of gain recognition from a loan of their units are urged to modify any applicable brokerage account agreements to prohibit their brokers from borrowing their units.
As a result of investing in our units, our unitholders are subject to state and local taxes and return filing requirements in jurisdictions where we operate or own or acquire property.
In addition to federal income taxes, our unitholders are likely subject to other taxes, including state and local taxes, unincorporated business taxes and estate, inheritance or intangible taxes that are imposed by the various jurisdictions in which we conduct business or own property now or in the future, even if our unitholders do not live in any of those jurisdictions. Our unitholders are likely required to file state and local income tax returns and pay state and local income taxes in some or all of these various jurisdictions. Further, our unitholders may be subject to penalties for failure to comply with those requirements. We own property and conduct business in a number of states in the United States. Most of these states impose an income tax on individuals, corporations and other entities. As we make acquisitions or expand our business, we may own assets or conduct business in additional states that impose a personal income tax. It is the unitholder's responsibility to file all U.S. federal, state and local tax returns.
None.
37
We are involved, from time to time, in various legal proceedings arising in the ordinary course of business. While the ultimate results of these proceedings cannot be predicted with certainty, we believe these claims will not have a material effect on our financial position, liquidity or operations. We are currently involved in the litigation proceedings described below.
Foresight Energy Disputes
In November 2015, we filed a lawsuit against Foresight Energy’s subsidiary, Hillsboro Energy LLC ("Hillsboro"), in the Circuit Court of the Fourth Judicial Circuit in Montgomery County, Illinois. We have subsequently named Foresight Energy and certain of its subsidiaries in the suit. The lawsuit alleges, among other items, breach of contract by Hillsboro resulting from a wrongful declaration of force majeure at Hillsboro’s Deer Run mine, as well as alter-ego and tortious interference claims against Foresight Energy. In late March 2015, elevated carbon monoxide readings were detected at the Deer Run mine, and coal production at the mine was idled. In July 2015, Hillsboro declared a force majeure event under its lease with us, and Hillsboro has failed to make its contractually obligated minimum quarterly payments of $7.5 million since then. We believe the force majeure declaration has no merit and we are vigorously pursuing recovery against Hillsboro, as well as against Foresight Energy and certain of its other subsidiaries. Hillsboro has failed to make
$76.0 million
of deficiency payments to us to date, and such amount will continue to increase for each quarter with respect to which the payment is not made.
In April 2016, we filed a lawsuit against Macoupin Energy, LLC ("Macoupin"), a subsidiary of Foresight Energy, in Macoupin County, Illinois. The lawsuit alleges that Macoupin has failed to comply with the terms of its coal mining, rail loadout and rail loop leases by incorrectly recouping previously paid minimum royalties. As a result, Macoupin owes NRP approximately
$9.5 million
in improperly recouped minimums through December 31, 2017.
Anadarko Contingent Consideration Payment Dispute
In January 2013, we acquired a non-controlling 48.51% general partner interest in OCI Wyoming, L.P. ("OCI LP") and all of the preferred stock and a portion of the common stock of OCI Wyoming Co. ("OCI Co") (which in turn owned a 1% limited partner interest in OCI LP) from Anadarko Holding Company and its subsidiary, Big Island Trona Company (together, "Anadarko"). The remaining general partner interest in OCI LP and common stock of OCI Co were owned by subsidiaries of OCI Chemical Corporation.
The acquisition agreement provided for additional contingent consideration of up to $50 million to be paid by us if certain performance criteria were met at OCI LP as defined in the purchase and sale agreement in any of the years 2013, 2014 or 2015. For those years, we paid an aggregate of $11.5 million to Anadarko in full satisfaction of these contingent consideration payment obligations.
In July 2013, pursuant to a series of transactions in connection with an initial public offering by a subsidiary of OCI Chemical Corporation, the ownership structure in OCI LP was simplified. In connection with such reorganization, we exchanged the stock of OCI Co for a limited partner interest in OCI LP. Following the reorganization, our interest in OCI LP increased to 49%, consisting of both limited and general partner interests. The restructuring did not have any impact on the operations, revenues, management or control of OCI LP.
In July 2017, Anadarko filed a lawsuit against Opco and NRP Trona LLC in the District Court of Harris County, Texas, 157th Judicial District, alleging that the transactions conducted in 2013 triggered an acceleration of our obligation under the purchase agreement with Anadarko to pay additional contingent consideration in full and demanded immediate payment of such amount, together with interest, court costs and attorneys’ fees. We do not believe the reorganization transactions triggered an obligation to pay any additional contingent consideration, and we intend to vigorously defend this lawsuit. However, the ultimate outcome cannot be predicted with certainty given the early stage of this matter and we estimate a possible range of loss between $0, if we prevail, and approximately $40 million, plus interest, court costs and attorneys’ fees if Anadarko prevails and is awarded the full damages it seeks.
The information concerning mine safety violations or other regulatory matters required by SEC regulations is included in Exhibit 95.1 to this Annual Report on Form 10-K.
38
NRP Common Units and Cash Distributions
Our common units are listed and traded on the NYSE under the symbol "NRP". As of February 1, 2018
,
there were approximately 20,225 beneficial and registered holders of our common units. The computation of the approximate number of unitholders is based upon a broker survey.
The following table sets forth the high and low sales prices per common unit, as reported on the NYSE Composite Transaction Tape from January 1, 2016 to December 31, 2017, and the quarterly cash distribution declared and paid per common unit with respect to each quarter.
|
|
Price Range
|
Cash Distribution History
|
|||||||||||||
|
|
High
|
Low
|
Per
Unit
|
Record
Date
|
Payment
Date
|
||||||||||
|
2016
|
|||||||||||||||
|
First Quarter
|
$
|
13.86
|
|
$
|
5.00
|
|
$
|
0.45
|
|
5/5/2016
|
5/13/2016
|
||||
|
Second Quarter
|
$
|
18.92
|
|
$
|
7.13
|
|
$
|
0.45
|
|
8/5/2016
|
8/12/2016
|
||||
|
Third Quarter
|
$
|
29.85
|
|
$
|
13.97
|
|
$
|
0.45
|
|
11/7/2016
|
11/14/2016
|
||||
|
Fourth Quarter
|
$
|
40.00
|
|
$
|
25.11
|
|
$
|
0.45
|
|
2/7/2017
|
2/14/2017
|
||||
|
2017
|
|||||||||||||||
|
First Quarter
|
$
|
45.60
|
|
$
|
32.15
|
|
$
|
0.45
|
|
5/5/2017
|
5/12/2017
|
||||
|
Second Quarter
|
$
|
37.65
|
|
$
|
26.50
|
|
$
|
0.45
|
|
8/7/2017
|
8/14/2017
|
||||
|
Third Quarter
|
$
|
29.25
|
|
$
|
22.81
|
|
$
|
0.45
|
|
11/7/2017
|
11/14/2017
|
||||
|
Fourth Quarter
|
$
|
27.85
|
|
$
|
23.75
|
|
$
|
0.45
|
|
2/7/2018
|
2/14/2018
|
||||
|
Cash Distributions to Partners
|
||||||||||||||||
|
|
General
Partner
(1)
|
Common Unitholders
(2)
|
Preferred
Unitholders
(3)
|
Total
Distributions
|
||||||||||||
|
|
(in thousands)
|
|||||||||||||||
|
2016 Distributions
|
$
|
451
|
|
$
|
22,014
|
|
$
|
—
|
|
$
|
22,465
|
|
||||
|
2017 Distributions
|
$
|
449
|
|
$
|
22,018
|
|
$
|
8,844
|
|
$
|
31,311
|
|
||||
|
(1)
|
Represents distributions on our general partner’s general partner interest in us.
|
|
(2)
|
Includes $0.3 million distributions to our general partner on 156,000 common units beneficially owned by our general partner in both
2016
and
2017
.
|
|
(3)
|
During 2017, we declared
$17.7 million
in total distributions on the Preferred Units, half of which were paid in cash and the other half were paid in additional Preferred Units.
|
39
The following table shows selected historical financial data for Natural Resource Partners L.P. for the periods and as of the dates indicated. We derived the information in the following tables from, and the information should be read together with and is qualified in its entirety by reference to, the historical financial statements and the accompanying notes included in "Item 8. Financial Statements and Supplementary Data" in this and previously filed Annual Reports on Form 10-K. These tables should be read together with "Item 7. Management’s Discussion and Analysis of Financial Condition and Results of Operations."
40
|
|
For the Years Ended December 31,
|
||||||||||||||||||
|
|
2017
|
2016
|
2015
|
2014
|
2013
|
||||||||||||||
|
|
(In thousands, except per unit data)
|
||||||||||||||||||
|
Total revenues and other income
|
$
|
378,017
|
|
$
|
400,059
|
|
$
|
439,648
|
|
$
|
350,918
|
|
$
|
352,739
|
|
||||
|
Asset impairments
|
$
|
3,031
|
|
$
|
16,926
|
|
$
|
384,545
|
|
$
|
26,209
|
|
$
|
734
|
|
||||
|
Income (loss) from operations
|
$
|
183,975
|
|
$
|
185,745
|
|
$
|
(170,427
|
)
|
$
|
176,140
|
|
$
|
233,740
|
|
||||
|
Net income (loss) from continuing operations
|
$
|
89,208
|
|
$
|
95,214
|
|
$
|
(260,171
|
)
|
$
|
96,713
|
|
$
|
169,621
|
|
||||
|
Net income from continuing operations excluding impairments
|
$
|
92,239
|
|
$
|
112,140
|
|
$
|
124,374
|
|
$
|
122,922
|
|
$
|
170,355
|
|
||||
|
Net income (loss) from discontinued operations
|
$
|
(541
|
)
|
$
|
1,678
|
|
$
|
(311,549
|
)
|
$
|
12,117
|
|
$
|
2,457
|
|
||||
|
Net income (loss)
|
$
|
88,667
|
|
$
|
96,892
|
|
$
|
(571,720
|
)
|
$
|
108,830
|
|
$
|
172,078
|
|
||||
|
Per common unit amounts (basic)
|
|||||||||||||||||||
|
Net income (loss) from continuing operations
|
$
|
5.11
|
|
$
|
7.65
|
|
$
|
(20.78
|
)
|
$
|
8.37
|
|
$
|
15.17
|
|
||||
|
Net income (loss) from discontinued operations
|
$
|
(0.04
|
)
|
$
|
0.13
|
|
$
|
(24.97
|
)
|
$
|
1.05
|
|
$
|
0.22
|
|
||||
|
Net income (loss)
|
$
|
5.06
|
|
$
|
7.78
|
|
$
|
(45.75
|
)
|
$
|
9.42
|
|
$
|
15.39
|
|
||||
|
Per common unit amounts (diluted)
|
|||||||||||||||||||
|
Net income (loss) from continuing operations
|
$
|
3.98
|
|
$
|
7.65
|
|
$
|
(20.78
|
)
|
$
|
8.37
|
|
$
|
15.17
|
|
||||
|
Net income (loss) from discontinued operations
|
$
|
(0.02
|
)
|
$
|
0.13
|
|
$
|
(24.97
|
)
|
$
|
1.05
|
|
$
|
0.22
|
|
||||
|
Net income (loss)
|
$
|
3.96
|
|
$
|
7.78
|
|
$
|
(45.75
|
)
|
$
|
9.42
|
|
$
|
15.39
|
|
||||
|
Distributions paid per common unit
|
$
|
1.80
|
|
$
|
1.80
|
|
$
|
2.70
|
|
$
|
14.00
|
|
$
|
22.00
|
|
||||
|
Average number of common units outstanding - basic
|
12,232
|
|
12,232
|
|
12,232
|
|
11,326
|
|
10,958
|
|
|||||||||
|
Average number of common units outstanding - diluted
|
21,950
|
|
12,232
|
|
12,232
|
|
11,326
|
|
10,958
|
|
|||||||||
|
Net cash provided by (used in)
|
|||||||||||||||||||
|
Operating activities of continuing operations
|
$
|
127,838
|
|
$
|
100,643
|
|
$
|
168,512
|
|
$
|
192,164
|
|
$
|
246,891
|
|
||||
|
Investing activities of continuing operations
|
$
|
3,337
|
|
$
|
59,943
|
|
$
|
6,985
|
|
$
|
(169,512
|
)
|
$
|
(230,436
|
)
|
||||
|
Financing activities of continuing operations
|
$
|
(141,719
|
)
|
$
|
(161,419
|
)
|
$
|
(183,264
|
)
|
$
|
(65,986
|
)
|
$
|
(73,574
|
)
|
||||
|
Distributable Cash Flow
(1)
|
$
|
132,141
|
|
$
|
271,415
|
|
$
|
176,617
|
|
$
|
196,929
|
|
$
|
306,690
|
|
||||
|
Adjusted EBITDA
(1)
|
$
|
231,542
|
|
$
|
255,432
|
|
$
|
262,621
|
|
$
|
263,775
|
|
$
|
328,452
|
|
||||
|
Cash and cash equivalents
|
$
|
29,827
|
|
$
|
40,371
|
|
$
|
41,204
|
|
$
|
48,971
|
|
$
|
92,305
|
|
||||
|
Total assets
|
$
|
1,389,164
|
|
$
|
1,448,649
|
|
$
|
1,674,865
|
|
$
|
2,431,549
|
|
$
|
1,981,432
|
|
||||
|
Current portion of long-term debt, net
|
$
|
79,740
|
|
$
|
140,037
|
|
$
|
80,745
|
|
$
|
80,745
|
|
$
|
80,745
|
|
||||
|
Long-term debt, net
|
$
|
729,608
|
|
$
|
990,234
|
|
$
|
1,130,696
|
|
$
|
1,190,558
|
|
$
|
993,295
|
|
||||
|
Class A Convertible Preferred Units
|
$
|
173,431
|
|
$
|
—
|
|
$
|
—
|
|
$
|
—
|
|
$
|
—
|
|
||||
|
Partners’ capital
|
$
|
265,211
|
|
$
|
151,530
|
|
$
|
76,336
|
|
$
|
720,155
|
|
$
|
616,789
|
|
||||
|
(1)
|
See "Non-GAAP Financial Measures" below.
|
41
Non-GAAP Financial Measures
Distributable Cash Flow
Our Distributable Cash Flow ("DCF") represents
net cash provided by operating activities of continuing operations plus returns of equity from unconsolidated investment, proceeds from sales of assets, including those included in discontinued operations, and return of long-term contract receivables (including affiliate); less maintenance capital expenditures and distributions to non-controlling interest. DCF is not a measure of financial performance under GAAP and should not be considered as an alternative to cash flows from operating, investing or financing activities. DCF may not be calculated the same for us as for other companies. In addition, DCF presented below is not calculated or presented on the same basis as Distributable Cash Flow as defined in our partnership agreement, which is used as a metric to determine whether we are able to increase quarterly distributions to our common unitholders. DCF is a supplemental liquidity measure used by our management and by external users of our financial statements, such as investors, commercial banks, research analysts and others to assess the Partnership's ability to make cash distributions to our common and preferred unitholders and our general partner and repay debt.
The following table reconciles net cash provided by operating activities of continuing operations (the most comparable GAAP financial measure) to Distributable Cash Flow for the years ended
December 31, 2017, 2016, 2015, 2014, and 2013
:
|
Year Ended December 31,
|
|||||||||||||||||||
|
(In thousands)
|
2017
|
2016
|
2015
|
2014
|
2013
|
||||||||||||||
|
Net cash provided by operating activities of continuing operations
|
$
|
127,838
|
|
$
|
100,643
|
|
$
|
168,512
|
|
$
|
192,164
|
|
$
|
246,891
|
|
||||
|
Add: return of equity from unconsolidated investment
|
5,646
|
|
—
|
|
—
|
|
3,633
|
|
48,833
|
|
|||||||||
|
Add: proceeds from sale of PP&E
|
1,008
|
|
1,350
|
|
11,024
|
|
1,006
|
|
—
|
|
|||||||||
|
Add: proceeds from sale of mineral rights
|
974
|
|
61,033
|
|
3,505
|
|
412
|
|
10,929
|
|
|||||||||
|
Add: proceeds from sale of assets included in discontinued operations
|
—
|
|
109,872
|
|
—
|
|
—
|
|
—
|
|
|||||||||
|
Add: return of long-term contract receivables (including affiliates)
|
3,010
|
|
2,968
|
|
2,463
|
|
1,904
|
|
2,558
|
|
|||||||||
|
Less: maintenance capital expenditures
(1)
|
(6,335
|
)
|
(4,451
|
)
|
(6,143
|
)
|
(1,216
|
)
|
—
|
|
|||||||||
|
Less: distributions to non-controlling interest
|
—
|
|
—
|
|
(2,744
|
)
|
(974
|
)
|
(2,521
|
)
|
|||||||||
|
Distributable Cash Flow
|
$
|
132,141
|
|
$
|
271,415
|
|
$
|
176,617
|
|
$
|
196,929
|
|
$
|
306,690
|
|
||||
|
(1)
|
Maintenance capital expenditures primarily consist of costs to maintain the long-term productive capacity of our Construction Aggregates segment.
|
42
Adjusted EBITDA
Adjusted EBITDA
is a non-GAAP financial measure that we define as net income (loss) from continuing operations less equity earnings from unconsolidated investment and gain on reserve swap; plus distributions from unconsolidated investment, interest expense, net, debt modification expense, loss on extinguishment of debt, depreciation, depletion and amortization and asset impairments.
Adjusted EBITDA should not be considered an alternative to, or more meaningful than, net income or loss, net income or loss attributable to partners, operating income, cash flows from operating activities or any other measure of financial performance presented in accordance with GAAP as measures of operating performance, liquidity or ability to service debt obligations. There are significant limitations to using Adjusted EBITDA as a measure of performance, including the inability to analyze the effect of certain recurring items that materially affect our net income (loss), the lack of comparability of results of operations of different companies and the different methods of calculating Adjusted EBITDA reported by different companies. In addition, Adjusted EBITDA presented below is not calculated or presented on the same basis as Consolidated EBITDA as defined in our partnership agreement or Consolidated EBITDDA as defined in Opco's debt agreements.
See
Note 13. Debt
included in the Notes to Consolidated Financial Statements in Item 8. "Financial Statements and Supplementary Data" included elsewhere in this Annual Report on Form 10-K for a description of Opco’s debt agreements.
Adjusted EBITDA is a supplemental performance measure used by our management and by external users of our financial statements, such as investors, commercial banks, research analysts and others to assess the financial performance of our assets without regard to financing methods, capital structure or historical cost basis.
The following table reconciles net income (loss) from continuing operations (the most comparable GAAP financial measure) to Adjusted EBITDA for the years ended
December 31, 2017, 2016, 2015, 2014, and 2013
:
|
|
Year Ended December 31,
|
||||||||||||||||||
|
(In thousands)
|
2017
|
2016
|
2015
|
2014
|
2013
|
||||||||||||||
|
Net income (loss) from continuing operations
|
$
|
89,208
|
|
$
|
95,214
|
|
$
|
(260,171
|
)
|
$
|
96,713
|
|
$
|
169,621
|
|
||||
|
Less: equity earnings from unconsolidated investment
|
(40,457
|
)
|
(40,061
|
)
|
(49,918
|
)
|
(41,416
|
)
|
(34,186
|
)
|
|||||||||
|
Less: gain on reserve swap
|
—
|
|
—
|
|
(9,290
|
)
|
(5,690
|
)
|
(8,149
|
)
|
|||||||||
|
Add: distributions from unconsolidated investment
|
49,000
|
|
46,550
|
|
46,795
|
|
46,638
|
|
72,946
|
|
|||||||||
|
Add: interest expense, net
|
82,721
|
|
90,531
|
|
89,744
|
|
79,427
|
|
64,119
|
|
|||||||||
|
Add: debt modification expense
|
7,939
|
|
—
|
|
—
|
|
—
|
|
—
|
|
|||||||||
|
Add: loss on extinguishment of debt
|
4,107
|
|
—
|
|
—
|
|
—
|
|
—
|
|
|||||||||
|
Add: depreciation, depletion and amortization
|
35,993
|
|
46,272
|
|
60,916
|
|
61,894
|
|
63,367
|
|
|||||||||
|
Add: asset impairments
|
3,031
|
|
16,926
|
|
384,545
|
|
26,209
|
|
734
|
|
|||||||||
|
Adjusted EBITDA
|
$
|
231,542
|
|
|
$
|
255,432
|
|
|
$
|
262,621
|
|
|
$
|
263,775
|
|
|
$
|
328,452
|
|
43
Introduction
The following discussion and analysis presents management’s view of our business, financial condition and overall performance and should be read in conjunction with our consolidated financial statements and footnotes included elsewhere in this filing. Our discussion and analysis consists of the following subjects:
•
Executive Overview
•
Results of Operations
•
Liquidity and Capital Resources
•
Off-Balance Sheet Transactions
•
Inflation
•
Environmental Regulation
•
Related Party Transactions
•
Summary of Critical Accounting Estimates
•
Recent Accounting Standards
As used in this Item 7, unless the context otherwise requires: "we," "our," "us" and the "Partnership" refer to Natural Resource Partners L.P. and, where the context requires, our subsidiaries. References to "NRP" and "Natural Resource Partners" refer to Natural Resource Partners L.P. only, and not to NRP (Operating) LLC or any of Natural Resource Partners L.P.’s subsidiaries. References to "Opco" refer to NRP (Operating) LLC, a wholly owned subsidiary of NRP, and its subsidiaries. References to NRP Oil and Gas refer to NRP Oil and Gas LLC, a wholly owned subsidiary of NRP. NRP Finance Corporation ("NRP Finance") is a wholly owned subsidiary of NRP and a co-issuer with NRP on the 10.50% senior notes due 2022 (the "2022 Notes").
44
Executive Overview
We are a diversified natural resource company engaged principally in the business of owning, operating, managing and leasing a diversified portfolio of mineral properties in the United States, including interests in coal, trona and soda ash, construction aggregates and other natural resources. Our common units trade on the New York Stock Exchange under the symbol "NRP".
Our business is organized into three operating segments:
Coal Royalty and Other
—consists primarily of coal royalty properties and coal-related transportation and processing assets. Other assets include aggregate, industrial mineral and oil and gas royalty properties and timber. Our coal reserves are primarily located in Appalachia, the Illinois Basin and the Western United States. Our aggregates and industrial minerals are primarily located in Pennsylvania, West Virginia, Tennessee, Kentucky and Louisiana. Our oil and gas royalty assets are primarily located in Louisiana.
Soda Ash
—consists of our 49% non-controlling equity interest in a trona ore mining operation and soda ash refinery in the Green River Basin, Wyoming. Ciner Resources LP, our operating partner, mines the trona, processes it into soda ash, and distributes the soda ash both domestically and internationally into the glass and chemicals industries. We receive regular quarterly distributions from this business.
Construction Aggregates
—consists of our construction materials business that operates hard rock quarries, an underground limestone mine, sand and gravel plants, asphalt plants and marine terminals. The construction aggregates business
operates in Pennsylvania, West Virginia, Tennessee, Kentucky and Louisiana.
For the year ended
December 31, 2017
, our consolidated financial results included:
|
(In thousands)
|
|||
|
Revenues and other income
|
$
|
378,017
|
|
|
Net income from continuing operations
|
$
|
89,208
|
|
|
Adjusted EBITDA
(1)
|
$
|
231,542
|
|
|
Operating cash flow provided by continuing operations
|
$
|
127,838
|
|
|
Investing cash flow provided by continuing operations
|
$
|
3,337
|
|
|
Financing cash flow (used in) continuing operations
|
$
|
(141,719
|
)
|
|
Distributable Cash Flow ("DCF")
(1)
|
$
|
132,141
|
|
|
(1)
|
See "Results of Operations" below for additional information regarding non-GAAP financial measures and reconciliations to the most comparable GAAP financial measures.
|
2017 Recapitalization Transactions and Debt Reduction
During the first quarter of 2017, we completed the recapitalization transactions that improved our liquidity and strengthened our balance sheet. These recapitalization transactions included the issuance of $250 million of Class A Preferred Units and the issuance of Warrants to purchase Common Units, and the extension of the majority of our 2018 debt maturities to 2020 and 2022. For more information on these transactions, see
Note 3. Class A Convertible Preferred Units and Warrants
and
Note 13. Debt
in the Notes to Consolidated Financial Statements under Item 8 in this Annual Report on Form 10-K, which is incorporated herein by reference.
During 2017, we reduced our debt by
$311.1 million
. See "Liquidity and Capital Resources" below for additional information on our debt reduction. We remain focused on further reducing our debt, improving our credit metrics and creating long-term value for our stakeholders.
45
Current Results/Market Commentary
Coal Royalty and Other Business Segment
For the year ended December 31,
2017
, our Coal Royalty and Other business segment financial results included the following:
|
(In thousands)
|
|||
|
Revenues and other income
|
$
|
205,868
|
|
|
Net income from continuing operations
|
$
|
154,899
|
|
|
Adjusted EBITDA
(1)
|
$
|
181,280
|
|
|
Operating cash flow provided by continuing operations
|
$
|
166,138
|
|
|
Investing cash flow provided by continuing operations
|
$
|
4,161
|
|
|
Financing cash flow provided by continuing operations
|
$
|
517
|
|
|
DCF
(1)
|
$
|
170,299
|
|
|
(1)
|
See "—Results of Operations" below for additional information regarding non-GAAP financial measures and reconciliations to the most comparable GAAP financial measures.
|
Metallurgical coal prices were significantly higher during 2017 as compared to the prior year driven by supply constraints and a 5% increase in worldwide steel production, according to data published by the World Steel Association. Increased steel demand combined with a reduction in Chinese steel exports led to higher steel prices and steel producer profit margins internationally, which supports higher prices for raw material inputs such as metallurgical coal and coke. Declines in Australian metallurgical exports due to impacts from Cyclone Debbie, logistical constraints and industry-wide operational challenges led to positive metallurgical coal supply and demand fundamentals. While domestic metallurgical coal production increased in 2017, domestic supply response was impacted by a lack of capital investment and workforce constraints. As a result of these market conditions, metallurgical prices in 2017 reached the highest levels since 2012. Benefiting from higher metallurgical coal prices, we derived approximately
58%
of our coal royalty revenues and approximately
45%
of our coal royalty production from metallurgical coal during 2017. For 2018, we expect metallurgical coal markets to remain tight due to continued global economic growth and supportive steel industry fundamentals combined with logistical and operational supply constraints across the industry.
Thermal coal prices in Appalachia improved over the prior year primarily as a result of increased export demand from Asia and northern Europe whereas Illinois Basin thermal prices remained relatively flat year over year. According to the U.S. Energy Information Administration, domestic electricity generation from coal decreased 3% during 2017 and was negatively impacted by mild weather in coal heavy regions, coal plant retirements and continued gains by renewables in the electricity generation mix. During 2017, thermal coal benefited from higher average natural gas prices, which increased 18%, from $2.55/mmBtu in 2016 to $3.02/mmBtu in 2017. Coal’s relative share of the electricity generation mix in 2017 was roughly flat at 30% of the total, while the relative share of natural gas declined from 34% in 2016 to 32% in 2017. As a result, domestic thermal markets were oversupplied in 2017 despite the relative strength in export demand and shrinking utility inventory stockpiles. During 2018, we expect domestic thermal coal markets to remain challenged. Long term, domestic thermal production and prices will continue to be negatively impacted by low natural gas prices, coal fired power plant retirements and the availability of renewable generation.
46
Soda Ash Business Segment
For the year ended December 31,
2017
, our Soda Ash business segment financial results included the following:
|
(In thousands)
|
|||
|
Revenues and other income
|
$
|
40,457
|
|
|
Net income from continuing operations
|
$
|
40,457
|
|
|
Adjusted EBITDA
(1)
|
$
|
49,000
|
|
|
Operating cash flow provided by continuing operations
|
$
|
43,354
|
|
|
Investing cash flow provided by continuing operations
|
$
|
5,646
|
|
|
DCF
(1)
|
$
|
49,000
|
|
|
(1)
|
See "—Results of Operations" below for additional information regarding non-GAAP financial measures and reconciliations to the most comparable GAAP financial measures.
|
During the year ended
December 31, 2017
, international prices for soda ash, particularly in Asia, continued to be strong, and domestic prices have improved slightly over
2016
. Income from this segment was slightly higher in the year ended December 31,
2017
compared to the prior year as the effect of the increased prices noted above were offset by temporary production issues that were resolved in the fourth quarter of 2017. During the year ended
December 31, 2017
, we received distributions totaling
$49.0 million
.
We expect the international market to remain strong in 2018 as a result of continued strength in Asia and a smaller than expected impact from the new soda ash production capacity coming on line in Turkey. Prices, both internationally and domestically, are expected to remain around current levels during the year.
Construction Aggregates Business Segment
For the year ended December 31,
2017
, our Construction Aggregates business segment financial results included the following:
|
(In thousands)
|
|||
|
Revenues and other income
|
$
|
131,692
|
|
|
Net income from continuing operations
|
$
|
6,428
|
|
|
Adjusted EBITDA (1)
|
$
|
19,764
|
|
|
Operating cash flow provided by continuing operations
|
$
|
15,687
|
|
|
Investing cash flow used by continuing operations
|
$
|
(6,470
|
)
|
|
Financing cash flow used by continuing operations
|
$
|
(1,293
|
)
|
|
DCF (1)
|
$
|
10,183
|
|
|
(1)
|
See "—Results of Operations" below for additional information regarding non-GAAP financial measures and reconciliations to the most comparable GAAP financial measures.
|
Our overall construction aggregates performance in the year ended December 31,
2017
improved compared to the prior year primarily due to a higher production and sales of crushed stone, gravel and sand, higher delivery and haul income and increased road construction and asphalt paving projects. Our construction aggregates business is largely dependent on the strength of the local markets that it serves. In particular, key drivers of performance in the regions of our operations include: 1) natural gas drilling customers in the Marcellus shale, 2) traditional construction markets of Southwest Pennsylvania and Northern West Virginia, 3) energy-related and infrastructure spending in the Louisiana market, and 4) military spending in the Clarksville, Tennessee market.
47
Results of Operations
Year Ended December 31,
2017
Compared to Year Ended December 31,
2016
Revenues and Other Income
Revenues and other income
decreased
$22.0 million
, or
6%
, from
$400.1 million
in the year ended
December 31, 2016
to
$378.0 million
in the year ended
December 31, 2017
. The following table shows our revenues and other income by business segment for the year ended
December 31, 2017
and
2016
:
|
(In thousands)
|
Coal Royalty and Other
|
Soda Ash
|
Construction Aggregates
|
Total
|
||||||||||||
|
2017
|
||||||||||||||||
|
Revenues and other income
|
$
|
205,868
|
|
$
|
40,457
|
|
$
|
131,692
|
|
$
|
378,017
|
|
||||
|
Percentage of total
|
54
|
%
|
11
|
%
|
35
|
%
|
||||||||||
|
2016
|
||||||||||||||||
|
Revenues and other income
|
$
|
239,183
|
|
$
|
40,061
|
|
$
|
120,815
|
|
$
|
400,059
|
|
||||
|
Percentage of total
|
60
|
%
|
10
|
%
|
30
|
%
|
||||||||||
The changes in revenue and other income are discussed for each of the business segments below:
48
Coal Royalty and Other
Revenues and other income related to our Coal Royalty and Other segment
decreased
$33.3 million
, or
14%
, from
$239.2 million
in the year ended
December 31, 2016
to
$205.9 million
in the year ended
December 31, 2017
. The table below presents coal production and coal royalty revenues (including affiliates) derived from our major coal producing regions and the significant categories of other coal royalty and other revenues:
|
|
For the Year Ended December 31,
|
Increase
(Decrease)
|
Percentage
Change
|
|||||||||||
|
(In thousands, except per ton data)
|
2017
|
2016
|
||||||||||||
|
Coal production (tons)
|
||||||||||||||
|
Appalachia
|
||||||||||||||
|
Northern
|
2,136
|
|
2,312
|
|
(176
|
)
|
(8
|
)%
|
||||||
|
Central
|
14,735
|
|
13,222
|
|
1,513
|
|
11
|
%
|
||||||
|
Southern
|
2,256
|
|
2,776
|
|
(520
|
)
|
(19
|
)%
|
||||||
|
Total Appalachia
|
19,127
|
|
18,310
|
|
817
|
|
4
|
%
|
||||||
|
Illinois Basin
|
4,373
|
|
8,116
|
|
(3,743
|
)
|
(46
|
)%
|
||||||
|
Northern Powder River Basin
|
4,386
|
|
3,781
|
|
605
|
|
16
|
%
|
||||||
|
Gulf Coast
|
—
|
|
0.4
|
|
—
|
|
—
|
%
|
||||||
|
Total coal production
|
27,886
|
|
30,207
|
|
(2,321
|
)
|
(8
|
)%
|
||||||
|
Coal royalty revenue per ton
|
||||||||||||||
|
Appalachia
|
||||||||||||||
|
Northern
|
$
|
1.53
|
|
$
|
1.15
|
|
$
|
0.38
|
|
33
|
%
|
|||
|
Central
|
5.12
|
|
3.64
|
|
1.48
|
|
41
|
%
|
||||||
|
Southern
|
5.94
|
|
3.84
|
|
2.10
|
|
55
|
%
|
||||||
|
Illinois Basin
|
3.88
|
|
3.66
|
|
0.22
|
|
6
|
%
|
||||||
|
Northern Powder River Basin
|
2.65
|
|
2.81
|
|
(0.16
|
)
|
(6
|
)%
|
||||||
|
Gulf Coast
|
—
|
|
3.28
|
|
(3.28
|
)
|
(100
|
)%
|
||||||
|
Combined average coal royalty revenue per ton
|
4.33
|
|
3.37
|
|
0.96
|
|
28
|
%
|
||||||
|
Coal royalty revenues
|
||||||||||||||
|
Appalachia
|
||||||||||||||
|
Northern
|
$
|
3,271
|
|
$
|
2,667
|
|
$
|
604
|
|
23
|
%
|
|||
|
Central
|
75,489
|
|
48,119
|
|
27,370
|
|
57
|
%
|
||||||
|
Southern
|
13,399
|
|
10,660
|
|
2,739
|
|
26
|
%
|
||||||
|
Total Appalachia
|
92,159
|
|
61,446
|
|
30,713
|
|
50
|
%
|
||||||
|
Illinois Basin
|
16,989
|
|
29,680
|
|
(12,691
|
)
|
(43
|
)%
|
||||||
|
Northern Powder River Basin
|
11,642
|
|
10,637
|
|
1,005
|
|
9
|
%
|
||||||
|
Gulf Coast
|
—
|
|
1
|
|
(1
|
)
|
(100
|
)%
|
||||||
|
Total coal royalty revenue
|
$
|
120,790
|
|
$
|
101,764
|
|
$
|
19,026
|
|
19
|
%
|
|||
|
Other revenues
|
||||||||||||||
|
Minimums recognized as revenue
|
$
|
30,822
|
|
$
|
64,591
|
|
$
|
(33,769
|
)
|
(52
|
)%
|
|||
|
Property tax revenue
|
5,124
|
|
10,457
|
|
(5,333
|
)
|
(51
|
)%
|
||||||
|
Wheelage
|
4,734
|
|
2,374
|
|
2,360
|
|
99
|
%
|
||||||
|
Coal overriding royalty revenue
|
9,836
|
|
2,281
|
|
7,555
|
|
331
|
%
|
||||||
|
Lease assignment fee
|
1,000
|
|
—
|
|
1,000
|
|
100
|
%
|
||||||
|
Hard mineral royalty revenues
|
4,241
|
|
3,163
|
|
1,078
|
|
34
|
%
|
||||||
|
Oil and gas royalty revenues
|
4,225
|
|
3,537
|
|
688
|
|
19
|
%
|
||||||
|
Other
|
1,029
|
|
2,612
|
|
(1,583
|
)
|
(61
|
)%
|
||||||
|
Total other revenues
|
$
|
61,011
|
|
$
|
89,015
|
|
$
|
(28,004
|
)
|
(31
|
)%
|
|||
|
Coal royalty and other income
|
181,801
|
|
190,779
|
|
(8,978
|
)
|
(5
|
)%
|
||||||
|
Transportation and processing
|
20,522
|
|
19,336
|
|
1,186
|
|
6
|
%
|
||||||
|
Gain on coal royalty and other segment asset sales
|
3,545
|
|
29,068
|
|
(25,523
|
)
|
(88
|
)%
|
||||||
|
Total coal royalty and other segment revenues and other income
|
$
|
205,868
|
|
$
|
239,183
|
|
$
|
(33,315
|
)
|
(14
|
)%
|
|||
49
Coal royalty revenues
increased
$19.0 million
, or
19%
, from
$101.8 million
in the year ended December 31, 2016 to
$120.8 million
in the year ended December 31, 2017. Further discussion of the key drivers for the increase follows:
|
•
|
Appalachia: Coal royalty revenue increased
$30.7 million
as a result of increased metallurgical coal prices and production.
|
|
•
|
Illinois Basin: Lower production partially offset by higher royalty revenue per ton led to a
$12.7 million
decrease in coal royalty revenue. The decreased production was primarily a result of the temporary relocation of certain production off of NRP's coal reserves, which resulted in a $7.5 million increase in coal overriding royalty revenue and wheelage associated with the production of non-NRP coal.
|
Total other revenues decreased
$28.0 million
in 2017 compared to 2016 primarily as a result of a
$33.8 million
decrease in minimums recognized as revenue due to certain lease modifications and terminations in the second quarter 2016 and a
$5.3 million
decrease in property tax reimbursements. However, the decrease in property tax revenue was fully offset by lower property tax expenses as described in operating and maintenance expenses below. These decreases were partially offset by an increase in coal override revenue as discussed above.
Gain on coal royalty and other segment asset sales decreased
$25.5 million
year-over-year primarily as a result of numerous asset sales completed during the year ended December 30, 2016.
Construction Aggregates
The table below presents the significant categories of Construction Aggregates revenues:
|
Years Ended December 31,
|
Increase
(Decrease)
|
Percentage
Change
|
||||||||||||
|
(In thousands)
|
2017
|
2016
|
||||||||||||
|
Crushed stone, sand & gravel
|
$
|
60,822
|
|
$
|
55,623
|
|
$
|
5,199
|
|
9
|
%
|
|||
|
Delivery and fuel income
|
38,941
|
|
36,017
|
|
2,924
|
|
8
|
%
|
||||||
|
Road construction and asphalt paving
|
18,411
|
|
17,047
|
|
1,364
|
|
8
|
%
|
||||||
|
Other
|
13,207
|
|
12,115
|
|
1,092
|
|
9
|
%
|
||||||
|
Total construction aggregates revenues
|
131,381
|
|
120,802
|
|
10,579
|
|
9
|
%
|
||||||
|
Gain on asset sales, net
|
311
|
|
13
|
|
298
|
|
2,292
|
%
|
||||||
|
Total construction aggregates revenues and other income
|
$
|
131,692
|
|
$
|
120,815
|
|
$
|
10,877
|
|
9
|
%
|
|||
Revenues and other income related to our Construction Aggregates segment
increased
$10.9 million
, or
9%
, from
$120.8 million
in the year ended
December 31, 2016
to
$131.7 million
in the year ended
December 31, 2017
. The increase was primarily due to higher sales volumes.
Operating and Maintenance Expenses (including affiliates)
Operating and maintenance expenses (including affiliates)
increased
$6.0 million
, or
5%
, from
$130.5 million
in the year ended
December 31, 2016
to
$136.5 million
in the year ended
December 31, 2017
. This
increase
is primarily related to
increased
costs within our Construction Aggregates segment, partially offset by
decreased
costs within the Coal Royalty and Other segment.
|
•
|
Construction Aggregates segment costs
increased
$11.0 million
, or
11%
from
$100.7 million
in the year ended
December 31, 2016
to
$111.6 million
in the year ended
December 31, 2017
. This increase is primarily related to an increase in production costs, repairs and maintenance and labor costs due to the increase in production and sales as discussed above.
|
|
•
|
Coal Royalty and Other segment costs
decreased
$5.0 million
, or
17%
from
$29.9 million
in the year ended
December 31, 2016
to
$24.9 million
the year ended
December 31, 2017
. This
decrease
is primarily related to $5.8 million lower property tax expense as a result of lower property tax rates and property tax values primarily in Kentucky and West Virginia and lower employee-related costs.
|
50
Depreciation, Depletion and Amortization ("DD&A") Expense
DD&A expense
decreased
$10.3 million
, or
22%
, from
$46.3 million
in the year ended
December 31, 2016
to
$36.0 million
in the year ended
December 31, 2017
. This
decrease
is primarily driven by lower coal production in the Illinois Basin and $1.9 million lower depreciation expense of construction aggregate assets due to fully depreciated assets.
General and Administrative ("G&A") Expense (including affiliates)
Corporate and financing G&A expense (including affiliates) includes corporate headquarters, financing and centralized treasury and accounting. These costs
decreased
$2.1 million
, or
10%
, from
$20.6 million
in the year ended
December 31, 2016
to
$18.5 million
in the year ended
December 31, 2017
. This
decrease
is primarily due to decreased legal, consulting and advisory fees incurred in 2016 as a result of the recapitalization transactions completed in March 2017.
Asset Impairments
Asset impairments
decreased
$13.9 million
, or
82%
, from
$16.9 million
in the year ended
December 31, 2016
to
$3.0 million
in the year ended
December 31, 2017
. Asset impairments in the year ended
December 31, 2017
primarily consisted of certain coal, aggregates and timber properties. Asset impairments in the year ended
December 31, 2016
primarily consisted of certain coal and hard mineral properties.
Interest Expense (including affiliates)
Interest expense (including affiliates)
decreased
$7.7 million
, or
8%
, from
$90.6 million
in the year ended
December 31, 2016
to
$82.9 million
in the year ended
December 31, 2017
. This
decrease
is primarily related to lower debt balances during 2017 as a result of the recapitalization transactions entered into in March 2017.
Debt Modification Expense
Debt modification expense was
$7.9 million
for the year ended
December 31, 2017
and related to costs incurred as a result of the exchange of $241 million of our 2018 Senior Notes for 2022 Senior Notes in March 2017.
Loss on Extinguishment of Debt
Loss on extinguishment of debt was
$4.1 million
for the year ended
December 31, 2017
and related to the 4.563% premium paid to redeem the 2018 Senior Notes in April 2017.
Income (Loss) from Discontinued Operations
Income from discontinued operations
decreased
$2.2 million
, from income of
$1.7 million
in the year ended
December 31, 2016
to a loss of
$0.5 million
in the year ended
December 31, 2017
. The decrease is primarily a result of the sale of the discontinued non-operated oil and gas working interest assets in July 2016.
51
Adjusted EBITDA (Non-GAAP Financial Measure)
The following table reconciles net income (loss) from continuing operations (the most comparable GAAP financial measure) to Adjusted EBITDA by business segment for the years ended
December 31, 2017
and
2016
:
|
Operating Segments
|
||||||||||||||||||||
|
For the Year Ended (In thousands)
|
Coal Royalty and Other
|
Soda Ash
|
Construction Aggregates
|
Corporate and Financing
|
Total
|
|||||||||||||||
|
December 31, 2017
|
||||||||||||||||||||
|
Net income (loss) from continuing operations
|
$
|
154,899
|
|
$
|
40,457
|
|
$
|
6,428
|
|
$
|
(112,576
|
)
|
$
|
89,208
|
|
|||||
|
Less: equity earnings from unconsolidated investment
|
—
|
|
(40,457
|
)
|
—
|
|
—
|
|
(40,457
|
)
|
||||||||||
|
Add: distributions from unconsolidated investment
|
—
|
|
49,000
|
|
—
|
|
—
|
|
49,000
|
|
||||||||||
|
Add: interest expense, net
|
—
|
|
—
|
|
693
|
|
82,028
|
|
82,721
|
|
||||||||||
|
Add: debt modification expense
|
—
|
|
—
|
|
—
|
|
7,939
|
|
7,939
|
|
||||||||||
|
Add: loss on extinguishment of debt
|
—
|
|
—
|
|
—
|
|
4,107
|
|
4,107
|
|
||||||||||
|
Add: depreciation, depletion and amortization
|
23,414
|
|
—
|
|
12,579
|
|
—
|
|
35,993
|
|
||||||||||
|
Add: asset impairments
|
2,967
|
|
—
|
|
64
|
|
—
|
|
3,031
|
|
||||||||||
|
Adjusted EBITDA
|
$
|
181,280
|
|
$
|
49,000
|
|
$
|
19,764
|
|
$
|
(18,502
|
)
|
$
|
231,542
|
|
|||||
|
December 31, 2016
|
||||||||||||||||||||
|
Net income (loss) from continuing operations
|
$
|
161,816
|
|
$
|
40,061
|
|
$
|
4,438
|
|
$
|
(111,101
|
)
|
$
|
95,214
|
|
|||||
|
Less: equity earnings from unconsolidated investment
|
—
|
|
(40,061
|
)
|
—
|
|
—
|
|
(40,061
|
)
|
||||||||||
|
Add: distributions from unconsolidated investment
|
—
|
|
46,550
|
|
—
|
|
—
|
|
46,550
|
|
||||||||||
|
Add: interest expense, net
|
—
|
|
—
|
|
—
|
|
90,531
|
|
90,531
|
|
||||||||||
|
Add: depreciation, depletion and amortization
|
31,766
|
|
—
|
|
14,506
|
|
—
|
|
46,272
|
|
||||||||||
|
Add: asset impairments
|
15,861
|
|
—
|
|
1,065
|
|
—
|
|
16,926
|
|
||||||||||
|
Adjusted EBITDA
|
$
|
209,443
|
|
$
|
46,550
|
|
$
|
20,009
|
|
$
|
(20,570
|
)
|
$
|
255,432
|
|
|||||
Adjusted EBITDA
decreased
$23.9 million
, or
9%
, from
$255.4 million
in the year ended
December 31, 2016
to
$231.5 million
in the year ended
December 31, 2017
. The
decrease
is primarily a result of the following:
|
•
|
Coal Royalty and Other segment Adjusted EBITDA
decreased
$28.2 million
. While performance of our coal-related assets improved as described above, the prior year amount included
$40.5 million
of revenue resulting from one-time lease modifications and
$25.5 million
higher gains on asset sales.
|
|
•
|
Soda Ash segment Adjusted EBITDA
increased
$2.5 million
as a result of increased cash distributions received in the year ended
December 31, 2017
.
|
|
•
|
Construction Aggregates segment Adjusted EBITDA was flat in the year ended
December 31, 2017
compared to
2016
. Increased production and sales volume, increased marine terminal activity and higher margins on road construction and asphalt paving projects were offset by increased production costs and repairs and maintenance expenses.
|
|
•
|
Corporate and financing Adjusted EBITDA increased primarily due to legal and consulting fees related to the recapitalization activities incurred in 2016.
|
See "Item 6. Selected Financial Data—Non-GAAP Financial Measures—Adjusted EBITDA" for an explanation of Adjusted EBITDA.
52
Distributable Cash Flow
(Non-GAAP Financial Measure)
The following table presents the three major categories of the statement of cash flows by business segment for the years ended
December 31, 2017
and
2016
:
|
Operating Segments
|
||||||||||||||||||||
|
For the Year Ended (In thousands)
|
Coal Royalty and Other
|
Soda Ash
|
Construction Aggregates
|
Corporate and Financing
|
Total
|
|||||||||||||||
|
December 31, 2017
|
||||||||||||||||||||
|
Net cash provided by (used in) operating activities of continuing operations
|
$
|
166,138
|
|
$
|
43,354
|
|
$
|
15,687
|
|
$
|
(97,341
|
)
|
$
|
127,838
|
|
|||||
|
Net cash provided by (used in) investing activities of continuing operations
|
4,161
|
|
5,646
|
|
(6,470
|
)
|
—
|
|
3,337
|
|
||||||||||
|
Net cash provided by (used in) financing activities of continuing operations
|
517
|
|
—
|
|
(1,293
|
)
|
(140,943
|
)
|
(141,719
|
)
|
||||||||||
|
December 31, 2016
|
||||||||||||||||||||
|
Net cash provided by (used in) operating activities of continuing operations
|
$
|
134,490
|
|
$
|
46,550
|
|
$
|
20,400
|
|
$
|
(100,797
|
)
|
$
|
100,643
|
|
|||||
|
Net cash provided by (used in) investing activities of continuing operations
|
65,057
|
|
—
|
|
(5,114
|
)
|
—
|
|
59,943
|
|
||||||||||
|
Net cash provided by (used in) financing activities of continuing operations
|
16
|
|
(7,229
|
)
|
(1,825
|
)
|
(152,381
|
)
|
(161,419
|
)
|
||||||||||
53
The following table reconciles net cash provided by operating activities (the most comparable GAAP financial measure) by business segment to DCF for the years ended
December 31, 2017
and
2016
:
|
Operating Segments
|
||||||||||||||||||||
|
For the Year Ended (In thousands)
|
Coal Royalty and Other
|
Soda Ash
|
Construction Aggregates
|
Corporate and Financing
|
Total
|
|||||||||||||||
|
December 31, 2017
|
||||||||||||||||||||
|
Net cash provided by (used in) operating activities of continuing operations
|
$
|
166,138
|
|
$
|
43,354
|
|
$
|
15,687
|
|
$
|
(97,341
|
)
|
$
|
127,838
|
|
|||||
|
Add: return of equity from unconsolidated investment
|
—
|
|
5,646
|
|
—
|
|
—
|
|
5,646
|
|
||||||||||
|
Add: proceeds from sale of PP&E
|
177
|
|
—
|
|
831
|
|
—
|
|
1,008
|
|
||||||||||
|
Add: proceeds from sale of mineral rights
|
974
|
|
—
|
|
—
|
|
—
|
|
974
|
|
||||||||||
|
Add: return of long-term contract receivables (including affiliates)
|
3,010
|
|
—
|
|
—
|
|
—
|
|
3,010
|
|
||||||||||
|
Less: maintenance capital expenditures
|
—
|
|
—
|
|
(6,335
|
)
|
—
|
|
(6,335
|
)
|
||||||||||
|
Distributable Cash Flow
|
$
|
170,299
|
|
$
|
49,000
|
|
$
|
10,183
|
|
$
|
(97,341
|
)
|
$
|
132,141
|
|
|||||
|
December 31, 2016
|
||||||||||||||||||||
|
Net cash provided by (used in) operating activities of continuing operations
|
$
|
134,490
|
|
$
|
46,550
|
|
$
|
20,400
|
|
$
|
(100,797
|
)
|
$
|
100,643
|
|
|||||
|
Add: proceeds from sale of PP&E
|
1,084
|
|
—
|
|
266
|
|
—
|
|
1,350
|
|
||||||||||
|
Add: proceeds from sale of mineral rights
|
61,033
|
|
—
|
|
—
|
|
—
|
|
61,033
|
|
||||||||||
|
Add: proceeds from sale of assets included in discontinued operations
|
—
|
|
—
|
|
—
|
|
—
|
|
109,872
|
|
||||||||||
|
Add: return of long-term contract receivables—affiliate
|
2,968
|
|
—
|
|
—
|
|
—
|
|
2,968
|
|
||||||||||
|
Less: maintenance capital expenditures
|
(28
|
)
|
—
|
|
(4,423
|
)
|
—
|
|
(4,451
|
)
|
||||||||||
|
Distributable Cash Flow
|
$
|
199,547
|
|
$
|
46,550
|
|
$
|
16,243
|
|
$
|
(100,797
|
)
|
$
|
271,415
|
|
|||||
DCF
decreased
$139.3 million
, or
51%
, from
$271.4 million
in the year ended
December 31, 2016
to
$132.1 million
in the year ended
December 31, 2017
. This
decrease
is due primarily to the following:
|
•
|
$109.9 million
net cash proceeds from the sale of assets included in discontinued operations in the year ended December 31, 2016.
|
|
•
|
Coal Royalty and Other segment: DCF
decreased
$29.2 million
primarily due to
$61.0 million
higher cash flow from asset sales in the year ended December 31, 2016 as compared to 2017, partially offset by
$31.8 million
improved performance of segment assets which increased DCF in the year ended
December 31, 2017
.
|
|
•
|
Construction Aggregates segment: While operating performance was flat as described in Adjusted EBITDA above, DCF
decreased
$6.1 million
due to lower operating cash flows primarily related to timing of cash receipts coupled with higher maintenance capital expenditures.
|
|
•
|
Corporate and Financing: DCF
increased
$3.5 million
primarily as a result of lower interest, legal, consulting and advisory fees following the completion of the recapitalization transactions in March 2017.
|
See "Item 6. Selected Financial Data—Non-GAAP Financial Measures—Distributable Cash Flow" for an explanation of Distributable Cash Flow.
54
Results of Operations
Year Ended
December 31, 2016
Compared to Year Ended
December 31, 2015
Revenues and Other Income
Revenues and other income decreased $39.5 million, or 9%, from $439.6 million in the year ended December 31, 2015 to $400.1 million in the year ended December 31, 2016. The following table shows our diversified sources of natural resource revenues and other income by business segment for the year ended December 31, 2016 and 2015:
|
(In thousands)
|
Coal Royalty and Other
|
Soda Ash
|
Construction Aggregates
|
Total
|
||||||||||||
|
2016
|
||||||||||||||||
|
Revenues
|
$
|
239,183
|
|
$
|
40,061
|
|
$
|
120,815
|
|
$
|
400,059
|
|
||||
|
Percentage of total
|
60
|
%
|
|
10
|
%
|
|
30
|
%
|
||||||||
|
2015
|
||||||||||||||||
|
Revenues
|
$
|
250,717
|
|
$
|
49,918
|
|
$
|
139,013
|
|
$
|
439,648
|
|
||||
|
Percentage of total
|
57
|
%
|
11
|
%
|
32
|
%
|
||||||||||
The changes in revenue and other income are discussed for each of the business segments below:
55
Coal Royalty and Other
Revenues and other income related to our Coal Royalty and Other segment decreased $11.5 million, or 5%, from $250.7 million in the year ended December 31, 2015 to $239.2 million in the year ended December 31, 2016. The table below presents coal production and coal royalty revenues (including affiliates) derived from our major coal producing regions and the significant categories of other coal royalty and other revenues:
|
|
For the Years Ended
December 31,
|
Increase
(Decrease)
|
Percentage
Change
|
|||||||||||
|
(In thousands, except per ton data)
|
2016
|
2015
|
||||||||||||
|
Coal production (tons)
|
||||||||||||||
|
Appalachia
|
||||||||||||||
|
Northern
|
2,312
|
|
9,562
|
|
(7,250
|
)
|
(76
|
)%
|
||||||
|
Central
|
13,222
|
|
16,862
|
|
(3,640
|
)
|
(22
|
)%
|
||||||
|
Southern
|
2,776
|
|
3,803
|
|
(1,027
|
)
|
(27
|
)%
|
||||||
|
Total Appalachia
|
18,310
|
|
30,227
|
|
(11,917
|
)
|
(39
|
)%
|
||||||
|
Illinois Basin
|
8,116
|
|
11,173
|
|
(3,057
|
)
|
(27
|
)%
|
||||||
|
Northern Powder River Basin
|
3,781
|
|
4,905
|
|
(1,124
|
)
|
(23
|
)%
|
||||||
|
Gulf Coast
|
0.4
|
|
740
|
|
(740
|
)
|
(100
|
)%
|
||||||
|
Total coal production
|
30,207
|
|
47,045
|
|
(16,838
|
)
|
(36
|
)%
|
||||||
|
Coal royalty revenue per ton
|
||||||||||||||
|
Appalachia
|
||||||||||||||
|
Northern
|
$
|
1.15
|
|
$
|
0.28
|
|
$
|
0.87
|
|
311
|
%
|
|||
|
Central
|
3.64
|
|
3.85
|
|
(0.21
|
)
|
(5
|
)%
|
||||||
|
Southern
|
3.84
|
|
4.57
|
|
(0.73
|
)
|
(16
|
)%
|
||||||
|
Illinois Basin
|
3.66
|
|
3.94
|
|
(0.28
|
)
|
(7
|
)%
|
||||||
|
Northern Powder River Basin
|
2.81
|
|
2.54
|
|
0.27
|
|
11
|
%
|
||||||
|
Gulf Coast
|
3.28
|
|
3.47
|
|
(0.19
|
)
|
(5
|
)%
|
||||||
|
Combined average coal royalty revenue per ton
|
3.37
|
|
3.06
|
|
0.31
|
|
10
|
%
|
||||||
|
Coal royalty revenues
|
||||||||||||||
|
Appalachia
|
||||||||||||||
|
Northern
|
$
|
2,667
|
|
$
|
2,672
|
|
$
|
(5
|
)
|
—
|
%
|
|||
|
Central
|
48,119
|
|
64,877
|
|
(16,758
|
)
|
(26
|
)%
|
||||||
|
Southern
|
10,660
|
|
17,390
|
|
(6,730
|
)
|
(39
|
)%
|
||||||
|
Total Appalachia
|
61,446
|
|
84,939
|
|
(23,493
|
)
|
(28
|
)%
|
||||||
|
Illinois Basin
|
29,680
|
|
44,063
|
|
(14,383
|
)
|
(33
|
)%
|
||||||
|
Northern Powder River Basin
|
10,637
|
|
12,443
|
|
(1,806
|
)
|
(15
|
)%
|
||||||
|
Gulf Coast
|
1
|
|
2,570
|
|
(2,569
|
)
|
(100
|
)%
|
||||||
|
Total coal royalty revenue
|
$
|
101,764
|
|
$
|
144,015
|
|
$
|
(42,251
|
)
|
(29
|
)%
|
|||
|
Other revenues
|
||||||||||||||
|
Minimums recognized as revenue
|
$
|
64,591
|
|
$
|
15,489
|
|
$
|
49,102
|
|
317
|
%
|
|||
|
Property tax revenue
|
10,457
|
|
11,258
|
|
(801
|
)
|
(7
|
)%
|
||||||
|
Wheelage
|
2,374
|
|
3,166
|
|
(792
|
)
|
(25
|
)%
|
||||||
|
Coal overriding royalty revenue
|
2,281
|
|
2,920
|
|
(639
|
)
|
(22
|
)%
|
||||||
|
Lease assignment fee
|
—
|
|
21,000
|
|
(21,000
|
)
|
(100
|
)%
|
||||||
|
Gain on reserve swap
|
—
|
|
9,290
|
|
(9,290
|
)
|
(100
|
)%
|
||||||
|
Hard mineral royalty revenues
|
3,163
|
|
8,090
|
|
(4,927
|
)
|
(61
|
)%
|
||||||
|
Oil and gas royalty revenues
|
3,537
|
|
4,364
|
|
(827
|
)
|
(19
|
)%
|
||||||
|
Other
|
2,612
|
|
2,156
|
|
456
|
|
21
|
%
|
||||||
|
Total other revenues
|
$
|
89,015
|
|
$
|
77,733
|
|
$
|
11,282
|
|
15
|
%
|
|||
|
Coal royalty and other income
|
190,779
|
|
221,748
|
|
(30,969
|
)
|
(14
|
)%
|
||||||
|
Transportation and processing
|
19,336
|
|
22,033
|
|
(2,697
|
)
|
(12
|
)%
|
||||||
|
Gain on coal royalty and other segment asset sales
|
29,068
|
|
6,936
|
|
22,132
|
|
319
|
%
|
||||||
|
Total coal royalty and other segment revenues and other income
|
$
|
239,183
|
|
$
|
250,717
|
|
$
|
(8,837
|
)
|
(4
|
)%
|
|||
Total coal production decreased 16.8 million tons, or 36%, from 47.0 million tons in the year ended December 31, 2015 to 30.2 million tons in the year ended December 31, 2016. Total coal royalty revenues decreased $42.3 million, or 29%, from $144.0 million in the year ended December 31, 2015 to $101.8 million in the year ended December 31, 2016. Total coal
56
production and coal royalty revenue decreases were driven by downward pressure in the coal markets as described above, with Central Appalachian thermal coal producers in particular continuing to face challenges, as their production costs remain high relative to sales prices.
Total other revenues increased $8.6 million in 2016 compared to 2015 primarily as a result of the agreements with certain lessees to either modify or terminate existing coal-related leases that resulted in the recognition of $40.5 million of deferred revenue. This increase was partially offset by non-recurring revenue transactions in 2015 that included $21.0 million in lease assignment fees and $9.3 million gain on reserve swap. Other revenues were also decreased $4.9 million in 2016 primarily as a result of the sale of our aggregates royalty assets in the first quarter of 2016.
Gain on coal royalty and other segment asset sales increased
$22.1 million
primarily as a result of the following asset sales during the first quarter of 2016:
1)
Oil and gas royalty and overriding royalty interests in several producing properties located in the Appalachian Basin for
$36.4 million gross sales proceeds. The effective date of the sale was January 1, 2016, and we recorded an $18.6 million
gain from this sale.
2)
Aggregate reserves and related royalty rights in the Coal Royalty and Other segment at three aggregates operations located
in Texas, Georgia and Tennessee for $10.0 million gross sales proceeds. The effective date of the sale was February 1,
2016, and we recorded a $1.5 million gain from this sale.
Soda Ash
Revenues and other income related to our equity investment in Ciner Wyoming decreased $9.8 million, or 20%, from $49.9 million in the year ended December 31, 2015 to $40.1 million in the year ended December 31, 2016. This decrease is primarily related to lower international prices compared to the prior year, in addition to higher royalty and G&A costs. These decreases were partially offset by an increase in soda ash volumes sold compared to the prior year.
Construction Aggregates
The table below presents the significant categories of Construction Aggregates revenues:
|
Years Ended December 31,
|
Increase
(Decrease)
|
Percentage
Change
|
||||||||||||
|
(In thousands, except per ton data)
|
2016
|
2015
|
||||||||||||
|
Crushed stone, sand & gravel
|
$
|
55,623
|
|
$
|
57,587
|
|
$
|
(1,964
|
)
|
(3
|
)%
|
|||
|
Delivery and fuel income
|
36,017
|
|
42,626
|
|
(6,609
|
)
|
(16
|
)%
|
||||||
|
Road construction and asphalt paving
|
17,047
|
|
14,964
|
|
2,083
|
|
14
|
%
|
||||||
|
Other
|
12,115
|
|
23,872
|
|
(11,757
|
)
|
(49
|
)%
|
||||||
|
Total revenues
|
120,802
|
|
139,049
|
|
(18,247
|
)
|
(13
|
)%
|
||||||
|
Gain (loss) on asset sales, net
|
13
|
|
(36
|
)
|
49
|
|
136
|
%
|
||||||
|
Total construction aggregates revenues and other income
|
$
|
120,815
|
|
$
|
139,013
|
|
$
|
(18,198
|
)
|
(13
|
)%
|
|||
Revenues and other income related to our Construction Aggregates segment decreased $18.2 million, or 13%, from $139.0 million in the year ended December 31, 2015 to $120.8 million in the year ended December 31, 2016. This decrease is primarily due to a decrease in construction aggregates and brokered stone revenue as well as lower delivery and fuel income year-over-year. Tonnage sold by the Construction Aggregates segment decreased 0.4 million tons, or 5% from 7.4 million tons in the year ended December 31, 2015 to 7.0 million tons in the year ended December 31, 2016 as a result of decreased construction aggregates demand in the oil and gas services sector that was partially offset by increased aggregates sales into the construction market.
Operating and Maintenance Expenses (including affiliates)
Operating and maintenance expenses (including affiliates) decreased $21.8 million, or 14%, from $152.3 million in the year ended December 31, 2015 to $130.5 million in the year ended December 31, 2016. Operating and maintenance expenses (including affiliates) in our Construction Aggregates segment decreased $16.2 million, or 14% from $116.9 million in the year ended December 31, 2015 to $100.7 million in the year ended December 31, 2016. This decrease is primarily due to the decline in materials cost as a result of the decrease in construction aggregates and brokered stone volume year-over-year due to reduced demand in the oil and gas sector and a decrease in delivery and fuel costs due to the lower construction aggregates production and brokered stone purchases year-over-year partially and effective variable cost management.
57
Depreciation, Depletion and Amortization ("DD&A") Expense
DD&A expense decreased $14.6 million, or 24%, from $60.9 million in the year ended December 31, 2015 to $46.3 million in the year ended December 31, 2016. This decrease is primarily related to the reduced cost basis of our coal and aggregates royalty mineral rights due to the asset impairments recorded in the third and fourth quarters of 2015 and the decline in coal royalty production year-over-year.
General and Administrative ("G&A") Expense (including affiliates)
Corporate and financing G&A expense (including affiliates) includes corporate headquarters, financing and centralized treasury and accounting. These costs increased $8.3 million, or 67%, from $12.3 million in the year ended December 31, 2015 to $20.6 million in the year ended December 31, 2016. This increase is primarily related to increased legal and consulting fees associated with the implementation of our long-term plan to strengthen our balance sheet, reduce debt and enhance our liquidity and increased LTIP expense as a result of our unit price increasing in 2016 compared to decreasing unit price in 2015 and the accelerated recognition of our LTIP awards granted in 2016
Asset Impairment
Asset impairments decreased $367.6 million, or 96%, from $384.5 million in the year ended December 31, 2015 to $16.9 million in the year ended December 31, 2016. We recorded the following asset impairments during the years ended December 31, 2016 and 2015:
|
For the Year Ended
December 31,
|
||||||||
|
(In thousands)
|
2016
|
2015
|
||||||
|
Coal Royalty and Other
|
||||||||
|
Mineral Rights
|
$
|
13,801
|
|
$
|
371,397
|
|
||
|
Plant and Equipment
|
2,060
|
|
6,930
|
|
||||
|
Total Coal Royalty and Other Impairment
|
$
|
15,861
|
|
$
|
378,327
|
|
||
|
Construction Aggregates
|
||||||||
|
Plant and Equipment
|
$
|
1,065
|
|
$
|
692
|
|
||
|
Goodwill
|
—
|
|
5,526
|
|
||||
|
Total Construction Aggregates Impairment
|
$
|
1,065
|
|
$
|
6,218
|
|
||
|
Total impairment
|
$
|
16,926
|
|
$
|
384,545
|
|
||
Coal Royalty and Other
Asset impairments decreased $362.4 million, or 96%, from $378.3 million in the year ended December 31, 2015 to $15.9 million in the year ended December 31, 2016. This decrease is primarily related to $257.5 million in coal property impairment, $70.5 million in oil and gas property impairment and $43.4 million in aggregate property impairment recorded during the year ended December 31, 2015 as compared to $12.1 million in coal property impairment and $1.7 million in aggregate property impairment recorded during the year ended December 31, 2016. The impairments in 2015 primarily resulted from the continued deterioration and expectations of further reductions in global and domestic coal demand due to reduced global steel demand, sustained low natural gas prices, and continued regulatory pressure on the electric power generation industry.
Construction Aggregates
Asset impairments decreased $5.1 million, or 82%, from $6.2 million in the year ended December 31, 2015 to $1.1 million in the year ended December 31, 2016. This decrease is primarily related to the $5.5 million write off of goodwill during the year ended December 31, 2015.
58
Income (Loss) from Discontinued Operations
Income from discontinued operations increased $313.2 million, from a loss of $311.5 million in the year ended December 31, 2015 to income of $1.7 million in the year ended December 31, 2016. The change in income (loss) from discontinued operations is primarily related to the $297.0 million asset impairments recorded in 2015, the sale of our non-operated oil and gas working interest assets that was completed in July 2016 with an effective date of April 1, 2016 and the $8.3 million gain on sale for the year ended December 31, 2016.
Adjusted EBITDA (Non-GAAP Financial Measure)
The following table reconciles net income (loss) from continuing operations (the most comparable GAAP financial measure) to Adjusted EBITDA by business segment for the years ended
December 31, 2016
and
2015
:
|
Operating Segments
|
||||||||||||||||||||
|
For the Year Ended (In thousands)
|
Coal Royalty and Other
|
Soda Ash
|
Construction Aggregates
|
Corporate and Financing
|
Total
|
|||||||||||||||
|
December 31, 2016
|
||||||||||||||||||||
|
Net income (loss) from continuing operations
|
$
|
161,816
|
|
$
|
40,061
|
|
$
|
4,438
|
|
$
|
(111,101
|
)
|
$
|
95,214
|
|
|||||
|
Less: equity earnings from unconsolidated investment
|
—
|
|
(40,061
|
)
|
—
|
|
—
|
|
(40,061
|
)
|
||||||||||
|
Add: distributions from unconsolidated investment
|
—
|
|
46,550
|
|
—
|
|
—
|
|
46,550
|
|
||||||||||
|
Add: interest expense, net
|
—
|
|
—
|
|
—
|
|
90,531
|
|
90,531
|
|
||||||||||
|
Add: depreciation, depletion and amortization
|
31,766
|
|
—
|
|
14,506
|
|
—
|
|
46,272
|
|
||||||||||
|
Add: asset impairments
|
15,861
|
|
—
|
|
1,065
|
|
—
|
|
16,926
|
|
||||||||||
|
Adjusted EBITDA
|
$
|
209,443
|
|
$
|
46,550
|
|
$
|
20,009
|
|
$
|
(20,570
|
)
|
$
|
255,432
|
|
|||||
|
December 31, 2015
|
||||||||||||||||||||
|
Net income (loss) from continuing operations
|
$
|
(208,248
|
)
|
$
|
49,918
|
|
$
|
251
|
|
$
|
(102,092
|
)
|
$
|
(260,171
|
)
|
|||||
|
Less: equity earnings from unconsolidated investment
|
—
|
|
(49,918
|
)
|
—
|
|
—
|
|
(49,918
|
)
|
||||||||||
|
Less: gain on reserve swap
|
(9,290
|
)
|
—
|
|
—
|
|
—
|
|
(9,290
|
)
|
||||||||||
|
Add: distributions from unconsolidated investment
|
—
|
|
46,795
|
|
—
|
|
—
|
|
46,795
|
|
||||||||||
|
Add: interest expense, net
|
—
|
|
—
|
|
—
|
|
89,744
|
|
89,744
|
|
||||||||||
|
Add: depreciation, depletion and amortization
|
45,338
|
|
—
|
|
15,578
|
|
—
|
|
60,916
|
|
||||||||||
|
Add: asset impairments
|
378,327
|
|
—
|
|
6,218
|
|
—
|
|
384,545
|
|
||||||||||
|
Adjusted EBITDA
|
$
|
206,127
|
|
$
|
46,795
|
|
$
|
22,047
|
|
$
|
(12,348
|
)
|
$
|
262,621
|
|
|||||
Adjusted EBITDA decreased $7.1 million, or 3%, from $262.6 million in the year ended December 31, 2015 to $255.5 million in the year ended December 31, 2016. The decrease is primarily a result of $42.3 million in reduced coal royalty revenue resulting from decreased coal production and coal royalty revenue per ton driven by the continued pressure on U.S. coal producers as described above, $21.0 million in non-recurring 2015 lease assignment fees, $4.9 million of reduced aggregates royalty revenue in 2016 due to decreased 2016 aggregates production and sales and $8.3 million of additional G&A expense in 2016 compared to 2015 as described above. These decreases were partially offset by a $49.1 million increase in minimums recognized as revenue primarily as a result of coal lease modifications or terminations that resulted in our lessee forfeiting their minimum royalty balances and $22.2 million of additional gains on asset sales as compared to the same period in 2015. See "Item 6. Selected Financial Data—Non-GAAP Financial Measures—Adjusted EBITDA" for an explanation of Adjusted EBITDA.
59
Distributable Cash Flow
(Non-GAAP Financial Measure)
The following table presents the three major categories of the statement of cash flows by business segment for the years ended
December 31, 2016
and
2015
:
|
Operating Segments
|
||||||||||||||||||||
|
For the Year Ended (In thousands)
|
Coal Royalty and Other
|
Soda Ash
|
Construction Aggregates
|
Corporate and Financing
|
Total
|
|||||||||||||||
|
December 31, 2016
|
||||||||||||||||||||
|
Net cash provided by (used in) operating activities of continuing operations
|
$
|
134,490
|
|
$
|
46,550
|
|
$
|
20,400
|
|
$
|
(100,797
|
)
|
$
|
100,643
|
|
|||||
|
Net cash provided by (used in) investing activities of continuing operations
|
65,057
|
|
—
|
|
(5,114
|
)
|
—
|
|
59,943
|
|
||||||||||
|
Net cash provided by (used in) financing activities of continuing operations
|
16
|
|
(7,229
|
)
|
(1,825
|
)
|
(152,381
|
)
|
(161,419
|
)
|
||||||||||
|
December 31, 2015
|
||||||||||||||||||||
|
Net cash provided by (used in) operating activities of continuing operations
|
$
|
204,934
|
|
$
|
43,029
|
|
$
|
23,605
|
|
$
|
(103,056
|
)
|
$
|
168,512
|
|
|||||
|
Net cash provided by (used in) investing activities of continuing operations
|
15,805
|
|
—
|
|
(8,820
|
)
|
—
|
|
6,985
|
|
||||||||||
|
Net cash used in financing activities of continuing operations
|
(2,744
|
)
|
—
|
|
—
|
|
(180,520
|
)
|
(183,264
|
)
|
||||||||||
60
The following table reconciles net cash provided by operating activities (the most comparable GAAP financial measure) by business segment to DCF for the years ended
December 31, 2016
and
2015
:
|
(In thousands)
|
Operating Segments
|
|||||||||||||||||||
|
For the Year Ended
|
Coal Royalty and Other
|
Soda Ash
|
Construction Aggregates
|
Corporate and Financing
|
Total
|
|||||||||||||||
|
December 31, 2016
|
||||||||||||||||||||
|
Net cash provided by (used in) operating activities of continuing operations
|
$
|
134,490
|
|
$
|
46,550
|
|
$
|
20,400
|
|
$
|
(100,797
|
)
|
$
|
100,643
|
|
|||||
|
Add: proceeds from sale of PP&E
|
1,084
|
|
—
|
|
266
|
|
—
|
|
1,350
|
|
||||||||||
|
Add: proceeds from sale of mineral rights
|
61,033
|
|
—
|
|
—
|
|
—
|
|
61,033
|
|
||||||||||
|
Add: proceeds from sale of assets included in discontinued operations
|
—
|
|
—
|
|
—
|
|
—
|
|
109,872
|
|
||||||||||
|
Add: return of long-term contract receivables—affiliate
|
2,968
|
|
—
|
|
—
|
|
—
|
|
2,968
|
|
||||||||||
|
Less: maintenance capital expenditures
|
(28
|
)
|
—
|
|
(4,423
|
)
|
—
|
|
(4,451
|
)
|
||||||||||
|
Distributable Cash Flow
|
$
|
199,547
|
|
$
|
46,550
|
|
$
|
16,243
|
|
$
|
(100,797
|
)
|
$
|
271,415
|
|
|||||
|
December 31, 2015
|
||||||||||||||||||||
|
Net cash provided by (used in) operating activities of continuing operations
|
$
|
204,934
|
|
$
|
43,029
|
|
$
|
23,605
|
|
$
|
(103,056
|
)
|
$
|
168,512
|
|
|||||
|
Add: proceeds from sale of PP&E
|
10,100
|
|
—
|
|
924
|
|
—
|
|
11,024
|
|
||||||||||
|
Add: proceeds from sale of mineral rights
|
3,505
|
|
—
|
|
—
|
|
—
|
|
3,505
|
|
||||||||||
|
Add: return of long-term contract receivables—affiliate
|
2,463
|
|
—
|
|
—
|
|
—
|
|
2,463
|
|
||||||||||
|
Less: maintenance capital expenditures
|
(416
|
)
|
—
|
|
(5,727
|
)
|
—
|
|
(6,143
|
)
|
||||||||||
|
Less: distributions to non-controlling interest
|
(2,744
|
)
|
—
|
|
—
|
|
—
|
|
(2,744
|
)
|
||||||||||
|
Distributable Cash Flow
|
$
|
217,842
|
|
$
|
43,029
|
|
$
|
18,802
|
|
$
|
(103,056
|
)
|
$
|
176,617
|
|
|||||
DCF increased
$94.8 million
, or
54%
, from
$176.6 million
in the year ended December 31, 2015 to
$271.4 million
in the year ended December 31, 2016. This increase is due primarily to the
$109.9 million
net cash proceeds from the sale of our discontinued operation in addition to
$61.0 million
in net cash proceeds from sales of mineral rights in 2016. These increases were partially offset by lower coal royalty production, lower coal royalty revenue per ton and less minimum payments received from our coal leases. These decreases are driven by the continued pressure on U.S. coal producers as described above. See "Item 6. Selected Financial Data—Non-GAAP Financial Measures—Distributable Cash Flow" for an explanation of Distributable Cash Flow.
61
Liquidity and Capital Resources
Current Liquidity
The principal indicators of our liquidity are our cash on hand and our available borrowing capacity. As of
December 31, 2017
, we had a total of
$29.8 million
of cash and cash equivalents and
$90.0 million
in borrowing capacity under our Opco Credit Facility. During the year ended
December 31, 2017
, we reduced our debt by approximately
$311.1 million
as summarized in the table below:
|
As of December 31,
|
Difference
|
|||||||||||
|
Debt Instrument (In thousands)
|
2017
|
2016
|
||||||||||
|
NRP LP Debt
|
||||||||||||
|
2018 Senior Notes
|
$
|
—
|
|
$
|
425,000
|
|
$
|
(425,000
|
)
|
|||
|
2022 Senior Notes
|
345,638
|
|
—
|
|
345,638
|
|
||||||
|
Opco debt
|
||||||||||||
|
Revolving credit facility
|
60,000
|
|
210,000
|
|
(150,000
|
)
|
||||||
|
Senior Notes
|
422,206
|
|
502,971
|
|
(80,765
|
)
|
||||||
|
Other
|
—
|
|
961
|
|
(961
|
)
|
||||||
|
Total
|
$
|
827,844
|
|
$
|
1,138,932
|
|
$
|
(311,088
|
)
|
|||
Additionally, in March 2017, we issued $250 million of Class A Convertible Preferred Units representing limited partner interests in NRP (the "Preferred Units"). The Preferred Units entitle the Preferred Purchasers to receive cumulative distributions at a rate of
12%
per year, up to one half of which we may pay in additional Preferred Units (such additional Preferred Units, the "PIK Units"). For more information on the terms of the Preferred Units, see
Note 3. Class A Convertible Preferred Units and Warrants
in the Notes to Consolidated Financial Statements under Item 8 in this Annual Report on Form 10-K, which is incorporated herein by reference. During 2017, we declared
$17.7 million
in distributions on the Preferred Units, one-half of which were paid in cash. In February 2018, we paid the entire
$7.8 million
distribution on the Preferred Units in cash and redeemed all of the outstanding PIK Units, which resulted in an additional
$8.8 million
cash payment.
The March 2017 recapitalization transactions increased our liquidity and extended the majority of our 2018 debt maturities to 2020 and 2022. Even with these meaningful improvements to our liquidity and balance sheet, we continue to have substantial debt outstanding and intend to continue to use cash from operations to deleverage our balance sheet over time. While we have a diversified portfolio of assets, we face challenges in coal and other commodity markets and other factors, some of which are beyond our control.
Cash Flows
Cash flow provided by operating activities
increased
$19.2 million
, from
$108.0 million
in the year ended December 31, 2016 to
$127.1 million
in the year ended December 31, 2017. Cash flows from continuing operations
increased
$27.2 million
primarily from increased operational performance from our Coal Royalty and Other segment assets year-over-year. This increase was partially offset by an
$8.0 million
decrease
in operating cash flow from discontinued operations. Cash flows from discontinued operations represent cash flow from operations of these assets prior to the sale date.
Cash flow provided by operating activities decreased $95.4 million, from $203.4 million in the year ended December 31, 2015 to $108.0 million in the year ended December 31, 2016. Operating cash flow from continuing operations decreased $70.4 million in our Coal Royalty and Other segment year-over-year primarily as a result of the reduction in coal royalty revenue and reduction of coal royalty minimum cash payments received on certain leases. Cash flow provided by operating activities of discontinued operations decreased $27.6 million, from $34.9 million in the year ended December 31, 2015 to $7.3 million in the year ended December 31, 2016 primarily as a result of completing the sale of our non-operated oil and gas working interest assets in July 2016 that had an effective date of April 1, 2016.
Cash flow provided by investing activities
decreased
$163.3 million
, from
$166.8 million
in the year ended December 31, 2016 to
$3.5 million
in the year ended December 31, 2017. Investing cash flows from discontinued operations
decreased
$106.7 million
primarily as a result of the sale of our non-operated oil and gas working interest assets in 2016 for
$109.9 million
in net
62
cash proceeds. Investing cash flows from continuing operations
decreased
$56.6 million
primarily as a result of the proceeds received in 2016 from the sales of our oil and gas and aggregates royalty properties.
Cash flow provided by investing activities increased $197.1 million, from $30.3 million used in the year ended December 31, 2015 to $166.8 million provided in the year ended December 31, 2016. Investing cash flows from discontinued operations increased $144.2 million primarily as a result of the sale of our non-operated oil and gas working interest assets in July 2016 for $109.9 million in net cash proceeds in addition to a $37.8 million decrease in cash flow used as a result of lower oil and gas drilling activity and the non-operated working interest asset sale in July 2016. Investing cash flows from continuing operations increased $52.9 million primarily as a result of 2016 sales of oil and gas and aggregate royalty properties.
Cash flow used in financing activities
decreased
$145.0 million
from
$286.2 million
in the year ended December 31, 2016 to
$141.2 million
in the year ended December 31, 2017. This
decrease
in cash flow used is primarily due to the proceeds received from the issuance of Preferred Units and warrants and 2022 Senior Notes. These proceeds were partially offset by additional debt repayments year-over-year and the fees paid related to the March 2017 recapitalization transactions.
Cash flow used in financing activities increased $114.7 million, from $171.5 million in the year ended December 31, 2015 to $286.2 million in the year ended December 31, 2016. Cash used in financing activities of discontinued operations increased $136.6 million primarily as a result of using $85.0 million to repay the RBL Credit Facility and contributing the $39.4 million of discontinued asset sales proceeds that remained after repayment of the RBL Facility in full to continuing operations. This increase in cash flow used in financing activities was partially offset by a $21.9 million decrease in cash flow used in financing activities from continuing operations primarily a result of distributing $49.3 million less cash to partners and receiving the remaining net proceeds from discontinuing operations after repayment as described above.
Capital Expenditures
A portion of the capital expenditures associated with our construction aggregates segment are maintenance capital expenditures, which are capital expenditures made to maintain the long-term production capacity of those businesses. Expansion capital expenditures are made to increase productive capacity. We deduct maintenance capital expenditures when calculating DCF.
Capital Resources and Obligations
Indebtedness
As of December 31, 2017 and 2016, we had the following indebtedness:
|
December 31,
|
|||||||
|
(In thousands)
|
2017
|
2016
|
|||||
|
Current portion of long-term debt, net
|
$
|
79,740
|
|
$
|
140,037
|
|
|
|
Long-term debt and debt, net
|
729,608
|
|
990,234
|
|
|||
|
Total debt and debt, net
|
$
|
809,348
|
|
$
|
1,130,271
|
|
|
We have been and continue to be in compliance with the terms of the financial covenants contained in our debt agreements. For additional information regarding our debt and the agreements governing our debt, including the covenants contained therein, see and "—Executive Overview—2017 Recapitalization Transactions and Debt Reduction" above and "Item 8. Financial Statements and Supplementary Data—
Note 13. Debt
" in this Annual Report on Form 10-K.
63
Long-Term Contractual Obligations
The following table reflects our long-term, non-cancelable contractual obligations as of December 31, 2017:
|
Payments Due by Period
|
||||||||||||||||||||||||||||
|
Contractual Obligations (In millions)
|
Total
|
2018
|
2019
|
2020
|
2021
|
2022
|
Thereafter
|
|||||||||||||||||||||
|
NRP:
|
||||||||||||||||||||||||||||
|
Long-term debt principal payments (including current maturities)
(1)
|
$
|
345.6
|
|
$
|
—
|
|
$
|
—
|
|
$
|
—
|
|
$
|
—
|
|
$
|
345.6
|
|
$
|
—
|
|
|||||||
|
Long-term debt interest payments
(1)
|
163.3
|
|
36.3
|
|
36.3
|
|
36.3
|
|
36.3
|
|
18.1
|
|
—
|
|
||||||||||||||
|
Opco:
|
||||||||||||||||||||||||||||
|
Long-term debt principal payments (including current maturities)
(2)
|
482.2
|
|
80.4
|
|
75.8
|
|
114.5
|
|
46.8
|
|
46.8
|
|
117.9
|
|
||||||||||||||
|
Long-term debt interest payments
(3)
|
86.5
|
|
23.0
|
|
18.1
|
|
14.1
|
|
11.1
|
|
8.5
|
|
11.7
|
|
||||||||||||||
|
Rental leases
(4)
|
4.2
|
|
1.7
|
|
0.2
|
|
0.2
|
|
0.1
|
|
0.1
|
|
1.9
|
|
||||||||||||||
|
Total
|
$
|
1,081.8
|
|
$
|
141.4
|
|
$
|
130.4
|
|
$
|
165.1
|
|
$
|
94.3
|
|
$
|
419.1
|
|
$
|
131.5
|
|
|||||||
|
(1)
|
The amounts indicated in the table include principal and interest due on NRP’s 2022 Notes.
|
|
(2)
|
The amounts indicated in the table include principal due on Opco’s senior notes and credit facility.
|
|
(3)
|
The amounts indicated in the table include interest due on Opco’s senior notes.
|
|
(4)
|
The rental lease amounts primarily consist of office space and Construction Aggregates equipment leases.
|
Shelf Registration Statement
In September 2015, we filed a registration statement on Form S-3 with the SEC that is available for registered offerings of common units. In April 2017, we filed a shelf registration statement on Form S-3 with the SEC to register the common units issuable upon conversion of the warrants, as described above.
Off-Balance Sheet Transactions
We do not have any off-balance sheet arrangements with unconsolidated entities or related parties and accordingly, there are no off-balance sheet risks to our liquidity and capital resources from unconsolidated entities.
Inflation
Inflation in the United States has been relatively low in recent years and did not have a material impact on operations for the years ended December 31, 2017, 2016 and 2015.
Environmental Regulation
For additional information on environmental regulation that may have a material impact on our business, see "Item 1. Business and Properties—Regulation and Environmental Matters."
Related Party Transactions
The information required by this Item is included under "Item 8. Financial Statements and Supplementary Data—
Note 15. Related Party Transactions
" and "Item 13. Certain Relationships and Related Transactions, and Director Independence" in this Annual Report on Form 10-K and is incorporated by reference herein.
64
Summary of Critical Accounting Estimates
Preparation of the accompanying financial statements in conformity with accounting principles generally accepted in the United States requires management to make estimates and assumptions that affect the reported amounts of assets, liabilities, revenues and expenses. See
Note 2. Summary of Significant Accounting Policies
to the audited consolidated financial statements under Item 8 of this Form 10-K for discussion of our significant accounting policies. The following critical accounting policies are affected by estimates and assumptions used in the preparation of Consolidated Financial Statements. We evaluate our estimates and assumptions on a regular basis. Actual results could differ from those estimates.
Revenues
Coal Royalty and Other Revenues.
Coal royalty and other revenues are recognized on the basis of tons of mineral sold by our lessees and the corresponding revenue from those sales. Generally, the lessees make payments to us based on the greater of a percentage of the gross sales price or a fixed price per ton of mineral they sell. While we may have multiple contracts with a single lessee, they are accounted for as separate arrangements.
Most of our coal and aggregates lessees must make minimum annual or quarterly payments which are generally recoupable over certain time periods. These minimum payments are recorded as a deferred revenue liability when received. The deferred revenue attributable to the minimum payment is recognized as revenue based upon the underlying mineral lease when the lessee recoups the minimum payment through production or in the period immediately following the expiration of the lessee’s ability to recoup the payments.
Oil and gas related revenues consist of revenues from royalties and overriding royalties. Oil and gas royalty revenues are recognized on the basis of volume of hydrocarbons sold by lessees and the corresponding revenue from those sales.
Transportation and Processing.
Transportation fees are recognized on the basis of tons of material transported over the beltlines. Under the terms of the transportation contracts, we receive a fixed price per ton for all material transported on the beltlines. Processing fees are recognized on the basis of tons of material processed through the facilities by our lessees and the corresponding revenue from those sales. Generally, the lessees of the processing facilities make payments to us based on the greater of a percentage of the gross sales price or a fixed price per ton of material that is processed and sold from the facilities. The processing leases are structured in a manner so that the lessees are responsible for operating and maintenance expenses associated with the facilities. These fees are recorded in Transportation and processing fees (or Transportation and processing fees-affiliate) in the Consolidated Statements of Comprehensive Income (Loss).
Equity in Earnings of Ciner Wyoming.
We account for non-marketable equity investments using the equity method of accounting if the investment gives us the ability to exercise significant influence over, but not control of, an investee. Significant influence generally exists if we have an ownership interest representing between 20% and 50% of the voting stock of the investee. We account for our investment in Ciner Wyoming using this method.
Under the equity method of accounting, investments are stated at initial cost and are adjusted for subsequent additional investments and the proportionate share of earnings or losses and distributions. The basis difference between the investment and the proportional share of the investee's net assets is hypothetically allocated first to identified tangible assets and liabilities, then to finite-lived intangibles or indefinite-lived intangibles and the remaining balance is attributed to goodwill. The portion of the basis difference attributed to net tangible assets and finite-lived intangibles is amortized over its estimated useful life while indefinite-lived intangibles, if any, and goodwill are not amortized. The amortization of the basis difference is recorded as a reduction of earnings from the equity investment in the Consolidated Statements of Comprehensive Income (Loss).
Our carrying value in an equity method investee company is reflected in the caption "Equity in unconsolidated investment" in our Consolidated Balance Sheets. Our adjusted share of the earnings or losses of the investee company is reflected in the Consolidated Statements of Comprehensive Income (Loss) as revenues and other income under the caption ‘‘Equity in earnings of Ciner Wyoming." Our share of investee earnings are adjusted to reflect the amortization of any difference between the cost basis of the equity investment and the proportionate share of the investee’s net assets, which has been allocated to the fair value of net identified tangible and finite-lived intangible assets and amortized over the estimated lives of those assets.
Construction Aggregates Revenues.
Revenues from the sale of aggregates, gravel, sand and asphalt are recorded based upon the transfer of product at delivery to customers, which generally occurs at the quarries or asphalt plants.
65
Road Construction and Asphalt Paving.
Revenues from long-term construction contracts are recognized on the percentage-of-completion method, measured by the percentage of total costs incurred to date to the estimated total costs for each contract. That method is used since we consider total cost to be the best available measure of progress on the contracts. Provisions for estimated losses on uncompleted contracts are made in the period in which such losses are determined. Changes in job performance, job conditions and estimated profitability, including those arising from final contract settlements, which result in revisions to job costs and profits are recognized in the period in which the revisions are determined. Contract costs include all direct job costs and those indirect costs related to contract performance, such as indirect labor, supplies, insurance, equipment maintenance and depreciation.
Impact of New Revenue Recognition Standard Adoption.
We concluded that the new revenue recognition standard (Topic 606) will have no impact on revenue from our Construction Aggregates or Soda Ash operating segments. However, we determined that adoption of the new revenue recognition standard will impact certain revenue from our coal royalty leases as further described below. The other revenue streams within the Coal Royalty and Other segment will not be impacted.
Under the new revenue recognition standard (Topic 606), we have defined our coal royalty lease performance obligation as providing the lessee the right to mine and sell our coal over the lease term. We then evaluated the likelihood that consideration we received from our lessees resulting from coal production would exceed consideration received from minimum payments over the lease term. As a result of this evaluation, revenue recognition from our leases will now be based on either production or minimum payments as follows:
1.
Production Leases: Leases for which we expect that consideration from coal production will be greater than consideration from minimums over the lease term. Revenue recognition for these leases will be recognized over time based on coal production and minimum payments will continue to be deferred until recoupment occurs or the recoupment becomes remote. However, if we receive minimum payments from these coal royalty leases, we will begin to evaluate the likelihood of recoupment and recognize deferred revenue prior to expiration of the recoupment period if it concludes that recoupment is remote.
2.
Minimum Leases: Leases for which we expect that consideration from minimums will be greater than consideration from coal production over the lease term. Revenue recognition for these leases will now be recognized straight line over the lease term based on the minimum payment consideration amount.
Mineral Rights
Mineral rights owned and leased are recorded at its original cost of construction or, upon acquisition, at fair value of the assets acquired. Coal and aggregate mineral rights are depleted on a unit-of-production basis by lease, based upon minerals mined in relation to the net cost of the mineral properties and estimated proven and probable tonnage as defined by the SEC’s Industry Guide 7 and estimated by our internal reserve engineers. The technologies and economic data used by our internal reserve engineers in the estimation of our proved reserves include, but are not limited to, drill logs, geophysical logs, geologic maps including isopach, mine, and coal quality, cross sections, statistical analysis, and available public production data. There are numerous uncertainties inherent in estimating the quantities and qualities of recoverable reserves, including many factors beyond our control. Estimates of economically recoverable coal reserves depend upon a number of variable factors and assumptions, any one of which may, if incorrect, result in an estimate that varies considerably from actual results.
Asset Impairment
We have developed procedures to periodically evaluate our long-lived assets for possible impairment. These procedures are performed throughout the year and are based on historic, current and future performance and are designed to be early warning tests. If an asset fails one of the early warning tests, additional evaluation is performed for that asset that considers both quantitative and qualitative information. A long-lived asset is deemed impaired when the future expected undiscounted cash flows from its use and disposition is less than the assets’ carrying value. Impairment is measured based on the estimated fair value, which is usually determined based upon the present value of the projected future cash flow compared to the assets’ carrying value. We believe our estimates of cash flows and discount rates are consistent with those of principal market participants. In addition to the evaluations discussed above, specific events such as a reduction in economically recoverable reserves or production ceasing on a property for an extended period may require a separate impairment evaluation be completed on a significant property.
66
We evaluate our equity investment for impairment when events or changes in circumstances indicate, in management’s judgment, that the carrying value of such investment may have experienced an other-than-temporary decline in value. When evidence of loss in value has occurred, management compares the estimated fair value of the investment to the carrying value of the investment to determine whether impairment has occurred. If the estimated fair value is less than the carrying value and management considers the decline in value to be other than temporary, the excess of the carrying value over the estimated fair value is recognized in the financial statements as an impairment loss. The fair value of the impaired investment is based on quoted market prices, or upon the present value of expected cash flows using discount rates believed to be consistent with those used by principal market participants, plus market analysis of comparable assets owned by the investee, if appropriate.
Recent Accounting Standards
For a discussion of recent accounting pronouncements, see the applicable section of "Item 8. Financial Statements and Supplementary Data—Note 2. Summary of Significant Accounting Policies" to the audited consolidated financial statements included elsewhere in this Annual Report on Form 10-K.
We are exposed to market risk, which includes adverse changes in commodity prices and interest rates as discussed below:
Commodity Price Risk
We are dependent upon the effective marketing of the coal mined by our lessees. Our lessees sell the coal under various long-term and short-term contracts as well as on the spot market. Current conditions in the coal industry may make it difficult for our lessees to extend existing contracts or enter into supply contracts with terms of one year or more. Our lessees’ failure to negotiate long-term contracts could adversely affect the stability and profitability of our lessees’ operations and adversely affect our coal royalty revenues. If more coal is sold on the spot market, coal royalty revenues may become more volatile due to fluctuations in spot coal prices.
We have market risk related to prices for our aggregates products. Aggregates prices are primarily driven by economic conditions in the local markets in which the products are sold.
The market price of soda ash directly affects the profitability of Ciner Wyoming’s operations. If the market price for soda ash declines, Ciner Wyoming’s sales will decrease. Historically, the global market and, to a lesser extent, the domestic market for soda ash have been volatile, and those markets are likely to remain volatile in the future.
Interest Rate Risk
Our exposure to changes in interest rates results from our borrowings under the Opco Credit Facility, which is subject to variable interest rates based upon LIBOR. At December 31, 2017, we had
$60.0
million outstanding in variable interest rate debt. If interest rates were to increase by 1%, annual interest expense would increase approximately
$0.6
million, assuming the same principal amount remained outstanding during the year.
67
Fair Value of Financial Instruments
Our financial instruments consist of cash and cash equivalents, accounts receivable, contracts receivable, accounts payable, debt, Preferred Units and warrants. The carrying amounts reported on the Consolidated Balance Sheets for cash and cash equivalents, accounts receivable and accounts payable approximate fair value due to their short-term nature.
We use available market data and valuation methodologies to estimate the fair value of debt. The fair value of debt is the estimated amount we would have to pay a third party to assume the debt, including a credit spread for the difference between the issue rate and the period end market rate. The credit spread is our default or repayment risk. The following table shows the carrying amount and estimated fair value of our debt and contracts receivable (including affiliates):
|
|
December 31, 2017
|
December 31, 2016
|
|||||||||||||
|
(In thousands)
|
Carrying
Value
|
Estimated
Fair Value |
Carrying
Value |
Estimated
Fair Value |
|||||||||||
|
Debt:
|
|||||||||||||||
|
NRP 2018 Senior Notes
(1)
|
$
|
—
|
|
$
|
—
|
|
$
|
420,097
|
|
$
|
412,250
|
|
|||
|
NRP 2022 Senior Notes
(1)
|
330,404
|
|
366,376
|
|
—
|
|
—
|
|
|||||||
|
Opco Senior Notes and utility local improvement obligation
(2)
|
418,944
|
|
447,538
|
|
500,174
|
|
488,814
|
|
|||||||
|
Opco Revolving Credit Facility
(3)
|
60,000
|
|
60,000
|
|
210,000
|
|
210,000
|
|
|||||||
|
Assets:
|
|||||||||||||||
|
Contracts receivable (including affiliates), current and long-term
(4)
|
$
|
43,826
|
|
$
|
30,517
|
|
$
|
46,742
|
|
$
|
32,554
|
|
|||
|
(1)
|
The Level 1 fair value is based upon quotations obtained for identical instruments on the closing trading prices near period end.
|
|
(2)
|
Due to no observable quoted prices on these instruments, the Level 3 fair value is estimated by management using quotations obtained for the NRP Senior Notes on the closing trading prices near period end.
|
|
(3)
|
The Level 3 fair value approximates the outstanding borrowing amount because the interest rates are variable and reflective of market rates and the terms of the credit facility allow the Partnership to repay this debt at any time without penalty.
|
|
(4)
|
The Level 3 fair value is determined based on the present value of future cash flow projections related to the underlying assets.
|
68
INDEX TO CONSOLIDATED FINANCIAL STATEMENTS
|
|
Page
|
69
Report of Independent Registered Public Accounting Firm
The Partners of Natural Resource Partners L.P.
Opinion on the Financial Statements
We have audited the accompanying consolidated balance sheets of Natural Resource Partners L.P. (the Partnership) as of December 31, 2017 and 2016, and the related consolidated statements of comprehensive income (loss), partners’ capital and cash flows for each of the three years in the period ended December 31, 2017, and the related notes (collectively referred to as the “consolidated financial statements”). In our opinion, the consolidated financial statements present fairly, in all material respects, the financial position of the Partnership at December 31, 2017 and 2016, and the results of its operations and its cash flows for each of the three years in the period ended December 31, 2017, in conformity with U.S. generally accepted accounting principles.
We did not audit the financial statements of Ciner Wyoming LLC (Ciner Wyoming), a Limited Liability Company in which the Partnership has a 49% interest. In the consolidated financial statements, the Partnership’s investment in Ciner Wyoming is stated at $245 million and $256 million as of December 31, 2017 and 2016, respectively, and the Partnership’s equity in the net income of Ciner Wyoming is stated at $40 million in 2017, $40 million in 2016 and $50 million in 2015. Those statements were audited by other auditors whose report has been furnished to us, and our opinion, insofar as it relates to the amounts included for Ciner Wyoming, is based on the report of the other auditors.
We also have audited, in accordance with the standards of the Public Company Accounting Oversight Board (United States) (PCAOB), the Partnership's internal control over financial reporting as of December 31, 2017, based on criteria established in Internal Control-Integrated Framework issued by the Committee of Sponsoring Organizations of the Treadway Commission (2013 framework), and our report dated March 1, 2018 expressed an unqualified opinion thereon.
Adoption of ASU 2017-11
As discussed in Note 2 to the consolidated financial statements, the Partnership changed its method for accounting for warrants to purchase common units as a result of the adoption of the amendments to the FASB Accounting Standards Codification resulting from Accounting Standards Update No. 2017-11, “Earnings Per Share.”
Basis for Opinion
These financial statements are the responsibility of the Partnership's management. Our responsibility is to express an opinion on the Partnership’s financial statements based on our audits. We are a public accounting firm registered with the PCAOB and are required to be independent with respect to the Partnership in accordance with the U.S. federal securities laws and the applicable rules and regulations of the Securities and Exchange Commission and the PCAOB.
We conducted our audits in accordance with the standards of the PCAOB. Those standards require that we plan and perform the audit to obtain reasonable assurance about whether the financial statements are free of material misstatement, whether due to error or fraud. Our audits included performing procedures to assess the risks of material misstatement of the financial statements, whether due to error or fraud, and performing procedures that respond to those risks. Such procedures included examining, on a test basis, evidence regarding the amounts and disclosures in the financial statements. Our audits also included evaluating the accounting principles used and significant estimates made by management, as well as evaluating the overall presentation of the financial statements. We believe that our audits and the report of other auditors provide a reasonable basis for our opinion.
/s/ Ernst & Young LLP
We have served as the Partnership’s auditor since 2002.
Houston, Texas
March 1, 2018
70
REPORT OF INDEPENDENT REGISTERED PUBLIC ACCOUNTING FIRM
The Board of Managers and Members of
Ciner Wyoming LLC
Atlanta, Georgia
Opinion on the Financial Statements
We have audited the accompanying balance sheets of Ciner Wyoming LLC (“the Company”) as of December 31, 2017 and 2016, and the related statements of operations and comprehensive income, members’ equity, and cash flows for each of the three years in the period ended December 31, 2017 and the related notes included in Exhibit 99.1 (collectively referred to as the "financial statements"). In our opinion, the financial statements present fairly, in all material respects, the financial position of the Company as of December 31, 2017 and 2016, and the results of its operations and its cash flows for each of the three years in the period ended December 31, 2017, in conformity with accounting principles generally accepted in the United States of America.
Basis for Opinion
These financial statements are the responsibility of the Company’s management. Our responsibility is to express an opinion on the Company’s financial statements based on our audits. We are a public accounting firm registered with the Public Company Accounting Oversight Board (United States) (PCAOB) and are required to be independent with respect to the Company in accordance with the U.S. federal securities laws and the applicable rules and regulations of the Securities and Exchange Commission and the PCAOB.
We conducted our audits in accordance with the standards of the PCAOB and in accordance with auditing standards generally accepted in the United States of America. Those standards require that we plan and perform the audit to obtain reasonable assurance about whether the financial statements are free of material misstatement, whether due to error or fraud. The Company is not required to have, nor were we engaged to perform, an audit of its internal control over financial reporting. As part of our audits, we are required to obtain an understanding of internal control over financial reporting but not for the purpose of expressing an opinion on the effectiveness of the Company’s internal control over financial reporting. Accordingly, we express no such opinion.
Our audits included performing procedures to assess the risks of material misstatement of the financial statements, whether due to error or fraud, and performing procedures that respond to those risks. Such procedures included examining, on a test basis, evidence regarding the amounts and disclosures in the financial statements. Our audits also included evaluating the accounting principles used and significant estimates made by management, as well as evaluating the overall presentation of the financial statements. We believe that our audits provide a reasonable basis for our opinion.
/s/ Deloitte & Touche LLP
Atlanta, Georgia
March 1, 2018
We have served as the Company’s auditor since 2008.
71
NATURAL RESOURCE PARTNERS L.P.
|
December 31,
|
|||||||
|
(In thousands, except unit data)
|
2017
|
2016
|
|||||
|
ASSETS
|
|||||||
|
Current assets:
|
|||||||
|
Cash and cash equivalents
|
$
|
29,827
|
|
$
|
40,371
|
|
|
|
Accounts receivable, net
|
47,026
|
|
43,202
|
|
|||
|
Accounts receivable—affiliates, net
|
161
|
|
6,658
|
|
|||
|
Inventory
|
7,553
|
|
6,893
|
|
|||
|
Prepaid expenses and other
|
5,838
|
|
7,271
|
|
|||
|
Current assets of discontinued operations (see Note 7)
|
991
|
|
991
|
|
|||
|
Total current assets
|
91,396
|
|
105,386
|
|
|||
|
Land
|
25,247
|
|
25,252
|
|
|||
|
Plant and equipment, net
|
46,170
|
|
49,443
|
|
|||
|
Mineral rights, net
|
883,885
|
|
908,192
|
|
|||
|
Intangible assets, net
|
49,554
|
|
3,236
|
|
|||
|
Intangible assets, net—affiliate
|
—
|
|
49,811
|
|
|||
|
Equity in unconsolidated investment
|
245,433
|
|
255,901
|
|
|||
|
Long-term contracts receivable
|
40,776
|
|
—
|
|
|||
|
Long-term contracts receivable—affiliate
|
—
|
|
43,785
|
|
|||
|
Other assets
|
6,547
|
|
6,625
|
|
|||
|
Other assets—affiliate
|
156
|
|
1,018
|
|
|||
|
Total assets
|
$
|
1,389,164
|
|
$
|
1,448,649
|
|
|
|
LIABILITIES AND CAPITAL
|
|||||||
|
Current liabilities:
|
|||||||
|
Accounts payable
|
$
|
6,957
|
|
$
|
6,234
|
|
|
|
Accounts payable—affiliates
|
562
|
|
940
|
|
|||
|
Accrued liabilities
|
16,890
|
|
25,999
|
|
|||
|
Accrued liabilities—affiliates
|
515
|
|
—
|
|
|||
|
Accrued interest
|
15,484
|
|
15,588
|
|
|||
|
Current portion of long-term debt, net
|
79,740
|
|
140,037
|
|
|||
|
Current liabilities of discontinued operations (see Note 7)
|
401
|
|
353
|
|
|||
|
Total current liabilities
|
120,549
|
|
189,151
|
|
|||
|
Deferred revenue
|
100,605
|
|
44,931
|
|
|||
|
Deferred revenue—affiliates
|
—
|
|
71,632
|
|
|||
|
Long-term debt, net
|
729,608
|
|
990,234
|
|
|||
|
Other non-current liabilities
|
2,808
|
|
4,565
|
|
|||
|
Other non-current liabilities—affiliate
|
346
|
|
—
|
|
|||
|
Total liabilities
|
953,916
|
|
1,300,513
|
|
|||
|
Commitments and contingencies (see Note 17)
|
|||||||
|
Class A Convertible Preferred Units (258,844 units issued and outstanding at $1,000 par value per unit; liquidation preference of $1,500 per unit)
|
173,431
|
|
—
|
|
|||
|
Partners’ capital:
|
|||||||
|
Common unitholders’ interest (12,232,006 units issued and outstanding)
|
199,851
|
|
152,309
|
|
|||
|
General partner’s interest
|
1,857
|
|
887
|
|
|||
|
Warrant holders’ interest
|
66,816
|
|
—
|
|
|||
|
Accumulated other comprehensive loss
|
(3,313
|
)
|
(1,666
|
)
|
|||
|
Total partners’ capital
|
265,211
|
|
151,530
|
|
|||
|
Non-controlling interest
|
(3,394
|
)
|
(3,394
|
)
|
|||
|
Total capital
|
261,817
|
|
148,136
|
|
|||
|
Total liabilities and capital
|
$
|
1,389,164
|
|
$
|
1,448,649
|
|
|
The accompanying notes are an integral part of these consolidated financial statements.
72
NATURAL RESOURCE PARTNERS L.P.
|
|
For the Years Ended December 31,
|
||||||||||
|
(In thousands, except per unit data)
|
2017
|
2016
|
2015
|
||||||||
|
Revenues and other income:
|
|||||||||||
|
Coal royalty and other
|
$
|
158,399
|
|
$
|
144,520
|
|
$
|
154,066
|
|
||
|
Coal royalty and other—affiliates
|
23,402
|
|
46,259
|
|
67,682
|
|
|||||
|
Transportation and processing
|
14,510
|
|
—
|
|
—
|
|
|||||
|
Transportation and processing—affiliates
|
6,012
|
|
19,336
|
|
22,033
|
|
|||||
|
Construction aggregates
|
112,970
|
|
103,755
|
|
124,085
|
|
|||||
|
Road construction and asphalt paving
|
18,411
|
|
17,047
|
|
14,964
|
|
|||||
|
Equity in earnings of Ciner Wyoming
|
40,457
|
|
40,061
|
|
49,918
|
|
|||||
|
Gain on asset sales, net
|
3,856
|
|
29,081
|
|
6,900
|
|
|||||
|
Total revenues and other income
|
$
|
378,017
|
|
|
$
|
400,059
|
|
|
$
|
439,648
|
|
|
Operating expenses:
|
|||||||||||
|
Operating and maintenance expenses
|
$
|
126,982
|
|
$
|
119,621
|
|
$
|
136,943
|
|
||
|
Operating and maintenance expenses—affiliates, net
|
9,534
|
|
10,925
|
|
15,323
|
|
|||||
|
Depreciation, depletion and amortization
|
34,985
|
|
43,087
|
|
57,295
|
|
|||||
|
Amortization expense—affiliate
|
1,008
|
|
3,185
|
|
3,621
|
|
|||||
|
General and administrative
|
13,513
|
|
16,979
|
|
7,036
|
|
|||||
|
General and administrative—affiliates
|
4,989
|
|
3,591
|
|
5,312
|
|
|||||
|
Asset impairments
|
3,031
|
|
16,926
|
|
384,545
|
|
|||||
|
Total operating expenses
|
$
|
194,042
|
|
$
|
214,314
|
|
$
|
610,075
|
|
||
|
Income (loss) from operations
|
$
|
183,975
|
|
$
|
185,745
|
|
$
|
(170,427
|
)
|
||
|
Other income (expense)
|
|||||||||||
|
Interest expense
|
$
|
(82,902
|
)
|
$
|
(90,047
|
)
|
$
|
(87,911
|
)
|
||
|
Interest expense—affiliate
|
—
|
|
(523
|
)
|
(1,851
|
)
|
|||||
|
Debt modification expense
|
(7,939
|
)
|
—
|
|
—
|
|
|||||
|
Loss on extinguishment of debt
|
(4,107
|
)
|
—
|
|
—
|
|
|||||
|
Interest income
|
181
|
|
39
|
|
18
|
|
|||||
|
Other expense, net
|
$
|
(94,767
|
)
|
$
|
(90,531
|
)
|
$
|
(89,744
|
)
|
||
|
Net income (loss) from continuing operations
|
$
|
89,208
|
|
$
|
95,214
|
|
$
|
(260,171
|
)
|
||
|
Income (loss) from discontinued operations (see Note 7)
|
(541
|
)
|
1,678
|
|
(311,549
|
)
|
|||||
|
Net income (loss)
|
$
|
88,667
|
|
$
|
96,892
|
|
$
|
(571,720
|
)
|
||
|
Less: income attributable to preferred unitholders
|
(25,453
|
)
|
—
|
|
—
|
|
|||||
|
Net income (loss) attributable to common unitholders and general partner
|
$
|
63,214
|
|
$
|
96,892
|
|
$
|
(571,720
|
)
|
||
|
|
|
||||||||||
|
Net income (loss) attributable to common unitholders
|
$
|
61,950
|
|
$
|
95,229
|
|
$
|
(559,492
|
)
|
||
|
Net income (loss) attributable to the general partner
|
1,264
|
|
1,663
|
|
(12,228
|
)
|
|||||
|
Income (loss) from continuing operations per common unit (see Note 5)
|
|||||||||||
|
Basic
|
$
|
5.11
|
|
$
|
7.65
|
|
$
|
(20.78
|
)
|
||
|
Diluted
|
3.98
|
|
7.65
|
|
(20.78
|
)
|
|||||
|
Net income (loss) per common unit (see Note 5)
|
|||||||||||
|
Basic
|
$
|
5.06
|
|
$
|
7.78
|
|
$
|
(45.75
|
)
|
||
|
Diluted
|
3.96
|
|
7.78
|
|
(45.75
|
)
|
|||||
|
Net income (loss)
|
$
|
88,667
|
|
$
|
96,892
|
|
$
|
(571,720
|
)
|
||
|
Add: comprehensive income (loss) from unconsolidated investment and other
|
(1,647
|
)
|
486
|
|
(1,693
|
)
|
|||||
|
Comprehensive income (loss)
|
$
|
87,020
|
|
$
|
97,378
|
|
$
|
(573,413
|
)
|
||
The accompanying notes are an integral part of these consolidated financial statements.
73
NATURAL RESOURCE PARTNERS L.P.
CONSOLIDATED STATEMENTS OF PARTNERS’ CAPITAL
|
|
Common Unitholders
|
General Partner
|
Warrant Holders
|
Accumulated
Other Comprehensive Income (Loss) |
Partners' Capital Excluding Non-Controlling Interest
|
Non-Controlling Interest
|
Total Capital
|
|||||||||||||||||||||||
|
|
||||||||||||||||||||||||||||||
|
(In thousands)
|
Units
|
Amounts
|
||||||||||||||||||||||||||||
|
Balance at December 31, 2014
|
12,232
|
|
$
|
709,019
|
|
$
|
12,245
|
|
$
|
—
|
|
$
|
(459
|
)
|
$
|
720,805
|
|
$
|
(650
|
)
|
$
|
720,155
|
|
|||||||
|
Net Loss
|
—
|
|
(559,492
|
)
|
(12,228
|
)
|
—
|
|
—
|
|
(571,720
|
)
|
—
|
|
(571,720
|
)
|
||||||||||||||
|
Cost associated with equity transactions
|
—
|
|
(109
|
)
|
—
|
|
—
|
|
—
|
|
(109
|
)
|
—
|
|
(109
|
)
|
||||||||||||||
|
Distributions to common unitholders and general partner
|
—
|
|
(70,324
|
)
|
(1,434
|
)
|
—
|
|
—
|
|
(71,758
|
)
|
—
|
|
(71,758
|
)
|
||||||||||||||
|
Distributions to non-controlling interests
|
—
|
|
—
|
|
—
|
|
—
|
|
—
|
|
—
|
|
(2,744
|
)
|
(2,744
|
)
|
||||||||||||||
|
Non-cash contributions
|
—
|
|
—
|
|
811
|
|
—
|
|
—
|
|
811
|
|
—
|
|
811
|
|
||||||||||||||
|
Comprehensive loss from unconsolidated investment and other
|
—
|
|
—
|
|
|
|
—
|
|
(1,693
|
)
|
(1,693
|
)
|
—
|
|
(1,693
|
)
|
||||||||||||||
|
Balance at December 31, 2015
|
12,232
|
|
$
|
79,094
|
|
$
|
(606
|
)
|
$
|
—
|
|
$
|
(2,152
|
)
|
$
|
76,336
|
|
$
|
(3,394
|
)
|
$
|
72,942
|
|
|||||||
|
Net income
|
—
|
|
95,229
|
|
1,663
|
|
—
|
|
—
|
|
96,892
|
|
—
|
|
96,892
|
|
||||||||||||||
|
Distributions to common unitholders and general partner
|
—
|
|
(22,014
|
)
|
(451
|
)
|
—
|
|
—
|
|
(22,465
|
)
|
—
|
|
(22,465
|
)
|
||||||||||||||
|
Non-cash contributions
|
—
|
|
—
|
|
281
|
|
—
|
|
—
|
|
281
|
|
—
|
|
281
|
|
||||||||||||||
|
Comprehensive income from unconsolidated investment and other
|
—
|
|
—
|
|
—
|
|
—
|
|
486
|
|
486
|
|
—
|
|
486
|
|
||||||||||||||
|
Balance at December 31, 2016
|
12,232
|
|
$
|
152,309
|
|
$
|
887
|
|
|
$
|
—
|
|
$
|
(1,666
|
)
|
|
$
|
151,530
|
|
$
|
(3,394
|
)
|
$
|
148,136
|
|
|||||
|
Net income
(1)
|
—
|
|
86,894
|
|
1,773
|
|
—
|
|
—
|
|
88,667
|
|
—
|
|
88,667
|
|
||||||||||||||
|
Distributions to common unitholders and general partner
|
—
|
|
(22,018
|
)
|
(449
|
)
|
—
|
|
—
|
|
(22,467
|
)
|
—
|
|
(22,467
|
)
|
||||||||||||||
|
Distributions to preferred unitholders
|
—
|
|
(17,334
|
)
|
(354
|
)
|
—
|
|
—
|
|
(17,688
|
)
|
—
|
|
(17,688
|
)
|
||||||||||||||
|
Issuance of Warrants
|
—
|
|
—
|
|
|
|
66,816
|
|
—
|
|
66,816
|
|
—
|
|
66,816
|
|
||||||||||||||
|
Comprehensive loss from unconsolidated investment and other
|
—
|
|
—
|
|
—
|
|
—
|
|
(1,647
|
)
|
(1,647
|
)
|
—
|
|
(1,647
|
)
|
||||||||||||||
|
Balance at December 30, 2017
|
12,232
|
|
$
|
199,851
|
|
$
|
1,857
|
|
$
|
66,816
|
|
$
|
(3,313
|
)
|
$
|
265,211
|
|
$
|
(3,394
|
)
|
$
|
261,817
|
|
|||||||
|
(1)
|
Net income includes
$25.5 million
attributable to Preferred Unitholders that accumulated during the period, of which
$24.9 million
is allocated to the common unitholders and
$0.5 million
is allocated to the general partner.
|
The accompanying notes are an integral part of these consolidated financial statements.
74
NATURAL RESOURCE PARTNERS L.P.
|
|
Years Ended December 31,
|
||||||||||
|
(In thousands)
|
2017
|
2016
|
2015
|
||||||||
|
Cash flows from operating activities:
|
|||||||||||
|
Net income (loss)
|
$
|
88,667
|
|
$
|
96,892
|
|
$
|
(571,720
|
)
|
||
|
Adjustments to reconcile net income (loss) to net cash provided by operating activities of continuing operations:
|
|||||||||||
|
Depreciation, depletion and amortization
|
34,985
|
|
43,087
|
|
57,295
|
|
|||||
|
Amortization expense—affiliates
|
1,008
|
|
3,185
|
|
3,621
|
|
|||||
|
Return on earnings from unconsolidated investment
|
43,354
|
|
46,550
|
|
46,795
|
|
|||||
|
Equity earnings from unconsolidated investment
|
(40,457
|
)
|
(40,061
|
)
|
(49,918
|
)
|
|||||
|
Gain on asset sales, net
|
(3,856
|
)
|
(29,081
|
)
|
(6,900
|
)
|
|||||
|
Debt modification expense
|
7,939
|
|
—
|
|
—
|
|
|||||
|
Loss on extinguishment of debt
|
4,107
|
|
—
|
|
—
|
|
|||||
|
(Income) loss from discontinued operations
|
541
|
|
(1,678
|
)
|
311,549
|
|
|||||
|
Asset impairments
|
3,031
|
|
16,926
|
|
384,545
|
|
|||||
|
Gain on reserve swap
|
—
|
|
—
|
|
(9,290
|
)
|
|||||
|
Amortization of debt issuance costs and other
|
8,005
|
|
8,284
|
|
(7,109
|
)
|
|||||
|
Other, net—affiliates
|
1,207
|
|
993
|
|
(912
|
)
|
|||||
|
Change in operating assets and liabilities:
|
|||||||||||
|
Accounts receivable
|
2,305
|
|
431
|
|
7,705
|
|
|||||
|
Accounts receivable—affiliates
|
367
|
|
(313
|
)
|
3,149
|
|
|||||
|
Accounts payable
|
1,361
|
|
707
|
|
(3,625
|
)
|
|||||
|
Accounts payable—affiliates
|
(377
|
)
|
139
|
|
(32
|
)
|
|||||
|
Accrued liabilities
|
(8,443
|
)
|
5,397
|
|
2,656
|
|
|||||
|
Accrued liabilities—affiliates
|
515
|
|
—
|
|
—
|
|
|||||
|
Accrued interest
|
(105
|
)
|
(779
|
)
|
(1,236
|
)
|
|||||
|
Accrued interest—affiliates
|
—
|
|
(456
|
)
|
—
|
|
|||||
|
Deferred revenue
|
(5,791
|
)
|
(35,881
|
)
|
7,605
|
|
|||||
|
Deferred revenue—affiliates
|
(10,166
|
)
|
(11,222
|
)
|
(4,200
|
)
|
|||||
|
Other items, net
|
(359
|
)
|
(2,477
|
)
|
(1,466
|
)
|
|||||
|
Net cash provided by operating activities of continuing operations
|
$
|
127,838
|
|
$
|
100,643
|
|
$
|
168,512
|
|
||
|
Net cash provided by (used in) operating activities of discontinued operations
|
(699
|
)
|
7,318
|
|
34,912
|
|
|||||
|
Net cash provided by operating activities
|
$
|
127,139
|
|
$
|
107,961
|
|
$
|
203,424
|
|
||
|
Cash flows from investing activities:
|
|||||||||||
|
Return of equity from unconsolidated investment
|
$
|
5,646
|
|
$
|
—
|
|
$
|
—
|
|
||
|
Proceeds from sale of assets
|
1,982
|
|
62,383
|
|
14,529
|
|
|||||
|
Return of long-term contract receivable
|
2,206
|
|
—
|
|
—
|
|
|||||
|
Return of long-term contract receivables—affiliate
|
804
|
|
2,968
|
|
2,463
|
|
|||||
|
Acquisition of plant and equipment and other
|
(7,301
|
)
|
(5,408
|
)
|
(9,607
|
)
|
|||||
|
Acquisition of mineral rights
|
—
|
|
—
|
|
(400
|
)
|
|||||
|
Net cash provided by investing activities of continuing operations
|
$
|
3,337
|
|
$
|
59,943
|
|
$
|
6,985
|
|
||
|
Net cash provided by (used in) investing activities of discontinued operations
|
206
|
|
106,872
|
|
(37,256
|
)
|
|||||
|
Net cash provided by (used in) investing activities
|
$
|
3,543
|
|
$
|
166,815
|
|
$
|
(30,271
|
)
|
||
75
NATURAL RESOURCE PARTNERS L.P.
CONSOLIDATED STATEMENTS OF CASH FLOWS
|
|
Years Ended December 31,
|
||||||||||
|
(In thousands)
|
2017
|
2016
|
2015
|
||||||||
|
Cash flows from financing activities:
|
|||||||||||
|
Proceeds from issuance of Class A Convertible Preferred Units and Warrants, net
|
$
|
242,100
|
|
$
|
—
|
|
$
|
—
|
|
||
|
Proceeds from issuance of 2022 Senior Notes, net
|
103,688
|
|
—
|
|
—
|
|
|||||
|
Proceeds from loans
|
77,000
|
|
20,000
|
|
100,000
|
|
|||||
|
Repayments of loans
|
(492,319
|
)
|
(183,141
|
)
|
(165,983
|
)
|
|||||
|
Distributions to common unitholders and general partner
|
(22,467
|
)
|
(22,465
|
)
|
(71,758
|
)
|
|||||
|
Distributions to preferred unitholders
|
(8,844
|
)
|
—
|
|
—
|
|
|||||
|
Distributions to non-controlling interest
|
—
|
|
—
|
|
(2,744
|
)
|
|||||
|
Proceeds from (contributions to) discontinued operations
|
(493
|
)
|
39,421
|
|
(36,725
|
)
|
|||||
|
Debt issue costs and other
|
(40,384
|
)
|
(15,234
|
)
|
(6,054
|
)
|
|||||
|
Net cash used in financing activities of continuing operations
|
$
|
(141,719
|
)
|
$
|
(161,419
|
)
|
$
|
(183,264
|
)
|
||
|
Net cash provided by (used in) financing activities of discontinued operations
|
493
|
|
(124,759
|
)
|
11,808
|
|
|||||
|
Net cash used in financing activities
|
$
|
(141,226
|
)
|
$
|
(286,178
|
)
|
$
|
(171,456
|
)
|
||
|
Net increase (decrease) in cash and cash equivalents
|
$
|
(10,544
|
)
|
$
|
(11,402
|
)
|
$
|
1,697
|
|
||
|
Cash and cash equivalents of continuing operations at beginning of period
|
$
|
40,371
|
|
$
|
41,204
|
|
$
|
48,971
|
|
||
|
Cash and cash equivalents of discontinued operations at beginning of period
|
—
|
|
10,569
|
|
1,105
|
|
|||||
|
Cash and cash equivalents at beginning of period
|
$
|
40,371
|
|
$
|
51,773
|
|
$
|
50,076
|
|
||
|
Cash and cash equivalents at end of period
|
$
|
29,827
|
|
$
|
40,371
|
|
$
|
51,773
|
|
||
|
Less: cash and cash equivalents of discontinued operations at end of period
|
—
|
|
—
|
|
10,569
|
|
|||||
|
Cash and cash equivalents of continuing operations at end of period
|
$
|
29,827
|
|
$
|
40,371
|
|
$
|
41,204
|
|
||
|
Supplemental cash flow information:
|
|||||||||||
|
Cash paid during the period for interest from continuing operations
|
$
|
72,850
|
|
$
|
84,380
|
|
$
|
85,738
|
|
||
|
Cash paid during the period for interest from discontinued operations
|
$
|
—
|
|
$
|
1,906
|
|
$
|
2,755
|
|
||
|
Non-cash investing and financing activities:
|
|||||||||||
|
Plant, equipment and mineral rights funded with accounts payable or accrued liabilities
|
$
|
294
|
|
$
|
—
|
|
$
|
4,304
|
|
||
|
Issuance of 2022 Senior Notes in exchange for 2018 Senior Notes
|
$
|
240,638
|
|
$
|
—
|
|
$
|
—
|
|
||
The accompanying notes are an integral part of these consolidated financial statements.
76
NATURAL RESOURCE PARTNERS L.P.
NOTES TO CONSOLIDATED FINANCIAL STATEMENTS
1. Organization and Nature of Operations
Natural Resource Partners L.P. (the "Partnership"), a Delaware limited partnership, was formed in April 2002. The general partner of the Partnership is NRP (GP) LP ("NRP GP"), a Delaware limited partnership, whose general partner is GP Natural Resource Partners LLC, a Delaware limited liability company. The Partnership engages principally in the business of owning, operating, managing and leasing a diversified portfolio of mineral properties in the United States, including interests in coal, trona and soda ash, construction aggregates and other natural resources and is organized into
three
operating segments further described in
Note 6. Segment Information
. As used in these Notes to Consolidated Financial Statements, the terms "NRP," "we," "us" and "our" refer to Natural Resource Partners L.P. and its subsidiaries, unless otherwise stated or indicated by context.
The Partnership’s operations are conducted through, and its operating assets are owned by, its subsidiaries. The Partnership owns its subsidiaries through
one
wholly owned operating company, NRP (Operating) LLC ("Opco"). NRP GP has sole responsibility for conducting the Partnership's business and for managing its operations. Because NRP GP is a limited partnership, its general partner, GP Natural Resource Partners LLC, conducts its business and operations, and the board of directors and officers of GP Natural Resource Partners LLC makes decisions on its behalf. Robertson Coal Management LLC ("RCM"), a limited liability company wholly owned by Corbin J. Robertson, Jr., owns all of the membership interest in GP Natural Resource Partners LLC. Subject to the Board Representation and Observation Rights Agreement with certain entities controlled by funds affiliated with The Blackstone Group, L.P. (collectively referred to as "Blackstone") and affiliates of GoldenTree Asset Management LP (collectively referred to as "GoldenTree"), RCM is entitled to appoint the directors of the Board of Directors of GP Natural Resource Partners LLC. RCM has delegated the right to appoint one director to Blackstone.
2. Summary of Significant Accounting Policies
Basis of Presentation
The accompanying Consolidated Financial Statements of the Partnership have been prepared in accordance with generally accepted accounting principles in the United States of America ("GAAP"). The consolidated financial statements include the accounts of Natural Resource Partners L.P. and its wholly owned subsidiaries, as well as BRP LLC ("BRP"), a joint venture with International Paper Company controlled by the Partnership. The Partnership has an equity investment through which it is able to exercise significant influence over but does not control the investee and is not the primary beneficiary of the investee’s activities and is accounted for using the equity method. Intercompany transactions and balances have been eliminated. Certain reclassifications have been made to prior year amounts on the Consolidated Balance Sheets, Consolidated Statements of Comprehensive Income (Loss) and Statements of Cash Flows to conform with current year presentation. These reclassifications have no impact on previously reported assets, liabilities, total revenues and other income, net income (loss), or cash flows from operations, investing or financing.
Use of Estimates
Preparation of the accompanying financial statements in conformity with GAAP requires management to make estimates and assumptions that affect the reported amounts of assets and liabilities in the accompanying Consolidated Balance Sheets, the disclosure of contingent assets and liabilities at the date of the financial statements, and the reported amounts of revenues and expenses in the accompanying Consolidated Statements of Comprehensive Income (Loss) during the reporting period. Actual results could differ from those estimates. The most significant estimates pertain to coal and aggregate reserves and related cash flow estimates which are used to compute depreciation, depletion and amortization and impairments of coal and aggregate properties and commitments and contingencies.
77
NATURAL RESOURCE PARTNERS L.P.
NOTES TO CONSOLIDATED FINANCIAL STATEMENTS—CONTINUED
Fair Value
The Partnership discloses certain assets and liabilities using fair value as defined by authoritative guidance. Fair value is defined as the price that would be received to sell an asset or paid to transfer a liability in an orderly transaction between market participants at the measurement date. See
Note 14. Fair Value Measurements.
There are three levels of inputs that may be used to measure fair value:
|
•
|
Level 1—Quoted prices in active markets for identical assets or liabilities.
|
|
•
|
Level 2—Observable inputs other than Level 1 prices, such as quoted prices for similar assets or liabilities; quoted prices in markets that are not active; or other inputs that are observable or can be corroborated by observable market data for substantially the full term of the assets or liabilities.
|
|
•
|
Level 3—Unobservable inputs that are supported by little or no market activity and that are significant to the fair value of the assets or liabilities. Level 3 assets and liabilities include financial instruments whose value is determined using pricing models, discounted cash flow methodologies, or similar techniques, as well as instruments for which the determination of fair value requires significant management judgment or estimation.
|
Cash and Cash Equivalents
The Partnership considers all highly liquid short-term investments with an original maturity of three months or less to be cash equivalents.
Allowance for Doubtful Accounts
Accounts receivable are recorded net of the allowance for doubtful accounts. The Partnership records an allowance for doubtful accounts for receivables which it determines to be uncollectible based on the specific identification method. Accounts are written off when collection efforts are exhausted and future recovery is doubtful. The allowance for doubtful accounts included in the Partnership's net accounts receivable balance (including affiliates) was
$5.1 million
and
$4.6 million
at
December 31, 2017
and
December 31, 2016
, respectively. A significant amount of the Partnership's allowance for doubtful accounts relates to coal-related receivables. The Partnership recorded bad debt expense of
$2.4 million
,
$0.4 million
and
$4.9 million
, respectively, included in Operating and maintenance expense (including affiliates) on its Consolidated Statements of Comprehensive Income (Loss) for the years ended December 31, 2017, 2016 and 2015, respectively.
Inventory
Inventories are comprised of aggregates and supplies and parts and are stated at the lower of cost or net realizable value. The cost of aggregates and asphalt components such as stone, sand, and recycled and liquid asphalt is determined by the first-in, first-out (FIFO) method. Cost includes all direct materials, direct labor and related production overheads based on normal operating capacity. The cost of supplies and parts inventory is determined by the average cost method and includes operating and maintenance supplies to be used in the Partnership’s aggregates operations.
Plant and Equipment
Plant and equipment is recorded at its original cost of construction or, upon acquisition, at fair value of the asset acquired and consists of coal preparation plants, related coal handling facilities, and other coal and aggregate transportation and processing infrastructure. Expenditures for new facilities or that substantially increase the useful life of property, including interest during construction, are capitalized and reported in the Consolidated Statements of Cash Flows. These assets are depreciated on a straight-line basis over their useful lives generally as follows:
|
|
Years
|
|
Buildings and improvements
|
20 to 40
|
|
Machinery and equipment
|
5 to 12
|
|
Leasehold improvements
|
Life of Lease
|
78
NATURAL RESOURCE PARTNERS L.P.
NOTES TO CONSOLIDATED FINANCIAL STATEMENTS—CONTINUED
The Partnership begins capitalizing costs for construction in process and mine development at its aggregates operations at a point when reserves are determined to be proven or probable, economically mineable and when demand supports investment in the market. Once production commences, capitalization of such costs ceases. Mine development costs are amortized based on production over the estimated life of mineral reserves and amortization is included as a component of depreciation expense.
Mineral Rights
Mineral rights owned and leased are recorded at its original cost of construction or, upon acquisition, at fair value of the assets acquired. Coal and aggregate mineral rights are depleted on a unit-of-production basis by lease, based upon minerals mined in relation to the net cost of the mineral properties and estimated proven and probable tonnage therein.
Intangible Assets
The Partnership’s intangible assets consist primarily of contracts that at acquisition were more favorable for the Partnership than prevailing market rates, known as above-market contracts. The estimated fair values of the above-market rate contracts are determined based on the present value of future cash flow projections related to the underlying assets acquired. Intangible assets are amortized on a unit-of-production basis except that a minimum amortization is calculated on a straight-line basis over the remaining term of the underlying lease for temporarily idled assets.
Asset Impairment
The Partnership has developed procedures to evaluate its long-lived assets for possible impairment periodically or whenever events or changes in circumstances indicate an asset's carrying amount may not be recoverable. These procedures are performed throughout the year and are based on historic, current and future performance and consider both quantitative and qualitative information. A long-lived asset is deemed impaired when the future expected undiscounted cash flows from its use and disposition is less than the assets’ carrying value. Impairment is measured based on the estimated fair value, which is usually determined based upon the present value of the projected future cash flow compared to the assets’ carrying value. The Partnership believes its estimates of cash flows and discount rates are consistent with those of principal market participants. In addition to the evaluations discussed above, specific events such as a reduction in economically recoverable reserves or production ceasing on a property for an extended period may require a separate impairment evaluation be completed on a property.
The Partnership evaluates its equity investment for impairment when events or changes in circumstances indicate, in management’s judgment, that the carrying value of such investment may have experienced an other-than-temporary decline in value. When evidence of loss in value has occurred, management compares the estimated fair value of the investment to the carrying value of the investment to determine whether potential impairment has occurred. If the estimated fair value is less than the carrying value and management considers the decline in value to be other than temporary, the excess of the carrying value over the estimated fair value is recognized in the financial statements as an impairment loss. The fair value of the impaired investment is based on quoted market prices, or upon the present value of expected cash flows using discount rates believed to be consistent with those used by principal market participants, plus market analysis of comparable assets owned by the investee, if appropriate.
Revenue Recognition
Coal Royalty and Other Revenues.
Coal royalty and other revenues are recognized on the basis of tons of mineral mined or sold by the Partnership's lessees and the corresponding revenue from those sales. Generally, the lessees make payments to the Partnership based on the greater of a percentage of the gross sales price or a fixed price per ton of mineral they mine or sell. While the Partnership may have multiple contracts with a single lessee, such contracts are accounted for as separate arrangements.
Most of the Partnership’s coal and aggregates lessees must pay the Partnership minimum annual or quarterly amounts which are generally recoupable out of actual production over certain time periods. These minimum payments are recorded as deferred revenue liability when received. The deferred revenue attributable to the minimum payment is recognized as coal royalty revenue when the underlying mineral lease recoups the minimum payment through production or is recognized as minimums recognized as revenue in the period immediately following the expiration of the lessee’s ability to recoup the payments.
79
NATURAL RESOURCE PARTNERS L.P.
NOTES TO CONSOLIDATED FINANCIAL STATEMENTS—CONTINUED
The Partnership periodically audits lessee information by examining certain records and internal reports of its lessees. The Partnership’s regional managers also perform periodic mine inspections to verify that the information that has been reported to the Partnership is accurate. The audit and inspection processes are designed to identify material variances from lease terms as well as differences between the information reported to the Partnership and the actual results from each property. Audits and inspections, however, are in periods subsequent to when the revenue is reported and any adjustment identified by these processes might be in a reporting period different from when the revenue was initially recorded. Typically there are no material adjustments from this process.
Oil and gas related revenues consist of revenues from royalties and overriding royalties and are recognized on the basis of volume of hydrocarbons sold by lessees and the corresponding revenue from those sales. Also, included within oil and gas royalties are lease bonus payments, which are generally paid upon the execution of a lease.
Transportation and Processing.
Transportation fees are recognized on the basis of tons of material transported over the beltlines. Under the terms of the transportation contracts, the Partnership receives a fixed price per ton for all material transported on the beltlines. Processing fees are recognized on the basis of tons of material processed through the facilities by the lessees and the corresponding revenue from those sales. Generally, the lessees of the processing facilities make payments to the Partnership based on the greater of a percentage of the gross sales price or a fixed price per ton of material that is processed and sold from the facilities. The processing leases are structured in a manner so that the lessees are responsible for operating and maintenance expenses associated with the facilities. These fees are included in Transportation and processing fees (or Transportation and processing fees-affiliate) in the Consolidated Statements of Comprehensive Income (Loss).
Equity in Earnings from Ciner Wyoming.
The Partnership accounts for non-marketable equity investments using the equity method of accounting if the investment gives it the ability to exercise significant influence over, but not control of, an investee. Significant influence generally exists if the Partnership has an ownership interest representing between
20%
and
50%
of the voting stock of the investee. The Partnership accounts for its investment in Ciner Wyoming, of which it owns
49%
, using this method.
Under the equity method of accounting, investments are stated at initial cost and are adjusted for subsequent additional investments and the proportionate share of earnings or losses and distributions. The basis difference between the investment and the proportional share of investee's net assets is hypothetically allocated first to identified tangible assets and liabilities, then to finite-lived intangibles or indefinite-lived intangibles and the balance is attributed to goodwill. The portion of the basis difference attributed to net tangible assets and finite-lived intangibles is amortized over its estimated useful life while indefinite-lived intangibles, if any, and goodwill are not amortized. The amortization of the basis difference is recorded as a reduction of earnings from the equity investment in the Consolidated Statements of Comprehensive Income (Loss).
The carrying value in Ciner Wyoming is reflected in the caption "Equity in unconsolidated investment" in the Partnership's Consolidated Balance Sheets. The Partnership's adjusted share of the earnings or losses of Ciner Wyoming is reflected in the Consolidated Statements of Comprehensive Income (Loss) as revenues and other income under the caption ‘‘Equity in earnings of Ciner Wyoming." The Partnership's share of investee earnings are adjusted to reflect the amortization of any difference between the cost basis of the equity investment and the proportionate share of the investee’s net assets, which has been allocated to the fair value of net identified tangible and finite-lived intangible assets and amortized over the estimated lives of those assets. In reporting cash flows of its equity method investment in Ciner Wyoming, the Partnership utilizes the cumulative earnings approach in which distributions received are considered returns on investment and classified as cash inflows from operating activities unless the cumulative distributions received exceed cumulative equity in earnings recognized by the Partnership, in which case the excess cumulative distributions received would be classified as cash inflows from investing activities as a return of investment.
Construction Aggregates Revenues.
Revenues from the sale of aggregates, gravel, sand and asphalt are recorded based upon the transfer of product at delivery to customers, which generally occurs at the quarries or asphalt plants.
Road Construction and Asphalt Paving.
Revenues from long-term construction contracts are recognized on the percentage-of-completion method, measured by the percentage of total costs incurred to date to the estimated total costs for each contract. That method is used since the Partnership considers total cost to be the best available measure of progress on the contracts. Provisions for estimated losses on uncompleted contracts are made in the period in which such losses are determined. Changes in job performance, job conditions and estimated profitability, including those arising from final contract settlements, which result in revisions to job costs and profits are recognized in the period in which the revisions are determined. Contract costs include all direct job costs and those indirect costs related to contract performance, such as indirect labor, supplies, insurance, equipment maintenance and depreciation.
80
NATURAL RESOURCE PARTNERS L.P.
NOTES TO CONSOLIDATED FINANCIAL STATEMENTS—CONTINUED
See "—Recently Issued Accounting Standards - Revenue Recognition" below for information regarding the impact of adopting the new revenue recognition standard in January 2018.
Property Taxes
The Partnership is responsible for paying property taxes on the properties it owns. Typically, the lessees are contractually responsible for reimbursing the Partnership for property taxes on the leased properties. The payment of and reimbursement of property taxes is included in Operating and maintenance expenses and in Coal Royalty and Other revenues, respectively, in the Consolidated Statements of Comprehensive Income (Loss).
Transportation Revenue and Expense
The Partnership records transportation revenue and pays transportation costs to a Foresight Energy LP ("Foresight Energy") affiliate to operate equipment on behalf of the Partnership. The revenue and expenses related to these transactions are recorded as Transportation and processing revenues (or Transportation and processing revenues—affiliates) and Operating and maintenance expenses or (Operating and maintenance expenses—affiliates), respectively, in the Consolidated Statements of Comprehensive Income (Loss). Subsequent to May 9, 2017, Foresight Energy is no longer deemed a related party; refer to
Note 15. Related Party Transactions
for further details.
Shipping and handling costs invoiced to aggregate customers and paid to third-party carriers are recorded as Construction Aggregates revenues and Operating and maintenance expenses in the Consolidated Statements of Comprehensive Income (Loss). Shipping and handling revenue included in Construction Aggregates revenues was
$38.9 million
,
$36.0 million
and
$42.6 million
for the years ended December 31, 2017, 2016 and 2015, respectively. Shipping and handling costs included in Operating and maintenance expenses was
$36.3 million
,
$35.9 million
and
$42.1 million
for the years ended December 31, 2017, 2016, and 2015, respectively.
Unit-Based Compensation
The Partnership has awarded unit-based compensation in the form of phantom units and accounts for such awards using the fair value method, which requires the Partnership to estimate compensation costs based on the fair value of the grant and remeasure each reporting period based on the Partnership’s common unit price over the requisite service, which is generally vesting period of the grant. In addition, estimated forfeitures are included in the periodic computation of the fair value of the liability. Unit-based compensation expense is recognized in General and administrative expense in the Consolidated Statements of Comprehensive Income.
Deferred Financing Costs
Deferred financing costs consist of legal and other costs related to the issuance of the Partnership’s long-term debt. These costs are amortized over the term of the line-of-credit or debt arrangements. Deferred financing costs related to the Partnership's revolving credit facility are included in other assets (long-term) and deferred financing costs related to the Partnership's note agreements are included as a direct deduction from the carrying amount of the debt liability in Long-term debt, net on the Partnership's Consolidated Balance Sheets.
Income Taxes
The Partnership is not subject to federal or material state income taxes, as the partners are taxed individually on their allocable share of taxable income. Net income for financial statement purposes may differ significantly from taxable income reportable to unitholders as a result of differences between the tax basis and financial reporting basis of assets and liabilities. In the event of an examination of the Partnership’s tax return, the tax liability of the partners could be changed if an adjustment in the Partnership’s income is ultimately sustained by the taxing authorities.
81
NATURAL RESOURCE PARTNERS L.P.
NOTES TO CONSOLIDATED FINANCIAL STATEMENTS—CONTINUED
Recently Adopted Accounting Standards
Statement of Cash Flows.
In August 2016, the Financial Accounting Standards Board (FASB) issued Accounting Standards Update (ASU) No. 2016-15, Statement of Cash Flows (Topic 230), which is intended to clarify how certain cash receipts and cash payments are presented and classified in the statement of cash flows in order to reduce current and potential future diversity in practice. The guidance addresses eight specific cash flow issues for which current GAAP is either unclear or does not include specific guidance. The guidance is effective for annual periods beginning after December 15, 2017 and interim periods within those annual periods.
The Partnership elected to early adopt this guidance in the second quarter of 2017 and elected to continue to classify distributions it received from its equity method investees under the cumulative earnings approach in which distributions received are considered returns on investment and classified as cash inflows from operating activities unless the cumulative distributions received exceed cumulative equity in earnings recognized by the Partnership. The early adoption of this guidance in the second quarter of 2017 did not have a material effect on its consolidated financial statements.
Accounting Changes and Error Corrections.
In January 2017, the FASB issued ASU No. 2017-03, Accounting Changes and Error Corrections (Topic 250) and Investments - Equity Method and Joint Venture (Topic 323), which states that registrants should consider additional qualitative disclosures if the impact of an issued but not yet adopted ASU is unknown or cannot be reasonably estimated and to include a description of the effect of the accounting policies that the registrant expects to apply, if determined. Transition guidance in certain issued but not yet adopted ASUs, including Leases and Revenue Recognition, was also updated to reflect this amendment. This guidance is effective immediately. The Partnership adopted this guidance during the first quarter of 2017. The adoption of this guidance impacted the Partnership's disclosures but had no effect on its financial position, results of operations or cash flows.
Earnings per Share.
In July 2017, the FASB issued ASU No. 2017-11, Earnings Per Share (Topic 260); Distinguishing Liabilities from Equity (Topic 480); Derivatives and Hedging (Topic 815): (Part I) Accounting for Certain Financial Instruments with Down Round Features, (Part II) Replacement of the Indefinite Deferral for Mandatorily Redeemable Financial Instruments of Certain Nonpublic Entities and Certain Mandatorily Redeemable Noncontrolling Interests with a Scope Exception. The guidance eliminates the requirement to consider "down-round" features when determining whether certain equity-linked financial instruments or embedded features are indexed to an entity’s own stock. The guidance requires entities that present earnings per share ("EPS") under ASC 260 to recognize the effect of a down-round feature in a freestanding equity-classified financial instrument only when it is triggered. The effect of triggering such a feature will be recognized as a dividend and a reduction to income available to common shareholders in basic EPS. Entities will also have to make new disclosures for financial instruments with down-round features and other terms that change conversion or exercise prices. The guidance is effective for annual and interim periods ending after December 31, 2018 and early adoption is permitted. The Partnership early adopted this guidance in the third quarter of 2017. Refer to Note 2. Change in Method of Accounting for NRP's Warrants in the Partnerships September 30, 2017 Form 10-Q for disclosure of the effects of adoption on its quarterly consolidated financial statements. There was no impact to the consolidated financial statements for the years ended December 31, 2017, 2016 and 2015.
Recently Issued Accounting Standards
Revenue Recognition.
In May 2014, the FASB issued ASU No. 2014-09, Revenue from Contracts with Customers, as a new Topic, ASC Topic 606. The new revenue recognition standard provides a five-step analysis of transactions to determine when and how revenue is recognized. The core principle of this guidance is that an entity should recognize revenue to depict the transfer of promised goods or services to customers in an amount that reflects the consideration to which the entity expects to be entitled in exchange for those goods or services. The guidance also requires enhanced disclosures, provide more comprehensive guidance for transactions such as service revenue and contract modifications, and enhance guidance for multiple-element arrangements. In August 2015, the FASB issued ASU No. 2015-14, Revenue from Contracts with Customers (Topic 606), which deferred the effective date of ASU No. 2014-09 by one year, making the new standard effective for interim and annual periods beginning after December 15, 2017. This ASU can be adopted either retrospectively or as a cumulative-effect adjustment as of the date of adoption.
Additionally, in March 2016, the FASB issued ASU No. 2016-08, Revenue from Contracts with Customers (Topic 606): Principal versus agent considerations (reporting revenue gross versus net), which clarifies the implementation guidance on principal versus agent considerations on such matters. In April 2016, the FASB issued ASU No. 2016-10, Revenue from Contracts with Customers (Topic 606): Identifying performance obligations and licensing, which clarifies guidance related to identifying performance obligations and licensing implementation guidance contained in the new revenue recognition standard. In May 2016,
82
NATURAL RESOURCE PARTNERS L.P.
NOTES TO CONSOLIDATED FINANCIAL STATEMENTS—CONTINUED
the FASB issued ASU No. 2016-12, Revenue from Contracts with Customers (Topic 606): Narrow-scope improvements and practical expedients, which addresses narrow-scope improvements to the guidance on collectibility, non-cash consideration, and completed contracts at transition. Additionally, the amendments in this update provide a practical expedient for contract modifications at transition and an accounting policy election related to the presentation of sales taxes and other similar taxes collected from customers. In December 2016, the FASB issued ASU No. 2016-20, Technical Corrections and Improvements to Topic 606, Revenue from Contracts with Customers, which clarifies the guidance or corrects unintended application of guidance.
The Partnership adopted the new standard on January 1, 2018 and has elected to use the modified retrospective adoption method. Adopting this guidance will result in increased disclosures related to revenue recognition policies and disaggregation of revenue.
The Partnership identified the contracts for all of its revenue streams and utilized the practical expedient of grouping contracts or performance obligations with similar characteristics as prescribed by the new standard. As a result of the analysis performed, the Partnership concluded that the new revenue recognition standard will have no impact on revenue from NRP's Construction Aggregates or Soda Ash operating segments. However, the Partnership determined that adoption of the new revenue recognition standard will impact certain revenue from NRP's coal royalty leases as further described below. The other revenue streams within the Coal Royalty and Other segment will not be impacted.
Historically, NRP has recognized all coal royalty revenue over the lease term based on coal production and minimum payments were deferred until either recoupment occurred or the recoupment period expired. Under the new revenue recognition standard, management has defined NRP's coal royalty lease performance obligation as providing the lessee the right to mine and sell NRP's coal over the lease term. The Partnership then evaluated the likelihood that consideration NRP received from its lessees resulting from coal production would exceed consideration received from minimum payments over the lease term. As a result of this evaluation, revenue recognition from the Partnership's leases will now be based on either production or minimum payments as follows:
1.
Production Leases: Leases for which the Partnership expects that consideration from coal production will be greater than consideration from minimums over the lease term. Revenue recognition for these leases will be recognized over time based on coal production and minimum payments will continue to be deferred until recoupment occurs or the recoupment becomes remote. If the Partnership does receive minimum payments from these coal royalty leases, it will begin to evaluate the likelihood of recoupment and recognize deferred revenue prior to expiration of the recoupment period if it concludes that recoupment is remote.
2.
Minimum Leases: Leases for which the Partnership expects that consideration from minimums will be greater than consideration from coal production over the lease term. Revenue recognition for these leases will now be recognized straight line over the lease term based on the minimum payment consideration amount.
As a result of implementation of the new standard for the Partnership's coal lease contracts, NRP expects to record approximately
$80 million
to
$90 million
reduction to deferred revenue and a corresponding increase in retained earnings on January 1, 2018. The Partnership will perform this contract evaluation at the end of each reporting period going forward.
Leases
. In February 2016, the FASB issued ASU No. 2016-02, Leases, as a new Topic, ASC Topic 842. The new lease guidance supersedes Topic 840. Lessees are to recognize assets and liabilities on the balance sheet for the present value of the rights and obligations created by all leases with terms of more than 12 months. This ASU does not apply to leases to explore for or use minerals, oil, natural gas and similar non-regenerative resources, including the intangible right to explore for those natural resources and rights to use the land in which those natural resources are contained. The guidance also requires disclosures designed to give financial statement users information on the amount, timing, and uncertainty of cash flows arising from leases. The guidance is effective for annual and interim periods beginning after December 31, 2018. The Partnership is currently evaluating the impact of the provisions of this guidance on its consolidated financial statements.
83
NATURAL RESOURCE PARTNERS L.P.
NOTES TO CONSOLIDATED FINANCIAL STATEMENTS—CONTINUED
3. Class A Convertible Preferred Units and Warrants
On March 2, 2017, NRP issued
$250 million
of Class A Convertible Preferred Units representing limited partner interests in NRP (the "Preferred Units") to certain entities controlled by funds affiliated with The Blackstone Group, L.P. (collectively referred to as "Blackstone") and certain affiliates of GoldenTree Asset Management LP (collectively referred to as "GoldenTree") (together the "Preferred Purchasers") pursuant to a Preferred Unit and Warrant Purchase Agreement. NRP issued
250,000
Preferred Units to the Preferred Purchasers at a price of
$1,000
per Preferred Unit (the "Per Unit Purchase Price"), less a
2.5%
structuring and origination fee. The Preferred Units entitle the Preferred Purchasers to receive cumulative distributions at a rate of
12%
per year, up to one half of which NRP may pay in additional Preferred Units (such additional Preferred Units, the "PIK Units"). The Preferred Units have a perpetual term, unless converted or redeemed as described below.
NRP also issued two tranches of warrants (the "Warrants") to purchase common units to the Preferred Purchasers (Warrants to purchase
1.75 million
common units with a strike price of
$22.81
and Warrants to purchase
2.25 million
common units with a strike price of
$34.00
). The Warrants may be exercised by the holders thereof at any time before the eighth anniversary of the closing date. Upon exercise of the Warrants, NRP may, at its option, elect to settle the Warrants in common units or cash, each on a net basis.
After March 2, 2022 and prior to March 2, 2025, the holders of the Preferred Units may elect to convert up to
33%
of the outstanding Preferred Units in any 12-month period into common units if the volume weighted average trading price of our common units (the "VWAP") for the 30 trading days immediately prior to date notice is provided is greater than
$51.00
. In such case, the number of common units to be issued upon conversion would be equal to the Per Unit Purchase Price plus the value of any accrued and unpaid distributions divided by an amount equal to a
7.5%
discount to the VWAP for the 30 trading days immediately prior to the notice of conversion. Rather than have the Preferred Units convert to common units in accordance with the provisions of this paragraph, NRP would have the option to elect to redeem the Preferred Units proposed to be converted for cash at a price equal to Per Unit Purchase Price plus the value of any accrued and unpaid distributions.
On or after March 2, 2025, the holders of the Preferred Units may elect to convert the Preferred Units to common units at a conversion rate equal to the Liquidation Value divided by an amount equal to a
10%
discount to the VWAP for the 30 trading days immediately prior to the notice of conversion. The “Liquidation Value” will be an amount equal to the greater of: (1) (a) the Per Unit Purchase Price multiplied by (i) prior to March 2, 2020,
1.50
, (ii) on or after March 2, 2020 and prior to March 2, 2021,
1.70
and (iii) on or after March 2, 2021,
1.85
, less (b)(i) all Preferred Unit distributions previously made by NRP and (ii) all cash payments previously made in respect of redemption of any PIK Units; and (2) the Per Unit Purchase Price plus the value of all accrued and unpaid distributions.
To the extent the holders of the Preferred Units have not elected to convert their Preferred Units before March 2, 2029, NRP has the right to force conversion of the Preferred Units at a price equal to the Liquidation Value divided by an amount equal to a
10%
discount to the VWAP for the 30 trading days immediately prior to the notice of conversion.
In addition, NRP has the ability to redeem at any time (subject to compliance with its debt agreements) all or any portion of the Preferred Units and any outstanding PIK Units for cash. The redemption price for each outstanding PIK Unit is
$1,000
plus the value of any accrued and unpaid distributions per PIK Unit. The redemption price for each Preferred Unit is the Liquidation Value divided by the number of outstanding Preferred Units. The Preferred Units are redeemable at the option of the Preferred Purchasers only upon a change in control.
The terms of the Preferred Units contain certain restrictions on NRP's ability to pay distributions on its common units. To the extent that either (i) NRP's consolidated Leverage Ratio, as defined in the Partnership's Fifth Amended and Restated Partnership Agreement dated March 2, 2017 (the "Restated Partnership Agreement"), is greater than
3.25
x, or (ii) the ratio of NRP's Distributable Cash Flow (as defined in the Restated Partnership Agreement) to cash distributions made or proposed to be made is less than
1.2
x (in each case, with respect to the most recently completed four-quarter period), NRP may not increase the quarterly distribution above
$0.45
per quarter without the approval of the holders of a majority of the outstanding Preferred Units. In addition, if at any time after January 1, 2022, any PIK Units are outstanding, NRP may not make distributions on its common units until it has redeemed all PIK Units for cash.
The holders of the Preferred Units have the right to vote with holders of NRP’s common units on an as-converted basis and have other customary approval rights with respect to changes of the terms of the Preferred Units. In addition, Blackstone has certain approval rights over certain matters as identified in the Restated Partnership Agreement. GoldenTree also has more limited approval
84
NATURAL RESOURCE PARTNERS L.P.
NOTES TO CONSOLIDATED FINANCIAL STATEMENTS—CONTINUED
rights that will expand once Blackstone's ownership goes below the Minimum Preferred Unit Threshold (as defined below). These approval rights are not transferrable without NRP's consent. In addition, the approval rights held by Blackstone and GoldenTree will terminate at such time that Blackstone (together with their affiliates) or GoldenTree (together with their affiliates), as applicable, no longer own at least
20%
of the total number of Preferred Units issued on the closing date, together with all PIK Units that have been issued but not redeemed (the "Minimum Preferred Unit Threshold").
At the closing, pursuant to the Board Representation and Observation Rights Agreement, the Preferred Purchasers received certain board appointment and observation rights, and Blackstone appointed one director and one observer to the Board of Directors of GP Natural Resource Partners LLC.
NRP also entered into a registration rights agreement (the "Preferred Unit and Warrant Registration Rights Agreement") with the Preferred Purchasers, pursuant to which NRP is required to file (i) a shelf registration statement to register the common units issuable upon exercise of the Warrants and to cause such registration statement to become effective not later than 90 days following the closing date and (ii) a shelf registration statement to register the common units issuable upon conversion of the Preferred Units and to cause such registration statement to become effective not later than the earlier of the fifth anniversary of the closing date or 90 days following the first issuance of any common units upon conversion of Preferred Units (the "Registration Deadlines"). In addition, the Preferred Unit and Warrant Registration Rights Agreement gives the Preferred Purchasers piggyback registration and demand underwritten offering rights under certain circumstances. The shelf registration statement to register the common units issuable upon exercise of the Warrants became effective on April 20, 2017. If the shelf registration statement to register the common units issuable upon conversion of the Preferred Units is not effective by the applicable Registration Deadline, NRP will be required to pay the Preferred Purchasers liquidated damages in the amounts and upon the term set forth in the Preferred Unit and Warrant Registration Rights Agreement.
Accounting for the Preferred Units and Warrants
Classification
The Preferred Units are accounted for on NRP's consolidated balance sheets as temporary equity due to certain contingent redemption rights that may be exercised at the election of Preferred Purchasers. The Warrants are accounted for on NRP's consolidated balance sheets as equity. Prior to July 1, 2017, the Warrants were previously classified as a liability because of a "down-round" anti-dilution price protection provision that would reduce the Warrant holders' exercise price if NRP were to sell common units at a price less than the current strike price (subject to certain exceptions). The Partnership retrospectively adopted ASU No. 2017-11, Earnings Per Share (Topic 260) in the third quarter of 2017 and reclassified the Warrants on its Consolidated Balance Sheets. Refer to
Note 2. Summary of Significant Accounting Policies
for more discussion.
Initial Measurement
The net transaction price as shown below was allocated to the Preferred Units and Warrants based on their relative fair values at inception date. NRP allocated the transaction issuance costs to the Preferred Units and Warrants primarily on a pro-rata basis based on their relative inception date allocated values. The Preferred Units and Warrants were initially recognized as follows:
|
(In thousands)
|
March 2, 2017
|
|||
|
Transaction price, gross
|
$
|
250,000
|
|
|
|
Structuring, origination and other fees to Preferred Purchasers
|
(7,900
|
)
|
||
|
Transaction costs to other third parties
|
(10,697
|
)
|
||
|
Transaction price, net
|
$
|
231,403
|
|
|
|
Allocation of net transaction price
|
||||
|
Preferred Units, net
|
$
|
164,587
|
|
|
|
Warrant holders interest, net
|
66,816
|
|
||
|
Transaction price, net
|
$
|
231,403
|
|
|
85
NATURAL RESOURCE PARTNERS L.P.
NOTES TO CONSOLIDATED FINANCIAL STATEMENTS—CONTINUED
Subsequent Measurement
Subsequent adjustment of the Preferred Units will not occur until NRP has determined that the conversion or redemption of all or a portion of the Preferred Units is probable of occurring. Once conversion or redemption becomes probable of occurring, the carrying amount of the Preferred Units will be accreted to their redemption value over the period from the date the feature is probable of occurring to the date the Preferred Units can first be converted or redeemed.
Subsequent adjustment of the Warrants will not occur until the Warrants are exercised, at which time, NRP may, at its option, elect to settle the Warrants in common units or cash, each on a net basis. The net basis will be equal to the difference between the Partnership's common unit price and the strike price of the Warrant. Once Warrant exercise occurs, the difference between the carrying amount of the Warrants and the net settlement amount will be allocated on a pro-rata basis to the common unitholders and general partner.
Certain embedded features within the Preferred Unit and Warrant purchase agreement are accounted for at fair value and are remeasured each quarter. See
Note 14. Fair Value Measurements
for further information regarding valuation of these embedded derivatives.
4. Common and Preferred Unit Distributions
The Partnership makes cash distributions to common unit holders on a quarterly basis, subject to approval by the Board of Directors. The Partnership also makes distributions to the preferred unitholders at a rate of
12%
per year, up to one half of which NRP may pay in additional Preferred Units (such additional Preferred Units, the "PIK Units"), subject to approval by the Board of Directors. NRP recognizes both Common and Preferred Unit distributions on the date the distribution is declared.
Common Unit Distributions
Distributions made on the common units and the general partner's general partner interest are made on a pro-rata basis in accordance with their relative percentage interests in the Partnership. The general partner is entitled to receive 2% of such distributions. The following table shows the distributions paid by the Partnership on its common units and general partner's general partner interest during the years ended December 31,
2017
,
2016
and
2015
:
|
(In thousands, except per unit data)
|
Total Distributions
|
|||||||||||||||||
|
Date Paid
|
Period Covered by Distribution
|
Distribution per Common Unit
|
Common Units
|
GP Interest
|
Total
|
|||||||||||||
|
2017
|
||||||||||||||||||
|
February 14, 2017
|
October 1 - December 31, 2016
|
$
|
0.45
|
|
$
|
5,503
|
|
$
|
112
|
|
$
|
5,615
|
|
|||||
|
May 12, 2017
|
January 1 - March 31, 2017
|
0.45
|
|
5,506
|
|
113
|
|
5,619
|
|
|||||||||
|
August 14, 2017
|
April 1 - June 30, 2017
|
0.45
|
|
5,504
|
|
112
|
|
5,616
|
|
|||||||||
|
November 14, 2017
|
July 1 - September 30, 2017
|
0.45
|
|
5,505
|
|
112
|
|
5,617
|
|
|||||||||
|
2016
|
||||||||||||||||||
|
February 12, 2016
|
October 1 - December 31, 2015
|
$
|
0.45
|
|
$
|
5,503
|
|
$
|
113
|
|
$
|
5,616
|
|
|||||
|
May 13, 2016
|
January 1 - March 31, 2016
|
0.45
|
|
5,503
|
|
113
|
|
5,616
|
|
|||||||||
|
August 12, 2016
|
April 1 - June 30, 2016
|
0.45
|
|
5,505
|
|
112
|
|
5,617
|
|
|||||||||
|
November 14, 2016
|
July 1 - September 30, 2016
|
0.45
|
|
5,503
|
|
113
|
|
5,616
|
|
|||||||||
|
2015
|
||||||||||||||||||
|
February 13, 2015
|
October 1 - December 31, 2014
|
$
|
3.50
|
|
$
|
42,804
|
|
$
|
874
|
|
$
|
43,678
|
|
|||||
|
May 14, 2015
|
January 1 - March 31, 2015
|
0.90
|
|
11,007
|
|
225
|
|
11,232
|
|
|||||||||
|
August 14, 2015
|
April 1 - June 30, 2015
|
0.90
|
|
11,009
|
|
223
|
|
11,232
|
|
|||||||||
|
November 13, 2015
|
July 1 - September 30, 2015
|
0.45
|
|
5,504
|
|
112
|
|
5,616
|
|
|||||||||
86
NATURAL RESOURCE PARTNERS L.P.
NOTES TO CONSOLIDATED FINANCIAL STATEMENTS—CONTINUED
Preferred Unit Distributions
The following table shows the cash and paid-in-kind distributions declared and paid to Preferred Unitholders by the Partnership during the year ended December 31,
2017
:
|
(In thousands, except per unit data)
|
|||||||||||||||||
|
Date Paid
|
Period Covered by Distribution
|
Distribution per Preferred Unit
|
Paid-in-Kind Preferred Units
|
Cash Distributions
|
Total Distribution Declared
|
||||||||||||
|
May 30, 2017
|
March 2 - March 31, 2017
|
$
|
5.00
|
|
1,250
|
|
$
|
1,250
|
|
$
|
2,500
|
|
|||||
|
August 29, 2017
|
April 1 - June 30, 2017
|
$
|
15.00
|
|
3,769
|
|
3,769
|
|
7,538
|
|
|||||||
|
November 29, 2017
|
July 1 - September 30, 2017
|
$
|
15.00
|
|
3,825
|
|
3,825
|
|
7,650
|
|
|||||||
|
8,844
|
|
$
|
8,844
|
|
$
|
17,688
|
|
||||||||||
The following table shows the units outstanding and financial position of the Preferred Units from initial measurement at March 2, 2017 to December 31, 2017:
|
(In thousands)
|
Units outstanding
|
Financial position
|
||||
|
Balance at December 31, 2016
|
—
|
|
$
|
—
|
|
|
|
Issuance of Preferred Units, net
|
250,000
|
|
164,587
|
|
||
|
Distribution paid-in-kind
|
8,844
|
|
8,844
|
|
||
|
Balance at December 31, 2017
|
258,844
|
|
$
|
173,431
|
|
|
Income available to common unitholders and the general partner is reduced by Preferred Unit distributions that accumulated during the period. During the year ended
December 31, 2017
, NRP reduced net income attributable to common unitholders and the general partner by
$25.5 million
as a result of accumulated Preferred Unit distributions.
Subsequent Event
On February 14, 2018, the Partnership paid a distribution of
$0.45
per unit to unitholders of record on February 7, 2018. In addition, the Partnership paid a distribution on NRP's
12.0%
Class A Convertible Preferred Units with respect to the fourth quarter. The entire
$7.8 million
distribution on the Preferred Units was paid in cash. Additionally, the Partnership redeemed all of the outstanding PIK Units, which resulted in an
$8.8 million
cash payment.
5. Net Income Per Common Unit
Basic net income per common unit is computed by dividing net income, after considering income attributable to preferred unitholders and the general partner’s interest, by the weighted average number of common units outstanding. Diluted net income per common unit includes the effect of NRP's Warrants and Preferred Units (see
Note 3. Class A Convertible Preferred Units and Warrants
), if the inclusion of these items is dilutive.
The dilutive effect of the Warrants is calculated using the treasury stock method, which assumes that the proceeds from the exercise of these instruments are used to purchase common units at the average market price for the period. The calculation of the dilutive effect of the Warrants for the three and twelve months ended
December 31, 2017
, did not include the net settlement of Warrants to purchase
2.25 million
common units with a strike price of
$34.00
because the impact would have been anti-dilutive.
The dilutive effect of the Preferred Units is calculated using the if-converted method. Under the if-converted method, the Preferred Units are assumed to be converted at the beginning of the period, and the resulting common units are included in the denominator of the diluted net income per unit calculation for the period being presented. Interest recognized during the period (including the effect of accretion of discounts and amortization of issuance costs, if any), distributions declared in the period and undeclared distributions on the Preferred Units that accumulated during the period are added back to the numerator for purposes of the if-converted calculation.
87
NATURAL RESOURCE PARTNERS L.P.
NOTES TO CONSOLIDATED FINANCIAL STATEMENTS—CONTINUED
The following table reconciles net income and weighted average units used in computing basic and diluted net income per common unit is as follows (in thousands, except per unit data):
|
Years Ended December 31,
|
||||||||||||
|
(In thousands, except per unit data)
|
2017
|
2016
|
2015
|
|||||||||
|
Allocation of net income:
|
||||||||||||
|
Net income (loss) from continuing operations
|
$
|
89,208
|
|
$
|
95,214
|
|
$
|
(260,171
|
)
|
|||
|
Less: income attributable to preferred unitholders
|
25,453
|
|
—
|
|
—
|
|
||||||
|
Less: net income (loss) from continuing operations and income attributable to preferred unitholders allocated to the general partner
|
1,275
|
|
1,629
|
|
(5,998
|
)
|
||||||
|
Net income (loss) from continuing operations attributable to common unitholders
|
$
|
62,480
|
|
$
|
93,585
|
|
$
|
(254,173
|
)
|
|||
|
Net income (loss) from discontinued operations
|
$
|
(541
|
)
|
$
|
1,678
|
|
$
|
(311,549
|
)
|
|||
|
Less: net income (loss) from discontinued operations attributable to the general partner
|
(11
|
)
|
34
|
|
(6,230
|
)
|
||||||
|
Net income (loss) from discontinued operations attributable to common unitholders
|
$
|
(530
|
)
|
$
|
1,644
|
|
$
|
(305,319
|
)
|
|||
|
Net income (loss)
|
$
|
88,667
|
|
$
|
96,892
|
|
$
|
(571,720
|
)
|
|||
|
Less: income attributable to preferred unitholders
|
25,453
|
|
—
|
|
—
|
|
||||||
|
Less: net income (loss) and income attributable to preferred unitholders allocated to the general partner
|
1,264
|
|
1,663
|
|
(12,228
|
)
|
||||||
|
Net income (loss) attributable to common unitholders
|
$
|
61,950
|
|
$
|
95,229
|
|
$
|
(559,492
|
)
|
|||
|
Basic Income (Loss) per Unit:
|
||||||||||||
|
Weighted average common units—basic
|
12,232
|
|
12,232
|
|
12,232
|
|
||||||
|
Basic net income (loss) from continuing operations per common unit
|
$
|
5.11
|
|
$
|
7.65
|
|
$
|
(20.78
|
)
|
|||
|
Basic net income (loss) from discontinued operations per common unit
|
$
|
(0.04
|
)
|
$
|
0.13
|
|
$
|
(24.97
|
)
|
|||
|
Basic net income (loss) per common unit
|
$
|
5.06
|
|
$
|
7.78
|
|
$
|
(45.75
|
)
|
|||
|
Diluted Income (Loss) per Unit:
|
||||||||||||
|
Weighted average common units—basic
|
12,232
|
|
12,232
|
|
12,232
|
|
||||||
|
Plus: dilutive effect of Warrants
|
300
|
|
—
|
|
—
|
|
||||||
|
Plus: dilutive effect of Preferred Units
|
9,418
|
|
—
|
|
—
|
|
||||||
|
Weighted average common units—diluted
|
21,950
|
|
12,232
|
|
12,232
|
|
||||||
|
Net income (loss) from continuing operations
|
$
|
89,208
|
|
$
|
95,214
|
|
$
|
(260,171
|
)
|
|||
|
Less: net income (loss) from continuing operations allocated to the general partner
|
1,784
|
|
1,629
|
|
(5,998
|
)
|
||||||
|
Diluted net income (loss) from continuing operations attributable to common unitholders
|
$
|
87,424
|
|
$
|
93,585
|
|
$
|
(254,173
|
)
|
|||
|
Diluted net income (loss) from discontinued operations attributable to common unitholders
|
$
|
(530
|
)
|
$
|
1,644
|
|
$
|
(305,319
|
)
|
|||
|
Net income (loss)
|
$
|
88,667
|
|
$
|
96,892
|
|
$
|
(571,720
|
)
|
|||
|
Less: net income (loss) allocated to the general partner
|
1,773
|
|
1,663
|
|
(12,228
|
)
|
||||||
|
Diluted net income (loss) attributable to common unitholders
|
$
|
86,894
|
|
$
|
95,229
|
|
$
|
(559,492
|
)
|
|||
|
Diluted net income (loss) from continuing operations per common unit
|
$
|
3.98
|
|
$
|
7.65
|
|
$
|
(20.78
|
)
|
|||
|
Diluted net income (loss) from discontinued operations per common unit
|
$
|
(0.02
|
)
|
$
|
0.13
|
|
$
|
(24.97
|
)
|
|||
|
Diluted net income (loss) per common unit
|
$
|
3.96
|
|
$
|
7.78
|
|
$
|
(45.75
|
)
|
|||
88
NATURAL RESOURCE PARTNERS L.P.
NOTES TO CONSOLIDATED FINANCIAL STATEMENTS—CONTINUED
6. Segment Information
The Partnership's segments are strategic business units that offer products and services to different customers in different geographies within the U.S. and that are managed accordingly. NRP has the following
three
operating segments:
Coal Royalty and Other
—consists primarily of coal royalty and coal-related transportation and processing assets. Other assets include aggregates royalty, industrial mineral royalty, oil and gas royalty and timber. The Partnership's coal reserves are primarily located in Appalachia, the Illinois Basin and the Western United States. The Partnership's aggregates and industrial minerals properties are located in a number of states across the United States. The Partnership's oil and gas royalty assets are primarily located in Louisiana.
Soda Ash
—consists of the Partnership's
49%
non-controlling equity interest in a trona ore mining operation and soda ash refinery in the Green River Basin, Wyoming. Ciner Resources LP, the Partnership's operating partner, mines the trona, processes it into soda ash, and distributes the soda ash both domestically and internationally into the glass and chemicals industries. The Partnership receives regular quarterly distributions from this business.
Construction Aggregates
—consists of the Partnership's construction materials business that operates hard rock quarries, an underground limestone mine, sand and gravel plants, asphalt plants and marine terminals. Construction Aggregates
operates in Pennsylvania, West Virginia, Tennessee, Kentucky and Louisiana.
Direct segment costs and certain costs incurred at the corporate level that are identifiable and that benefit the Partnership's segments are allocated to the operating segments. These allocated costs include costs of: taxes, legal, information technology and shared facilities services and are included in Operating and maintenance expenses and Operating and maintenance expenses—affiliates on the Consolidated Statements of Comprehensive Income (Loss). Intersegment sales are at prices that approximate market.
Corporate and Financing includes functional corporate departments that do not earn revenues. Costs incurred by these departments include interest and financing, corporate headquarters and overhead, centralized treasury and accounting and other corporate-level activity not specifically allocated to a segment and are included in General and administrative expenses and General and administrative expenses—affiliates on the Consolidated Statements of Comprehensive Income (Loss).
The following table summarizes certain financial information for each of the Partnership's operating segments:
|
Operating Segments
|
||||||||||||||||||||
|
(In thousands)
|
Coal Royalty and Other
|
Soda Ash
|
Construction Aggregates
|
Corporate and Financing
|
Total
|
|||||||||||||||
|
For the Year Ended December 31, 2017
|
||||||||||||||||||||
|
Revenues (including affiliates)
|
$
|
202,323
|
|
$
|
40,457
|
|
$
|
131,381
|
|
$
|
—
|
|
$
|
374,161
|
|
|||||
|
Intersegment revenues (expenses)
|
295
|
|
—
|
|
(295
|
)
|
—
|
|
—
|
|
||||||||||
|
Gain on asset sales, net
|
3,545
|
|
—
|
|
311
|
|
—
|
|
3,856
|
|
||||||||||
|
Operating and maintenance expenses
(including affiliates)
|
24,883
|
|
—
|
|
111,633
|
|
—
|
|
136,516
|
|
||||||||||
|
General and administrative (including affiliates)
|
—
|
|
—
|
|
—
|
|
18,502
|
|
18,502
|
|
||||||||||
|
Depreciation, depletion and amortization
(including affiliates)
|
23,414
|
|
—
|
|
12,579
|
|
—
|
|
35,993
|
|
||||||||||
|
Asset impairment
|
2,967
|
|
—
|
|
64
|
|
—
|
|
3,031
|
|
||||||||||
|
Other expense, net
|
—
|
|
—
|
|
693
|
|
94,074
|
|
94,767
|
|
||||||||||
|
Net income (loss) from continuing operations
|
154,899
|
|
40,457
|
|
6,428
|
|
(112,576
|
)
|
89,208
|
|
||||||||||
|
Net income from discontinued operations
|
—
|
|
—
|
|
—
|
|
—
|
|
(541
|
)
|
||||||||||
|
Capital expenditures
|
—
|
|
—
|
|
7,595
|
|
—
|
|
7,595
|
|
||||||||||
|
As of December 31, 2017
|
||||||||||||||||||||
|
Total assets of continuing operations
|
$
|
945,237
|
|
$
|
245,433
|
|
$
|
191,374
|
|
$
|
6,129
|
|
$
|
1,388,173
|
|
|||||
|
Total assets of discontinued operations
|
—
|
|
—
|
|
—
|
|
—
|
|
991
|
|
||||||||||
|
Trade accounts receivable (including affiliates)
|
16,355
|
|
—
|
|
22,976
|
|
—
|
|
39,331
|
|
||||||||||
|
Property taxes and other receivable (including affiliates)
|
7,856
|
|
—
|
|
—
|
|
—
|
|
7,856
|
|
||||||||||
89
NATURAL RESOURCE PARTNERS L.P.
NOTES TO CONSOLIDATED FINANCIAL STATEMENTS—CONTINUED
|
Operating Segments
|
||||||||||||||||||||
|
(In thousands)
|
Coal Royalty and Other
|
Soda Ash
|
Construction Aggregates
|
Corporate and Financing
|
Total
|
|||||||||||||||
|
For the Year Ended December 31, 2016
|
||||||||||||||||||||
|
Revenues (including affiliates)
|
$
|
210,115
|
|
$
|
40,061
|
|
$
|
120,802
|
|
$
|
—
|
|
$
|
370,978
|
|
|||||
|
Intersegment revenues (expenses)
|
150
|
|
—
|
|
(150
|
)
|
—
|
|
—
|
|
||||||||||
|
Gain on asset sales, net
|
29,068
|
|
—
|
|
13
|
|
—
|
|
29,081
|
|
||||||||||
|
Operating and maintenance expenses
(including affiliates) |
29,890
|
|
—
|
|
100,656
|
|
—
|
|
130,546
|
|
||||||||||
|
General and administrative (including affiliates)
|
—
|
|
—
|
|
—
|
|
20,570
|
|
20,570
|
|
||||||||||
|
Depreciation, depletion and amortization
(including affiliates)
|
31,766
|
|
—
|
|
14,506
|
|
—
|
|
46,272
|
|
||||||||||
|
Asset impairment
|
15,861
|
|
—
|
|
1,065
|
|
—
|
|
16,926
|
|
||||||||||
|
Other expense, net
|
—
|
|
—
|
|
—
|
|
90,531
|
|
90,531
|
|
||||||||||
|
Net income (loss) from continuing operations
|
161,816
|
|
40,061
|
|
4,438
|
|
(111,101
|
)
|
95,214
|
|
||||||||||
|
Net income from discontinued operations
|
—
|
|
—
|
|
—
|
|
—
|
|
1,678
|
|
||||||||||
|
Capital expenditures
|
5
|
|
—
|
|
5,380
|
|
—
|
|
5,385
|
|
||||||||||
|
As of December 31, 2016
|
||||||||||||||||||||
|
Total assets of continuing operations
|
$
|
990,172
|
|
$
|
255,901
|
|
$
|
190,615
|
|
$
|
10,970
|
|
$
|
1,447,658
|
|
|||||
|
Total assets of discontinued operations
|
—
|
|
—
|
|
—
|
|
—
|
|
991
|
|
||||||||||
|
Trade accounts receivable (including affiliates)
|
18,791
|
|
—
|
|
19,168
|
|
—
|
|
37,959
|
|
||||||||||
|
Property taxes and other receivable (including affiliates)
|
11,661
|
|
—
|
|
208
|
|
32
|
|
11,901
|
|
||||||||||
|
For the Year Ended December 31, 2015
|
||||||||||||||||||||
|
Revenues (including affiliates)
|
$
|
243,781
|
|
$
|
49,918
|
|
$
|
139,049
|
|
$
|
—
|
|
$
|
432,748
|
|
|||||
|
Intersegment revenues (expenses)
|
21
|
|
—
|
|
(21
|
)
|
—
|
|
—
|
|
||||||||||
|
Gain (loss) on asset sales, net
|
6,936
|
|
—
|
|
(36
|
)
|
—
|
|
6,900
|
|
||||||||||
|
Operating and maintenance expenses
(including affiliates)
|
35,321
|
|
—
|
|
116,945
|
|
—
|
|
152,266
|
|
||||||||||
|
General and administrative (including affiliates)
|
—
|
|
—
|
|
—
|
|
12,348
|
|
12,348
|
|
||||||||||
|
Depreciation, depletion and amortization
(including affiliates)
|
45,338
|
|
—
|
|
15,578
|
|
—
|
|
60,916
|
|
||||||||||
|
Asset impairment
|
378,327
|
|
—
|
|
6,218
|
|
—
|
|
384,545
|
|
||||||||||
|
Other expense, net
|
—
|
|
—
|
|
—
|
|
89,744
|
|
89,744
|
|
||||||||||
|
Net income (loss) from continuing operations
|
(208,248
|
)
|
49,918
|
|
251
|
|
(102,092
|
)
|
(260,171
|
)
|
||||||||||
|
Net loss from discontinued operations
|
—
|
|
—
|
|
—
|
|
—
|
|
(311,549
|
)
|
||||||||||
|
Capital expenditures
|
428
|
|
—
|
|
14,039
|
|
—
|
|
14,467
|
|
||||||||||
90
NATURAL RESOURCE PARTNERS L.P.
NOTES TO CONSOLIDATED FINANCIAL STATEMENTS—CONTINUED
7. Discontinued Operations
In July 2016, NRP Oil and Gas sold its non-operated oil and gas working interest assets for
$116.1 million
in gross sales proceeds. The sale had an effective date of April 1, 2016.
The Partnership's exit from its non-operated oil and gas working interest business represented a strategic shift to reduce debt and focus on its coal royalty, soda ash and construction aggregates business segments. As a result, the Partnership classified the operating results, cash flows and assets and liabilities of its non-operated oil and gas working interest assets as discontinued operations in its Consolidated Balance Sheets, Consolidated Statements of Comprehensive Income and Consolidated Statements of Cash Flows for all periods presented. The Partnership transitioned the remaining investments in royalty interests in oil and natural gas properties into the Coal Royalty and Other operating segment during the third quarter of 2016.
The following table presents the carrying amounts of the Partnership's assets and liabilities of discontinued operations in the Consolidated Balance Sheets:
|
December 31,
|
|||||||
|
(In thousands)
|
2017
|
2016
|
|||||
|
ASSETS
|
|||||||
|
Current assets:
|
|||||||
|
Accounts receivable, net (including affiliates)
(1)
|
$
|
991
|
|
$
|
991
|
|
|
|
Total assets of discontinued operations
|
$
|
991
|
|
$
|
991
|
|
|
|
LIABILITIES
|
|||||||
|
Current liabilities:
|
|||||||
|
Other (including affiliates)
(1)
|
$
|
401
|
|
$
|
353
|
|
|
|
Total liabilities of discontinued operations
|
$
|
401
|
|
$
|
353
|
|
|
|
(1)
|
See
Note 15. Related Party Transactions
for additional information on the Partnership's related party assets and liabilities.
|
The following table presents summarized financial results of the Partnership's discontinued operations in the Consolidated Statements of Comprehensive Income (Loss):
|
For the Years Ended December 31,
|
|||||||||||
|
(In thousands)
|
2017
|
2016
|
2015
|
||||||||
|
Revenues and other income:
|
|||||||||||
|
Oil and gas
|
$
|
38
|
|
$
|
16,486
|
|
$
|
48,750
|
|
||
|
Gain on asset sales
|
(289
|
)
|
8,274
|
|
451
|
|
|||||
|
Total revenues and other income
|
$
|
(251
|
)
|
$
|
24,760
|
|
$
|
49,201
|
|
||
|
Operating expenses:
|
|||||||||||
|
Operating and maintenance expenses (including affiliates)
|
$
|
290
|
|
$
|
11,503
|
|
$
|
19,724
|
|
||
|
Depreciation, depletion and amortization
|
—
|
|
7,527
|
|
39,912
|
|
|||||
|
Asset impairments
|
—
|
|
564
|
|
297,049
|
|
|||||
|
Total operating expenses
|
$
|
290
|
|
$
|
19,594
|
|
$
|
356,685
|
|
||
|
Interest expense
|
—
|
|
(3,488
|
)
|
(4,065
|
)
|
|||||
|
Income (loss) from discontinued operations
|
$
|
(541
|
)
|
$
|
1,678
|
|
$
|
(311,549
|
)
|
||
91
NATURAL RESOURCE PARTNERS L.P.
NOTES TO CONSOLIDATED FINANCIAL STATEMENTS—CONTINUED
The following table presents supplemental cash flow information of the Partnership's discontinued operations:
|
Years Ended December 31,
|
|||||||||||
|
(In thousands)
|
2017
|
2016
|
2015
|
||||||||
|
Cash paid for interest
|
$
|
—
|
|
$
|
1,906
|
|
$
|
2,755
|
|
||
|
Plant, equipment and mineral rights funded with accounts payable or accrued liabilities
|
—
|
|
—
|
|
1,645
|
|
|||||
Capital expenditures related to the Partnership's discontinued operations were
$1.4 million
and
$30.6 million
during the years months ended December 31, 2016 and 2015, respectively.
8. Equity Investment
The Partnership accounts for its
49%
investment in Ciner Wyoming using the equity method of accounting. Ciner Wyoming distributed
$49.0 million
,
$46.6 million
and
$46.8 million
to the Partnership in the year ended
December 31, 2017
,
2016
and
2015
, respectively.
The difference between the amount at which the investment in Ciner Wyoming is carried and the amount of underlying equity in Ciner Wyoming's net assets was
$145.6 million
and
$150.0 million
as of
December 31, 2017
and
2016
, respectively. This excess basis relates to plant, property and equipment and right to mine assets. The excess basis difference that relates to property, plant and equipment is being amortized into income using the straight-line method over a weighted average of
28 years
. The excess basis difference that relates to right to mine assets is being amortized into income using the units of production method.
The Partnership's equity in the earnings of Ciner Wyoming is summarized as follows:
|
For the Year Ended December 31,
|
|||||||||||
|
(In thousands)
|
2017
|
2016
|
2015
|
||||||||
|
Income allocation to NRP’s equity interests
(1)
|
$
|
44,846
|
|
$
|
44,882
|
|
$
|
54,709
|
|
||
|
Amortization of basis difference
|
(4,389
|
)
|
(4,821
|
)
|
(4,791
|
)
|
|||||
|
Equity in earnings of unconsolidated investment
|
$
|
40,457
|
|
$
|
40,061
|
|
$
|
49,918
|
|
||
|
(1)
|
Includes reclassifications of accumulated other comprehensive loss to income allocation to NRP equity interest of
$0.7 million
,
$0.9 million
and
$0.7 million
for the year ended December 31, 2017, 2016 and 2015, respectively.
|
The results of Ciner Wyoming’s operations are summarized as follows:
|
|
For the Year Ended December 31,
|
||||||||||
|
(In thousands)
|
2017
|
2016
|
2015
|
||||||||
|
Sales
|
$
|
497,340
|
|
$
|
475,187
|
|
$
|
486,393
|
|
||
|
Gross profit
|
114,202
|
|
114,232
|
|
131,493
|
|
|||||
|
Net Income
|
91,523
|
|
91,596
|
|
111,650
|
|
|||||
The financial position of Ciner Wyoming is summarized as follows:
|
December 31,
|
|||||||
|
(In thousands)
|
2017
|
2016
|
|||||
|
Current assets
|
$
|
180,433
|
|
$
|
134,616
|
|
|
|
Noncurrent assets
|
228,002
|
|
235,427
|
|
|||
|
Current liabilities
|
56,219
|
|
55,396
|
|
|||
|
Noncurrent liabilities
|
148,401
|
|
98,425
|
|
|||
92
NATURAL RESOURCE PARTNERS L.P.
NOTES TO CONSOLIDATED FINANCIAL STATEMENTS—CONTINUED
The purchase agreement for the acquisition of the Partnership’s interest in Ciner Wyoming required the Partnership to pay additional contingent consideration to Anadarko to the extent certain performance criteria described in the purchase agreement were met by Ciner Wyoming in any of the years 2013, 2014 or 2015. During the first quarters of 2016, 2015 and 2014, the Partnership paid contingent consideration of
$7.2 million
,
$3.8 million
and
$0.5 million
, respectively, in contingent consideration to Anadarko for performance criteria met by Ciner Wyoming in 2015, 2014 and 2013, respectively.
9. Inventory
The components of inventories are as follows:
|
December 31,
|
|||||||
|
(In thousands)
|
2017
|
2016
|
|||||
|
Aggregates
|
$
|
6,209
|
|
$
|
6,037
|
|
|
|
Supplies and parts
|
1,344
|
|
856
|
|
|||
|
Total inventory
|
$
|
7,553
|
|
$
|
6,893
|
|
|
10. Plant and Equipment
The Partnership’s plant and equipment consist of the following:
|
December 31,
|
|||||||
|
(In thousands)
|
2017
|
2016
|
|||||
|
Plant and equipment at cost
|
$
|
84,173
|
|
$
|
79,171
|
|
|
|
Construction in process
|
803
|
|
557
|
|
|||
|
Less accumulated depreciation
|
(38,806
|
)
|
(30,285
|
)
|
|||
|
Total plant and equipment, net
|
$
|
46,170
|
|
|
$
|
49,443
|
|
Depreciation expense related to the Partnership's plant and equipment totaled
$10.3 million
,
$12.4 million
and
$15.9 million
for the year ended
December 31, 2017
,
2016
and
2015
, respectively.
Impairment expense related to the Partnership's plant and equipment totaled
$0.1 million
,
$3.1 million
, and
$7.7 million
and are included in Asset impairments in the Consolidated Statements of Comprehensive Income (Loss) for the year ending
December 31, 2017
,
2016
and
2015
, respectively. During 2016, the Partnership recorded a
$2.0 million
impairment expense in its Coal Royalty and Other segment primarily related to a coal preparation plant and a
$1.1 million
impairment expense in its Construction Aggregates segment primarily related to equipment write-downs. During 2015, the Partnership recorded
$7.0 million
in impairment expense in its Coal Royalty and Other segment related to a coal preparation plant, transportation and processing assets and obsolete equipment. Additionally, the Partnership recorded a
$0.7 million
impairment expense related to obsolete plant and equipment in its Construction Aggregates segment.
11. Mineral Rights
The Partnership’s mineral rights consist of the following:
|
|
December 31, 2017
|
||||||||||
|
(In thousands)
|
Carrying Value
|
Accumulated Depletion
|
Net Book Value
|
||||||||
|
Coal properties
|
$
|
1,170,104
|
|
$
|
(436,964
|
)
|
$
|
733,140
|
|
||
|
Aggregates properties
|
150,642
|
|
(16,836
|
)
|
133,806
|
|
|||||
|
Oil and gas royalty properties
|
12,395
|
|
(7,158
|
)
|
5,237
|
|
|||||
|
Other
|
13,168
|
|
(1,466
|
)
|
11,702
|
|
|||||
|
Total mineral rights, net
|
$
|
1,346,309
|
|
$
|
(462,424
|
)
|
$
|
883,885
|
|
||
93
NATURAL RESOURCE PARTNERS L.P.
NOTES TO CONSOLIDATED FINANCIAL STATEMENTS—CONTINUED
|
|
December 31, 2016
|
||||||||||
|
(In thousands)
|
Carrying Value
|
Accumulated Depletion
|
Net Book Value
|
||||||||
|
Coal properties
|
$
|
1,170,904
|
|
$
|
(420,032
|
)
|
$
|
750,872
|
|
||
|
Aggregates properties
|
176,774
|
|
(39,056
|
)
|
137,718
|
|
|||||
|
Oil and gas royalty properties
|
12,395
|
|
(6,289
|
)
|
6,106
|
|
|||||
|
Other
|
14,946
|
|
(1,450
|
)
|
13,496
|
|
|||||
|
Total mineral rights, net
|
$
|
1,375,019
|
|
$
|
(466,827
|
)
|
$
|
908,192
|
|
||
Depletion expense related to the Partnership’s mineral rights totaled
$22.2 million
,
$29.8 million
and
$40.4 million
for the year ended
December 31, 2017
,
2016
and
2015
, respectively.
Asset Divestitures
During the year ended December 31, 2017, the Partnership sold mineral reserves in its Coal Royalty and Other segment in multiple transactions for cumulative
$1.0 million
of gross sales proceeds and recorded a
$3.5 million
gain on asset sales included in Gain on asset sales, net on its Consolidated Statement of Comprehensive Income (Loss).
During the year ended December 31, 2016, the Partnership completed the sale of the following assets:
1)
Oil and gas royalty and overriding royalty interests in the Coal Royalty and Other segment in several producing properties located in the Appalachian Basin for
$36.4 million
gross sales proceeds. The effective date of the sale was January 1, 2016, and the Partnership recorded an
$18.6 million
gain from this sale included in Gain on asset sales, net on its Consolidated Statement of Comprehensive Income (Loss).
2)
Aggregates reserves and related royalty rights in the Coal Royalty and Other segment at three aggregates operations located in Texas, Georgia and Tennessee for
$10.0 million
gross sales proceeds. The effective date of the sale was February 1, 2016, and the Partnership recorded a
$1.5 million
gain from this sale included in Gain on asset sales, net on its Consolidated Statement of Comprehensive Income (Loss).
In addition to the two asset sales described above, during the year ended December 31, 2016, the Partnership sold mineral reserves within its Coal Royalty and Other segment in multiple sale transactions for cumulative
$17.3 million
of gross sales proceeds and recorded
$8.6 million
of cumulative gain from these sale transactions that are included in Gain on asset sales, net on its Consolidated Statement of Comprehensive Income (Loss). These amounts primarily relate to eminent domain transactions with governmental agencies and the sale of additional oil and gas royalty interests.
During the year ended December 31, 2015, the Partnership sold mineral reserves in its Coal Royalty and Other segment in multiple transactions for cumulative
$3.5 million
of gross sales proceeds and recorded a
$3.3 million
gain on asset sales included in Gain on asset sales, net on its Consolidated Statement of Comprehensive Income (Loss).
Impairment of Mineral Rights
For the evaluation of the Partnership's long-lived assets for possible impairment, inputs used by management for fair value measurements include significant inputs that are not observable in the market and thus represent a Level 3 fair value measurement for these types of assets. In addition to the evaluations discussed above, specific events such as a reduction in economically recoverable reserves or production ceasing on a property for an extended period may require that a separate impairment evaluation be completed on a significant property.
94
NATURAL RESOURCE PARTNERS L.P.
NOTES TO CONSOLIDATED FINANCIAL STATEMENTS—CONTINUED
During the years ended
December 31, 2017
,
2016
and
2015
, the Partnership identified facts and circumstances that indicated that the carrying value of certain of its mineral rights exceed future cash flows from those assets and recorded non-cash impairment expense as follows:
|
For the years ended December 31,
|
|||||||||||
|
(In thousands)
|
2017
|
2016
|
2015
|
||||||||
|
Coal properties
(1)
|
$
|
595
|
|
$
|
12,088
|
|
$
|
257,468
|
|
||
|
Oil and gas properties
(2)
|
—
|
|
36
|
|
70,527
|
|
|||||
|
Aggregates and timber royalty properties
(3)
|
2,372
|
|
1,677
|
|
43,402
|
|
|||||
|
Total
|
$
|
2,967
|
|
$
|
13,801
|
|
$
|
371,397
|
|
||
|
(1)
|
The Partnership recorded
$0.6 million
of coal property impairments during the year ended
December 31, 2017
. The Partnership recorded
$12.1 million
of coal property impairments during the year ended December 31, 2016, primarily as a result of lease surrender and termination. The Partnership recorded
$3.8 million
of coal property impairment during the three months ended September 30, 2016 and the fair value of the impaired asset was reduced to
$4.0 million
at September 30, 2016. The Partnership recorded
$8.2 million
of coal property impairment during the three months ended December 31, 2016 and the fair value of the impaired asset was reduced to
$0.0 million
at December 31, 2016. Total coal property impairment expense for the year ended December 31, 2015 was
$257.5 million
. The Partnership recorded
$1.5 million
of coal property impairment during the three months ended June 30, 2015 and the fair value measurement of these impaired assets was reduced to
$0.0 million
at June 30, 2015. The Partnership recorded
$247.8 million
of coal property impairment during the three months ended September 30, 2015 and the fair value of these impaired assets was reduced to
$28.4 million
at September 30, 2015. The Partnership recorded the remaining
$8.2 million
of coal property impairment during the three months ended December 31, 2015 and the fair value of these impaired assets was reduced to
$0.4 million
at December 31, 2015. These impairments primarily resulted from the continued deterioration and expectations of further reductions in global and domestic coal demand due to reduced global steel demand, sustained low natural gas prices, and continued regulatory pressure on the electric power generation industry. NRP compared net capitalized costs of its coal properties to estimated undiscounted future net cash flows. If the net capitalized cost exceeded the undiscounted future cash flows, the Partnership recorded an impairment for the excess of net capitalized cost over fair value. Significant inputs used to determine fair value include estimates of future cash flow, discount rate and useful economic life. Estimated cash flows are the product of a process that began with current realized pricing as of the measurement date and included an adjustment for risk related to the future realization of cash flows.
|
|
(2)
|
The Partnership recorded
$36 thousand
of oil and gas royalty asset impairment during the year ended December 31, 2016. The total oil and gas royalty impairment for the year ended December 31, 2015 was
$70.5 million
. The Partnership recorded this impairment during the three months ended September 30, 2015. The fair value measurement of these impaired assets was reduced to
$13.0 million
at September 30, 2015. This impairment primarily resulted from declines in future expected realized commodity prices and reduced expected drilling activity on its acreage. NRP compared net capitalized costs of its oil and gas royalty properties to estimated undiscounted future net cash flows. If the net capitalized cost exceeded the undiscounted future net cash flows, the Partnership recorded an impairment for the excess of net capitalized cost over fair value. A discounted cash flow method was used to estimate fair value. Significant inputs used to determine the fair value include estimates of: (i) oil and gas reserves and risk-adjusted probable and possible reserves; (ii) future commodity prices; (iii) production costs, (iv) capital expenditures, (v) production and (vi) discount rates. The underlying commodity prices embedded in the Partnership's estimated cash flows are the product of a process that begins with NYMEX forward curve pricing as of the measurement date, adjusted for estimated location and quality differentials.
|
|
(3)
|
The Partnership recorded
$2.4 million
of aggregates and timber royalty property impairments during the year ended December 31, 2017. The Partnership recorded
$1.7 million
of aggregates royalty property impairments during the year ended December 31, 2016. Total aggregates property impairment expense for the year ended December 31, 2015 was
$43.4 million
. This impairment was recorded during the three months ended September 30, 2015. The fair value measurement of these impaired assets was reduced to
$13.1 million
at September 30, 2015. This impairment primarily resulted from greenfield development projects that have not performed as projected, leading to recent lease concessions on minimums and royalties combined with the continued regional market decline for certain properties. NRP compared net capitalized costs of its aggregates properties to estimated undiscounted future net cash flows. If the net capitalized cost exceeded the undiscounted cash flows, the Partnership recorded an impairment for the excess of net capitalized cost over fair value. A discounted cash flow model was used to estimate fair value. Significant inputs used to determine fair value include estimates
|
95
NATURAL RESOURCE PARTNERS L.P.
NOTES TO CONSOLIDATED FINANCIAL STATEMENTS—CONTINUED
of future cash flow, discount rate and useful economic life. Estimated cash flows are the product of a process that began with current realized pricing as of the measurement date and included an adjustment for risk related to the future realization of cash flows.
12. Goodwill and Intangible Assets (Including Affiliate)
The Partnership's intangible assets (including affiliate) primarily consists of above market coal transportation contracts with subsidiaries of Foresight Energy in which the Partnership receives throughput fees for the handling and transportation of coal. As of May 9, 2017, Foresight Energy is no longer deemed to be an affiliate of the Partnership. Refer to
Note 15. Related Party Transactions
for additional details. The Partnership's intangible assets include permits, aggregates-related trade names and other agreements. The Partnership's intangible assets (including affiliate) included in the Partnership's Consolidated Balance Sheets are as follows:
|
December 31,
|
|||||||
|
(In thousands)
|
2017
|
2016
|
|||||
|
Intangible assets (including affiliate)
|
$
|
86,336
|
|
$
|
86,336
|
|
|
|
Less accumulated amortization (including affiliate)
|
(36,782
|
)
|
(33,289
|
)
|
|||
|
Total intangible assets, net (including affiliate)
|
$
|
49,554
|
|
$
|
53,047
|
|
|
Amortization expense related to the Partnership's intangible assets—affiliate totaled
$1.0 million
,
$3.2 million
and
$3.6 million
for the years ended
December 31, 2017
,
2016
and
2015
, respectively. Amortization expense related to the Partnership's intangible assets totaled
$2.5 million
,
$0.8 million
and
$1.0 million
for the years ended
December 31, 2017
,
2016
and
2015
, respectively.
The estimates of amortization expense for the years ended December 31, as indicated below, are based on current mining plans and are subject to revision as those plans change in future periods.
|
(In thousands)
|
Estimated Amortization Expense
|
|||
|
2018
|
$
|
3,123
|
|
|
|
2019
|
2,921
|
|
||
|
2020
|
3,492
|
|
||
|
2021
|
3,351
|
|
||
|
2022
|
3,351
|
|
||
The weighted average remaining amortization period for contract intangibles and other intangibles was
25 years
and
14 years
, respectively.
During 2014,
$52.0 million
of goodwill was added relating to the Construction Aggregates acquisition. This amount represented the preliminary residual value. During 2015, the purchase price allocation was adjusted as more detailed analysis was completed and additional information was obtained about the facts and circumstances for Construction Aggregates’ property, plant and equipment, right to mine assets and asset retirement obligations that existed as of the acquisition date. These adjustments decreased goodwill by
$46.5 million
and resulted in an acquisition date goodwill of
$5.5 million
. During 2015, the Partnership evaluated goodwill for impairment and compared the estimated fair value of the Construction Aggregates reporting unit to its carrying amount. The carrying amount exceeded fair value and the Partnership recorded a
$5.5 million
goodwill impairment expense include in Asset impairments on the Partnership's Consolidated Statements of Comprehensive Income (Loss). The lower fair value was primarily a result of the deterioration in certain regional markets in which Construction Aggregates operates causing a decline in future performance levels compared to levels estimated during the purchase price allocation process. A discounted cash flow model was used to estimate fair value. Significant inputs used to determine fair value include estimates of future cash flow, discount rate and useful economic life. These estimates were based on current conditions and historical experience applied to develop projections of future operating performance.
96
NATURAL RESOURCE PARTNERS L.P.
NOTES TO CONSOLIDATED FINANCIAL STATEMENTS—CONTINUED
13. Debt
The Partnership's debt consisted of the following:
|
December 31,
|
|||||||
|
(In thousands)
|
2017
|
2016
|
|||||
|
NRP LP debt:
|
|||||||
|
10.500% senior notes, with semi-annual interest payments in March and September, due March 2022, $241 million issued at par and $105 million issued at 98.75%
|
$
|
345,638
|
|
$
|
—
|
|
|
|
9.125% senior notes, with semi-annual interest payments in April and October, due October 2018, $300 million issued at 99.007% and $125 million issued at 99.5%
|
—
|
|
425,000
|
|
|||
|
Opco debt:
|
|||||||
|
Revolving credit facility
|
60,000
|
|
210,000
|
|
|||
|
Senior notes
|
|||||||
|
4.91% with semi-annual interest payments in June and December, with annual principal payments in June, due June 2018
|
4,586
|
|
9,187
|
|
|||
|
8.38% with semi-annual interest payments in March and September, with annual principal payments in March, due March 2019
|
42,670
|
|
64,029
|
|
|||
|
5.05% with semi-annual interest payments in January and July, with annual principal payments in July, due July 2020
|
22,946
|
|
30,633
|
|
|||
|
5.55% with semi-annual interest payments in June and December, with annual principal payments in June, due June 2023
|
16,115
|
|
18,825
|
|
|||
|
4.73% with semi-annual interest payments in June and December, with annual principal payments in December, due December 2023
|
44,693
|
|
52,204
|
|
|||
|
5.82% with semi-annual interest payments in March and September, with annual principal payments in March, due March 2024
|
104,520
|
|
119,524
|
|
|||
|
8.92% with semi-annual interest payments in March and September, with annual principal payments in March, due March 2024
|
31,733
|
|
36,272
|
|
|||
|
5.03% with semi-annual interest payments in June and December, with annual principal payments in December, due December 2026
|
120,547
|
|
134,035
|
|
|||
|
5.18% with semi-annual interest payments in June and December, with annual principal payments in December, due December 2026
|
34,396
|
|
38,262
|
|
|||
|
5.31% utility local improvement obligation, with annual principal and interest payments in February, due March 2021
|
—
|
|
961
|
|
|||
|
Total debt at face value
|
$
|
827,844
|
|
$
|
1,138,932
|
|
|
|
Net unamortized debt discount
|
(1,661
|
)
|
(1,322
|
)
|
|||
|
Net unamortized debt issuance costs
|
(16,835
|
)
|
(7,339
|
)
|
|||
|
Total debt, net
|
$
|
809,348
|
|
$
|
1,130,271
|
|
|
|
Less: current portion of long-term debt
|
79,740
|
|
140,037
|
|
|||
|
Total long-term debt, net
|
$
|
729,608
|
|
$
|
990,234
|
|
|
97
NATURAL RESOURCE PARTNERS L.P.
NOTES TO CONSOLIDATED FINANCIAL STATEMENTS—CONTINUED
NRP LP Debt
NRP 2018 Senior Notes
In March 2017, the Partnership and NRP Finance exchanged
$241 million
aggregate principal amount of the 2018 Senior Notes for
$241 million
aggregate principal amount of a new series of
10.500%
Senior Notes due 2022 (the “2022 Senior Notes”). In April 2017, the Partnership and NRP Finance redeemed
$90 million
in aggregate principal amount of the 2018 Senior Notes at a redemption price of
104.563%
, and paid all accrued and unpaid interest thereon. In addition, pursuant to the 2022 Indenture (as defined below), the Partnership and NRP Finance redeemed the remaining outstanding
$94.4 million
of 2018 Senior Notes at par (and paid accrued and unpaid interest thereon) on October 2, 2017 using a combination of cash on hand and borrowings from the Opco Credit Facility.
2022 Senior Notes
In March 2017, NRP and NRP Finance issued
$346 million
aggregate principal amount of 2022 Senior Notes to several holders of their 2018 Senior Notes. Of the
$346 million
of 2022 Senior Notes issued,
$241 million
in aggregate principal amount were issued in exchange for
$241 million
in aggregate principal amount of 2018 Senior Notes, and
$105 million
of the 2022 Senior Notes were issued to the holders for cash. The 2022 Senior Notes are issued under an Indenture dated as of March 2, 2017 (the "2022 Indenture"), bear interest at
10.500%
per year, are payable semi-annually on March 15 and September 15, beginning September 15, 2017, and mature on March 15, 2022. The
$105.0 million
in 2022 Senior Notes purchased for cash were issued at a price of
98.75%
(original issue discount of
1.25%
), and each holder exchanging 2018 Senior Notes received a fee of
5.813%
of the aggregate principal amount of all 2018 Senior Notes tendered for exchange by such holder, as well as all accrued and unpaid interest thereon. The
5.813%
fee included a
4.563%
call premium on the early repayment of the 2018 Senior Notes and a
1.25%
fee on the exchange of the 2018 Notes for 2022 Senior Notes. This fee is accounted for as a debt issue cost, capitalized and shown net of the debt liability on our consolidated balance sheets.
NRP and NRP Finance have the option to redeem the 2022 Senior Notes, in whole or in part, at any time on or after March 15, 2019, at the redemption prices (expressed as percentages of principal amount) of
105.25%
for the 12-month period beginning March 15, 2019,
102.625%
for the 12-month period beginning March 15, 2020, and thereafter at
100.000%
, together, in each case, with any accrued and unpaid interest to the date of redemption. Furthermore, before March 15, 2019, NRP may on any one or more occasions redeem up to
35%
of the aggregate principal amount of the 2022 Senior Notes with the net proceeds of certain public or private equity offerings at a redemption price of
110.500%
of the principal amount of 2022 Senior Notes, plus any accrued and unpaid interest, if any, to the date of redemption, if at least
65%
of the aggregate principal amount of the 2022 Senior Notes issued under the 2022 Indenture remains outstanding immediately after such redemption and the redemption occurs within 180 days of the closing date of such equity offering. In the event of a change of control, as defined in the 2022 Indenture, the holders of the 2022 Senior Notes may require the Partnership to purchase their 2022 Senior Notes at a purchase price equal to
101%
of the principal amount of the 2022 Senior Notes, plus accrued and unpaid interest, if any.
The 2022 Indenture contains restrictive covenants that are substantially similar to those contained in the Indenture governing the 2018 Senior Notes, except that the debt incurrence and restricted payments covenants contain additional restrictions. Under the debt incurrence covenant, NRP's non-guarantor restricted subsidiaries will not be permitted to incur additional indebtedness unless their consolidated leverage ratio is less than
3.00
x (measured on a pro forma basis and assuming that the greater of (i)
$150.0 million
of debt (or, if less, at NRP's election, the amount of total lending commitments under any revolving credit facility) and (ii) the actual amount of debt outstanding is outstanding under any revolving credit facility); provided, however, that such non-guarantor restricted subsidiaries will be permitted to make up to
$150 million
in borrowings under a revolving credit facility (which amount will be reduced on a dollar-for-dollar basis to the extent NRP has made the election described in clause (i) above). Under the restricted payments covenant, NRP will not be able to increase the quarterly distribution on its common units or elect to pay more than
50%
of the distributions required to be made on the Preferred Units in cash, unless, in each case, its consolidated leverage ratio is less than
4.00
x. The 2022 Indenture also contains restrictions on NRP's ability to redeem the Preferred Units.
The 2022 Senior Notes are the senior unsecured obligations of NRP and NRP Finance. The 2022 Senior Notes rank equal in right of payment to all existing and future senior unsecured debt of NRP and NRP Finance and senior in right of payment to any of NRP's subordinated debt. The 2022 Senior Notes are effectively subordinated in right of payment to all future secured debt of NRP and NRP Finance to the extent of the value of the collateral securing such indebtedness and are structurally subordinated in right of payment to all existing and future debt and other liabilities of our subsidiaries, including the Opco Credit Facility and each series of Opco’s existing senior notes. None of NRP's subsidiaries guarantee the 2022 Senior Notes.
98
NATURAL RESOURCE PARTNERS L.P.
NOTES TO CONSOLIDATED FINANCIAL STATEMENTS—CONTINUED
As of
December 31, 2017
and December 31, 2016, NRP and NRP Finance were in compliance with the terms of its debt agreements.
Opco Debt
All of Opco’s debt is guaranteed by its wholly owned subsidiaries and is secured by certain of the assets of Opco and its wholly owned subsidiaries other than NRP Trona LLC, as further described below. As of
December 31, 2017
and 2016, Opco was in compliance with the terms of the financial covenants contained in its debt agreements.
Opco Credit Facility
Opco’s Third Amended and Restated Credit Agreement, as amended (the "Opco Credit Facility"), matures on April 30, 2020. Commitments under the Opco Credit Facility were reduced to
$150 million
at December 31, 2017 and will be further reduced to
$100 million
at December 31, 2018 through maturity in April 2020.
Indebtedness under the Opco Credit Facility bears interest, at Opco's option, at:
|
•
|
the higher of (i) the prime rate as announced by the agent bank; (ii) the federal funds rate plus
0.50%
; or (iii) LIBOR plus
1%
, in each case plus an applicable margin ranging from
2.50%
to
3.50%
; or
|
|
•
|
a rate equal to LIBOR plus an applicable margin ranging from
3.50%
to
4.50%
.
|
The weighted average interest rates for the borrowings outstanding under the Opco Credit Facility for the years ended
December 31, 2017
and 2016 were
5.32%
and
4.46%
, respectively. Debt issue cost related to the OpCo credit facility were
$4.6 million
and
$4.0 million
at
December 31, 2017
and December 31, 2016, respectively and have been capitalized and included in Other assets on the Partnership's Consolidated Balance Sheets. Opco will incur a commitment fee on the unused portion of the revolving credit facility at a rate of
0.50%
per annum. Opco may prepay all amounts outstanding under the Opco Credit Facility at any time without penalty. As of
December 31, 2017
, Opco had
$60.0 million
of indebtedness outstanding and
$90.0 million
in borrowing capacity under our Opco Credit Facility.
The Opco Credit Facility contains financial covenants requiring Opco to maintain:
|
•
|
a leverage ratio of consolidated indebtedness to EBITDDA (as defined in the Opco Credit Facility) not to exceed
4.0
x; provided, however, that if NRP increases its quarterly distribution to its common unitholders above
$0.45
per common unit, the maximum leverage ratio under the Opco Credit Facility will permanently decrease from
4.0
x to
3.0
x; and
|
|
•
|
a fixed charge coverage ratio of consolidated EBITDDA to consolidated fixed charges (consisting of consolidated interest expense and consolidated lease expense) of not less than
3.5
to 1.0.
|
The Opco Credit Facility contains certain additional customary negative covenants that, among other items, restrict Opco’s ability to incur additional debt, grant liens on its assets, make investments, sell assets and engage in business combinations. Included in the investment covenant are restrictions upon Opco’s ability to acquire assets where Opco does not maintain certain levels of liquidity. In addition, Opco is required to use
75%
of the net cash proceeds of certain non-ordinary course asset sales to repay the Opco Credit Facility (without any corresponding commitment reduction) and use the remaining
25%
of the net cash proceeds to offer to repay its senior notes on a pro-rata basis, as described below under “—Opco Senior Notes.” The Opco Credit Facility also contains customary events of default, including cross-defaults under Opco’s senior notes.
The Opco Credit Facility is collateralized and secured by liens on certain of Opco’s assets with carrying values of
$649.7 million
and
$673.0 million
classified as Land, Plant and equipment and Mineral rights on the Partnership’s Consolidated Balance Sheets as of
December 31, 2017
and 2016, respectively. The collateral includes (1) the equity interests in all of Opco’s wholly owned subsidiaries, other than NRP Trona LLC (which owns a
49%
non-controlling equity interest in Ciner Wyoming), (2) the personal property and fixtures owned by Opco’s wholly owned subsidiaries, other than NRP Trona LLC, (3) Opco’s material coal royalty revenue producing properties, (4) real property associated with certain of Construction Aggregates’ construction aggregates mining operations, and (5) certain of Opco’s coal-related infrastructure assets.
99
NATURAL RESOURCE PARTNERS L.P.
NOTES TO CONSOLIDATED FINANCIAL STATEMENTS—CONTINUED
Opco Senior Notes
Opco has issued several series of private placement senior notes (the "Opco Senior Notes") with various interest rates and principal due dates. As of
December 31, 2017
and 2016, the Opco Senior Notes had cumulative principal balances of
$422.2 million
and
$503.0 million
, respectively. Opco made mandatory principal payments on the Opco Senior Notes of
$80.8 million
$82.9 million
and
$80.8 million
for the years ended
December 31, 2017
, 2016 and 2015, respectively.
The Note Purchase Agreements relating to the Opco Senior Notes contain covenants requiring Opco to:
|
•
|
maintain a ratio of consolidated indebtedness to consolidated EBITDDA (as defined in the note purchase agreement) of no more than
4.0
to 1.0 for the four most recent quarters;
|
|
•
|
not permit debt secured by certain liens and debt of subsidiaries to exceed
10%
of consolidated net tangible assets (as defined in the note purchase agreement); and
|
|
•
|
maintain the ratio of consolidated EBITDDA (as defined in the note purchase agreement) to consolidated fixed charges (consisting of consolidated interest expense and consolidated operating lease expense) at not less than
3.5
to 1.0.
|
In addition, the Note Purchase Agreements include a covenant that provides that, in the event NRP Operating or any of its subsidiaries is subject to any additional or more restrictive covenants under the agreements governing its material indebtedness (including the Opco Credit Facility and all renewals, amendments or restatements thereof), such covenants shall be deemed to be incorporated by reference in the Note Purchase Agreements and the holders of the Notes shall receive the benefit of such additional or more restrictive covenants to the same extent as the lenders under such material indebtedness agreement.
The
8.38%
and
8.92%
Opco Senior Notes also provide that in the event that Opco’s leverage ratio of consolidated indebtedness to consolidated EBITDDA (as defined in the Note Purchase Agreements) exceeds
3.75
to 1.00 at the end of any fiscal quarter, then in addition to all other interest accruing on these notes, additional interest in the amount of
2.00%
per annum shall accrue on the notes for the two succeeding quarters and for as long thereafter as the leverage ratio remains above
3.75
to 1.00. Opco has not exceeded the
3.75
to 1.00 ratio at the end of any fiscal quarter through
December 31, 2017
.
In September 2016, Opco amended the Opco Senior Notes. Under this amendment, Opco agreed to use certain asset sale proceeds to make mandatory prepayment offers on the Opco Senior Notes as follows:
|
•
|
until the earlier of the time that (1) Opco has sold
$300 million
of assets and (2) June 30, 2020, Opco will be required to make prepayment offers to the holders of the Opco Senior Notes using
25%
of the net cash proceeds from certain asset sales; and
|
|
•
|
after the earlier to occur of the dates above, Opco will be required to make prepayment offers to the holders of the Opco Senior Notes using an amount of net cash proceeds from certain asset sales that will be calculated pro-rata based on the amount of Opco Senior Notes then outstanding compared to the other total Opco senior debt outstanding that is being prepaid.
|
The mandatory prepayment offers described above will be made pro-rata across each series of outstanding Opco Senior Notes and will not require any make-whole payment by Opco. In addition, the remaining principal and interest payments on the Opco Senior Notes will be adjusted accordingly based on the amount of Opco Senior Notes actually prepaid. The prepayments do not affect the maturity dates of any series of the Opco Senior Notes.
100
NATURAL RESOURCE PARTNERS L.P.
NOTES TO CONSOLIDATED FINANCIAL STATEMENTS—CONTINUED
Consolidated Principal Payments
The consolidated principal payments due are set forth below:
|
|
NRP LP
|
Opco
|
|
||||||||||||
|
(In thousands)
|
Senior Notes
(1)
|
Senior Notes
|
Credit Facility
|
Total
|
|||||||||||
|
2018
|
$
|
—
|
|
$
|
80,385
|
|
$
|
—
|
|
$
|
80,385
|
|
|||
|
2019
|
—
|
|
75,799
|
|
—
|
|
75,799
|
|
|||||||
|
2020
|
—
|
|
54,464
|
|
60,000
|
|
114,464
|
|
|||||||
|
2021
|
—
|
|
46,815
|
|
—
|
|
46,815
|
|
|||||||
|
2022
|
345,638
|
|
46,815
|
|
—
|
|
392,453
|
|
|||||||
|
Thereafter
|
—
|
|
117,928
|
|
—
|
|
117,928
|
|
|||||||
|
$
|
345,638
|
|
|
$
|
422,206
|
|
|
$
|
60,000
|
|
|
$
|
827,844
|
|
|
|
(1)
|
The
10.500%
senior notes due 2022 were issued at a discount and were carried at
$344.0 million
as of December 31, 2017.
|
14. Fair Value Measurements
Fair Value of Financial Instruments
The Partnership’s financial instruments consist of cash and cash equivalents, accounts receivable, contracts receivable, accounts payable, debt, Preferred Units and warrants. The carrying amounts reported on the Consolidated Balance Sheets for cash and cash equivalents, accounts receivable and accounts payable approximate fair value due to their short-term nature. There were no transfers between Level 1, Level 2 or Level 3 of the fair value hierarchy during the years ended
December 31, 2017
or
2016
.
The Partnership uses available market data and valuation methodologies to estimate the fair value of debt. The fair value of debt is the estimated amount the Partnership would have to pay a third party to assume the debt, including a credit spread for the difference between the issue rate and the period end market rate. The credit spread is the Partnership's default or repayment risk. The following table shows the carrying amount and estimated fair value of the Partnership's debt and contracts receivable (including affiliates):
|
|
December 31, 2017
|
December 31, 2016
|
|||||||||||||
|
(In thousands)
|
Carrying
Value
|
Estimated
Fair Value |
Carrying
Value |
Estimated
Fair Value |
|||||||||||
|
Debt
|
|||||||||||||||
|
NRP 2018 Senior Notes
(1)
|
$
|
—
|
|
$
|
—
|
|
$
|
420,097
|
|
$
|
412,250
|
|
|||
|
NRP 2022 Senior Notes
(1)
|
330,404
|
|
366,376
|
|
—
|
|
—
|
|
|||||||
|
Opco Senior Notes and utility local improvement obligation
(2)
|
418,944
|
|
447,538
|
|
500,174
|
|
488,814
|
|
|||||||
|
Opco Revolving Credit Facility
(3)
|
60,000
|
|
60,000
|
|
210,000
|
|
210,000
|
|
|||||||
|
Assets:
|
|||||||||||||||
|
Contracts receivable (including affiliates), current and long-term
(4)
|
$
|
43,826
|
|
$
|
30,517
|
|
$
|
46,742
|
|
$
|
32,554
|
|
|||
|
(1)
|
The Level 1 fair value is based upon quotations obtained for identical instruments on the closing trading prices near period end.
|
|
(2)
|
Due to no observable quoted prices on these instruments, the Level 3 fair value is estimated by management using quotations obtained for the NRP Senior Notes on the closing trading prices near period end.
|
|
(3)
|
The Level 3 fair value approximates the outstanding borrowing amount because the interest rates are variable and reflective of market rates and the terms of the credit facility allow the Partnership to repay this debt at any time without penalty.
|
101
NATURAL RESOURCE PARTNERS L.P.
NOTES TO CONSOLIDATED FINANCIAL STATEMENTS—CONTINUED
|
(4)
|
The Level 3 fair value is determined based on the present value of future cash flow projections related to the underlying assets.
|
NRP has embedded derivatives in the Preferred Units related to certain conversion options, redemption features and the change of control provision that are accounted for separately from the Preferred Units as assets and liabilities at fair value in NRP's consolidated balance sheets. Level 3 valuation of the embedded derivatives are based on numerous factors including the likelihood of the event occurring. The embedded derivatives are revalued at each reporting period, and changes in their fair value would be recorded in Other income (expense) in NRP's Consolidated Statements of Comprehensive Income (Loss). The embedded derivatives had
zero
value at inception and as of
December 31, 2017
.
Fair Value of Non-Financial Assets
The Partnership discloses or recognizes its non-financial assets, such as impairments of coal and aggregate properties and other assets, at fair value on a nonrecurring basis. Refer to
Note 10. Plant and Equipment
and
Note 11. Mineral Rights
for additional disclosures related to the fair value associated with the impaired assets.
15. Related Party Transactions
Cline Affiliates and Foresight Energy
Mr. Chris Cline, both individually and through another affiliate, Adena Minerals, LLC ("Adena"), owned a
31%
interest in NRP's general partner, as well as approximately
0.5 million
of NRP's common units through May 9, 2017. On May 9, 2017, Adena sold its
31%
limited partner interest in NRP (GP) LP (the Partnership’s general partner) (“NRP GP”) to Great Northern Properties Limited Partnership (“GNPLP”) and Western Pocahontas Properties Limited Partnership ("WPPLP") (the “Adena Sale”). GNPLP and WPPLP are companies controlled by Corbin J. Robertson, the Chairman and Chief Executive Officer of GP Natural Resource Partners LLC (the general partner of NRP GP) (“GP LLC”). Upon closing of this transaction, NRP no longer considers the various companies affiliated with Chris Cline, including Foresight Energy to be affiliates of NRP. As a result, all transactions (including revenues, expenses and cash flows) after May 9, 2017, with the various companies affiliated with Chris Cline, including Foresight Energy, are considered to be third party transactions.
Various subsidiaries of Foresight Energy lease coal reserves from the Partnership, and the Partnership also leases coal transportation assets to them for a fee. Revenues related to these transactions with Foresight Energy are included in the Partnership's Consolidated Statement of Comprehensive Income (Loss) as follows:
|
For the Years Ended December 31,
|
|||||||||||
|
(In thousands)
|
2017
|
2016
|
2015
|
||||||||
|
Coal royalty and other revenue
|
$
|
43,273
|
|
$
|
—
|
|
$
|
—
|
|
||
|
Coal royalty and other
—
affiliates revenue
|
27,216
|
|
63,355
|
|
86,614
|
|
|||||
|
Total
|
$
|
70,489
|
|
$
|
63,355
|
|
$
|
86,614
|
|
||
During the year ended December 31, 2015, the Partnership recognized a gain of
$9.3 million
on a reserve swap at Foresight Energy's Williamson mine. The gain is included in Coal royalty and other—affiliates revenues on the Consolidated Statements of Comprehensive Income (Loss). The Level 3 fair value of the reserves was estimated using a discounted cash flow model. The expected cash flows were developed using estimated annual sales tons, forecasted sales prices and anticipated market royalty rates.
In addition, NRP owns and leases a rail load out facility and owns a contractual overriding royalty interest at Foresight Energy's Sugar Camp mine. NRP's rail load out lease with a subsidiary of Foresight Energy is accounted for as a direct financing lease. Minimum lease payments are
$5.0 million
per year for the next five years and represent a
$1.25 million
per quarter in deficiency payment. NRP's contractual overriding royalty interest from a subsidiary of Foresight Energy provides for payments based upon production from specific tons at Foresight Energy's Sugar Camp operations. This overriding royalty is accounted for as a financing arrangement. Revenues from these transactions are included in Coal royalty and other revenues, including affiliates, in the table above.
102
NATURAL RESOURCE PARTNERS L.P.
NOTES TO CONSOLIDATED FINANCIAL STATEMENTS—CONTINUED
Lastly, NRP owns rail load out transportation assets and subcontracts out the operating responsibilities to a subsidiary of Foresight Energy at Foresight's Williamson mine. Expenses related to these transactions with Foresight Energy are included in the Partnership's Consolidated Statement of Comprehensive Income (Loss) as follows:
|
For the Years Ended December 31,
|
|||||||||||
|
(In thousands)
|
2017
|
2016
|
2015
|
||||||||
|
Operating and maintenance expense
|
$
|
1,066
|
|
$
|
—
|
|
$
|
—
|
|
||
|
Operating and maintenance expense—affiliates, net
|
452
|
|
1,347
|
|
1,413
|
|
|||||
|
Total
|
$
|
1,518
|
|
$
|
1,347
|
|
$
|
1,413
|
|
||
The following table shows certain amounts related to NRP's Sugar Camp rail load out facility direct financing lease and amounts of all other transactions with subsidiaries of Foresight Energy reflected on NRP's Consolidated Balance Sheets:
|
December 31,
|
|||||||
|
(In thousands)
|
2017
|
2016
|
|||||
|
Sugar Camp rail load out direct financing lease amounts
|
|||||||
|
Projected remaining payments
|
$
|
71,452
|
|
$
|
76,424
|
|
|
|
Unearned Income
|
28,366
|
|
31,803
|
|
|||
|
ASSETS
|
|||||||
|
Accounts receivable
|
$
|
6,127
|
|
$
|
—
|
|
|
|
Accounts receivable—affiliates, net
|
—
|
|
6,496
|
|
|||
|
Long-term contracts receivable
|
40,776
|
|
—
|
|
|||
|
Long-term contracts receivable—affiliates
|
—
|
|
43,785
|
|
|||
|
LIABILITIES
|
|||||||
|
Deferred revenue
|
$
|
53,778
|
|
—
|
|
||
|
Deferred revenue—affiliates
|
—
|
|
$
|
71,632
|
|
||
Reimbursements to Affiliates of our General Partner
The Partnership’s general partner does not receive any management fee or other compensation for its management of Natural Resource Partners L.P. However, in accordance with the partnership agreement, the general partner and its affiliates are reimbursed for services provided to the Partnership and for expenses incurred on the Partnership’s behalf. Employees of Quintana Minerals Corporation ("QMC") and WPPLP, affiliates of the Partnership, provide their services to manage the Partnership's business. QMC and WPPLP charge the Partnership the portion of their employee salary and benefits costs related to their employee services provided to NRP. These QMC and WPPLP employee management service costs and non-cash equity compensation expenses are presented as Operating and maintenance expenses—affiliates, net and General and administrative—affiliates on the Consolidated Statements of Comprehensive Income (Loss). NRP also reimburses overhead costs incurred by its affiliates to manage the Partnership's business. These overhead costs include certain rent, legal, accounting, treasury, information technology, insurance, administration of employee benefits and other corporate services incurred by or on behalf of the Partnership’s general partner and its affiliates and are presented as Operating and maintenance expenses—affiliates, net and General and administrative—affiliates on the Consolidated Statements of Comprehensive Income (Loss).
The Partnership had Accounts payable—affiliates to QMC of
$0.4 million
on its Consolidated Balance Sheets at both December 31, 2017 and 2016. Included in Current liabilities of discontinued operations on the Partnership's Consolidated Balance Sheets is less than
$0.1 million
in accounts payable due to QMC at both December 31, 2017 and 2016. The Partnership had Accounts payable—affiliates to WPPLP of
$0.1 million
and
$0.6 million
on its Consolidated Balance Sheets at
December 31, 2017
and
2016
, respectively.
103
NATURAL RESOURCE PARTNERS L.P.
NOTES TO CONSOLIDATED FINANCIAL STATEMENTS—CONTINUED
Direct general and administrative expenses charged to the Partnership by WPPLP and QMC are as follows:
|
For the Years Ended December 31,
|
|||||||||||
|
(In thousands)
|
2017
|
2016
|
2015
|
||||||||
|
Operating and maintenance expenses—affiliates, net
|
$
|
7,606
|
|
$
|
9,891
|
|
$
|
10,063
|
|
||
|
General and administrative—affiliates
|
$
|
4,989
|
|
$
|
3,591
|
|
$
|
5,312
|
|
||
Included in Income (loss) from discontinued operations on the Partnership's Consolidated Statements of Income (Loss) are
$1.3 million
and
$0.7 million
of operating and maintenance expenses charged by QMC for the year ended December 31, 2016 and 2015, respectively.
Quintana Capital Group GP, Ltd.
Corbin J. Robertson, Jr. is a principal in Quintana Capital Group GP, Ltd. ("Quintana Capital"), which controls several private equity funds focused on investments in the energy business. In connection with the formation of Quintana Capital, the Partnership adopted a formal conflicts policy that establishes the opportunities that will be pursued by the Partnership and those that will be pursued by Quintana Capital. The governance documents of Quintana Capital’s affiliated investment funds reflect the guidelines set forth in the Partnership's conflicts policy. At
December 31, 2017
, a fund controlled by Quintana Capital owned a substantial interest in Corsa Coal Corp. ("Corsa"), a coal mining company traded on the TSX Venture Exchange that is one of the Partnership’s lessees in Tennessee. Corbin J. Robertson III, one of the Partnership’s directors, was Chairman of the Board of Corsa through May 10, 2017.
Coal-related revenues from Corsa totaled
$1.3 million
,
$2.2 million
and
$3.1 million
for the years ended
December 31, 2017
,
2016
and
2015
, respectively and are included in Coal royalty and other—affiliates revenue in the Partnership's Statements of Comprehensive Income (Loss). The Partnership had Accounts receivable—affiliates totaling
$0.2 million
from Corsa at both
December 31, 2017
and
2016
on the Consolidated Balance Sheets.
WPPLP Production Royalty and Overriding Royalty
During the year ended
December 31, 2017
,
2016
and
2015
, the Partnership recorded
$1.5 million
,
$0.7 million
and
$0.4 million
in Operating and maintenance expenses—affiliates, respectively, on the Statements of Comprehensive Income (Loss) related to a non-participating production royalty payable to WPPLP pursuant to a conveyance agreement entered into in 2007. The Partnership had Other assets—affiliate from WPPLP of
$0.2 million
and
$1.0 million
at
December 31, 2017
and December 31,
2016
, respectively on the Consolidated Balance Sheets related to a non-production royalty receivable from WPPLP for overriding royalty interest on a mine.
Quinwood Coal Company Royalty
In May 2017, a subsidiary of Alpha Natural Resources assigned two coal leases with the Partnership to Quinwood Coal Partners LP ("Quinwood"), an entity controlled by Corbin J. Robertson III. In connection with this lease assignment, Quinwood forfeited the historical recoupable balance related to this property. As a result, NRP recognized
$0.9 million
of deferred minimum payments received in prior periods from the subsidiary of Alpha as Coal royalty and other—affiliates revenue on the Statements of Comprehensive Income (Loss) during the year ended
December 31, 2017
. There were no deferred minimum payments received in prior periods from the subsidiary of Alpha recognized as Coal royalty and other—affiliates revenue on the Statements of Comprehensive Income (Loss) during the year ended
December 31, 2017
.
104
NATURAL RESOURCE PARTNERS L.P.
NOTES TO CONSOLIDATED FINANCIAL STATEMENTS—CONTINUED
16. Major Customers
Revenues from customers that exceeded 10 percent of total revenues and other income for any of the periods presented below are as follows:
|
|
For the Years Ended December 31,
|
||||||||||||||||||||
|
|
2017
|
2016
|
2015
|
||||||||||||||||||
|
(In thousands)
|
Revenues
|
Percent
|
Revenues
|
Percent
|
Revenues
|
Percent
|
|||||||||||||||
|
Foresight Energy
|
$
|
70,489
|
|
18.6
|
%
|
$
|
63,355
|
|
15.8
|
%
|
$
|
86,614
|
|
19.7
|
%
|
||||||
Revenues from Foresight Energy are included within the Partnership's Coal Royalty and Other segment.
17. Commitments and Contingencies
Legal
NRP is involved, from time to time, in various legal proceedings arising in the ordinary course of business. While the ultimate results of these proceedings cannot be predicted with certainty, Partnership management believes these claims will not have a material effect on the Partnership’s financial position, liquidity or operations. NRP is also currently involved in the legal proceedings described below.
Anadarko Contingent Consideration Payment Dispute
In January 2013, NRP acquired a non-controlling
48.51%
general partner interest in OCI Wyoming, L.P. ("OCI LP") and all of the preferred stock and a portion of the common stock of OCI Wyoming Co. ("OCI Co") (which in turn owned a
1%
limited partner interest in OCI LP) from Anadarko Holding Company and its subsidiary, Big Island Trona Company (together, "Anadarko"). The remaining general partner interest in OCI LP and common stock of OCI Co were owned by subsidiaries of OCI Chemical Corporation.
The acquisition agreement provided for additional contingent consideration of up to
$50 million
to be paid by the NRP if certain performance criteria were met at OCI LP as defined in the purchase and sale agreement in any of the years 2013, 2014 or 2015. For those years, NRP paid an aggregate of
$11.5 million
to Anadarko in full satisfaction of these contingent consideration payment obligations.
In July 2013, pursuant to a series of transactions in connection with an initial public offering by a subsidiary of OCI Chemical Corporation, the ownership structure in OCI LP was simplified. In connection with such reorganization, NRP exchanged the stock of OCI Co for a limited partner interest in OCI LP. Following the reorganization, NRP's interest in OCI LP increased to
49%
, consisting of both limited and general partner interests. The restructuring did not have any impact on the operations, revenues, management or control of OCI LP.
In July 2017, Anadarko filed a lawsuit against Opco and NRP Trona LLC alleging that the transactions conducted in 2013 triggered an acceleration of NRP's obligation under the purchase agreement with Anadarko to pay additional contingent consideration in full and demanded immediate payment of such amount, together with interest, court costs and attorneys’ fees. NRP does not believe the reorganization transactions triggered an obligation to pay any additional contingent consideration, and intends to vigorously defend this lawsuit. However, the ultimate outcome cannot be predicted with certainty given the early stage of this matter, and the Partnership estimates a possible range of loss between
$0
, if it prevails, and approximately
$40 million
, plus interest, court costs and attorneys’ fees if Anadarko prevails and is awarded the full damages it seeks.
105
NATURAL RESOURCE PARTNERS L.P.
NOTES TO CONSOLIDATED FINANCIAL STATEMENTS—CONTINUED
Foresight Energy Disputes
In November 2015, NRP filed a lawsuit against Foresight Energy’s subsidiary, Hillsboro Energy LLC ("Hillsboro") and has subsequently named Foresight Energy and certain of its other subsidiaries in that lawsuit. The lawsuit alleges, among other items, breach of contract by Hillsboro resulting from a wrongful declaration of force majeure at Hillsboro’s Deer Run mine, as well as alter-ego and tortious interference claims against Foresight Energy. In late March 2015, elevated carbon monoxide readings were detected at the Deer Run mine, and coal production at the mine was idled. In July 2015, Hillsboro declared a force majeure event under its lease with us, and Hillsboro has failed to make its contractually obligated minimum quarterly payments of
$7.5 million
since then. NRP believes the force majeure declaration by Hillsboro has no merit, and is vigorously pursuing recovery against Hillsboro as well as against Foresight Energy and certain of its other subsidiaries. Hillsboro has failed to make
$76.0 million
of required quarterly payments to NRP to date and such amount will continue to increase by
$7.5 million
for each quarter with respect to which payment is not made.
In April 2016, NRP filed a lawsuit against Macoupin Energy, LLC ("Macoupin"), a subsidiary of Foresight Energy, in Macoupin County, Illinois. The lawsuit alleges that Macoupin has failed to comply with the terms of its coal mining, rail loadout and rail loop leases by incorrectly recouping previously paid minimum royalties. As a result, Macoupin owes NRP approximately
$9.5 million
in improperly recouped minimum royalties through December 31, 2017.
Environmental Compliance
The operations the Partnership’s lessees conduct on its properties, as well as the aggregates/industrial minerals and oil and gas operations in which the Partnership has interests, are subject to federal and state environmental laws and regulations. See "Item 1. Business—Regulation and Environmental Matters." As an owner of surface interests in some properties, the Partnership may be liable for certain environmental conditions occurring on the surface properties. The terms of substantially all of the Partnership’s coal leases require the lessee to comply with all applicable laws and regulations, including environmental laws and regulations. Lessees post reclamation bonds assuring that reclamation will be completed as required by the relevant permit, and substantially all of the leases require the lessee to indemnify the Partnership against, among other things, environmental liabilities. Some of these indemnifications survive the termination of the lease. The Partnership makes regular visits to the mines to ensure compliance with lease terms, but the duty to comply with all regulations rests with the lessees. The Partnership believes that its lessees will be able to comply with existing regulations and does not expect that any lessee’s failure to comply with environmental laws and regulations to have a material impact on the Partnership’s financial condition or results of operations. The Partnership has neither incurred, nor is aware of, any material environmental charges imposed on the Partnership related to its properties for the period ended December 31, 2017. The Partnership is not associated with any material environmental contamination that may require remediation costs. However, the Partnership’s lessees do conduct reclamation work on the properties under lease to them. Because the Partnership is not the permittee of the mines being reclaimed, the Partnership is not responsible for the costs associated with these reclamation operations.
The Partnership is also responsible for losses and liabilities, including environmental liabilities that may arise from uninsured and underinsured events at its Construction Aggregates operations. Additionally, as a former owner of working interests in oil and natural gas operations, the Partnership is responsible for its proportionate share of any losses and liabilities, including environmental liabilities, arising from uninsured and underinsured events during the period it was an owner.
106
NATURAL RESOURCE PARTNERS L.P.
NOTES TO CONSOLIDATED FINANCIAL STATEMENTS—CONTINUED
18. Deferred Revenue and Deferred Revenue—Affiliate
Most of the Partnership’s coal and aggregates lessees must pay the Partnership minimum annual or quarterly amounts which are generally recoupable out of actual production over certain time periods. These minimum payments are recorded as a deferred revenue liability when received. The deferred revenue attributable to the minimum payment is recognized as revenue based upon the underlying mineral lease when the lessee recoups the minimum payment through production or in the period immediately following the expiration of the lessee’s ability to recoup the payments. The Partnership’s deferred revenue (including affiliate) consists of the following:
|
December 31,
|
|||||||
|
(In thousands)
|
2017
|
2016
|
|||||
|
Deferred revenue
|
$
|
100,605
|
|
$
|
44,931
|
|
|
|
Deferred revenue—affiliate
|
—
|
|
71,632
|
|
|||
|
Total deferred revenue (including affiliate)
|
$
|
100,605
|
|
$
|
116,563
|
|
|
The Partnership recognized the following amounts of deferred revenue (including affiliate) attributable to previously paid minimums resulting from the expiration of the lessee’s ability to recoup the payments as Coal royalty and other revenue:
|
|
For the Years Ended December 31,
|
||||||||||
|
(In thousands)
|
2017
|
2016
|
2015
|
||||||||
|
Coal royalty and other
|
$
|
16,767
|
|
$
|
49,284
|
|
$
|
3,451
|
|
||
|
Coal royalty and other—affiliates
|
14,055
|
|
15,307
|
|
12,038
|
|
|||||
|
Total coal royalty and other (including affiliates)
|
$
|
30,822
|
|
$
|
64,591
|
|
$
|
15,489
|
|
||
Lease Modifications, Termination and Forfeitures of Minimum Royalty Balances
During the years ended
December 31, 2017
,
2016
and
2015
, the Partnership entered into agreements with certain lessees to either modify or terminate existing coal-related leases that resulted in the Partnership recognizing
$3.4 million
,
$40.5 million
, and less than
$0.1 million
of deferred revenue as revenue, respectively.
19. Unit-Based Compensation
GP Natural Resource Partners LLC adopted the Natural Resource Partners Long-Term Incentive Plan (the "Long-Term Incentive Plan") for directors of GP Natural Resource Partners LLC and employees of its affiliates who perform services for the Partnership. The Compensation, Nominating and Governance Committee ("CNG Committee") of GP Natural Resource Partners LLC’s board of directors (the "Board") administers the Long-Term Incentive Plan. Subject to the rules of the exchange upon which the common units are listed at the time, the Board and the CNG Committee have the right to alter or amend the Long-Term Incentive Plan or any part of the Long-Term Incentive Plan from time to time. Except upon the occurrence of unusual or nonrecurring events, no change in any outstanding grant may be made that would materially reduce the benefit intended to be made available to a participant without the consent of the participant.
Phantom units are incentive based equity awards issued to employees over a vesting period that entitle the grantee to receive the cash equivalent to the value of a unit of the Parent common units upon each vesting. The Partnership records compensation cost equal to the fair value of the award at the measurement date, which is determined to be the earlier of the performance commitment date or the service completion date. In addition, compensation cost for unvested phantom unit awards is adjusted each reporting period for any changes in the Partnership’s unit price. Under the plan a grantee will receive the market value of a common unit in cash upon vesting. Market value is defined as the average closing price over the
20
trading days prior to the vesting date. The compensation committee may make grants under the Long-Term Incentive Plan to employees and directors containing such terms as it determines, including the vesting period. Outstanding grants vest upon a change in control of the Partnership, the general partner, or GP Natural Resource Partners LLC. If a grantee’s employment or membership on the board of directors terminates for any reason, outstanding grants will be automatically forfeited unless and to the extent the compensation committee provides otherwise.
107
NATURAL RESOURCE PARTNERS L.P.
NOTES TO CONSOLIDATED FINANCIAL STATEMENTS—CONTINUED
In connection with the phantom unit awards, the CNG Committee also granted tandem Distribution Equivalent Rights ("DERs"), which entitle the holders to receive distributions equal to the distributions paid on the Partnership’s common units between the date the units are granted and the vesting date. The DERs are payable in cash upon vesting but may be subject to forfeiture if the grantee ceases employment prior to vesting.
A summary of activity in the outstanding grants during
2017
is as follows:
|
(In thousands)
|
Phantom Units
|
|
|
Outstanding grants at January 1, 2017
|
86
|
|
|
Grants during the period
|
—
|
|
|
Grants vested and paid during the period
|
(28
|
)
|
|
Forfeitures during the period
|
(5
|
)
|
|
Outstanding grants at December 31, 2017
|
53
|
|
Grants typically vest at the end of a
four
-year period and are paid in cash upon vesting. The grant date fair value was
$4.2 million
for awards in
2015
. There were no new awards issued in 2016 or 2017. The Partnership recognized compensation expense (benefit) of
$0.3 million
,
$1.4 million
and
$(3.4) million
included in Operating and maintenance expenses and General and administrative expenses on its Consolidated Statements of Comprehensive Income (Loss) for the years ended
December 31, 2017
,
2016
and
2015
, respectively. Compensation expense includes the amortization of the awards over the vesting period and changes in the market price of the Partnership's common units during the period. The unamortized cost associated with unvested outstanding grants and related DERs at
December 31, 2017
and
December 31, 2016
, was
$0.2 million
and
$0.8 million
, respectively.
In connection with the Long-Term Incentive Plans, cash payments are typically made during the first quarter of the year. Payments of
$1.8 million
,
$1.5 million
and
$4.4 million
were made during the years ended December 31,
2017
,
2016
, and
2015
, respectively.
108
NATURAL RESOURCE PARTNERS L.P.
SUPPLEMENTAL QUARTERLY INFORMATION
(Unaudited)
Quarterly Financial Data
The following table summarizes quarterly financial data for 2017:
|
(In thousands, except per unit data)
|
First
Quarter (1) |
Second
Quarter (2) |
Third
Quarter |
Fourth
Quarter |
Total
2017 |
||||||||||||||
|
Revenues (including affiliates)
|
$
|
88,653
|
|
$
|
91,570
|
|
$
|
93,116
|
|
$
|
100,822
|
|
$
|
374,161
|
|
||||
|
Gain on asset sales
|
44
|
|
3,361
|
|
171
|
|
280
|
|
3,856
|
|
|||||||||
|
Asset impairments
|
1,778
|
|
—
|
|
—
|
|
1,253
|
|
3,031
|
|
|||||||||
|
Income from operations
|
37,042
|
|
50,404
|
|
46,531
|
|
49,998
|
|
183,975
|
|
|||||||||
|
Debt modification expense
|
7,807
|
|
132
|
|
—
|
|
—
|
|
7,939
|
|
|||||||||
|
Loss on extinguishment of debt
|
—
|
|
4,107
|
|
—
|
|
—
|
|
4,107
|
|
|||||||||
|
Net income from continuing operations
|
6,111
|
|
25,857
|
|
26,499
|
|
30,741
|
|
89,208
|
|
|||||||||
|
Net income (loss) from discontinued operations
|
(207
|
)
|
133
|
|
(433
|
)
|
(34
|
)
|
(541
|
)
|
|||||||||
|
Net income
|
5,904
|
|
25,990
|
|
26,066
|
|
30,707
|
|
88,667
|
|
|||||||||
|
Net income attributable to common unitholders and general partner
|
3,404
|
|
18,452
|
|
18,416
|
|
22,942
|
|
63,214
|
|
|||||||||
|
Net income per common unit (basic)
|
0.28
|
|
1.47
|
|
1.48
|
|
1.84
|
|
5.06
|
|
|||||||||
|
Net income per common unit (diluted)
|
0.28
|
|
1.13
|
|
1.07
|
|
1.26
|
|
3.96
|
|
|||||||||
|
Weighted average number of common units outstanding (basic)
|
12,232
|
|
12,232
|
|
12,232
|
|
12,232
|
|
12,232
|
|
|||||||||
|
Weighted average number of common units outstanding (diluted)
|
14,945
|
|
22,459
|
|
23,980
|
|
23,874
|
|
21,950
|
|
|||||||||
|
(1)
|
During the first quarter of 2017 the Partnership incurred
$7.8 million
of debt modification costs as a result of the exchange of
$241 million
of our 2018 Senior Notes for 2022 Senior Notes.
|
|
(2)
|
During the second quarter of 2017 the Partnership incurred a
$4.1 million
loss on extinguishment of debt related to the
4.563%
premium paid to redeem the 2018 Senior Notes in April 2017.
|
109
NATURAL RESOURCE PARTNERS L.P.
SUPPLEMENTAL QUARTERLY INFORMATION
(Unaudited)
The following table summarizes quarterly financial data for 2016:
|
(In thousands, except per unit data)
|
First
Quarter (1) |
Second
Quarter (2) |
Third
Quarter (3) |
Fourth
Quarter |
Total
2016 |
||||||||||||||
|
Revenues (including affiliates)
|
$
|
73,902
|
|
$
|
119,317
|
|
$
|
91,448
|
|
$
|
86,311
|
|
$
|
370,978
|
|
||||
|
Gain (loss) on asset sales
|
21,925
|
|
(1,071
|
)
|
6,426
|
|
1,801
|
|
29,081
|
|
|||||||||
|
Asset impairments
(4)
|
1,893
|
|
91
|
|
5,697
|
|
9,245
|
|
16,926
|
|
|||||||||
|
Income from operations
|
48,991
|
|
70,741
|
|
38,907
|
|
27,106
|
|
185,745
|
|
|||||||||
|
Net income from continuing operations
|
26,351
|
|
48,633
|
|
16,419
|
|
3,811
|
|
95,214
|
|
|||||||||
|
Net income (loss) from discontinued operations
|
(2,924
|
)
|
(2,187
|
)
|
7,112
|
|
(323
|
)
|
1,678
|
|
|||||||||
|
Net income
|
23,427
|
|
46,446
|
|
23,531
|
|
3,488
|
|
96,892
|
|
|||||||||
|
Net income attributable to common unitholders and general partner
|
23,427
|
|
46,446
|
|
23,531
|
|
3,488
|
|
96,892
|
|
|||||||||
|
Net income per common unit (basic and diluted)
|
1.88
|
|
3.73
|
|
1.89
|
|
0.28
|
|
7.78
|
|
|||||||||
|
Weighted average number of common units outstanding (basic and diluted)
|
12,232
|
|
12,232
|
|
12,232
|
|
12,232
|
|
12,232
|
|
|||||||||
|
(1)
|
During the first quarter of 2016 the Partnership sold oil and gas royalty and aggregates royalty assets for a cumulative gain of
$21.9 million
.
|
|
(2)
|
During the second quarter of 2016 the Partnership entered into agreements with certain lessees to either modify or terminate existing coal-related leases that resulted in the Partnership recognizing
$35 million
of deferred revenue.
|
|
(3)
|
During the third quarter of 2016 the Partnership sold assets in multiple sale transactions for a net gain of
$6.4 million
primarily related to eminent domain transactions with governmental agencies.
|
|
(4)
|
See
Note 11. Mineral Rights
for asset impairment discussion.
|
110
None.
Evaluation of Disclosure Controls and Procedures
We carried out an evaluation of the effectiveness of the design and operation of our disclosure controls and procedures (as defined in Rule 13a-15(e) of the Exchange Act) as of
December 31, 2017
. This evaluation was performed under the supervision and with the participation of our management, including the Chief Executive Officer and Chief Financial Officer of GP Natural Resource Partners LLC, our managing general partner. Based upon that evaluation, the Chief Executive Officer and Chief Financial Officer concluded that these disclosure controls and procedures were effective as of
December 31, 2017
at the reasonable assurance level in producing the timely recording, processing, summary and reporting of information and in accumulation and communication of information to management to allow for timely decisions with regard to required disclosures.
Management’s Report on Internal Control Over Financial Reporting
Our management is responsible for establishing and maintaining adequate internal control over financial reporting, as such term is defined in Exchange Act Rules 13a-15(f) and 15d-15(f). Under the supervision and with the participation of our management, including the Chief Executive Officer and Chief Financial Officer of GP Natural Resource Partners LLC, our managing general partner, we conducted an evaluation of the effectiveness of our internal control over financial reporting as of
December 31, 2017
based on the framework in Internal Control-Integrated Framework issued by the Committee of Sponsoring Organizations of the Treadway Commission "2013 Framework" (COSO). Based on that evaluation, as of
December 31, 2017
, our management concluded that our internal control over financial reporting was effective at a reasonable assurance level based on those criteria. No changes were made to our internal control over financial reporting during the last fiscal quarter that materially affected, or are reasonably likely to materially affect, our internal control over financial reporting.
Ernst & Young, LLP, the independent registered public accounting firm who audited the Partnership’s consolidated financial statements included in this Annual Report on Form 10-K, has issued a report on the Partnership’s internal control over financial reporting, which is included herein.
111
Report of Independent Registered Public Accounting Firm
The Partners of Natural Resource Partners L.P.
Opinion on Internal Control over Financial Reporting
We have audited Natural Resource Partners L.P.’s internal control over financial reporting as of December 31, 2017, based on criteria established in Internal Control—Integrated Framework issued by the Committee of Sponsoring Organizations of the Treadway Commission (2013 framework) (the COSO criteria). In our opinion, Natural Resource Partners L.P. (the Partnership) maintained, in all material respects, effective internal control over financial reporting as of December 31, 2017, based on the COSO criteria.
We also have audited, in accordance with the standards of the Public Company Accounting Oversight Board (United States) (PCAOB), the consolidated balance sheets of Natural Resource Partners L.P. as of December 31, 2017 and 2016, and the related consolidated statements of comprehensive income (loss), partners’ capital and cash flows for each of the three years in the period ended December 31, 2017, and related notes and our report dated March 1, 2018 expressed an unqualified opinion thereon.
Basis for Opinion
The Partnership’s management is responsible for maintaining effective internal control over financial reporting and for its assessment of the effectiveness of internal control over financial reporting included in the accompanying Management’s Report on Internal Control Over Financial Reporting. Our responsibility is to express an opinion on the Partnership’s internal control over financial reporting based on our audit. We are a public accounting firm registered with the PCAOB and are required to be independent with respect to the Partnership in accordance with the U.S. federal securities laws and the applicable rules and regulations of the Securities and Exchange Commission and the PCAOB.
We conducted our audit in accordance with the standards of the PCAOB. Those standards require that we plan and perform the audit to obtain reasonable assurance about whether effective internal control over financial reporting was maintained in all material respects.
Our audit included obtaining an understanding of internal control over financial reporting, assessing the risk that a material weakness exists, testing and evaluating the design and operating effectiveness of internal control based on the assessed risk, and performing such other procedures as we considered necessary in the circumstances. We believe that our audit provides a reasonable basis for our opinion.
Definition and Limitations of Internal Control Over Financial Reporting
A company’s internal control over financial reporting is a process designed to provide reasonable assurance regarding the reliability of financial reporting and the preparation of financial statements for external purposes in accordance with generally accepted accounting principles. A company’s internal control over financial reporting includes those policies and procedures that (1) pertain to the maintenance of records that, in reasonable detail, accurately and fairly reflect the transactions and dispositions of the assets of the company; (2) provide reasonable assurance that transactions are recorded as necessary to permit preparation of financial statements in accordance with generally accepted accounting principles, and that receipts and expenditures of the company are being made only in accordance with authorizations of management and directors of the company; and (3) provide reasonable assurance regarding prevention or timely detection of unauthorized acquisition, use, or disposition of the company’s assets that could have a material effect on the financial statements.
Because of its inherent limitations, internal control over financial reporting may not prevent or detect misstatements. Also, projections of any evaluation of effectiveness to future periods are subject to the risk that controls may become inadequate because of changes in conditions, or that the degree of compliance with the policies or procedures may deteriorate.
/s/ Ernst & Young LLP
Houston, Texas
March 1, 2018
112
None.
113
As a master limited partnership we do not employ any of the people responsible for the management of our properties. Instead, we reimburse affiliates of our managing general partner, GP Natural Resource Partners LLC, for their services. The following table sets forth information concerning the directors and officers of GP Natural Resource Partners LLC as of the date of this Annual Report on Form 10-K. Each officer and director is elected for their respective office or directorship on an annual basis. Subject to Board Representation and Observation Rights Agreement with Blackstone and GoldenTree, Mr. Robertson is entitled to appoint the members of the Board of Directors of GP Natural Resource Partners LLC. Mr. Robertson has delegated the right to appoint one director to Blackstone.
|
Name
|
Age
|
Position with the General
Partner
|
|||
|
Corbin J. Robertson, Jr.
|
70
|
|
Chairman of the Board and Chief Executive Officer
|
||
|
Craig W. Nunez
|
56
|
|
President and Chief Operating Officer
|
||
|
Christopher J. Zolas
|
43
|
|
Chief Financial Officer and Treasurer
|
||
|
Jennifer L. Odinet
|
39
|
|
Chief Accounting Officer
|
||
|
Kevin J. Craig
|
49
|
|
Executive Vice President, Coal
|
||
|
Kathy H. Roberts
|
66
|
|
Vice President, Investor Relations
|
||
|
Kathryn S. Wilson
|
43
|
|
Vice President, General Counsel and Secretary
|
||
|
Gregory F. Wooten
|
61
|
|
Vice President, Chief Engineer
|
||
|
Perry W. Donahoo
|
63
|
|
Chief Executive Officer, VantaCore Partners LLC
|
||
|
Russell D. Gordy
|
67
|
|
Director
|
||
|
Jasvinder S. Khaira
|
36
|
|
Director
|
||
|
S. Reed Morian
|
72
|
|
Director
|
||
|
Richard A. Navarre
|
57
|
|
Director
|
||
|
Corbin J. Robertson, III
|
47
|
|
Director
|
||
|
Stephen P. Smith
|
57
|
|
Director
|
||
|
Leo A. Vecellio, Jr.
|
71
|
|
Director
|
||
Corbin J. Robertson, Jr.
has served as Chief Executive Officer and Chairman of the Board of Directors of GP Natural Resource Partners LLC since 2002. Mr. Robertson has vast business experience having founded and served as a director and as an officer of multiple companies, both private and public, and has served on the boards of numerous non-profit organizations. He has served as the Chief Executive Officer and Chairman of the Board of the general partner of Great Northern Properties Limited Partnership since 1992 and Quintana Minerals Corporation since 1978, as Chairman of the Board of Directors of New Gauley Coal Corporation since 1986, and the general partner of Western Pocahontas Properties Limited Partnership since 1986. In addition, Mr. Robertson served as Chief Executive Officer of the general partner of Western Pocahontas Properties Limited Partnership from 1986 until 2008 and currently serves on the Board of Managers of Premium Resources, LLC. He also serves as a Principal with Quintana Capital Group, Chairman of the Board of the Cullen Trust for Higher Education and on the boards of the American Petroleum Institute, the National Petroleum Council, the Baylor College of Medicine and the Spirit Golf Association. In 2006, Mr. Robertson was inducted into the Texas Business Hall of Fame. Mr. Robertson is the father of Corbin J. Robertson, III.
Craig W. Nunez
has served as President and Chief Operating Officer of GP Natural Resource Partners LLC since August 2017 and previously served as Chief Financial Officer and Treasurer of GP Natural Resource Partners LLC from January 2015 to August 2017. Prior to joining NRP, Mr. Nunez was an owner and Chief Executive Officer of Bocage Group, a private investment company specializing in energy, natural resources and master limited partnerships since March 2012. In addition, until joining NRP, he was a FINRA-registered Investment Advisor Representative with Searle & Co since July 2012 and served as an Executive Advisor to Capital One Asset Management since January 2014. From September 2011 through March 2012, Mr. Nunez served as the Executive Vice President and Chief Financial Officer of Quicksilver Resources Canada, Inc. Mr. Nunez was Senior Vice President and Treasurer of Halliburton Company from January 2007 until September 2011, and Vice President and Treasurer of Halliburton Company from February 2006 to January 2007. Prior to that, he was Treasurer of Colonial Pipeline Company from
114
November 1995 to February 2006. Mr. Nunez has been involved in numerous charitable organizations and currently serves on the boards of Goodwill Industries of Houston and Medical Bridges, Inc.
Christopher J. Zolas
has served as Chief Financial Officer and Treasurer of GP Natural Resource Partners LLC since August 2017 and previously served as Chief Accounting Officer of GP Natural Resource Partners from March 2015 to August 2017. Prior to joining NRP, Mr. Zolas served as Director of Financial Reporting at Cheniere Energy, Inc., a publicly traded energy company, where he performed financial statement preparation and analysis, technical accounting and SEC reporting for five separate SEC registrants, including a master limited partnership. Mr. Zolas joined Cheniere Energy, Inc. in 2007 as Manager of SEC Reporting and Technical Accounting and was promoted to Director in 2009. Prior to joining Cheniere Energy, Inc., Mr. Zolas worked in public accounting with KPMG LLP from 2002 to 2007.
Jennifer L. Odinet
joined GP Natural Resource Partners LLC as Chief Accounting Officer in October 2017. Ms. Odinet most recently served as Director, Financial Reporting for Cabot Oil & Gas Corporation, a publicly traded energy company, where she was responsible for SEC and internal reporting, complex technical accounting matters and financial statement preparation and analysis. Prior to joining Cabot, Ms. Odinet was a Senior Manager in the Assurance practice for PricewaterhouseCoopers LLC from June 2000 to April 2010.
Kevin J. Craig
has served as Executive Vice President, Coal of GP Natural Resource Partners since September 2014. Mr. Craig was the Vice President of Business Development for GP Natural Resource Partners LLC since 2005. Mr. Craig also represents NRP as one of its appointees to the Board of Managers of Ciner Wyoming LLC. Mr. Craig joined NRP in 2005 from CSX Transportation, where he served as Terminal Manager for the West Virginia Coalfields. He has extensive marketing, finance and operations experience within the energy industry. Mr. Craig served as a member of the West Virginia House of Delegates having been elected in 2000 and re-elected in 2002, 2004, 2006, 2008, 2010 and 2012. In addition to other leadership positions, Delegate Craig served as Chairman of the Committee on Energy. Mr. Craig did not seek re-election in 2014 and his term ended January 2015. Prior to joining CSX, he served as a Captain in the United States Army. Mr. Craig has served as the Chairman of the Huntington Regional Chamber of Commerce Board of Directors and continues as a member of both the West Virginia Chamber of Commerce and the Huntington Regional Chamber of Commerce’s respective board of directors. He is involved in numerous state coal associations and serves as a member of the Board of Directors of BrickStreet Mutual Insurance Company.
Kathy H. Roberts
is Vice President, Investor Relations of GP Natural Resource Partners LLC. Ms. Roberts joined NRP in July 2002. She was the Principal of IR Consulting Associates from 2001 to July 2002 and from 1980 through 2000 held various financial and investor relations positions with Santa Fe Energy Resources, most recently as Vice President-Public Affairs. She is a Certified Public Accountant. Ms. Roberts currently serves on the Board of Directors of the Master Limited Partnership Association and has served on the local board of directors of the National Investor Relations Institute. She has also served on the Executive Committee and as a National Vice President of the Institute of Management Accountants.
Kathryn S. Wilson
has served as Vice President, General Counsel and Secretary of GP Natural Resource Partners LLC since December 2013. Ms. Wilson served as Associate General Counsel from March 2013 to December 2013. Since October 2013, Ms. Wilson has also served as General Counsel and Secretary of each of Quintana Minerals Corporation, New Gauley Coal Corporation, the general partner of Western Pocahontas Properties Limited Partnership, and the general partner of Great Northern Properties Limited Partnership. Ms. Wilson practiced corporate and securities law with Vinson & Elkins L.L.P. from September 2001 to February 2010 and from November 2011 to February 2013. Ms. Wilson served as General Counsel of Antero Resources Corporation from March 2010 to June 2011.
Gregory F. Wooten
has served as Vice President, Chief Engineer of GP Natural Resource Partners LLC since December 2013. Mr. Wooten joined NRP in 2007, serving as Regional Manager. Prior to joining NRP, Mr. Wooten served as Vice President, COO and Chief Engineer of Dingess Rum Properties, Inc., where he managed coal, oil, gas and timber properties from 1982 until 2007. Prior to 1982, Mr. Wooten worked as a planning and production engineer in the coal industry and is a member of the American Institute of Mining, Metallurgical, and Petroleum Engineers. Mr. Wooten has served as Chairman of the National Council of Coal Lessors since 2015.
Perry W. Donahoo
was named Chief Executive Officer of VantaCore Partners LLC, NRP’s construction aggregates subsidiary, in July 2017. Mr. Donahoo previously served as VantaCore’s Chief Operating Officer beginning in 2010. Mr. Donahoo also represents NRP as one of its appointees to the Board of Managers of Ciner Wyoming LLC. Mr. Donahoo has extensive operations, marketing, sales, business development and mergers and acquisition experience. His operational experience predominantly includes mining of granite, limestone, sand and gravel, as well as calcium carbonate using both surface and underground mining. Previously
115
Mr. Donahoo served as a senior executive with three major construction aggregates companies.
Russell D. Gordy
joined the Board of Directors of GP Natural Resource Partners in October 2013. Mr. Gordy brings extensive oil and gas industry, mineral interest and land ownership and financial experience to the Board. Mr. Gordy is currently managing partner and majority owner in SG Interests, a producer of oil and coal bed methane gas, RGGS, which controls mineral acres currently producing oil and gas, coal, iron ore, limestone, and copper, and Rock Creek Ranch. He is also President of Gordy Oil Company, an oil and gas exploration company in the Gulf Coast of Texas and Louisiana, and Gordy Gas Corporation, an oil and gas exploration company in the San Juan Basin of Colorado and New Mexico. Prior to forming SG Interests in 1989, Mr. Gordy was a founding partner of Northwind Exploration Company an exploration company created in 1981 with former Houston Oil and Minerals employees. Mr. Gordy served on the board of directors of Houston Exploration Company from 1987 until 2001.
Jasvinder S. Khaira
joined the Board of Directors of GP Natural Resource Partners LLC in March 2017. Mr. Khaira brings extensive financial and investing experience to the Board of Directors. Mr. Khaira currently is a Senior Managing Director in the Tactical Opportunities group at The Blackstone Group L.P. Mr. Khaira joined Blackstone as a member of its Private Equity Group in 2004. Mr. Khaira has been designated to serve as a director of GP Natural Resource Partners LLC by Blackstone Tactical Opportunities, pursuant to its right to designate a director to the Board of Directors of GP Natural Resource Partners LLC. Since joining Blackstone, Mr. Khaira has been involved in a variety of investments and strategic business initiatives at Blackstone.
S. Reed Morian
joined the Board of Directors of GP Natural Resource Partners LLC in 2002. Mr. Morian has vast executive business experience having served as Chairman and Chief Executive Officer of several companies since the early 1980s and serving on the board of other companies. Mr. Morian has served as a member of the Board of Directors of the general partner of Western Pocahontas Properties Limited Partnership since 1986, New Gauley Coal Corporation since 1992 and the general partner of Great Northern Properties Limited Partnership since 1992. Mr. Morian also serves on the Board of Managers of Premium Resources, LLC since 2006. Mr. Morian worked for Dixie Chemical Company from 1971 to 2006 and served as its Chairman and Chief Executive Officer from 1981 to 2006. He has also served as Chairman, Chief Executive Officer and President of DX Holding Company since 1989. He formerly served on the Board of Directors for the Federal Reserve Bank of Dallas-Houston Branch from April 2003 until December 2008 and as a Director of Prosperity Bancshares, Inc. from March 2005 until April 2009.
Richard A. Navarre
joined the Board of Directors of GP Natural Resource Partners LLC in October 2013. Mr. Navarre brings extensive financial, strategic planning, public company and coal industry experience to the Board of Directors. From 1993 until 2012, Mr. Navarre held several executive positions with Peabody Energy Corporation, including President-Americas from March 2012 to June 2012, President and Chief Commercial Officer from January 2008 to March 2012, Executive Vice President of Corporate Development and Chief Financial Officer from July 2006 to January 2008 and Chief Financial Officer from October 1999 to June 2008. Since his retirement from Peabody Energy in 2012, Mr. Navarre has provided advisory services to the coal industry and private equity firms. Mr. Navarre serves on the Board of Directors of Civeo Corporation, where he serves as Chairman of the Board, and Arch Coal, where he serves on the Audit committee. He is a member of the Hall of Fame of the College of Business and a member of the Board of Advisors of the College of Business and Administration of Southern Illinois University Carbondale. He is a member of the Board of Directors of the Foreign Policy Association and is the former Chairman of the Bituminous Coal Operators’ Association and former advisor to the New York Mercantile Exchange. Mr. Navarre is a Certified Public Accountant. Mr. Navarre also has been involved in numerous civic and charitable organizations throughout his career.
Corbin J. Robertson, III
joined the Board of Directors of GP Natural Resource Partners LLC in May 2013. Mr. Robertson has experience with investments in a variety of energy businesses, having served both in management of private equity firms and having served on several boards of directors. Mr. Robertson has served as a Co-Managing Partner of LKCM Headwater Investments GP, LLC and LKCM Headwater Investments I, L.P., a private equity fund, since June 2011. He has served as the Chief Executive Officer of the general partner of Western Pocahontas Properties Limited Partnership since May 2008, and has served on the Board of Directors of Quintana Minerals Corporation since 2007 and Western Pocahontas since October 2012. Mr. Robertson also has served on the Board of Managers of Premium Resources, LLC since 2016. Mr. Robertson also co-founded Quintana Energy Partners, an energy-focused private equity firm in 2006, and served as a Managing Director thereof from 2006 until December 2010. Mr. Robertson has served on the Board of Directors for Quintana Minerals Corporation since October 2007, and previously served as Vice President-Acquisitions for GP Natural Resource Partners LLC from 2003 until 2005. Mr. Robertson also serves on the Board of Directors of Buckhorn Energy Services and LL&B Minerals, each of which is in the energy business. Mr. Robertson is the son of Corbin J. Robertson, Jr.
Stephen P. Smith
joined the Board of Directors of GP Natural Resource Partners LLC in 2004. Mr. Smith brings extensive public company financial experience in the power and energy industries to the Board of Directors. Mr. Smith formerly served as
116
Chief Financial Officer and Chief Accounting Officer of the general partner of Columbia Pipeline Partners L.P. from December 2014 and as a Director from September 2014 until June 2016. Mr. Smith also formerly served as Executive Vice President and Chief Financial Officer of Columbia Pipeline Group. Mr. Smith served as Executive Vice President and Chief Financial Officer for NiSource, Inc. from June 2008 to June 2015. Prior to joining NiSource, he held several positions with American Electric Power Company, Inc, including Senior Vice President - Shared Services from January 2008 to June 2008, Senior Vice President and Treasurer from January 2004 to December 2007, and Senior Vice President - Finance from April 2003 to December 2003. From November 2000 to January 2003, Mr. Smith served as President and Chief Operating Officer - Corporate Services for NiSource Inc. Prior to joining NiSource, Mr. Smith served as Deputy Chief Financial Officer for Columbia Energy Group from November 1999 to November 2000 and Chief Financial Officer for Columbia Gas Transmission Corporation and Columbia Gulf Transmission Company from 1996 to 1999.
Leo A. Vecellio, Jr.
joined the Board of Directors of GP Natural Resource Partners LLC in May 2007. Mr. Vecellio brings extensive experience in the aggregates and coal mine development industry to the Board of Directors. Mr. Vecellio and his family have been in the aggregates materials and construction business since the late 1930s. Since November 2002, Mr. Vecellio has served as Chairman and Chief Executive Officer of Vecellio Group, Inc, a major aggregates producer, contractor and oil terminal developer/operator in the Mid-Atlantic and Southeastern states. For nearly 30 years prior to that time Mr. Vecellio served in various capacities with Vecellio & Grogan, Inc., having most recently served as Chairman and Chief Executive Officer from April 1996 to November 2002. Mr. Vecellio is the former Chairman of the American Road and Transportation Builders and is a longtime member of the Florida Council of 100, as well as many other civic and charitable organizations.
Corporate Governance
Changes to Board of Directors and Committees During 2017
During the year ended December 31, 2017, there were a number of changes to the Board and the committees thereof:
|
•
|
Effective March 2, 2017, Jasvinder S. Khaira joined the Board as the designee of Blackstone pursuant to the Board Representation and Observation Rights Agreement;
|
|
•
|
Effective April 1, 2017, Mr. Karn resigned as Chairman of the Audit Committee, and Stephen P. Smith became Chairman of that Committee;
|
|
•
|
Effective April 1, 2017, Mr. Blakely resigned as Chairman of the Compensation, Nominating and Governance Committee, and Leo A. Vecellio, Jr. became Chairman of that Committee;
|
|
•
|
Effective May 9, 2017, Trey Jackson, resigned from the Board in connection with the sale by Adena Minerals, LLC of its 31% interest in our general partner to affiliates of ours; and
|
|
•
|
Effective December 31, 2017, Robert T. Blakely and Robert B. Karn, III each retired from the Board and all committees thereof in accordance with the age requirements of NRP’s Corporate Governance Guidelines.
|
Board Meetings and Executive Sessions
The Board met 10 times in 2017. During 2017, our non-management directors met in executive session several times. The presiding director was Mr. Vecellio, the Chairman of our Compensation, Nominating and Governance Committee, or CNG Committee. In addition, our independent directors met one time in executive session in December 2017. Mr. Vecellio was the presiding director at that meeting. Interested parties may communicate with our non-management directors by writing a letter to the Chairman of the CNG Committee, NRP Board of Directors, 1201 Louisiana Street, Suite 3400, Houston, Texas 77002.
Independence of Directors
The Board of Directors has affirmatively determined that Messrs. Blakely, Gordy, Karn, Navarre, Smith and Vecellio are independent based on all facts and circumstances considered by the Board, including the standards set forth in Section 303A.02(a) of the NYSE’s listing standards. Although we had a majority of independent directors in 2017, because we are a limited partnership as defined in Section 303A of the NYSE’s listing standards, we are not required to do so. The Board has an Audit Committee, a Compensation, Nominating and Governance Committee, and a Conflicts Committee, each of which is staffed solely by independent directors.
117
Audit Committee
Our Audit Committee is currently comprised of Mr. Smith, who serves as chairman, Mr. Gordy and Mr. Navarre. Mr. Smith and Mr. Navarre are "Audit Committee Financial Experts" as determined pursuant to Item 407 of Regulation S-K. During 2017, the Audit Committee met seven times. Mr. Gordy joined the Audit Committee effective January 1, 2018. Mr. Blakely and Mr. Karn each served as members of the Audit Committee during the full calendar year of 2017. Both Mr. Blakley and Mr. Karn are "Audit Committee Financial Experts" as determined pursuant to Item 407 of Regulation S-K.
Report of the Audit Committee
Our Audit Committee is composed entirely of independent directors. The members of the Audit Committee meet the independence and experience requirements of the New York Stock Exchange. The Audit Committee has adopted, and annually reviews, a charter outlining the practices it follows. The charter complies with all current regulatory requirements. The Audit Committee Charter is available on our website at
www.nrplp.com
and is available in print upon request.
During 2017, at each of its meetings, the Audit Committee met with the senior members of our financial management team, our general counsel and our independent auditors. The Audit Committee had private sessions at certain of its meetings with our independent auditors and the senior members of our financial management team and the general counsel at which candid discussions of financial management, accounting and internal control and legal issues took place.
The Audit Committee approved the engagement of Ernst & Young LLP as our independent auditors for the year ended December 31, 2017 and reviewed with our financial managers and the independent auditors overall audit scopes and plans, the results of internal and external audit examinations, evaluations by the auditors of our internal controls and the quality of our financial reporting.
Management has reviewed the audited financial statements in the Annual Report with the Audit Committee, including a discussion of the quality, not just the acceptability, of the accounting principles, the reasonableness of significant accounting judgments and estimates, and the clarity of disclosures in the financial statements. In addressing the quality of management’s accounting judgments, members of the Audit Committee asked for management’s representations and reviewed certifications prepared by the Chief Executive Officer and Chief Financial Officer that our unaudited quarterly and audited consolidated financial statements fairly present, in all material respects, our financial condition and results of operations, and have expressed to both management and auditors their general preference for conservative policies when a range of accounting options is available.
The Committee also discussed with the independent auditors other matters required to be discussed by the auditors with the Committee by PCAOB Auditing Standard No. 16,
Communications With Audit Committees.
The Committee received and discussed with the auditors their annual written report on their independence from the partnership and its management, which is made under Rule 3526,
Communication With Audit Committees Concerning Independence,
and considered with the auditors whether the provision of non-audit services provided by them to the partnership during 2017 was compatible with the auditors’ independence.
In performing all of these functions, the Audit Committee acts only in an oversight capacity. The Audit Committee reviews our Quarterly Reports on Form 10-Q and Annual Reports on Form 10-K prior to filing with the Securities and Exchange Commission. In 2017, the Audit Committee also reviewed quarterly earnings announcements with management and representatives of the independent auditor in advance of their issuance. In its oversight role, the Audit Committee relies on the work and assurances of our management, which has the primary responsibility for financial statements and reports, and of the independent auditors, who, in their report, express an opinion on the conformity of our annual financial statements with U.S. generally accepted accounting principles.
In reliance on these reviews and discussions, and the report of the independent auditors, the Audit Committee has recommended to the Board of Directors, and the Board has approved, that the audited financial statements be included in our Annual Report on Form 10-K for the year ended December 31, 2017, for filing with the Securities and Exchange Commission.
|
Stephen P. Smith, Chairman
|
||||
|
Russell D. Gordy
|
||||
|
Richard A. Navarre
|
||||
118
Compensation, Nominating and Governance Committee
Executive officer compensation is administered by the CNG Committee, which is currently comprised of three members: Mr. Vecellio, as Chairman, Mr. Gordy and Mr. Smith. Mr. Smith joined the CNG Committee effective January 1, 2018. Messrs. Blakely and Karn each served on the CNG Committee for the full calendar year of 2017. The CNG Committee has reviewed and approved the compensation arrangements described in the Compensation Discussion and Analysis section of this Annual Report on Form 10-K. During 2017, the CNG Committee met eight times. Our Board of Directors appoints the CNG Committee and delegates to the CNG Committee responsibility for:
|
•
|
reviewing and approving the compensation for our executive officers in light of the time that each executive officer allocates to our business;
|
|
•
|
reviewing and recommending the annual and long-term incentive plans in which our executive officers participate and approving awards thereunder; and
|
|
•
|
reviewing and approving compensation for the Board of Directors.
|
Our Board of Directors has determined that each CNG Committee member is independent under the listing standards of the NYSE and the rules of the SEC.
Pursuant to its charter, the CNG Committee is authorized to obtain at NRP’s expense compensation surveys, reports on the design and implementation of compensation programs for directors and executive officers and other data that the CNG Committee considers as appropriate. In addition, the CNG Committee has the sole authority to retain and terminate any outside counsel or other experts or consultants engaged to assist it in the evaluation of compensation of our directors and executive officers. The CNG Committee Charter is available in print upon request.
Section 16(a) Beneficial Ownership Reporting Compliance
Section 16(a) of the Exchange Act requires directors, officers and persons who beneficially own more than ten percent of a registered class of our equity securities to file with the SEC and the NYSE initial reports of ownership and reports of changes in ownership of their equity securities. These people are also required to furnish us with copies of all Section 16(a) forms that they file. Based solely upon a review of the copies of Forms 3, 4 and 5 furnished to us, or written representations from certain reporting persons that no Forms 5 were required for transactions occurring in 2016, and we believe that, except as provided below, our officers and directors and persons who beneficially own more than ten percent of a registered class of our equity securities complied with all filing requirements with respect to transactions in our equity securities during 2017. On February 16, 2017, Mr. Blakely filed a Form 4 reporting the vesting of 370 phantom units on February 13, 2017 that had not been previously reported on a timely basis as a result of a technical issue with his Edgar filing codes.
Partnership Agreement
Investors may view our partnership agreement and the amendments to the partnership agreement on our website at
www.nrplp.com
. The partnership agreement is also filed with the SEC and is available in print to any unitholder that requests them.
Corporate Governance Guidelines and Code of Business Conduct and Ethics
We have adopted Corporate Governance Guidelines. We have also adopted a Code of Business Conduct and Ethics that applies to our management, and complies with Item 406 of Regulation S-K. Our Corporate Governance Guidelines and our Code of Business Conduct and Ethics are available on our website at
www.nrplp.com
and are available in print upon request.
NYSE Certification
Pursuant to Section 303A of the NYSE Listed Company Manual, in 2017, Corbin J. Robertson, Jr. certified to the NYSE that he was not aware of any violation by the Partnership of NYSE corporate governance listing standards.
119
Compensation Discussion and Analysis
Overview
As a publicly traded partnership, we have a unique employment and compensation structure that is different from that of a typical public corporation. Our executive officers based in Houston, Texas are employed by Quintana Minerals Corporation (“Quintana”), and our executive officers based in Huntington, West Virginia are employed by Western Pocahontas Properties Limited Partnership (“Western Pocahontas”). Quintana and Western Pocahontas are controlled by our Chairman and Chief Executive Officer and are affiliates of NRP. While our executive officers are employed by affiliates of NRP, each of them has been appointed to serve as an executive officer of GP Natural Resource Partners LLC (“GP LLC”), the general partner of NRP (GP) LLC (“NRP GP”), the general partner of NRP. For a more detailed description of our structure, see “Item 1. Business—Partnership Structure and Management” in this Annual Report on Form 10-K.
Although our executives’ salaries and bonuses are paid directly by the private companies that employ them, we reimburse those companies based on the time allocated to NRP by each executive officer. Our reimbursement for the compensation of executive officers is governed by our partnership agreement. For purposes of this Compensation Discussion and Analysis, our “named executive officers” are:
|
•
|
Corbin J. Robertson, Jr.—Chairman and Chief Executive Officer
|
|
•
|
Craig W. Nunez—President and Chief Operating Officer (former Chief Financial Officer and Treasurer)
|
|
•
|
Kathryn S. Wilson—Vice President, General Counsel and Secretary
|
|
•
|
Christopher J. Zolas—Chief Financial Officer and Treasurer (former Chief Accounting Officer)
|
|
•
|
Kevin J. Craig—Executive Vice President—Coal
|
|
•
|
Wyatt L. Hogan—Former President and Chief Operating Officer
|
Effective as of August 8, 2017, Wyatt L. Hogan resigned from his position as President and Chief Operating Officer of GP Natural Resource Partners LLC. Effective as of the same date, Craig W. Nunez, who previously served as Chief Financial Officer and Treasurer of GP LLC, became President and Chief Operating Officer of GP LLC and Christopher J. Zolas, who previously served as Chief Accounting Officer of GP LLC, became Chief Financial Officer and Treasurer of GP LLC.
Executive Officer Compensation Strategy and Philosophy
Under our partnership agreement, we are required to distribute all of our available cash each quarter. Historically, our primary business objective was to generate cash flows at levels that could sustain long-term quarterly cash distributions to our investors. However, given the difficult coal markets over the past few years, coupled with the limitations on our ability to access capital from additional sources, our current objective is to preserve long-term equity value for our unitholders by using our excess free cash flow to reduce our leverage. Our objective in determining the compensation of our executive officers is to retain qualified people to manage the business through a difficult market cycle. Although we historically have not tied our compensation to achievement of specific financial targets or fixed performance criteria, we have reevaluated that strategy in light of current market conditions. See “—2016 Cash Long-Term Incentive Plan” and “—2017 Long-Term Incentive Plan” below.
The
2017
compensation for executive officers consisted of four primary components:
|
•
|
base salaries;
|
|
•
|
short-term cash incentive compensation;
|
|
•
|
long-term cash incentive compensation; and
|
|
•
|
perquisites and other benefits.
|
120
In December 2016, our CNG Committee reviewed the performance of the executive officers and the amount of time expected to be spent by each NRP officer on NRP business, and determined the salaries for each officer for 2017. All of our named executive officers, other than Corbin J. Robertson, Jr., our Chairman and Chief Executive Officer, Kathryn S. Wilson, our Vice President, General Counsel and Secretary, and Kevin J. Craig, our Executive Vice President —Coal, spent 100% of their time on NRP matters during 2017, and NRP bears the proportionate cost of their time. Mr. Robertson does not receive a salary or an annual bonus in his capacity as Chief Executive Officer. Rather, Mr. Robertson has historically been compensated exclusively through long-term incentive awards.
Historically, in February of each year, the CNG Committee has approved the year-end bonuses for the year just ended and long-term incentive awards for the executive officers. The CNG Committee considers the performance of the partnership, the performance of the individuals and the outlook for the future in determining the amounts of the awards. Prior to 2016, we issued phantom units, coupled with tandem distribution equivalent rights (“DERs”), to our executive officers that are paid in cash based on the average closing price of our common units for the 20-day trading period prior to vesting. The phantom units and DERs typically vest four years from the date of grant. In past years, these awards have served to align the executive officers’ interests with those of our unitholders.
Prior to 2017, our general partner would use a portion of the annual cash distributions it received on the NRP common units held by our general partner for awards to our executive officers. We referred to this as the “GP Bonus Award” program. Mr. Robertson determined the awards allocated to each executive officer in his sole discretion, but the award amounts were reviewed by the CNG Committee and taken into account when making officer compensation determinations. During 2017, Mr. Robertson determined to discontinue the GP Bonus Award program beginning with respect to the year ended December 31, 2017.
In February 2016, the Board adopted a cash long-term incentive plan and made time-based and performance-based awards to officers under the plan in March 2016. In March 2017, the Board determined that the conditions to the vesting of the performance awards under the 2016 cash incentive plan had been met as a result of the completion of the 2017 recapitalization transactions. See “—2016 Cash Long-Term Incentive Plan” below. Following completion of the recapitalization transactions, the Board determined to evaluate options for a new long-term incentive plan that would result in officers and directors being awarded equity in NRP. See “—2017 Long-Term Incentive Plan” below.
2016 Cash Long-Term Incentive Plan
In February 2016, the CNG Committee adopted a new cash-based long-term incentive plan (the “2016 Cash LTIP”) and recommended the new plan and awards thereunder to the non-management members of the Board for approval. The Board approved the 2016 Cash LTIP and the forms of long-term incentive award agreements in February 2016. Two types of cash incentive awards were made to the executive officers in March 2016: (1) time vesting awards, 50% of which vested in February 2017 and 50% of which vested in February 2018, and (2) performance-based awards that provided that such awards would vest 50% upon the repayment, refinancing or rollover of the Opco revolving credit facility that would mature in April 2018 and 50% upon the repayment, refinancing or rollover of NRP’s 9.125% Senior Notes that would be due in October 2018, in each case as determined by the Board and depending upon the continued employment of the applicable executive officer. The performance-based awards vested in full in 2017 upon the completion of the recapitalization transactions. The performance awards also provided that up to an additional 100% of the amount of the performance-based awards may be awarded to the executive officers in the sole discretion of the Board after considering additional performance criteria including, but not limited to, NRP’s common unit price, projected EBITDA, and leverage ratio. As described in greater detail below under “—Evaluation of 2017 Performance; Components of Compensation—Long-Term Incentive Cash Compensation,” an additional 100% of the performance-based awards was awarded by the Board in March 2017.
2017 Long-Term Incentive Plan
Following completion of the recapitalization transactions, the Board directed the CNG Committee to evaluate a new long-term incentive program that would continue to incentivize management while also align the long-term interests of management with the interests of NRP’s unitholders. In December 2017, the CNG Committee approved and the Board adopted the Natural Resource Partners 2017 Long-Term Incentive Plan (the “2017 LTIP”), subject to unitholder approval. On December 20, 2017, unitholders holding the requisite percentage of votes necessary to approve the 2017 LTIP approved the 2017 LTIP by written consent in lieu of a special meeting of unitholders. The 2017 LTIP became effective on January 16, 2018. On February 14, 2018, the CNG Committee made awards of common units and phantom units to be settled in common units under the 2017 LTIP to NRP’s officers and directors.
121
Role of Compensation Experts
Historically, the CNG Committee periodically has utilized consultants to get a basic sense of the market, but has considered the advice of the consultant as only one of many factors among the other items discussed in this compensation discussion and analysis. Neither the Board, nor the CNG Committee retained any consultants to evaluate compensation of officers or directors in 2017.
Role of Our Executive Officers in the Compensation Process
With respect to 2017 salaries and vesting of the performance awards under the 2016 Cash LTIP, Mr. Hogan, our former President and Chief Operating Officer, provided Mr. Robertson with recommendations relating to the executive officers other than himself. Mr. Robertson considered those recommendations and provided the CNG Committee and Board with recommendations for all of the executive officers other than himself. Mr. Robertson relied on his personal experience in setting compensation over a number of years in determining the appropriate amounts for each employee, and considered each of the factors described elsewhere in this compensation discussion and analysis. Mr. Robertson and Mr. Hogan attended the CNG Committee and Board meetings at which the Committee deliberated and approved the 2017 salaries and performance award vesting, as applicable, but were excused from the meetings when the CNG Committee and Board, as applicable, discussed their compensation.
With respect to 2017 short-term cash incentive compensation, Mr. Nunez, provided Mr. Robertson with recommendations relating to the executive officers other than himself. Mr. Robertson considered those recommendations and provided the CNG Committee with recommendations for all of the executive officers other than himself. Mr. Robertson relied on his personal experience in setting compensation over a number of years in determining the appropriate amounts for each employee, and considered each of the factors described elsewhere in this compensation discussion and analysis. Mr. Robertson and Mr. Nunez attended the CNG Committee meetings at which the Committee deliberated and approved the short-term cash incentive compensation, but were excused from the meetings when the CNG Committee discussed their compensation.
Components of Compensation
Base Salaries
With the exception of Mr. Robertson, who, as described above, does not receive a salary for his services as Chief Executive Officer, our executive officers are paid an annual base salary by Quintana or Western Pocahontas for services rendered to us by the executive officers during the fiscal year. We then reimburse Quintana and Western Pocahontas based on the time allocated by each executive officer to our business. The base salaries of our named executive officers are reviewed on an annual basis as well as at the time of a promotion or other material change in responsibilities. The CNG Committee reviews and approves the full salaries paid to each executive officer by Quintana and Western Pocahontas, based on both the actual time allocations to NRP in the prior year and the anticipated time allocations in the coming year. Adjustments in base salary are based on an evaluation of individual performance, our partnership’s overall performance during the fiscal year and the individual’s contribution to our overall performance.
In determining salaries for NRP’s executive officers for 2017, at the December 2016 meeting, the CNG Committee considered the financial performance of NRP for the nine months ended September 30, 2016 as well as the projected financial performance of NRP for the fourth quarter of 2016 and for the year ending December 31, 2017. The CNG Committee also considered the individual performance of each member of the executive management team during 2016. Salaries for 2017 were held flat over 2016 salaries and are shown in the Summary Compensation Table below.
Short-Term Cash Incentive Compensation
Each named executive officer, with the exception of Mr. Robertson, received a discretionary short-term cash incentive award approved in February 2018 by the CNG Committee based on similar criteria used to evaluate the annual base salaries. The amounts awarded with respect to 2017 under this program are disclosed in the Summary Compensation Table under the Bonus column. As with the base salaries, there are no formulas or specific performance targets related to these awards. The short-term cash incentive awards with respect to 2017 were generally lower than 2016 amounts due to vesting of the cash performance awards during 2017, as described below.
122
Long-Term Cash Incentive Compensation
In March 2017, one-half of the time-based awards granted under the 2016 Cash LTIP vested and were paid. In addition, following the completion of the March 2017 recapitalization transactions, on March 3, 2017, the Board determined that both vesting conditions of the performance awards made under the 2016 Cash LTIP had been met and therefore the target performance award grant amounts would be awarded to each executive officer. In addition, following consideration of additional performance criteria including, but not limited to: (1) the performance of NRP’s common units over the past twelve months and subsequent to the announcement of the transactions; (2) the 2016 and projected 2017 EBITDA for NRP; and (3) the current and projected leverage ratios for NRP and its subsidiaries, the Board determined to award an additional 100% of the amount of the performance-based awards to the executive officers. The amounts paid to the named executive officers were equal to 200% of the performance award grant amounts. Amounts vested and paid under the 2016 Cash LTIP are shown in the Summary Compensation Table under the Non-Equity Incentive Plan column.
Perquisites and Other Personal Benefits
Both Quintana and Western Pocahontas maintain employee benefit plans that provide our executive officers and other employees with the opportunity to enroll in health, dental and life insurance plans. Each of these benefit plans require the employee to pay a portion of the health and dental premiums, with the company paying the remainder. These benefits are offered on the same basis to all employees of Quintana and Western Pocahontas, and the company costs are reimbursed by us to the extent the employee allocates time to our business.
Quintana and Western Pocahontas also maintain tax-qualified 401(k) and defined contribution retirement plans. During 2017, Quintana matched 100% of the first 4.5% of the employee contributions under the 401(k) plan and Western Pocahontas matched the employee contributions at a level of 100% of the first 3% of the contribution and 50% of the next 3% of the contribution. In addition, each company contributed 1/12 of each employee’s base salary to the defined contribution retirement plan. As with the other contributions, any amounts contributed by Quintana and Western Pocahontas are reimbursed by us based on the time allocated by the employee to our business. None of NRP, Quintana or Western Pocahontas maintains a pension plan or a defined benefit retirement plan.
Unit Ownership Requirements
We have not historically had any policy or guidelines that require specified ownership of our common units by our directors or executive officers or unit retention guidelines.
In December 2017, in connection with the adoption of the 2017 LTIP, the Board adopted the Natural Resource Partners L.P. Unit Ownership and Retention Guidelines (the “ownership guidelines”), which will be administered by the CNG Committee. The ownership guidelines require NRP’s officers who are required to file ownership reports under Section 16 of the Securities Exchange Act of 1934 (the “Exchange Act”) and certain other officers as designated from time-to-time by the Board or the CNG Committee to retain all common units awarded under any NRP incentive plan (net of any units withheld or sold to cover tax liabilities) until certain ownership guidelines are met. The guideline for NRP’s President and Chief Operating Officer is for such individual to hold common units having a value of four times his or her base salary at the date of measurement. The guideline for the other officers subject to the ownership guidelines is for each such individual to hold common units having a value of three times his or her base salary at the date of measurement. There is no minimum time period required to achieve the unit ownership guidelines. Due to his substantial ownership in us, the ownership guidelines do not currently apply to our Chief Executive Officer.
The ownership guidelines also require directors who are not officers to retain common units with a value equal to three times the amount of the annual cash
retainer paid to directors. Directors are required to achieve the unit ownership guideline within five years. Until the unit ownership guideline is achieved, each director is encouraged to retain all
common units awarded under any NRP incentive plan (net of any units sold to cover tax liabilities).
Units that count towards the satisfaction of the officer and director guidelines include common units held directly by the executive officer or director, common units owned indirectly by the executive officer or director (
e.g,
by a spouse or other immediate family member residing in the same household or a trust for the benefit of the executive officer or director or his or her family), units granted under NRP’s long-term incentive plans (including phantom units representing the right to receive units), and units purchased in the open market (whether purchased before or after the effective date of the ownership guidelines).
123
Incentive Compensation Recoupment Policy
We have not historically had any policy or guidelines regarding recoupment or adjustment of compensation of our executive officers. In December 2017, in connection with the adoption of the 2017 LTIP, the Board adopted the Natural Resource Partners L.P. Incentive Compensation Recoupment Policy, which will be administered by the CNG Committee. The policy authorizes the Board or committee thereof to recoup incentive compensation in the event of a restatement of financial statements due to material non-compliance with securities laws, fraud or misconduct.
Securities Trading Policy
Our insider trading policy states that executive officers and directors may not purchase or sell puts or calls to sell or buy our common units, engage in short sales with respect to our common units, or buy our securities on margin.
Report of the Compensation, Nominating and Governance Committee
The CNG Committee has reviewed and discussed the Compensation Discussion and Analysis required by Item 402(b) of Regulation S-K with management. Based on the reviews and discussions referred to in the foregoing sentence, the CNG Committee recommended to the Board that the Compensation Discussion and Analysis be included in this Annual Report on Form 10-K for the year ended December 31, 2017.
Leo A. Vecellio, Jr., Chairman
Russell D. Gordy
Stephen P. Smith
124
Summary Compensation Table
The following table sets forth the amounts reimbursed to affiliates of our general partner for compensation for 2015, 2016 and 2017:
|
Name and Principal Position
(1)
|
Year
|
Salary ($)
|
Cash Bonus ($)
|
Non-Equity Incentive Plan Compensation ($)
(1)
|
Phantom Unit Awards ($)
(2)
|
All Other Compensation ($)
(3)
|
|
Total ($)
|
||||||||||||
|
Corbin J. Robertson, Jr.—Chief Executive Officer
|
||||||||||||||||||||
|
2017
|
—
|
|
—
|
|
3,250,000
|
|
—
|
|
—
|
|
3,250,000
|
|
||||||||
|
2016
|
—
|
|
—
|
|
—
|
|
—
|
|
—
|
|
—
|
|
||||||||
|
2015
|
—
|
|
—
|
|
—
|
|
321,912
|
|
—
|
|
321,912
|
|
||||||||
|
Craig W. Nunez—President and Chief Operating Officer
(4)
|
||||||||||||||||||||
|
2017
|
375,000
|
|
250,000
|
|
1,218,750
|
|
—
|
|
34,650
|
|
1,878,400
|
|
||||||||
|
2016
|
375,000
|
|
425,000
|
|
—
|
|
—
|
|
34,383
|
|
834,383
|
|
||||||||
|
2015
|
375,000
|
|
375,000
|
|
—
|
|
446,575
|
|
33,783
|
|
1,230,358
|
|
||||||||
|
Kathryn S. Wilson—Vice President, General Counsel and Secretary
(5)
|
||||||||||||||||||||
|
2017
|
321,750
|
|
150,000
|
|
975,000
|
|
—
|
|
34,304
|
|
1,481,054
|
|
||||||||
|
2016
|
305,500
|
|
225,000
|
|
—
|
|
—
|
|
31,631
|
|
562,131
|
|
||||||||
|
2015
|
315,250
|
|
175,000
|
|
—
|
|
84,949
|
|
33,413
|
|
608,612
|
|
||||||||
|
Christopher J. Zolas—Chief Financial Officer
(6)
|
||||||||||||||||||||
|
2017
|
300,000
|
|
180,000
|
|
375,000
|
|
—
|
|
34,650
|
|
889,650
|
|
||||||||
|
2016
|
300,000
|
|
200,000
|
|
—
|
|
—
|
|
34,383
|
|
534,383
|
|
||||||||
|
2015
|
244,932
|
|
150,000
|
|
—
|
|
239,295
|
|
30,858
|
|
665,085
|
|
||||||||
|
Kevin J. Craig—Executive Vice President, Coal
(7)
|
||||||||||||||||||||
|
2017
|
172,000
|
|
145,600
|
|
375,000
|
|
—
|
|
22,427
|
|
715,027
|
|
||||||||
|
Wyatt L. Hogan—Former President and Chief Operating Officer
(8)
|
||||||||||||||||||||
|
2017
|
437,500
|
|
250,000
|
|
1,625,000
|
|
—
|
|
34,650
|
|
2,347,150
|
|
||||||||
|
2016
|
400,000
|
|
450,000
|
|
—
|
|
—
|
|
34,383
|
|
884,383
|
|
||||||||
|
2015
|
400,000
|
|
400,000
|
|
—
|
|
160,956
|
|
33,783
|
|
994,739
|
|
||||||||
|
(1)
|
See “
—
Compensation Discussion and Analysis
—
Components of Compensation
—
Long-Term Incentive Cash Compensation” above.
|
|
(2)
|
Amounts represent the grant date fair value of phantom unit awards determined in accordance with Accounting Standards Codification Topic 718 determined without regard to forfeitures. For information regarding the assumptions used in calculating these amounts, see Note 19 to the audited consolidated financial statements included elsewhere in this Annual Report on Form 10-K.
|
|
(3)
|
Includes portions of 401(k) matching and retirement contributions allocated to Natural Resource Partners by Quintana and Western Pocahontas.
|
|
(4)
|
Mr. Nunez served as NRP’s Chief Financial Officer and Treasurer from January 1, 2015 until August 8, 2017, at which time he became President and Chief Operating Officer.
|
|
(5)
|
Ms. Wilson allocated approximately 97%, 94% and 99% of her time to NRP during the years ended December 31, 2015, 2016 and 2017, respectively, and amounts included in the table reflect this allocation.
|
|
(6)
|
Mr. Zolas served as NRP’s Chief Accounting Officer from March 9, 2015 until August 8, 2017, at which time he became Chief Financial Officer and Treasurer.
|
|
(7)
|
Mr. Craig was not a named executive officer for purposes of this table during the years ended December 31, 2015 or 2016. Mr. Craig allocated approximately 80% of his time to NRP during the year ended December 31, 2017, and amounts included in the table reflect this allocation.
|
|
(8)
|
Mr. Hogan resigned as President and Chief Operating Officer effective August 8, 2017. Upon his resignation, he entered into an employment agreement with Quintana that provides for a salary and other benefits for Mr. Hogan the cost of which are borne by NRP. Such amounts paid with respect to 2017 are included in the table above. For more information, see “—Employment Agreements” below.
|
125
Grants of Plan-Based Awards in 2017
No plan-based awards were granted during the year ended December 31, 2017.
Employment Agreements
Following his resignation as President and Chief Operating Officer, Mr. Hogan and Quintana entered into a two-year employment agreement dated August 15, 2017, pursuant to which Mr. Hogan continued to be employed by Quintana and agreed to continue to provide services to NRP. The employment agreement provides for Mr. Hogan to receive an annualized salary of $500,000 beginning August 15, 2017 through the end of the two-year term and the same health benefits that he received during his time as an officer of NRP, all of the costs of which are borne by NRP. Mr. Hogan’s employment with Quintana terminated in February 2018, and Mr. Hogan received his 2017 bonus of $250,000 at that time pursuant to the terms of the employment agreement. The employment agreement also provides that Mr. Hogan will continue to receive his salary for the remaining term of his employment agreement, and that all of his outstanding phantom units and cash incentive awards will be vested on the date of termination and settle in accordance with the terms of such awards.
None of our other named executive officers has an employment agreement.
Phantom Units Vested in 2017
The table below shows the phantom units that vested in 2017 with respect to each named executive officer, along with the phantom unit value realized by each individual:
|
Named Executive Officer
|
Phantom Units Vested in 2017
(1)
|
Value Realized on 2017 Vesting
|
|||||
|
Corbin J. Robertson, Jr.
|
3,200
|
|
$
|
240,120
|
|
||
|
Craig W. Nunez
|
1,200
|
|
53,445
|
|
|||
|
Kathryn S. Wilson
|
650
|
|
48,774
|
|
|||
|
Christopher J. Zolas
|
650
|
|
26,674
|
|
|||
|
Kevin J. Craig
|
900
|
|
67,534
|
|
|||
|
Wyatt L. Hogan
|
1,600
|
|
120,060
|
|
|||
|
(1)
|
The unit numbers in the table above give effect to NRP's one-for-ten (1:10) reverse common unit split that became effective on February 17, 2016.
|
Outstanding Equity Awards at December 31, 2017
The table below shows the total number of outstanding phantom units held by each named executive officer at December 31, 2017. The phantom units shown below were awarded in February 2014 and 2015, with a portion of the phantom units having vested in February 2018 and the remaining portion vesting in February 2019.
|
Named Executive Officer
|
Unvested
Phantom Units
(1)
|
|
Market Value of Unvested Phantom Units
(2)
|
||||
|
Corbin J. Robertson, Jr.
|
6,960
|
|
(3)
|
$
|
180,960
|
|
|
|
Craig W. Nunez
|
2,700
|
|
(4)
|
70,200
|
|
||
|
Kathryn S. Wilson
|
1,633
|
|
(5)
|
42,458
|
|
||
|
Christopher J. Zolas
|
1,750
|
|
(6)
|
45,500
|
|
||
|
Kevin J. Craig
|
1,895
|
|
(7)
|
49,270
|
|
||
|
Wyatt L. Hogan
|
3,480
|
|
(8)
|
90,480
|
|
||
|
(1)
|
The unit numbers in the table above give effect to NRP's one-for-ten (1:10) reverse common unit split that became effective on February 17, 2016.
|
126
|
(2)
|
Based on a unit price of $26.00, the closing price for the common units on December 29, 2017.
|
|
(3)
|
3,360 phantom units vested in February 2018 and 3,600 phantom units vesting in February 2019.
|
|
(4)
|
1,300 phantom units vested in February 2018, and 1,400 phantom units vesting in February 2019.
|
|
(5)
|
683 phantom units vested in February 2018, and 950 phantom units vesting in February 2019.
|
|
(6)
|
800 phantom units vested in February 2018, and 950 phantom units vesting in February 2019.
|
|
(7)
|
945 phantom units vested in February 2018, and 950 phantom units vesting in February 2019
|
|
(8)
|
1,680 phantom units vested in February 2018, and 1,800 phantom units vesting in February 2019.
|
Potential Payments upon Termination or Change in Control
There are no severance benefits payable to any named executive officer upon the termination of their employment, other than benefits payable to Mr. Hogan pursuant to his employment agreement. Upon the occurrence of a change in control of NRP, our general partner, or GP Natural Resource Partners LLC, both the outstanding phantom unit awards and the outstanding cash incentive awards held by each of our named executive officers would immediately vest and become payable. The table below indicates the estimated payments to each named executive officer following a change in control at December 31, 2017.
|
Phantom Unit Awards
|
||||||||||||||||||||||||
|
Named Executive Officer
|
Unvested Phantom Units
(1)
|
Market Value of Unvested Phantom Units
(2)
|
Accumulated DERs
|
Cash Incentive Awards
|
Salary
|
Bonus
|
Other
|
Total Potential Payments
|
||||||||||||||||
|
Corbin J. Robertson, Jr.
|
6,960
|
|
173,130
|
|
87,756
|
|
250,000
|
|
—
|
|
—
|
|
—
|
|
510,886
|
|
||||||||
|
Craig W. Nunez
|
2,700
|
|
67,163
|
|
20,345
|
|
93,750
|
|
—
|
|
—
|
|
—
|
|
181,258
|
|
||||||||
|
Kathryn S. Wilson
|
1,633
|
|
40,621
|
|
19,115
|
|
75,000
|
|
—
|
|
—
|
|
—
|
|
134,736
|
|
||||||||
|
Christopher J. Zolas
|
1,750
|
|
43,531
|
|
10,238
|
|
75,000
|
|
—
|
|
—
|
|
—
|
|
128,769
|
|
||||||||
|
Kevin J. Craig
|
1,895
|
|
47,138
|
|
24,316
|
|
75,000
|
|
—
|
|
—
|
|
—
|
|
146,454
|
|
||||||||
|
Wyatt L. Hogan
|
3,480
|
|
86,565
|
|
43,878
|
|
125,000
|
|
812,500
|
|
250,000
|
|
33,256
|
|
1,351,199
|
|
||||||||
|
(1)
|
The unit numbers in the table above give effect to NRP's one-for-ten (1:10) reverse common unit split that became effective on February 17, 2016.
|
|
(2)
|
Calculated based on a per unit price of $24.875, the average closing price for our common units for the 20 trading days ended December 29, 2017, as required by the terms of the phantom unit agreements.
|
Directors’ Compensation for the Year Ended December 31, 2017
During the year ended December 31, 2017, there were a number of changes to the Board and the committees thereof:
|
•
|
Effective March 2, 2017, Jasvinder S. Khaira joined the Board as the designee of Blackstone pursuant to the Board Representation and Observation Rights Agreement;
|
|
•
|
Effective April 1, 2017, Mr. Karn resigned as Chairman of the Audit Committee, and Stephen P. Smith became Chairman of that Committee;
|
|
•
|
Effective April 1, 2017, Mr. Blakely resigned as Chairman of the Compensation, Nominating and Governance Committee, and Leo A. Vecellio, Jr. became Chairman of that Committee;
|
|
•
|
Effective May 9, 2017, Trey Jackson, resigned from the Board in connection with the sale by Adena Minerals, LLC of its 31% interest in our general partner to affiliates of ours; and
|
|
•
|
Effective December 31, 2017, Robert T. Blakely and Robert B. Karn, III each retired from the Board in accordance with the age requirements of NRP’s Corporate Governance Guidelines.
|
127
For more information regarding the Board and committees thereof, see “Item 10. Directors and Executive Officers of the Managing General Partner and Corporate Governance” elsewhere in this Annual Report on Form 10-K.
In December 2016, the Board approved an annual cash retainer payment of $60,000 to each non-employee director, plus annual committee fees equal to $10,000 in cash for each committee chairman and $5,000 in cash for each committee member. Following completion of the 2017 recapitalization transactions, each non-employee director (other than Mr. Khaira) received a bonus of $25,000 to compensate them for the additional time spent on NRP matters in connection with those transactions. In October 2017, the Board reviewed total Board compensation and determined to increase the annual retainer to $150,000 effective for the year ended December 31, 2017. Factors considered in increasing the annual retainer included the fact that the Board cash retainer had remained at $60,000 since 2011, the fact that NRP had not issued any phantom units since 2015, market rates for public company directorships, and the need to retain additional directors following the retirements of Messrs. Blakely and Karn at the end of 2017.
The table below shows the directors’ compensation for the year ended December 31, 2017.
|
Name of Director
|
Fees Earned or Paid in Cash
(1)
|
|||
|
Robert T. Blakely
(2)
|
$
|
192,500
|
|
|
|
Russell D. Gordy
|
180,000
|
|
||
|
L.G. ("Trey") Jackson, III
(3)
|
55,000
|
|
||
|
Robert B. Karn, III
(2)
|
192,500
|
|
||
|
Jasvinder S. Khaira
(4)
|
—
|
|
||
|
S. Reed Morian
|
175,000
|
|
||
|
Richard A. Navarre
|
205,000
|
|
||
|
Corbin J. Robertson, III
|
175,000
|
|
||
|
Stephen P. Smith
|
190,000
|
|
||
|
Leo A. Vecellio, Jr.
|
190,000
|
|
||
|
(1)
|
No phantom unit awards were made to directors in 2017. As of December 31, 2017, each director other than Messrs. Blakely, Karn and Khaira held 799 phantom units, of which 389 vested in February 2018, and 410 phantom units will vest in February 2019. The award amounts included in the foregoing sentence give effect to NRP’s one-for-ten (1:10) reverse common unit split that became effective on February 17, 2016.
|
|
(2)
|
Pursuant to the terms of the phantom unit awards, all outstanding phantom units held by Messrs. Blakely and Karn vested effective December 31, 2017 following their retirements from the Board.
|
(3) Mr. Jackson resigned from the Board in May 2017.
|
(4)
|
Mr. Khaira does not receive Board compensation as the Blackstone designee.
|
128
The table below shows the phantom units that vested in 2017 with respect to each Director, along with the value realized by each individual:
|
Director
|
Phantom Units Vested
|
Value Realized
on Vesting
|
||||||
|
Robert T. Blakely
(1)
|
1,169
|
|
$
|
59,293
|
|
|||
|
Russell D. Gordy
|
370
|
|
23,694
|
|
(2)
|
|||
|
L.G. ("Trey") Jackson, III
|
—
|
|
—
|
|
||||
|
Robert B. Karn, III
(1)
|
1,169
|
|
59,293
|
|
||||
|
Jasvinder S. Khaira
|
—
|
|
—
|
|
||||
|
S. Reed Morian
|
370
|
|
27,764
|
|
||||
|
Richard A. Navarre
|
370
|
|
23,694
|
|
(2)
|
|||
|
Corbin J. Robertson, III
|
370
|
|
25,729
|
|
(3)
|
|||
|
Stephen P. Smith
|
370
|
|
27,764
|
|
||||
|
Leo A. Vecellio, Jr.
|
370
|
|
27,764
|
|
||||
(1) Includes 799 phantom units that vested for Messrs. Blakely and Karn effective December 31, 2017 following their retirements from the Board.
(2) Includes DERs from October 31, 2013, the date that Messrs. Gordy and Navarre joined the Board.
(3) Includes DERs from May 21, 2013, the date that Mr. Robertson, III joined the Board.
Compensation Committee Interlocks and Insider Participation
During the year ended December 31, 2017, Messrs. Blakely, Gordy, Karn and Vecellio served on the CNG Committee. None of Messrs. Blakely, Gordy, Karn or Vecellio has ever been an officer or employee of NRP or GP Natural Resource Partners LLC. None of our executive officers serve as a member of the board of directors or compensation committee of any entity that has any executive officer serving as a member of our Board or CNG Committee.
Pay Ratio Disclosure
The Securities and Exchange Commission has adopted a rule requiring annual disclosure of the ratio of the median employee’s total annual compensation to the total annual compensation of the CEO.
The personnel providing services to our Construction Aggregates business are employed by consolidated subsidiaries of ours. Other personnel providing services to us, including our executive officers, are employed by Quintana or Western Pocahontas and consequently, are not considered our employees for purposes of calculating the required pay ratio. We identified the median employee by examining the 2017 total taxable compensation, as reflected in our payroll records as reported to the Internal Revenue Service on Form W-2, for all individuals, who were employed by our consolidated subsidiaries on December 31, 2017. We included all employees of our Construction Aggregates business, whether employed on a full-time, part-time, temporary or seasonal basis. As of December 31, 2017, we employed 243 such persons. We did not make any assumptions, adjustments, or estimates with respect to total cash compensation or equity compensation and we did not annualize the compensation for any employees that were not employed for all of 2017.
129
After identifying the median employee based on total compensation, we calculated annual 2017 compensation for the median employee using the same methodology used to calculate the Chief Executive Officer’s total compensation as reflected in the Summary Compensation Table above. The median employee’s annual 2017 compensation was as follows:
|
Name
|
Year
|
Salary
|
Bonus
|
Non-Equity Incentive Plan Compensation
|
Phantom Unit Awards
|
All Other Compensation
|
Total
|
|||||||||||||||||||
|
Median Employee
|
2017
|
$
|
46,786
|
|
$
|
3,002
|
|
$
|
—
|
|
$
|
—
|
|
$
|
—
|
|
$
|
49,788
|
|
|||||||
Our 2017 ratio of Chief Executive Officer total compensation to our median employee’s total compensation is reasonably estimated to be 65:1.
130
The following table sets forth, as of March 1, 2018, the amount and percentage of our common units and Preferred Units beneficially held by (1) each person known to us to beneficially own 5% or more of any class of our units, (2) by each of our directors and named executive officers and (3) by all directors and executive officers as a group. Unless otherwise noted, each of the named persons and members of the group has sole voting and investment power with respect to the units shown.
|
Name of Beneficial Owner
|
Common
Units
|
Percentage of
Common
Units
(1)
|
||||
|
Corbin J. Robertson, Jr.
(2)
|
4,128,605
|
|
33.7
|
%
|
||
|
Premium Resources LLC
(3)
|
4,128,599
|
|
33.7
|
%
|
||
|
Maple Rock Capital Partners, Inc.
(4)
|
827,710
|
|
6.8
|
%
|
||
|
JPMorgan Chase & Co.
(5)
|
724,081
|
|
5.9
|
%
|
||
|
Craig W. Nunez
|
—
|
|
—
|
|
||
|
Kathryn S. Wilson
|
—
|
|
—
|
|
||
|
Christopher J. Zolas
|
—
|
|
—
|
|
||
|
Kevin J. Craig
|
950
|
|
*
|
|
||
|
Wyatt L. Hogan
(6)
|
1,250
|
|
*
|
|
||
|
Russell D. Gordy
(7)
|
9,399
|
|
*
|
|
||
|
Jasvinder S. Khaira
|
—
|
|
—
|
|
||
|
S. Reed Morian
|
2,399
|
|
*
|
|
||
|
Richard A. Navarre
|
1,000
|
|
*
|
|
||
|
Corbin J. Robertson III
(8)
|
175,189
|
|
1.4
|
%
|
||
|
Stephen P. Smith
|
355
|
|
*
|
|
||
|
Leo A. Vecellio, Jr.
|
4,399
|
|
*
|
|
||
|
Directors and Officers as a Group
|
4,329,501
|
|
35.4
|
%
|
||
|
*
|
Less than one percent.
|
|
(1)
|
Percentages based upon 12,241,602 common units issued and outstanding as of March 1, 2018. Unless otherwise noted, beneficial ownership is less than 1%.
|
|
(2)
|
Mr. Robertson may be deemed to beneficially own the
4,128,599
common units owned by Premium Resources LLC. Mr. Robertson’s address is 1415 Louisiana Street, Suite 2400, Houston, Texas 77002.
|
|
(3)
|
These common units may be deemed to be beneficially owned by Mr. Robertson. The address of Premium Resources LLC is 1415 Louisiana Street, Suite 2400, Houston, Texas 77002.
|
|
(4)
|
According to a Schedule13G filing with the SEC on February 14, 2018, Maple Rock Capital Partners, Inc. holds sole voting power and sole dispositive power with respect to
827,710
common units in the Partnership. The business address of Maple Rock Capital Partners, Inc. is 45 St. Clair Avenue West, Suite 903, Toronto, A6 M4V 1K9.
|
|
(5)
|
According to a Schedule 13G filing with the SEC on December 29, 2017, JPMorgan Chase & Co. holds sole voting power and sole dispositive power with respect to
724,081
common units in the Partnership. The business address of JPMorgan Chase & Co. is 270 Park Ave., New York, NY 10017.
|
|
(6)
|
Mr. Hogan resigned as President and Chief Operating Officer in August 2017 and is one of our Named Executive Officers for purposes of this Annual Report on Form 10-K. Of these common units, 50 common units are owned by the Anna Margaret Hogan 2002 Trust, 50 common units are held by the Alice Elizabeth Hogan 2002 Trust, and 50 common units are held by the Ellen Catlett Hogan 2005 Trust. Mr. Hogan is a trustee of each of these trusts.
|
|
(7)
|
Mr. Gordy may be deemed to beneficially own 5,000 common units owned by Minion Trail, Ltd. and 2,000 common units owned by Rock Creek Ranch 1, Ltd.
|
|
(8)
|
Mr. Robertson III may be deemed to beneficially own 9,783 common units held CIII Capital Management, LLC, 10,000 common units held by BHJ Investments, 5,046 common units held by The Corbin James Robertson III 2009 Family Trust
|
131
and 39 common units held by his spouse, Brooke Robertson. The address for CIII Capital Management, LLC is 1415 Louisiana Street, Suite 2400, Houston, Texas 77002, the address for BHJ Investments is 1415 Louisiana Street, Suite 2400, Houston, Texas 77002 and the address for The Corbin James Robertson III 2009 Family Trust is 1415 Louisiana Street, Suite 2400, Houston, Texas 77002. The following common units are pledged as collateral for loans: 29,542 common units owned directly by Mr. Robertson III.
|
Name of Beneficial Owner
|
Preferred Units
|
Percentage of
Preferred Units
|
||||
|
The Blackstone Group L.P.
(1)
|
142,500
|
|
57
|
%
|
||
|
GoldenTree Asset Management, LP
(2)
|
107,500
|
|
43
|
%
|
||
|
(1)
|
The Preferred Units are owned by funds managed by The Blackstone Group L.P., whose address is 345 Park Ave, New York, NY 10154. Blackstone Group Management L.L.C. is the general partner of The Blackstone Group L.P., and is wholly owned by Blackstone’s senior managing directors and controlled by its founder, Stephen A. Schwarzman.
|
|
(2)
|
The Preferred Units are owned by funds managed by GoldenTree Asset Management, LP, whose address is 300 Park Ave, New York, NY 10022. Steven A. Tananbaum serves as senior managing member of GoldenTree Asset Management LLC, the general partner of GoldenTree Asset Management, LP.
|
Western Pocahontas Properties Limited Partnership, New Gauley Coal Corporation and Great Northern Properties Limited Partnership are three privately held companies that are primarily engaged in owning and managing mineral properties. We refer to these companies collectively as the WPP Group. Corbin J. Robertson, Jr. owns the general partner of Western Pocahontas Properties, 85% of the general partner of Great Northern Properties Limited Partnership and is the Chairman and Chief Executive Officer of New Gauley Coal Corporation.
Omnibus Agreement
As part of the omnibus agreement entered into concurrently with the closing of our initial public offering, the WPP Group and any entity controlled by Corbin J. Robertson, Jr., which we refer to in this section as the “GP affiliates,” each agreed that neither they nor their affiliates will, directly or indirectly, engage or invest in entities that engage in the following activities (each, a "restricted business") in the specific circumstances described below:
|
•
|
the entering into or holding of leases with a party other than an affiliate of the GP affiliate for any GP affiliate-owned fee coal reserves within the United States; and
|
|
•
|
the entering into or holding of subleases with a party other than an affiliate of the GP affiliate for coal reserves within the United States controlled by a paid-up lease owned by any GP affiliate or its affiliate.
|
"Affiliate" means, with respect to any GP affiliate or, any other entity in which such GP affiliate owns, through one or more intermediaries, 50% or more of the then outstanding voting securities or other ownership interests of such entity. Except as described below, the WPP Group and their respective controlled affiliates will not be prohibited from engaging in activities in which they compete directly with us.
A GP affiliate may, directly or indirectly, engage in a restricted business if:
|
•
|
the GP affiliate was engaged in the restricted business at the closing of the offering; provided that if the fair market value of the asset or group of related assets of the restricted business subsequently exceeds $10 million, the GP affiliate must offer the restricted business to us under the offer procedures described below.
|
|
•
|
the asset or group of related assets of the restricted business have a fair market value of $10 million or less; provided that if the fair market value of the assets of the restricted business subsequently exceeds $10 million, the GP affiliate must offer the restricted business to us under the offer procedures described below.
|
|
•
|
the asset or group of related assets of the restricted business have a fair market value of more than $10 million and the general partner (with the approval of the conflicts committee) has elected not to cause us to purchase these assets under the procedures described below.
|
132
|
•
|
its ownership in the restricted business consists solely of a non-controlling equity interest.
|
For purposes of this paragraph, "fair market value" means the fair market value as determined in good faith by the relevant GP affiliate.
The total fair market value in the good faith opinion of the WPP Group of all restricted businesses engaged in by the WPP Group, other than those engaged in by the WPP Group at closing of our initial public offering, may not exceed $75 million. For purposes of this restriction, the fair market value of any entity engaging in a restricted business purchased by the WPP Group will be determined based on the fair market value of the entity as a whole, without regard for any lesser ownership interest to be acquired.
If the WPP Group desires to acquire a restricted business or an entity that engages in a restricted business with a fair market value in excess of $10 million and the restricted business constitutes greater than 50% of the value of the business to be acquired, then the WPP Group must first offer us the opportunity to purchase the restricted business. If the WPP Group desires to acquire a restricted business or an entity that engages in a restricted business with a value in excess of $10 million and the restricted business constitutes 50% or less of the value of the business to be acquired, then the GP affiliate may purchase the restricted business first and then offer us the opportunity to purchase the restricted business within six months of acquisition. For purposes of this paragraph, "restricted business" excludes a general partner interest or managing member interest, which is addressed in a separate restriction summarized below. For purposes of this paragraph only, "fair market value" means the fair market value as determined in good faith by the relevant GP affiliate.
If we want to purchase the restricted business and the GP affiliate and the general partner, with the approval of the conflicts committee, agree on the fair market value and other terms of the offer within 60 days after the general partner receives the offer from the GP affiliate, we will purchase the restricted business as soon as commercially practicable. If the GP affiliate and the general partner, with the approval of the conflicts committee, are unable to agree in good faith on the fair market value and other terms of the offer within 60 days after the general partner receives the offer, then the GP affiliate may sell the restricted business to a third party within two years for no less than the purchase price and on terms no less favorable to the GP affiliate than last offered by us. During this two-year period, the GP affiliate may operate the restricted business in competition with us, subject to the restriction on total fair market value of restricted businesses owned in the case of the WPP Group.
If, at the end of the two year period, the restricted business has not been sold to a third party and the restricted business retains a value, in the good faith opinion of the relevant GP affiliate, in excess of $10 million, then the GP affiliate must reoffer the restricted business to the general partner. If the GP affiliate and the general partner, with the approval of the conflicts committee, agree on the fair market value and other terms of the offer within 60 days after the general partner receives the second offer from the GP affiliate, we will purchase the restricted business as soon as commercially practicable. If the GP Affiliate and the general partner, with the concurrence of the conflicts committee, again fail to agree after negotiation in good faith on the fair market value of the restricted business, then the GP affiliate will be under no further obligation to us with respect to the restricted business, subject to the restriction on total fair market value of restricted businesses owned.
In addition, if during the two-year period described above, a change occurs in the restricted business that, in the good faith opinion of the GP affiliate, affects the fair market value of the restricted business by more than 10 percent and the fair market value of the restricted business remains, in the good faith opinion of the relevant GP affiliate, in excess of $10 million, the GP affiliate will be obligated to reoffer the restricted business to the general partner at the new fair market value, and the offer procedures described above will recommence.
If the restricted business to be acquired is in the form of a general partner interest in a publicly held partnership or a managing member interest in a publicly held limited liability company, the WPP Group may not acquire such restricted business even if we decline to purchase the restricted business. If the restricted business to be acquired is in the form of a general partner interest in a non-publicly held partnership or a managing member of a non-publicly held limited liability company, the WPP Group may acquire such restricted business subject to the restriction on total fair market value of restricted businesses owned and the offer procedures described above.
The omnibus agreement may be amended at any time by the general partner, with the concurrence of the conflicts committee. The respective obligations of the WPP Group under the omnibus agreement terminate when the WPP Group and its affiliates cease to participate in the control of the general partner.
133
Board Representation and Observation Rights Agreement
Effective on March 2, 2017 in connection with the closing of the issuance of the Preferred Units, pursuant to the Board Representation and Observation Rights Agreement, Blackstone appointed Jasvinder S. Khaira to serve on the Board of Directors of GP Natural Resource Partners LLC and also appointed one observer to attend meetings of the Board. Blackstone's rights to appoint a member of the Board and an observer will terminate at such time as Blackstone, together with their affiliates, no longer own at least 20% of the total number of Preferred Units issued on the closing date, together with all PIK Units that have been issued but not redeemed (the "Minimum Preferred Unit Threshold"). Following the time that Blackstone (and their affiliates) no longer own the Minimum Preferred Unit Threshold and until such time as GoldenTree (together with their affiliates) no longer own the Minimum Preferred Unit Threshold, GoldenTree shall have the one time option to appoint either one person to serve as a member of the Board or one person to serve as a Board observer. To the extent GoldenTree elects to appoint a Board member and later remove such Board member, GoldenTree may then elect to appoint a Board observer. For more information on the Preferred Units, including the rights of the holders thereof, see
Note 3. Class A Convertible Preferred Units and Warrants
in the Notes to Consolidated Financial Statements under Item 8 in this Annual Report on Form 10-K.
Transactions with Cline Group and Affiliates
On May 9, 2017, Adena Minerals, LLC (“Adena”), an affiliate of Christopher Cline (“Cline”) sold its 31% limited partner interest in our general partner to Great Northern Properties Limited Partnership and WPPLP (the “Adena Sale”). In connection with the Adena Sale, on May 9, 2017, the Investor Rights Agreement effective as of January 4, 2007 by and among Adena, NRP GP, GP LLC, and Robertson Coal Management (the “Investor Rights Agreement”) terminated pursuant to its terms. Also on May 9, 2017, the Restricted Business Contribution Agreement effective as of January 4, 2007, by and among Christopher Cline, Foresight Reserves LP, Adena, NRP, NRP GP, and NRP (Operating) LLC (the “RBCA”) terminated pursuant to the terms thereof. In addition, the rights of Adena and its affiliates under the Partnership’s partnership agreement are no longer in effect as a result of the Adena Sale (other than customary rights to indemnification). The Investor Rights Agreement and RBCA are described below.
As a result of the Adena Sale, we no longer consider Cline or his affiliates, including Foresight Energy, affiliates of NRP.
Restricted Business Contribution Agreement
Christopher Cline, Foresight Reserves LP and Adena (collectively, the "Cline Parties") and NRP entered into a Restricted Business Contribution Agreement in 2007. Pursuant to the terms of the Restricted Business Contribution Agreement, the Cline Parties and their affiliates were obligated to offer to NRP any business owned, operated or invested in by the Cline Parties, subject to certain exceptions, that either (a) owns, leases or invests in hard minerals or (b) owns, operates, leases or invests in transportation infrastructure relating to future mine developments by the Cline Parties in Illinois. In addition, we created an area of mutual interest (the "AMI") around certain of the properties that we have acquired from Cline affiliates. During the applicable term of the Restricted Business Contribution Agreement, the Cline Parties were obligated to contribute any coal reserves held or acquired by the Cline Parties or their affiliates within the AMI to us. In connection with the offer of mineral properties by the Cline Parties to NRP, the parties to the Restricted Business Contribution Agreement agreed to negotiate and agree upon an area of mutual interest around such minerals, which would supplement and become a part of the AMI. On May 9, 2017, Adena Minerals, LLC (“Adena”) sold its 31% limited partner interest in NRP (GP) LP (the Partnership’s general partner) (“NRP GP”) to Great Northern Properties Limited Partnership (“GNPLP”) and WPPLP (the “Adena Sale”).
For a summary of revenues that we have derived from the Cline relationship, including Foresight Energy LP, see "Item 8. "Item 8. Financial Statements and Supplementary Data—
Note 15. Related Party Transactions
—Cline Affiliates" elsewhere in this Annual Report on Form 10-K.
Investor Rights Agreement
NRP and certain affiliates and Adena executed an Investor Rights Agreement pursuant to which Adena was granted certain management rights. Specifically, Adena had the right to name two directors (one of which must be independent) to the Board of Directors of our managing general partner so long as Adena beneficially owned either 5% of our limited partnership interests or 5% of our general partner’s limited partnership interests and so long as certain rights under our managing general partner’s LLC Agreement had not been exercised by Adena or Mr. Robertson. During 2017, Leo A. Vecellio and L.G. (Trey) Jackson III served as Adena’s two directors. Mr. Jackson resigned from the Board in connection with the Adena Sale. Mr. Vecellio, who is an
134
independent director, remains on the Board. Adena also had the right, pursuant to the terms of the Investor Rights Agreement, to withhold its consent to the sale or other disposition of any entity or assets contributed by Cline affiliates to NRP, and any such sale or disposition would have been void without Adena’s consent.
Quintana Capital Group GP, Ltd.
Corbin J. Robertson, Jr. is a principal in Quintana Capital Group GP, Ltd., which controls several private equity funds focused on investments in the energy business. NRP’s Board of Directors has adopted a formal conflicts policy that establishes the opportunities that will be pursued by NRP and those that will be pursued by Quintana Capital. The basic tenets of the policy are set forth below.
NRP’s business strategy has historically focused on:
|
•
|
The ownership of natural resource properties in North America, including, but not limited to coal, aggregates and industrial minerals, and oil and gas. NRP leases these properties to mining or operating companies that mine or produce the resources and pay NRP a royalty.
|
|
•
|
The ownership and operation of transportation, storage and related logistics activities related to extracted hard minerals.
|
The businesses and investments described in this paragraph are referred to as the "NRP Businesses."
NRP’s acquisition strategy also includes:
|
•
|
The ownership of non-operating working interests in oil and gas properties.
|
|
•
|
The ownership of non-controlling equity interests in companies involved in natural resource development and extraction.
|
|
•
|
The operation of construction aggregates mining and production businesses.
|
The businesses and investments described in this paragraph are referred to as the "Shared Businesses."
NRP’s business strategy does not, and is not expected to, include:
|
•
|
The ownership of equity interests in companies involved in the mining or extraction of coal.
|
|
•
|
Investments that do not generate "qualifying income" for a publicly traded partnership under U.S. tax regulations.
|
|
•
|
Investments outside of North America.
|
|
•
|
Midstream or refining businesses that do not involve hard extracted minerals, including the gathering, processing, fractionation, refining, storage or transportation of oil, natural gas or natural gas liquids.
|
The businesses and investments described in this paragraph are referred to as the "Non-NRP Businesses."
It is acknowledged that neither Quintana Capital nor Mr. Robertson will have any obligation to offer investments relating to Non-NRP Businesses to NRP, and that NRP will not have any obligation to refrain from pursuing a Non-NRP Business if there is a change in its business strategy.
For so long as Corbin Robertson, Jr. remains both an affiliate of Quintana Capital and an executive officer or director of NRP or an affiliate of its general partner, before making an investment in an NRP Business, Quintana Capital has agreed to adhere to the following procedures:
|
•
|
Quintana Capital will first offer such opportunity in its entirety to NRP. NRP may elect to pursue such investment wholly for its own account, to pursue the opportunity jointly with Quintana Capital or not to pursue such opportunity.
|
|
•
|
If NRP elects not to pursue an NRP Business investment opportunity, Quintana Capital may pursue the investment for its own account on similar terms.
|
|
•
|
NRP will undertake to advise Quintana Capital of its decision regarding a potential investment opportunity within 10 business days of the identification of such opportunity to the Conflicts Committee.
|
If the opportunity relates to the acquisition of a Shared Business, NRP and Quintana Capital will adhere to the following procedures:
135
|
•
|
If the opportunity is generated by individuals other than Mr. Robertson, the opportunity will belong to the entity for which those individuals are working.
|
|
•
|
If the opportunity is generated by Mr. Robertson and both NRP and Quintana Capital are interested in pursuing the opportunity, it is expected that the Conflicts Committee will work together with the relevant Limited Partner Advisory Committees for Quintana Capital to reach an equitable resolution of the conflict, which may involve investments by both parties.
|
In all cases above in which Mr. Robertson has a conflict of interest, investment decisions will be made on behalf of NRP by the Conflicts Committee and on behalf of Quintana Capital Group by the relevant Investment Committee, with Mr. Robertson abstaining.
A fund controlled by Quintana Capital owns an interest in Corsa Coal Corp, a coal mining company traded on the TSX Venture Exchange that is one of our lessees in Tennessee. Corbin J. Robertson, III, one of our directors, was Chairman of the Board of Corsa through May 10, 2017. In addition, in May 2017, a subsidiary of Alpha Natural Resources assigned two coal leases with us to Quinwood Coal Partners LP ("Quinwood"), an entity controlled by Mr. Robertson, III. In connection with this lease assignment, Quinwood forfeited the historical recoupable balance related to this property.
For more information on our relationship with Corsa Coal and Quinwood, see "Item 8. Financial Statements and Supplementary Data—
Note 15. Related Party Transactions
—Quintana Capital Group GP, Ltd."
Office Building in Huntington, West Virginia
We lease an office building in Huntington, West Virginia from Western Pocahontas Properties Limited Partnership. The terms of the lease, including $0.6 million per year in lease payments, were approved by our conflicts committee.
Conflicts of Interest
Conflicts of interest exist and may arise in the future as a result of the relationships between our general partner and its affiliates (including the WPP Group) on the one hand, and our partnership and our limited partners, on the other hand. The directors and officers of GP Natural Resource Partners LLC have duties to manage GP Natural Resource Partners LLC and our general partner in a manner beneficial to its owners. At the same time, our general partner has a duty to manage our partnership in a manner beneficial to us and our unitholders. The Delaware Revised Uniform Limited Partnership Act, which we refer to as the Delaware Act, provides that Delaware limited partnerships may, in their partnership agreements, expand, restrict or eliminate the fiduciary duties otherwise owed by a general partner to limited partners and the partnership. Pursuant to these provisions, our partnership agreement contains various provisions modifying the fiduciary duties that would otherwise be owed by our general partner with contractual standards governing the duties of the general partner and the methods of resolving conflicts of interest. Our partnership agreement also specifically defines the remedies available to limited partners for actions taken that, without these defined liability standards, might constitute breaches of fiduciary duty under applicable Delaware law.
Whenever a conflict arises between our general partner or its affiliates, on the one hand, and our partnership or any other partner, on the other, our general partner will resolve that conflict. Our general partner may, but is not required to, seek the approval of the conflicts committee of the Board of Directors of our general partner of such resolution. The partnership agreement contains provisions that allow our general partner to take into account the interests of other parties in addition to our interests when resolving conflicts of interest.
Our general partner will not be in breach of its obligations under the partnership agreement or its duties to us or our unitholders if the resolution of the conflict is considered to be fair and reasonable to us. Any resolution is considered to be fair and reasonable to us if that resolution is:
|
•
|
approved by the conflicts committee, although our general partner is not obligated to seek such approval and our general partner may adopt a resolution or course of action that has not received approval;
|
|
•
|
on terms no less favorable to us than those generally being provided to or available from unrelated third parties; or
|
|
•
|
fair to us, taking into account the totality of the relationships between the parties involved, including other transactions that may be particularly favorable or advantageous to us.
|
136
In resolving a conflict, our general partner, including its conflicts committee, may, unless the resolution is specifically provided for in the partnership agreement, consider:
|
•
|
the relative interests of any party to such conflict and the benefits and burdens relating to such interest;
|
|
•
|
any customary or accepted industry practices or historical dealings with a particular person or entity;
|
|
•
|
generally accepted accounting practices or principles; and
|
|
•
|
such additional factors it determines in its sole discretion to be relevant, reasonable or appropriate under the circumstances.
|
Blackstone has certain consent rights and board appointment and observation rights and may be deemed to be an affiliate of our general partner. In addition, GoldenTree has certain limited consent rights. In the exercise of these consent rights and board rights, conflicts of interest could arise between us on the one hand, and Blackstone or GoldenTree on the other hand.
Conflicts of interest could arise in the situations described below, among others.
Actions taken by our general partner may affect the amount of cash available for distribution to unitholders.
The amount of cash that is available for distribution to unitholders is affected by decisions of our general partner regarding such matters as:
|
•
|
amount and timing of asset purchases and sales;
|
|
•
|
cash expenditures;
|
|
•
|
borrowings;
|
|
•
|
the issuance of additional common units; and
|
|
•
|
the creation, reduction or increase of reserves in any quarter.
|
In addition, borrowings by us and our affiliates do not constitute a breach of any duty owed by our general partner to the unitholders, including borrowings that have the purpose or effect of enabling our general partner to receive distributions.
For example, in the event we have not generated sufficient cash from our operations to pay the quarterly distribution on our common units, our partnership agreement permits us to borrow funds which may enable us to make this distribution on all outstanding common units.
The partnership agreement provides that we and our subsidiaries may borrow funds from our general partner and its affiliates. Our general partner and its affiliates may not borrow funds from us or our subsidiaries.
We do not have any officers or employees other than in our Construction Aggregates business. We rely on officers and employees of GP Natural Resource Partners LLC and its affiliates.
Excluding our Construction Aggregates business, we do not have any officers or employees and rely on officers and employees of GP Natural Resource Partners LLC and its affiliates. Affiliates of GP Natural Resource Partners LLC conduct businesses and activities of their own in which we have no economic interest. If these separate activities are significantly greater than our activities, there could be material competition for the time and effort of the officers and employees who provide services to our general partner. The officers of GP Natural Resource Partners LLC are not required to work full time on our affairs. Certain of these officers devote significant time to the affairs of the WPP Group or its affiliates and are compensated by these affiliates for the services rendered to them.
We reimburse our general partner and its affiliates for expenses.
We reimburse our general partner and its affiliates for costs incurred in managing and operating us, including costs incurred in rendering corporate staff and support services to us. The partnership agreement provides that our general partner determines the expenses that are allocable to us in any reasonable manner determined by our general partner in its sole discretion.
137
Our general partner intends to limit its liability regarding our obligations.
Our general partner intends to limit its liability under contractual arrangements so that the other party has recourse only to our assets, and not against our general partner or its assets. The partnership agreement provides that any action taken by our general partner to limit its liability or our liability is not a breach of our general partner’s fiduciary duties, even if we could have obtained more favorable terms without the limitation on liability.
Common unitholders have no right to enforce obligations of our general partner and its affiliates under agreements with us.
Any agreements between us on the one hand, and our general partner and its affiliates, on the other, do not grant to the unitholders, separate and apart from us, the right to enforce the obligations of our general partner and its affiliates in our favor.
Contracts between us, on the one hand, and our general partner and its affiliates, on the other, are not the result of arm’s-length negotiations.
The partnership agreement allows our general partner to pay itself or its affiliates for any services rendered to us, provided these services are rendered on terms that are fair and reasonable. Our general partner may also enter into additional contractual arrangements with any of its affiliates on our behalf. Neither the partnership agreement nor any of the other agreements, contracts and arrangements between us, on the one hand, and our general partner and its affiliates, on the other, are the result of arm’s-length negotiations.
All of these transactions entered into after our initial public offerings are on terms that are fair and reasonable to us.
Our general partner and its affiliates have no obligation to permit us to use any facilities or assets of our general partner and its affiliates, except as may be provided in contracts entered into specifically dealing with that use. There is no obligation of our general partner or its affiliates to enter into any contracts of this kind.
We may not choose to retain separate counsel for ourselves or for the holders of common units.
The attorneys, independent auditors and others who have performed services for us in the past were retained by our general partner, its affiliates and us and have continued to be retained by our general partner, its affiliates and us. Attorneys, independent auditors and others who perform services for us are selected by our general partner or the conflicts committee and may also perform services for our general partner and its affiliates. We may retain separate counsel for ourselves or the holders of common units in the event of a conflict of interest arising between our general partner and its affiliates, on the one hand, and us or the holders of common units, on the other, depending on the nature of the conflict. We do not intend to do so in most cases. Delaware case law has not definitively established the limits on the ability of a partnership agreement to restrict such fiduciary duties.
Our general partner’s affiliates may compete with us.
The partnership agreement provides that our general partner is restricted from engaging in any business activities other than those incidental to its ownership of interests in us. Except as provided in our partnership agreement and the Omnibus Agreement, affiliates of our general partner will not be prohibited from engaging in activities in which they compete directly with us.
The Conflicts Committee Charter is available upon request.
Director Independence
For a discussion of the independence of the members of the Board of Directors of our managing general partner under applicable standards, see "Item 10. Directors and Executive Officers of the Managing General Partner and Corporate Governance—Corporate Governance—Independence of Directors," which is incorporated by reference into this Item 13.
Review, Approval or Ratification of Transactions with Related Persons
If a conflict or potential conflict of interest arises between our general partner and its affiliates (including the WPP Group on the one hand, and our partnership and our limited partners, on the other hand, the resolution of any such conflict or potential conflict is addressed as described under "—Conflicts of Interest."
138
Pursuant to our Code of Business Conduct and Ethics, conflicts of interest are prohibited as a matter of policy, except under guidelines approved by the Board and as provided in the Omnibus Agreement and our partnership agreement. For the year ended December 31, 2017, there were no transactions where such guidelines were not followed.
The Audit Committee of the Board of Directors of GP Natural Resource Partners LLC recommended and we engaged Ernst & Young LLP to audit our accounts and assist with tax work for fiscal 2017 and 2016. All of our audit, audit-related fees and tax services have been approved by the Audit Committee of our Board of Directors. The following table presents fees for professional services rendered by Ernst &Young LLP:
|
2017
|
2016
|
||||||
|
Audit Fees
(1)
|
$
|
1,049,905
|
|
$
|
1,010,002
|
|
|
|
Tax Fees
(2)
|
772,449
|
|
746,463
|
|
|||
|
All Other Fees
(3)
|
1,820
|
|
1,980
|
|
|||
|
(1)
|
Audit fees include fees associated with the annual integrated audit of our consolidated financial statements and internal controls over financial reporting, separate audits of subsidiaries and reviews of our quarterly financial statement for inclusion in our Form 10-Q and comfort letters; consents; work related to acquisitions; assistance with and review of documents filed with the SEC.
|
|
(2)
|
Tax fees include fees principally incurred for assistance with tax planning, compliance, tax return preparation and filing of Schedules K-1.
|
|
(3)
|
All other fees include the subscription to EY Online research tool.
|
Audit and Non-Audit Services Pre-Approval Policy
I. Statement of Principles
Under the Sarbanes-Oxley Act of 2002 (the "Act"), the Audit Committee of the Board of Directors is responsible for the appointment, compensation and oversight of the work of the independent auditor. As part of this responsibility, the Audit Committee is required to pre-approve the audit and non-audit services performed by the independent auditor in order to assure that they do not impair the auditor’s independence from the Partnership. To implement these provisions of the Act, the SEC has issued rules specifying the types of services that an independent auditor may not provide to its audit client, as well as the audit committee’s administration of the engagement of the independent auditor. Accordingly, the Audit Committee has adopted, and the Board of Directors has ratified, this Audit and Non-Audit Services Pre-Approval Policy (the "Policy"), which sets forth the procedures and the conditions pursuant to which services proposed to be performed by the independent auditor may be pre-approved.
The SEC’s rules establish two different approaches to pre-approving services, which the SEC considers to be equally valid. Proposed services may either be pre-approved without consideration of specific case-by-case services by the Audit Committee ("general pre-approval") or require the specific pre-approval of the Audit Committee ("specific pre-approval"). The Audit Committee believes that the combination of these two approaches in this Policy will result in an effective and efficient procedure to pre-approve services performed by the independent auditor. As set forth in this Policy, unless a type of service has received general pre-approval, it will require specific pre-approval by the Audit Committee if it is to be provided by the independent auditor. Any proposed services exceeding pre-approved cost levels or budgeted amounts will also require specific pre-approval by the Audit Committee.
For both types of pre-approval, the Audit Committee will consider whether such services are consistent with the SEC’s rules on auditor independence. The Audit Committee will also consider whether the independent auditor is best positioned to provide the most effective and efficient service for reasons such as its familiarity with our business, employees, culture, accounting systems, risk profile and other factors, and whether the service might enhance the Partnership’s ability to manage or control risk or improve audit quality. All such factors will be considered as a whole, and no one factor will necessarily be determinative.
139
The Audit Committee is also mindful of the relationship between fees for audit and non-audit services in deciding whether to pre-approve any such services and may determine, for each fiscal year, the appropriate ratio between the total amount of fees for audit, audit-related and tax services.
The appendices to this Policy describe the audit, audit-related and tax services that have the general pre-approval of the Audit Committee. The term of any general pre-approval is 12 months from the date of pre-approval, unless the Audit Committee considers a different period and states otherwise. The Audit Committee will annually review and pre-approve the services that may be provided by the independent auditor without obtaining specific pre-approval from the Audit Committee. The Audit Committee will add or subtract to the list of general pre-approved services from time to time, based on subsequent determinations.
The purpose of this Policy is to set forth the procedures by which the Audit Committee intends to fulfill its responsibilities. It does not delegate the Audit Committee’s responsibilities to pre-approve services performed by the independent auditor to management.
Ernst & Young LLP, our independent auditor has reviewed this Policy and believes that implementation of the policy will not adversely affect its independence.
II. Delegation
As provided in the Act and the SEC’s rules, the Audit Committee has delegated either type of pre-approval authority to Robert B. Karn III, the Chairman of the Audit Committee. Mr. Karn must report, for informational purposes only, any pre-approval decisions to the Audit Committee at its next scheduled meeting.
III. Audit Services
The annual Audit services engagement terms and fees will be subject to the specific pre-approval of the Audit Committee. Audit services include the annual financial statement audit (including required quarterly reviews), subsidiary audits and other procedures required to be performed by the independent auditor to be able to form an opinion on the Partnership’s consolidated financial statements. These other procedures include information systems and procedural reviews and testing performed in order to understand and place reliance on the systems of internal control, and consultations relating to the audit or quarterly review. Audit services also include the attestation engagement for the independent auditor’s report on management’s report on internal controls for financial reporting. The Audit Committee monitors the audit services engagement as necessary, but not less than on a quarterly basis, and approves, if necessary, any changes in terms, conditions and fees resulting from changes in audit scope, partnership structure or other items.
In addition to the annual audit services engagement approved by the Audit Committee, the Audit Committee may grant general pre-approval to other audit services, which are those services that only the independent auditor reasonably can provide. Other audit services may include statutory audits or financial audits for our subsidiaries or our affiliates and services associated with SEC registration statements, periodic reports and other documents filed with the SEC or other documents issued in connection with securities offerings.
IV. Audit-related Services
Audit-related services are assurance and related services that are reasonably related to the performance of the audit or review of the Partnership’s financial statements or that are traditionally performed by the independent auditor. Because the Audit Committee believes that the provision of audit-related services does not impair the independence of the auditor and is consistent with the SEC’s rules on auditor independence, the Audit Committee may grant general pre-approval to audit-related services. Audit-related services include, among others, due diligence services pertaining to potential business acquisitions/dispositions; accounting consultations related to accounting, financial reporting or disclosure matters not classified as "Audit Services"; assistance with understanding and implementing new accounting and financial reporting guidance from rulemaking authorities; financial audits of employee benefit plans; agreed-upon or expanded audit procedures related to accounting and/or billing records required to respond to or comply with financial, accounting or regulatory reporting matters; and assistance with internal control reporting requirements.
140
V. Tax Services
The Audit Committee believes that the independent auditor can provide tax services to the Partnership such as tax compliance, tax planning and tax advice without impairing the auditor’s independence, and the SEC has stated that the independent auditor may provide such services. Hence, the Audit Committee believes it may grant general pre-approval to those tax services that have historically been provided by the auditor, that the Audit Committee has reviewed and believes would not impair the independence of the auditor and that are consistent with the SEC’s rules on auditor independence. The Audit Committee will not permit the retention of the independent auditor in connection with a transaction initially recommended by the independent auditor, the sole business purpose of which may be tax avoidance and the tax treatment of which may not be supported in the Internal Revenue Code and related regulations. The Audit Committee will consult with the Chief Financial Officer or outside counsel to determine that the tax planning and reporting positions are consistent with this Policy.
VI. Pre-Approval Fee Levels or Budgeted Amounts
Pre-approval fee levels or budgeted amounts for all services to be provided by the independent auditor will be established annually by the Audit Committee. Any proposed services exceeding these levels or amounts will require specific pre-approval by the Audit Committee. The Audit Committee is mindful of the overall relationship of fees for audit and non-audit services in determining whether to pre-approve any such services. For each fiscal year, the Audit Committee may determine the appropriate ratio between the total amount of fees for audit, audit-related and tax services.
VII. Procedures
All requests or applications for services to be provided by the independent auditor that do not require specific approval by the Audit Committee will be submitted to the Chief Financial Officer and must include a detailed description of the services to be rendered. The Chief Financial Officer will determine whether such services are included within the list of services that have received the general pre-approval of the Audit Committee. The Audit Committee will be informed on a timely basis of any such services rendered by the independent auditor.
Requests or applications to provide services that require specific approval by the Audit Committee will be submitted to the Audit Committee by both the independent auditor and the Chief Financial Officer, and must include a joint statement as to whether, in their view, the request or application is consistent with the SEC’s rules on auditor independence.
141
(a)(1) and (2) Financial Statements and Schedules
See "Item 8. Financial Statements and Supplementary Data."
(a)(3) Ciner Wyoming LLC Financial Statements
The financial statements of Ciner Wyoming LLC required pursuant to Rule 3-09 of Regulation S-X are included in this filing as Exhibit 99.1.
(a)(4) Exhibits
|
Exhibit
Number
|
Description
|
142
|
Exhibit
Number
|
Description
|
143
|
Exhibit
Number
|
Description
|
144
|
Exhibit
Number
|
Description
|
145
|
Exhibit
Number
|
Description
|
|
101.INS*
|
XBRL Instance Document
|
|
101.SCH*
|
XBRL Taxonomy Extension Schema Document
|
|
101.CAL*
|
XBRL Taxonomy Extension Calculation Linkbase Document
|
|
101.DEF*
|
XBRL Taxonomy Extension Definition Linkbase Document
|
|
101.LAB*
|
XBRL Taxonomy Extension Labels Linkbase Document
|
|
101.PRE*
|
XBRL Taxonomy Extension Presentation Linkbase Document
|
|
*
|
Filed herewith
|
|
**
|
Furnished herewith
|
|
***
|
Management compensatory plan or arrangement
|
146
SIGNATURES
Pursuant to the requirements of Section 13 or 15(d) of the Securities Exchange Act of 1934, the registrant has duly caused this report to be signed on its behalf by the undersigned, thereunto duly authorized.
|
NATURAL RESOURCE PARTNERS L.P.
|
|||
|
By:
|
NRP (GP) LP, its general partner
|
||
|
By:
|
GP NATURAL RESOURCE
|
||
|
PARTNERS LLC, its general partner
|
|||
|
Date: March 1, 2018
|
|||
|
By:
|
|
/
s
/ CORBIN J. ROBERTSON, JR.
|
|
|
|
Corbin J. Robertson, Jr.
|
||
|
|
Chairman of the Board, Director and
|
||
|
|
Chief Executive Officer
|
||
|
|
(Principal Executive Officer)
|
||
|
Date: March 1, 2018
|
|||
|
By:
|
|
/
s
/ CHRISTOPHER J. ZOLAS
|
|
|
|
Christopher J. Zolas
|
||
|
|
Chief Financial Officer and
|
||
|
|
Treasurer
|
||
|
|
(Principal Financial Officer)
|
||
|
Date: March 1, 2018
|
|||
|
By:
|
|
/
s
/ JENNIFER L. ODINET
|
|
|
|
Jennifer L. Odinet
|
||
|
Chief Accounting Officer
|
|||
|
(Principal Accounting Officer)
|
|||
147
Pursuant to the requirements of the Securities Exchange Act of 1934, this report has been signed below by the following persons on behalf of the registrant and in the capacities and on the dates indicated.
|
Date: March 1, 2018
|
|
|
/
s
/ RUSSELL D. GORDY
|
|
|
Russell D. Gordy
|
|
|
Director
|
|
|
Date: March 1, 2018
|
|
|
/s/ JASVINDER S. KHAIRA
|
|
|
Jasvinder S. Khaira
|
|
|
Director
|
|
|
Date: March 1, 2018
|
|
|
/
s
/ S. REED MORIAN
|
|
|
S. Reed Morian
|
|
|
Director
|
|
|
Date: March 1, 2018
|
|
|
/
s
/ RICHARD A. NAVARRE
|
|
|
Richard A. Navarre
|
|
|
Director
|
|
|
Date: March 1, 2018
|
|
|
/
s
/ CORBIN J. ROBERTSON III
|
|
|
Corbin J. Robertson III
|
|
|
Director
|
|
|
Date: March 1, 2018
|
|
|
/
s
/ STEPHEN P. SMITH
|
|
|
Stephen P. Smith
|
|
|
Director
|
|
|
Date: March 1, 2018
|
|
|
/
s
/ LEO A. VECELLIO, JR.
|
|
|
Leo A. Vecellio, Jr.
|
|
|
Director
|
|
148
TABLE OF CONTENTS
Part IItem 1A. Risk FactorsItem 1B. Unresolved Staff CommentsItem 3. Legal ProceedingsItem 4. Mine Safety DisclosuresPart IIItem 5. Market For Registrant's Common Equity, Related Unitholder Matters and Issuer Purchases Of Equity SecuritiesItem 6. Selected Financial DataItem 7. Management's Discussion and Analysis Of Financial Condition and Results Of OperationsItem 7A. Quantitative and Qualitative Disclosures About Market RiskItem 8. Financial Statements and Supplementary DataItem 9. Changes in and Disagreements with Accountants on Accounting and Financial DisclosureItem 9A. Controls and ProceduresItem 9B. Other InformationPart IIIItem 10. Directors and Executive Officers Of The Managing General Partner and Corporate GovernanceItem 11. Executive CompensationItem 12. Security Ownership Of Certain Beneficial Owners and ManagementItem 13. Certain Relationships and Related Transactions, and Director IndependenceItem 14. Principal Accountant Fees and ServicesPart IVItem 15. Exhibits and Financial Statement Schedules