NATIONAL STORAGE AFFILIATES TRUST
10-Ks and 10-Qs
|
|
|
|
|
|
|
|
|
|
|
|
|
|
|
|
|
|
|
|
|
|
|
|
|
|
|
|
|
|
|
|
UNITED STATES
SECURITIES AND EXCHANGE COMMISSION
WASHINGTON, D.C. 20549
FORM 10-K
|
x
|
ANNUAL REPORT PURSUANT TO SECTION 13 OR 15(d) OF THE SECURITIES EXCHANGE ACT OF 1934
|
For the fiscal year ended
December 31, 2018
OR
|
¨
|
TRANSITION REPORT PURSUANT TO SECTION 13 OR 15(d) OF THE SECURITIES EXCHANGE ACT OF 1934
|
For the transition period from to
Commission file number: 001-37351
National Storage Affiliates Trust
(Exact name of Registrant as specified in its charter)
|
Maryland
|
46-5053858
|
|
|
(State or other jurisdiction of
incorporation or organization)
|
(I.R.S. Employer
Identification No.)
|
|
8400 East Prentice Avenue
9th Floor
Greenwood Village, Colorado 80111
(Address of principal executive offices) (Zip code)
(720) 630-2600
(Registrant's telephone number including area code)
|
Title of each Class
|
Name of Each Exchange on Which Registered
|
|
|
Common Shares of Beneficial Interest, $0.01 par value per share
|
New York Stock Exchange
|
|
|
Series A Cumulative Redeemable Preferred Shares of Beneficial Interest, par value $0.01 per share
|
New York Stock Exchange
|
|
Indicate by check mark if the registrant is a well-known seasoned issuer, as defined in Rule 405 of the Securities Act. Yes
☒
No
☐
Indicate by check mark if the registrant is not required to file reports pursuant to Section 13 or Section 15(d) of the Act. Yes
☐
No
☒
Indicate by check mark whether the registrant (1) has filed all reports required to be filed by Section 13 or 15(d) of the Securities Exchange Act of 1934 during the preceding 12 months (or for such shorter period that the registrant was required to file such reports), and (2) has been subject to such filing requirements for the past 90 days. Yes
☒
No
☐
Indicate by check mark whether the registrant has submitted electronically every Interactive Data File required to be submitted and posted pursuant to Rule 405 of Regulation S-T (§232.405 of this chapter) during the preceding 12 months (or for such shorter period that the registrant was required to submit such files). Yes
☒
No
☐
Indicate by check mark if disclosure of delinquent filers pursuant to Item 405 of Regulation S-K is not contained herein, and will not be contained, to the best of registrant's knowledge, in definitive proxy or information statements incorporated by reference in Part III of this Form 10-K or any amendment to this Form 10-K. Yes
☒
No
☐
Indicate by check mark whether the registrant is a large accelerated filer, an accelerated filer, a non-accelerated filer, or a smaller reporting company. See the definitions of "large accelerated filer," "accelerated filer" and "smaller reporting company" in Rule 12b-2 of the Exchange Act.
|
Large Accelerated Filer
|
☒
|
Accelerated Filer
|
☐
|
|
|
Non-accelerated Filer
|
☐
|
Smaller Reporting Company
|
☐
|
|
|
Emerging Growth Company
|
☐
|
|||
If an emerging growth company, indicate by check mark if the registrant has elected not to use the extended transition period for complying with any new or revised financial accounting standards provided pursuant to Section 13(a) of the Exchange Act.
☐
Indicate by check mark whether the registrant is a shell company (as defined in Rule 12b-2 of the Exchange Act). Yes
☐
No
☒
The aggregate market value of the voting and non-voting common shares of beneficial interest of National Storage Affiliates Trust held by non-affiliates of National Storage Affiliates Trust was approximately $1.6 billion as of June 30, 2018. As of February 25, 2019,
56,699,541
common shares of beneficial interest, $0.01 par value per share, were outstanding.
|
Documents Incorporated by Reference
|
Portions of the registrant's definitive proxy statement for its annual meeting of shareholders are incorporated by reference into Part III of this Annual Report on Form 10-K.
|
NATIONAL STORAGE AFFILIATES TRUST
|
||
|
TABLE OF CONTENTS
|
||
|
ANNUAL REPORT ON FORM 10-K
|
||
|
For the Fiscal Year Ended December 31, 2018
|
||
|
Item
|
Page
|
|
|
PART I
|
||
|
1.
|
Business
|
|
|
1A.
|
Risk Factors
|
|
|
1B.
|
Unresolved Staff Comments
|
|
|
2.
|
Properties
|
|
|
3.
|
Legal Proceedings
|
|
|
4.
|
Mine Safety Disclosures
|
|
|
PART II
|
||
|
5.
|
Market for the Registrant's Common Equity, Related Shareholder Matters and Issuer Purchases of Equity Securities
|
|
|
6.
|
Selected Financial Data
|
|
|
7.
|
Management's Discussion and Analysis of Financial Condition and Results of Operations
|
|
|
7A.
|
Quantitative and Qualitative Disclosures About Market Risk
|
|
|
8.
|
Financial Statements and Supplementary Data
|
|
|
9.
|
Changes in and Disagreements With Accountants on Accounting and Financial Disclosure
|
|
|
9A.
|
Controls and Procedures
|
|
|
9B.
|
Other Information
|
|
|
PART III
|
||
|
10.
|
Directors, Executive Officers and Corporate Governance
|
|
|
11.
|
Executive Compensation
|
|
|
12.
|
Security Ownership of Certain Beneficial Owners and Management and Related Stockholder Matters
|
|
|
13.
|
Certain Relationships and Related Transactions, and Director Independence
|
|
|
14.
|
Principal Accounting Fees and Services
|
|
|
PART IV
|
||
|
15.
|
Exhibits and Financial Statement Schedules
|
|
|
16.
|
Form 10-K Summary
|
|
3
FORWARD-LOOKING STATEMENTS
National Storage Affiliates Trust and its consolidated subsidiaries (the "Company", "NSA," "we," "our", and "us") make forward-looking statements in this report that are subject to risks and uncertainties. These forward-looking statements include information about possible or assumed future results of our business, financial condition, liquidity, results of operations, plans and objectives. When we use the words "believe," "expect," "anticipate," "estimate," "plan," "continue," "intend," "should," "may," or similar expressions, we intend to identify forward-looking statements.
The forward-looking statements contained in this report reflect our current views about future events and are subject to numerous known and unknown risks, uncertainties, assumptions, and changes in circumstances that may cause our actual results to differ significantly from those expressed in any forward-looking statement.
Statements regarding the following subjects, among others, may be forward-looking:
|
•
|
market trends in our industry, interest rates, the debt and lending markets or the general economy;
|
|
•
|
our business and investment strategy;
|
|
•
|
the acquisition of properties, including those under contract, and the ability of our acquisitions to achieve underwritten capitalization rates and our ability to execute on our acquisition pipeline;
|
|
•
|
the timing of acquisitions;
|
|
•
|
our relationships with, and our ability and timing to attract additional, participating regional operators ("PROs");
|
|
•
|
our ability to effectively align the interests of our PROs with us and our shareholders;
|
|
•
|
the integration of our PROs and their managed portfolios into the Company, including into our financial and operational reporting infrastructure and internal control framework;
|
|
•
|
our operating performance and projected operating results, including our ability to achieve market rents and occupancy levels, reduce operating expenditures and increase the sale of ancillary products and services;
|
|
•
|
our ability to access additional off-market acquisitions;
|
|
•
|
actions and initiatives of the U.S. federal, state and local government and changes to U.S. federal, state and local government policies and the execution and impact of these actions, initiatives and policies;
|
|
•
|
the state of the U.S. economy generally or in specific geographic regions, states, territories or municipalities;
|
|
•
|
economic trends and economic recoveries;
|
|
•
|
our ability to obtain and maintain financing arrangements on favorable terms;
|
|
•
|
general volatility of the securities markets in which we participate;
|
|
•
|
changes in the value of our assets;
|
|
•
|
projected capital expenditures;
|
|
•
|
the impact of technology on our products, operations, and business;
|
|
•
|
the implementation of our technology and best practices programs (including our ability to effectively implement our integrated Internet marketing strategy);
|
|
•
|
changes in interest rates and the degree to which our hedging strategies may or may not protect us from interest rate volatility;
|
|
•
|
impact of and changes in governmental regulations, tax law and rates, accounting guidance and similar matters;
|
|
•
|
our ability to continue to qualify and maintain our qualification as a real estate investment trust for U.S. federal income tax purposes ("REIT");
|
|
•
|
availability of qualified personnel;
|
|
•
|
the timing of conversions of each series of Class B common units of limited partner interest ("subordinated performance units") in NSA OP, LP (our "operating partnership") and subsidiaries of our operating
|
4
partnership into Class A common units of limited partner interest ("OP units") in our operating partnership, the conversion ratio in effect at such time and the impact of such convertibility on our diluted earnings (loss) per share;
|
•
|
the risks of investing through joint ventures, including whether the anticipated benefits from a joint venture are realized or may take longer to realize than expected;
|
|
•
|
estimates relating to our ability to make distributions to our shareholders in the future; and
|
|
•
|
our understanding of our competition.
|
The forward-looking statements are based on our beliefs, assumptions and expectations of our future performance, taking into account all information currently available to us. Forward-looking statements are not predictions of future events. These beliefs, assumptions, and expectations can change as a result of many possible events or factors, not all of which are known to us. Readers should carefully review our financial statements and the notes thereto, as well as the sections entitled "Business," "Risk Factors," "Properties," and "Management's Discussion and Analysis of Financial Condition and Results of Operations," described in Item 1, Item 1A, Item 2 and Item 7, respectively, of this Annual Report on Form 10-K and the other documents we file from time to time with the Securities and Exchange Commission. If a change occurs, our business, financial condition, liquidity and results of operations may vary materially from those expressed in our forward-looking statements. Any forward-looking statement speaks only as of the date on which it is made. New risks and uncertainties arise over time, and it is not possible for us to predict those events or how they may affect us. Except as required by law, we are not obligated to, and do not intend to, update or revise any forward-looking statements, whether as a result of new information, future events or otherwise.
PART I
Item 1. Business
General
National Storage Affiliates Trust is a fully integrated, self-administered and self-managed real estate investment trust organized in the state of Maryland on May 16, 2013. We have elected and we believe that we have qualified to be taxed as a REIT for U.S. federal income tax purposes commencing with our taxable year ended December 31, 2015. We serve as the sole general partner of our operating partnership subsidiary, NSA OP, LP (our "operating partnership"), a Delaware limited partnership formed on February 13, 2013 to conduct our business, which is focused on the ownership, operation, and acquisition of self storage properties located within the top 100 metropolitan statistical areas ("MSAs") throughout the United States. As of
December 31, 2018
, we held ownership interests in and operated a geographically diversified portfolio of
675
self storage properties, located in 34 states and Puerto Rico, comprising approximately
43.0 million
rentable square feet, configured in approximately
345,000
storage units. According to the 2019 Self-Storage Almanac, we are the fifth largest owner and operator of self storage properties in the United States based on number of properties, self storage units, and rentable square footage. We completed our initial public offering in 2015 and our common shares are listed on the New York Stock Exchange under the symbol "NSA."
Our chairman and chief executive officer, Arlen D. Nordhagen, co-founded SecurCare Self Storage, Inc. in 1988 to invest in and manage self storage properties. While growing SecurCare to over 150 self storage properties, Mr. Nordhagen recognized a market opportunity for a differentiated public self storage REIT that would leverage the benefits of national scale by integrating multiple experienced regional self storage operators with local operational focus and expertise. We believe that his vision, which is the foundation of the Company, aligns the interests of our participating regional operators ("PROs"), with those of our public shareholders by allowing our PROs to participate alongside our shareholders in our financial performance and the performance of our PROs' "managed portfolios", which means, with respect to each PRO, the portfolio of properties that such PRO manages on our behalf. A key component of this strategy is to capitalize on the local market expertise and knowledge of regional self storage operators by maintaining the continuity of their roles as property managers.
We believe that our structure creates the right financial incentives to accomplish these objectives. We require our PROs to exchange the self storage properties they contribute to the Company for a combination of OP units and subordinated performance units in our operating partnership or subsidiaries of our operating partnership that issue units intended to be economically equivalent to the OP units and subordinated performance units issued by our operating partnership ("DownREIT partnerships"). OP units, which are economically equivalent to our common shares, create alignment with the performance of the Company as a whole. Subordinated performance units, which are linked to the performance of specific managed portfolios, incentivize our PROs to drive operating performance and support the
5
sustainability of the operating cash flow generated by the self storage properties that they manage on our behalf. Because subordinated performance unit holders receive distributions only after portfolio-specific minimum performance thresholds are satisfied, subordinated performance units play a key role in aligning the interests of our PROs with us and our shareholders. Our structure thus offers PROs a unique opportunity to serve as regional property managers for their managed portfolios and directly participate in the potential upside of those properties while simultaneously diversifying their investment to include a broader portfolio of self storage properties. We believe our structure provides us with a competitive growth advantage over self storage companies that do not offer property owners the ability to participate in the performance and potential future growth of their managed portfolios.
We believe that our national platform has significant potential for continued external and internal growth. We seek to further expand our platform by continuing to recruit additional established self storage operators as well as opportunistically partnering with institutional funds and other institutional investors in strategic joint venture arrangements while integrating our operations through the implementation of centralized initiatives, including management information systems, revenue enhancement, and cost optimization programs. We are currently engaged in preliminary discussions with additional self storage operators and believe that we could add one to three PROs in addition to the ten PROs we have currently identified, which will enhance our existing geographic footprint and allow us to enter regional markets in which we currently have limited or no market share.
Our PROs
The Company had
eight
PROs as of
December 31, 2018
: SecurCare Self Storage, Inc. and its controlled affiliates ("SecurCare"), Kevin Howard Real Estate Inc., d/b/a Northwest Self Storage and its controlled affiliates ("Northwest"), Optivest Properties LLC and its controlled affiliates ("Optivest"), Guardian Storage Centers LLC and its controlled affiliates ("Guardian"), Move It Self Storage and its controlled affiliates ("Move It"), Arizona Mini Storage Management Company d/b/a Storage Solutions and its controlled affiliates ("Storage Solutions"), Hide-Away Storage Services, Inc. and its controlled affiliates ("Hide-Away") and an affiliate of Shader Brothers Corporation d/b/a Personal Mini Storage ("Personal Mini").
In October 2018, we entered into definitive agreements with affiliates of Southern Self Storage, LLC d/b/a Southern Self Storage of Palm Beach Gardens, Florida, to add Southern Self Storage ("Southern") as our ninth PRO. In January 2019, we completed the initial contribution transaction with Southern, which included the acquisition of six self storage properties by us. In addition, in February 2019, we entered into definitive agreements with affiliates of Investment Real Estate Management, LLC d/b/a Moove In Self Storage of York, Pennsylvania to add Moove In Self Storage ("Moove In") as our tenth PRO. Moove In is led by John Gilliland, a past Chairman of the national Self Storage Association. Moove In currently owns 19 self storage properties in Pennsylvania, Maryland, New Jersey, and New York. Upon closing, Moove In intends to contribute six self storage properties to us as part of the initial contribution transaction, and its remaining properties will be added to our captive pipeline. We expect the initial contribution transaction and related closing documentation, including the entry into a facilities portfolio management agreement, to close during the first quarter of 2019, subject to customary closing conditions.
To capitalize on their recognized and established local brands, our PROs continue to function as property managers for their managed portfolios under their existing brands (which include various brands in addition to those discussed below). Over the long-run, we may seek to brand or co-brand each location as part of NSA.
|
•
|
SecurCare, which is headquartered in Lone Tree, Colorado, has been operating since 1988 and is one of our PROs responsible for covering the west, mountain, midwest and southeast regions. SecurCare provided property management services to 207 of our properties located in California, Colorado, Florida, Georgia, Indiana, Kentucky, Louisiana, Mississippi, North Carolina, Ohio, Oklahoma, South Carolina and Texas as of
December 31, 2018
. SecurCare is currently managed by David Cramer, who has worked in the self storage industry for more than 20 years.
|
|
•
|
Northwest, which is headquartered in Portland, Oregon, is our PRO responsible for covering the northwest region. Northwest provided property management services to 75 of our properties located in Oregon and Washington as of
December 31, 2018
. Northwest is run by Kevin Howard, one of our trustees, who founded the company over 30 years ago and is recognized in the industry for his successful track record as a self storage specialist in the areas of design and development, operations and property management, consultation, and brokerage.
|
|
•
|
Optivest, which is based in Dana Point, California, is one of our PROs responsible for covering portions of the northeast and southwest regions. Optivest managed 57 of our properties located in Arizona, California,
|
6
Massachusetts, Nevada, New Hampshire, New Mexico and Texas as of
December 31, 2018
. Optivest is run by its co-founder, Warren Allan, who has more than 25 years of financial and operational management experience in the self storage industry and is recognized as a self storage acquisition and development specialist.
|
•
|
Guardian, which is based in Irvine, California, is one of our PROs responsible for covering portions of the southern California and southwest regions. Guardian managed 54 of our properties located in California, Arizona and Nevada as of
December 31, 2018
. Guardian is led by John Minar, who has nearly 40 years of self storage acquisition, rehabilitation, ownership, operations and development experience.
|
|
•
|
Move It, which is based in Dallas, Texas, is one of our PROs responsible for covering portions of the Texas and southeast markets. Move It managed 29 of our properties located in Alabama, Florida, Louisiana, Mississippi and Texas as of
December 31, 2018
. Move It is led by its founder, Tracy Taylor, who has more than 40 years of experience in self storage development, acquisition and management, and is currently on the board of directors for the Large Owners Council of the Self Storage Association and is a former Chairman of the national Self Storage Association.
|
|
•
|
Storage Solutions, which is based in Chandler, Arizona, is our PRO responsible for covering portions of the Arizona and Nevada markets. Storage Solutions managed 10 of our properties in Arizona and Nevada as of
December 31, 2018
. Storage Solutions is led by its founder, Bill Bohannan, who is one of the largest operators in Phoenix and has more than 35 years of self storage acquisition, development and management experience. Mr. Bohannan is recognized in the industry as a self storage acquisition, development and management specialist.
|
|
•
|
Hide-Away, which is based in Sarasota, Florida, is our PRO responsible for covering the western Florida market. Hide-Away managed 21 of our properties in western Florida as of
December 31, 2018
. Hide-Away is led by its founder, Steve Wilson, one of the early developers of the self storage business, who served for more than 35 years as the President of Hide-Away and its related entities, and is a former Chairman of the national Self-Storage Association.
|
|
•
|
Personal Mini, which is based in Orlando, Florida, is our PRO responsible for covering portions of the central Florida market. Personal Mini managed seven of our properties in central Florida as of
December 31, 2018
. Personal Mini is led by Marc Smith, an active self storage investor who has been involved in all facets of the self storage business. Mr. Smith is a past Chairman of the Self Storage Association, and also previously served as president of the Southeast Region of the Self Storage Association.
|
|
•
|
Southern, which is based in Palm Beach Gardens, Florida, is our PRO responsible for covering portions of the southeast region, including New Orleans, the Florida Panhandle, and southern Georgia, and Puerto Rico. Southern is led by Bob McIntosh and Peter Cowie, who are active real estate operators with more than 30 years of self storage experience. At the beginning of 2019, Southern contributed six of its nine self storage properties to us as part of the initial contribution transaction. As part of its initial contribution, Southern also co-invested sufficient subordinated equity to manage our six properties located in Puerto Rico as well as an additional 11 properties in Louisiana that we acquired in January 2019.
|
We benefit from the local market knowledge and active presence of our PROs, allowing us to build and foster important customer and industry relationships. These local relationships provide attractive off-market acquisition opportunities that we believe will continue to fuel additional external growth.
We believe our structure allows our PROs to optimize their established property management platforms while addressing financial and operational hurdles. Before joining us, our PROs faced challenges in securing low cost capital and had to manage multiple investors and lending relationships, making it difficult to compete with larger competitors, including public REITs, for acquisition and investment opportunities. Our PROs were also limited in their ability to raise growth capital through the sale of assets, a portfolio refinancing, or capital contributions from new equity partners. Serving as our on-the-ground acquisition teams, our PROs now have access to our broader financing sources and lower cost of capital, while our national platform allows them to benefit from our economies of scale to drive operating efficiencies in a rapidly evolving, technology-driven industry.
7
Our Consolidated Properties
We seek to own properties that are well located in high quality sub-markets with highly accessible street access and attractive supply and demand characteristics, providing our properties with strong and stable cash flows that are less sensitive to the fluctuations of the general economy. Many of these markets have multiple barriers to entry against increased supply, including zoning restrictions against new construction and new construction costs that we believe are higher than our properties' fair market value. As of
December 31, 2018
, we owned a geographically diversified portfolio of
499
self storage properties, located in
26
states and Puerto Rico, comprising approximately
30.4 million
rentable square feet, configured in approximately
242,000
storage units. Of these properties, 247 were acquired by us from our PROs and 252 were acquired by us from third-party sellers. A complete listing of, and additional information about, our self storage properties is included in Item 2 of this report.
During the
year
ended
December 31, 2018
, we acquired
57
consolidated self storage properties and an expansion project adjacent to an existing property, of which four were acquired by us from our PROs and 53 were acquired by us from third-party sellers. The following is a summary of our 2018 consolidated acquisition activity (dollars in thousands):
|
Number of
|
Number of
|
Rentable
|
|||||||||||
|
State/Territory
|
Properties
|
Units
|
Square Feet
|
Fair Value
|
|||||||||
|
2018 Acquisitions:
|
|||||||||||||
|
Arizona
|
13
|
|
6,943
|
|
758,623
|
|
$
|
74,168
|
|
||||
|
Kansas
|
13
|
|
4,443
|
|
548,415
|
|
59,876
|
|
|||||
|
Florida
|
5
|
|
2,893
|
|
322,111
|
|
32,483
|
|
|||||
|
Missouri
|
4
|
|
2,000
|
|
235,300
|
|
28,175
|
|
|||||
|
North Carolina
|
4
|
|
2,296
|
|
285,975
|
|
39,596
|
|
|||||
|
California
|
2
|
|
895
|
|
102,207
|
|
15,741
|
|
|||||
|
Nevada
|
2
|
|
837
|
|
108,065
|
|
11,172
|
|
|||||
|
Oregon
|
2
|
|
486
|
|
63,805
|
|
8,137
|
|
|||||
|
Texas
|
2
|
|
956
|
|
125,087
|
|
9,549
|
|
|||||
|
Other
(1)
|
10
|
|
6,411
|
|
662,175
|
|
77,752
|
|
|||||
|
Total
|
57
|
|
28,160
|
|
3,211,763
|
|
356,649
|
|
|||||
|
(1) Self storage properties in other states and territories acquired during the year ended December 31, 2018 include Georgia, Maryland, Ohio, Washington, and Puerto Rico.
|
|||||||
During the year ended December 31, 2018, we sold
two
self storage properties to unrelated third parties for
$5.5 million
. The self storage properties comprised approximately
0.1 million
rentable square feet configured in approximately 1,500 storage units.
During the
year
ended
December 31, 2017
, we acquired 65 consolidated self storage properties, of which 10 were acquired by us from our PROs and 55 were acquired by us from third-party sellers. The following is a summary of our
2017
consolidated acquisition activity (dollars in thousands):
|
Number of
|
Number of
|
Rentable
|
|||||||||||
|
State
|
Properties
|
Units
|
Square Feet
|
Fair Value
|
|||||||||
|
2017 Acquisitions:
|
|||||||||||||
|
Georgia
|
13
|
|
6,836
|
|
934,780
|
|
$
|
84,631
|
|
||||
|
Florida
|
8
|
|
4,774
|
|
520,728
|
|
61,955
|
|
|||||
|
Texas
|
7
|
|
3,180
|
|
475,134
|
|
36,930
|
|
|||||
|
Nevada
|
5
|
|
2,640
|
|
311,547
|
|
35,446
|
|
|||||
|
California
|
4
|
|
2,194
|
|
304,504
|
|
36,547
|
|
|||||
|
Illinois
|
4
|
|
1,992
|
|
270,911
|
|
17,252
|
|
|||||
|
Louisiana
|
4
|
|
1,806
|
|
229,259
|
|
18,982
|
|
|||||
|
Kansas
|
3
|
|
1,297
|
|
215,035
|
|
20,558
|
|
|||||
|
Missouri
|
3
|
|
1,013
|
|
152,889
|
|
13,346
|
|
|||||
8
|
Number of
|
Number of
|
Rentable
|
|||||||||||
|
State
|
Properties
|
Units
|
Square Feet
|
Fair Value
|
|||||||||
|
Oregon
|
3
|
|
1,135
|
|
139,492
|
|
26,334
|
|
|||||
|
Indiana
|
2
|
|
950
|
|
127,570
|
|
11,665
|
|
|||||
|
Maryland
|
2
|
|
1,167
|
|
120,773
|
|
10,939
|
|
|||||
|
Other
(1)
|
7
|
|
3,208
|
|
419,907
|
|
52,215
|
|
|||||
|
Total
|
65
|
|
32,192
|
|
4,222,529
|
|
$
|
426,800
|
|
||||
|
(1) Self storage properties in other states acquired during the year ended December 31, 2017 include Arizona, Colorado, Massachusetts, New Hampshire, North Carolina, Virginia and Washington.
|
|||||||
During the year ended December 31, 2017, we sold three self storage properties to unrelated third parties and excess land parcels adjacent to our self storage properties for $17.8 million. The self storage properties comprised approximately 0.2 million rentable square feet configured in approximately 1,200 storage units.
Our Unconsolidated Real Estate Ventures
We seek to opportunistically partner with institutional funds and other institutional investors to acquire attractive portfolios utilizing a promoted return structure. We believe there is significant opportunity for continued external growth by partnering with institutional investors seeking to deploy capital in the self storage industry.
2018 Joint Venture
During the year ended December 31, 2018, we formed the 2018 Joint Venture (as defined in Note 5 to the consolidated financial statements in Item 8), in which we have a 25% ownership interest, with an affiliate of Heitman America Real Estate REIT LLC. In September 2018, the 2018 Joint Venture completed the acquisition of a portfolio of 112 self storage properties located across 17 states and Puerto Rico, consisting of approximately 8.2 million rentable square feet configured in over 68,000 storage units for an aggregate purchase price of approximately $1.325 billion (the "Portfolio").
Immediately following the closing of the acquisition, the 2018 Joint Venture distributed
six
self storage properties located in Puerto Rico and a single self storage property located in Ohio acquired as part of the Portfolio to our consolidated portfolio in exchange for a
$64.2 million
cash contribution from NSA. In addition,
two
of the properties acquired as part of the Portfolio were combined with other properties for operational efficiency. As of
December 31, 2018
, our 2018 Joint Venture owned and operated
103
properties containing approximately
7.6 million
rentable square feet, configured in approximately
63,000
storage units and located across
17
states.
2016 Joint Venture
As of
December 31, 2018
, our 2016 Joint Venture (as defined in Note 5 to the consolidated financial statements in Item 8), in which we have a 25% ownership interest, owned and operated a portfolio of
73
properties containing approximately
4.9 million
rentable square feet, configured in approximately
40,000
storage units and located across
14
states.
During the
year
ended
December 31, 2018
, our 2016 Joint Venture acquired
three
self storage properties and an expansion project at an existing property for
$28.5 million
, comprising approximately 0.2 million rentable square feet, configured in approximately 1,300 storage units. During the
year
ended
December 31, 2018
, our 2016 Joint Venture sold to an unrelated third party
one
self storage property for
$9.3 million
, comprising approximately 0.2 million rentable square feet, configured in approximately 800 storage units.
Our Property Management Platform
Through our property management platform, we direct, manage and control the day-to-day operations and affairs of certain consolidated properties and our unconsolidated real estate ventures. We earn certain customary fees for managing and operating the properties in the unconsolidated real estate ventures and we facilitate tenant insurance and/or tenant warranty protection programs for tenants at these properties in exchange for half of all proceeds from such programs.
As of December 31, 2018, our property management platform managed and controlled 39 of our consolidated properties in select markets in California, Illinois, Kansas, Maryland, Missouri, Ohio, Virginia and Puerto Rico. As discussed above, in January 2019, Southern began managing our six properties located in Puerto Rico.
9
Our Competitive Strengths
We believe our unique PRO structure combined with our property management platform allows us to differentiate ourselves from other self storage operators, and the following competitive strengths enable us to effectively compete against our industry peers:
High Quality Properties in Key Growth Markets.
We held ownership interests in and operated a geographically diversified portfolio of
675
self storage properties, located in 34 states and Puerto Rico, comprising approximately
43.0 million
rentable square feet, configured in approximately
345,000
storage units as of
December 31, 2018
. Over 75% of our consolidated portfolio is located in the top 100 MSAs, based on our
2018
net operating income ("NOI"). We believe that these properties are primarily located in high quality growth markets that have attractive supply and demand characteristics and are less sensitive to the fluctuations of the general economy. Many of these markets have multiple barriers to entry against increased supply, including zoning restrictions against new construction and new construction costs that we believe are higher than our properties' fair market value. Furthermore, we believe that our significant size and the overall geographic diversification of our portfolio reduces risks associated with specific local or regional economic downturns or natural disasters.
Differentiated, Growth-Oriented Strategy Focused on Established Operators.
We are a self storage REIT with a unique structure that supports our differentiated external growth strategy. Our structure appeals to operators who are looking for access to growth capital while maintaining an economic stake in the self storage properties that each manages on the Company's behalf. These attributes entice operators to join the Company rather than sell their properties for cash consideration. Our strategy is to attract operators who are confident in the future performance of their properties and desire to participate in the growth of the Company. We have successfully recruited established operators across the United States with a history of efficient property management and a track record of successful acquisitions. Our structure and differentiated strategy have enabled us to build a substantial captive pipeline from existing operators as well as potentially create external growth from the recruitment of additional PROs.
Integrated Platform Utilizing Advanced Technology for Enhanced Operational Performance and Best Practices.
Our national platform allows us to capture cost savings through integration and centralization, thereby eliminating redundancies and utilizing economies of scale across the property management platforms of our PROs. As compared to a stand-alone operator, our national platform has greater access to lower-cost capital, reduced Internet marketing costs per customer lead, discounted property insurance expense, and reduced overhead costs. In addition, the Company has sufficient scale for various centralized functions, including financial reporting, the operation of call centers, expanding cell tower leasing, a national credit card processing program, marketing, information technology, legal support, and capital market functions, to achieve substantial cost savings over smaller, individual operators.
Our national platform utilizes advanced technology for our data warehouse program, Internet marketing, our centralized call centers, financial and property analytic dashboards, revenue optimization analytics and expense management tools to enhance operational performance. These centralized programs, which are run through our Technology and Best Practices Group, are positively impacting our business performance, and we believe that they will continue to be a driver of organic growth going forward. We will utilize our Technology and Best Practices Group to help us benefit from the collective sharing of key operating strategies among our PROs in areas like human resource management, local marketing and operating procedures and building tenant insurance-related arrangements.
Aligned Incentive Structure with Shareholder Downside Protection.
Our structure promotes operator accountability as subordinated performance units issued to our PROs in exchange for the contribution of their properties are entitled to distributions only after those properties satisfy minimum performance thresholds. In the event of a material reduction in operating cash flow, distributions on our subordinated performance units will be reduced before or disproportionately to distributions on our common shares held by our common shareholders. In addition, we expect our PROs will generally co-invest subordinated equity in the form of subordinated performance units in each acquisition that they source from a third-party seller, and the value of these subordinated performance units will fluctuate with the performance of their managed portfolios. Therefore, our PROs are incentivized to select acquisitions that are expected to exceed minimum performance thresholds, thereby increasing the value of their subordinated equity stake. We expect that our shareholders will benefit from the higher levels of property performance that our PROs are incentivized to deliver.
10
Our Business and Growth Strategies
By capitalizing on our competitive strengths, we seek to increase scale, achieve optimal revenue-producing occupancy and rent levels, and increase long-term shareholder value by achieving sustainable long-term growth. Our business and growth strategies to achieve these objectives are as follows:
Maximize Property Level Cash Flow.
We strive to maximize the cash flows at our properties by leveraging the economies of scale provided by our national platform, including through the implementation of new ideas derived from our Technology and Best Practices Group. We believe that our unique PRO structure, centralized infrastructure and efficient national platform will enable us to achieve optimal market rents and occupancy, reduce operating expenses and increase the sale by our PROs of ancillary products and services, including tenant insurance, of which we receive a portion of the proceeds, truck rentals and packing supplies.
Acquire Built-in Captive Pipeline of Target Properties from Existing PROs.
We have an attractive, high quality potential acquisition pipeline (our "captive pipeline") of over 100 self storage properties valued at over $900 million that will continue to drive our future growth. We consider a property to be in our captive pipeline if it (i) is under a management service agreement with one of our PROs, (ii) meets our property quality criteria, and (iii) is either required to be offered to us under the applicable facilities portfolio management agreement or a PRO has a reasonable basis to believe that the controlling owner of the property intends to sell the property in the next seven years.
Our PROs have management service agreements with all of the properties in our captive pipeline and hold controlling and non-controlling ownership interests in some of these properties. With respect to each property in our captive pipeline in which a PRO holds a controlling ownership interest, such PRO has agreed that it will not transfer (or permit the transfer of, to the extent possible) any interest in such self storage property without first offering or causing to be offered (if permissible) such interest to us. In addition, upon maturity of the outstanding mortgage indebtedness encumbering such property, so long as occupancy is consistent with or exceeds average local market levels, which we determine in our sole discretion, such PRO has agreed to offer or cause to be offered (if permissible) such interest to us. With respect to captive pipeline properties in which our PROs have a non-controlling ownership interest or no ownership interest, each PRO has agreed to use commercially reasonable good faith efforts to facilitate our purchase of such property. We preserve the discretion to accept or reject any of the properties that our PROs are required to, or elect to, offer (or cause to be offered) to us.
Access Additional Off-Market Acquisition Opportunities.
Our PROs and their "on-the-ground" personnel have established an extensive network of industry relationships and contacts in their respective markets. Through these local connections, our PROs are able to access acquisition opportunities that are not publicly marketed or sold through auctions. Our structure incentivizes our PROs to source acquisitions in their markets from third-party sellers and consolidate these properties into the Company. Other public self storage companies generally have acquisition teams located at their central offices, which in many instances are far removed from regional and local markets. We believe our operators' networks and close familiarity with the other operators in their markets provide us clear competitive advantages in identifying and selecting attractive acquisition opportunities. Our PROs have sourced 252 acquisitions from third-party sellers comprising approximately 17.0 million rentable square feet as of
December 31, 2018
.
Recruit Additional New PROs in Target Markets.
We intend to continue to execute on our external growth strategy through additional acquisitions and contributions from future PROs in key markets. We believe there is significant opportunity for growth through consolidation of the highly fragmented composition of the market. We believe that future operators will be attracted to our unique structure, providing them with lower cost of capital, better economies of scale, and greater operational and overhead efficiencies while preserving their existing property management platforms. We intend to add one to three additional PROs to complement our existing geographic footprint and to achieve our goal of creating a highly diversified nationwide portfolio of properties focused in the top 100 MSAs. When considering a PRO candidate, we consider various factors, including the size of the potential PRO's portfolio, the quality and location of its properties, its market exposure, its operating expertise, its ability to grow its business, and its reputation with industry participants.
Strategic Joint Venture Arrangements.
We intend to continue to opportunistically partner with institutional funds and other institutional investors to acquire attractive portfolios utilizing a promoted return structure. We believe there is significant opportunity for continued external growth by partnering with institutional investors seeking to deploy capital in the self storage industry. We intend to leverage our property management platform to provide property and asset management services for future strategic joint ventures, generating additional operating profits and third party fee income.
11
Our Financing Strategy
We expect to maintain a flexible approach in financing new property acquisitions. In general, we expect to fund our property acquisitions through a combination of borrowings under bank credit facilities (including term loans and revolving facilities), property-level debt, issuances of OP equity and public and private equity and debt issuances.
As of
December 31, 2018
, our unsecured credit facility provided for total borrowings of
$1.0 billion
, consisting of
five
components: (i) a revolving line of credit (the "Revolver") which provides for a total borrowing commitment up to
$400.0 million
, whereby we may borrow, repay and re-borrow amounts under the Revolver, (ii) a
$235.0 million
tranche A term loan facility (the "Term Loan A"), (iii) a
$155.0 million
tranche B term loan facility (the "Term Loan B"), (iv) a
$105.0 million
tranche C term loan facility (the "Term Loan C") and (v) a
$125.0 million
tranche D term loan facility (the "Term Loan D" and together with the Revolver, the Term Loan A, the Term Loan B, and Term Loan C, the "credit facility"). As of
December 31, 2018
, we had the entire amounts drawn on Term Loan A, Term Loan B, Term Loan C and Term Loan D and we had
$139.5 million
of outstanding borrowings under the Revolver, and the capacity to borrow an additional
$254.8 million
under the Revolver while remaining in compliance with the credit facility's financial covenants. As of
December 31, 2018
, we have an expansion option under the credit facility, which, if exercised in full, would provide for a total credit facility of
$1.3 billion
.
We also have a credit agreement with a syndicated group of lenders for a term loan facility that matures in June 2023 (the "2023 Term Loan Facility") and is separate from the credit facility in an aggregate amount of
$175.0 million
, which amount is outstanding. We have an expansion option under the 2023 Term Loan Facility, which, if exercised in full, would provide for total availability in an aggregate amount up to $400.0 million.
During the year ended December 31, 2018, we entered into a credit agreement with a lender for a term loan facility that matures in December 2028 (the "2028 Term Loan Facility") and is separate from the credit facility and 2023 Term Loan Facility in an aggregate amount of $75.0 million, which amount is outstanding. We have an expansion option under the 2028 Term Loan Facility, which, if exercised in full, would provide for total borrowings in an aggregate amount up to $125.0 million.
The credit facility, 2023 Term Loan Facility and 2028 Term Loan Facility each contain the same financial covenants and customary affirmative and negative covenants that, among other things, could limit the Company's ability to make distributions or certain investments, incur debt, incur liens and enter into certain transactions.
We expect to employ leverage in our capital structure in amounts determined from time to time by our board of trustees. Although our board of trustees has not adopted a policy which limits the total amount of indebtedness that we may incur, it will consider a number of factors in evaluating our level of indebtedness from time to time, as well as the amount of such indebtedness that will be either fixed and variable-rate, and in making financial decisions, including, among others, the following:
|
•
|
the interest rate of the proposed financing;
|
|
•
|
the extent to which the financing impacts our flexibility in managing our properties;
|
|
•
|
prepayment penalties and restrictions on refinancing;
|
|
•
|
the purchase price of properties we acquire with debt financing;
|
|
•
|
our long-term objectives with respect to the financing;
|
|
•
|
our target investment returns;
|
|
•
|
the ability of particular properties, and the Company as a whole, to generate cash flow sufficient to cover expected debt service payments;
|
|
•
|
overall level of consolidated indebtedness;
|
|
•
|
timing of debt maturities;
|
|
•
|
provisions that require recourse and cross-collateralization;
|
|
•
|
corporate credit ratios including debt service coverage, debt to total market capitalization and debt to undepreciated assets; and
|
|
•
|
the overall ratio of fixed- and variable-rate debt.
|
12
Our indebtedness may be recourse, non-recourse or cross-collateralized. If the indebtedness is non-recourse, the collateral will be limited to the particular properties to which the indebtedness relates. In addition, we may invest in properties subject to existing loans secured by mortgages or similar liens on our properties, or may refinance properties acquired on a leveraged basis. We may use the proceeds from any borrowings to refinance existing indebtedness, to refinance investments, including the redevelopment of existing properties, for general working capital or for other purposes when we believe it is advisable.
Dividend Reinvestment Plan
In the future, we may adopt a dividend reinvestment plan that will permit shareholders who elect to participate in the plan to have their cash dividends reinvested in additional common shares.
Regulation
General
Generally, self storage properties are subject to various laws, ordinances and regulations, including those relating to lien sale rights and procedures, public accommodations, insurance, and the environment. Changes in any of these laws, ordinances or regulations could increase the potential liability existing or created by tenants or others on our properties. Laws, ordinances, or regulations affecting development, construction, operation, upkeep, safety and taxation requirements may result in significant unanticipated expenditures, loss of self storage sites or other impairments to operations, which would adversely affect our cash flows from operating activities.
Under the Americans with Disabilities Act of 1990 ("the ADA"), all places of public accommodation are required to meet certain federal requirements related to access and use by disabled persons. For additional information on the ADA, see "Item 1A. Risk Factors—Risks Related to Our Business—Costs associated with complying with the ADA may result in unanticipated expenses."
Insurance activities are subject to state insurance laws and regulations as determined by the particular insurance commissioner for each state in accordance with the McCarran-Ferguson Act, as well as subject to the Gramm-Leach-Bliley Act and the privacy regulations promulgated by the Federal Trade Commission pursuant thereto.
Under the Comprehensive Environmental Response Compensation and Liability Act of 1980, as amended (the "CERCLA"), and comparable state laws, we may be required to investigate and remediate regulated hazardous materials at one or more of our properties. For additional information on environmental matters and regulation, see "Item 1A. Risk Factors—Risks Related to Our Business—Environmental compliance costs and liabilities associated with operating our properties may affect our results of operations."
Property management activities are often subject to state real estate brokerage laws and regulations as determined by the particular real estate commission for each state.
REIT Qualification
We have elected and we believe that we have qualified to be taxed as a REIT under the Internal Revenue Code of 1986, as amended, (the "Code"), commencing with our taxable year ended on December 31, 2015. We generally will not be subject to U.S. federal income tax on our net taxable income to the extent that we distribute annually all of our net taxable income to our shareholders and maintain our qualification as a REIT. We believe that we have been organized and have operated in conformity with the requirements for qualification and taxation as a REIT under the Code, and we expect that our intended manner of operation will enable us to continue to meet the requirements for qualification and taxation as a REIT. To qualify, and maintain our qualification, as a REIT, we must meet on a continuing basis, through our organization and actual investment and operating results, various requirements under the Code relating to, among other things, the sources of our gross income, the composition and values of our assets, our distribution levels and the diversity of ownership of our shares. If we fail to qualify as a REIT in any taxable year and do not qualify for certain statutory relief provisions, we will be subject to U.S. federal income tax at regular corporate rates and may be precluded from qualifying as a REIT for the subsequent four taxable years following the year during which we failed to qualify as a REIT. Even if we qualify for taxation as a REIT, we still may be subject to some U.S. federal, state and local taxes on our income or assets. In addition, subject to maintaining our qualification as a REIT, a portion of our business is conducted through, and a portion of our income is earned by, one or more taxable REIT subsidiaries ("TRSs"), which are subject to U.S. federal corporate income tax at regular rates. Distributions paid by us generally will not be eligible for taxation at the preferential U.S. federal income tax rates that currently apply to certain distributions received
13
by individuals from taxable corporations, unless such distributions are attributable to dividends received by us from a TRS.
Recent U.S. Federal Income Tax Legislation
On December 22, 2017, Congress enacted H.R. 1, also known as the Tax Cuts and Jobs Act of 2017 ("TCJA"). The TCJA made major changes to the Internal Revenue Code, including the reduction of the tax rates applicable to individuals and subchapter C corporations, a reduction or elimination of certain deductions (including new limitations on the deductibility of interest expense), permitting immediate expensing of capital expenditures and significant changes in the taxation of earnings from non-U.S. sources. The effect of the significant changes made by the TCJA is highly uncertain, and additional administrative guidance is still required in order to fully evaluate the effect of many provisions. Technical corrections or other amendments to the new rules, and additional administrative guidance interpreting these new rules, may be forthcoming at any time but may also be significantly delayed. While we do not currently expect this reform to have a significant impact to the Company's consolidated financial statements, stockholders are urged to consult with their tax advisors regarding the effects of the TCJA or other legislative, regulatory or administrative developments on an investment in the Company's common stock.
Competition
We compete with many other entities engaged in real estate investment activities for customers and acquisitions of self storage properties and other assets, including national, regional, and local owners, operators, and developers of self storage properties. We compete based on a number of factors including location, rental rates, security, suitability of the property's design to prospective tenants' needs, and the manner in which the property is operated and marketed. We believe that the primary competition for potential customers comes from other self storage properties within a three to five mile radius. We have positioned our properties within their respective markets as high-quality operations that emphasize tenant convenience, security, and professionalism.
We also may compete with numerous other potential buyers when pursuing a possible property for acquisition, which can increase the potential cost of a project. These competing bidders also may possess greater resources than us and therefore be in a better position to acquire a property. However, our use of OP units and subordinated performance units as transactional currency allows us to structure our acquisitions in tax-deferred transactions. As a result, potential targets who are tax-sensitive might favor us as a suitor.
Our primary national competitors in many of our markets for both tenants and acquisition opportunities include local and regional operators, institutional investors, private equity funds, as well as the other public self storage REITs, including Public Storage, Cubesmart, Extra Space Storage Inc. and Life Storage, Inc. These entities also seek financing through similar channels to the Company. Therefore, we will continue to compete for institutional investors in a market where funds for real estate investment may decrease.
Employees
As of
December 31, 2018
, the Company had 461 employees, which includes employees of our property management platform but does not include persons employed by our PROs. As of
December 31, 2018
, our PROs, collectively, had approximately
1,100
full-time and part-time employees involved in management, operations, and reporting with respect to our self storage property portfolio.
Available Information
We file registration statements, proxy statements, our Annual Report on Form 10-K, Quarterly Reports on Form 10-Q, Current Reports on Form 8-K, and all amendments to those statements and reports with the Securities and Exchange Commission (the "SEC"). Investors may obtain copies of these statements and reports by accessing the SEC's website at www.sec.gov. Our statements and reports and any amendments to any of those statements and reports that we file with the Securities and Exchange Commission are available free of charge as soon as reasonably practicable on our website at www.nationalstorageaffiliates.com. The information contained on our website is not incorporated into this Annual Report on Form 10-K. Our common shares are listed on the New York Stock Exchange under the symbol "NSA."
14
Item 1A. Risk Factors
An investment in our common shares involves a high degree of risk. Before making an investment decision, you should carefully consider the following risk factors, together with the other information contained in this Annual Report on Form 10-K. If any of the risks discussed in this Annual Report on Form 10-K occurs, our business, financial condition, liquidity and results of operations could be materially and adversely affected.
Risks Related to Our Business
Adverse economic or other conditions in the markets in which we do business and more broadly associated with the real estate industry could negatively affect our occupancy levels and rental rates and therefore our operating results and the value of our self storage properties.
Our operating results are dependent upon our ability to achieve optimal occupancy levels and rental rates at our self storage properties. Adverse economic or other conditions in the markets in which we do business, particularly in our markets in California, Oregon, Texas, Florida, Arizona, Georgia and North Carolina, which accounted for approximately 24%, 12%, 10%, 9%, 6%, 5% and 5%, respectively, of our total rental and other property-related revenues for the year ended
December 31, 2018
, may lower our occupancy levels and limit our ability to maintain or increase rents or require us to offer rental discounts. No single customer represented a significant concentration of our
2018
revenues. The following adverse developments, among others, in the markets in which we do business may adversely affect the operating performance of our properties:
|
•
|
business layoffs or downsizing, industry slowdowns, relocation of businesses and changing demographics;
|
|
•
|
periods of economic slowdown or recession, declining demand for self storage or the public perception that any of these events may occur;
|
|
•
|
local or regional real estate market conditions, such as competing properties or products, the oversupply of self storage, vacancies or changes in self storage space market rents, or a reduction in demand for self storage in a particular area; and
|
|
•
|
perceptions by prospective tenants of the safety, convenience and attractiveness of our properties and the neighborhoods in which they are located.
|
We are also susceptible to the effects of adverse macro-economic events and business conditions that can result in higher unemployment, shrinking demand for products, large-scale business failures and tight credit markets. Our results of operations are sensitive to changes in overall economic conditions that impact consumer spending, including discretionary spending, as well as to increased bad debts due to recessionary pressures. Adverse economic conditions affecting disposable consumer income, such as employment levels, business conditions, interest rates and the availability of financing, tax rates, fuel and energy costs, could reduce consumer spending or cause consumers to shift their spending to other products and services. A general reduction in the level of discretionary spending or shifts in consumer discretionary spending could adversely affect our growth and profitability. Our operating results and cash available for distribution could also be adversely impacted if we experience increased operating costs, including maintenance, insurance premiums and real estate taxes, whether due to economic conditions, government regulation or otherwise. In addition, our operating expenses, including taxes, insurance, maintenance and debt service payments, may not be reduced even if we experience a reduction in revenues, which may exacerbate the impact on our profitability.
We may not be successful in identifying and consummating suitable acquisitions, adding additional suitable new PROs, or integrating and operating such acquisitions, including integrating them into our financial and operational reporting infrastructure and internal control framework in a timely manner, which may impede our growth.
Our ability to expand through acquisitions is integral to our business strategy and requires us to identify suitable acquisition candidates or investment opportunities that meet our criteria and are compatible with our growth strategy. We may not be successful in identifying suitable properties or other assets that meet our acquisition criteria or in consummating acquisitions on satisfactory terms or at all. Failure to identify or consummate acquisitions will slow our growth, which could in turn adversely affect our share price.
For the potential acquisitions in our captive pipeline, we have not entered into negotiations with the respective owners of these properties and there can be no assurance as to whether we will acquire any of these properties or the actual timing of any such acquisitions. Each captive pipeline property is subject to additional due diligence and the determination by us to pursue the acquisition of the property. In addition, with respect to the captive pipeline properties
15
in which our PROs have a non-controlling ownership interest or no ownership interest, the current owner of each property is not required to offer such property to us and there can be no assurance that we will acquire these properties.
Our ability to acquire properties on favorable terms and successfully integrate and operate them, including integrating them into our financial and operational reporting infrastructure in a timely manner, may be constrained by the following significant risks:
|
•
|
we face competition from national (e.g., large public and private self storage companies, institutional investors and private equity funds), regional and local owners, operators and developers of self storage properties, which may result in higher property acquisition prices and reduced yields;
|
|
•
|
we may not be able to achieve satisfactory completion of due diligence investigations and other customary closing conditions;
|
|
•
|
we may fail to finance an acquisition on favorable terms or at all;
|
|
•
|
we may spend more time and incur more costs than budgeted to make necessary improvements or renovations to acquired properties;
|
|
•
|
we may experience difficulties in effectively integrating the financial and operational reporting systems of the properties or portfolios we acquire into (or supplanting such systems with) our financial and operational reporting infrastructure and internal control framework in a timely manner; and
|
|
•
|
we may acquire properties subject to liabilities without any recourse, or with only limited recourse, with respect to unknown liabilities such as liabilities for clean-up of undisclosed environmental contamination, tax liabilities, claims by persons dealing with the former owners of the properties and claims for indemnification by general partners, trustees, officers and others indemnified by the former owners of the properties. The sellers or contributors of properties may make limited representations and warranties to us about the properties and may agree to indemnify us for a certain period of time following the closing for breaches of those representations and warranties. However, any resulting liabilities identified may not fall within the scope or time frame covered by the indemnification, and we may be required to bear those liabilities, which may materially and adversely affect our operating results, financial condition and business.
|
We face competition for tenants.
We compete with many other entities engaged in real estate investment activities for tenants, including national, regional and local owners, operators and developers of self storage properties. Our primary national competitors for tenants in many of our markets are the large public and private self storage companies, institutional investors, and private equity funds. Actions by our competitors may decrease or prevent increases in the occupancy and rental rates, while increasing the operating expenses of our properties.
Rental revenues are significantly influenced by demand for self storage space generally, and a decrease in such demand would likely have a greater adverse effect on our rental revenues than if we owned a more diversified real estate portfolio.
Because our portfolio of properties consists primarily of self storage properties, we are subject to risks inherent in investments in a single industry. A decrease in the demand for self storage space would have a greater adverse effect on our rental revenues than if we owned a more diversified real estate portfolio. Demand for self storage space has been and could be adversely affected by weakness in the national, regional and local economies, changes in supply of, or demand for, similar or competing self storage properties in an area and the excess amount of self storage space in a particular market. To the extent that any of these conditions occur, they are likely to affect market rents for self storage space, which could cause a decrease in our rental revenue. Any such decrease could impair our operating results, ability to satisfy debt service obligations and ability to make cash distributions to our shareholders.
Increases in taxes and regulatory compliance costs may reduce our income and adversely impact our cash flows.
Increases in income or other taxes generally are not passed through to tenants under leases and may reduce our net income, funds from operations ("FFO"), cash flows, financial condition, ability to pay or refinance our debt obligations, ability to make cash distributions to shareholders, and the trading price of our securities. Similarly, changes in laws increasing the potential liability for environmental conditions existing on properties or increasing the restrictions on discharges or other conditions may result in significant unanticipated expenditures, which could result in similar adverse effects.
16
Many states and jurisdictions are facing severe budgetary problems. Action that may be taken in response to these problems, such as changes to sales taxes or other governmental efforts, including mandating medical insurance for employees, could adversely impact our business and results of operations.
Our property taxes could increase due to various reasons, including a reassessment as a result of our contribution transactions, which could adversely impact our operating results and cash flow.
The value of our properties may be reassessed for property tax purposes by taxing authorities including as a result of our acquisition and contribution transactions. Accordingly, the amount of property taxes we pay in the future may increase substantially from what we have paid in the past or from what we expected in connection with our underwriting activities. If the property taxes we pay increase, our operating results and cash flow would be adversely impacted, and our ability to pay any expected dividends to our shareholders could be adversely affected.
Our storage leases are relatively short-term in nature, which exposes us to the risk that we may have to re-lease our units and we may be unable to do so on attractive terms, on a timely basis or at all.
Our storage leases are relatively short-term in nature, typically month-to-month, which exposes us to the risk that we may have to re-lease our units frequently and we may be unable to do so on attractive terms, on a timely basis or at all. Because these leases generally permit the tenant to leave at the end of the month without penalty, our revenues and operating results may be impacted by declines in market rental rates more quickly than if our leases were for longer terms. In addition, any delay in re-leasing units as vacancies arise would reduce our revenues and harm our operating results.
Security breaches through cyber-attacks, cyber-intrusions, or other methods could disrupt our information technology networks and related systems.
We and our PROs are increasingly dependent upon automated information technology processes and Internet commerce, and many of our and their tenants come from the telephone or over the Internet. Moreover, the nature of our and our PROs' business involves the receipt and retention of certain personal information about such tenants. In many cases, we and our PROs also rely significantly on third-party vendors to retain data, process transactions and provide other systems services. Our networks and operations could be disrupted, and sensitive data could be compromised, by physical or electronic security breaches, targeted against us, our PROs, our vendors or other organizations, including financial markets or institutions, including by way of or through cyber-attacks or cyber-intrusions over the Internet, malware, computer viruses, attachments to e-mails, phishing, employee theft or misuse, or inadequate security controls. Although we make efforts to protect the security and integrity of our networks and systems, there can be no assurance that these efforts and measures will be effective or that attempted security breaches or disruptions would not be successful, as such attacks and breaches may be difficult to detect (or not detected at all) and are becoming more sophisticated. In such event, we may experience business interruptions; data loss, ransom, misappropriation, or corruption; theft or misuse of confidential or proprietary information; or litigation and investigation by tenants, governmental or regulatory agencies, or other third parties. Such events could also have other adverse impacts on us, including breaches of debt covenants or other contractual or REIT compliance obligations, late or misstated financial reports, and significant diversion of management attention and resources. As a result, such events could have a material adverse effect on our financial condition, results of operations and cash flows and harm our business reputation or have such effects on our PROs.
We may become subject to litigation or threatened litigation that may divert management's time and attention, require us to pay damages and expenses or restrict the operation of our business.
We may become subject to disputes, including class or collective actions, with customers (or prospective customers), employees, commercial parties with whom we maintain relationships or other parties with whom we do business. Any such dispute could result in litigation between us and the other parties. Whether or not any dispute actually proceeds to litigation, we may be required to devote significant management time and attention to its successful resolution (through litigation, settlement or otherwise), which would detract from our management's ability to focus on our business. Any such resolution could involve the payment of damages or expenses by us, which may be significant and may not be covered by insurance. In addition, any such resolution could involve our agreement with terms that restrict the operation of our business.
There are other commercial parties, at both a local and national level, that may assert that our use of our brand names and other intellectual property conflict with their rights to use brand names and other intellectual property that they consider to be similar to ours. Any such commercial dispute and related resolution would involve all of the risks
17
described above, including, in particular, our agreement to restrict the use of our brand name or other intellectual property.
We also could be sued for personal injuries and/or property damage occurring on our properties. The liability insurance we maintain may not cover all costs and expenses arising from such lawsuits.
The acquisition of new properties that lack operating history with us will make it more difficult to predict our operating results.
With respect to acquisitions, if we fail to accurately estimate occupancy levels, rental rates, operating costs or costs of improvements to bring an acquired property up to the standards established for our intended market position, the performance of the property may be below expectations. Acquired properties may have characteristics or deficiencies affecting their valuation or profitability potential that we have not yet discovered. We cannot assure that the performance of properties acquired by us will increase or be maintained following our acquisition.
Costs associated with complying with the ADA may result in unanticipated expenses.
Under the ADA, places of public accommodation are required to meet certain federal requirements related to access and use by disabled persons. These requirements became effective in 1992. A number of additional U.S. federal, state and local laws may also require modifications to our properties, or restrict certain further renovations of the properties, with respect to access thereto by disabled persons. Noncompliance with the ADA could result in the imposition of fines or an award of damages to private litigants and also could result in an order to correct any non-complying feature, which could result in substantial capital expenditures. If one or more of our properties is not in compliance with the ADA or other legislation, then we would be required to incur additional costs to bring the property into compliance. If we incur substantial costs to comply with the ADA or other legislation, our financial condition, results of operations, cash flow, per share trading price of our common shares and our ability to satisfy our debt service obligations and to make cash distributions to our shareholders could be adversely affected.
Environmental compliance costs and liabilities associated with operating our properties may affect our results of operations.
Under various U.S. federal, state and local laws, ordinances and regulations, owners and operators of real estate may be liable for the costs of investigating and remediating certain hazardous substances or other regulated materials on or in such property. CERCLA and comparable state laws typically impose strict joint and several liabilities without regard to whether the owner or operator knew of, or was responsible for, the presence of such substances or materials. The presence of such substances or materials, or the failure to properly remediate such substances, may adversely affect the owner's or operator's ability to lease, sell or rent such property or to borrow using such property as collateral. Persons who arrange for the disposal or treatment of hazardous substances or other regulated materials may be liable for the costs of removal or remediation of such substances at a disposal or treatment facility, whether or not such facility is owned or operated by such person. Certain environmental laws impose liability for release of asbestos-containing materials into the air and third-parties may seek recovery from owners or operators of real properties for personal injury associated with asbestos-containing materials.
Certain environmental laws also impose liability, without regard to knowledge or fault, for removal or remediation of hazardous substances or other regulated materials upon owners and operators of contaminated property even after they no longer own or operate the property. Moreover, the past or present owner or operator of a property from which a release emanates could be liable for any personal injuries or property damages that may result from such releases, as well as any damages to natural resources that may arise from such releases.
Certain environmental laws impose compliance obligations on owners and operators of real property with respect to the management of hazardous materials and other regulated substances. For example, environmental laws govern the management of asbestos-containing materials and lead-based paint. Failure to comply with these laws can result in penalties or other sanctions.
In connection with the ownership, operation and management of our current or past properties and any properties that we may acquire and/or manage in the future, we could be legally responsible for environmental liabilities or costs relating to a release of hazardous substances or other regulated materials at or emanating from such property. In order to assess the potential for such liability, we conduct an environmental assessment of each property prior to acquisition and manage our properties in accordance with environmental laws while we own or operate them. We have engaged qualified, reputable and adequately insured environmental consulting firms to perform environmental site assessments
18
of all of our properties prior to acquisition and are not aware of any environmental issues that are expected to materially impact the operations of any property.
No assurances can be given that existing environmental studies with respect to any of our properties reveal all environmental liabilities, that any prior owner or operator of our properties did not create any material environmental condition not known to us, or that a material environmental condition does not otherwise exist as to any one or more of our properties. There also exists the risk that material environmental conditions, liabilities or compliance concerns may have arisen after the review was completed or may arise in the future. Finally, future laws, ordinances or regulations and future interpretations of existing laws, ordinances or regulations may impose additional material environmental liability.
We rely on on-site personnel to maximize tenant satisfaction at each of our properties, and any difficulties we or they encounter in hiring, training and maintaining skilled on-site personnel may harm our operating performance.
The general professionalism of site managers and staff are contributing factors to a site's ability to successfully secure rentals and retain tenants and we rely on on-site personnel to maintain clean and secure self storage properties. If we or our PROs are unable to successfully recruit, train and retain qualified on-site personnel, the quality of service we and our PROs strive to provide at our properties could be adversely affected, which could lead to decreased occupancy levels and reduced operating performance of our properties.
We and certain of our PROs have tenant insurance- and/or tenant protection plan-related arrangements that are in some cases subject to state-specific governmental regulation, which may adversely affect our results.
We and certain of our PROs have tenant insurance- and/or tenant protection plan-related arrangements with regulated insurance companies and our tenants. Some of our PROs earn access fees in connection with these arrangements. We receive a portion of the fees from these PROs. The tenant insurance and tenant protection plan businesses, including the payments associated with these arrangements, are in some cases subject to state-specific governmental regulation. State regulatory authorities generally have broad discretion to grant, renew and revoke licenses and approvals, to promulgate, interpret and implement regulations, and to evaluate compliance with regulations through periodic examinations, audits and investigations of the affairs of insurance industry participants. Although these arrangements are managed by our property management platform and/or certain of our PROs who have developed marketing programs and management procedures to navigate the regulatory environment, as a result of regulatory or private action in any jurisdiction in which we operate, we may be temporarily or permanently suspended from continuing some or all of our tenant insurance- and/or tenant protection plan-related activities, or otherwise fined or penalized or suffer an adverse judgment, which could adversely affect our business and results of operations.
Privacy concerns could result in regulatory changes that may harm our business.
Personal privacy has become a significant issue in the jurisdictions in which we operate. Many jurisdictions in which we operate have imposed or in the future may impose restrictions and requirements on the use of personal information by those collecting such information. For example, the California Consumer Privacy Act of 2018 was recently passed and will become effective as of January 1, 2020, which provides consumers with expansive rights and control over personal information obtained by or shared with certain covered businesses. Changes to law or regulations or the passage of new laws affecting privacy, if applicable to our business, could impose additional costs and liability on us and could limit our use and disclosure of such information.
Uninsured losses or losses in excess of our insurance coverage could adversely affect our financial condition, operating results and cash flow.
We maintain comprehensive liability, fire, flood, earthquake, wind (as deemed necessary or as required by our lenders), extended coverage and rental loss insurance with respect to our properties. Certain types of losses, however, may be either uninsurable or not economically insurable, such as losses due to earthquakes, hurricanes, tornadoes, riots, acts of war or terrorism. Should an uninsured loss occur, we could lose both our investment in and anticipated profits and cash flow from a property. In addition, if any such loss is insured, we may be required to pay significant amounts on any claim for recovery of such a loss prior to our insurer being obligated to reimburse us for the loss, or the amount of the loss may exceed our coverage for the loss. We currently self-insure a portion of our commercial insurance deductible risk through our captive insurance company. To the extent that our captive insurance company is unable to bear that risk, we may be required to fund additional capital to our captive insurance company or we may be required to bear that loss. As a result, our operating results may be adversely affected.
19
Illiquidity of real estate investments could significantly impede our ability to respond to adverse changes in the performance of our properties.
Because real estate investments are relatively illiquid, our ability to promptly sell one or more properties in our portfolio in response to changing economic, financial and investment conditions is limited. The real estate market is affected by many factors, such as general economic conditions, availability of financing, interest rates and other factors, including supply and demand, that are beyond our control. We cannot predict whether we will be able to sell any property for the price or on the terms set by us or whether any price or other terms offered by a prospective purchaser would be acceptable to us. We also cannot predict the length of time needed to find a willing purchaser and to close the sale of a property. In addition, we may be required to expend funds to correct defects or to make improvements before a property can be sold. We cannot assure you that we will have funds available to correct those defects or to make those improvements.
In acquiring a property, we may agree to transfer restrictions that materially restrict us from selling that property for a period of time or impose other restrictions, such as a limitation on the amount of debt that can be placed or repaid on that property. For example, we are party to certain agreements with our PROs that provide that, until March 31, 2023, our operating partnership shall not, and shall cause its subsidiaries not to, sell, dispose or otherwise transfer any property that is a part of the applicable self storage property portfolio relating to a series of subordinated performance units without the consent of the partners (including us) holding at least 50% of the then outstanding OP units and the partners holding at least 50% of the then outstanding series of subordinated performance units that relate to the applicable property, except for sales, dispositions or other transfers of a property to wholly owned subsidiaries of our operating partnership. These restrictions may require us to keep certain properties that we would otherwise sell, which could have an adverse effect on our results of operations, financial condition, cash flow and ability to execute our business plan.
Our business could be harmed if key personnel terminate their employment with us.
Our success depends, to a significant extent, on the continued services of Arlen D. Nordhagen and Tamara D. Fischer and the other members of our senior management team. At the time of our initial public offering, Mr. Nordhagen and Ms. Fischer entered into new employment agreements with us. These employment agreements provide for an initial three-year term of employment for these executives and automatic one-year extensions thereafter unless either party provides at least 90 days' notice of non-renewal. Notwithstanding these agreements, there can be no assurance that any of them will remain employed by us. The loss of services of one or more members of our senior management team could harm our business and our prospects.
We invest in strategic joint ventures that subject us to additional risks.
Some of our investments are. and in the future may be, structured as strategic joint ventures. Part of our strategy is to opportunistically partner with institutional funds and other institutional investors to acquire attractive portfolios through a promoted return structure. These arrangements are driven by the magnitude of capital required to complete the acquisitions and maintain the acquired portfolios. Such arrangements involve risks not present where a third party is not involved, including the possibility that partners or co-venturers might become bankrupt or otherwise fail to fund their share of required capital contributions. Additionally, partners or co-venturers might at any time have economic or other business interests or goals different from us and or in competition with us.
Joint ventures generally provide for a reduced level of control over an acquired project because governance rights are shared with others. Accordingly, certain major decisions relating to joint ventures, including decisions relating to, among other things, the approval of annual budgets, sales and acquisitions of properties, financings, and certain actions relating to bankruptcy, are often made by a majority vote of the investors or by separate agreements that are reached with respect to individual decisions. In addition, such decisions may be subject to the risk that the partners or co-venturers may make business, financial or management decisions with which we do not agree or take risks or otherwise act in a manner that does not serve our best interests. Because we may not have the ability to exercise control over such operations, we may not be able to realize some or all of the benefits that we believe will be created from our involvement. At times, we and our partners or co-venturers may also each have the right to trigger a buy-sell arrangement, which could cause us to sell our interest, or acquire our partners' or co-venturers' interest, at a time when we otherwise would not have initiated such a transaction. If any of the foregoing were to occur, our business, financial condition and results of operations could suffer as a result.
20
Risks Related to Our Structure and Our Relationships with Our PROs
Some of our PROs have limited experience operating under the Company's capital structure, and we may not be able to achieve the desired outcomes that the structure is intended to produce.
Some of our PROs have limited experience operating under our capital structure. As a means of incentivizing our PROs to drive operating performance and support the sustainability of the operating cash flow from the properties they manage on our behalf, we issued each PRO subordinated performance units aimed at aligning the interests of our PROs with our interests and those of our shareholders. The subordinated performance units are entitled to distributions exclusively tied to the performance of each PRO's managed portfolios but only after minimum performance thresholds are satisfied. Our issuance of such units, however, may have been and could be based on inaccurate valuations and thus misallocated, which would limit or eliminate the effectiveness of our intended incentive-based program. Moreover, difficulties in aligning incentives and implementing our structure could allow a PRO to underperform without triggering our right to terminate the applicable facilities portfolio and asset management agreements and transfer management rights of the PRO to us (or a designee) or cause our management to be distracted from other aspects of our business, which could adversely affect our operating results and business.
We are restricted in making certain property sales on account of agreements with our PROs that may require us to keep certain properties that we would otherwise sell.
The partnership unit designations related to our subordinated performance units provide that, until March 31, 2023, our operating partnership may not sell, dispose or otherwise transfer any property that is a part of the applicable self storage property portfolio relating to a series of subordinated performance units without the consent of the partners (including us) holding at least 50% of the then outstanding OP units and the consent of partners holding at least 50% of the then outstanding series of subordinated performance units that relate to the applicable property, except for sales, dispositions or other transfers of a property to wholly owned subsidiaries of our operating partnership. This restriction may require us to keep certain properties that we would otherwise sell, which could have an adverse effect on our results of operations, financial condition, cash flow and ability to execute our business plan. In addition, we may enter into agreements with future PROs that contain the same or similar restrictions or that impose such restrictions for different periods.
Our ability to terminate our facilities portfolio management agreements and asset management agreements with a PRO is limited, which may adversely affect our ability to execute our business plan.
We may elect to terminate our facilities portfolio management agreements and asset management agreements with a PRO and transfer property management responsibilities over the properties managed by such PRO to us (or our designee), (i) upon certain defaults by a PRO as set forth in these agreements, or (ii) if the PRO's properties, on a portfolio basis, fail to meet certain pre-determined performance thresholds for more than two consecutive calendar years or if the operating cash flow generated by the properties of the PRO for any calendar year falls below a level that will enable us to fund minimum levels of distributions, debt service payments attributable to the properties, and fund the properties' allocable operating expenses. Consequently, to the extent a PRO complies with these covenants, standards, and minimum requirements, we may not be able to terminate the applicable facilities portfolio management agreements and asset management agreements and transfer property management responsibilities over such properties even if our board of trustees believes that such PRO is not properly executing our business plan and/or is failing to operate its properties to their full potential. Moreover, transferring the management responsibilities over the properties managed by a PRO may be costly or difficult to implement or may be delayed, even if we are able to and believe that such a change in portfolio and property management would be beneficial to us and our shareholders.
We may less vigorously pursue enforcement of terms of agreements entered into with our PROs because of conflicts of interest with our PROs.
Our PROs are entities that have contributed or will contribute through contribution agreements, self storage properties, or legal entities owning self storage properties, to our operating partnership or DownREIT partnerships in exchange for ownership interests in our operating partnership or DownREIT partnerships. As part of each transaction, our PROs make and have made limited representations and warranties to our operating partnership regarding the entities, properties and other assets to be acquired by our operating partnership or DownREIT partnerships in the contribution and generally agree to indemnify our operating partnership for 12 months after the closing of the contribution for breaches of such representations. Such indemnification is limited, however, and our operating partnership is not entitled to any other indemnification in connection with the contributions. In addition, following each contribution from a PRO, the day-to-day operations of each of the managed properties will be managed by the PRO who was the principal of the
21
applicable self storage property portfolios prior to the contribution. In addition, certain of our PROs are members of our board of trustees, members of our PRO advisory committee, or are executive officers of the Company. Consequently, we may choose not to enforce, or to enforce less vigorously, our rights under these agreements and any other agreements with our PROs due to our desire to maintain our ongoing relationship with our PROs, which could adversely affect our operating results and business.
We own self storage properties in some of the same geographic regions as our PROs and may compete for tenants with other properties managed by our PROs.
Pursuant to the facilities portfolio management agreements with our PROs, each PRO has agreed that, without our consent, the PRO will not, and it will cause its affiliates not to, enter into any new agreements or arrangements for the management of additional self storage properties, other than the properties we are not acquiring and the properties each PRO contributes to our operating partnership. However, we have not and will not acquire all of the self storage properties of our PROs. We will therefore own self storage properties in some of the same geographic regions as our PROs, and, as a result, we may compete for tenants with our PROs. This competition may affect our ability to attract and retain tenants and may reduce the rental rates we are able to charge, which could adversely affect our operating results and business.
Our PROs may engage in other activities, diverting their attention from the management of our properties, which could adversely affect the execution of our business plan and our operating results.
Our PROs and their employees and personnel are in the business of managing self storage properties. We have agreed that our PROs may continue to manage properties not included in our portfolio, and our PROs are not obligated to dedicate any specific employees or personnel exclusively to the management of our properties. As a result, their time and efforts may be diverted from the management of our properties, which could adversely affect the execution of our business plan and our operating results.
When a PRO elects or is required to "retire" we may become exposed to new and additional costs and risks.
Under the facilities portfolio management agreements, after a two year period following the later of completion of our initial public offering or the initial contribution of their properties to us, a PRO may elect, or be required, to "retire" from the self storage business. Upon a retirement event, management of the properties will be transferred to us (or our designee) in exchange for OP units with a value equal to four times the average of the normalized annual EBITDA from the management contracts related to such PRO's managed portfolio over the immediately preceding 24-month period. As a result of this transfer, we may become exposed to new and additional costs and risks. Accordingly, the retirement of a PRO may adversely affect our financial condition and operating results.
Our formation transactions and subsequent contribution transactions were generally not negotiated on an arm's-length basis and may not be as favorable to us as if they had been negotiated with unaffiliated third parties.
We did not conduct arm's-length negotiations with certain of the parties involved regarding the terms of the formation transactions and subsequent contribution transactions, including the contribution agreements, facilities portfolio management agreements, sales commission agreements, asset management agreements and registration rights agreements. In the course of structuring the formation transactions and subsequent contribution transactions, certain members of our senior management team and other contributors had the ability to influence the type and level of benefits that they received from us. Accordingly, the terms of the formation transactions and subsequent contribution transactions may not solely reflect the best interests of us or our shareholders and may be overly favorable to the other party to such transactions and agreements.
Conflicts of interest could arise with respect to certain transactions between the holders of OP units (including subordinated performance units), which include our PROs, on the one hand, and us and our shareholders, on the other.
Conflicts of interest could arise with respect to the interests of holders of OP units (including subordinated performance units), on the one hand, which include members of our senior management team, PROs, and trustees (including Arlen D. Nordhagen, our chief executive officer and chairman of the board of trustees) and us and our shareholders, on the other. In particular, the consummation of certain business combinations, the sale, disposition or transfer of certain of our assets or the repayment of certain indebtedness that may be desirable to us and our shareholders could have adverse tax consequences to such unit holders. In addition, our trustees and officers have duties to the Company under applicable Maryland law in connection with their management of the Company. At the same time, we have fiduciary duties, as a general partner, to our operating partnership and to the limited partners under Delaware law
22
in connection with the management of our operating partnership. Our duties as a general partner to our operating partnership and its partners may come into conflict with the duties of our trustees and officers to the Company and our shareholders. The partnership agreement of our operating partnership does not require us to resolve such conflicts in favor of either the Company or the limited partners in our operating partnership. Further, there can be no assurance that any procedural protections we implement to address these or other conflicts of interest will result in optimal outcomes for us and our shareholders.
The partnership agreement of our operating partnership contains provisions that may delay, defer or prevent a change in control.
The partnership agreement of our operating partnership provides that subordinated performance unit holders holding more than 50% of the voting power of the subordinated performance units must approve certain change of control transactions involving us unless, as a result of such transactions, the holders of subordinated performance units are offered a choice (1) to allow their subordinated performance units to remain outstanding without the terms thereof being materially and adversely changed or the subordinated performance units are converted into or exchanged for equity securities of the surviving entity having terms and conditions that are substantially similar to those of the subordinated performance units (it being understood that we may not be the surviving entity and that the parent of the surviving entity or the surviving entity may not be publicly traded) or (2) to receive for each subordinated performance unit an amount of cash, securities or other property payable to a holder of OP units had such holder exercised its right to exchange its subordinated performance units for OP units without taking into consideration a specified conversion penalty associated with such an exchange. In addition, in the case of any such change of control transactions in which we have not received the consent of OP unit holders holding more than 50% of the OP units (other than those held by the Company or its subsidiaries) and of subordinated performance unit holders holding more than 50% of the voting power of the subordinated performance units (other than those held by the Company or its subsidiaries), such transaction is required to be approved by a companywide vote of limited partners holding more than 50% of our outstanding OP units in which OP units (including for this purpose OP units held by us and our subsidiaries) are voted and subordinated performance units (not held by us and our subsidiaries) are voted on an applicable as converted basis and in which we will be deemed to vote the OP units held by us and our subsidiaries in proportion to the manner in which all of our outstanding common shares were voted at a shareholders meeting relating to such transaction. These approval rights could delay, deter, or prevent a transaction or a change in control that might involve a premium price for our common shares or otherwise be in the best interests of our shareholders.
We may change our investment and financing strategies and enter into new lines of business without shareholder consent, which may subject us to different risks.
We may change our business and financing strategies and enter into new lines of business at any time without the consent of our shareholders, which could result in our making investments and engaging in business activities that are different from, and possibly riskier than, the investments and businesses described in this document. A change in our strategy or our entry into new lines of business may increase our exposure to other risks or real estate market fluctuations.
Certain provisions of Maryland law could inhibit a change in our control.
Certain provisions of the Maryland General Corporation Law (the "MGCL") applicable to a Maryland real estate investment trust may have the effect of inhibiting a third-party from making a proposal to acquire us or of impeding a change in our control under circumstances that otherwise could provide the holders of our common shares with the opportunity to realize a premium over the then prevailing market price of such shares. The "business combination" provisions of the MGCL, subject to limitations, prohibit certain business combinations between a REIT and an "interested shareholder" (defined generally as any person who beneficially owns 10% or more of the voting power of our then outstanding voting shares or an affiliate or associate of ours who, at any time within the two-year period prior to the date in question, was the beneficial owner, directly or indirectly, of 10% or more of our then outstanding voting shares) or an affiliate thereof for five years after the most recent date on which the shareholder becomes an interested shareholder and, thereafter, imposes special appraisal rights and special shareholder voting requirements on these combinations. These provisions of the MGCL do not apply, however, to business combinations that are approved or exempted by the board of trustees of a REIT prior to the time that the interested shareholder becomes an interested shareholder. Pursuant to the statute, our board of trustees has by resolution exempted business combinations between us and (1) any other person, provided that the business combination is first approved by our board of trustees (including a majority of trustees who are not affiliates or associates of such person), (2) Arlen D. Nordhagen and any of his affiliates and associates and (3) any person acting in concert with the foregoing, from these provisions of the MGCL. As a result, such persons may be able to enter into business combinations with us that may not be in the best interests of our
23
shareholders without compliance by us with the supermajority vote requirements and other provisions of the statute. This resolution, however, may be altered or repealed in whole or in part at any time. If this resolution is repealed, or our board of trustees does not otherwise approve a business combination, this statute may discourage others from trying to acquire control of us and increase the difficulty of consummating any offer.
The "control share" provisions of the MGCL provide that holders of "control shares" of a Maryland real estate investment trust (defined as voting shares which, when aggregated with all other shares controlled by the shareholder, entitle the shareholder to exercise one of three increasing ranges of voting power in the election of trustees) acquired in a "control share acquisition" (defined as the direct or indirect acquisition of ownership or control of issued and outstanding "control shares," subject to certain exceptions) have no voting rights with respect to such shares except to the extent approved by our shareholders by the affirmative vote of at least two-thirds of all the votes entitled to be cast on the matter, excluding votes entitled to be cast by the acquirer of control shares, our officers and our trustees who are also our employees. Our bylaws contain a provision exempting from the control share acquisition statute any and all acquisitions by any person of our shares. There can be no assurance that this provision will not be amended or eliminated at any time in the future.
Our authorized but unissued common and preferred shares may prevent a change in our control.
Our declaration of trust authorizes us to issue additional authorized but unissued common shares and preferred shares. In addition, our board of trustees may, without common shareholder approval, increase the aggregate number of our authorized shares or the number of shares of any class or series that we have authority to issue and classify or reclassify any unissued common shares or preferred shares, and may set or change the preferences, rights and other terms of any unissued classified or reclassified shares. As a result, among other things, our board may establish a class or series of common shares or preferred shares that could delay or prevent a transaction or a change in our control that might involve a premium price for our common shares or otherwise be in the best interests of our shareholders.
Our rights and the rights of our shareholders to take action against our trustees and officers are limited, which could limit your recourse in the event of actions not in your best interest.
Our declaration of trust limits the liability of our present and former trustees and officers to us and our shareholders for money damages to the maximum extent permitted under Maryland law. Under current Maryland law, our present and former trustees and officers will not have any liability to us or our shareholders for money damages other than liability resulting from:
|
•
|
actual receipt of an improper benefit or profit in money, property or services; or
|
|
•
|
active and deliberate dishonesty by the trustee or officer that was established by a final judgment and is material to the cause of action.
|
Our declaration of trust authorizes us to indemnify our present and former trustees and officers for actions taken by them in those capacities to the maximum extent permitted by Maryland law. Our bylaws require us to indemnify each present and former trustee or officer, to the maximum extent permitted by Maryland law, in connection with any proceeding to which he or she is made, or threatened to be made, a party to or witness in by reason of his or her service to us as a trustee or officer or in certain other capacities. In addition, we may be obligated to pay or reimburse the expenses incurred by our present and former trustees and officers without requiring a preliminary determination of their ultimate entitlement to indemnification. As a result, we and our shareholders may have more limited rights against our present and former trustees and officers than might otherwise exist absent the current provisions in our declaration of trust and bylaws or that might exist with other companies, which could limit your recourse in the event of actions not in your best interest.
Our declaration of trust contains provisions that make removal of our trustees difficult, which could make it difficult for our shareholders to effect changes to our management.
Our declaration of trust provides that, subject to the rights of holders of one or more classes or series of preferred shares, a trustee may be removed with or without cause, by the affirmative vote of at least two-thirds of the votes entitled to be cast generally in the election of trustees. Vacancies on our board of trustees generally may be filled only by a majority of the remaining trustees in office, even if less than a quorum. These requirements make it more difficult to change our management by removing and replacing trustees and may prevent a change in our control that is in the best interests of our shareholders.
24
Restrictions on ownership and transfer of our shares may restrict change of control or business combination opportunities in which our shareholders might receive a premium for their shares.
In order for us to qualify as a REIT for each taxable year, no more than 50% in value of our outstanding shares may be owned, directly or constructively, by five or fewer individuals during the last half of any calendar year, and at least 100 persons must beneficially own our shares during at least 335 days of a taxable year of 12 months, or during a proportionate portion of a shorter taxable year. "Individuals" for this purpose include natural persons, private foundations, some employee benefit plans and trusts, and some charitable trusts. To assist us in preserving our REIT qualification, among other purposes, our declaration of trust generally prohibits, among other limitations, any person from beneficially or constructively owning more than 9.8% in value or in number of shares, whichever is more restrictive, of our aggregate outstanding shares of all classes and series, the outstanding shares of any class or series of our preferred shares or our outstanding common shares. These ownership limits and the other restrictions on ownership and transfer of our shares contained in our declaration of trust could have the effect of discouraging a takeover or other transaction in which holders of our common shares might receive a premium for their shares over the then prevailing market price or which holders might believe to be otherwise in their best interests. Our board of trustees has established exemptions from these ownership limits which permits certain of our institutional investors to hold up to 20% of our common shares and up to 25% of our preferred shares.
Risks Related to Our Debt Financings
There are risks associated with our indebtedness.
There is no assurance that we will succeed in securing expansions of our credit facility, 2023 Term Loan Facility or 2028 Term Loan Facility, if we desire to do so.
Our level of debt and the limitations imposed on us by our debt agreements could have significant adverse consequences, including the following:
|
•
|
our cash flow may be insufficient to meet our required principal and interest payments;
|
|
•
|
we may be unable to borrow additional funds as needed or on favorable terms, including to make acquisitions or to continue to make distributions required to maintain our qualification as a REIT;
|
|
•
|
we may be unable to refinance our indebtedness at maturity or the refinancing terms may be less favorable than the terms of our original indebtedness;
|
|
•
|
because a portion of our debt that bears interest at variable rates is not hedged, a material increase in interest rates could materially increase our interest expense;
|
|
•
|
we may be forced to dispose of one or more of our properties, possibly on disadvantageous terms;
|
|
•
|
our debt level could place us at a competitive disadvantage compared to our competitors with less debt;
|
|
•
|
we may experience increased vulnerability to economic and industry downturns, reducing our ability to respond to changing business and economic conditions;
|
|
•
|
we may default on our obligations and the lenders or mortgagees may foreclose on our properties that secure their loans and receive an assignment of rents and leases;
|
|
•
|
we may default on our obligations and the lenders or mortgagees may enforce our guarantees;
|
|
•
|
we may violate restrictive covenants in our loan documents, which would entitle the lenders to accelerate our debt obligations; and
|
|
•
|
our default under any one of our mortgage loans with cross-default or cross-collateralization provisions could result in a default on other indebtedness or result in the foreclosures of other properties.
|
Disruptions in the financial markets could affect our ability to obtain debt financing on reasonable terms or at all and have other adverse effects on us.
Uncertainty in the credit markets may negatively impact our ability to access additional debt financing or to refinance existing debt maturities on favorable terms (or at all), which may negatively affect our ability to make acquisitions. A downturn in the credit markets may cause us to seek alternative sources of potentially less attractive financing, and may require us to adjust our business plans accordingly. In addition, these factors may make it more
25
difficult for us to sell properties or may adversely affect the price we receive for properties that we do sell, as prospective buyers may experience increased costs of debt financing or difficulties in obtaining debt financing.
We depend on external sources of capital that are outside of our control, which could adversely affect our ability to acquire or develop properties, satisfy our debt obligations and/or make distributions to shareholders.
We depend on external sources of capital to acquire properties, to satisfy our debt obligations and to make distributions to our shareholders required to maintain our qualification as a REIT, and these sources of capital may not be available on favorable terms, or at all. Our access to external sources of capital depends on a number of factors, including the market's perception of our growth potential and our current and potential future earnings and our ability to continue to qualify as a REIT for U.S. federal income tax purposes. If we are unable to obtain external sources of capital, we may not be able to acquire properties when strategic opportunities exist, satisfy our debt obligations or make cash distributions to our shareholders that would permit us to qualify as a REIT or avoid paying tax on all of our net taxable income.
Increases in interest rates may increase our interest expense and adversely affect our cash flow and our ability to service our indebtedness and make cash distributions to our shareholders, and our decision to hedge against interest rate risk might not be effective.
As of
December 31, 2018
, we had approximately
$1.3 billion
of debt outstanding, of which approximately
$214.5 million
, or 16.7%, is subject to variable interest rates (excluding variable-rate debt subject to interest rate swaps). Although the credit markets have recently experienced historic lows in interest rates, if interest rates continue to rise, the interest rates on our variable-rate debt could be higher than current levels, which could increase our financing costs and decrease our cash flow and our ability to pay cash distributions to our shareholders. For example, if market rates of interest on this variable-rate debt increased by 100 basis points (excluding variable-rate debt with interest rate swaps), the increase in interest expense would decrease future earnings and cash flows by approximately
$2.1 million
annually.
Although we have historically sought, and may in the future seek, to manage our exposure to interest rate volatility by using interest rate hedging arrangements, these arrangements may not be effective. Developing an effective interest rate risk strategy is complex and no strategy can completely insulate us from risks associated with interest rate fluctuations. Failure to hedge effectively against interest rate changes may adversely affect our financial condition, results of operations and ability to make cash distributions to our shareholders.
The terms and covenants relating to our indebtedness could adversely impact our economic performance.
Our credit facility, 2023 Term Loan Facility and 2028 Term Loan Facility contain (and any new or amended facility we may enter into from time to time will likely contain) customary affirmative and negative covenants, including financial covenants that, among other things, cap our total leverage at 60% of our gross asset value (as defined in our credit facility, 2023 Term Loan Facility and 2028 Term Loan Facility), require us to have a minimum fixed charge coverage ratio of 1.5 to 1, and require us to have a minimum net worth (as defined in our credit facility) of at least $682.6 million plus 75% of the net proceeds of equity issuances. In the event that we fail to satisfy our covenants, we would be in default under our credit agreements and may be required to repay such debt with capital from other sources. Under such circumstances, other sources of debt or equity capital may not be available to us, or may be available only on unattractive terms. Moreover, the presence of such covenants could cause us to operate our business with a view toward compliance with such covenants, which might not produce optimal returns for shareholders.
Risks Related to Our Qualification as a REIT
Our failure to remain qualified as a REIT would subject us to U.S. federal income tax and applicable state and local taxes, which would reduce the amount of operating cash flow to our shareholders.
We have elected and we believe that we have qualified to be taxed as a REIT commencing with our taxable year ended December 31, 2015. We have not requested, and do not intend to request a ruling from the Internal Revenue Service ("IRS"), that we qualify as a REIT. Qualification as a REIT involves the application of highly technical and complex Code provisions and Treasury Regulations promulgated thereunder for which there are limited judicial and administrative interpretations. The complexity of these provisions and of applicable Treasury Regulations is greater in the case of a REIT that, like us, holds its assets through partnerships, and judicial and administrative interpretations of the U.S. federal income tax laws governing REIT qualification are limited. To qualify as a REIT, we must meet, on an ongoing basis through actual operating results, various tests regarding the nature and diversification of our assets and our income, the ownership of our outstanding shares and the amount of our distributions. Our compliance with the REIT income and quarterly asset requirements also depends upon our ability to manage successfully the composition
26
of our income and assets on an ongoing basis. Our ability to satisfy these asset tests depends upon our analysis of the characterization and fair market values of our assets, some of which are not susceptible to a precise determination, and for which we will not obtain independent appraisals. Moreover, new legislation, court decisions or administrative guidance may, in each case possibly with retroactive effect, make it more difficult or impossible for us to qualify as a REIT. Thus, while we believe that we have been organized and operated and we intend to operate so that we will continue to qualify as a REIT, given the highly complex nature of the rules governing REITs, the ongoing importance of factual determinations and the possibility of future changes in our circumstances, no assurance can be given that we have qualified or will so qualify for any particular year. These considerations also might restrict the types of assets that we can acquire or services that we can provide in the future.
If we fail to qualify as a REIT in any taxable year, and we do not qualify for certain statutory relief provisions, we would be required to pay U.S. federal income tax on our taxable income at regular corporate rates, and distributions to our shareholders would not be deductible by us in determining our taxable income. In such a case, we might need to borrow money, sell assets, or reduce or even cease making distributions in order to pay our taxes. Our payment of income tax would reduce significantly the amount of operating cash flow to our shareholders. Furthermore, if we fail to maintain our qualification as a REIT, we no longer would be required to make distributions to our shareholders. In addition, unless we were eligible for certain statutory relief provisions, we could not re-elect to be taxed as a REIT until the fifth calendar year following the year in which we failed to qualify.
Even if we qualify as a REIT, we may face other tax liabilities that reduce our cash flow.
Even if we qualify for taxation as a REIT, we may be subject to certain U.S. federal, state and local taxes on our income and assets, including taxes on any undistributed income, state or local income and property and transfer taxes, including real property transfer taxes. In addition, we could, in certain circumstances, be required to pay an excise or penalty tax (which could be significant in amount) in order to utilize one or more relief provisions under the Code to maintain our qualification as a REIT. Any of these taxes would decrease operating cash flow to our shareholders. In addition, in order to meet the REIT qualification requirements, or to avert the imposition of a 100% tax that applies to certain gains derived by a REIT from dealer property or inventory, we may hold some of our assets or provide certain services to our tenants through one or more TRSs, or other subsidiary corporations that will be subject to corporate-level income tax at regular corporate rates. Any TRSs or other taxable corporations in which we invest will be subject to U.S. federal, state and local corporate taxes. Furthermore, if we acquire appreciated assets from a corporation that is or has been a subchapter C corporation in a transaction in which the adjusted tax basis of such assets in our hands is less than the fair market value of the assets, determined at the time we acquired such assets, and if we subsequently dispose of any such assets during the 5-year period following the acquisition of the assets from the C corporation, we will be subject to tax at the highest corporate tax rates on any gain from the disposition of such assets to the extent of the excess of the fair market value of the assets on the date that we acquired such assets over the basis of such assets on such date, which we refer to as built-in gains. Payment of these taxes generally could materially and adversely affect our income, cash flow, results of operations, financial condition, liquidity and prospects, and could adversely affect the value of our common shares and our ability to make distributions to our shareholders.
Failure to make required distributions would subject us to tax, which would reduce the operating cash flow to our shareholders.
In order to qualify as a REIT, we must distribute to our shareholders each calendar year at least 90% of our net taxable income (excluding net capital gain). To the extent that we satisfy the 90% distribution requirement, but distribute less than 100% of our net taxable income (including net capital gain), we would be subject to U.S. federal corporate income tax on our undistributed net taxable income. In addition, we will incur a 4% non-deductible excise tax on the amount, if any, by which our distributions in any calendar year are less than a minimum amount specified under U.S. federal income tax laws. Although we intend to distribute our net taxable income to our shareholders in a manner intended to satisfy the REIT 90% distribution requirement and to avoid the 4% non-deductible excise tax, it is possible that we, from time to time, may not have sufficient cash to distribute 100% of our net taxable income. There may be timing differences between our actual receipt of cash and the inclusion of items in our income for U.S. federal income tax purposes. Accordingly, there can be no assurance that we will be able to distribute net taxable income to shareholders in a manner that satisfies the REIT distribution requirements and avoids the 4% non-deductible excise tax.
27
To maintain our REIT qualification, we may be forced to borrow funds during unfavorable market conditions.
In order to maintain our REIT qualification and avoid the payment of income and excise taxes, we may need to borrow funds to meet the REIT distribution requirements even if the then prevailing market conditions are not favorable for these borrowings. These borrowing needs could result from, among other things, timing differences between the actual receipt of cash and inclusion of income for federal income tax purposes, or the effect of non-deductible capital expenditures, the creation of reserves or required debt or amortization payments. These sources, however, may not be available on favorable terms or at all. Our access to third-party sources of capital depends on a number of factors, including the market's perception of our growth potential, our current debt levels, the per share trading price of our common shares, and our current and potential future earnings. We cannot assure you that we will have access to such capital on favorable terms at the desired times, or at all, which may cause us to curtail our investment activities and/or to dispose of assets at inopportune times, and could adversely affect our financial condition, results of operations, cash flows and our ability to pay distributions on, and the per share trading price of, our common shares.
Complying with the REIT requirements may cause us to forgo and/or liquidate otherwise attractive investments.
To qualify as a REIT, we must ensure that at least 75% of our gross income for each taxable year, excluding certain amounts, is derived from certain real property-related sources, and at least 95% of our gross income for each taxable year, excluding certain amounts, is derived from certain real property-related sources and passive income such as dividends and interest. In addition, we must ensure that, at the end of each calendar quarter, at least 75% of the value of our total assets consists of cash, cash items, U.S. government securities and qualified real estate assets. The remainder of our investment in securities generally cannot include more than 10% of the outstanding voting securities of any one issuer (other than U.S. government securities, securities of corporations that are treated as TRSs and qualified real estate assets) or more than 10% of the total value of the outstanding securities of any one issuer (other than government securities, securities of corporations that are treated as TRSs and qualified real estate assets). In addition, in general, no more than 5% of the value of our assets can consist of the securities of any one issuer (other than U.S. government securities, securities of corporations that are treated as TRSs and qualified real estate assets), no more than 20% (25% for taxable years beginning prior to January 1, 2018) of the value of our total assets can be represented by securities of one or more TRSs and no more than 25% of the value of our assets can consist of debt instruments issued by publicly offered REITs that are not otherwise secured by real property. If we fail to comply with these asset requirements at the end of any calendar quarter, we must correct the failure within 30 days after the end of the calendar quarter or qualify for certain statutory relief provisions to avoid losing our REIT qualification and suffering adverse tax consequences.
To meet these tests, we may be required to take or forgo taking actions that we would otherwise consider advantageous. For instance, in order to satisfy the gross income or asset tests applicable to REITs under the Code, we may be required to forgo investments that we otherwise would make. Furthermore, we may be required to liquidate from our portfolio otherwise attractive investments. In addition, we may be required to make distributions to shareholders at disadvantageous times or when we do not have funds readily available for distribution. These actions could reduce our income and amounts available for distribution to our shareholders. Thus, compliance with the REIT requirements may hinder our investment performance.
We may be subject to a 100% tax on income from "prohibited transactions," and this tax may limit our ability to sell assets or require us to restructure certain of our activities in order to avoid being subject to the tax.
We will be subject to a 100% tax on any income from a prohibited transaction. "Prohibited transactions" generally include sales or other dispositions of property (other than property treated as foreclosure property under the Code) that is held as inventory or primarily for sale to customers in the ordinary course of a trade or business by a REIT, either directly or indirectly through certain pass-through subsidiaries. The characterization of an asset sale as a prohibited transaction depends on the particular facts and circumstances.
The 100% tax will not apply to gains from the sale of inventory that is held through a TRS or other taxable corporation, although such income will be subject to tax in the hands of the corporation at regular corporate income tax rates.
28
Our TRSs will be subject to U.S. federal income tax and will be required to pay a 100% penalty tax on certain income or deductions if our transactions with our TRSs are not conducted on arm's length terms.
We may conduct certain activities (such as facilitating sales by our PROs of tenant insurance, of which we receive a portion of the proceeds, selling packing supplies and locks and renting trucks or other moving equipment) through one or more TRSs.
A TRS is a corporation other than a REIT in which a REIT directly or indirectly holds stock, and that has made a joint election with such REIT to be treated as a TRS. If a TRS owns more than 35% of the total voting power or value of the outstanding securities of another corporation, such other corporation will also be treated as a TRS. Other than some activities relating to lodging and health care properties, a TRS may generally engage in any business, including the provision of customary or non-customary services to tenants of its parent REIT. A TRS is subject to U.S. federal income tax as a regular C corporation.
No more than 20% (25% for taxable years beginning prior to January 1, 2018) of the value of a REIT's total assets may consist of stock or securities of one or more TRSs. This requirement limits the extent to which we can conduct our activities through TRSs. The values of some of our assets, including assets that we hold through TRSs, may not be subject to precise determination, and values are subject to change in the future. Furthermore, if a REIT lends money to a TRS, the TRS may be unable to deduct all or a portion of the interest paid to the REIT, which could increase the tax liability of the TRS. In addition, the Code imposes a 100% tax on certain transactions between a TRS and its parent REIT that are not conducted on an arm's length basis. We intend to structure transactions with any TRS on terms that we believe are arm's length to avoid incurring the 100% excise tax described above. There can be no assurances, however, that we will be able to avoid application of the 100% tax.
If our operating partnership is treated as a corporation for U.S. federal income tax purposes, we will cease to qualify as a REIT.
We believe our operating partnership qualifies as a partnership for U.S. federal income tax purposes. As a partnership for U.S. federal income tax purposes, our operating partnership will not be subject to U.S. federal income tax on its income. Instead, each of its partners, including us, will be required to pay tax on its allocable share of our operating partnership's income. No assurance can be provided, however, that the IRS will not challenge our operating partnership's status as a partnership for U.S. federal income tax purposes, or that a court would not sustain such a challenge. If the IRS were successful in treating our operating partnership as a corporation for U.S. federal income tax purposes, we would fail to meet the gross income tests and certain of the asset tests applicable to REITs. As a result, we would cease to qualify as a REIT and both we and our operating partnership would become subject to U.S. federal, state and local income tax. The payment by our operating partnership of income tax would reduce significantly the amount of cash available to our operating partnership to satisfy obligations to make principal and interest payments on its debt and to make distribution to its partners, including us.
Dividends payable by REITs generally do not qualify for the reduced tax rates on dividend income from regular corporations, which could adversely affect the value of our shares.
The maximum U.S. federal income tax rate for certain qualified dividends payable to domestic shareholders that are individuals, trusts and estates is 20%. Dividends payable by REITs, however, are generally not eligible for these reduced qualified dividend rates. However, for taxable years beginning after December 31, 2017 and before January 1, 2026, under the recently enacted Tax Cuts and Jobs Act ("TCJA"), noncorporate taxpayers may deduct up to 20% of certain qualified business income, including "qualified REIT dividends" (generally, REIT dividends received by a shareholder that are not designated as capital gain dividends or qualified dividend income), subject to certain limitations, resulting in an effective maximum U.S. federal income tax rate of 29.6% on such income. Although the reduced U.S. federal income tax rate applicable to dividend income from regular corporate dividends does not adversely affect the taxation of REITs or dividends paid by REITs, the more favorable rates applicable to qualified dividends from C corporations could cause investors who are individuals, trusts and estates to perceive investments in REITs to be relatively less attractive than investments in the stocks of non-REIT corporations that pay dividends, which could adversely affect the value of the shares of REITs, including our shares.
Complying with REIT requirements may limit our ability to hedge effectively and may cause us to incur tax liabilities.
The REIT provisions of the Code may limit our ability to hedge our assets and operations. Under these provisions, any income that we generate from transactions intended to hedge our interest rate risk will be excluded from gross income for purposes of the REIT 75% and 95% gross income tests if (i) the instrument (a) hedges interest rate risk on
29
liabilities used to carry or acquire real estate assets or (b) hedges an instrument described in clause (a) for a period following the extinguishment of the liability or the disposition of the asset that was previously hedged by the hedged instrument, and (ii) the relevant instrument is properly identified under applicable Treasury regulations. Income from hedging transactions that does not meet these requirements will generally constitute non-qualifying income for purposes of both the REIT 75% and 95% gross income tests. As a result of these rules, we may have to limit our use of hedging techniques that might otherwise be advantageous or implement those hedges through a TRS. This could increase the cost of our hedging activities because our TRS would be subject to tax on gains or expose us to greater risks associated with changes in interest rates than we would otherwise want to bear. In addition, losses in our TRS will generally not provide any tax benefit, although, subject to limitation, such losses may be carried back or forward against past or future taxable income in the TRS. Under the TCJA, net operating losses generated beginning in 2018 may not be used to offset more than 80% of our TRS's taxable income. Net operating losses generated beginning in 2018 can be carried forward indefinitely but can no longer be carried back.
The ability of our board of trustees to revoke our REIT election without shareholder approval may cause adverse consequences to our shareholders.
Our declaration of trust provides that the board of trustees may revoke or otherwise terminate our REIT election, without the approval of our shareholders, if the board determines that it is no longer in our best interest to attempt to, or continue to, qualify as a REIT. If we cease to qualify as a REIT, we would become subject to U.S. federal income tax on our net taxable income and we generally would no longer be required to distribute any of our net taxable income to our shareholders, which may have adverse consequences on our total return to our shareholders.
Legislative or regulatory tax changes related to REITs could materially and adversely affect our business.
At any time, the U.S. federal income tax laws or regulations governing REITs or the administrative interpretations of those laws or regulations may be changed, possibly with retroactive effect. We cannot predict if or when any new U.S. federal income tax law, regulation or administrative interpretation, or any amendment to any existing U.S. federal income tax law, regulation or administrative interpretation, will be adopted, promulgated or become effective or whether any such law, regulation or interpretation may take effect retroactively. We and our shareholders could be adversely affected by any such change in, or any new, U.S. federal income tax law, regulation or administrative interpretation.
The TCJA, which was signed into law on December 22, 2017, significantly changes U.S. federal income tax laws applicable to businesses and their owners, including REITs and their shareholders, and may lessen the relative competitive advantage of operating as a REIT rather than as a C corporation. For additional discussion, see "
Recent U.S. Federal Income Tax Legislation
".
Risks Related to Our Common Shares and Preferred Shares
Common shares and preferred shares eligible for future sale may have adverse effects on our share price.
Subject to applicable law and the rules of any stock exchange on which our shares may be listed or traded, our board of trustees, without common shareholder approval, may authorize us to issue additional authorized and unissued common shares and preferred shares on the terms and for the consideration it deems appropriate and may amend our declaration of trust to increase the total number of shares, or the number of shares of any class or series, that we are authorized to issue. In addition, our operating partnership may issue OP units, which are redeemable for cash or, at our option exchangeable on a one-for-one basis into common shares after an agreed period of time and certain other conditions, preferred units of limited partnership interest, which are redeemable for cash or, at our option exchangeable on a one-for-one basis into our 6.000% Series A cumulative redeemable preferred shares of beneficial interest ("Series A Preferred Shares") and subordinated performance units, which are only convertible into OP units beginning two years following the initial issuance of the applicable series and then (i) at the holder's election only upon the achievement of certain performance thresholds relating to the properties to which such subordinated performance units relate or (ii) at our election upon a retirement event of a PRO that holds such subordinated performance units or upon certain qualifying terminations. Notwithstanding the two-year lock out period on conversions of subordinated performance units into OP units, if all such subordinated performance units were convertible into OP units as of
December 31, 2018
, each subordinated performance unit would on average hypothetically convert into
1.32
OP units, or into an aggregate of approximately
20.0 million
OP units. These amounts are based on historical financial information for the trailing twelve months ended
December 31, 2018
. The hypothetical conversion is calculated by dividing the average cash available for distribution, or CAD, per subordinated performance unit by 110% of the CAD per OP unit over the same period. We anticipate that as our CAD grows over time, the conversion ratio will also grow, including to levels that may exceed this amount. The actual number of OP units into which such subordinated performance units will become convertible
30
may vary significantly and will depend upon the applicable conversion penalty and the actual CAD to the OP units and the actual CAD to the converted subordinated performance units in the one-year period ending prior to conversion. We have also granted registration rights to those persons who will be eligible to receive common shares issuable upon exchange of OP units issued in our formation transactions and certain contribution transactions.
Pursuant to the registration rights agreements, we have filed a shelf registration statement on Form S-3 to register the offer and resale of the common shares issuable upon exchange of OP units (or securities convertible into or exchangeable for OP units and we expect to file a shelf registration statement on Form S-3 to register the offer and resale of the Series A Preferred Shares issuable upon the exchange of our 6.000% Series A-1 cumulative redeemable preferred units of limiting partnership interest ("Series A-1 preferred units") in the Company's operating partnership). We have the right to include common shares to be sold for our own account or other holders in the shelf registration statement. We are required to use all commercially reasonable efforts to keep such shelf registration statement continuously effective for a period ending when all common shares covered by the shelf registration statement are no longer Registrable Shares, as defined in the shelf registration statement.
We intend to bear the expenses incident to these registration requirements except that we will not bear the costs of (i) any underwriting fees, discounts or commissions, (ii) out-of-pocket expenses of the persons exercising the registration rights or (iii) transfer taxes.
We cannot predict the effect, if any, of future sales of our common or preferred shares or the availability of shares for future sales, on the market price of our common or preferred shares. The market price of our common shares may decline significantly when the restrictions on resale by certain of our shareholders lapse. Sales of substantial amounts of common or preferred shares or the perception that such sales could occur may adversely affect the prevailing market price for our common shares.
We cannot assure our ability to pay dividends in the future.
Historically, we have paid quarterly common share dividends to our shareholders and quarterly distributions to our operating partnership unitholders, and we intend to continue to pay quarterly dividends to our shareholders and to make quarterly distributions to our operating partnership unitholders in amounts such that all or substantially all of our net taxable income in each year is distributed, which, along with other factors, should enable us to continue to qualify for the tax benefits accorded to a REIT under the Code. We have not established a minimum dividends payment level, and all future distributions will be made at the discretion of our board of trustees. Our ability to pay dividends will depend upon, among other factors:
|
•
|
the operational and financial performance of our properties;
|
|
•
|
capital expenditures with respect to existing and newly acquired properties;
|
|
•
|
general and administrative expenses associated with our operation as a publicly-held REIT;
|
|
•
|
maintenance of our REIT qualification;
|
|
•
|
the amount of, and the interest rates on, our debt and the ability to refinance our debt;
|
|
•
|
the absence of significant expenditures relating to environmental and other regulatory matters; and
|
|
•
|
other risk factors described in this Annual Report on Form 10-K.
|
Certain of these matters are beyond our control and any significant difference between our expectations and actual results could have a material adverse effect on our cash flow and our ability to make distributions to shareholders.
Future offerings of debt or equity securities, which may rank senior to our common shares, may adversely affect the market price of our common shares.
If we decide to issue debt securities in the future, which would rank senior to our common shares, it is likely that they will be governed by an indenture or other instrument containing covenants restricting our operating flexibility. Additionally, any equity securities or convertible or exchangeable securities that we issue in the future may have rights, preferences and privileges more favorable than those of our common shares and may result in dilution to owners of our common shares. We and, indirectly, our shareholders will bear the cost of issuing and servicing such securities. Because our decision to issue debt or equity securities in any future offering will depend on market conditions and other factors beyond our control, we cannot predict or estimate the amount, timing or nature of our future offerings.
31
Thus, holders of our common shares will bear the risk of our future offerings reducing the market price of our common shares and diluting the value of their share holdings in us.
Item 1B. Unresolved Staff Comments
None.
Item 2. Properties
As of
December 31, 2018
, we held ownership interests in and operated a geographically diversified portfolio of
675
self storage properties, located in 34 states and Puerto Rico, comprising approximately
43.0 million
rentable square feet, configured in approximately
345,000
storage units. Of these properties, we consolidated
499
self storage properties that contain approximately
30.4 million
rentable square feet and we held a 25% ownership interest in
176
unconsolidated real estate venture properties that contain approximately
12.6 million
rentable square feet.
The following table sets forth summary information regarding our consolidated properties by state as of
December 31, 2018
.
|
Number of
|
Number of
|
Rentable
|
% of Rentable
|
Period-end
|
|||||||||||
|
State/Territory
|
Properties
|
Units
|
Square Feet
|
Square Feet
|
Occupancy
|
||||||||||
|
California
(1)
|
83
|
|
49,569
|
|
6,226,522
|
|
20.4
|
%
|
89.2
|
%
|
|||||
|
Texas
|
60
|
|
24,150
|
|
3,417,208
|
|
11.3
|
%
|
88.0
|
%
|
|||||
|
Oregon
|
60
|
|
24,298
|
|
3,076,899
|
|
10.0
|
%
|
82.5
|
%
|
|||||
|
Georgia
|
34
|
|
14,062
|
|
1,897,977
|
|
6.3
|
%
|
87.0
|
%
|
|||||
|
Florida
|
34
|
|
23,490
|
|
2,355,949
|
|
7.8
|
%
|
86.1
|
%
|
|||||
|
North Carolina
|
33
|
|
15,394
|
|
1,885,559
|
|
6.2
|
%
|
91.8
|
%
|
|||||
|
Oklahoma
|
30
|
|
13,875
|
|
1,902,947
|
|
6.3
|
%
|
85.1
|
%
|
|||||
|
Arizona
|
29
|
|
16,062
|
|
1,825,563
|
|
6.0
|
%
|
85.9
|
%
|
|||||
|
Indiana
|
16
|
|
8,790
|
|
1,135,080
|
|
3.7
|
%
|
88.8
|
%
|
|||||
|
Kansas
|
16
|
|
5,737
|
|
762,949
|
|
2.5
|
%
|
82.8
|
%
|
|||||
|
Washington
|
15
|
|
4,950
|
|
623,996
|
|
2.1
|
%
|
83.9
|
%
|
|||||
|
Louisiana
(1)
|
14
|
|
6,323
|
|
858,719
|
|
2.8
|
%
|
83.0
|
%
|
|||||
|
Nevada
|
13
|
|
6,606
|
|
836,616
|
|
2.8
|
%
|
91.8
|
%
|
|||||
|
Colorado
|
11
|
|
5,054
|
|
615,463
|
|
2.0
|
%
|
86.8
|
%
|
|||||
|
New Hampshire
|
10
|
|
4,186
|
|
509,720
|
|
1.7
|
%
|
92.7
|
%
|
|||||
|
Ohio
|
8
|
|
3,572
|
|
454,168
|
|
1.5
|
%
|
88.9
|
%
|
|||||
|
Missouri
|
7
|
|
3,008
|
|
386,991
|
|
1.3
|
%
|
74.5
|
%
|
|||||
|
Puerto Rico
|
6
|
|
4,459
|
|
431,612
|
|
1.4
|
%
|
88.8
|
%
|
|||||
|
Illinois
|
4
|
|
1,991
|
|
270,936
|
|
0.9
|
%
|
86.6
|
%
|
|||||
|
South Carolina
|
4
|
|
1,212
|
|
147,580
|
|
0.5
|
%
|
91.6
|
%
|
|||||
|
Maryland
|
3
|
|
1,659
|
|
176,962
|
|
0.6
|
%
|
93.1
|
%
|
|||||
|
Mississippi
|
3
|
|
864
|
|
114,311
|
|
0.4
|
%
|
87.1
|
%
|
|||||
|
New Mexico
|
2
|
|
1,154
|
|
155,125
|
|
0.5
|
%
|
88.5
|
%
|
|||||
|
Alabama
|
1
|
|
762
|
|
110,616
|
|
0.4
|
%
|
85.2
|
%
|
|||||
|
Massachusetts
|
1
|
|
284
|
|
42,650
|
|
0.1
|
%
|
95.1
|
%
|
|||||
|
Virginia
|
1
|
|
598
|
|
82,495
|
|
0.3
|
%
|
82.0
|
%
|
|||||
|
Kentucky
|
1
|
|
380
|
|
60,950
|
|
0.2
|
%
|
90.7
|
%
|
|||||
|
Total/Weighted Average
|
499
|
|
242,489
|
|
30,365,563
|
|
100.0
|
%
|
87.1
|
%
|
|||||
|
(1) Five of the California properties and one of the Louisiana properties are subject to non-cancelable leasehold interest agreements that are classified as operating leases. See "Note 12. Commitments and Contingencies" in Item 8. "Financial Statements and Supplementary Data."
|
|||||||||||||||
32
The following table sets forth summary information regarding our unconsolidated real estate venture properties by state as of
December 31, 2018
.
|
Number of
|
Number of
|
Rentable
|
% of Rentable
|
Period-end
|
|||||||||||
|
State
|
Properties
|
Units
|
Square Feet
|
Square Feet
|
Occupancy
|
||||||||||
|
Florida
|
27
|
|
15,096
|
|
1,715,596
|
|
13.6
|
%
|
84.8
|
%
|
|||||
|
Michigan
|
24
|
|
15,483
|
|
1,963,048
|
|
15.6
|
%
|
87.5
|
%
|
|||||
|
New Jersey
|
15
|
|
10,519
|
|
1,225,270
|
|
9.7
|
%
|
89.8
|
%
|
|||||
|
Alabama
|
14
|
|
5,573
|
|
830,036
|
|
6.6
|
%
|
88.7
|
%
|
|||||
|
Ohio
|
14
|
|
8,778
|
|
1,064,246
|
|
8.4
|
%
|
87.6
|
%
|
|||||
|
Georgia
|
11
|
|
6,149
|
|
872,308
|
|
6.9
|
%
|
89.1
|
%
|
|||||
|
California
|
10
|
|
6,201
|
|
754,000
|
|
6.0
|
%
|
89.3
|
%
|
|||||
|
Other
(1)
|
61
|
|
35,175
|
|
4,190,622
|
|
33.2
|
%
|
84.4
|
%
|
|||||
|
Total
|
176
|
|
102,974
|
|
12,615,126
|
|
100.0
|
%
|
86.7
|
%
|
|||||
|
(1) Other states in the unconsolidated real estate ventures include Arizona, Delaware, Illinois, Massachusetts, Minnesota, Mississippi, Nevada, New Mexico, New York, Oklahoma, Pennsylvania, Rhode Island, Tennessee, Texas and Virginia.
|
|||||||
Our portfolio consists of self storage properties that are designed to offer customers convenient, affordable, and secure storage units. Generally, our properties are in highly visible locations clustered in states or markets with strong population and job growth and are specifically designed to accommodate residential and commercial tenants with features such as security systems, electronic gate entry, easy access, climate control, and pest control. Our units typically range from 25 square feet to 300 square feet, and some of our properties also offer outside storage for vehicles, boats, and equipment. We provide 24-hour access to many storage units through computer controlled access systems, as well as alarm and sprinkler systems on many of our individual storage units. Almost all of the storage units in our portfolio are leased on a month-to-month basis providing us the flexibility to increase rental rates over time as market conditions permit. Additional information on our consolidated self storage properties is contained in "Schedule III - Real Estate and Accumulated Depreciation" in this Annual Report on Form 10-K.
Item 3. Legal Proceedings
We are not currently subject to any legal proceedings that we consider to be material.
Item 4. Mine Safety Disclosures
Not applicable.
33
PART II
Item 5. Market for the Registrant's Common Equity, Related Stockholder Matters and Issuer Purchases of Equity Securities
Market Information
Our common shares have been listed and traded on the NYSE under the symbol "NSA" since April 22, 2015. Prior to that time there was no public market for our common shares.
Holders
As of February 25, 2019, the Company had 66 record holders of its common shares. The 66 holders of record do not include the beneficial owners of common shares whose shares are held by a broker or bank. Such information was obtained from our transfer agent and registrar.
Dividends
Since our initial quarter as a publicly-traded REIT, we have made regular quarterly distributions to our shareholders. Holders of common shares are entitled to receive distributions when declared by our board of trustees out of any assets legally available for that purpose. In order to maintain our status as a REIT, we are required to distribute at least 90% of our "REIT taxable income," which is generally equivalent to our net taxable ordinary income, determined without regard to the deduction for dividends paid and excluding net capital gains to our shareholders annually in order to maintain our REIT qualification for U.S. federal income tax purposes.
Common share dividends are characterized for U.S. federal income tax purposes as ordinary income, capital gains, return of capital or a combination thereof. Each year we communicate to shareholders the tax characterization of the common share dividends paid during the preceding year. Our tax return for the year ended
December 31, 2018
has not yet been filed and consequently, the taxability information presented for our dividends paid in
2018
is based upon management's estimate. The following table summarizes the taxability of our dividends per common share for the year ended
December 31, 2018
:
|
Year Ended
|
|||||||
|
December 31, 2018
|
|||||||
|
Ordinary Income
|
$
|
0.799267
|
|
68.9
|
%
|
||
|
Return of Capital
|
$
|
0.360733
|
|
31.1
|
%
|
||
|
Total
|
$
|
1.160000
|
|
100.0
|
%
|
||
Equity Compensation Plan Information
Information about our equity compensation plans is incorporated by reference to Item 12 of Part III of this Annual Report on Form 10-K.
Unregistered Sales of Equity Securities
During the
three months ended December 31, 2018
, the Company, in its capacity as general partner of its operating partnership, caused the operating partnership to issue 98,430 common shares to satisfy redemption requests from certain limited partners.
As of February 25, 2019, other than those OP units held by the Company, 32,560,314 OP units were outstanding (including 945,770 outstanding Long-Term Incentive Plan Units ("LTIP units") and 1,848,261 outstanding OP units in certain consolidated subsidiaries of the operating partnership ("DownREIT OP units"), which are convertible into, or exchangeable for, OP units on a one-for-one basis, subject to certain conditions).
These issuances were exempt from registration under Section 4(a)(2) of the Securities Act of 1933, as amended.
34
Performance Graph
The following chart compares the yearly cumulative total shareholder return for our common shares with the cumulative shareholder return of companies on (i) the S&P 500 Index, (ii) the Russell 2000 and (iii) the Nareit All Equity REIT Index as provided by Nareit for the period beginning April 23, 2015 and ending
December 31, 2018
.
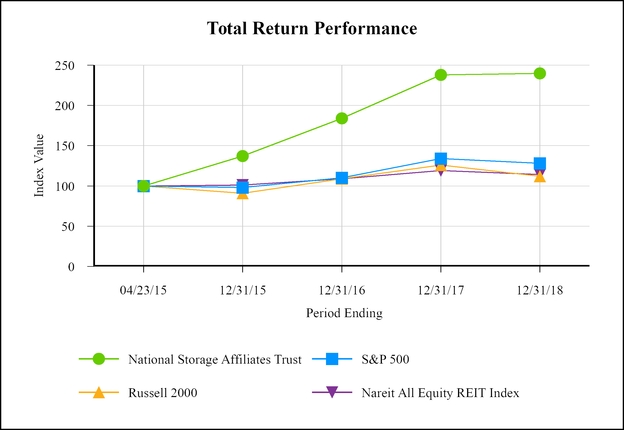
|
Period Ending
|
||||||||||||||||||||
|
Index
|
4/23/2015
|
12/31/2015
|
12/31/2016
|
12/31/2017
|
12/31/2018
|
|||||||||||||||
|
National Storage Affiliates Trust
|
$
|
100
|
|
$
|
137
|
|
$
|
184
|
|
$
|
238
|
|
$
|
240
|
|
|||||
|
S&P 500
|
100
|
|
98
|
|
110
|
|
134
|
|
128
|
|
||||||||||
|
Russell 2000
|
100
|
|
91
|
|
109
|
|
126
|
|
112
|
|
||||||||||
|
Nareit All Equity REIT Index
|
100
|
|
101
|
|
109
|
|
119
|
|
114
|
|
||||||||||
The foregoing item assumes $100.00 invested on April 23, 2015, with dividends reinvested. The Performance Graph will not be deemed to be incorporated by reference into any filing by NSA under the Securities Act of 1933, as amended, or the Securities Exchange Act of 1934, as amended, except to the extent that NSA specifically incorporates the same by reference.
35
Item 6. Selected Financial Data
The following table sets forth our selected historical financial and operating data as of and for the periods indicated. You should read the information below in conjunction with the financial statements and notes thereto included in Item 8. "Financial Statements and Supplementary Data" and Item 7. "Management's Discussion and Analysis of Financial Condition and Results of Operations" in this Annual Report on Form 10-K or in previous filings with the SEC. Dollars in the following table are in thousands, except per share amounts.
|
Year Ended December 31,
|
|||||||||||||||||||
|
2018
|
2017
|
2016
|
2015
|
2014
|
|||||||||||||||
|
OPERATING DATA:
|
|||||||||||||||||||
|
Total revenue
|
$
|
330,896
|
|
$
|
268,130
|
|
$
|
199,046
|
|
$
|
133,919
|
|
$
|
76,970
|
|
||||
|
Total operating expenses
|
229,242
|
|
189,630
|
|
141,390
|
|
102,328
|
|
59,887
|
|
|||||||||
|
Income from operations
|
101,654
|
|
78,500
|
|
57,656
|
|
31,591
|
|
17,083
|
|
|||||||||
|
Net income (loss)
|
56,326
|
|
45,998
|
|
24,866
|
|
4,796
|
|
(16,357
|
)
|
|||||||||
|
Net (income) loss attributable to noncontrolling interests
(1)
|
(42,217
|
)
|
(43,037
|
)
|
(6,901
|
)
|
7,644
|
|
16,357
|
|
|||||||||
|
Net income (loss) attributable to the Company
|
14,109
|
|
2,961
|
|
17,965
|
|
12,440
|
|
—
|
|
|||||||||
|
Earnings (loss) per share—basic
|
$
|
0.07
|
|
$
|
0.01
|
|
$
|
0.60
|
|
$
|
0.80
|
|
$
|
—
|
|
||||
|
Earnings (loss) per share—diluted
|
$
|
0.07
|
|
$
|
0.01
|
|
$
|
0.31
|
|
$
|
0.17
|
|
$
|
—
|
|
||||
|
Weighted average shares outstanding—basic (in thousands)
|
53,293
|
|
44,423
|
|
29,887
|
|
15,463
|
|
1
|
|
|||||||||
|
Weighted average shares outstanding—diluted (in thousands)
|
53,293
|
|
44,423
|
|
78,747
|
|
45,409
|
|
1
|
|
|||||||||
|
Dividends declared per common share
|
$
|
1.16
|
|
$
|
1.04
|
|
$
|
0.88
|
|
$
|
0.54
|
|
$
|
—
|
|
||||
|
BALANCE SHEET DATA (at end of period)
|
|||||||||||||||||||
|
Self storage properties, net
|
$
|
2,391,462
|
|
$
|
2,104,875
|
|
$
|
1,733,533
|
|
$
|
1,079,101
|
|
$
|
799,327
|
|
||||
|
Total assets
|
2,729,263
|
|
2,266,730
|
|
1,892,092
|
|
1,099,049
|
|
832,746
|
|
|||||||||
|
Debt financing
|
1,278,102
|
|
958,097
|
|
878,954
|
|
567,795
|
|
597,691
|
|
|||||||||
|
Total equity (deficit)
|
$
|
1,402,299
|
|
$
|
1,271,487
|
|
$
|
979,068
|
|
$
|
516,047
|
|
$
|
214,104
|
|
||||
|
OTHER DATA (at end of period)
|
|||||||||||||||||||
|
Number of properties
(2)
|
499
|
|
444
|
|
382
|
|
277
|
|
219
|
|
|||||||||
|
Rentable square feet (in thousands)
(3)
|
30,366
|
|
27,182
|
|
23,077
|
|
15,770
|
|
12,067
|
|
|||||||||
|
Occupancy percentage
(4)
|
87
|
%
|
87
|
%
|
88
|
%
|
89
|
%
|
85
|
%
|
|||||||||
|
(1) While we control our operating partnership, we did not have an ownership interest or share in our operating partnership's profits and losses prior to the completion of our initial public offering. As a result, all of our operating partnership's profits and losses for the year ended December 31, 2014 were allocated to owners other than us.
|
|||||||
|
(2) For a discussion of our acquisition and disposition activity during the years ended December 31, 2018 and 2017, see "Note 6. Self Storage Property Acquisitions and Dispositions" in Item 8. "Financial Statements and Supplementary Data."
|
|||||||
|
(3) Rentable square feet includes all enclosed self storage units but excludes commercial, residential, and covered parking space.
|
|||||||
|
(4) Represents total occupied rentable square feet divided by total rentable square feet as of the end of the period.
|
|||||||
36
Item 7. Management's Discussion and Analysis of Financial Condition and Results of Operations
You should read the following discussion and analysis of our financial condition and results of operations in conjunction with the financial statements and notes thereto included in Item 8. "Financial Statements and Supplementary Data" as well as Item 1. "Business," Item 1A. "Risk Factors," and Item 2. "Properties," respectively, in this Annual Report on Form 10-K.
Overview
National Storage Affiliates Trust is a fully integrated, self-administered and self-managed real estate investment trust organized in the state of Maryland on May 16, 2013. We have elected and we believe that we have qualified to be taxed as a REIT commencing with our taxable year ended December 31, 2015. We serve as the sole general partner of our operating partnership, a Delaware limited partnership formed on February 13, 2013 to conduct our business, which is focused on the ownership, operation, and acquisition of self storage properties located within the top 100 MSAs throughout the United States.
Our Structure
Our structure promotes operator accountability as subordinated performance units issued to our PROs in exchange for the contribution of their properties are entitled to distributions only after those properties satisfy minimum performance thresholds. In the event of a material reduction in operating cash flow, distributions on our subordinated performance units will be reduced before or disproportionately to distributions on our common shares held by our common shareholders. In addition, we expect our PROs will generally co-invest subordinated equity in the form of subordinated performance units in each acquisition that they source, and the value of these subordinated performance units will fluctuate with the performance of their managed portfolios. Therefore, our PROs are incentivized to select acquisitions that are expected to exceed minimum performance thresholds, thereby increasing the value of their subordinated equity stake. We expect that our shareholders will benefit from the higher levels of property performance that our PROs are incentivized to deliver.
Our PROs
We had
eight
PROs as of
December 31, 2018
: SecurCare, Northwest, Optivest, Guardian, Move It, Storage Solutions, Hide Away and Personal Mini. In January 2019, we completed the initial contribution transaction with Southern to add Southern as our ninth PRO. In addition, in February 2019, we entered into definitive agreements to add Moove In as our tenth PRO. We expect the initial contribution transaction and related closing documentation with Moove In, including the entry into a facilities portfolio management agreement, to close during the first quarter of 2019, subject to customary closing conditions.
We seek to further expand our platform by continuing to recruit additional established self storage operators, while integrating our operations through the implementation of centralized initiatives, including management information systems, revenue enhancement, and cost optimization programs. Our national platform allows us to capture cost savings by eliminating redundancies and utilizing economies of scale across the property management platforms of our PROs while also providing greater access to lower-cost capital.
Our Consolidated Properties
We seek to own properties that are well located in high quality sub-markets with highly accessible street access and attractive supply and demand characteristics, providing our properties with strong and stable cash flows that are less sensitive to the fluctuations of the general economy. Many of these markets have multiple barriers to entry against increased supply, including zoning restrictions against new construction and new construction costs that we believe are higher than our properties' fair market value.
As of
December 31, 2018
, we owned a geographically diversified portfolio of
499
self storage properties, located in
26
states and Puerto Rico, comprising approximately
30.4 million
rentable square feet, configured in approximately
242,000
storage units. Of these properties, 247 were acquired by us from our PROs and 252 were acquired by us from third-party sellers.
Our Unconsolidated Real Estate Ventures
We seek to opportunistically partner with institutional funds and other institutional investors to acquire attractive portfolios utilizing a promoted return structure. We believe there is significant opportunity for continued external growth by partnering with institutional investors seeking to deploy capital in the self storage industry.
37
2018 Joint Venture
During the year ended December 31, 2018, we formed the 2018 Joint Venture, in which we have a 25% ownership interest, with an affiliate of Heitman America Real Estate REIT LLC. In September 2018, the 2018 Joint Venture completed the acquisition of a Portfolio of 112 self storage properties located across 17 states and Puerto Rico, consisting of approximately 8.2 million rentable square feet configured in over 68,000 storage units for an aggregate purchase price of approximately $1.325 billion.
Immediately following the closing of the acquisition, the 2018 Joint Venture distributed the
six
self storage properties located in Puerto Rico and a single self storage property located in Ohio included in the Portfolio to us in exchange for a
$64.2 million
cash contribution from us. In addition,
two
of the properties acquired in the Portfolio were combined with other properties for operational efficiency. As of
December 31, 2018
, our 2018 Joint Venture owned and operated a portfolio of
103
properties containing approximately
7.6 million
rentable square feet, configured in approximately
63,000
storage units and located across
17
states.
2016 Joint Venture
As of
December 31, 2018
, our 2016 Joint Venture, in which we have a 25% ownership interest, owned and operated a portfolio of
73
properties containing approximately
4.9 million
rentable square feet, configured in approximately
40,000
storage units and located across
14
states.
During the
year
ended
December 31, 2018
, our 2016 Joint Venture acquired
three
self storage properties and an expansion project at an existing property for
$28.5 million
, comprising approximately 0.2 million rentable square feet, configured in approximately 1,300 storage units. During the
year
ended
December 31, 2018
, our 2016 Joint Venture sold to an unrelated third party
one
self storage property for
$9.3 million
, comprising approximately 0.2 million rentable square feet, configured in approximately 800 storage units.
Our Property Management Platform
Through our property management platform, we direct, manage and control the day-to-day operations and affairs of certain consolidated properties and our unconsolidated real estate ventures. We earn certain customary fees for managing and operating the properties in the unconsolidated real estate ventures and we facilitate tenant insurance and/or tenant warranty protection programs for tenants at these properties in exchange for half of all proceeds from such programs.
As of December 31, 2018, our property management platform managed and controlled 39 of our consolidated properties in select markets in California, Illinois, Kansas, Maryland, Missouri, Ohio, Virginia and Puerto Rico. In January 2019, Southern began managing our six properties located in Puerto Rico.
Results of Operations
When reviewing our results of operations it is important to consider the timing of acquisition activity. We acquired
57
self storage properties during the
year
ended
December 31, 2018
and
65
self storage properties during the year ended
December 31, 2017
. As a result of these and other factors, we do not believe that our historical results of operations discussed and analyzed below are comparable or necessarily indicative of our future results of operations or cash flows.
To help analyze the operating performance of our self storage properties, we also discuss and analyze operating results relating to our same store portfolio. Our same store portfolio is defined as those properties owned and operated since the first day of the earliest year presented, excluding any properties sold, expected to be sold or subject to significant changes such as expansions or casualty events which cause the portfolio's year-over-year operating results to no longer be comparable.
The following discussion and analysis of the results of our operations and financial condition should be read in conjunction with the accompanying consolidated financial statements in Item 8. Certain figures, such as interest rates and other percentages, included in this section have been rounded for ease of presentation. Percentage figures included in this section have not in all cases been calculated on the basis of such rounded figures but on the basis of such amounts prior to rounding. For this reason, percentage amounts in this section may vary slightly from those obtained by performing the same calculations using the figures in our consolidated financial statements or in the associated text. Certain other amounts that appear in this section may similarly not sum due to rounding.
38
Year Ended
December 31, 2018
compared to the Year Ended
December 31, 2017
Net income was
$56.3 million
for the year ended
December 31, 2018
, compared to
$46.0 million
for the year ended
December 31, 2017
, an
increase
of
$10.3 million
. The
increase
was primarily due to an increase in net operating income ("NOI") resulting from self storage properties acquired during
2017
and
2018
, increases in management fees and other revenue, partially offset by increases in depreciation and amortization, interest expense and general and administrative expenses. For a description of NOI, see "
Non-GAAP Financial measures – NOI
".
Overview
As of
December 31, 2018
, our same store portfolio consisted of
376
self storage properties. See "---Results of Operations" above for the definition of our same store portfolio. The following table illustrates the changes in rental revenue, other property-related revenue, management fees and other revenue, property operating expenses, and other expenses for the
year ended December 31, 2018
compared to the
year ended December 31, 2017
(dollars in thousands):
|
Year Ended December 31,
|
|||||||||||
|
2018
|
2017
|
Change
|
|||||||||
|
Rental revenue
|
|||||||||||
|
Same store portfolio
|
$
|
243,781
|
|
$
|
234,321
|
|
$
|
9,460
|
|
||
|
Non-same store portfolio
|
64,622
|
|
17,493
|
|
47,129
|
|
|||||
|
Total rental revenue
|
308,403
|
|
251,814
|
|
56,589
|
|
|||||
|
Other property-related revenue
|
|||||||||||
|
Same store portfolio
|
8,030
|
|
7,753
|
|
277
|
|
|||||
|
Non-same store portfolio
|
2,153
|
|
502
|
|
1,651
|
|
|||||
|
Total other property-related revenue
|
10,183
|
|
8,255
|
|
1,928
|
|
|||||
|
Property operating expenses
|
|||||||||||
|
Same store portfolio
|
79,591
|
|
77,576
|
|
2,015
|
|
|||||
|
Non-same store portfolio
|
24,284
|
|
6,879
|
|
17,405
|
|
|||||
|
Total property operating expenses
|
103,875
|
|
84,455
|
|
19,420
|
|
|||||
|
Net operating income
|
|||||||||||
|
Same store portfolio
|
172,220
|
|
164,498
|
|
7,722
|
|
|||||
|
Non-same store portfolio
|
42,491
|
|
11,116
|
|
31,375
|
|
|||||
|
Total net operating income
|
214,711
|
|
175,614
|
|
39,097
|
|
|||||
|
Management fees and other revenue
|
12,310
|
|
8,061
|
|
4,249
|
|
|||||
|
General and administrative expenses
|
(36,220
|
)
|
(30,060
|
)
|
(6,160
|
)
|
|||||
|
Depreciation and amortization
|
(89,147
|
)
|
(75,115
|
)
|
(14,032
|
)
|
|||||
|
Income from operations
|
101,654
|
|
78,500
|
|
23,154
|
|
|||||
|
Other (expense) income
|
|||||||||||
|
Interest expense
|
(42,724
|
)
|
(34,068
|
)
|
(8,656
|
)
|
|||||
|
Equity in losses of unconsolidated real estate ventures
|
(1,423
|
)
|
(2,339
|
)
|
916
|
|
|||||
|
Acquisition costs
|
(663
|
)
|
(593
|
)
|
(70
|
)
|
|||||
|
Non-operating expense
|
(91
|
)
|
(58
|
)
|
(33
|
)
|
|||||
|
Gain on sale of self storage properties
|
391
|
|
5,715
|
|
(5,324
|
)
|
|||||
|
Other expense
|
(44,510
|
)
|
(31,343
|
)
|
(13,167
|
)
|
|||||
|
Income before income taxes
|
57,144
|
|
47,157
|
|
9,987
|
|
|||||
|
Income tax expense
|
(818
|
)
|
(1,159
|
)
|
341
|
|
|||||
|
Net income
|
56,326
|
|
45,998
|
|
10,328
|
|
|||||
|
Net income attributable to noncontrolling interests
|
(42,217
|
)
|
(43,037
|
)
|
820
|
|
|||||
|
Net income attributable to National Storage Affiliates Trust
|
14,109
|
|
2,961
|
|
11,148
|
|
|||||
|
Distributions to preferred shareholders
|
(10,350
|
)
|
(2,300
|
)
|
(8,050
|
)
|
|||||
39
|
Year Ended December 31,
|
|||||||||||
|
2018
|
2017
|
Change
|
|||||||||
|
Net income attributable common shareholders
|
$
|
3,759
|
|
$
|
661
|
|
$
|
3,098
|
|
||
Total Revenue
Our total revenue
increased
by
$62.8 million
, or
23.4%
, for the
year ended December 31, 2018
, as compared to the
year ended December 31, 2017
. This
increase
was primarily attributable to incremental rental revenue from self storage properties acquired during
2017
and
2018
, regular rental increases for in-place tenants, and management fees and other revenue earned from our unconsolidated real estate ventures, partially offset by a
decrease
in average total portfolio occupancy from
88.9%
to
88.3%
. Average occupancy is calculated based on the average of the month-end occupancy immediately preceding the period presented and the month-end occupancies included in the respective period presented.
Rental Revenue
Rental revenue
increased
by
$56.6 million
, or
22.5%
, for the
year ended December 31, 2018
, as compared to the
year ended December 31, 2017
. The
increase
in rental revenue was due to a
$47.1 million
increase
in non-same store rental revenue which was primarily attributable to incremental rental revenue of $21.3 million from 57 self storage properties acquired during
2018
, and $26.9 million from 65 self storage properties acquired during
2017
. Same store portfolio rental revenues
increased
$9.5 million
, or
4.0%
, due to a
4.1%
increase
, from
$11.55
to
$12.02
, in same store rental revenue divided by average occupied square feet ("rental revenue per occupied square foot"), driven primarily by increased contractual lease rates for in-place tenants and fees.
Other Property-Related Revenue
Other property-related revenue represents ancillary income from our self storage properties, such as tenant insurance-related access fees and sales of storage supplies. Other property-related revenue
increased
by
$1.9 million
, or
23.4%
, for the
year ended December 31, 2018
, as compared to the
year ended December 31, 2017
. This
increase
primarily resulted from a
$1.7 million
increase
in non-same store other property-related revenue which was attributable to incremental other property-related revenue of $0.6 million from 57 self storage properties acquired during
2018
, and $1.1 million from 65 self storage properties acquired during
2017
.
Management Fees and Other Revenue
Management and other fees, which are primarily related to managing and operating our unconsolidated real estate ventures, were
$12.3 million
for the
year ended December 31, 2018
, compared to
$8.1 million
for the
year ended December 31, 2017
, an
increase
of
$4.2 million
, or
52.7%
. This increase was primarily attributable to incremental fees earned from the 2018 Joint Venture following the acquisition of the 2018 Joint Venture portfolio in September 2018.
Total Operating Expenses
Total operating expenses
increase
d
$39.6 million
, or
20.9%
, for the
year ended December 31, 2018
, compared to the
year ended December 31, 2017
. As discussed below, this change was primarily due to an
increase
of
$19.4 million
in property operating expenses,
$6.2 million
in general and administrative expenses, and
$14.0 million
in depreciation and amortization.
Property Operating Expenses
Property operating expenses
increase
d
$19.4 million
, or
23.0%
, for the
year ended December 31, 2018
compared to the
year ended December 31, 2017
. This
increase
resulted from a
$17.4 million
increase
in non-same store property operating expenses primarily attributable to incremental property operating expenses of $7.4 million from 57 self storage properties acquired during
2018
, and $10.6 million from 65 self storage properties acquired during
2017
. In addition, same store portfolio property operating expenses
increased
$2.0 million
, or
2.6%
, due to increases in property taxes, personnel expenses and repairs and maintenance expenses.
General and Administrative Expenses
General and administrative expenses
increased
$6.2 million
, or
20.5%
, for the
year ended December 31, 2018
, compared to the
year ended December 31, 2017
. This
increase
was attributable to
increase
s in supervisory and administrative fees charged by our PROs of
$2.5 million
primarily as a result of incremental fees related to the self
40
storage properties we acquired in 2018 and 2017, payroll and related costs of $2.3 million, of which $1.0 million is directly related to our property management platform and other general and administrative expenses of $1.4 million.
Depreciation and Amortization
Depreciation and amortization
increased
$14.0 million
, or
18.7%
, for the
year ended December 31, 2018
, compared to the
year ended December 31, 2017
. The
increase
was primarily attributable to incremental depreciation expense related to the self storage properties we acquired in 2018 and 2017. This increase was partially offset by a $1.9 million decrease in amortization of customer in-place leases from $13.5 million for the
year ended December 31, 2017
to $11.6 million for the
year ended December 31, 2018
.
Interest Expense
Interest expense
increased
$8.7 million
, or
25.4%
, for the
year ended December 31, 2018
, compared to the
year ended December 31, 2017
. The
increase
in interest expense was primarily due to higher outstanding borrowings under the Revolver, higher interest rates on variable-rate debt, $275.0 million of additional term loan borrowings during the
year ended December 31, 2018
and an $84.9 million secured debt financing we entered into during August 2017.
Equity In Losses Of Unconsolidated Real Estate Venture
Equity in losses of unconsolidated real estate venture represents our share of earnings and losses earned through our 25% ownership interests in the 2018 Joint Venture and the 2016 Joint Venture. During the
year ended December 31, 2018
, we recorded
$1.4 million
of equity in losses from our unconsolidated real estate ventures compared to
$2.3 million
of equity in losses for the
year ended December 31, 2017
. This was primarily the result of decreases in amortization of customer in-place leases recorded by our 2016 Joint Venture during the
year ended December 31, 2018
compared to the
year ended December 31, 2017
, offset by incremental losses from our 2018 Joint Venture following its formation in September 2018.
Gain On Sale of Self Storage Properties
Gain on sale of self storage properties was
$0.4 million
for the
year ended December 31, 2018
, compared to
$5.7 million
for the
year ended December 31, 2017
. During the
year ended December 31, 2018
, we sold two self storage properties to unrelated third parties for gross proceeds of
$5.5 million
and during the
year ended December 31, 2017
, we sold three self storage properties and improved land adjacent to self storage properties for gross proceeds of
$17.8 million
.
Income Tax Expense
Income tax expense
decreased
$0.3 million
, or
29.4%
, for the
year ended December 31, 2018
, compared to the
year ended December 31, 2017
. The
decrease
in income tax expense was primarily due to decreases in our tax provision for our TRS, partially offset by increases in certain state and local taxes related to growth in our portfolio.
Net Income Attributable to Noncontrolling Interests
As discussed in Note
2
to the consolidated financial statements in Item 8, we allocate U.S. generally accepted accounting principles ("GAAP") income (loss) utilizing the hypothetical liquidation at book value ("HLBV") method, in which we allocate income or loss based on the change in each unitholders' claim on the net assets of our operating partnership at period end after adjusting for any distributions or contributions made during such period.
Due to the stated liquidation priorities and because the HLBV method incorporates non-cash items such as depreciation expense, in any given period, income or loss may be allocated disproportionately to noncontrolling interests. Net income attributable to noncontrolling interests was
$14.1 million
for the
year ended December 31, 2018
, compared to
$3.0 million
for the
year ended December 31, 2017
.
Distributions to Preferred Shareholders
During the
year ended December 31, 2018
, we paid
$10.4 million
of distributions to our preferred shareholders, compared to
$2.3 million
during the
year ended December 31, 2017
. These amounts represent quarterly distributions paid to the holders of our Series A Preferred Shares, which we issued in October 2017.
41
Year Ended
December 31, 2017
compared to the Year Ended
December 31, 2016
Net income was $46.0 million for the year ended December 31, 2017, compared to $24.9 million for the year ended December 31, 2016, an increase of $21.1 million. The increase was primarily due to an increase in NOI resulting from self storage properties acquired during 2016 and 2017, increases in management fees and other revenue, gains from the sale of self storage properties and decreases in acquisition costs, partially offset by increases in depreciation and amortization, interest expense and general and administrative expenses.
Overview
As of December 31, 2017, our same store portfolio consisted of 277 self storage properties which consists of only those properties that were included in our consolidated financial statements since January 1, 2016. See "---Results of Operations" above for the definition of our same store portfolio. The following table illustrates the changes in rental revenue, other property-related revenue, management fees and other revenue, property operating expenses, and other expenses for the year ended December 31, 2017 compared to the year ended December 31, 2016 (dollars in thousands):
|
Year Ended December 31,
|
|||||||||||
|
2017
|
2016
|
Change
|
|||||||||
|
Rental revenue
|
|||||||||||
|
Same store portfolio
|
$
|
165,858
|
|
$
|
157,097
|
|
$
|
8,761
|
|
||
|
Non-same store portfolio
|
85,956
|
|
34,081
|
|
51,875
|
|
|||||
|
Total rental revenue
|
251,814
|
|
191,178
|
|
60,636
|
|
|||||
|
Other property-related revenue
|
|||||||||||
|
Same store portfolio
|
5,468
|
|
5,012
|
|
456
|
|
|||||
|
Non-same store portfolio
|
2,787
|
|
1,047
|
|
1,740
|
|
|||||
|
Total other property-related revenue
|
8,255
|
|
6,059
|
|
2,196
|
|
|||||
|
Property operating expenses
|
|||||||||||
|
Same store portfolio
|
53,045
|
|
52,034
|
|
1,011
|
|
|||||
|
Non-same store portfolio
|
31,410
|
|
12,764
|
|
18,646
|
|
|||||
|
Total property operating expenses
|
84,455
|
|
64,798
|
|
19,657
|
|
|||||
|
Net operating income
|
|||||||||||
|
Same store portfolio
|
118,281
|
|
110,075
|
|
8,206
|
|
|||||
|
Non-same store portfolio
|
57,333
|
|
22,364
|
|
34,969
|
|
|||||
|
Total net operating income
|
175,614
|
|
132,439
|
|
43,175
|
|
|||||
|
Management fees and other revenues
|
8,061
|
|
1,809
|
|
6,252
|
|
|||||
|
General and administrative expenses
|
(30,060
|
)
|
(21,528
|
)
|
(8,532
|
)
|
|||||
|
Depreciation and amortization
|
(75,115
|
)
|
(55,064
|
)
|
(20,051
|
)
|
|||||
|
Income from operations
|
78,500
|
|
57,656
|
|
20,844
|
|
|||||
|
Other (expense) income
|
|||||||||||
|
Interest expense
|
(34,068
|
)
|
(24,109
|
)
|
(9,959
|
)
|
|||||
|
Loss on early extinguishment of debt
|
—
|
|
(136
|
)
|
136
|
|
|||||
|
Equity in losses of unconsolidated real estate venture
|
(2,339
|
)
|
(1,484
|
)
|
(855
|
)
|
|||||
|
Acquisition costs
|
(593
|
)
|
(6,546
|
)
|
5,953
|
|
|||||
|
Non-operating expense
|
(58
|
)
|
(147
|
)
|
89
|
|
|||||
|
Gain on sale of self storage properties
|
5,715
|
|
—
|
|
5,715
|
|
|||||
|
Other expense
|
(31,343
|
)
|
(32,422
|
)
|
1,079
|
|
|||||
|
Income before income taxes
|
47,157
|
|
25,234
|
|
21,923
|
|
|||||
|
Income tax expense
|
(1,159
|
)
|
(368
|
)
|
(791
|
)
|
|||||
|
Net income
|
45,998
|
|
24,866
|
|
21,132
|
|
|||||
|
Net income attributable to noncontrolling interests
|
(43,037
|
)
|
(6,901
|
)
|
(36,136
|
)
|
|||||
|
Net income attributable to National Storage Affiliates Trust
|
$
|
2,961
|
|
$
|
17,965
|
|
(15,004
|
)
|
|||
42
|
Distributions to preferred shareholders
|
$
|
(2,300
|
)
|
$
|
—
|
|
$
|
(2,300
|
)
|
||
|
Net income attributable to common shareholders
|
$
|
661
|
|
$
|
17,965
|
|
$
|
(17,304
|
)
|
||
Our total revenue increased by $69.1 million, or 34.7%, for the year ended December 31, 2017, as compared to the year ended December 31, 2016. This increase was primarily attributable to incremental rental revenue from self storage properties acquired during 2016 and 2017, regular rental increases for in-place tenants, and management fees and other revenue earned from our Joint Venture, partially offset by a decrease in average total portfolio occupancy from 89.7% to 88.9%. Average occupancy is calculated based on the average of the month-end occupancy immediately preceding the period presented and the month-end occupancies included in the respective period presented.
Rental Revenue
Rental revenue increased by $60.6 million, or 31.7%, for the year ended December 31, 2017, as compared to the year ended December 31, 2016. The increase in rental revenue was due to a $51.9 million increase in non-same store rental revenue which was primarily attributable to incremental rental revenue of $15.1 million from 65 self storage properties acquired during 2017, and $36.7 million from 107 self storage properties acquired during 2016. Same store portfolio rental revenues increased $8.8 million, or 5.6%, due to a 5.8% increase, from $11.02 to $11.66, in same store rental revenue per occupied square foot, driven primarily by increased contractual lease rates and fees.
Other Property-Related Revenue
Other property-related revenue represents ancillary income from our self storage properties, such as tenant insurance-related access fees and sales of storage supplies. Other property-related revenue increased by $2.2 million, or 36.2%, for the year ended December 31, 2017, as compared to the year ended December 31, 2016. This increase resulted from a $1.7 million increase in non-same store other property-related revenue which was primarily attributable to incremental other property-related revenue of $0.4 million from 65 self storage properties acquired during 2017, and $1.3 million from 107 self storage properties acquired during 2016.
Management Fees and Other Revenue
Management fees and other revenue increased by $6.3 million, for the year ended December 31, 2017, as compared to the year ended December 31, 2016. The increase primarily resulted from a full year's worth of management and other fees for managing and operating the 2016 Joint Venture, which began its operations on October 4, 2016. The 2016 Joint Venture pays certain customary fees to us for managing and operating the 2016 Joint Venture properties, including property management fees, call center fees, platform fees and acquisition fees.
Total Operating Expenses
Total operating expenses increased $48.2 million, or 34.1%, for the year ended December 31, 2017, compared to the year ended December 31, 2016. As discussed below, this change was primarily due to an increase of $19.7 million in property operating expenses (which included $0.2 million of clean-up costs from hurricanes Harvey and Irma), $8.5 million in general and administrative expenses, and $20.1 million in depreciation and amortization.
Property Operating Expenses
Property operating expenses increased $19.7 million, or 30.3%, for the year ended December 31, 2017 compared to the year ended December 31, 2016. This increase resulted from a $18.6 million increase in non-same store property operating expenses primarily attributable to incremental property operating expenses of $5.7 million from 65 self storage properties acquired during 2017, and $12.9 million from 107 self storage properties acquired during 2016. In addition, same store portfolio property operating expenses increased $1.0 million, or 1.9%, due to increases in property taxes and repairs and maintenance expenses.
General and Administrative Expenses
General and administrative expenses increased $8.5 million, or 39.6%, for the year ended December 31, 2017, compared to the year ended December 31, 2016. This increase was attributable to increases in supervisory and administrative fees charged by our PROs of $3.4 million primarily as a result of incremental fees related to the self storage properties we acquired in 2016 and 2017, costs related to our property management platform of $2.7 million, salaries and benefits of $1.2 million and equity-based compensation expense of $1.2 million.
43
Depreciation and Amortization
Depreciation and amortization increased $20.1 million, or 36.4%, for the year ended December 31, 2017, compared to the year ended December 31, 2016. This increase was attributable to incremental depreciation expense related to the self storage properties we acquired in 2016 and 2017. In addition, amortization of customer in-place leases increased $1.5 million from $12.0 million for the year ended December 31, 2016 to $13.5 million for the year ended December 31, 2017.
Interest Expense
Interest expense increased $10.0 million, or 41.3%, for the year ended December 31, 2017, compared to the year ended December 31, 2016. The increase in interest expense was primarily due to higher interest rates on the Revolver, the new Term Loan C borrowing during February 2017, a new $84.9 million secured debt financing we entered into during August 2017 and a $0.5 million decrease in amortization of debt premiums.
Loss On Early Extinguishment of Debt
Loss on early extinguishment of debt decreased $0.1 million for the year ended December 31, 2017, compared to the year ended December 31, 2016. During the year ended December 31, 2016, in connection with an amendment to our credit facility, one of the lenders that was included in the syndicated group of lenders prior to the amendment is no longer a participating lender following the amendment, which constitutes an extinguishment of debt for accounting purposes. As a result, we wrote off $0.1 million of unamortized debt issuance costs, which is the amount attributed to the lender no longer included in the lending syndicate.
Equity In Losses Of Unconsolidated Real Estate Ventures
During the year ended December 31, 2017, we recorded $2.3 million of equity in losses from our 2016 Joint Venture compared to $1.5 million for the year ended December 31, 2016. The increase of $0.9 million of equity in losses can be attributed to a full year's worth of operations at the 2016 Joint Venture. Equity in losses of unconsolidated real estate venture represents our share of earnings and losses earned through our 25% ownership interest in the 2016 Joint Venture. The 2016 Joint Venture recorded net losses of $9.4 million during the year ended December 31, 2017, primarily due to NOI of $36.3 million, offset by $29.2 million of depreciation and amortization, $11.4 million of interest expense and $5.1 million of supervisory, administrative, acquisition and other expenses. The 2016 Joint Venture recorded net losses of $5.9 million during the year ended year ended December 31, 2016, primarily due to NOI of $8.3 million, offset by $6.2 million of depreciation and amortization, $4.3 million of other expenses, primarily consisting of acquisition costs associated with the acquisition of the 2016 Joint Venture portfolio, $2.8 million of interest expense and $0.9 million of supervisory, administrative and other expenses.
Acquisition Costs
Acquisition costs decreased $6.0 million, or 90.9%, for the year ended December 31, 2017, compared to the year ended December 31, 2016. This decrease was due to a reduction in the number of properties acquired and the adoption of ASU 2017-01 during the year ended December 31, 2017. As a result of the adoption of ASU 2017-01, the self storage properties acquired during the year ended December 31, 2017 were accounted for as asset acquisitions, and accordingly, $3.6 million of acquisition costs related to the self storage property acquisitions during the year ended December 31, 2017 were capitalized as part of the basis of the acquired properties.
Gain On Sale of Self Storage Properties
Gain on sale of self storage properties increased $5.7 million for the year ended December 31, 2017, compared to the year ended December 31, 2016. This increase resulted from the sale of three self storage properties and improved land adjacent to self storage properties during the year ended December 31, 2017 for gross proceeds of $17.8 million.
Income Tax Expense
Income tax expense increased $0.8 million, or 214.9%, for the year ended December 31, 2017, compared to the year ended December 31, 2016. The increase in income tax expense was primarily related to growth in the Company's portfolio contributing to increases in certain state and local taxes that are considered income-based taxes and increases in the Company's tax provision for its TRS, through which the Company provides management and other services to the 2016 Joint Venture as well as other activities.
44
Net Income Attributable to Noncontrolling Interests
As discussed in Note 2 to the consolidated financial statements in Item 8, we allocate GAAP income (loss) utilizing the HLBV method, in which we allocate income or loss based on the change in each unitholders' claim on the net assets of our operating partnership at period end after adjusting for any distributions or contributions made during such period.
Due to the stated liquidation priorities and because the HLBV method incorporates non-cash items such as depreciation expense, in any given period, income or loss may be allocated disproportionately to noncontrolling interests. Net income attributable to noncontrolling interests was $43.0 million for the year ended December 31, 2017, compared to $6.9 million for the year ended December 31, 2016.
Distributions to Preferred Shareholders
During the year ended December 31, 2017, we paid $2.3 million of distributions to our preferred shareholders, which represents a prorated quarterly distribution resulting from the issuance of our Series A Preferred Shares on October 11, 2017.
Critical Accounting Policies and Use of Estimates
Our financial statements have been prepared on the accrual basis of accounting in accordance with GAAP. The preparation of these financial statements requires us to make estimates and assumptions that affect the reported amounts of assets and liabilities and disclosure of contingent assets and liabilities at the date of the financial statements and the reported amounts of revenues and expenses during the reporting period. On an ongoing basis, we evaluate our estimates and assumptions, including those that impact our most critical accounting policies. We base our estimates and assumptions on historical experience and on various other factors that we believe are reasonable under the circumstances. Actual results may differ from these estimates. We believe the following are our most critical accounting policies.
Principles of Consolidation and Presentation of Noncontrolling Interests
Our consolidated financial statements include the accounts of our operating partnership and its controlled subsidiaries. All significant intercompany balances and transactions have been eliminated in the consolidation of entities.
The limited partner ownership interests in our operating partnership that are held by owners other than us are referred to as noncontrolling interests. Noncontrolling interests also include ownership interests in DownREIT partnerships held by entities other than our operating partnership. Noncontrolling interests in a subsidiary are generally reported as a separate component of equity in our consolidated balance sheets. In our statements of operations, the revenues, expenses and net income or loss related to noncontrolling interests in our operating partnership are included in the consolidated amounts, with net income or loss attributable to the noncontrolling interests deducted separately to arrive at the net income or loss solely attributable to us.
When we obtain an economic interest in an entity, we evaluate the entity to determine if the entity is deemed a variable interest entity ("VIE"), and if we are deemed to be the primary beneficiary, in accordance with authoritative guidance issued on the consolidation of VIEs. When an entity is not deemed to be a VIE, we consider the provisions of additional guidance to determine whether the general partner controls a limited partnership or similar entity when the limited partners have certain rights. We consolidate all entities that are VIEs and of which the Company is deemed to be the primary beneficiary.
Self Storage Properties and Customer In-Place Leases
Self storage properties are carried at historical cost less accumulated depreciation and any impairment losses. When self storage properties are acquired, the purchase price is allocated to the tangible and intangible assets acquired and liabilities assumed based on estimated fair values. The purchase price is allocated to the individual properties based on the fair value determined using an income approach or a cash flow analysis using appropriate risk adjusted capitalization rates, which take into account the relative size, age, and location of the individual properties along with current and projected occupancy and relative rental rates or appraised values, if available. Tangible assets are allocated to land, buildings and related improvements, and furniture and equipment.
In allocating the purchase price for a self storage property acquisition, we determine whether the acquisition includes intangible assets. We allocate a portion of the purchase price to an intangible asset attributed to the value of customer in-place leases. Because the majority of tenant leases are on a month-to-month basis, this intangible asset represents
45
the estimated value of the leases in effect on the acquisition date. This intangible asset is amortized to expense using the straight-line method over 12 months, the estimated average remaining rental period for the leases.
Non-GAAP Financial Measures
FFO and Core FFO
Funds from operations, or FFO, is a widely used performance measure for real estate companies and is provided here as a supplemental measure of our operating performance. The April 2002 National Policy Bulletin of Nareit, which we refer to as the White Paper, as amended, defines FFO as net income (loss) (as determined under GAAP), excluding gains (or losses) from sales of real estate and related impairment charges, plus real estate depreciation and amortization, and after adjustments for unconsolidated partnerships and joint ventures. We include amortization of customer in-place leases in real estate depreciation and amortization in the calculation of FFO because we believe the amortization of customer in-place leases is analogous to real estate depreciation, as the value of such intangibles is inextricably connected to the real estate acquired. Distributions declared on subordinated performance units and DownREIT subordinated performance units represent our allocation of FFO to noncontrolling interests held by subordinated performance unitholders and DownREIT subordinated performance unitholders. For purposes of calculating FFO attributable to common shareholders, OP unitholders and LTIP unitholders, we exclude distributions declared on subordinated performance units, DownREIT subordinated performance units, preferred shares and preferred units. We define Core FFO as FFO, as further adjusted to eliminate the impact of certain items that we do not consider indicative of our core operating performance. These further adjustments consist of acquisition costs, organizational and offering costs, gains on debt forgiveness, gains (losses) on early extinguishment of debt and after adjustments for unconsolidated partnerships and joint ventures.
Management uses FFO and Core FFO as key performance indicators in evaluating the operations of our properties. Given the nature of our business as a real estate owner and operator, we consider FFO and Core FFO as key supplemental measures of our operating performance that are not specifically defined by GAAP. We believe that FFO and Core FFO are useful to management and investors as a starting point in measuring our operational performance because FFO and Core FFO exclude various items included in net income (loss) that do not relate to or are not indicative of our operating performance such as gains (or losses) from sales of self storage properties and depreciation, which can make periodic and peer analyses of operating performance more difficult. Our computation of FFO and Core FFO may not be comparable to FFO reported by other REITs or real estate companies.
FFO and Core FFO should be considered in addition to, but not as a substitute for, other measures of financial performance reported in accordance with GAAP, such as total revenues, operating income and net income (loss). FFO and Core FFO do not represent cash generated from operating activities determined in accordance with GAAP and are not a measure of liquidity or an indicator of our ability to make cash distributions. We believe that to further understand our performance, FFO and Core FFO should be compared with our reported net income (loss) and considered in addition to cash flows computed in accordance with GAAP, as presented in our consolidated financial statements.
46
The following table presents a reconciliation of net income (loss) to FFO and Core FFO for the periods presented (in thousands, except per share and unit amounts):
|
Year Ended December 31,
|
|||||||||||
|
2018
|
2017
|
2016
|
|||||||||
|
Net income
|
$
|
56,326
|
|
$
|
45,998
|
|
$
|
24,866
|
|
||
|
Add (subtract):
|
|||||||||||
|
Real estate depreciation and amortization
|
87,938
|
|
73,669
|
|
54,193
|
|
|||||
|
Company's share of unconsolidated real estate venture real estate depreciation and amortization
|
10,233
|
|
7,296
|
|
1,559
|
|
|||||
|
Gain on sale of self storage properties
|
(391
|
)
|
(5,715
|
)
|
—
|
|
|||||
|
Company's share of unconsolidated real estate venture loss on sale of properties
|
205
|
|
—
|
|
—
|
|
|||||
|
Distributions to preferred shareholders and unitholders
|
(10,822
|
)
|
(2,300
|
)
|
—
|
|
|||||
|
FFO attributable to subordinated performance unitholders
(1)
|
(27,111
|
)
|
(28,364
|
)
|
(22,842
|
)
|
|||||
|
FFO attributable to common shareholders, OP unitholders, and LTIP unitholders
|
116,378
|
|
90,584
|
|
57,776
|
|
|||||
|
Add:
|
|||||||||||
|
Acquisition costs
|
663
|
|
593
|
|
6,546
|
|
|||||
|
Company's share of unconsolidated real estate venture acquisition costs
|
—
|
|
22
|
|
1,006
|
|
|||||
|
Loss on early extinguishment of debt
|
—
|
|
—
|
|
136
|
|
|||||
|
Core FFO attributable to common shareholders, OP unitholders, and LTIP unitholders
|
$
|
117,041
|
|
$
|
91,199
|
|
$
|
65,464
|
|
||
|
Weighted average shares and units outstanding - FFO and Core FFO:
(2)
|
|||||||||||
|
Weighted average shares outstanding - basic
|
53,293
|
|
44,423
|
|
29,887
|
|
|||||
|
Weighted average restricted common shares outstanding
|
29
|
|
25
|
|
18
|
|
|||||
|
Weighted average OP units outstanding
|
28,977
|
|
26,126
|
|
24,262
|
|
|||||
|
Weighted average DownREIT OP unit equivalents outstanding
|
1,835
|
|
1,835
|
|
1,835
|
|
|||||
|
Weighted average LTIP units outstanding
|
694
|
|
957
|
|
2,212
|
|
|||||
|
Total weighted average shares and units outstanding - FFO and Core FFO
|
84,828
|
|
73,366
|
|
58,214
|
|
|||||
|
FFO per share and unit
|
$
|
1.37
|
|
$
|
1.23
|
|
$
|
0.99
|
|
||
|
Core FFO per share and unit
|
$
|
1.38
|
|
$
|
1.24
|
|
$
|
1.12
|
|
||
|
(1) Amounts represent distributions declared for subordinated performance unitholders and DownREIT subordinated performance unitholders for the periods presented.
|
|||||||
|
(2) NSA combines OP units and DownREIT OP units with common shares because, after the applicable lock-out periods, OP units in the Company's operating partnership are redeemable for cash or, at NSA's option, exchangeable for common shares on a one-for-one basis and DownREIT OP units are also redeemable for cash or, at NSA's option, exchangeable for OP units in our operating partnership on a one-for-one basis, subject to certain adjustments in each case. Subordinated performance units, DownREIT subordinated performance units, and LTIP units may also, under certain circumstances, be convertible into or exchangeable for common shares (or other units that are convertible into or exchangeable for common shares). See footnote
(1)
to the following table for additional discussion of subordinated performance units, DownREIT subordinated performance units, and LTIP units in the calculation of FFO and Core FFO per share and unit.
|
|||||||
47
The following table presents a reconciliation of earnings (loss) per share - diluted to FFO and Core FFO per share and unit for the periods presented:
|
Year Ended December 31,
|
|||||||||||
|
2018
|
2017
|
2016
|
|||||||||
|
Earnings (loss) per share - diluted
|
$
|
0.07
|
|
$
|
0.01
|
|
$
|
0.31
|
|
||
|
Impact of the difference in weighted average number of shares
(1)
|
(0.03
|
)
|
—
|
|
0.11
|
|
|||||
|
Impact of GAAP accounting for noncontrolling interests, two-class method and treasury stock method
(2)
|
0.49
|
|
0.59
|
|
—
|
|
|||||
|
Add real estate depreciation and amortization
|
1.04
|
|
1.00
|
|
0.93
|
|
|||||
|
Add Company's share unconsolidated venture real estate depreciation and amortization
|
0.12
|
|
0.10
|
|
0.03
|
|
|||||
|
Subtract gain on sale of self storage properties
|
—
|
|
(0.08
|
)
|
—
|
|
|||||
|
FFO attributable to subordinated performance unitholders
|
(0.32
|
)
|
(0.39
|
)
|
(0.39
|
)
|
|||||
|
FFO per share and unit
|
1.37
|
|
1.23
|
|
0.99
|
|
|||||
|
Add acquisition costs, Company's share of unconsolidated real estate venture acquisition costs and loss on early extinguishment of debt
|
0.01
|
|
0.01
|
|
0.13
|
|
|||||
|
Core FFO per share and unit
|
$
|
1.38
|
|
$
|
1.24
|
|
$
|
1.12
|
|
||
|
(1) Adjustment accounts for the difference between the weighted average number of shares used to calculate diluted earnings per share and the weighted average number of shares used to calculate FFO and Core FFO per share and unit. Diluted earnings per share is calculated using the two-class method for the company's restricted common shares, the treasury stock method for certain unvested LTIP units, and includes the assumption of a hypothetical conversion of subordinated performance units and DownREIT subordinated performance units into OP units, even though such units may only be convertible into OP units (i) after a lock-out period and (ii) upon certain events or conditions. For additional information about the conversion of subordinated performance units, DownREIT subordinated performance units and LTIP units into OP units, see Note 10 to the consolidated financial statements in Item 8. The computation of weighted average shares and units for FFO and Core FFO per share and unit includes all restricted common shares and LTIP units that participate in distributions and excludes all subordinated performance units and DownREIT subordinated performance units because their effect has been accounted for through the allocation of FFO to the related unitholders based on distributions declared.
|
|||||||||||
|
(2) Represents the effect of adjusting the numerator to consolidated net income (loss) prior to GAAP allocations for noncontrolling interests, after deducting preferred share and unit distributions, and before the application of the two-class method and treasury stock method, as described in footnote
(1)
.
|
|||||||||||
NOI
We define NOI as net income (loss), as determined under GAAP, plus general and administrative expenses, depreciation and amortization, interest expense, loss on early extinguishment of debt, equity in earnings (losses) of unconsolidated real estate ventures, acquisition costs, organizational and offering expenses, income tax expense, impairment of long-lived assets, losses on the sale of properties and non-operating expense and by subtracting management fees and other revenue, gains on sale of properties, debt forgiveness, and non-operating income. NOI is not a measure of performance calculated in accordance with GAAP.
We believe NOI is useful to investors in evaluating our operating performance because:
|
•
|
NOI is one of the primary measures used by our management and our PROs to evaluate the economic productivity of our properties, including our ability to lease our properties, increase pricing and occupancy and control our property operating expenses;
|
|
•
|
NOI is widely used in the real estate industry and the self storage industry to measure the performance and value of real estate assets without regard to various items included in net income that do not relate to or are not indicative of operating performance, such as depreciation and amortization, which can vary depending upon accounting methods, the book value of assets, and the impact of our capital structure; and
|
|
•
|
We believe NOI helps our investors to meaningfully compare the results of our operating performance from period to period by removing the impact of our capital structure (primarily interest expense on our outstanding indebtedness) and depreciation of the cost basis of our assets from our operating results.
|
48
There are material limitations to using a non-GAAP measure such as NOI, including the difficulty associated with comparing results among more than one company and the inability to analyze certain significant items, including depreciation and interest expense, that directly affect our net income (loss). We compensate for these limitations by considering the economic effect of the excluded expense items independently as well as in connection with our analysis of net income (loss). NOI should be considered in addition to, but not as a substitute for, other measures of financial performance reported in accordance with GAAP, such as total revenues, income from operations and net loss.
The following table presents a reconciliation of net income (loss) to NOI for the periods presented (dollars in thousands):
|
Year Ended December 31,
|
|||||||||||
|
2018
|
2017
|
2016
|
|||||||||
|
Net income
|
$
|
56,326
|
|
$
|
45,998
|
|
$
|
24,866
|
|
||
|
(Subtract) add:
|
|||||||||||
|
Management fees and other revenue
|
(12,310
|
)
|
(8,061
|
)
|
(1,809
|
)
|
|||||
|
General and administrative expenses
|
36,220
|
|
30,060
|
|
21,528
|
|
|||||
|
Depreciation and amortization
|
89,147
|
|
75,115
|
|
55,064
|
|
|||||
|
Interest expense
|
42,724
|
|
34,068
|
|
24,109
|
|
|||||
|
Equity in losses of unconsolidated real estate venture
|
1,423
|
|
2,339
|
|
1,484
|
|
|||||
|
Loss on early extinguishment of debt
|
—
|
|
—
|
|
136
|
|
|||||
|
Acquisition costs
|
663
|
|
593
|
|
6,546
|
|
|||||
|
Income tax expense
|
818
|
|
1,159
|
|
368
|
|
|||||
|
Gain on sale of self storage properties
|
(391
|
)
|
(5,715
|
)
|
—
|
|
|||||
|
Non-operating expense
|
91
|
|
58
|
|
147
|
|
|||||
|
Net Operating Income
|
$
|
214,711
|
|
$
|
175,614
|
|
$
|
132,439
|
|
||
Our consolidated NOI shown in the table above does not include our proportionate share of NOI for our unconsolidated real estate ventures. For additional information about our 2018 Joint Venture and 2016 Joint Venture see Note 5 to the consolidated financial statements in Item 8.
EBITDA and Adjusted EBITDA
We define EBITDA as net income (loss), as determined under GAAP, plus interest expense, loss on early extinguishment of debt, income taxes, depreciation and amortization expense and the Company's share of unconsolidated real estate venture depreciation and amortization. We define Adjusted EBITDA as EBITDA plus acquisition costs, organizational and offering expenses, equity-based compensation expense, losses on sale of properties and impairment of long-lived assets, minus gains on sale of properties and debt forgiveness, and after adjustments for unconsolidated partnerships and joint ventures. These further adjustments eliminate the impact of items that we do not consider indicative of our core operating performance. In evaluating EBITDA and Adjusted EBITDA, you should be aware that in the future we may incur expenses that are the same as or similar to some of the adjustments in this presentation. Our presentation of EBITDA and Adjusted EBITDA should not be construed as an inference that our future results will be unaffected by unusual or non-recurring items.
We present EBITDA and Adjusted EBITDA because we believe they assist investors and analysts in comparing our performance across reporting periods on a consistent basis by excluding items that we do not believe are indicative of our core operating performance. EBITDA and Adjusted EBITDA have limitations as an analytical tool. Some of these limitations are:
|
•
|
EBITDA and Adjusted EBITDA do not reflect our cash expenditures, or future requirements, for capital expenditures, contractual commitments or working capital needs;
|
|
•
|
EBITDA and Adjusted EBITDA do not reflect the significant interest expense, or the cash requirements necessary to service interest or principal payments, on our debts;
|
|
•
|
although depreciation and amortization are non-cash charges, the assets being depreciated and amortized will often have to be replaced in the future, and EBITDA and Adjusted EBITDA do not reflect any cash requirements for such replacements;
|
49
|
•
|
Adjusted EBITDA excludes equity-based compensation expense, which is and will remain a key element of our overall long-term incentive compensation package, although we exclude it as an expense when evaluating our ongoing operating performance for a particular period;
|
|
•
|
EBITDA and Adjusted EBITDA do not reflect the impact of certain cash charges resulting from matters we consider not to be indicative of our ongoing operations; and
|
|
•
|
other companies in our industry may calculate EBITDA and Adjusted EBITDA differently than we do, limiting their usefulness as comparative measures.
|
We compensate for these limitations by considering the economic effect of the excluded expense items independently as well as in connection with our analysis of net income (loss). EBITDA and Adjusted EBITDA should be considered in addition to, but not as a substitute for, other measures of financial performance reported in accordance with GAAP, such as total revenues, income from operations, and net income (loss).
The following table presents a reconciliation of net loss to EBITDA and Adjusted EBITDA for the periods presented (dollars in thousands):
|
Year Ended December 31,
|
|||||||||||
|
2018
|
2017
|
2016
|
|||||||||
|
Net income
|
$
|
56,326
|
|
$
|
45,998
|
|
$
|
24,866
|
|
||
|
Add:
|
|||||||||||
|
Depreciation and amortization
|
89,147
|
|
75,115
|
|
55,064
|
|
|||||
|
Company's share of unconsolidated real estate venture depreciation and amortization
|
10,233
|
|
7,296
|
|
1,559
|
|
|||||
|
Income tax expense
|
818
|
|
1,159
|
|
368
|
|
|||||
|
Interest expense
|
42,724
|
|
34,068
|
|
24,109
|
|
|||||
|
Loss on early extinguishment of debt
|
—
|
|
—
|
|
136
|
|
|||||
|
EBITDA
|
199,248
|
|
163,636
|
|
106,102
|
|
|||||
|
Add:
|
|||||||||||
|
Acquisition costs
|
663
|
|
593
|
|
6,546
|
|
|||||
|
Company's share of unconsolidated real estate venture acquisition costs
|
—
|
|
22
|
|
1,006
|
|
|||||
|
Gain on sale of self storage properties
|
(391
|
)
|
(5,715
|
)
|
—
|
|
|||||
|
Company's share of unconsolidated real estate venture loss on sale of properties
|
205
|
|
—
|
|
—
|
|
|||||
|
Equity-based compensation expense
|
3,837
|
|
3,764
|
|
2,597
|
|
|||||
|
Adjusted EBITDA
|
$
|
203,562
|
|
$
|
162,300
|
|
$
|
116,251
|
|
||
Liquidity and Capital Resources
Liquidity Overview
Liquidity is the ability to meet present and future financial obligations. Our primary source of liquidity is cash flow from our operations. Additional sources are proceeds from equity and debt offerings, and debt financings including borrowings under the credit facility, 2023 Term Loan Facility and 2028 Term Loan Facility.
Our short-term liquidity requirements consist primarily of property operating expenses, property acquisitions, capital expenditures, general and administrative expenses and principal and interest on our outstanding indebtedness. A further short-term liquidity requirement relates to distributions to our common and preferred shareholders and holders of preferred units, OP units, subordinated performance units, DownREIT OP units and DownREIT subordinated performance units. We expect to fund short-term liquidity requirements from our operating cash flow, cash on hand and borrowings under our credit facility.
Our long-term liquidity needs consist primarily of the repayment of debt, property acquisitions, and capital expenditures. We acquire properties through the use of cash, preferred units, OP units and subordinated performance units in our operating partnership or DownREIT partnerships. We expect to meet our long-term liquidity requirements
50
with operating cash flow, cash on hand, secured and unsecured indebtedness, and the issuance of equity and debt securities.
The availability of credit and its related effect on the overall economy may affect our liquidity and future financing activities, both through changes in interest rates and access to financing. Currently, interest rates are low compared to historical levels and many lenders are active in the market. We believe that, as a publicly-traded REIT, we will have access to multiple sources of capital to fund our long-term liquidity requirements, including the incurrence of additional debt and the issuance of debt and additional equity securities. However, we cannot assure you that this will be the case.
Cash Flows
At
December 31, 2018
, we had
$13.2 million
in cash and cash equivalents and
$3.2 million
of restricted cash, a
decrease
in cash and cash equivalents of
$0.2 million
and an
increase
in restricted cash of
$0.1 million
from
December 31, 2017
. Restricted cash primarily consists of escrowed funds deposited with financial institutions for real estate taxes, insurance, and other reserves for capital improvements in accordance with our loan agreements. The following discussion relates to changes in cash due to operating, investing, and financing activities, which are presented in our consolidated statements of cash flows included in Item 8 of this report.
Operating Activities
Cash
provided by
our operating activities was
$161.8 million
for the
year
ended
December 31, 2018
compared to
$124.3 million
for the
year
ended
December 31, 2017
, an
increase
of
$37.5 million
. Our operating cash flow
increased
primarily due to
65
self storage properties acquired during the year ended
December 31, 2017
that generated cash flow for the entire year ended
December 31, 2018
and
57
self storage properties that were acquired during the year ended
December 31, 2018
. In addition, operating distributions from our unconsolidated real estate ventures increased by $3.1 million for the year ended
December 31, 2018
compared to the year ended
December 31, 2017
. These
increase
s were partially offset by higher cash payments for general and administrative expenses and interest expense.
Cash provided by our operating activities was $124.3 million for the year ended December 31, 2017 compared to $94.6 million for the year ended December 31, 2016, an increase of $29.7 million. Our operating cash flow increased primarily due to 107 self storage properties acquired during the year ended December 31, 2016 that generated cash flow for the entire year ended December 31, 2017 and 65 self storage properties that were acquired during the year ended December 31, 2017. In addition, operating distributions from our 2016 Joint Venture increased by $4.4 million for the year ended December 31, 2017 compared to the year ended December 31, 2016. These increases were partially offset by higher cash payments for general and administrative expenses and interest expense.
Investing Activities
Cash
used in
investing activities was
$514.5 million
for the
year
ended
December 31, 2018
compared to
$409.3 million
for the
year
ended
December 31, 2017
. The primary uses of cash for the
year
ended
December 31, 2018
were for our acquisition of
57
self storage properties and an expansion project for cash consideration of
$313.7 million
, investments in our unconsolidated real estate ventures of
$165.6 million
, deposits for potential acquisitions of
$21.0 million
and capital expenditures of
$19.0 million
, partially offset by
$5.3 million
of proceeds from the sale of
two
self storage properties. The primary uses of cash for the
year
ended
December 31, 2017
were for our acquisition of
65
self storage properties for cash consideration of $391.6 million, investment in our 2016 Joint Venture of $15.3 million, capital expenditures of $14.7 million and deposits for potential acquisitions of $4.9 million, partially offset by $17.5 million of proceeds from the sale of three self storage properties and land parcels.
Cash used in investing activities was $409.3 million for the year ended December 31, 2017 compared to $642.4 million for the year ended December 31, 2016. The primary uses of cash for the year ended December 31, 2017 were for our acquisition of 65 self storage properties for cash consideration of $391.6 million, investments in our unconsolidated real estate venture of $15.3 million, capital expenditures of $14.7 million and deposits for potential acquisitions of $4.9 million, partially offset by $17.5 million of proceeds from the sale of three self storage properties and land parcels. The primary uses of cash for the year ended December 31, 2016 were for our acquisition of 107 self storage properties for cash consideration of $532.0 million, investment in our 2016 Joint Venture of $83.0 million, acquisition of our property management platform for $19.9 million, and capital expenditures of $11.4 million.
Capital expenditures totaled
$19.0 million
,
$14.7 million
and
$11.4 million
during the
year
s ended
December 31, 2018
,
2017
and
2016
respectively, We generally fund post-acquisition capital additions from cash provided by operating activities.
51
We categorize our capital expenditures broadly into three primary categories:
|
•
|
recurring capital expenditures, which represent the portion of capital expenditures that are deemed to replace the consumed portion of acquired capital assets and extend their useful life;
|
|
•
|
value enhancing capital expenditures, which represent the portion of capital expenditures that are made to enhance the revenue and value of an asset from its original purchase condition; and
|
|
•
|
acquisitions capital expenditures, which represent the portion of capital expenditures capitalized during the current period that were identified and underwritten prior to a property's acquisition.
|
The following table presents a summary of the capital expenditures for these categories, along with a reconciliation of the total for these categories to the capital expenditures reported in the accompanying consolidated statements of cash flows for the periods presented (dollars in thousands):
|
Year Ended December 31,
|
|||||||||||
|
2018
|
2017
|
2016
|
|||||||||
|
Recurring capital expenditures
|
$
|
6,001
|
|
$
|
3,495
|
|
$
|
2,917
|
|
||
|
Value enhancing capital expenditures
|
3,563
|
|
2,755
|
|
2,641
|
|
|||||
|
Acquisitions capital expenditures
|
9,356
|
|
8,953
|
|
6,114
|
|
|||||
|
Total capital expenditures
|
18,920
|
|
15,203
|
|
11,672
|
|
|||||
|
Increase in accrued capital spending
|
94
|
|
(547
|
)
|
(254
|
)
|
|||||
|
Capital expenditures per statement of cash flows
|
$
|
19,014
|
|
$
|
14,656
|
|
$
|
11,418
|
|
||
Financing Activities
Cash
provided by
our financing activities was
$352.6 million
for the
year
ended
December 31, 2018
compared to
$286.1 million
for the
year
ended
December 31, 2017
. Our sources of financing cash flows for the
year
ended
December 31, 2018
primarily consisted of
$175.6 million
of proceeds from the issuance of common shares, $672.5 million of borrowings under our credit facility, $75.0 million of borrowings under our 2023 Term Loan Facility and $75.0 million of borrowings under our 2028 Term Loan Facility. Our primary uses of financing cash flows for the
year
ended
December 31, 2018
were for principal payments on existing debt of
$507.2 million
(which included $496.5 million of principal repayments under the Revolver, $5.8 million of fixed rate mortgage principal payoffs and $4.9 million of scheduled fixed rate mortgage principal payments), distributions to noncontrolling interests of
$63.4 million
, distributions to common shareholders of
$62.2 million
and distributions to preferred shareholders of
$10.4 million
. Our sources of financing cash flows for the
year
ended
December 31, 2017
primarily consisted of $166.6 million of proceeds from the issuance of preferred shares, $140.3 million of proceeds from the issuance of common shares, $676.0 million of borrowings under our credit facility, an $84.9 million secured debt financing and $7.0 million of proceeds from the issuance of 300,043 subordinated performance units to an affiliate of Personal Mini. Our primary uses of financing cash flows for the year ended December 31, 2017 were for principal payments on existing debt of $679.1 million (which included $664.0 million of principal repayments under the Revolver, $10.4 million of fixed rate mortgage principal payoffs and $4.7 million of scheduled fixed rate mortgage principal payments), distributions to noncontrolling interests of $57.3 million, distributions to common shareholders of $47.7 million and distributions to preferred shareholders of $2.3 million.
Cash provided by our financing activities was $286.1 million for the year ended December 31, 2017 compared to $553.7 million for the year ended December 31, 2016. Our sources of financing cash flows for the year ended December 31, 2017 primarily consisted of $166.6 million of proceeds from the issuance of preferred shares, $140.3 million of proceeds from the issuance of common shares, $676.0 million of borrowings under our credit facility, an $84.9 million secured debt financing and $7.0 million of proceeds from the issuance of 300,043 subordinated performance units to an affiliate of Personal Mini. Our primary uses of financing cash flows for the year ended December 31, 2017 were for principal payments on existing debt of $679.1 million (which included $664.0 million of principal repayments under the Revolver, $10.4 million of fixed rate mortgage principal payoffs and $4.7 million of scheduled fixed rate mortgage principal payments), distributions to noncontrolling interests of $57.3 million, distributions to common shareholders of $47.7 million and distributions to preferred shareholders of $2.3 million. Our sources of financing cash flows for the year ended December 31, 2016 primarily consisted of $378.3 million of proceeds from the issuance of common shares, $712.5 million of borrowings under our credit facility and
52
$100.0 million of borrowings under our 2023 Term Loan Facility. Our primary uses of financing cash flows for the year ended December 31, 2016 were for principal payments on existing debt of $558.6 million (which included $529.0 million of principal repayments under the Revolver, $25.2 million of fixed rate mortgage principal payoffs and $4.4 million of scheduled fixed rate mortgage principal payments), distributions to noncontrolling interests of $47.0 million, and distributions to common shareholders of $26.7 million.
Credit Facility and Term Loan Facilities
As of
December 31, 2018
, our credit facility provided for total borrowings of
$1.0 billion
, consisting of
five
components: (i) a Revolver which provides for a total borrowing commitment up to
$400.0 million
, whereby we may borrow, repay and re-borrow amounts under the Revolver, (ii) a
$235.0 million
Term Loan A, (iii) a
$155.0 million
Term Loan B, (iv) a $
105.0 million
Term Loan C and (v) a
$125.0 million
Term Loan D. The Revolver matures in May 2020; provided that we may elect to extend the maturity to May 2021 by paying an extension fee of
0.15%
of the total borrowing commitment thereunder at the time of extension and meeting other customary conditions with respect to compliance. The Term Loan A matures in May 2021, the Term Loan B matures in May 2022, the Term Loan C matures in February 2024 and the Term Loan D matures in January 2023. The Revolver, Term Loan A, Term Loan B, Term Loan C and Term Loan D are not subject to any scheduled reduction or amortization payments prior to maturity. As of
December 31, 2018
, we have an expansion option under the credit facility, which, if exercised in full, would provide for a total credit facility of
$1.3 billion
.
As of
December 31, 2018
,
$235.0 million
was outstanding under the Term Loan A with an effective interest rate of
2.91%
,
$155.0 million
was outstanding under the Term Loan B with an effective interest rate of
2.94%
,
$105.0 million
was outstanding under the Term Loan C with an effective interest rate of
3.71%
,
$125.0 million
was outstanding under the Term Loan D with an effective interest rate of
3.79%
and
$139.5 million
was outstanding under the Revolver with an effective interest rate of
3.90%
. As of
December 31, 2018
, we would have had the capacity to borrow remaining Revolver commitments of
$254.8 million
while remaining in compliance with the credit facility's financial covenants.
We also have the 2023 Term Loan Facility that matures in June 2023 and is separate from the credit facility in an aggregate amount of
$175.0 million
. As of
December 31, 2018
the entire amount was outstanding under the 2023 Term Loan Facility with an effective interest rate of
3.13%
. We have an expansion option under the 2023 Term Loan Facility, which, if exercised in full, would provide for total borrowings in an aggregate amount of
$400.0 million
.
During the year ended
December 31, 2018
, we entered into a credit agreement with a lender for the 2028 Term Loan Facility that matures in December 2028 and is separate from the credit facility and 2023 Term Loan Facility in an aggregate amount of
$75.0 million
. As of
December 31, 2018
the entire amount was outstanding under the 2028 Term Loan Facility with an effective interest rate of
4.62%
. We have an expansion option under the 2028 Term Loan Facility, which, if exercised in full, would provide for total borrowings in an aggregate amount up to $125.0 million.
For a summary of our financial covenants and additional detail regarding our credit facility, 2023 Term Loan Facility and 2028 Term Loan Facility, please see Note 8 to the consolidated financial statements in Item 8.
Contractual Obligations
The following table summarizes information contained elsewhere in this Annual Report on Form 10-K regarding payments due under contractual obligations and commitments on an undiscounted basis as of
December 31, 2018
(dollars in thousands):
|
Year Ending December 31,
|
|||||||||||||||||||||||||||
|
2019
|
2020
|
2021
|
2022
|
2023
|
Thereafter
|
Total
|
|||||||||||||||||||||
|
Debt financings:
|
|||||||||||||||||||||||||||
|
Principal
(1)
|
$
|
5,128
|
|
$
|
178,897
|
|
$
|
242,603
|
|
$
|
159,205
|
|
$
|
377,049
|
|
$
|
314,756
|
|
$
|
1,277,638
|
|
||||||
|
Interest
(2)
|
39,731
|
|
38,902
|
|
33,294
|
|
27,542
|
|
17,131
|
|
32,179
|
|
188,779
|
|
|||||||||||||
|
Real estate leasehold interests
|
1,334
|
|
1,379
|
|
1,404
|
|
1,419
|
|
1,424
|
|
36,074
|
|
43,034
|
|
|||||||||||||
|
Office lease
|
345
|
|
398
|
|
387
|
|
381
|
|
346
|
|
1,073
|
|
2,930
|
|
|||||||||||||
|
Total
|
$
|
46,538
|
|
$
|
219,576
|
|
$
|
277,688
|
|
$
|
188,547
|
|
$
|
395,950
|
|
$
|
384,082
|
|
$
|
1,512,381
|
|
||||||
|
(1)
|
Includes scheduled principal and maturity payments related to our debt financings.
|
53
|
(2)
|
Interest is calculated until the maturity date (without regard to any extension that may be elected by the Company) based on the outstanding principal balance and the effective interest rate as of
December 31, 2018
.
|
Equity Transactions
Issuance of Common Shares
During the
year
ended
December 31, 2018
, we closed a follow-on public offering of
5,900,000
of our common shares at an offering price of
$29.86
per share. We received aggregate net proceeds from the offering of approximately
$175.6 million
after deducting expenses associated with the offering. We used the net proceeds from the offering to repay borrowings outstanding under our Revolver and to make capital contributions to the 2018 Joint Venture.
During the
year
ended
December 31, 2018
, after receiving notices of redemption from certain OP unitholders, we elected to issue
462,778
common shares to such holders in exchange for
462,778
OP units in satisfaction of the operating partnership's redemption obligations.
Issuance of OP Equity
In connection with the
57
properties acquired during the
year
ended
December 31, 2018
,
$28.1 million
of OP equity was issued (consisting of 584,004 OP units, 343,719 Series A-1 preferred units and
141,811
subordinated performance units).
During the
year
ended
December 31, 2018
, the Company issued
2,024,170
OP units upon conversion of
997,074
subordinated performance units as further described under "Subordinated Performance Units and DownREIT Subordinated Performance Units" in Note 3 to the consolidated financial statements in Item 8.
Dividends and Distributions
During the
year ended December 31, 2018
, the Company paid
$62.2 million
of distributions to common shareholders,
$10.4 million
of distributions to preferred shareholders and distributed
$63.4 million
to noncontrolling interests.
On February 21, 2019, our board of trustees declared a cash dividend and distribution, respectively, of $0.30 per common share and OP unit to shareholders and OP unitholders of record as of March 15, 2019. On February 21, 2019, our board of trustees also declared cash distributions of $0.375 per Series A Preferred Share and Series A-1 preferred unit to shareholders and unitholders of record as of March 15, 2019. In addition, we expect to declare a cash distribution in the first quarter of 2019 to our subordinated performance unitholders of record as of March 15, 2019. Such dividends and distributions are expected to be paid on March 29, 2019.
Cash Distributions from our Operating Partnership
Under the LP Agreement of our operating partnership, to the extent that we, as the general partner of our operating partnership, determine to make distributions to the partners of our operating partnership out of the operating cash flow or capital transaction proceeds generated by a real property portfolio managed by one of our PROs, the holders of the series of subordinated performance units that relate to such portfolio are entitled to share in such distributions. Under the LP Agreement of our operating partnership, operating cash flow with respect to a portfolio of properties managed by one of our PROs is generally an amount determined by us, as general partner, of our operating partnership equal to the excess of property revenues over property related expenses from that portfolio. In general, property revenue from the portfolio includes:
|
(i)
|
all receipts, including rents and other operating revenues;
|
|
(ii)
|
any incentive, financing, break-up and other fees paid to us by third parties;
|
|
(iii)
|
amounts released from previously set aside reserves; and
|
|
(iv)
|
any other amounts received by us, which we allocate to the particular portfolio of properties.
|
In general, property-related expenses include all direct expenses related to the operation of the properties in that portfolio, including real property taxes, insurance, property-level general and administrative expenses, employee costs, utilities, property marketing expense, property maintenance and property reserves and other expenses incurred at the property level. In addition, other expenses incurred by our operating partnership will also be allocated by us, as general partner, to the property portfolio and will be included in the property-related expenses of that portfolio. Examples of such other expenses include:
54
|
(i)
|
corporate-level general and administrative expenses;
|
|
(ii)
|
out-of-pocket costs, expenses and fees of our operating partnership, whether or not capitalized;
|
|
(iii)
|
the costs and expenses of organizing and operating our operating partnership;
|
|
(iv)
|
amounts paid or due in respect of any loan or other indebtedness of our operating partnership during such period;
|
|
(v)
|
extraordinary expenses of our operating partnership not previously or otherwise deducted under item (ii) above;
|
|
(vi)
|
any third-party costs and expenses associated with identifying, analyzing, and presenting a proposed property to us and/or our operating partnership; and
|
|
(vii)
|
reserves to meet anticipated operating expenditures debt service or other liabilities, as determined by us.
|
To the extent that we, as the general partner of our operating partnership, determine to make distributions to the partners of our operating partnership out of the operating cash flow of a real property portfolio managed by one of our PROs, operating cash flow from a property portfolio is required to be allocated to OP unitholders and to the holders of series of subordinated performance units that relate to such property portfolio as follows:
First, an amount is allocated to OP unitholders in order to provide OP unitholders (together with any prior allocations of capital transaction proceeds) with a cumulative preferred allocation on the unreturned capital contributions attributed to the OP units in respect of such property portfolio. The preferred allocation for all of our existing portfolios is 6%. As of
December 31, 2018
, our operating partnership had an aggregate of $1,500.9 million of unreturned capital contributions with respect to common shareholders and OP unitholders, with respect to the various property portfolios.
Second, an amount is allocated to the holders of the series of subordinated performance units relating to such property portfolio in order to provide such holders with an allocation (together with prior distributions of capital transaction proceeds) on their unreturned capital contributions. Although the subordinated allocation for the subordinated performance units is non-cumulative from period to period, if the operating cash flow from a property portfolio related to a series of subordinated performance units is sufficient, in the judgment of the general partner (with the approval of a majority of our independent trustees), to fund distributions to the holders of such series of subordinated performance units, but we, as the general partner of our operating partnership, decline to make distributions to such holders, the amount available but not paid as distributions will be added to the subordinated allocation corresponding to such series of subordinated performance units. The subordinated allocation for the outstanding subordinated performance units is 6%. As of
December 31, 2018
, an aggregate of $143.0 million of unreturned capital contributions has been allocated to the various series of subordinated performance units.
Thereafter, any additional operating cash flow is allocated to OP unitholders and the applicable series of subordinated performance units equally.
Following the allocation described above, we as the general partner of our operating partnership, will generally cause our operating partnership to distribute the amounts allocated to the relevant series of subordinated performance units to the holders of such series of subordinated performance units. We, as the general partner, may cause our operating partnership to distribute the amounts allocated to OP unitholders or may cause our operating partnership to retain such amounts to be used by our operating partnership for any purpose. Any operating cash flow that is attributable to amounts retained by our operating partnership pursuant to the preceding sentence will generally be available to be allocated as an additional capital contribution to the various property portfolios.
The foregoing description of the allocation of operating cash flow between the OP unitholders and subordinated performance unitholders is used for purposes of determining distributions to holders of subordinated performance units but does not necessarily represent the operating cash flow that will be distributed to OP unitholders (or paid as dividends to holders of our common shares). Any distribution of operating cash flow allocated to the OP unitholders will be made at our discretion (and paid as dividends to holders of our common shares at the discretion of our board of trustees).
Under the LP Agreement of our operating partnership, capital transactions are transactions that are outside the ordinary course of our operating partnership's business, involve the sale, exchange, other disposition, or refinancing of any property, and are designated as capital transactions by us, as the general partner. To the extent the general partner determines to distribute capital transaction proceeds, the proceeds from capital transactions involving a particular property portfolio are required to be allocated to OP unitholders and to the series of subordinated performance units that relate to such property portfolio as follows:
55
First, an amount determined by us, as the general partner, of such capital transaction proceeds is allocated to OP unitholders in order to provide OP unitholders (together with any prior allocations of operating cash flow) with a cumulative preferred allocation on the unreturned capital contributions attributed to the OP unitholders in respect of such property portfolio that relate to such capital transaction plus an additional amount equal to such unreturned capital contributions.
Second, an amount determined by us, as the general partner, is allocated to the holders of the series of subordinated performance units relating to such property portfolio in order to provide such holders with a non-cumulative subordinated allocation on the unreturned capital contributions made by such holders in respect of such property portfolio that relate to such capital transaction plus an additional amount equal to such unreturned capital contributions.
The preferred allocation and subordinated allocation with respect to capital transaction proceeds for each portfolio is equal to the preferred allocation and subordinated allocation for distributions of operating cash flow with respect to that portfolio.
Thereafter, any additional capital transaction proceeds are allocated to OP unitholders and the applicable series of subordinated performance units equally.
Following the allocation described above, we, as the general partner of our operating partnership, will generally cause our operating partnership to distribute the amounts allocated to the relevant series of subordinated performance units to the holders of such series of subordinated performance units. We, as general partner of our operating partnership, may cause our operating partnership to distribute the amounts allocated to the OP unitholders or may cause our operating partnership to retain such amounts to be used by our operating partnership for any purpose. Any capital transaction proceeds that are attributable to amounts retained by our operating partnership pursuant to the preceding sentence will generally be available to be allocated as an additional capital contribution to the various property portfolios.
The foregoing allocation of capital transaction proceeds between the OP unitholders and subordinated performance unitholders is used for purposes of determining distributions to holders of subordinated performance units but does not necessarily represent the capital transaction proceeds that will be distributed to OP unitholders (or paid as dividends to holders of our common shares). Any distribution of capital transaction proceeds allocated to the OP unitholders will be made at our discretion (and paid as dividends to holders of our common shares at the discretion of our board of trustees).
Our OP units are redeemable for cash or, at our option exchangeable on a one-for-one basis into common shares after an agreed period of time and certain other conditions. Our subordinated performance units are only convertible into OP units following a
two
year lock-out period and then (i) at the holder's election only upon the achievement of certain performance thresholds relating to the properties to which such subordinated performance units relate or (ii) at our election upon a retirement event of a PRO that holds such subordinated performance units or upon certain qualifying terminations.
Notwithstanding the two-year lock out period on conversions of subordinated performance units into OP units, if such subordinated performance units were convertible into OP units as of
December 31, 2018
, each subordinated performance unit would on average hypothetically convert into
1.32
OP units, or into an aggregate of approximately
20.0 million
OP units. These amounts are based on historical financial information for the trailing twelve months ended
December 31, 2018
. The hypothetical conversion is calculated by dividing the average cash available for distribution, or CAD, per subordinated performance unit by 110% of the CAD per OP unit over the same period. We anticipate that as our CAD grows over time, the conversion ratio will also grow, including to levels that may exceed this amount. The actual number of OP units into which such subordinated performance units will become convertible may vary significantly and will depend upon the applicable conversion penalty and the actual CAD to the OP units and the actual CAD to the converted subordinated performance units in the one-year period ending prior to conversion. We have also granted registration rights to those persons who will be eligible to receive common shares issuable upon exchange of OP units issued in our formation transactions and certain contribution transactions.
56
Allocation of Capital Contributions
We, as the general partner of our operating partnership, in our discretion, have the right to increase or decrease, as appropriate, the amount of capital contributions allocated to our operating partnership in general and to each series of subordinated performance units to reflect capital expenditures made by our operating partnership in respect of each portfolio, the sale or refinancing of all or a portion of the properties comprising the portfolio, the distribution of capital transaction proceeds by our operating partnership, the retention by our operating partnership of cash for working capital purposes and other events impacting the amount of capital contributions allocated to the holders. In addition, to avoid conflicts of interests, any decision by us to increase or decrease allocations of capital contributions must also be approved by a majority of our independent trustees.
Off-Balance Sheet Arrangements
Except as disclosed in the notes to our financial statements, as of
December 31, 2018
, we did not have any relationships with unconsolidated entities or financial partnerships, such as entities often referred to as structured finance or special purposes entities, which typically are established for the purpose of facilitating off-balance sheet arrangements or other contractually narrow or limited purposes. Further, except as disclosed in the notes to our financial statements, as of
December 31, 2018
, we have not guaranteed any obligations of unconsolidated entities nor made any commitments to provide funding to any such entities that creates any material exposure to any financing, liquidity, market or credit risk.
Segment
We manage our business as one reportable segment consisting of investments in self storage properties located in the United States. Although we operate in several markets, these operations have been aggregated into one reportable segment based on the similar economic characteristics among all markets.
Seasonality
The self storage business is subject to minor seasonal fluctuations. A greater portion of revenues and profits are realized from May through September. Historically, our highest level of occupancy has typically been in July, while our lowest level of occupancy has typically been in February. Results for any quarter may not be indicative of the results that may be achieved for the full fiscal year.
Inflation
Inflation in the United States has been relatively low in recent years and did not have a material impact on our results of operations for the years ended
December 31, 2018
,
2017
and
2016
. Although the impact of inflation has been relatively insignificant in recent years, it remains a factor in the U.S. economy and may increase the cost of acquiring or replacing self storage properties and related improvements, as well as real estate property taxes, employee salaries, wages and benefits, utilities, and other expenses. Because our tenant leases are month-to-month, we may be able to rapidly adjust our rental rates to minimize the adverse impact of any inflation which could mitigate our exposure to increases in costs and expenses resulting from inflation.
ITEM 7A. Quantitative and Qualitative Disclosures About Market Risk
Market risk refers to the risk of loss from adverse changes in market prices and interest rates. Our future income, cash flows, and fair values of financial instruments are dependent upon prevailing market interest rates. The primary market risk to which we believe we are exposed is interest rate risk. Interest rate risk is highly sensitive to many factors, including governmental monetary and tax policies, domestic and international economic and political considerations, and other factors beyond our control. We use interest rate swaps to moderate our exposure to interest rate risk by effectively converting the interest on variable rate debt to a fixed rate. We make limited use of other derivative financial instruments and we do not use them for trading or other speculative purposes.
As of
December 31, 2018
, we had
$214.5 million
of debt subject to variable interest rates (excluding variable-rate debt subject to interest rate swaps). If the one-month London Interbank Offered Rate ("LIBOR") were to increase or decrease by 100 basis points, the increase or decrease in interest expense on the variable-rate debt (excluding variable-rate debt subject to interest rate swaps) would increase or decrease future earnings and cash flows by approximately
$2.1 million
annually.
Interest rate risk amounts were determined by considering the impact of hypothetical interest rates on our financial instruments. These analyses do not consider the effect of any change in overall economic activity that could occur.
57
Further, in the event of a change of that magnitude, we may take actions to further mitigate our exposure to the change. However, due to the uncertainty of the specific actions that would be taken and their possible effects, these analyses assume no changes in our financial structure.
Item 8. Financial Statements and Supplementary Data
The independent registered public accounting firm's reports, consolidated financial statements and schedule listed in the accompanying index are filed as part of this report and incorporated herein by this reference. See "Index to Financial Statements" on page F-1 of this Annual Report on Form 10-K.
Item 9. Changes in and Disagreements With Accountants on Accounting and Financial Disclosure
None.
Item 9A. Controls and Procedures
Disclosure Controls and Procedures
A review and evaluation was performed by our management, including our Chief Executive Officer (the "CEO") and Chief Financial Officer (the "CFO"), of the effectiveness of the design and operation of our disclosure controls and procedures (as such term is defined in Rules 13a-15(e) and 15d-15(e) under the Exchange Act), as of the end of the period covered by this Annual Report on Form 10-K. Based on that review and evaluation, the CEO and CFO have concluded that our current disclosure controls and procedures, as designed and implemented, were effective.
Notwithstanding the foregoing, a control system, no matter how well designed and operated, can provide only reasonable, not absolute, assurance that it will detect or uncover failures within the Company to disclose material information otherwise required to be set forth in our periodic reports.
Management's Report on Internal Control Over Financial Reporting
Our management is responsible for establishing and maintaining adequate internal control over financial reporting. Internal control over financial reporting is defined in Rules 13a-15(f) and 15d-15(f) promulgated under the Exchange Act as a process designed by, or under the supervision of, our principal executive and principal financial officers and effected by our board of trustees, audit committee, management and other personnel to provide reasonable assurance regarding the reliability of financial reporting and the preparation of financial statements for external purposes in accordance with U.S. GAAP and includes those policies and procedures that:
|
•
|
pertain to the maintenance of records that in reasonable detail accurately and fairly reflect the transactions and dispositions of the assets of the Company;
|
|
•
|
provide reasonable assurance that transactions are recorded as necessary to permit preparation of financial statements in accordance with U.S. GAAP, and that our receipts and expenditures are being made only in accordance with authorizations of our management and trustees; and
|
|
•
|
provide reasonable assurance regarding prevention or timely detection of unauthorized acquisition, use or disposition of our assets that could have a material effect on the financial statements.
|
Because of its inherent limitations, internal control over financial reporting may not prevent or detect misstatements. Projections of any evaluation of effectiveness to future periods are subject to the risks that controls may become inadequate because of changes in conditions or that the degree of compliance with the policies or procedures may deteriorate.
Our management assessed the effectiveness of our internal control over financial reporting as of
December 31, 2018
. In making this assessment, our management used criteria set forth by the Committee of Sponsoring Organizations of the Treadway Commission in Internal Control-Integrated Framework (2013 Framework).
Based on this assessment, our management believes that, as of
December 31, 2018
, our internal control over financial reporting was effective based on those criteria.
The Company’s independent registered public accounting firm has issued an attestation report on the Company’s internal control over financial reporting.
58
Changes in Internal Control Over Financial Reporting
There have been no changes in our internal control over financial reporting that occurred during the quarter ended
December 31, 2018
that have materially affected, or are reasonably likely to materially affect, our internal control over financial reporting.
Item 9B. Other Information
None.
PART III
Item 10. Directors, Executive Officers and Corporate Governance
The information regarding our trustees, executive officers and certain other matters required by Item 401 of Regulation S-K is incorporated herein by reference to our definitive proxy statement relating to our annual meeting of shareholders (the "Proxy Statement"), to be filed with the SEC within 120 days after
December 31, 2018
.
The information regarding compliance with Section 16(a) of the Exchange Act required by Item 405 of Regulation S-K is incorporated herein by reference to the Proxy Statement to be filed with the SEC within 120 days after
December 31, 2018
.
The information regarding our Code of Business Conduct and Ethics required by Item 406 of Regulation S-K is incorporated herein by reference to the Proxy Statement to be filed with the SEC within 120 days after
December 31, 2018
.
The information regarding certain matters pertaining to our corporate governance required by Item 407(c)(3), (d)(4) and (d)(5) of Regulation S-K is incorporated by reference to the Proxy Statement to be filed with the SEC within 120 days after
December 31, 2018
.
Item 11. Executive Compensation
The information regarding executive compensation and other compensation related matters required by Items 402 and 407(e)(4) and (e)(5) of Regulation S-K is incorporated herein by reference to the Proxy Statement to be filed with the SEC within 120 days after
December 31, 2018
.
Item 12. Security Ownership of Certain Beneficial Owners and Management and Related Stockholder Matters
The tables on equity compensation plan information and beneficial ownership of the Company required by Items 201(d) and 403 of Regulation S-K are incorporated herein by reference to the Proxy Statement to be filed with the SEC within 120 days after
December 31, 2018
.
Item 13. Certain Relationships and Related Transactions, and Director Independence
The information regarding transactions with related persons, promoters and certain control persons and trustee independence required by Items 404 and 407(a) of Regulation S-K is incorporated herein by reference to the Proxy Statement to be filed with the SEC within 120 days after
December 31, 2018
.
Item 14. Principal Accounting Fees and Services
The information concerning principal accounting fees and services and the Audit Committee's pre-approval policies and procedures required by Item 14 is incorporated herein by reference to the Proxy Statement to be filed with the SEC within 120 days after
December 31, 2018
.
PART IV
Item 15. Exhibits, Financial Statement Schedules
(a)(1) The financial statements listed in the Index to Financial Statements on Page F-1 of this report are filed as part of this report and incorporated herein by reference.
(a)(2) The financial statement schedule listed in the Index to Financial Statements on Page F-1 of this report is filed as part of this report and incorporated herein by reference.
(a)(3) The Exhibit Index is incorporated herein by reference.
59
|
INDEX TO EXHIBITS (1) (2)
|
|
|
Exhibit Number
|
Exhibit Description
|
60
61
62
|
101*
|
XBRL (Extensible Business Reporting Language). The following materials from NSA's Annual Report on Form 10-K for the year ended December 31, 2018, tagged in XBRL: ((i) consolidated balance sheets; (ii) consolidated statements of operations; (iii) consolidated statements of comprehensive income (loss); (iv) consolidated statement of changes in equity; (v) consolidated statements of cash flows; (vi) notes to consolidated financial statements; and (vii) financial statement schedule (3).
|
|
*
|
Filed herewith.
|
Item 16. Form 10-K Summary
None.
63
SIGNATURES
Pursuant to the requirements of Section 13 or 15(d) of the Securities Exchange Act of 1934, the registrant has duly caused this report to be signed on its behalf by the undersigned thereunto duly authorized.
|
National Storage Affiliates Trust
|
|
|
By:
|
/s/ ARLEN D. NORDHAGEN
|
|
Arlen D. Nordhagen
|
|
|
chairman of the board of trustees and
|
|
|
chief executive officer
|
|
|
(principal executive officer)
|
|
Date:
February 26, 2019
POWER OF ATTORNEY
KNOW ALL PERSONS BY THESE PRESENTS, that each person whose signature appears below constitutes and appoints Arlen D. Nordhagen and Tamara D. Fischer, and each of them, with full power to act without the other, such person's true and lawful attorneys-in-fact and agents, with full power of substitution and resubstitution, for him or her and in his or her name, place and stead, in any and all capacities, to sign this Form 10-K and any and all amendments thereto, and to file the same, with exhibits and schedules thereto, and other documents in connection therewith, with the Securities and Exchange Commission, granting unto said attorneys-in-fact and agents, and each of them, full power and authority to do and perform each and every act and thing necessary or desirable to be done in and about the premises, as fully to all intents and purposes as he or she might or could do in person, hereby ratifying and confirming all that said attorneys-in-fact and agents, or any of them, or their or his or her substitute or substitutes, may lawfully do or cause to be done by virtue hereof.
64
Pursuant to the requirements of the Securities Exchange Act of 1934, the registrant has duly caused this report to be signed on its behalf by the undersigned and in the capacities and on the dates indicated.
|
Signature
|
Title
|
Date
|
|
National Storage Affiliates Trust
|
||
|
/s/ ARLEN D. NORDHAGEN
|
chairman of the board of trustees and
|
February 26, 2019
|
|
Arlen D. Nordhagen
|
chief executive officer
|
|
|
(principal executive officer)
|
||
|
/s/ TAMARA D. FISCHER
|
president and chief financial officer
|
February 26, 2019
|
|
Tamara D. Fischer
|
(principal financial officer)
|
|
|
/s/ BRANDON S. TOGASHI
|
chief accounting officer
|
February 26, 2019
|
|
Brandon S. Togashi
|
(principal accounting officer)
|
|
|
/s/ GEORGE L. CHAPMAN
|
trustee
|
February 26, 2019
|
|
George L. Chapman
|
||
|
/s/ KEVIN M. HOWARD
|
trustee
|
February 26, 2019
|
|
Kevin M. Howard
|
||
|
/s/ PAUL W. HYLBERT, JR.
|
trustee
|
February 26, 2019
|
|
Paul W. Hylbert, Jr.
|
||
|
/s/ CHAD L. MEISINGER
|
trustee
|
February 26, 2019
|
|
Chad L. Meisinger
|
||
|
/s/ STEVEN G. OSGOOD
|
trustee
|
February 26, 2019
|
|
Steven G. Osgood
|
||
|
/s/ DOMINIC M. PALAZZO
|
trustee
|
February 26, 2019
|
|
Dominic M. Palazzo
|
||
|
/s/ REBECCA L. STEINFORT
|
trustee
|
February 26, 2019
|
|
Rebecca L. Steinfort
|
||
|
/s/ MARK VAN MOURICK
|
trustee
|
February 26, 2019
|
|
Mark Van Mourick
|
||
65
|
NATIONAL STORAGE AFFILIATES TRUST
|
||
|
INDEX TO FINANCIAL STATEMENTS
|
||
|
Page
|
||
|
Financial Statements:
|
||
|
Reports of Independent Registered Public Accounting Firm
|
||
|
Consolidated Balance Sheets as of December 31, 2018 and 2017
|
||
|
Consolidated Statements of Operations for the Years Ended December 31, 2018, 2017 and 2016
|
||
|
Consolidated Statements of Comprehensive Income (Loss) for the Years Ended December 31, 2018, 2017 and 2016
|
||
|
Consolidated Statements of Changes in Equity for the Years Ended December 31, 2018, 2017 and 2016
|
||
|
Consolidated Statements of Cash Flows for the Years Ended December 31, 2018, 2017 and 2016
|
||
|
Notes to the Consolidated Financial Statements
|
||
|
Financial Statement Schedule:
|
||
|
Schedule III - Real Estate and Accumulated Depreciation
|
||
|
All other schedules are omitted because they are not applicable or the required information is shown in the financial statements or notes thereto.
|
||
F-1
Report of Independent Registered Public Accounting Firm
To the Shareholders and Board of Trustees
National Storage Affiliates Trust:
National Storage Affiliates Trust:
Opinion on the Consolidated Financial Statements
We have audited the accompanying consolidated balance sheets of National Storage Affiliates Trust and subsidiaries (the Company) as of
December 31, 2018
and
2017
, the related consolidated statements of operations, comprehensive income (loss), changes in equity, and cash flows for each of the years in the three‑year period ended
December 31, 2018
, and the related notes, and the financial statement schedule, Schedule III - Real Estate and Accumulated Depreciation (collectively, the consolidated financial statements). In our opinion, the consolidated financial statements present fairly, in all material respects, the financial position of the Company as of
December 31, 2018
and
2017
, and the results of its operations and its cash flows for each of the years in the three‑year period ended
December 31, 2018
, in conformity with U.S. generally accepted accounting principles.
We also have audited, in accordance with the standards of the Public Company Accounting Oversight Board (United States) (PCAOB), the Company’s internal control over financial reporting as of
December 31, 2018
, based on criteria established in
Internal Control - Integrated Framework (2013)
issued by the Committee of Sponsoring Organizations of the Treadway Commission, and our report dated
February 26, 2019
expressed an unqualified opinion on the effectiveness of the Company’s internal control over financial reporting.
Basis for Opinion
These consolidated financial statements are the responsibility of the Company’s management. Our responsibility is to express an opinion on these consolidated financial statements based on our audits. We are a public accounting firm registered with the PCAOB and are required to be independent with respect to the Company in accordance with the U.S. federal securities laws and the applicable rules and regulations of the Securities and Exchange Commission and the PCAOB.
We conducted our audits in accordance with the standards of the PCAOB. Those standards require that we plan and perform the audit to obtain reasonable assurance about whether the consolidated financial statements are free of material misstatement, whether due to error or fraud. Our audits included performing procedures to assess the risks of material misstatement of the consolidated financial statements, whether due to error or fraud, and performing procedures that respond to those risks. Such procedures included examining, on a test basis, evidence regarding the amounts and disclosures in the consolidated financial statements. Our audits also included evaluating the accounting principles used and significant estimates made by management, as well as evaluating the overall presentation of the consolidated financial statements. We believe that our audits provide a reasonable basis for our opinion.
/s/ KPMG LLP
We have served as the Company’s auditor since 2013.
Denver, Colorado
February 26, 2019
February 26, 2019
F-2
Report of Independent Registered Public Accounting Firm
To the Shareholders and Board of Trustees
National Storage Affiliates Trust:
National Storage Affiliates Trust:
Opinion on Internal Control Over Financial Reporting
We have audited National Storage Affiliates Trust and subsidiaries’ (the Company) internal control over financial reporting as of
December 31, 2018
based on criteria established in
Internal Control - Integrated Framework (2013)
issued by the Committee of Sponsoring Organizations of the Treadway Commission. In our opinion, the Company maintained, in all material respects, effective internal control over financial reporting as of
December 31, 2018
, based on criteria established in
Internal Control - Integrated Framework (2013)
issued by the Committee of Sponsoring Organizations of the Treadway Commission.
We also have audited, in accordance with the standards of the Public Company Accounting Oversight Board (United States) (PCAOB), the consolidated balance sheets of the Company as of
December 31, 2018
and
2017
, the related consolidated statements of operations, comprehensive income (loss), changes in equity, and cash flows for each of the years in the three-year period ended
December 31, 2018
, and the related notes, and the financial statement schedule, Schedule III - Real Estate and Accumulated Depreciation (collectively, the consolidated financial statements), and our report dated
February 26, 2019
expressed an unqualified opinion on those consolidated financial statements.
Basis for Opinion
The Company’s management is responsible for maintaining effective internal control over financial reporting and for its assessment of the effectiveness of internal control over financial reporting, included in the accompanying Management’s Report on Internal Control Over Financial Reporting. Our responsibility is to express an opinion on the Company’s internal control over financial reporting based on our audit. We are a public accounting firm registered with the PCAOB and are required to be independent with respect to the Company in accordance with the U.S. federal securities laws and the applicable rules and regulations of the Securities and Exchange Commission and the PCAOB.
We conducted our audit in accordance with the standards of the PCAOB. Those standards require that we plan and perform the audit to obtain reasonable assurance about whether effective internal control over financial reporting was maintained in all material respects. Our audit of internal control over financial reporting included obtaining an understanding of internal control over financial reporting, assessing the risk that a material weakness exists, and testing and evaluating the design and operating effectiveness of internal control based on the assessed risk. Our audit also included performing such other procedures as we considered necessary in the circumstances. We believe that our audit provides a reasonable basis for our opinion.
Definition and Limitations of Internal Control Over Financial Reporting
A company’s internal control over financial reporting is a process designed to provide reasonable assurance regarding the reliability of financial reporting and the preparation of financial statements for external purposes in accordance with generally accepted accounting principles. A company’s internal control over financial reporting includes those policies and procedures that (1) pertain to the maintenance of records that, in reasonable detail, accurately and fairly reflect the transactions and dispositions of the assets of the company; (2) provide reasonable assurance that transactions are recorded as necessary to permit preparation of financial statements in accordance with generally accepted accounting principles, and that receipts and expenditures of the company are being made only in accordance with authorizations of management and directors of the company; and (3) provide reasonable assurance regarding prevention or timely detection of unauthorized acquisition, use, or disposition of the company’s assets that could have a material effect on the financial statements.
Because of its inherent limitations, internal control over financial reporting may not prevent or detect misstatements. Also, projections of any evaluation of effectiveness to future periods are subject to the risk that controls may become inadequate because of changes in conditions, or that the degree of compliance with the policies or procedures may deteriorate.
/s/ KPMG LLP
Denver, Colorado
February 26, 2019
February 26, 2019
F-3
NATIONAL STORAGE AFFILIATES TRUST
CONSOLIDATED BALANCE SHEETS
(dollars in thousands, except per share amounts)
|
December 31,
|
|||||||
|
2018
|
2017
|
||||||
|
ASSETS
|
|||||||
|
Real estate
|
|||||||
|
Self storage properties
|
$
|
2,637,723
|
|
$
|
2,275,233
|
|
|
|
Less accumulated depreciation
|
(246,261
|
)
|
(170,358
|
)
|
|||
|
Self storage properties, net
|
2,391,462
|
|
2,104,875
|
|
|||
|
Cash and cash equivalents
|
13,181
|
|
13,366
|
|
|||
|
Restricted cash
|
3,182
|
|
3,041
|
|
|||
|
Debt issuance costs, net
|
1,260
|
|
2,185
|
|
|||
|
Investment in unconsolidated real estate ventures
|
245,125
|
|
89,093
|
|
|||
|
Other assets, net
|
75,053
|
|
52,615
|
|
|||
|
Assets held for sale
|
—
|
|
1,555
|
|
|||
|
Total assets
|
$
|
2,729,263
|
|
$
|
2,266,730
|
|
|
|
LIABILITIES AND EQUITY
|
|||||||
|
Liabilities
|
|||||||
|
Debt financing
|
$
|
1,278,102
|
|
$
|
958,097
|
|
|
|
Accounts payable and accrued liabilities
|
33,130
|
|
24,459
|
|
|||
|
Deferred revenue
|
15,732
|
|
12,687
|
|
|||
|
Total liabilities
|
1,326,964
|
|
995,243
|
|
|||
|
Commitments and contingencies (Note 12)
|
|
|
|||||
|
Equity
|
|||||||
|
Preferred shares of beneficial interest, par value $0.01 per share. 50,000,000 authorized, 6,900,000 issued and outstanding at December 31, 2018 and 2017, at liquidation preference
|
172,500
|
|
172,500
|
|
|||
|
Common shares of beneficial interest, par value $0.01 per share. 250,000,000 authorized, 56,654,009 and 50,284,934 shares issued and outstanding at December 31, 2018 and 2017, respectively
|
567
|
|
503
|
|
|||
|
Additional paid-in capital
|
844,276
|
|
711,467
|
|
|||
|
Distributions in excess of earnings
|
(114,122
|
)
|
(55,729
|
)
|
|||
|
Accumulated other comprehensive income
|
13,618
|
|
12,282
|
|
|||
|
Total shareholders' equity
|
916,839
|
|
841,023
|
|
|||
|
Noncontrolling interests
|
485,460
|
|
430,464
|
|
|||
|
Total equity
|
1,402,299
|
|
1,271,487
|
|
|||
|
Total liabilities and equity
|
$
|
2,729,263
|
|
$
|
2,266,730
|
|
|
See notes to consolidated financial statements.
F-4
NATIONAL STORAGE AFFILIATES TRUST
CONSOLIDATED STATEMENTS OF OPERATIONS
(in thousands, except per share amounts)
|
Year Ended December 31,
|
|||||||||||
|
2018
|
2017
|
2016
|
|||||||||
|
REVENUE
|
|||||||||||
|
Rental revenue
|
$
|
308,403
|
|
$
|
251,814
|
|
$
|
191,178
|
|
||
|
Other property-related revenue
|
10,183
|
|
8,255
|
|
6,059
|
|
|||||
|
Management fees and other revenue
|
12,310
|
|
8,061
|
|
1,809
|
|
|||||
|
Total revenue
|
330,896
|
|
268,130
|
|
199,046
|
|
|||||
|
OPERATING EXPENSES
|
|||||||||||
|
Property operating expenses
|
103,875
|
|
84,455
|
|
64,798
|
|
|||||
|
General and administrative expenses
|
36,220
|
|
30,060
|
|
21,528
|
|
|||||
|
Depreciation and amortization
|
89,147
|
|
75,115
|
|
55,064
|
|
|||||
|
Total operating expenses
|
229,242
|
|
189,630
|
|
141,390
|
|
|||||
|
Income from operations
|
101,654
|
|
78,500
|
|
57,656
|
|
|||||
|
OTHER (EXPENSE) INCOME
|
|||||||||||
|
Interest expense
|
(42,724
|
)
|
(34,068
|
)
|
(24,109
|
)
|
|||||
|
Loss on early extinguishment of debt
|
—
|
|
—
|
|
(136
|
)
|
|||||
|
Equity in losses of unconsolidated real estate ventures
|
(1,423
|
)
|
(2,339
|
)
|
(1,484
|
)
|
|||||
|
Acquisition costs
|
(663
|
)
|
(593
|
)
|
(6,546
|
)
|
|||||
|
Non-operating expense
|
(91
|
)
|
(58
|
)
|
(147
|
)
|
|||||
|
Gain on sale of self storage properties
|
391
|
|
5,715
|
|
—
|
|
|||||
|
Other expense
|
(44,510
|
)
|
(31,343
|
)
|
(32,422
|
)
|
|||||
|
Income before income taxes
|
57,144
|
|
47,157
|
|
25,234
|
|
|||||
|
Income tax expense
|
(818
|
)
|
(1,159
|
)
|
(368
|
)
|
|||||
|
Net income
|
56,326
|
|
45,998
|
|
24,866
|
|
|||||
|
Net income attributable to noncontrolling interests
|
(42,217
|
)
|
(43,037
|
)
|
(6,901
|
)
|
|||||
|
Net income attributable to National Storage Affiliates Trust
|
14,109
|
|
2,961
|
|
17,965
|
|
|||||
|
Distributions to preferred shareholders
|
(10,350
|
)
|
(2,300
|
)
|
—
|
|
|||||
|
Net income attributable to common shareholders
|
$
|
3,759
|
|
$
|
661
|
|
$
|
17,965
|
|
||
|
Earnings (loss) per share - basic
|
$
|
0.07
|
|
$
|
0.01
|
|
$
|
0.60
|
|
||
|
Earnings (loss) per share - diluted
|
$
|
0.07
|
|
$
|
0.01
|
|
$
|
0.31
|
|
||
|
Weighted average shares outstanding - basic
|
53,293
|
|
44,423
|
|
29,887
|
|
|||||
|
Weighted average shares outstanding - diluted
|
53,293
|
|
44,423
|
|
78,747
|
|
|||||
See notes to consolidated financial statements.
F-5
NATIONAL STORAGE AFFILIATES TRUST
CONSOLIDATED STATEMENTS OF COMPREHENSIVE INCOME (LOSS)
(dollars in thousands)
|
Year Ended December 31,
|
|||||||||||
|
2018
|
2017
|
2016
|
|||||||||
|
Net income
|
$
|
56,326
|
|
$
|
45,998
|
|
$
|
24,866
|
|
||
|
Other comprehensive income (loss)
|
|||||||||||
|
Unrealized gain on derivative contracts
|
3,598
|
|
1,935
|
|
6,434
|
|
|||||
|
Reclassification of other comprehensive (income) loss to interest expense
|
(1,817
|
)
|
2,308
|
|
2,678
|
|
|||||
|
Other comprehensive income
|
1,781
|
|
4,243
|
|
9,112
|
|
|||||
|
Comprehensive income
|
58,107
|
|
50,241
|
|
33,978
|
|
|||||
|
Comprehensive income attributable to noncontrolling interests
|
(43,244
|
)
|
(44,697
|
)
|
(7,272
|
)
|
|||||
|
Comprehensive income attributable to National Storage Affiliates Trust
|
$
|
14,863
|
|
$
|
5,544
|
|
$
|
26,706
|
|
||
See notes to consolidated financial statements.
F-6
NATIONAL STORAGE AFFILIATES TRUST
CONSOLIDATED STATEMENT OF CHANGES IN EQUITY
(dollars in thousands, except share amounts)
|
Accumulated
|
|||||||||||||||||||||||||||||||||
|
Additional
|
Distributions
|
Other
|
|||||||||||||||||||||||||||||||
|
Preferred Shares
|
Common Shares
|
Paid-in
|
in Excess of
|
Comprehensive
|
Noncontrolling
|
Total
|
|||||||||||||||||||||||||||
|
Number
|
Amount
|
Number
|
Amount
|
Capital
|
Earnings
|
Income
|
Interests
|
Equity
|
|||||||||||||||||||||||||
|
Balances, December 31, 2015
|
—
|
|
$
|
—
|
|
23,015,751
|
|
$
|
230
|
|
$
|
236,392
|
|
$
|
11
|
|
$
|
—
|
|
$
|
279,414
|
|
$
|
516,047
|
|
||||||||
|
OP equity issuances in business combinations:
|
|||||||||||||||||||||||||||||||||
|
OP units and subordinated performance units, net of offering costs
|
—
|
|
—
|
|
—
|
|
—
|
|
—
|
|
—
|
|
—
|
|
120,827
|
|
120,827
|
|
|||||||||||||||
|
LTIP units
|
—
|
|
—
|
|
—
|
|
—
|
|
—
|
|
—
|
|
—
|
|
814
|
|
814
|
|
|||||||||||||||
|
Redemption of OP units
|
—
|
|
—
|
|
1,125,503
|
|
11
|
|
13,004
|
|
—
|
|
(4
|
)
|
(13,011
|
)
|
—
|
|
|||||||||||||||
|
Issuance of common shares, net of offering costs
|
—
|
|
—
|
|
18,962,209
|
|
190
|
|
376,224
|
|
—
|
|
—
|
|
—
|
|
376,414
|
|
|||||||||||||||
|
Issuance of common shares, share based compensation plans
|
—
|
|
—
|
|
4,309
|
|
—
|
|
—
|
|
—
|
|
—
|
|
—
|
|
—
|
|
|||||||||||||||
|
Effect of changes in ownership for consolidated entities
|
—
|
|
—
|
|
—
|
|
—
|
|
(49,349
|
)
|
—
|
|
288
|
|
49,061
|
|
—
|
|
|||||||||||||||
|
Issuance of OP units
|
—
|
|
—
|
|
—
|
|
—
|
|
—
|
|
—
|
|
—
|
|
1,441
|
|
1,441
|
|
|||||||||||||||
|
Equity-based compensation expense
|
—
|
|
—
|
|
—
|
|
—
|
|
120
|
|
—
|
|
—
|
|
2,477
|
|
2,597
|
|
|||||||||||||||
|
Issuance of LTIP units for acquisition expenses
|
—
|
|
—
|
|
—
|
|
—
|
|
—
|
|
—
|
|
—
|
|
56
|
|
56
|
|
|||||||||||||||
|
Issuance of restricted common shares
|
—
|
|
—
|
|
8,090
|
|
—
|
|
—
|
|
—
|
|
—
|
|
—
|
|
—
|
|
|||||||||||||||
|
Vesting and forfeitures of restricted common shares
|
—
|
|
—
|
|
(5,500
|
)
|
—
|
|
(26
|
)
|
—
|
|
—
|
|
—
|
|
(26
|
)
|
|||||||||||||||
|
Reduction in receivables from partners of OP
|
—
|
|
—
|
|
—
|
|
—
|
|
—
|
|
—
|
|
—
|
|
1,375
|
|
1,375
|
|
|||||||||||||||
|
Common share dividends
|
—
|
|
—
|
|
—
|
|
—
|
|
—
|
|
(26,695
|
)
|
—
|
|
—
|
|
(26,695
|
)
|
|||||||||||||||
|
Distributions to noncontrolling interests
|
—
|
|
—
|
|
—
|
|
—
|
|
—
|
|
—
|
|
—
|
|
(47,760
|
)
|
(47,760
|
)
|
|||||||||||||||
|
Other comprehensive income
|
—
|
|
—
|
|
—
|
|
—
|
|
—
|
|
—
|
|
8,741
|
|
371
|
|
9,112
|
|
|||||||||||||||
|
Net income
|
—
|
|
—
|
|
—
|
|
—
|
|
—
|
|
17,965
|
|
—
|
|
6,901
|
|
24,866
|
|
|||||||||||||||
|
Balances, December 31, 2016
|
—
|
|
—
|
|
43,110,362
|
|
431
|
|
576,365
|
|
(8,719
|
)
|
9,025
|
|
401,966
|
|
979,068
|
|
|||||||||||||||
|
Issuance of preferred shares, net of offering costs
|
6,900,000
|
|
172,500
|
|
—
|
|
—
|
|
(5,934
|
)
|
—
|
|
—
|
|
—
|
|
166,566
|
|
|||||||||||||||
See notes to consolidated financial statements.
F-7
NATIONAL STORAGE AFFILIATES TRUST
CONSOLIDATED STATEMENT OF CHANGES IN EQUITY (CONTINUED)
(dollars in thousands, except share amounts)
|
Accumulated
|
|||||||||||||||||||||||||||||||||
|
Additional
|
Distributions
|
Other
|
|||||||||||||||||||||||||||||||
|
Preferred Shares
|
Common Shares
|
Paid-in
|
in Excess of
|
Comprehensive
|
Noncontrolling
|
Total
|
|||||||||||||||||||||||||||
|
Number
|
Amount
|
Number
|
Amount
|
Capital
|
Earnings
|
Income
|
Interests
|
Equity
|
|||||||||||||||||||||||||
|
OP equity recorded in connection with property acquisitions:
|
|||||||||||||||||||||||||||||||||
|
OP units and subordinated performance units, net of offering costs
|
—
|
|
—
|
|
—
|
|
—
|
|
—
|
|
—
|
|
—
|
|
29,900
|
|
29,900
|
|
|||||||||||||||
|
LTIP units
|
—
|
|
—
|
|
—
|
|
—
|
|
—
|
|
—
|
|
—
|
|
854
|
|
854
|
|
|||||||||||||||
|
Issuance of subordinated performance units
|
—
|
|
—
|
|
—
|
|
—
|
|
—
|
|
—
|
|
—
|
|
7,000
|
|
7,000
|
|
|||||||||||||||
|
Redemptions of OP units
|
—
|
|
—
|
|
1,409,715
|
|
14
|
|
18,389
|
|
—
|
|
289
|
|
(18,692
|
)
|
—
|
|
|||||||||||||||
|
Issuance of common shares, net of offering costs
|
—
|
|
—
|
|
5,750,000
|
|
58
|
|
140,203
|
|
—
|
|
—
|
|
—
|
|
140,261
|
|
|||||||||||||||
|
Issuance of common shares, share based compensation plans
|
—
|
|
—
|
|
6,862
|
|
—
|
|
—
|
|
—
|
|
—
|
|
—
|
|
—
|
|
|||||||||||||||
|
Effect of changes in ownership for consolidated entities
|
—
|
|
—
|
|
—
|
|
—
|
|
(17,749
|
)
|
—
|
|
385
|
|
17,364
|
|
—
|
|
|||||||||||||||
|
Issuance of OP units
|
—
|
|
—
|
|
—
|
|
—
|
|
—
|
|
—
|
|
—
|
|
1,262
|
|
1,262
|
|
|||||||||||||||
|
Equity-based compensation expense
|
—
|
|
—
|
|
—
|
|
—
|
|
244
|
|
—
|
|
—
|
|
3,520
|
|
3,764
|
|
|||||||||||||||
|
Issuance of LTIP units for acquisition expenses
|
—
|
|
—
|
|
—
|
|
—
|
|
—
|
|
—
|
|
—
|
|
15
|
|
15
|
|
|||||||||||||||
|
Issuance of restricted common shares
|
—
|
|
—
|
|
16,525
|
|
—
|
|
—
|
|
—
|
|
—
|
|
—
|
|
—
|
|
|||||||||||||||
|
Vesting and forfeitures of restricted common shares
|
—
|
|
—
|
|
(8,530
|
)
|
—
|
|
(51
|
)
|
—
|
|
—
|
|
—
|
|
(51
|
)
|
|||||||||||||||
|
Reduction in receivables from partners of OP
|
—
|
|
—
|
|
—
|
|
—
|
|
—
|
|
—
|
|
—
|
|
812
|
|
812
|
|
|||||||||||||||
|
Preferred share dividends
|
—
|
|
—
|
|
—
|
|
—
|
|
—
|
|
(2,300
|
)
|
—
|
|
—
|
|
(2,300
|
)
|
|||||||||||||||
|
Common share dividends
|
—
|
|
—
|
|
—
|
|
—
|
|
—
|
|
(47,671
|
)
|
—
|
|
—
|
|
(47,671
|
)
|
|||||||||||||||
|
Distributions to noncontrolling interests
|
—
|
|
—
|
|
—
|
|
—
|
|
—
|
|
—
|
|
—
|
|
(58,234
|
)
|
(58,234
|
)
|
|||||||||||||||
|
Other comprehensive income
|
—
|
|
—
|
|
—
|
|
—
|
|
—
|
|
—
|
|
2,583
|
|
1,660
|
|
4,243
|
|
|||||||||||||||
|
Net income
|
—
|
|
—
|
|
—
|
|
—
|
|
—
|
|
2,961
|
|
—
|
|
43,037
|
|
45,998
|
|
|||||||||||||||
|
Balances, December 31, 2017
|
6,900,000
|
|
172,500
|
|
50,284,934
|
|
503
|
|
711,467
|
|
(55,729
|
)
|
12,282
|
|
430,464
|
|
1,271,487
|
|
|||||||||||||||
See notes to consolidated financial statements.
F-8
NATIONAL STORAGE AFFILIATES TRUST
CONSOLIDATED STATEMENT OF CHANGES IN EQUITY (CONTINUED)
(dollars in thousands, except share amounts)
|
Accumulated
|
|||||||||||||||||||||||||||||||||
|
Additional
|
Distributions
|
Other
|
|||||||||||||||||||||||||||||||
|
Preferred Shares
|
Common Shares
|
Paid-in
|
in Excess of
|
Comprehensive
|
Noncontrolling
|
Total
|
|||||||||||||||||||||||||||
|
Number
|
Amount
|
Number
|
Amount
|
Capital
|
Earnings
|
Income
|
Interests
|
Equity
|
|||||||||||||||||||||||||
|
OP equity issued for property acquisitions:
|
|||||||||||||||||||||||||||||||||
|
Series A-1 preferred units, OP units and subordinated performance units, net of offering costs
|
—
|
|
—
|
|
—
|
|
—
|
|
—
|
|
—
|
|
—
|
|
27,962
|
|
27,962
|
|
|||||||||||||||
|
Redemptions of OP units
|
—
|
|
—
|
|
462,778
|
|
5
|
|
5,904
|
|
—
|
|
172
|
|
(6,081
|
)
|
—
|
|
|||||||||||||||
|
Issuance of common shares, net of offering costs
|
—
|
|
—
|
|
5,900,000
|
|
59
|
|
175,557
|
|
—
|
|
—
|
|
—
|
|
175,616
|
|
|||||||||||||||
|
Effect of changes in ownership for consolidated entities
|
—
|
|
—
|
|
—
|
|
—
|
|
(48,830
|
)
|
—
|
|
410
|
|
48,420
|
|
—
|
|
|||||||||||||||
|
Issuance of OP units
|
—
|
|
—
|
|
—
|
|
—
|
|
—
|
|
—
|
|
—
|
|
1,236
|
|
1,236
|
|
|||||||||||||||
|
Equity-based compensation expense
|
—
|
|
—
|
|
—
|
|
—
|
|
253
|
|
—
|
|
—
|
|
3,584
|
|
3,837
|
|
|||||||||||||||
|
Issuance of restricted common shares
|
—
|
|
—
|
|
12,311
|
|
—
|
|
—
|
|
—
|
|
—
|
|
—
|
|
—
|
|
|||||||||||||||
|
Vesting and forfeitures of restricted common shares, net
|
—
|
|
—
|
|
(6,014
|
)
|
—
|
|
(75
|
)
|
—
|
|
—
|
|
—
|
|
(75
|
)
|
|||||||||||||||
|
Reduction in receivables from partners of the operating partnership
|
—
|
|
—
|
|
—
|
|
—
|
|
—
|
|
—
|
|
—
|
|
642
|
|
642
|
|
|||||||||||||||
|
Preferred share dividends
|
—
|
|
—
|
|
—
|
|
—
|
|
—
|
|
(10,350
|
)
|
—
|
|
—
|
|
(10,350
|
)
|
|||||||||||||||
|
Common share dividends
|
—
|
|
—
|
|
—
|
|
—
|
|
—
|
|
(62,152
|
)
|
—
|
|
—
|
|
(62,152
|
)
|
|||||||||||||||
|
Distributions to noncontrolling interests
|
—
|
|
—
|
|
—
|
|
—
|
|
—
|
|
—
|
|
—
|
|
(64,011
|
)
|
(64,011
|
)
|
|||||||||||||||
|
Other comprehensive income
|
—
|
|
—
|
|
—
|
|
—
|
|
—
|
|
—
|
|
754
|
|
1,027
|
|
1,781
|
|
|||||||||||||||
|
Net income
|
—
|
|
—
|
|
—
|
|
—
|
|
—
|
|
14,109
|
|
—
|
|
42,217
|
|
56,326
|
|
|||||||||||||||
|
Balances, December 31, 2018
|
6,900,000
|
|
$
|
172,500
|
|
56,654,009
|
|
$
|
567
|
|
$
|
844,276
|
|
$
|
(114,122
|
)
|
$
|
13,618
|
|
$
|
485,460
|
|
$
|
1,402,299
|
|
||||||||
See notes to consolidated financial statements.
F-9
NATIONAL STORAGE AFFILIATES TRUST
CONSOLIDATED STATEMENTS OF CASH FLOWS
(dollars in thousands)
|
Year Ended December 31,
|
|||||||||||
|
2018
|
2017
|
2016
|
|||||||||
|
CASH FLOWS FROM OPERATING ACTIVITIES
|
|||||||||||
|
Net income
|
$
|
56,326
|
|
$
|
45,998
|
|
$
|
24,866
|
|
||
|
Adjustments to reconcile net income to net cash provided by operating activities:
|
|||||||||||
|
Depreciation and amortization
|
89,147
|
|
75,115
|
|
55,064
|
|
|||||
|
Amortization of debt issuance costs
|
2,569
|
|
2,175
|
|
1,955
|
|
|||||
|
Amortization of debt discount and premium, net
|
(1,469
|
)
|
(1,570
|
)
|
(2,051
|
)
|
|||||
|
Loss on debt extinguishment
|
—
|
|
—
|
|
136
|
|
|||||
|
Gain on sale of self storage properties
|
(391
|
)
|
(5,715
|
)
|
—
|
|
|||||
|
LTIP units issued for acquisition expenses
|
—
|
|
—
|
|
56
|
|
|||||
|
Equity-based compensation expense
|
3,837
|
|
3,764
|
|
2,597
|
|
|||||
|
Equity in losses of unconsolidated real estate ventures
|
1,423
|
|
2,339
|
|
1,484
|
|
|||||
|
Distributions from unconsolidated real estate ventures
|
8,187
|
|
5,093
|
|
730
|
|
|||||
|
Change in assets and liabilities, net of effects of self storage property acquisitions:
|
|||||||||||
|
Other assets
|
(5,713
|
)
|
(2,398
|
)
|
(1,994
|
)
|
|||||
|
Accounts payable and accrued liabilities
|
6,597
|
|
1,200
|
|
8,386
|
|
|||||
|
Deferred revenue
|
1,283
|
|
(1,713
|
)
|
3,417
|
|
|||||
|
Net Cash Provided by Operating Activities
|
161,796
|
|
124,288
|
|
94,646
|
|
|||||
|
CASH FLOWS FROM INVESTING ACTIVITIES
|
|||||||||||
|
Acquisition of self storage properties
|
(313,712
|
)
|
(391,619
|
)
|
(532,030
|
)
|
|||||
|
Capital expenditures
|
(19,014
|
)
|
(14,656
|
)
|
(11,418
|
)
|
|||||
|
Investments in and advances to unconsolidated real estate ventures
|
(165,642
|
)
|
(15,289
|
)
|
(82,950
|
)
|
|||||
|
Distributions from unconsolidated real estate ventures
|
—
|
|
250
|
|
—
|
|
|||||
|
Acquisition of property management platform
|
—
|
|
—
|
|
(19,933
|
)
|
|||||
|
Deposits and advances for self storage property and other acquisitions
|
(20,977
|
)
|
(4,923
|
)
|
(345
|
)
|
|||||
|
Expenditures for corporate furniture, equipment and other
|
(403
|
)
|
(588
|
)
|
(527
|
)
|
|||||
|
Net proceeds from sale of self storage properties
|
5,259
|
|
17,534
|
|
4,823
|
|
|||||
|
Net Cash Used In Investing Activities
|
(514,489
|
)
|
(409,291
|
)
|
(642,380
|
)
|
|||||
|
CASH FLOWS FROM FINANCING ACTIVITIES
|
|||||||||||
|
Proceeds from issuance of common shares
|
175,616
|
|
140,261
|
|
378,281
|
|
|||||
|
Proceeds from issuance of preferred shares
|
—
|
|
166,566
|
|
—
|
|
|||||
|
Proceeds from issuance of subordinated performance units
|
—
|
|
7,000
|
|
—
|
|
|||||
|
Borrowings under debt financings
|
822,500
|
|
760,900
|
|
812,500
|
|
|||||
|
Receipts for OP unit subscriptions
|
1,211
|
|
1,150
|
|
1,344
|
|
|||||
|
Collection of receivables from issuance of OP equity
|
—
|
|
—
|
|
930
|
|
|||||
|
Principal payments under debt financings
|
(507,239
|
)
|
(679,104
|
)
|
(558,597
|
)
|
|||||
|
Payment of dividends to common shareholders
|
(62,152
|
)
|
(47,671
|
)
|
(26,695
|
)
|
|||||
|
Payment of dividends to preferred shareholders
|
(10,350
|
)
|
(2,300
|
)
|
—
|
|
|||||
|
Distributions to noncontrolling interests
|
(63,350
|
)
|
(57,314
|
)
|
(47,005
|
)
|
|||||
|
Debt issuance costs
|
(2,860
|
)
|
(2,381
|
)
|
(5,665
|
)
|
|||||
See notes to consolidated financial statements.
F-10
NATIONAL STORAGE AFFILIATES TRUST
CONSOLIDATED STATEMENTS OF CASH FLOWS (CONTINUED)
(dollars in thousands)
|
Year Ended December 31,
|
|||||||||||
|
2018
|
2017
|
2016
|
|||||||||
|
Equity offering costs
|
(727
|
)
|
(1,034
|
)
|
(1,399
|
)
|
|||||
|
Net Cash Provided by Financing Activities
|
352,649
|
|
286,073
|
|
553,694
|
|
|||||
|
(Decrease) Increase in Cash, Cash Equivalents and Restricted Cash
|
(44
|
)
|
1,070
|
|
5,960
|
|
|||||
|
CASH, CASH EQUIVALENTS AND RESTRICTED CASH
|
|||||||||||
|
Beginning of year
|
16,407
|
|
15,337
|
|
9,377
|
|
|||||
|
End of year
|
$
|
16,363
|
|
$
|
16,407
|
|
$
|
15,337
|
|
||
|
Supplemental Cash Flow Information
|
|||||||||||
|
Cash paid for interest
|
$
|
40,475
|
|
$
|
32,951
|
|
$
|
23,313
|
|
||
|
Supplemental Disclosure of Non-Cash Investing and Financing Activities
|
|||||||||||
|
Consideration exchanged in property acquisitions:
|
|||||||||||
|
Issuance of OP units and subordinated performance units
|
$
|
28,063
|
|
$
|
30,327
|
|
$
|
120,952
|
|
||
|
Deposits on acquisitions applied to purchase price
|
5,050
|
|
350
|
|
631
|
|
|||||
|
LTIP units vesting upon acquisition of properties
|
—
|
|
854
|
|
814
|
|
|||||
|
Assumption of mortgages payable
|
7,581
|
|
—
|
|
61,628
|
|
|||||
|
Other net liabilities assumed
|
2,167
|
|
3,616
|
|
4,817
|
|
|||||
|
Issuance of OP unit subscription liability through reduced distributions
|
1,236
|
|
1,262
|
|
1,441
|
|
|||||
|
Settlement of acquisition receivables through reduced distributions
|
642
|
|
812
|
|
445
|
|
|||||
|
Increase in OP unit subscription liability through reduced distributions
|
19
|
|
108
|
|
310
|
|
|||||
|
Increase in payables for offering costs
|
626
|
|
600
|
|
593
|
|
|||||
|
Settlement of offering expenses from equity issuance proceeds
|
575
|
|
12,299
|
|
11,673
|
|
|||||
See notes to consolidated financial statements.
F-11
1. ORGANIZATION AND NATURE OF OPERATIONS
National Storage Affiliates Trust was organized in the state of Maryland on May 16, 2013 and is a fully integrated, self-administered and self-managed real estate investment trust focused on the self storage sector. As used herein, "NSA," the "Company," "we," "our," and "us" refers to National Storage Affiliates Trust and its consolidated subsidiaries, except where the context indicates otherwise. The Company has elected and believes that it has qualified to be taxed as a real estate investment trust for U.S. federal income tax purposes ("REIT") commencing with its taxable year ended December 31, 2015.
Through its controlling interest as the sole general partner of NSA OP, LP (its "operating partnership"), a Delaware limited partnership formed on February 13, 2013, the Company is focused on the ownership, operation, and acquisition of self storage properties located within the top 100 MSAs in the United States. Pursuant to the Agreement of Limited Partnership (as amended, the "LP Agreement") of its operating partnership, the Company's operating partnership is authorized to issue preferred units, Class A Units ("OP units"), different series of Class B Units ("subordinated performance units"), and Long-Term Incentive Plan Units ("LTIP units"). The Company also owns certain of its self storage properties through other consolidated limited partnership subsidiaries of its operating partnership, which the Company refers to as "DownREIT partnerships." The DownREIT partnerships issue equity ownership interests that are intended to be economically equivalent to the Company's OP units ("DownREIT OP units") and subordinated performance units ("DownREIT subordinated performance units").
The Company owned
499
self storage properties in
26
states and Puerto Rico with approximately
30.4 million
rentable square feet (unaudited) in approximately
242,000
storage units as of
December 31, 2018
. These properties are managed with local operational focus and expertise by the Company and its participating regional operators ("PROs"). These PROs are SecurCare Self Storage, Inc. and its controlled affiliates ("SecurCare"), Kevin Howard Real Estate Inc., d/b/a Northwest Self Storage and its controlled affiliates ("Northwest"), Optivest Properties LLC and its controlled affiliates ("Optivest"), Guardian Storage Centers LLC and its controlled affiliates ("Guardian"), Move It Self Storage and its controlled affiliates ("Move It"), Arizona Mini Storage Management Company d/b/a Storage Solutions and its controlled affiliates ("Storage Solutions"), Hide-Away Storage Services, Inc. and its controlled affiliates ("Hide-Away") and an affiliate of Shader Brothers Corporation d/b/a Personal Mini Storage ("Personal Mini").
In October 2018, the Company entered into definitive agreements with affiliates of Southern Self Storage, LLC d/b/a Southern Self Storage of Palm Beach Gardens, Florida, to add Southern Self Storage ("Southern") as the Company's ninth PRO. In January 2019, the Company completed the initial contribution transaction with Southern. As discussed in Note 15, in February 2019, the Company entered into definitive agreements with affiliates of Investment Real Estate Management, LLC d/b/a Moove In Self Storage of York, Pennsylvania to add Moove In Self Storage ("Moove In") as the Company's tenth PRO.
As of
December 31, 2018
, the Company also managed through its property management platform an additional portfolio of
176
properties owned by the Company's unconsolidated real estate ventures. These properties contain approximately
12.6 million
rentable square feet, configured in approximately
103,000
storage units and located across
22
states. The Company owns a
25%
equity interest in each of its unconsolidated real estate ventures.
As of
December 31, 2018
, in total, the Company operated and held ownership interests in
675
self storage properties located across
34
states and Puerto Rico with approximately
43.0 million
rentable square feet in approximately
345,000
storage units.
2. SUMMARY OF SIGNIFICANT ACCOUNTING POLICIES
Basis of Presentation
The accompanying consolidated financial statements are presented on the accrual basis of accounting in accordance with U.S. generally accepted accounting principles ("GAAP").
F-12
Principles of Consolidation
The Company's consolidated financial statements include the accounts of its operating partnership and its controlled subsidiaries. All significant intercompany balances and transactions have been eliminated in the consolidation of entities.
When the Company obtains an economic interest in an entity, the Company evaluates the entity to determine if the entity is deemed a variable interest entity ("VIE"), and if the Company is deemed to be the primary beneficiary, in accordance with authoritative guidance issued on the consolidation of VIEs. When an entity is not deemed to be a VIE, the Company considers the provisions of additional guidance to determine whether the general partner controls a limited partnership or similar entity when the limited partners have certain rights. The Company consolidates all entities that are VIEs and of which the Company is deemed to be the primary beneficiary. The Company has determined that its operating partnership is a VIE. The sole significant asset of National Storage Affiliates Trust is its investment in its operating partnership, and consequently, substantially all of the Company's assets and liabilities represent those assets and liabilities of its operating partnership.
As of
December 31, 2018
, the Company's operating partnership was the primary beneficiary of, and therefore consolidated,
21
DownREIT partnerships that are considered VIEs, which owned
34
self storage properties. The net book value of the real estate owned by these VIEs was
$240.4 million
and
$248.0 million
as of
December 31, 2018
and
December 31, 2017
, respectively. For certain DownREIT partnerships which are subject to fixed rate mortgages payable, the carrying value of such fixed rate mortgages payable held by these VIEs was
$138.4 million
and
$140.3 million
as of
December 31, 2018
and
December 31, 2017
, respectively. The creditors of the consolidated VIEs do not have recourse to the Company's general credit.
Noncontrolling Interests
All of the limited partner equity interests ("OP equity") in its operating partnership not held by the Company are reflected as noncontrolling interests. Noncontrolling interests also include ownership interests in DownREIT partnerships held by entities other than the Company's operating partnership. In the consolidated statements of operations, the Company allocates net income (loss) attributable to noncontrolling interests to arrive at net income (loss) attributable to National Storage Affiliates Trust.
For transactions that result in changes to the Company's ownership interest in its operating partnership, the carrying amount of noncontrolling interests is adjusted to reflect such changes. The difference between the fair value of the consideration received or paid and the amount by which the noncontrolling interests is adjusted is reflected as an adjustment to additional paid-in capital on the consolidated balance sheets.
Self Storage Properties
Self storage properties are carried at historical cost less accumulated depreciation and any impairment losses. Major replacements and betterments, which improve or extend the life of an asset, are capitalized. Expenditures for ordinary repairs and maintenance are expensed as incurred and are included in property operating expenses. Estimated depreciable lives of self storage properties are determined by considering the age and other indicators about the condition of the assets at the respective dates of acquisition, resulting in a range of estimated useful lives for assets within each category. All self storage property assets are depreciated using the straight-line method. Buildings and improvements are depreciated over estimated useful lives primarily between
seven
and
40 years
; furniture and equipment are depreciated over estimated useful lives primarily between
three
and
10 years
.
When a self storage property is acquired, the purchase price of the acquired self storage property is allocated to land, buildings and improvements, furniture and equipment, customer in-place leases, assumed real estate leasehold interests, other assets acquired and liabilities assumed, based on the estimated fair value of each component. When a portfolio of self storage properties is acquired, the purchase price is allocated to the individual self storage properties based on the fair value determined using an income approach with appropriate risk-adjusted capitalization rates, which take into account the relative size, age and location of the individual self storage properties.
Cash and Cash Equivalents
The Company considers all highly-liquid investments purchased with original maturities of three months or less to be cash equivalents. From time to time, the Company maintains cash balances in financial institutions in excess of federally insured limits. The Company has never experienced a loss that resulted from exceeding federally insured limits.
F-13
Restricted Cash
The Company's restricted cash consists of escrowed funds deposited with financial institutions for real estate taxes, insurance and other reserves for capital improvements in accordance with the Company's loan agreements.
Customer In-place Leases
In allocating the purchase price for a self storage property acquisition, the Company determines whether the acquisition includes intangible assets. The Company allocates a portion of the purchase price to an intangible asset attributed to the value of customer in-place leases. This intangible asset is amortized to expense using the straight-line method over
12 months
, the estimated average rental period for the leases. Substantially all of the leases in place at acquired properties are at market rates, as the leases are month-to-month contracts.
Impairment of Long-Lived Assets
The Company evaluates long-lived assets for impairment when events and circumstances indicate that there may be impairment. When events or changes in circumstances indicate that the Company's long-lived assets may not be recoverable, the carrying value of these long-lived assets is compared to the undiscounted future net operating cash flows, plus a terminal value attributable to the assets. If an asset's carrying value is not considered recoverable, an impairment loss is recorded to the extent the net carrying value of the asset exceeds the fair value. For the periods presented,
no
assets were determined to be impaired under this policy.
Costs of Raising Capital
Commissions, legal fees and other costs that are directly associated with equity offerings are capitalized as deferred offering costs, pending a determination of the success of the offering. Deferred offering costs related to successful offerings are charged to additional paid-in capital within equity in the period it is determined that the offering was successful.
Debt issuance costs are amortized over the estimated life of the related debt using the straight-line method, which approximates the effective interest rate method. Amortization of debt issuance costs is included in interest expense in the accompanying statements of operations.
Revenue Recognition
Rental revenue
Rental revenue consists of space rentals and related fees. Management has determined that all of the Company's leases are operating leases. Substantially all leases may be terminated on a month-to-month basis and rental income is recognized ratably over the lease term using the straight-line method. Rents received in advance are deferred and recognized on a straight-line basis over the related lease term associated with the prepayment. Promotional discounts and other incentives are recognized as a reduction to rental income over the applicable lease term.
Other property-related revenue
Other property-related revenue consists of ancillary revenues such as tenant insurance and/or tenant warranty protection-related access fees and sales of storage supplies which are recognized in the period earned.
The Company and certain of the Company’s PROs have tenant insurance- and/or tenant warranty protection plan-related arrangements with insurance companies and the Company’s tenants. During the years ended
December 31, 2018
,
2017
and
2016
, the Company recognized
$7.5 million
,
$6.0 million
and
$4.2 million
, respectively, of tenant insurance and tenant warranty protection plan revenues.
The Company sells boxes, packing supplies, locks and other retail merchandise at its properties. During the years ended
December 31, 2018
,
2017
and
2016
, the Company recognized retail sales of
$1.5 million
,
$1.3 million
and
$1.0 million
, respectively.
Management fees and other revenue
Management fees and other revenue consist of property management fees, platform fees, call center fees, acquisition fees, and a portion of tenant warranty protection or tenant insurance proceeds that the Company earns for managing and operating its unconsolidated real estate ventures.
With respect to both the 2018 Joint Venture and the 2016 Joint Venture, the Company provides supervisory and administrative property management services, centralized call center services, and technology platform and revenue
F-14
management services to the properties in the unconsolidated real estate ventures. The property management fees are equal to
6%
of monthly gross revenues and net sales revenues from the assets of the unconsolidated real estate ventures, and the platform fees are equal to
$1,250
per month per unconsolidated real estate venture property. With respect to the 2016 Joint Venture only, the call center fees are equal to
1%
of each of monthly gross revenues and net sales revenues from the 2016 Joint Venture properties. During the years ended
December 31, 2018
,
2017
and
2016
, the Company recognized property management fees, call center fees and platform fees of
$7.8 million
,
$4.8 million
and
$1.1 million
, respectively.
For acquisition fees, the Company provides sourcing, underwriting and administration services to the unconsolidated real estate ventures. The 2016 Joint Venture paid the Company a
$4.1 million
acquisition fee equal to
0.65%
of the gross capitalization (including debt and equity) of the original
66
-property 2016 Joint Venture portfolio (the "Initial 2016 JV Portfolio") in 2016, at the time of the Initial 2016 JV Portfolio acquisition. The 2018 Joint Venture paid the Company a
$4.0 million
acquisition fee related to the initial acquisition of properties by the 2018 Joint Venture (the "Initial 2018 JV Portfolio") during the year ended December 31, 2018, at the time of the Initial 2018 JV Portfolio acquisition. These fees are refundable to the unconsolidated real estate ventures, on a prorated basis, if the Company is removed as the managing member during the initial
four
year life of the unconsolidated real estate ventures and as such, the Company's performance obligation for these acquisition fees are satisfied over a
four
year period. As of
December 31, 2018
and
2017
, the Company had deferred revenue related to the acquisition fees of
$4.6 million
and
$2.8 million
, respectively.
The Company also earns acquisition fees for properties acquired by the unconsolidated real estate ventures subsequent to the Initial 2016 JV Portfolio and the Initial 2018 JV Portfolio. These fees are based on a percentage of the gross capitalization of the acquired assets determined by the members of the 2016 Joint Venture and the 2018 Joint Venture, and are generally earned when the unconsolidated real estate ventures obtain title and control of an acquired property. During the years ended
December 31, 2018
,
2017
and
2016
, the Company recognized acquisition fees of
$1.6 million
,
$1.5 million
and
$0.3 million
, respectively.
An affiliate of the Company facilitates tenant warranty protection or tenant insurance programs for tenants of the properties in the unconsolidated real estate ventures in exchange for
50%
of all proceeds from such programs at each unconsolidated real estate venture property. During the years ended
December 31, 2018
,
2017
and
2016
, the Company recognized
$2.4 million
,
$1.9 million
and
$0.5 million
, respectively, of revenue related to these activities.
Advertising Costs
The Company incurs advertising costs primarily attributable to internet, directory and other advertising. Advertising costs are included in property operating expenses in the accompanying statements of operations. These costs are expensed in the period in which the cost is incurred. The Company incurred advertising costs of
$4.1 million
,
$3.7 million
and
$3.1 million
for the years ended
December 31, 2018
,
2017
and
2016
, respectively.
Acquisition Costs
The Company incurs title, legal and consulting fees, and other costs associated with the completion of acquisitions. During the year ended December 31, 2017, the Company adopted Accounting Standards Update ("ASU") 2017-01 and as a result, the Company's self storage property acquisitions during the years ended
December 31, 2018
and
2017
were accounted for as asset acquisitions, and accordingly, acquisition costs directly related to the self storage property acquisitions were capitalized as part of the basis of the acquired properties. Indirect acquisition costs remain included in acquisition costs in the accompanying statements of operations in the period in which they were incurred. Prior to the Company's adoption of ASU 2017-01, direct and indirect costs were included in acquisition costs in the accompanying statements of operations in the period in which they were incurred.
Income Taxes
Through December 31, 2014, the Company did not have a profit and loss sharing interest in its operating partnership and did not have any other operations that were subject to taxation. Accordingly, the Company did not generate a federal income tax benefit or expense for the period from its inception through December 31, 2014.
The Company has elected and believes it has qualified to be taxed as a REIT under sections 856 through 860 of the U.S. Internal Revenue Code (the "Code") commencing with the taxable year ended December 31, 2015. To qualify as a REIT, among other things, the Company is required to distribute at least 90% of its REIT taxable income to its shareholders and meet certain tests regarding the nature of its income and assets. As a REIT, the Company is not subject to federal income tax on the earnings distributed currently to its shareholders that it derives from its REIT qualifying
F-15
activities. If the Company fails to qualify as a REIT in any taxable year, and is unable to avail itself of certain provisions set forth in the Code, all of the Company's taxable income would be subject to federal and state income taxes at regular corporate rates.
The Company will not be required to make distributions with respect to income derived from the activities conducted through subsidiaries that the Company elects to treat as taxable REIT subsidiaries ("TRS") for federal income tax purposes. Certain activities that the Company undertakes must be conducted by a TRS, such as performing non-customary services for its customers, facilitating sales by PROs of tenant insurance and holding assets that the Company is not permitted to hold directly. A TRS is subject to federal and state income taxes.
On June 25, 2014, the Company formed NSA TRS, LLC ("NSA TRS"), a Delaware limited liability company. The Company has elected to treat NSA TRS as a TRS, and consequently, NSA TRS is subject to U.S. federal and state corporate income taxes. Deferred tax assets and liabilities are recognized to the extent of any differences between the financial reporting and tax bases of assets and liabilities.
No
material deferred tax assets and liabilities were recorded as of December 31,
2018
and
2017
.
The Company did not have any unrecognized tax benefits related to uncertain tax positions as of December 31,
2018
and
2017
. Future amounts of accrued interest and penalties, if any, related to uncertain tax positions will be recorded as a component of income tax expense. The Company does not expect that the amount of unrecognized tax benefits will change significantly in the next 12 months.
The Company's material taxing jurisdiction is the U.S. federal jurisdiction; the 2015 tax year is the earliest period that remains open to examination by these taxing jurisdictions.
Earnings per Share
Basic earnings per share is calculated based on the weighted average number of the Company's common shares of beneficial interest,
$0.01
par value per share ("common shares"), outstanding during the period. Diluted earnings per share is calculated by further adjusting for the dilutive impact using the treasury stock method for any share options and unvested share equivalents outstanding during the period and the if-converted method for any convertible securities outstanding during the period.
As more fully described below under "
–Allocation of Net Income (Loss)"
, the Company allocates GAAP income (loss) utilizing the hypothetical liquidation at book value ("HLBV") method, which could result in net income (or net loss) attributable to National Storage Affiliates Trust during a period when the Company reports consolidated net loss (or net income), or net income (or net loss) attributable to National Storage Affiliates Trust in excess of the Company's consolidated net income (or net loss). The computations of basic and diluted earnings (loss) per share may be materially affected by these disproportionate income (loss) allocations, resulting in volatile fluctuations of basic and diluted earnings (loss) per share.
Equity-Based Awards
The measurement and recognition of compensation cost for all equity-based awards granted to officers, employees and consultants is based on estimated fair values. Compensation cost is recognized on a straight-line basis over the requisite service periods of each award with non-graded vesting. For awards granted which contain a graded vesting schedule and the only condition for vesting is a service condition, compensation cost is recognized as an expense on a straight-line basis over the requisite service period as if the award was, in substance, a single award. For awards granted for which vesting is subject to a performance condition, compensation cost is recognized over the requisite service period if and when the Company concludes it is probable that the performance condition will be achieved.
The estimated fair value of all equity-based awards issued to PROs and their affiliates in connection with self storage property acquisitions is included in the cost of the respective acquisitions. The estimated fair value of such awards is measured at the date the self storage properties are acquired, as this date represents satisfaction of the performance condition and coincides with the award vesting.
F-16
Derivative Financial Instruments
The Company carries all derivative financial instruments on the balance sheet at fair value. Fair value of derivatives is determined by reference to observable prices that are based on inputs not quoted on active markets, but corroborated by market data. The accounting for changes in the fair value of a derivative instrument depends on whether the derivative has been designated and qualifies as part of a hedging relationship. The Company's use of derivative instruments has been limited to interest rate swap and cap agreements. The fair values of derivative instruments are included in other assets and accounts payable and accrued liabilities in the accompanying balance sheets. For derivative instruments not designated as cash flow hedges, the unrealized gains and losses are included in interest expense in the accompanying statements of operations. For derivatives designated as cash flow hedges, the effective portion of the changes in the fair value of the derivatives is initially reported in accumulated other comprehensive income (loss) in the Company's balance sheets and subsequently reclassified into earnings when the hedged transaction affects earnings.
The valuation of interest rate swap and cap agreements is determined using widely accepted valuation techniques including discounted cash flow analysis on the expected cash flows of each derivative. This analysis reflects the contractual terms of derivatives, including the period to maturity, and uses observable market-based inputs, including interest rate curves. The fair values of interest rate swaps are determined using the market standard methodology of netting the discounted future fixed cash payments and the discounted expected variable cash receipts. The variable cash receipts are based on an expectation of future interest rates (forward curves) derived from observable market interest rate forward curves. The Company may enter into derivative contracts that are intended to economically hedge certain of its risk, even though hedge accounting does not apply or the Company elects not to apply hedge accounting.
Fair Value Measurements
When measuring fair value of financial instruments that are required to be recorded or disclosed at fair value, the Company uses a three-tier measurement hierarchy which prioritizes the inputs used to calculate fair value. These tiers include Level 1, defined as observable inputs such as quoted prices in active markets; Level 2, defined as inputs other than quoted prices in active markets that are either directly or indirectly observable; and Level 3, defined as unobservable inputs in which little or no market data exists, therefore requiring an entity to develop its own assumptions.
Investments in Unconsolidated Real Estate Ventures
The Company’s investments in its unconsolidated real estate ventures are recorded under the equity method of accounting in the accompanying consolidated financial statements. Under the equity method, the Company’s investments in unconsolidated real estate ventures are stated at cost and adjusted for the Company’s share of net earnings or losses and reduced by distributions. Equity in earnings (losses) is recognized based on the Company’s ownership interest in the earnings (losses) of the unconsolidated real estate ventures. The Company follows the "nature of the distribution approach" for classification of distributions from its unconsolidated real estate ventures in its consolidated statements of cash flows. Under this approach, distributions are reported on the basis of the nature of the activity or activities that generated the distributions as either a return on investment, which are classified as operating cash flows, or a return of investment (e.g., proceeds from the unconsolidated real estate ventures' sale of assets) which are reported as investing cash flows.
Segment Reporting
The Company manages its business as
one
reportable segment consisting of investments in self storage properties located in the United States. Although the Company operates in several markets, these operations have been aggregated into one reportable segment based on the similar economic characteristics among all markets.
Reclassifications
Certain amounts in the consolidated financial statements and related notes have been reclassified to conform to the current year presentation. Such reclassifications do not impact the Company's previously reported financial position or net income (loss).
F-17
Allocation of Net Income (Loss)
The distribution rights and priorities set forth in the operating partnership's LP Agreement differ from what is reflected by the underlying percentage ownership interests of the unitholders. Accordingly, the Company allocates GAAP income (loss) utilizing the hypothetical liquidation at book value ("HLBV") method, in which the Company allocates income or loss based on the change in each unitholders’ claim on the net assets of its operating partnership at period end after adjusting for any distributions or contributions made during such period. The HLBV method is commonly applied to equity investments where cash distribution percentages vary at different points in time and are not directly linked to an equity holder’s ownership percentage.
The HLBV method is a balance sheet-focused approach to income (loss) allocation. A calculation is prepared at each balance sheet date to determine the amount that unitholders would receive if the operating partnership were to liquidate all of its assets (at GAAP net book value) and distribute the resulting proceeds to its creditors and unitholders based on the contractually defined liquidation priorities. The difference between the calculated liquidation distribution amounts at the beginning and the end of the reporting period, after adjusting for capital contributions and distributions, is used to derive each unitholder's share of the income (loss) for the period. Due to the stated liquidation priorities and because the HLBV method incorporates non-cash items such as depreciation expense, in any given period, income or loss may be allocated disproportionately to unitholders as compared to their respective ownership percentage in the operating partnership, and net income (loss) attributable to National Storage Affiliates Trust could be more or less net income than actual cash distributions received and more or less income or loss than what may be received in the event of an actual liquidation. Additionally, the HLBV method could result in net income (or net loss) attributable to National Storage Affiliates Trust during a period when the Company reports consolidated net loss (or net income), or net income (or net loss) attributable to National Storage Affiliates Trust in excess of the Company's consolidated net income (or net loss). The computations of basic and diluted earnings (loss) per share may be materially affected by these disproportionate income (loss) allocations, resulting in volatile fluctuations of basic and diluted earnings (loss) per share.
Other Comprehensive Income (Loss)
The Company has cash flow hedge derivative instruments that are measured at fair value with unrealized gains or losses recognized in other comprehensive income (loss) with a corresponding adjustment to accumulated other comprehensive income (loss) within equity, as discussed further in Note 13. Under the HLBV method of allocating income (loss) discussed above, a calculation is prepared at each balance sheet date by applying the HLBV method including, and excluding, the assets and liabilities resulting from the Company's cash flow hedge derivative instruments to determine comprehensive income (loss) attributable to National Storage Affiliates Trust. As a result of the distribution rights and priorities set forth in the operating partnership's LP Agreement, in any given period, other comprehensive income (loss) may be allocated disproportionately to unitholders as compared to their respective ownership percentage in the operating partnership and as compared to their respective allocation of net income (loss).
Assets Held For Sale
The Company classifies properties as held for sale when certain criteria are met. At such time, the properties, including significant assets and liabilities that are expected to be transferred as part of a sale transaction, are presented separately on the consolidated balance sheet at the lower of carrying value or estimated fair value less costs to sell and depreciation is no longer recognized. As of December 31,
2017
, the Company had
one
self storage property classified as held for sale. The results of operations for the self storage properties classified as held for sale are reflected within income from operations in the Company's consolidated statements of operations.
Goodwill
Goodwill represents the costs of business acquisitions in excess of the fair value of identifiable net assets acquired. The Company evaluates goodwill for potential impairment annually, or whenever impairment indicators are present. The Company determined that there was
no
impairment to goodwill during the years ended
December 31, 2018
and
2017
.
Use of Estimates
The preparation of financial statements in conformity with GAAP requires management to make estimates and assumptions that affect the reported amounts of assets and liabilities and disclosure of contingent assets and liabilities at the date of the financial statements and the reported amounts of revenues and expenses during the reporting period. Actual results could differ from those estimates.
F-18
Recent Accounting Pronouncements
In May 2014, the Financial Accounting Standards Board ("FASB") issued ASU 2014-09, Revenue from Contracts with Customers, which requires an entity to recognize the amount of revenue to which it expects to be entitled for the transfer of promised goods or services to customers. The Company adopted ASU 2014-09 effective January 1, 2018, and concluded that its adoption of ASU 2014-09 had no material effect on its consolidated financial statements as most of the Company's revenue is derived from lease contracts, which are excluded from the scope of the new guidance. For the Company’s other property-related revenue and management fees and other revenue subject to the new guidance, the Company performed an evaluation which included identifying its performance obligations and when such performance obligations are satisfied. Based on this evaluation, the Company determined that there was no material change in the timing or pattern of recognition of revenue for these activities as compared to the application of previous revenue recognition guidance.
In February 2016, the FASB issued ASU 2016-02, Leases, which amends the existing guidance for accounting for leases, including requiring lessors to account for leases using an approach that is substantially equivalent to existing guidance for sales-type leases, direct financing leases and operating leases and lessees to recognize most leases on-balance sheet as lease liabilities with corresponding right-of-use assets. ASU 2016-02 initially required a modified retrospective approach, with entities applying the new guidance at the beginning of the earliest period presented in the financial statements in which they first apply the new standard, with certain elective transition relief. In July 2018, the FASB issued ASU 2018-11, Leases - Targeted Improvements, which allows entities the option to apply the new standard at adoption date with a cumulative-effect adjustment in the period of adoption.
The Company adopted ASU 2016-02 and ASU 2018-11 effective January 1, 2019. The Company elected the package of practical expedients which permits the Company to not reassess (i) whether any expired or existing contracts are or contain leases, (ii) the lease classification for any expired or existing leases, and (iii) any initial direct costs for any existing leases as of the effective date. As a lessor, the Company's recognition of rental revenue remained consistent with previous guidance, and the adoption of the lease standard did not change the Company's consolidated statements of operations and did not result in a cumulative catch-up adjustment to opening equity. Adoption of the lease standard will have a material impact on the Company's consolidated balance sheets for its non-cancelable leasehold interest agreements in which it is the lessee. As a lessee, the Company expects to record lease liabilities of approximately $24 million with corresponding right-of-use assets of approximately $23 million. See Note 12 for additional detail about the Company's non-cancelable leasehold interest agreements.
3. SHAREHOLDERS' EQUITY AND NONCONTROLLING INTERESTS
Shareholders' Equity
Common Share Offerings
On July 13, 2018, the Company closed a follow-on offering of
5,900,000
of its common shares at an offering price of
$29.86
per share. The Company received aggregate net proceeds from the offering of approximately
$175.6
million after deducting expenses associated with the offering.
On December 11, 2017, the Company closed a follow-on public offering of
5,750,000
of its common shares, which included
750,000
common shares sold upon the exercise in full by the underwriters of their option to purchase additional common shares, at a public offering price of $
25.50
per share. The Company received aggregate net proceeds from the offering of approximately
$140.3 million
after deducting the underwriting discount and additional expenses associated with the offering.
On July 6, 2016, the Company closed a follow-on public offering of
12,046,250
of its common shares, which included
1,571,250
common shares sold upon the exercise in full by the underwriters of their option to purchase additional common shares, at a public offering price of
$20.75
per share. The Company received aggregate net proceeds from the offering of approximately
$237.5 million
after deducting the underwriting discount and additional expenses associated with the offering.
On December 16, 2016, the Company closed a follow-on offering of
5,175,000
of its common shares, which included
675,000
common shares sold upon the exercise in full by the underwriters of their option to purchase additional common shares, at an offering price of
$20.48
per share. The Company received aggregate net proceeds from the offering of approximately
$105.5 million
after deducting the underwriting discount and additional expenses associated with the offering.
F-19
Series A Preferred Share Offering
On October 11, 2017, the Company completed an underwritten public offering of
6,900,000
of its
6.000%
Series A Preferred Shares, which included
900,000
Series A Preferred Shares sold upon the exercise in full by the underwriters of their option to purchase additional Series A Preferred Shares, resulting in net proceeds to the Company of approximately $
166.6 million
, after deducting the underwriting discount and the Company's other offering expenses. Dividends on the Series A Preferred Shares, which are payable quarterly in arrears, are cumulative from the date of original issuance in the amount of
$1.50
per share each year. The Series A Preferred Shares rank senior to the Company's common shares with respect to dividend rights and rights upon our liquidation, dissolution or winding up. Generally, the Series A Preferred Shares become redeemable by the Company beginning in October 2022 for a cash redemption price of $
25.00
per share, plus accrued but unpaid dividends.
Noncontrolling Interests
All of the OP equity in the Company's operating partnership not held by the Company is reflected as noncontrolling interests. Noncontrolling interests also include ownership interests in DownREIT partnerships held by entities other than the Company's operating partnership. NSA is the general partner of its operating partnership and is authorized to cause its operating partnership to issue additional partner interests, including OP units and subordinated performance units, at such prices and on such other terms as it determines in its sole discretion.
As of
December 31, 2018
and
2017
, units reflecting noncontrolling interests consisted of the following:
|
December 31,
|
|||||
|
2018
|
2017
|
||||
|
Series A-1 preferred units
|
343,719
|
|
—
|
|
|
|
OP units
|
28,874,103
|
|
26,719,607
|
|
|
|
Subordinated performance units
|
10,749,475
|
|
11,604,738
|
|
|
|
LTIP units
|
931,671
|
|
771,396
|
|
|
|
DownREIT units
|
|||||
|
DownREIT OP units
|
1,834,786
|
|
1,834,786
|
|
|
|
DownREIT subordinated performance units
|
4,386,999
|
|
4,386,999
|
|
|
|
Total
|
47,120,753
|
|
45,317,526
|
|
|
The
6.000%
Series A-1 Cumulative Redeemable Preferred Units ("Series A-1 preferred units") rank senior to OP units and subordinated performance units in the Company's operating partnership with respect to distributions and liquidation. The Series A-1 preferred units have a stated value of
$25.00
per unit and receive distributions at an annual rate of
6.000%
. These distributions are cumulative. The Series A-1 preferred units are redeemable at the option of the holder after the first anniversary of the date of issuance, which redemption obligations may be satisfied at the Company’s option in cash in an amount equal to the market value of an equivalent number of the Company's
6.000%
Series A Preferred Shares or the issuance of
6.000%
Series A Preferred Shares on a
one
-for-one basis, subject to adjustments. The increase in Series A-1 preferred units outstanding from
December 31, 2017
to
December 31, 2018
was due to the issuance of Series A-1 preferred units in connection with the acquisition of self storage properties.
OP Units and DownREIT OP units
OP units in the Company's operating partnership are redeemable for cash or, at the Company's option, exchangeable for common shares on a
one
-for-one basis, and DownREIT OP units are redeemable for cash or, at the Company's option, exchangeable for OP units in its operating partnership on a
one
-for-one basis, subject to certain adjustments in each case. The holders of OP units are generally not entitled to elect redemption until
one year
after the issuance of the OP units. The holders of DownREIT OP units are generally not entitled to elect redemption until
five years
after the date of the contributor's initial contribution.
The increase in OP Units outstanding from
December 31, 2017
to
December 31, 2018
was due to the issuance of
2,024,170
OP units related to the voluntary conversions of
997,074
subordinated performance units (as discussed further below), the issuance of
584,004
OP units in connection with the acquisition of self storage properties and
9,100
LTIP units which were converted into OP units, partially offset by the redemption of
462,778
OP units for common shares.
F-20
Subordinated Performance Units and DownREIT Subordinated Performance Units
Subordinated performance units may also, under certain circumstances, be convertible into OP units which are exchangeable for common shares as described above, and DownREIT subordinated performance units may, under certain circumstances, be exchangeable for subordinated performance units on a
one
-for-one basis. Subordinated performance units are only convertible into OP units after a
two
year lock-out period and then generally (i) at the holder’s election only upon the achievement of certain performance thresholds relating to the properties to which such subordinated performance units relate or (ii) at the Company's election upon a retirement event of a PRO that holds such subordinated performance units or upon certain qualifying terminations. The holders of DownREIT subordinated performance units are generally not entitled to elect redemption until at least
five years
after the date of the contributor's initial contribution.
The decrease in subordinated performance units outstanding from
December 31, 2017
to
December 31, 2018
was due to the voluntary conversion of
997,074
subordinated performance units into
2,024,170
OP units partially offset by the issuance of
141,811
subordinated performance units for co-investment by certain of the Company's PROs in connection with the acquisition of self storage properties.
LTIP Units
LTIP units are a special class of partnership interest in the Company's operating partnership that allow the holder to participate in the ordinary and liquidating distributions received by holders of the OP units (subject to the achievement of specified levels of profitability by the Company's operating partnership or the achievement of certain events). LTIP units may also, under certain circumstances, be convertible into OP units on a
one
-for-one basis, which are then exchangeable for common shares as described above. LTIP units do not have full parity with OP units with respect to liquidating distributions and may not receive ordinary distributions until such parity is reached pursuant to the terms of the LP Agreement. If such parity is reached under the LP Agreement, upon vesting, vested LTIP units may be converted into an equal number of OP units, and thereafter have all the rights of OP units, including redemption rights. See Note 9 for additional information about the Company's LTIP Units.
The increase in LTIP units outstanding from
December 31, 2017
to
December 31, 2018
was due to the issuance of compensatory LTIP units to employees, trustees and consultants net of forfeitures partially offset by the conversion of
9,100
LTIP units into OP units.
4. SELF STORAGE PROPERTIES
Self storage properties are summarized as follows (dollars in thousands):
|
December 31,
|
|||||||
|
2018
|
2017
|
||||||
|
Land
|
$
|
583,455
|
|
$
|
528,304
|
|
|
|
Buildings and improvements
|
2,048,281
|
|
1,741,459
|
|
|||
|
Furniture and equipment
|
5,987
|
|
5,470
|
|
|||
|
Total self storage properties
|
2,637,723
|
|
2,275,233
|
|
|||
|
Less accumulated depreciation
|
(246,261
|
)
|
(170,358
|
)
|
|||
|
Self storage properties, net
|
$
|
2,391,462
|
|
$
|
2,104,875
|
|
|
Depreciation expense related to self storage properties amounted to
$76.3 million
,
$60.5 million
and
$42.7 million
for the years ended
December 31, 2018
,
2017
and
2016
, respectively.
5. INVESTMENT IN UNCONSOLIDATED REAL ESTATE VENTURES
2018 Joint Venture
During the year ended December 31, 2018, a wholly owned subsidiary of the Company (the "NSA Member") entered into a limited liability company agreement (the "JV Agreement") of NSA HHF JV, LLC (the "2018 Joint Venture") with an affiliate of Heitman America Real Estate REIT LLC (the "JV Investor" and, together with the NSA Member, the "Members") and the 2018 Joint Venture acquired from Simply Self Storage, which is a portfolio company of a private real estate fund managed by Brookfield Asset Management,
two
REITs that own a portfolio of self storage properties (the "Portfolio") for an aggregate purchase price of approximately
$1.325 billion
in cash consisting of
112
F-21
self storage properties containing approximately
8.2 million
rentable square feet, configured in over
68,000
storage units and located across
17
states and Puerto Rico.
In September 2018, the 2018 Joint Venture completed its acquisition of the Portfolio. Immediately following the acquisition, the 2018 Joint Venture distributed the
six
self storage properties in the Portfolio located in Puerto Rico and a single self storage property in the Portfolio located in Ohio to the Company in exchange for a
$64.2 million
cash contribution from the Company. The
103
properties from the Portfolio that remain in the 2018 Joint Venture post-closing (
two
of the properties acquired in the Portfolio were combined with other properties in the Portfolio for operational efficiency) contain approximately
7.6 million
rentable square feet configured in approximately
63,000
storage units.
The 2018 Joint Venture was capitalized with approximately
$639.7 million
in equity (approximately
$159.9 million
from the NSA Member in exchange for a
25%
ownership interest in the 2018 Joint Venture and approximately
$479.8 million
from the JV Investor in exchange for a
75%
ownership interest in the 2018 Joint Venture) and proceeds from a
$643.0 million
interest-only debt financing with an interest rate of
4.34%
per annum and a maturity of
10
years secured by a first mortgage lien on substantially all of the properties currently held by the 2018 Joint Venture.
A subsidiary of the Company is acting as the non-member manager of the 2018 Joint Venture (the "NSA Manager"). The NSA Manager directs, manages and controls the day-to-day operations and affairs of the 2018 Joint Venture but may not cause the 2018 Joint Venture to make certain major decisions involving the business of the 2018 Joint Venture without the consent of both Members, including the approval of annual budgets, sales and acquisitions of properties, financings, and certain actions relating to bankruptcy.
The Company's investment in the 2018 Joint Venture is accounted for using the equity method of accounting and is included in investment in unconsolidated real estate ventures in the Company’s consolidated balance sheets. The Company’s earnings from its investment in the 2018 Joint Venture are presented in equity in earnings (losses) of unconsolidated real estate ventures on the Company’s consolidated statements of operations.
2016 Joint Venture
As of
December 31, 2018
, the Company's unconsolidated real estate venture, formed in September 2016 with a state pension fund advised by Heitman Capital Management LLC (the "2016 Joint Venture"), in which the Company has a 25% ownership interest, owned and operated a portfolio of
73
properties containing approximately
4.9 million
rentable square feet, configured in approximately
40,000
storage units and located across
14
states.
The 2016 Joint Venture acquired
three
self storage properties and an expansion project at an existing property for
$28.5 million
during the
year
ended
December 31, 2018
. The 2016 Joint Venture financed these acquisitions with capital contributions from the 2016 Joint Venture members, of which the Company contributed
$7.3 million
for its
25%
proportionate share. During the
year
ended
December 31, 2018
, the 2016 Joint Venture also sold to an unrelated third party
one
self storage property for a gross sales price of
$9.3 million
.
The following table presents the combined condensed financial position of the Company's unconsolidated real estate ventures as of
December 31, 2018
and
December 31, 2017
(in thousands):
|
December 31, 2018
|
December 31, 2017
|
||||||
|
ASSETS
|
|||||||
|
Self storage properties, net
|
$
|
1,894,412
|
|
$
|
655,973
|
|
|
|
Other assets
|
50,915
|
|
8,397
|
|
|||
|
Total assets
|
$
|
1,945,327
|
|
$
|
664,370
|
|
|
|
LIABILITIES AND EQUITY
|
|||||||
|
Debt financing
|
$
|
956,357
|
|
$
|
317,359
|
|
|
|
Other liabilities
|
16,516
|
|
4,855
|
|
|||
|
Equity
|
972,454
|
|
342,156
|
|
|||
|
Total liabilities and equity
|
$
|
1,945,327
|
|
$
|
664,370
|
|
|
F-22
The following table presents the combined condensed operating information of the Company's unconsolidated real estate ventures for the years ended
December 31, 2018
and
2017
and the period ended December 31,
2016
(in thousands):
|
Year Ended December 31,
|
Period Ended
|
||||||||||
|
2018
|
2017
|
December 31, 2016
|
|||||||||
|
Total revenue
|
$
|
94,507
|
|
$
|
54,747
|
|
$
|
12,197
|
|
||
|
Property operating expenses
|
30,229
|
|
18,463
|
|
3,850
|
|
|||||
|
Net operating income
|
64,278
|
|
36,284
|
|
8,347
|
|
|||||
|
Supervisory, administrative and other expenses
|
(6,397
|
)
|
(3,921
|
)
|
(949
|
)
|
|||||
|
Depreciation and amortization
|
(40,930
|
)
|
(29,192
|
)
|
(6,235
|
)
|
|||||
|
Interest expense
|
(20,718
|
)
|
(11,389
|
)
|
(2,823
|
)
|
|||||
|
Loss on sale of self storage properties
|
(820
|
)
|
—
|
|
—
|
|
|||||
|
Acquisition and other expenses
|
(1,188
|
)
|
(1,146
|
)
|
(4,277
|
)
|
|||||
|
Net loss
|
$
|
(5,775
|
)
|
$
|
(9,364
|
)
|
$
|
(5,937
|
)
|
||
The combined condensed operating information in the table above only includes information for the 2018 Joint Venture following the acquisition of the Portfolio in September 2018.
6. SELF STORAGE PROPERTY ACQUISITIONS AND DISPOSITIONS
Acquisitions
The Company acquired
57
self storage properties and an expansion project adjacent to an existing property with an estimated fair value of
$356.6 million
during the
year
ended
December 31, 2018
and
65
self storage properties with an estimated fair value of
$426.8 million
during the
year
ended
December 31, 2017
. Of these acquisitions, during the
year
ended
December 31, 2018
,
four
self storage properties and the expansion project adjacent to an existing property with an estimated fair value of
$23.1 million
were acquired by the Company from its PROs and during the
year
ended
December 31, 2017
,
10
self storage properties with an estimated fair value of
$73.2 million
were acquired by the Company from its PROs.
The self storage property acquisitions were accounted for as asset acquisitions and accordingly, during the years ended
December 31, 2018
and
2017
,
$1.9 million
and
$3.6 million
, respectively, of transaction costs related to the acquisitions were capitalized as part of the basis of the acquired properties. The Company recognized the estimated fair value of the acquired assets and assumed liabilities on the respective dates of such acquisitions. The Company allocated a portion of the purchase price to identifiable intangible assets consisting of customer in-place leases which were recorded at estimated fair values of
$9.1 million
and
$10.5 million
during the years ended
December 31, 2018
and
2017
, respectively, resulting in a total fair value of
$347.5 million
and
$416.3 million
allocated to real estate during the years ended
December 31, 2018
and
2017
, respectively.
F-23
The following table summarizes, by calendar quarter, the investments in self storage property acquisitions completed by the Company during the
year
s ended
December 31, 2018
and
2017
(dollars in thousands):
|
Acquisitions closed during the Three Months Ended:
|
Summary of Investment
|
|||||||||||||||||||||
|
Number of Properties
|
Cash and Acquisition Costs
|
Value of OP Equity
(1)
|
Liabilities Assumed
|
Total
|
||||||||||||||||||
|
Mortgages
(2)
|
Other
|
|||||||||||||||||||||
|
March 31, 2018
|
25
|
$
|
105,135
|
|
$
|
22,403
|
|
$
|
7,581
|
|
$
|
670
|
|
$
|
135,789
|
|
||||||
|
June 30, 2018
|
12
|
62,470
|
|
—
|
|
—
|
|
467
|
|
62,937
|
|
|||||||||||
|
September 30, 2018
|
13
|
102,012
|
|
3,660
|
|
—
|
|
856
|
|
106,528
|
|
|||||||||||
|
December 31, 2018
|
7
|
49,221
|
|
2,000
|
|
—
|
|
174
|
|
51,395
|
|
|||||||||||
|
Total
|
57
|
$
|
318,838
|
|
$
|
28,063
|
|
$
|
7,581
|
|
$
|
2,167
|
|
$
|
356,649
|
|
||||||
|
March 31, 2017
|
5
|
$
|
26,780
|
|
$
|
4,964
|
|
$
|
—
|
|
$
|
183
|
|
$
|
31,927
|
|
||||||
|
June 30, 2017
|
10
|
60,672
|
|
8,931
|
|
—
|
|
387
|
|
69,990
|
|
|||||||||||
|
September 30, 2017
|
19
|
122,742
|
|
267
|
|
—
|
|
826
|
|
123,835
|
|
|||||||||||
|
December 31, 2017
|
31
|
181,809
|
|
17,019
|
|
—
|
|
2,220
|
|
201,048
|
|
|||||||||||
|
Total
|
65
|
$
|
392,003
|
|
$
|
31,181
|
|
$
|
—
|
|
$
|
3,616
|
|
$
|
426,800
|
|
||||||
|
(1)
|
Value of OP equity represents the fair value of Series A-1 preferred units, OP units, subordinated performance units, and LTIP units.
|
|
(2)
|
Includes fair value of debt adjustment for assumed mortgages of approximately
$0.2 million
during the
year
ended December 31,
2018
.
|
The results of operations for these self storage acquisitions are included in the Company's statements of operations beginning on the respective closing date for each acquisition. The accompanying statements of operations includes aggregate revenue of
$21.9 million
and operating income of
$2.5 million
related to the
57
self storage properties acquired during the
year ended
December 31, 2018
. For the year ended
December 31, 2017
, the accompanying statements of operations includes aggregate revenue of
$15.5 million
and operating income of
$0.5 million
related to the
65
self storage properties acquired during such period.
Dispositions
During the
year
ended
December 31, 2018
, the Company sold to unrelated third parties
two
self storage properties,
one
of which was classified as held for sale as of December 31, 2017. The gross sales price was
$5.5 million
and the Company recognized
$0.4 million
of gains on the sale.
In December
2017
, the Company sold to an unrelated third party
three
self storage properties and excess land parcels adjacent to its self storage properties. The gross sales price was
$17.8 million
and the Company recognized
$5.7 million
of gain on sales.
F-24
7. OTHER ASSETS
Other assets consist of the following (dollars in thousands):
|
December 31,
|
|||||||
|
2018
|
2017
|
||||||
|
Customer in-place leases, net of accumulated amortization of $5,090 and $3,914, respectively
|
$
|
4,063
|
|
$
|
6,590
|
|
|
|
Receivables:
|
|||||||
|
Trade, net
|
3,402
|
|
2,274
|
|
|||
|
PROs and other affiliates
|
2,027
|
|
979
|
|
|||
|
Receivable from unconsolidated real estate venture
|
4,573
|
|
1,200
|
|
|||
|
Property acquisition deposits
|
20,977
|
|
5,050
|
|
|||
|
Interest rate swaps
|
16,164
|
|
12,414
|
|
|||
|
Prepaid expenses and other
|
4,266
|
|
3,949
|
|
|||
|
Corporate furniture, equipment and other, net
|
1,574
|
|
1,444
|
|
|||
|
Trade name
|
3,200
|
|
3,200
|
|
|||
|
Management contract, net of accumulated amortization of $1,564 and $856, respectively
|
9,057
|
|
9,765
|
|
|||
|
Goodwill
|
5,750
|
|
5,750
|
|
|||
|
Total
|
$
|
75,053
|
|
$
|
52,615
|
|
|
Amortization expense related to customer in-place leases amounted to $
11.6 million
, $
13.5 million
and $
12.0 million
for the years ended
December 31, 2018
,
2017
and
2016
, respectively.
The Company measured the fair value of the trade name, which has an indefinite life and is not amortized, using the relief from royalty method at acquisition.
The management contract asset is charged to amortization expense on a straight-line basis over 15 years, which represents the time period over which the majority of value was attributed in the Company’s discounted cash flow model. Amortization expense related to the management contract amounted to
$0.7 million
,
$0.7 million
and
$0.1 million
for the years ended
December 31, 2018
,
2017
and
2016
respectively.
8. DEBT FINANCING
The Company's outstanding debt as of
December 31, 2018
and
2017
is summarized as follows (dollars in thousands):
|
December 31,
|
|||||||||
|
Interest Rate
(1)
|
2018
|
2017
|
|||||||
|
Credit Facility:
|
|||||||||
|
Revolving line of credit
|
3.90%
|
$
|
139,500
|
|
$
|
88,500
|
|
||
|
Term loan A
|
2.91%
|
235,000
|
|
235,000
|
|
||||
|
Term loan B
|
2.94%
|
155,000
|
|
155,000
|
|
||||
|
Term loan C
|
3.71%
|
105,000
|
|
105,000
|
|
||||
|
Term loan D
|
3.79%
|
125,000
|
|
—
|
|
||||
|
2023 Term loan facility
|
3.13%
|
175,000
|
|
100,000
|
|
||||
|
2028 Term loan facility
|
4.62%
|
75,000
|
|
—
|
|
||||
|
Fixed rate mortgages payable
|
4.18%
|
268,138
|
|
271,491
|
|
||||
|
Total principal
|
1,277,638
|
|
954,991
|
|
|||||
|
Unamortized debt issuance costs and debt premium, net
|
464
|
|
3,106
|
|
|||||
|
Total debt
|
$
|
1,278,102
|
|
$
|
958,097
|
|
|||
F-25
|
(1)
|
Represents the effective interest rate as of
December 31, 2018
. Effective interest rate incorporates the stated rate plus the impact of interest rate cash flow hedges and discount and premium amortization, if applicable. For the revolving line of credit, the effective interest rate excludes fees for unused borrowings.
|
Credit Facility
The Company has an unsecured credit facility with a syndicated group of lenders, which, as of
December 31, 2018
, provided for total borrowings of
$1.0 billion
consisting of
five
components: (i) a Revolver which provides for a total borrowing commitment up to
$400.0 million
, whereby the Company may borrow, repay and re-borrow amounts under the Revolver, (ii) a
$235.0 million
Term Loan A, (iii) a
$155.0 million
Term Loan B, (iv) a
$105.0 million
Term Loan C, and (v) a
$125.0 million
Term Loan D.
The Revolver matures in May 2020; provided that the Company may elect to extend the maturity to May 2021 by paying an extension fee of
0.15%
of the total borrowing commitment thereunder at the time of extension and meeting other customary conditions with respect to compliance. The Term Loan A matures in May 2021, the Term Loan B matures in May 2022, the Term Loan C matures in February 2024 and the Term Loan D matures in January 2023. The Revolver, Term Loan A, Term Loan B, Term Loan C and Term Loan D are not subject to any scheduled reduction or amortization payments prior to maturity.
Interest rates applicable to loans under the credit facility are determined based on a 1, 2, 3 or 6 month LIBOR period (as elected by the Company at the beginning of any applicable interest period) plus an applicable margin or a base rate, determined by the greatest of the Key Bank prime rate, the federal funds rate plus
0.50%
or one month LIBOR plus
1.00%
, plus an applicable margin. The applicable margins for the credit facility are leverage based and range from
1.30%
to
2.25%
for LIBOR loans and
0.30%
to
1.25%
for base rate loans; provided that after such time as the Company achieves an investment grade rating from at least
two
rating agencies, the Company may elect (but is not required to elect) that the credit facility is subject to the rating based on applicable margins ranging from
0.85%
to
2.45%
for LIBOR Loans and
0.00%
to
1.45%
for base rate loans. The Company is also required to pay the following usage based fees ranging from
0.15%
to
0.25%
with respect to the unused portion of the Revolver; provided that if the Company makes an investment grade pricing election as described in the preceding sentence, the Company will be required to pay rating based fees ranging from
0.125%
to
0.300%
with respect to the entire Revolver in lieu of any usage based fees. The Company has an expansion option under the credit facility, which if exercised in full, would provide for a total borrowing capacity under the credit facility of
$1.3 billion
.
As of
December 31, 2018
, the Company had outstanding letters of credit totaling
$5.7 million
and would have had the capacity to borrow remaining Revolver commitments of
$254.8 million
while remaining in compliance with the credit facility's financial covenants described in the following paragraph.
The Company is required to comply with the following financial covenants under the credit facility:
•
Maximum total leverage ratio not to exceed
60%
•
Minimum fixed charge coverage ratio of at least
1.5
x
•
Minimum net worth of at least
$682.6 million
plus
75%
of future equity issuances
•
Maximum unsecured debt to unencumbered asset value ratio not to exceed
60%
•
Unencumbered adjusted net operating income to unsecured interest expense of at least
2.0
x
In addition, the terms of the credit facility contain customary affirmative and negative covenants that, among other things, limit the Company's ability to make distributions or certain investments, incur debt, incur liens and enter into certain transactions. At
December 31, 2018
, the Company was in compliance with all such covenants.
2023 Term Loan Facility
On June 30, 2016, the Company entered into a credit agreement with a syndicated group of lenders to make available a term loan facility that matures in June 2023 (the "2023 Term Loan Facility") in an aggregate amount of
$100.0 million
. On June 5, 2018, the Company's operating partnership and the Company entered into the Second Amendment (the "Second Amendment") to the Credit Agreement, whereby the Company's operating partnership, among other things, partially exercised its existing
$100.0 million
expansion option in an aggregate amount equal to
$75.0 million
, increasing the aggregate amount outstanding under the 2023 Term Loan Facility to
$175.0 million
. The Company also increased the remaining expansion option by
$200.0 million
, for a total expansion option of
$225.0 million
. If the remaining
F-26
expansion option is exercised in full, the total expansion option would provide for a total borrowing capacity under the 2023 Term Loan Facility in an aggregate amount of
$400.0 million
.
The entire outstanding principal amount of, and all accrued but unpaid interest, is due on the maturity date. Interest rates applicable to loans under the 2023 Term Loan Facility are payable during such periods as such loans are LIBOR loans, at the applicable LIBOR based on a 1, 2, 3 or 6 month LIBOR period (as elected by the Company at the beginning of any applicable interest period) plus an applicable margin, and during the period that such loans are base rate loans, at the base rate under the 2023 Term Loan Facility in effect from time to time plus an applicable margin. The base rate under the 2023 Term Loan Facility is equal to the greatest of the Capital One prime rate, the federal funds rate plus
0.50%
or one month LIBOR plus
1.00%
. The applicable margin for the 2023 Term Loan Facility is leverage-based and ranges from
1.30%
to
1.70%
for LIBOR loans and
0.30%
to
0.70%
for base rate loans; provided that after such time as the Company achieves an investment grade rating from at least two rating agencies, the Company may elect (but is not required to elect) that the 2023 Term Loan Facility is subject to the rating based on applicable margins ranging from
0.90%
to
1.75%
for LIBOR Loans and
0.00%
to
0.75%
for base rate loans.
The Company is required to comply with the same financial covenants under the 2023 Term Loan Facility as it is with the credit facility. In addition, the terms of the 2023 Term Loan Facility contain customary affirmative and negative covenants that, among other things, limit the Company's ability to make distributions or certain investments, incur debt, incur liens and enter into certain transactions.
2028 Term Loan Facility
On December 21, 2018, the Company entered into a credit agreement with Huntington National Bank to make available a term loan facility that matures in December 2028 (the "2028 Term Loan Facility") in an aggregate amount of
$75.0 million
. The entire outstanding principal amount of, and all accrued but unpaid interest, is due on the maturity date. The Company has an expansion option under the 2028 Term Loan Facility, which, if exercised in full, would provide for a total 2028 Term Loan Facility in an aggregate amount of
$125.0 million
.
Interest rates applicable to loans under the 2028 Term Loan Facility are payable during such periods as such loans are LIBOR loans, at the applicable LIBOR based on a 1, 2, 3 or 6 month LIBOR period (as elected by the Company at the beginning of any applicable interest period) plus an applicable margin, and during the period that such loans are base rate loans, at the base rate under the 2028 Term Loan Facility in effect from time to time plus an applicable margin. The base rate under the 2028 Term Loan Facility is equal to the greatest of the Huntington National Bank prime rate, the federal funds rate plus
0.50%
or one month LIBOR plus
1.00%
. The applicable margin for the 2028 Term Loan Facility is leverage-based and ranges from
1.80%
to
2.35%
for LIBOR loans and
0.80%
to
1.35%
for base rate loans; provided that after such time as the Company achieves an investment grade rating from at least two rating agencies, the Company may elect (but is not required to elect) that the 2028 Term Loan Facility is subject to the rating based on applicable margins ranging from
1.40%
to
2.25%
for LIBOR Loans and
0.40%
to
1.25%
for base rate loans.
The Company is required to comply with the same financial covenants under the 2028 Term Loan Facility as it is with the credit facility and the 2023 Term Loan Facility. In addition, the terms of the 2028 Term Loan Facility contain customary affirmative and negative covenants that, among other things, limit the Company's ability to make distributions or certain investments, incur debt, incur liens and enter into certain transactions.
Fixed Rate Mortgages Payable
Fixed rate mortgages have scheduled maturities at various dates through October 2031, and have effective interest rates that range from
3.63%
to
5.00%
. Principal and interest are generally payable monthly or in monthly interest-only payments with balloon payments due at maturity.
The Company assumed fixed rate mortgages of
$7.6 million
in connection with
four
of the properties acquired during the
year
ended
December 31, 2018
.
In August 2017, the Company entered into an agreement with a single lender for an
$84.9 million
debt financing secured by
22
of the Company's self storage properties. This interest-only loan matures in August 2027 and has a fixed interest rate of
4.14%
.
F-27
Future Debt Maturities
Based on existing debt agreements in effect as of
December 31, 2018
, the scheduled principal and maturity payments for the Company's outstanding borrowings are presented in the table below (in thousands):
|
Year Ending December 31,
|
Scheduled Principal and Maturity Payments
|
Premium Amortization and Unamortized Debt Issuance Costs
|
Total
|
|||||||||
|
2019
|
$
|
5,128
|
|
$
|
(361
|
)
|
$
|
4,767
|
|
|||
|
2020
|
178,897
|
|
(699
|
)
|
178,198
|
|
||||||
|
2021
|
242,603
|
|
(779
|
)
|
241,824
|
|
||||||
|
2022
|
159,205
|
|
(441
|
)
|
158,764
|
|
||||||
|
2023
|
377,049
|
|
(42
|
)
|
377,007
|
|
||||||
|
After 2024
|
314,756
|
|
2,786
|
|
317,542
|
|
||||||
|
$
|
1,277,638
|
|
$
|
464
|
|
$
|
1,278,102
|
|
||||
9. EQUITY-BASED AWARDS
The Company grants awards in the form of LTIP units and restricted common shares to provide equity based incentive compensation to members of its senior management team, independent trustees, advisers, consultants, other personnel, and as consideration for self storage property acquisitions.
LTIP units were first granted under the 2013 Long-Term Incentive Plan (the "2013 Plan"), which authorized up to
2.5 million
LTIP units for issuance. In connection with the Company's initial public offering, the Company terminated the 2013 Plan but the awards granted thereunder remained outstanding after its termination. Restricted common shares were first granted under the 2015 National Storage Affiliates Trust Equity Incentive Plan (the "2015 Plan"), which authorizes the Company's compensation, nominating, and corporate governance committee to grant share options, restricted common shares, phantom shares, dividend equivalent rights, LTIP units and other restricted limited partnership units issued by its operating partnership and other equity-based awards up to an aggregate of
5%
of the common shares issued and outstanding from time to time on a fully diluted basis (assuming, if applicable, the exercise of all outstanding options and the conversion of all warrants and convertible securities, including OP units and LTIP units, into common shares).
As of
December 31, 2018
, the Company did not have outstanding under its equity compensation plan, any options, warrants or rights to purchase the Company's common shares.
LTIP Units
Through
December 31, 2018
, an aggregate of
2,474,710
LTIP units have been issued under the 2013 Plan,
565,672
LTIP units have been issued under the 2015 Plan, and
313,759
LTIP units have been issued under the LP Agreement. Some of the granted LTIP units vested immediately or upon completion of the Company's initial public offering. Others vest upon the contribution of self storage properties or along a schedule at certain times through May 15, 2022.
Compensatory Grants
The Company grants two types of compensatory LTIP units, time-based LTIP unit awards that are subject to time-based vesting typically over a period of
one
to
three years
from the grant date, so long as such person remains an employee or trustee, and performance-based LTIP unit awards, which are designed to align the interests of the Company's executive officers with those of the Company's shareholders in a pay-for-performance structure. The performance-based LTIP unit awards vest contingent upon the achievement of performance criteria measured over a period of
three years
from the grant date, which is based on the Company's total shareholder return ("TSR") relative to the TSR of the companies in the Morgan Stanley Capital International US REIT Index and the Company's TSR relative to the TSR of its peers in the self storage industry. The value of the performance-based LTIP unit awards take into consideration the probability that the awards will ultimately vest; therefore previously recorded compensation expense is not adjusted in the event that the performance criteria is not achieved.
Compensation expense related to compensatory LTIP units granted to members of the Company's senior management team, the Company's independent trustees, advisers, consultants and other personnel is included in general
F-28
and administrative expense in the accompanying statements of operations. Total compensation cost recognized for the compensatory LTIP unit awards was
$3.6 million
,
$3.5 million
and
$2.5 million
for the years ended
December 31, 2018
,
2017
and
2016
, respectively. At
December 31, 2018
, total unvested compensation cost not yet recognized was
$3.7 million
. The Company expects to recognize this compensation cost over a period of approximately
3.4 years
.
Time-based LTIP unit awards are granted with a fair value equal to the closing market price of the Company's common shares on the date of grant. The following table summarizes activity for the time-based LTIP unit awards for the years ended
December 31, 2018
,
2017
and
2016
:
|
Time-Based LTIP Unit Awards
|
||||||||||||||||||||
|
2018
|
2017
|
2016
|
||||||||||||||||||
|
Number of LTIP units
|
Weighted Average Grant-Date Fair Value
|
Number of LTIP units
|
Weighted Average Grant-Date Fair Value
|
Number of LTIP units
|
Weighted Average Grant-Date Fair Value
|
|||||||||||||||
|
Outstanding unvested at beginning of year
|
227,766
|
|
$
|
20.37
|
|
294,529
|
|
$
|
14.74
|
|
236,265
|
|
$
|
10.41
|
|
|||||
|
Granted
|
100,176
|
|
27.08
|
|
128,051
|
|
22.89
|
|
177,546
|
|
17.59
|
|
||||||||
|
Vested
|
(104,130
|
)
|
20.18
|
|
(194,814
|
)
|
13.43
|
|
(119,282
|
)
|
10.41
|
|
||||||||
|
Unvested at end of year
|
223,812
|
|
$
|
23.54
|
|
227,766
|
|
$
|
20.37
|
|
294,529
|
|
$
|
14.74
|
|
|||||
The aggregate fair value of the time-based LTIP unit awards that vested during the years ended
December 31, 2018
,
2017
and
2016
was
$2.1 million
,
$2.6 million
and
$1.2 million
, respectively.
The following table summarizes activity for the performance-based LTIP unit awards granted during the year ended
December 31, 2018
and
2017
, including the minimum, target and maximum number of LTIP units that may be earned upon the achievement of the performance criteria measured over the period of three years from the grant date.
|
Performance-Based LTIP Unit Awards
|
||||||||||||
|
Minimum
|
Target
|
Maximum
|
Weighted Average Grant-Date Fair Value
|
|||||||||
|
Outstanding unvested at December 31, 2016
|
—
|
|
—
|
|
—
|
|
$
|
—
|
|
|||
|
Granted
|
—
|
|
40,390
|
|
90,874
|
|
27.63
|
|
||||
|
Outstanding unvested at December 31, 2017
|
—
|
|
40,390
|
|
90,874
|
|
$
|
27.63
|
|
|||
|
Granted
|
—
|
|
46,017
|
|
69,025
|
|
24.67
|
|
||||
|
Outstanding unvested at December 31, 2018
|
—
|
|
86,407
|
|
159,899
|
|
$
|
26.35
|
|
|||
The fair value of the performance-based LTIP unit awards, which have a market condition, is estimated on the date of grant using a Monte Carlo simulation. The simulation requires assumptions for expected volatility, risk-free rate of return, and dividend yield. The following table summarizes the assumptions used to value the performance-based LTIP unit awards granted during the years ended
December 31, 2018
and
2017
:
|
2018
|
2017
|
||||
|
Risk-free interest rate
|
2.04
|
%
|
1.58
|
%
|
|
|
Dividend yield
|
4.11
|
%
|
4.35
|
%
|
|
|
Expected volatility
|
24.44
|
%
|
29.96
|
%
|
|
Acquisition Consideration Grants
On December 31, 2013, the Company granted
1,683,560
LTIP units under the 2013 Plan to PROs as part of the consideration for their respective self storage property acquisitions and contributions. The following table presents the number of units vested and forfeited for acquisition grants during the years ended
December 31, 2018
,
2017
and
2016
:
F-29
|
Total LTIP units
|
||
|
Total unvested units, December 31, 2015
|
423,800
|
|
|
Units vested in 2016 related to properties contributed or sourced by PROs
|
(45,100
|
)
|
|
Units forfeited
|
(118,300
|
)
|
|
Total unvested units, December 31, 2016
|
260,400
|
|
|
Units vested in 2017 related to properties contributed or sourced by PROs
|
(36,400
|
)
|
|
Total unvested units, December 31, 2017
|
224,000
|
|
|
Units vested in 2018 related to properties contributed or sourced by PROs
|
—
|
|
|
Total unvested units, December 31, 2018
|
224,000
|
|
The aggregate fair value of purchase consideration recognized during the years ended December 31,
2017
and
2016
was
$0.9 million
and
$0.8 million
, respectively. As of
December 31, 2018
, the remaining unvested LTIP units will vest as additional self storage properties are contributed or sourced by the PROs. The fair value of such LTIP units will be recorded as additional acquisition consideration based on the fair value in the period such acquisitions are completed.
LP Agreement Grants to Consultants
Pursuant to the LP Agreement, during the years ended
December 31, 2018
,
2017
and
2016
, the Company issued
174
,
776
and
2,758
LTIP units, respectively, that were immediately vested to consultants that provided acquisition services. During the
year
s ended
December 31, 2018
and 2017, the self storage properties acquired were accounted for as asset acquisitions and accordingly, the acquisition costs related to the LTIP units granted to consultants were capitalized as part of the basis of the acquired properties. Prior to January 1, 2017, the Company's self storage property acquisitions were accounted for as business combinations and accordingly, the acquisition costs related to the LTIP units granted to consultants during the year ended December 31, 2016 are included in acquisition costs in the accompanying statements of operations. The aggregate fair value of the LTIP units was less than
$0.1 million
, less than
$0.1 million
and
$0.1 million
for the years ended
December 31, 2018
,
2017
and
2016
, respectively.
Restricted Common Shares
Through
December 31, 2018
, an aggregate of
54,136
restricted common shares have been issued under the 2015 Plan. These restricted common shares vest over a weighted average period of approximately
3.0 years
. Restricted common shares are granted with a fair value equal to the closing market price of the Company's common shares on the date of grant.
The following table summarizes activity for restricted common shares for the years ended
December 31, 2018
,
2017
and
2016
:
|
Year Ended December 31,
|
||||||||||||||||||||
|
2018
|
2017
|
2016
|
||||||||||||||||||
|
Number of Restricted Common Shares
|
Weighted Average Grant-Date Fair Value
|
Number of Restricted Common Shares
|
Weighted Average Grant-Date Fair Value
|
Number of Restricted Common Shares
|
Weighted Average Grant-Date Fair Value
|
|||||||||||||||
|
Outstanding at beginning of year
|
21,585
|
|
$
|
22.43
|
|
13,590
|
|
$
|
12.40
|
|
11,000
|
|
$
|
12.40
|
|
|||||
|
Granted
|
12,311
|
|
27.26
|
|
16,525
|
|
24.04
|
|
8,090
|
|
17.19
|
|
||||||||
|
Vested
|
(8,041
|
)
|
21.88
|
|
(8,530
|
)
|
14.11
|
|
(5,500
|
)
|
12.40
|
|
||||||||
|
Forfeited
|
(3,266
|
)
|
25.35
|
|
—
|
|
—
|
|
—
|
|
—
|
|
||||||||
|
Unvested at end of year
|
22,589
|
|
$
|
24.83
|
|
21,585
|
|
$
|
22.43
|
|
13,590
|
|
$
|
12.40
|
|
|||||
The aggregate fair value of restricted common shares that vested during the years ended
December 31, 2018
,
2017
and
2016
was
$0.2 million
,
$0.1 million
and
$0.1 million
respectively. Total compensation cost recognized for restricted common shares during the years ended
December 31, 2018
,
2017
and
2016
was
$0.3 million
,
$0.2 million
and
$0.1 million
, respectively. At
December 31, 2018
, total unvested compensation cost not yet recognized was
$0.3 million
.
F-30
The Company expects to recognize this compensation cost over a period of approximately
2.0 years
. If the grantee has a termination of service for any reason during the vesting period, the unvested restricted common shares will be forfeited. Compensation expense related to restricted common shares is included in general and administrative expense in the accompanying statements of operations.
10. EARNINGS PER SHARE
The following table sets forth the computation of basic and diluted earnings (loss) per common share for the years ended
December 31, 2018
,
2017
and
2016
(in thousands, except per share amounts):
|
Year Ended December 31,
|
|||||||||||
|
2018
|
2017
|
2016
|
|||||||||
|
Earnings (loss) per common share - basic and diluted
|
|||||||||||
|
Numerator
|
|||||||||||
|
Net income
|
$
|
56,326
|
|
$
|
45,998
|
|
$
|
24,866
|
|
||
|
Net income attributable to noncontrolling interests
|
(42,217
|
)
|
(43,037
|
)
|
(6,901
|
)
|
|||||
|
Net income attributable to National Storage Affiliates Trust
|
14,109
|
|
2,961
|
|
17,965
|
|
|||||
|
Distributions to preferred shareholders
|
(10,350
|
)
|
(2,300
|
)
|
—
|
|
|||||
|
Distributed and undistributed earnings allocated to participating securities
|
(27
|
)
|
(28
|
)
|
(18
|
)
|
|||||
|
Net income attributable to common shareholders - basic
|
3,732
|
|
633
|
|
17,947
|
|
|||||
|
Effect of assumed conversion of dilutive securities
|
—
|
|
—
|
|
6,783
|
|
|||||
|
Net income attributable to common shareholders - diluted
|
$
|
3,732
|
|
$
|
633
|
|
$
|
24,730
|
|
||
|
Denominator
|
|||||||||||
|
Weighted average shares outstanding - basic
|
53,293
|
|
44,423
|
|
29,887
|
|
|||||
|
Effect of dilutive securities:
|
|||||||||||
|
Weighted average OP units outstanding
|
—
|
|
—
|
|
24,262
|
|
|||||
|
Weighted average DownREIT OP unit equivalents outstanding
|
—
|
|
—
|
|
1,835
|
|
|||||
|
Weighted average LTIP units outstanding
|
—
|
|
—
|
|
1,846
|
|
|||||
|
Weighted average subordinated performance units and DownREIT subordinated performance unit equivalents
|
—
|
|
—
|
|
20,917
|
|
|||||
|
Weighted average shares outstanding - diluted
|
53,293
|
|
44,423
|
|
78,747
|
|
|||||
|
Earnings (loss) per share - basic
|
$
|
0.07
|
|
$
|
0.01
|
|
$
|
0.60
|
|
||
|
Earnings (loss) per share - diluted
|
$
|
0.07
|
|
$
|
0.01
|
|
$
|
0.31
|
|
||
|
Dividends declared per common share
|
$
|
1.16
|
|
$
|
1.04
|
|
$
|
0.88
|
|
||
As discussed in Note 2, the Company allocates GAAP income (loss) utilizing the HLBV method, in which the Company allocates income or loss based on the change in each unitholders' claim on the net assets of its operating partnership at period end after adjusting for any distributions or contributions made during such period. Due to the stated liquidation priorities and because the HLBV method incorporates non-cash items such as depreciation expense, in any given period, income or loss may be allocated disproportionately to National Storage Affiliates Trust and noncontrolling interests, resulting in volatile fluctuations of basic and diluted earnings (loss) per share.
Outstanding equity interests of the Company's operating partnership and DownREIT partnerships are considered potential common shares for purposes of calculating diluted earnings (loss) per share as the unitholders may, through the exercise of redemption rights, obtain common shares, subject to various restrictions. Basic earnings per share is calculated based on the weighted average number of common shares outstanding during the period. Diluted earnings per share is calculated by further adjusting for the dilutive impact using the treasury stock method for unvested LTIP units subject to a service condition outstanding during the period and the if-converted method for any convertible securities outstanding during the period.
F-31
Generally, following certain lock-out periods, OP units in the Company's operating partnership are redeemable for cash or, at the Company's option, exchangeable for common shares on a
one
-for-one basis, subject to certain adjustments and DownREIT OP units are redeemable for cash or, at the Company's option, exchangeable for OP units in its operating partnership on a
one
-for-one basis, subject to certain adjustments in each case.
LTIP units may also, under certain circumstances, be convertible into OP units on a
one
-for-one basis, which are then exchangeable for common shares as described above. Vested LTIP units and unvested LTIP units that vest based on a service condition are allocated income or loss in a similar manner as OP units. Unvested LTIP units subject to a service condition are evaluated for dilution using the treasury stock method. For the
year ended
December 31, 2018
,
383,712
unvested LTIP units that vest based on a service condition are excluded from the calculation of diluted earnings (loss) per share as they are not dilutive to earnings (loss) per share. For the
year ended
December 31, 2018
,
224,000
unvested LTIP units that vest upon the future acquisition of properties are excluded from the calculation of diluted earnings (loss) per share because the contingency for the units to vest has not been attained as of the end of the reported periods.
Subordinated performance units may also, under certain circumstances, be convertible into OP units which are exchangeable for common shares as described above, and DownREIT subordinated performance units may, under certain circumstances, be exchangeable for subordinated performance units on a
one
-for-one basis. Subordinated performance units are only convertible into OP units, after a
two
year lock-out period and then generally (i) at the holder’s election only upon the achievement of certain performance thresholds relating to the properties to which such subordinated performance units relate or (ii) at the Company's election upon a retirement event of a PRO that holds such subordinated performance units or upon certain qualifying terminations. Although subordinated performance units may only be convertible after a
two
year lock-out period, the Company assumes a hypothetical conversion of each subordinated performance unit (including each DownREIT subordinated performance unit) into OP units (with subsequently assumed redemption into common shares) for the purposes of calculating diluted weighted average common shares. This hypothetical conversion is calculated using historical financial information, and as a result, is not necessarily indicative of the results of operations, cash flows or financial position of the Company upon expiration of the
two
-year lock out period on conversions.
For the years ended
December 31, 2018
and 2017, potential common shares totaling
50.6 million
and
50.6 million
, respectively, related to OP units, DownREIT OP units, subordinated performance units and DownREIT subordinated performance units have been excluded from the calculation of diluted earnings (loss) per share as they are not dilutive to earnings (loss) per share.
Participating securities, which consist of unvested restricted common shares, receive dividends equal to those received by common shares. The effect of participating securities for the periods presented above is calculated using the two-class method of allocating distributed and undistributed earnings.
11. RELATED PARTY TRANSACTIONS
Supervisory and Administrative Fees
For the self storage properties that are managed by the PROs, the Company has entered into asset management agreements with the PROs to provide leasing, operating, supervisory and administrative services. The asset management agreements generally provide for fees ranging from
5%
to
6%
of gross revenue for the managed self storage properties. During the
year
s ended
December 31, 2018
,
2017
and
2016
, the Company incurred
$16.9 million
,
$14.4 million
and
$11.0 million
, respectively, for supervisory and administrative fees to the PROs. Such fees are included in general and administrative expenses in the accompanying statements of operations.
Payroll Services
For the self storage properties that are managed by the PROs, the employees responsible for operation of the self storage properties are generally employees of the PROs who charge the Company for the costs associated with the respective employees. For the
year
s ended
December 31, 2018
,
2017
and
2016
, the Company incurred
$29.5 million
,
$24.6 million
and
$19.4 million
, respectively, for payroll and related costs reimbursable to these PROs. Such costs are included in property operating expenses in the accompanying statements of operations.
F-32
Due Diligence Costs
During the
year
s ended
December 31, 2018
,
2017
and
2016
, the Company incurred
$0.4 million
,
$0.7 million
and
$1.1 million
, respectively, of expenses payable to certain PROs related to self storage property acquisitions sourced by the PROs. These expenses, which are based on the volume of transactions sourced by the PROs, are intended to reimburse the PROs for due diligence costs incurred in the sourcing and underwriting process. For the years ended
December 31, 2018
and
2017
these due diligence costs are capitalized as part of the basis of the acquired self storage properties and for the year ended
December 31, 2016
, these due diligence costs are included in acquisition costs in the accompanying statements of operations.
Notes Receivable
In connection with the acquisition of
16
self storage properties from PROs during the year ended December 31, 2014, the Company assumed certain mortgages that provided for interest at above-market rates. The sellers of the self storage properties agreed to reimburse the Company for the difference between the fair value and the contractual value of the assumed mortgages which amounted to
$5.2 million
. Due to the structure of the transaction, the amount owed to the Company was considered a receivable for the issuance of equity and was recorded as an offset against equity. During the
year
s ended
December 31, 2018
and
2017
, the Company received above-market interest reimbursements from the sellers totaling
$1.2 million
and
$1.3 million
, respectively.
In addition, in exchange for
$1.2 million
and
$1.3 million
of principal payment reimbursements received related to these assumed mortgages during the
year
s ended
December 31, 2018
and
2017
, the Company issued
44,502
and
47,339
OP units to the sellers during the year ended
December 31, 2018
and
2017
.
Self Storage Property Acquisitions
During the
year
ended
December 31, 2018
, the Company issued
11,490
subordinated performance units to an affiliate of Personal Mini (the Company's chairman and chief executive officer, Arlen D. Nordhagen, has a noncontrolling minority ownership interest in this affiliate of Personal Mini), for
$0.3 million
of co-investment related to the acquisition of a self storage property from an unrelated third party.
During the
year
ended
December 31, 2018
, the Company issued
19,047
OP units and
5,824
subordinated performance units as partial consideration for the acquisition of self storage properties to an affiliate of Northwest and an affiliate of Kevin Howard, a member of the Company's board of trustees.
12. COMMITMENTS AND CONTINGENCIES
Operating Leases
The Company has
six
properties that are subject to non-cancelable leasehold interest agreements that are classified as operating leases. These lease agreements expire between 2034 and 2092, inclusive of extension options that the Company anticipates exercising. To the extent that the leasehold interest agreements provide for fixed increases throughout the term of the lease, the Company recognizes lease expense on a straight-line basis over the expected lease terms. Rent expense under these leasehold interest agreements is included in property operating expenses in the accompanying statements of operations and amounted to
$1.6 million
,
$1.2 million
and
$1.1 million
for the years ended
December 31, 2018
,
2017
and
2016
, respectively.
The Company has entered into non-cancelable operating leases that expire between August 2020 and November 2026 for its corporate office space. Rent expense related to these office leases are included in general and administrative expenses in the accompanying statements of operations and amounted to
$0.2 million
,
$0.2 million
and
$0.1 million
for the years ended
December 31, 2018
,
2017
and
2016
, respectively.
F-33
As of
December 31, 2018
, future minimum cash payments under the Company's operating leases are as follows (in thousands):
|
Year Ending December 31,
|
Real Estate Leasehold Interests
|
Office Leases
|
Total
|
|||||||||
|
2019
|
$
|
1,334
|
|
$
|
345
|
|
$
|
1,679
|
|
|||
|
2020
|
1,379
|
|
398
|
|
1,777
|
|
||||||
|
2021
|
1,404
|
|
387
|
|
1,791
|
|
||||||
|
2022
|
1,419
|
|
381
|
|
1,800
|
|
||||||
|
2023
|
1,424
|
|
346
|
|
1,770
|
|
||||||
|
2024 through 2092
|
36,074
|
|
1,073
|
|
37,147
|
|
||||||
|
$
|
43,034
|
|
$
|
2,930
|
|
$
|
45,964
|
|
||||
Legal Proceedings
The Company is subject to litigation, claims, and assessments that may arise in the ordinary course of its business activities. Such matters include contractual matters, employment related issues, and regulatory proceedings. Although occasional adverse decisions or settlements may occur, the Company believes that the final disposition of such matters will not have a material adverse effect on the Company's financial position, results of operations, or liquidity.
13. FAIR VALUE MEASUREMENTS
Recurring Fair Value Measurements
The Company sometimes limits its exposure to interest rate fluctuations by entering into interest rate swap agreements. The interest rate swap agreements moderate the Company's exposure to interest rate risk by effectively converting the interest on variable rate debt to a fixed rate. The Company measures its interest rate swap derivatives at fair value on a recurring basis. The effective portion of changes in the fair value of derivatives designated and that qualify as cash flow hedges are recorded in accumulated other comprehensive income (loss) and are subsequently reclassified into earnings in the period that the hedged transaction affects earnings. The ineffective portion of the change in fair value of the derivatives is recognized directly into earnings.
Information regarding the Company's interest rate swaps measured at fair value, which are classified within Level 2 of the GAAP fair value hierarchy, is presented below (dollars in thousands):
|
Interest Rate Swaps Designated as Cash Flow Hedges
|
|||
|
Fair value at December 31, 2016
|
$
|
8,159
|
|
|
Cash flow hedge ineffectiveness
|
12
|
|
|
|
Losses on interest rate swaps reclassified into interest expense from accumulated other comprehensive income
|
2,308
|
|
|
|
Unrealized gains included in accumulated other comprehensive income
|
1,935
|
|
|
|
Fair value at December 31, 2017
|
$
|
12,414
|
|
|
Gains on interest rate swaps reclassified into interest expense from accumulated other comprehensive income
|
(1,817
|
)
|
|
|
Unrealized gains included in accumulated other comprehensive income
|
3,598
|
|
|
|
Fair value at December 31, 2018
|
$
|
14,195
|
|
As of
December 31, 2018
and
2017
, the Company had outstanding interest rate swaps designated as cash flow hedges with aggregate notional amounts of
$795.0 million
and
$595.0 million
, respectively. As of
December 31, 2018
, the Company's swaps had a weighted average remaining term of
4.5 years
. The fair value of these swaps are presented within other assets and accounts payable and accrued liabilities in the accompanying balance sheets, and the Company recognizes any changes in the fair value as an adjustment of accumulated other comprehensive income (loss) within equity to the extent of their effectiveness. If the forward rates at
December 31, 2018
remain constant, the Company
F-34
estimates that during the next
12 months
, the Company would reclassify into earnings approximately
$5.4 million
of the unrealized gains included in accumulated other comprehensive income (loss). If market interest rates increase above the
1.87%
weighted average fixed rate under these interest rate swaps the Company will benefit from net cash payments due to it from its counterparty to the interest rate swaps.
There were no transfers between levels during the
year
s ended
December 31, 2018
and
2017
. For financial assets and liabilities that utilize Level 2 inputs, the Company utilizes both direct and indirect observable price quotes, including LIBOR yield curves. The Company uses valuation techniques for Level 2 financial assets and liabilities which include LIBOR yield curves at the reporting date as well as assessing counterparty credit risk. Counterparties to these contracts are highly rated financial institutions. Although the Company has determined that the majority of the inputs used to value its derivatives fall within Level 2 of the fair value hierarchy, the credit valuation adjustments associated with the Company's derivatives utilize Level 3 inputs, such as estimates of current credit spreads, to evaluate the likelihood of default by the Company and the counterparties. As of
December 31, 2018
and
2017
, the Company determined that the effect of credit valuation adjustments on the overall valuation of its derivative positions are not significant to the overall valuation of its derivatives. Therefore, the Company has determined that its derivative valuations are appropriately classified in Level 2 of the fair value hierarchy.
Fair Value Disclosures
The carrying values of cash and cash equivalents, restricted cash, trade receivables, and accounts payable and accrued liabilities reflected in the balance sheets at
December 31, 2018
and
2017
, approximate fair value due to the short term nature of these financial assets and liabilities. The carrying value of variable rate debt financing reflected in the balance sheets at
December 31, 2018
and
2017
approximates fair value as the changes in their associated interest rates reflect the current market and credit risk is similar to when the loans were originally obtained.
The fair values of fixed rate mortgages were estimated using the discounted estimated future cash payments to be made on such debt; the discount rates used approximated current market rates for loans, or groups of loans, with similar maturities and credit quality (categorized within Level 2 of the fair value hierarchy). The combined principal balance of the Company's fixed rate mortgages payable was approximately
$268.1 million
as of
December 31, 2018
with a fair value of approximately
$276.5 million
. In determining the fair value, the Company estimated a weighted average market interest rate of approximately
4.17%
, compared to the weighted average contractual interest rate of
4.85%
. The combined principal balance of the Company's fixed rate mortgages was approximately
$271.5 million
as of
December 31, 2017
with a fair value of approximately
$282.6 million
. In determining the fair value as of
December 31, 2017
, the Company estimated a weighted average market interest rate of approximately
4.04%
, compared to the weighted average contractual interest rate of
4.87%
.
14. UNAUDITED SELECTED QUARTERLY FINANCIAL DATA
The following is a summary of quarterly financial information for the years ended
December 31, 2018
and
2017
(in thousands, except per share data):
|
For the three months ended
|
|||||||||||||||
|
March 31,
|
June 30,
|
September 30,
|
December 31,
|
||||||||||||
|
2018
|
2018
|
2018
|
2018
|
||||||||||||
|
Total revenues
|
$
|
76,493
|
|
$
|
79,723
|
|
$
|
85,382
|
|
$
|
89,298
|
|
|||
|
Total operating expenses
|
54,900
|
|
56,033
|
|
57,869
|
|
60,440
|
|
|||||||
|
Income from operations
|
21,593
|
|
23,690
|
|
27,513
|
|
28,858
|
|
|||||||
|
Gain (loss) on sale of self storage properties
|
474
|
|
(83
|
)
|
—
|
|
—
|
|
|||||||
|
Net income
|
11,973
|
|
13,041
|
|
16,829
|
|
14,483
|
|
|||||||
|
Net income (loss) attributable to common shareholders
|
$
|
7,872
|
|
$
|
3,304
|
|
$
|
1,806
|
|
$
|
(9,223
|
)
|
|||
|
Earnings (loss) per share - basic
|
$
|
0.16
|
|
$
|
0.07
|
|
$
|
0.03
|
|
$
|
(0.16
|
)
|
|||
|
Earnings (loss) per share - diluted
|
$
|
0.09
|
|
$
|
0.07
|
|
$
|
0.03
|
|
$
|
(0.16
|
)
|
|||
F-35
|
For the three months ended
|
|||||||||||||||
|
March 31,
|
June 30,
|
September 30,
|
December 31,
|
||||||||||||
|
2017
|
2017
|
2017
|
2017
|
||||||||||||
|
Total revenues
|
$
|
61,563
|
|
$
|
64,341
|
|
$
|
68,858
|
|
$
|
73,368
|
|
|||
|
Total operating expenses
|
45,613
|
|
45,008
|
|
47,561
|
|
51,448
|
|
|||||||
|
Income from operations
|
15,950
|
|
19,333
|
|
21,297
|
|
21,920
|
|
|||||||
|
Gain (loss) on sale of self storage properties
|
—
|
|
5,637
|
|
106
|
|
(28
|
)
|
|||||||
|
Net income
|
7,181
|
|
15,576
|
|
11,226
|
|
12,015
|
|
|||||||
|
Net income (loss) attributable to common shareholders
|
$
|
555
|
|
$
|
2,367
|
|
$
|
1,271
|
|
$
|
(3,532
|
)
|
|||
|
Earnings (loss) per share - basic
|
$
|
0.01
|
|
$
|
0.05
|
|
$
|
0.03
|
|
$
|
(0.08
|
)
|
|||
|
Earnings (loss) per share - diluted
|
$
|
0.01
|
|
$
|
0.05
|
|
$
|
0.03
|
|
$
|
(0.08
|
)
|
|||
15. SUBSEQUENT EVENTS
Self Storage Property Acquisitions
In January and February 2019, the Company acquired
23
self storage properties for approximately
$147.0 million
. Consideration for these acquisitions included approximately
$122.9 million
of net cash, the assumption of
$0.4 million
of other working capital liabilities and OP equity of approximately
$23.7 million
(consisting of the issuance of
58,942
OP Units,
158,199
Series A-1 preferred units and
692,075
subordinated performance units). In connection with these acquisitions, the Company reimbursed the PROs for
$0.1 million
of due diligence costs related to the self storage properties sourced by the PROs.
New PRO
In February 2019, the Company entered into definitive agreements with affiliates of Investment Real Estate Management, LLC d/b/a Moove In Self Storage of York, Pennsylvania to add Moove In Self Storage ("Moove In") as the Company's
ten
th PRO. Moove In currently owns
19
self storage properties in Pennsylvania, Maryland, New Jersey, and New York. Upon closing, Moove In intends to contribute
six
self storage properties to NSA as part of the initial contribution transaction, and its remaining properties will be added to the Company's captive pipeline. The Company expects the initial contribution transaction and related closing documentation, including the entry into a facilities portfolio management agreement, to close during the first quarter of 2019, subject to customary closing conditions.
Subordinated Performance Unit To OP Unit Conversions
Subordinated performance units are convertible into OP units after a
two
year lock-out period and then generally (i) at the holder’s election only upon the achievement of certain performance thresholds relating to the properties to which such subordinated performance units relate (a "voluntary conversion") or (ii) at the Company's election upon a retirement event of a PRO that holds such subordinated performance units or upon certain qualifying terminations.
Following such lock-out period, a holder of subordinated performance units in the Company's operating partnership may elect a voluntary conversion one time each year prior to December 1st to convert a pre-determined portion of such subordinated performance units into OP units in the Company's operating partnership, with such conversion effective January 1st of the following year with each subordinated performance unit being converted into the number of OP units determined by dividing the average cash available for distribution, or CAD, per unit on the series of specific subordinated performance units over the
one
-year period prior to conversion by
110%
of the CAD per unit on the OP units determined over the same period. CAD per unit on the series of specific subordinated performance units and OP units is determined by the Company based generally upon the application of the provisions of the operating partnership agreement applicable to the distributions of operating cash flow and capital transactions proceeds.
During the year ended
December 31, 2018
, the Company received notices requesting the conversion of
929,057
subordinated performance units (including
15,377
subordinated performance units in the Company's DownREIT partnerships). Effective January 1, 2019, the Company issued
876,623
OP units (including
13,475
OP units in the Company's DownREIT partnerships) in satisfaction of such conversion requests.
F-36
NATIONAL STORAGE AFFILIATES TRUST
SCHEDULE III-REAL ESTATE AND ACCUMULATED DEPRECIATION
December 31, 2018
(dollars in thousands)
|
Location
|
Initial Cost to Company
|
Gross Carrying Amount at Year-End
|
||||||||||||||||||||||||||||||
|
MSA
(1)
|
State/Territory
|
Land
|
Buildings and
Improvements
|
Subsequent
Additions
|
Land
|
Buildings and
Improvements
|
Total
(2)
|
Accumulated
Depreciation
|
Date
Acquired
|
|||||||||||||||||||||||
|
Mobile
|
AL
|
$
|
991
|
|
$
|
4,874
|
|
$
|
730
|
|
$
|
991
|
|
$
|
5,604
|
|
$
|
6,595
|
|
$
|
862
|
|
4/12/2016
|
|||||||||
|
Lake Havasu City-Kingman
|
AZ
|
671
|
|
1,572
|
|
45
|
|
671
|
|
1,617
|
|
2,288
|
|
396
|
|
4/1/2014
|
||||||||||||||||
|
Lake Havasu City-Kingman
|
AZ
|
722
|
|
2,546
|
|
57
|
|
722
|
|
2,603
|
|
3,325
|
|
685
|
|
7/1/2014
|
||||||||||||||||
|
Phoenix-Mesa-Glendale
|
AZ
|
1,089
|
|
6,607
|
|
66
|
|
1,089
|
|
6,673
|
|
7,762
|
|
1,353
|
|
6/30/2014
|
||||||||||||||||
|
Phoenix-Mesa-Glendale
|
AZ
|
3,813
|
|
7,831
|
|
66
|
|
3,813
|
|
7,897
|
|
11,710
|
|
1,207
|
|
9/30/2014
|
||||||||||||||||
|
Phoenix-Mesa-Glendale
|
AZ
|
1,375
|
|
2,613
|
|
79
|
|
1,375
|
|
2,692
|
|
4,067
|
|
728
|
|
9/30/2014
|
||||||||||||||||
|
Phoenix-Mesa-Glendale
|
AZ
|
1,653
|
|
7,531
|
|
39
|
|
1,653
|
|
7,570
|
|
9,223
|
|
999
|
|
10/1/2014
|
||||||||||||||||
|
Phoenix-Mesa-Glendale
|
AZ
|
1,661
|
|
3,311
|
|
69
|
|
1,661
|
|
3,380
|
|
5,041
|
|
563
|
|
10/1/2014
|
||||||||||||||||
|
Phoenix-Mesa-Glendale
|
AZ
|
1,050
|
|
5,359
|
|
44
|
|
1,050
|
|
5,403
|
|
6,453
|
|
552
|
|
1/1/2015
|
||||||||||||||||
|
Phoenix-Mesa-Glendale
|
AZ
|
1,198
|
|
1,921
|
|
35
|
|
1,198
|
|
1,956
|
|
3,154
|
|
335
|
|
5/1/2015
|
||||||||||||||||
|
Phoenix-Mesa-Glendale
|
AZ
|
1,324
|
|
3,626
|
|
38
|
|
1,324
|
|
3,664
|
|
4,988
|
|
520
|
|
5/1/2015
|
||||||||||||||||
|
Phoenix-Mesa-Glendale
|
AZ
|
3,816
|
|
4,348
|
|
13
|
|
3,816
|
|
4,361
|
|
8,177
|
|
598
|
|
5/1/2015
|
||||||||||||||||
|
Phoenix-Mesa-Scottsdale
|
AZ
|
5,576
|
|
6,746
|
|
253
|
|
5,576
|
|
6,999
|
|
12,575
|
|
960
|
|
5/19/2016
|
||||||||||||||||
|
Phoenix-Mesa-Scottsdale
|
AZ
|
1,506
|
|
2,881
|
|
163
|
|
1,609
|
|
3,044
|
|
4,653
|
|
297
|
|
7/29/2016
|
||||||||||||||||
|
Phoenix-Mesa-Scottsdale
|
AZ
|
2,120
|
|
5,442
|
|
17
|
|
2,120
|
|
5,459
|
|
7,579
|
|
348
|
|
2/13/2017
|
||||||||||||||||
|
Phoenix-Mesa-Scottsdale
|
AZ
|
1,809
|
|
4,787
|
|
13
|
|
1,809
|
|
4,800
|
|
6,609
|
|
193
|
|
1/4/2018
|
||||||||||||||||
|
Phoenix-Mesa-Scottsdale
|
AZ
|
840
|
|
5,274
|
|
12
|
|
840
|
|
5,286
|
|
6,126
|
|
206
|
|
1/4/2018
|
||||||||||||||||
|
Phoenix-Mesa-Scottsdale
|
AZ
|
2,111
|
|
7,963
|
|
22
|
|
2,111
|
|
7,985
|
|
10,096
|
|
285
|
|
1/4/2018
|
||||||||||||||||
|
Phoenix-Mesa-Scottsdale
|
AZ
|
748
|
|
4,027
|
|
194
|
|
748
|
|
4,221
|
|
4,969
|
|
176
|
|
1/11/2018
|
||||||||||||||||
|
Phoenix-Mesa-Scottsdale
|
AZ
|
676
|
|
4,098
|
|
51
|
|
676
|
|
4,149
|
|
4,825
|
|
152
|
|
1/11/2018
|
||||||||||||||||
|
Phoenix-Mesa-Scottsdale
|
AZ
|
1,011
|
|
3,453
|
|
51
|
|
1,011
|
|
3,504
|
|
4,515
|
|
127
|
|
1/11/2018
|
||||||||||||||||
|
Phoenix-Mesa-Scottsdale
|
AZ
|
1,125
|
|
3,554
|
|
63
|
|
1,125
|
|
3,617
|
|
4,742
|
|
152
|
|
1/11/2018
|
||||||||||||||||
|
Phoenix-Mesa-Scottsdale
|
AZ
|
949
|
|
7,351
|
|
40
|
|
949
|
|
7,391
|
|
8,340
|
|
229
|
|
1/11/2018
|
||||||||||||||||
|
Phoenix-Mesa-Scottsdale
|
AZ
|
1,419
|
|
5,504
|
|
51
|
|
1,419
|
|
5,555
|
|
6,974
|
|
204
|
|
1/11/2018
|
||||||||||||||||
|
Phoenix-Mesa-Scottsdale
|
AZ
|
1,117
|
|
5,918
|
|
208
|
|
1,117
|
|
6,126
|
|
7,243
|
|
172
|
|
2/1/2018
|
||||||||||||||||
|
Tucson
|
AZ
|
421
|
|
3,855
|
|
91
|
|
421
|
|
3,946
|
|
4,367
|
|
596
|
|
8/29/2013
|
||||||||||||||||
|
Tucson
|
AZ
|
716
|
|
1,365
|
|
15
|
|
716
|
|
1,380
|
|
2,096
|
|
392
|
|
8/29/2013
|
||||||||||||||||
|
Tucson
|
AZ
|
358
|
|
2,047
|
|
70
|
|
358
|
|
2,117
|
|
2,475
|
|
108
|
|
1/4/2018
|
||||||||||||||||
|
Tucson
|
AZ
|
439
|
|
2,501
|
|
35
|
|
439
|
|
2,536
|
|
2,975
|
|
104
|
|
1/4/2018
|
||||||||||||||||
|
Tucson
|
AZ
|
606
|
|
2,580
|
|
273
|
|
606
|
|
2,853
|
|
3,459
|
|
120
|
|
1/4/2018
|
||||||||||||||||
|
Anaheim-Santa Ana-Irvine
|
CA
|
1,530
|
|
5,799
|
|
301
|
|
1,530
|
|
6,100
|
|
7,630
|
|
429
|
|
8/1/2016
|
||||||||||||||||
|
Bakersfield
|
CA
|
511
|
|
2,804
|
|
205
|
|
511
|
|
3,009
|
|
3,520
|
|
316
|
|
8/1/2016
|
||||||||||||||||
|
Bakersfield
|
CA
|
1,409
|
|
3,907
|
|
194
|
|
1,228
|
|
4,101
|
|
5,329
|
|
388
|
|
8/1/2016
|
||||||||||||||||
F-37
|
Location
|
Initial Cost to Company
|
Gross Carrying Amount at Year-End
|
||||||||||||||||||||||||||||||
|
MSA
(1)
|
State/Territory
|
Land
|
Buildings and
Improvements
|
Subsequent
Additions
|
Land
|
Buildings and
Improvements
|
Total
(2)
|
Accumulated
Depreciation
|
Date
Acquired
|
|||||||||||||||||||||||
|
Bakersfield
|
CA
|
1,882
|
|
3,858
|
|
111
|
|
1,882
|
|
3,969
|
|
5,851
|
|
446
|
|
8/1/2016
|
||||||||||||||||
|
Bakersfield
|
CA
|
1,355
|
|
4,678
|
|
231
|
|
1,355
|
|
4,909
|
|
6,264
|
|
498
|
|
8/1/2016
|
||||||||||||||||
|
Bakersfield
|
CA
|
1,306
|
|
3,440
|
|
132
|
|
1,306
|
|
3,572
|
|
4,878
|
|
488
|
|
8/1/2016
|
||||||||||||||||
|
Bakersfield
|
CA
|
1,016
|
|
3,638
|
|
102
|
|
1,016
|
|
3,740
|
|
4,756
|
|
342
|
|
8/1/2016
|
||||||||||||||||
|
Bakersfield
|
CA
|
1,579
|
|
3,357
|
|
116
|
|
1,579
|
|
3,473
|
|
5,052
|
|
398
|
|
8/1/2016
|
||||||||||||||||
|
Bakersfield
|
CA
|
750
|
|
5,802
|
|
124
|
|
750
|
|
5,926
|
|
6,676
|
|
570
|
|
8/1/2016
|
||||||||||||||||
|
Fresno
|
CA
|
840
|
|
7,502
|
|
433
|
|
840
|
|
7,935
|
|
8,775
|
|
1,039
|
|
8/1/2016
|
||||||||||||||||
|
Los Angeles-Long Beach-Glendale
|
CA
|
2,345
|
|
6,820
|
|
641
|
|
2,345
|
|
7,461
|
|
9,806
|
|
533
|
|
8/1/2016
|
||||||||||||||||
|
Los Angeles-Long Beach-Glendale
|
CA
|
1,350
|
|
11,266
|
|
159
|
|
1,350
|
|
11,425
|
|
12,775
|
|
920
|
|
8/1/2016
|
||||||||||||||||
|
Los Angeles-Long Beach-Glendale
|
CA
|
763
|
|
6,258
|
|
175
|
|
763
|
|
6,433
|
|
7,196
|
|
520
|
|
8/1/2016
|
||||||||||||||||
|
Los Angeles-Long Beach-Santa Ana
|
CA
|
6,641
|
|
8,239
|
|
48
|
|
6,641
|
|
8,287
|
|
14,928
|
|
1,235
|
|
4/1/2014
|
||||||||||||||||
|
Los Angeles-Long Beach-Santa Ana
|
CA
|
1,122
|
|
1,881
|
|
9
|
|
1,122
|
|
1,890
|
|
3,012
|
|
381
|
|
6/30/2014
|
||||||||||||||||
|
Los Angeles-Long Beach-Santa Ana(3)
|
CA
|
7,186
|
|
12,771
|
|
75
|
|
7,186
|
|
12,846
|
|
20,032
|
|
2,241
|
|
9/17/2014
|
||||||||||||||||
|
Los Angeles-Long Beach-Santa Ana(3)(4)
|
CA
|
—
|
|
7,106
|
|
37
|
|
—
|
|
7,143
|
|
7,143
|
|
1,201
|
|
9/17/2014
|
||||||||||||||||
|
Los Angeles-Long Beach-Santa Ana(3)
|
CA
|
2,366
|
|
4,892
|
|
104
|
|
2,366
|
|
4,996
|
|
7,362
|
|
900
|
|
9/17/2014
|
||||||||||||||||
|
Los Angeles-Long Beach-Santa Ana(3)
|
CA
|
2,871
|
|
3,703
|
|
47
|
|
2,871
|
|
3,750
|
|
6,621
|
|
577
|
|
10/7/2014
|
||||||||||||||||
|
Los Angeles-Long Beach-Santa Ana(3)
|
CA
|
5,448
|
|
10,015
|
|
220
|
|
5,448
|
|
10,235
|
|
15,683
|
|
1,853
|
|
10/7/2014
|
||||||||||||||||
|
Los Angeles-Long Beach-Santa Ana(4)
|
CA
|
—
|
|
13,150
|
|
16
|
|
—
|
|
13,166
|
|
13,166
|
|
1,768
|
|
1/1/2015
|
||||||||||||||||
|
Los Angeles-Long Beach-Santa Ana(4)
|
CA
|
—
|
|
10,084
|
|
100
|
|
—
|
|
10,184
|
|
10,184
|
|
363
|
|
10/3/2017
|
||||||||||||||||
|
Modesto
|
CA
|
1,526
|
|
12,032
|
|
50
|
|
1,526
|
|
12,082
|
|
13,608
|
|
1,023
|
|
11/10/2016
|
||||||||||||||||
|
Modesto
|
CA
|
773
|
|
5,655
|
|
6
|
|
773
|
|
5,661
|
|
6,434
|
|
401
|
|
11/10/2016
|
||||||||||||||||
|
Riverside-San Bernardino-Ontario
|
CA
|
1,842
|
|
3,420
|
|
31
|
|
1,842
|
|
3,451
|
|
5,293
|
|
478
|
|
1/1/2015
|
||||||||||||||||
|
Riverside-San Bernardino-Ontario
|
CA
|
1,981
|
|
3,323
|
|
63
|
|
1,981
|
|
3,386
|
|
5,367
|
|
582
|
|
1/1/2015
|
||||||||||||||||
|
Riverside-San Bernardino-Ontario(3)
|
CA
|
3,418
|
|
9,907
|
|
141
|
|
3,418
|
|
10,048
|
|
13,466
|
|
1,214
|
|
8/5/2015
|
||||||||||||||||
|
Riverside-San Bernardino-Ontario(3)
|
CA
|
1,913
|
|
6,072
|
|
71
|
|
1,913
|
|
6,143
|
|
8,056
|
|
884
|
|
8/5/2015
|
||||||||||||||||
|
Riverside-San Bernardino-Ontario(3)
|
CA
|
772
|
|
4,044
|
|
74
|
|
772
|
|
4,118
|
|
4,890
|
|
705
|
|
8/5/2015
|
||||||||||||||||
|
Riverside-San Bernardino-Ontario(3)
|
CA
|
597
|
|
5,464
|
|
65
|
|
597
|
|
5,529
|
|
6,126
|
|
690
|
|
8/5/2015
|
||||||||||||||||
|
Riverside-San Bernardino-Ontario(3)
|
CA
|
3,022
|
|
8,124
|
|
79
|
|
3,022
|
|
8,203
|
|
11,225
|
|
1,166
|
|
8/5/2015
|
||||||||||||||||
|
Riverside-San Bernardino-Ontario(3)
|
CA
|
2,897
|
|
5,725
|
|
654
|
|
2,467
|
|
6,379
|
|
8,846
|
|
1,118
|
|
8/5/2015
|
||||||||||||||||
|
Riverside-San Bernardino-Ontario(3)
|
CA
|
2,835
|
|
5,589
|
|
831
|
|
2,164
|
|
6,420
|
|
8,584
|
|
1,017
|
|
8/5/2015
|
||||||||||||||||
|
Riverside-San Bernardino-Ontario(3)
|
CA
|
2,484
|
|
5,903
|
|
78
|
|
2,484
|
|
5,981
|
|
8,465
|
|
674
|
|
8/5/2015
|
||||||||||||||||
|
Riverside-San Bernardino-Ontario(3)
|
CA
|
1,139
|
|
5,054
|
|
8
|
|
1,139
|
|
5,062
|
|
6,201
|
|
669
|
|
10/1/2015
|
||||||||||||||||
|
Riverside-San Bernardino-Ontario(3)
|
CA
|
1,401
|
|
4,577
|
|
7
|
|
1,401
|
|
4,584
|
|
5,985
|
|
470
|
|
10/1/2015
|
||||||||||||||||
|
Riverside-San Bernardino-Ontario(3)
|
CA
|
925
|
|
3,459
|
|
40
|
|
925
|
|
3,499
|
|
4,424
|
|
474
|
|
10/1/2015
|
||||||||||||||||
F-38
|
Location
|
Initial Cost to Company
|
Gross Carrying Amount at Year-End
|
||||||||||||||||||||||||||||||
|
MSA
(1)
|
State/Territory
|
Land
|
Buildings and
Improvements
|
Subsequent
Additions
|
Land
|
Buildings and
Improvements
|
Total
(2)
|
Accumulated
Depreciation
|
Date
Acquired
|
|||||||||||||||||||||||
|
Riverside-San Bernardino-Ontario(3)
|
CA
|
1,174
|
|
2,556
|
|
88
|
|
1,174
|
|
2,644
|
|
3,818
|
|
422
|
|
10/1/2015
|
||||||||||||||||
|
Riverside-San Bernardino-Ontario(3)
|
CA
|
1,506
|
|
2,913
|
|
38
|
|
1,506
|
|
2,951
|
|
4,457
|
|
374
|
|
10/1/2015
|
||||||||||||||||
|
Riverside-San Bernardino-Ontario(3)
|
CA
|
631
|
|
2,307
|
|
53
|
|
631
|
|
2,360
|
|
2,991
|
|
406
|
|
10/1/2015
|
||||||||||||||||
|
Riverside-San Bernardino-Ontario(3)
|
CA
|
1,318
|
|
2,394
|
|
43
|
|
1,318
|
|
2,437
|
|
3,755
|
|
398
|
|
10/1/2015
|
||||||||||||||||
|
Riverside-San Bernardino-Ontario(3)
|
CA
|
1,942
|
|
2,647
|
|
30
|
|
1,942
|
|
2,677
|
|
4,619
|
|
516
|
|
10/1/2015
|
||||||||||||||||
|
Riverside-San Bernardino-Ontario(3)
|
CA
|
1,339
|
|
2,830
|
|
30
|
|
1,339
|
|
2,860
|
|
4,199
|
|
425
|
|
10/1/2015
|
||||||||||||||||
|
Riverside-San Bernardino-Ontario(3)
|
CA
|
1,105
|
|
2,672
|
|
35
|
|
1,105
|
|
2,707
|
|
3,812
|
|
483
|
|
10/1/2015
|
||||||||||||||||
|
Riverside-San Bernardino-Ontario(3)
|
CA
|
1,542
|
|
2,127
|
|
15
|
|
1,542
|
|
2,142
|
|
3,684
|
|
382
|
|
10/1/2015
|
||||||||||||||||
|
Riverside-San Bernardino-Ontario(3)
|
CA
|
1,478
|
|
4,534
|
|
14
|
|
1,478
|
|
4,548
|
|
6,026
|
|
479
|
|
10/1/2015
|
||||||||||||||||
|
Riverside-San Bernardino-Ontario
|
CA
|
3,245
|
|
4,420
|
|
1,424
|
|
3,245
|
|
5,844
|
|
9,089
|
|
878
|
|
5/16/2016
|
||||||||||||||||
|
Riverside-San Bernardino-Ontario
|
CA
|
670
|
|
8,613
|
|
436
|
|
670
|
|
9,049
|
|
9,719
|
|
739
|
|
8/1/2016
|
||||||||||||||||
|
Riverside-San Bernardino-Ontario
|
CA
|
538
|
|
3,921
|
|
379
|
|
538
|
|
4,300
|
|
4,838
|
|
369
|
|
8/1/2016
|
||||||||||||||||
|
Riverside-San Bernardino-Ontario
|
CA
|
382
|
|
3,442
|
|
336
|
|
382
|
|
3,778
|
|
4,160
|
|
328
|
|
8/1/2016
|
||||||||||||||||
|
Riverside-San Bernardino-Ontario
|
CA
|
806
|
|
3,852
|
|
560
|
|
806
|
|
4,412
|
|
5,218
|
|
380
|
|
8/1/2016
|
||||||||||||||||
|
Riverside-San Bernardino-Ontario
|
CA
|
570
|
|
4,238
|
|
343
|
|
570
|
|
4,581
|
|
5,151
|
|
378
|
|
8/1/2016
|
||||||||||||||||
|
Riverside-San Bernardino-Ontario
|
CA
|
345
|
|
3,270
|
|
145
|
|
345
|
|
3,415
|
|
3,760
|
|
321
|
|
8/1/2016
|
||||||||||||||||
|
Riverside-San Bernardino-Ontario
|
CA
|
252
|
|
4,419
|
|
86
|
|
252
|
|
4,505
|
|
4,757
|
|
405
|
|
9/1/2016
|
||||||||||||||||
|
Riverside-San Bernardino-Ontario
|
CA
|
2,691
|
|
3,950
|
|
209
|
|
2,691
|
|
4,159
|
|
6,850
|
|
327
|
|
9/1/2016
|
||||||||||||||||
|
Riverside-San Bernardino-Ontario
|
CA
|
302
|
|
4,169
|
|
107
|
|
302
|
|
4,276
|
|
4,578
|
|
300
|
|
5/8/2017
|
||||||||||||||||
|
Riverside-San Bernardino-Ontario
|
CA
|
896
|
|
6,397
|
|
295
|
|
896
|
|
6,692
|
|
7,588
|
|
450
|
|
5/31/2017
|
||||||||||||||||
|
Riverside-San Bernardino-Ontario(3)
|
CA
|
552
|
|
3,010
|
|
126
|
|
552
|
|
3,136
|
|
3,688
|
|
872
|
|
5/16/2008
|
||||||||||||||||
|
Riverside-San Bernardino-Ontario
|
CA
|
1,342
|
|
4,446
|
|
120
|
|
1,342
|
|
4,566
|
|
5,908
|
|
1,454
|
|
4/1/2013
|
||||||||||||||||
|
Riverside-San Bernardino-Ontario
|
CA
|
1,672
|
|
2,564
|
|
58
|
|
1,672
|
|
2,622
|
|
4,294
|
|
515
|
|
4/1/2014
|
||||||||||||||||
|
Riverside-San Bernardino-Ontario
|
CA
|
978
|
|
1,854
|
|
294
|
|
978
|
|
2,148
|
|
3,126
|
|
561
|
|
5/30/2014
|
||||||||||||||||
|
Riverside-San Bernardino-Ontario
|
CA
|
1,068
|
|
2,609
|
|
118
|
|
1,068
|
|
2,727
|
|
3,795
|
|
625
|
|
5/30/2014
|
||||||||||||||||
|
Riverside-San Bernardino-Ontario
|
CA
|
1,202
|
|
2,032
|
|
54
|
|
1,202
|
|
2,086
|
|
3,288
|
|
429
|
|
6/30/2014
|
||||||||||||||||
|
Riverside-San Bernardino-Ontario
|
CA
|
1,803
|
|
2,758
|
|
40
|
|
1,803
|
|
2,798
|
|
4,601
|
|
756
|
|
6/30/2014
|
||||||||||||||||
|
Riverside-San Bernardino-Ontario
|
CA
|
1,337
|
|
4,489
|
|
55
|
|
1,337
|
|
4,544
|
|
5,881
|
|
821
|
|
6/30/2014
|
||||||||||||||||
|
Riverside-San Bernardino-Ontario
|
CA
|
846
|
|
2,508
|
|
47
|
|
846
|
|
2,555
|
|
3,401
|
|
656
|
|
7/1/2014
|
||||||||||||||||
|
Riverside-San Bernardino-Ontario(3)
|
CA
|
1,026
|
|
4,552
|
|
54
|
|
1,026
|
|
4,606
|
|
5,632
|
|
781
|
|
9/17/2014
|
||||||||||||||||
|
Riverside-San Bernardino-Ontario(3)
|
CA
|
1,878
|
|
5,104
|
|
39
|
|
1,878
|
|
5,143
|
|
7,021
|
|
782
|
|
9/17/2014
|
||||||||||||||||
|
Riverside-San Bernardino-Ontario(3)
|
CA
|
14,109
|
|
23,112
|
|
217
|
|
14,109
|
|
23,329
|
|
37,438
|
|
4,167
|
|
9/17/2014
|
||||||||||||||||
|
Riverside-San Bernardino-Ontario
|
CA
|
3,974
|
|
6,962
|
|
114
|
|
3,974
|
|
7,076
|
|
11,050
|
|
1,509
|
|
10/1/2014
|
||||||||||||||||
|
Riverside-San Bernardino-Ontario
|
CA
|
2,018
|
|
3,478
|
|
693
|
|
2,018
|
|
4,171
|
|
6,189
|
|
1,123
|
|
10/1/2014
|
||||||||||||||||
F-39
|
Location
|
Initial Cost to Company
|
Gross Carrying Amount at Year-End
|
||||||||||||||||||||||||||||||
|
MSA
(1)
|
State/Territory
|
Land
|
Buildings and
Improvements
|
Subsequent
Additions
|
Land
|
Buildings and
Improvements
|
Total
(2)
|
Accumulated
Depreciation
|
Date
Acquired
|
|||||||||||||||||||||||
|
Riverside-San Bernardino-Ontario
|
CA
|
1,644
|
|
2,588
|
|
6
|
|
1,644
|
|
2,594
|
|
4,238
|
|
84
|
|
5/17/2018
|
||||||||||||||||
|
Sacramento-Roseville-Arden-Arcade
|
CA
|
1,195
|
|
8,407
|
|
5
|
|
1,195
|
|
8,412
|
|
9,607
|
|
581
|
|
11/10/2016
|
||||||||||||||||
|
Sacramento-Roseville-Arden-Arcade
|
CA
|
425
|
|
7,249
|
|
19
|
|
425
|
|
7,268
|
|
7,693
|
|
558
|
|
11/10/2016
|
||||||||||||||||
|
Sacramento-Roseville-Arden-Arcade
|
CA
|
1,652
|
|
9,510
|
|
56
|
|
1,652
|
|
9,566
|
|
11,218
|
|
120
|
|
9/26/2018
|
||||||||||||||||
|
San Diego-Carlsbad
|
CA
|
4,318
|
|
19,775
|
|
1,028
|
|
4,323
|
|
20,803
|
|
25,126
|
|
1,462
|
|
8/1/2016
|
||||||||||||||||
|
San Diego-Carlsbad-San Marcos(3)
|
CA
|
3,703
|
|
5,582
|
|
48
|
|
3,703
|
|
5,630
|
|
9,333
|
|
872
|
|
9/17/2014
|
||||||||||||||||
|
San Diego-Carlsbad-San Marcos
|
CA
|
3,544
|
|
4,915
|
|
217
|
|
3,544
|
|
5,132
|
|
8,676
|
|
838
|
|
10/1/2014
|
||||||||||||||||
|
San Diego-Carlsbad-San Marcos(4)
|
CA
|
—
|
|
5,568
|
|
87
|
|
—
|
|
5,655
|
|
5,655
|
|
628
|
|
1/1/2015
|
||||||||||||||||
|
San Diego-Carlsbad-San Marcos(4)
|
CA
|
—
|
|
4,041
|
|
50
|
|
—
|
|
4,091
|
|
4,091
|
|
833
|
|
1/31/2015
|
||||||||||||||||
|
Stockton-Lodi
|
CA
|
559
|
|
5,514
|
|
15
|
|
559
|
|
5,529
|
|
6,088
|
|
397
|
|
11/10/2016
|
||||||||||||||||
|
Stockton-Lodi
|
CA
|
1,710
|
|
8,995
|
|
29
|
|
1,710
|
|
9,024
|
|
10,734
|
|
737
|
|
11/10/2016
|
||||||||||||||||
|
Stockton-Lodi
|
CA
|
1,637
|
|
11,901
|
|
28
|
|
1,637
|
|
11,929
|
|
13,566
|
|
541
|
|
7/31/2017
|
||||||||||||||||
|
Colorado Springs
|
CO
|
455
|
|
1,351
|
|
58
|
|
455
|
|
1,409
|
|
1,864
|
|
421
|
|
8/29/2007
|
||||||||||||||||
|
Colorado Springs
|
CO
|
588
|
|
2,162
|
|
1,119
|
|
588
|
|
3,281
|
|
3,869
|
|
885
|
|
3/26/2008
|
||||||||||||||||
|
Colorado Springs
|
CO
|
632
|
|
3,118
|
|
401
|
|
632
|
|
3,519
|
|
4,151
|
|
1,047
|
|
3/26/2008
|
||||||||||||||||
|
Colorado Springs
|
CO
|
414
|
|
1,535
|
|
334
|
|
414
|
|
1,869
|
|
2,283
|
|
556
|
|
5/1/2008
|
||||||||||||||||
|
Colorado Springs(3)
|
CO
|
300
|
|
1,801
|
|
110
|
|
300
|
|
1,911
|
|
2,211
|
|
468
|
|
6/1/2009
|
||||||||||||||||
|
Colorado Springs
|
CO
|
766
|
|
5,901
|
|
574
|
|
766
|
|
6,475
|
|
7,241
|
|
257
|
|
10/19/2017
|
||||||||||||||||
|
Denver-Aurora-Broomfield
|
CO
|
868
|
|
128
|
|
2,303
|
|
868
|
|
2,431
|
|
3,299
|
|
530
|
|
6/22/2009
|
||||||||||||||||
|
Denver-Aurora-Lakewood
|
CO
|
938
|
|
8,449
|
|
24
|
|
938
|
|
8,473
|
|
9,411
|
|
523
|
|
11/1/2016
|
||||||||||||||||
|
Fort Collins-Loveland
|
CO
|
3,213
|
|
3,087
|
|
213
|
|
3,213
|
|
3,300
|
|
6,513
|
|
947
|
|
8/29/2007
|
||||||||||||||||
|
Fort Collins-Loveland
|
CO
|
2,514
|
|
1,786
|
|
107
|
|
2,514
|
|
1,893
|
|
4,407
|
|
546
|
|
8/29/2007
|
||||||||||||||||
|
Pueblo
|
CO
|
156
|
|
2,797
|
|
6
|
|
156
|
|
2,803
|
|
2,959
|
|
278
|
|
2/17/2016
|
||||||||||||||||
|
Cape Coral-Fort Myers(3)
|
FL
|
4,122
|
|
8,453
|
|
48
|
|
4,122
|
|
8,501
|
|
12,623
|
|
821
|
|
4/1/2016
|
||||||||||||||||
|
Gainesville
|
FL
|
1,072
|
|
4,698
|
|
62
|
|
1,072
|
|
4,760
|
|
5,832
|
|
188
|
|
1/10/2018
|
||||||||||||||||
|
Gainesville
|
FL
|
264
|
|
2,369
|
|
1
|
|
264
|
|
2,370
|
|
2,634
|
|
4
|
|
12/18/2018
|
||||||||||||||||
|
Jacksonville
|
FL
|
2,087
|
|
19,473
|
|
122
|
|
2,087
|
|
19,595
|
|
21,682
|
|
1,222
|
|
11/10/2016
|
||||||||||||||||
|
Jacksonville
|
FL
|
1,629
|
|
4,929
|
|
256
|
|
1,629
|
|
5,185
|
|
6,814
|
|
417
|
|
11/10/2016
|
||||||||||||||||
|
Jacksonville
|
FL
|
527
|
|
2,434
|
|
427
|
|
527
|
|
2,861
|
|
3,388
|
|
156
|
|
12/20/2017
|
||||||||||||||||
|
Lakeland-Winter Haven(3)
|
FL
|
972
|
|
2,159
|
|
140
|
|
972
|
|
2,299
|
|
3,271
|
|
334
|
|
5/4/2015
|
||||||||||||||||
|
Naples-Immokalee-Marco Island(3)
|
FL
|
3,849
|
|
16,688
|
|
83
|
|
3,849
|
|
16,771
|
|
20,620
|
|
1,374
|
|
4/1/2016
|
||||||||||||||||
|
North Port-Sarasota-Bradenton(3)
|
FL
|
2,211
|
|
5,682
|
|
28
|
|
2,211
|
|
5,710
|
|
7,921
|
|
535
|
|
4/1/2016
|
||||||||||||||||
|
North Port-Sarasota-Bradenton(3)
|
FL
|
2,488
|
|
7,282
|
|
131
|
|
2,488
|
|
7,413
|
|
9,901
|
|
657
|
|
4/1/2016
|
||||||||||||||||
|
North Port-Sarasota-Bradenton(3)
|
FL
|
1,767
|
|
5,955
|
|
19
|
|
1,767
|
|
5,974
|
|
7,741
|
|
606
|
|
4/1/2016
|
||||||||||||||||
F-40
|
Location
|
Initial Cost to Company
|
Gross Carrying Amount at Year-End
|
||||||||||||||||||||||||||||||
|
MSA
(1)
|
State/Territory
|
Land
|
Buildings and
Improvements
|
Subsequent
Additions
|
Land
|
Buildings and
Improvements
|
Total
(2)
|
Accumulated
Depreciation
|
Date
Acquired
|
|||||||||||||||||||||||
|
North Port-Sarasota-Bradenton
|
FL
|
2,143
|
|
5,005
|
|
3,487
|
|
3,373
|
|
8,492
|
|
11,865
|
|
860
|
|
10/11/2016
|
||||||||||||||||
|
North Port-Sarasota-Bradenton(3)
|
FL
|
1,924
|
|
4,514
|
|
42
|
|
1,924
|
|
4,556
|
|
6,480
|
|
515
|
|
4/1/2016
|
||||||||||||||||
|
North Port-Sarasota-Bradenton
|
FL
|
1,176
|
|
3,421
|
|
4
|
|
1,176
|
|
3,425
|
|
4,601
|
|
323
|
|
4/1/2016
|
||||||||||||||||
|
North Port-Sarasota-Bradenton(3)
|
FL
|
1,839
|
|
8,377
|
|
20
|
|
1,839
|
|
8,397
|
|
10,236
|
|
672
|
|
4/1/2016
|
||||||||||||||||
|
North Port-Sarasota-Bradenton(3)
|
FL
|
2,507
|
|
7,766
|
|
44
|
|
2,507
|
|
7,810
|
|
10,317
|
|
683
|
|
4/1/2016
|
||||||||||||||||
|
North Port-Sarasota-Bradenton(3)
|
FL
|
1,685
|
|
5,439
|
|
34
|
|
1,685
|
|
5,473
|
|
7,158
|
|
524
|
|
4/1/2016
|
||||||||||||||||
|
North Port-Sarasota-Bradenton(3)
|
FL
|
437
|
|
5,128
|
|
203
|
|
437
|
|
5,331
|
|
5,768
|
|
530
|
|
4/1/2016
|
||||||||||||||||
|
North Port-Sarasota-Bradenton
|
FL
|
1,015
|
|
3,031
|
|
22
|
|
1,015
|
|
3,053
|
|
4,068
|
|
272
|
|
4/1/2016
|
||||||||||||||||
|
North Port-Sarasota-Bradenton
|
FL
|
1,985
|
|
4,299
|
|
891
|
|
1,985
|
|
5,190
|
|
7,175
|
|
357
|
|
1/31/2017
|
||||||||||||||||
|
North Port-Sarasota-Bradenton
|
FL
|
1,336
|
|
4,085
|
|
1
|
|
1,336
|
|
4,086
|
|
5,422
|
|
223
|
|
4/6/2017
|
||||||||||||||||
|
Orlando-Kissimmee-Sanford
|
FL
|
2,426
|
|
9,314
|
|
90
|
|
2,426
|
|
9,404
|
|
11,830
|
|
689
|
|
11/10/2016
|
||||||||||||||||
|
Orlando-Kissimmee-Sanford
|
FL
|
2,166
|
|
4,672
|
|
89
|
|
2,166
|
|
4,761
|
|
6,927
|
|
391
|
|
11/10/2016
|
||||||||||||||||
|
Orlando-Kissimmee-Sanford
|
FL
|
4,583
|
|
8,752
|
|
88
|
|
4,583
|
|
8,840
|
|
13,423
|
|
810
|
|
11/10/2016
|
||||||||||||||||
|
Orlando-Kissimmee-Sanford
|
FL
|
4,181
|
|
4,268
|
|
162
|
|
4,181
|
|
4,430
|
|
8,611
|
|
297
|
|
6/30/2017
|
||||||||||||||||
|
Pensacola-Ferry Pass-Brent
|
FL
|
1,025
|
|
8,157
|
|
114
|
|
1,025
|
|
8,271
|
|
9,296
|
|
327
|
|
10/3/2017
|
||||||||||||||||
|
Pensacola-Ferry Pass-Brent
|
FL
|
841
|
|
5,075
|
|
162
|
|
841
|
|
5,237
|
|
6,078
|
|
184
|
|
2/20/2018
|
||||||||||||||||
|
Pensacola-Ferry Pass-Brent
|
FL
|
644
|
|
4,785
|
|
31
|
|
644
|
|
4,816
|
|
5,460
|
|
8
|
|
12/12/2018
|
||||||||||||||||
|
Punta Gorda(3)
|
FL
|
1,157
|
|
2,079
|
|
85
|
|
1,157
|
|
2,164
|
|
3,321
|
|
173
|
|
4/27/2017
|
||||||||||||||||
|
Tampa-St. Petersburg-Clearwater(3)
|
FL
|
5,436
|
|
10,092
|
|
27
|
|
5,436
|
|
10,119
|
|
15,555
|
|
983
|
|
4/1/2016
|
||||||||||||||||
|
Tampa-St. Petersburg-Clearwater(3)
|
FL
|
361
|
|
1,238
|
|
83
|
|
361
|
|
1,321
|
|
1,682
|
|
257
|
|
5/4/2015
|
||||||||||||||||
|
Tampa-St. Petersburg-Clearwater
|
FL
|
3,581
|
|
2,612
|
|
41
|
|
3,581
|
|
2,653
|
|
6,234
|
|
251
|
|
5/1/2017
|
||||||||||||||||
|
Tampa-St. Petersburg-Clearwater
|
FL
|
4,708
|
|
13,984
|
|
60
|
|
4,708
|
|
14,044
|
|
18,752
|
|
731
|
|
5/24/2017
|
||||||||||||||||
|
Tampa-St. Petersburg-Clearwater
|
FL
|
2,063
|
|
5,351
|
|
—
|
|
2,063
|
|
5,351
|
|
7,414
|
|
68
|
|
8/28/2018
|
||||||||||||||||
|
Atlanta-Sandy Springs-Marietta
|
GA
|
515
|
|
687
|
|
100
|
|
515
|
|
787
|
|
1,302
|
|
254
|
|
8/29/2007
|
||||||||||||||||
|
Atlanta-Sandy Springs-Marietta
|
GA
|
272
|
|
1,357
|
|
358
|
|
272
|
|
1,715
|
|
1,987
|
|
499
|
|
8/29/2007
|
||||||||||||||||
|
Atlanta-Sandy Springs-Marietta
|
GA
|
702
|
|
1,999
|
|
319
|
|
702
|
|
2,318
|
|
3,020
|
|
724
|
|
8/29/2007
|
||||||||||||||||
|
Atlanta-Sandy Springs-Marietta
|
GA
|
1,413
|
|
1,590
|
|
179
|
|
1,413
|
|
1,769
|
|
3,182
|
|
550
|
|
8/29/2007
|
||||||||||||||||
|
Atlanta-Sandy Springs-Marietta
|
GA
|
341
|
|
562
|
|
131
|
|
341
|
|
693
|
|
1,034
|
|
240
|
|
8/29/2007
|
||||||||||||||||
|
Atlanta-Sandy Springs-Marietta
|
GA
|
553
|
|
847
|
|
172
|
|
553
|
|
1,019
|
|
1,572
|
|
345
|
|
8/29/2007
|
||||||||||||||||
|
Atlanta-Sandy Springs-Marietta
|
GA
|
85
|
|
445
|
|
285
|
|
85
|
|
730
|
|
815
|
|
257
|
|
9/28/2007
|
||||||||||||||||
|
Atlanta-Sandy Springs-Marietta(3)
|
GA
|
494
|
|
2,215
|
|
248
|
|
494
|
|
2,463
|
|
2,957
|
|
722
|
|
9/28/2007
|
||||||||||||||||
|
Atlanta-Sandy Springs-Marietta
|
GA
|
1,614
|
|
2,476
|
|
1,719
|
|
1,614
|
|
4,195
|
|
5,809
|
|
382
|
|
7/29/2015
|
||||||||||||||||
|
Atlanta-Sandy Springs-Marietta
|
GA
|
1,595
|
|
2,143
|
|
1,894
|
|
1,595
|
|
4,037
|
|
5,632
|
|
385
|
|
7/29/2015
|
||||||||||||||||
|
Atlanta-Sandy Springs-Marietta
|
GA
|
666
|
|
5,961
|
|
48
|
|
666
|
|
6,009
|
|
6,675
|
|
339
|
|
7/17/2017
|
||||||||||||||||
F-41
|
Location
|
Initial Cost to Company
|
Gross Carrying Amount at Year-End
|
||||||||||||||||||||||||||||||
|
MSA
(1)
|
State/Territory
|
Land
|
Buildings and
Improvements
|
Subsequent
Additions
|
Land
|
Buildings and
Improvements
|
Total
(2)
|
Accumulated
Depreciation
|
Date
Acquired
|
|||||||||||||||||||||||
|
Atlanta-Sandy Springs-Marietta
|
GA
|
1,028
|
|
7,041
|
|
8
|
|
1,028
|
|
7,049
|
|
8,077
|
|
408
|
|
10/19/2017
|
||||||||||||||||
|
Atlanta-Sandy Springs-Marietta
|
GA
|
748
|
|
3,382
|
|
25
|
|
748
|
|
3,407
|
|
4,155
|
|
173
|
|
10/19/2017
|
||||||||||||||||
|
Atlanta-Sandy Springs-Marietta
|
GA
|
703
|
|
4,014
|
|
11
|
|
703
|
|
4,025
|
|
4,728
|
|
202
|
|
10/19/2017
|
||||||||||||||||
|
Atlanta-Sandy Springs-Marietta
|
GA
|
1,873
|
|
9,109
|
|
17
|
|
1,873
|
|
9,126
|
|
10,999
|
|
422
|
|
10/19/2017
|
||||||||||||||||
|
Atlanta-Sandy Springs-Marietta
|
GA
|
547
|
|
4,073
|
|
11
|
|
547
|
|
4,084
|
|
4,631
|
|
200
|
|
10/19/2017
|
||||||||||||||||
|
Atlanta-Sandy Springs-Marietta
|
GA
|
1,499
|
|
5,279
|
|
3
|
|
1,499
|
|
5,282
|
|
6,781
|
|
262
|
|
10/19/2017
|
||||||||||||||||
|
Atlanta-Sandy Springs-Marietta
|
GA
|
763
|
|
5,135
|
|
23
|
|
763
|
|
5,158
|
|
5,921
|
|
211
|
|
10/19/2017
|
||||||||||||||||
|
Atlanta-Sandy Springs-Marietta
|
GA
|
795
|
|
2,941
|
|
12
|
|
795
|
|
2,953
|
|
3,748
|
|
144
|
|
10/19/2017
|
||||||||||||||||
|
Atlanta-Sandy Springs-Marietta
|
GA
|
1,356
|
|
7,516
|
|
16
|
|
1,356
|
|
7,532
|
|
8,888
|
|
356
|
|
10/19/2017
|
||||||||||||||||
|
Atlanta-Sandy Springs-Marietta
|
GA
|
912
|
|
5,074
|
|
18
|
|
912
|
|
5,092
|
|
6,004
|
|
213
|
|
10/19/2017
|
||||||||||||||||
|
Atlanta-Sandy Springs-Marietta
|
GA
|
570
|
|
3,477
|
|
39
|
|
570
|
|
3,516
|
|
4,086
|
|
176
|
|
10/19/2017
|
||||||||||||||||
|
Atlanta-Sandy Springs-Marietta
|
GA
|
1,052
|
|
7,102
|
|
13
|
|
1,052
|
|
7,115
|
|
8,167
|
|
291
|
|
10/19/2017
|
||||||||||||||||
|
Atlanta-Sandy Springs-Marietta
|
GA
|
430
|
|
3,470
|
|
39
|
|
430
|
|
3,509
|
|
3,939
|
|
384
|
|
3/29/2016
|
||||||||||||||||
|
Atlanta-Sandy Springs-Rosewell
|
GA
|
972
|
|
2,342
|
|
56
|
|
972
|
|
2,398
|
|
3,370
|
|
221
|
|
8/17/2016
|
||||||||||||||||
|
Atlanta-Sandy Springs-Rosewell
|
GA
|
919
|
|
3,899
|
|
25
|
|
919
|
|
3,924
|
|
4,843
|
|
95
|
|
5/21/2018
|
||||||||||||||||
|
Augusta
|
GA
|
84
|
|
539
|
|
147
|
|
84
|
|
686
|
|
770
|
|
232
|
|
8/29/2007
|
||||||||||||||||
|
Augusta
|
GA
|
205
|
|
686
|
|
143
|
|
205
|
|
829
|
|
1,034
|
|
265
|
|
8/29/2007
|
||||||||||||||||
|
Columbus(3)
|
GA
|
169
|
|
342
|
|
166
|
|
169
|
|
508
|
|
677
|
|
138
|
|
5/1/2009
|
||||||||||||||||
|
Macon
|
GA
|
180
|
|
840
|
|
41
|
|
180
|
|
881
|
|
1,061
|
|
260
|
|
9/28/2007
|
||||||||||||||||
|
Savannah
|
GA
|
1,741
|
|
1,160
|
|
389
|
|
1,741
|
|
1,549
|
|
3,290
|
|
409
|
|
8/29/2007
|
||||||||||||||||
|
Savannah(3)
|
GA
|
597
|
|
762
|
|
165
|
|
597
|
|
927
|
|
1,524
|
|
294
|
|
9/28/2007
|
||||||||||||||||
|
Savannah
|
GA
|
409
|
|
1,335
|
|
21
|
|
409
|
|
1,356
|
|
1,765
|
|
393
|
|
1/31/2014
|
||||||||||||||||
|
Savannah
|
GA
|
811
|
|
1,181
|
|
143
|
|
811
|
|
1,324
|
|
2,135
|
|
391
|
|
6/25/2014
|
||||||||||||||||
|
St. Louis
|
IL
|
225
|
|
4,394
|
|
123
|
|
225
|
|
4,517
|
|
4,742
|
|
241
|
|
8/28/2017
|
||||||||||||||||
|
St. Louis
|
IL
|
179
|
|
5,154
|
|
294
|
|
179
|
|
5,448
|
|
5,627
|
|
281
|
|
8/28/2017
|
||||||||||||||||
|
St. Louis
|
IL
|
226
|
|
3,088
|
|
204
|
|
226
|
|
3,292
|
|
3,518
|
|
193
|
|
8/28/2017
|
||||||||||||||||
|
St. Louis
|
IL
|
174
|
|
3,338
|
|
215
|
|
174
|
|
3,553
|
|
3,727
|
|
178
|
|
9/25/2017
|
||||||||||||||||
|
Indianapolis-Carmel-Anderson
|
IN
|
855
|
|
7,273
|
|
18
|
|
855
|
|
7,291
|
|
8,146
|
|
740
|
|
2/16/2016
|
||||||||||||||||
|
Indianapolis-Carmel-Anderson
|
IN
|
815
|
|
3,844
|
|
11
|
|
815
|
|
3,855
|
|
4,670
|
|
485
|
|
2/16/2016
|
||||||||||||||||
|
Indianapolis-Carmel-Anderson
|
IN
|
688
|
|
3,845
|
|
16
|
|
688
|
|
3,861
|
|
4,549
|
|
490
|
|
2/16/2016
|
||||||||||||||||
|
Indianapolis-Carmel-Anderson
|
IN
|
626
|
|
4,049
|
|
36
|
|
626
|
|
4,085
|
|
4,711
|
|
455
|
|
2/25/2016
|
||||||||||||||||
|
Indianapolis-Carmel-Anderson
|
IN
|
1,118
|
|
4,444
|
|
278
|
|
1,118
|
|
4,722
|
|
5,840
|
|
668
|
|
2/25/2016
|
||||||||||||||||
|
Indianapolis-Carmel-Anderson
|
IN
|
614
|
|
5,487
|
|
39
|
|
614
|
|
5,526
|
|
6,140
|
|
544
|
|
2/25/2016
|
||||||||||||||||
|
Indianapolis-Carmel-Anderson
|
IN
|
619
|
|
2,140
|
|
18
|
|
619
|
|
2,158
|
|
2,777
|
|
265
|
|
11/10/2016
|
||||||||||||||||
F-42
|
Location
|
Initial Cost to Company
|
Gross Carrying Amount at Year-End
|
||||||||||||||||||||||||||||||
|
MSA
(1)
|
State/Territory
|
Land
|
Buildings and
Improvements
|
Subsequent
Additions
|
Land
|
Buildings and
Improvements
|
Total
(2)
|
Accumulated
Depreciation
|
Date
Acquired
|
|||||||||||||||||||||||
|
Indianapolis-Carmel-Anderson
|
IN
|
689
|
|
6,944
|
|
38
|
|
689
|
|
6,982
|
|
7,671
|
|
516
|
|
11/10/2016
|
||||||||||||||||
|
Indianapolis-Carmel-Anderson
|
IN
|
609
|
|
3,172
|
|
39
|
|
609
|
|
3,211
|
|
3,820
|
|
326
|
|
11/10/2016
|
||||||||||||||||
|
Indianapolis-Carmel-Anderson
|
IN
|
532
|
|
5,441
|
|
21
|
|
532
|
|
5,462
|
|
5,994
|
|
401
|
|
11/10/2016
|
||||||||||||||||
|
Indianapolis-Carmel-Anderson
|
IN
|
433
|
|
5,817
|
|
20
|
|
433
|
|
5,837
|
|
6,270
|
|
409
|
|
11/10/2016
|
||||||||||||||||
|
Indianapolis-Carmel-Anderson
|
IN
|
688
|
|
5,413
|
|
33
|
|
688
|
|
5,446
|
|
6,134
|
|
463
|
|
11/10/2016
|
||||||||||||||||
|
Indianapolis-Carmel-Anderson
|
IN
|
575
|
|
5,168
|
|
65
|
|
575
|
|
5,233
|
|
5,808
|
|
415
|
|
11/10/2016
|
||||||||||||||||
|
Indianapolis-Carmel-Anderson
|
IN
|
522
|
|
5,366
|
|
23
|
|
522
|
|
5,389
|
|
5,911
|
|
404
|
|
11/10/2016
|
||||||||||||||||
|
Indianapolis-Carmel-Anderson
|
IN
|
528
|
|
2,877
|
|
9
|
|
528
|
|
2,886
|
|
3,414
|
|
172
|
|
10/19/2017
|
||||||||||||||||
|
Indianapolis-Carmel-Anderson
|
IN
|
1,257
|
|
6,694
|
|
20
|
|
1,257
|
|
6,714
|
|
7,971
|
|
333
|
|
10/19/2017
|
||||||||||||||||
|
Kansas City
|
KS
|
816
|
|
5,432
|
|
124
|
|
816
|
|
5,556
|
|
6,372
|
|
283
|
|
10/19/2017
|
||||||||||||||||
|
Kansas City
|
KS
|
975
|
|
6,967
|
|
171
|
|
975
|
|
7,138
|
|
8,113
|
|
382
|
|
10/19/2017
|
||||||||||||||||
|
Kansas City
|
KS
|
719
|
|
5,143
|
|
167
|
|
719
|
|
5,310
|
|
6,029
|
|
241
|
|
10/19/2017
|
||||||||||||||||
|
Kansas City(3)
|
KS
|
521
|
|
5,168
|
|
125
|
|
521
|
|
5,293
|
|
5,814
|
|
155
|
|
3/1/2018
|
||||||||||||||||
|
Kansas City
|
KS
|
640
|
|
3,367
|
|
120
|
|
640
|
|
3,487
|
|
4,127
|
|
91
|
|
5/31/2018
|
||||||||||||||||
|
Kansas City
|
KS
|
533
|
|
3,138
|
|
94
|
|
533
|
|
3,232
|
|
3,765
|
|
81
|
|
5/31/2018
|
||||||||||||||||
|
Kansas City
|
KS
|
499
|
|
4,041
|
|
111
|
|
499
|
|
4,152
|
|
4,651
|
|
107
|
|
5/31/2018
|
||||||||||||||||
|
Kansas City
|
KS
|
724
|
|
4,245
|
|
124
|
|
724
|
|
4,369
|
|
5,093
|
|
102
|
|
5/31/2018
|
||||||||||||||||
|
Wichita(3)
|
KS
|
1,156
|
|
5,662
|
|
142
|
|
1,156
|
|
5,804
|
|
6,960
|
|
185
|
|
3/1/2018
|
||||||||||||||||
|
Wichita(3)
|
KS
|
721
|
|
3,395
|
|
116
|
|
721
|
|
3,511
|
|
4,232
|
|
112
|
|
3/1/2018
|
||||||||||||||||
|
Wichita(3)
|
KS
|
443
|
|
3,635
|
|
77
|
|
443
|
|
3,712
|
|
4,155
|
|
111
|
|
3/1/2018
|
||||||||||||||||
|
Wichita
|
KS
|
630
|
|
7,264
|
|
104
|
|
630
|
|
7,368
|
|
7,998
|
|
181
|
|
3/1/2018
|
||||||||||||||||
|
Wichita
|
KS
|
430
|
|
1,740
|
|
63
|
|
430
|
|
1,803
|
|
2,233
|
|
57
|
|
3/1/2018
|
||||||||||||||||
|
Wichita
|
KS
|
655
|
|
1,831
|
|
136
|
|
655
|
|
1,967
|
|
2,622
|
|
53
|
|
5/31/2018
|
||||||||||||||||
|
Wichita
|
KS
|
393
|
|
3,950
|
|
143
|
|
393
|
|
4,093
|
|
4,486
|
|
102
|
|
5/31/2018
|
||||||||||||||||
|
Wichita
|
KS
|
1,353
|
|
2,241
|
|
37
|
|
1,353
|
|
2,278
|
|
3,631
|
|
51
|
|
8/28/2018
|
||||||||||||||||
|
Louisville/Jefferson County
|
KY
|
2,174
|
|
3,667
|
|
39
|
|
2,174
|
|
3,706
|
|
5,880
|
|
512
|
|
5/1/2015
|
||||||||||||||||
|
Baton Rouge
|
LA
|
386
|
|
1,744
|
|
73
|
|
386
|
|
1,817
|
|
2,203
|
|
192
|
|
4/12/2016
|
||||||||||||||||
|
Baton Rouge
|
LA
|
1,098
|
|
5,208
|
|
517
|
|
1,098
|
|
5,725
|
|
6,823
|
|
646
|
|
4/12/2016
|
||||||||||||||||
|
Baton Rouge
|
LA
|
1,203
|
|
3,156
|
|
226
|
|
1,203
|
|
3,382
|
|
4,585
|
|
376
|
|
7/21/2016
|
||||||||||||||||
|
Baton Rouge
|
LA
|
755
|
|
2,702
|
|
272
|
|
755
|
|
2,974
|
|
3,729
|
|
324
|
|
7/21/2016
|
||||||||||||||||
|
New Orleans-Metairie
|
LA
|
1,287
|
|
6,235
|
|
131
|
|
1,287
|
|
6,366
|
|
7,653
|
|
634
|
|
4/12/2016
|
||||||||||||||||
|
Shreveport-Bossier City
|
LA
|
971
|
|
3,474
|
|
54
|
|
1,549
|
|
4,938
|
|
6,487
|
|
548
|
|
5/5/2015
|
||||||||||||||||
|
Shreveport-Bossier City
|
LA
|
964
|
|
3,573
|
|
40
|
|
964
|
|
3,613
|
|
4,577
|
|
600
|
|
5/5/2015
|
||||||||||||||||
|
Shreveport-Bossier City
|
LA
|
772
|
|
2,906
|
|
31
|
|
772
|
|
2,937
|
|
3,709
|
|
484
|
|
5/5/2015
|
||||||||||||||||
F-43
|
Location
|
Initial Cost to Company
|
Gross Carrying Amount at Year-End
|
||||||||||||||||||||||||||||||
|
MSA
(1)
|
State/Territory
|
Land
|
Buildings and
Improvements
|
Subsequent
Additions
|
Land
|
Buildings and
Improvements
|
Total
(2)
|
Accumulated
Depreciation
|
Date
Acquired
|
|||||||||||||||||||||||
|
Shreveport-Bossier City
|
LA
|
479
|
|
1,439
|
|
39
|
|
479
|
|
1,478
|
|
1,957
|
|
256
|
|
5/5/2015
|
||||||||||||||||
|
Shreveport-Bossier City
|
LA
|
475
|
|
854
|
|
45
|
|
475
|
|
899
|
|
1,374
|
|
189
|
|
5/5/2015
|
||||||||||||||||
|
Shreveport-Bossier City
|
LA
|
645
|
|
2,004
|
|
7
|
|
645
|
|
2,011
|
|
2,656
|
|
165
|
|
10/19/2017
|
||||||||||||||||
|
Shreveport-Bossier City
|
LA
|
654
|
|
3,589
|
|
27
|
|
654
|
|
3,616
|
|
4,270
|
|
163
|
|
10/19/2017
|
||||||||||||||||
|
Shreveport-Bossier City
|
LA
|
906
|
|
3,618
|
|
34
|
|
906
|
|
3,652
|
|
4,558
|
|
181
|
|
10/19/2017
|
||||||||||||||||
|
Shreveport-Bossier City(4)
|
LA
|
—
|
|
5,113
|
|
24
|
|
—
|
|
5,137
|
|
5,137
|
|
196
|
|
10/19/2017
|
||||||||||||||||
|
Worchester
|
MA
|
414
|
|
4,122
|
|
47
|
|
414
|
|
4,169
|
|
4,583
|
|
237
|
|
6/30/2017
|
||||||||||||||||
|
California-Lexington Park
|
MD
|
827
|
|
4,936
|
|
72
|
|
827
|
|
5,008
|
|
5,835
|
|
189
|
|
2/16/2018
|
||||||||||||||||
|
Nonmetropolitan Area
|
MD
|
965
|
|
6,738
|
|
118
|
|
965
|
|
6,856
|
|
7,821
|
|
438
|
|
7/31/2017
|
||||||||||||||||
|
Nonmetropolitan Area
|
MD
|
550
|
|
2,409
|
|
77
|
|
550
|
|
2,486
|
|
3,036
|
|
168
|
|
9/6/2017
|
||||||||||||||||
|
Kansas City
|
MO
|
541
|
|
4,874
|
|
199
|
|
541
|
|
5,073
|
|
5,614
|
|
135
|
|
5/31/2018
|
||||||||||||||||
|
Kansas City
|
MO
|
461
|
|
5,341
|
|
107
|
|
461
|
|
5,448
|
|
5,909
|
|
131
|
|
5/31/2018
|
||||||||||||||||
|
Kansas City
|
MO
|
341
|
|
3,748
|
|
171
|
|
341
|
|
3,919
|
|
4,260
|
|
98
|
|
5/31/2018
|
||||||||||||||||
|
St. Louis
|
MO
|
1,675
|
|
10,606
|
|
2
|
|
1,675
|
|
10,608
|
|
12,283
|
|
135
|
|
9/26/2018
|
||||||||||||||||
|
St. Louis
|
MO
|
352
|
|
7,100
|
|
260
|
|
352
|
|
7,360
|
|
7,712
|
|
409
|
|
8/28/2017
|
||||||||||||||||
|
St. Louis
|
MO
|
163
|
|
1,025
|
|
52
|
|
163
|
|
1,077
|
|
1,240
|
|
64
|
|
8/28/2017
|
||||||||||||||||
|
St. Louis
|
MO
|
354
|
|
4,034
|
|
173
|
|
354
|
|
4,207
|
|
4,561
|
|
233
|
|
8/28/2017
|
||||||||||||||||
|
Gulfport-Biloxi-Pascagoula
|
MS
|
645
|
|
2,413
|
|
253
|
|
645
|
|
2,666
|
|
3,311
|
|
428
|
|
4/12/2016
|
||||||||||||||||
|
Meridian(3)
|
MS
|
224
|
|
1,052
|
|
144
|
|
224
|
|
1,196
|
|
1,420
|
|
298
|
|
5/1/2009
|
||||||||||||||||
|
Meridian(3)
|
MS
|
382
|
|
803
|
|
196
|
|
382
|
|
999
|
|
1,381
|
|
254
|
|
5/1/2009
|
||||||||||||||||
|
Charlotte-Concord-Gastonia
|
NC
|
1,871
|
|
4,174
|
|
72
|
|
1,871
|
|
4,246
|
|
6,117
|
|
589
|
|
5/1/2015
|
||||||||||||||||
|
Charlotte-Concord-Gastonia(3)
|
NC
|
1,108
|
|
3,935
|
|
71
|
|
1,108
|
|
4,006
|
|
5,114
|
|
565
|
|
5/4/2015
|
||||||||||||||||
|
Charlotte-Concord-Gastonia(3)
|
NC
|
2,301
|
|
4,458
|
|
208
|
|
2,301
|
|
4,666
|
|
6,967
|
|
713
|
|
5/4/2015
|
||||||||||||||||
|
Charlotte-Concord-Gastonia(3)
|
NC
|
1,862
|
|
3,297
|
|
95
|
|
1,862
|
|
3,392
|
|
5,254
|
|
533
|
|
9/2/2015
|
||||||||||||||||
|
Durham-Chapel Hill
|
NC
|
1,711
|
|
4,180
|
|
30
|
|
1,711
|
|
4,210
|
|
5,921
|
|
529
|
|
5/1/2015
|
||||||||||||||||
|
Durham-Chapel Hill
|
NC
|
390
|
|
1,025
|
|
219
|
|
390
|
|
1,244
|
|
1,634
|
|
387
|
|
8/29/2007
|
||||||||||||||||
|
Durham-Chapel Hill(3)
|
NC
|
663
|
|
2,743
|
|
228
|
|
663
|
|
2,971
|
|
3,634
|
|
887
|
|
9/28/2007
|
||||||||||||||||
|
Durham-Chapel Hill
|
NC
|
1,024
|
|
1,383
|
|
388
|
|
1,024
|
|
1,771
|
|
2,795
|
|
519
|
|
9/28/2007
|
||||||||||||||||
|
Fayetteville(3)
|
NC
|
1,195
|
|
2,072
|
|
18
|
|
1,195
|
|
2,090
|
|
3,285
|
|
253
|
|
10/1/2015
|
||||||||||||||||
|
Fayetteville(3)
|
NC
|
830
|
|
3,710
|
|
39
|
|
830
|
|
3,749
|
|
4,579
|
|
375
|
|
10/1/2015
|
||||||||||||||||
|
Fayetteville
|
NC
|
636
|
|
2,169
|
|
1,671
|
|
636
|
|
3,840
|
|
4,476
|
|
1,093
|
|
8/29/2007
|
||||||||||||||||
|
Fayetteville(3)
|
NC
|
151
|
|
5,392
|
|
360
|
|
151
|
|
5,752
|
|
5,903
|
|
1,614
|
|
9/28/2007
|
||||||||||||||||
|
Fayetteville
|
NC
|
1,319
|
|
3,444
|
|
24
|
|
1,319
|
|
3,468
|
|
4,787
|
|
660
|
|
10/10/2013
|
||||||||||||||||
|
Fayetteville
|
NC
|
772
|
|
3,406
|
|
30
|
|
772
|
|
3,436
|
|
4,208
|
|
545
|
|
10/10/2013
|
||||||||||||||||
F-44
|
Location
|
Initial Cost to Company
|
Gross Carrying Amount at Year-End
|
||||||||||||||||||||||||||||||
|
MSA
(1)
|
State/Territory
|
Land
|
Buildings and
Improvements
|
Subsequent
Additions
|
Land
|
Buildings and
Improvements
|
Total
(2)
|
Accumulated
Depreciation
|
Date
Acquired
|
|||||||||||||||||||||||
|
Fayetteville(3)
|
NC
|
1,276
|
|
4,527
|
|
42
|
|
1,276
|
|
4,569
|
|
5,845
|
|
660
|
|
12/20/2013
|
||||||||||||||||
|
Greensboro-High Point
|
NC
|
873
|
|
769
|
|
204
|
|
873
|
|
973
|
|
1,846
|
|
327
|
|
8/29/2007
|
||||||||||||||||
|
Jacksonville
|
NC
|
1,265
|
|
2,123
|
|
89
|
|
1,265
|
|
2,212
|
|
3,477
|
|
454
|
|
5/1/2015
|
||||||||||||||||
|
Nonmetropolitan Area
|
NC
|
530
|
|
2,394
|
|
8
|
|
530
|
|
2,402
|
|
2,932
|
|
372
|
|
12/11/2014
|
||||||||||||||||
|
Nonmetropolitan Area
|
NC
|
667
|
|
2,066
|
|
16
|
|
667
|
|
2,082
|
|
2,749
|
|
341
|
|
12/11/2014
|
||||||||||||||||
|
Nonmetropolitan Area(3)
|
NC
|
689
|
|
3,153
|
|
32
|
|
689
|
|
3,185
|
|
3,874
|
|
449
|
|
5/6/2015
|
||||||||||||||||
|
Nonmetropolitan Area
|
NC
|
2,093
|
|
2,045
|
|
59
|
|
2,093
|
|
2,104
|
|
4,197
|
|
170
|
|
8/4/2017
|
||||||||||||||||
|
Nonmetropolitan Area
|
NC
|
173
|
|
2,193
|
|
33
|
|
173
|
|
2,226
|
|
2,399
|
|
58
|
|
7/17/2018
|
||||||||||||||||
|
Raleigh-Cary
|
NC
|
396
|
|
1,700
|
|
174
|
|
396
|
|
1,874
|
|
2,270
|
|
589
|
|
8/29/2007
|
||||||||||||||||
|
Raleigh-Cary
|
NC
|
393
|
|
1,190
|
|
190
|
|
393
|
|
1,380
|
|
1,773
|
|
414
|
|
8/29/2007
|
||||||||||||||||
|
Raleigh-Cary
|
NC
|
907
|
|
2,913
|
|
129
|
|
907
|
|
3,042
|
|
3,949
|
|
890
|
|
8/29/2007
|
||||||||||||||||
|
Raleigh-Cary(3)
|
NC
|
1,578
|
|
4,678
|
|
92
|
|
1,578
|
|
4,770
|
|
6,348
|
|
588
|
|
5/4/2015
|
||||||||||||||||
|
Wilmington
|
NC
|
1,881
|
|
4,618
|
|
52
|
|
1,881
|
|
4,670
|
|
6,551
|
|
608
|
|
5/1/2015
|
||||||||||||||||
|
Wilmington
|
NC
|
1,283
|
|
1,747
|
|
256
|
|
1,141
|
|
2,003
|
|
3,144
|
|
553
|
|
8/29/2007
|
||||||||||||||||
|
Wilmington(3)
|
NC
|
860
|
|
828
|
|
85
|
|
860
|
|
913
|
|
1,773
|
|
273
|
|
9/28/2007
|
||||||||||||||||
|
Wilmington
|
NC
|
1,720
|
|
9,032
|
|
—
|
|
1,720
|
|
9,032
|
|
10,752
|
|
37
|
|
11/7/2018
|
||||||||||||||||
|
Wilmington
|
NC
|
2,021
|
|
8,136
|
|
—
|
|
2,021
|
|
8,136
|
|
10,157
|
|
36
|
|
11/7/2018
|
||||||||||||||||
|
Wilmington
|
NC
|
3,083
|
|
12,487
|
|
—
|
|
3,083
|
|
12,487
|
|
15,570
|
|
47
|
|
11/7/2018
|
||||||||||||||||
|
Winston-Salem
|
NC
|
362
|
|
529
|
|
74
|
|
362
|
|
603
|
|
965
|
|
191
|
|
8/29/2007
|
||||||||||||||||
|
Concord
|
NH
|
899
|
|
3,863
|
|
43
|
|
899
|
|
3,906
|
|
4,805
|
|
446
|
|
9/22/2015
|
||||||||||||||||
|
Concord
|
NH
|
632
|
|
1,040
|
|
45
|
|
632
|
|
1,085
|
|
1,717
|
|
404
|
|
6/24/2013
|
||||||||||||||||
|
Dover-Durham
|
NH
|
197
|
|
901
|
|
24
|
|
197
|
|
925
|
|
1,122
|
|
318
|
|
6/24/2013
|
||||||||||||||||
|
Boston-Cambridge-Quincy
|
NH
|
1,488
|
|
7,300
|
|
94
|
|
1,488
|
|
7,394
|
|
8,882
|
|
1,331
|
|
7/1/2014
|
||||||||||||||||
|
Manchester-Nashua
|
NH
|
1,786
|
|
6,100
|
|
23
|
|
1,786
|
|
6,123
|
|
7,909
|
|
631
|
|
2/22/2016
|
||||||||||||||||
|
Manchester-Nashua
|
NH
|
1,395
|
|
5,573
|
|
34
|
|
1,395
|
|
5,607
|
|
7,002
|
|
534
|
|
2/22/2016
|
||||||||||||||||
|
Nonmetropolitan Area
|
NH
|
2,053
|
|
5,425
|
|
49
|
|
2,053
|
|
5,474
|
|
7,527
|
|
357
|
|
6/15/2017
|
||||||||||||||||
|
Greater New Hampshire
|
NH
|
1,528
|
|
2,686
|
|
21
|
|
1,528
|
|
2,707
|
|
4,235
|
|
384
|
|
2/22/2016
|
||||||||||||||||
|
Rockingham County-Strafford County
|
NH
|
1,597
|
|
3,138
|
|
75
|
|
1,597
|
|
3,213
|
|
4,810
|
|
388
|
|
2/22/2016
|
||||||||||||||||
|
Rockingham County-Strafford County
|
NH
|
1,445
|
|
2,957
|
|
60
|
|
1,445
|
|
3,017
|
|
4,462
|
|
384
|
|
2/22/2016
|
||||||||||||||||
|
Albuquerque
|
NM
|
1,089
|
|
2,845
|
|
170
|
|
1,089
|
|
3,015
|
|
4,104
|
|
411
|
|
8/31/2016
|
||||||||||||||||
|
Albuquerque
|
NM
|
854
|
|
3,436
|
|
81
|
|
854
|
|
3,517
|
|
4,371
|
|
323
|
|
9/19/2016
|
||||||||||||||||
|
Carson City
|
NV
|
985
|
|
1,438
|
|
—
|
|
985
|
|
1,438
|
|
2,423
|
|
3
|
|
12/13/2018
|
||||||||||||||||
|
Las Vegas-Henderson-Paradise
|
NV
|
1,757
|
|
4,223
|
|
58
|
|
1,757
|
|
4,281
|
|
6,038
|
|
434
|
|
9/20/2016
|
||||||||||||||||
|
Las Vegas-Henderson-Paradise
|
NV
|
1,121
|
|
1,510
|
|
108
|
|
1,121
|
|
1,618
|
|
2,739
|
|
208
|
|
9/20/2016
|
||||||||||||||||
F-45
|
Location
|
Initial Cost to Company
|
Gross Carrying Amount at Year-End
|
||||||||||||||||||||||||||||||
|
MSA
(1)
|
State/Territory
|
Land
|
Buildings and
Improvements
|
Subsequent
Additions
|
Land
|
Buildings and
Improvements
|
Total
(2)
|
Accumulated
Depreciation
|
Date
Acquired
|
|||||||||||||||||||||||
|
Las Vegas-Henderson-Paradise
|
NV
|
2,160
|
|
4,544
|
|
236
|
|
2,160
|
|
4,780
|
|
6,940
|
|
346
|
|
11/17/2016
|
||||||||||||||||
|
Las Vegas-Henderson-Paradise
|
NV
|
1,047
|
|
7,413
|
|
280
|
|
1,047
|
|
7,693
|
|
8,740
|
|
193
|
|
4/11/2018
|
||||||||||||||||
|
Las Vegas-Paradise
|
NV
|
1,169
|
|
3,616
|
|
205
|
|
1,169
|
|
3,821
|
|
4,990
|
|
1,193
|
|
12/23/2013
|
||||||||||||||||
|
Las Vegas-Paradise
|
NV
|
389
|
|
2,850
|
|
75
|
|
389
|
|
2,925
|
|
3,314
|
|
606
|
|
4/1/2014
|
||||||||||||||||
|
Las Vegas-Paradise
|
NV
|
794
|
|
1,406
|
|
119
|
|
794
|
|
1,525
|
|
2,319
|
|
406
|
|
7/1/2014
|
||||||||||||||||
|
Las Vegas-Paradise
|
NV
|
2,362
|
|
8,445
|
|
123
|
|
2,362
|
|
8,568
|
|
10,930
|
|
366
|
|
8/15/2017
|
||||||||||||||||
|
Las Vegas-Paradise
|
NV
|
2,157
|
|
2,753
|
|
84
|
|
2,157
|
|
2,837
|
|
4,994
|
|
172
|
|
8/15/2017
|
||||||||||||||||
|
Las Vegas-Paradise
|
NV
|
1,296
|
|
8,039
|
|
215
|
|
1,296
|
|
8,254
|
|
9,550
|
|
334
|
|
8/15/2017
|
||||||||||||||||
|
Las Vegas-Paradise
|
NV
|
828
|
|
2,030
|
|
263
|
|
828
|
|
2,293
|
|
3,121
|
|
147
|
|
8/29/2017
|
||||||||||||||||
|
Las Vegas-Paradise
|
NV
|
3,864
|
|
2,870
|
|
444
|
|
3,976
|
|
3,314
|
|
7,290
|
|
264
|
|
8/29/2017
|
||||||||||||||||
|
Canton-Massillon
|
OH
|
83
|
|
2,911
|
|
45
|
|
83
|
|
2,956
|
|
3,039
|
|
253
|
|
11/10/2016
|
||||||||||||||||
|
Canton-Massillon
|
OH
|
292
|
|
2,107
|
|
54
|
|
292
|
|
2,161
|
|
2,453
|
|
380
|
|
11/10/2016
|
||||||||||||||||
|
Cincinnati
|
OH
|
2,059
|
|
11,660
|
|
41
|
|
2,059
|
|
11,701
|
|
13,760
|
|
142
|
|
9/6/2018
|
||||||||||||||||
|
Cleveland-Elyria
|
OH
|
169
|
|
2,702
|
|
42
|
|
169
|
|
2,744
|
|
2,913
|
|
223
|
|
11/10/2016
|
||||||||||||||||
|
Cleveland-Elyria
|
OH
|
193
|
|
3,323
|
|
36
|
|
193
|
|
3,359
|
|
3,552
|
|
246
|
|
11/10/2016
|
||||||||||||||||
|
Cleveland-Elyria
|
OH
|
490
|
|
1,050
|
|
26
|
|
490
|
|
1,076
|
|
1,566
|
|
141
|
|
11/10/2016
|
||||||||||||||||
|
Cleveland-Elyria
|
OH
|
845
|
|
4,916
|
|
32
|
|
845
|
|
4,948
|
|
5,793
|
|
425
|
|
11/10/2016
|
||||||||||||||||
|
Cleveland-Elyria
|
OH
|
842
|
|
2,044
|
|
27
|
|
842
|
|
2,071
|
|
2,913
|
|
284
|
|
11/10/2016
|
||||||||||||||||
|
Oklahoma City
|
OK
|
388
|
|
3,142
|
|
133
|
|
388
|
|
3,275
|
|
3,663
|
|
1,010
|
|
5/29/2007
|
||||||||||||||||
|
Oklahoma City
|
OK
|
213
|
|
1,383
|
|
78
|
|
213
|
|
1,461
|
|
1,674
|
|
449
|
|
5/29/2007
|
||||||||||||||||
|
Oklahoma City
|
OK
|
561
|
|
2,355
|
|
440
|
|
561
|
|
2,795
|
|
3,356
|
|
955
|
|
5/29/2007
|
||||||||||||||||
|
Oklahoma City
|
OK
|
349
|
|
2,368
|
|
458
|
|
349
|
|
2,826
|
|
3,175
|
|
940
|
|
5/29/2007
|
||||||||||||||||
|
Oklahoma City
|
OK
|
466
|
|
2,544
|
|
107
|
|
466
|
|
2,651
|
|
3,117
|
|
804
|
|
5/29/2007
|
||||||||||||||||
|
Oklahoma City
|
OK
|
144
|
|
1,576
|
|
148
|
|
144
|
|
1,724
|
|
1,868
|
|
569
|
|
5/29/2007
|
||||||||||||||||
|
Oklahoma City
|
OK
|
168
|
|
1,696
|
|
245
|
|
168
|
|
1,941
|
|
2,109
|
|
625
|
|
5/29/2007
|
||||||||||||||||
|
Oklahoma City
|
OK
|
220
|
|
1,606
|
|
119
|
|
220
|
|
1,725
|
|
1,945
|
|
529
|
|
5/30/2007
|
||||||||||||||||
|
Oklahoma City
|
OK
|
376
|
|
1,460
|
|
42
|
|
376
|
|
1,502
|
|
1,878
|
|
445
|
|
5/30/2007
|
||||||||||||||||
|
Oklahoma City
|
OK
|
337
|
|
2,788
|
|
90
|
|
337
|
|
2,878
|
|
3,215
|
|
864
|
|
5/30/2007
|
||||||||||||||||
|
Oklahoma City
|
OK
|
814
|
|
3,161
|
|
1,178
|
|
814
|
|
4,339
|
|
5,153
|
|
985
|
|
5/30/2007
|
||||||||||||||||
|
Oklahoma City
|
OK
|
590
|
|
1,502
|
|
1,753
|
|
590
|
|
3,255
|
|
3,845
|
|
891
|
|
8/29/2007
|
||||||||||||||||
|
Oklahoma City
|
OK
|
205
|
|
1,772
|
|
461
|
|
205
|
|
2,233
|
|
2,438
|
|
722
|
|
5/1/2009
|
||||||||||||||||
|
Oklahoma City
|
OK
|
701
|
|
4,926
|
|
2
|
|
701
|
|
4,928
|
|
5,629
|
|
373
|
|
9/1/2016
|
||||||||||||||||
|
Oklahoma City
|
OK
|
548
|
|
1,892
|
|
110
|
|
548
|
|
2,002
|
|
2,550
|
|
583
|
|
8/29/2007
|
||||||||||||||||
|
Oklahoma City
|
OK
|
764
|
|
1,386
|
|
427
|
|
764
|
|
1,813
|
|
2,577
|
|
555
|
|
8/29/2007
|
||||||||||||||||
F-46
|
Location
|
Initial Cost to Company
|
Gross Carrying Amount at Year-End
|
||||||||||||||||||||||||||||||
|
MSA
(1)
|
State/Territory
|
Land
|
Buildings and
Improvements
|
Subsequent
Additions
|
Land
|
Buildings and
Improvements
|
Total
(2)
|
Accumulated
Depreciation
|
Date
Acquired
|
|||||||||||||||||||||||
|
Oklahoma City
|
OK
|
1,305
|
|
2,533
|
|
159
|
|
1,305
|
|
2,692
|
|
3,997
|
|
798
|
|
8/29/2007
|
||||||||||||||||
|
Tulsa
|
OK
|
940
|
|
2,196
|
|
337
|
|
940
|
|
2,533
|
|
3,473
|
|
742
|
|
8/29/2007
|
||||||||||||||||
|
Tulsa
|
OK
|
59
|
|
466
|
|
342
|
|
59
|
|
808
|
|
867
|
|
243
|
|
8/29/2007
|
||||||||||||||||
|
Tulsa
|
OK
|
426
|
|
1,424
|
|
288
|
|
426
|
|
1,712
|
|
2,138
|
|
574
|
|
8/29/2007
|
||||||||||||||||
|
Tulsa
|
OK
|
250
|
|
667
|
|
173
|
|
250
|
|
840
|
|
1,090
|
|
273
|
|
8/29/2007
|
||||||||||||||||
|
Tulsa(3)
|
OK
|
944
|
|
2,085
|
|
56
|
|
944
|
|
2,141
|
|
3,085
|
|
597
|
|
2/14/2008
|
||||||||||||||||
|
Tulsa(3)
|
OK
|
892
|
|
2,421
|
|
29
|
|
892
|
|
2,450
|
|
3,342
|
|
679
|
|
2/14/2008
|
||||||||||||||||
|
Tulsa
|
OK
|
492
|
|
1,343
|
|
182
|
|
492
|
|
1,525
|
|
2,017
|
|
395
|
|
4/1/2008
|
||||||||||||||||
|
Tulsa
|
OK
|
505
|
|
1,346
|
|
725
|
|
505
|
|
2,071
|
|
2,576
|
|
742
|
|
4/1/2008
|
||||||||||||||||
|
Tulsa
|
OK
|
466
|
|
1,270
|
|
153
|
|
466
|
|
1,423
|
|
1,889
|
|
400
|
|
4/1/2008
|
||||||||||||||||
|
Tulsa(3)
|
OK
|
1,103
|
|
4,431
|
|
177
|
|
1,103
|
|
4,608
|
|
5,711
|
|
1,609
|
|
6/10/2013
|
||||||||||||||||
|
Tulsa
|
OK
|
1,082
|
|
4,218
|
|
19
|
|
1,082
|
|
4,237
|
|
5,319
|
|
443
|
|
1/1/2016
|
||||||||||||||||
|
Tulsa
|
OK
|
736
|
|
2,925
|
|
3
|
|
736
|
|
2,928
|
|
3,664
|
|
374
|
|
1/1/2016
|
||||||||||||||||
|
Tulsa
|
OK
|
1,135
|
|
3,759
|
|
15
|
|
1,135
|
|
3,774
|
|
4,909
|
|
416
|
|
1/1/2016
|
||||||||||||||||
|
Bend
|
OR
|
295
|
|
1,369
|
|
21
|
|
295
|
|
1,390
|
|
1,685
|
|
426
|
|
4/1/2013
|
||||||||||||||||
|
Bend
|
OR
|
1,692
|
|
2,410
|
|
61
|
|
1,692
|
|
2,471
|
|
4,163
|
|
838
|
|
4/1/2013
|
||||||||||||||||
|
Bend(3)
|
OR
|
571
|
|
1,917
|
|
2
|
|
571
|
|
1,919
|
|
2,490
|
|
431
|
|
6/10/2013
|
||||||||||||||||
|
Bend(3)
|
OR
|
397
|
|
1,180
|
|
99
|
|
397
|
|
1,279
|
|
1,676
|
|
457
|
|
6/10/2013
|
||||||||||||||||
|
Bend
|
OR
|
690
|
|
1,983
|
|
846
|
|
690
|
|
2,829
|
|
3,519
|
|
479
|
|
5/1/2014
|
||||||||||||||||
|
Bend
|
OR
|
722
|
|
2,151
|
|
4
|
|
722
|
|
2,155
|
|
2,877
|
|
442
|
|
5/1/2014
|
||||||||||||||||
|
Bend
|
OR
|
800
|
|
2,836
|
|
3
|
|
800
|
|
2,839
|
|
3,639
|
|
582
|
|
5/1/2014
|
||||||||||||||||
|
Bend-Redmond
|
OR
|
2,688
|
|
10,731
|
|
11
|
|
2,688
|
|
10,742
|
|
13,430
|
|
1,086
|
|
4/15/2016
|
||||||||||||||||
|
Corvallis
|
OR
|
382
|
|
1,465
|
|
2
|
|
382
|
|
1,467
|
|
1,849
|
|
387
|
|
12/30/2013
|
||||||||||||||||
|
Eugene-Springfield
|
OR
|
710
|
|
1,539
|
|
98
|
|
710
|
|
1,637
|
|
2,347
|
|
473
|
|
4/1/2013
|
||||||||||||||||
|
Eugene-Springfield
|
OR
|
842
|
|
1,674
|
|
37
|
|
842
|
|
1,711
|
|
2,553
|
|
530
|
|
4/1/2013
|
||||||||||||||||
|
Eugene-Springfield(3)
|
OR
|
414
|
|
1,990
|
|
—
|
|
414
|
|
1,990
|
|
2,404
|
|
382
|
|
6/10/2013
|
||||||||||||||||
|
Eugene-Springfield(3)
|
OR
|
1,149
|
|
2,061
|
|
69
|
|
1,149
|
|
2,130
|
|
3,279
|
|
495
|
|
6/10/2013
|
||||||||||||||||
|
Eugene-Springfield
|
OR
|
728
|
|
3,230
|
|
108
|
|
728
|
|
3,338
|
|
4,066
|
|
575
|
|
12/30/2013
|
||||||||||||||||
|
Eugene-Springfield
|
OR
|
1,601
|
|
2,686
|
|
109
|
|
1,601
|
|
2,795
|
|
4,396
|
|
831
|
|
4/1/2014
|
||||||||||||||||
|
Hood River
|
OR
|
997
|
|
1,874
|
|
2
|
|
997
|
|
1,876
|
|
2,873
|
|
322
|
|
12/1/2014
|
||||||||||||||||
|
Portland-Vancouver-Hillsboro
|
OR
|
2,670
|
|
8,709
|
|
53
|
|
2,670
|
|
8,762
|
|
11,432
|
|
802
|
|
8/10/2015
|
||||||||||||||||
|
Portland-Vancouver-Hillsboro
|
OR
|
771
|
|
4,121
|
|
—
|
|
771
|
|
4,121
|
|
4,892
|
|
152
|
|
11/15/2017
|
||||||||||||||||
|
Portland-Vancouver-Hillsboro
|
OR
|
2,002
|
|
14,445
|
|
1
|
|
2,002
|
|
14,446
|
|
16,448
|
|
610
|
|
12/14/2017
|
||||||||||||||||
|
Portland-Vancouver-Hillsboro
|
OR
|
851
|
|
2,063
|
|
6
|
|
851
|
|
2,069
|
|
2,920
|
|
427
|
|
4/1/2013
|
||||||||||||||||
F-47
|
Location
|
Initial Cost to Company
|
Gross Carrying Amount at Year-End
|
||||||||||||||||||||||||||||||
|
MSA
(1)
|
State/Territory
|
Land
|
Buildings and
Improvements
|
Subsequent
Additions
|
Land
|
Buildings and
Improvements
|
Total
(2)
|
Accumulated
Depreciation
|
Date
Acquired
|
|||||||||||||||||||||||
|
Portland-Vancouver-Hillsboro
|
OR
|
1,704
|
|
2,313
|
|
176
|
|
1,704
|
|
2,489
|
|
4,193
|
|
694
|
|
4/1/2013
|
||||||||||||||||
|
Portland-Vancouver-Hillsboro
|
OR
|
1,254
|
|
2,787
|
|
12
|
|
1,254
|
|
2,799
|
|
4,053
|
|
598
|
|
4/1/2013
|
||||||||||||||||
|
Portland-Vancouver-Hillsboro
|
OR
|
2,808
|
|
4,437
|
|
19
|
|
2,808
|
|
4,456
|
|
7,264
|
|
1,171
|
|
4/1/2013
|
||||||||||||||||
|
Portland-Vancouver-Hillsboro
|
OR
|
1,015
|
|
2,184
|
|
3
|
|
1,015
|
|
2,187
|
|
3,202
|
|
495
|
|
4/1/2013
|
||||||||||||||||
|
Portland-Vancouver-Hillsboro(3)
|
OR
|
1,077
|
|
3,008
|
|
170
|
|
1,077
|
|
3,178
|
|
4,255
|
|
587
|
|
6/10/2013
|
||||||||||||||||
|
Portland-Vancouver-Hillsboro(3)
|
OR
|
1,072
|
|
2,629
|
|
19
|
|
1,072
|
|
2,648
|
|
3,720
|
|
655
|
|
6/10/2013
|
||||||||||||||||
|
Portland-Vancouver-Hillsboro(3)
|
OR
|
2,217
|
|
3,766
|
|
15
|
|
2,217
|
|
3,781
|
|
5,998
|
|
766
|
|
6/10/2013
|
||||||||||||||||
|
Portland-Vancouver-Hillsboro(3)
|
OR
|
1,334
|
|
2,324
|
|
127
|
|
1,334
|
|
2,451
|
|
3,785
|
|
587
|
|
6/10/2013
|
||||||||||||||||
|
Portland-Vancouver-Hillsboro(3)
|
OR
|
996
|
|
2,525
|
|
126
|
|
996
|
|
2,651
|
|
3,647
|
|
615
|
|
6/10/2013
|
||||||||||||||||
|
Portland-Vancouver-Hillsboro
|
OR
|
1,496
|
|
3,372
|
|
152
|
|
1,496
|
|
3,524
|
|
5,020
|
|
660
|
|
6/24/2013
|
||||||||||||||||
|
Portland-Vancouver-Hillsboro
|
OR
|
954
|
|
3,026
|
|
95
|
|
954
|
|
3,121
|
|
4,075
|
|
537
|
|
6/24/2013
|
||||||||||||||||
|
Portland-Vancouver-Hillsboro
|
OR
|
1,627
|
|
2,388
|
|
70
|
|
1,627
|
|
2,458
|
|
4,085
|
|
529
|
|
6/24/2013
|
||||||||||||||||
|
Portland-Vancouver-Hillsboro
|
OR
|
2,509
|
|
4,200
|
|
99
|
|
2,509
|
|
4,299
|
|
6,808
|
|
883
|
|
12/30/2013
|
||||||||||||||||
|
Portland-Vancouver-Hillsboro
|
OR
|
787
|
|
1,915
|
|
62
|
|
787
|
|
1,977
|
|
2,764
|
|
374
|
|
12/30/2013
|
||||||||||||||||
|
Portland-Vancouver-Hillsboro
|
OR
|
1,703
|
|
4,729
|
|
9
|
|
1,703
|
|
4,738
|
|
6,441
|
|
806
|
|
4/1/2014
|
||||||||||||||||
|
Portland-Vancouver-Hillsboro
|
OR
|
738
|
|
2,483
|
|
—
|
|
738
|
|
2,483
|
|
3,221
|
|
424
|
|
4/1/2014
|
||||||||||||||||
|
Portland-Vancouver-Hillsboro
|
OR
|
1,690
|
|
2,995
|
|
106
|
|
1,690
|
|
3,101
|
|
4,791
|
|
416
|
|
4/1/2014
|
||||||||||||||||
|
Portland-Vancouver-Hillsboro
|
OR
|
1,200
|
|
9,531
|
|
254
|
|
1,200
|
|
9,785
|
|
10,985
|
|
2,275
|
|
5/30/2014
|
||||||||||||||||
|
Portland-Vancouver-Hillsboro
|
OR
|
401
|
|
3,718
|
|
84
|
|
401
|
|
3,802
|
|
4,203
|
|
717
|
|
5/30/2014
|
||||||||||||||||
|
Portland-Vancouver-Hillsboro
|
OR
|
1,160
|
|
3,291
|
|
21
|
|
1,160
|
|
3,312
|
|
4,472
|
|
605
|
|
6/30/2014
|
||||||||||||||||
|
Portland-Vancouver-Hillsboro
|
OR
|
1,435
|
|
4,342
|
|
—
|
|
1,435
|
|
4,342
|
|
5,777
|
|
798
|
|
6/30/2014
|
||||||||||||||||
|
Portland-Vancouver-Hillsboro
|
OR
|
1,478
|
|
4,127
|
|
6
|
|
1,478
|
|
4,133
|
|
5,611
|
|
752
|
|
6/30/2014
|
||||||||||||||||
|
Portland-Vancouver-Hillsboro
|
OR
|
1,402
|
|
3,196
|
|
22
|
|
1,402
|
|
3,218
|
|
4,620
|
|
558
|
|
6/30/2014
|
||||||||||||||||
|
Portland-Vancouver-Hillsboro
|
OR
|
3,538
|
|
4,938
|
|
6
|
|
3,398
|
|
3,984
|
|
7,382
|
|
725
|
|
6/30/2014
|
||||||||||||||||
|
Portland-Vancouver-Hillsboro
|
OR
|
1,501
|
|
3,136
|
|
6
|
|
1,501
|
|
3,142
|
|
4,643
|
|
572
|
|
6/30/2014
|
||||||||||||||||
|
Portland-Vancouver-Hillsboro
|
OR
|
1,746
|
|
3,393
|
|
16
|
|
1,746
|
|
3,409
|
|
5,155
|
|
626
|
|
8/27/2014
|
||||||||||||||||
|
Portland-Vancouver-Hillsboro
|
OR
|
1,014
|
|
3,017
|
|
13
|
|
1,014
|
|
3,030
|
|
4,044
|
|
578
|
|
8/27/2014
|
||||||||||||||||
|
Portland-Vancouver-Hillsboro
|
OR
|
2,202
|
|
3,477
|
|
127
|
|
2,202
|
|
3,604
|
|
5,806
|
|
689
|
|
10/20/2014
|
||||||||||||||||
|
Portland-Vancouver-Hillsboro
|
OR
|
1,764
|
|
7,360
|
|
7
|
|
1,764
|
|
7,367
|
|
9,131
|
|
1,101
|
|
12/16/2014
|
||||||||||||||||
|
Portland-Vancouver-Hillsboro
|
OR
|
860
|
|
3,740
|
|
—
|
|
860
|
|
3,740
|
|
4,600
|
|
240
|
|
1/11/2017
|
||||||||||||||||
|
Portland-Vancouver-Hillsboro
|
OR
|
410
|
|
622
|
|
179
|
|
410
|
|
801
|
|
1,211
|
|
96
|
|
7/14/2016
|
||||||||||||||||
|
Portland-Vancouver-Hillsboro
|
OR
|
1,258
|
|
6,298
|
|
3
|
|
1,258
|
|
6,301
|
|
7,559
|
|
392
|
|
11/21/2016
|
||||||||||||||||
|
Portland-Vancouver-Hillsboro
|
OR
|
2,334
|
|
7,726
|
|
34
|
|
2,339
|
|
7,760
|
|
10,099
|
|
588
|
|
12/6/2016
|
||||||||||||||||
|
Portland-Vancouver-Hillsboro
|
OR
|
1,048
|
|
3,549
|
|
—
|
|
1,048
|
|
3,549
|
|
4,597
|
|
64
|
|
8/16/2018
|
||||||||||||||||
F-48
|
Location
|
Initial Cost to Company
|
Gross Carrying Amount at Year-End
|
||||||||||||||||||||||||||||||
|
MSA
(1)
|
State/Territory
|
Land
|
Buildings and
Improvements
|
Subsequent
Additions
|
Land
|
Buildings and
Improvements
|
Total
(2)
|
Accumulated
Depreciation
|
Date
Acquired
|
|||||||||||||||||||||||
|
Portland-Vancouver-Hillsboro
|
OR
|
472
|
|
2,880
|
|
—
|
|
472
|
|
2,880
|
|
3,352
|
|
20
|
|
10/24/2018
|
||||||||||||||||
|
Prineville
|
OR
|
427
|
|
1,648
|
|
6
|
|
427
|
|
1,654
|
|
2,081
|
|
294
|
|
8/27/2014
|
||||||||||||||||
|
Roseburg(3)
|
OR
|
474
|
|
1,789
|
|
80
|
|
474
|
|
1,869
|
|
2,343
|
|
439
|
|
6/10/2013
|
||||||||||||||||
|
Salem
|
OR
|
1,405
|
|
2,650
|
|
418
|
|
1,405
|
|
3,068
|
|
4,473
|
|
787
|
|
4/1/2014
|
||||||||||||||||
|
Salem
|
OR
|
492
|
|
1,248
|
|
18
|
|
492
|
|
1,266
|
|
1,758
|
|
179
|
|
4/20/2016
|
||||||||||||||||
|
The Dalles
|
OR
|
1,108
|
|
2,100
|
|
2
|
|
1,108
|
|
2,102
|
|
3,210
|
|
390
|
|
12/5/2014
|
||||||||||||||||
|
Ponce-Yauco-Coamo
|
PR
|
745
|
|
4,813
|
|
3
|
|
745
|
|
4,816
|
|
5,561
|
|
66
|
|
9/6/2018
|
||||||||||||||||
|
San Juan-Caguas-Guaynabo
|
PR
|
1,095
|
|
8,073
|
|
3
|
|
1,095
|
|
8,076
|
|
9,171
|
|
85
|
|
9/6/2018
|
||||||||||||||||
|
San Juan-Caguas-Guaynabo
|
PR
|
1,205
|
|
9,967
|
|
6
|
|
1,205
|
|
9,973
|
|
11,178
|
|
90
|
|
9/6/2018
|
||||||||||||||||
|
San Juan-Caguas-Guaynabo
|
PR
|
1,266
|
|
15,805
|
|
3
|
|
1,266
|
|
15,808
|
|
17,074
|
|
122
|
|
9/6/2018
|
||||||||||||||||
|
San Juan-Caguas-Guaynabo
|
PR
|
356
|
|
1,892
|
|
10
|
|
356
|
|
1,902
|
|
2,258
|
|
26
|
|
9/6/2018
|
||||||||||||||||
|
San Juan-Caguas-Guaynabo
|
PR
|
573
|
|
2,373
|
|
3
|
|
573
|
|
2,376
|
|
2,949
|
|
37
|
|
9/6/2018
|
||||||||||||||||
|
Anderson
|
SC
|
92
|
|
976
|
|
120
|
|
92
|
|
1,096
|
|
1,188
|
|
349
|
|
8/29/2007
|
||||||||||||||||
|
Charlotte-Gastonia-Rock Hill(3)
|
SC
|
924
|
|
3,086
|
|
52
|
|
924
|
|
3,138
|
|
4,062
|
|
421
|
|
5/4/2015
|
||||||||||||||||
|
Greenville-Mauldin-Easley
|
SC
|
82
|
|
838
|
|
97
|
|
82
|
|
935
|
|
1,017
|
|
278
|
|
8/29/2007
|
||||||||||||||||
|
Spartanburg
|
SC
|
535
|
|
1,934
|
|
29
|
|
535
|
|
1,963
|
|
2,498
|
|
273
|
|
11/12/2015
|
||||||||||||||||
|
Amarillo(3)
|
TX
|
80
|
|
877
|
|
106
|
|
80
|
|
983
|
|
1,063
|
|
257
|
|
5/1/2009
|
||||||||||||||||
|
Amarillo(3)
|
TX
|
78
|
|
697
|
|
165
|
|
78
|
|
862
|
|
940
|
|
229
|
|
5/1/2009
|
||||||||||||||||
|
Amarillo(3)
|
TX
|
147
|
|
810
|
|
145
|
|
147
|
|
955
|
|
1,102
|
|
250
|
|
5/1/2009
|
||||||||||||||||
|
Austin-Round Rock-San Marcos
|
TX
|
936
|
|
6,446
|
|
24
|
|
936
|
|
6,470
|
|
7,406
|
|
235
|
|
10/19/2017
|
||||||||||||||||
|
Austin-Round Rock-San Marcos
|
TX
|
937
|
|
5,319
|
|
86
|
|
937
|
|
5,405
|
|
6,342
|
|
944
|
|
6/24/2013
|
||||||||||||||||
|
Austin-Round Rock-San Marcos
|
TX
|
1,395
|
|
2,790
|
|
25
|
|
1,395
|
|
2,815
|
|
4,210
|
|
754
|
|
6/24/2013
|
||||||||||||||||
|
Austin-Round Rock-San Marcos
|
TX
|
768
|
|
1,923
|
|
290
|
|
768
|
|
2,213
|
|
2,981
|
|
405
|
|
10/29/2014
|
||||||||||||||||
|
Brownsville-Harlingen
|
TX
|
845
|
|
2,364
|
|
64
|
|
845
|
|
2,428
|
|
3,273
|
|
375
|
|
9/4/2014
|
||||||||||||||||
|
Brownsville-Harlingen
|
TX
|
639
|
|
1,674
|
|
101
|
|
639
|
|
1,775
|
|
2,414
|
|
332
|
|
9/4/2014
|
||||||||||||||||
|
Brownsville-Harlingen
|
TX
|
386
|
|
2,798
|
|
185
|
|
386
|
|
2,983
|
|
3,369
|
|
330
|
|
5/2/2016
|
||||||||||||||||
|
College Station-Bryan
|
TX
|
618
|
|
2,512
|
|
88
|
|
618
|
|
2,600
|
|
3,218
|
|
746
|
|
8/29/2007
|
||||||||||||||||
|
College Station-Bryan
|
TX
|
551
|
|
349
|
|
231
|
|
551
|
|
580
|
|
1,131
|
|
170
|
|
8/29/2007
|
||||||||||||||||
|
College Station-Bryan
|
TX
|
295
|
|
988
|
|
150
|
|
295
|
|
1,138
|
|
1,433
|
|
302
|
|
4/1/2008
|
||||||||||||||||
|
College Station-Bryan
|
TX
|
51
|
|
123
|
|
66
|
|
51
|
|
189
|
|
240
|
|
64
|
|
4/1/2008
|
||||||||||||||||
|
College Station-Bryan
|
TX
|
110
|
|
372
|
|
176
|
|
110
|
|
548
|
|
658
|
|
134
|
|
4/1/2008
|
||||||||||||||||
|
College Station-Bryan
|
TX
|
62
|
|
208
|
|
13
|
|
62
|
|
221
|
|
283
|
|
63
|
|
4/1/2008
|
||||||||||||||||
|
Dallas-Fort Worth-Arlington
|
TX
|
164
|
|
865
|
|
49
|
|
164
|
|
914
|
|
1,078
|
|
273
|
|
8/29/2007
|
||||||||||||||||
|
Dallas-Fort Worth-Arlington
|
TX
|
155
|
|
105
|
|
53
|
|
155
|
|
158
|
|
313
|
|
58
|
|
9/28/2007
|
||||||||||||||||
F-49
|
Location
|
Initial Cost to Company
|
Gross Carrying Amount at Year-End
|
||||||||||||||||||||||||||||||
|
MSA
(1)
|
State/Territory
|
Land
|
Buildings and
Improvements
|
Subsequent
Additions
|
Land
|
Buildings and
Improvements
|
Total
(2)
|
Accumulated
Depreciation
|
Date
Acquired
|
|||||||||||||||||||||||
|
Dallas-Fort Worth-Arlington
|
TX
|
98
|
|
282
|
|
170
|
|
98
|
|
452
|
|
550
|
|
137
|
|
9/28/2007
|
||||||||||||||||
|
Dallas-Fort Worth-Arlington
|
TX
|
264
|
|
106
|
|
165
|
|
264
|
|
271
|
|
535
|
|
108
|
|
9/28/2007
|
||||||||||||||||
|
Dallas-Fort Worth-Arlington(3)
|
TX
|
376
|
|
803
|
|
120
|
|
376
|
|
923
|
|
1,299
|
|
294
|
|
9/28/2007
|
||||||||||||||||
|
Dallas-Fort Worth-Arlington(3)
|
TX
|
338
|
|
681
|
|
101
|
|
338
|
|
782
|
|
1,120
|
|
237
|
|
9/28/2007
|
||||||||||||||||
|
Dallas-Fort Worth-Arlington
|
TX
|
1,388
|
|
4,195
|
|
43
|
|
1,388
|
|
4,238
|
|
5,626
|
|
857
|
|
6/24/2013
|
||||||||||||||||
|
Dallas-Fort Worth-Arlington
|
TX
|
1,859
|
|
5,293
|
|
129
|
|
1,859
|
|
5,422
|
|
7,281
|
|
1,044
|
|
7/25/2013
|
||||||||||||||||
|
Dallas-Fort Worth-Arlington
|
TX
|
379
|
|
2,212
|
|
128
|
|
379
|
|
2,340
|
|
2,719
|
|
637
|
|
7/25/2013
|
||||||||||||||||
|
Dallas-Fort Worth-Arlington
|
TX
|
1,397
|
|
5,250
|
|
90
|
|
1,397
|
|
5,340
|
|
6,737
|
|
964
|
|
7/25/2013
|
||||||||||||||||
|
Dallas-Fort Worth-Arlington
|
TX
|
2,102
|
|
5,755
|
|
94
|
|
2,102
|
|
5,849
|
|
7,951
|
|
1,229
|
|
7/25/2013
|
||||||||||||||||
|
Dallas-Fort Worth-Arlington
|
TX
|
649
|
|
1,637
|
|
49
|
|
649
|
|
1,686
|
|
2,335
|
|
626
|
|
7/25/2013
|
||||||||||||||||
|
Dallas-Fort Worth-Arlington
|
TX
|
396
|
|
1,411
|
|
466
|
|
396
|
|
1,877
|
|
2,273
|
|
420
|
|
4/29/2015
|
||||||||||||||||
|
Dallas-Fort Worth-Arlington
|
TX
|
1,263
|
|
3,346
|
|
52
|
|
1,263
|
|
3,398
|
|
4,661
|
|
581
|
|
10/19/2015
|
||||||||||||||||
|
Dallas-Plano-Irving
|
TX
|
1,421
|
|
2,349
|
|
491
|
|
1,421
|
|
2,840
|
|
4,261
|
|
367
|
|
6/1/2016
|
||||||||||||||||
|
Dallas-Plano-Irving
|
TX
|
710
|
|
3,578
|
|
101
|
|
710
|
|
3,679
|
|
4,389
|
|
211
|
|
10/19/2017
|
||||||||||||||||
|
Dallas-Plano-Irving
|
TX
|
421
|
|
2,668
|
|
69
|
|
421
|
|
2,737
|
|
3,158
|
|
140
|
|
10/19/2017
|
||||||||||||||||
|
El Paso
|
TX
|
338
|
|
1,275
|
|
42
|
|
338
|
|
1,317
|
|
1,655
|
|
388
|
|
8/29/2007
|
||||||||||||||||
|
El Paso
|
TX
|
94
|
|
400
|
|
168
|
|
94
|
|
568
|
|
662
|
|
174
|
|
8/29/2007
|
||||||||||||||||
|
Houston-Sugar Land-Baytown
|
TX
|
698
|
|
2,648
|
|
264
|
|
698
|
|
2,912
|
|
3,610
|
|
411
|
|
7/20/2015
|
||||||||||||||||
|
Houston-The Woodlands-Sugar Land
|
TX
|
1,042
|
|
3,061
|
|
413
|
|
1,042
|
|
3,474
|
|
4,516
|
|
455
|
|
1/22/2016
|
||||||||||||||||
|
Houston-The Woodlands-Sugar Land
|
TX
|
1,426
|
|
2,910
|
|
115
|
|
1,426
|
|
3,025
|
|
4,451
|
|
230
|
|
6/13/2017
|
||||||||||||||||
|
Houston-The Woodlands-Sugar Land
|
TX
|
826
|
|
3,683
|
|
189
|
|
826
|
|
3,872
|
|
4,698
|
|
185
|
|
1/4/2018
|
||||||||||||||||
|
Houston-The Woodlands-Sugar Land
|
TX
|
649
|
|
4,077
|
|
70
|
|
649
|
|
4,147
|
|
4,796
|
|
188
|
|
1/4/2018
|
||||||||||||||||
|
Killeen-Temple
|
TX
|
203
|
|
4,065
|
|
219
|
|
203
|
|
4,284
|
|
4,487
|
|
274
|
|
2/2/2017
|
||||||||||||||||
|
Killeen-Temple
|
TX
|
1,128
|
|
6,149
|
|
217
|
|
1,128
|
|
6,366
|
|
7,494
|
|
341
|
|
8/8/2017
|
||||||||||||||||
|
Longview(3)
|
TX
|
651
|
|
671
|
|
102
|
|
651
|
|
773
|
|
1,424
|
|
204
|
|
5/1/2009
|
||||||||||||||||
|
Longview(3)
|
TX
|
104
|
|
489
|
|
164
|
|
104
|
|
653
|
|
757
|
|
163
|
|
5/1/2009
|
||||||||||||||||
|
Longview(3)
|
TX
|
310
|
|
966
|
|
201
|
|
310
|
|
1,167
|
|
1,477
|
|
296
|
|
5/1/2009
|
||||||||||||||||
|
Longview
|
TX
|
2,466
|
|
3,559
|
|
89
|
|
2,466
|
|
3,648
|
|
6,114
|
|
620
|
|
6/19/2014
|
||||||||||||||||
|
Longview
|
TX
|
959
|
|
1,640
|
|
22
|
|
959
|
|
1,662
|
|
2,621
|
|
306
|
|
6/25/2014
|
||||||||||||||||
|
McAllen–Edinburg–Mission
|
TX
|
1,217
|
|
2,738
|
|
277
|
|
1,243
|
|
3,015
|
|
4,258
|
|
715
|
|
7/31/2014
|
||||||||||||||||
|
McAllen–Edinburg–Mission
|
TX
|
1,973
|
|
4,517
|
|
58
|
|
1,973
|
|
4,575
|
|
6,548
|
|
865
|
|
9/4/2014
|
||||||||||||||||
|
McAllen–Edinburg–Mission
|
TX
|
1,295
|
|
3,929
|
|
74
|
|
1,295
|
|
4,003
|
|
5,298
|
|
741
|
|
9/4/2014
|
||||||||||||||||
|
McAllen–Edinburg–Mission
|
TX
|
3,079
|
|
7,574
|
|
88
|
|
3,079
|
|
7,662
|
|
10,741
|
|
1,523
|
|
9/4/2014
|
||||||||||||||||
|
McAllen–Edinburg–Mission
|
TX
|
1,017
|
|
3,261
|
|
69
|
|
1,017
|
|
3,330
|
|
4,347
|
|
606
|
|
9/4/2014
|
||||||||||||||||
F-50
|
Location
|
Initial Cost to Company
|
Gross Carrying Amount at Year-End
|
|||||||||||||||||||||||||||||||
|
MSA
(1)
|
State/Territory
|
Land
|
Buildings and
Improvements
|
Subsequent
Additions
|
Land
|
Buildings and
Improvements
|
Total
(2)
|
Accumulated
Depreciation
|
Date
Acquired
|
||||||||||||||||||||||||
|
McAllen–Edinburg–Mission
|
TX
|
803
|
|
2,914
|
|
79
|
|
803
|
|
2,993
|
|
3,796
|
|
443
|
|
9/4/2014
|
|||||||||||||||||
|
McAllen–Edinburg–Mission
|
TX
|
2,249
|
|
4,966
|
|
57
|
|
2,249
|
|
5,023
|
|
7,272
|
|
971
|
|
9/4/2014
|
|||||||||||||||||
|
McAllen–Edinburg–Mission
|
TX
|
1,118
|
|
3,568
|
|
70
|
|
1,118
|
|
3,638
|
|
4,756
|
|
567
|
|
9/4/2014
|
|||||||||||||||||
|
Midland(3)
|
TX
|
691
|
|
1,588
|
|
165
|
|
691
|
|
1,753
|
|
2,444
|
|
440
|
|
5/1/2009
|
|||||||||||||||||
|
Odessa(3)
|
TX
|
168
|
|
561
|
|
119
|
|
168
|
|
680
|
|
848
|
|
177
|
|
5/1/2009
|
|||||||||||||||||
|
San Angelo(3)
|
TX
|
381
|
|
986
|
|
104
|
|
381
|
|
1,090
|
|
1,471
|
|
272
|
|
5/1/2009
|
|||||||||||||||||
|
San Antonio-New Braunfels
|
TX
|
614
|
|
2,640
|
|
61
|
|
614
|
|
2,701
|
|
3,315
|
|
581
|
|
4/1/2014
|
|||||||||||||||||
|
San Antonio-New Braunfels
|
TX
|
715
|
|
4,566
|
|
69
|
|
715
|
|
4,635
|
|
5,350
|
|
227
|
|
10/19/2017
|
|||||||||||||||||
|
Washington-Arlington-Alexandria
|
VA
|
1,516
|
|
12,633
|
|
62
|
|
1,516
|
|
12,695
|
|
14,211
|
|
557
|
|
7/21/2017
|
|||||||||||||||||
|
Centralia(3)
|
WA
|
810
|
|
1,530
|
|
2
|
|
810
|
|
1,532
|
|
2,342
|
|
561
|
|
6/10/2013
|
|||||||||||||||||
|
Centralia(3)
|
WA
|
998
|
|
1,862
|
|
94
|
|
998
|
|
1,956
|
|
2,954
|
|
756
|
|
6/10/2013
|
|||||||||||||||||
|
Longview
|
WA
|
448
|
|
2,356
|
|
14
|
|
448
|
|
2,370
|
|
2,818
|
|
313
|
|
9/3/2015
|
|||||||||||||||||
|
Portland-Vancouver-Hillsboro
|
WA
|
421
|
|
2,313
|
|
2
|
|
421
|
|
2,315
|
|
2,736
|
|
474
|
|
4/1/2013
|
|||||||||||||||||
|
Portland-Vancouver-Hillsboro
|
WA
|
1,903
|
|
2,239
|
|
2
|
|
1,903
|
|
2,241
|
|
4,144
|
|
584
|
|
4/1/2013
|
|||||||||||||||||
|
Portland-Vancouver-Hillsboro(3)
|
WA
|
923
|
|
2,821
|
|
8
|
|
923
|
|
2,829
|
|
3,752
|
|
571
|
|
6/10/2013
|
|||||||||||||||||
|
Portland-Vancouver-Hillsboro
|
WA
|
935
|
|
2,045
|
|
6
|
|
935
|
|
2,051
|
|
2,986
|
|
370
|
|
4/1/2014
|
|||||||||||||||||
|
Portland-Vancouver-Hillsboro
|
WA
|
478
|
|
2,158
|
|
169
|
|
478
|
|
2,327
|
|
2,805
|
|
456
|
|
4/1/2014
|
|||||||||||||||||
|
Portland-Vancouver-Hillsboro
|
WA
|
2,023
|
|
3,484
|
|
39
|
|
2,023
|
|
3,523
|
|
5,546
|
|
722
|
|
8/27/2014
|
|||||||||||||||||
|
Portland-Vancouver-Hillsboro
|
WA
|
1,870
|
|
4,632
|
|
2
|
|
1,870
|
|
4,634
|
|
6,504
|
|
369
|
|
1/11/2017
|
|||||||||||||||||
|
Portland-Vancouver-Hillsboro
|
WA
|
422
|
|
2,271
|
|
1
|
|
422
|
|
2,272
|
|
2,694
|
|
69
|
|
3/29/2018
|
|||||||||||||||||
|
Seattle-Tacoma-Bellevue
|
WA
|
770
|
|
3,203
|
|
22
|
|
770
|
|
3,225
|
|
3,995
|
|
672
|
|
4/1/2014
|
|||||||||||||||||
|
Seattle-Tacoma-Bellevue
|
WA
|
1,390
|
|
2,506
|
|
43
|
|
1,390
|
|
2,549
|
|
3,939
|
|
555
|
|
8/27/2014
|
|||||||||||||||||
|
Seattle-Tacoma-Bellevue
|
WA
|
1,438
|
|
3,280
|
|
37
|
|
1,438
|
|
3,317
|
|
4,755
|
|
644
|
|
9/18/2014
|
|||||||||||||||||
|
Seattle-Tacoma-Bellevue
|
WA
|
1,105
|
|
2,121
|
|
9
|
|
1,105
|
|
2,130
|
|
3,235
|
|
371
|
|
10/3/2014
|
|||||||||||||||||
|
Total
|
$
|
582,960
|
|
$
|
1,981,269
|
|
$
|
72,549
|
|
$
|
583,455
|
|
$
|
2,054,268
|
|
$
|
2,637,723
|
|
$
|
246,261
|
|
||||||||||||
|
(1) Refers to metropolitan and micropolitan statistical area (MSA) as defined by the U.S. Census Bureau.
|
|||||||||||||||||||||||||||||||||
|
(2) The aggregate cost of land and depreciable property for Federal income tax purposes was approximately $2.3 billion (unaudited) at December 31, 2018.
|
|||||||||||||||||||||||||||||||||
|
(3) As of December 31, 2018, 93 of our self storage properties were encumbered by an aggregate of $268.1 million of debt financing.
|
|||||||||||||||||||||||||||||||||
|
(4) Property subject to a long-term lease agreement.
|
|||||||||||||||||||||||||||||||||
|
Note: The Company only owns one class of real estate, which is self storage properties. The estimated useful lives of the individual assets that comprise buildings and improvements range from 3 years to 40 years. The category for buildings and improvements in the table above includes furniture and equipment.
|
|||||||||||||||||||||||||||||||||
F-51
NATIONAL STORAGE AFFILIATES TRUST
SCHEDULE III-REAL ESTATE AND ACCUMULATED DEPRECIATION
For the Years Ended December 31, 2018, 2017 and 2016
(in thousands)
|
2018
|
2017
|
2016
|
||||||||||
|
Self Storage properties:
|
||||||||||||
|
Balance at beginning of year
|
$
|
2,275,233
|
|
$
|
1,844,336
|
|
$
|
1,147,201
|
|
|||
|
Acquisitions and improvements
|
366,522
|
|
431,542
|
|
715,509
|
|
||||||
|
Reclassification from assets held for sale
|
—
|
|
8,607
|
|
—
|
|
||||||
|
Write-off of fully depreciated assets and other
|
(323
|
)
|
(50
|
)
|
—
|
|
||||||
|
Dispositions
|
(3,709
|
)
|
(7,336
|
)
|
(4,820
|
)
|
||||||
|
Reclassification to assets held for sale
|
—
|
|
(1,866
|
)
|
(13,554
|
)
|
||||||
|
Balance at end of year
|
$
|
2,637,723
|
|
$
|
2,275,233
|
|
$
|
1,844,336
|
|
|||
|
Accumulated depreciation:
|
||||||||||||
|
Balance at beginning of year
|
$
|
170,358
|
|
$
|
110,803
|
|
$
|
68,100
|
|
|||
|
Depreciation expense
|
76,299
|
|
60,522
|
|
42,703
|
|
||||||
|
Write-off of fully depreciated assets and other
|
—
|
|
(10
|
)
|
—
|
|
||||||
|
Dispositions
|
(396
|
)
|
(646
|
)
|
—
|
|
||||||
|
Assets held for sale
|
$
|
—
|
|
$
|
(311
|
)
|
$
|
—
|
|
|||
|
Balance at end of year
|
$
|
246,261
|
|
$
|
170,358
|
|
$
|
110,803
|
|
|||
F-52
TABLE OF CONTENTS
Part IItem 1. BusinessItem 1A. Risk FactorsItem 1B. Unresolved Staff CommentsItem 2. PropertiesItem 3. Legal ProceedingsItem 4. Mine Safety DisclosuresPart IIItem 5. Market For The Registrant's Common Equity, Related Stockholder Matters and Issuer Purchases Of Equity SecuritiesItem 6. Selected Financial DataItem 7. Management's Discussion and Analysis Of Financial Condition and Results Of OperationsItem 7A. Quantitative and Qualitative Disclosures About Market RiskItem 8. Financial Statements and Supplementary DataItem 9. Changes in and Disagreements with Accountants on Accounting and Financial DisclosureItem 9A. Controls and ProceduresItem 9B. Other InformationPart IIIItem 10. Directors, Executive Officers and Corporate GovernanceItem 11. Executive CompensationItem 12. Security Ownership Of Certain Beneficial Owners and Management and Related Stockholder MattersItem 13. Certain Relationships and Related Transactions, and Director IndependenceItem 14. Principal Accounting Fees and ServicesPart IVItem 15. Exhibits, Financial Statement SchedulesItem 16. Form 10-k Summary