INSPERITY, INC.
10-Ks and 10-Qs
|
|
|
|
|
|
|
|
|
|
|
|
|
|
|
|
|
|
|
|
|
|
|
|
|
|
|
|
|
|
|
|
|
|
|
|
|
|
|
|
|
|
|
|
|
|
|
|
|
|
|
|
|
|
|
|
UNITED STATES
SECURITIES AND EXCHANGE COMMISSION
Washington, D.C. 20549
FORM 10-Q
(Mark One)
|
ý
|
Quarterly Report Pursuant to Section 13 or 15(d) of the Securities Exchange Act of 1934
|
|
For the quarterly period ended September 30, 2018.
|
|
|
or
|
|
|
o
|
Transition Report Pursuant to Section 13 or 15(d) of the Securities Exchange Act of 1934
|
|
For the transition period from _______________ to _______________
|
|
Commission File No. 1-13998

Insperity, Inc.
(Exact name of registrant as specified in its charter)
|
Delaware
|
|
76-0479645
|
|
(State or other jurisdiction of incorporation or organization)
|
|
(I.R.S. Employer Identification No.)
|
|
|
|
|
|
19001 Crescent Springs Drive
|
|
|
|
Kingwood, Texas
|
|
77339
|
|
(Address of principal executive offices)
|
|
(Zip Code)
|
(Registrant’s Telephone Number, Including Area Code): (281) 358-8986
Indicate by check mark whether the registrant (1) has filed all reports required to be filed by Section 13 or 15(d) of the Securities Exchange Act of 1934 during the preceding 12 months (or for such shorter period that the registrant was required to file such reports) and (2) has been subject to such filing requirements for the past 90 days. Yes
x
No
o
Indicate by check mark whether the registrant has submitted electronically every Interactive Data File required to be submitted pursuant to Rule 405 of Regulation S-T during the preceding 12 months (or for such shorter period that the registrant was required to submit such files). Yes
x
No
o
Indicate by check mark whether the registrant is a large accelerated filer, an accelerated filer, a non-accelerated filer, smaller reporting company or an emerging growth company. See definition of “large accelerated filer,” “accelerated filer”, “non-accelerated filer”, “smaller reporting company” and “emerging growth company” in Rule 12b-2 of the Exchange Act.
|
Large accelerated filer
ý
|
Accelerated filer
o
|
Non-accelerated filer
o
|
|
Smaller reporting company
o
|
Emerging growth company
o
|
|
If an emerging growth company, indicate by check mark if the registrant has elected not to use the extended transition period for complying with any new or revised financial accounting standards provided pursuant to Section 13(a) of the Exchange Act.
o
Indicate by check mark whether the registrant is a shell company (as defined in Rule 12b-2 of the Exchange Act).
Yes
o
No
x
As of
October 25, 2018
,
41,810,065
shares of the registrant’s common stock, par value $0.01 per share, were outstanding.
|
TABLE OF CONTENTS
|
|
Page
|
||
|
Part I, Item 1.
|
||
|
Part I, Item 2.
|
||
|
Part I, Item 3.
|
||
|
Part I, Item 4.
|
||
|
Part II, Item 1.
|
||
|
Part II, Item 1A.
|
||
|
Part II, Item 2.
|
||
|
Part II, Item 6.
|
||
|
FINANCIAL STATEMENTS
(Unaudited)
|
|
(in thousands)
|
September 30, 2018
|
|
December 31, 2017
|
|
|||
|
Assets
|
|||||||
|
Current assets:
|
|||||||
|
Cash and cash equivalents
|
$
|
328,299
|
|
$
|
354,260
|
|
|
|
Restricted cash
|
42,257
|
|
41,137
|
|
|||
|
Marketable securities
|
37,576
|
|
1,960
|
|
|||
|
Accounts receivable, net:
|
|||||||
|
Trade
|
3,402
|
|
12,292
|
|
|||
|
Unbilled
|
392,122
|
|
318,431
|
|
|||
|
Other
|
4,477
|
|
3,258
|
|
|||
|
400,001
|
|
333,981
|
|
||||
|
Prepaid insurance
|
13,755
|
|
10,782
|
|
|||
|
Other current assets
|
24,274
|
|
26,991
|
|
|||
|
Income taxes receivable
|
—
|
|
9,824
|
|
|||
|
Total current assets
|
846,162
|
|
778,935
|
|
|||
|
Noncurrent assets:
|
|
|
|
|
|||
|
Property and equipment, net of accumulated depreciation
|
100,681
|
|
95,659
|
|
|||
|
Other assets:
|
|||||||
|
Prepaid health insurance
|
9,000
|
|
9,000
|
|
|||
|
Deposits – health insurance
|
5,300
|
|
5,300
|
|
|||
|
Deposits – workers’ compensation
|
152,268
|
|
154,215
|
|
|||
|
Goodwill and other intangible assets, net
|
12,729
|
|
12,762
|
|
|||
|
Deferred income taxes, net
|
4,874
|
|
4,283
|
|
|||
|
Other assets
|
5,663
|
|
3,541
|
|
|||
|
Total other assets
|
189,834
|
|
189,101
|
|
|||
|
Total noncurrent assets
|
290,515
|
|
284,760
|
|
|||
|
Total assets
|
$
|
1,136,677
|
|
$
|
1,063,695
|
|
|
|
Insperity | 2018 Third Quarter Form 10-Q
|
3
|
|
|
FINANCIAL STATEMENTS
(Unaudited)
|
CONSOLIDATED BALANCE SHEETS (Continued)
|
(in thousands)
|
September 30, 2018
|
|
December 31, 2017
|
|
|||
|
Liabilities and stockholders’ equity
|
|||||||
|
Current liabilities:
|
|||||||
|
Accounts payable
|
$
|
5,316
|
|
$
|
6,447
|
|
|
|
Payroll taxes and other payroll deductions payable
|
204,086
|
|
303,247
|
|
|||
|
Accrued worksite employee payroll cost
|
340,115
|
|
267,402
|
|
|||
|
Accrued health insurance costs
|
33,458
|
|
26,075
|
|
|||
|
Accrued workers’ compensation costs
|
45,773
|
|
42,974
|
|
|||
|
Accrued corporate payroll and commissions
|
43,849
|
|
52,595
|
|
|||
|
Other accrued liabilities
|
24,600
|
|
27,741
|
|
|||
|
Income taxes payable
|
61
|
|
—
|
|
|||
|
Total current liabilities
|
697,258
|
|
726,481
|
|
|||
|
Noncurrent liabilities:
|
|
|
|||||
|
Accrued workers’ compensation costs
|
183,099
|
|
166,493
|
|
|||
|
Long-term debt
|
104,400
|
|
104,400
|
|
|||
|
Total noncurrent liabilities
|
287,499
|
|
270,893
|
|
|||
|
Commitments and contingencies
|
|
|
|
|
|||
|
Stockholders’ equity:
|
|
|
|
|
|||
|
Common stock
|
555
|
|
555
|
|
|||
|
Additional paid-in capital
|
32,047
|
|
25,337
|
|
|||
|
Treasury stock, at cost
|
(262,187
|
)
|
(256,363
|
)
|
|||
|
Retained earnings
|
381,505
|
|
296,792
|
|
|||
|
Total stockholders’ equity
|
151,920
|
|
66,321
|
|
|||
|
Total liabilities and stockholders’ equity
|
$
|
1,136,677
|
|
$
|
1,063,695
|
|
|
See accompanying notes.
|
Insperity | 2018 Third Quarter Form 10-Q
|
4
|
|
|
FINANCIAL STATEMENTS
(Unaudited)
|
|
Three Months Ended September 30,
|
Nine Months Ended
September 30, |
||||||||||||
|
(in thousands, except per share amounts)
|
2018
|
2017
|
2018
|
2017
|
|||||||||
|
Revenues
(1)
|
$
|
925,126
|
|
$
|
795,513
|
|
$
|
2,861,793
|
|
$
|
2,473,729
|
|
|
|
Payroll taxes, benefits and workers’ compensation costs
|
759,072
|
|
655,547
|
|
2,341,475
|
|
2,043,864
|
|
|||||
|
Gross profit
|
166,054
|
|
139,966
|
|
520,318
|
|
429,865
|
|
|||||
|
Salaries, wages and payroll taxes
|
70,552
|
|
65,223
|
|
226,486
|
|
189,138
|
|
|||||
|
Stock-based compensation
|
5,769
|
|
6,584
|
|
14,656
|
|
16,390
|
|
|||||
|
Commissions
|
6,818
|
|
5,675
|
|
19,863
|
|
15,815
|
|
|||||
|
Advertising
|
3,846
|
|
3,476
|
|
13,996
|
|
13,623
|
|
|||||
|
General and administrative expenses
|
25,294
|
|
24,513
|
|
82,565
|
|
75,315
|
|
|||||
|
Depreciation and amortization
|
5,642
|
|
4,696
|
|
16,335
|
|
13,355
|
|
|||||
|
Total operating expenses
|
117,921
|
|
110,167
|
|
373,901
|
|
323,636
|
|
|||||
|
Operating income
|
48,133
|
|
29,799
|
|
146,417
|
|
106,229
|
|
|||||
|
Other income (expense):
|
|
|
|
|
|
|
|
|
|||||
|
Interest income
|
2,028
|
|
1,015
|
|
5,291
|
|
2,158
|
|
|||||
|
Interest expense
|
(1,174
|
)
|
(894
|
)
|
(3,352
|
)
|
(2,320
|
)
|
|||||
|
Income before income tax expense
|
48,987
|
|
29,920
|
|
148,356
|
|
106,067
|
|
|||||
|
Income tax expense
|
12,780
|
|
10,718
|
|
37,598
|
|
37,219
|
|
|||||
|
Net income
|
$
|
36,207
|
|
$
|
19,202
|
|
$
|
110,758
|
|
$
|
68,848
|
|
|
|
Less distributed and undistributed earnings allocated to participating securities
|
(503
|
)
|
(337
|
)
|
(1,546
|
)
|
(1,233
|
)
|
|||||
|
Net income allocated to common shares
|
$
|
35,704
|
|
$
|
18,865
|
|
$
|
109,212
|
|
$
|
67,615
|
|
|
|
Net income per share of common stock
|
|||||||||||||
|
Basic
|
$
|
0.86
|
|
$
|
0.46
|
|
$
|
2.64
|
|
$
|
1.65
|
|
|
|
Diluted
|
$
|
0.86
|
|
$
|
0.46
|
|
$
|
2.63
|
|
$
|
1.64
|
|
|
____________________________________
|
(1)
|
Revenues are comprised of gross billings less worksite employee (“WSEE”) payroll costs as follows:
|
|
Three Months Ended September 30,
|
Nine Months Ended September 30,
|
||||||||||||
|
(in thousands)
|
2018
|
2017
|
2018
|
2017
|
|||||||||
|
Gross billings
|
$
|
5,810,779
|
|
$
|
4,898,333
|
|
$
|
17,284,477
|
|
$
|
14,655,545
|
|
|
|
Less: WSEE payroll cost
|
4,885,653
|
|
4,102,820
|
|
14,422,684
|
|
12,181,816
|
|
|||||
|
Revenues
|
$
|
925,126
|
|
$
|
795,513
|
|
$
|
2,861,793
|
|
$
|
2,473,729
|
|
|
See accompanying notes.
|
Insperity | 2018 Third Quarter Form 10-Q
|
5
|
|
|
FINANCIAL STATEMENTS
(Unaudited)
|
|
Nine Months Ended September 30,
|
|||||||
|
(in thousands)
|
2018
|
2017
|
|||||
|
Cash flows from operating activities
|
|||||||
|
Net income
|
$
|
110,758
|
|
$
|
68,848
|
|
|
|
Adjustments to reconcile net income to net cash provided by operating activities:
|
|||||||
|
Depreciation and amortization
|
16,335
|
|
13,355
|
|
|||
|
Stock-based compensation
|
14,656
|
|
16,390
|
|
|||
|
Deferred income taxes
|
(591
|
)
|
5,820
|
|
|||
|
Changes in operating assets and liabilities:
|
|||||||
|
Accounts receivable
|
(66,020
|
)
|
(32,007
|
)
|
|||
|
Prepaid insurance
|
(2,973
|
)
|
(3,937
|
)
|
|||
|
Other current assets
|
2,717
|
|
266
|
|
|||
|
Other assets
|
(1,760
|
)
|
(3,195
|
)
|
|||
|
Accounts payable
|
(1,131
|
)
|
(1,119
|
)
|
|||
|
Payroll taxes and other payroll deductions payable
|
(99,161
|
)
|
(62,310
|
)
|
|||
|
Accrued worksite employee payroll expense
|
72,713
|
|
41,488
|
|
|||
|
Accrued health insurance costs
|
7,383
|
|
8,183
|
|
|||
|
Accrued workers’ compensation costs
|
19,405
|
|
20,180
|
|
|||
|
Accrued corporate payroll, commissions and other accrued liabilities
|
(11,887
|
)
|
(7,639
|
)
|
|||
|
Income taxes payable/receivable
|
9,885
|
|
4,071
|
|
|||
|
Total adjustments
|
(40,429
|
)
|
(454
|
)
|
|||
|
Net cash provided by operating activities
|
70,329
|
|
68,394
|
|
|||
|
Cash flows from investing activities
|
|
|
|
|
|||
|
Marketable securities:
|
|
|
|
|
|||
|
Purchases
|
(54,754
|
)
|
(1,337
|
)
|
|||
|
Proceeds from dispositions
|
16,299
|
|
—
|
|
|||
|
Proceeds from maturities
|
2,650
|
|
1,181
|
|
|||
|
Property and equipment:
|
|||||||
|
Purchases
|
(21,519
|
)
|
(26,518
|
)
|
|||
|
Net cash used in investing activities
|
(57,324
|
)
|
(26,674
|
)
|
|||
|
Cash flows from financing activities
|
|||||||
|
Purchase of treasury stock
|
(16,236
|
)
|
(27,172
|
)
|
|||
|
Dividends paid
|
(25,170
|
)
|
(17,831
|
)
|
|||
|
Other
|
1,613
|
|
1,177
|
|
|||
|
Net cash used in financing activities
|
(39,793
|
)
|
(43,826
|
)
|
|||
|
Net decrease in cash, cash equivalents and restricted cash
|
(26,788
|
)
|
(2,106
|
)
|
|||
|
Cash, cash equivalents and restricted cash beginning of period
|
549,612
|
|
472,609
|
|
|||
|
Cash, cash equivalents and restricted cash end of period
|
$
|
522,824
|
|
$
|
470,503
|
|
|
|
Insperity | 2018 Third Quarter Form 10-Q
|
6
|
|
|
FINANCIAL STATEMENTS
(Unaudited)
|
CONSOLIDATED STATEMENTS OF CASH FLOWS (Continued)
|
Nine Months Ended September 30,
|
|||||||
|
(in thousands)
|
2018
|
2017
|
|||||
|
Supplemental schedule of cash and cash equivalents and restricted cash
|
|||||||
|
Cash and cash equivalents
|
$
|
354,260
|
|
$
|
286,034
|
|
|
|
Restricted cash
|
41,137
|
|
42,637
|
|
|||
|
Deposits – workers’ compensation
|
154,215
|
|
143,938
|
|
|||
|
Cash, cash equivalents and restricted cash beginning of period
|
$
|
549,612
|
|
$
|
472,609
|
|
|
|
Cash and cash equivalents
|
$
|
328,299
|
|
$
|
285,934
|
|
|
|
Restricted cash
|
42,257
|
|
41,748
|
|
|||
|
Deposits – workers’ compensation
|
152,268
|
|
142,821
|
|
|||
|
Cash, cash equivalents and restricted cash end of period
|
$
|
522,824
|
|
$
|
470,503
|
|
|
See accompanying notes.
|
Insperity | 2018 Third Quarter Form 10-Q
|
7
|
|
|
FINANCIAL STATEMENTS
(Unaudited)
|
CONSOLIDATED STATEMENT OF STOCKHOLDERS’ EQUITY
|
Common Stock Issued
|
Additional Paid-In Capital
|
Treasury Stock
|
Retained Earnings and AOCI
|
Total
|
|||||||||||||
|
(in thousands)
|
Shares
|
Amount
|
|||||||||||||||
|
Balance at December 31, 2017
|
55,489
|
|
$
|
555
|
|
$
|
25,337
|
|
$
|
(256,363
|
)
|
$
|
296,792
|
|
$
|
66,321
|
|
|
Purchase of treasury stock, at cost
|
—
|
|
—
|
|
—
|
|
(16,236
|
)
|
—
|
|
(16,236
|
)
|
|||||
|
Issuance of long-term incentive awards and dividend equivalents
|
—
|
|
—
|
|
(5,764
|
)
|
6,619
|
|
(855
|
)
|
—
|
|
|||||
|
Stock-based compensation expense
|
—
|
|
—
|
|
11,293
|
|
3,363
|
|
—
|
|
14,656
|
|
|||||
|
Other
|
—
|
|
—
|
|
1,181
|
|
430
|
|
—
|
|
1,611
|
|
|||||
|
Dividends paid
|
—
|
|
—
|
|
—
|
|
—
|
|
(25,170
|
)
|
(25,170
|
)
|
|||||
|
Unrealized loss on marketable securities, net of tax
|
—
|
|
—
|
|
—
|
|
—
|
|
(20
|
)
|
(20
|
)
|
|||||
|
Net income
|
—
|
|
—
|
|
—
|
|
—
|
|
110,758
|
|
110,758
|
|
|||||
|
Balance at September 30, 2018
|
55,489
|
|
$
|
555
|
|
$
|
32,047
|
|
$
|
(262,187
|
)
|
$
|
381,505
|
|
$
|
151,920
|
|
See accompanying notes.
|
Insperity | 2018 Third Quarter Form 10-Q
|
8
|
|
|
NOTES TO CONSOLIDATED FINANCIAL STATEMENTS
(Unaudited)
|
|
1.
|
Basis of Presentation
|
Insperity, Inc., a Delaware corporation (“Insperity,” “we,” “our,” and “us”), provides an array of human resources (“HR”) and business solutions designed to help improve business performance. Our most comprehensive HR services offerings are provided through our professional employer organization (“PEO”) services, known as Workforce Optimization
®
and Workforce Synchronization
TM
solutions (together, our “PEO HR Outsourcing solutions”), which encompass a broad range of HR functions, including payroll and employment administration, employee benefits, workers’ compensation, government compliance, performance management, and training and development services, along with our cloud-based human capital management solution, the Insperity Premier
TM
platform.
In addition to our PEO HR Outsourcing solutions, we also offer a comprehensive traditional payroll and human capital management solution, known as Workforce Acceleration. We also offer a number of other business performance solutions, including Time and Attendance, Performance Management, Organizational Planning, Recruiting Services, Employment Screening, Expense Management, Retirement Services and Insurance Services, many of which are offered as a cloud-based software solution and are offered separately or with our other solutions.
The Consolidated Financial Statements include the accounts of Insperity and its wholly owned subsidiaries. Intercompany accounts and transactions have been eliminated in consolidation.
The preparation of financial statements in conformity with accounting principles generally accepted in the United States (“GAAP”) requires management to make estimates and assumptions that affect the amounts reported in the financial statements and accompanying notes. Actual results could differ from those estimates.
The accompanying Consolidated Financial Statements should be read in conjunction with our audited Consolidated Financial Statements at and for the year ended
December 31, 2017
. Our Consolidated Balance Sheet at
December 31, 2017
has been derived from the audited financial statements at that date, but does not include all of the information or footnotes required by GAAP for complete financial statements. Our Consolidated Balance Sheet at
September 30, 2018
and our Consolidated Statements of Operations for the
three and nine
month periods ended
September 30, 2018
and
2017
, our Consolidated Statements of Cash Flows for the
nine
month periods ended
September 30, 2018
and
2017
and our Consolidated Statement of Stockholders’ Equity for the
nine
month period ended
September 30, 2018
, have been prepared by us without audit. In the opinion of management, all adjustments, consisting only of normal recurring adjustments necessary to present fairly the consolidated financial position, results of operations and cash flows, have been made. Certain prior year amounts have been reclassified to conform to the
2018
presentation.
The results of operations for the interim periods are not necessarily indicative of the operating results for a full year or of future operations.
|
2.
|
Accounting Policies
|
Health Insurance Costs
We provide group health insurance coverage to our WSEEs in our PEO HR Outsourcing solutions through a national network of carriers, including UnitedHealthcare (“United”), UnitedHealthcare of California, Kaiser Permanente, Blue Shield of California, HMSA BlueCross BlueShield of Hawaii, and Tufts, all of which provide fully insured policies or service contracts.
The policy with United provides the majority of our health insurance coverage. As a result of certain contractual terms, we have accounted for this plan since its inception using a partially self-funded insurance accounting model. Accordingly, we record the costs of the United plan, including an estimate of the incurred claims, taxes and administrative fees (collectively the “Plan Costs”) as benefits expense, which is a component of direct costs, in our Consolidated Statements of Operations. The estimated incurred claims are based upon: (1) the level of claims processed during the quarter; (2) estimated completion rates based upon recent claim development patterns under the plan; and (3) the number of participants in the plan, including both active and COBRA enrollees. Each reporting period, changes in the estimated ultimate costs resulting from claim trends, plan design and migration, participant demographics and other factors are incorporated into the benefits costs.
|
Insperity | 2018 Third Quarter Form 10-Q
|
9
|
|
|
NOTES TO CONSOLIDATED FINANCIAL STATEMENTS
(Unaudited)
|
Additionally, since the plan’s inception, under the terms of the contract, United establishes cash funding rates
90
days in advance of the beginning of a reporting quarter. If the Plan Costs for a reporting quarter are greater than the premiums paid and owed to United, a deficit in the plan would be incurred and a liability for the excess costs would be accrued in our Consolidated Balance Sheets. On the other hand, if the Plan Costs for the reporting quarter are less than the premiums paid and owed to United, a surplus in the plan would be incurred and we would record an asset for the excess premiums in our Consolidated Balance Sheets. The terms of the arrangement require us to maintain an accumulated cash surplus in the plan of
$9.0 million
, which is reported as long-term prepaid insurance. In addition, United requires a deposit equal to approximately one day of claims funding activity, which was
$5.1 million
as of
September 30, 2018
, and is reported as a long-term asset. As of
September 30, 2018
, Plan Costs were less than the net premiums paid and owed to United by
$18.9 million
. As this amount is
in excess of
the agreed-upon
$9.0 million
surplus maintenance level, the
$9.9 million
difference is included in
prepaid health insurance, a current asset
, in our Consolidated Balance Sheets. The premiums, including the additional quarterly premiums, owed to United at
September 30, 2018
were
$28.5 million
, which is included in accrued health insurance costs, a current liability in our Consolidated Balance Sheets. Our benefits costs incurred in the first
nine
months of
2018
included
a reduction
of
$1.3 million
for changes in estimated run-off related to prior periods. Our benefits costs incurred in the first
nine
months of
2017
included an increase of
$1.0 million
for changes in estimated run-off related to prior periods.
Workers’ Compensation Costs
Our workers’ compensation coverage for our WSEEs in our PEO HR Outsourcing solutions has been provided through an arrangement with the Chubb Group of Insurance Companies or its predecessors (the “Chubb Program”) since 2007. The Chubb Program is fully insured in that Chubb has the responsibility to pay all claims incurred under the policy regardless of whether we satisfy our responsibilities. Under the Chubb Program, we have financial responsibility to Chubb for the first
$1 million
layer of claims per occurrence and, for claims over $1 million, up to a maximum aggregate amount of
$5 million
per policy year for claims that exceed
$1 million
. Chubb bears the financial responsibility for all claims in excess of these levels.
Because we bear the financial responsibility for claims up to the levels noted above, such claims, which are the primary component of our workers’ compensation costs, are recorded in the period incurred. Workers’ compensation insurance includes ongoing health care and indemnity coverage whereby claims are paid over numerous years following the date of injury. Accordingly, the accrual of related incurred costs in each reporting period includes estimates, which take into account the ongoing development of claims and therefore requires a significant level of judgment.
We utilize a third-party actuary to estimate our loss development rate, which is primarily based upon the nature of WSEEs job responsibilities, the location of WSEEs, the historical frequency and severity of workers’ compensation claims, and an estimate of future cost trends. Each reporting period, changes in the actuarial assumptions resulting from changes in actual claims experience and other trends are incorporated into our workers’ compensation claims cost estimates. During the
nine
months ended
September 30,
2018
and
2017
, we reduced accrued workers’ compensation costs by
$13.4 million
and
$11.0 million
, respectively, for changes in estimated losses related to prior reporting periods. Workers’ compensation cost estimates are discounted to present value at a rate based upon the U.S. Treasury rates that correspond with the weighted average estimated claim payout period (the average discount rate utilized in the
2018
period was
2.5%
and in the
2017
period was
1.5%
) and are accreted over the estimated claim payment period and included as a component of direct costs in our Consolidated Statements of Operations.
|
Insperity | 2018 Third Quarter Form 10-Q
|
10
|
|
|
NOTES TO CONSOLIDATED FINANCIAL STATEMENTS
(Unaudited)
|
The following table provides the activity and balances related to incurred but not paid workers’ compensation claims:
|
Nine Months Ended September 30,
|
|||||||
|
(in thousands)
|
2018
|
2017
|
|||||
|
Beginning balance, January 1,
|
$
|
207,630
|
|
$
|
183,928
|
|
|
|
Accrued claims
|
54,744
|
|
52,133
|
|
|||
|
Present value discount
|
(5,372
|
)
|
(3,048
|
)
|
|||
|
Paid claims
|
(31,645
|
)
|
(29,574
|
)
|
|||
|
Ending balance
|
$
|
225,357
|
|
$
|
203,439
|
|
|
|
Current portion of accrued claims
|
$
|
42,258
|
|
$
|
41,748
|
|
|
|
Long-term portion of accrued claims
|
183,099
|
|
161,691
|
|
|||
|
Total accrued claims
|
$
|
225,357
|
|
$
|
203,439
|
|
|
The current portion of accrued workers’ compensation costs on our Consolidated Balance Sheets at
September 30, 2018
includes
$3.5 million
of workers’ compensation administrative fees.
As of
September 30, 2018
and
2017
, the undiscounted accrued workers’ compensation costs were
$241.3 million
and
$215.0 million
, respectively.
At the beginning of each policy period, the workers’ compensation insurance carrier establishes monthly funding requirements comprised of premium costs and funds to be set aside for payment of future claims (“claim funds”). The level of claim funds is primarily based upon anticipated WSEE payroll levels and expected workers’ compensation loss rates, as determined by the insurance carrier. Monies funded into the program for incurred claims expected to be paid within
one year
are recorded as restricted cash, a short-term asset, while the remainder of claim funds are included in deposits – workers’ compensation, a long-term asset in our Consolidated Balance Sheets. During the first
nine
months of
2018
and
2017
, we received
$19.4 million
and
$22.7 million
, respectively, for the return of excess claim funds related to the workers’ compensation program, which resulted in a net decrease to deposits - workers’ compensation. As of
September 30, 2018
, we had restricted cash of
$42.3 million
and deposits – workers’ compensation of
$152.3 million
.
Our estimate of incurred claim costs expected to be paid within
one year
is included in short-term liabilities, while our estimate of incurred claim costs expected to be paid beyond one year is included in long-term liabilities on our Consolidated Balance Sheets.
Recently Adopted Accounting Standards
On January 1, 2018, we adopted Accounting Standards Update (“ASU”) No. 2014-09,
Revenue from Contracts with Customers (Topic 606)
using the modified retrospective approach. Under this method, the guidance is applied only to the most current period presented in the financial statements. ASU No. 2014-09 outlines a single comprehensive revenue recognition model for revenue arising from contracts with customers and superseded most of the previous revenue recognition guidance, including industry-specific guidance. Under ASU No. 2014-09, an entity recognizes revenue for the transfer of promised goods or services to customers in an amount that reflects the consideration for which the entity expects to be entitled in exchange for those goods or services. Our revenue recognition policies remained substantially unchanged as a result of adoption ASU No. 2014-09 and we did not have any significant changes in our business processes or systems.
We enter into contracts with our customers for human resources services based on a stated rate and price in the contract. Our contracts generally have a term of 12 months, but are cancellable at any time by either party with 30-days’ notice. Our performance obligations are satisfied as services are rendered each month. The term between invoicing and when our performance obligations are satisfied is not significant. Payment terms are typically due concurrently with the invoicing of our PEO services. We do not have significant financing components or significant payment terms.
|
Insperity | 2018 Third Quarter Form 10-Q
|
11
|
|
|
NOTES TO CONSOLIDATED FINANCIAL STATEMENTS
(Unaudited)
|
Our revenue is generally recognized ratably over the payroll period as WSEEs perform their service at the client worksite. Customers are invoiced concurrently with each periodic payroll of its WSEEs. Revenues that have been recognized but not invoiced are included in unbilled accounts receivable on our Consolidated Balance Sheets.
Pursuant to the “practical expedients” provided under ASU No 2014-09, we expense sales commissions when incurred because the terms of our contracts are cancellable by either party with a 30-day notice. These costs are recorded in commissions in our Consolidated Statements of Operations.
Our revenue for our PEO HR Outsourcing solutions by geographic region and for our other products and services offerings are as follows:
|
Three Months Ended September 30,
|
Nine Months Ended September 30,
|
||||||||||||||||
|
(in thousands)
|
2018
|
2017
|
% Change
|
2018
|
2017
|
% Change
|
|||||||||||
|
Northeast
|
$
|
237,076
|
|
$
|
204,318
|
|
16.0
|
%
|
$
|
748,717
|
|
$
|
644,703
|
|
16.1
|
%
|
|
|
Southeast
|
109,552
|
|
92,646
|
|
18.2
|
%
|
333,004
|
|
283,501
|
|
17.5
|
%
|
|||||
|
Central
|
155,184
|
|
131,978
|
|
17.6
|
%
|
476,277
|
|
405,854
|
|
17.4
|
%
|
|||||
|
Southwest
|
217,946
|
|
184,572
|
|
18.1
|
%
|
664,731
|
|
573,773
|
|
15.9
|
%
|
|||||
|
West
|
192,011
|
|
169,321
|
|
13.4
|
%
|
599,617
|
|
527,217
|
|
13.7
|
%
|
|||||
|
911,769
|
|
782,835
|
|
16.5
|
%
|
2,822,346
|
|
2,435,048
|
|
15.9
|
%
|
||||||
|
Other revenue
|
13,357
|
|
12,678
|
|
5.4
|
%
|
39,447
|
|
38,681
|
|
2.0
|
%
|
|||||
|
Total revenue
|
$
|
925,126
|
|
$
|
795,513
|
|
16.3
|
%
|
$
|
2,861,793
|
|
$
|
2,473,729
|
|
15.7
|
%
|
|
In November 2016, the Financial Accounting Standards Board (“FASB”) issued ASU 2016-18,
Statement of Cash Flows (Topic 230), Restricted Cash
, clarifying the classification and presentation of changes in restricted cash on the statement of cash flows. The amendments in this ASU require that a statement of cash flows explain the change during the period in the total of cash, cash equivalents and restricted cash. Therefore, amounts generally described as restricted cash should be included with cash and cash equivalents when reconciling the beginning period and ending period total amounts shown on the statement of cash flows. As a result of our adoption of the new guidance, in the first quarter of 2018, our beginning and ending cash balances on the Consolidated Statements of Cash Flows now include restricted cash and long-term workers compensation deposits and prior period balances were retrospectively adjusted. Restricted cash and long-term workers compensation deposits are cash deposits funded to secure future claim payments under our workers compensation program and are considered restricted under Topic 230.
In March 2018, the FASB issued ASU 2018-05,
Income Taxes (Topic 740): Amendments to SEC Paragraph Pursuant to SEC Staff Accounting Bulletin No. 118 (SEC Update).
ASU 2018-05 adds the SEC guidance released on December 22, 2017 regarding the U.S. tax reform to the FASB Accounting Standards Codification. At
September 30, 2018
, we have not made a material adjustment to the provisional tax provision recorded under ASU 2018-05 at December 31, 2017. In addition, we have considered the impact of the statutory changes from the Act in our estimated tax rate for 2018, including reasonable estimates of those provisions effective for the 2018 tax year.
New Accounting Pronouncements
In February 2016, the FASB issued ASU No. 2016-02,
Leases
. The new standard requires recognition of lease assets and lease liabilities for leases previously classified as operating leases. The guidance is effective for fiscal years beginning after December 15, 2018. We are currently reviewing the guidance and assessing the impact on our consolidated financial statements.
|
Insperity | 2018 Third Quarter Form 10-Q
|
12
|
|
|
NOTES TO CONSOLIDATED FINANCIAL STATEMENTS
(Unaudited)
|
|
3.
|
Cash, Cash Equivalents and Marketable Securities
|
The following table summarizes our cash and investments in cash equivalents and marketable securities held by investment managers and overnight investments:
|
September 30, 2018
|
December 31, 2017
|
||||||||||||||||||
|
(in thousands)
|
Cash & Cash Equivalents
|
Marketable Securities
|
Total
|
Cash & Cash Equivalents
|
Marketable Securities
|
Total
|
|||||||||||||
|
Overnight holdings
|
$
|
270,172
|
|
$
|
—
|
|
$
|
270,172
|
|
$
|
338,112
|
|
$
|
—
|
|
$
|
338,112
|
|
|
|
Investments holdings
|
43,989
|
|
37,576
|
|
81,565
|
|
22,634
|
|
1,960
|
|
24,594
|
|
|||||||
|
Cash in demand accounts
|
29,585
|
|
—
|
|
29,585
|
|
26,700
|
|
—
|
|
26,700
|
|
|||||||
|
Outstanding checks
|
(15,447
|
)
|
—
|
|
(15,447
|
)
|
(33,186
|
)
|
—
|
|
(33,186
|
)
|
|||||||
|
Total
|
$
|
328,299
|
|
$
|
37,576
|
|
$
|
365,875
|
|
$
|
354,260
|
|
$
|
1,960
|
|
$
|
356,220
|
|
|
Our cash and overnight holdings fluctuate based on the timing of clients’ payroll processing cycles. Included in the cash, cash equivalents and marketable securities at
September 30, 2018
and
December 31, 2017
are
$181.3 million
and
$271.5 million
, respectively, of funds associated with federal and state income tax withholdings, employment taxes and other payroll deductions, as well as
$18.0 million
and
$23.6 million
in client prepayments, respectively.
|
4.
|
Fair Value Measurements
|
We account for our financial assets in accordance with Accounting Standard Codification 820,
Fair Value Measurement
. This standard defines fair value, establishes a framework for measuring fair value and expands disclosures about fair value measurements. The fair value measurement disclosures are grouped into three levels based on valuation factors:
|
•
|
Level 1 - quoted prices in active markets using identical assets
|
|
•
|
Level 2 - significant other observable inputs, such as quoted prices for similar assets or liabilities, quoted prices in markets that are not active, or other observable inputs
|
|
•
|
Level 3 - significant unobservable inputs
|
Fair Value of Instruments Measured and Recognized at Fair Value
The following table summarizes the levels of fair value measurements of our financial assets:
|
September 30, 2018
|
December 31, 2017
|
||||||||||||||||||
|
(in thousands)
|
Total
|
Level 1
|
Level 2
|
Total
|
Level 1
|
Level 2
|
|||||||||||||
|
Money market funds
|
$
|
314,161
|
|
$
|
314,161
|
|
$
|
—
|
|
$
|
360,746
|
|
$
|
360,746
|
|
$
|
—
|
|
|
|
U.S. Treasury bills
|
20,867
|
|
—
|
|
20,867
|
|
—
|
|
—
|
|
—
|
|
|||||||
|
Municipal bonds
|
16,709
|
|
—
|
|
16,709
|
|
1,960
|
|
—
|
|
1,960
|
|
|||||||
|
Total
|
$
|
351,737
|
|
$
|
314,161
|
|
$
|
37,576
|
|
$
|
362,706
|
|
$
|
360,746
|
|
$
|
1,960
|
|
|
Our valuation techniques used to measure fair value for these securities during the period consisted primarily of third-party pricing services that utilized actual market data such as trades of comparable bond issues, broker/dealer quotations for the same or similar investments in active markets and other observable inputs.
|
Insperity | 2018 Third Quarter Form 10-Q
|
13
|
|
|
NOTES TO CONSOLIDATED FINANCIAL STATEMENTS
(Unaudited)
|
The following is a summary of our available-for-sale marketable securities:
|
(in thousands)
|
Amortized Cost
|
Gross Unrealized Gains
|
Gross Unrealized Losses
|
Estimated Fair Value
|
||||||||
|
September 30, 2018
|
||||||||||||
|
U.S. Treasury bills
|
$
|
20,869
|
|
$
|
—
|
|
$
|
(2
|
)
|
$
|
20,867
|
|
|
Municipal bonds
|
16,732
|
|
—
|
|
(23
|
)
|
16,709
|
|
||||
|
Total
|
$
|
37,601
|
|
$
|
—
|
|
$
|
(25
|
)
|
$
|
37,576
|
|
|
December 31, 2017
|
||||||||||||
|
U.S. Treasury bills
|
$
|
—
|
|
$
|
—
|
|
$
|
—
|
|
$
|
—
|
|
|
Municipal bonds
|
1,965
|
|
—
|
|
(5
|
)
|
1,960
|
|
||||
|
Total
|
$
|
1,965
|
|
$
|
—
|
|
$
|
(5
|
)
|
$
|
1,960
|
|
As of
September 30, 2018
, the contractual maturities of our marketable securities were as follows:
|
(in thousands)
|
Amortized Cost
|
Estimated Fair Value
|
||||
|
Less than one year
|
$
|
37,601
|
|
$
|
37,576
|
|
|
One to five years
|
—
|
|
—
|
|
||
|
Total
|
$
|
37,601
|
|
$
|
37,576
|
|
Fair Value of Other Financial Instruments
The carrying amounts of cash, cash equivalents, restricted cash, accounts receivable, deposits and accounts payable approximate their fair values due to the short-term maturities of these instruments.
As of
September 30, 2018
, the carrying value of borrowings under our revolving credit facility approximates fair value and was classified as Level 2 in the fair value hierarchy. Please read
Note 5
, “
Long-Term Debt
,” for additional information.
|
5.
|
|
We have a revolving credit facility (the “Facility”) with borrowing capacity up to
$350 million
. The Facility may be increased to
$400 million
based on the terms and subject to the conditions set forth in the agreement relating to the Facility (the “Credit Agreement”). The Facility is available for working capital and general corporate purposes, including acquisitions, stock repurchases and issuances of letters of credit. Our obligations under the Facility are secured by
65%
of the stock of our captive insurance subsidiary and are guaranteed by all of our domestic subsidiaries. At
September 30, 2018
, our outstanding balance on the Facility was
$104.4 million
, and we had an outstanding
$1.0 million
letter of credit issued under the Facility, providing us with an available borrowing capacity of
$244.6 million
.
The Facility matures on
February 6, 2023
. Borrowings under the Facility bear interest at an
alternate base rate
or
LIBOR
, at our option, plus an applicable margin. Depending on our leverage ratio, the applicable margin varies (1) in the case of LIBOR loans, from
1.50%
to
2.25%
and (2) in the case of
alternate base rate
loans, from
0.00%
to
0.50%
. The alternate base rate is the highest of (1) the prime rate most recently published in The Wall Street Journal, (2) the federal funds rate plus
0.50%
and (3) the 30-day LIBOR rate plus
2.00%
. We also pay an unused commitment fee on the average daily unused portion of the Facility at a rate of
0.25%
. The interest rate at
September 30, 2018
was
3.76%
. Interest expense and unused commitment fees are recorded in other income (expense).
The Facility contains both affirmative and negative covenants that we believe are customary for arrangements of this nature. Covenants include, but are not limited to, limitations on our ability to incur additional indebtedness, sell
|
Insperity | 2018 Third Quarter Form 10-Q
|
14
|
|
|
NOTES TO CONSOLIDATED FINANCIAL STATEMENTS
(Unaudited)
|
material assets, retire, redeem or otherwise reacquire our capital stock, acquire the capital stock or assets of another business, make investments and pay dividends. In addition, the Credit Agreement requires us to comply with financial covenants limiting our total funded debt, minimum interest coverage ratio and maximum leverage ratio. We were in compliance with all financial covenants under the Credit Agreement at
September 30, 2018
.
|
6.
|
Stockholders' Equity
|
During the first
nine
months of
2018
, we repurchased or withheld an aggregate of
211,972
shares of our common stock, as described below.
Two-for-One Stock Split
On December 18, 2017, we effected a two-for-one stock split in the form 100% stock dividend.
Repurchase Program
Our Board of Directors (the “Board”) has authorized a program to repurchase shares of our outstanding common stock (“Repurchase Program”). The purchases are to be made from time to time in the open market or directly from stockholders at prevailing market prices based on market conditions and other factors. During the
nine months ended September 30, 2018
,
80,000
shares were repurchased under the Repurchase Program. As of
September 30, 2018
, we were authorized to repurchase an additional
2,597,564
shares under the Repurchase Program.
Withheld Shares
During the
nine
months ended
September 30, 2018
, we withheld
131,972
shares to satisfy tax withholding obligations for the vesting of long-term incentive and restricted stock awards.
Dividends
The Board declared quarterly dividends as follows:
|
(amounts per share)
|
2018
|
|
2017
|
|
|||
|
First quarter
|
$
|
0.20
|
|
$
|
0.125
|
|
|
|
Second quarter
|
0.20
|
|
0.150
|
|
|||
|
Third quarter
|
0.20
|
|
0.150
|
|
|||
During the
nine months ended September 30, 2018
and
2017
, we paid dividends totaling
$25.2 million
and
$17.8 million
, respectively.
|
7.
|
Net Income Per Share
|
We utilize the two-class method to compute net income per share. The two-class method allocates a portion of net income to participating securities, which includes unvested awards of share-based payments with non-forfeitable rights to receive dividends. Net income allocated to unvested share-based payments is excluded from net income allocated to common shares. Any undistributed losses resulting from dividends exceeding net income are not allocated to participating securities. Basic net income per share is computed by dividing net income allocated to common shares by the weighted average number of common shares outstanding during the period. Diluted net income per share is computed by dividing net income allocated to common shares by the weighted average number of common shares outstanding during the period, plus the dilutive effect of outstanding stock options.
|
Insperity | 2018 Third Quarter Form 10-Q
|
15
|
|
|
NOTES TO CONSOLIDATED FINANCIAL STATEMENTS
(Unaudited)
|
The following table summarizes the net income allocated to common shares and the basic and diluted shares used in the net income per share computations:
|
Three Months Ended
September 30, |
Nine Months Ended
September 30, |
||||||||||||
|
(in thousands)
|
2018
|
2017
|
2018
|
2017
|
|||||||||
|
Net income
|
$
|
36,207
|
|
$
|
19,202
|
|
$
|
110,758
|
|
$
|
68,848
|
|
|
|
Less distributed and undistributed earnings allocated to participating securities
|
(503
|
)
|
(337
|
)
|
(1,546
|
)
|
(1,233
|
)
|
|||||
|
Net income allocated to common shares
|
$
|
35,704
|
|
$
|
18,865
|
|
$
|
109,212
|
|
$
|
67,615
|
|
|
|
Weighted average common shares outstanding
|
41,330
|
|
40,946
|
|
41,311
|
|
41,110
|
|
|||||
|
Incremental shares from assumed LTIP awards and conversions of common stock options
|
218
|
|
296
|
|
283
|
|
238
|
|
|||||
|
Adjusted weighted average common shares outstanding
|
41,548
|
|
41,242
|
|
41,594
|
|
41,348
|
|
|||||
|
8.
|
Commitments and Contingencies
|
Worksite Employee 401(k) Retirement Plan Class Action Litigation
In December 2015, a class action lawsuit was filed against us and the third-party discretionary trustee of the Insperity 401(k) retirement plan that is available to eligible worksite employees (the “Plan”) in the United States District Court for the Northern District of Georgia, Atlanta Division, on behalf of Plan participants. The suit generally alleges that Insperity’s third-party discretionary trustee of the Plan and Insperity breached their fiduciary duties to plan participants by selecting an Insperity subsidiary to serve as the recordkeeper for the Plan, by causing participants in the Plan to pay excessive recordkeeping fees to the Insperity subsidiary, by failing to monitor other fiduciaries, and by making imprudent investment choices. The parties filed a stipulation concerning class certification that defined the class as “all participants and beneficiaries of the Insperity 401(k) Plan from December 22, 2009 through September 30, 2017.” In November 2017, the court approved the class certification stipulation and denied the plaintiffs’ request for a jury trial. A date for the bench trial has not yet been set. Discovery is complete. On June 8, 2018, we filed a motion for summary judgment seeking dismissal of all claims. Briefing on that motion was completed in September 2018, which motion is now awaiting a ruling by the court. We believe we have meritorious defenses, and we intend to vigorously defend this litigation. As a result of uncertainty regarding the outcome of this matter,
no
provision has been made in the accompanying consolidated financial statements.
Other Litigation
We are a defendant in various other lawsuits and claims arising in the normal course of business. Management believes it has valid defenses in these cases and is defending them vigorously. While the results of litigation cannot be predicted with certainty, management believes the final outcome of such litigation will not have a material adverse effect on our financial position or results of operations.
|
Insperity | 2018 Third Quarter Form 10-Q
|
16
|
|
|
MANAGEMENT’S DISCUSSION AND ANALYSIS OF
FINANCIAL CONDITION AND RESULTS OF OPERATIONS
|
You should read the following discussion in conjunction with our Annual Report on Form 10-K for the year ended
December 31, 2017
, as well as our Consolidated Financial Statements and notes thereto included in this Quarterly Report on Form 10-Q.
Executive Summary
Overview
Insperity, Inc. (“Insperity,” “we,” “our,’ and “us”) provides an array of human resources (“HR”) and business solutions designed to help improve business performance. Our most comprehensive HR services offerings are provided through our professional employer organization (“PEO”) services, known as Workforce Optimization
®
and Workforce Synchronization
TM
solutions (together, our “PEO HR Outsourcing solutions”), which encompass a broad range of HR functions, including payroll and employment administration, employee benefits, workers’ compensation, government compliance, performance management, and training and development services, along with our cloud-based human capital management solution, the Insperity Premier
TM
platform.
2018
Highlights
Our results for
2018
reflect the impact of continued worksite employee (“WSEE”) growth and
effective management of gross profit and operating costs contributing to our significant earnings growth.
Third
Quarter
2018
Compared to
Third
Quarter
2017
|
•
|
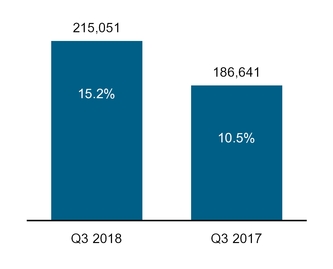
Average number of WSEEs
paid per month increased
15.2%
to
215,051
, driving an
18.6%
gross profit increase
|
|
•
|
Net income
and diluted earnings per share (“diluted
EPS”)
increased
88.6%
and
87.0%
, to
$36.2 million
and
$0.86
, respectively
|
|
•
|
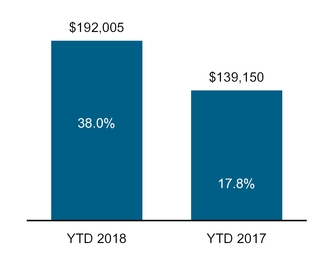
Adjusted EBITDA
increased
42.8%
to
$61.6 million
|
|
•
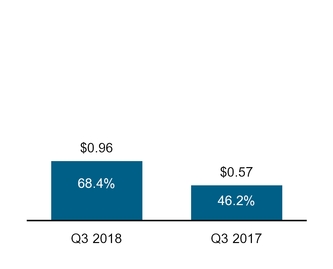
|
Adjusted EPS
increased
68.4%
to
$0.96
|
First
Nine
Months
2018
Compared to First
Nine
Months
2017
|
•
|
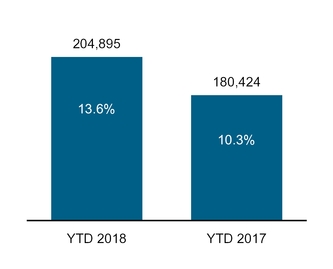
Average number of WSEEs
paid per month increased
13.6%
to
204,895
, driving a
21.0%
gross profit increase
|
|
•
|
Net income
and diluted
EPS
increased
60.9%
and
60.4%
, to
$110.8 million
and
$2.63
, respectively
|
|
•
|
Adjusted EBITDA
increased
38.0%
to
$192.0 million
|
|
•
|
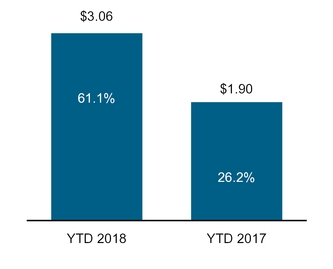
Adjusted EPS
increased
61.1%
to
$3.06
|
Please read “Non-GAAP Financial Measures” for a reconciliation of adjusted EBITDA and adjusted EPS to their most directly comparable financial measures calculated and presented in accordance with GAAP.
|
Insperity | 2018 Third Quarter Form 10-Q
|
17
|
|
|
MANAGEMENT’S DISCUSSION AND ANALYSIS OF
FINANCIAL CONDITION AND RESULTS OF OPERATIONS
|
Key Financial and Statistical Data
|
(in thousands, except per share and WSEE data)
|
Three Months Ended September 30,
|
Nine Months Ended September 30,
|
|||||||||||||||
|
2018
|
2017
|
% Change
|
2018
|
2017
|
% Change
|
||||||||||||
|
Financial data:
|
|||||||||||||||||
|
Revenues
|
$
|
925,126
|
|
$
|
795,513
|
|
16.3
|
%
|
$
|
2,861,793
|
|
$
|
2,473,729
|
|
15.7
|
%
|
|
|
Gross profit
|
166,054
|
|
139,966
|
|
18.6
|
%
|
520,318
|
|
429,865
|
|
21.0
|
%
|
|||||
|
Operating expenses
|
117,921
|
|
110,167
|
|
7.0
|
%
|
373,901
|
|
323,636
|
|
15.5
|
%
|
|||||
|
Operating income
|
48,133
|
|
29,799
|
|
61.5
|
%
|
146,417
|
|
106,229
|
|
37.8
|
%
|
|||||
|
Other income (expense)
|
854
|
|
121
|
|
—
|
|
1,939
|
|
(162
|
)
|
—
|
|
|||||
|
Net income
|
36,207
|
|
19,202
|
|
88.6
|
%
|
110,758
|
|
68,848
|
|
60.9
|
%
|
|||||
|
Diluted EPS
(1)
|
0.86
|
|
0.46
|
|
87.0
|
%
|
2.63
|
|
1.64
|
|
60.4
|
%
|
|||||
|
Non-GAAP financial measures
(2)
:
|
|||||||||||||||||
|
Adjusted net income
|
$
|
40,471
|
|
$
|
24,081
|
|
68.1
|
%
|
$
|
128,698
|
|
$
|
79,994
|
|
60.9
|
%
|
|
|
Adjusted EBITDA
|
61,572
|
|
43,112
|
|
42.8
|
%
|
192,005
|
|
139,150
|
|
38.0
|
%
|
|||||
|
Adjusted EPS
|
0.96
|
|
0.57
|
|
68.4
|
%
|
3.06
|
|
1.90
|
|
61.1
|
%
|
|||||
|
Average WSEE
|
215,051
|
|
186,641
|
|
15.2
|
%
|
204,895
|
|
180,424
|
|
13.6
|
%
|
|||||
|
Statistical data (per WSEE per month):
|
|||||||||||||||||
|
Revenues
(3)
|
$
|
1,434
|
|
$
|
1,421
|
|
0.9
|
%
|
$
|
1,552
|
|
$
|
1,523
|
|
1.9
|
%
|
|
|
Gross profit
|
257
|
|
250
|
|
2.8
|
%
|
282
|
|
265
|
|
6.4
|
%
|
|||||
|
Operating expenses
|
183
|
|
197
|
|
(7.1
|
)%
|
203
|
|
199
|
|
2.0
|
%
|
|||||
|
Operating income
|
75
|
|
53
|
|
41.5
|
%
|
79
|
|
65
|
|
21.5
|
%
|
|||||
|
Net income
|
56
|
|
34
|
|
64.7
|
%
|
60
|
|
42
|
|
42.9
|
%
|
|||||
|
(1)
|
Amounts in 2017 adjusted to reflect the two-for-one split of our common stock effected on December 18, 2017 in the form of a stock dividend.
|
|
(2)
|
Please read “Non-GAAP Financial Measures” for a reconciliation of the non-GAAP financial measures to their most directly comparable financial measures calculated and presented in accordance with GAAP.
|
|
(3)
|
Revenues per WSEE per month are comprised of gross billings per WSEE per month less WSEE payroll costs per WSEE per month as follows:
|
|
Three Months Ended September 30,
|
Nine Months Ended September 30,
|
||||||||||||
|
(per WSEE per month)
|
2018
|
2017
|
2018
|
2017
|
|||||||||
|
Gross billings
|
$
|
9,007
|
|
$
|
8,748
|
|
$
|
9,373
|
|
$
|
9,025
|
|
|
|
Less: WSEE payroll cost
|
7,573
|
|
7,327
|
|
7,821
|
|
7,502
|
|
|||||
|
Revenues
|
$
|
1,434
|
|
$
|
1,421
|
|
$
|
1,552
|
|
$
|
1,523
|
|
|
|
Insperity | 2018 Third Quarter Form 10-Q
|
18
|
|
|
MANAGEMENT’S DISCUSSION AND ANALYSIS OF
FINANCIAL CONDITION AND RESULTS OF OPERATIONS
|
New Accounting Pronouncements
Please read
Note 2
to the Consolidated Financial Statements, "
Accounting Policies
– New Accounting Pronouncements," for new accounting pronouncements information.
Results of Operations
Key Operating Metrics
We monitor certain key metrics to measure our performance, including:
|
•
|
WSEE
|
|
•
|
Adjusted EBITDA
|
|
•
|
Adjusted EPS
|
Our growth in the number of WSEEs paid is affected by three primary sources: new client sales, client retention and the net change in existing clients through WSEE new hires and layoffs.
|
•
|
During the
third
quarter of
2018
(“
Q3 2018
”), the number of WSEEs paid from new client sales increased 57.5% over the
third
quarter of
2017
(“
Q3 2017
”) on a
16.5%
increase in the average number of Business Performance Advisors (“BPAs”). In addition, the net change in existing clients and client retention improved as compared to
Q3 2017
.
|
|
•
|
During the first
nine
months of
2018
(“
YTD 2018
”), the number of WSEEs paid from new client sales and the net change in existing clients improved as compared to the first
nine
months of
2017
(“
YTD 2017
”), while client retention remained consistent with
YTD 2017
.
|
Average WSEEs Paid and
Year-over-Year Growth Percentage
|
Insperity | 2018 Third Quarter Form 10-Q
|
19
|
|
|
MANAGEMENT’S DISCUSSION AND ANALYSIS OF
FINANCIAL CONDITION AND RESULTS OF OPERATIONS
|
Adjusted EBITDA and
Year-over-Year Growth Percentage
(in thousands)

Adjusted EPS
(1)
and
Year-over-Year Growth Percentage
(amounts per share)
____________________________________
|
(1)
|
Amounts in 2017 adjusted to reflect the two-for-one split of our common stock effected on December 18, 2017 in the form of a stock dividend.
|
Revenues
Our PEO HR Outsourcing solutions revenues are primarily derived from our gross billings, which are based on (1) the payroll cost of our WSEEs and (2) a markup computed as a percentage of the payroll cost.
Our revenues are primarily dependent on the number of clients enrolled, the resulting number of WSEEs paid each period and the number of WSEEs enrolled in our benefit plans. Because our total markup is computed as a percentage of payroll cost, certain revenues are also affected by the payroll cost of WSEEs, which may fluctuate based on the composition of the WSEE base, inflationary effects on wage levels and differences in the local economies of our markets.
|
Insperity | 2018 Third Quarter Form 10-Q
|
20
|
|
|
MANAGEMENT’S DISCUSSION AND ANALYSIS OF
FINANCIAL CONDITION AND RESULTS OF OPERATIONS
|
Revenue and
Year-over-Year Growth Percentage
(in thousands)
Third
Quarter
2018
Compared to
Third
Quarter
2017
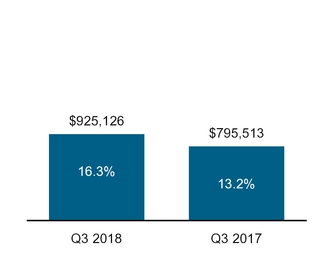
Our revenues for
Q3 2018
were
$925.1 million
, an increase of
16.3%
, primarily due to the following:
|
•
|
Average WSEEs paid
increased
15.2%
|
|
•
|
Revenues per WSEE
per month increased
0.9%
, or
$13
|
First
Nine
Months
2018
Compared to First
Nine
Months
2017
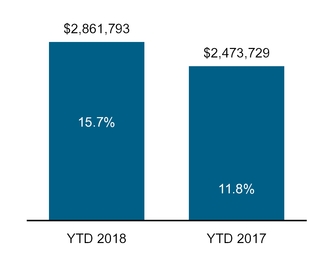
Our revenues for
YTD 2018
were
$2.9 billion
, an increase of
15.7%
, primarily due to the following:
|
•
|
Average WSEEs paid
increased
13.6%
|
|
•
|
Revenues per WSEE
per month increased
1.9%
, or
$29
|
|
Insperity | 2018 Third Quarter Form 10-Q
|
21
|
|
|
MANAGEMENT’S DISCUSSION AND ANALYSIS OF
FINANCIAL CONDITION AND RESULTS OF OPERATIONS
|
We provide our PEO HR Outsourcing solutions to small and medium-sized businesses in strategically selected markets throughout the United States. Our PEO HR Outsourcing solutions revenue distribution by region follows:
PEO HR Outsourcing Solutions Revenue by Region
(in thousands)
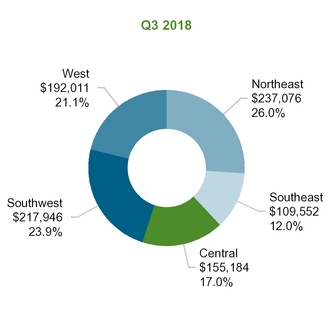

The percentage of total PEO HR Outsourcing solutions revenue in our significant markets includes the following:
Significant Markets
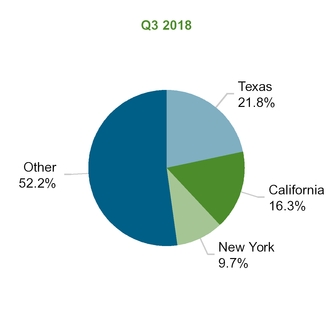
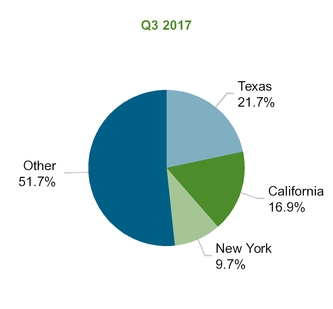
Gross Profit
In determining the pricing of the markup component of our gross billings, we take into consideration our estimates of the costs directly associated with our WSEEs, including payroll taxes, benefits and workers’ compensation costs, plus an acceptable gross profit margin. As a result, our operating results are significantly impacted by our ability to accurately estimate, control and manage our direct costs relative to the revenues derived from the markup component of our gross billings.
Our gross profit per WSEE is primarily determined by our ability to accurately estimate and control direct costs and our ability to incorporate changes in these costs into the gross billings charged to PEO HR Outsourcing solutions
|
Insperity | 2018 Third Quarter Form 10-Q
|
22
|
|
|
MANAGEMENT’S DISCUSSION AND ANALYSIS OF
FINANCIAL CONDITION AND RESULTS OF OPERATIONS
|
clients, which are subject to pricing arrangements that are typically renewed annually. We use gross profit per WSEE per month as our principal measurement of relative performance at the gross profit level.
Gross Profit and
Year-over-Year Growth Percentage
(in thousands)
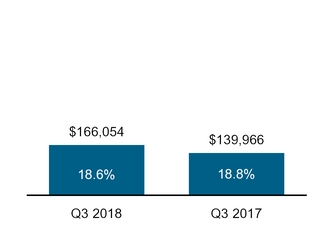
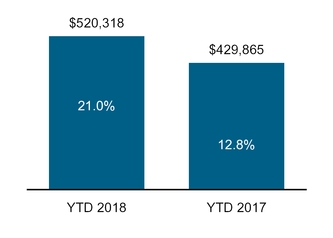
Gross Profit per WSEE per Month and
Year-over-Year Growth Percentage
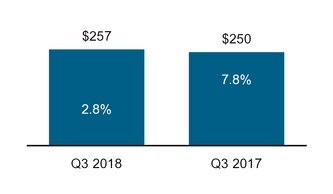
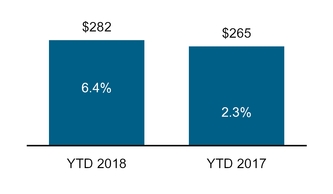
Third
Quarter
2018
Compared to
Third
Quarter
2017
Gross profit for
Q3 2018
increased
18.6%
to
$166.1 million
compared to
$140.0 million
in
Q3 2017
. Gross profit per WSEE per month for
Q3 2018
increased
$7
to
$257
compared to
$250
in
Q3 2017
.
Our pricing objectives attempt to achieve a level of revenue per WSEE that matches or exceeds changes in primary direct costs and operating expenses. Our revenues and direct costs per WSEE per month increased
$13
and
$6
, respectively, in
Q3 2018
. The net
increase
in the change in cost estimates for benefits and workers compensation between
Q3 2018
and
Q3 2017
totaled
$4.8 million
as discussed below. The primary direct cost components changed as follows:
Benefits costs
|
•
|
Th
e cost of group health insurance and related employee benefits
decreased
$2
per WSEE per month, but
increased
1.7%
on a cost per covered employee basis.
|
|
•
|
The percentage of WSEEs covered under our health insurance plans was
66.7%
in
Q3 2018
compared to
68.1%
in
Q3 2017
.
|
|
•
|
Changes in estimated claims run-off related to prior periods was
a reduction
of
$0.7 million
, or
$1
per WSEE per month, in
Q3 2018
compared to
a reduction
of
$5.0 million
, or
$9
per WSEE per month, in
Q3 2017
.
|
|
Insperity | 2018 Third Quarter Form 10-Q
|
23
|
|
|
MANAGEMENT’S DISCUSSION AND ANALYSIS OF
FINANCIAL CONDITION AND RESULTS OF OPERATIONS
|
Please read
Note 2
to the Consolidated Financial Statements, “
Accounting Policies
– Health Insurance Costs,” for a discussion of our accounting for health insurance costs.
Workers’ compensation costs
Our continued discipline around our client selection, safety and claims management contributed to the small increase in our cost per WSEE and, as a result, has allowed for claims within our policy periods to be closed out at amounts below our original cost estimates.
|
•
|
Workers’ compensation costs
increased
20.9%
, or
$2
on a per WSEE per month basis, in
Q3 2018
compared to
Q3 2017
, on a
17.4%
increase
in non-bonus payroll costs.
|
|
•
|
As a percentage of non-bonus payroll cost, workers’ compensation costs in
Q3 2018
were
0.55%
compared to
0.53%
in
Q3 2017
.
|
|
•
|
As a result of closing out claims at lower than expected costs, we recorded
a reduction
in workers’ compensation costs of
$2.4 million
, or
0.05%
of non-bonus payroll costs, in
Q3 2018
compared to
a reduction
of
$2.9 million
, or
0.08%
of non-bonus payroll costs, in
Q3 2017
.
|
Please read
Note 2
to the Consolidated Financial Statements, “
Accounting Policies
– Workers’ Compensation Costs,” for a discussion of our accounting for workers’ compensation costs.
Payroll tax costs
|
•
|
Payroll taxes
increased
16.8%
, or
$6
per WSEE per month, primarily due to a
19.1%
increase
in payroll costs.
|
|
•
|
Payroll taxes as a percentage of payroll costs were
6.2%
in
Q3 2018
compared to
6.3%
in
Q3 2017
.
|
First
Nine
Months
2018
Compared to First
Nine
Months
2017
Gross profit for
YTD 2018
increased
21.0%
to
$520.3 million
compared to
$429.9 million
in
YTD 2017
. Gross profit per WSEE per month for
YTD 2018
increased
$17
to
$282
compared to
$265
in
YTD 2017
. Our revenues and direct costs per WSEE per month increased
$29
and
$12
, respectively, in
YTD 2018
.
The net
decrease
in the change in cost estimates for benefits and workers compensation between
YTD 2018
and
YTD 2017
totaled
$4.7 million
as discussed below. The primary direct cost components changed as follows:
Benefits costs
|
•
|
Th
e cost of group health insurance and related employee benefits
increased
$2
per WSEE per month, or
1.1%
on a cost per covered employee basis.
|
|
•
|
The percentage of WSEEs covered under our health insurance plans was
68.3%
in
YTD 2018
compared to
68.8%
in
YTD 2017
.
|
|
•
|
Changes in estimated claims run-off related to prior periods was
a reduction
of
$1.3 million
, or
$1
per WSEE per month, in
YTD 2018
compared to
an increase
of
$1.0 million
in
YTD 2017
.
|
Please read
Note 2
to the Consolidated Financial Statements, “
Accounting Policies
– Health Insurance Costs,” for a discussion of our accounting for health insurance costs.
Workers’ compensation costs
Our continued discipline around our client selection, safety and claims management contributed to the reduction in our cost per WSEE and, as a result, has allowed for claims within our policy periods to be closed out at amounts below our original cost estimates.
|
•
|
Workers’ compensation costs
increased
6.6%
, but
decreased
$2
on a per WSEE per month basis, in
YTD 2018
compared to YTD 2017, on a
16.8%
increase
in non-bonus payroll costs.
|
|
•
|
As a percentage of non-bonus payroll cost, workers’ compensation costs were
0.51%
in
YTD 2018
compared to
0.56%
in
YTD 2017
.
|
|
Insperity | 2018 Third Quarter Form 10-Q
|
24
|
|
|
MANAGEMENT’S DISCUSSION AND ANALYSIS OF
FINANCIAL CONDITION AND RESULTS OF OPERATIONS
|
|
•
|
As a result of closing out claims at lower than expected costs, we recorded
a reduction
in workers’ compensation costs of
$13.4 million
, or
0.10%
of non-bonus payroll costs, in
YTD 2018
compared to
a reduction
of
$11.0 million
, or
0.10%
of non-bonus payroll costs, in
YTD 2017
.
|
Please read
Note 2
to the Consolidated Financial Statements, “
Accounting Policies
– Workers’ Compensation Costs,” for a discussion of our accounting for workers’ compensation costs.
Payroll tax costs
|
•
|
Payroll taxes
increased
15.8%
,or
$11
per WSEE per month, due primarily to an
18.4%
increase
in payroll costs.
|
|
•
|
Payroll taxes as a percentage of payroll costs were
7.1%
in
YTD 2018
compared to
7.3%
in
YTD 2017
.
|
Operating Expenses
Our operating expenses are comprised of the following:
|
•
|
Salaries, wages and payroll taxes
— Salaries, wages and payroll taxes (“Salaries”) are primarily a function of the number of corporate employees, their associated average pay and any additional incentive compensation.
|
|
•
|
Stock-based compensation
— Our stock-based compensation relates to the recognition of non-cash compensation expense over the vesting period of restricted stock and long-term incentive plan awards.
|
|
•
|
Commissions
— Commissions expense consists primarily of channel referral fees and amounts paid to sales managers and BPAs. Commissions are based on new accounts sold and a percentage of revenue generated by such personnel.
|
|
•
|
Advertising
— Advertising expense primarily consists of media advertising and other business promotions in our current and anticipated sales markets.
|
|
•
|
General and administrative expenses
— Our general and administrative expenses primarily include:
|
|
•
|
rent expenses related to our service centers and sales offices
|
|
•
|
outside professional service fees related to legal, consulting and accounting services
|
|
•
|
administrative costs, such as postage, printing and supplies
|
|
•
|
employee travel and training expenses
|
|
•
|
technology and facility repairs and maintenance costs
|
|
•
|
Depreciation and amortization
— Depreciation and amortization expense is primarily a function of our capital investments in corporate facilities, service centers, sales offices, technology infrastructure and expenses associated with our acquisitions.
|
|
Insperity | 2018 Third Quarter Form 10-Q
|
25
|
|
|
MANAGEMENT’S DISCUSSION AND ANALYSIS OF
FINANCIAL CONDITION AND RESULTS OF OPERATIONS
|
Third
Quarter
2018
Compared to
Third
Quarter
2017
|
Three Months Ended September 30,
|
|||||||||||||||||
|
$
|
WSEE
|
||||||||||||||||
|
(in thousands, except per WSEE)
|
2018
|
2017
|
% Change
|
2018
|
2017
|
% Change
|
|||||||||||
|
Salaries
|
$
|
70,552
|
|
$
|
65,223
|
|
8.2
|
%
|
$
|
109
|
|
$
|
116
|
|
(6.0
|
)%
|
|
|
Stock-based compensation
|
5,769
|
|
6,584
|
|
(12.4
|
)%
|
9
|
|
12
|
|
(25.0
|
)%
|
|||||
|
Commissions
|
6,818
|
|
5,675
|
|
20.1
|
%
|
11
|
|
10
|
|
10.0
|
%
|
|||||
|
Advertising
|
3,846
|
|
3,476
|
|
10.6
|
%
|
6
|
|
6
|
|
—
|
|
|||||
|
General and administrative
|
25,294
|
|
24,513
|
|
3.2
|
%
|
39
|
|
44
|
|
(11.4
|
)%
|
|||||
|
Depreciation and amortization
|
5,642
|
|
4,696
|
|
20.1
|
%
|
9
|
|
9
|
|
—
|
|
|||||
|
Total operating expenses
|
$
|
117,921
|
|
$
|
110,167
|
|
7.0
|
%
|
$
|
183
|
|
$
|
197
|
|
(7.1
|
)%
|
|
Operating expenses for
Q3 2018
increased
7.0%
to
$117.9 million
compared to
$110.2 million
in
Q3 2017
. Operating expenses per WSEE per month for
Q3 2018
decreased
7.1%
to
$183
compared to
$197
in
Q3 2017
.
|
•
|
Salaries
of corporate and sales staff for
Q3 2018
increased
8.2%
to
$70.6 million
, but
decreased
$7
on a per WSEE per month basis, compared to
Q3 2017
. This increase was primarily due to an
11.1%
increase
in corporate headcount, which includes a
16.5%
increase in the number of BPAs.
|
|
•
|
Stock based compensation expense for
Q3 2018
decreased
12.4%
to
$5.8 million
, or
$3
per WSEE per month compared to
Q3 2017
. The decrease was primarily due to performance adjustments made in 2017 related to our long-term incentive awards.
|
|
•
|
Commissions expense for
Q3 2018
increased
20.1%
to
$6.8 million
, or
$1
per WSEE per month, compared to
Q3 2017
. The increase was primarily due to commissions associated with growth in our PEO HR Outsourcing solutions, including an increase in the amount of sales channel referral fees paid during 2018.
|
|
•
|
General and administrative
expenses for
Q3 2018
increased
3.2%
to
$25.3 million
, but
decreased
$5
on a per WSEE per month basis, compared to
Q3 2017
. The increase was primarily due to increased travel and training expenses associated with the increase in BPAs, rent, office expenses and maintenance costs, partially offset by the non-recurrence of charitable contributions made in 2017 related to Hurricane Harvey relief efforts.
|
|
•
|
Depreciation and amortization expense for
Q3 2018
increased
20.1%
to
$5.6 million
, but remained flat on a per WSEE per month basis, compared to
Q3 2017
. The increase was primarily due to increased capital expenditures related to software development costs.
|
First
Nine
Months
2018
Compared to First
Nine
Months
2017
|
Nine Months Ended September 30,
|
|||||||||||||||||
|
$
|
WSEE
|
||||||||||||||||
|
(in thousands, except per WSEE)
|
2018
|
2017
|
% Change
|
2018
|
2017
|
% Change
|
|||||||||||
|
Salaries
|
$
|
226,486
|
|
$
|
189,138
|
|
19.7
|
%
|
$
|
123
|
|
$
|
116
|
|
6.0
|
%
|
|
|
Stock-based compensation
|
14,656
|
|
16,390
|
|
(10.6
|
)%
|
8
|
|
10
|
|
(20.0
|
)%
|
|||||
|
Commissions
|
19,863
|
|
15,815
|
|
25.6
|
%
|
11
|
|
10
|
|
10.0
|
%
|
|||||
|
Advertising
|
13,996
|
|
13,623
|
|
2.7
|
%
|
8
|
|
8
|
|
—
|
|
|||||
|
General and administrative
|
82,565
|
|
75,315
|
|
9.6
|
%
|
44
|
|
46
|
|
(4.3
|
)%
|
|||||
|
Depreciation and amortization
|
16,335
|
|
13,355
|
|
22.3
|
%
|
9
|
|
9
|
|
—
|
|
|||||
|
Total operating expenses
|
$
|
373,901
|
|
$
|
323,636
|
|
15.5
|
%
|
$
|
203
|
|
$
|
199
|
|
2.0
|
%
|
|
Operating expenses for
YTD 2018
increased
15.5%
to
$373.9 million
compared to
$323.6 million
in
YTD 2017
. Operating expenses per WSEE per month for
YTD 2018
increased
2.0%
to
$203
compared to
$199
in
YTD 2017
.
|
Insperity | 2018 Third Quarter Form 10-Q
|
26
|
|
|
MANAGEMENT’S DISCUSSION AND ANALYSIS OF
FINANCIAL CONDITION AND RESULTS OF OPERATIONS
|
|
•
|
Salaries
of corporate and sales staff for
YTD 2018
increased
19.7%
to
$226.5 million
, or
$7
per WSEE per month, compared to
YTD 2017
. This increase was primarily due to a $9.3 million charge related to a one-time tax reform bonus paid to corporate employees, a
10.8%
increase in corporate headcount, which includes a
17.6%
increase in the number of BPAs, and additional incentive compensation expense as a result of strong operating results.
|
|
•
|
Stock-based compensation for
YTD 2018
decreased
10.6%
to
$14.7 million
, or
$2
per WSEE per month, compared to
YTD 2017
. This decrease was primarily due to the acceleration of restricted stock awards and associated expense in the fourth quarter of 2017 that were originally scheduled to vest in the first quarter of 2018.
|
|
•
|
Commissions expense for
YTD 2018
increased
25.6%
to
$19.9 million
, or
$1
per WSEE per month, compared to
YTD 2017
. The increase was primarily due to commissions associated with growth in our PEO HR Outsourcing solutions, including an increase in the amount of sales channel referral fees paid during 2018.
|
|
•
|
General and administrative
expenses for
YTD 2018
increased
9.6%
to
$82.6 million
, but
decreased
$2
on a per WSEE per month basis, compared to
YTD 2017
. The increase was primarily due to increased travel and training expenses associated with the increase in BPAs, professional services, rent and office expenses partially offset by the non-recurrence of charitable contributions made in 2017 related to Hurricane Harvey relief efforts.
|
|
•
|
Depreciation and amortization expense for
YTD 2018
increased
22.3%
to
$16.3 million
, but remained flat on a per WSEE per month basis, compared to
YTD 2017
. The increase was primarily due to increased capital expenditures related to software development costs.
|
Income Tax Expense
|
Three Months Ended September 30,
|
Nine Months Ended September 30,
|
||||
|
2018
|
2017
|
2018
|
2017
|
||
|
Effective income tax rate
|
26.1%
|
35.8%
|
25.3%
|
35.1%
|
|
As a result of U.S. tax reform enacted in late 2017, the U.S. statutory rate decreased from 35% in 2017 to 21% in 2018.
For the three months ended
September 30, 2018
, our provision for income taxes differed from the U.S. statutory rate of 21% primarily due to state income taxes and non-deductible expenses.
For the
nine
months ended
September 30, 2018
, our provision for income taxes differed from the U.S. statutory rate primarily due to state income taxes and non-deductible expenses and vesting of long-term incentive stock awards. During the first
nine
months of
2018
and
2017
, we recognized an income tax benefit of $3.7 million and $3.3 million, respectively, related to the vesting of long-term incentive and restricted stock awards.
|
Insperity | 2018 Third Quarter Form 10-Q
|
27
|
|
|
MANAGEMENT’S DISCUSSION AND ANALYSIS OF
FINANCIAL CONDITION AND RESULTS OF OPERATIONS
|
Non-GAAP Financial Measures
Non-GAAP financial measures are not prepared in accordance with GAAP and may be different from non-GAAP financial measures used by other companies. Non-GAAP financial measures should not be considered as a substitute for, or superior to, measures of financial performance prepared in accordance with GAAP. Investors are encouraged to review the reconciliation of the non-GAAP financial measures used to their most directly comparable GAAP financial measures as provided in the tables below.
|
Non-GAAP Measure
|
Definition
|
Benefit of Non-GAAP Measure
|
|
Non-bonus payroll cost
|
Non-bonus payroll cost is a non-GAAP financial measure that excludes the impact of bonus payrolls paid to our WSEEs.
Bonus payroll cost varies from period to period, but has no direct impact to our ultimate workers’ compensation costs under the current program.
|
Our management refers to non-bonus payroll cost in analyzing, reporting and forecasting our workers’ compensation costs.
We include these non-GAAP financial measures because we believe they are useful to investors in allowing for greater transparency related to the costs incurred under our current workers’ compensation program.
|
|
Adjusted cash, cash equivalents and marketable securities
|
Excludes funds associated with:
• federal and state income tax withholdings,
• employment taxes,
• other payroll deductions, and
• client prepayments.
|
We believe that the exclusion of the identified items helps us reflect the fundamentals of our underlying business model and analyze results against our expectations, against prior period, and to plan for future periods by focusing on our underlying operations. We believe that the adjusted results provide relevant and useful information for investors because they allow investors to view performance in a manner similar to the method used by management and improves their ability to understand and assess our operating performance.
|
|
Adjusted operating expense
|
Represents operating expenses excluding the impact of the following:
• costs associated with a one-time tax reform bonus paid to corporate employees and
• charitable donations to Hurricane Harvey relief efforts.
|
|
|
EBITDA
|
Represents net income computed in accordance with GAAP, plus:
• interest expense,
• income tax expense, and
• depreciation and amortization expense.
|
|
|
Adjusted EBITDA
|
Represents EBITDA plus:
• non-cash stock based compensation,
• costs associated with a one-time tax reform bonus paid to corporate employees, and
• charitable donations to Hurricane Harvey relief efforts.
|
|
|
Adjusted Net Income
|
Represents net income computed in accordance with GAAP, excluding:
• non-cash stock based compensation,
• costs associated with a one-time tax reform bonus paid to corporate employees, and
• charitable donations to Hurricane Harvey relief efforts.
|
|
|
Adjusted EPS
|
Represents diluted net income per share computed in accordance with GAAP, excluding:
• non-cash stock based compensation,
• costs associated with a one-time tax reform bonus paid to corporate employees, and
• charitable donations to Hurricane Harvey relief efforts.
|
|
|
Insperity | 2018 Third Quarter Form 10-Q
|
28
|
|
|
MANAGEMENT’S DISCUSSION AND ANALYSIS OF
FINANCIAL CONDITION AND RESULTS OF OPERATIONS
|
Following is a reconciliation of payroll cost (GAAP) to non-bonus payroll costs (non-GAAP):
|
Three Months Ended September 30,
|
Nine Months Ended September 30,
|
||||||||||||||||||||||||||
|
(in thousands, except per WSEE per month)
|
2018
|
2017
|
2018
|
2017
|
|||||||||||||||||||||||
|
$
|
WSEE
|
$
|
WSEE
|
$
|
WSEE
|
$
|
WSEE
|
||||||||||||||||||||
|
Payroll cost
|
$
|
4,885,653
|
|
$
|
7,573
|
|
$
|
4,102,820
|
|
$
|
7,327
|
|
$
|
14,422,684
|
|
$
|
7,821
|
|
$
|
12,181,816
|
|
$
|
7,502
|
|
|||
|
Less: Bonus payroll cost
|
434,942
|
|
674
|
|
312,230
|
|
557
|
|
1,638,028
|
|
888
|
|
1,233,827
|
|
760
|
|
|||||||||||
|
Non-bonus payroll cost
|
$
|
4,450,711
|
|
$
|
6,899
|
|
$
|
3,790,590
|
|
$
|
6,770
|
|
$
|
12,784,656
|
|
$
|
6,933
|
|
$
|
10,947,989
|
|
$
|
6,742
|
|
|||
|
% Change period over period
|
17.4
|
%
|
1.9
|
%
|
12.9
|
%
|
2.2
|
%
|
16.8
|
%
|
2.8
|
%
|
12.0
|
%
|
1.5
|
%
|
|||||||||||
Following is a reconciliation of cash, cash equivalents and marketable securities (GAAP) to adjusted cash, cash equivalents and marketable securities (non-GAAP):
|
(in thousands)
|
September 30, 2018
|
|
December 31, 2017
|
|
|||
|
Cash, cash equivalents and marketable securities
|
$
|
365,875
|
|
$
|
356,220
|
|
|
|
Less:
|
|||||||
|
Amounts payable for withheld federal and state income taxes, employment taxes and other payroll deductions
|
181,329
|
|
271,547
|
|
|||
|
Client prepayments
|
18,043
|
|
23,603
|
|
|||
|
Adjusted cash, cash equivalents and marketable securities
|
$
|
166,503
|
|
$
|
61,070
|
|
|
Following is a reconciliation of operating expenses (GAAP) to adjusted operating expenses (non-GAAP) in thousands, except per WSEE per month:
|
Three Months Ended September 30,
|
Nine Months Ended September 30,
|
||||||||||||||||||||||||||
|
(in thousands, except per WSEE per month)
|
2018
|
2017
|
2018
|
2017
|
|||||||||||||||||||||||
|
$
|
WSEE
|
$
|
WSEE
|
$
|
WSEE
|
$
|
WSEE
|
||||||||||||||||||||
|
Operating expenses
|
$
|
117,921
|
|
$
|
183
|
|
$
|
110,167
|
|
$
|
197
|
|
$
|
373,901
|
|
$
|
203
|
|
$
|
323,636
|
|
$
|
199
|
|
|||
|
Less:
|
|||||||||||||||||||||||||||
|
One-time tax reform bonus
|
—
|
|
—
|
|
—
|
|
—
|
|
9,306
|
|
5
|
|
—
|
|
—
|
|
|||||||||||
|
Charitable donations to Hurricane Harvey relief efforts
|
—
|
|
—
|
|
1,218
|
|
2
|
|
—
|
|
—
|
|
1,218
|
|
1
|
|
|||||||||||
|
Adjusted operating expenses
|
$
|
117,921
|
|
$
|
183
|
|
$
|
108,949
|
|
$
|
195
|
|
$
|
364,595
|
|
$
|
198
|
|
$
|
322,418
|
|
$
|
198
|
|
|||
|
% Change period over period
|
8.2
|
%
|
(6.2
|
)%
|
14.7
|
%
|
4.3
|
%
|
13.1
|
%
|
—
|
|
11.6
|
%
|
0.5
|
%
|
|||||||||||
|
Insperity | 2018 Third Quarter Form 10-Q
|
29
|
|
|
MANAGEMENT’S DISCUSSION AND ANALYSIS OF
FINANCIAL CONDITION AND RESULTS OF OPERATIONS
|
Following is a reconciliation of net income (GAAP) to EBITDA (non-GAAP) and adjusted EBITDA (non-GAAP):
|
Three Months Ended September 30,
|
Nine Months Ended September 30,
|
||||||||||||||||||||||||||
|
(in thousands, except per WSEE per month)
|
2018
|
2017
|
2018
|
2017
|
|||||||||||||||||||||||
|
$
|
WSEE
|
$
|
WSEE
|
$
|
WSEE
|
$
|
WSEE
|
||||||||||||||||||||
|
Net income
|
$
|
36,207
|
|
$
|
56
|
|
$
|
19,202
|
|
$
|
34
|
|
$
|
110,758
|
|
$
|
60
|
|
$
|
68,848
|
|
$
|
42
|
|
|||
|
Income tax expense
|
12,780
|
|
20
|
|
10,718
|
|
19
|
|
37,598
|
|
20
|
|
37,219
|
|
23
|
|
|||||||||||
|
Interest expense
|
1,174
|
|
2
|
|
894
|
|
2
|
|
3,352
|
|
2
|
|
2,320
|
|
1
|
|
|||||||||||
|
Depreciation and amortization
|
5,642
|
|
8
|
|
4,696
|
|
8
|
|
16,335
|
|
9
|
|
13,355
|
|
9
|
|
|||||||||||
|
EBITDA
|
55,803
|
|
86
|
|
35,510
|
|
63
|
|
168,043
|
|
91
|
|
121,742
|
|
75
|
|
|||||||||||
|
Stock-based compensation
|
5,769
|
|
9
|
|
6,584
|
|
12
|
|
14,656
|
|
8
|
|
16,390
|
|
10
|
|
|||||||||||
|
Charitable donations to Hurricane Harvey relief efforts
|
—
|
|
—
|
|
1,218
|
|
2
|
|
—
|
|
—
|
|
1,218
|
|
1
|
|
|||||||||||
|
Other
|
—
|
|
—
|
|
(200
|
)
|
—
|
|
—
|
|
—
|
|
(200
|
)
|
—
|
|
|||||||||||
|
One-time tax reform bonus
|
—
|
|
—
|
|
—
|
|
—
|
|
9,306
|
|
5
|
|
—
|
|
—
|
|
|||||||||||
|
Adjusted EBITDA
|
$
|
61,572
|
|
$
|
95
|
|
$
|
43,112
|
|
$
|
77
|
|
$
|
192,005
|
|
$
|
104
|
|
$
|
139,150
|
|
$
|
86
|
|
|||
|
% Change period over period
|
42.8
|
%
|
23.4
|
%
|
37.5
|
%
|
24.2
|
%
|
38.0
|
%
|
20.9
|
%
|
17.8
|
%
|
7.5
|
%
|
|||||||||||
Following reconciliation of net income (GAAP) to adjusted net income (non-GAAP):
|
Three Months Ended September 30,
|
Nine Months Ended September 30,
|
||||||||||||
|
(in thousands)
|
2018
|
2017
|
2018
|
2017
|
|||||||||
|
Net income
|
$
|
36,207
|
|
$
|
19,202
|
|
$
|
110,758
|
|
$
|
68,848
|
|
|
|
Non-GAAP adjustments:
|
|||||||||||||
|
Stock-based compensation
|
5,769
|
|
6,584
|
|
14,656
|
|
16,390
|
|
|||||
|
Charitable donations to Hurricane Harvey relief efforts
|
—
|
|
1,218
|
|
—
|
|
1,218
|
|
|||||
|
Other
|
—
|
|
(200
|
)
|
—
|
|
(200
|
)
|
|||||
|
One-time tax reform bonus
|
—
|
|
—
|
|
9,306
|
|
—
|
|
|||||
|
Total non-GAAP adjustments
|
5,769
|
|
7,602
|
|
23,962
|
|
17,408
|
|
|||||
|
Tax effect
|
(1,505
|
)
|
(2,723
|
)
|
(6,022
|
)
|
(6,262
|
)
|
|||||
|
Adjusted net income
|
$
|
40,471
|
|
$
|
24,081
|
|
$
|
128,698
|
|
$
|
79,994
|
|
|
|
% Change period over period
|
68.1
|
%
|
44.3
|
%
|
60.9
|
%
|
24.1
|
%
|
|||||
|
Insperity | 2018 Third Quarter Form 10-Q
|
30
|
|
|
MANAGEMENT’S DISCUSSION AND ANALYSIS OF
FINANCIAL CONDITION AND RESULTS OF OPERATIONS
|
Following is a reconciliation of diluted EPS (GAAP) to adjusted EPS
(non-GAAP)
(1)
:
|
Three Months Ended September 30,
|
Nine Months Ended September 30,
|
||||||||||||
|
(amounts per share)
|
2018
|
2017
|
2018
|
2017
|
|||||||||
|
Diluted EPS
|
$
|
0.86
|
|
$
|
0.46
|
|
$
|
2.63
|
|
$
|
1.64
|
|
|
|
Non-GAAP adjustments:
|
|||||||||||||
|
Stock-based compensation
|
0.14
|
|
0.16
|
|
0.35
|
|
0.39
|
|
|||||
|
Charitable donations to Hurricane Harvey relief efforts
|
—
|
|
0.03
|
|
—
|
|
0.03
|
|
|||||
|
Other
|
—
|
|
(0.01
|
)
|
—
|
|
(0.01
|
)
|
|||||
|
One-time tax reform bonus
|
—
|
|
—
|
|
0.22
|
|
—
|
|
|||||
|
Total non-GAAP adjustments
|
0.14
|
|
0.18
|
|
0.57
|
|
0.41
|
|
|||||
|
Tax effect
|
(0.04
|
)
|
(0.07
|
)
|
(0.14
|
)
|
(0.15
|
)
|
|||||
|
Adjusted EPS
|
$
|
0.96
|
|
$
|
0.57
|
|
$
|
3.06
|
|
$
|
1.90
|
|
|
|
% Change period over period
|
68.4
|
%
|
46.2
|
%
|
61.1
|
%
|
26.2
|
%
|
|||||
|
(1)
|
Amounts in 2017 adjusted to reflect the two-for-one split of our common stock effected on December 18, 2017 in the form of a stock dividend.
|
Liquidity and Capital Resources
We periodically evaluate our liquidity requirements, capital needs and availability of resources in view of, among other things, our expansion plans, stock repurchase, potential acquisitions, debt service requirements and other operating cash needs. To meet short-term liquidity requirements, which are primarily the payment of direct costs and operating expenses, we rely primarily on cash from operations. Longer-term projects, large stock repurchases or significant acquisitions may be financed with debt or equity. We have in the past sought, and may in the future seek, to raise additional capital or take other steps to increase or manage our liquidity and capital resources. We had
$365.9 million
in cash, cash equivalents and marketable securities at
September 30, 2018
, of which approximately
$181 million
was payable in early
October
2018
for withheld federal and state income taxes, employment taxes and other payroll deductions, and approximately
$18 million
were client prepayments that were payable in
October
2018
. At
September 30, 2018
, we had working capital of
$148.9 million
compared to
$52.5 million
at
December 31, 2017
. We currently believe that our cash on hand, marketable securities, cash flows from operations and availability under our revolving credit facility will be adequate to meet our liquidity requirements for the remainder of
2018
. We intend to rely on these same sources, as well as public and private debt or equity financing, to meet our longer-term liquidity and capital needs.
We have a
$350 million
revolving credit facility (“Facility”) with a syndicate of financial institutions. The Facility is available for working capital and general corporate purposes, including acquisitions and stock repurchases. As of
September 30, 2018
, we had an outstanding letter of credit and borrowings totaling
$105.4 million
under the Facility. Please read
Note 5
to the Consolidated Financial Statements, “
Long-Term Debt
,” for additional information.
Cash Flows from Operating Activities
Net cash
provided by
operating activities in the first
nine
months of
2018
was
$70.3 million
. Our primary source of cash from operations is the comprehensive service fee and payroll funding we collect from our clients. Our cash and cash equivalents, and thus our reported cash flows from operating activities, are significantly impacted by various external and internal factors, which are reflected in part by the changes in our balance sheet accounts. These include the following:
|
•
|
Timing of client payments / payroll levels
–
We typically collect our comprehensive service fee, along with the client’s payroll funding, from clients at least one day prior to the payment of WSEE payrolls and associated payroll taxes. Therefore, the last business day of a reporting period has a substantial impact on our reporting of operating cash flows. For example, many WSEEs are paid on Fridays; therefore, operating cash flows decrease in the reporting periods that end on a Friday or a Monday. In the period ended
September 30, 2018
,
|
|
Insperity | 2018 Third Quarter Form 10-Q
|
31
|
|
|
MANAGEMENT’S DISCUSSION AND ANALYSIS OF
FINANCIAL CONDITION AND RESULTS OF OPERATIONS
|
the last business day of the reporting period was a
Friday
, client prepayments were
$18.0 million
and accrued worksite employee payroll was
$340.1 million
. In the period ended September 30, 2017, the last business day of the reporting period was also a Friday, client prepayments were
$14.2 million
and accrued worksite employee payroll was
$256.7 million
.
|
•
|
Workers’ compensation plan funding
–
During YTD 2018 and YTD 2017, we received
$19.4 million
and
$22.7 million
, respectively, for the return of excess claim funds related to the workers’ compensation program, which resulted in an increase in working capital.
|
|
•
|
Medical plan funding
–
Our health care contract with United establishes participant cash funding rates
90
days in advance of the beginning of a reporting quarter. Therefore, changes in the participation level of the United plan have a direct impact on our operating cash flows. In addition, changes to the funding rates, which are solely determined by United based primarily upon recent claim history and anticipated cost trends, also have a significant impact on our operating cash flows. As of
September 30, 2018
, premiums owed and cash funded to United have exceeded the costs of the United plan, resulting in an
$18.9 million
surplus,
$9.9 million
of which is reflected as a current asset, and
$9.0 million
of which is reflected as a long-term asset on our Consolidated Balance Sheets. The premiums, including an additional quarterly premium, owed to United at
September 30, 2018
, were
$28.5 million
, which is included in accrued health insurance costs, a current liability, on our Consolidated Balance Sheets.
|
|
•
|
Operating results
– Our net income has a significant impact on our operating cash flows. Our adjusted net income
increased
60.9%
to
$128.7 million
in the first
nine months ended September 30, 2018
, compared to
$80.0 million
in the first
nine months ended September 30, 2017
, due to higher gross profit. Please read “Results of Operations
– First
Nine Months Ended September 30, 2018
Compared to First
Nine Months Ended September 30, 2017
.”
|
Cash Flows from Investing Activities
Net cash flows
used in
investing activities were
$57.3 million
for the
nine months ended September 30, 2018
, primarily due to marketable securities purchases, net of maturities and dispositions of
$35.8 million
and property and equipment purchases of
$21.5 million
.
Cash Flows from Financing Activities
Net cash flows
used in
financing activities were
$39.8 million
for the
nine months ended September 30, 2018
. We repurchased
$16.2 million
in stock and paid
$25.2 million
in dividends during the
nine months ended September 30, 2018
.
|
Insperity | 2018 Third Quarter Form 10-Q
|
32
|
|
|
QUANTITATIVE AND QUALITATIVE DISCLOSURES ABOUT MARKET RISK AND CONTROLS AND PROCEDURES
|
We are primarily exposed to market risks from fluctuations in interest rates and the effects of those fluctuations on the market values of our cash equivalent short-term investments, our available-for-sale marketable securities and our borrowings under our Facility, which bears interest at a variable market rate. As of
September 30, 2018
, we had outstanding letters of credit and borrowings totaling
$105.4 million
under the Facility. Please read
Note 5
to the Consolidated Financial Statements, “
Long-Term Debt
,” for additional information.
The cash equivalent short-term investments consist primarily of overnight investments, which are not significantly exposed to interest rate risk, except to the extent that changes in interest rates will ultimately affect the amount of interest income earned on these investments. Our available-for-sale marketable securities are subject to interest rate risk because these securities generally include a fixed interest rate. As a result, the market values of these securities are affected by changes in prevailing interest rates.
We attempt to limit our exposure to interest rate risk primarily through diversification and low investment turnover. Our investment policy is designed to maximize after-tax interest income while preserving our principal investment. As a result, our marketable securities consist of tax-exempt short term and intermediate term debt securities, which are primarily pre-funded municipal bonds that are secured by escrow funds containing U.S. Government Securities.
In accordance with Rules 13a-15 and 15d-15 of the Securities Exchange Act of 1934, as amended (the “Exchange Act”), we carried out an evaluation, under the supervision and with the participation of management, including our Chief Executive Officer and Chief Financial Officer, of the effectiveness of our disclosure controls and procedures as of the end of the period covered by this report. Based on that evaluation, our Chief Executive Officer and Chief Financial Officer concluded that our disclosure controls and procedures were effective as of
September 30, 2018
.
There has been no change in our internal controls over financial reporting that occurred during the
three months ended September 30, 2018
that has materially affected, or is reasonably likely to materially affect, our internal controls over financial reporting.
|
Insperity | 2018 Third Quarter Form 10-Q
|
33
|
|
|
OTHER INFORMATION
|
Please read
Note 8
to the Consolidated Financial Statements, “
Commitments and Contingencies
,” which is incorporated herein by reference.
Forward-Looking Statements
The statements contained herein that are not historical facts are forward-looking statements within the meaning of the federal securities laws (Section 27A of the Securities Act of 1933 and Section 21E of the Exchange Act). You can identify such forward-looking statements by the words “expects,” “intends,” “plans,” “projects,” “believes,” “estimates,” “likely,” “possibly,” “probably,” “goal,” “opportunity,” “objective,” “target,” “assume,” “outlook,” “guidance,” “predicts,” “appears,” “indicator” and similar expressions. Forward-looking statements involve a number of risks and uncertainties. In the normal course of business, Insperity, Inc., in an effort to help keep our stockholders and the public informed about our operations, may from time to time issue such forward-looking statements, either orally or in writing. Generally, these statements relate to business plans or strategies, projected or anticipated benefits or other consequences of such plans or strategies, or projections involving anticipated revenues, earnings, unit growth, profit per worksite employee, pricing, operating expenses or other aspects of operating results. We base the forward-looking statements on our expectations, estimates and projections at the time such statements are made. These statements are not guarantees of future performance and involve risks and uncertainties that we cannot predict. In addition, we have based many of these forward-looking statements on assumptions about future events that may prove to be inaccurate. Therefore, the actual results of the future events described in such forward-looking statements could differ materially from those stated in such forward-looking statements. Among the factors that could cause actual results to differ materially are:
|
•
|
adverse economic conditions;
|
|
•
|
regulatory and tax developments and possible adverse application of various federal, state and local regulations;
|
|
•
|
the ability to secure competitive replacement contracts for health insurance and workers’ compensation insurance at expiration of current contracts;
|
|
•
|
cancellation of client contracts on short notice, or the inability to renew client contracts or attract new clients;
|
|
•
|
vulnerability to regional economic factors because of our geographic market concentration;
|
|
•
|
increases in health insurance costs and workers’ compensation rates and underlying claims trends, health care reform, financial solvency of workers’ compensation carriers, other insurers or financial institutions, state unemployment tax rates, liabilities for employee and client actions or payroll-related claims;
|
|
•
|
failure to manage growth of our operations and the effectiveness of our sales and marketing efforts;
|
|
•
|
the impact of the competitive environment and other developments in the human resources services industry, including the PEO industry, on our growth and/or profitability;
|
|
•
|
our liability for worksite employee payroll, payroll taxes and benefits costs;
|
|
•
|
our liability for disclosure of sensitive or private information;
|
|
•
|
our ability to integrate or realize expected returns on our acquisitions;
|
|
•
|
failure of our information technology systems;
|
|
•
|
an adverse final judgment or settlement of claims against Insperity; and
|
|
•
|
disruptions to our business resulting from the actions of certain stockholders.
|
|
Insperity | 2018 Third Quarter Form 10-Q
|
34
|
|
|
OTHER INFORMATION
|
These factors are discussed in further detail in our Annual Report on Form 10-K for the year ended December 31,
2017
under “Item 1A. Risk Factors” in Part I and “Item 7. Management’s Discussion and Analysis of Financial Condition and Results of Operations” in Part II, and elsewhere in this report. Any of these factors, or a combination of such factors, could materially affect the results of our operations and whether forward-looking statements we make ultimately prove to be accurate.
Except to the extent otherwise required by federal securities law, we do not undertake any obligation to update our forward-looking statements to reflect events or circumstances after the date they are made or to reflect the occurrence of unanticipated events.
The following table provides information about purchases by Insperity during the
three months ended September 30, 2018
of equity securities that are registered by Insperity pursuant to Section 12 of the Exchange Act:
|
Period |
Total Number of Shares Purchased
(1)
|
Average Price Paid per Share
|
Total Number of Shares Purchased Under Announced Program
(2)
|
Maximum Number of Shares Available for Purchase under Announced Program
(2)
|
|||||
|
07/01/2018 – 07/31/2018
|
96
|
|
$
|
97.00
|
|
—
|
|
2,597,564
|
|
|
08/01/2018 – 08/31/2018
|
—
|
|
—
|
|
—
|
|
2,597,564
|
|
|
|
09/01/2018 – 09/30/2018
|
—
|
|
—
|
|
—
|
|
2,597,564
|
|
|
|
Total
|
96
|
|
$
|
97.00
|
|
—
|
|
||
|
(1)
|
During the three months ended
September 30, 2018
,
96
shares of stock were withheld to satisfy tax-withholding obligations arising in conjunction with the vesting of restricted stock awards. The required withholding is calculated using the closing sales price reported by the New York Stock Exchange on the date prior to the applicable vesting date. These shares are not subject to the repurchase program described above.
|
|
(2)
|
Our Board of Directors (the “Board”) has approved a program to repurchase shares of our outstanding common stock. As of
September 30, 2018
, we were authorized to repurchase an additional
2,597,564
shares under the program. Unless terminated earlier by resolution of the Board, the repurchase program will expire when we have repurchased all shares authorized for repurchase under the repurchase program.
|
|
Insperity | 2018 Third Quarter Form 10-Q
|
35
|
|
|
OTHER INFORMATION
|
|
Exhibit No
|
Exhibit
|
|
|
31.1
|
*
|
|
|
31.2
|
*
|
|
|
32.1
|
**
|
|
|
32.2
|
**
|
|
|
101.INS
|
*
|
XBRL Instance Document.
(1)
|
|
101.SCH
|
*
|
XBRL Taxonomy Extension Schema Document.
|
|
101.CAL
|
*
|
XBRL Taxonomy Extension Calculation Linkbase Document.
|
|
101.DEF
|
*
|
XBRL Extension Definition Linkbase Document.
|
|
101.LAB
|
*
|
XBRL Taxonomy Extension Label Linkbase Document.
|
|
101.PRE
|
*
|
XBRL Taxonomy Extension Presentation Linkbase Document.
|
|
____________________________________
|
|||
|
*
|
Filed with this report.
|
||
|
**
|
Furnished with this report.
|
||
|
(1)
|
Attached as exhibit 101 to this report are the following documents formatted in XBRL (Extensible Business Reporting Language): (1) the Consolidated Statements of Operations for the
three and nine
month periods ended
September 30, 2018
and
2017
; (2) the Consolidated Balance Sheets at
September 30, 2018
and
December 31, 2017
; (3) the Consolidated Statement of Stockholders’ Equity for the
nine
month period ended
September 30, 2018
; (4) the Consolidated Statements of Cash Flows for the
nine
month periods ended
September 30, 2018
and
2017
; and (5) Notes to the Consolidated Financial Statements.
|
|
Insperity | 2018 Third Quarter Form 10-Q
|
36
|
|
SIGNATURES
Pursuant to the requirements of the Securities Exchange Act of 1934, the registrant has duly caused this report to be signed on its behalf by the undersigned thereunto duly authorized.
|
|
INSPERITY, INC.
|
|
|
|
|
|
|
Date: November 1, 2018
|
By:
|
/s/ Douglas S. Sharp
|
|
|
|
Douglas S. Sharp
|
|
|
|
Senior Vice President of Finance,
|
|
|
|
Chief Financial Officer and Treasurer
|
|
|
|
(Principal Financial Officer)
|
|
Insperity | 2018 Third Quarter Form 10-Q
|
37
|
|
TABLE OF CONTENTS
Part IItem 1. Financial StatementsItem 2. Management S Discussion and Analysis Of Financial Condition and Results Of OperationsItem 3. Quantitative and Qualitative Disclosures About Market RiskItem 4. Controls and ProceduresPart IIItem 1. Legal ProceedingsItem 1A. Risk FactorsItem 2. Unregistered Sales Of Equity Securities and Use Of ProceedsItem 6. Exhibits