UNITED STATES
SECURITIES AND EXCHANGE COMMISSION
Washington, D.C. 20549
FORM
20-F
(Mark One)
OR
For the fiscal year ended
|
|
OR
OR
Date of event requiring this shell company report . . . . . . . . . . . . . . . . . . .
For the transition period from ___________________________ to ___________________________
Commission file number:
001-37877
The Bank of N.T. Butterfield & Son Limited
(Exact name of Registrant as specified in its charter)
(Jurisdiction of incorporation or organization)
(Address of principal executive offices)
Telephone: (
441
)
295-1111
; Fax:
(441) 292-4365
E-mail:
Shaun.Morris@Butterfieldgroup.com
(Name, Telephone, E-mail and/or Facsimile number and Address of Company Contact Person)
Securities registered or to be registered pursuant to Section 12(b) of the Act.
|
Title of each class
|
Trading Symbol (s)
|
Name of each exchange on which registered
|
|
|
|
|
|
|
|
Bermuda Stock Exchange
|
Securities registered or to be registered pursuant to Section 12(g) of the Act:
None
Securities for which there is a reporting obligation pursuant to Section 15(d) of the Act:
None
Indicate the number of outstanding shares of each of the issuer’s classes of capital or common stock as of the close of the
period covered by the annual report.
As at December 31, 2019, there were
53,005,177
shares of the registrant's common stock outstanding.
Indicate by check mark if the registrant is a well-known seasoned issuer, as defined in Rule 405 of the Securities Act.
x
Yes
o
No
If this report is an annual or transition report, indicate by check mark if the registrant is not required to file reports pursuant to Section 13 or 15(d) of the Securities Exchange Act of 1934.
o
Yes
x
No
Note – Checking the box above will not relieve any registrant required to file reports pursuant to Section 13 or 15(d) of the
Securities Exchange Act of 1934 from their obligations under those Sections.
Indicate by check mark whether the registrant (1) has filed all reports required to be filed by Section 13 or 15(d) of the Securities Exchange Act of 1934 during the preceding 12 months (or for such shorter period that the registrant was required to file such reports), and (2) has been subject to such filing requirements for the past 90 days.
x
Yes
o
No
Indicate by check mark whether the registrant has submitted electronically every Interactive Data File required to be submitted pursuant to Rule 405 of Regulation S-T (§232.405 of this chapter) during the preceding 12 months (or for such shorter period that the registrant was required to submit and post such files).
x
Yes
o
No
Indicate by check mark whether the registrant is a large accelerated filer, an accelerated filer, or a non-accelerated filer. See
definition of “accelerated filer and large accelerated filer” in Rule 12b-2 of the Exchange Act. (Check one):
Indicate by check mark which basis of accounting the registrant has used to prepare the financial statements included in this filing:
International Financial Reporting Standards as issued by the International Accounting Standards Board
o
Other
o
If “Other” has been checked in response to the previous question, indicate by check mark which financial statement item the
registrant has elected to follow.
o
Item 17
o
Item 18
If this is an annual report, indicate by check mark whether the registrant is a shell company (as defined in Rule 12b-2 of the
Exchange Act).
TABLE OF CONTENTS
|
Cross Reference Sheet
|
|
|
Explanatory Note
|
|
|
Implications of Being a Foreign Private Issuer
|
|
|
Cautionary Note Regarding Forward-Looking Statements
|
|
|
Information on the Company
|
|
|
Selected Consolidated Financial and Other Data
|
|
|
Risk Factors
|
|
|
Market Information
|
|
|
Dividend Policy
|
|
|
Management’s Discussion and Analysis of Financial Condition and Results of Operations
|
|
|
Selected Statistical Data
|
|
|
Risk Management
|
|
|
Supervision and Regulation
|
|
|
Management
|
|
|
Major Shareholders and Related Party Transactions
|
|
|
Certain Taxation Considerations
|
|
|
Enforcement of Civil Liabilities
|
|
|
Disclosure Control and Procedures
|
|
|
Principal Accountant Fees and Services
|
|
|
Issuer Purchases of Equity Securities
|
|
|
Where You Can Find More Information
|
|
|
Index to the Financial Statements
|
|
CROSS REFERENCE SHEET
Form 20-F
|
Item Caption
|
Location
|
Page
|
||||
|
Part I
|
||||||
|
Item 1
|
Identity of Directors, Senior Management and Advisors
|
Not Applicable
|
N/A
|
|||
|
Item 2
|
Offer Statistics and Expected Timetable
|
Not Applicable
|
N/A
|
|||
|
Item 3
|
Key Information
|
Explanatory Note
|
||||
|
Risk Factors
|
||||||
|
Selected Consolidated Financial and Other Data
|
||||||
|
Item 4
|
Information on the Company
|
Information on the Company
|
||||
|
Supervision and Regulation
|
||||||
|
Where You Can Find More Information
|
||||||
|
Item 4A
|
Unresolved Staff Comments
|
Not Applicable
|
N/A
|
|||
|
Item 5
|
Operating and Financial Review and Prospects
|
Management's Discussion and Analysis of Financial Condition and Results of Operations
|
||||
|
Item 6
|
Directors, Senior Management and Employees
|
Information on the Company
|
||||
|
Management
|
||||||
|
Major Shareholders and Related Party Transactions
|
||||||
|
Item 7
|
Major Shareholders and Related Party Transactions
|
Major Shareholders and Related Party Transactions
|
||||
|
Item 8
|
Financial Information
|
Reports of Independent Registered Public Accounting Firms
|
||||
|
Consolidated Financial Statements and Notes to the Consolidated Financial Statements
|
||||||
|
Dividend Policy
|
||||||
|
Item 9
|
The Offer and Listing
|
Market Information
|
||||
|
Item 10
|
Additional Information
|
Management
|
||||
|
Supervision and Regulation
|
||||||
|
Certain Taxation Considerations
|
||||||
|
Item 11
|
Quantitative and Qualitative Disclosures about Market Risk
|
Risk Management
|
||||
|
Item 12
|
Description of Securities other than Equity Securities
|
Not Applicable
|
N/A
|
|||
|
Part II
|
||||||
|
Item 13
|
Defaults, Dividend Arrearages and Delinquencies
|
None
|
N/A
|
|||
|
Item 14
|
Material Modifications to the Rights of Security Holders and Use of Proceeds
|
Not Applicable
|
N/A
|
|||
|
Item 15
|
Controls and Procedures
|
Disclosure Controls and Procedures
|
||||
|
Item 16A
|
Audit Committee Financial Expert
|
Management - Audit Committee
|
||||
|
Item 16B
|
Code of Ethics
|
Management - Code of Conduct and Ethics and Whistleblower Policy
|
||||
|
Item 16C
|
Principal Accountant Fees and Services
|
Principal Accountant Fees and Services
|
||||
|
Item 16D
|
Exemption from the Listing Standards for Audit Committees
|
Not Applicable
|
N/A
|
|||
|
Item 16E
|
Purchases of Equity Securities by the Issuer and Affiliated Purchasers
|
Issuer Purchases of Equity Securities
|
||||
|
Item 16F
|
Changes in Registrant's Certifying Accountant
|
Not Applicable
|
N/A
|
|||
|
Item 16G
|
Significant Differences in Corporate Governance Practices
|
Management - Foreign Private Issuer Status
|
||||
|
Item 16H
|
Mine Safety Disclosure
|
Not Applicable
|
N/A
|
|||
i
ii
EXPLANATORY NOTE
In this report, unless the context indicates otherwise, the term:
|
•
|
"
Bank
" or "
Butterfield
" refers to:
|
|
•
|
The Bank of N.T. Butterfield & Son Limited;
|
|
•
|
"
BMA
" refers to:
|
|
•
|
The Bermuda Monetary Authority;
|
|
•
|
"
Board
" refers to:
|
|
•
|
The Board of Directors of the Bank;
|
|
•
|
"
IPO
" refers to:
|
|
•
|
our initial public offering on the New York Stock Exchange of 12,234,042 common shares completed on September 21, 2016;
|
|
•
|
"
common shares
" refers to:
|
|
•
|
the voting ordinary shares of par value BM$ 0.01 each in the Bank; and
|
|
•
|
"
we
", "
our
", "
us
", "
the Company
" and "
the Group
" refer to:
|
|
•
|
the Bank and its consolidated subsidiaries.
|
PRESENTATION OF FINANCIAL AND OTHER INFORMATION
In this report, references to “
BMD
”, “
BM$
”, or “
Bermuda Dollars
” are to the lawful currency of Bermuda, and “
USD
”, “
US$
”, “
$
” and “
US Dollars
” are to the lawful currency of the United States of America. The Bermuda Dollar is pegged to the US Dollar on a one‑to‑one basis and therefore, for all periods presented, BM$1.00 = US$1.00.
Certain monetary amounts, percentages and other figures included in this report have been subject to rounding adjustments. Accordingly, figures shown as totals in certain tables may not be the arithmetic aggregation of the figures that precede them, and figures expressed as percentages in the text may not total 100% or, as applicable, when aggregated may not be the arithmetic aggregation of the percentages that precede them.
Our consolidated financial statements as at
December 31, 2019
and
2018
and for the years ended
December 31, 2019
,
2018
and
2017
have been audited, as stated in the report appearing herein, by PricewaterhouseCoopers Ltd., Bermuda, and are included in this report and are referred to as our audited consolidated financial statements. We have prepared these financial statements in accordance with generally accepted accounting principles in the United States of America (“
GAAP
”).
We believe that the non‑GAAP measures included in this report provide valuable information to readers because they enable the reader to identify the financial measures we use to track the performance of our business and guide management. Furthermore, these measures provide readers with valuable information regarding our core activities, which allows for a more meaningful evaluation of relevant trends when considered in conjunction with measures calculated in accordance with GAAP. Non‑GAAP measures used in this report are not a substitute for GAAP measures and readers should consider the GAAP measures as well. For more information on non‑GAAP measures, including a reconciliation to the most directly comparable GAAP financial measures, see “Selected Consolidated Financial and Other Data — Reconciliation of Non‑GAAP Financial Measures”.
INDUSTRY AND MARKET DATA
Some of the discussion contained in this report relies on certain market and industry data obtained from third‑party sources that we believe to be reliable. Market estimates are calculated by using independent industry publications and third‑party forecasts in conjunction with our assumptions about our markets. While we believe the industry and market data to be reliable as of the date of this report, this information is subject to change based on various factors, including those discussed under the headings “Cautionary Note Regarding Forward‑Looking Statements” and “Risk Factors” in this report.
TRADEMARKS AND SERVICE MARKS
We own or have rights to trademarks and service marks for use in connection with the operation of our business. All other trademarks or service marks appearing in this report that are not identified as marks owned by us are the property of their respective owners. Solely for convenience, the trademarks, service marks and trade names referred to in this report are listed without the
®
, (TM) and (sm) symbols, but we will assert, to the fullest extent under applicable law, our applicable rights in these trademarks, service marks and trade names.
iii
IMPLICATIONS OF BEING A FOREIGN PRIVATE ISSUER
We are a foreign private issuer, and so long as we qualify as a foreign private issuer under the Securities Exchange Act of 1934 (the "Exchange Act"), we will be exempt from certain provisions of the Exchange Act that are applicable to US domestic public companies, including:
|
•
|
the sections of the Exchange Act regulating the solicitation of proxies, consents or authorizations in respect of a security registered under the Exchange Act;
|
|
•
|
the sections of the Exchange Act requiring insiders to file public reports of their share ownership and trading activities and liability for insiders who profit from trades made in a short period of time;
|
|
•
|
the rules under the Exchange Act requiring the filing with the Securities and Exchange Commission (the "SEC") of quarterly reports on Form 10‑Q containing unaudited financial and other specified information, or current reports on Form 8‑K, upon the occurrence of specified significant events; and
|
|
•
|
Regulation Fair Disclosure ("Regulation FD"), which regulates selective disclosures of material information by issuers.
|
We are, however, required to file an annual report on Form 20‑F within four months of the end of each fiscal year. In addition, we have published and intend to continue to publish our results on a quarterly basis through press releases, distributed pursuant to the rules and regulations of the New York Stock Exchange (the "NYSE"). Press releases related to financial results and material events have been and will continue to be furnished to the SEC on Form 6‑K. However, the information we are required to file with or furnish to the SEC is less extensive and less timely compared to that required to be filed with the SEC by U.S. domestic issuers. As a result, you may not be afforded the same protections or information that would be made available to you, were you investing in a U.S. domestic issuer. For additional discussion on our foreign private issuer status, see “Management — Foreign Private Issuer Status”.
iv
CAUTIONARY NOTE REGARDING FORWARD-LOOKING STATEMENTS
This annual report contains forward-looking statements. Forward-looking statements are neither historical facts nor assurances of future performance. Instead, they are based on our current beliefs, expectations or assumptions regarding the future of our business, future plans and strategies, our operational results and other future conditions. Forward-looking statements can be identified by words such as "anticipate," "believe," "estimate," "expect," "intend," "may," "plan," "predict," "project," "seek," "target," "potential," "will," "would," "could," "should," "continue," "contemplate" and other similar expressions, although not all forward-looking statements contain these identifying words. These forward-looking statements include all matters that are not historical facts. They appear in a number of places throughout this annual report and include statements regarding our intentions, beliefs or current expectation concerning, among other things, our results of operations, financial condition, capital and liquidity requirements, prospects, growth, strategies and the industry in which we operate.
There are important factors that could cause actual results to differ materially from those contemplated by such forward-looking statements. By their nature, forward-looking statements involve risks and uncertainties because they relate to events and depend on circumstances that may or may not occur in the future. We believe that these risks and uncertainties include, but are not limited to, those described in the "Risk Factors" section of this annual report, which include, but are not limited to, the following:
|
•
|
changes in economic and market conditions, particularly in our primary markets;
|
|
•
|
the impact of geopolitical events;
|
|
•
|
changes in market interest rates;
|
|
•
|
the lack of a central bank or lender of last resort in Bermuda and certain other jurisdictions in our primary markets;
|
|
•
|
a decline in tourism in Bermuda or certain other jurisdictions in our primary markets;
|
|
•
|
severe weather and natural disasters disrupting our business;
|
|
•
|
competition in the markets in which we operate;
|
|
•
|
our ability to successfully execute our business plan and implement our growth strategy;
|
|
•
|
our ability to successfully expand our business through acquisitions or investments;
|
|
•
|
our ability to successfully develop and commercialize new or enhanced products and services;
|
|
•
|
damage to our reputation from any of the factors described in this section, in "Risk Factors" and in "Management's Discussion and Analysis of Financial Condition and Results of Operations";
|
|
•
|
a decline in the residential real estate markets in Bermuda, the Cayman Islands or the Channel Islands and the United Kingdom ("UK");
|
|
•
|
our reliance on appraisals and valuation techniques;
|
|
•
|
changes in the value of our investment portfolio;
|
|
•
|
fluctuations in foreign currency exchange rates;
|
|
•
|
fluctuations in interest rates and inflation;
|
|
•
|
prepayments of our loan and investment portfolios;
|
|
•
|
our access to sources of liquidity and capital to address our liquidity needs;
|
|
•
|
our reliance on other financial institutions and counterparties, such as clearing houses;
|
|
•
|
changes in banks' inter-bank lending rate reporting practices;
|
|
•
|
our ability to attract and retain wealth management, trust and banking clients;
|
|
•
|
a decline in our credit ratings;
|
|
•
|
our ability to attract and maintain highly skilled and qualified employees, including our senior management, other key employees and members of the Board;
|
|
•
|
our reliance on third-party vendors;
|
|
•
|
our reliance on representations provided to us about clients and counterparties;
|
|
•
|
our exposure to litigation and regulatory actions;
|
|
•
|
our ability to protect our intellectual property;
|
|
•
|
the effectiveness of our insurance coverage;
|
|
•
|
our reliance on the effective implementation, use and protection of technology systems used by us and by our vendors;
|
|
•
|
our ability to identify and address cyber-security risks;
|
|
•
|
the effectiveness of our internal disclosure controls and procedures;
|
|
•
|
the adequacy of our risk management framework, systems and processes;
|
|
•
|
the complex and changing regulatory environment in which we operate, including any changing regulatory requirements and restrictions placed on us by our principal regulator, the BMA, and other regulators, as well as our ability to comply with regulatory schemes in multiple jurisdictions;
|
|
•
|
our effectiveness in complying with applicable privacy, data security and data protection laws;
|
|
•
|
changes in accounting policies;
|
|
•
|
our effectiveness in complying with applicable anti-corruption legislations;
|
|
•
|
the impact of decisions made by the Financial Action Task Force ("FATF") relating to our operating jurisdictions;
|
|
•
|
the impact of economic substance legislation and regulations in our operating jurisdictions;
|
|
•
|
the impact of proposed tax reform in Bermuda; and
|
|
•
|
the impact of US Federal income tax and tax information reporting requirements.
|
These factors should not be construed as exhaustive and should be read with the other cautionary statements in this annual report.
Although we base these forward-looking statements on assumptions that we believe are reasonable when made, we caution you that forward-looking statements are not guarantees of future performance and that our actual results of operations, financial condition and liquidity, and the development of the industry in which we operate may differ materially from those made in or suggested by the forward-looking statements contained in this report. In addition, even if our results of operations, financial condition and
v
liquidity, and the development of the industry in which we operate, are consistent with the forward-looking statements contained in this report, those results or developments may not be indicative of results or developments in subsequent periods.
Given these risks and uncertainties, you are cautioned not to place undue reliance on these forward-looking statements. Any forward-looking statement that we make in this report speaks only as of the date of such statement. Except to the extent required by applicable law, we undertake no obligation to update any forward-looking statements or to publicly announce the results of any revisions to any of those statements to reflect future events or developments. Comparisons of results for current and any prior periods are not intended to express any future trends or indications of future performance, unless specifically expressed as such, and should only be viewed as historical data.
vi
INFORMATION ON THE COMPANY
Overview
We are a full service bank and wealth manager headquartered in Hamilton, Bermuda. We operate our business through three geographic segments: Bermuda, the Cayman Islands, and the Channel Islands and the UK. We offer banking services, comprising of retail and corporate banking, treasury services, and wealth management, which consists of investment management, advisory and brokerage services, trust, estate, and company management in both our Bermuda and Cayman Islands segments, as well as custody services in our Bermuda segment. The Channel Islands and the UK segment include the jurisdictions of Guernsey and Jersey (Channel Islands), and the UK. In the Channel Islands, a broad range of services are provided to private clients and financial intermediaries including private banking and treasury services, internet banking, wealth management and fiduciary services. The UK jurisdiction provides mortgage services for high-value residential properties. We also have operations in the jurisdictions of The Bahamas, Canada, Mauritius, Singapore and Switzerland, which we include in our Other segment.
For the year ended
December 31, 2019
we generated
$532.6 million
in net revenue after provision for credit losses and other gains/losses ("net revenue"). Our total net revenue, before inter-segment eliminations, by each of our three geographic segments and our non-reportable "Other" segment for the years ended December 31,
2019
,
2018
and
2017
are as follows:
|
For the year ended
|
|||||||||||
|
In millions of $
|
2019
|
2018
|
2017
|
||||||||
|
Net Revenue
|
|||||||||||
|
Bermuda
|
$
|
272.1
|
|
$
|
299.4
|
|
$
|
268.7
|
|
||
|
Cayman Islands
|
$
|
168.9
|
|
$
|
152.6
|
|
$
|
133.1
|
|
||
|
Channel Islands and the UK
|
$
|
82.9
|
|
$
|
59.0
|
|
$
|
46.8
|
|
||
|
Other
|
$
|
22.2
|
|
$
|
15.2
|
|
$
|
11.6
|
|
||
Our net revenue for the year ended
December 31, 2019
consisted of
49.8%
from our Bermuda segment,
30.9%
from our Cayman Islands segment,
15.2%
from our Channel Islands and the UK segment and
4.1%
from our Other segment. As at
December 31, 2019
, we had
$13.9 billion
in total assets,
$5.1 billion
in net loans,
$12.4 billion
in customer deposits (54% USD deposits, 15% USD-pegged deposits),
$91.7 billion
and
$30.3 billion
, respectively, of trust and custody businesses assets under administration ("AUA"), and
$5.6 billion
of assets under management ("AUM").
In our Bermuda and Cayman Islands segments, our bank provides a full range of retail and corporate banking services to individuals, local businesses, captive insurers, reinsurance companies, trust companies, and hedge funds. The key products we offer include personal and business deposit services, residential and commercial mortgages, small and medium-sized enterprise and corporate loans, credit and debit card suite, merchant acquiring, mobile and internet banking, and cash management.
In all of our segments, we offer wealth management to high net worth and ultra-high net worth individuals, family offices, and institutional and corporate clients. Our wealth management platform has three lines of business: trust, private banking, and asset management.
The trust business line, which utilizes specialists in each of our geographic areas, responds to client needs in estate and succession planning, administration of complex asset holdings, and efficient coordination of family affairs. In addition, the business provides pension and employee benefits services for multinational corporations, as well as services that involve administration of and fiduciary responsibility for customized trust structures holding a wide range of asset types including financial assets, property, business assets, and art.
Our private banking business line offers access to a suite of services, targeted toward high net worth and ultra-high net worth individuals, trusts, and family offices, that can be customized to each client's needs and preferences and delivered as part of a coordinated strategy by a dedicated private banker. We provide clients in our Bermuda, Cayman Islands, and Channel Islands and the UK segments with an integrated model that combines traditional wealth management with banking, lending, cash management, foreign exchange services, custody and access to asset management and trust professionals within Butterfield. We also provide our clients with immediate access to their account information through the use of internet and mobile banking.
Our asset management business line provides a broad range of portfolio management services to institutional and private clients. Our target client base includes institutions such as pension funds and captive insurance companies with investable assets over $10 million and private clients such as high net worth and ultra-high net worth individuals, families, and trusts with investable assets over $1 million. Our principal services include discretionary investment management, managed portfolio services, money market, and mutual fund offerings. We also offer advisory and self-directed brokerage options. Over 90% of the business's discretionary investment mandates call for balanced growth to conservative allocations. We focus on delivery of reasonable appreciation with an emphasis on capital preservation. The Bank relies on third parties to provide research and investment management expertise, while our own services are concentrated on portfolio construction and managing client relationships. We also provide customized reporting to meet specific needs of our major clients.
From
2015
to
2019
, our GAAP net income to common shareholders and our core net income to common shareholders (‘‘Core Net Income to Common
’
’)
(1)
had compound annual growth rates (‘‘CAGR’’) of
24%
and
15%
, respectively. Our earnings generation has allowed us to build capital to return to shareholders and invest strategically, both organically and through acquisitions, to further enhance the growth prospects of our Company. We aim to continue to build excess capital in the future, which we can redeploy into growing our business and return to shareholders.
______________________________
|
(1)
|
Core Net Income to Common is a non-GAAP financial measure that is calculated by adjusting net income for income or expense items which management considers not to be representative of the ongoing operations of our business and preference share dividends, guarantee fees and premiums paid on preference share buybacks and redemptions. For a reconciliation of Core Net Income to Common to GAAP net income to common, see "Selected Consolidated Financial and Other Data - Reconciliation of Non-GAAP Financial Measures".
|
1
Our History
The origin of The Bank of N.T. Butterfield & Son Limited traces back to 1784, to the founding of the trading firm of Nathaniel Butterfield. In 1858, our company was established as a bank in Bermuda and has been instrumental to the local economy ever since. The Bank was later incorporated under a special act of the local Parliament in 1904. In the 1960s, as international businesses began contributing substantially to Bermuda's economy, we developed services to work to meet their needs. In 1967, we opened offices in the Cayman Islands and by the 1980s had expanded our operations to include retail banking, investment management, and fund administration. In 1973, we opened our Guernsey office in order to provide customers with access to the Pound Sterling currency after Bermuda's departure from the British Sterling zone. In addition to being Bermuda's first bank, we opened the first ATMs in Bermuda in the 1980s and launched Bermuda's first internet banking service in 2001. In 1971, we listed our common shares on the BSX ("Bermuda Stock Exchange") under the ticker symbol "NTB.BH". In 2016, we listed our common shares on the NYSE under the ticker symbol "NTB".
In 2008 and 2009, as a result of the global financial crisis, we realized losses attributable primarily to US non-agency mortgage backed securities in our investment portfolio, as well as write-downs on local market hospitality loans. To raise capital to offset these losses, the Bank executed a $200 million preference share offering in June 2009. In 2009 and 2010, we implemented a comprehensive restructuring plan for the Company: we hired a new management team, de-risked our balance sheet, and raised $550 million of common equity from a group of investors that included Carlyle Global Financial Services and related entities (collectively, "The Carlyle Group" or "Carlyle") and Canadian Imperial Bank of Commerce ("CIBC"), as well as existing shareholders. As part of the transaction, we launched a rights offering of $130 million on April 12, 2010, so as to allow the pre-transaction shareholders to participate in the recapitalization of the Company. The rights offering, which closed on May 12, 2010, was fully subscribed to, and the proceeds were used to repurchase shares from the recapitalization investors. As a result, the recapitalization investors' total investment was reduced to $420 million.
Since our restructuring, we have pursued a strategy to focus on our core business in banking and wealth management. We have executed upon our strategy by streamlining the Company's operations through exiting non-core markets, repositioning our balance sheet, investing in efficiency initiatives, and continuing to invest in our core business lines to grow both organically and through acquisitions. By following this strategy, we have improved our financial results and have been able to initiate a progressive capital return policy for investors. The following items were key steps in executing our strategy:
|
•
|
In 2010, we sold our operations in Hong Kong and Malta, and in 2012, we sold our operations in Barbados as they were no longer consistent with our strategy.
|
|
•
|
In 2010, we sold $820 million of asset-backed securities to cleanse our investment portfolio.
|
|
•
|
In 2013, we implemented an annual cash dividend of $0.40 per year plus a $0.10 per year special dividend.
|
|
•
|
In 2014, we completed two acquisitions, which allowed us to both expand and complement our existing business lines: Legis Group Holdings' Guernsey-based trust and corporate services business, as well as a significant portion of HSBC's corporate and retail banking business in the Cayman Islands.
|
|
•
|
In April 2015, CIBC sold its 19% ownership stake. We repurchased and retired 8 million shares for a total of $120 million, and The Carlyle Group purchased CIBC's remaining 2.3 million shares and subsequently sold them to other existing investors.
|
|
•
|
In December 2015, we repositioned our balance sheet to better match the duration of our assets and liabilities and to reclassify a portion of our Available-for-sale ("AFS") portfolio as Held-to-maturity ("HTM").
|
|
•
|
In February 2016, we commenced an orderly wind-down ("OWD") of our UK operations. We exited our private banking and asset management operations in our UK segment, but retained our UK high net worth and ultra-high net worth mortgage lending business. The OWD was completed by early 2017 with the change in the business operations to mortgage lending services and the change of name of our UK operations to Butterfield Mortgages Limited. The excess capital in the UK was released early in 2017, which we invested in other areas of our business.
|
|
•
|
In April 2016, we completed an acquisition of HSBC's Bermuda trust business and private banking investment management operations that added $1.6 billion of deposits to our balance sheet. As part of the transaction, HSBC also entered into an agreement to refer its existing private banking clients to Butterfield.
|
|
•
|
In September 2016, we successfully completed a $288 million initial public offering and listing on the NYSE, through which we raised approximately $126 million in net primary proceeds.
|
|
•
|
In December 2016, we redeemed and canceled all of our issued and outstanding preference shares, which had a book value of $183 million, removing approximately $16 million of annual preference dividend and guarantee fees. We also repurchased for cancellation the outstanding warrant from the Government of Bermuda, removing a potentially dilutive instrument.
|
|
•
|
In February 2017, we successfully completed a first follow-on offering of 10,989,163 Common Shares. Following the closing of the offering, The Carlyle Group no longer held any Common Shares and the Investment Agreement between Butterfield and Carlyle was terminated.
|
|
•
|
In October 2017, we entered into an agreement to acquire Deutsche Bank AG’s ("Deutsche Bank's") Global Trust Solutions (“GTS”) business, excluding its US operations. Upon completion of the transaction, Butterfield took over the ongoing management and administration of the GTS portfolio, comprising approximately 1,000 trust structures for some 900 private clients in Guernsey, Switzerland, the Cayman Islands and Singapore. As part of the deal, we also purchased a service company in Mauritius to provide operations and support services to the Cayman Islands and the Channel Islands banking and custody businesses. This transaction was completed in March 2018.
|
|
•
|
In February 2018, we entered into an agreement to acquire Deutsche Bank’s banking and custody business in the Cayman Islands, Jersey and Guernsey, which provides services primarily to financial intermediaries and corporate clients. The Bank began to onboard certain customer deposits relating to the acquisition in 2018, and this onboarding activity was completed in the first half of 2019.
|
|
•
|
In May 2018, we issued $75 million of 5.25% Fixed to Floating Rate Subordinated Notes due 2028 to repay a portion of our outstanding indebtedness and for other general corporate purposes.
|
|
•
|
In July 2019, we completed the acquisition of ABN AMRO (Channel Islands) Limited ("ABN AMRO (Channel Islands)"), which provides banking, investment management and custody products to three distinct client groups, including trusts, private clients, and funds.
|
Our Markets
As at
December 31, 2019
,
37%
of our total assets were held by our Bermuda segment,
27%
by our Cayman Islands segment, and
36%
were held by our Channel Islands and the UK segment. As at
December 31, 2019
, our Bermuda segment had
$5.2 billion
of assets,
$44.4 billion
and
$15.2 billion
of trust and custody businesses AUA, respectively, and
$4.0 billion
of AUM, our Cayman Islands segment had
$3.8 billion
of assets,
$7.7 billion
and
$2.6 billion
of trust and custody businesses AUA, respectively and
$0.8 billion
of AUM, and our Channel Islands and the UK segment had
$5.1 billion
of assets,
$20.4 billion
and
$12.5 billion
of trust and custody businesses AUA, respectively and
$0.8 billion
of AUM.
2
The charts below provide the geographic distribution of our Net Revenue for the year ended
December 31, 2019
.
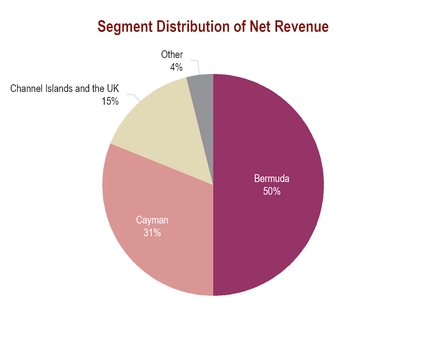
2019
Net Revenue:
$532.6 million
The Bermuda and Cayman Islands banking markets have historically been characterized by a limited number of participants and significant barriers to entry. In addition, these markets provide us with access to several attractive customer bases: in retail banking, we serve local residents and businesses; in corporate banking, we serve captive insurers, hedge funds, middle-market reinsurers, and other corporates; and in wealth management, we serve private trust clients and high net worth and ultra-high net worth individuals and families.
The international trust market is primarily concentrated in select jurisdictions, including Bermuda, the Cayman Islands, Guernsey, Jersey, Hong Kong, Singapore, and Switzerland. The leading international trust law firms serve as key introducers of clients to Butterfield and are the primary source of new business. Trust clients often hold assets that are international in nature, and as a result, performance of trust businesses is not generally linked to performance of the domestic economies where clients are served.
The private banking market in Bermuda, the Cayman Islands, and Guernsey is composed largely of resident high net worth and ultra-high net worth individuals meeting minimum deposit and/or loan thresholds. Clients are introduced to the private bank through Butterfield's retail banking operation upon reaching the appropriate deposit or loan threshold, Butterfield's trust and asset management arms, as well as through external introducers. Although locally based, private banking clients often hold international assets, and as a result, business performance is not necessarily correlated to the domestic economies where clients are served.
Our asset management business line operates in Bermuda, the Cayman Islands, and Guernsey. As at
December 31, 2019
,
70%
of our AUM was in Bermuda,
15%
was in the Cayman Islands, and
15%
was in Guernsey. In Bermuda and the Cayman Islands, a majority of our institutional and private clients are domestic from a domicile perspective while a majority of our clients in Guernsey are tied to our trust business and are international in nature.
Corporate Information
We are a company incorporated under the laws of Bermuda, incorporated on October 22, 1904, pursuant to the The N.T. Butterfield & Son Bank Act, 1904 (the "Butterfield Act"). We are registered with the Registrar of Companies in Bermuda under registration number 2106. Our registered office and principal executive offices are located at 65 Front Street, Hamilton, HM 12, Bermuda. Our agent for service of process in the United States is C T Corporation System, 28 Liberty Street, New York, New York 10005. Our telephone number is (441) 295 1111. We maintain a website at www.butterfieldgroup.com. Neither this website nor the information on or accessible through this website is included or incorporated in, or is a part of, this report.
The SEC maintains an internet site at https://www.sec.gov that contains reports, information statements, and other information regarding issuers that file electronically with the SEC.
3
Our International Network and Group Structure
The following map presents the several geographic regions in which our business operates
.
Non-client facing support centers in Canada and Mauritius are not shown.

The following chart presents our corporate structure, indicating our principal regulated subsidiaries as at
December 31, 2019
. All of the subsidiaries listed below are wholly owned by the Bank.
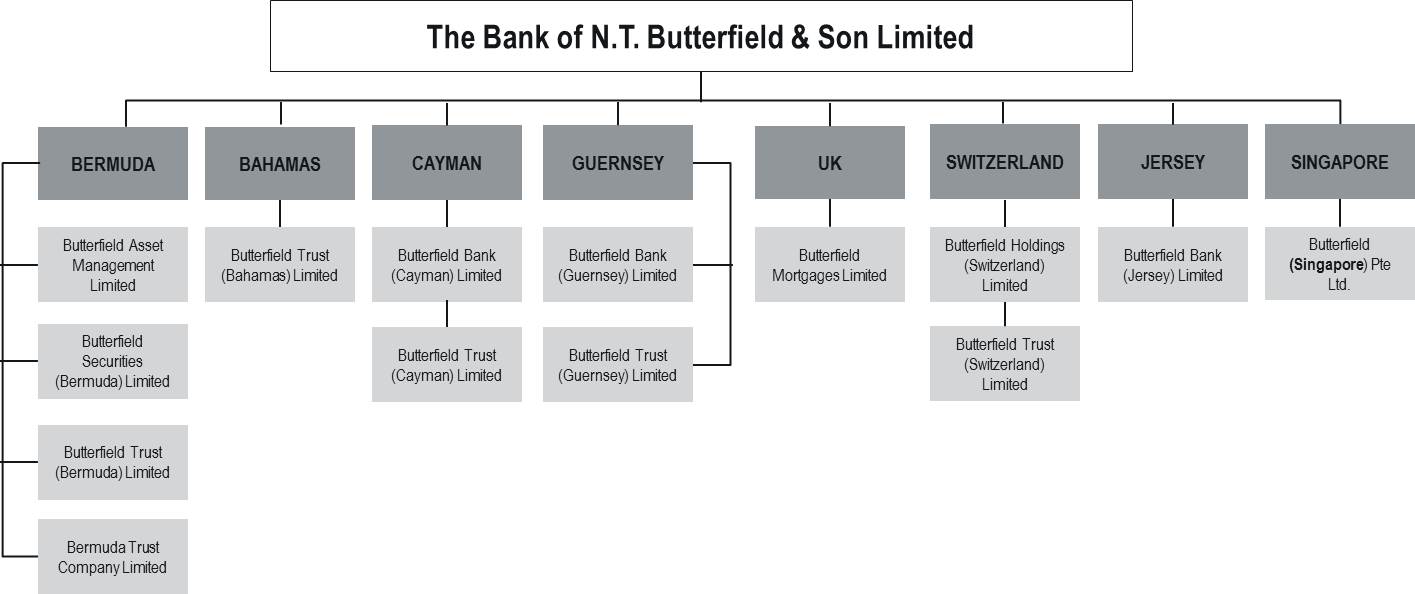
Bermuda
The Bank itself is licensed in Bermuda to provide banking services and wealth management services. Through Butterfield Asset Management Limited, it is licensed and provides asset management services and, through Butterfield Trust (Bermuda) Limited and Bermuda Trust Company Limited, it is licensed and provides corporate trustee, fiduciary and corporate administration services. Butterfield Securities (Bermuda) Limited provides investment advisory and listing sponsor services.
Cayman Islands
Butterfield Bank (Cayman) Limited provides banking services and Butterfield Trust (Cayman) Limited provides trustee, fiduciary and corporate administration services.
Guernsey
Butterfield Bank (Guernsey) Limited provides private banking, custody and administered banking services. Butterfield Trust (Guernsey) Limited provides trustee and fiduciary services.
Bahamas
Butterfield Trust (Bahamas) Limited provides trust and fiduciary services.
4
Switzerland
Butterfield Holdings (Switzerland) Limited provides investment services and Butterfield Trust (Switzerland) Limited provides trust and fiduciary services.
United Kingdom
Butterfield Mortgages Limited provides residential property lending services.
Singapore
Butterfield (Singapore) Pte. Ltd. provides trust and fiduciary services.
Jersey
Butterfield Bank (Jersey) Limited provides deposit-taking, investment business and custody services.
Competition
The financial services industry and each of the markets in which we operate are competitive. We face strong competition in gathering deposits, making loans and obtaining client assets for management. We compete, both domestically and internationally, with globally oriented asset managers, retail and commercial banks, investment banking firms, brokerage firms and other investment service firms. Due to the trend toward consolidation in the global financial services industry, our larger competitors tend to have broader ranges of product and service offerings, increased access to capital, and greater efficiency. Larger financial institutions may also have greater ability to leverage increasing regulatory requirements and investment in expensive technology platforms. We also face competition from non-banking financial institutions. These institutions have the ability to offer services previously limited to commercial banks. In addition, non-banking financial institutions are not subject to the same regulatory restrictions as banks, and can often operate with greater flexibility and lower cost structures.
The Bermuda banking industry currently consists of four licensed banks and one licensed deposit-taking institution. These include one large subsidiary of an international bank, HSBC, and three domestic institutions, including Bermuda Commercial Bank and Clarien Bank. In the Cayman Islands, the Bank is one of six Class 'A' full service retail banks licensed to conduct business with domestic and international clients. There are also three non-retail Class 'A' banks and 116 limited service Class 'B' banks according to CIMA ("Cayman Islands Monetary Authority"). In the Channel Islands, Guernsey has 22 licensed banks and Jersey has 29, the majority of which are top global banking groups and brands such as Barclays, RBS, Lloyds, Credit Suisse, Investec, RBC and Northern Trust. In certain interest rate environments, additional significant competition for deposits may be expected to arise from corporate and government debt securities and money market mutual funds. We view HSBC in Bermuda and Scotia and CIBC FirstCaribbean in the Cayman Islands as our most significant competitors in those markets.
In our wealth management business line, we face competition from local competitors, as well as much larger financial institutions, including financial institutions that are not based in the markets in which we operate. Revenues from the trust and wealth management business depend in large part on the level of assets under management, and larger international banks may have higher levels of assets under management.
In our trust business line, we face competition primarily from other specialized trust service providers. There are many trust companies in the main international financial centers, and many of our competitors in this sector offer fund administration and corporate services alongside private client fiduciary services.
Competition for deposits is also affected by the ease with which customers can transfer deposits from one institution to another. Our cost of funds fluctuates with market interest rates and may be affected by higher rates being offered by other financial institutions. Our management believes that our most direct competition for deposits comes from international and domestic financial services firms that target the same customers as the Bank.
Deposits
We are a deposit-led institution with leading market shares in Bermuda and the Cayman Islands, but a relatively small market share in the Channel Islands. We strive to maintain deposit growth and to maintain a strong liquidity profile through a significant excess of deposits over loans through market cycles.
Our deposits are generated principally by our banking business line, which offers retail and corporate checking, savings, and term deposits through our segments in Bermuda, the Cayman Islands and the Channel Islands. In addition, wealth management, through its private banking business line, also provides deposit services to high net worth and ultra-high net worth clients in those same geographic segments. As at
December 31, 2019
, our Bermuda, Cayman Islands and Channel Islands and the UK segments contributed
$4.4 billion
,
$3.5 billion
and
$4.6 billion
, respectively, to our total customer deposit base.
Total deposits as at
December 31, 2019
were
$12.4 billion
,
up
31.6%
over total deposits as at
December 31, 2018
. Customer demand deposits, which include checking, savings and call accounts, totaled
$9.4 billion
, or
75.4%
of customer deposits, as at
December 31, 2019
, compared to
$7.4 billion
, or
79.1%
, as at
December 31, 2018
. Customer term deposits totaled
$3.0 billion
as at
December 31, 2019
. The cost of funds on total deposits
increased
from
18
basis points in
2018
to
47
basis points in
2019
. Deposit balances increased primarily as a result of the ABN AMRO (Channel Islands) acquisition in 2019 while cost of funds increased primarily due to higher interest rates as well as increased cost of funding associated with the ABN AMRO (Channel Islands) acquisition.
Lending
We offer a broad set of lending products and services including residential mortgage lending, automobile lending, credit cards, consumer financing, and overdraft facilities to our retail customers, and commercial real estate lending, commercial and industrial loans, and overdraft facilities to our commercial and corporate customers. These offerings are provided to our retail, commercial, and private banking clients in our key jurisdictions of Bermuda and the Cayman Islands. We also offer residential mortgage lending through our private banking business in Guernsey and to our high net worth and ultra-high net worth clients in the UK. Our loan portfolio, net of allowance for credit losses, stood at
$5.1 billion
as at
December 31, 2019
. The loan portfolio represented
36.9%
of total assets as at
December 31, 2019
, and loans, net of allowance for credit losses, as a percentage of customer deposits were
41.4%
. The effective yield on total loans for the year ended
December 31, 2019
was
5.36%
, compared to
5.47%
for the year ended
December 31, 2018
.
Residential Mortgage Lending
The residential mortgage portfolio comprises mortgages to clients with whom we are seeking to establish (or already have) a comprehensive financial services relationship. It includes mortgages to individuals and corporate loans secured by way of first ranking charges over the residential property to which each specific loan relates, generally on terms which allow for the repossession and sale of the property if the borrower fails to comply with the terms of the loan. As at
December 31, 2019
, residential
5
mortgages (after specific allowance for credit losses) totaled
$3.2 billion
(a
$557.7 million
increase
from
December 31, 2018
), accounting for approximately
62.3%
of the Group's total gross loan portfolio (after specific allowance for credit losses) and approximately
76.1%
of total non-accrual loans in the Group's loan portfolio.
Consumer Lending
We provide loans, as part of our normal banking business, in respect of automobile financing, consumer financing, credit cards and overdraft facilities to retail and private banking clients in the jurisdictions in which we operate. As at
December 31, 2019
, non-residential loans to consumers (after specific allowance for credit losses) totaled
$256.5 million
, accounting for approximately
5.0%
of the Group's total gross loan portfolio (after specific allowance for credit losses) and approximately
2.5%
of total non-accrual loans in the Group's loan portfolio.
Commercial Real Estate Lending
Commercial real estate loans are offered to real estate investors, developers and builders domiciled primarily in Bermuda, Cayman, Guernsey and the UK. To manage the Group's credit exposure on such loans, the principal collateral is real estate held for commercial purposes and is supported by a registered mortgage. Cash flows from the properties, primarily from rental income, are generally supported by long-term leases.
As at
December 31, 2019
, our commercial real estate loan portfolio (after specific allowance for credit losses) totaled
$753.8 million
, accounting for approximately
14.6%
of the Group's total gross loan portfolio and approximately
6.4%
of total non-accrual loans in the Group's loan portfolio.
Our commercial real estate loan portfolio is broken down into two categories: commercial mortgage and construction. As at
December 31, 2019
, commercial mortgages totaled
$658.8 million
(after specific allowance for credit losses), and construction loans totaled
$94.9 million
, accounting for approximately
87.4%
and
12.6%
of our commercial real estate loan portfolio (after specific allowance for credit losses), respectively.
Other Commercial Lending
The commercial and industrial loan portfolio includes loans and overdraft facilities advanced primarily to corporations and small and medium-sized entities, which are generally not collateralized by real estate and where loan repayments are expected to flow from the operation of the underlying businesses. As at
December 31, 2019
, the Group's other commercial loan portfolio totaled
$559.4 million
(after specific allowance for credit losses), accounting for approximately
10.9%
of the Group's total gross loan portfolio (after specific allowance for credit losses). As of the same date, the Group's loans to governments totaled
$370.8 million
, accounting for approximately
7.2%
of our loan portfolio (after specific allowance for credit losses). As at
December 31, 2019
, other commercial loans accounted for approximately
15.0%
of our total non-accrual loans.
Investments
Given the large customer deposit base commanded in our Bermuda, Cayman Islands and Channel Islands operations, and the relatively low volume of lending demand from our customer base, our investment strategy is more important than may be the case for most financial institutions. In recognition of this, we maintain what we believe to be a conservative approach to investments, requiring the purchase of mainly fixed-rate investments in order to manage interest rate risk. Our investment portfolio comprises of mainly securities issued or guaranteed by the US Government or federal agencies. The securities in which we invest are limited generally to securities that are considered investment grade (i.e., "BBB" and higher by S&P's Financial Services LLC or an equivalent credit rating). Effective July 31, 2012, we entered into an agreement with Alumina Investment Management LLC ("Alumina") pursuant to which Alumina provides investment advisory services to us in respect of our US Treasury and agency portfolio.
As at
December 31, 2019
, the Group held
$4.4 billion
in investments, representing approximately
31.9%
of total assets.
Cash and Liquidity Management
We operate across multiple currency jurisdictions with multi-currency products. In our deposit taking jurisdictions—Bermuda, the Cayman Islands, Guernsey and Jersey—there are currently no dedicated central banks, and no pre-funded deposit insurance scheme infrastructures (such as the Federal Deposit Insurance Corporation in the United States), with the exception of Bermuda, where a pre-funded deposit insurance scheme has been implemented, and as described in “Supervision and Regulation” and “Risk Factors - Risks Relating to the Markets in Which We Operate - Certain jurisdictions in which we operate, including Bermuda, Guernsey and Jersey, have a Deposit Insurance Scheme or Deposit Compensation Scheme and we incur ongoing costs as a result”. In addition, we do not have access to borrowing or deposit facilities with the US Federal Reserve or the European Central Bank; therefore, we conservatively manage client deposit balances and the liquidity risk profile of our balance sheets. This involves the retention of significant cash or cash equivalent balances, management of intra-bank counterparty exposure and management of a significant short-dated US Treasury Bill portfolio. As at
December 31, 2019
, the cash due from banks of
$2.6 billion
was composed primarily of
$1.6 billion
in interest earning cash equivalents, which are investments with a less than ninety day duration. The remaining amounts were comprised of non-interest earning and interest earning deposits of
$0.1 billion
and
$0.8 billion
, respectively.
Foreign Exchange Services
We provide foreign exchange services in the normal course of business in all jurisdictions. The major contributors to foreign exchange revenues are Bermuda and the Cayman Islands, accounting for
84%
and 92% of our foreign exchange revenue for the year ended
December 31, 2019
and
2018
, respectively. We do not maintain a proprietary trading book. Foreign exchange income is generated from client-driven transactions and totaled
$37.0 million
during the year ended
December 31, 2019
, compared to
$32.9 million
for the comparative period in
2018
. The
$4.1 million
period-over-period increase reflects increased client activity and related volumes in retail and institutional foreign exchange flows, as well as increased unrealized gains on client service derivatives held over period ends.
Administration Services
Through our wholly-owned trust subsidiaries, we provide custody administration and settlement services to a wide range of internal and external investment clients dealing in global markets. Our custody service currently offers custody settlement and safekeeping services in 39 markets globally, including major markets and smaller, less-developed markets, with principal markets covered being the United States, Canada, Europe and the Far East.
Our custody service offers safekeeping services for physical and book-entry assets. Custody for listed securities is conducted through Bank of New York Mellon ("BNYM"). Hedge funds, mutual funds and Exchange Traded Funds are held by Brown Brothers Harriman ("BBH"). Trading in investment transactions is settled via our global sub-custodians, BNYM and BBH. Custody services are offered from our Bermuda, Cayman Islands and Channel Islands segments and complement core wealth management services offered by other parts of the Group, and we currently anticipate this business to grow generally proportionally with our wealth management business. Clients of our custody service include a wide range of investment funds and other investment vehicles, corporations and trusts whose related banking requirements are provided by the Bank. As such, the custody client base, in addition to delivering a fee based income, also provides cash balances and foreign exchange transaction flows.
6
Custody fees comprise a basis point charge on the value of Assets Under Custody ("AUC"), which are subject to a minimum level for smaller, less complex portfolios and charged on a reducing scale as AUC values increase. In addition to these fees, custody clients are charged banking transactions fees based on account activity.
Employees
As at
December 31, 2019
, we had 1,512 employees on a full-time equivalency basis, which included 1,389 full-time and part-time employees and 123 temporary employees. As at
December 31, 2019
, we had 520 employees in Bermuda, 296 employees in the Cayman Islands, 425 in the Channel Islands and the UK, and 271 employees in the Other segment. As at December 31, 2018, we had 1,373 employees on a full-time equivalency basis, which included 1,274 full-time and part-time employees and 99 temporary employees. As at December 31, 2018, we had 572 employees in Bermuda, 277 employees in the Cayman Islands, 331 in the Channel Islands and the UK, and 194 employees in the Other segment. As at December 31, 2017, we had 1,190 employees on a full-time equivalency basis, which included 1,117 full-time and part-time employees and 34 temporary employees. As at December 31, 2017, we had 590 employees in Bermuda, 270 employees in the Cayman Islands, 207 in Guernsey, 22 employees in the United Kingdom, 20 employees in The Bahamas and 9 employees in Switzerland.
The increase from 2018 to 2019 was a result of the Halifax service center expansion and the ABN AMRO (Channel Islands) acquisition. The increase from 2017 to 2018 was a result of the two Deutsche Bank acquisitions completed during 2018.
We have not experienced any material employment-related issues or interruptions of services due to labor disagreements and are not a party to any collective bargaining agreements.
Information Technology
We devote significant resources to maintain stable, reliable, efficient and scalable information technology systems. We work with our third-party vendors to monitor and maximize the efficiency of our use of their applications. We use integrated systems to originate and process loans and deposit accounts, which reduces processing time, improves customer experience and reduces costs. Most customer records are maintained digitally. We are also currently executing several initiatives to enhance our online and mobile banking services to further improve the overall client experience.
Since 2011, we have made significant investments to align banking operations, as well as harmonize across the Group for products, services, licensing and hosting locations. Currently, our information technology is operationally divided into two platforms: (i) Bermuda and Cayman and (ii) Channel Islands and the UK and Group Trust. In 2011, our Bermuda and Cayman operations transitioned to a single industry standard banking technology platform utilizing a predominantly outsourced and supported model hosted in Canada. In late 2013, our Guernsey and UK operations were placed under the Group Technology governance structure with a goal to hub core services in the Channel Islands and the UK segment in a single location, Guernsey.
Protecting our systems to ensure the safety of our customers' information is critical to our business. We use multiple layers of protection to control access and reduce risk, including conducting penetration testing and regular vulnerability scanning on our platforms, systems and applications to reduce the risk that any attacks are successful. To protect against disasters, we have a backup offsite core processing system and recovery plans. For more information, see "Risk Factors - Risks Relating to Risk Oversight and Internal Controls".
Marketing
Through our Marketing & Communications department, we engage select advertising, branding and promotional companies on an as-needed basis and provide business development and sales support for businesses in all jurisdictions. In support of our banking businesses, we broadly market our products and services through print, broadcast, web and social media advertising in the major markets in which we operate. Trust and fiduciary services are marketed primarily to intermediaries through representative attendance at and sponsorship of industry conferences and through print advertising in international trade journals.
Intellectual Property
In the highly competitive banking industry in which we operate, intellectual property is important to the success of our business. We own a variety of trademarks, service marks, trade names and logos and spend time and resources maintaining this intellectual property portfolio. We control access to our intellectual property through license agreements, confidentiality procedures, non-disclosure agreements with third parties, employment agreements and other contractual rights to protect our intellectual property. For more information, see "Risk Factors - Risks Relating to Our Strategy, Brand, Portfolio and Other Aspects of Our Business".
Properties
Our corporate headquarters is located at 65 Front Street, Hamilton HM 12, Bermuda. In addition to our corporate headquarters we also maintain offices in the Cayman Islands, Guernsey, Jersey, the UK, The Bahamas, Switzerland, Singapore, Mauritius and Canada. Additionally we operate three branch locations in Bermuda and four branch locations in the Cayman Islands.
Legal Proceedings
From time to time we are a party to various litigation matters incidental to the conduct and in the ordinary course of our business.
As publicly announced, in November 2013, the US Attorney's Office ("USAO") applied for and secured the issuance of so-called John Doe Summonses to six US financial institutions with which the Bank had correspondent bank relationships. The purpose of these Summonses was to identify US persons who may have been using our banking, trust, or other services to evade their own tax obligations in the US. The Bank has been cooperating with the US authorities in their ongoing investigation.
Although we are unable to determine the amount of financial consequences, fines and/or penalties resulting from this tax compliance review, we have recorded as at
December 31, 2019
, a provision of
$5.5 million
(
December 31, 2018
:
$5.5 million
). As the investigation remains ongoing at this time, the timing and terms of the final resolution, including any fines or penalties, remain uncertain and the financial impact to the Bank could exceed the amount of the provision. In this regard, we note that the US authorities have not approved or commented on the adequacy or reasonableness of the provision. The provision is included on the consolidated balance sheets under other liabilities.
7
SELECTED CONSOLIDATED FINANCIAL AND OTHER DATA
Consolidated Financial Information
The following tables present our selected consolidated financial information as at and for the years ended
December 31, 2019
,
2018
,
2017
,
2016
, and
2015
.
Our historical results for any prior period do not necessarily indicate our results to be expected for any future period. The following data should be read in conjunction with "Management's Discussion and Analysis of Financial Condition and Results of Operations".
The selected consolidated financial information presented as at
December 31, 2019
and
2018
and for the years ended
December 31, 2019
,
2018
and
2017
have been derived from the audited consolidated financial statements of The Bank of N.T. Butterfield & Son Limited included elsewhere in this report. The selected consolidated financial information presented as at
December 31, 2017
,
2016
and
2015
and for the years ended
December 31, 2016
and
2015
have been derived from the audited consolidated financial statements of The Bank of N.T. Butterfield & Son Limited, which are not included elsewhere in this report.
|
For the year ended
December 31,
|
|||||||||||||||
|
(in millions of $, unless indicated otherwise)
|
2019
|
2018
|
2017
|
2016
|
2015
|
||||||||||
|
Total interest income
|
405.1
|
|
367.6
|
|
305.6
|
|
274.9
|
|
262.6
|
|
|||||
|
Total interest expense
|
59.4
|
|
24.6
|
|
15.9
|
|
16.4
|
|
23.3
|
|
|||||
|
Net interest income before provisions for credit losses
|
345.7
|
|
343.0
|
|
289.7
|
|
258.5
|
|
239.3
|
|
|||||
|
Provision for credit recoveries (losses)
|
0.2
|
|
7.0
|
|
5.8
|
|
(4.4
|
)
|
(5.7
|
)
|
|||||
|
Net interest income after provisions for credit losses
|
345.9
|
|
350.0
|
|
295.6
|
|
254.1
|
|
233.5
|
|
|||||
|
Total non-interest income
|
184.0
|
|
168.7
|
|
157.8
|
|
147.5
|
|
140.2
|
|
|||||
|
Total other gains (losses)
|
2.8
|
|
(0.9
|
)
|
1.3
|
|
1.0
|
|
(9.4
|
)
|
|||||
|
Total net revenue
|
532.6
|
|
517.8
|
|
454.7
|
|
402.6
|
|
364.3
|
|
|||||
|
Total non-interest expense
|
356.9
|
|
321.3
|
|
300.3
|
|
285.9
|
|
285.2
|
|
|||||
|
Net income before income taxes
|
175.7
|
|
196.5
|
|
154.3
|
|
116.7
|
|
79.0
|
|
|||||
|
Income tax benefit (expense)
|
1.4
|
|
(1.3
|
)
|
(1.1
|
)
|
(0.7
|
)
|
(1.3
|
)
|
|||||
|
Net income
|
177.1
|
|
195.2
|
|
153.3
|
|
115.9
|
|
77.7
|
|
|||||
|
Net income to common shareholders
|
177.1
|
|
195.2
|
|
153.3
|
|
58.4
|
|
61.2
|
|
|||||
|
Earnings per common share from continuing operations (in US$)
(1)
|
|
|
|
|
|||||||||||
|
Basic
|
3.33
|
|
3.55
|
|
2.82
|
|
1.20
|
|
1.25
|
|
|||||
|
Diluted
(2)
|
3.30
|
|
3.50
|
|
2.76
|
|
1.18
|
|
1.23
|
|
|||||
|
Cash Dividends declared per common share (in BM$)
(1)
|
1.76
|
|
1.52
|
|
1.28
|
|
0.40
|
|
0.50
|
|
|||||
|
Dividends declared per preference share (in US$)
|
—
|
|
—
|
|
—
|
|
80.00
|
|
80.00
|
|
|||||
______________________________
|
(1)
|
Figures reflect the reverse share split that the Bank effected on September 6, 2016.
|
|
(2)
|
Reflects only "in the money" options and warrants to purchase the common shares as well as certain unvested share awards, which have a dilutive effect. Warrants issued to the Government of Bermuda in exchange for the Government's guarantee of the preference shares are not included in the computation of earnings per share because the exercise price was greater than the average market price of the common shares for the relevant periods. In December 2016, in connection with the preference share redemption, the warrant issued to the Government of Bermuda was repurchased for cancellation by the Bank. Only share awards and options for which the sum of (1) the expense that will be recognized in the future (i.e., the unrecognized expense) and (2) its exercise price, if any, was lower than the average market price of the common shares were considered dilutive, and therefore, included in the computation of diluted earnings per share.
|
8
|
As at December 31,
|
|||||||||||||||
|
(in millions of $)
|
2019
|
2018
|
2017
|
2016
|
2015
|
||||||||||
|
Assets
|
|
|
|
|
|
|
|
|
|
|
|||||
|
Cash due from banks
|
2,550.1
|
|
2,053.9
|
|
1,535.1
|
|
2,101.7
|
|
2,288.9
|
|
|||||
|
Of which cash and demand deposits with banks — non-interest bearing
(1)
|
88.0
|
|
91.7
|
|
55.6
|
|
79.1
|
|
71.5
|
|
|||||
|
Of which demand deposits with banks — interest bearing
(1)
|
839.3
|
|
520.0
|
|
374.0
|
|
358.1
|
|
418.0
|
|
|||||
|
Of which cash equivalents — interest bearing
|
1,622.7
|
|
1,442.1
|
|
1,105.5
|
|
1,664.5
|
|
1,799.4
|
|
|||||
|
Securities purchased under agreements to resell
|
142.3
|
|
27.3
|
|
178.8
|
|
148.8
|
|
—
|
|
|||||
|
Short-term investments
|
1,218.4
|
|
52.3
|
|
250.0
|
|
519.8
|
|
409.5
|
|
|||||
|
Investment in securities
|
4,436.4
|
|
4,255.4
|
|
4,706.2
|
|
4,400.2
|
|
3,223.9
|
|
|||||
|
Of which equity securities at fair value
(2)
|
7.4
|
|
6.5
|
|
6.8
|
|
6.3
|
|
6.2
|
|
|||||
|
Of which trading
(2)
|
—
|
|
—
|
|
—
|
|
—
|
|
315.1
|
|
|||||
|
Of which available-for-sale
|
2,220.3
|
|
2,182.7
|
|
3,317.4
|
|
3,332.7
|
|
2,201.3
|
|
|||||
|
Of which held-to-maturity
(3)
|
2,208.7
|
|
2,066.1
|
|
1,382.0
|
|
1,061.1
|
|
701.3
|
|
|||||
|
Loans, net of allowance for credit losses
|
5,142.6
|
|
4,043.9
|
|
3,776.9
|
|
3,570.5
|
|
4,000.2
|
|
|||||
|
Premises, equipment and computer software, net of accumulated depreciation
|
158.2
|
|
158.1
|
|
164.8
|
|
167.8
|
|
183.4
|
|
|||||
|
Accrued interest
|
23.6
|
|
20.9
|
|
24.9
|
|
22.8
|
|
17.5
|
|
|||||
|
Goodwill
|
24.8
|
|
24.0
|
|
21.5
|
|
19.6
|
|
23.5
|
|
|||||
|
Other intangible assets, net
|
71.7
|
|
50.8
|
|
39.1
|
|
42.3
|
|
27.7
|
|
|||||
|
Equity method investments
|
14.5
|
|
14.7
|
|
14.1
|
|
13.5
|
|
12.8
|
|
|||||
|
Other real estate owned, net
|
3.8
|
|
5.3
|
|
9.1
|
|
14.2
|
|
11.2
|
|
|||||
|
Other assets
|
135.2
|
|
66.7
|
|
58.7
|
|
82.5
|
|
77.1
|
|
|||||
|
Total assets
|
13,921.6
|
|
10,773.2
|
|
10,779.2
|
|
11,103.5
|
|
10,275.6
|
|
|||||
|
Liabilities
|
|
|
|||||||||||||
|
Total customer and bank deposits
|
12,441.6
|
|
9,452.2
|
|
9,536.5
|
|
10,033.6
|
|
9,182.1
|
|
|||||
|
Of which customer deposits — non-interest bearing
|
2,230.0
|
|
2,111.5
|
|
2,479.7
|
|
2,385.0
|
|
1,881.7
|
|
|||||
|
Of which customer deposits — interest bearing
|
10,177.9
|
|
7,306.9
|
|
7,044.3
|
|
7,624.8
|
|
7,285.9
|
|
|||||
|
Of which bank deposits
|
33.8
|
|
33.8
|
|
12.5
|
|
23.8
|
|
14.5
|
|
|||||
|
Employee benefit plans
|
110.3
|
|
117.2
|
|
128.8
|
|
140.0
|
|
122.1
|
|
|||||
|
Accrued interest
|
8.4
|
|
5.1
|
|
2.4
|
|
2.1
|
|
2.7
|
|
|||||
|
Preference share dividends payable
|
—
|
|
—
|
|
—
|
|
—
|
|
0.7
|
|
|||||
|
Pending payable for investments purchased
|
—
|
|
—
|
|
51.9
|
|
—
|
|
—
|
|
|||||
|
Other liabilities
|
254.0
|
|
173.0
|
|
119.8
|
|
100.0
|
|
100.5
|
|
|||||
|
Long-term debt
|
143.5
|
|
143.3
|
|
117.0
|
|
117.0
|
|
117.0
|
|
|||||
|
Total liabilities
|
12,957.8
|
|
9,890.8
|
|
9,956.4
|
|
10,392.8
|
|
9,525.2
|
|
|||||
|
Total shareholders' equity
(4)(5)
|
963.7
|
|
882.3
|
|
822.9
|
|
710.7
|
|
750.4
|
|
|||||
|
Of which common share capital
(5)
|
0.5
|
|
0.6
|
|
0.5
|
|
0.5
|
|
0.5
(6)
|
|
|||||
|
Total liabilities and shareholders' equity
|
13,921.6
|
|
10,773.2
|
|
10,779.2
|
|
11,103.5
|
|
10,275.6
|
|
|||||
|
Common shares outstanding (number)
(5)
|
53.0
|
|
55.4
|
|
54.7
|
|
53.3
|
|
47.3
|
|
|||||
______________________________
|
(1)
|
For the years ended December 31, 2018, 2017, 2016 and 2015, the classification of certain interest bearing and non-interest bearing cash items was amended.
|
|
(2)
|
For the year ended December 31, 2015, investments in trading securities has been split into equity securities at fair value and trading debt securities to align with current GAAP guidance.
|
|
(3)
|
Fair value of HTM debt securities was
$2,256.0 million
as at
December 31, 2019
,
$2,036.2 million
as at
December 31, 2018
, $1,377.4 million as at
December 31, 2017
, $1,046.8 million as at
December 31, 2016
and $701.5 million as at
December 31, 2015
.
|
|
(4)
|
As at
December 31, 2019
the number of outstanding awards of unvested common shares was
0.9 million
(
December 31, 2018
:
0.9 million
,
December 31, 2017
:
0.9 million
,
December 31, 2016
: 0.8 million and
December 31, 2015
: 0.9 million). Only awards for which the sum of 1) the expense that will be recognized in the future (i.e., the unrecognized expense) and 2) its exercise price, if any, was lower than the average market price of the Bank‘s common shares were considered dilutive and, therefore, included in the computation of diluted earnings per share. A warrant, outstanding until the Bank repurchased it in December 2016, to purchase 0.43 million shares (December 31, 2015: 0.43 million) was excluded from the computation of earnings per share because the exercise price was greater than the average market price of the common shares. Figures reflect the reverse share split that the Bank effected on September 6, 2016.
|
|
(5)
|
Figures reflect the reverse share split that the Bank effected on September 6, 2016 and the retirement of 2,928,788 shares during the year ended December 31, 2019 (December 31, 2018, 2017, 2016 and 2015: nil).
|
|
(6)
|
Reflects the repurchase for cancellation of 8,000,000 common shares previously held by CIBC effected on April 30, 2015. Figures reflect the reverse share split that the Bank effected on September 6, 2016.
|
9
Financial Ratios and Other Performance Indicators
We use a number of financial measures to track the performance of our business and guide our management. Some of these measures are defined by, and calculated in compliance with, applicable banking regulations, but such regulations often provide for certain discretion in defining and calculating the measures. These measures allow management to review our core activities, enabling us and our investors to evaluate relevant trends meaningfully when considered in conjunction with (but not in lieu of) measures that are calculated in accordance with GAAP. Non-GAAP measures used in this report are not a substitute for GAAP measures and readers should consider the GAAP measures as well.
The following table shows certain of our key financial measures for the periods indicated. Because of the discretion that we and other banks and companies have in defining and calculating these measures, care should be taken in comparing such measures used by us with similarly titled measures of other banks and companies, as such measures may not be directly comparable.
Many of these measures are non-GAAP financial measures. We believe that each of these measures is useful for investors in understanding trends in our business that may not otherwise be apparent when relying solely on our GAAP-calculated results. For more information on the non-GAAP financial measures presented below, including a reconciliation to the most directly comparable GAAP financial measures, see "— Reconciliation of Non-GAAP Financial Measures."
|
For the year ended December 31,
|
|||||||||||||||
|
(in %, unless otherwise indicated)
|
2019
|
2018
|
2017
|
2016
|
2015
|
||||||||||
|
Return on average common shareholders' equity
(1)
|
19.1
|
|
23.1
|
|
19.9
|
|
8.9
|
|
10.1
|
|
|||||
|
Core return on average tangible common equity
(2)
|
23.4
|
|
25.6
|
|
22.4
|
|
20.5
|
|
17.6
|
|
|||||
|
Return on average assets
(3)
|
1.4
|
|
1.8
|
|
1.4
|
|
1.1
|
|
0.8
|
|
|||||
|
Core return on average tangible assets
(4)
|
1.6
|
|
1.8
|
|
1.5
|
|
1.3
|
|
1.1
|
|
|||||
|
Net interest margin
(5)
|
2.86
|
|
3.25
|
|
2.73
|
|
2.45
|
|
2.48
|
|
|||||
|
Efficiency margin
(6)
|
66.4
|
|
61.8
|
|
66.2
|
|
69.3
|
|
74.0
|
|
|||||
|
Core efficiency ratio
(7)
|
62.2
|
|
61.5
|
|
64.3
|
|
63.8
|
|
66.0
|
|
|||||
|
Fee income ratio
(8)
|
34.7
|
|
32.5
|
|
34.8
|
|
36.7
|
|
37.5
|
|
|||||
|
Common equity Tier 1 capital ratio
(9)(10)
|
17.3
|
|
19.6
|
|
18.2
|
|
15.3
|
|
N/A
|
|
|||||
|
Tier 1 common ratio
(9)
|
N/A
|
|
N/A
|
|
N/A
|
|
N/A
|
|
12.0
|
|
|||||
|
Tier 1 capital ratio
(9)
|
17.3
|
|
19.6
|
|
18.2
|
|
15.3
|
|
16.2
|
|
|||||
|
Total capital ratio
(9)
|
19.4
|
|
22.4
|
|
19.9
|
|
17.6
|
|
19.0
|
|
|||||
|
Leverage ratio
(9)(10)
|
5.9
|
|
7.6
|
|
6.9
|
|
5.8
|
|
6.4
|
|
|||||
|
Tangible common equity/tangible assets
(11)
|
6.3
|
|
7.5
|
|
7.1
|
|
5.9
|
|
5.1
|
|
|||||
|
Tangible total equity/tangible assets
(12)
|
6.3
|
|
7.5
|
|
7.1
|
|
5.9
|
|
6.8
|
|
|||||
|
Non-performing assets ratio
(13)
|
0.4
|
|
0.4
|
|
0.4
|
|
0.5
|
|
0.7
|
|
|||||
|
Non-accrual ratio
(14)
|
1.0
|
|
1.2
|
|
1.2
|
|
1.3
|
|
1.6
|
|
|||||
|
Non-performing loan ratio
(15)
|
1.3
|
|
1.4
|
|
1.3
|
|
1.6
|
|
2.0
|
|
|||||
|
Net charge-off ratio
(16)
|
—
|
|
0.1
|
|
0.1
|
|
0.3
|
|
0.2
|
|
|||||
|
Core net income attributable to common shareholders
(17)(18)
(in $ million)
|
197.9
|
|
197.0
|
|
158.9
|
|
123.0
|
|
97.4
|
|
|||||
|
Core earnings per common share fully diluted
(19)(21)
(in $)
|
3.69
|
|
3.53
|
|
2.86
|
|
2.48
|
|
1.95
|
|
|||||
|
Common equity per share
(20)(21)
(in $)
|
18.40
|
|
15.94
|
|
15.05
|
|
13.34
|
|
12.24
|
|
|||||
______________________________
|
(1)
|
Return on average common shareholders' equity ("ROE") measures profitability revealing how much profit is generated with the money invested by common shareholders. ROE represents the amount of net income to common shareholders as a percentage of average common equity and calculated as net income to common shareholders / average common equity. Net income to common shareholders is net income for the full fiscal year, before dividends paid to common shareholders but after dividends to preference shareholders. Average common equity does not include the preference shareholders' equity.
|
|
(2)
|
Core return on average tangible common equity ("Core ROATCE") is a non-GAAP financial measure. Core ROATCE measures core profitability as a percentage of average tangible common equity. Core ROATCE is the amount of core income to common shareholders as a percentage of average tangible common equity and is calculated as core earnings to common shareholders / average tangible common equity. Core earnings to common shareholders is net earnings to common shareholders for the full fiscal year (before dividends paid to common shareholders but after dividends to preference shareholders) adjusted to exclude certain items that are included in the financial results presented in accordance with GAAP. Average tangible common equity does not include the preference shareholders' equity or goodwill and intangible assets. For more information on the non-GAAP financial measures, see "— Reconciliation of Non-GAAP Financial Measures".
|
|
(3)
|
Return on average assets ("ROA") is an indicator of profitability relative to average total assets and is intended to demonstrate how efficient management is at using the assets to generate earnings. The ROA ratio is calculated as net income / average total assets.
|
|
(4)
|
Core return on average tangible assets ("Core ROATA") is a non-GAAP financial measure. Core ROATA is an indicator used to assess the core profitability of average tangible assets and is intended to demonstrate how efficiently management is utilizing its tangible assets to generate core net income. Core ROATA is calculated by taking the core income as a percentage of average tangible assets and is calculated as core net income / average tangible assets. Core net income is the net income adjusted to exclude certain items that are included in the financial results presented in accordance with GAAP. Core ROATA is a non-GAAP financial measure. For more information on the non-GAAP financial measures, see "— Reconciliation of Non-GAAP Financial Measures".
|
|
(5)
|
Net interest margin ("NIM") is a performance metric that examines how successful the Bank's investment decisions are compared to its cost of funding assets and is expressed as net interest income as a percentage of average interest-earning assets. NIM is calculated as net interest income before provision for credit losses / average interest-earning assets. Net interest income is the interest earned on cash due from banks, investments, loans and other interest earning assets minus the interest paid for deposits, short-term borrowings and long-term debt. The average interest-earning assets is calculated using daily average balances of interest-earning assets.
|
10
|
(6)
|
Efficiency margin is a non-GAAP financial measure. Efficiency margin is an indicator used to assess operating efficiencies and is intended to demonstrate how efficiently management is controlling expenses relative to generating revenues. The efficiency margin is calculated by taking the non-interest expenses as a percentage of total net revenue before total other gains (losses) and provisions for credit losses, and is calculated as (non-interest expense - amortization of intangible assets) / (total non-interest income + net interest income before provision for credit losses). For more information on the non-GAAP financial measures, see "— Reconciliation of Non-GAAP Financial Measures".
|
|
(7)
|
The core efficiency ratio is a non-GAAP financial measure. The core efficiency ratio is an indicator used to assess operating efficiencies and is intended to demonstrate how efficiently management is controlling expenses relative to generating revenues on our core activities. The core efficiency ratio is calculated by taking the core non-interest expenses as a percentage of total net revenue before provision for credit losses and other gains and losses and is calculated as (core non-interest expenses - amortization of intangible assets) / (core non-interest income + core net interest income before provision for credit losses). Core non-interest expenses exclude certain items that are included in the financial results presented in accordance with GAAP including income taxes and amortization of intangible assets. For more information on the non-GAAP financial measures, see "— Reconciliation of Non-GAAP Financial Measures".
|
|
(8)
|
The fee income ratio is a measure used to determine the proportion of revenues derived from non-interest income sources. The ratio is calculated as non-interest income / (non-interest income + net interest income after provision for credit losses).
|
|
(9)
|
The total capital ratio measures the amount of the Bank's capital in relation to the amount of risk it is taking. All banks must ensure that a reasonable proportion of their risk is covered by permanent capital. Prior to January 1, 2015, the Bank's regulatory capital was determined in accordance with Basel II guidelines issued by the BMA. Under Basel II, Pillar I, banks must maintain a minimum total capital ratio of 14.46%, inclusive of all capital buffers. In effect, this means that 14.46% of the risk weighted assets ("RWA") must be covered by permanent or near permanent capital. The risk weighting process takes into account the relative risk of various types of lending and asset placements. The higher the capital adequacy ratio a bank has, the greater the level of unexpected losses it can absorb before becoming insolvent. Under Basel III as implemented by the BMA for 2019, we must maintain a total capital ratio of
16.3%
. The tier 1 capital ratio is the ratio of the Bank's core equity capital, as measured under Basel II, to its total RWA. RWA are the total of all assets held by the Bank weighted by credit risk according to a formula determined by the regulator. The Bank follows the Basel Committee on Banking Supervision ("BCBS") guidelines in setting formulas for asset risk weights. The tier 1 common ratio is equivalent to the tier 1 capital ratio except that it only includes common equity in the numerator and deducts the preference shareholders' equity. Note that the tier 1 common ratio is calculated in the same manner as the common equity tier 1 ("CET1") ratio discussed below, but differs in its inputs based upon RWA calculations under Basel II versus Basel III.
|
|
(10)
|
Effective January 1, 2015, the Bank's regulatory capital is determined in accordance with current Basel III guidelines issued by the BMA. However, the Bank was not required to publish its capital ratios under Basel III until January 1, 2016 as per guidance from the BMA and continued to publish certain ratios under Basel II during 2015. Basel III adopts CET1 as the predominant form of regulatory capital with the CET1 ratio as a new metric. Under Basel III as implemented by the BMA, we must maintain a minimum CET1 ratio of
10%
. Basel III also adopts the new Leverage Ratio regime, which is calculated by dividing tier 1 capital by an exposure measure. Under Basel III, banks must maintain a minimum Leverage Ratio of
5.0%
. The exposure measure consists of total assets (excluding items deducted from tier 1 capital) and certain off balance sheet items converted into credit exposure equivalents as well as adjustments for derivatives to reflect credit and other risks.
|
|
(11)
|
The tangible common equity/tangible assets ("TCE/TA") ratio is a non-GAAP financial measure. The TCE/TA ratio is a measure used to determine how significant of an unexpected loss can be incurred by the Bank before other forms of capital, other than common equity, are impacted. The TCE/TA ratio is calculated as (common equity - intangible assets - goodwill) / tangible assets. Tangible common equity does not include the preference shareholders' equity or goodwill and intangible assets. Tangible assets are the Bank's total assets from continuing operations less goodwill and intangibles. For more information on the non-GAAP financial measures, see "— Reconciliation of Non-GAAP Financial Measures".
|
|
(12)
|
The tangible total equity/tangible assets ("TE/TA") ratio is a non-GAAP financial measure. The TE/TA ratio is a measure used to determine how much loss the Bank can absorb before subordinated debt capital is impacted. The TE/TA ratio is calculated as (total shareholders' equity - intangible assets - goodwill) / tangible assets. Tangible assets are the Bank's total assets from continuing operations less intangible assets and goodwill. For more information on the non-GAAP financial measures, see "— Reconciliation of Non-GAAP Financial Measures".
|
|
(13)
|
The non-performing assets ("NPA") ratio is an indicator of the credit quality of the Bank's total assets by expressing the non-performing assets as a percentage of total assets. The NPA ratio is calculated as (gross non-accrual loans - specific allowance for credit losses on non-accrual loans + accruing loans past due 90 days + other real estate owned ("OREO")) / total assets.
|
|
(14)
|
The non-accrual ("NACL") ratio is an indicator used to assess the credit performance of the Bank's loan portfolio by calculating the non-accrual loans as a percentage of loans. The NACL ratio is calculated as gross non-accrual loans / gross total loans. Note the reference to gross implies the amounts prior to loan allowances for credit losses.
|
|
(15)
|
The non-performing loan ("NPL") ratio is an indicator used to assess the credit performance of the Bank's loan portfolio by calculating the non-performing loans as a percentage of loans. The NPL ratio is calculated as total gross non-performing loans / total gross loans.
|
|
(16)
|
The net charge-off ("NCO") ratio is an indicator used to assess the net credit loss of the Bank's loan portfolio by calculating the net charge-offs as a percentage of average total loans. The NCO ratio is calculated as net charge-off expense / average total loans. Average total loan is calculated as the average of the month-end asset balances during the relevant period.
|
|
(17)
|
Core net income is a non-GAAP financial measure. Core net income measures net income on a core basis. Core net income is calculated by adjusting net income for income or expense items which are not representative of the ongoing operations of our business. For a reconciliation of core net income to net income, see "— Reconciliation of Non-GAAP Financial Measures".
|
|
(18)
|
Core net income attributable to common shareholders ("CEACS") is a non-GAAP financial measure. CEACS measures profitability attributable to common shareholders on a core basis. For a reconciliation of CEACS to net income, see "— Reconciliation of Non-GAAP Financial Measures".
|
|
(19)
|
Core net income per common share — fully diluted is a non-GAAP financial measure. Core net income per common share — fully diluted measures core profitability attributable to common shareholders on a per share basis. For a reconciliation to net income per share, see "— Reconciliation of Non-GAAP Financial Measures".
|
|
(20)
|
Common equity per share is calculated as total common equity / number of common shares issued and outstanding at period end.
|
|
(21)
|
Figures reflect the reverse share split that the Bank effected on September 6, 2016.
|
11
Net Interest Income
Net interest income is the amount of interest earned on our interest‑earning assets less interest paid on our interest bearing liabilities. The following table shows our net interest income before provision for credit losses for the periods indicated.
|
For the year ended December 31,
|
|||||||||||||||||
|
2019
|
2018
|
||||||||||||||||
|
(in millions of $)
|
Average
balance
($)
|
Interest
($)
|
Average
rate
(%)
|
Average
balance
($)
|
Interest
($)
|
Average
rate
(%)
|
|||||||||||
|
Assets
|
|||||||||||||||||
|
Cash due from banks, securities purchased under agreements to resell, and short‑term investments
|
3,233.3
|
|
41.6
|
|
1.29
|
%
|
1,977.3
|
|
24.8
|
|
1.26
|
%
|
|||||
|
Investment in securities
|
4,474.9
|
|
129.4
|
|
2.89
|
%
|
4,578.9
|
|
124.3
|
|
2.71
|
%
|
|||||
|
Loans
|
4,369.5
|
|
234.0
|
|
5.36
|
%
|
3,995.8
|
|
218.5
|
|
5.47
|
%
|
|||||
|
Interest earning assets
|
12,077.6
|
|
405.1
|
|
3.35
|
%
|
10,552.0
|
|
367.6
|
|
3.48
|
%
|
|||||
|
Other assets
|
371.5
|
|
350.7
|
|
|||||||||||||
|
Total assets
|
12,449.1
|
|
10,902.7
|
|
|||||||||||||
|
Liabilities
|
|||||||||||||||||
|
Deposits
|
8,851.5
|
|
(51.5
|
)
|
(0.58
|
)%
|
7,375.8
|
|
(17.6
|
)
|
(0.24
|
)%
|
|||||
|
Securities sold under agreements to repurchase
|
0.7
|
|
—
|
|
(2.12
|
)%
|
1.6
|
|
—
|
|
(2.11
|
)%
|
|||||
|
Long-term debt
|
143.4
|
|
(7.9
|
)
|
(5.49
|
)%
|
133.4
|
|
(6.9
|
)
|
(5.21
|
)%
|
|||||
|
Interest bearing liabilities
|
8,995.5
|
|
(59.4
|
)
|
(0.66
|
)%
|
7,510.8
|
|
(24.6
|
)
|
(0.33
|
)%
|
|||||
|
Non-interest bearing current accounts
|
2,147.2
|
|
2,231.8
|
|
|||||||||||||
|
Other liabilities
|
310.4
|
|
281.0
|
|
|||||||||||||
|
Total liabilities
|
11,453.1
|
|
10,023.7
|
|
|||||||||||||
|
Shareholders’ equity
|
995.9
|
|
879.0
|
|
|||||||||||||
|
Total liabilities and shareholders’ equity
|
12,449.1
|
|
10,902.7
|
|
|||||||||||||
|
Non‑interest bearing funds net of non‑interest earning assets (free balance)
|
3,082.1
|
|
3,041.1
|
|
|||||||||||||
|
Net interest margin
|
345.7
|
|
2.86
|
%
|
343.0
|
|
3.25
|
%
|
|||||||||
|
For the year ended December 31,
|
||||||||||||||||||||||||||
|
2017
|
2016
|
2015
|
||||||||||||||||||||||||
|
(in millions of $)
|
Average
balance
($)
|
Interest
($)
|
Average
rate
(%)
|
Average
balance
($)
|
Interest
($)
|
Average
rate
(%)
|
Average
balance
($)
|
Interest
($)
|
Average
rate
(%)
|
|||||||||||||||||
|
Assets
|
||||||||||||||||||||||||||
|
Cash due from banks, securities purchased under agreements to resell, and short‑term investments
|
2,372.7
|
|
17.2
|
|
0.72
|
%
|
2,655.3
|
|
9.8
|
|
0.37
|
%
|
2,407.9
|
|
6.5
|
|
0.27
|
%
|
||||||||
|
Investment in securities
|
4,573.9
|
|
101.4
|
|
2.22
|
%
|
3,940.6
|
|
77.2
|
|
1.95
|
%
|
3,217.0
|
|
69.6
|
|
2.16
|
%
|
||||||||
|
Loans
|
3,665.8
|
|
187.0
|
|
5.10
|
%
|
3,921.1
|
|
188.0
|
|
4.78
|
%
|
4,026.7
|
|
186.5
|
|
4.63
|
%
|
||||||||
|
Interest earning assets
|
10,612.4
|
|
305.6
|
|
2.88
|
%
|
10,517.0
|
|
275.0
|
|
2.61
|
%
|
9,651.6
|
|
262.6
|
|
2.72
|
%
|
||||||||
|
Other assets
|
346.0
|
|
343.4
|
|
371.5
|
|
||||||||||||||||||||
|
Total assets
|
10,958.4
|
|
10,860.4
|
|
|
|
10,023.1
|
|
||||||||||||||||||
|
Liabilities
|
||||||||||||||||||||||||||
|
Deposits
|
7,445.0
|
|
(10.9
|
)
|
(0.15
|
)%
|
7,733.8
|
|
(11.8
|
)
|
(0.15
|
)%
|
7,156.7
|
|
(18.4
|
)
|
(0.26
|
)%
|
||||||||
|
Securities sold under agreement to repurchase
|
—
|
|
—
|
|
—
|
%
|
16.0
|
|
(0.1
|
)
|
(0.73
|
)%
|
2.1
|
|
—
|
|
—
|
%
|
||||||||
|
Long-term debt
|
117.0
|
|
(5.0
|
)
|
(4.24
|
)%
|
117.0
|
|
(4.5
|
)
|
(3.84
|
)%
|
117.0
|
|
(4.9
|
)
|
(4.15
|
)%
|
||||||||
|
Interest bearing liabilities
|
7,562.0
|
|
(15.9
|
)
|
(0.21
|
)%
|
7,866.8
|
|
(16.4
|
)
|
(0.21
|
)%
|
7,275.8
|
|
(23.3
|
)
|
(0.32
|
)%
|
||||||||
|
Non-interest bearing current accounts
|
2,393.1
|
|
2,042.5
|
|
1,720.7
|
|
||||||||||||||||||||
|
Other liabilities
|
254.4
|
|
123.7
|
|
196.8
|
|
||||||||||||||||||||
|
Total liabilities
|
10,209.6
|
|
10,033.0
|
|
9,193.3
|
|
||||||||||||||||||||
|
Shareholders’ equity
|
748.9
|
|
827.4
|
|
829.8
|
|
||||||||||||||||||||
|
Total liabilities and shareholders’ equity
|
10,958.4
|
|
10,860.4
|
|
10,023.1
|
|
||||||||||||||||||||
|
Non-interest bearing funds net of non-interest earning assets (free balance)
|
3,050.3
|
|
2,650.2
|
|
2,375.8
|
|
||||||||||||||||||||
|
Net interest margin
|
289.7
|
|
2.73
|
%
|
258.6
|
|
2.45
|
%
|
239.3
|
|
2.48
|
%
|
||||||||||||||
12
Reconciliation of Non-GAAP Financial Measures
The tables below present computations of earnings and certain other financial measures, which exclude certain significant items that are included in the financial results presented in accordance with GAAP.
We focus on core net income in many of these measures and ratios, which we calculate by adjusting net income for income or expense items which are not representative of the ongoing operations of our business, which results in non-core gains, losses and expense measures. Core net income includes revenue, gains, losses and expense items incurred in the normal course of business. We consider the normal course of business to be the general operations of our business lines of banking and wealth management. We believe that expressing earnings and certain other financial measures excluding these non-core items provides a meaningful base for period-to-period comparisons, which management believes will assist investors in analyzing the operating results of the Bank and predicting future performance. Non-core items are determined by the Chief Financial Officer ("CFO") in conjunction with the Chairman and Chief Executive Officer ("CEO"), and approved by our Board of Directors. Consideration is given as to whether the expense, gain or loss is a result of exceptional circumstances or other decisions made not in the normal course of business. Items which are not in the normal course of business, such as business acquisition costs or impairment losses, or a result of exceptional circumstances, such as business restructuring costs, are considered non-core. These non-GAAP financial measures based on core net income are also used by management to assess the performance of the Bank's business because management does not consider the activities related to the adjustments to be indications of core operations. We believe that presentation of these non-GAAP financial measures will permit investors to assess the performance of the Bank on the same basis as that applied by management. Management and the Board utilize these non-GAAP financial measures as follows:
|
•
|
Preparation of the Bank's operating budgets;
|
|
•
|
Quarterly financial performance reporting; and
|
|
•
|
Monthly reporting of consolidated results (management reporting only).
|
We calculate core net income attributable to common shareholders by deducting preference dividend and guarantee fees from core net income. We calculate core net income per common share by dividing the core net income attributable to common shareholders by the average number of common shares issued and outstanding during the relevant period.
The core efficiency ratio (non-GAAP), which is a measure of productivity, is generally calculated by taking the core non-interest expenses (which is the total non-interest expenses excluding non-core non-interest expenses) as a percentage of total net revenue before provision for credit losses and other gains and losses and is calculated as (core non-interest expenses - amortization of intangible assets) / (core non-interest income + core net interest income before provision for credit losses). Management uses this ratio to monitor performance regarding the efficiency of expense management and believes this measure provides meaningful information to investors.
Tangible common shareholders' equity ratios and tangible total asset ratios have become a focus of some investors in analyzing the capital position of the Bank absent the effects of intangible assets and preference shareholders' equity. Traditionally, the BMA and other banking regulatory bodies have assessed a bank's capital adequacy based on Tier 1 capital, and from January 1, 2016 onwards, CET1 capital, the calculation of which is codified in the Basel II and Basel III framework, respectively, as implemented by the BMA. Because tangible common shareholders' equity and tangible total assets are not formally defined by GAAP, these measures are considered to be non-GAAP financial measures and other entities may calculate them differently. Since analysts and banking regulators may assess the Bank's capital adequacy using tangible common shareholders' equity or tangible assets, the Bank believes that it is useful to provide investors the ability to assess the Bank's capital adequacy on this same basis. The Bank calculates tangible common equity and tangible total assets on a period end basis. The Bank also measures performance relative to core net income over average tangible common shareholders' equity and average tangible assets to monitor performance and efficiency relative to the Bank's capital adequacy.
We believe the non-GAAP financial measures presented in this report provide useful information to management and investors that is supplementary to our financial condition, results of operations and cash flows computed in accordance with GAAP; however, we acknowledge that our non-GAAP financial measures have a number of limitations. As such, these disclosures should not be viewed as a substitute for results determined in accordance with GAAP, and they are not necessarily comparable to non-GAAP financial measures that other companies use.
The following tables provide: (1) a reconciliation of net income (GAAP) to core net income and core net income attributable to common shareholders (non-GAAP), (2) a computation of core net income attributable to common shareholders per common share fully diluted (non-GAAP), (3) a reconciliation of average and total shareholders' equity (GAAP) to average and total equity and average tangible common equity (non-GAAP), (4) a computation of core return to average tangible common equity (non-GAAP), (5) a reconciliation of average total assets (GAAP) to average tangible assets (non-GAAP), (6) a computation of core return on average tangible assets (non-GAAP), (7) a computation of tangible common equity to tangible assets (non-GAAP), (8) a computation of tangible total equity to tangible assets (non-GAAP), (9) a reconciliation of non-interest expenses (GAAP) to core non-interest expenses (non-GAAP), (10) a computation of the efficiency ratio (non-GAAP), and (11) a computation of the core efficiency ratio (non-GAAP).
13
|
For the year ended December 31,
|
||||||||||||||||
|
(in millions of $, unless otherwise indicated)
|
2019
|
2018
|
2017
|
2016
|
2015
|
|||||||||||
|
|
|
|
|
|
|
|
|
|
|
|||||||
|
Reconciliation of net income (GAAP) to core net income (non-GAAP)
|
||||||||||||||||
|
Net income
|
A
|
177.1
|
|
195.2
|
|
153.3
|
|
115.9
|
|
77.7
|
|
|||||
|
Dividends and guarantee fee of preference shares
|
—
|
|
—
|
|
—
|
|
(15.7
|
)
|
(16.5
|
)
|
||||||
|
Premium paid on repurchase/redemption of preference shares
(1)
|
B
|
—
|
|
—
|
|
—
|
|
(41.9
|
)
|
—
|
|
|||||
|
Net income to common shareholders
|
C
|
177.1
|
|
195.2
|
|
153.3
|
|
58.4
|
|
61.2
|
|
|||||
|
Non-core (gains), losses and expenses
|
|
|
|
|
||||||||||||
|
Non-core (gains) losses
|
|
|
|
|
||||||||||||
|
Gain on disposal of a pass-through note investment (formerly a SIV)
(2)
|
(1.0
|
)
|
(1.2
|
)
|
(2.6
|
)
|
(0.6
|
)
|
—
|
|
||||||
|
Impairment of and gain on disposal of fixed assets (including software)
(3)
|
—
|
|
—
|
|
—
|
|
—
|
|
5.1
|
|
||||||
|
Change in unrealized (gains) losses on certain investments
(4)
|
—
|
|
—
|
|
—
|
|
—
|
|
0.7
|
|
||||||
|
Adjustment to holdback payable for a previous business acquisition
(5)
|
—
|
|
—
|
|
0.1
|
|
0.9
|
|
—
|
|
||||||
|
Settlement loss on de-risking on a defined benefit plan
(6)
|
—
|
|
1.5
|
|
—
|
|
—
|
|
—
|
|
||||||
|
Total non-core (gains) losses
|
D
|
(1.0
|
)
|
0.3
|
|
(2.5
|
)
|
0.3
|
|
5.8
|
|
|||||
|
Non-core expenses
|
|
|
|
|
||||||||||||
|
Early retirement program, redundancies and other non-core compensation costs
(7)
|
16.3
|
|
—
|
|
0.2
|
|
1.8
|
|
8.2
|
|
||||||
|
Tax compliance review costs
(8)
|
—
|
|
0.5
|
|
2.1
|
|
1.6
|
|
3.8
|
|
||||||
|
Provision in connection with ongoing tax compliance review
(9)
|
—
|
|
—
|
|
—
|
|
0.7
|
|
4.8
|
|
||||||
|
Business acquisition costs
(10)
|
5.5
|
|
1.0
|
|
2.0
|
|
3.2
|
|
1.0
|
|
||||||
|
Restructuring charges and related professional service fees
(11)
|
—
|
|
—
|
|
1.8
|
|
6.3
|
|
2.5
|
|
||||||
|
Investigation of an international stock exchange listing costs
(12)
|
—
|
|
—
|
|
—
|
|
—
|
|
10.1
|
|
||||||
|
Cost of 2010 legacy option plan vesting and related payroll taxes
(13)
|
—
|
|
—
|
|
—
|
|
8.8
|
|
—
|
|
||||||
|
Secondary offering costs
(14)
|
—
|
|
—
|
|
2.0
|
|
—
|
|
—
|
|
||||||
|
Total non-core expenses
|
E
|
21.8
|
|
1.5
|
|
8.1
|
|
22.4
|
|
30.4
|
|
|||||
|
Total non-core (gains), losses and expenses
|
F=D+E
|
20.8
|
|
1.8
|
|
5.6
|
|
22.7
|
|
36.2
|
|
|||||
|
Core net income
|
G=A+F
|
197.9
|
|
197.0
|
|
158.9
|
|
138.6
|
|
113.9
|
|
|||||
|
Reconciliation of return on equity (GAAP) to core return on average tangible common equity (non-GAAP)
|
||||||||||||||||
|
Core net income attributable to common shareholders
(1)
|
H=C-B+F
|
197.9
|
|
197.0
|
|
158.9
|
|
123.0
|
|
97.4
|
|
|||||
|
Average shareholders' equity
|
927.7
|
|
843.2
|
|
771.9
|
|
826.0
|
|
791.8
|
|
||||||
|
Less: average preference shareholders' equity
|
—
|
|
—
|
|
—
|
|
(168.8
|
)
|
(182.9
|
)
|
||||||
|
Average common equity
|
I
|
927.7
|
|
843.2
|
|
771.9
|
|
657.2
|
|
608.9
|
|
|||||
|
Less: average goodwill and intangible assets
|
(83.2
|
)
|
(74.6
|
)
|
(61.4
|
)
|
(58.6
|
)
|
(54.8
|
)
|
||||||
|
Average tangible common equity
|
J
|
844.5
|
|
768.6
|
|
710.5
|
|
598.6
|
|
554.1
|
|
|||||
|
Return on equity
|
C/I
|
19.1
|
|
%
|
23.1
|
|
%
|
19.9
|
|
%
|
8.9
|
|
%
|
10.1
|
|
%
|
|
Core return on average tangible common equity
|
H/J
|
23.4
|
|
%
|
25.6
|
|
%
|
22.4
|
|
%
|
20.5
|
|
%
|
17.6
|
|
%
|
14
|
|
For the year ended December 31,
|
|||||||||||||||
|
(in millions of $, unless otherwise indicated)
|
|
2019
|
2018
|
2017
|
2016
|
2015
|
||||||||||
|
Reconciliation of diluted earnings per share (GAAP) to core earnings per common share fully diluted (non-GAAP)
|
||||||||||||||||
|
Adjusted weighted average number of diluted common shares (in thousands)
(15)
|
K
|
53.7
|
|
55.7
|
|
55.5
|
|
49.6
|
|
50.0
|
|
|||||
|
Earnings per common share fully diluted
|
C/K
|
3.30
|
|
3.50
|
|
2.76
|
|
1.18
|
|
1.23
|
|
|||||
|
Non-core items per share
|
(F-B)/K
|
0.39
|
|
0.03
|
|
0.10
|
|
1.30
|
|
0.72
|
|
|||||
|
Core earnings per common share fully diluted
|
3.69
|
|
3.53
|
|
2.86
|
|
2.48
|
|
1.95
|
|
||||||
|
Reconciliation of return on average assets (GAAP) to core return on average tangible assets (non-GAAP)
|
|
|
|
|
|
|||||||||||
|
Total average assets
|
L
|
12,471.8
|
|
10,851.2
|
|
10,926.1
|
|
10,842.6
|
|
9,967.5
|
|
|||||
|
Less: average goodwill and intangible assets
|
|
(83.2
|
)
|
(74.6
|
)
|
(61.4
|
)
|
(58.6
|
)
|
(54.8
|
)
|
|||||
|
Average tangible assets
|
M
|
12,388.5
|
|
10,776.6
|
|
10,864.8
|
|
10,784.0
|
|
9,912.7
|
|
|||||
|
Return on average assets
|
A/L
|
1.4
|
|
%
|
1.8
|
|
%
|
1.4
|
|
%
|
1.1
|
|
%
|
0.8
|
|
%
|
|
Core return on average tangible assets
|
G/M
|
1.6
|
|
%
|
1.8
|
|
%
|
1.5
|
|
%
|
1.3
|
|
%
|
1.1
|
|
%
|
|
Tangible equity to tangible assets
|
|
|
|
|
|
|||||||||||
|
Shareholders' equity
|
|
963.7
|
|
882.3
|
|
822.9
|
|
710.7
|
|
750.4
|
|
|||||
|
Less: goodwill and intangible assets
|
|
(96.5
|
)
|
(74.7
|
)
|
(60.6
|
)
|
(61.9
|
)
|
(51.1
|
)
|
|||||
|
Tangible total equity
|
N
|
867.2
|
|
807.6
|
|
762.3
|
|
648.8
|
|
699.3
|
|
|||||
|
Less: preference shareholders' equity
|
|
—
|
|
—
|
|
—
|
|
—
|
|
(182.9
|
)
|
|||||
|
Tangible common equity
|
O
|
867.2
|
|
807.6
|
|
762.3
|
|
648.8
|
|
516.4
|
|
|||||
|
Total assets
|
|
13,921.6
|
|
10,773.2
|
|
10,779.2
|
|
11,103.5
|
|
10,275.6
|
|
|||||
|
Less: goodwill and intangible assets
|
|
(96.5
|
)
|
(74.7
|
)
|
(60.6
|
)
|
(61.9
|
)
|
(51.1
|
)
|
|||||
|
Tangible assets
|
P
|
13,825.1
|
|
10,698.4
|
|
10,718.6
|
|
11,041.6
|
|
10,224.5
|
|
|||||
|
Tangible common equity to tangible assets
|
O/P
|
6.3
|
|
%
|
7.5
|
|
%
|
7.1
|
|
%
|
5.9
|
|
%
|
5.1
|
|
%
|
|
Tangible total equity to tangible assets
|
N/P
|
6.3
|
|
%
|
7.5
|
|
%
|
7.1
|
|
%
|
5.9
|
|
%
|
6.8
|
|
%
|
|
Efficiency ratio
|
|
|
|
|
|
|
|
|||||||||
|
Non-interest expenses
|
|
356.9
|
|
321.3
|
|
300.3
|
|
285.9
|
|
285.2
|
|
|||||
|
Less: amortization of intangibles
|
|
(5.5
|
)
|
(5.1
|
)
|
(4.2
|
)
|
(4.5
|
)
|
(4.4
|
)
|
|||||
|
Non-interest expenses before amortization of intangibles
|
Q
|
351.5
|
|
316.3
|
|
296.1
|
|
281.4
|
|
280.8
|
|
|||||
|
Non-interest income
|
|
184.0
|
|
168.7
|
|
157.8
|
|
147.5
|
|
140.2
|
|
|||||
|
Net interest income before provision for credit losses
|
|
345.7
|
|
343.0
|
|
289.7
|
|
258.5
|
|
239.3
|
|
|||||
|
Net revenue before provision for credit losses and other gains/losses
|
R
|
529.7
|
|
511.7
|
|
447.6
|
|
406.0
|
|
379.5
|
|
|||||
|
Efficiency ratio
|
Q/R
|
66.4
|
|
%
|
61.8
|
|
%
|
66.2
|
|
%
|
69.3
|
|
%
|
74.0
|
|
%
|
|
Core efficiency ratio
|
|
|
|
|
|
|
|
|||||||||
|
Non-interest expenses
|
|
356.9
|
|
321.3
|
|
300.3
|
|
285.9
|
|
285.2
|
|
|||||
|
Less: non-core expenses
|
E
|
(21.8
|
)
|
(1.5
|
)
|
(8.1
|
)
|
(22.4
|
)
|
(30.4
|
)
|
|||||
|
Less: amortization of intangibles
|
|
(5.5
|
)
|
(5.1
|
)
|
(4.2
|
)
|
(4.5
|
)
|
(4.4
|
)
|
|||||
|
Core non-interest expenses before amortization of intangibles
|
S
|
329.7
|
|
314.7
|
|
288.0
|
|
259.0
|
|
250.4
|
|
|||||
|
Core revenue before other gains and losses and provision for credit losses
|
T
|
529.7
|
|
511.7
|
|
447.6
|
|
406.0
|
|
379.5
|
|
|||||
|
Core efficiency ratio
|
S/T
|
62.2
|
|
%
|
61.5
|
|
%
|
64.3
|
|
%
|
63.8
|
|
%
|
66.0
|
|
%
|
______________________________
|
(1)
|
Premium paid on the preference share buy-backs and redemption are removed from core net income available to common shareholders as management views these premium amounts as non-core.
|
|
(2)
|
Reflects a gain realized on a liquidation settlement from the Avenir pass-through note, our last remaining structured investment, in 2014. As the Bank no longer holds structured investment products, management determined the gains represented by these liquidation settlements to be non-core. In 2016, 2017, 2018 and 2019, the Bank received further distributions on this liquidation settlement.
|
|
(3)
|
In 2015, reflected impairment write-downs on the core banking system in the UK related to the orderly wind-down of the deposit taking and investment management businesses. The loss was a result of decisions made which are not part of the core business strategy and therefore management considers this loss to be non-core.
|
|
(4)
|
These gains and losses were a result of the price movements of certain securities which were previously classified as AFS for our operations in Guernsey and the UK but should have been classified as trading securities in the previously published financial statements since 2011, which have been subsequently revised. This classification introduced unintended asymmetry between core accounting performance measures of the Bank and economic/risk performance of the Bank, and led management to the decision to prospectively dispose of the securities. Management considers this to be an exceptional circumstance, and accordingly has classified these as non-core items.
|
|
(5)
|
In 2017 and 2016, reflected an adjustment to the holdback payable for the acquisition of Legis due to continued strong revenue from legacy clients. While management considers the integrated operations of acquired entities to be core to our business operations, due to the limited and isolated nature of acquisitions, management does not consider the costs associated with these acquisitions to be a part of the normal course of business. Therefore management considers costs associated with acquisitions, including these contractual adjustments to the holdback payable amount, to be non-core.
|
|
(6)
|
In 2018, these losses reflected a non-core settlement loss on the de-risking of a defined benefit pension plan.
|
15
|
(7)
|
In 2015, predominantly reflected the cost of negotiated packages for three executives who stepped down from their positions during the year. In 2016, reflected payments to non-executive management staff whose roles were made redundant resulting from a span of control review. In 2017, primarily reflected severance payments to staff in our Bahamas segment as a result of management rescinding our banking license in that jurisdiction. In 2019, primarily related to the costs associated with the departure of a senior executive, severance payments relating to the closure of a branch location, and staff exit costs associated with the implementation of a target operating staffing model for the combined Channel Islands segment following the ABN AMRO (Channel Islands) Limited acquisition. Management does not consider the costs associated with these projects to be core to the strategy of the business.
|
|
(8)
|
In each of the periods reflected costs associated with a review and account remediation exercise to determine the US tax compliance status of US person account holders linked to the publicly announced so-called John Doe Summonses in November 2013 issued by the USAO to six US financial institutions with which the Bank had correspondent banking relationships. These expenses are a result of exceptional circumstances which arose outside of the normal course of business.
|
|
(9)
|
In 2015 and 2016, reflected a provision associated with the aforementioned review and account remediation exercise referenced in the above footnote. Although the Bank is unable to determine the amount of financial consequences, fine and/or penalties resulting from this tax compliance review, this reflects a provision which management believes to be appropriate. These expenses are a result of exceptional circumstances which arose outside of the normal course of business.
|
|
(10)
|
In 2015 and 2016, reflected contract negotiation, due diligence and IT implementation costs relating to the acquisition of the Bermuda Trust Company Limited and the private banking investment management of operations of HSBC Bank Bermuda Limited. In 2017 and 2018, reflected contract negotiation, due diligence and other legal costs relating to the agreement to acquire Deutsche Bank’s GTS business, excluding its US operations. In 2019, reflected contract negotiation, due diligence and other legal costs relating to the acquisition of ABN AMRO (Channel Islands) Limited. As above, due to the limited nature of acquisitions, management does not consider the costs associated with these acquisitions to be a part of normal course of business. Therefore, management considers costs associated with acquisitions, specifically including the costs associated with negotiation and integration of operations, to be non-core.
|
|
(11)
|
In 2015, 2016 and 2017, reflected costs associated with the orderly wind-down of the deposit taking, investment management and custody businesses of Butterfield Bank (UK) Limited which included staff redundancy expenses and professional fees. These expenses are a result of exceptional circumstances which arose outside of the normal course of business.
|
|
(12)
|
In 2015, reflected professional and legal fees related to the research and evaluation of an international stock exchange listing for the Bank's common shares. This research and evaluation was undertaken in an effort to provide a means for liquidity for the Bank's shareholders, and was therefore not in the normal course of business. Accordingly, management considers the expenses associated with this investigation to be non-core.
|
|
(13)
|
In 2016, reflected the expense for the vesting of the outstanding 2010 Performance Options resulting from the IPO which led to an $8.5 million salaries and other employee benefits expense, and a related payroll tax expense of $0.3 million. Management does not consider these expenses to be core to the strategy of the business.
|
|
(14)
|
In 2017, reflected professional and legal fees related to the secondary follow-on offering of the Bank's common shares. This offering was undertaken in an effort to provide further liquidity for the Bank's shareholders, and was therefore not in the normal course of business. Accordingly, management considers the expenses associated with this offering to be non-core.
|
|
(15)
|
Figures reflect the reverse share split that the Bank effected on September 6, 2016.
|
16
RISK FACTORS
The material risks and uncertainties that management believes affect us are described below. Any of the following risks, as well as risks that we do not know of or currently deem immaterial, could have a material adverse effect on our business, financial condition or results of operations. Further, the risk factors below include cautionary statements identifying important factors that could cause actual results to differ materially from those expressed in any forward-looking statements made by us or on our behalf. See "Cautionary Note Regarding Forward-Looking Statements."
Risks Relating to the Markets in Which We Operate
Adverse economic and market conditions in Bermuda, the Cayman Islands, the Channel Islands and the UK, and other markets in which we operate, have in the past resulted in and could in the future result in lower revenue, lower asset quality, increased provisions and lower earnings.
Our financial performance generally, and in particular the ability of our borrowers to pay interest and repay principal on outstanding loans and the value for the collateral securing those loans, as well as demand for loans and other products and services we offer and whose success we rely on to drive our future growth, are highly dependent upon the business environment in the markets in which we operate. A downturn in Bermuda, the Cayman Islands, and the Channel Islands and the UK can have a profound impact on our business performance. Some elements of the business environment that affect our financial performance include short-term and long-term interest rates, any downgrade in sovereign credit ratings, the prevailing yield curve, inflation and price levels, monetary policy, regulatory or legal changes (including changes in tax laws) or changes in enforcement thereof, unemployment rates, investor or business confidence, natural or man-made disasters, the strength of the local economy in the markets in which we operate, or a combination of these or other factors.
Unfavorable market conditions can result in a deterioration in the credit quality of our borrowers and the demand for our products and services, an increase in the number of loan delinquencies, defaults and charge-offs, additional provisions for loan losses, decreases in asset values, deterioration in investment performance and an overall material adverse effect on the quality of our loan portfolio.
Unlike banks that are more geographically diversified, our business is concentrated primarily in Bermuda, the Cayman Islands, and the Channel Islands and the UK, and we may be more affected by a downturn in these markets than more diversified competitors.
Our banking operations are concentrated in Bermuda, the Cayman Islands, and the Channel Islands and the UK, and we serve customers in these markets. In the year ended
December 31, 2019
,
50%
,
31%
and
15%
respectively, of our total net revenue was derived from our Bermuda, the Cayman Islands, and the Channel Islands and the UK segments. In addition, in the year ended
December 31, 2019
, 40%, 21% and 39% respectively, of our loans originated in Bermuda, the Cayman Islands, and the Channel Islands and the UK. Accordingly, a downturn in these markets may have a profound effect on our banking business. In addition, we have sought to expand our core business lines, including through recent acquisitions. Any failure in our ability to expand our core business lines, or any reduction in demand for our core services in our Bermuda, Cayman Islands and Channel Islands and the UK segments, including due to perceived reputational risks, increasing regulatory scrutiny over activities in these jurisdictions or otherwise, may adversely impact our business and results of operations, including the ongoing success of any of our acquired businesses.
Geopolitical events could disrupt our businesses and adversely affect our financial condition or results of operations.
We are exposed to risks arising out of geopolitical events, such as trade barriers, including the imposition of tariffs and other limitations on international trade and travel, exchange controls, government shutdowns, other measures taken by sovereign governments, including by the US, and uncertainty arising from recent or upcoming elections (including in the US and the UK) that can hinder economic or financial activity levels. Furthermore, unfavorable political, military or diplomatic events, armed conflict, pandemics and terrorist acts and threats, and the responses to them by governments, could also negatively affect economic activity and have an adverse effect upon our business, financial condition or results of operations.
For example, the UK formally leaving the EU (“Brexit”) and the US's present and future policies may increase the uncertainty and instability in the global financial markets, which could lead to weaker macroeconomic conditions, globally and in our key markets, that continue for the foreseeable future. Such economic weakness and uncertainty may adversely affect our business, financial condition and results of operations. We expect that Brexit could lead to legal uncertainty and potentially divergent national laws and regulations as the UK determines which EU laws to replicate or replace and we could face associated costs, particularly as they relate to our operations in the UK and certain UK territories and dependencies, namely Bermuda, the Cayman Islands, and the Channel Islands. It may also be time-consuming and expensive for us to alter our internal operations in order to comply with new regulations. The long-term financial and legal effects of Brexit will depend in part on any agreements the UK makes to retain access to EU markets following the UK's withdrawal from the EU, and there remains considerable uncertainty as to when any relationship will be agreed and implemented. The UK formally left the EU on January 31, 2020 (subject to transitional arrangements which on current plans would expire by January 2021). The political and economic instability created by Brexit may cause significant volatility in the global financial market. Political and economic uncertainty has in the past led to, and the outcome of Brexit could lead to, declines in market liquidity and activity levels, volatile market conditions and exchange rates, a contraction of available credit, lower or negative interest rates, declines in the real estate market, weaker economic growth and investment performance and reduced business confidence, all of which could impact our business.
Also, changes in legislation and regulation or an attempt by any territory or dependency of the UK in which we operate, to declare independence from the UK or to implement changes in its constitution, including its fiscal and monetary policies, could have a negative effect on the applicable jurisdiction's position as an international business center. This could have a significant negative effect on the local economy and in turn negatively affect our business.
Because the primary markets in which we operate do not have well-diversified economies, a downturn in their key industries could affect their economies as a whole and have an adverse effect on our business, financial condition or results of operations.
Bermuda is among the largest reinsurance markets in the world. The Cayman Islands is a leader in fund domiciliation for global asset managers, with 10,885 regulated mutual funds as at December 31, 2019 according to CIMA. The Channel Islands are among the leading financial centers for banking, investment funds and other financial services. Many of our commercial customers are reinsurance or regulated fund service providers. As a result, a downturn in these key sectors, a change in laws or regulations (including the favorable tax treatment of entities in these jurisdictions), or a shift of business away from Bermuda, the Cayman Islands, or the Channel Islands, including as a result of the inclusion of any of these jurisdictions on the EU list of non-cooperative jurisdictions for tax purposes, could result in job losses and adversely impact the economies in these markets. Any downturn or further concentration in the reinsurance, investment and asset management and banking markets could also adversely affect our business, financial condition and results of operations.
Banks domiciled in Bermuda, including us, are not supported by a central bank from which to borrow funds, so if we are unable to maintain sufficient liquidity by continuously attracting deposits and other short-term funding, our financial condition, including our capital ratios, funding costs or results of operations could be adversely affected.
Unlike many other jurisdictions, there is no central bank or similar governmental agency in Bermuda from which we may borrow US or Bermuda Dollars if we experience liquidity shortages, which may leave us without a lender of last resort in the event that Bermuda suffers a severe economic downturn at the same time as a liquidity
17
shortage. Similarly, there is no central bank in the Cayman Islands, Jersey or Guernsey to act as a lender of last resort. Accordingly, we may not have a lender of last resort in case of future liquidity shortages and we may be unable to sufficiently fund our liquidity needs. While there is no central bank or similar governmental agency in Bermuda, the Cayman Islands, Jersey or Guernsey that insures bank deposits, such as the Federal Deposit Insurance Corporation in the United States, the Governments of Bermuda and Jersey and the Government of the States of Guernsey have each implemented a Deposit Insurance Scheme or Deposit Compensation Scheme. See "Supervision and Regulation" and "- Certain jurisdictions in which we operate, including Bermuda, Guernsey and Jersey, have a Deposit Insurance Scheme or Deposit Compensation Scheme and we incur ongoing costs as a result.” The regulators in these jurisdictions have also required us to hold capital add-ons to compensate for the systemic importance of our bank to the economy in the absence of a central bank. Without a central bank from which we could borrow funds, liquidity management will be critical to the management of our consolidated balance sheet, and an inability to obtain sufficient liquidity could adversely affect our financial condition.
Certain jurisdictions in which we operate, including Bermuda, Guernsey and Jersey, have a Deposit Insurance Scheme or Deposit Compensation Scheme and we incur ongoing costs as a result.
As a bank licensed by the BMA, we are required to be a member of the Deposit Insurance Scheme ("DIS") and pay contributions to the Deposit Insurance Fund. Currently, our premium contribution is calculated by the Bermuda Deposit Insurance Corporation as 0.25% per annum of the average total amount of our Bermuda Dollar deposits that are covered by the DIS guarantee over a rolling three-month period, payable every three months in arrears. The amount of the contribution we are liable to pay may change from time to time as the total level of our insured Bermuda Dollar deposits changes; in addition there is no guarantee that the current rate of premium contributions charged by the Bermuda Deposit Insurance Corporation will stay the same and not increase or that the Bermuda Deposit Insurance Corporation will not require additional contributions in the event that the Deposit Insurance Fund is insufficient to pay compensation due to insured depositors. We may also not be able to recover our contributions to the Deposit Insurance Fund from any failed institution whose insured depositors receive payments from the Deposit Insurance Fund. Any contributions we are required to make as part of the DIS (and any associated costs) are a cost to our business, and such costs, including any future increases, may have an adverse effect on our business, financial condition or results of operations.
As a bank licensed by the Guernsey Financial Services Commission, we are required to pay contributions to the Guernsey Deposit Compensation Scheme (the "Guernsey DCS"). Currently, we are required to pay an administration levy which is calculated by the Guernsey DCS Board . The amount of the contribution we are liable to pay may change from time to time and there is no guarantee that the current rate charged by the Guernsey DCS Board will stay the same and not increase. In the event of the failure of a Guernsey licensed bank the Guernsey DCS Board will estimate the total level of compensation levy required and the Bank will be liable in equal shares with every other participant (i.e. every other licensed bank in Guernsey) for the first £10,000,000. If the total compensation levy exceeds £10,000,000 then the Bank will be liable on a pro-rata basis (calculated by reference to the total "value at risk" of our Guernsey deposits compared to the Guernsey market) with every other participant for the amount of such excess. We may also not be able to recover our contributions to the Guernsey DCS from any failed licensed bank whose insured depositors receive payments from the Guernsey DCS. Any contributions we are required to make as part of the Guernsey DCS (and any associated costs) are a cost to our business, and such costs, including any future increases, may have an adverse effect on our business, financial condition or results of operations.
The Jersey Bank Depositors Compensation Scheme ("Jersey DCS") is funded primarily through an upfront loan from the States of Jersey. In the event of a bank failing, levies would be raised on Jersey banks, subject to certain caps for banking groups over a 5 year period, based on the proportion of protected deposits each bank holds to repay the loan. In the event that the full £100 million liability of the Jersey DCS was called upon, banks would contribute approximately two-thirds of funding, with the States of Jersey contributing one third.
We are not currently required to pay any contributions to the Jersey DCS. Any contributions we may be required in future to make as part of the Jersey DCS (and any associated costs) are a cost to our business, and such costs, including any future increases, may have an adverse effect on our business, financial condition or results of operations.
A decline in tourism in Bermuda or the Cayman Islands could have a material adverse effect on our business, financial condition or results of operations.
Tourism is a major contributor to the economies of Bermuda and the Cayman Islands. In 2018, travel and tourism contributed 13% of GDP in Bermuda and 30% of GDP in the Cayman Islands. The deterioration of the tourism industry could decrease the value of hotels and other commercial properties, which could adversely affect our commercial loan portfolio. A decline in tourism could similarly result in an increase in unemployment, which could affect the ability of our residential borrowers to make payments on their loans. Accordingly, a decline in tourism in Bermuda or the Cayman Islands could have a material adverse effect on the economic stability of these jurisdictions, and our business, financial condition or results of operations.
Severe weather and natural disasters could disrupt our businesses and adversely affect our financial condition or results of operations.
The key markets in which we operate include Bermuda and the Cayman Islands and our business is therefore subject to the risks associated with severe tropical storms, hurricanes, tornadoes and earthquakes, including downed telephone lines, flooded facilities, power outages, fuel shortages, damaged or destroyed property and equipment, and work interruptions. Although hurricanes in the Caribbean during 2017, 2018 and 2019 did not negatively impact the Bank's operations nor cause any insurable losses,
such severe weather conditions and natural disasters may, in the future, negatively impact us and our clients and their ability to meet their financial obligations to us, including the repayment of loans. Such events may also result in an impairment of the value of property or other collateral used to secure the loans that we extend.
Climate change may aggravate the impact and increase the incidence of such severe weather. Furthermore, severe weather events may have a significant impact on the economies of the key markets in which we operate, which could have a material adverse impact on our operations.
We cannot predict whether we will continue to be able to obtain insurance for hazard-related damages to our premises or, if obtainable and carried, whether this insurance will be adequate to cover our losses. Moreover, we expect any insurance of this nature to be subject to substantial deductibles and to provide for premium adjustments based on claims, and we do not carry insurance against all types of losses. For all these reasons, any future hazard-related costs and work interruptions could have an adverse effect on our business, financial condition or results of operations.
The majority of the markets in which we operate do not have systemic credit bureau reports.
Unlike the US where the Fair Credit Reporting Act ("FCRA") is designed to help ensure that credit bureaus furnish correct and complete information when evaluating loan applications, the majority of the markets in which we operate do not have systemic credit bureau reports. Therefore, we manually review each loan and we use a formal and documented tiered credit approval process that is administered through and governed by our risk management framework. Due to limitations in the availability of information, our assessment of credit risk associated with a particular customer may not be based on complete, accurate or reliable information. In addition, although we have made and continue to make improvements to our credit scoring systems to better assess borrowers' credit risk profiles, we cannot provide assurance that our credit scoring systems collect complete or accurate information reflecting the actual behavior of customers or that their credit risk can be assessed correctly. Without complete, accurate and reliable information, we have to rely on other publicly available resources and our internal resources, which may not be effective. As a result, our ability to effectively manage our credit risk and subsequently our impairment losses and allowance for credit losses may be materially adversely affected. In addition, because our credit approval process involves detailed analyses of the customer or credit risk, taking into account both quantitative and qualitative factors, it is subject to human or information technology systems
18
errors. In exercising their judgment on current or future credit risk behavior of our customers, our employees may not always be able to assign an accurate credit rating, which may result in our exposure to higher credit risks than indicated by our risk rating system. In addition, we have been refining our credit policies and guidelines to address potential risks associated with particular industries or types of customers. However, we may not be able to timely detect all possible risks before they occur, or due to limited tools available to us, our employees may not be able to effectively implement them, which may increase our credit risk. Failure to effectively implement, consistently follow or continuously refine our credit risk management system may result in an increase in the level of nonperforming loans and a higher risk exposure for us, which could have a material adverse effect on us.
Risks Relating to Our Strategy, Brand, Portfolio and Other Aspects of Our Business
Our strategy includes expansion of our business through acquisitions of, or investments in, other companies or new products and services, but we may not be able to achieve regulatory approval for such transactions or be able to achieve the anticipated cost savings, growth opportunities and other benefits anticipated from such transactions.
We seek to grow both organically and through acquisitions. In the past several years, we have made various acquisitions and investments intended to complement and expand our businesses, including our July 2019 acquisition of ABN AMRO (Channel Islands) Limited, our February 2018 agreement with Deutsche Bank to refer Deutsche Bank's clients from their banking and custody business in the Cayman and Channel Islands to us, and our March 2018 acquisition of Deutsche Bank’s GTS business, excluding its US operations. Our long-term growth strategy includes identifying and effecting selective acquisitions in our core geographies, but we cannot be sure that we will be able to continue to identify suitable acquisition candidates or investment opportunities. Even if we identify suitable targets, there can be no assurance that we will be able to obtain the necessary funding on acceptable terms, if at all, to finance any of those potential acquisitions or investments.
We may also be required to obtain regulatory approval (including from the BMA) prior to any potential acquisition or investment depending on the transaction and the laws and regulations of the target’s country of incorporation (for example, from the Guernsey Financial Services Commission in respect of the acquisition of ABN AMRO (Channel Islands) Limited). Regulators consider a number of factors when determining whether to approve a proposed transaction, and we may have difficulty obtaining the necessary regulatory approvals, government permits or licenses required for such acquisitions. We may fail to pursue, evaluate or complete strategic and competitively significant business opportunities as a result of our inability, or our perceived inability, to obtain any required regulatory approvals in a timely manner or at all.
Even where we are able to complete an acquisition or an investment, we cannot be sure that such acquired entity, business or asset or such investment will perform in line with our assumptions or expectations or otherwise complement our business or strategy due to a variety of factors, including lower revenues than expected, unforeseen operating difficulties and expenditures. customer loss and business disruption (including, without limitation, difficulties in maintaining relationships with employees, customers, clients or suppliers) and risks associated with the disruption of management’s attention from ongoing business operations due to acquisition and integration activities.
In addition, integrating an acquired company, business or technology possesses significant risks including, among other things:
|
•
|
the incorporation of new technologies into our existing business infrastructure;
|
|
•
|
the maintenance of standards, controls, procedures and policies throughout the organization (including effective internal controls over financial reporting and disclosure controls and procedures);
|
|
•
|
the consolidation of our corporate or administrative functions;
|
|
•
|
the coordination of our sales and marketing functions to incorporate the new business or technology;
|
|
•
|
the potential for liabilities and claims arising out of the acquired businesses;
|
|
•
|
the integration of corporate cultures;
|
|
•
|
the maintenance of morale, retention and integration of key employees to support the new business or technology and management of our expansion in capacity; and
|
|
•
|
compliance with the regulatory regimes of newly entered jurisdictions.
|
In addition, a significant portion of the purchase price of companies that we may acquire may be allocated to goodwill and other intangible assets. Intangible assets are tested for impairment annually or when there is a triggering event requiring such testing; an intangible asset that is subject to amortization is periodically reviewed for impairment. Goodwill is tested for impairment on an annual basis. As at
December 31, 2019
, we had
$24.8 million
and
$71.7 million
of goodwill and intangible assets respectively. In the future, if our acquisitions do not yield expected returns or there are changes in discount rates, we may be required to take additional charges to our earnings based on the impairment assessment process, which could harm our business, financial condition, results of operations and prospects.
We rely on our reputation and the appeal of our brand to our customers. Any damage to our reputation and appeal could harm us and our business prospects.
The success of our strategy relies significantly on our reputation and the reputation of our senior management and the Board. In addition, our customers and key introducers must continue to associate our brand with meeting customer needs and delivering value to those customers. Adverse publicity (whether or not justified) relating to activities by our management, employees, agents or others with whom we do business, such as customer service mishaps or noncompliance with laws, could tarnish our reputation and reduce the value of our brand. With the increase in the use of social media outlets such as Facebook, YouTube, Instagram and Twitter, adverse publicity can be disseminated quickly and broadly, making it increasingly difficult for us to effectively respond. This unfavorable publicity could also require us to allocate significant resources to rebuild our reputation.
As a bank operating in Bermuda, the Cayman Islands, the Channel Islands and other international financial centers, we are subject to increasing scrutiny with respect to potential or alleged legal and regulatory breaches and unethical behavior and associated reputational risks, including with respect to the general perception and reputation of financial institutions in those jurisdictions, which may in turn be affected by factors including the EU list of non-cooperative jurisdictions for tax purposes (for example, the inclusion of the Cayman Islands on the list in February 2020), and policies on controversial industries such as gaming and cryptocurrencies, among others. See "
Our business may be negatively impacted by the economic substance legislation and regulations in the jurisdictions in which we operate, including Bermuda, the Cayman Islands, and the Channel Islands.
" Any circumstance that causes real or perceived damage to our brand or reputation, or banking or wealth management generally in these jurisdictions, may negatively affect our relationships with our customers and key introducers, which would have an adverse effect on our business, financial condition or results of operations.
Potential reputational issues include, but are not limited to:
|
•
|
breaching or facing allegations of having breached legal and regulatory requirements (including, but not limited to, conduct requirements, money laundering, anti-terrorism financing requirements, laws against assisting in tax evasion, cybersecurity and data protection laws, bribery and corruption);
|
|
•
|
legacy issues we inherit from the businesses we acquire through a merger or acquisition;
|
|
•
|
acting or facing allegations of having acted unethically (including having adopted inappropriate sales and trading practices);
|
19
|
•
|
failing or facing allegations of having failed to maintain appropriate standards of customer privacy, customer service and record-keeping;
|
|
•
|
failing to appropriately address potential conflicts of interest;
|
|
•
|
experiencing technology failures that impact customer services and accounts;
|
|
•
|
failing to properly identify legal, reputational, credit, liquidity and market risks inherent in products offered; and
|
|
•
|
changing the terms of our product offerings and pricing that may result in outcomes for customers that are unfair or perceived to be unfair.
|
A failure to address the above or any other relevant issues appropriately could make customers unwilling to do business with us, which could have an adverse effect on our business, financial condition or results of operations and could damage our relationships with our employees and regulators.
A decline in the residential real estate market, including in Bermuda, the Cayman Islands, the Channel Islands and the United Kingdom, could increase the risk of loans being impaired and could have an adverse effect on our business, financial condition or results of operations.
We are exposed to the risk that our borrowers may not repay their loans according to their contractual terms and that the collateral securing the payment of these loans may be insufficient. As at
December 31, 2019
, approximately
53.4%
of our Bermuda loan portfolio, net of allowance for credit losses, was composed of residential mortgages in Bermuda and approximately
68.3%
of our loan portfolio, net of allowance for credit losses, in our remaining jurisdictions was comprised of residential mortgages. A decline in the real estate market, in particular in Bermuda, the Cayman Islands, the Channel Islands and the UK (including as a result of Brexit), would mean that the collateral for our loans would hold less value. As a result, our ability to recover on defaulted loans by selling the underlying real estate would be diminished, and we would be more likely to suffer losses on the defaulted loans. Declines in the real estate market, including as a result of lower infrastructure spending in the markets in which we operate, could also adversely affect demand for new loans, further decreasing the interest revenue generated by our loan portfolio. In addition, if our estimate for our allowance for credit losses proves to be inadequate, we will have to increase the allowance accordingly and may have future charge-offs. This may lead to impairment charges on loans and other assets, higher costs and higher incurred loan-loss provisions.
The risk of loan impairment may be compounded by the fact that there is limited economic and statistical data regarding the Bermuda, the Cayman Islands and the Channel Islands real estate markets.
Although reliable and comprehensive economic and statistical data is available for certain real estate markets, such as the Case-Schiller Home Price Index in the United States, there is no comparable statistical data or mechanism to value the overall real estate market in all our markets.
This lack of information makes it difficult to assess the market value of real estate in these markets, and requires us to rely on observations of the valuation of our own real estate originations in order to assess whether the value of mortgaged real estate has declined. See "- The appraisals and other valuation techniques we use in evaluating and monitoring loans secured by real property may not accurately describe the net value of the collateral that we can realize." Any of the above factors could have an adverse effect on our business, financial condition or results of operations.
The appraisals and other valuation techniques we use in evaluating and monitoring loans secured by real property may not accurately describe the net value of the collateral that we can realize.
In considering whether to make a loan secured by real property, we generally require an appraisal of the property. However, an appraisal is only an estimate of the value of the property at the time the appraisal is made, and, as real estate values may change significantly in relatively short periods of time (especially in periods of heightened economic uncertainty), this estimate may not accurately describe the net value of the real property collateral after the loan is made. As a result, we may not be able to realize the full amount of any remaining indebtedness when we foreclose on and sell the relevant property. In addition, we rely on appraisals and other valuation techniques to establish the value of our OREO and to determine certain loan impairments. If any of these valuations is inaccurate, our consolidated financial statements may not reflect the correct value of our OREO, and our allowance for credit losses may not reflect accurate loan impairments. This could have an adverse effect on our business, financial condition or results of operations.
The value of the securities in our investment portfolio may decline in the future.
As at
December 31, 2019
, we owned
$4.4 billion
of investment securities consisting primarily of securities issued by the US government and US governmental agencies. In
2019
, our investment portfolio had an average yield of
2.89%
.
The fair value of our investment securities may be adversely affected by market conditions, including changes in interest rates, and the occurrence of any events adversely affecting the issuer of particular securities in our investment portfolio. We perform periodic reviews to determine if an other-than-temporary impairment ("OTTI") has occurred. Our Group Asset and Liability Committee reviews the results of impairment analysis and advises whether an OTTI exists. The process for determining whether an impairment is other-than-temporary usually requires complex, subjective judgments about the future financial performance of the issuer of the relevant security in order to assess the probability of receiving all contractual principal and interest payments on the security.
We did not record any OTTI losses on investments in the years ended
December 31, 2019
,
2018
and
2017
. However, in prior periods we have experienced higher OTTI on investments, in particular as a result of investments in structured securities. See "- If we are unable to effectively manage our liquidity we may need to seek additional financing and our business, financial condition or results of operations could be adversely affected."
We may be required to recognize OTTI in future periods, which could have an adverse effect on our business, financial condition or results of operations.
Volatility levels and fluctuations in foreign currency exchange rates may affect our business, financial position and results of operations.
We are exposed to foreign currency risk as a result of our holdings of foreign currency denominated assets and liabilities, investment in foreign subsidiaries, and future foreign currency denominated revenue and expense. Fluctuations in exchange rates may raise the potential for losses resulting from foreign currency trading positions, where aggregate obligations to purchase and sell a foreign currency do not offset each other or offset each other in different time periods. In addition, Brexit and the recent UK elections have introduced volatility for the Pound Sterling, which may continue in the future. Such volatility may adversely affect our operations that employ the Pound Sterling as the functional currency and materially affect our results of operations. US political events and policy have also caused significant volatility for the US dollar, which may continue in the future. Such volatility may have negative impacts on our business, financial position and results of operations.
We also provide foreign exchange services to our clients, including trading on behalf of clients in all major currencies and providing hedging solutions to manage foreign exchange risk. Foreign currency volatility influences the level of client activity. Changes in client activity may result in reduced foreign exchange trading income.
In addition, the Bermuda Dollar and the Cayman Islands Dollar are pegged to the US Dollar at exchange rates of 1 Bermuda Dollar to 1 US Dollar and 1 Cayman Islands Dollar to 1.20 US Dollar respectively. However, we cannot make assurances that these pegs will be maintained. In the event that the Bermuda Dollar or Cayman Islands Dollar is de-pegged or the current ratios are changed, including as a result of changes in laws, regulations or policies in these jurisdictions, the value of our common shares could be adversely affected. Moreover, our US Dollar deposits are used to fund mortgages in Bermuda Dollars and Cayman Islands Dollars. As the Bermuda Dollar and the Cayman Islands Dollar are pegged to the US Dollar, we do not engage in hedging activities to counteract this currency risk. If the Bermuda Dollar or Cayman Islands Dollar
20
ceased to be pegged to the US Dollar at the current ratios, however, we could be exposed to significant currency risks.
Fluctuations in interest rates and inflation may negatively impact our net interest margin and our profitability.
Net interest income is a significant component of our revenues and changes in prevailing interest rates may adversely affect our business, including the level of net interest income we earn, and for our banking business, the levels of deposits and the demand for loans. The low interest rate environment following the global financial crisis has led to changes in savings rates and continues to shift the interest of savers away from low-rate retail bank deposits.
If interest rates increase, our net interest income would narrow if our cost of funding increased without a correlative increase in the interest we earn from loans and investments. Because we rely extensively on deposits to fund our operations, our cost of funding would increase if there is an increase in the interest rate we are required to pay our customers to retain their deposits. This could occur, for instance, if we are faced with competitive or regulatory pressures to increase rates on deposits.
In addition, our cost of funding would increase if the interest rates we are required to pay for other sources of funding increase. Moreover, increases in interest rates may decrease customer demand for loans as the higher cost of obtaining credit may deter customers from seeking new loans. Further, higher interest rates might also lead to an increased number of delinquent loans and defaults, which would affect the value of our loans.
Changes in interest rates may negatively affect the value of our assets and our ability to realize gains or avoid losses from the sale of those assets, all of which also ultimately affect earnings and capital, as well as our regulatory solvency position. A sustained increase in the inflation rate in our key markets may also have an adverse effect on our business, financial condition or results of operations. For example, a sustained increase in the inflation rate may result in an increase in nominal market interest rates. A failure to accurately anticipate higher inflation and factor it into our product-pricing assumptions may result in mispricing of our products, which could adversely affect our business, financial position or results of operations. On the other hand, recent concerns regarding negative interest rates and the low level of interest rates generally may negatively impact our net interest income, which may have an adverse impact on our profitability.
Our loan and investment portfolios are subject to risk of prepayment, which could have a material adverse effect on us.
Our fixed rate loan and investment portfolios are subject to prepayment risk, which results from the ability of a borrower or issuer to pay a debt obligation prior to maturity. Generally, in a low interest rate environment, prepayment activity increases, which reduces the weighted average lives of our earning assets and could have a material adverse effect on us. We would also be required to recognize net premiums or commissions as income over a shorter period of time, thereby reducing the corresponding asset yield and net interest income. Prepayment risk also has a significant adverse impact on credit card and collateralized mortgage loans, since prepayments could shorten the weighted average life of these assets, which may result in a mismatch in our funding obligations and reinvestment at lower yields. Prepayment risk is inherent to our commercial activity and an increase in prepayments could have a material adverse effect on us.
If we are unable to effectively manage our liquidity we may need to seek additional financing and our business, financial condition or results of operations could be adversely affected.
We need liquidity to pay our operating expenses, interest on our debt and dividends on our common shares, and to replace certain maturing liabilities. Without sufficient liquidity, we will be forced to curtail our operations and our business will suffer.
Our main source of funding is customer deposits. As at
December 31, 2019
, we had
$12.4 billion
in customer deposits (54% USD deposits, 15% USD-pegged deposits), with 35% of our deposits derived from our Bermuda segment and 28% of our deposits derived from the Cayman Islands segment, and 37% derived from the Channel Islands. In addition, we source our funding from net income generated by the Bank, net of dividends paid, and to a lesser extent from other sources including the sale of securities to institutional counterparties under repurchase agreements and the sale of equity securities and AFS securities. Our deposit base includes both demand and term liabilities, but the significant majority of such deposits are demand deposits or are due within six months. Because we rely primarily on short-term deposits for funding, a sudden or unexpected shortage of funds in the banking systems in which we operate may prevent us from obtaining necessary funding without incurring higher costs. Our deposit base includes deposits from commercial and institutional clients which may be more sensitive to financial strength rating changes. A significant withdrawal of deposits in either of these markets could significantly affect our liquidity and our ability to meet our funding needs.
In addition, as a bank with subsidiaries located in various jurisdictions, the Bank’s access to inter-company funds can be restricted because our regulated banking subsidiaries are required to maintain certain liquidity ratios or minimum levels of capital in accordance with the laws of the jurisdictions in which they operate or otherwise. The necessity of maintaining these ratios or levels of capital or other liquidity considerations could restrict the ability of these subsidiaries to transfer funds to us, in the form of cash dividends, loans or advances.
In the event that our current resources do not satisfy our needs, we may need to seek additional financing. The availability of additional financing will depend on a variety of factors, such as market conditions, the general availability of credit, the volume of trading activities, the overall availability of credit to the financial services industry, our credit ratings and credit capacity, as well as the possibility that customers or lenders could develop a negative perception of our long- or short-term financial prospects, including as a result of economic uncertainty or any downgrade in sovereign credit ratings in key markets in which we operate.
We could be negatively affected if the soundness of other financial institutions and counterparties deteriorates or if such counterparties, including clearing houses, are unwilling to do business with us, in particular in respect of US Dollar transactions.
Given the high level of interdependence between financial institutions, we are and will continue to be subject to the risk of actual or perceived deterioration in the commercial and financial soundness of other financial services institutions. Within the financial services industry, the default by any one institution could lead to defaults by other institutions. Concerns about, or a default by, one institution could lead to significant liquidity problems, losses or defaults by other institutions, because the commercial and financial soundness of many financial institutions may be closely related as a result of their credit, trading, clearing or other relationships. Even the perceived lack of creditworthiness of, or questions about, a financial institution may lead to market-wide liquidity problems and losses or defaults by us or by other institutions. This risk is sometimes referred to as "systemic risk" or "contagion" and may adversely affect financial intermediaries, such as clearing agencies, clearing houses and banks with whom we interact on a daily basis. In particular, BNYM and Wells Fargo Bank, N.A. ("Wells Fargo") act as clearing houses for all our US Dollar transactions. If BNYM's or Wells Fargo's ability to act as our clearing houses becomes impaired or BNYM or Wells Fargo cease to act as our clearing houses for any other reason and other financial institutions are not willing to provide the services currently provided to us by BNYM and Wells Fargo, we could lose our ability to engage in US Dollar transactions, which could lead to severe disruptions in our operations and adversely impact our business, financial condition or results of operations.
Changes in banks’ inter-bank lending rate reporting practices or the method pursuant to which London Interbank Offered Rate ("LIBOR") is determined may adversely affect our business and results of operations.
LIBOR and other indices which are deemed “benchmarks” are the subject of recent national, international, and other regulatory guidance and proposals for reform. Some of these reforms are already effective while others are still to be implemented. These reforms may cause such benchmarks to perform differently than in the past, or have other consequences which cannot be predicted. In particular, on July 27, 2017, the UK Financial Conduct Authority (“FCA”) announced that it intends to stop persuading or
21
compelling banks to submit LIBOR rates after 2021 (the “2017 Announcement”). The 2017 Announcement indicated that the continuation of LIBOR on the current basis cannot and will not be guaranteed after 2021. This was confirmed in a 2019 Announcement from the FCA which required firms to transition to alternative rates before 2021. In September 2018, a joint Dear CEO letter was sent from the FCA and the Prudential Regulation Authority to major banks and insurers supervised in the UK, asking for the preparations and actions they are taking to manage the transition from LIBOR to alternative interest rate benchmarks. The FCA and Bank of England are working with market participants to support the transition away from LIBOR in sterling markets through the Working Group on Sterling Risk-Free Reference Rates (“RFR Working Group”). In April 2017, the RFR Working Group recommended a reformed version of the Sterling Overnight Index Average, known as the “SONIA benchmark.” The SONIA benchmark has been proposed as a robust alternative to LIBOR and is based on overnight interest rates in wholesale markets. The Alternative Reference Rates Committee, a steering committee comprised of large US financial institutions, has also proposed replacing USD-LIBOR with a new index calculated by short-term repurchase agreements - the Secured Overnight Financing Rate ("SOFR"). It is not possible to predict whether the SONIA benchmark, SOFR or any other reference rate, will become an accepted alternative to LIBOR or the effect of such an alternative on the value of LIBOR-linked financial instruments.
LIBOR is used as a reference or base rate in a portion of our loan portfolio, our investment portfolio and our subordinated debt outstanding. Any of the above changes or any other consequential changes to LIBOR or any alternative rate or benchmark as a result of any international, national, or other proposals for reform or other initiatives or investigations, or any further uncertainty in relation to the timing and manner of implementation of such changes, could have a material adverse effect on the value of the investment portfolio, or impact the interest earned on loans and interest payable on our subordinated debt.
As a result of the transition away from LIBOR, we are reviewing our loan agreements and our investments to understand the events that trigger a LIBOR substitution event and how a LIBOR substitution will be implemented on a case-by-case basis. In certain instances, legacy instruments do not address these matters in clear and workable ways, and we are working with counterparties to address these on a case-by-case basis to determine the most effective transition.
Any alternative reference or base rate may result in interest payments that are lower than or that do not otherwise correlate over time with the payments that would have been made on the elements of our balance sheet if the LIBOR rate was available in its current form.
More generally, any of the above changes or any other consequential changes to LIBOR as a result of international, national or other proposals for reform or other initiatives or investigations, or any further uncertainty in relation to the timing and manner of implementation of such changes, could have a material adverse effect on our business and results of operations, including pricing volatility, loss of market share in certain products, adverse tax or accounting impacts, compliance, legal and operational costs and risks associated with client disclosures, as well as systems disruption, model disruption and other business continuity issues. In addition, uncertainty relating to LIBOR could result in increased capital requirements for the Bank given potential low transaction volumes, a lack of liquidity or limited observability for exposures linked to LIBOR or any emerging successor rates and operational incidents associated with changes in and the discontinuance of LIBOR. Any of the above changes or any other consequential changes to LIBOR may also adversely affect the yield on loans or securities held by us, amounts paid on securities we have issued, amounts received and paid on derivative instruments we have entered into, the value of such loans, securities or derivative instruments, the trading market for securities, the terms of new loans being made using different or modified reference rates, or the availability or cost of our floating-rate funding and our exposure to fluctuations in interest rates.
We face competition in all aspects of our business, and may not be able to attract and retain wealth management, trust and banking clients at current levels.
We compete with a broad range of financial institutions. Many of our competitors are larger and have broader ranges of product and service offerings, increased access to capital, greater efficiency and pricing power. We face competition from other lending institutions and from numerous other providers of financial services, including the following:
|
•
|
Non-banking financial institutions.
The ability of these institutions to offer services previously limited to commercial banks has intensified competition. Because non-banking financial institutions are not subject to the same regulatory restrictions as banks, they can often operate with greater flexibility and lower cost structures; and
|
|
•
|
Competitors that have greater financial resources.
Some of our larger competitors, including certain international banks that have a significant presence in our market area, may have greater capital and resources and higher lending limits and may offer products, services and technology that we do not. We cannot predict the reaction of our customers and other third parties with respect to our financial or commercial strength relative to our competition, including our larger competitors.
|
In our banking business, we face competition mainly from other local banks, such as Bermuda Commercial Bank and Clarien Bank in Bermuda and from Cayman National Corporation in the Cayman Islands, as well as from subsidiaries of international banks, being RBC in the Cayman Islands and HSBC in Bermuda, whom we view as our most significant competitors. In our wealth management business line, we face competition from local competitors as well as much larger financial institutions including financial institutions that are not based in the markets in which we operate. Revenues from the trust and wealth management business depend in large part on the level of AUM, and larger international banks may have higher levels of AUM.
In our trust business, we face competition primarily from other specialized trust service providers. There are approximately 500 trust companies in the main international financial centers, and many of our competitors in this sector offer fund administration and corporate services work alongside private client fiduciary services.
Our ability to successfully attract and retain trust, wealth management and banking clients is dependent upon our ability to compete with competitors' investment products, retail products and services, level of investment performance, client services and marketing and distribution capabilities. If we are not successful, our business, financial condition or results of operations may be adversely affected.
The Bank's credit ratings have a direct effect on its competitive position, and declines in the Bank's ratings would increase the cost of borrowing funds and make our ability to raise new funds, attract and retain deposits or renew maturing debt more difficult, which may negatively affect long-term and short-term funding.
The Bank's credit strength ratings are an important component of its liquidity profile and competitive position. Ratings show each agency's view of our financial strength, operating performance and ability to meet debt obligations as they become due. Nationally recognized statistical rating organizations ("NRSROs") periodically review the financial performance and condition of banks and may downgrade or change the outlook on a bank's ratings due to, for example: a change in a bank's regulatory capital ratios; a change in an NRSRO's determination of the amount of capital cushion required to maintain a particular rating; an increase in the perceived risk of a bank's investment portfolio; reduced confidence in management; or other considerations that may or may not be under our control. The Bank has credit ratings from Standard & Poor's ("S&P"), Moody's Investor Service ("Moody's") and Kroll Bond Rating Agency ("KBRA"). Each of the rating agencies reviews its ratings and rating methodologies on a recurring basis and may decide on a downgrade at any time. The Bank's ratings as at
December 31, 2019
are shown in the table below:
22
|
|
Ratings
|
||||
|
|
KBRA
|
|
Moody's
|
|
S&P
|
|
Long-term issuer
|
A+
|
|
A3
|
|
BBB+
|
|
Short-term issuer
|
K1
|
|
P-2
|
|
A-2
|
|
Subordinated debt
|
|
A3
|
|
|
|
|
Long-term counterparty risk assessment
|
|
|
A2
|
|
|
|
Short-term counterparty risk assessment
|
|
|
P-1
|
|
|
A downgrade in our credit ratings could adversely affect clients' perception of us and our ability to compete successfully in the marketplace for deposits (or result in the withdrawal of deposits). A downgrade in our short-term debt ratings will affect our short-term funding capabilities. As a result, the impact of a one-notch downgrade in credit ratings is currently not likely to have a direct impact on funding programs, activities, borrowing capacity or borrowing costs. In addition, there has been no measurable correlation or effect on deposit levels during previous downgrades and, as a result, historically, no material impacts on the Bank's operations or results.
Negative changes in the Bank's long-term deposit ratings would also likely increase the cost of raising long-term funding in the capital markets or of borrowing funds. Even where we can access the capital markets, negative changes in our ratings could affect our share price and make any equity offerings more difficult and dilutive to current shareholders, further driving down the Bank's share price. Our ability to replace maturing or existing debt may be more difficult and expensive. In addition, our lenders and counterparties in derivative transactions are sensitive to the risk of a ratings downgrade. However, we may issue additional debt securities in the future which may increase the impact of a one notch downgrade in credit ratings.
Management cannot predict what actions rating agencies may take, or what actions we may take in response to the actions of rating agencies that could adversely affect our business. As with other companies in the financial services industry, our ratings could be downgraded at any time and without any notice by any NRSRO, which could adversely affect our business, financial conditions or results of operations.
We could fail to attract, retain or motivate highly skilled and qualified personnel, including our senior management, other key employees or members of the Board, which could adversely affect our business.
Our ability to implement our strategic plan and our future success depends on our ability to continue to attract, retain and motivate highly skilled and qualified personnel, including our senior management and other key employees and directors, competitively with our peers. The marketplace for skilled personnel is becoming more competitive, which means the cost of hiring, incentivizing and retaining skilled personnel may continue to increase. The failure to attract or retain, including as a result of an untimely death or illness of key personnel, or replace a sufficient number of appropriately skilled and key personnel could place us at a significant competitive disadvantage and prevent us from successfully implementing our strategy or effectively managing our risk framework and business operations. This could impair our ability to implement our strategic plan successfully, achieve our performance targets and otherwise have an adverse effect on our business, financial condition or results of operations.
We may also be unable to attract and retain staff due to our locations. Many of our employees are employed in Bermuda, the Cayman Islands, and the Channel Islands, which are small markets. To the extent we have needs for employees in these locations, this may be an impediment to attracting and retaining experienced personnel. Further, immigration laws in small markets may impose limitations on attracting experienced personnel.
In addition, governmental scrutiny with respect to matters relating to compensation and other business practices in the financial services industry has increased dramatically in the past several years and has resulted in more aggressive and intense regulatory supervision in certain markets in which we operate. Future legislation or regulation or government views on compensation may result in us altering compensation practices in ways that could adversely affect our ability to attract and retain talented employees.
We rely on third parties to provide services that are integral to our ordinary operations, and their failure to perform in a satisfactory manner could negatively affect us.
We rely on third parties to provide services that are integral to our ordinary course operations, including providers of information technology, administrative or investment advisory services. For example, we have a contract with Alumina pursuant to which it provides investment advisory services to us and a contract with DXC Technologies ("DXC") to supply technology infrastructure and application development management, information security and technical support for our locations in Bermuda and the Cayman Islands. We rely on Alumina to provide investment advisory services in respect of our US treasury and agency portfolio and to provide investment advice. Poor performance on the part of providers of investment advisory services could adversely affect our financial performance. A material breach of customer data, including by DXC, may negatively impact our business reputation and cause a loss of customer business; result in increased expense to contain the event and/or require that we provide credit monitoring services for affected customers; result in regulatory fines and sanctions; and/or may result in litigation. We rely on our outsourced service providers to implement and maintain prudent cyber security controls. We have procedures in place to assess a vendor's cyber security controls prior to establishing a contractual relationship and to periodically review assessments of those control systems; however, these procedures are not infallible and a vendor's system can be breached despite the procedures we employ. In addition, outsourcing is subject to regulatory controls in certain jurisdictions in which we operate and we may not always be able to obtain approval to outsourcing on terms available or sought by us, which could adversely affect our ability to enter into outsourcing arrangements.
In addition, BNYM and Wells Fargo act as clearing houses for all our US Dollar transactions and, if our relationships with BNYM and Wells Fargo are terminated, we could lose our ability to engage in US Dollar transactions. For more information see " - We could be negatively affected if the soundness of other financial institutions and counterparties deteriorates or if such counterparties, including clearing houses, are unwilling to do business with us, in particular in respect of US Dollar transactions."
Information provided to us about clients and counterparties may not be accurate or complete.
In deciding whether to extend credit or enter into other transactions with clients and counterparties, we rely on information furnished by or on behalf of clients and counterparties, including financial statements and other financial information. We also may rely on representations of clients and counterparties as to the accuracy and completeness of that information and, with respect to financial statements, on reports of independent auditors. Such information could turn out to be inaccurate, including as a result of fraud or misrepresentation on behalf of our clients, counterparties or other third parties, which would increase our credit risk and expose us to possible write-downs and losses.
We cannot be certain that our underwriting and operational controls will prevent or detect such fraud or that we will not experience fraud losses or incur costs or other losses related to such fraud. Our clients and counterparties may also experience fraud in their businesses which could adversely affect their ability to repay their loans or make use of our services.
23
During the periods reported in this annual report, we have not experienced any material losses, or had to write down collateral, as a result of fraud or misrepresentation, but we cannot be certain that the Bank will not experience any such losses or have to write down any such collateral in the future, which could have a material adverse impact on our results of operation and financial condition.
Our business is subject to risks related to litigation and regulatory actions.
We are, from time to time, involved in various legal proceedings arising from our normal business activities. These claims and legal actions, including supervisory actions by our regulators or proceedings or investigations brought by other regulators, could involve large monetary claims and significant defense costs. The outcome of these cases is uncertain. Substantial legal liability or significant regulatory action against us could have material financial effects or cause significant reputational harm to us, which in turn could seriously harm our business, financial condition, results of operations and prospects. We may be exposed to substantial uninsured liabilities, which could materially affect our results of operations and financial condition.
As previously publicly announced, in November 2013, the USAO applied for and secured the issuance of so-called John Doe Summonses to six US financial institutions with which the Bank had correspondent bank relationships. The purpose of these summonses was to identify US persons who may have been using our banking, trust, or other services to evade their own tax obligations in the United States. Although the Bank has been cooperating with the US authorities in their ongoing investigation, we are unable at this point to predict the timing or outcome of the investigation and it is possible that the ultimate resolution of this matter may be material to our financial results. Although we are unable to determine the precise amount of financial consequences, fines and/or penalties resulting from this tax compliance review, we have recorded as at
December 31, 2019
, a provision of
$5.5 million
(
December 31, 2018
:
$5.5 million
). As the investigation remains ongoing at this time, the timing and terms of the final resolution, including any fines or penalties, remain uncertain and the financial impact to the Bank could exceed the amount of the provision. In this regard, we note that the US authorities have not approved or commented on the adequacy or reasonableness of the provision.
We may be alleged to have infringed upon intellectual property rights owned by others or may be unable to protect our own intellectual property.
Competitors or other third parties may allege that we, or consultants or other third parties retained or indemnified by us, infringe on their intellectual property rights. Even in instances where we believe that claims and allegations of intellectual property infringement against us are without merit, defending against such claims is time consuming and expensive and could result in the diversion of time and attention of our management and employees. In addition, although in some cases a third party may have agreed to indemnify us for such costs, such indemnifying party may refuse, or be unable, to uphold its contractual obligations.
Moreover, we rely on a variety of measures to protect our intellectual property and proprietary information, including copyrights, trademarks, and controls on access and distribution. These measures may not prevent misappropriation or infringement of our intellectual property or proprietary information and a resulting loss of competitive advantage. In any event, we may be required to litigate to protect our intellectual property and proprietary information from misappropriation or infringement by others, which is expensive and could cause a diversion of resources and may not be successful.
Our insurance coverage may not be adequate to cover all possible losses that we could suffer, and our insurance costs could increase in the future.
Our insurance policies do not cover all types of potential losses and liabilities and are subject to limits and excesses. There can be no assurance that our insurance will be sufficient to cover the full extent of all losses or liabilities for which we are ultimately responsible, which could result in losses being incurred by the Bank. Additionally, we cannot guarantee that we will be able to renew our current insurance policies on favorable terms, or at all.
Risks Relating to Risk Oversight and Internal Controls
Our operations are reliant on effective implementation and use of technology and require us to adapt to new technologies, and a breach, interruption or failure of our technology services or the inability to effectively integrate new technologies could have an adverse effect on our business, financial condition or results of operations.
We rely heavily on communications and information systems to conduct business. In particular, we rely on technology to provide key components of our information system infrastructure, including loan, deposit and general ledger processing, risk management information collection and processing for internal control purposes, internet connections and network access. Any disruption in service of these key components, due to a natural catastrophe, or the termination of any third-party software licenses upon which any of these systems is based, could adversely affect our ability to effectively deliver products and services to clients, to detect, assess and manage risk and otherwise to conduct operations. See "- We rely on third parties to provide services that are integral to our ordinary operations, and their failure to perform in a satisfactory manner could negatively affect us.” Furthermore, any security breach, due to computer viruses, programming, malfeasance or human errors or other events or developments, of information systems or data, whether managed by us or third parties, could interrupt our business, harm our reputation or cause a decrease in the number of clients using our services. The financial services industry is continually undergoing rapid technological change with frequent introductions of new, and technology-driven products and services. The effective use of technology increases efficiency, enables financial institutions to better serve customers, and to reduce costs. We have continually invested in upgrades to our core banking systems in our largest markets, including Bermuda, the Cayman Islands, the Channel Islands and the UK, and have introduced mobile banking in Bermuda, the Cayman Islands, and the Channel Islands. However, we face the risk of having to establish and maintain further improved technological capabilities, and our future success depends, in part, on our ability to recognize and implement new technologies to address our operational and internal control needs and to meet the demands of our clients. See "- Cyber-attacks, distributed denial of service attacks and other cyber-security matters, if successful, could have an adverse effect on our business, financial condition or results of operations.”
The widespread adoption of new technologies, including cryptocurrencies and payment systems, could require substantial expenditures to modify or adapt our existing products and services as we continue to grow our internet and mobile banking capabilities. The persistence or acceleration of this shift in demand towards internet and mobile banking may necessitate changes to our retail distribution strategy, which may include restructuring our branches and work force. These actions could lead to losses on these assets and may lead to increased expenditures to reform our retail distribution channel.
Many of our competitors have substantially greater resources to invest in technological improvements than we do. We may not be able to effectively implement new, technology-driven products and services or be successful in marketing these products and services to our customers. In addition, the implementation of technological changes and upgrades to maintain current systems and integrate new ones may also cause service interruptions, transaction processing errors and system conversion delays and may cause us to fail to comply with applicable laws. Failure to successfully keep pace with technological change affecting the financial services industry and avoid interruptions, errors and delays could have an adverse effect on our business, financial condition, results of operations, or our competitive position.
Cyber-attacks, distributed denial of service attacks and other cyber-security matters, if successful, could have an adverse effect on our business, financial condition or results of operations.
We are under continuous threat of loss due to cyber-attacks, especially as we continue to expand customer capabilities to utilize the internet and other remote channels to transact business. Third parties with whom we or our customers do business also present operational and information security risks to us, including security
24
breaches or failures of their own systems. Two of the most significant cyber-attack risks that we face are e-fraud and loss of sensitive customer data. Loss from e-fraud occurs when cyber-criminals extract funds directly from customers' or our accounts using fraudulent schemes that may include internet-based funds transfers. Such attacks are infrequent, but could present significant reputational, legal and regulatory costs to us if successful.
We also face risks related to cyber-attacks and other security breaches in connection with credit card transactions that typically involve the transmission of sensitive information regarding our customers through various third parties, including merchant acquiring banks, payment processors, payment card networks (e.g., Visa or Mastercard), our processors, and BNYM and Wells Fargo as clearing banks. Some of these parties have in the past been the target of security breaches and cyber-attacks, and because the transactions involve third parties and environments such as the point of sale that we do not control or secure, future security breaches or cyber-attacks affecting any of these third parties could impact us through no fault of our own, and in some cases we may have exposure and suffer losses for breaches or attacks relating to them, including from remediation costs, increased future protection costs, reputational harm, loss of customers and potential regulatory inquiries and/or civil litigation. We also rely on numerous other third-party service providers to conduct other aspects of our business operations and face similar risks relating to them.
Often there are distributed denial of service attacks on financial services companies. Distributed denial of service attacks are designed to saturate the targeted online network with excessive amounts of network traffic, resulting in slow response times, or in some cases, causing the site to be temporarily unavailable. Generally, these attacks are conducted to interrupt or suspend a company's access to internet service. The attacks can adversely affect the performance of a company's website and in some instances prevent customers from accessing a company's website. Potential cyber threats that include hacking and other attempts to breach information technology security controls are rapidly evolving and we may not be able to anticipate or prevent all such attacks. As these threats continue to evolve, we may be required to expend significant additional resources to continue to modify or enhance our layers of defense or to investigate and remediate any information security vulnerabilities. We may also be required to incur significant costs in connection with any regulatory investigation or civil litigation resulting from a cyber-attack or information security breach that impacts us.
In addition, in April 2016, the Society for Worldwide Interbank Financial Telecommunication ("SWIFT") announced that one of its member banks was a target of a cyber-attack in February 2016. During 2017 and 2018, there were several instances of cyber-attacks involving access to the SWIFT platform.
The SWIFT platform is used by more than 10,000 financial institutions around the world, including us, to effect fund transfers. A cyber-attack on the SWIFT network can result in theft of funds and other adverse consequences, and our business, financial condition or results of operations may be adversely affected in the event that such a cyber-attack is successful.
Our operational risk management and control systems and processes are designed to help ensure that the risks associated with our activities, including those arising from cyber-attacks, breaches of information security and failure of security and physical protection, are appropriately controlled. However, these systems and processes have inherent limitations, and it is possible that we may not be able to anticipate, detect or recognize threats to our systems or data or that our preventative measures will not be effective to prevent an attack or a security breach. We also have insurance coverage that may, subject to policy terms and conditions, cover certain losses associated with cyber-attacks or information security breaches, but it may be insufficient to cover all losses from any such attack or breach. A successful cyber-attack could result in reputational harm, loss of customers, regulatory fines, civil litigation, remediation costs, increased insurance premiums and/or additional cybersecurity protection costs, any of which could materially and adversely affect our business, financial condition or results of operations.
Our controls and procedures may fail or be circumvented, which could have an adverse impact on our business, financial condition or results of operations.
We face the risk that the design of our controls and procedures that govern operations, financial reporting and compliance across jurisdictions, including those to mitigate the risk of human error, fraud or breach of fiduciary duties relating to our trust services by employees or outsiders, or to monitor financial reporting, may be inadequate, circumvented or exposed to variations in compliance at the local level, thereby causing inaccuracies in data and information or delays in the detection of errors. At present, we do not have a uniform core banking platform in place across the jurisdictions in which we operate and, therefore, we need to use manual processes to compile certain financial information from certain subsidiaries. Moreover, in the past, our information technology capabilities in Bermuda and other jurisdictions have experienced difficulties with certain identified weaknesses, including internal control deficiencies in our operations (including interest rate calculation functions).
To address this, we used manual processing, data spreadsheets or a combination thereof. Use of such manual procedures and data spreadsheets presents financial reporting and operational risks and increases the importance of staff compliance with internal operating and security procedures. In addition, we may incur operational losses due to non-compliance by our staff with internal operating and control procedures and arising from human error. Any failure or circumvention of our controls and procedures or failure to comply with any current or future regulations related to controls and procedures could have an adverse effect on our business, financial condition or results of operations.
Our risk management framework, systems and process, and related guidelines and policies, may prove inadequate to manage our risks, and any failure to properly assess or manage such risks could harm us.
Our approach to risk management requires senior management to make complex judgments, including decisions (based on assumptions about economic factors) about the level and types of risk that we are willing to accept in order to achieve our business objectives. These also include the maximum level of risks we can assume before breaching constraints determined by regulatory capital and liquidity needs and our regulatory and legal obligations including, among others, from a conduct and prudential perspective. Given these complexities, and the dynamic environment in which we operate, the decisions made by senior management may not be appropriate or yield the results expected. In addition, senior management may be unable to recognize emerging risks for us quickly enough to take appropriate action in a timely manner.
Regulatory and Tax-Related Risks
We operate in a complex and changing regulatory environment and legal and regulatory changes or our failure to comply with laws and regulations could have a negative impact on our business, financial condition or results of operations.
Our business is subject to ongoing changes in laws, regulations, policies, voluntary codes of practice and interpretations in the markets in which we operate. We currently face an increasingly extensive and complex set of laws, regulations and standards as a result of the concerns enveloping the global financial sector. We are exposed to potential changes in governmental or regulatory policies, price controls, capital controls, exchange controls, other restrictive actions, unfavorable political and diplomatic developments and changes in legislation.
Some areas of potential regulatory change involve multiple jurisdictions seeking to adopt a coordinated approach. This may result in conflicts with specific requirements of the jurisdictions in which we operate and, in addition, such changes may be inconsistently introduced across jurisdictions. See "- Our international business model exposes us to various and possibly conflicting regulatory regimes across multiple jurisdictions."
Changes may also occur in the oversight approach of regulators. It is possible that governments in jurisdictions in which we operate or obtain funding might revise their application of existing regulatory policies that apply to, or impact, the Bank's business, including for reasons relating to national interest and/or systemic stability. The powers exercisable by our regulators may also be expanded in the future.
Regulatory changes and the timing of their introduction continue to evolve and we manage our businesses in the context of regulatory uncertainty. The nature and impact of future changes are not predictable and are beyond our control. Regulatory compliance and the management of regulatory change are an important part of our
25
planning processes. We expect that we will be required to continue to invest significantly in compliance and the management and implementation of regulatory change and, at the same time, significant management attention and resources will be required to update existing, or implement new, processes to comply with new regulations.
Changes and restrictions imposed by our primary lead regulator, the BMA, and other regulators may also impact our operations by requiring us to have increased levels of liquidity, higher levels of, and better quality, capital and funding, as well as placing restrictions on the businesses we conduct (including limiting our ability to provide products and services to certain customers), requiring us to amend our corporate structure or requiring us to alter our product or service offerings. If a regulatory change has any such effect, it could adversely affect one or more of our businesses, restrict our flexibility, require us to incur substantial costs and impact the profitability of one or more of our business lines. Any such costs or restrictions could adversely affect our business, prospects, financial performance or financial condition.
Effective as of January 1, 2015, the BMA adopted capital and liquidity regulatory requirements consistent with Basel III, a framework released by the Basel Committee on Banking Supervision. Because the Basel III framework is relatively new and the BMA retains certain limited discretions, we cannot guarantee that we will be able to fully comply with all regulatory requirements. We also cannot predict what effect Bermuda's adoption of Basel III will have on our operations in other jurisdictions, some of which have not yet adopted Basel III and still operate under the Basel II framework. Furthermore, because Basel III can require capital to be held sometimes far in excess of capital required under Basel II, if other jurisdictions in which we operate move to a Basel III framework, we may not be able to meet our total capital adequacy requirements in those jurisdictions, which may lead us to move more capital into a given jurisdiction. Further, as our capital requirements remain under continuous review by the BMA, we cannot guarantee that the BMA will not seek a higher total capital ratio requirement at any time. Finally, we may be subject to heightened regulatory oversight by the BMA or other regulatory bodies in the future. For more information, see "Supervision and Regulation - Bermuda - Supervision and Monitoring by the BMA.”
Our failure or inability to fully comply with the laws and regulations could lead to fines, public reprimands, reputational damage, civil liability, enforced suspension of operations or, in extreme cases, withdrawal of authorization to operate, which could adversely affect our business, financial condition or results of operations. We could also be required to incur significant expenses to comply with new or revised regulations. Future developments or changes in laws, regulations, policies, voluntary codes of practice and their effects are expected to require greater capital resources and significant management attention, and may require us to modify our business strategies and plans.
The costs of complying with, or our failure to comply with, US and foreign laws related to privacy, data security and data protection, such as the EU General Data Protection Regulation, could adversely affect our financial condition, operating results and reputation.
Regulatory authorities have increased their focus on how companies collect, process, use, store, share and transmit personal data. New privacy security laws and regulations, including the UK's Data Protection Act 2018, the Data Protection (Jersey) Law 2018, the Data Protection (Bailiwick of Guernsey) Law, 2017, The Cayman Islands Data Protection Law 2017 (which became effective on September 30, 2019), Bermuda’s Personal Information Protection Act 2016, and the EU General Data Protection Regulation 2016, pose increasingly complex and rigorous compliance challenges, which may increase our compliance costs. Any failure to comply with data privacy laws and regulations could result in significant penalties, fines, legal challenges and reputational harm. See "Supervision and Regulation".
Changes in accounting policies and practices may be adopted by applicable regulatory agencies or other authoritative bodies, which could materially impact our financial statements.
Our accounting policies and methods are fundamental to how we record and report our financial condition and results of operations. From time to time, applicable regulatory agencies and other authoritative bodies change the financial accounting and reporting standards that govern the preparation of our financial statements. These changes can be difficult to predict and can materially impact how we record and report our financial condition and results of operations.
Failure to comply with any applicable anti-corruption legislation could result in fines, criminal penalties and an adverse effect on our business, financial condition or results of operations.
We must comply with all applicable laws and regulations, which include anti-corruption, anti-money laundering, international financial sanctions and anti-terrorist financing laws and regulations. Recently, there has been a substantial increase in the global enforcement of these laws and regulations, in particular in respect of the financial services industry. The measures and procedures we have in place may not be entirely effective in preventing third parties from using us (and our correspondent banks) as a conduit for money laundering (including illegal cash operations), terrorist financing or other financial crimes without our (and our correspondent banks') knowledge or consent. Although, as of the date of this report, we have not been subject to any fines or penalties, as a result of violations of anti-money laundering and countering terrorism laws and regulations, there can be no assurances that we will not be subject to such fines, penalties or losses or harm in the future. If we were to be associated with money laundering (including illegal cash operations) or terrorist financing, our reputation could be harmed and we could become subject to fines, sanctions or legal enforcement (including being added to any "blacklists" that would prohibit certain parties, potentially including US Dollar clearing banks, from engaging in transactions with us), which could have an adverse effect on our business, financial condition or results of operations.
Our international business model exposes us to various and possibly conflicting regulatory regimes across multiple jurisdictions.
Our international business model exposes us to different regulatory schemes across multiple jurisdictions. Although our central management and a large part of our business are located in Bermuda, our operations are spread throughout ten international jurisdictions. In addition to the logistical and communications challenges this creates, the financial services industry is heavily regulated in many jurisdictions, and each line of the business is exposed to different, constantly evolving and possibly conflicting regulatory schemes. Our management has enacted internal controls and procedures that are designed to result in compliance with these regulatory schemes, which are periodically reviewed and updated, but in the future we might have difficulty meeting and remaining in compliance with existing or new regulatory requirements imposed by a particular jurisdiction, particularly in light of the increasing regulatory scrutiny of financial institutions and their subsidiaries. Our current internal controls for one jurisdiction may not sufficiently comply with the demands of increased oversight in another jurisdiction.
To the extent we are unable to comply with the regulatory scheme of a particular jurisdiction, we might not be able to operate in that jurisdiction, or we may incur fines or penalties for compliance failures or incur costs in order to remediate compliance failures, any or all of which could adversely affect our business, financial condition or results of operations.
The Financial Action Task Force (“FATF”) may identify any of the jurisdictions in which we operate as a jurisdiction which has systemic Anti-Money Laundering and/or Anti-Terrorist Financial deficiencies, which could have an adverse effect on our business.
The FATF is an international body that identifies jurisdictions with weak measures to combat money laundering and terrorist financing in public documents published three times a year. FATF and its regional bodies work with such jurisdictions governments and regulatory bodies and report on progress made in addressing identified deficiencies. Such reviews are at a country level, rather than an entity-specific level. Thus, while the Bank can have in place globally accepted standards to fight money laundering and terrorist financing, the existing regulations in any of the jurisdictions in which we operate may not meet FATF requirements. In March 2019, the Caribbean FATF concluded that the Cayman Islands had major shortcomings on operational effectiveness and placed the Cayman Islands under a 12-month observation period. Failure to comply with FATF standards by any jurisdictions in which we operate could adversely affect our reputation, our ability to obtain financing from the international markets and attract foreign investments.
26
Our business may be negatively impacted by the economic substance legislation and regulations in the jurisdictions in which we operate, including Bermuda, the Cayman Islands, and the Channel Islands.
In 2018, all major offshore jurisdictions enacted legislation in response to new requirements imposed by the EU’s Economic and Financial Affairs Council (“ECOFIN”) regarding the need for entities registered in offshore jurisdictions to demonstrate economic substance. Compliance with these requirements is necessary to avoid a jurisdiction being placed on the EU’s list of non-cooperative jurisdictions for tax purposes. Many of the jurisdictions in which we operate, including Bermuda, the Cayman Islands, The Bahamas, Guernsey and Jersey have enacted legislation that will require entities registered, incorporated or continued under certain legislation in the respective jurisdictions engaged in “relevant activities” (which includes engaging in banking or financing activities) to satisfy economic substance requirements by maintaining a substantial economic presence in the respective jurisdiction. For example, in December 2018, Bermuda passed The Economic Substance Act 2018, the Cayman Islands passed International Tax Co-operation (Economic Substance) Law, Guernsey passed the Income Tax (Substance Requirements) (Implementation) Regulations, 2018 and Jersey passed the Taxation (Companies - Economic Substance) (Jersey) Law 2019. Any entity that must satisfy economic substance requirements but fails to do so could face financial penalties, a restriction of its business activities or being struck-off as a registered entity in the relevant jurisdiction.
In February 2020, the Cayman Islands were placed on the EU’s list of non-cooperative jurisdictions for tax purposes. ECOFIN concluded that the Cayman Islands did not have appropriate measures in place relating to collective investment vehicles. Bermuda was similarly placed on the EU’s list of non-cooperative tax jurisdictions in March 2019, but removed from this list in May 2019 and added, along with The Bahamas, to the EU's list of cooperative tax jurisdictions in February 2020. EU Finance Ministers signaled their approval of the economic substance regulations by placing Jersey and Guernsey on the EU's list of cooperative tax jurisdictions in March 2019, and the Organisation for Economic Co-operation and Development has endorsed Jersey and Guernsey’s domestic legal framework as being in line with the relevant standard. As the EU continues to monitor compliance by the jurisdictions in which we operate, further economic substance requirements imposed by these jurisdictions or a future addition of these jurisdictions to the EU's list of non-cooperative tax jurisdictions could have a material adverse effect on us.
There is significant uncertainty with respect to the impact of these new economic substance requirements, and any past or future addition to the EU's list of non-cooperative tax jurisdictions on the economies of the jurisdictions in which we operate that have enacted economic substance legislation. In particular, our existing customers may be out of scope of economic substance requirements, may already be compliant with the economic substance requirements, or may be required to restructure their business and operations to comply with economic substance requirements, which may include exiting jurisdictions and terminating their banking relationship with us. The new economic substance requirements and any addition of a jurisdiction to the EU's list of non-cooperative tax jurisdictions may lead to a decline in AUM, a reduction in our client base and/or a general economic downturn in the jurisdictions in which we operate, any or all of which could adversely affect our business, financial condition or results of operations.
We are also required to evidence our compliance (and the compliance of each of our subsidiaries located in Bermuda, the Cayman Islands, The Bahamas and the Channel Islands) with applicable economic substance requirements. Ensuring and reporting on our compliance with new economic substance requirements may require us to devote additional resources or divert resources from other aspects of our business, and/or restructure certain of our operations, all of which may lead to greater expense and could adversely affect our business, financial condition or results of operations.
Our business in Bermuda may be negatively impacted by the proposed Bermuda Tax Reform legislation.
On October 29, 2018, the Bermuda Tax Reform Commission (the “Tax Commission”) released a report on Bermuda’s system of taxation. In particular, the Tax Commission focused on reforms that would increase the Bermuda Government’s tax revenue from 17% of gross domestic product, or GDP, to 20% of GDP, an increase representing approximately $147 million of additional taxes. A number of the additional taxes identified by the Tax Commission would both directly and indirectly impact our business and operations in our largest market, Bermuda. In particular, the Tax Commission proposed both a general services tax on the value of services provided in Bermuda and a “managed services” withholding tax, both of which could potentially result in increased costs to our business and operations in Bermuda, and lead to decreased demand for our banking services in Bermuda. In addition, the Tax Commission recommended a tax on rental income from residential properties; the imposition of such rental income tax could materially affect the ability of our residential mortgage customers to service their loans, which may lead to a reduction in our interest income and an increase in loan impairment charges. While none of the Tax Commission’s proposals have been legislated as yet, if such proposals or similar reforms were enacted, any one of or combination of the foregoing could adversely affect our business, financial condition or results of operations.
We are required to obtain approval from our regulators before engaging in certain activities.
The laws, regulations, policies, voluntary codes of practice and interpretations applicable to us govern a variety of matters, including acquisitions and other activities we may engage in. As our primary lead regulator, the BMA requires that we obtain its prior consent, letter of no objection and/or approval before engaging in certain activities, including paying dividends on our common shares, entering into material acquisitions or issuing or repurchasing our common shares, and there can be no assurance that any regulatory approvals we may require will be obtained, either in a timely manner or at all. See "- Our strategy includes expansion of our business through acquisitions of, or investments in, other companies or new products and services, but we may not be able to achieve regulatory approval for such transactions or be able to achieve the anticipated cost savings, growth opportunities and other benefits anticipated from such transactions." Our regulators have the ability to compel us to, or restrict us from, taking certain actions entirely, such as actions that our regulators deem to constitute an unsafe or unsound banking practice. Any restrictions on our business placed by a regulator could have a negative impact on our ability to execute on our growth strategy. See “"- Laws in certain jurisdictions in which we operate and our bye-laws could adversely affect the rights of our shareholders or prevent or delay a change in control.”
Our ability to pay dividends to non-residents of Bermuda and the transfer of our common shares to non-residents of Bermuda could be impaired by Bermuda regulations.
A large number of our shareholders are resident outside of Bermuda, and our common shares are listed on the BSX and the NYSE. Bermuda regulations impacting non-Bermuda holders of our common shares are set by the Bermuda’s Controller of Foreign Exchange whose current policy:
|
•
|
permits the conversion of Bermuda Dollars for payment of dividends in foreign currency to shareholders who are non-residents of Bermuda for exchange control purposes, provided that all payments are processed through an authorized dealer, including, for this purpose, us; and
|
|
•
|
permits the free transferability of equity securities of a Bermuda company for so long as such equity securities of such company are listed on an ‘‘appointed stock exchange’’ appointed by the Minister of Finance under section 2(9) of the Companies Act 1981.
|
However, if the Controller of Foreign Exchange were to change the foregoing policies, our ability to pay dividends in US Dollars to non-residents of Bermuda for exchange control purposes could be impaired. Furthermore each transfer of our common shares to or from non-residents of Bermuda for exchange control purposes could require specific approval by the Controller of Foreign Exchange. This could impact the liquidity of the market for our common shares, and the value of the common shares could be adversely affected.
27
If we are considered to be a passive foreign investment company, such characterization could result in adverse US federal income tax consequences to shareholders that are US investors.
Special adverse US federal income tax rules apply if a US shareholder holds shares of a company that is treated as a passive foreign investment company ("PFIC"), for any taxable year during which the US shareholder held such shares. A foreign corporation will be considered a PFIC for any taxable year in which (1) 75% or more of its gross income is passive income, or (2) 50% or more of the average fair market value of its assets is attributable to assets that produce or are held for the production of passive income (the "asset test"). Passive income for this purpose generally includes dividends, interest, royalties, rents, annuities and gains from assets that produce passive income. If a foreign corporation owns at least 25% (by value) of the stock of another corporation, the foreign corporation is treated, for purposes of the PFIC tests, as owning a proportionate share of the other corporation's assets and receiving its proportionate share of the other corporation's income.
Banks generally derive a substantial part of their income from assets that are interest-bearing or that otherwise could be considered passive under the PFIC rules. The US Internal Revenue Service (the "IRS"), has issued a notice, and has proposed regulations, that exclude from passive income any income derived in the active conduct of a banking business by a qualifying foreign bank.
Based upon the proportion of our income derived from activities that are "bona fide" banking activities for US federal income tax purposes, we believe that we were not a PFIC for the taxable year ending
December 31, 2019
(the latest period for which the determination can be made) and, based further on our present regulatory status under local laws, the present nature of our activities, and the present composition of our assets and sources of income, we do not expect to be a PFIC for the current year or for any future years. However, because PFIC status is a factual determination and because there are uncertainties in the application of the relevant rules, there can be no assurances that we will not be a PFIC for any particular year. If we were a PFIC in any taxable year during which a US shareholder owns our common shares and the US shareholder does not make a "mark-to-market" election, as discussed under the heading "Certain Taxation Considerations - Material US Federal Income Tax Consequences - US shareholders - Passive Foreign Investment Company Considerations," or a special "purging election," we generally would continue to be treated as a PFIC with respect to such US shareholders in all succeeding years, regardless of whether we continue to meet the income or asset test discussed above. US shareholders are urged to consult their own tax advisers with respect to the tax consequences to them if we were to become a PFIC for any taxable year in which they own our common shares.
US withholding tax and information reporting requirements imposed under the Foreign Account Tax Compliance Act may apply.
As discussed below under the heading "Certain Taxation Considerations - Material US Federal Income Tax Consequences - Foreign Account Tax Compliance Act Withholding," pursuant to the Foreign Account Tax Compliance Act ("FATCA") enacted in 2010, a 30% withholding tax will be imposed on certain payments to certain non-US financial institutions that fail to comply with certain information-reporting, account identification, withholding, certification and other FATCA-related requirements in respect of their direct and indirect US shareholders and/or US accountholders. To avoid becoming subject to FATCA withholding, we and other financial institutions may be required to report information to the IRS regarding the holders of our common shares and to withhold on a portion of payments under our common shares to certain holders that fail to comply with the relevant information reporting requirements (or that hold our common shares directly or indirectly through certain non-compliant intermediaries). However, under proposed Treasury regulations, such withholding will not apply to payments made before the date that is two years after the date on which final regulations defining the term “foreign passthru payment” are enacted. The rules for the implementation of this legislation have not yet been fully finalized, so it is impossible to determine at this time what impact, if any, this legislation will have on holders of the common shares.
Many countries, including Bermuda, have entered into agreements with the United States ("intergovernmental agreements" or "IGAs") to facilitate the implementation of FATCA. These IGAs modify the FATCA withholding regime described above. In December 2013, Bermuda entered into a Model 2 IGA with the United States pursuant to which Bermudian financial institutions are directed by the Bermudian authorities to register with the IRS and to enter into an agreement with the IRS to perform specified due diligence, reporting and withholding functions.
Risks Relating to the Common Shares
The value of the common shares may fluctuate significantly.
The value of our common shares may fluctuate significantly as a result of a large number of factors, including, in part, changes in our actual or forecasted operating results and the inability to fulfill the profit expectations of securities analysts, as well as the high volatility in the securities markets generally, and more particularly in shares of financial institutions. The current market price of our common shares may not be indicative of future market prices.
Other factors, beside our financial results, that may impact the price of our common shares include, but are not limited to:
|
•
|
market expectations of the performance and capital adequacy of financial institutions in general;
|
|
•
|
investor perception of the success and impact of our strategies;
|
|
•
|
investor perception of our positions and risks, including risks associated with economic uncertainty in key markets in which we operate;
|
|
•
|
a downgrade or review of our credit ratings;
|
|
•
|
potential litigation or regulatory action involving us;
|
|
•
|
announcements concerning financial problems or any investigations into the accounting practices of other financial institutions; and
|
|
•
|
general market circumstances.
|
Holders of our common shares may not receive dividends.
The dividend policy described under "Dividend Policy" should not be construed as a dividend forecast. Our results of operations and financial condition are dependent on our performance. There can be no assurance that we will declare and pay dividends in the future. Any decision to declare and pay dividends in the future will be subject to the prior approval of the BMA and be made at the discretion of the Board. Such dividends shall be declared and paid by the Board only as permitted under applicable law. In determining the amount of any future dividends, factors the Board may take into account include: (1) our financial results; (2) our available cash, as well as anticipated cash requirements (including debt servicing); (3) our capital requirements, including the capital requirements of our subsidiaries; (4) our capital requirements to fund potential acquisitions; (5) contractual, legal, tax and regulatory restrictions on, and implications of, the declaration and payment of dividends by us to our shareholders or share buy-back activity; (6) general economic and business conditions; (7) restrictions applicable to the Bank and its subsidiaries under Bermuda and other applicable laws, regulations and policies, including the requirement to obtain a letter of no objection from the BMA for the payment of dividends on our common shares; and (8) any other factors that the Board may deem relevant. Therefore, there can be no assurance that we will declare or pay any dividends to holders of the common shares, or as to the amount of any such dividends.
Our ability to declare and pay dividends may also depend on the level of distributions, if any, received from our operating subsidiaries. Our operating subsidiaries may be precluded from declaring and paying dividends by various factors, such as their own financial condition, or restrictions applicable to us and our subsidiaries under Bermuda and other applicable laws, regulations and policies. The ability of certain of our subsidiaries to upstream funds has been increasingly restricted due to changes in the business
28
and regulatory environments in the jurisdictions in which those subsidiaries operate. In addition, any change in tax treatment of dividends or interest received by us may reduce the level of yield received by our shareholders.
Purchases of our common shares under our new share repurchase program may have resulted in the price of our common shares being higher than the price that otherwise might have existed in the open market.
On December 3, 2019, we announced that our Board of Directors approved a new $125 million share repurchase program. Pursuant to the program, the Bank is authorized to repurchase up to 3.5 million common shares of the Bank through February 28, 2021. This was executed following the completion of the previous share repurchase program of 2.5 million common shares approved by our Board of Directors on December 6, 2018 with effect from December 10, 2018 to February 28, 2020. The timing, manner, price and amount of any repurchases will be determined by the Company, in its discretion, based upon the evaluation of economic and market conditions, stock price, available cash, applicable legal and regulatory requirements and other factors, and which may include purchases pursuant to Rule 10b5-1 of the Exchange Act. The program does not require the Company to repurchase any specific number of shares and there can be no assurance that any shares will be repurchased under the program. The program may be suspended, extended, modified or discontinued by the Company at any time. These activities may have had the effect of maintaining the market price of our common shares or retarding a decline in the market price of the common shares, and, as a result, the price of our common shares may have been higher than the price that otherwise might have existed in the open market.
We are a "foreign private issuer" under US securities law. Therefore, we are exempt from certain requirements applicable to US domestic registrants.
Although we are subject to the periodic reporting requirements of the Exchange Act, the periodic disclosure required of foreign private issuers, including us, under the Exchange Act is different from periodic disclosure required of US domestic registrants. Therefore, there may be less publicly available information about us than is regularly published by or about US domestic registrants. We are exempt from certain other sections of the Exchange Act to which US domestic registrants are subject, including the requirement to provide our shareholders with information statements or proxy statements that comply with the Exchange Act. In addition, our insiders and large shareholders are not obligated to file reports under Section 16 of the Exchange Act. See ‘‘Implications of Being a Foreign Private Issuer.”
As a foreign private issuer, we are also permitted by the NYSE to comply with Bermuda corporate governance practice in lieu of complying with certain NYSE corporate governance requirements. This means that we are not required to comply with NYSE requirements that:
|
•
|
the board of directors consists of a majority of independent directors;
|
|
•
|
independent directors meet in regularly scheduled executive sessions;
|
|
•
|
the audit committee satisfy NYSE standards for director independence;
|
|
•
|
the audit committee has a written charter addressing the committee's purpose and responsibilities;
|
|
•
|
we have a nominating and corporate governance committee composed of independent directors with a written charter addressing the committee's purpose and responsibilities;
|
|
•
|
we have a compensation committee composed of independent directors with a written charter addressing the committee's purpose and responsibilities;
|
|
•
|
we establish corporate governance guidelines and a code of business conduct;
|
|
•
|
our shareholders approve any equity compensation plans; and
|
|
•
|
there be an annual performance evaluation of the nominating and corporate governance and compensation committees.
|
With the exception of having shareholders approve equity compensation plans, we have elected to comply with the NYSE requirements listed above, notwithstanding the exemptions available to us as a foreign private issuer. However, as ongoing compliance is not required by the NYSE, our shareholders may not have the same protections afforded to shareholders of companies that are subject to all of the NYSE corporate governance requirements.
We are a Bermuda company. Bermuda law differs from the laws in effect in the United States and might afford less protection to shareholders.
We are a Bermuda-based company incorporated under the laws of Bermuda. As a result, the rights of holders of our common shares will be governed by Bermuda law, including the Companies Act, the Butterfield Act and our bye-laws. The rights of shareholders under Bermuda law may differ from the rights of shareholders of companies incorporated in other jurisdictions. In particular, under Bermuda law, the duties of directors and officers of a company are generally owed to the company only, and shareholders do not generally have rights to take action against directors or officers of the company. In addition, class actions and derivative actions are generally not available to shareholders under Bermuda law. The status of laws currently in place, and areas not currently governed, are subject to change. The interests of our shareholders could be adversely affected if significant regulations are added or deleted from Bermuda’s existing statutory framework. For a summary of the existing legal framework in Bermuda, see “Supervision and Regulation.”
In addition, our business is based outside of the United States, a majority of our directors and officers reside outside of the United States and a majority of our assets and some or all of the assets of such persons are located outside of the United States. As a result, it may be difficult or impossible to effect service of process on us or our directors and officers in the United States or to enforce in the United States judgments obtained in the United States courts against us or those persons based on the civil liability provisions of the United States securities laws. Furthermore, it is doubtful whether courts in Bermuda will enforce judgments obtained in other jurisdictions, including the United States, against us or our directors or officers under the securities laws of those jurisdictions or entertain actions in Bermuda against us or our directors or officers under the securities laws of other jurisdictions.
There are provisions in our bye-laws that may be used to delay or block a takeover attempt, which could discourage, delay or prevent a change in control of the Bank and could adversely impact the value of our common shares. For a detailed summary of the anti-takeover provisions in our bye-laws, see "Description of Share Capital" in our registration statement on Form F-1 filed with the SEC on February 13, 2017 with file number 333-216018.
Laws in certain jurisdictions in which we operate and our bye-laws could adversely affect the rights of our shareholders or prevent or delay a change in control.
Under the provisions of Bermuda's Banks and Deposit Companies Act 1999 ("BDCA"), the rights of our shareholders could be impaired if any such shareholder becomes a shareholder controller. If a shareholder controller fails to comply with the notice requirements in connection with a change in control under the BDCA or continues as such after being given notice of objection to its being a shareholder controller, the BMA may take the actions specified in the BDCA, including, among other things revoking the relevant license of the Bank under the BDCA. For more information, see the summaries of relevant provisions of the BDCA regulations under "Supervision and Regulation” and "Description of Share Capital" in our registration statement on Form F-1 filed with the SEC on February 13, 2017 with file number 333-216018.
Similarly, in Guernsey certain changes to the ownership structure of our Guernsey company (which is licensed by the Guernsey Financial Services Commission) may be considered to be a change of control requiring a declaration of "no objection" from the regulator, and in Jersey a change to the ownership or control of the Jersey regulated entity may also require regulatory approval.
29
In addition to these restrictions, the provisions of our bye-laws provide that a person who is not "Bermudian" (as such term is defined in the Companies Act) who is "interested" (as such term is defined in the bye-laws) in our shares which constitute more than 40% of all shares then issued and outstanding is not entitled to vote the shares which are in excess of such 40% interest at any general meeting without the prior written approval of the Minister of Finance. See also "Supervision and Regulation.”
The issuance of additional shares in connection with future acquisitions, any share incentive or share option plan or otherwise may dilute all other shareholdings.
We may seek to raise capital to fund future acquisitions and other growth opportunities. We may, for these and other purposes, such as in connection with share incentive and share option plans, issue additional equity or convertible securities. Any issuance of additional shares, however, is subject to prior BMA approval, and we cannot guarantee that their approval will be obtained, either in a timely manner or at all. In the event that we are able to and do issue additional shares, existing shareholders could suffer dilution in their percentage ownership.
Our common shares trade on more than one market and this may result in price variations; in addition, investors may not be able to easily move shares for trading between such markets.
Our common shares have traded on the BSX since 1971 and began trading on the NYSE in September 2016. Trading in our common shares on these markets takes place in different currencies (US Dollars on the NYSE and Bermuda Dollars on the BSX), and at different times (resulting from different time zones, different trading days and different public holidays in the United States and Bermuda). The trading prices of our common shares on these two markets may differ due to these and other factors. Any decrease in the price of our common shares on the BSX could cause a decrease in the trading price of our common shares on the NYSE, or vice versa. Investors could seek to sell or buy our common shares to take advantage of any price differences between the markets through a practice referred to as arbitrage. Any arbitrage activity could create unexpected volatility in both our share prices on one exchange, and the shares available for trading on the other exchange.
30
MARKET INFORMATION
The Bank's common shares trade on the New York Stock Exchange under the symbol "NTB" and on the Bermuda Stock Exchange under the symbol "NTB.BH".
31
DIVIDEND POLICY
Dividend Policy
It is our intention to pay a quarterly dividend subject to the requisite approvals. There can be no assurance, however, that we will pay any dividend for any given period, and the declaration of dividends remains subject to the approval of our Board and receipt of a letter of no objection from the BMA.
Although we currently expect to pay dividends according to our dividend policy, we may elect not to pay dividends. Any declarations of dividends will be at the discretion of the Board and will be subject to the receipt of a letter of no objection from the BMA. Such dividends may be declared and paid by the Board only as permitted under applicable law. In determining the amount of any future dividends, the Board may take into account: (1) our financial results; (2) our available cash, as well as anticipated cash requirements (including debt servicing); (3) our capital requirements, including the capital requirements of our subsidiaries; (4) contractual, legal, tax and regulatory restrictions on, and implications of, the payment of dividends by us to our shareholders; (5) general economic and business conditions; (6) restrictions applicable to us and our subsidiaries under Bermuda and other applicable laws, regulations and policies, including the requirement to obtain a letter of no objection from the BMA for the payment of dividends on our common shares; and (7) any other factors that the Board may deem relevant. Therefore, there can be no assurance that we will declare or pay any dividends to holders of the common shares, or as to the amount of any such dividends. See ‘‘Risk Factors — Risks Relating to the Common Shares — Holders of our common shares may not receive dividends.’’
Our Historical Dividends
Since 2013 we have declared and paid dividends on a quarterly basis. For the year ended
December 31, 2019
, we declared four quarterly dividends of $0.44 per quarter totaling
$1.76
for each common share held on record as of the applicable record dates.
The following table sets forth dividends per share paid per common share during the periods indicated.
|
Year ended December 31,
|
|||||||||
|
2019
|
2018
|
2017
|
|||||||
|
(in $, unless otherwise indicated)
|
|||||||||
|
Period
|
|||||||||
|
First Quarter
|
0.44
|
|
0.38
|
|
0.32
|
|
|||
|
Second Quarter
|
0.44
|
|
0.38
|
|
0.32
|
|
|||
|
Third Quarter
|
0.44
|
|
0.38
|
|
0.32
|
|
|||
|
Fourth Quarter
|
0.44
|
|
0.38
|
|
0.32
|
|
|||
|
Total dividends per common share
|
1.76
|
|
1.52
|
|
1.28
|
|
|||
|
Total dividends per common share as a percentage of earnings per share (in %)
|
52.9
|
%
|
42.8
|
%
|
46.4
|
%
|
|||
On
February 12, 2020
, the Board of Directors declared an interim dividend of
$0.44
per common share to be paid on
March 11, 2020
to shareholders of record on
February 26, 2020
.
32
MANAGEMENT'S DISCUSSION AND ANALYSIS OF FINANCIAL CONDITION
AND RESULTS OF OPERATIONS
This section presents management's perspective on our financial condition and results of operations. The following discussion and analysis is intended to highlight and supplement data and information presented elsewhere in this report, including the consolidated financial statements and related notes and should be read in conjunction with the accompanying tables and our financial statements included in this report. The consolidated financial statements and notes have been prepared in accordance with GAAP. Certain statements in this discussion and analysis may be deemed to include "forward-looking statements" and are based on management's current expectations and are subject to uncertainty and changes in circumstances. Forward-looking statements are not historical facts but instead represent only management's belief regarding future events, many of which by their nature are inherently uncertain and outside of management's control. Actual results may differ materially from those included in these statements due to a variety of factors, including worldwide and local economic conditions, success in business retention and obtaining new business and other factors. Factors that could cause these differences are discussed in the sections titled "Cautionary Note Regarding Forward-Looking Statements" and "Risk Factors." For management's considerations and determinations of each non-core item discussed, please see "Selected Consolidated Financial Data—Reconciliation of Non-GAAP Financial Measures".
Overview
We are a full service bank and wealth manager headquartered in Hamilton, Bermuda. We operate our business through our three reportable geographic segments: Bermuda, the Cayman Islands, the Channel Islands and the UK and Other. We offer banking services, comprising of retail and corporate banking, and wealth management, which consists of trust, private banking, and asset management. In our Bermuda and Cayman Islands segments, we offer retail banking and wealth management. In our Channel Islands and the UK segment, we offer wealth management, and specifically in the UK jurisdiction, we offer residential property lending. The Other segment includes our operations in the jurisdictions of The Bahamas, Canada, Mauritius, Singapore and Switzerland. In these jurisdictions we either provide wealth management or operate service centers. These jurisdictions individually and collectively do not meet the quantitative threshold for segmented reporting and are therefore aggregated as a non-reportable operating segment.
The following table details our Net Revenue in total and by segment, as well as our total assets, total loans, total deposits, total AUA (which includes trust and custody AUA) and AUM for the years ended
December 31, 2019
,
December 31, 2018
and
December 31, 2017
.
|
For the year ended December 31,
|
||||||||
|
2019
|
2018
|
2017
|
||||||
|
Net Revenue
|
||||||||
|
% of Net Revenue from:
|
||||||||
|
Bermuda segment
|
49.8
|
%
|
56.9
|
%
|
58.4
|
%
|
||
|
Cayman Islands segment
|
30.9
|
%
|
29.0
|
%
|
28.9
|
%
|
||
|
Channel Islands and the UK segment
|
15.2
|
%
|
11.2
|
%
|
10.2
|
%
|
||
|
Other segment
|
4.1
|
%
|
2.9
|
%
|
2.5
|
%
|
||
|
(in millions of $)
|
||||||||
|
Summary Balance Sheet
|
||||||||
|
Total Assets
|
13,921.6
|
|
10,773.2
|
|
||||
|
Total Loans
|
5,142.6
|
|
4,043.9
|
|
||||
|
Total Deposits
|
12,441.6
|
|
9,452.2
|
|
||||
|
Assets under administration
|
||||||||
|
Custody and other administration services
|
30,308.1
|
|
24,514.1
|
|
||||
|
Trust
|
91,688.7
|
|
96,064.2
|
|
||||
|
Assets under management
|
||||||||
|
Butterfield Funds
|
2,156.7
|
|
2,058.4
|
|
||||
|
Other assets under management
|
3,490.9
|
|
2,786.4
|
|
||||
Market Environment
Our business is affected by international, regional and local economic conditions, as well as, the perception of future economic prospects. The significant macro-economic factors that impact our business include the US and global economic landscapes, unemployment rates, the housing markets and interest rates. During 2019, global GDP growth rates declined amidst fears over increased US-China trade tariffs, and, to a lesser extent, Brexit generated uncertainty with respect to existing global supply chains. Economic growth, inflation, and interest rates all declined over the course of 2019 although rates of unemployment remained low. In the second half of 2019, the US federal reserve cut short term interest rates to create a more accommodative environment. Interest rates remain historically low across the yield curve for most global markets. Policy accommodation across multiple major central banks continues to buoy sentiment, as equities and credit products remain solid performers.
In Bermuda, we continued to face mixed economic conditions during 2019, owing to a continued slowdown in private consumption. In real terms, GDP grew by an average of 3.5% in the first half of 2019 driven primarily by the construction sector on projects such as the new airport, new hotel development and the island's utility power station. During the second half of 2019, the growth rate is expected to slow down to 1-2%. In the tourism sector, air arrivals were down after being bolstered in the two years prior by the economic stimulus provided by Bermuda's hosting of the America's Cup international sailing event but, due to cruise passengers, total visitor numbers are up. The Bermuda economy continues to face medium-term challenges from high unemployment, significant government debt and related debt service charges. See "Risk Factors - Risks Relating to the Markets in Which We Operate - Adverse economic and market conditions in Bermuda, the Cayman Islands and the Channel Islands and the UK, have in the past resulted in and could in the future result in lower revenue, lower asset quality, increased provisions and lower earnings" and “Risk Factors - Risks Relating to the Markets in Which We Operate - A decline in tourism in Bermuda or the Cayman Islands could have a material adverse effect on our business, financial condition or results of
33
operations”. Overcoming these challenges, as well as continuing to attract foreign capital, is a key focus of the Bermuda Government. Sustainable growth for the Bermudian economy will be driven largely by successful management of these issues.
Following the 2008 financial crisis, the Bermuda economy experienced consecutive years of GDP declines. In addition, the impact of the crisis on employment, population levels and real estate values was negative for several years thereafter. Since 2015, GDP growth has been more robust. Real estate and rents have also recovered over this period. International business activity declined from 2009 to 2011, with modest annual growth from 2012 onwards. The real estate and international business components represent approximately 40% of Bermuda’s GDP and therefore provide insight into both the overall health of the Bermuda economy and the longer-term recovery. The table below shows the extent to which the real estate market and overall economy has recovered, stabilized, and begun to show growth.
|
2018
|
2017
|
2016
|
2015
|
2014
|
|||||||||||
|
Bermuda GDP (in millions)
|
7,263
|
|
7,142
|
|
6,900
|
|
6,655
|
|
6,414
|
|
|||||
|
% change from prior year
|
1.7
|
%
|
3.5
|
%
|
3.7
|
%
|
3.8
|
%
|
(0.8
|
)%
|
|||||
|
Selected GDP Components:
|
|
|
|||||||||||||
|
Real estate and renting GDP (in millions)
|
1,014
|
|
981
|
|
929
|
|
905
|
|
893
|
|
|||||
|
% change from prior year
|
3.4
|
%
|
5.6
|
%
|
2.7
|
%
|
1.3
|
%
|
(0.2
|
)%
|
|||||
|
International business GDP (in millions)
|
1,725
|
|
1,720
|
|
1,718
|
|
1,707
|
|
1,617
|
|
|||||
|
% change from prior year
|
0.3
|
%
|
0.1
|
%
|
0.6
|
%
|
5.6
|
%
|
4.6
|
%
|
|||||
Source
: Government of Bermuda, Department of Statistics, Annual Publication - 2018, Gross Domestic Product at current purchaser's prices, Table 4
The Government of Bermuda, Department of Statistics, Quarterly GDP at current prices for 2018 are shown below to provide further insight into current GDP trends. Note that the Q3 nor Q4 figures for 2019 are not available as of the date of this report.
The Cayman Islands projected real GDP growth in 2019 of 2.6%, which is down from 3.3% in the previous year. However, it is expected that growth in tourism, construction and auxiliary services will remain robust whilst growth in financial services, the largest contributor to GDP, will be more modest. Tourism arrivals have benefited from sustained economic growth in source markets, predominantly the US and Canada, 2017 hurricane impacts on Caribbean competitors as well as improved marketing. The Owen Roberts International Airport redevelopment and expansion project was completed in the second half of 2019 at a cost of $80 million with further expansion of the runway, to accommodate larger direct flights, mainly from Europe, still to be undertaken. Additional infrastructure projects include the proposed Cruise Berthing Facility and Cargo Port Redevelopment Project which would cost in excess of $200 million. The Cayman Islands Government continues to record growing surpluses and overall external debt reduction. The most recent consumer price index data estimates an inflation increase of 2.9% for 2019 driven by rising crude oil prices in the international market and increased demand in the US, a major source market of the Cayman Islands. An increasing local population has also led to a higher demand for goods and services causing additional inflationary pressure. Commercial credit reported increased activity led by financial corporations, primary production and trade and commerce, while credits to households reported increases in domestic property, vehicle, education and technology loans, which plays to our strength in the Cayman Islands and is reflected in the growth of our domestic residential mortgage book.
Meanwhile, the UK quarterly economic growth was flat in the fourth quarter of 2019 as expected due to the continued political uncertainty around the UK’s exit from the EU which took place on January 31, 2020. This follows a 0.5% advance in the previous period. Manufacturing contracted for a third quarter in a row whilst the service sector slowed around the time of the election. Our operations in the Channel Islands and the UK use the Pound Sterling as their functional currency, and are closely linked to economic trends in both the UK and the Eurozone due to the close relationships between the UK and Europe, despite the Channel Islands' autonomy from the UK. See "Risk Factors - Risks Related to Markets in Which We Operate - Geopolitical events could disrupt our businesses and adversely affect our financial condition or results of operations".
Against this backdrop, our banking businesses in the Channel Islands and the UK continued to benefit from strong loan demand. Our loan offering has proven to be competitive in the UK market, specifically in the Prime Central London property market.
We continue to maintain a cautious stance with a liquid balance sheet, a conservative investment portfolio, and no reliance on wholesale funding. Total liquid cash and investments made up
60.0%
of our balance sheet at
December 31, 2019
, which is up slightly from
59.3%
at
December 31, 2018
.
34
Management's Discussion and Analysis of Financial Condition and Results of Operations for the Year Ended
December 31, 2019
2019
Overview
In
2019
, our net income decreased to
$177.1 million
from
$195.2 million
in
2018
. The
$18.1 million
decrease was driven by a decreasing interest rate environment and costs associated with the expansion of the Halifax service center, as well as certain items which management believes are not representative of our financial results (or "non-core") which were partially offset by growth in fee income attributable to increased card service contributions and foreign exchange transactional volumes. The non-core items contributing to the decrease in our net income comprised principally of deal-related expenses attributable to the ABN AMRO (Channel Islands) acquisition and our cost restructuring initiatives in Bermuda and the Channel Islands. Excluding the non-core items, core net income improved year-over-year by
$0.9 million
to
$197.9 million
, which was driven by a continued focus on prudent expansion within our core businesses and markets, diligent management of capital, expenses and risks, and maintaining our strong capital position with CET1 and Total capital ratios of
17.3%
and
19.4%
, respectively. To enhance common shareholder returns, for the year ended December 31,
2019
, the Board declared four quarterly dividends of
$0.44
per quarter totaling $1.76 for each common share held on record as of the applicable record dates, and approved a new share buy-back program authorizing the purchase of up to $125 million or 3.5 million shares. The Board will continue to evaluate capital planning options and the payment of future dividends as warranted, subject to regulatory requirements. See "Dividend Policy" and "Risk Factors – Risks Relating to the Common Shares — Holders of our common shares may not receive dividends" elsewhere in this report for further details.
The quality of our assets remained strong and total assets increased year-over-year by
$3.1 billion
to
$13.9 billion
, driven primarily by our acquisition of ABN AMRO (Channel Islands). Deposits increased
$3.0 billion
to
$12.4 billion
and loans increased
$1.1 billion
to
$5.1 billion
, both primarily as a result of the acquisition of ABN AMRO (Channel Islands), with loans also benefiting from increased residential loan originations in prime central London and two new sovereign mandates in Bermuda and Cayman. Investments marginally increased by
$0.2 billion
to
$4.4 billion
. Overall liquidity remained strong, as measured by cash due from banks, securities purchased under agreement to resell, short-term investments and investments in securities as a percentage of total assets, ended the year at
60.0%
compared to
59.3%
in the prior year.
Our shareholders’ equity increased year-over-year by
$81.4 million
to
$963.7 million
, which was a result of organic growth through net income net of dividends paid out during the year, the positive effect of mark-to-market movements in the value of our fixed income investments, partially offset by the common share buy-backs and retirements throughout the year.
Key contributors to our
2019
results were as follows:
|
•
|
Profitability:
Net income decreased year-over-year
$18.1 million
, or
9.3%
, to
$177.1 million
, which was largely attributable to three US Federal Reserve interest rate cuts, costs associated with the expansion of a group service center prior to the transition in the first half of 2020 and higher non-core items comprised principally of transaction-related expenses attributable to the ABN AMRO (Channel Islands) acquisition and cost restructuring initiatives in Bermuda and the Channel Islands. After eliminating items which management believes are not representative of our financial results, or "non-core", our core net income increased
$0.9 million
to
$197.9 million
. Increases in non-interest income are due to increased card service fee contributions, increased transactional volumes on foreign exchange transactions, new business and the impact of the late 2018 on-boarding of Deutsche Bank clients as well as the ABN AMRO (Channel Islands) acquisition. Increases in interest income on investments and deposits with banks is due to additional funding as a result of the ABN AMRO (Channel Islands) acquisition. Increases in interest income on loans is also largely due to the ABN AMRO (Channel Islands) acquisition.
|
|
•
|
Net interest margin:
NIM decreased by
39
basis points to
286
basis points compared to
325
basis points in
2018
, and the cost of funding increased by
29
basis point to
47
basis points. One of the drivers of the decrease in NIM was a decrease in loan yields by
11
basis points to
536
basis points as a result of the impact of Fed Funds rate reductions on the US prime rate referenced Cayman loans and the inclusion of the new ABN AMRO (Channel Islands) loan book at a lower yield. An additional driver is the 29 basis points increase in cost of deposits to 47 basis points as a result of the higher rates as well as higher volumes of deposits as a result of the ABN AMRO (Channel Islands) acquisition. The investment portfolio offset the overall NIM decrease, with yields increasing by
18
basis points to
289
basis points due to additional funding as a result of the ABN AMRO (Channel Islands) acquisition.
|
|
•
|
Expenses:
Total non-interest expenses increased year-over-year
$35.6 million
to
$356.9 million
in
2019
due largely to the increased salaries and other employee benefits resulting from an increased headcount with the ABN AMRO (Channel Islands) acquisition and Halifax service center expansion as well as cost restructuring initiatives in Bermuda and the Channel Islands, costs associated with the departure of a senior executive, increases in marketing expenses associated with the rebranding initiative we announced in Q4 2019, and overall increased costs associated with the ABN AMRO (Channel Islands) acquisition. Total non-interest expenses were also due to the non-core expense items discussed above that management does not believe are representative of our ongoing operations. After removing the effect of these items, core non-interest expenses increased by $15.3 million, from $319.8 million in
2018
, to $335.1 million in
2019
. The core efficiency ratio increased from
61.5%
in
2018
to
62.2%
in
2019
, reflecting the rate of core non-interest expense relative to the relative increase in revenue.
|
|
•
|
Deposits:
Customer deposits increased year-over-year by
$3.0 billion
as at
December 31, 2019
due primarily to the acquisition of ABN AMRO (Channel Islands), and to a lower extent, to organic growth while interest bearing deposit costs increased by
34
basis points to
58
basis points in
2019
. With non-interest bearing deposits totaling
$2.2 billion
on
December 31, 2019
, the average cost of deposits for the year increased by
29
basis points to
47
basis points.
|
|
•
|
Loan quality:
As at
December 31, 2019
, we had gross non-accrual loans of
$50.4 million
representing
1.0%
of total gross loans, a slight increase from the
$48.7 million
, or
1.2%
, of total loans, at year-end
2018
. Net non-accrual loans were
$32.7 million
, equivalent to
0.6%
of net loans, after specific provisions of
$17.7 million
, reflecting an increase in the specific provision coverage ratio of
35.1%
, from
30.6%
on
December 31, 2018
.
|
2018
Overview
In 2018, our net income increased to $195.2 million from $153.3 million in 2017, which was driven by our focus on prudent expansion within our core businesses and markets, diligent management of capital, expenses and risks. While net income increased by $41.9 million to $195.2 million, this increase was offset by the impact of certain items which management believes are not representative of our financial results, or "non-core". The significant non-core items excluded from core net income are as follows: due diligence and other legal costs relating to the agreement to acquire Deutsche Bank’s GTS business and Deutsche Bank's Channel Islands and Cayman Islands banking businesses, a loss recorded due to a non-core settlement loss on the de-risking of a legacy defined benefit pension plan; and tax compliance review costs, which were partially offset by a gain on liquidation of a legacy structured investment vehicle. Excluding these items, core net income improved by $38.2 million to $197.0 million, building on our strong capital position with Total and Tier 1 capital ratios of 22.4% and 19.6%, respectively. For the year ended December 31, 2018, the Board declared four quarterly dividends of $0.38 per quarter totaling $1.52 for each common share held on record as of the applicable record dates.
The quality of our assets remained strong as total assets decreased marginally year-over-year by $6.1 million to $10.8 billion, driven by an increase in loans outstanding, which increased by $0.3 billion to $4.0 billion as a result of new residential mortgage lending in our UK jurisdiction. Deposits decreased year-over-year by $84.2 million to $9.5 billion, primarily a result of several large customers withdrawing deposits during the year. Investments decreased year-over-year by $0.5 billion to $4.3 billion to help fund lending opportunities. However, held-to maturity investments increased year-over-year by $0.7 billion to $2.1 billion as investment duration extended. Overall liquidity remained strong, as measured by cash due from banks, securities purchased under agreement to resell, short-term investments and investments in securities as a percentage of total assets, ended the year at 59.3% compared to 61.9% in the prior year.
35
Our shareholders’ equity increased year-over-year by $59.5 million to $882.3 million, which was a result of the strong return on equity driven by net income net of dividends paid out during the year, which was offset by mark-to-market movements in the value of our fixed income investments, which decreased as interest rates rose during the year.
Key contributors to our 2018 results were as follows:
|
•
|
Profitability:
Net income increased year-over-year by $41.9 million, or 27.4%, to $195.2 million, which was largely attributable to increases in non-interest and net interest income and partially offset by certain "non-core" items described above. After eliminating these non-core items, our core net income increased $38.2 million to $197.0 million. Increases in non-interest income were driven largely by additional revenues earned from trust fees as a result of the recent acquisition of Deutsche Bank's GTS business. Increases in net interest income were largely a result of continued increased yields on loans as a result of base rate increases in certain jurisdictions and increased yields on investments resulting from a rising interest rate environment.
|
|
•
|
Net interest margin:
NIM increased by 52 basis points to 325 basis points compared to 273 basis points in 2017, and the cost of funding increased by 7 basis point to 18 basis points. The primary driver of the increase in NIM was an increase in loan yields by 37 basis points to 547 basis points as a result of base rate increases in certain jurisdictions during the year. The investment portfolio augmented the increase, with yields increasing by 49 basis points to 271 basis points due to an average increase in the long-term yield of US Treasury debt over the year, which was reflected in our portfolio due to the high proportion of our portfolio in adjustable-rate securities as well as purchases of longer duration, higher yielding securities into our HTM portfolio.
|
|
•
|
Expenses:
Total non-interest expenses increased year-over-year by $21.0 million to $321.3 million in 2018, due largely to the increased salaries and other employee benefits resulting from an increased headcount from the two acquisitions and increased discretionary compensation, in conjunction with increased professional fees associated with the two Deutsche Bank acquisitions, increased costs supporting our cyber risk protection program, which include staffing and other professional fees, and other regulatory compliance costs. Total non-interest expenses also increased due to the non-core expense items discussed above that management does not believe are representative of our ongoing operations. After removing the effect of these items, core non-interest expenses increased by $27.6 million, from $292.2 million in 2017, to $319.8 million in 2018. The core efficiency ratio decreased from 64.3% in 2017 to 61.5% in 2018, reflecting the rate of core non-interest expense relative to the relative increase in revenue.
|
|
•
|
Deposits:
Customer deposits decreased year-over-year by $105.6 million as at December 31, 2018 due to several large corporate clients withdrawing their deposits during the year, partially offset by organic growth and growth from the acquisition of Deutsche Bank's banking and custody business in the Cayman and Channel Islands, while interest bearing deposit costs increased by 9 basis points to 24 basis points in 2018 and 2017. With non-interest bearing deposits totaling $2.1 billion on December 31, 2018, the average cost of deposits for the year increased by 7 basis point to 18 basis points.
|
|
•
|
Loan quality:
As at December 31, 2018, we had gross non-accrual loans of $48.7 million representing 1.2% of total gross loans, relatively flat from the $43.9 million, or 1.2%, of total loans at year-end 2017. Net non-accrual loans were $33.8 million, equivalent to 0.8% of net loans, after specific provisions of $14.9 million, reflecting an increase in the specific provision coverage ratio of 30.6%, down from 31.1% on December 31, 2017.
|
Financial Summary
|
Summary Balance Sheet
|
As at December 31
|
||||||||
|
(in millions of $)
|
2019
|
2018
|
Dollar change
|
Percent change
|
|||||
|
Cash due from banks
|
2,550.1
|
|
2,053.9
|
|
496.2
|
|
24.2
|
%
|
|
|
Securities purchased under agreements to resell
|
142.3
|
|
27.3
|
|
115.0
|
|
421.2
|
%
|
|
|
Short-term investments
|
1,218.4
|
|
52.3
|
|
1,166.1
|
|
2,229.6
|
%
|
|
|
Investment in securities
|
4,436.4
|
|
4,255.4
|
|
181.0
|
|
4.3
|
%
|
|
|
Loans, net of allowance for credit losses
|
5,142.6
|
|
4,043.9
|
|
1,098.7
|
|
27.2
|
%
|
|
|
Premises, equipment and computer software, net of accumulated depreciation
|
158.2
|
|
158.1
|
|
0.1
|
|
0.1
|
%
|
|
|
Goodwill and intangible assets, net
|
96.5
|
|
74.7
|
|
21.8
|
|
29.2
|
%
|
|
|
Total assets
|
13,921.6
|
|
10,773.2
|
|
3,148.4
|
|
29.2
|
%
|
|
|
Total deposits
|
12,441.6
|
|
9,452.2
|
|
2,989.4
|
|
31.6
|
%
|
|
|
Long-term debt
|
143.5
|
|
143.3
|
|
0.2
|
|
0.1
|
%
|
|
|
Shareholders' equity
|
963.7
|
|
882.3
|
|
81.4
|
|
9.2
|
%
|
|
36
|
Summary Income Statement
|
For the year ended December 31
|
Dollar change
|
Percent change
|
||||||||||||||
|
(in millions of $, except per share data)
|
2019
|
2018
|
2017
|
2018 to 2019
|
2017 to 2018
|
2018 to 2019
|
2017 to 2018
|
||||||||||
|
Interest income
|
|
|
|
|
|||||||||||||
|
Loans
|
234.0
|
|
218.5
|
|
187.0
|
|
15.5
|
|
31.5
|
|
7.1
|
%
|
16.8
|
%
|
|||
|
Investments
|
129.4
|
|
124.3
|
|
101.4
|
|
5.1
|
|
22.9
|
|
4.1
|
%
|
22.6
|
%
|
|||
|
Deposits with banks
|
41.6
|
|
24.8
|
|
17.2
|
|
16.8
|
|
7.6
|
|
67.7
|
%
|
44.2
|
%
|
|||
|
Interest expense
|
(59.4
|
)
|
(24.6
|
)
|
(15.9
|
)
|
(34.8
|
)
|
(8.7
|
)
|
141.5
|
%
|
54.7
|
%
|
|||
|
Net interest income before provision for credit losses
|
345.7
|
|
343.0
|
|
289.7
|
|
2.8
|
|
53.2
|
|
0.8
|
%
|
18.4
|
%
|
|||
|
Non-interest income
|
184.0
|
|
168.7
|
|
157.8
|
|
15.4
|
|
11.0
|
|
9.1
|
%
|
7.0
|
%
|
|||
|
Net revenue
|
529.7
|
|
511.7
|
|
447.6
|
|
18.0
|
|
64.1
|
|
3.6
|
%
|
14.3
|
%
|
|||
|
Provision for credit recoveries (losses)
|
0.2
|
|
7.0
|
|
5.8
|
|
(6.8
|
)
|
1.2
|
|
(97.1
|
)%
|
20.7
|
%
|
|||
|
Salaries and other employee benefits
|
(183.7
|
)
|
(159.8
|
)
|
(145.1
|
)
|
(23.9
|
)
|
(14.7
|
)
|
15.0
|
%
|
10.1
|
%
|
|||
|
Other non-interest expenses (including income taxes)
|
(171.9
|
)
|
(162.8
|
)
|
(156.3
|
)
|
(9.1
|
)
|
(6.5
|
)
|
5.6
|
%
|
4.2
|
%
|
|||
|
Net income before other gains (losses)
|
174.3
|
|
196.0
|
|
152.0
|
|
(21.7
|
)
|
44.0
|
|
(11.1
|
)%
|
28.9
|
%
|
|||
|
Total other gains (losses)
|
2.8
|
|
(0.9
|
)
|
1.3
|
|
3.7
|
|
(2.2
|
)
|
(411.1
|
)%
|
(169.2
|
)%
|
|||
|
Net income
|
177.1
|
|
195.2
|
|
153.3
|
|
(18.1
|
)
|
41.9
|
|
(9.3
|
)%
|
27.3
|
%
|
|||
|
Non-core items
|
20.8
|
|
1.8
|
|
5.6
|
|
19.0
|
|
(3.8
|
)
|
1,055.6
|
%
|
(67.9
|
)%
|
|||
|
Core net income (Non-GAAP)
|
197.9
|
|
197.0
|
|
158.9
|
|
0.9
|
|
38.1
|
|
0.5
|
%
|
24.0
|
%
|
|||
|
Core earnings to common shareholders (Non-GAAP)
|
197.9
|
|
197.0
|
|
158.9
|
|
0.9
|
|
38.1
|
|
0.5
|
%
|
24.0
|
%
|
|||
|
Common dividends paid
|
(93.6
|
)
|
(83.7
|
)
|
(69.7
|
)
|
(9.9
|
)
|
(14.0
|
)
|
11.8
|
%
|
20.1
|
%
|
|||
The following charts show the trajectory of our performance from
2015
to
2019
:
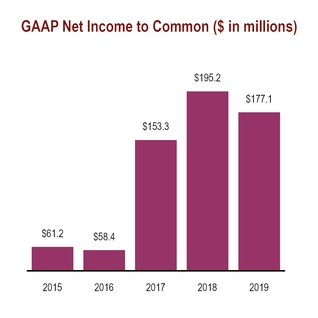
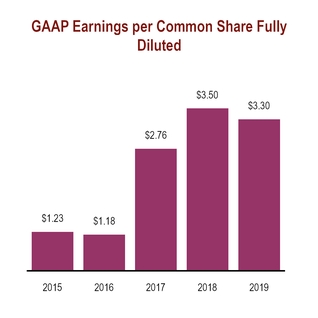
37

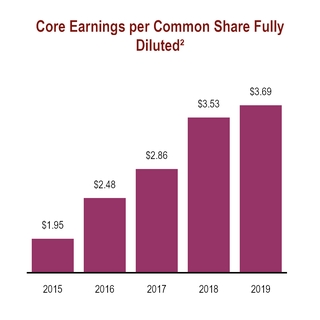
____________________________
|
(1)
|
Core Net Income to Common is a non-GAAP financial measure that is calculated by adjusting net income for income or expense items which management considers not to be representative of the ongoing operations of our business and preference share dividends, guarantee fees and premiums paid on preference share buybacks and redemptions. For a reconciliation of Core Net Income to Common to GAAP net income to common, see "Selected Consolidated Financial and Other Data – Reconciliation of Non-GAAP Financial Measures".
|
|
(2)
|
Core Earnings per Common Share Fully Diluted is a non-GAAP financial measure that is calculated by dividing Core Earnings to Common by the weighted average shares outstanding. For a reconciliation of Core Earnings per Common Share Fully Diluted to GAAP earnings per share, see "Selected Consolidated Financial and Other Data – Reconciliation of Non-GAAP Financial Measures".
|
Our return on equity for
2019
of
19.1%
and our Core ROATCE
1
for
2019
of
23.4%
were driven by a number of factors, including: significant fee income with historically low capital requirements, low cost deposits, a high yielding loan portfolio, a conservative capital efficient securities portfolio, and our operations in corporate income tax neutral jurisdictions. As a result, our business generated core net income in
2019
well in excess of that needed to execute our organic balance sheet growth strategy.
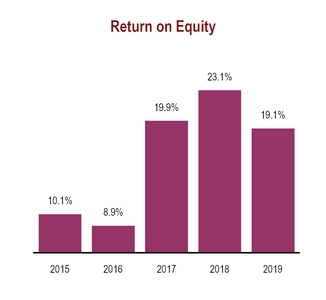
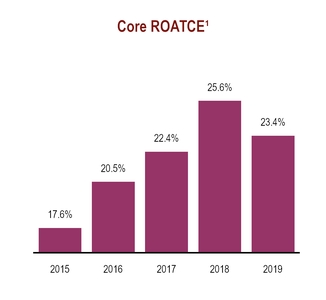
____________________________
|
(1)
|
Core ROATCE is a non-GAAP financial measure that is calculated by dividing core earnings to common shareholders by average tangible common equity. Average tangible common equity does not include the preference shareholders' equity or goodwill and intangible assets. For more information on the non-GAAP financial measures, see "Selected Consolidated Financial and Other Data — Reconciliation of Non-GAAP Financial Measures."
|
38
The following chart shows customer deposit trends for
2015
to
2019
:
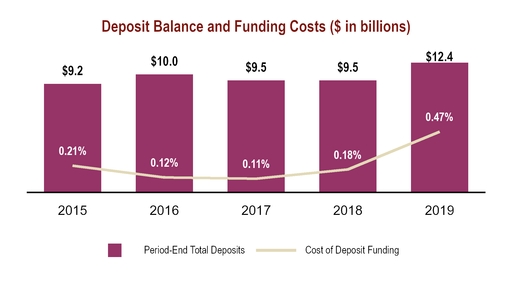
Historically, the markets in which we operate generate fewer loans than deposits, which has led us to take a conservative approach to managing our balance sheet. We accomplish this by maintaining a large cash balance and investing in high quality and liquid securities. The following chart illustrates our asset composition as at
December 31, 2019
:
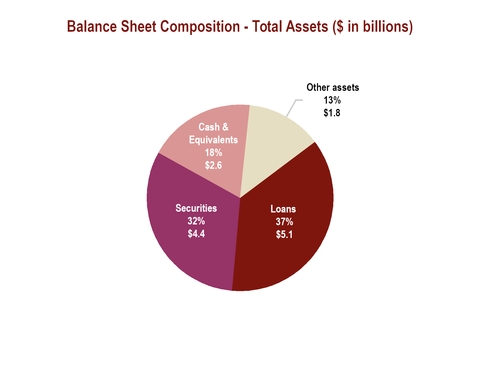
A
s
at
December 31, 2019
,
18%
of our balance sheet was cash and cash equivalents, which included cash and demand deposits with banks, unrestricted term deposits, and treasury bills with a maturity less than three months.
In addition to maintaining a large cash and cash equivalents balance, we also have a large and conservative securities investment portfolio. We have a disciplined investment portfolio selection process and invest in highly rated securities. We also seek to ensure that our portfolio remains liquid across market cycles:
96.1%
of our portfolio was invested in US government treasuries and mortgage-backed securities issued by US governmental agencies. Our investment strategy as at
December 31, 2019
, aims to align the behavioral interest rate risk profile of our assets and liabilities — as at
December 31, 2019
, the average duration of our AFS investment portfolio was 3.1 years, the average duration of our HTM investment portfolio was 4.0 years, and the average duration of our total investment portfolio was 3.5 years. As at
December 31, 2019
, the total carrying value of our AFS investment portfolio was
$2.2 billion
, and the total carrying value of our HTM investment portfolio was
$2.2 billion
.
39
The following charts show the composition of our investment portfolio by rating and asset type as
at
December 31, 2019
:
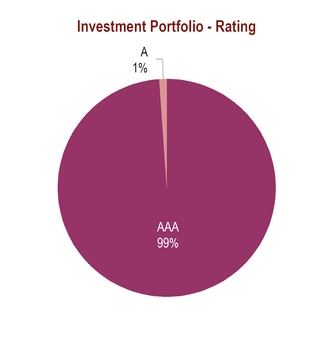
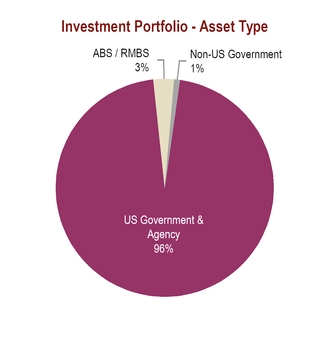
The combination of our significant cash and securities portfolios helps drive our capital efficient balance sheet, with risk-weighted assets equal to
35.2%
of our total assets and a Basel III total capital ratio of
19.4%
, each as at
December 31, 2019
.
Our loan underwriting process requires that we complete a full credit assessment of every customer prior to committing to a loan, which we believe has resulted in a high quality loan portfolio. Our lending markets do not have secondary markets for loans and as such we hold all of our originated loans on our balance sheet. In
2018
and
2019
, net charge-offs represented 0.08% and
0.03%
, respectively, of average loans. As at
December 31, 2019
, our non-accrual loan balance was
$50.4 million
, or
1.0%
of total gross loans, and our loans past due were
$106.9 million
or 2.1% of total gross loans, of which 82.9% were full recourse residential mortgages. As at
December 31, 2019
, our loan portfolio consisted of 79% floating-rate loans and 21% fixed-rate loans.
The following chart shows the segment composition of our loan portfolio as at
December 31, 2019
:
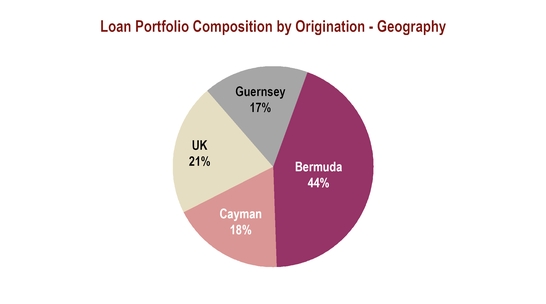
40
Our loan portfolio has exhibited stability over time. The following chart shows loan portfolio trends for
2015
to
2019
:
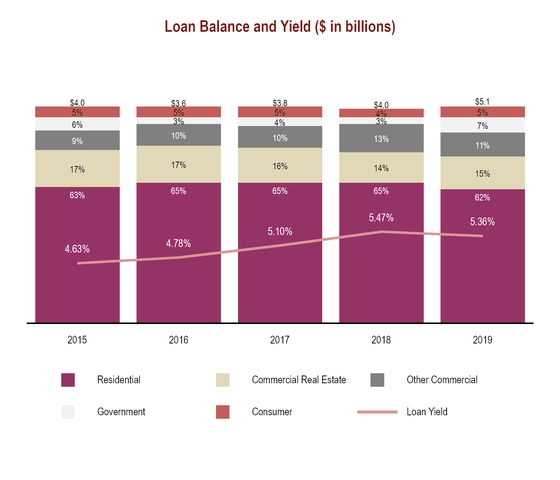
The domestic lending markets in Bermuda, the Cayman Islands, and the Channel Islands have a limited number of participants and significant barriers to entry.
62.3%
of our loan balances were residential mortgages as at
December 31, 2019
. These loans are attractive for a number of reasons. Our mortgages have exhibited predictable cash flows, with historically negligible refinancing activity due to high costs to refinance in these lending markets. Additionally, our mortgages in these markets have historically benefited from a manual underwriting process, low LTVs (75.6% of residential loans below 70% LTV as at
December 31, 2019
), and a full recourse system.
We have also generated balanced sources of non-interest income from a well-diversified customer base. For the five-year period ended
December 31, 2019
, our non-interest income is evenly split between banking which consists of banking and foreign exchange revenue, and wealth management, which consists of trust, asset management, and custody and other administration services. The wealth management non-interest income stream is not directly correlated with the performance of our banking business. For example, the typical trust we manage generates a relatively constant fee stream on an annual basis throughout its life. In addition, because fee revenue in our wealth management business lines is driven primarily by the size and complexity of our clients’ assets and holdings, which are generally diversified across multiple geographies, the performance of these businesses is not typically linked to the performance of the domestic economies of our local markets. Non-interest income represented
34.7%
of our total Net Revenue (our fee income ratio) in
2019
, and contributed materially to the Company’s high Core ROATCE and excess capital generation as limited capital is required for our fee income business.
41
The following chart shows our various sources of non-interest income for the year ended
December 31, 2019
:
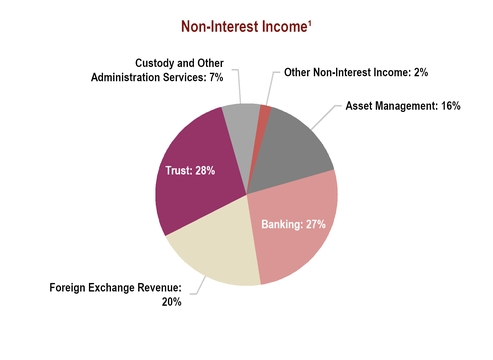
2019
Non-Interest Income:
$184.0 million
/
34.7%
Fee Income Ratio
_____________
(1)
Foreign exchange revenue represents income generated from client-driven transactions in the normal course of business. We do not engage in proprietary trading.
Growth Opportunities
We expect that, all else being equal, a rising rate environment would increase our net interest income before provision for credit losses because an increase in our cost of deposits would lag an increase in yield of our securities and loans. In addition, a significant portion of our deposits are non-interest bearing (
18%
as at
December 31, 2019
), and as a result, a portion of our funding is only partially sensitive to rising rates. Our non-interest bearing deposit balances have historically exhibited low correlation with interest rates, a behavior that we attribute in part to a sizable client base that utilizes our bank for custody and clearing services as well as cash management purposes. Potential changes to our net interest income in hypothetical rising and declining rate scenarios, measured over a 12-month period, are presented in the chart below (these projections assume parallel shifts of the yield curves occurring immediately and no changes in other potential variables):
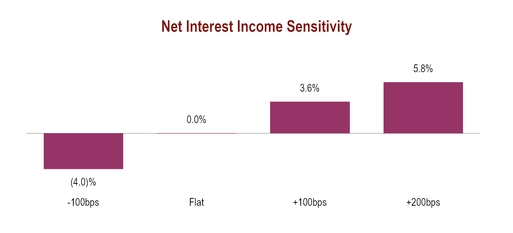
A negative 100 basis points interest rate shock reflects a reduction in projected 12-month net interest income of 4.0% compared to the flat rate scenario. The loss of income is driven by lower loan and investment yields, which more than offset reduced rates paid on deposits. Mitigating against the loss of income is the potential to charge negative interest rates on deposits (which we currently do in limited instances) and certain loans that have rate floors.
In addition, we are well-positioned as an acquirer of certain businesses, in private trust and banking. Our acquisition strategy seeks to capitalize on opportunities created by international financial institutions that have faced operating issues requiring them to simplify their businesses. We consider a wide range of potential acquisition opportunities, and we have a well-defined, disciplined approach to identifying potential acquisition targets across numerous criteria including: geography, business alignment, size, timing, quality, buyer universe and financial hurdles. Our focus has been on the private trust business and banking where we have expertise, scale and a strong brand.
In April 2016, we acquired HSBC’s Bermuda trust business and private banking investment management operations. HSBC also entered into an agreement to refer its existing private banking clients to Butterfield. This acquisition added over $18.9 billion of trust AUA, $1.3 billion of AUM, and $1.6 billion of deposits.
42
In October 2017, we entered into an agreement to acquire Deutsche Bank’s Global Trust Solutions business, excluding its US operations. This transaction added the ongoing management and administration of the GTS portfolio, comprising approximately 1,000 trust structures for approximately 900 private clients in Guernsey, Switzerland, the Cayman Islands, and Singapore. As part of the deal, we also purchased a service company in Mauritius to provide operations and support services to the Cayman and Channel Islands banking and custody businesses. This transaction was completed in March 2018.
In February 2018, we entered into an agreement to acquire Deutsche Bank’s banking and custody business in the Cayman Islands, Jersey and Guernsey, which provide services primarily to financial intermediaries and corporate clients. The Bank began to onboard certain customer deposits relating to the acquisition in 2018, and this activity was completed in the first half of 2019.
In April 2019, we entered into an agreement to acquire ABN AMRO (Channel Islands) Limited which provides banking, investment management and custody products to three distinct client groups, including trusts, private clients, and funds in Jersey and Guernsey. The transaction completed in July 2019.
Our relationship-driven business model and international corporate clientèle have allowed us to develop a sticky deposit base with historically low funding costs. We believe our customers’ deposit activity has historically been relatively inelastic to deposit pricing given the nature of corporate activity and competition in retail deposit taking in our segments. From
2015
to
2019
, customer deposits have grown at a CAGR of approximately 1% in Bermuda, 3% in the Cayman Islands, and 20% in the Channel Islands and the UK, taking into account the HSBC Cayman acquisition in November 2014 that added $0.5 billion of new deposits, the April 2016 acquisition of HSBC’s Bermuda trust business and private banking investment management operations that added $1.6 billion of new deposits, the Deutsche Bank's banking and custody businesses acquisition in February 2018 that added $0.9 billion of new deposits, and the ABN AMRO (Channel Islands) acquisition in April 2019 that added $3.5 billion in deposits. As at
December 31, 2019
, we had $
12.4 billion
in deposits at a cost of
0.47%
, of which
18%
were non-interest bearing demand deposits,
57%
were interest bearing demand deposits with a weighted-average cost of
0.19%
, and
25%
were term deposits with a weighted-average cost of
1.45%
and an average maturity of 86 days. We believe the market conditions in Bermuda, the Cayman Islands, and the Channel Islands will allow us to continue to benefit from favorable deposit pricing.
Consolidated Results of Operations and Discussion for Fiscal Years Ended
December 31, 2019
,
2018
and
2017
Net Revenue
2019
vs.
2018
Total net revenue before provision for credit losses and other gains and losses for
2019
was
$529.7 million
, up
$18.0 million
, or
3.5%
, from
2018
. Net interest income before provision for credit losses increased from
$343.0 million
in
2018
to
$345.7 million
in
2019
, an improvement of
$2.7 million
, or
0.8%
, and was driven by increases in loan interest, investment interest and deposits with banks primarily due to the acquisition of ABN AMRO (Channel Islands). Loan interest income increased by
$15.5 million
to
$234.0 million
, the average volume of loans outstanding increased by
$373.7 million
principally as a result of the ABN AMRO (Channel Islands) acquisition, new residential mortgages underwritten in our UK jurisdiction, increases in government lending in Bermuda and Cayman, and decreased yields on loans by
11
basis points due to base rate decreases across all jurisdictions during the year. Investment interest income rose
$5.2 million
to $129.2 million, the average volume of investments decreased by
$104.0 million
, and yields on investments increased
18
basis points in reaction to decreases in short-term US Treasury rates and re-balancing of the portfolio. Deposits with banks interest income rose
$16.8 million
, or
67.6%
, the average volume increased
$1,256.0 million
due to the ABN AMRO (Channel Islands) acquisition, and yield increased 3 basis points. The total cost of deposits increased by
$33.9 million
or
192.3%
, reflecting a
29
basis points increase to
47
basis points. In addition, non-interest income was up
$15.3 million
, or
9.1%
, principally attributable to increases in banking fees due to transaction volume on credit cards, increases in foreign exchange income due to increased transactional volume on foreign exchange transactions, as well as an overall increase in asset management, trust and custody fees due to the impact of the Deutsche Bank acquisitions in 2018 and the ABN AMRO (Channel Islands) acquisition in 2019.
2018 vs. 2017
Total net revenue before provision for credit losses and other gains and losses for 2018 was $511.7 million, up $64.1 million, or 14.3%, from 2017. Net interest income before provision for credit losses increased from $289.7 million in 2017 to $343.0 million in 2018, an improvement of $53.2 million, or 18.4%. The increase in net interest income was driven primarily by an increase in both the average volume of loans outstanding and the yield on loans, which drove a $31.5 million increase to $218.5 million. The average volume of loans outstanding increased by $330.0 million principally as a result of new residential mortgages underwritten in our UK jurisdiction. Yields on loans increased by 37 basis points due to base rate increases across all jurisdictions during the year. Further augmenting this was an increase in interest income on investments due to a 49 basis point increase in yield in reaction to increases in short-term US Treasury rates, which drove an increase in interest income on investments by $22.8 million. The total cost of deposits increased by 7 basis points to 18 basis points. In addition, non-interest income was up $10.9 million, or 6.9%, principally attributable to increased trust revenues as a result of the Deutsche Bank GTS acquisition, as well as increases in banking fees due to transaction volume on credit cards.
Net Interest Income Before Provision For Credit Losses
Net interest income is the amount of interest earned on our interest-earning assets less interest paid on our interest bearing liabilities. There are several drivers of the change in net interest income, including changes in the volume and mix of interest-earning assets and interest bearing liabilities, their relative sensitivity to interest rate movements, and the proportion of non-interest bearing sources of funds, such as equity and non-interest bearing current accounts.
43
The following table presents the components of net interest income for the years ended
December 31, 2019
,
2018
and
2017
:
|
Year ended December 31
|
|||||||||||||||||||||
|
2019
|
2018
|
2017
|
|||||||||||||||||||
|
(in millions of $)
|
Average
balance
($)
|
Interest
($)
|
Average
rate
(%)
|
Average
balance
($)
|
Interest
($)
|
Average
rate
(%)
|
Average
balance ($) |
Interest
($) |
Average
rate (%) |
||||||||||||
|
Assets
|
|
|
|
|
|
|
|
|
|
|
|
|
|||||||||
|
Cash due from banks, securities purchased under agreements to resell, and short-term investments
|
3,233.3
|
|
41.6
|
|
1.29
|
%
|
1,977.3
|
|
24.8
|
|
1.26
|
%
|
2,372.7
|
|
17.2
|
|
0.72
|
%
|
|||
|
Investment in securities
|
4,474.9
|
|
129.4
|
|
2.89
|
%
|
4,578.9
|
|
124.3
|
|
2.71
|
%
|
4,573.9
|
|
101.4
|
|
2.22
|
%
|
|||
|
Loans
|
4,369.5
|
|
234.0
|
|
5.36
|
%
|
3,995.8
|
|
218.5
|
|
5.47
|
%
|
3,665.8
|
|
187.0
|
|
5.10
|
%
|
|||
|
Interest earning assets
|
12,077.6
|
|
405.1
|
|
3.35
|
%
|
10,552.0
|
|
367.6
|
|
3.48
|
%
|
10,612.4
|
|
305.6
|
|
2.88
|
%
|
|||
|
Other assets
|
371.5
|
|
—
|
|
350.7
|
|
—
|
|
346.0
|
|
—
|
|
|||||||||
|
Total assets
|
12,449.1
|
|
405.1
|
|
3.25
|
%
|
10,902.7
|
|
367.6
|
|
3.37
|
%
|
10,958.4
|
|
305.6
|
|
2.79
|
%
|
|||
|
Liabilities
|
|||||||||||||||||||||
|
Deposits
|
8,851.5
|
|
(51.5
|
)
|
(0.58
|
)%
|
7,375.8
|
|
(17.6
|
)
|
(0.24
|
)%
|
7,445.0
|
|
(10.9
|
)
|
(0.15
|
)%
|
|||
|
Securities sold under agreement to repurchase
|
0.7
|
|
—
|
|
(2.12
|
)%
|
1.6
|
|
—
|
|
(2.11
|
)%
|
—
|
|
—
|
|
—%
|
|
|||
|
Long-term debt
|
143.4
|
|
(7.9
|
)
|
(5.49
|
)%
|
133.4
|
|
(6.9
|
)
|
(5.21
|
)%
|
117.0
|
|
(5.0
|
)
|
(4.24
|
)%
|
|||
|
Interest bearing liabilities
|
8,995.5
|
|
(59.4
|
)
|
(0.66
|
)%
|
7,510.8
|
|
(24.6
|
)
|
(0.33
|
)%
|
7,562.0
|
|
(15.9
|
)
|
(0.21
|
)%
|
|||
|
Non-interest bearing current accounts
|
2,147.2
|
|
2,231.8
|
|
2,393.1
|
|
|||||||||||||||
|
Other liabilities
|
310.4
|
|
281.0
|
|
254.4
|
|
|||||||||||||||
|
Total liabilities
|
11,453.1
|
|
(59.4
|
)
|
(0.52
|
)%
|
10,023.7
|
|
(24.6
|
)
|
(0.25
|
)%
|
10,209.6
|
|
(15.9
|
)
|
(0.16
|
)%
|
|||
|
Shareholders' equity
|
995.9
|
|
879.0
|
|
748.9
|
|
|||||||||||||||
|
Total liabilities and shareholders' equity
|
12,449.1
|
|
10,902.7
|
|
10,958.4
|
|
|||||||||||||||
|
Non-interest bearing funds net of non-interest earning assets (free balance)
|
3,082.1
|
|
3,041.1
|
|
3,050.3
|
|
|||||||||||||||
|
Net interest margin
|
345.7
|
|
2.86
|
%
|
343.0
|
|
3.25
|
%
|
289.7
|
|
2.73
|
%
|
|||||||||
2019
vs.
2018
Net interest income before provision for credit losses of
$345.7 million
in
2019
represented an increase of
$2.7 million
(or
0.8%
) over our net interest income before provision for credit losses in
2018
. Net interest income is generated by our main segments of Bermuda, Cayman, and Channel Islands and the UK. Interest income increased by
$37.5 million
in
2019
, which was driven by increased loan portfolio balances with decreased yields, decreased investment portfolio balances with increased yields partially offset by an increase in the deposit balances and the cost of deposits, all of which were primarily attributable to the ABN AMRO (Channel Islands) acquisition in a decreasing rate environment.
Loan interest income was higher in
2019
by
$15.5 million
due primarily to a
$373.7 million
increase in average balances, partially offset by an
11
basis point decrease in yield. The increase in average balances was largely due to new loan origination in the Channel Islands and the UK, increases in government lending in Bermuda and Cayman, as well as the ABN AMRO (Channel Islands) acquisition. The majority of the loan portfolio is on a floating rate basis, and utilizes US Federal Reserve rates as a repricing reference point. Therefore, movements in the US Federal Reserve rates can impact loan interest income if management elects to change base rates. During
2019
, there were three decreases in the US Federal Reserve target rate.
Investment interest income increased by
$5.2 million
, driven by an
18
basis point rise in yield partially offset by a decrease of
$104.0 million
in average investment balances. The improved yield resulted from the re-balancing of our investment portfolio in late 2018 by selling floating rate notes for fixed in order to lock in fixed rates in anticipation of potential US Federal Reserve rate cuts in 2019. The overall duration of the portfolio at year-end was 3.5 years, a decrease of 0.5 years from
2018
.
Interest bearing liability costs increased to
66
basis points, which resulted in an increase in interest expense by
$34.8 million
, attributable to the increase in the average interest bearing deposit balances of
$1,475.7 million
, principally due to the ABN AMRO (Channel Islands) deposits which had a higher cost of funding.
Average free balances for
2019
were
$3.1 billion
(
2018
:
$3.0 billion
), including non-interest bearing current accounts of
$2.1 billion
(
2018
:
$2.2 billion
), shareholders' equity of
$995.9 million
(
2018
:
$879.0 million
), net of other assets and other liabilities totaling
$61.1 million
(
2018
:
$69.7 million
). See "Risk Management" for more information on how interest rate risk is managed.
2018
vs.
2017
Net interest income before provision for credit losses of $343.0 million in 2018 represented an increase of $53.2 million (or 18.4%) over our net interest income before provision for credit losses in 2017. Net interest income is generated largely by our Bermuda and Cayman segments, which accounted for 89.9% of total net interest income in 2018. Interest income increased by $62.0 million in 2018, which was driven by increased loan portfolio balances and yields, increased yields on the investment portfolio partially offset by a slight increase in the cost of deposits, all of which were attributable to a rising rate environment.
Loan interest income was higher in 2018 by $31.5 million due primarily to a $330.0 million increase in average balances, as well as a 37 basis point increase in yield. The increase in average balances was largely due to an increase in residential mortgages underwritten in our UK jurisdiction, while the increase in yield was due to the Bermuda and the Cayman base rate increases during the year in reaction to the US Federal Reserve target rate increases, as well as the Channel Islands and the UK base rate increase in reaction to the Bank of England target rate increase. The majority of the loan portfolio is on a floating rate basis, and utilizes US Federal Reserve rates as a repricing
44
reference point. Therefore, movements in the US Federal Reserve rates can impact loan interest income if management elects to change base rates. During 2018, there were four increases in the US Federal Reserve target rate.
Investment interest income increased by $22.8 million, driven by an increase of $5.0 million in average investment balances, which benefited from a 49 basis point rise in yield. The improved yield resulted from increases in our floating rate portfolio in reaction to the US Federal Reserve target rate increases during the year, as well as a additions to higher yielding investments in the HTM portfolio of $684.2 million. The overall duration of the portfolio at year-end was 4.0 years, an increase of 0.9 from 2017.
Interest bearing liability costs increased to 33 basis points, which resulted in an increase in interest expense by $8.7 million, attributable to an increase in the deposit rates paid, principally on term deposits.
Average free balances for 2018 were $3.0 billion (2017: $3.1 billion), including non-interest bearing current accounts of $2.2 billion (2017: $2.4 billion), shareholders' equity of $879.0 million (2017: $748.9 million), net of other assets and other liabilities totaling $69.7 million (2017: $91.6 million). See "Risk Management" for more information on how interest rate risk is managed.
Provision for Credit Losses
2019
vs.
2018
Our net provision for credit losses in
2019
was a release of
$0.2 million
compared to a release of
$7.0 million
in
2018
. Provision releases were primarily a result of
$5.7 million
of releases from general reserves, due principally to qualitative factor revisions for UK residential real estate lending as well as decreases in the historical loss rates within the Commercial and Residential sectors as a result of improving credit markets in our key jurisdictions. Offsetting this was
$5.5 million
of incremental specific provisions, relating principally to consumer loans and residential mortgages. Group non-accrual loans increased
$1.7 million
to
$50.4 million
in
2019
, principally as a result of net additional loans changing to non-accrual during the year.
2018
vs.
2017
Our net provision for credit losses in 2018 was a release of $7.0 million compared to a release of $5.8 million in 2017, an increase in the release by $1.2 million. Provision releases were primarily a result of $11.9 million of releases from general reserves, due principally to qualitative factor revisions for commercial and residential real estate lending as a result of evidence of improving credit markets in our key jurisdictions. Partially offsetting this was $5.0 million of incremental specific provisions, relating principally to commercial loans and residential mortgages. In comparison, in 2017, we had a net release out of provisions of $5.8 million due principally to qualitative factor revisions for commercial and residential real estate lending as a result of evidence of improving credit markets in our key jurisdictions, which was partially offset by certain incremental provisions relating to specific reserves, relating principally to commercial loans and residential mortgages. Recoveries on consumer and residential mortgages were 95% of 2018 recoveries and 92% of 2017 recoveries. The decrease in provision expenses relate primarily to a reduction in Bermuda residential credit losses, demonstrating the stability of our domestic credit markets. Group non-accrual loans increased $4.8 million to $48.7 million in 2018, principally as a result of a Barbados sovereign loan changing to non-accrual during the year.
Other Gains (Losses)
The following table represents the components of other gains (losses) for the years ended
December 31, 2019
,
2018
and
2017
:
|
For the year ended December 31,
|
Dollar Change
|
Percent Change
|
|||||||||||||||
|
(in thousands of $)
|
2019
|
2018
|
2017
|
2018 to 2019
|
2017 to 2018
|
2018 to 2019
|
2017 to 2018
|
||||||||||
|
Net gains (losses) on equity securities
|
925
|
|
(329
|
)
|
511
|
|
1,254
|
|
(840
|
)
|
(381.2
|
)%
|
(164.4
|
)%
|
|||
|
Net realized gains (losses) on available-for-sale investments
|
1,624
|
|
1,100
|
|
4,186
|
|
524
|
|
(3,086
|
)
|
47.6
|
%
|
(73.7
|
)%
|
|||
|
Net gains (losses) on other real estate owned
|
(5
|
)
|
(322
|
)
|
(2,383
|
)
|
317
|
|
2,061
|
|
(98.4
|
)%
|
(86.5
|
)%
|
|||
|
Net other gains (losses)
|
223
|
|
(1,304
|
)
|
(1,045
|
)
|
1,527
|
|
(259
|
)
|
(117.1
|
)%
|
24.8
|
%
|
|||
|
Total other gains (losses)
|
2,767
|
|
(855
|
)
|
1,269
|
|
3,622
|
|
(2,124
|
)
|
|
(423.6
|
)%
|
(167.4
|
)%
|
||
Net gains (losses) on equity securities
A
$0.9 million
gain was recorded with respect to equity securities at fair value in
2019
compared to net losses of
$0.3 million
in
2018
and net gains of
$0.5 million
in
2017
. The gains in
2019
reflected higher mark-to-market gains on equity securities. The losses in
2018
reflected losses on equity securities. The gains in
2017
reflected pricing movements on certain equity securities.
Net Realized Gains (Losses) on Available-For-Sale Investments
Net realized gains of
$1.6 million
were recorded in
2019
and
$1.1 million
in
2018
. In
2019
, primarily as a result of the rebalancing of our investment portfolio resulting in the sale of our remaining corporate debt and commercial mortgage-backed securities and the sale of a US Treasury security and liquidation proceeds from a former investment as detailed below. In
2018
, the gain was a result of the sale of certain investments from our US government and federal agency portfolio and liquidation proceeds from a former investment as detailed below. In both
2019
and
2018
, the proceeds from the sale of the above-mentioned investments were used to acquire US government and federal agency securities for either our AFS or HTM portfolios.
Included in this amount in
2019
was a
$1.0 million
net realized gain on the receipt of liquidation proceeds from our former investment in the Avenir Pass-through Note, which was formerly a structured investment vehicle. In
2017
and
2018
, we received
$2.6 million
and
$1.2 million
, respectively, in liquidation proceeds from this same investment. Management considers these gains in
2017
,
2018
and
2019
to be non-core.
Net Realized/Unrealized Gains (Losses) on other real estate owned
Valuation adjustments and realized gains and losses related to real estate held for sale were losses of
$5.0 thousand
in
2019
compared to losses of
$0.3 million
in
2018
and
$2.4 million
in
2017
. In 2019, these small losses were attributable to the revaluation of properties offset by the gain on the sale of a property in Bermuda. In
2018
, these losses were attributable largely to the revaluation of several properties in Bermuda. In
2017
, these gains were attributable largely to the revaluation of two properties in Bermuda.
45
Net Other Gains (Losses)
Net other gains were
$0.2 million
in
2019
compared to net other losses of
$1.3 million
in
2018
and
$1.0 million
in
2017
. The gains in
2019
are principally the result of the sale of a fixed asset. The losses in 2018 are principally the result of a non-core defined pension plan settlement loss incurred in the UK. Included in the 2017 results is a write-off of a fees receivable balance partially offset by repricing gains on certain private equity investments.
Non-Interest Income
Non-interest income represents capital efficient and stable revenue sources for the Group. Non-interest income is derived primarily from banking, including cards, foreign exchange commissions, asset management fees as well as trust fees. Our trust fee structure provides for varied pricing that depends primarily on the size of the relationship and the nature of services provided. As a result, it is not always possible to draw a direct relationship between the value of client assets and the level of non-interest income, though the trend of non-interest income generally follows the trend in client asset levels.
Total non-interest income increased from
$168.7 million
in
2018
to
$184.0 million
in
2019
. Non-interest income as a percentage of total net revenue increased slightly from 32.5% in
2018
to
34.7%
in
2019
.
Total non-interest income increased from
$157.8 million
in
2017
to
$168.7 million
in
2018
. Non-interest income as a percentage of total net revenue decreased slightly from 34.8% in
2017
to 32.5% in
2018
.
The following table presents the components of non-interest income for the years ended
December 31, 2019
,
2018
and
2017
:
|
For the year ended December 31,
|
Dollar change
|
Percent change
|
|||||||||||||||
|
(in thousands of $)
|
2019
|
2018
|
2017
|
|
2018 to 2019
|
2017 to 2018
|
|
2018 to 2019
|
2017 to 2018
|
||||||||
|
Asset management
|
28,721
|
|
25,603
|
|
24,711
|
|
3,118
|
|
892
|
|
12.2
|
%
|
3.6
|
%
|
|||
|
Banking
|
49,347
|
|
45,010
|
|
43,772
|
|
4,337
|
|
1,238
|
|
9.6
|
%
|
2.8
|
%
|
|||
|
Foreign exchange revenue
|
37,001
|
|
32,895
|
|
32,222
|
|
4,106
|
|
673
|
|
12.5
|
%
|
2.1
|
%
|
|||
|
Trust
|
51,220
|
|
51,004
|
|
44,936
|
|
216
|
|
6,068
|
|
0.4
|
%
|
13.5
|
%
|
|||
|
Custody and other administration services
|
12,868
|
|
9,262
|
|
8,149
|
|
3,606
|
|
1,113
|
|
38.9
|
%
|
13.7
|
%
|
|||
|
Other non-interest income
|
4,818
|
|
4,912
|
|
4,035
|
|
(94
|
)
|
877
|
|
(1.9
|
)%
|
21.7
|
%
|
|||
|
Total non-interest income
|
183,975
|
|
168,686
|
|
157,825
|
|
15,289
|
|
10,861
|
|
9.1
|
%
|
6.9
|
%
|
|||
Asset Management
Asset management revenues are generally based on the market value of assets managed and the volume of transactions and fees for other services rendered. We provide asset management services from our offices in Bermuda, the Cayman Islands, and the Channel Islands. Revenues from asset management were
$28.7 million
in
2019
, compared to
$25.6 million
in
2018
, and
$24.7 million
in
2017
.
The table that follows shows the changes in the year-end values of clients' assets under management, sub-divided between those managed for clients on a discretionary basis and client funds invested in mutual funds that Butterfield manages ("Butterfield Funds"):
|
Year ended December 31,
|
Dollar Change
|
|||||||||||
|
(in millions of $)
|
2019
|
2018
|
2017
|
2018 to 2019
|
2017 to 2018
|
|||||||
|
Butterfield Funds
|
2,157
|
|
2,058
|
|
2,099
|
|
99
|
|
(41
|
)
|
||
|
Other assets under management
|
3,491
|
|
2,786
|
|
2,947
|
|
705
|
|
(161
|
)
|
||
|
Total assets under management
|
5,648
|
|
4,844
|
|
5,046
|
|
804
|
|
(202
|
)
|
||
2019
vs.
2018
Asset management fees are generated primarily from management fees earned from Butterfield Funds and discretionary portfolios, as well as custody and brokerage fees. AUM were
$5.6 billion
as at
December 31, 2019
, compared to
$4.8 billion
as at
December 31, 2018
. The increase in AUM was largely a result of overall valuation increases in the stock and bond markets as well as the acquisition of ABN AMRO (Channel Islands). In line with the increase in AUM, asset management fees earned increased by $
3.1 million
or
12.2%
in
2019
, compared to
2018
.
2018
vs.
2017
AUM were $4.8 billion as at December 31, 2018, compared to $5.0 billion as at December 31, 2017. The decrease in AUM was largely a result of a decrease in valuation of the investments within the Butterfield Funds due to market performance. In spite of this, asset management fees earned on Butterfield Funds increased by $1.7 million due to increased management fee rates applied to certain of the Butterfield Funds as well as several corporate clients transferring their mandates to the Butterfield Funds from discretionary portfolios.
The remaining asset management fees are generated primarily from management fees on discretionary portfolios other than Butterfield Funds, as well as custody and brokerage fees. Management fees on the other mutual funds decreased by $1.1 million as a result of decreased AUM in those funds due to the aforementioned transfer to the Butterfield Funds as well as several lost customers. Custody and brokerage fees increased by $0.3 million to $2.1 million, predominantly as a result of a slight increase in brokerage commission from transaction volume.
46
Banking
We provide a full range of community, commercial, and private banking services in select jurisdictions. Banking services are offered to individuals and small to medium-sized businesses through branch locations, internet banking, automated teller machines, debit and credit cards, and mobile banking in Bermuda and the Cayman Islands, while private banking services are offered in Bermuda, the Cayman Islands, and Guernsey. Banking revenues reflect loan, transaction processing, and other fees earned in these jurisdictions.
Banking fee revenues increased by
9.6%
in
2019
to
$49.3 million
, compared to
$45.0 million
in
2018
, due primarily to further increases in credit card activity, and increased fees resulting from the acquisition of ABN AMRO (Channel Islands).
Banking fee revenues increased by 2.8% in 2018 to $45.0 million, compared to $43.8 million in 2017, due primarily to further increases in credit card activity, and revised fee schedules in several jurisdictions in 2018.
Foreign Exchange
We provide foreign exchange services in the normal course of business in all jurisdictions. The major contributors to foreign exchange revenues are Bermuda and the Cayman Islands, accounting for 84% of our foreign exchange revenue (
2018
: 93%;
2017
: 92%). We do not maintain a proprietary trading book. Foreign exchange income is generated from client-driven transactions and totaled
$37.0 million
in
2019
, compared to
$32.9 million
in
2018
and
$32.2 million
in
2017
. The
$4.1 million
increase from
2018 to 2019
primarily resulted from increased revenues relating to the ABN AMRO (Channel Islands) acquisition and increased client activity and related volumes in both retail and institutional foreign exchange flows. The $0.7 million increase from 2017 to 2018 reflects further increased client activity and related volumes in both retail and institutional foreign exchange flows.
Trust
We provide both personal and institutional fiduciary services from our operations in Bermuda, The Bahamas, the Cayman Islands, Guernsey, Singapore and Switzerland. Revenues are derived from a combination of fixed fees, fees based on the size and complexity of the trust relationship and fees based on time spent in relation to the range of personal trust and company administration services and pension and employee benefit trust services we provide.
In
2019
, trust revenues represented
27.8%
of our non-interest income, down from 30.2% in
2018
. In
2019
, trust revenues totaled
$51.2 million
, an increase of
$0.2 million
or
0.4%
over
2018
.
In 2018, trust revenues represented 30.2% of our non-interest income, up from 28.5% in 2017. In 2018, trust revenues totaled $51.0 million, an increase of $6.1 million or 13.5% over 2017, attributable largely to an additional revenue as a result of the acquisition of Deutsche Bank's GTS businesses in March 2018, as well as structured, proactive business development activities. Improved new business results were seen in all of our businesses in both personal and institutional fiduciary services.
Trust AUA were
$91.7 billion
at the end of
2019
compared to $96.1 billion at the end of
2018
, a decrease of
$4.4 billion
or
4.6%
, which is attributable largely to a strategic decision to exit certain customer relationships. Trust AUA increased by $0.7 billion or 0.7% from
2017
to
2018
, which is attributable to the addition of AUA as a result of the acquisition of Deutsche Bank’s Global Trust Solutions in March 2018, as well as revisions to the value of the AUA.
Custody and Other Administration Services
Custody fees are generally based on market values of assets in custody, the volume of transactions and flat fees for other services rendered. We provide custody services from our offices in Bermuda, Guernsey, and Jersey. In
2019
, revenues were
$12.9 million
, an increase of
$3.6 million
from
2018
partially as a result of the aforementioned acquisition of ABN AMRO (Channel Islands) and from a full year's activity related to the clients onboarded late in 2018 and in the first quarter of 2019 from the Deutsche Bank’s Global Trust Solutions acquisition in 2018. From
2017
to
2018
, revenues increased by
$1.1 million
as a result of the aforementioned acquisition of Deutsche Bank's GTS businesses.
Total AUA for the custody and other administration services business were
$30.3 billion
on
December 31, 2019
, up from $24.5 billion on
December 31, 2018
and $27.5 billion on
December 31, 2017
.
Other Non-Interest Income
The components of our other non-interest income for the years ended
December 31, 2019
,
2018
and
2017
are set forth in the following table:
|
Year ended December 31,
|
Dollar Change
|
Percent Change
|
|||||||||||||||
|
(in thousands of $)
|
2019
|
2018
|
2017
|
2018 to 2019
|
2017 to 2018
|
2018 to 2019
|
2017 to 2018
|
||||||||||
|
Net share of earnings from equity method investments
|
331
|
|
1,122
|
|
1,091
|
|
(791
|
)
|
31
|
|
(70.5
|
)%
|
2.8
|
%
|
|||
|
Rental income
|
1,211
|
|
1,087
|
|
1,714
|
|
124
|
|
(627
|
)
|
11.4
|
%
|
(36.6
|
)%
|
|||
|
Other
|
3,276
|
|
2,703
|
|
1,230
|
|
573
|
|
1,473
|
|
21.2
|
%
|
119.8
|
%
|
|||
|
Total other non-interest income
|
4,818
|
|
4,912
|
|
4,035
|
|
(94
|
)
|
877
|
|
(1.9
|
)%
|
21.7
|
%
|
|||
In
2019
, we recorded our net share of earnings from equity method investments as a gain of
$0.3 million
, a
$0.8 million
decrease due to lower earnings by equity method investments. From
2017
to
2018
, equity pickup was flat. Rental income increased by
$0.1 million
to
$1.2 million
in
2019
and decreased by
$0.6 million
from
2017 to 2018
due to the sale of a rented property in early 2018. Included in the "Other" category are maintenance fees from leased premises and other miscellaneous income.
Non-Interest Expenses
Expense management continued to be a key focus in
2019
, however we continued to incur costs associated with our US listing, primarily Sarbanes-Oxley related consultancy costs, as well as an increase in salaries and benefit costs. Total non-interest expenses in
2019
were
$356.9 million
compared to
$321.3 million
in
2018
and
$300.3 million
in
2017
. These figures include non-core expenses in
2019
,
2018
and
2017
of
$21.8 million
,
$1.5 million
and
$8.1 million
, respectively. After adjusting for these non-core items,
2019
core expenses were up
$15.3 million
(
4.8%
) with a slight increase in core efficiency ratio to
62.2%
from
61.5%
in
2018
. From
2017
to
2018
, core expenses increased by
$27.6 million
(
9.4%
) with a corresponding improvement in core efficiency ratio to 61.5% from 64.3% in
2017
.
47
In
2019
, salaries and other employee benefits accounted for
51.5%
of non-interest expenses, with technology and communications and property making up
24.3%
combined.
The following table presents the components of non-interest expenses for the years ended
December 31, 2019
,
2018
and
2017
:
|
Year ended December 31,
|
Dollar Change
|
Percent Change
|
|||||||||||||||
|
(in millions of $)
|
2019
|
2018
|
2017
|
2018 to 2019
|
2017 to 2018
|
|
2018 to 2019
|
2017 to 2018
|
|||||||||
|
Salaries and other employee benefits
|
183.7
|
|
159.8
|
|
145.1
|
|
23.9
|
|
14.7
|
|
14.9
|
%
|
10.1
|
%
|
|||
|
Technology and communications
|
62.6
|
|
60.3
|
|
54.0
|
|
2.4
|
|
6.3
|
|
3.9
|
%
|
11.7
|
%
|
|||
|
Property
|
24.2
|
|
21.8
|
|
19.9
|
|
2.4
|
|
1.9
|
|
10.8
|
%
|
9.5
|
%
|
|||
|
Professional and outside services
|
28.0
|
|
26.0
|
|
27.2
|
|
1.9
|
|
(1.2
|
)
|
7.4
|
%
|
(4.4
|
)%
|
|||
|
Indirect taxes
|
21.1
|
|
19.5
|
|
18.1
|
|
1.6
|
|
1.4
|
|
8.3
|
%
|
7.7
|
%
|
|||
|
Amortization of intangible assets
|
5.5
|
|
5.1
|
|
4.2
|
|
0.4
|
|
0.9
|
|
7.1
|
%
|
21.4
|
%
|
|||
|
Marketing
|
8.1
|
|
6.1
|
|
5.7
|
|
1.9
|
|
0.4
|
|
31.6
|
%
|
7.0
|
%
|
|||
|
Restructuring costs
|
—
|
|
—
|
|
1.8
|
|
—
|
|
(1.8
|
)
|
—
|
%
|
(100.0
|
)%
|
|||
|
Non-service employee benefits expense
|
5.6
|
|
5.6
|
|
8.1
|
|
0.1
|
|
(2.5
|
)
|
1.4
|
%
|
(30.9
|
)%
|
|||
|
Other non-interest expenses
|
18.2
|
|
17.2
|
|
16.3
|
|
1.1
|
|
0.9
|
|
6.3
|
%
|
5.5
|
%
|
|||
|
Total non-interest expenses
|
356.9
|
|
321.3
|
|
300.3
|
|
35.6
|
|
21.0
|
|
11.1
|
%
|
7.0
|
%
|
|||
|
Non-core items (Non-GAAP)
|
(21.8
|
)
|
(1.5
|
)
|
(8.1
|
)
|
(20.3
|
)
|
6.6
|
|
1,353.3
|
%
|
(81.5
|
)%
|
|||
|
Core non-interest expenses (Non-GAAP)
|
335.1
|
|
319.8
|
|
292.2
|
|
15.3
|
|
27.6
|
|
4.8
|
%
|
9.4
|
%
|
|||
For a full reconciliation of GAAP net income to core net income, please see "Selected Consolidated Financial Data — Reconciliation of Non-GAAP Financial Measures".
Salaries and Other Employee Benefits
Total salaries and other employee benefits costs were
$183.7 million
in
2019
, up
$23.9 million
compared to
2018
. Included in
2019
were (i): $16.0 million of non-core costs in relation with severance and early retirement programs (nil million in 2018, and $0.2 million in 2017); and (ii) nil million in 2019, nil million in 2018, and $0.6 million in 2017 relating to the extensive review and account remediation exercise to determine the US tax compliance status of US person account holders.
Core salaries, which exclude these amounts, and other employee benefits costs were $167.7 million in
2019
, up $7.9 million compared to
2018
primarily due to the acquisition of ABN AMRO (Channel Islands) and the Halifax service center expansion. From
2017
to
2018
, core salaries increased $15.5 million due to an increase in discretionary compensation expense, and an increase due to headcount increases resulting from the acquisition of Deutsche Bank's GTS business and its banking and custody business in the Cayman and Channel Islands completed during 2018.
Headcount on a full-time equivalency basis at the end of
2019
was 1,512, compared to 1,373 in
2018
and 1,190 in
2017
. The increase from
2018
to
2019
was a result of the Halifax service center expansion and the ABN AMRO (Chanel Islands) acquisition. The increase from
2017
to
2018
was a result of the two acquisitions completed during 2018.
Technology and Communications
Technology and communication costs reflect expenses relating to the support for our IT infrastructure and increased from
$60.3 million
in
2018
to
$62.6 million
in
2019
primarily due to the acquisition of ABN AMRO (Channel Islands) in July 2019. From
2017
to
2018
, technology and communications costs increased by
$6.3 million
to
$60.3 million
due to increased support services provided during the year.
Property
Property costs, which reflect occupancy expenses, building maintenance, and depreciation of property, plant and equipment, were
$24.2 million
in
2019
, up
$2.4 million
from
$21.8 million
recorded in
2018
due primarily to the ABN AMRO (Channel Islands) acquisition.
From
2017
to
2018
, property costs increased by
$1.9 million
due primarily to the costs associated with the build out for new operations in Jersey, Singapore and Mauritius.
Professional and Outside Services
Professional and outside services primarily include consulting, legal, audit and other professional services. The
2019
expense of
$28.0 million
included
$5.5 million
of non-core specific acquisition related costs. In
2018
and
2017
, the total expenses of
$26.0 million
and
$27.2 million
included non-core project expenses of $0.9 million and $4.8 million, respectively. Excluding the non-core costs, professional fees for our core business decreased by $2.6 million from
2018
to
2019
due to the non-recurrence of items in 2018 such as the development of a recovery plan and cyber risk related programs, offset by an increase in audit and external legal costs, including those in connection with the ABN AMRO (Channel Islands) acquisition. Excluding the non-core project-related programs, professional fees for our core business increased by $2.8 million from
2017
to
2018
due to an increase in costs associated with our external audit associated with the expanded geographic footprint and the integrated audit approach, and an increase in external legal costs. The non-core professional fee project-related costs in
2019
and prior periods included:
|
•
|
Legal and professional fees relating to the acquisition of ABN AMRO (Channel Islands), which amounted to
$5.5 million
in 2019;
|
|
•
|
Costs relating to the extensive review and account remediation exercise to determine the US tax compliance status of US person account holders resulting from the so-called John Doe Summonses issued by the USAO to six US financial institutions with which we had correspondent bank relationships. There were no costs associated with this remediation exercise during the year ended December 31,
2019
(
2018
: nil;
2017
: $0.9 million);
|
48
|
•
|
Legal and professional fees relating to the acquisition of Deutsche Bank’s GTS business, excluding its US operations, which were completed in 2018 (2018: $0.9 million; 2017: $2.1 million); and
|
|
•
|
Legal and professional fees relating to the secondary bank share offering completed during 2017, which amounted to $1.9 million in 2017.
|
Indirect Taxes
These taxes reflect taxes levied in the jurisdictions in which we operate, including employee-related payroll taxes, customs duties, and business licenses. In
2019
, the expense was
$21.1 million
, up
$1.6 million
due primarily to the increased financial services tax in Bermuda related to a rate increase in 2019. Of the
$21.1 million
in indirect taxes, $17.0 million was paid to the Bermuda government agencies for payroll tax, business licenses, deposit insurance, land taxes, and financial services tax and $4.1 million was paid to other governments for business licenses, insurance tax, land taxes and work permit fees. From
2017
to
2018
, indirect taxes increased by
$1.4 million
due mainly to increased payroll taxes and increased payments on the asset tax introduced in the prior year, as well as payments for the Bermuda Deposit Insurance Scheme, all in Bermuda.
Amortization of Intangible Assets
Intangible assets relate to client relationships acquired from business acquisitions and are amortized on a straight-line basis over their estimated useful lives, not exceeding 15 years. The estimated lives of these acquired intangible assets are re-evaluated annually and tested for impairment. The amortization expense associated with intangible assets was
$5.5 million
in
2019
compared to
$5.1 million
in
2018
and
$4.2 million
in
2017
. Amortization increased from
2018
to
2019
by
$0.4 million
as a result of additional identifiable intangible assets resulting from the acquisition of ABN AMRO (Channel Islands) in April 2019, and increased by $0.9 million from
2017
to
2018
as a result of additional identifiable intangible assets resulting from the two acquisitions completed during 2018.
Marketing
Marketing expenses reflect costs incurred in advertising and promoting our products and services. Marketing expenses totaled
$8.1 million
in
2019
, up $2.0 million compared to
2018
, primarily as a result of expenses associated with the re-branding initiative announced in Q3 2019. Marketing expenses increased slightly as a percentage of total net revenue before provision for credit losses and other gains and losses to
1.5%
from 1.2%. From
2017
to
2018
marketing expenses increased by
$0.4 million
, primarily as a result of several smaller marketing initiatives and costs associated with new business initiatives, and decreased slightly as a percentage of total net revenue before provision for credit losses and other gains and losses to 1.2% from 1.3%.
Other Non-Interest Expenses
|
For the year ended December 31,
|
Dollar Change
|
Percent Change
|
|||||||||||||||
|
(in millions of $)
|
2019
|
2018
|
2017
|
2018 to 2019
|
2017 to 2018
|
2018 to 2019
|
2017 to 2018
|
||||||||||
|
Stationery & supplies
|
1.7
|
|
1.4
|
|
1.3
|
|
0.2
|
|
0.1
|
|
16.1
|
%
|
7.7
|
%
|
|||
|
Custodian & handling
|
2.5
|
|
2.2
|
|
2.1
|
|
0.3
|
|
0.1
|
|
12.9
|
%
|
4.8
|
%
|
|||
|
Charitable donations
|
1.4
|
|
1.3
|
|
1.0
|
|
0.1
|
|
0.3
|
|
6.3
|
%
|
30.0
|
%
|
|||
|
Insurance
|
3.4
|
|
3.1
|
|
3.3
|
|
0.3
|
|
(0.2
|
)
|
9.9
|
%
|
(6.1
|
)%
|
|||
|
Other expenses
|
9.4
|
|
9.2
|
|
8.6
|
|
0.2
|
|
0.6
|
|
2.4
|
%
|
7.0
|
%
|
|||
|
Total other non-interest expenses
|
18.2
|
|
17.2
|
|
16.3
|
|
1.1
|
|
0.9
|
|
6.3
|
%
|
5.5
|
%
|
|||
Other non-interest expenses were
$18.2 million
in
2019
, an increase of
$1.1 million
compared to
2018
, reflecting the acquisition of ABN AMRO (Channel Islands) and the timing of the Deutsche Bank GTS acquisition in 2018 and related costs primarily in Jersey.
From
2017
to
2018
, other non-interest expenses increased
$0.9 million
, principally driven by an increase in charitable donations during 2018.
Income Taxes
Each jurisdiction in which we operate is subject to different corporate income tax laws. See "Risk Factors - Regulatory and Tax-Related Risks". We are incorporated in Bermuda as a local company and, pursuant to Bermuda law, not obligated to pay any direct taxes in Bermuda on either income or capital gains there. Our subsidiaries in the Cayman Islands and The Bahamas are not subject to any taxes on either income or capital gains under current laws applicable in the respective jurisdictions. In general, entities in Bermuda and the Cayman Islands are not subject to corporate income taxes but are required to pay higher rates of indirect taxes (included above) such as license fees and, in Bermuda, payroll taxes.
Our subsidiaries in the UK, Guernsey, Jersey, Switzerland, Canada, Singapore, and Mauritius are subject to the tax laws of those jurisdictions. See Note
26
"Income taxes" in the Audited Consolidated Financial Statements for a reconciliation between the effective income tax rate and the statutory income tax rate.
In
2019
, income tax expense netted to a recovery of
$1.4 million
compared to an expense of
$1.3 million
in
2018
. The change in income tax expense of
$2.7 million
in 2019 was mostly due to a change in the deferred tax valuation allowance resulting in a deferred tax recovery in the UK.
From
2017
to
2018
, the change in income tax of $0.2 million was due primarily to increased profitability in our Guernsey subsidiary.
Net Income
We reported net income of
$177.1 million
for the year ended
December 31, 2019
, compared to
$195.2 million
in
2018
and
$153.3 million
in
2017
. The decrease from
2018
to
2019
of
$18.1 million
was driven by higher non-interest expenses and lower provision for credit recoveries, offset by higher net interest and non-interest income, higher other gains, and an income tax recovery
.
These movements primarily reflect the impact of the acquisition of ABN AMRO (Channel Islands) in 2019, the effects of the completed Deutsche Bank acquisitions in 2018, and the non-core items of $20.8 million for the year related principally to deal-related expenses attributable to the ABN AMRO (Channel Islands) acquisition and cost restructuring initiatives in Bermuda and the Channel Islands.
The increase from
2017
to
2018
of
$41.9 million
was driven by higher net interest and non-interest income, offset by higher non-interest expenses. The increases in net interest and non-interest income were driven principally by an increasing interest rate environment, which drove higher interest income on loans and investments, and revised fee schedules, which led to higher banking fees and asset management fees.
49
Consolidated Balance Sheet and Discussion
The following table shows the balance sheet as reported as at
December 31, 2019
and
2018
:
|
As at
December 31
|
||||||||||
|
(in millions of $)
|
2019
|
2018
|
Dollar Change
|
Percent Change
|
||||||
|
Assets
|
|
|
|
|
|
|
||||
|
Cash due from banks
|
2,550
|
|
2,054
|
|
496
|
|
24.1
|
%
|
||
|
Securities purchased under agreement to resell
|
142
|
|
27
|
|
115
|
|
425.9
|
%
|
||
|
Short-term investments
|
1,218
|
|
52
|
|
1,166
|
|
2,242.3
|
%
|
||
|
Investment in securities
|
4,436
|
|
4,255
|
|
181
|
|
4.3
|
%
|
||
|
Loans, net of allowance for credit losses
|
5,143
|
|
4,044
|
|
1,099
|
|
27.2
|
%
|
||
|
Premises, equipment and computer software
|
158
|
|
158
|
|
—
|
|
—
|
%
|
||
|
Goodwill and intangibles
|
97
|
|
75
|
|
22
|
|
29.3
|
%
|
||
|
Other assets
|
177
|
|
108
|
|
69
|
|
63.9
|
%
|
||
|
Total assets
|
13,922
|
|
10,773
|
|
3,149
|
|
29.2
|
%
|
||
|
Liabilities
|
|
|
|
|
|
|
||||
|
Total deposits
|
12,442
|
|
9,452
|
|
2,990
|
|
31.6
|
%
|
||
|
Total other liabilities
|
373
|
|
295
|
|
78
|
|
26.4
|
%
|
||
|
Long-term debt
|
144
|
|
143
|
|
1
|
|
0.7
|
%
|
||
|
Total liabilities
|
12,958
|
|
9,891
|
|
3,067
|
|
31.0
|
%
|
||
|
Common shareholders' equity
|
964
|
|
882
|
|
82
|
|
9.3
|
%
|
||
|
Total shareholders' equity
|
964
|
|
882
|
|
82
|
|
9.3
|
%
|
||
|
Total liabilities and shareholders' equity
|
13,922
|
|
10,773
|
|
3,149
|
|
29.2
|
%
|
||
|
As at
December 31,
|
|||||
|
2019
|
2018
|
||||
|
Capital Ratios
|
|
|
|
|
|
|
Risk-weighted assets
|
4,898
|
|
4,321
|
|
|
|
Tangible common equity (TCE)
|
867
|
|
808
|
|
|
|
Tangible assets (TA)
|
13,825
|
|
10,698
|
|
|
|
TCE/TA
|
6.3
|
%
|
7.5
|
%
|
|
|
Common Equity Tier 1
|
17.3
|
%
|
19.6
|
%
|
|
|
Total Tier 1
|
17.3
|
%
|
19.6
|
%
|
|
|
Total Capital
|
19.4
|
%
|
22.4
|
%
|
|
|
Leverage ratio
|
5.9
|
%
|
7.6
|
%
|
|
We maintain a liquid balance sheet and are well capitalized. As at
December 31, 2019
, total cash due from banks, short-term investments and investment in securities represented
$8.3 billion
, or
60.0%
of total assets, up slightly from
59.3%
at the end of
2018
. Shareholders' equity at
December 31, 2019
was
$963.7 million
, up from
$882.3 million
at the end of
2018
due primarily to net income on the year net of dividends paid.
Total assets increased by
$3.1 billion
to
$13.9 billion
from
2018
to
2019
, primarily reflecting the acquisition of ABN AMRO (Channel Islands) in July 2019.
As at
December 31, 2019
, our capital ratios were strong, and were significantly in excess of regulatory requirements. Effective January 1, 2016, the Bank's regulatory capital is determined in accordance with current Basel III guidelines as issued by the BMA. Basel III adopts CET1 as the predominant form of regulatory capital with the CET1 ratio as a new metric. Basel III also adopts the new Leverage Ratio regime, which is calculated by dividing Tier 1 capital by an exposure measure. The exposure measure consists of total assets (excluding items deducted from Tier 1 capital) and certain off-balance sheet items converted into credit exposure equivalents as well as adjustments for derivatives to reflect credit risk and other risks.
The TCE/TA ratio at the end of
2019
was
6.3%
(
2018
:
7.5%
), while the CET1 and total Tier 1 capital ratios at the end of
2019
were
17.3%
(
2018
:
19.6%
) and
17.3%
(
2018
:
19.6%
), respectively. These ratios continue to remain in excess of regulatory minimums at
December 31, 2019
.
50
Cash Due from Banks, Securities Purchased Under Agreement to Resell and Short-Term Investments
We only place deposits with highly-rated institutions and ensure that there is appropriate geographic and sector diversification in our exposures. Limits are set for aggregate geographic exposures and for every counterparty for which we place deposits. Those limits are monitored and reviewed by our Credit Risk Management division and approved by the Financial Institutions Committee. We define cash due from banks to include cash on hand, cash items in the process of collection, amounts due from correspondent banks and liquid investments that are readily convertible to known amounts of cash and which are subject to an insignificant risk of change in fair value. Such investments are those with less than three months maturity from the date of acquisition and include unrestricted term deposits, certificates of deposit and treasury bills. Investments of a similar nature that are either restricted or have a maturity of more than three months but less than one year are classified as short-term investments. Securities purchased under agreement to resell are treated as collateralized lending transactions, and are referred to as repurchase agreements. We utilize repurchase agreements to manage liquidity. The risks of these transactions include changes in the fair value in the securities posted or received as collateral and other credit-related events. The Bank manages these risks by ensuring that the collateral involved is appropriate and by monitoring the value of the securities posted or received as collateral on a daily basis.
As at
December 31, 2019
, cash due from banks, securities purchased under agreements to resell and short-term investments were
$3.9 billion
, compared to
$2.1 billion
as at
December 31, 2018
. The increase from
2018
to
2019
is primarily a result of the acquired ABN AMRO (Channel Islands) multi-currency earning assets held in cash and short term investments until behavioralized over the medium term.
See "
Note 3: Cash due from banks
", "
Note 4: Short-term investments
" and "
Note 12: Credit related arrangements, repurchase agreements and commitments
" to our audited consolidated financial statements as at and for the year ended
December 31, 2019
for additional tables and information.
Investment in Securities
Our investment policy requires management to maintain a portfolio of securities that provide the liquidity necessary to cover our obligations as they come due, and mitigate our overall exposure to credit and interest rate risk, while achieving a satisfactory return on the funds invested. The securities in which we invest are limited to securities that are considered investment grade. Securities in our investment portfolio are accounted for as either equity securities at fair value, trading, AFS or HTM. Investment policies are approved by the Board, governed by the Group Asset and Liability Committee and monitored by Group Market Risk, a department of the Group Risk Management division.
Consistent with industry and rating agency designations, we define investment grade as "BBB" or higher. As at
December 31, 2019
,
99.8%
(
2018
: 99.9%) of our total investments were investment grade. Of these securities,
99.8%
(
2018
: 99.9%) are rated "A" or higher.
The following table presents the carrying value of investment securities by balance sheet category as at
December 31, 2019
and
2018
:
|
As at
December 31,
|
|
|
|
|
|||||||
|
(in millions of $)
|
2019
|
2018
|
Dollar Change
|
Percent Change
|
|||||||
|
Equity securities at fair value
|
7
|
|
6
|
|
1
|
|
16.7
|
%
|
|||
|
Available-for-sale
|
2,220
|
|
2,183
|
|
37
|
|
1.7
|
%
|
|||
|
Held-to-maturity
|
2,209
|
|
2,066
|
|
143
|
|
6.9
|
%
|
|||
|
Total Investment in Securities
|
4,436
|
|
4,255
|
|
181
|
|
4.3
|
%
|
|||
The investment portfolio was
$4.4 billion
as at
December 31, 2019
, compared to
$4.3 billion
as at
December 31, 2018
. The total investments were placed primarily in US government and federal agency securities were $4.3 billion, based upon carrying value, or 96.0% of the total investment portfolio, as at
December 31, 2019
. Total net unrealized gains of the investment portfolio were
$60.8 million
, compared to net unrealized losses of $72.8 million at the end of
2018
. The movement in unrealized gains for the year was primarily driven by a decrease in the yield of longer-dated US treasuries during the period. The 10-year treasury rate was 1.92% as at
December 31, 2019
compared to 2.68% as at
December 31, 2018
.
Equity securities at fair value totaled
$7.4 million
at the end of
2019
, compared to
$6.5 million
at the end of
2018
. As at
December 31, 2019
and
2018
, equity securities at fair value consisted entirely of real estate mutual funds and seed capital invested in mutual funds managed by the Bank.
AFS securities totaled
$2.2 billion
at the end of
2019
, compared to
$2.2 billion
at the end of
2018
. As at
December 31, 2019
,
92.4%
or
$2.1 billion
(
2018
:
81.8%
, or
$1.8 billion
) of AFS securities consisted of holdings of securities issued by the US government and federal agencies. The US government guarantees 55.1% or $2.4 billion (
2018
: 45.8% or $1.9 billion) of these securities. As at
December 31, 2019
, the remaining
7.6%
, or
$167.9 million
of AFS securities (
2018
:
14.6%
or
$317.5 million
) was comprised primarily of guaranteed student loan-backed securities of
0.6%
, or
$12.9 million
(
2018
:
0.6%
, or
$12.6 million
), debt securities issued by non-US governments of
1.2%
, or
$25.7 million
(
2018
:
1.2%
, or
$25.4 million
) and residential mortgage-backed securities of
5.8%
, or
$129.3 million
(
2018
:
7.2%
, or
$156.3 million
). The overall increase in US government and federal agency securities was funded by both a reallocation from short-term investments and the ABN AMRO (Channel Islands) acquisition.
HTM investments were
$2.2 billion
as at
December 31, 2019
(
2018
:
$2.1 billion
) and consisted entirely of mortgage-backed securities issued by US federal agencies that management does not intend to sell before contractual maturity. The increase in the HTM portfolio was also related to a repositioning in the third quarter of 2019 of the investment portfolio intended to increase investment yield and reduce volatility in other comprehensive income.
Investment Valuation — OTTI Considerations
Securities in unrealized loss positions are analyzed as part of management's ongoing assessment of OTTI. When management intends to sell securities, it recognizes an impairment loss equal to the full difference between the amortized cost basis and the fair value of those securities. When management does not intend and is not required to sell equity or debt securities in an unrealized loss position, potential OTTI is considered using a variety of factors, including: the length of time and extent to which the market value has been less than amortized cost; adverse conditions specifically related to the industry, geographic area or financial condition of the issuer or underlying collateral of a security; payment structure of the security; changes to the rating of the security by a rating agency; the volatility of the fair value changes; and changes in fair value of the security after the balance sheet date.
While management sold AFS securities in
2019
and
2018
, these securities were sold for gains of
$0.7 million
and $0.1 million, respectively. Management does not have the intention or does not foresee a more likely than not scenario where the Bank will be required to sell any further securities which are in an unrealized loss position, and accordingly, management has concluded that these sales do not result in an OTTI indicator for any remaining securities in a loss position as at
December 31, 2019
.
51
See "
Note 5: Investment in securities
" to our audited consolidated financial statements as at
December 31, 2019
for additional tables and information.
Loans
The loan portfolio increased from
$4.0 billion
at the end of
2018
to
$5.1 billion
as at
December 31, 2019
, mostly as a result of the acquisition of ABN AMRO (Channel Islands) as well as new residential loan origination in the central London mortgage book and two new sovereign mandates in Bermuda and Cayman. Lending in the UK grew to $1.1 billion as at
December 31, 2019
, an increase of $0.3 billion from
December 31, 2018
.
The loan portfolio represented
36.9%
of total assets as at
December 31, 2019
(
2018
:
37.5%
), while loans as a percentage of customer deposits decreased from
42.9%
at the end of
2018
to
41.4%
at the end of
2019
.
Allowance for credit losses as at
December 31, 2019
totaled
$23.6 million
, a decrease of
$1.5 million
from the prior year. The movement in the allowance was mainly the result of recoveries and provision releases of
$1.5 million
(including recoveries of
$1.6 million
), augmented by charge-offs of
$3.0 million
recorded during the year. Of the total allowance, the general allowance was
$5.9 million
(
2018
:
$10.2 million
) and the specific allowance was
$17.7 million
(
2018
:
$14.9 million
), reflecting a specific coverage ratio of
35.1%
, compared to
30.6%
as at
December 31, 2018
.
Gross non-accrual loans totaled
$50.4 million
as at
December 31, 2019
, marginally higher than
$48.7 million
as at
December 31, 2018
, and represented
1.0%
of the total loan portfolio as at
December 31, 2019
, compared to 1.2% as at
December 31, 2018
. During
2019
, we held OREO amounting to
$3.8 million
(
2018
:
$5.3 million
), consisting of commercial real estate of $3.3 million (
2018
: $3.3 million) and foreclosed residential properties of $0.5 million (
2018
: $2.1 million).
Government
Loans to governments were
$370.8 million
, which was a
$265.1 million
increase from
2018
, due primarily to an increase in sovereign lending in Bermuda and Cayman in the latter part of 2019.
Commercial
The commercial and industrial loan portfolio includes loans and overdraft facilities advanced primarily to corporations and small and medium-sized entities, which are generally not collateralized by real estate and where loan repayments are expected to flow from the operation of the underlying businesses.
Commercial real estate loans are offered to real estate investors, developers and builders domiciled primarily in Bermuda and the Cayman Islands. To manage our credit exposure on such loans, the principal collateral is real estate held for commercial purposes and is supported by a registered mortgage. Cash flows from the properties, primarily from rental income, are generally supported by non-cancellable long-term leases to high quality international businesses. These cash flows are generally sufficient to service the loan. The portfolio
increased
by
$178.7 million
to
$753.8 million
at
December 31, 2019
as a result of the ABN AMRO (Channel Islands) acquisition.
Commercial loans outstanding as at
December 31, 2019
were
$559.4 million
, which represented an
increase
of
$16.9 million
from the previous year.
Residential
The residential mortgage portfolio comprises mortgages to clients with whom we are seeking to establish (or already have) a comprehensive financial services relationship. It includes mortgages to individuals and corporate loans secured by residential property.
All mortgages were underwritten utilizing our stringent credit standards. See "Risk Management — Credit Risk". Residential loans consist of conventional home mortgages and equity credit lines.
As at
December 31, 2019
, residential mortgages totaled
$3.2 billion
(or
62.3%
of total gross loans), a
$0.6 billion
increase
from
December 31, 2018
. This
increase
was attributed mainly to the acquisition of ABN AMRO (Channel Islands) as well as increases in the UK residential mortgage portfolio.
OREO and Non-Accrual Loans
Non-accrual loans increased during the year by
$1.7 million
, and OREO
decreased
by
$1.5 million
. Non-accrual loans increased as a result of several loans, primarily within residential mortgages, moving to non-performing status during the year. This was partially offset by the extinguishment of the Barbados Government debt in exchange for both cash and Barbados government bonds now held in our AFS securities portfolio. The decrease in OREO was principally driven by the sale of residential property in Bermuda. The Bank continues to work with customers with non-performing loans and focus on improving the quality of the loan portfolio.
Other Loan Portfolios
We provide loans, as part of our normal banking business, in respect of automobile financing, consumer financing, credit cards, commercial financing, loans to financial institutions and overdraft facilities to retail, corporate and private banking clients in the jurisdictions in which we operate. As at
December 31, 2019
, other consumer loans totaled
$256.5 million
(or
5.0%
of total gross loans), a
$76.0 million
increase
from
December 31, 2018
principally due to the ABN AMRO (Channel) Islands acquisition.
See "
Note 6: Loans
" and "
Note 7: Credit risk concentrations
" to our audited consolidated financial statements as at
December 31, 2019
for more information on our loan portfolio and contractual obligations and arrangements.
Deposits
Deposits are our principal funding source for use in lending, investments and liquidity. We are a deposit-led bank and do not require the use of wholesale or institutional markets to fund our loan business. See "Risk Management — Liquidity Risk" and "Risk Management — Credit Risk". Deposit balances at the end of reporting periods can fluctuate due to significant balances that flow in and out from private trust, fund and insurance clients to meet quarter-end operational requirements.
52
The table below shows the year-end and average customer deposit balances by jurisdiction for the year ended and as at
December 31, 2019
and
2018
:
|
As at
December 31
|
Dollar change
|
Average balance
|
Dollar change
|
|||||||||||||
|
(in millions of $)
|
2019
|
2018
|
2019
|
2018
|
||||||||||||
|
Bermuda
|
4,403
|
|
4,503
|
|
(100
|
)
|
4,371
|
|
5,281
|
|
(910
|
)
|
||||
|
Cayman
|
3,450
|
|
3,345
|
|
105
|
|
3,315
|
|
2,979
|
|
336
|
|
||||
|
Channel Island and the UK
|
4,555
|
|
1,604
|
|
2,951
|
|
3,283
|
|
1,348
|
|
1,935
|
|
||||
|
Other
|
—
|
|
—
|
|
—
|
|
—
|
|
58
|
|
(58
|
)
|
||||
|
Total customer deposits
|
12,408
|
|
9,452
|
|
2,956
|
|
10,969
|
|
9,666
|
|
1,303
|
|
||||
Average customer deposits increased by
$1.3 billion
to
$11.0 billion
in
2019
. On a year-end basis, customer deposits were up
$3.0 billion
to
$12.4 billion
from
$9.5 billion
at the end of
2018
. The increase was largely a result of the acquisition of ABN AMRO (Channel Islands).
Customer demand deposits, which include checking accounts (both interest bearing and non-interest bearing), savings and call accounts, totaled
$9.4 billion
, or
75.4%
of total customer deposits at the end of
2019
, compared to
$7.4 billion
, or
79.1%
, at the end of
2018
. Customer term deposits increased by
$1.1 billion
to
$3.0 billion
compared to the prior year. The cost of funds on deposits increased from
18
basis points in the full year ended
2018
to
47
basis points in
2019
as a result of both increases in term deposit rates paid across all jurisdictions as well as the ABN AMRO (Channel Islands) deposit book which had a higher cost of funding. Average non-interest bearing deposits decreased slightly to
$2.1 billion
.
See "
Note 10: Customer deposits and deposits from banks
" to our audited consolidated financial statements as at
December 31, 2019
for additional tables and information.
Borrowings
We have no issuances of certificates of deposit ("CD"), commercial paper ("CP") or senior notes outstanding and have no CD or CP issuance programs. We use funding from the inter-bank market as part of interest rate risk and liquidity management. As at
December 31, 2019
, deposits from banks totaled
$33.8 million
, relatively flat from the prior year.
Employee Future Benefits
We maintain trusteed pension plans including non-contributory defined benefit plans and a number of defined contribution plans, and provide post-retirement healthcare benefits to our qualifying retirees. The defined benefit provisions under the pension plans are generally based upon years of service and average salary during the final years of employment. The defined benefit pension and post-retirement healthcare plans are not open to new participants, are non-contributory and thus the funding required is provided by us, based upon the advice of an independent actuary.
Effective December 31, 2011, the Bermuda defined benefit pension benefits were amended to freeze credited service and final average earnings for remaining active members. Effective January 2012, all the participants of the Bermuda defined benefit pension plan are inactive and in accordance with GAAP, the net actuarial loss of the Bermuda defined benefit pension plan is amortized over the estimated average remaining life expectancy of the inactive participants of 22.8 years. Prior to all Bermuda participants being inactive, the net actuarial loss of the Bermuda defined benefit pension plan was amortized to net income over the estimated average remaining service period for active members of 4.5 years.
Effective September 30, 2014, the defined benefit pension benefits of our Guernsey operations were amended to freeze credited service and final average earnings for remaining active members. The benefits amendment resulted in a further reduction in the Guernsey defined benefit pension liability of $4.6 million as at September 30, 2014.
Effective October 2014, all of the participants of the Guernsey defined benefit pension plan are inactive and in accordance with GAAP, the net actuarial loss of the Guernsey defined benefit pension plan will be amortized over the estimated average remaining life expectancy of the inactive participants of 39 years. Prior to all Guernsey participants being inactive, the net actuarial loss of the Guernsey defined benefit pension plan was amortized to net income over the estimated average remaining service period for active members of 15 years.
For the year ended December 31, 2014, numerous changes in the plan provisions were made to align the plan provisions with our administrative practices resulting in a further increase in the Bermuda defined benefit post-retirement healthcare plan liability of $7.9 million. We amortize prior service credit resulting from plan amendments that occurred when plan members were active employees, on a linear basis over the expected average remaining service period (to full eligibility) of active members expected to receive benefits under the plan. Such remaining service periods are as follow: 3.1 years for the 2010 plan amendments and 4.6 years for the 2011 plan amendments. Plan amendments occurring in 2014 resulted in the recognition of new prior service cost on December 31, 2014 on a plan for which substantially all members are now inactive and, in accordance with GAAP, we have elected to amortize this new prior service cost on a linear basis over 21 years, which is the average remaining life expectancy of members eligible for benefits under the plan at the time of the amendments.
As at
December 31, 2019
, we had a net obligation for employee future benefits in the amount of
$110.3 million
, down
$6.9 million
(
5.8%
) from
$117.2 million
at the end of
2018
. The decrease was driven primarily by improvements in the valuation of fund assets, partially offset by plan amendments.
See "
Note 11: Employee benefit plans
" to our audited consolidated financial statements as at
December 31, 2019
for additional tables and information.
We had outstanding issuances of long-term debt with a carrying value of
$143.5 million
as at
December 31, 2019
and
$143.3 million
as at
December 31, 2018
, all issued in US Dollars. As at
December 31, 2019
, $97.3 million of our outstanding long-term debt was eligible for inclusion in our Tier 2 regulatory capital base and was limited to 50% of Tier 1 capital, down from $111.3 million at the end of
2018
due to the two older issuances amortizing in the last five years to maturity. On May 24, 2018, the Bank issued US $75 million of Subordinated Lower Tier II capital notes. The notes were issued at par and are due on June 1, 2028. The notes were offered in the US pursuant to the Bank's automatic shelf registration statement of Form F-3 filed with the SEC on April 18, 2018. The notes are listed on the BSX in the specialist debt securities category. The proceeds from the sale of the notes were used, among other, to repay the entire amount of the US $47 million outstanding subordinated notes series 2003-B. The notes issued pay a fixed
53
coupon of 5.25% until June 1, 2023 when they become redeemable in whole at the option of the Bank. The notes were priced at a spread of 2.27% over the 10-year US Treasury yield. There were no other significant movements in long-term debt during the period from
December 31, 2018
to
December 31, 2019
.
The following table presents the contractual maturity, interest rates and principal outstanding as at
December 31, 2019
:
|
Long-term debt (in millions of $)
|
Earliest date
redeemable at
the Bank's option
|
Contractual
maturity date
|
Interest rate until date redeemable
|
Interest rate from earliest date
redeemable to contractual maturity
|
Principal
outstanding
|
|
2005 issuance - Series B
|
July 2, 2015
|
July 2, 2020
|
5.11%
|
3 months US$ LIBOR + 1.695%
|
45.0
|
|
2008 issuance - Series B
|
May 27, 2018
|
May 27, 2023
|
8.44%
|
3 months US$ LIBOR + 4.929%
|
25.0
|
|
2018 issuance
|
June 1, 2023
|
June 1, 2028
|
5.25%
|
3 months US$ LIBOR + 2.255%
|
75.0
|
|
Unamortized issuance costs
|
(1.5)
|
||||
|
Total
|
|
|
|
|
143.5
|
See "
Note 20: Long-term debt
" to our audited consolidated financial statements as at
December 31, 2019
for additional information.
Other Liabilities
Other liabilities include operating lease liabilities, derivative liabilities, current employee salaries and benefits payable and related payroll tax, as well as sundry liabilities. Other liabilities increased by
$81.0 million
to
$254.0 million
as at
December 31, 2019
. This increase was a result of the acquisition of ABN AMRO (Channel Islands) as well as the adoption of the new Lease accounting standard, Accounting Standards Update (“ASU”) 2016-02 Leases (Topic 842)), requiring the Bank to recognize (prospectively, with no adjustments to prior periods) right-of-use assets and lease liabilities for operating leases and for finance leases from January 1, 2019.
Contractual Obligations
Credit-Related Arrangements
We enter into standby letters of credit, letters of guarantee and contractual commitments to extend credit in the normal course of business, which are not required to be recorded on the balance sheet. Since many commitments expire unused or only partially used, these totals do not necessarily reflect future cash requirements. Generally, the term of the standby letters of credit does not exceed one year, while the term of the letters of guarantee does not exceed four years. The following table sets forth the outstanding financial guarantees with contractual amounts representing credit risk as of the dates indicated:
|
December 31, 2019
|
December 31, 2018
|
|||||||||||
|
(in millions of $)
|
Gross
|
Collateral
|
Net
|
Gross
|
Collateral
|
Net
|
||||||
|
Standby letters of credit
|
231.0
|
|
223.7
|
|
7.3
|
|
245.2
|
|
237.1
|
|
8.1
|
|
|
Letters of guarantee
|
7.8
|
|
7.7
|
|
0.1
|
|
2.7
|
|
2.6
|
|
0.1
|
|
|
Total
|
238.8
|
|
231.4
|
|
7.4
|
|
247.8
|
|
239.7
|
|
8.2
|
|
The Bank enters into contractual commitments to extend credit, normally with fixed expiration dates or termination clauses, at specified rates and for specific purposes. Substantially all of the Bank's commitments to extend credit are contingent upon customers maintaining specific credit standards at the time of loan funding. Management assesses the credit risk associated with certain commitments to extend credit in determining the level of the allowance for possible loan losses. The following table sets forth the outstanding unfunded legally binding commitments to extend credit as of the dates indicated:
|
(in millions of $)
|
December 31, 2019
|
December 31, 2018
|
||
|
Commitments to extend credit
|
549.0
|
|
445.2
|
|
|
Documentary and commercial letters of credit
|
0.4
|
|
0.6
|
|
|
Total unfunded commitments to extend credit
|
549.4
|
|
445.8
|
|
The Bank has a facility by one of its custodians, whereby the Bank may offer up to $200 million of standby letters of credit to its customers on a fully secured basis. Under the standard terms of the facility, the custodian has the right to set-off against securities held of 110% of the utilized facility. At
December 31, 2019
, $
143.6 million
(
December 31, 2018
:
$137.4 million
) of standby letters of credit were issued under this facility.
54
Contractual Obligations
The following table presents our outstanding contractual obligations as at
December 31, 2019
:
|
(in millions of $)
|
Total
|
Less than 1
year
|
1 to 3
years
|
3 to 5
years
|
After 5
years
|
|||||
|
Long term debt
(1)
|
145.0
|
|
45.0
|
|
25.0
|
|
—
|
|
75.0
|
|
|
Sourcing arrangements
(2)
|
27.6
|
|
15.6
|
|
12.0
|
|
—
|
|
—
|
|
|
Term deposits
|
3,051.3
|
|
2,973.1
|
|
78.2
|
|
—
|
|
—
|
|
|
Other obligations
|
26.3
|
|
12.6
|
|
9.9
|
|
2.8
|
|
1.0
|
|
|
Total outstanding contractual obligations
(3)
|
3,250.2
|
|
3,046.3
|
|
125.1
|
|
2.8
|
|
76.0
|
|
______________________________
|
(1)
|
Long-term debt excludes interest and unamortized debt issuance costs.
|
|
(2)
|
We have an outstanding contractual obligation relating to a five-year agreement entered into in November 2016 with DXC (previously HP) to supply technology infrastructure and application development management, information security and technical support for our locations in Bermuda and the Cayman Islands. Under our agreement with DXC, server management and maintenance, technology field support, application support and development and help desk functions are managed by DXC. Our obligations to DXC under this agreement amounted to
$27.6 million
as at
December 31, 2019
(
December 31, 2018
: $39.2 million).
|
|
(3)
|
This excludes Lease obligations which are discussed in
Leases
below.
|
See "
Note 12: Credit related arrangements, repurchase agreements and commitments
" to our audited consolidated financial statements as at
December 31, 2019
for additional information.
Interest expense on our contractual obligations relates primarily to deposits liabilities and our long-term debt. Interest expense on customer deposits was $
51.5 million
for the year-ended
December 31, 2019
, compared to $17.6 million and $10.9 million for the years ended
December 31, 2018
and
2017
, respectively. Movements in interest expense on deposits liabilities are due primarily to volume and rate movements, with yearly average deposits liabilities of $
8.9 billion
, $
7.4 billion
and $
7.4 billion
for
2019
,
2018
and
2017
, respectively. The increase in the expense is related primarily to a 34 basis point increase in average term deposit rates during
2019
.
During the year-ended
December 31, 2019
, none of the rates on any tranches of our long-term debt reset and there were no new issuances of long-term debt. For the year ended
December 31, 2019
, total interest expense increased by $
34.8 million
to $
59.4 million
mostly due to the increases in customer term deposit rates and the increased volume of average deposits following the acquisition of ABN AMRO (Channel Islands). For the year ended
December 31, 2018
, interest expense on commitments increased by $8.9 million compared to 2017 due to both the increase in rates paid on term deposits and the increased floating rate paid on LIBOR based long-term debt, as well as the higher volume of long-term debt outstanding. In 2018, we issued $75 million in new long-term debt at a fixed rate of 5.25%, which is fixed at this rate until June 1, 2023 and used the proceeds of this new issuance to partially repay the entire amount of the $47 million outstanding subordinated 2003 issuance - Series B. Until its repurchase, the 2003 issuance - Series B, as well as the 2005 issuance - Series B were on floating rates fixed to LIBOR, which increased during the year.
Leases
In the normal course of operation, the Bank enters into leasing agreements either as the lessee or the lessor, mostly for office and parking spaces as well as for small office equipment. Starting on January 1, 2019 (the adoption date of the new lease accounting guidance ASU 2016-02 Leases (Topic 842)), the Bank recognized (prospectively, with no adjustments to prior periods) right-of-use assets and lease liabilities for operating leases and for finance leases. Lease liabilities are measured as the present value of future lease payments, including term renewals that are reasonably certain to occur, discounted using the Bank’s incremental borrowing rate. The Bank has used the rate of its May 24, 2018 debt issuance as the current incremental borrowing rate.
The terms of the existing leases, including renewal options that are reasonably certain to be exercised, extend up to the year 2035. Certain lease payments will be adjusted during the related leases’ terms based on movements in the relevant consumer price index.
See "
Note 13: Leases
" to our audited consolidated financial statements as at
December 31, 2019
for additional information.
Repurchase Agreements
We also obtain funds from time to time from the sale of securities to institutional investors under repurchase agreements. In a repurchase agreement transaction, we will generally pledge investment securities as collateral in a borrowing transaction, agreeing to repurchase the identical security on a specified later date, generally not more than 90 days, at a price greater than the original sales price. The difference between the sale price and repurchase price is the cost of the use of the proceeds, or interest expense. The investment securities underlying these agreements may be delivered to securities dealers who arrange such transactions as collateral for the repurchase obligation. Repurchase agreements represent a cost competitive funding source and also provide liquidity on agency paper for us. However, we are subject to the risk that the borrower of the securities may default at maturity and not return the collateral. In order to minimize this potential risk when entering into such transactions, we generally deal with large, established investment brokerage firms with whom we have master repurchase agreements. Repurchase transactions are accounted for as collateralized financing arrangements rather than as sales of such securities, and the obligation to repurchase such securities is reflected as a liability in our consolidated financial statements. As at
December 31, 2019
and
2018
, there were no repurchase agreements outstanding.
Shareholders' Equity
Shareholders' equity
increased
during the year ended
December 31, 2019
by
$81.4 million
to
$963.7 million
.
Increases totaling $257.5 million included:
|
•
|
$177.1 million
of net income for the year;
|
|
•
|
$55.4 million
from net change in unrealized gains (losses) on AFS investments;
|
|
•
|
$17.5 million
for share-based compensation;
|
|
•
|
$6.9 million
from adjustments to employee benefit plans;
|
|
•
|
$0.3 million
from issuance of new common shares as part of share-based settlements; and
|
55
|
•
|
$0.3 million of other smaller adjustments.
|
The increases were offset by the following decreases of $176.1 million:
|
•
|
$93.6 million
of common share dividends;
|
|
•
|
$81.5 million
from net increases in treasury shares; and
|
|
•
|
$1.0 million
of translation adjustments on foreign operations.
|
Liquidity
We define liquidity as our ability to maintain cash flow that is adequate to fund operations and meet present and future financial obligations through either the sale or maturity of existing assets or by obtaining additional funding through liability management.
Sources and Uses of Cash
Our primary sources of cash are (i) cash obtained from deposits, (ii) long-term debt, and (ii) cash from operations. Our primary uses are (i) the payment of our operating expenses, (ii) payment of dividends on our common shares, (iii) repayment of certain maturing liabilities, (iv) repurchase of our common shares, and (v) extraordinary requirements for cash, such as acquisitions. We had
$2.6 billion
of cash and cash equivalents as at
December 31, 2019
and
$2.1 billion
as at
December 31, 2018
, as well as
$3.6 billion
and
$2.3 billion
, respectively, of liquid securities, the balance of which could be sold to meet liquidity requirements. In our opinion, the Bank’s working capital is sufficient for the Bank’s present requirements.
Liquidity Risk
Our liquidity risk is managed through a comprehensive framework of policies and limits overseen by our Group Asset and Liability Committee. We consider the effective and prudent management of liquidity to be fundamental to our health and strength. Our objective is to manage our cash flow and liquidity reserves so that they are adequate to fund our obligations and other commitments on a timely basis and at a reasonable cost.
We continuously monitor and make adjustments to our liquidity position by adjusting the balance between sources and uses of funds as we deem appropriate. Our primary measures of liquidity include monthly cash flow analysis under ordinary business activities and conditions and under situations simulating a severe run on the Bank. The Bank strives to use a balanced liquidity risk appetite with internal quantitative liquidity risk tolerances more stringent than regulatory requirements. Specifically the Bank manages liquidity against internal limits established by the market risk management policy and its related liquidity risk standard and quarterly stress testing methodology. The results of these measures and analysis are incorporated into our liquidity contingency plan, which provides the basis for the identification of our liquidity needs. For more information, see "Risk Management — Liquidity Risk".
Capital Resources
We have financed our operations, growth and cash needs primarily through income from operations and issuances of debt and equity securities. We believe that our cash on hand and cash flows from operations will be sufficient to repay our outstanding debt as it matures. In the future, we may need to incur additional debt or issue additional equity securities, which we may be unable to do or which may be on less favorable terms.
We manage our capital both on a consolidated basis and, where appropriate, on a legal entity basis. The group finance team has the responsibility for measuring, monitoring and reporting capital levels within guidelines and limits established by the Risk Policy & Compliance Committee of the Board. The management of capital will also involve jurisdictional management to ensure compliance with local regulation. In establishing the guidelines and limits for capital, a variety of factors are taken into consideration, including the overall risk of the business in stressed scenarios, regulatory requirements, capital levels relative to our peers, and the impact on our credit ratings.
Effective January 1, 2015, the BMA implemented the capital reforms proposed by the BCBS and referred to as the Basel III regulatory framework. Basel III aims to raise the quality, consistency and transparency of the capital base, limit the build-up of excess leverage and increase capital requirements for the banking sector. Basel III adopts CET1 capital as the predominant form of regulatory capital with the CET1 ratio as a new metric. Basel III also adopts the new Leverage Ratio, Liquidity Coverage Ratio ("LCR") and Net Stable Funding Ratio ("NSFR") regimes.
The Bank was required to report under both Basel II and Basel III guidance during 2015. However only the Basel II results were required to be published under guidance from the BMA. From January 1, 2016 onwards, all published ratios are calculated under Basel III. The Basel III regulatory framework adopts a phased implementation approach for Bermuda banks with full implementation from January 1, 2019, consistent with BCBS recommendations. We are now subject to the following fully phased-in requirements:
|
•
|
CET1 ratio of at least 7.0% of RWA, inclusive of a minimum CET1 ratio of 4.5% and the new capital conservation buffer of 2.5%, but excluding the Domestic Systematically Important Bank ("D-SIB") surcharge described below;
|
|
•
|
Tier 1 capital of at least 8.5% of RWA, inclusive of a minimum Tier 1 ratio of 6% and the new capital conservation buffer of 2.5% but excluding the D-SIB surcharge described below;
|
|
•
|
Total capital of at least 10.5% of RWA, inclusive of a minimum total capital ratio of 8% and the new capital conservation buffer of 2.5% but excluding the D-SIB surcharge described below;
|
|
•
|
We are considered to be a D-SIB and are subject to a 3% surcharge composed of CET1-eligible capital implemented by the BMA effective September 30, 2015. This is based upon our assessment of the extent to which we (individually and collectively with the other Bermuda banks) pose a degree of material systemic risk to the economy of Bermuda due to our role in deposit taking, corporate lending, payment systems and other core economic functions;
|
|
•
|
Counter-cyclical buffer of up to 2.5% composed of CET1-eligible capital may be implemented by the BMA when macroeconomic indicators provide an assessment of excessive credit or other pressures building in the banking sector, potentially increasing the CET1, Tier 1 and total capital ratios by up to 2.5%. No counter-cyclical buffer has been implemented to date;
|
|
•
|
Leverage ratio must be at 5.0% or higher;
|
|
•
|
LCR with a minimum requirement of 100%; and
|
56
|
•
|
NSFR with a minimum requirement of 100%.
|
The minimum capital ratio requirements set forth above do not reflect additional Pillar II add-on requirements that the BMA may impose upon us as a prudential measure from time to time. As of January 1, 2019, our minimum total capital ratio required by the BMA is 16.3% and our minimum CET1 ratio requirement is 10.0%. As of the date hereof, we expect that our minimum total capital ratio requirement at January 1, 2020 will remain at 16.3% (inclusive of the minimum required total capital ratio of 10.5% as described above). However, as our capital requirements remain under continuous review by the BMA pursuant to its prudential supervision, we cannot guarantee that the BMA will not seek higher total capital ratio requirements at any time.
In December 2017, the BCBS published standards that it described as the finalization of the Basel III post-crisis regulatory reforms (the standards are commonly referred to as "Basel IV"). Among other things, these standards revise the BCBS's standardized approach for credit risk (including by recalibrating risk weights and introducing new segmentations for exposures) and provides a new standardized approach for operational risk capital. Under the BCBS framework, these standards will generally be effective on January 1, 2022, with an aggregate output floor phasing in through January 1, 2027. The impact of these standards on us will depend on the manner in which they are implemented by the BMA.
The following table sets forth our capital adequacy as at
December 31, 2019
and
2018
in accordance with the Basel III framework:
|
As at December 31,
|
|||||
|
(in millions of $)
|
2019
|
2018
|
|||
|
Capital
|
|
|
|
|
|
|
Common Equity Tier 1
|
848.8
|
|
846.0
|
|
|
|
Tier 1 capital
|
848.8
|
|
846.0
|
|
|
|
Tier 2 capital
|
103.2
|
|
121.5
|
|
|
|
Total capital
|
952.1
|
|
967.6
|
|
|
|
Risk Weighted Assets
|
|
|
|
|
|
|
Cash due from banks and investments
|
862.8
|
|
918.1
|
|
|
|
Loans
|
2,697.4
|
|
2,244.8
|
|
|
|
Other assets
|
287.4
|
|
236.7
|
|
|
|
Off-balance sheet items
|
282.1
|
|
227.6
|
|
|
|
Operational risk charge
|
768.2
|
|
694.2
|
|
|
|
Total risk-weighted assets
|
4,897.9
|
|
4,321.4
|
|
|
|
Capital Ratios (%)
|
|
|
|
|
|
|
Common Equity Tier 1
|
17.3
|
%
|
19.6
|
%
|
|
|
Tier 1 total
|
17.3
|
%
|
19.6
|
%
|
|
|
Total capital
|
19.4
|
%
|
22.4
|
%
|
|
|
Leverage ratio
|
5.9
|
%
|
7.6
|
%
|
|
CET 1 capital has remained broadly flat due to earnings accretion being offset by dividends paid to ordinary shareholders, shares repurchased under the Bank’s share buy-back program and an increase in the goodwill and intangible asset regulatory deduction as a result of the ABN AMRO (Channel Islands) acquisition. Tier 2 capital decreased due to the amortization of subordinated notes that have less than 5 years to maturity. The increase in RWAs is also driven by the ABN AMRO (Channel Islands) acquisition and this has also impacted our Total capital and leverage ratios. As at
December 31, 2019
, we were in compliance with the minimum LCR of 100% as well as the minimum NSFR of 100%.
Share Buy-Back Program
The Bank repurchases its common shares through share buy-back programs from time to time as a means to improve shareholder liquidity and facilitate growth in share value. In accordance with applicable laws, regulations and listing standards, each program was approved by the Board and repurchases of shares pursuant to each program is subject to the approval of the BMA. In addition, the BSX is advised monthly of shares purchased pursuant to each program.
Common Share Buy-Back Program
On February 26, 2015, the Board approved, with effect from April 1, 2015, the 2015 common share buy-back program, authorizing the purchase for treasury of up to 0.8 million common shares. This program expired on March 31, 2016.
On February 19, 2016, the Board approved, with effect from April 1, 2016, the 2016 common share buy-back program, authorizing the purchase for treasury of up to 0.8 million common shares. This program expired on March 31, 2017.
On February 15, 2018, the Board approved, with effect on April 1, 2018, the 2018 common share buy-back program, authorizing the purchase for treasury of up to 1.0 million common shares. On December 6, 2018, following the completion of the initial 2018 share buy-back program, the Board approved the 2019 share buy-back program, authorizing for purchase for treasury of up to 2.5 million common shares through February 29, 2020.
On December 2, 2019, the Board approved, with effect from the completion of the previous program on December 20, 2019 through to February 28, 2021, a common share buy-back program, authorizing the purchase for treasury of up to 3.5 million common shares or $125 million. The timing and amount of repurchase transactions under the new program will be based on market conditions, share price, legal requirements and other factors. No assurances can be given as to the amount of common shares that may actually be repurchased.
57
Total common share buy-backs for the years ending
December 31, 2019
,
2018
,
2017
,
2016
and
2015
, are as follows:
|
For the year ending December 31
|
||||||||||||
|
2019
|
2018
|
2017
|
2016
|
2015
|
Total
|
|||||||
|
Acquired number of shares (to the nearest share)
|
2,293,788
|
|
1,254,212
|
|
—
|
|
97,053
|
|
250,371
|
|
3,895,424
|
|
|
Average cost per common share (in $)
|
35.55
|
|
38.62
|
|
—
|
|
16.36
|
|
19.42
|
|
35.02
|
|
|
Total cost (in $)
|
81,534,076
|
|
48,442,768
|
|
—
|
|
1,588,189
|
|
4,862,248
|
|
136,427,281
|
|
The foregoing reflects the reverse share split that the Bank effected on September 6, 2016.
Preference Share Buy-Back Program
On February 26, 2015, the Board approved, with effect from May 5, 2015, the 2015 preference share buy-back program, authorizing the purchase and cancellation of up to 5,000 preference shares.
Total preference share buy-backs for the years ending
December 31, 2019
,
2018
,
2017
, and
2016
are as follows:
|
For the year ending December 31
|
||||||||||||
|
2019
|
2018
|
2017
|
2016
|
2015
|
Total
|
|||||||
|
Acquired number of shares (to the nearest share)
|
—
|
|
—
|
|
—
|
|
—
|
|
183
|
|
183
|
|
|
Average cost per common share (in $)
|
—
|
|
—
|
|
—
|
|
—
|
|
1,151.55
|
|
1,151.55
|
|
|
Total cost (in $)
|
—
|
|
—
|
|
—
|
|
—
|
|
210,734
|
|
210,734
|
|
All of the preference shares were redeemed and canceled in December 2016.
From time to time, our associates, insiders and insiders' associates as defined by the BSX regulations may sell shares which may result in such shares being repurchased pursuant to each program, provided no more than any such person's pro-rata share of the listed securities is repurchased. Pursuant to the BSX regulations, all repurchases made by any issuer pursuant to a securities repurchase program must be made: (1) in the open market and not by private agreement; and (2) for a price not higher than the last independent trade for a round lot of the relevant class of securities.
Warrants
Following the capital raise on March 2, 2010, the terms of the 427,960 warrants with an exercise price of $70.10 previously issued to the Government of Bermuda in conjunction with the issuance of the preference shares in 2009 were adjusted in accordance with the terms of the Guarantee. Subsequently, the Government of Bermuda held 0.43 million (2016: 0.43 million) warrants with an exercise price of $34.72 (2016: $34.72) with an expiration date of June 22, 2019. On December 16, 2016, the Bank repurchased for cancellation all of the outstanding warrants for $0.1 million.
Dividends
During the year ended
December 31, 2019
, we paid cash dividends totaling
$93.6 million
or
$1.76
for each common share on record as of the related record dates (
2018
:
$83.7 million
or
$1.52
for each common share on record,
2017
:
$69.7 million
or
$1.28
for each common share on record). The Board declared these dividends as a quarterly dividend of $0.44 per common share for each quarter of
2019
, $0.38 per common share for each quarter of
2018
, and $0.32 per common share for each quarter of
2017
.
For more information, see "Risk Factors – Risks Relating to the Common Shares – Holders of our common shares may not receive dividends".
Cash Flows
2019
vs.
2018
Cash due from banks was
$2.6 billion
as at
December 31, 2019
, compared to
$2.1 billion
as at
December 31, 2018
. The increase is described below by category of operating, investing and financing activities.
For the year ended
December 31, 2019
, net cash provided by operating activities totaled
$249.6 million
(
2018
:
$296.3 million
). Cash flows from operating activities are generally the cash effects of transactions and other events that enter into the determination of net income. Cash provided by operating activities decreased by
$46.7 million
from
2018
to
2019
, due primarily to a decrease in net income as well as movements in other liabilities.
Net cash provided by investing activities for the year ending
December 31, 2019
totaled
$1,092.5 million
, compared to cash provided by investing activities of
$338.6 million
in
2018
. The
$754.0 million
increase in cash provided by investing activities in
2019
was mainly attributable to the acquisition of ABN AMRO (Channel Islands) which had significant deposit funding which was deployed into short term investments for the short to medium term until such deposits are behavioralized.
Net cash used in financing activities totaled
$919.4 million
in
2019
, compared to net cash used in financing activities of
$125.2 million
in
2018
. The
$794.3 million
increase is mainly due to a reduction in the balance of customer deposits liabilities, excluding the customer deposits obtained during the ABN AMRO (Channel Islands) acquisition.
2018
vs.
2017
Cash due from banks was $2.1 billion as at December 31, 2018, compared to $1.5 billion as at December 31, 2017. The increase is described below by category of operating, investing and financing activities.
58
For the year ended December 31, 2018, net cash provided by operating activities totaled $296.3 million (2017: $242.1 million). Cash flows from operating activities are generally the cash effects of transactions and other events that enter into the determination of net income. Cash provided by operating activities increased by $65.7 million from 2017 to 2018, due primarily to an increase in net income and movements in employee future benefits. This was partially offset by movements in other assets.
Net cash provided by investing activities for the year ending December 31, 2018 totaled $338.6 million, compared to cash used in investing activities of $164.3 million in 2017. The $502.9 million increase in cash provided by investing activities in 2017 was mainly attributable to proceeds from the sale of AFS securities and lower purchases of AFS securities. This was partially offset by increased purchases of HTM securities and a net increase in loan balances.
Net cash used in financing activities totaled $125.2 million in 2018, compared to net cash provided by financing activities of $686.3 million in 2017. The $549.7 million decrease is mainly due to a net decrease of demand and term deposits.
Off Balance Sheet Arrangements
Assets Under Administration and Assets Under Management
In the normal course of business, we hold AUA and AUM in a fiduciary or agency capacity for our clients. In accordance with GAAP, these assets are not our assets and are not included in our consolidated balance sheets.
Credit-Related Arrangements
We enter into standby letters of credit, letters of guarantee and contractual commitments to extend credit in the normal course of business, which are not required to be recorded on the balance sheet. Since many commitments expire unused or only partially used, these arrangements do not necessarily reflect future cash requirements. Management believes there are no material commitments to extend credit that represent risks of an unusual nature.
Standby letters of credit and letters of guarantee are issued at the request of our clients in order to secure a client's payment or performance obligations to a third party. These guarantees represent our irrevocable obligation to pay the third-party beneficiary upon presentation of the guarantee and satisfaction of the documentary requirements stipulated therein, without investigation as to the validity of the beneficiary's claim against the client. Generally, the term of the standby letters of credit does not exceed one year, while the term of the letters of guarantee does not exceed four years.
Credit risk is the principal risk associated with these instruments. The contractual amounts of these instruments represent the credit risk should the instrument be fully drawn upon and the client defaults. To control the credit risk associated with issuing letters of credit and letters of guarantee, we subject such activities to the same credit quality and monitoring controls as our lending activities. The types and amounts of collateral security we hold for these standby letters of credit and letters of guarantee are generally represented by our deposits or a charge over assets held in mutual funds. We are obligated to meet the entire financial obligation of these agreements and in certain cases are able to recover the amounts paid through recourse against the collateral security.
59
Segment Overview
The Bank is managed by the Group CEO on a geographic basis. In 2017, the Bank presented six segments which included Bermuda, Cayman, Guernsey, Switzerland, The Bahamas, and the UK. In 2018, the Bank reassessed the segment reporting as a result of acquisitions which were announced in 2017 or early 2018 and concluded on the following four geographic segments: Bermuda, Cayman, Channel Islands and the UK and Other. The Other segment is composed of several non-reportable operating segments that have been aggregated in accordance with GAAP. Each reportable segment has a managing director who reports to the Group CEO. The Group CEO and the segment managing director have final authority over resource allocation decisions and performance assessment.
Transactions between segments are accounted for on an accrual basis and are all eliminated upon consolidation. The Bank generally does not allocate assets, revenues and expenses among its business segments, with the exception of certain corporate overhead expenses and loan participation revenue and expense. Loan participation revenue and expenses are allocated pro-rata based on the percentage of the total loan funded by each jurisdiction participating in the loan.
Bermuda (Including Head Office)
For more than 150 years, Bermuda has served as home to our headquarters and remains our largest jurisdiction in terms of number of employees and business volume. The following table provides certain financial information for our Bermuda segment for the years ended
December 31, 2019
,
2018
and
2017
.
|
Summary Income Statement
|
For the year ended December 31,
|
Dollar change
|
Percent change
|
||||||||||||
|
(in millions of $)
|
2019
|
2018
|
2017
|
2018 to 2019
|
2017 to 2018
|
2018 to 2019
|
2017 to 2018
|
||||||||
|
Net interest income
|
183.9
|
|
205.3
|
|
179.9
|
|
(21.4
|
)
|
25.4
|
|
(10.4
|
)%
|
14.1
|
%
|
|
|
Provision for credit recoveries (losses)
|
(3.1
|
)
|
6.8
|
|
4.6
|
|
(9.9
|
)
|
2.2
|
|
(145.6
|
)%
|
47.8
|
%
|
|
|
Non-interest income
|
89.1
|
|
87.4
|
|
81.4
|
|
1.7
|
|
6.0
|
|
1.9
|
%
|
7.4
|
%
|
|
|
Net revenue before other gains (losses)
|
269.9
|
|
299.5
|
|
265.9
|
|
(29.6
|
)
|
33.6
|
|
(9.9
|
)%
|
12.6
|
%
|
|
|
Operating expenses
|
(209.4
|
)
|
(202.4
|
)
|
(192.0
|
)
|
(7.0
|
)
|
(10.4
|
)
|
3.5
|
%
|
5.4
|
%
|
|
|
Net income before other gains (losses)
|
60.5
|
|
97.1
|
|
73.9
|
|
(36.6
|
)
|
23.2
|
|
(37.7
|
)%
|
31.4
|
%
|
|
|
Total other gains (losses)
|
2.2
|
|
—
|
|
2.8
|
|
2.2
|
|
(2.8
|
)
|
100.0
|
%
|
(100.0
|
)%
|
|
|
Net income
|
62.7
|
|
97.1
|
|
76.7
|
|
(34.4
|
)
|
20.4
|
|
(35.4
|
)%
|
26.6
|
%
|
|
|
Summary Balance Sheet
|
As at December 31,
|
||||||||
|
(in millions of $)
|
2019
|
2018
|
Dollar change
|
Percent change
|
|||||
|
Customer deposits
|
4,403
|
|
4,496
|
|
(93
|
)
|
(2.1
|
)%
|
|
|
Loans, net of allowance for credit losses
|
2,096
|
|
1,998
|
|
98
|
|
4.9
|
%
|
|
|
Total assets
|
5,220
|
|
5,387
|
|
(167
|
)
|
(3.1
|
)%
|
|
|
Assets under administration
|
|
|
|||||||
|
Custody and other administration services
|
15,220
|
|
16,539
|
|
(1,319
|
)
|
(8.0
|
)%
|
|
|
Trust
|
44,369
|
|
46,906
|
|
(2,537
|
)
|
(5.4
|
)%
|
|
|
Assets under management
|
|
|
|||||||
|
Butterfield Funds
|
1,897
|
|
1,774
|
|
123
|
|
6.9
|
%
|
|
|
Other assets under management
|
2,085
|
|
1,860
|
|
225
|
|
12.1
|
%
|
|
|
Total assets under management
|
3,981
|
|
3,634
|
|
347
|
|
9.5
|
%
|
|
|
Number of employees
|
520
|
|
572
|
|
(52
|
)
|
(9.1
|
)%
|
|
2019
vs.
2018
Net income before other gains and losses was
$60.5 million
for the year ended
December 31, 2019
, down by
$36.6 million
from
$97.1 million
in the prior year. This decrease is due principally to the following movements in net interest income, provision for credit losses, non-interest income, operating expenses and total other gains.
Net interest income before provision for credit losses decreased by
$21.4 million
to
$183.9 million
in
2019
, due primarily to a lower average volume of interest earning assets in 2019 driven by lower customer deposit funding as well as higher interest rates paid on customer term deposits.
Provision for credit losses was
$3.1 million
which was down
$9.9 million
from a release in the prior year. This resulted primarily from smaller releases from the general provision compared to the prior year as well as increased specific provisions on a few residential mortgages and a commercial loan.
Non-interest income increased by
$1.7 million
to
$89.1 million
in
2019
. This was primarily driven by increased card service fee contributions, increased asset management fees due to new business, increased custody fees due to new fees and offset by reduced foreign exchange income due to reduced transactional volumes on foreign exchange transactions.
Operating expenses increased by
$7.0 million
to
$209.4 million
in
2019
due primarily to increased salary and other employee benefit costs, due to both restructuring initiatives and costs associated with the departure of a senior executive, increased professional and other outside services costs, resulting from costs associated with the ABN AMRO (Channel Islands) acquisition which were booked at the Head Office level, and increased marketing costs associated with the rebranding initiative.
Other gains increased by
$2.2 million
in 2019 . Other gains in
2018
were immaterial. This was driven by higher mark-to-market gains on equity securities and net realized gains on the sale of AFS.
60
Total assets as at
December 31, 2019
were
$5.2 billion
, down
$0.2 billion
from
December 31, 2018
. Customer deposits ended
2019
at
$4.4 billion
, down
$0.1 billion
from the end of
2018
, and loan balances ended
2019
at
$2.1 billion
, up
$0.1 billion
from the end of
2018
.
Client AUA for the trust and custody businesses as at
December 31, 2019
were
$44.4 billion
and
$15.2 billion
, respectively, while assets under management were
$4.0 billion
. This compares with
$46.9 billion
,
$16.5 billion
and
$3.6 billion
, respectively, as at
December 31, 2018
.
2018
vs.
2017
Net income before other gains and losses was $97.1 million for the year ended December 31, 2018, up by $23.2 million from $73.9 million in the prior year. This increase is due principally to the following movements in net interest income, provision for credit losses, non-interest income and operating expenses.
Net interest income before provision for credit losses increased by $25.4 million to $205.3 million in 2018, driven primarily by increased investment income due to a higher yield, increased loan interest income resulting from the increases in the Bermuda base rate, increased deposit income from higher average balances, and lower deposit expense due to a lower average volume of interest bearing deposits.
Provision for credit losses was a release of $6.8 million which was up $2.2 million from a recovery in the prior year. This resulted primarily from larger releases from the general provision compared to the prior year.
Non-interest income increased by $6.0 million to $87.4 million in 2018. This was primarily driven by custody and other administrative services fees, which increased by $1.6 million due to several new customers, and asset management fees which increased by $1.3 million due to revised fee schedules and higher AUM in certain Butterfield mutual funds.
Operating expenses increased by $10.4 million to $202.4 million in 2018 due primarily to increased salary and other employee benefit costs, resulting from increased post-retirement medical costs and higher performance related compensation, increased professional and other outside services costs, resulting from costs associated with our external audit and the costs associated with compliance programs and increased IT and communications costs associated with higher depreciation and increased sourcing costs. This increase was further augmented by an increase in indirect taxation, resulting from increased asset-based taxes, higher payroll tax and the costs of the Bermuda Deposit Insurance program.
Other gains decreased by $2.8 million to nil. Other gains in 2017 were due primarily to a $2.6 million receipt from a liquidation distribution on a pass-through note which was previously fully impaired in 2010 and $1.7 million of realized gains upon the sale of AFS investments.
Total assets as at December 31, 2018 were $5.4 billion, down $0.7 billion from December 31, 2017. Customer deposits ended 2018 at $4.5 billion, down $0.8 billion from the end of 2017 from deposits where certain large corporate customers withdrew deposits during the year, and loan balances ended 2018 at $2.0 billion, down $12.0 million from the end of 2017.
Client AUA for the trust and custody businesses as at December 31, 2018 were $46.9 billion and $16.5 billion, respectively, while AUM were $3.6 billion. This compares with $47.8 billion, $19.6 billion and $3.7 billion, respectively, as at December 31, 2017.
Cayman Islands
We are a leading financial services provider in the Cayman Islands, offering a comprehensive range of personal and corporate financial services. In addition to our strong retail presence, we are focused on the provision of wealth management services including private banking, asset management and trust services.
We have continued to enhance our client delivery channels including the newly opened Camana Bay banking branch and online and mobile banking platform upgrades. With four Banking Centers in desirable locations and 15 ATMs strategically located in Grand Cayman, we continue to be a leading provider of financial services locally. The following table provides certain financial information for our Cayman Islands segment for the years ended
December 31, 2019
,
2018
and
2017
.
|
Summary Income Statement
|
For the year ended December 31,
|
Dollar change
|
Percent change
|
||||||||||||
|
(in millions of $)
|
2019
|
2018
|
2017
|
2018 to 2019
|
2017 to 2018
|
2018 to 2019
|
2017 to 2018
|
||||||||
|
Net interest income
|
114.6
|
|
103.2
|
|
86.1
|
|
11.4
|
|
17.1
|
|
11.0
|
%
|
19.9
|
%
|
|
|
Provision for credit recoveries (losses)
|
1.9
|
|
1.3
|
|
1.0
|
|
0.6
|
|
0.3
|
|
46.2
|
%
|
30.0
|
%
|
|
|
Non-interest income
|
51.9
|
|
47.8
|
|
46.0
|
|
4.1
|
|
1.8
|
|
8.6
|
%
|
3.9
|
%
|
|
|
Net revenue before other gains (losses)
|
168.4
|
|
152.3
|
|
133.1
|
|
16.1
|
|
19.2
|
|
10.6
|
%
|
14.4
|
%
|
|
|
Operating expenses
|
(61.1
|
)
|
(60.7
|
)
|
(59.4
|
)
|
(0.4
|
)
|
(1.3
|
)
|
0.7
|
%
|
2.2
|
%
|
|
|
Net income before other gains (losses)
|
107.3
|
|
91.6
|
|
73.7
|
|
15.7
|
|
17.9
|
|
17.1
|
%
|
24.3
|
%
|
|
|
Total other gains (losses)
|
0.6
|
|
0.4
|
|
—
|
|
0.2
|
|
0.4
|
|
50.0
|
%
|
—
|
%
|
|
|
Net income
|
107.9
|
|
92.0
|
|
73.7
|
|
15.9
|
|
18.3
|
|
17.3
|
%
|
24.8
|
%
|
|
61
|
Summary Balance Sheet
|
As at December 31,
|
||||||||
|
(in millions of $)
|
2019
|
2018
|
Dollar change
|
Percent change
|
|||||
|
Customer deposits
|
3,450
|
|
3,320
|
|
130
|
|
3.9
|
%
|
|
|
Loans, net of allowance for credit losses
|
1,105
|
|
1,012
|
|
93
|
|
9.2
|
%
|
|
|
Total assets
|
3,839
|
|
3,706
|
|
133
|
|
3.6
|
%
|
|
|
Assets under administration
|
|||||||||
|
Custody and other administration services
|
2,582
|
|
2,244
|
|
338
|
|
15.1
|
%
|
|
|
Trust
|
7,723
|
|
7,700
|
|
23
|
|
0.3
|
%
|
|
|
Assets under management
|
|||||||||
|
Butterfield Funds
|
195
|
|
229
|
|
(34
|
)
|
(14.8
|
)%
|
|
|
Other assets under management
|
646
|
|
606
|
|
40
|
|
6.6
|
%
|
|
|
Total assets under management
|
841
|
|
835
|
|
6
|
|
0.7
|
%
|
|
|
Number of employees
|
296
|
|
277
|
|
19
|
|
6.9
|
%
|
|
2019
vs.
2018
Net income before other gains and losses for the year ended
December 31, 2019
was
$107.3 million
, up by
$15.7 million
from
$91.6 million
in
2018
. This increase is due principally to the following movements in net interest income, provision for credit losses, non-interest income and operating expenses.
Net interest income before provision for credit losses was
$114.6 million
in
2019
, an improvement of
$11.4 million
compared to
2018
. The increase from
2018
to
2019
was driven primarily by an improvement in investment income which was up by $8.8 million from
2018
to
2019
as a result of the increase in higher yielding investment assets. Interest income on loans also increased by $1.9 million as a result of higher loan volumes. Deposit liability costs increased from $4.2 million in
2018
to $8.4 million in
2019
as a result of higher volumes and customer rates.
Provision for credit losses was a recovery of
$1.9 million
in
2019
, representing an increase of
$0.6 million
compared to a smaller credit recovery in
2018
. This increase in recovery was due to a net specific provision release driven by a small government loan-to-debt conversion and additional releases in the general provision in
2019
.
Non-interest income was
$51.9 million
, up
$4.1 million
from
2018
due primarily to increased transactional volumes on foreign exchange transactions and to increased card service fee contributions.
Operating expenses increased by
$0.4 million
from
2018
to
2019
, to
$61.1 million
, driven primarily by higher compensation costs from increased headcount and offset by reduced property expenses due to the expiry and non-renewal of a lease.
Other gains and losses for the year ended December 31,
2019
were gains of
$0.6 million
, an increase of
$0.2 million
from gains in the prior year, which resulted primarily from investment sales as a part of the strategic repositioning of the investment portfolio.
Total assets as at December 31,
2019
were
$3.8 billion
, up
$0.1 billion
from the end of
2018
, reflecting higher total deposit levels. Net loans increased
$0.1 billion
from year-end
2018
to year-end
2019
at
$1.1 billion
due to an increase in both corporate and consumer lending.
Client AUA for the trust and custody businesses were
$7.7 billion
and
$2.6 billion
, respectively, while AUM were $
0.8 billion
at the end of
2019
. This compares with
$7.7 billion
,
$2.2 billion
and
$0.8 billion
, respectively, on December 31,
2018
.
2018
vs.
2017
Net income before other gains and losses for the year ended December 31, 2018 was $91.6 million, up by $17.9 million from $73.7 million in 2017. This increase is due principally to the following movements in net interest income, provision for credit losses, non-interest income and operating expenses.
Net interest income before provision for credit losses was $103.2 million in 2018, an improvement of $17.1 million compared to 2017. The increase from 2017 to 2018 was driven primarily by an improvement in investment income which was up by $8.1 million from 2017 to 2018 as a result of an increase in average AFS and HTM investment balances, along with a 52 basis point increase in yield. Interest income on loans also increased by $6.3 million as a result of an increase in the Cayman base rate and higher loan volumes. Deposit liability costs increased from $2.9 million in 2017 to $3.8 million in 2018 as a result of slightly higher deposit rates.
Provision for credit losses was a recovery of $1.3 million in 2018, representing a decrease of $0.3 million compared to a smaller credit recovery in 2017. This decrease was primarily a result of a larger releases from the general provision in 2018.
Non-interest income was $47.8 million, up $1.8 million from 2017 due primarily to volume driven increases in banking fees led by account service charges, wire transfer and card volumes, foreign exchange income which increased due to higher volumes and increased trust revenue from the recent acquisition.
Operating expenses increased by $1.3 million from 2017 to 2018, to $60.7 million, driven primarily by increased performance related compensation costs, property costs, costs in technology and communication, as well as increased inter-company charges.
Other gains and losses for the year ended December 31, 2018 were gains of $0.4 million, an increase of $0.4 million from small losses in the prior year, which resulted primarily from investment sales as a part of the strategic repositioning of the investment portfolio.
Total assets as at December 31, 2018 were $3.7 billion, up $0.5 billion from the end of 2017, reflecting higher total deposit levels. Net loans increased $0.1 billion from year-end 2017 to year-end 2018 at $1.0 billion due to an increase in both corporate and consumer lending.
Client AUA for the trust and custody businesses were $7.7 billion and $2.2 billion, respectively, while AUM were $0.8 billion at the end of 2018. This compares with $5.1 billion, $2.2 billion and $0.9 billion, respectively, on December 31, 2017.
62
Channel Islands and the UK
The Channel Islands and UK segment includes the jurisdictions of Guernsey, Jersey (both in the Channel Islands), and the UK. In the Channel Islands, a broad range of services are provided to private clients and financial institutions including private banking and treasury services, internet banking, wealth management and fiduciary services. The UK jurisdiction provides mortgage services for high-value residential properties. The following table provides certain financial information for our Channel Islands and the UK segment for the years ended
December 31, 2019
,
2018
and
2017
.
|
Summary Income Statement
|
For the year ended December 31,
|
Dollar change
|
Percent change
|
||||||||||||
|
(in millions of $)
|
2019
|
2018
|
2017
|
2018 to 2019
|
2017 to 2018
|
2018 to 2019
|
2017 to 2018
|
||||||||
|
Net interest income
|
47.2
|
|
34.5
|
|
23.6
|
|
12.7
|
|
10.9
|
|
36.8
|
%
|
46.2
|
%
|
|
|
Provision for credit recoveries (losses)
|
1.4
|
|
(1.1
|
)
|
0.2
|
|
2.5
|
|
(1.3
|
)
|
(227.3
|
)%
|
(650.0
|
)%
|
|
|
Non-interest income
|
34.3
|
|
26.8
|
|
24.4
|
|
7.5
|
|
2.4
|
|
28.0
|
%
|
9.8
|
%
|
|
|
Net revenue before other gains (losses)
|
82.9
|
|
60.2
|
|
48.2
|
|
22.7
|
|
12.0
|
|
37.7
|
%
|
24.9
|
%
|
|
|
Operating expenses
|
(74.2
|
)
|
(50.4
|
)
|
(43.8
|
)
|
(23.8
|
)
|
(6.6
|
)
|
47.2
|
%
|
15.1
|
%
|
|
|
Net income before other gains (losses)
|
8.7
|
|
9.8
|
|
4.4
|
|
(1.1
|
)
|
5.4
|
|
(11.2
|
)%
|
122.7
|
%
|
|
|
Total other gains (losses)
|
—
|
|
(1.2
|
)
|
(1.5
|
)
|
1.2
|
|
0.3
|
|
(100.0
|
)%
|
(20.0
|
)%
|
|
|
Net income
|
8.7
|
|
8.6
|
|
2.9
|
|
0.1
|
|
5.7
|
|
1.2
|
%
|
196.6
|
%
|
|
|
Summary Balance Sheet
|
As at December 31,
|
||||||||
|
(in millions of $)
|
2019
|
2018
|
Dollar change
|
Percent change
|
|||||
|
Customer deposits
|
4,554
|
|
1,603
|
|
2,951
|
|
184.1
|
%
|
|
|
Loans, net of allowance for credit losses
|
2,025
|
|
1,081
|
|
944
|
|
87.3
|
%
|
|
|
Total assets
|
5,108
|
|
1,967
|
|
3,141
|
|
159.7
|
%
|
|
|
Assets under administration
|
|||||||||
|
Custody and other administration services
|
12,506
|
|
6,282
|
|
6,224
|
|
99.1
|
%
|
|
|
Trust
|
20,417
|
|
21,490
|
|
(1,073
|
)
|
(5.0
|
)%
|
|
|
Assets under management
|
|||||||||
|
Butterfield Funds
|
65
|
|
55
|
|
10
|
|
18.2
|
%
|
|
|
Other assets under management
|
760
|
|
321
|
|
439
|
|
136.8
|
%
|
|
|
Total assets under management
|
825
|
|
376
|
|
449
|
|
119.4
|
%
|
|
|
Number of employees
|
425
|
|
331
|
|
94
|
|
28.4
|
%
|
|
2019
vs.
2018
Our Channel Islands and UK segment posted net income before gains and losses of
$8.7 million
in
2019
, a decrease of
$1.1 million
when compared to
2018
. This movement is due principally to the following movements in net interest income, provision for credit losses, non-interest income and operating expenses.
Net interest income before provision for credit losses increased by
$12.7 million
to
$47.2 million
in
2019
, compared to
$34.5 million
in
2018
, primarily due to $15.1 million increase in loan interest income and $15.1 million increase in deposits with banks interest income due to additional funding as a result of the ABN AMRO (Channel Islands) acquisition. Partially offsetting this was a $18.9 million increase in interest expense, principally from deposit funding from the ABN AMRO (Channel Islands) acquisition.
Provision for credit losses was a recovery of
$1.4 million
, compared to an expense of
$1.1 million
in
2018
due to the reversal of Brexit economic factors that were no longer supported and reduced historical rates.
Non-interest income increased by
$7.5 million
to
$34.3 million
in
2019
, attributable to the impact of the late-2018 onboarding of Deutsche Bank clients as well as the ABN AMRO (Channel Islands) acquisition.
Operating expenses of
$74.2 million
in
2019
were
$23.8 million
higher than
2018
, principally due to increased salaries and other staff benefits from a higher headcount as a result of the ABN AMRO acquisition, increased property expenses from ABN AMRO staff occupying a separate building as well as higher technology expenses from increased infrastructure investment and to accommodate the other elements of the ABN AMRO acquisition.
Other gains for
2019
saw an improvement of
$1.2 million
compared to
2018
. Losses in
2018
reflected a non-core settlement loss on a defined benefit pension plan.
Total assets of
$5.1 billion
as at December 31,
2019
, an increase from
$2.0 billion
as at December 31,
2018
primarily from the ABN AMRO (Channel Islands) acquisition as well as an increase in new residential loan origination in the UK.
At the end of
2019
, client AUA for the trust and custody businesses were
$20.4 billion
and
$12.5 billion
, respectively, while AUM were
$0.8 billion
. This compares with
$21.5 billion
,
$6.3 billion
and
$0.4 billion
, respectively, as at December 31,
2018
.
2018
vs.
2017
63
Our Channel Islands and the UK segment posted net income before gains and losses of $9.8 million in 2018, an increase of $5.4 million when compared to 2017. This movement is due principally to the following movements in net interest income, provision for credit losses, non-interest income and operating expenses.
Net interest income before provision for credit losses increased by $10.9 million to $34.5 million in 2018, compared to $23.6 million in 2017, primarily due a $10.4 million increase in loan interest income, due to increased loans underwritten in the UK jurisdiction which were funded by the Guernsey jurisdiction. Partially offsetting this was a $4.7 million increase in interest expense, principally from a 22 basis point increase in the cost of deposits from increased rates on term deposits.
Provision for credit losses was an expense of $1.1 million, compared to an expense of $0.2 million in 2017 due to increased general provisioning rates on UK exposures compared to the prior year together with a specific provision raised in Guernsey of $0.8 million.
Non-interest income decreased by $2.4 million to $26.8 million in 2018, attributable to an increase in trust revenue predominantly as a result of new revenues generated from clients acquired from the recent acquisition.
Operating expenses of $50.4 million in 2018 were $6.6 million higher than 2017, principally due to increased salaries and other staff benefits from a higher headcount as a result of the recent acquisitions and increased discretionary incentive costs. Augmenting this was higher technology expenses from increased infrastructure investment to set up the Jersey jurisdiction and to accommodate the other elements of the recent acquisition.
Other losses for 2018 were $1.2 million, an improvement by $0.3 million compared to net losses of $1.5 million in 2017. Losses in 2018 reflected non-core settlement loss on a defined benefit pension plan, while losses in 2017 reflected purchase price adjustments during the earn-out period of the Legis transaction recorded in 2017. Net income after gains and losses was $8.6 million in 2017, an increase of $5.7 million from $2.9 million in 2017.
Total assets of $2.0 billion as at December 31, 2018, an increase from $1.6 billion as at December 31, 2017 primarily from an increase in customer deposits, principally in the Jersey jurisdiction and loan origination growth from the UK jurisdiction, which was funded by Guernsey.
At the end of 2018, client AUA for the trust and custody businesses were $21.5 billion and $6.3 billion, respectively, while AUM were $0.4 billion. This compares with $26.5 billion, $5.8 billion and $0.4 billion, respectively, as at December 31, 2017.
Critical Accounting Policies and Estimates
The Bank's significant accounting policies conform to GAAP and are described in Note 2 of our audited consolidated financial statements. Various elements of our accounting policies, by their nature, are inherently subject to estimation techniques, valuation assumptions and other subjective assessments. Given the sensitivity of our consolidated financial statements to these critical accounting policies, the use of other judgments, estimates and assumptions could result in material differences in our results of operations or financial condition. Details of certain critical policies and estimates that affect our business results are summarized below:
Allowance for Credit Losses
We maintain an allowance for credit losses, which in management's opinion is adequate to absorb all estimated credit-related losses in our lending and off-balance sheet credit-related arrangements at the balance sheet date.
The allowance for credit losses could be affected by a variety of internal and external factors. Internal factors include portfolio performance such as delinquency levels, assigned risk ratings, the mix and level of loan balances, differing economic risks associated with each loan category and the financial condition of specific borrowers. External factors include fluctuations in the general economy, unemployment rates, bankruptcy filings, developments within a particular industry, changes in collateral values and factors particular to a specific commercial credit such as competition, business and management performance. The allowance for credit losses may be adjusted to reflect our current assessment of various qualitative risks, factors and events that may not be measured in our statistical procedures. There is no certainty that the allowance for credit losses will be appropriate over time to cover losses because of unanticipated adverse changes in any of these internal, external or qualitative factors.
For non-accrual loans and loans modified in a Troubled Debt Restructuring ("TDR"), we conduct specific analysis on a loan level basis to determine the probable amount of credit loss. If appropriate, a specific allowance is established for the loan through a charge to the provision for credit losses. For all classes of impaired loans, if the expected realizable value of the impaired loan is less than the recorded investment in the loan, impairment is recognized through an allowance estimate. If we determine that part of the allowance is uncollectible, in such cases, the provision for credit losses is not affected when a specific reserve for at least that amount already exists. Techniques utilized include comparing the loan's carrying amount to the estimated present value of its future cash flows or the fair value of its underlying collateral, or the loan's observable market price.
Even minor changes in the level of estimated losses can significantly affect management's determination of the appropriate allowance because those changes must be applied across a large portfolio. To illustrate, an increase in estimated losses equal to one percent of our residential mortgage loan portfolio would result in a
$32.2 million
increase in the allowance, and a corresponding decrease to net income, or a
$0.61
decrease in basic earnings per common share. The same increase in estimated losses for the commercial loan and commercial mortgage portfolio would result in a
$16.9 million
increase in the allowance and a corresponding decrease to net income, or a
$0.32
decrease in basic earnings per common share. Such adjustments to the allowance for credit losses can materially affect financial results.
Determination of the allowance for credit losses is inherently subjective. It requires significant estimates including the amounts and timing of expected future cash flows on impaired loans, appraisal values of underlying collateral for collateralized loans, and the amount of estimated losses on pools of homogeneous loans which is based on historical loss experience and consideration of current economic trends, all of which may be susceptible to significant change.
Recognition of Other-Than-Temporary Impairments on Investments
For debt securities, we consider a decline in fair value to be other-than-temporary when it does not expect to recover the entire amortized cost basis of the security. Investments in debt securities in unrealized loss positions are analyzed as part of our ongoing assessment of OTTI. When we intend to sell such securities or it is more likely than not that we will be required to sell the securities before recovering the amortized cost, we recognize an impairment loss equal to the full difference between the amortized cost basis and the fair value of those securities. When we do not intend to sell or it is more likely than not that we will hold such securities until recovering the amortized cost, we determine whether any credit losses exist to identify any OTTI.
In situations where there is a credit loss, only the amount of impairment relating to credit losses on AFS and HTM investments is recognized in net income. The degree of judgment involved in determining the recoverable value of an investment security is dependent upon the availability of observable market prices or observable market parameters. When observable market prices and parameters do not exist, judgment is necessary to estimate recoverable value which gives rise to added uncertainty in the
64
assessment. The assessment takes into consideration factors such as interest rate changes, movements in credit spreads. We believe that the amount that has been recognized in net income has been a historically accurate estimate of the amount of impairment relating to credit losses on these investments.
Our valuations may include inputs and assumptions that are less observable or require greater estimation, thereby resulting in values which may be greater or lower than the actual value at which the investments may be ultimately sold or the ultimate cash flows that may be recovered. If the assumptions on which we base our valuations change, we may experience additional OTTI or realized losses or gains, and the period-to-period changes in value could vary significantly.
Fair Values
We define fair value as the exchange price that would be received for an asset or paid to transfer a liability (an exit price) in the principal or most advantageous market for the asset or liability in an orderly transaction between market participants on the measurement date. We determine the fair values of assets and liabilities based on the fair value hierarchy which requires an entity to maximize the use of observable inputs and minimize the use of unobservable inputs when measuring fair value. The relevant accounting standard describes three levels of inputs that may be used to measure fair value. Investments classified as trading and AFS, and derivative assets and liabilities are recognized in the consolidated balance sheet at fair value.
Fair value inputs are considered Level 1 when based on unadjusted quoted prices in active markets for identical assets.
We determine fair value based on quoted market prices, where available. If quoted prices are not available, fair value is estimated based upon other observable inputs, and may include valuation techniques such as present value cash flow models or other conventional valuation methods. In addition, when estimating the fair value of assets, we may use the quoted price of similar assets, if available.
We use unobservable inputs when observable inputs are not available. These inputs are based upon our judgments and assumptions, which represent our assessment of the assumptions market participants would use in pricing the asset or liability, which may include assumptions about risk, counterparty credit quality and liquidity and are developed based on the best information available. The use of different assumptions could produce significantly different results, which could have material positive or negative effects on the Bank's results of operations.
Significant assets measured at fair value on a recurring basis include our US government and federal agencies investments, corporate debt securities, and commercial mortgage-backed securities. The fair values of these instruments are generally sourced from an external pricing service and are classified as Level 2 within the fair value hierarchy. The service's pricing models use predominantly observable valuation inputs to measure the fair value of these securities under both the market and income approaches.
Fair value is also used on a nonrecurring basis to evaluate certain assets for impairment or for disclosure purposes. Examples of nonrecurring uses of fair value include OREO, loan impairments for certain loans and goodwill.
We review and update the fair value hierarchy classifications on a quarterly basis. We also verify the accuracy of the pricing provided by our primary external pricing service on a quarterly basis.
There were no transfers between Level 1 and Level 2 during the years ended
December 31, 2019
and
2018
.
Refer to
Note 18: Fair value measurements
of the audited consolidated financial statements for further detail on the judgments made in classifying instruments in the fair value hierarchy.
Goodwill
We account for acquisitions using the acquisition method of accounting, under which the acquired company's net assets are recorded at fair value at the date of the acquisition and the difference between the fair value of consideration and fair value of the net assets acquired is recorded as goodwill, if positive, and as bargain purchase gain, if negative.
Goodwill is tested annually in the third quarter for impairment at the reporting unit level, or more frequently if events or circumstances indicate there may be impairment. The goodwill impairment analysis is a two-step test. The first step, used to identify potential impairment, involves comparing each reporting unit's fair value to its carrying value including goodwill. If the fair value of a reporting unit exceeds its carrying value, applicable goodwill is deemed to be not impaired. If the carrying value exceeds fair value, there is an indication of impairment and the second step is performed to measure the amount of impairment.
The second step involves calculating an implied fair value of goodwill for each reporting unit for which the first step indicated impairment. The implied fair value of goodwill is determined in the same manner as the amount of goodwill recognized in a business combination, which is the excess of the fair value of the reporting unit, as determined in the first step, over the aggregate fair values of the individual assets, liabilities and identifiable intangible assets as if the reporting unit were being acquired in a business combination. If the implied fair value of goodwill exceeds the carrying value of goodwill assigned to the reporting unit, there is no impairment. If the carrying value of goodwill assigned to a reporting unit exceeds the implied fair value of the goodwill, an impairment charge is recorded for the excess. An impairment loss recognized cannot exceed the amount of goodwill assigned to a reporting unit, and the loss establishes a new basis in the goodwill. Subsequent reversal of goodwill impairment losses is not permitted.
We rely on several assumptions when estimating the fair value of our reporting units using the discounted cash flow method. These assumptions include the estimated future cash flows from operations, required discount rate, as well as projected loan losses, an estimate of terminal value and other inputs. Our estimated future cash flows are largely based on our historical actual cash flows and industry and economic trends, among other considerations. Although management has used the estimates and assumptions it believes to be most appropriate in the circumstances, it should be noted that even relatively minor changes in certain valuation assumptions used in management's calculation would result in significant differences in the results of the impairment test.
The valuation of goodwill is dependent on forward-looking expectations related to nationwide and local economic conditions and our associated financial performance. In the future, if our acquisitions do not yield expected returns or there are changes in discount rates, we may be required to take additional charges to our earnings based on the impairment assessment process, which could harm our business, financial condition, results of operations and prospects. We had
$24.8 million
as of
December 31, 2019
and
$24.0 million
as of
December 31, 2018
of goodwill, and the results of the impairment analysis for both annual periods resulted in no impairment being required.
65
Employee Future Benefits
We maintain trusteed pension plans for substantially all employees as either non-contributory defined benefit plans or defined contribution plans. Benefits under the defined benefit plans are primarily based on the employee's years of credited service and average annual salary during the final years of employment as defined in the plans. We also provide post-retirement medical benefits for certain qualifying active and retired Bermuda-based employees.
The calculations of the amounts recorded require the use of various actuarial assumptions, such as discount rates, assumed rates of return on plan assets, compensation increases, and turnover rates. We review our actuarial assumptions on an annual basis and make modifications to the assumptions based on current rates and trends when appropriate. We believe that the assumptions used in recording our defined benefit plan obligations are reasonable based on our experience and advice from our actuaries.
The post-retirement medical benefits obligation is determined using our assumptions regarding health care cost trend rates. The health care trend rates are developed based on historical cost data, the near-term outlook on health care trends and the likely long-term trends.
In accordance with GAAP, actual results that differ from the assumptions are accumulated and amortized over future periods and, therefore, generally affect recognized expense and the recorded obligation of future periods. While management believes that the assumptions used are appropriate, differences in actual experience or changes in assumptions may affect the defined benefit obligations and future expense.
See
Note 11: Employee benefit plans
to our audited consolidated financial statements as at
December 31, 2019
for more information on our pension plans and post-retirement medical benefit plan, along with the key actuarial assumptions.
Share-based Payments
We engage in equity settled share-based payment transactions in respect of services received from eligible employees. The fair value of the services received is measured by reference to the fair value of the shares or share options granted on the date of the grant. The cost of the employee services received in respect of the shares or share options granted is recognized in the consolidated statements of operations over the shorter of the vesting or service period.
The fair value of the options granted is determined using option pricing models, which take into account the exercise price of the option, the current share price, the risk-free interest rate, expected dividend rate, the expected volatility of the share price over the life of the option and other relevant factors. The fair value of unvested share awards is deemed to be the closing price of the publicly traded Bank shares on grant date. The fair value of time vesting conditions are taken into account by adjusting the number of shares or share options included in the measurement of the cost of employee services so that ultimately, the amount recognized in the consolidated statements of operations reflects the number of vested shares or share options. The Bank recognizes compensation cost for awards with performance conditions if and when the Bank concludes that it is probable that the performance condition will be achieved, net of an estimate of pre-vesting forfeitures (e.g., due to termination of employment prior to vesting).
See
Note 22: Share-based payments
to our audited consolidated financial statements as at
December 31, 2019
for more information on share-based payments.
Business Combinations
All business combinations are accounted for using the acquisition method. Identifiable intangible assets (mostly customer relationships) are recognized separately from goodwill and are initially valued at fair value using discounted cash flow calculations and other recognized valuation techniques. Goodwill represents the excess of the fair value of the consideration paid for the acquisition of a business over the fair value of the net assets acquired. Contingent purchase consideration is measured at its fair value and recorded on the purchase date. Any subsequent changes in the fair value of a contingent consideration liability will be recorded through the consolidated statements of operations.
See
Note 27: Business combinations
to our audited consolidated financial statements as at
December 31, 2019
for more information on business combinations.
66
SELECTED STATISTICAL DATA
Distribution of Assets, Liabilities and Shareholders' Equity; Interest Rates and Interest Differential
Average Balance Sheet and Interest Rates
The following table presents average consolidated balance sheets and net interest income for the years indicated:
|
For the year ended December 31
|
|||||||||||||||||||||
|
2019
|
2018
|
2017
|
|||||||||||||||||||
|
(in millions of $)
|
Average
balance
|
Interest
income
(expense)
|
Average
yield/
rate
|
Average
balance
|
Interest
income (expense) |
Average
yield/
rate
|
Average
balance |
Interest
income (expense) |
Average
yield/ rate |
||||||||||||
|
Assets
|
|
|
|
|
|
|
|
|
|
|
|
||||||||||
|
Cash due from banks — Interest bearing
|
2,818.4
|
|
35.9
|
|
1.27
|
%
|
1,770.4
|
|
21.8
|
|
1.23
|
%
|
1,990.2
|
|
14.5
|
|
0.73
|
%
|
|||
|
Securities purchased under agreement to resell
|
39.6
|
|
1.2
|
|
3.04
|
%
|
72.0
|
|
1.9
|
|
2.59
|
%
|
70.2
|
|
1.3
|
|
1.85
|
%
|
|||
|
Short-term investments
|
375.2
|
|
4.5
|
|
1.20
|
%
|
134.8
|
|
1.2
|
|
0.89
|
%
|
312.3
|
|
1.4
|
|
0.44
|
%
|
|||
|
Equity securities at fair value
|
1.2
|
|
—
|
|
—
|
|
1.1
|
|
—
|
|
—
|
|
0.9
|
|
—
|
|
—
|
|
|||
|
Available-for-sale
|
2,247.3
|
|
60.7
|
|
2.70
|
%
|
2,774.2
|
|
68.9
|
|
2.48
|
%
|
3,315.5
|
|
65.3
|
|
1.97
|
%
|
|||
|
Held-to-maturity
|
2,226.3
|
|
68.7
|
|
3.09
|
%
|
1,803.6
|
|
55.3
|
|
3.07
|
%
|
1,257.5
|
|
36.1
|
|
2.87
|
%
|
|||
|
Investment in securities
(1)
|
4,474.9
|
|
129.4
|
|
2.89
|
%
|
4,578.9
|
|
124.3
|
|
2.71
|
%
|
4,573.9
|
|
101.4
|
|
2.22
|
%
|
|||
|
Commercial loans
|
1,412.0
|
|
80.9
|
|
5.73
|
%
|
1,323.2
|
|
76.3
|
|
5.76
|
%
|
1,230.9
|
|
60.8
|
|
4.93
|
%
|
|||
|
Consumer loans
|
2,957.5
|
|
153.1
|
|
5.18
|
%
|
2,672.6
|
|
142.2
|
|
5.31
|
%
|
2,434.9
|
|
126.3
|
|
5.18
|
%
|
|||
|
Total loans, net of allowance for credit losses
(2)
|
4,369.5
|
|
234.0
|
|
5.36
|
%
|
3,995.8
|
|
218.5
|
|
5.46
|
%
|
3,665.8
|
|
187.0
|
|
5.09
|
%
|
|||
|
Interest-earning assets
|
12,077.6
|
|
405.1
|
|
3.35
|
%
|
10,552.0
|
|
367.6
|
|
3.48
|
%
|
10,612.4
|
|
305.6
|
|
2.88
|
%
|
|||
|
Other assets
|
371.5
|
|
350.7
|
|
346.0
|
|
|||||||||||||||
|
Total assets
|
12,449.1
|
|
10,902.7
|
|
|
|
10,958.4
|
|
|||||||||||||
|
Liabilities
|
|||||||||||||||||||||
|
Customer deposits
|
8,822.4
|
|
(50.3
|
)
|
(0.57
|
)%
|
7,352.8
|
|
(16.6
|
)
|
(0.23
|
)%
|
7,419.6
|
|
(10.2
|
)
|
(0.14
|
)%
|
|||
|
Bank deposits
|
29.1
|
|
(1.2
|
)
|
(4.11
|
)%
|
23.0
|
|
(1.0
|
)
|
(4.22
|
)%
|
25.5
|
|
(0.8
|
)
|
(3.01
|
)%
|
|||
|
Interest bearing deposits
|
8,851.5
|
|
(51.5
|
)
|
(0.58
|
)%
|
7,375.8
|
|
(17.6
|
)
|
(0.24
|
)%
|
7,445.0
|
|
(10.9
|
)
|
(0.15
|
)%
|
|||
|
Securities sold under agreement to repurchase
|
0.7
|
|
—
|
|
(2.12
|
)%
|
1.6
|
|
—
|
|
(2.11
|
)%
|
—
|
|
—
|
|
—
|
%
|
|||
|
Long-term debt
|
143.4
|
|
(7.9
|
)
|
(5.49
|
)%
|
133.4
|
|
(6.9
|
)
|
(5.21
|
)%
|
117.0
|
|
(5.0
|
)
|
(4.23
|
)%
|
|||
|
Interest bearing liabilities
|
8,995.5
|
|
(59.4
|
)
|
(0.66
|
)%
|
7,510.8
|
|
(24.6
|
)
|
(0.33
|
)%
|
7,562.0
|
|
(15.9
|
)
|
(0.21
|
)%
|
|||
|
Non-interest bearing current accounts
|
2,147.2
|
|
2,231.8
|
|
2,393.1
|
|
|||||||||||||||
|
Other liabilities
|
310.4
|
|
281.0
|
|
254.4
|
|
|||||||||||||||
|
Total liabilities
|
11,453.1
|
|
10,023.7
|
|
10,209.6
|
|
|||||||||||||||
|
Shareholders' equity
|
995.9
|
|
879.0
|
|
748.9
|
|
|||||||||||||||
|
Total liabilities and shareholders' equity
|
12,449.1
|
|
10,902.7
|
|
10,958.4
|
|
|||||||||||||||
|
Non-interest bearing funds net of non-interest-earning assets (free balance)
|
1,775.7
|
|
1,881.1
|
|
2,047.1
|
|
|||||||||||||||
|
Net interest margin
|
345.7
|
|
2.86
|
%
|
343.0
|
|
3.25
|
%
|
289.7
|
|
2.73
|
%
|
|||||||||
|
Net interest spread
|
2.74
|
%
|
3.13
|
%
|
2.63
|
%
|
|||||||||||||||
|
Ratio of average interest earning asset/ interest bearing liabilities
|
134.3
|
%
|
140.5
|
%
|
140.3
|
%
|
|||||||||||||||
______________________________
|
(1)
|
Yields are based on average historical costs and yields on securities held in income tax exempt jurisdictions are not computed on a tax-equivalent yield basis.
|
|
(2)
|
Interest income and rates on loans include loan fees. Additionally, average non-accrual loans were included in the average loan balances used to determine the average yield on loans in all of the periods presented.
|
67
Analysis of Changes in Volume and Rate on Interest Income and Interest Expense
The following table presents the amount of changes in interest income and interest expense from
December 31, 2018
to
December 31, 2019
and from
December 31, 2017
to
December 31, 2018
, due to changes in both average volume and average rate. Changes not solely due to volume or rate have been allocated to volume.
|
2019 compared to 2018
|
2018 compared to 2017
|
|||||||||||||
|
(in millions of $)
|
Increase/
(Decrease)
due to
Changes in
|
Net
Increase/
(Decrease)
|
Increase/
(Decrease)
due to
Changes in
|
Net
Increase/
(Decrease)
|
||||||||||
|
Volume
|
|
Rate
|
|
|
|
Volume
|
|
Rate
|
|
|
|
|||
|
Interest income related to:
|
|
|
|
|
|
|
|
|
|
|
|
|
||
|
Cash due from banks — Interest bearing
|
13.36
|
|
0.80
|
|
14.16
|
|
(2.70
|
)
|
9.98
|
|
7.28
|
|
||
|
Securities purchased under agreement to resell
|
(0.99
|
)
|
0.32
|
|
(0.66
|
)
|
0.05
|
|
0.52
|
|
0.57
|
|
||
|
Short-term investments
|
2.88
|
|
0.42
|
|
3.30
|
|
(1.57
|
)
|
1.38
|
|
(0.19
|
)
|
||
|
Equity securities at fair value
|
—
|
|
—
|
|
—
|
|
—
|
|
—
|
|
—
|
|
||
|
Available-for-sale
|
(14.23
|
)
|
5.98
|
|
(8.25
|
)
|
(13.45
|
)
|
17.08
|
|
3.64
|
|
||
|
Held-to-maturity
|
13.05
|
|
0.36
|
|
13.41
|
|
16.75
|
|
2.44
|
|
19.19
|
|
||
|
Total investment in securities
(1)
|
(1.18
|
)
|
6.34
|
|
5.16
|
|
3.30
|
|
19.53
|
|
22.83
|
|
||
|
Commercial loans
|
5.09
|
|
(0.51
|
)
|
4.58
|
|
5.33
|
|
10.25
|
|
15.58
|
|
||
|
Consumer loans
|
14.75
|
|
(3.80
|
)
|
10.96
|
|
12.64
|
|
3.25
|
|
15.90
|
|
||
|
Total loans, net of allowance for credit losses
(2)
|
19.84
|
|
(4.30
|
)
|
15.54
|
|
17.97
|
|
13.51
|
|
31.47
|
|
||
|
Total interest-earning assets
|
33.91
|
|
3.58
|
|
37.49
|
|
17.05
|
|
44.91
|
|
61.96
|
|
||
|
Interest expenses related to:
|
||||||||||||||
|
Customer deposits
|
(8.38
|
)
|
(25.27
|
)
|
(33.65
|
)
|
0.15
|
|
(6.63
|
)
|
(6.48
|
)
|
||
|
Bank deposits
|
(0.25
|
)
|
0.03
|
|
(0.22
|
)
|
0.10
|
|
(0.31
|
)
|
(0.21
|
)
|
||
|
Securities sold under agreement to repurchase
|
0.02
|
|
—
|
|
0.02
|
|
(0.03
|
)
|
—
|
|
(0.03
|
)
|
||
|
Long-term debt
|
(0.55
|
)
|
(0.38
|
)
|
(0.93
|
)
|
(0.86
|
)
|
(1.14
|
)
|
(1.99
|
)
|
||
|
Total interest bearing liabilities
|
(9.15
|
)
|
(25.63
|
)
|
(34.78
|
)
|
(0.63
|
)
|
(8.08
|
)
|
(8.71
|
)
|
||
|
Change in net interest income
|
24.76
|
|
(22.05
|
)
|
2.71
|
|
16.41
|
|
36.83
|
|
53.25
|
|
||
______________________________
|
(1)
|
Yields are based on average historical costs and yields on securities held in income tax exempt jurisdictions are not computed on a tax-equivalent yield basis.
|
|
(2)
|
Interest income and rates on loans include loan fees. Additionally, average non-accrual loans were included in the average loan balances used to determine the average yield on loans in all of the periods presented.
|
68
Investment Portfolio
The following table sets forth the composition of our debt and equity securities as at the dates indicated measured at amortized cost or fair value. See Note 5 "Investment in securities" to our audited consolidated financial statements as at and for the year ended
December 31, 2019
and
2018
, included elsewhere in this report for further discussion.
|
As at
December 31
|
|||||||||
|
(in millions of $)
|
2019
|
2018
|
2017
|
||||||
|
Equity securities
|
|
|
|
|
|||||
|
Mutual funds
|
7.4
|
|
6.5
|
|
6.8
|
|
|||
|
Total equity securities
|
7.4
|
|
6.5
|
|
6.8
|
|
|||
|
Available-for-sale
|
|
|
|
|
|||||
|
US government and federal agencies
|
2,052.4
|
|
1,786.5
|
|
2,709.1
|
|
|||
|
Non-US governments debt securities
|
25.7
|
|
25.4
|
|
26.2
|
|
|||
|
Corporate debt securities
|
—
|
|
78.7
|
|
243.4
|
|
|||
|
Asset-backed securities — Student loans
|
12.9
|
|
12.6
|
|
12.5
|
|
|||
|
Commercial mortgage-backed securities
|
—
|
|
123.2
|
|
141.5
|
|
|||
|
Residential mortgage-backed securities
|
129.3
|
|
156.3
|
|
184.7
|
|
|||
|
Total available-for-sale
|
2,220.3
|
|
2,182.7
|
|
3,317.4
|
|
|||
|
Held-to-maturity
|
|
|
|
|
|||||
|
US government and federal agencies
|
2,208.7
|
|
2,066.1
|
|
1,382.0
|
|
|||
|
Total held-to-maturity
|
2,208.7
|
|
2,066.1
|
|
1,382.0
|
|
|||
|
Total investment in securities
|
4,436.4
|
|
4,255.4
|
|
4,706.2
|
|
|||
The following table presents an analysis of remaining contractual maturities and weighted average yields for interest bearing securities as at
December 31, 2019
. Yields on tax-exempt obligations have been computed on a tax-equivalent basis.
|
Remaining term to maturity
|
||||||||||||||||||
|
(in millions of $)
|
Within
1 year
|
1 to 5
years
|
5 to 10
years
|
Over 10
years
|
No specific
maturity
|
Total
|
||||||||||||
|
Equity securities
|
|
|
|
|
|
|
|
|
|
|
||||||||
|
Mutual funds
|
—
|
|
—
|
|
—
|
|
—
|
|
7.4
|
|
7.4
|
|
||||||
|
Total equity securities
|
—
|
|
—
|
|
—
|
|
—
|
|
7.4
|
|
7.4
|
|
||||||
|
Available-for-sale
|
|
|
|
|
|
|
|
|
|
|
||||||||
|
US government and federal agencies
|
—
|
|
—
|
|
—
|
|
—
|
|
2,052.4
|
|
2,052.4
|
|
||||||
|
Non-US governments debt securities
|
—
|
|
22.4
|
|
3.2
|
|
—
|
|
—
|
|
25.6
|
|
||||||
|
Asset-backed securities — Student loans
|
—
|
|
—
|
|
—
|
|
—
|
|
12.9
|
|
12.9
|
|
||||||
|
Residential mortgage-backed securities
|
—
|
|
—
|
|
—
|
|
—
|
|
129.3
|
|
129.3
|
|
||||||
|
Total available-for-sale
|
—
|
|
22.4
|
|
3.2
|
|
—
|
|
2,194.7
|
|
2,220.3
|
|
||||||
|
Held-to-maturity
|
|
|
|
|
|
|
|
|
|
|||||||||
|
US government and federal agencies
|
—
|
|
—
|
|
—
|
|
—
|
|
2,208.7
|
|
2,208.7
|
|
||||||
|
Total held-to-maturity
|
—
|
|
—
|
|
—
|
|
—
|
|
2,208.7
|
|
2,208.7
|
|
||||||
|
Total investment in securities
|
—
|
|
22.4
|
|
3.2
|
|
—
|
|
4,410.7
|
|
4,436.4
|
|
||||||
|
Weighted average yield
(1)
|
—
|
%
|
4.82
|
%
|
7.23
|
%
|
—
|
%
|
3.06
|
%
|
3.07
|
%
|
||||||
___________
|
(1)
|
Yields are based on average historical costs and yields on securities held in income tax exempt jurisdictions are not computed on a tax-equivalent yield basis.
|
As at December 31,
2019
, no investment other than securities of the US Government and US Government agencies exceeded 10% of shareholders' equity.
69
Loan Portfolio
Composition of the Loan Portfolio
The following table shows the composition of the Group's loan portfolio by type of loan as of the dates indicated. See Note 6 "Loans" to our audited consolidated financial statements included elsewhere in this report for further discussion of our loan portfolio inclusive of the Bank's policies for placing loans on a non-accrual status.
|
As at December 31
|
|||||||||||||||
|
2019
|
2018
|
2017
|
2016
|
2015
|
|||||||||||
|
Government
|
370.8
|
|
105.7
|
|
153.4
|
|
112.4
|
|
225.2
|
|
|||||
|
Commercial and industrial
|
535.7
|
|
513.9
|
|
371.0
|
|
331.9
|
|
342.7
|
|
|||||
|
Commercial overdrafts
|
28.5
|
|
33.1
|
|
21.5
|
|
25.4
|
|
40.7
|
|
|||||
|
Total commercial loans
|
935.0
|
|
652.6
|
|
545.9
|
|
469.6
|
|
608.6
|
|
|||||
|
Specific allowance for credit losses on commercial loans
|
(4.9
|
)
|
(4.5
|
)
|
(2.9
|
)
|
(0.6
|
)
|
(0.6
|
)
|
|||||
|
Total commercial loans after specific allowance for credit loss
|
930.1
|
|
648.1
|
|
543.0
|
|
469.0
|
|
608.0
|
|
|||||
|
Commercial mortgage
|
659.3
|
|
497.0
|
|
535.8
|
|
581.6
|
|
665.3
|
|
|||||
|
Construction
|
94.9
|
|
78.7
|
|
48.2
|
|
28.9
|
|
13.6
|
|
|||||
|
Total commercial real estate loans
|
754.2
|
|
575.7
|
|
584.1
|
|
610.5
|
|
678.9
|
|
|||||
|
Specific allowance for credit losses on commercial real estate loans
|
(0.5
|
)
|
(0.6
|
)
|
(0.6
|
)
|
(0.8
|
)
|
(2.9
|
)
|
|||||
|
Total commercial real estate loans after specific allowance for credit losses
|
753.8
|
|
575.1
|
|
583.5
|
|
609.7
|
|
676.0
|
|
|||||
|
Automobile financing
|
21.5
|
|
20.2
|
|
19.3
|
|
20.0
|
|
19.9
|
|
|||||
|
Credit card
|
87.7
|
|
84.1
|
|
79.0
|
|
78.5
|
|
78.9
|
|
|||||
|
Overdrafts
|
7.9
|
|
12.9
|
|
8.4
|
|
5.6
|
|
13.0
|
|
|||||
|
Other consumer
|
140.1
|
|
63.5
|
|
81.0
|
|
94.0
|
|
116.1
|
|
|||||
|
Total consumer loans
|
257.1
|
|
180.6
|
|
187.7
|
|
198.1
|
|
227.9
|
|
|||||
|
Specific allowance for credit losses on consumer loans
|
(0.7
|
)
|
(0.3
|
)
|
(0.3
|
)
|
(0.3
|
)
|
(0.3
|
)
|
|||||
|
Total consumer loans after specific allowance for credit losses
|
256.5
|
|
180.4
|
|
187.4
|
|
197.8
|
|
227.5
|
|
|||||
|
Residential mortgage loans
|
3,219.8
|
|
2,660.0
|
|
2,494.7
|
|
2,336.6
|
|
2,534.0
|
|
|||||
|
Specific allowance for credit losses on residential mortgage loans
|
(11.6
|
)
|
(9.6
|
)
|
(9.9
|
)
|
(10.2
|
)
|
(15.3
|
)
|
|||||
|
Total residential mortgage loans after specific allowance for credit losses
|
3,208.2
|
|
2,650.4
|
|
2,484.8
|
|
2,326.4
|
|
2,518.7
|
|
|||||
|
Total gross loans
|
5,166.2
|
|
4,069.0
|
|
3,812.3
|
|
3,614.7
|
|
4,049.5
|
|
|||||
|
Specific allowance for credit losses
|
(17.7
|
)
|
(14.9
|
)
|
(13.7
|
)
|
(11.8
|
)
|
(19.1
|
)
|
|||||
|
General allowance for credit losses
|
(5.9
|
)
|
(10.2
|
)
|
(21.8
|
)
|
(32.6
|
)
|
(30.2
|
)
|
|||||
|
Net loans
|
5,142.6
|
|
4,043.9
|
|
3,776.9
|
|
3,570.5
|
|
4,000.1
|
|
|||||
Maturity Profile of the Loan Portfolio
The following table presents certain items in our loan portfolio by contractual maturity as at
December 31, 2019
.
|
As at December 31, 2019
Remaining term to average
contractual maturity
|
||||||||||||
|
(in millions of $) (audited)
|
Within
1 year
|
1 to 5
years
|
Over 5
years
|
Total
|
||||||||
|
Commercial loans
|
243.6
|
|
199.1
|
|
492.3
|
|
935.0
|
|
||||
|
Commercial real estate
|
102.9
|
|
210.8
|
|
440.5
|
|
754.2
|
|
||||
|
Consumer loans
|
113.0
|
|
61.5
|
|
82.7
|
|
257.2
|
|
||||
|
Residential mortgages
|
275.8
|
|
1,331.2
|
|
1,612.8
|
|
3,219.8
|
|
||||
|
Total
|
735.3
|
|
1,802.6
|
|
2,628.3
|
|
5,166.2
|
|
||||
70
The following table presents our loan portfolio by maturity and type of interest as at
December 31, 2019
.
|
As at December 31, 2019
Remaining term to average
contractual maturity
|
||||||||||||
|
(in millions of $) (audited)
|
Within
1 year
|
1 to 5
years
|
Over 5
years
|
Total
|
||||||||
|
Loans with fixed interest rates
|
102.6
|
|
207.2
|
|
765.4
|
|
1,075.2
|
|
||||
|
Loans with floating or adjustable interest rates
|
632.7
|
|
1,595.4
|
|
1,862.9
|
|
4,091.0
|
|
||||
|
Total
|
735.3
|
|
1,802.6
|
|
2,628.3
|
|
5,166.2
|
|
||||
Loan and Lease Concentrations
As at
December 31, 2019
and 2018, we did not identify any concentration of loans and leases that exceeded 10% of total loans and leases. See Note 7 "Credit risk concentrations" to our audited consolidated financial statements as at and for the year ended
December 31, 2019
included elsewhere in this report for further discussion of how we manage concentration exposures.
Risk Elements
For details on our policy for placing loans on non-accrual status, see Note 2 "Significant accounting policies" to our audited consolidated financial statements as at and for the year ended
December 31, 2019
included elsewhere in this report.
The following table shows a five-year history of non-accrual loans, loans past due 90 days or more and other potential problem loans. See "Management's Discussion and Analysis of Financial Condition and Results of Operations — Critical Accounting Policies and Estimates" for our policies for determining non-performing and potential problem loans.
|
As at December 31
|
|||||||||||||||
|
(in millions of $)
|
2019
|
2018
|
2017
|
2016
|
2015
|
||||||||||
|
Non-accrual loans
|
|||||||||||||||
|
Commercial loans
|
|||||||||||||||
|
Commercial and industrial
|
7.6
|
|
11.2
|
|
7.5
|
|
0.6
|
|
0.6
|
|
|||||
|
Total commercial loans
|
7.6
|
|
11.2
|
|
7.5
|
|
0.6
|
|
0.6
|
|
|||||
|
Commercial real estate loans
|
3.2
|
|
4.1
|
|
4.7
|
|
6.0
|
|
10.3
|
|
|||||
|
Consumer loans
|
|||||||||||||||
|
Automobile financing
|
0.2
|
|
0.2
|
|
0.2
|
|
0.3
|
|
0.1
|
|
|||||
|
Other consumer
|
1.1
|
|
0.8
|
|
0.5
|
|
0.7
|
|
1.3
|
|
|||||
|
Total consumer loans
|
1.3
|
|
1.0
|
|
0.7
|
|
1.0
|
|
1.4
|
|
|||||
|
Residential mortgages
|
38.3
|
|
32.2
|
|
30.9
|
|
40.9
|
|
53.0
|
|
|||||
|
Total non‑accrual loans
|
50.4
|
|
|
48.5
|
|
43.8
|
|
48.5
|
|
65.3
|
|
||||
|
Accruing loans past due 90 days and more
|
|||||||||||||||
|
Commercial real estate loans
|
3.1
|
|
—
|
|
—
|
|
—
|
|
0.7
|
|
|||||
|
Consumer loans
|
|||||||||||||||
|
Credit card
|
0.4
|
|
0.1
|
|
0.2
|
|
0.4
|
|
0.1
|
|
|||||
|
Overdrafts
|
—
|
|
—
|
|
—
|
|
—
|
|
0.5
|
|
|||||
|
Other consumer
|
—
|
|
—
|
|
—
|
|
0.3
|
|
0.1
|
|
|||||
|
Total consumer loans
|
0.4
|
|
0.1
|
|
0.2
|
|
0.7
|
|
0.7
|
|
|||||
|
Residential mortgages
|
12.1
|
|
6.5
|
|
4.2
|
|
8.5
|
|
12.7
|
|
|||||
|
Total accruing loans past 90 days and more
|
15.6
|
|
6.6
|
|
4.4
|
|
9.2
|
|
14.1
|
|
|||||
|
Loans modified in a troubled debt restructuring ("TDR")
(1)
|
|||||||||||||||
|
Commercial loans
|
0.9
|
|
1.0
|
|
1.0
|
|
1.0
|
|
1.1
|
|
|||||
|
Commercial real estate loans
|
4.3
|
|
4.5
|
|
4.5
|
|
3.3
|
|
14.6
|
|
|||||
|
Consumer loans
|
—
|
|
—
|
|
—
|
|
—
|
|
0.1
|
|
|||||
|
Residential mortgages
|
74.9
|
|
74.7
|
|
70.5
|
|
46.5
|
|
35.6
|
|
|||||
|
Total loans modified in a TDR
|
80.1
|
|
80.2
|
|
76.0
|
|
50.8
|
|
51.4
|
|
|||||
________________
|
(1)
|
Total recorded investment.
|
71
Impact of Impaired Loans on Interest Income
The following table presents the gross interest income for both non-accrual and TDRs that would have been recognized if such loans had been current in accordance with their original contractual terms, and had been outstanding throughout the period or since origination if held for only part of the period. The table also presents the interest income related to these loans that was actually recognized for the year.
|
(in millions of $)
|
Year-ended
December 31, 2019
Total
|
||
|
Gross amount of interest income that would have been recorded in accordance with original contractual terms, and had been outstanding throughout the year or since origination, if held for only part of the year
(1)
|
7.7
|
|
|
|
Interest income actually recognized (in negative)
|
(5.0
|
)
|
|
|
Total interest income forgone
|
2.7
|
|
|
________________
|
(1)
|
Based on the contractual rate that was being charged at the time the loan was restructured or placed on non-accrual status.
|
Potential Problem Loans
This disclosure presents outstanding amounts as well as specific reserves for certain loans and leases where information about possible credit problems of borrowers causes management to have serious doubts as to the ability of such borrowers to comply with the present repayment terms. At
December 31, 2019
, we did not identify any potential problem loans or leases within the portfolio that were not already included in "Risk Elements" above.
Cross-Border Outstandings
The following table presents the aggregate amount of cross-border outstandings from borrowers or counterparties for each foreign country that exceeds 0.75% of consolidated assets for any of the periods reported below. Cross-border outstandings include loans, receivables, interest bearing deposits with other banks, other interest bearing investments and monetary assets that are denominated in either dollars or other non-local currency.
The table separately presents the amounts of cross-border outstandings by type of borrower including governments, banks and financial institutions and other, along with an analysis of local country assets net of local country liabilities.
|
(in millions of $)
|
For the year ended December 31, 2019
|
|||||||||||||
|
Country of counterparty
|
United
Kingdom
|
United
States
|
Canada
|
St. Lucia
|
Australia
|
|||||||||
|
Governments and official institutions
|
1,091.0
|
|
385.9
|
|
77.0
|
|
—
|
|
—
|
|
||||
|
Banks and other financial institutions
|
642.7
|
|
371.0
|
|
505.1
|
|
—
|
|
171.0
|
|
||||
|
Commercial and industrial
|
441.4
|
|
162.3
|
|
—
|
|
29.6
|
|
—
|
|
||||
|
Residential
|
636.7
|
|
4,395.0
|
|
—
|
|
—
|
|
||||||
|
Total cross border outstandings
|
2,811.8
|
|
5,314.2
|
|
582.1
|
|
29.6
|
|
171.0
|
|
||||
|
Net local country claims
|
13.5
|
|
—
|
|
—
|
|
—
|
|
—
|
|
||||
|
Cross‑border commitments
|
12.9
|
|
—
|
|
—
|
|
—
|
|
—
|
|
||||
|
Total exposure
|
2,838.2
|
|
5,314.2
|
|
582.1
|
|
29.6
|
|
171.0
|
|
||||
|
(in millions of $)
|
For the year ended December 31, 2018
|
|||||||||||||
|
Country of counterparty
|
United
Kingdom
|
United
States
|
Canada
|
St. Lucia
|
Australia
|
|||||||||
|
Governments and official institutions
|
51.0
|
|
99.3
|
|
146.6
|
|
—
|
|
—
|
|
||||
|
Banks and other financial institutions
|
657.2
|
|
405.5
|
|
314.3
|
|
—
|
|
145.7
|
|
||||
|
Commercial and industrial
|
317.0
|
|
174.6
|
|
—
|
|
90.5
|
|
—
|
|
||||
|
Residential
|
469.4
|
|
3,973.9
|
|
—
|
|
—
|
|
—
|
|
||||
|
Total cross border outstandings
|
1,494.6
|
|
4,653.3
|
|
460.9
|
|
90.5
|
|
145.7
|
|
||||
|
Net local country claims
|
18.8
|
|
—
|
|
—
|
|
—
|
|
—
|
|
||||
|
Cross‑border commitments
|
36.9
|
|
—
|
|
—
|
|
—
|
|
—
|
|
||||
|
Total exposure
|
1,550.3
|
|
4,653.3
|
|
460.9
|
|
90.5
|
|
145.7
|
|
||||
72
|
(in millions of $)
|
For the year ended December 31, 2017
|
|||||||||||||
|
Country of counterparty
|
United
Kingdom
|
United
States
|
Canada
|
St. Lucia
|
Australia
|
|||||||||
|
Governments and official institutions
|
159.7
|
|
249.1
|
|
115.5
|
|
—
|
|
—
|
|
||||
|
Banks and other financial institutions
|
602.6
|
|
444.7
|
|
272.7
|
|
—
|
|
113.9
|
|
||||
|
Commercial and industrial
|
208.3
|
|
349.9
|
|
—
|
|
120.1
|
|
—
|
|
||||
|
Residential
|
355.7
|
|
4,183.5
|
|
—
|
|
—
|
|
—
|
|
||||
|
Total cross border outstandings
|
1,326.3
|
|
5,227.2
|
|
388.2
|
|
120.1
|
|
113.9
|
|
||||
|
Net local country claims
|
16.2
|
|
—
|
|
—
|
|
—
|
|
—
|
|
||||
|
Cross‑border commitments
|
52.7
|
|
—
|
|
—
|
|
—
|
|
—
|
|
||||
|
Total exposure
|
1,395.2
|
|
5,227.2
|
|
388.2
|
|
120.1
|
|
113.9
|
|
||||
____________________________
There were no countries listed above which were experiencing liquidity problems as of any of the period-end dates listed.
Loan Concentration
As at December 31,
2019
, there were no individual loans for which their net carrying value was greater than 10% of the total loans outstanding.
Summary of Loan Loss Experience
The following table presents our loan loss experience for the years indicated.
|
For the year ended December 31
|
|||||||||||||||
|
(in millions of $)
|
2019
|
2018
|
2017
|
2016
|
2015
|
||||||||||
|
Allowance, balance at the beginning of the year
|
25.1
|
|
35.4
|
|
44.2
|
|
49.3
|
|
47.5
|
|
|||||
|
Charge-offs
|
|||||||||||||||
|
Commercial loans
|
(0.4
|
)
|
(0.2
|
)
|
(0.2
|
)
|
(0.1
|
)
|
(0.5
|
)
|
|||||
|
Commercial real estate
|
—
|
|
—
|
|
(0.8
|
)
|
(4.5
|
)
|
(0.3
|
)
|
|||||
|
Consumer loans
|
(2.2
|
)
|
(0.9
|
)
|
(1.0
|
)
|
(1.9
|
)
|
(3.7
|
)
|
|||||
|
Residential mortgages
|
(0.4
|
)
|
(2.9
|
)
|
(2.4
|
)
|
(3.9
|
)
|
(2.0
|
)
|
|||||
|
Recoveries
|
|||||||||||||||
|
Commercial loans
|
—
|
|
—
|
|
0.1
|
|
0.1
|
|
0.2
|
|
|||||
|
Commercial real estate
|
—
|
|
—
|
|
—
|
|
—
|
|
0.8
|
|
|||||
|
Consumer loans
|
1.2
|
|
0.7
|
|
0.7
|
|
1.3
|
|
0.4
|
|
|||||
|
Residential mortgages
|
0.4
|
|
0.2
|
|
0.5
|
|
0.1
|
|
1.4
|
|
|||||
|
Charge-offs, net of recoveries
|
(1.4
|
)
|
(3.2
|
)
|
(3.1
|
)
|
(9.0
|
)
|
(3.7
|
)
|
|||||
|
Additional charge to operations
|
(0.1
|
)
|
(7.1
|
)
|
(5.7
|
)
|
3.9
|
|
5.5
|
|
|||||
|
Allowance, balance at the end of the year
|
23.6
|
|
25.1
|
|
35.4
|
|
44.2
|
|
49.3
|
|
|||||
|
Average loans
|
4,369.5
|
|
3,995.8
|
|
3,665.8
|
|
3,921.1
|
|
4,026.7
|
|
|||||
|
Ratio of net charge-offs during the period to average loans outstanding during the year
|
(0.03
|
)%
|
(0.08
|
)%
|
(0.08
|
)%
|
(0.23
|
)%
|
(0.09
|
)%
|
|||||
See "Management's Discussion and Analysis of Financial Condition and Results of Operations" located elsewhere in this report for further details on additional charges to operations.
The following table presents allocation of allowances for credit losses for the periods indicated.
|
For the year ended December 31
|
|||||||||||||||||||||||||
|
2019
|
2018
|
2017
|
2016
|
2015
|
|||||||||||||||||||||
|
(in millions of $)
|
$
|
%
(1)
|
$
|
%
(1)
|
$
|
%
(1)
|
$
|
%
(1)
|
$
|
%
(1)
|
|||||||||||||||
|
Balance at the end of the year
|
|
|
|
|
|
|
|
|
|
|
|
|
|
|
|
|
|
|
|
|
|||||
|
Commercial loans
|
7.3
|
|
0.8
|
|
6.9
|
|
1.0
|
|
3.3
|
|
0.6
|
|
3.4
|
|
0.8
|
|
8.7
|
|
1.5
|
|
|||||
|
Commercial real estate
|
1.5
|
|
0.2
|
|
4.1
|
|
0.9
|
|
10.6
|
|
2.0
|
|
16.2
|
|
3.0
|
|
6.5
|
|
1.0
|
|
|||||
|
Consumer loans
|
1.5
|
|
0.6
|
|
0.8
|
|
0.6
|
|
0.9
|
|
0.5
|
|
1.0
|
|
0.6
|
|
2.8
|
|
1.2
|
|
|||||
|
Residential mortgages
|
13.3
|
|
0.4
|
|
13.3
|
|
0.8
|
|
20.7
|
|
1.3
|
|
23.7
|
|
1.5
|
|
31.3
|
|
1.8
|
|
|||||
|
Total
|
23.6
|
|
0.5
|
%
|
25.1
|
|
0.6
|
|
35.5
|
|
0.9
|
|
44.3
|
|
1.2
|
|
49.3
|
|
1.6
|
|
|||||
______________________________
|
(1)
|
Percent of loans in each category to total loans.
|
73
Deposits
The following table presents our interest bearing customer deposits for the years indicated.
|
For the year ended December 31
|
|||||||||||||||
|
2019
|
2018
|
2017
|
|||||||||||||
|
(in millions of $, unless otherwise indicated)
|
Average
balance
|
Average
rate
|
Average
balance |
Average
rate |
Average
balance |
Average
rate |
|||||||||
|
Interest bearing deposits
|
|||||||||||||||
|
Demand
|
6,197.3
|
|
0.19
|
%
|
5,587.4
|
|
0.02
|
%
|
5,697.0
|
|
0.03
|
%
|
|||
|
Term
|
2,625.1
|
|
1.46
|
%
|
1,765.4
|
|
0.87
|
%
|
1,722.6
|
|
0.49
|
%
|
|||
|
Total interest bearing deposits
|
8,822.4
|
|
7,352.8
|
|
7,419.6
|
|
|||||||||
Term Deposits of $100,000 or More
The following table presents the amount of term deposits of $100,000 or more by time remaining until maturity as at
December 31, 2019
:
|
Remaining term to maturity
|
||||||||||||||
|
(in millions of $)
|
3 months
or less
|
3 to 6 months
|
6 to 12 months
|
Over
12 months
|
Total
|
|||||||||
|
Customer
|
2,398.8
|
|
224.4
|
|
290.9
|
|
61.7
|
|
2,975.9
|
|
||||
|
Bank
|
3.8
|
|
0.5
|
|
0.1
|
|
—
|
|
4.4
|
|
||||
|
Total Term Deposits of $100,000 or More
|
2,402.6
|
|
224.9
|
|
291.0
|
|
61.7
|
|
2,980.3
|
|
||||
Return on Equity and Assets
The following table presents our return on equity and assets for the years indicated.
|
For the year ended December 31
|
|||||||||
|
2019
|
2018
|
2017
|
|||||||
|
Return on assets
(1)
|
1.4
|
%
|
1.8
|
%
|
1.4
|
%
|
|||
|
Return on equity
(2)
|
19.1
|
%
|
23.1
|
%
|
19.9
|
%
|
|||
|
Dividend payout ratio
(3)
|
52.9
|
%
|
42.8
|
%
|
46.4
|
%
|
|||
|
Equity to assets ratio
(4)
|
8.0
|
%
|
8.1
|
%
|
6.8
|
%
|
|||
|
(1)
|
Net income divided by average total assets.
|
|
(2)
|
Net income divided by average equity.
|
|
(3)
|
Dividends declared per share divided by net income per share.
|
|
(4)
|
Average equity divided by average total assets.
|
Short-Term Borrowings
There were no short-term borrowings in excess of 30% of shareholders' equity as at
December 31, 2019
and
2018
.
74
RISK MANAGEMENT
Risk Oversight and Management
General
The principal types of risk inherent in our business are market, liquidity, credit and operational risks.
Organizational structure
The Board has overall responsibility for determining the strategy for risk management, setting the Bank's risk appetite and ensuring that risk is monitored and controlled effectively. It accomplishes its mandate through the activities of two dedicated committees:
The Risk Policy and Compliance Committee
("
RPCC
"): This committee of the Board assists the Board in fulfilling its responsibilities by overseeing the Group's risk profile and its performance against approved risk appetites and tolerance thresholds. Specifically, the committee considers the sufficiency of the Group's policies, procedures and limits related to the identification, measurement, monitoring and control of activities that give rise to credit, market, liquidity, interest rate, operational, regulatory, compliance and reputational risks, as well as overseeing its compliance with laws, regulations and codes of conduct.
The Audit Committee
: This committee reviews the overall adequacy and effectiveness of the Group's system of internal controls and the control environment, including in respect of the risk management process. It reviews recommendations arising from internal and independent audit review activities and management's response to any findings raised.
Both the RPCC and Audit Committee are supported in the execution of their respective mandates by the dedicated Audit, Compliance and Risk Policy Committees for our UK, Guernsey, Jersey, Cayman Islands and The Bahamas operations, which oversee the sufficiency of local risk management policies and procedures and the effectiveness of the system of internal controls that are in place. These committees are chaired by non-executive directors drawn from the boards of directors for each jurisdiction.
The Group executive management team is led by the Chairman and CEO and includes the members of executive management reporting directly to the Chairman and CEO. The executive management team is responsible for setting business strategy and for monitoring, evaluating and managing risks across the Group. It is supported by the following management committees:
The Group Risk Committee
("
GRC
"): This committee comprises executive and senior management team members and is chaired by the Group Chief Risk Officer. It provides a forum for the strategic assessment of risks assumed across the Group as a whole based on an integrated view of credit, market, liquidity, legal, regulatory and financial crime compliance, operational, cybersecurity, insurance, pension, investment, capital and reputational risks, ensuring that these exposures are consistent with the risk appetites and tolerance thresholds promulgated by the Board. It is responsible (i) for reviewing, evaluating and recommending the Group's Risk Appetite Framework, the results of the Capital Assessment and Risk Profile and recovery and resolution planning processes (including all associated stress testing performed) and the Group's key risk policies to the Board for approval; (ii) for reviewing and evaluating current and proposed business strategies in the context of our risk appetites; and (iii ) for identifying, reviewing and advising on current and emerging risk issues and associated mitigation plans.
The Group Asset and Liability Committee
("
GALCO
"): This committee comprises executive and senior management team members and is chaired by the Group CFO. The committee is responsible for liquidity, interest rate and exchange rate risk management and other balance sheet issues. It also oversees key policies and the execution of the Group's investment and capital management strategies and monitors the associated risks assumed. It is supported in the execution of its mandate by the work undertaken by the dedicated Asset & Liability Committees in each of the Bank's jurisdictional business units.
The Group Credit Committee
("
GCC
"): This committee comprises executive and senior management and is chaired by the Group Chief Risk Officer. The committee is responsible for a broad range of activities relating to the monitoring, evaluation and management of credit risks assumed across the Group at both transaction and portfolio levels. It is supported in the execution of its mandate by the Financial Institutions Committee ("FIC"), a dedicated sub-committee that is responsible for the evaluation and approval of recommended inter-bank and counterparty exposures assumed in the Group's treasury and investment portfolios, and by the activities of the jurisdictional Credit Committees, which review and approve transactions within delegated authorities and recommends specific transactions outside of these limits to the GCC for approval.
The Provisions and Impairments Committee
: This committee comprises executive and senior management team members and is chaired by the Group Chief Risk Officer. The committee is responsible for approving significant provisions and other impairment charges. It also oversees the overall credit risk profile of the Group in regards to non-accrual loans and assets. It is supported in the execution of its mandate by local credit committees and the GCC, which make recommendations to this committee.
Risk Management
We manage our exposure to risk through a three "lines of defense" model.
The first "line of defense"
is provided by our jurisdictional business units, which retain ultimate responsibility for the risks they assume and for bearing the cost of risks associated with these exposures.
The second "line of defense"
is provided by our Risk Management and Compliance groups, which work in collaboration with our business units to identify, assess, mitigate and monitor the risks associated with our business activities and strategies. They do this by:
|
•
|
making recommendations to the GRC regarding the constitution of the Risk Appetite Framework;
|
|
•
|
setting risk strategies that are designed to manage risk exposures assumed in the course of pursuing our business strategies and aligning them with agreed appetites;
|
|
•
|
establishing and communicating policies, procedures and limits to control risks in alignment with these risk strategies;
|
|
•
|
measuring, monitoring and reporting on risk levels;
|
|
•
|
opining on specific transactions that fall outside delegated risk limits; and
|
|
•
|
identifying and assessing emerging risks.
|
The functions within the Risk Management and Compliance groups that support our risk management activities are outlined below.
75
Group Market Risk
— This unit provides independent oversight of the measurement, monitoring and control of liquidity and funding risks, interest rate and foreign exchange risks as well as the market risks associated with our investment portfolios. It also monitors compliance with both regulatory requirements and our internal policies and procedures relating to the management of these risks.
Group Credit Risk Management
— This unit is responsible for the adjudication and oversight of credit risks associated with our retail and commercial lending activities and the management of risks associated with our investment portfolios and counterparty exposures. It also establishes the parameters and delegated limits within which credit risks may be assumed and promulgates guidelines on how exposures should be managed and monitored.
Group Operational Risk
— This unit assesses the effectiveness of our procedures and internal controls in managing our exposure to various forms of operational risk, including those associated with new business activities and processes and the deployment of new technologies. It also oversees our incident management processes and reviews the effectiveness of our loss data collection activities.
Group Compliance
— This unit provides independent analysis and assurance of our compliance with applicable laws, regulations, codes of conduct and recommended best practices, including those associated with the prevention of financial crime, including money laundering and terrorist financing. It is also responsible for assessing our potential exposure to upstream risks and for providing guidance on the preparations that should be made in advance of these changes coming into effect. The Group Head of Compliance reports directly to the Chairman and CEO.
The third "line of defense"
is provided by our Group Internal Audit function, which performs oversight and ongoing review, and challenges the effectiveness of the internal controls that are executed by both the business, Risk Management and Compliance. The Group Head of Internal Audit has a dual reporting line to both the Chair of the Audit Committee and the Chairman and CEO.
Regulatory Review Process
Our banking, trust and investment business activities in Bermuda are monitored by the BMA as the lead regulator. One of the principal objectives of the BMA is to supervise, regulate and inspect Bermuda-based financial institutions to ensure their financial stability and soundness.
In addition to conducting on-site reviews, the BMA utilizes a comprehensive quarterly statistical return system that enables off-site monitoring. The statistical system is consistent with Basel Committee Standards, which provides the BMA with a detailed breakdown of a bank's balance sheet and profit-and-loss accounts on both a consolidated and unconsolidated basis. This information enables the BMA to monitor the soundness of a bank's financial position and ensure that it meets certain capital requirements. For more information, see "Supervision and Regulation — Bermuda — Supervision and Monitoring by the BMA".
Each of our regulated entities is separately monitored by the local regulatory authority in that jurisdiction to ensure their financial stability and soundness.
The Risk Appetite Framework
The Risk Appetite Framework is the cornerstone of our approach to risk management. Developed by executive management and approved formally by the Board, it outlines the appropriateness of taking on certain risks in the pursuit of our strategic objectives and defines those that should be avoided. It also provides management with a clear mandate regarding the amount and type of risk that it may accept and establishes minimum expectations regarding the practices and behaviors that should be brought to bear in managing the exposures assumed. It is aligned with the interests of our stakeholders, feeds into our business planning processes, and shapes our discussions on risk matters generally.
Our framework comprises the following elements:
(1) Broad categories of risk: outsourcing; credit; market; liquidity; regulatory compliance; financial crime compliance; fiduciary; governance; operational; people; cyber and information security; technology; investment; tax reporting; strategy; financial reporting; correspondent banking; reputational and change. These represent the various risks that the Group assumes across the entirety of its operations in the pursuit of its strategic goals.
(2) A declared risk appetite. To ensure consistency in our risk conversations, these have been distilled into the three options set out in the following table, with each appetite designed to convey a clear strategic direction in terms of the risk/reward profile assumed:
|
Appetite
|
|
Definition
|
|
Profile
|
|
Conservative
|
|
Areas in which the Group avoids risk, or acts to minimize or eliminate the likelihood that the risk will occur, because we have determined the potential downside costs are intolerable; we must maintain a very strong control environment
|
|
Our processes and controls are defensive and focus on detection and prevention.
|
|
Balanced
|
|
Areas in which the Group must constantly strike a balance between the potential upside benefits and potential downside costs of a given decision
|
|
Exposures are only assumed when the risk can be quantified accurately and is assessed as being acceptable.
|
|
Tolerant
|
|
Areas in which the Group has a preference for disciplined risk-taking because we have determined the potential upside benefits outweigh the potential costs
|
|
Exposures can be estimated reliably and structures, systems and processes are in place to manage them.
|
(3) A statement of our governing principles relating to each risk category. This establishes the characteristics of the risks that the Bank is willing to assume and the management behaviors that we should exhibit when doing so.
Specific performance measures and tolerance thresholds in respect of each risk category, combining quantitative and qualitative targets (which are designed to reflect both forward-looking as well as historical perspectives), are designed to provide executive management and the Board with an indication of the "direction" of our exposure relative to our declared risk appetite and an early warning of material adverse developments requiring remedial action.
76
Application of the Risk Appetite Framework
The limits, targets and thresholds used to measure performance continue to be refined by the Group Risk Management function in an effort to express as complete a "picture" as possible of our exposure to a given risk, relative to the stated appetite. All changes proposed pass through a formal review and approval process at both the executive management and Board levels prior to their adoption. Through this approach, the risk appetite framework sets the tone for our risk culture across the Group as a whole, influencing behaviors at all levels of the organization and reinforcing accountability for decisions taken. Many of our jurisdictional offices have developed subsidiary risk appetite frameworks in conjunction with their local risk management functions. This ensures appropriate coverage of local risk factors and the establishment of proportional tolerance thresholds. Group Risk has reviewed these frameworks prior to their adoption and has modified any appetites proposed that are considered to be inconsistent with the overall Group approach.
Market Risks
Interest Rate Risk Management
Our primary market risk is interest rate risk, which is defined as the risk of loss of net interest income or changes in net interest margin because of changes in interest rates.
We seek to measure and manage the potential impact of interest rate risk. Interest rate risk occurs when interest earning assets and interest bearing liabilities mature or re-price at different times, on a different basis or in unequal amounts. Interest rate risk also arises when our assets, liabilities and off-balance sheet contracts each respond differently to changes in interest rates, including as a result of explicit and implicit provisions in agreements related to such assets and liabilities and in off-balance sheet contracts that alter the applicable interest rate and cash flow characteristics as interest rates change. The two primary examples of such provisions that we are exposed to are the duration and rate sensitivity associated with indeterminate-maturity deposits (e.g., interest bearing call accounts) and the rate of prepayment associated with fixed-rate lending and mortgage-backed securities. Interest rates may also affect loan demand, credit losses, mortgage origination volume and other items affecting earnings.
Our management of interest rate risk is overseen by the RPCC, which outlines reporting and measurement requirements. In particular, this infrastructure sets limits and management targets, calculated for various metrics, including our economic value sensitivity, our economic value of equity and net interest income simulations involving parallel shifts in interest rate curves, steepening and flattening yield curves, and various prepayment and deposit duration assumptions. Our Risk Management infrastructure also requires a periodic review of all key assumptions used, such as identifying appropriate interest rate scenarios, setting loan prepayment rates based on historical analysis, non-interest bearing and interest bearing demand deposit durations based on historical analysis, and the targeted investment term of capital.
The principal objective of our interest rate risk management is to maximize profit potential while minimizing exposure to changes in interest rates. Our actions in this regard are taken under the guidance of GALCO. The committee is actively involved in formulating the economic assumptions that we use in our financial planning and budgeting processes and establishes policies which control and monitor the sources, uses and pricing of funds. From time to time, we utilize hedging techniques to reduce interest rate risk. GALCO uses interest income simulation and economic value of equity analysis to measure inherent risk in our balance sheet at specific points in time.
Appetite for interest rate risk is documented in the Group's policies on market risk and investments. This includes the completion of stress testing on at least a quarterly basis of the impact of an immediate and sustained shift in interest rates of +/– 200 basis points on net interest income, economic value of equity and the ratio of tangible total equity to average assets. If any of the parameters established by policy are exceeded, GALCO will provide a plan to executive management to bring the exposure back within tolerance under advice to the Board. The plan does not have to bring the exposure back within limit immediately, but must adjust the exposure within Board and management approved timeframes.
We also use derivatives in the asset and liability management of positions to minimize significant unplanned fluctuations in earnings that are caused by interest rate volatility. Our derivative contracts principally involve over-the-counter transactions that are privately negotiated between the Group and the counterparty to the contract. Derivative instruments that are used as part of our interest rate risk management strategy include interest rate swaps. Interest rate swaps generally involve the exchange of fixed and variable rate interest payments between two parties, based on a common notional principal amount and maturity date.
Interest Rate Risk
The following table sets out the assets, liabilities and shareholders' equity and off-balance sheet instruments on the date of the earlier of contractual maturity, expected maturity and repricing date. Use of these tables to derive information about our interest rate risk position is limited by the fact that customers may choose to terminate their financial instruments at a date earlier than the contractual maturity or repricing date. Examples of this include fixed-rate mortgages, which are shown at contractual maturity but which may pre-pay earlier, and certain term deposits, which are shown at contractual maturity but which may be withdrawn before their contractual maturity subject to prepayment penalties. Investments are shown based on remaining contractual maturities. The remaining contractual principal maturities for mortgage-backed securities (primarily US Government agencies) do not consider prepayments. Remaining expected maturities differ from contractual maturities because borrowers may have the right to prepay obligations before the underlying mortgages mature.
77
|
December 31, 2019
|
Earlier of contractual maturity or repricing date
|
||||||||||||||||
|
(in $ millions)
|
Within
3 months
|
3 to 6
months
|
6 to 12
months
|
1 to 5
years
|
After
5 years
|
Non-interest
bearing
|
Total
|
Total fair value
(1)
|
|||||||||
|
Assets
|
|
|
|
|
|
|
|
|
|
|
|
|
|
|
|||
|
Cash and deposits with banks
|
2,462
|
|
—
|
|
—
|
|
—
|
|
—
|
|
88
|
|
2,550
|
|
2,550
|
|
|
|
Securities purchased under agreement to resell
|
142
|
|
—
|
|
—
|
|
—
|
|
—
|
|
—
|
|
142
|
|
142
|
|
|
|
Short-term investments
|
622
|
|
591
|
|
3
|
|
—
|
|
—
|
|
2
|
|
1,218
|
|
1,218
|
|
|
|
Investments
(2)
|
415
|
|
23
|
|
11
|
|
102
|
|
3,878
|
|
7
|
|
4,436
|
|
4,484
|
|
|
|
Loans
(3)
|
4,025
|
|
16
|
|
148
|
|
292
|
|
648
|
|
14
|
|
5,143
|
|
5,161
|
|
|
|
Other assets
|
—
|
|
—
|
|
—
|
|
—
|
|
—
|
|
433
|
|
433
|
|
433
|
|
|
|
Total assets
|
7,666
|
|
630
|
|
162
|
|
394
|
|
4,526
|
|
544
|
|
13,922
|
|
13,988
|
|
|
|
Liabilities and shareholders' equity
|
|
|
|
|
|
|
|
|
|
|
|
|
|
|
|||
|
Demand deposits
|
7,151
|
|
—
|
|
—
|
|
—
|
|
—
|
|
2,239
|
|
9,390
|
|
9,390
|
|
|
|
Term deposits
(4)
|
2,435
|
|
234
|
|
305
|
|
78
|
|
—
|
|
—
|
|
3,052
|
|
3,050
|
|
|
|
Other liabilities
|
—
|
|
—
|
|
—
|
|
—
|
|
—
|
|
373
|
|
373
|
|
373
|
|
|
|
Subordinated capital
(4)
|
70
|
|
—
|
|
—
|
|
73
|
|
—
|
|
—
|
|
143
|
|
148
|
|
|
|
Shareholders' equity
|
—
|
|
—
|
|
—
|
|
—
|
|
—
|
|
964
|
|
964
|
|
1,027
|
|
|
|
Total liabilities and shareholders' equity
|
9,656
|
|
234
|
|
305
|
|
151
|
|
—
|
|
3,576
|
|
13,922
|
|
13,988
|
|
|
|
Interest rate sensitivity gap
|
(1,990
|
)
|
396
|
|
(143
|
)
|
243
|
|
4,526
|
|
(3,032
|
)
|
—
|
|
|||
|
Cumulative interest rate sensitivity gap
|
(1,990
|
)
|
(1,594
|
)
|
(1,737
|
)
|
(1,494
|
)
|
3,032
|
|
—
|
|
—
|
|
|||
____________________________
|
(1)
|
See "Critical Accounting Policies and Estimates - Fair Values" and "
Note 18: Fair value measurements
" of the audited consolidated financial statements for further detail on the determination of fair value.
|
|
(2)
|
Investments include (i) HTM, which are carried at their amortized cost on the consolidated balance sheet, and (ii) equity securities and AFS investments, each of which are carried at fair value on the consolidated balance sheet. The fair value columns presents all classifications at their fair value.
|
|
(3)
|
Loans are carried on the consolidated balance sheet as the principal amount outstanding, net of allowance for credit losses, unearned income, fair value adjustments arising from hedge accounting and net deferred loan fees.
|
|
(4)
|
Term deposits and subordinated capital are carried on the consolidated balance sheet as the principal outstanding.
|
Asset/Liability Management and Interest Rate Risk
The principal objective of our asset and liability management function is to evaluate the interest rate risk within the balance sheet and pursue a controlled assumption of interest rate risk while maximizing net income and preserving adequate levels of liquidity and capital.
As a financial institution, our primary component of market risk is interest rate volatility. Fluctuations in interest rates will ultimately impact both the level of income and expense recorded on most of our assets and liabilities, and the fair value of all interest earning assets and interest bearing liabilities, other than those which have a short term to maturity. Interest rate risk is the potential of economic losses due to future interest rate changes. These economic losses can be reflected as a loss of future net interest income and/or a loss of current fair values. The objective is to measure the effect on net interest income and to adjust the balance sheet to minimize the inherent risk while at the same time maximizing income.
We manage our exposure to interest rates primarily by structuring our balance sheet in the ordinary course of business. We do not typically enter into derivative contracts for the purpose of managing interest rate risk, but we may elect to do so in the future. Based upon the nature of our operations, we are not subject to foreign exchange or commodity price risk. Our exposure to holdings categorized as "trading positions" falls below the
de minimis
threshold established of 5% (ratio of total trading book open position compared to the sum of on and off-balance sheet assets that are not part of the trading book).
We use an interest rate risk simulation model to test the interest rate sensitivity of net interest income and the balance sheet. Instantaneous parallel rate shift scenarios are modeled and utilized to evaluate risk and establish exposure limits for acceptable changes in net interest margin. These scenarios, known as rate shocks, simulate an instantaneous change in interest rates and use various assumptions, including, but not limited to, prepayments on securities, deposit decay rates, pricing decisions on loans and deposits, reinvestment and replacement of asset and liability cash flows. We also analyze the economic value of equity as a secondary measure of interest rate risk. This is a complementary measure to net interest income where the calculated value is the result of the fair value of assets less the fair value of liabilities. The economic value of equity is a longer-term view of interest rate risk because it measures the present value of all future cash flows. The impact of changes in interest rates on this calculation is analyzed for the risk to our future earnings and is used in conjunction with the analysis on net interest income. The following table summarizes simulated change in net interest income versus unchanged rates as at
December 31, 2019
an
d
December 31, 2018
:
78
|
For the year ended
|
||||||||||||
|
December 31, 2019
|
December 31, 2018
|
|||||||||||
|
Following
12 Months
|
Months 13 - 24
|
Following
12 Months
|
Months 13 - 24
|
|||||||||
|
+300 basis points
|
7.70
|
%
|
14.00
|
%
|
10.40
|
%
|
13.20
|
%
|
||||
|
+200 basis points
|
5.80
|
%
|
10.20
|
%
|
6.80
|
%
|
8.90
|
%
|
||||
|
+100 basis points
|
3.60
|
%
|
5.90
|
%
|
3.70
|
%
|
4.90
|
%
|
||||
|
Flat rates
|
0.00
|
%
|
0.00
|
%
|
0.00
|
%
|
0.00
|
%
|
||||
|
−100 basis points
|
(4.00
|
)%
|
(7.40
|
)%
|
(8.20
|
)%
|
(11.10
|
)%
|
||||
The following table presents the change in our economic value of equity as at
December 31, 2019
and
December 31, 2018
, assuming immediate parallel shifts in interest rates:
|
For the year ended
|
||||||
|
December 31, 2019
|
December 31, 2018
|
|||||
|
+300 basis points
|
(7.70
|
)%
|
(6.20
|
)%
|
||
|
+200 basis points
|
(5.30
|
)%
|
(4.50
|
)%
|
||
|
+100 basis points
|
(2.00
|
)%
|
(2.10
|
)%
|
||
|
Flat rates
|
0.00
|
%
|
0.00
|
%
|
||
|
−100 basis points
|
(2.10
|
)%
|
(3.20
|
)%
|
||
The differences between the change in our economic value of equity assuming immediate parallel shifts in interests rates from
December 31, 2018
to
December 31, 2019
is driven by an increase in both fixed rate investments and loans in order to reduce the Bank’s exposure to lower interest rates.
Many assumptions are used to calculate the impact of interest rate fluctuations. Actual results may be significantly different than our projections due to several factors, including the timing and frequency of rate changes, market conditions and the shape of the yield curve. The computations of interest rate risk shown above do not include the full suite of actions that our management may undertake to manage the risks in response to anticipated changes in interest rates, and actual results may also differ materially.
Foreign Exchange Risk
The Group holds various non-USD denominated assets and liabilities and maintains investments in subsidiaries whose domestic currency is either not USD or whose domestic currency is not pegged to USD. Assets and liabilities denominated in currencies other than USD are translated to USD at the rates of exchange prevailing at the balance sheet date. The resulting gains or losses are included in foreign exchange revenue in the consolidated statement of operations. Assets and liabilities of subsidiaries outside of Bermuda are translated at the rate of exchange prevailing on the balance sheet date while associated revenues and expenses are translated to USD at the average rate of exchange prevailing through the accounting period. Unrealized translation gains or losses on investments in foreign currency based subsidiaries are recorded as a separate component of shareholders' equity within accumulated other comprehensive loss. Such gains or losses are recorded in the consolidated statement of operations only when realized. Our foreign currency subsidiaries may give rise to significant foreign currency translation movements against the USD. We also provide foreign exchange services to our clients, principally in connection with our banking and wealth management businesses, and effect other transactions in non-USD currencies. Foreign currency volatility and fluctuations in exchange rates may impact the value of non-USD denominated assets and liabilities and raise the potential for losses resulting from foreign currency trading positions where aggregate obligations to purchase and sell a currency other than USD do not offset one another, or offset each other in different time periods. If the policies and procedures we have in place to assess and mitigate potential impacts of foreign exchange volatility are not followed, or are not effective to mitigate such risks, our results and earnings may be negatively affected. The Group maintains a clearly articulated foreign exchange risk exposure tolerance framework which limits exposures to select currencies.
Liquidity Risk
The objectives of liquidity risk management are to ensure that the Group can meet its cash flow requirements and capitalize on business opportunities on a timely and cost-effective basis. Liquidity is defined as the ability to hold and/or generate cash adequate to meet our needs for day-to-day operations and material long and short-term commitments. Liquidity risk is the risk of potential loss if the Group were unable to meet its funding requirements at a reasonable cost.
We monitor and manage our liquidity on a Group-wide basis. The treasury functions in the Group's banking operations, located in Bermuda, the Cayman Islands, Guernsey, and Jersey, manage day-to-day liquidity. The Group market risk function has the responsibility for measuring and reporting to senior management on liquidity risk positions. We manage our liquidity based on demand, commitments, specific events and uncertainties to meet current and future financial obligations of a short-term nature. Our objective in managing liquidity is to respond to the needs of depositors and borrowers as well as to earnings enhancement opportunities in a changing marketplace. Management is responsible for establishing and monitoring liquidity targets as well as strategies to meet these targets. The Group adopts a cautious liquidity risk appetite with internal quantitative liquidity risk tolerances more stringent than regulatory requirements. Specifically the Group manages liquidity against internal limits established by the market risk management policy and its related liquidity risk standard and quarterly stress testing methodology.
We maintained a balance sheet with loans representing
36.9%
of total assets as at
December 31, 2019
. Further, at that date there were significant sources of liquidity within our balance sheet in the form of cash and cash equivalents, short-term investments securities purchased under agreement to resell and investments amounting to
$8.3 billion
, or
60.0%
, of total assets.
An important element of our liquidity management is our liquidity contingency plan which can be employed in the event of a liquidity crisis. The objective of the liquidity contingency plan is to ensure that we maintain our liquidity during periods of stress. This plan takes into consideration a variety of scenarios that could challenge our liquidity. These scenarios include specific and systemic events that can impact our on-and off-balance sheet sources and uses of liquidity. This plan is reviewed and updated at least annually.
79
Credit Risk
Credit risk is defined as the risk that unexpected losses arise as a result of the Group's borrowers or market counterparties failing to meet their obligations to repay. Credit risk is managed through the jurisdictional credit risk management departments ("CRM"). CRM provides a system of checks and balances for our diverse credit-related activities by establishing and monitoring all credit-related policies and practices throughout the Group and assuring their uniform application. These activities are designed to diversify credit exposure on an industry and client basis, thus lessening overall credit risk. These credit management activities also apply to our use of derivative financial instruments, including foreign exchange contracts and interest rate risk management instruments, which are used primarily to facilitate client transactions.
Individual credit authority for commercial and other loans is limited to specified amounts and maturities. Credit decisions involving commitment exposure in excess of the specified individual limits are submitted to CRM and then to the GCC, which provides a forum for ongoing executive review of loan activity, establishing our credit guidelines and policies and approving selected credit transactions in accordance with our business objectives. The committee reviews large credit exposures, establishes and reviews credit strategy and policy and approves selected credit transactions. The Financial Institutions Committee ("FIC") manages counterparty risk in respect of (third party) bank counterparties which do not have commercial credit relationships within the Group and also approves country exposure limits.
As part of our ongoing credit granting process, internal ratings are assigned to commercial clients before credit is extended, based on an assessment of creditworthiness. At least annually, a review of all significant credit exposures is undertaken to identify, at an early stage, clients who might be facing financial difficulties. Internal borrower risk ratings are also reviewed during this process, allowing identification of adverse individual borrower and sector trends.
An integral part of the CRM function is to formally review past due and potential problem loans to determine which credits, if any, need to be placed on non-accrual status or charged off. The allowance for loan losses is reviewed monthly to determine the amount necessary to maintain an adequate provision for credit losses.
Another way credit risk is managed is by requiring collateral. Management's assessment of the borrower's creditworthiness determines whether collateral is obtained. The amount and type of collateral held varies but may include deposits held in financial institutions, mutual funds, US Treasury securities, other marketable securities, income-producing commercial properties, accounts receivable, residential real estate, property, plant and equipment, and inventory. Values of variable collateral are monitored on a regular basis to ensure that they are maintained at an appropriate level.
Credit Risk — Retail and Private Banking
Retail and private lending activity is split between residential mortgages, personal loans, credit cards and authorized overdrafts. Retail credit risks are managed in accordance with limits and processes set out in the credit risk policies and guidelines approved by GCC and GRC (and approved by the Board). The policies set out where specialist underwriting may be needed.
For residential mortgages, a combination of lending policy criteria, lending guidelines and underwriting are used to make a decision on applications for credit. The primary factors considered are affordability, residential status, residential history, credit history, employment history, nature of income and loan-to-value ("LTV") of the residential property. In addition, confirmation of a borrower's identity is obtained and an assessment of the value of the collateral carried out prior to granting a credit facility. When considering applications the primary focus is placed on the willingness and ability to repay.
LTV ratios are derived based on third-party valuations as part of the original underwriting or when increased borrowing has been requested. Updated valuations are not otherwise obtained unless the loan reaches non-accrual status. Non-accrual loans which are collateral-dependent on real estate must be supported by a third-party valuation no older than 12 months. Specific provisions are calculated as the amount by which non-accrual loan principal exceeds the value of the supporting real estate, after application of a haircut for the estimated costs of sale. Costs of sale for commercial properties are calculated based on individual circumstances, whereas the haircuts for residential real estate are prescribed in lending guidelines by geographic location and are never less than 15% of the valuation amount.
As valuations are conducted throughout the year, the rolling average age of the valuations is closer to 6 months than 12 months. In addition, on at least a quarterly basis, impairment levels are adjusted for any changes in non-accrual principal.
To further ensure that valuations within the 12-month revaluation period remain appropriate measures for impairment, we: (1) compare renewal valuations to the prior valuation to track market movement; (2) back-test all sales to compare net carrying value versus any additional gain/loss at the time of sale; (3) segregate the tests described in (1) and (2) by geographic area and, where required, amend provision factors accordingly; and (4) perform a review of new valuations to ascertain such valuations' reasonableness and determine if any change in value may impact similar properties or locations where valuations are more stale-dated and require an adjustment to the impairment level.
The Bank performs an annual assessment of group residential LTV ranges as part of its stress-testing exercise for regulatory and capital-adequacy purposes. Real estate indices are not available in the Bank's primary markets and LTV values are based on standard reductions in value over time, based on observed market activity.
Generally, maximum LTV for new residential and commercial loans follow:
|
Bermuda
|
Cayman
|
UK—London
|
Channel Islands
|
|||||||||
|
Residential:
|
|
|
|
|
|
|
||||||
|
Owner-occupied freehold
|
80
|
%
|
85
|
%
|
65
|
%
|
65
|
%
|
||||
|
Owner-occupied leasehold condominium
|
80
|
%
|
85
|
%
|
65
|
%
|
65
|
%
|
||||
|
Investment
(not owner-occupied)
|
65
|
%
|
75
|
%
|
65
|
%
|
65
|
%
|
||||
|
Raw land
|
50
|
%
|
80
|
%
|
n/a
|
|
n/a
|
|
||||
|
Commercial Real Estate
|
65
|
%
|
65
|
%
|
n/a
|
|
65
|
%
|
||||
For other retail lending products, similar lending policy criteria are used, and each of these products has its own policy and underwriting guidelines to enable decisions on applications for credit and to manage accounts. The factors used are attuned to the lending product in question, although affordability and credit history are considered in all cases. Ongoing monitoring of all retail and private banking credit is undertaken by the business unit concerned as well as by CRM. In addition, the GCC reviews reports on a weekly basis. In the event that particular exposures show adverse features such as arrears, the Bank's specialist recovery teams generally work with borrowers to resolve the situation.
80
Unlike the United States where the FCRA is designed to help ensure that credit bureaus furnish correct and complete information when evaluating loan applications, the markets in which we operate do not have systemic credit bureau reports. Therefore, we manually review each loan and we use a formally governed tiered credit approval process that is administered through and governed by our Risk Management framework.
Credit Risk — Commercial Banking
Commercial credit risks are managed in accordance with limits and asset quality measures set out in the credit risk policies and guidelines approved by GCC (and ratified by the Board).
In respect of Commercial Banking, there is a level of delegated sanctioning authority to underwrite certain credit risks based upon an evaluation of the borrower's experience, track record, financial strength, ability to repay, transaction structure and security characteristics. Lending decisions for large or high risk exposures are based upon a thorough credit risk analysis and the assignment of an internal borrower risk rating, and are subject to further approval by the assigned officers in CRM or the GCC.
Consideration is also given to risk mitigation measures which will provide the Group with protection, such as third-party guarantees, supporting collateral and security, legal documentation and financial covenants. Commercial portfolio asset quality monitoring is based upon a number of measures, including the monitoring of financial covenants, cash flows, pricing movements and variable collateral. In the event that particular exposures begin to show adverse features such as payment arrears, covenant breaches or business trading losses, a full risk reassessment is undertaken. Where appropriate, a specialist recovery team will work with the borrower to resolve the situation. If this proves unsuccessful, the case will be subject to intensive monitoring and management procedures designed to maximize debt recovery.
Credit Risk — Treasury
Treasury credit risks are managed in accordance with limits, asset quality measures and criteria set out within the policy approved by the GCC and ratified by the Board. The policy also sets out powers which require higher levels of authorization according to the size of the transaction or the nature of the associated risk. The FIC identifies, assesses, prioritizes and manages our risks associated with counterparty exposure to other financial institutions, as well as country-specific exposures.
Exposures to financial institutions arise within the Group's investment portfolio and treasury operations. The Group has treasury operations in all of its banking locations. Treasury exposures primarily take the form of deposits with banks and foreign exchange positions. Exposures to financial institutions in the investment portfolio can take the form of bonds, floating rate notes and or certificates of deposit.
Diversification and avoidance of concentration is emphasized. The Group establishes limits for countries and each financial institution where there is an expected exposure. Ongoing asset quality monitoring is undertaken by Treasury and CRM and reports are sent to the FIC, GCC and the GRC on a monthly basis. Exception reporting takes place against a range of asset quality triggers. Treasury uses a number of risk mitigation techniques including netting and collateralization agreements. Other methods (such as margining and derivatives) are used periodically to mitigate the risk associated with particular transactions or group of transactions.
For its exposure to Treasury credit risk, the Group uses S&P, Fitch and Moody's as external credit assessment institutions as permitted under Basel II for sovereign, financial institutions, asset-backed securities, covered bonds and corporate risks. With regard to financial institutions and corporates, the Group's preference for a long-term rating is the senior unsecured rating. However, counterparty ratings and/or short-term deposit or commercial paper ratings are used if this is unavailable. For asset-backed securities, the issue or tranche rating is used.
Exposures
The following tables analyze the Group's regulatory credit risk exposures as at
December 31, 2019
and
December 31, 2018
. Expos
ures are allocated to specific standardized exposure portfolios determined by the BMA's Revised Framework for Regulatory Capital Assessment and it is these portfolios that determine the risk weights used. These exposures include both on and off-balance sheet exposures, with the latter shown separately after credit conversion factors have been applied.
|
Analysis of exposures class
(in millions of $)
|
Average
Exposure
2019
|
Position as at
December 31,
2019
|
Average
Exposure 2018 |
Position as at
December 31, 2018 |
||||||||
|
Cash
|
46.1
|
|
63.1
|
|
45.0
|
|
38.4
|
|
||||
|
Claims on Sovereigns
|
1,036.3
|
|
1,841.3
|
|
528.1
|
|
331.2
|
|
||||
|
Claims on Public Sector Entities
|
107.9
|
|
112.4
|
|
102.4
|
|
101.9
|
|
||||
|
Claims on Corporates
|
662.3
|
|
783.5
|
|
628.1
|
|
609.2
|
|
||||
|
Claims on Banks and Securities Firms
|
2,131.4
|
|
2,148.4
|
|
1,513.0
|
|
1,877.7
|
|
||||
|
Securitizations
|
4,361.2
|
|
4,415.0
|
|
4,351.4
|
|
4,121.2
|
|
||||
|
Retail Loans
|
229.2
|
|
268.8
|
|
216.2
|
|
222.1
|
|
||||
|
Residential Mortgages
|
2,838.5
|
|
3,175.3
|
|
2,531.0
|
|
2,626.5
|
|
||||
|
Commercial Mortgages
|
535.0
|
|
649.5
|
|
515.4
|
|
487.1
|
|
||||
|
Past Due Loans
|
50.0
|
|
57.8
|
|
42.5
|
|
45.2
|
|
||||
|
Other Balance Sheet Exposures
|
263.9
|
|
277.1
|
|
247.8
|
|
235.1
|
|
||||
|
Non‑Market Related Off-Balance Sheet Credit Exposures
|
412.5
|
|
451.8
|
|
367.2
|
|
379.8
|
|
||||
|
Market Related Off‑Balance Sheet Credit Exposures
|
62.1
|
|
94.8
|
|
60.1
|
|
51.3
|
|
||||
|
Total
|
12,736.2
|
|
14,338.8
|
|
11,148.2
|
|
11,126.7
|
|
||||
81
|
Geographic segment distribution of
exposures class as at December 31, 2019
(in millions of $)
|
Bermuda
|
Cayman
|
Channel Islands & UK
|
Other
|
Total
|
||||||||||
|
Cash
|
38.6
|
|
24.5
|
|
—
|
|
—
|
|
63.1
|
|
|||||
|
Claims on Sovereigns
|
224.2
|
|
122.8
|
|
1,494.3
|
|
—
|
|
1,841.3
|
|
|||||
|
Claims on Public Sector Entities
|
104.2
|
|
8.2
|
|
—
|
|
—
|
|
112.4
|
|
|||||
|
Claims on Corporates
|
484.6
|
|
114.9
|
|
184.0
|
|
—
|
|
783.5
|
|
|||||
|
Claims on Banks and Securities firms
|
390.7
|
|
733.9
|
|
1,015.4
|
|
8.4
|
|
2,148.4
|
|
|||||
|
Securitizations
|
2,239.4
|
|
1,893.8
|
|
281.8
|
|
—
|
|
4,415.0
|
|
|||||
|
Retail loan
|
103.6
|
|
87.4
|
|
77.8
|
|
—
|
|
268.8
|
|
|||||
|
Residential Mortgages
|
1,067.8
|
|
570.1
|
|
1,537.4
|
|
—
|
|
3,175.3
|
|
|||||
|
Commercial Mortgages
|
310.6
|
|
172.1
|
|
166.8
|
|
—
|
|
649.5
|
|
|||||
|
Past Due Loans
|
44.4
|
|
2.1
|
|
11.3
|
|
—
|
|
57.8
|
|
|||||
|
Other Balance Sheet Exposures
|
133.3
|
|
60.9
|
|
72.6
|
|
10.3
|
|
277.1
|
|
|||||
|
Non‑Market Related Off-Balance Sheet Credit exposures
|
185.9
|
|
155.8
|
|
110.1
|
|
—
|
|
451.8
|
|
|||||
|
Market Related Off-Balance Sheet Credit Exposures
|
28.4
|
|
6.8
|
|
59.6
|
|
—
|
|
94.8
|
|
|||||
|
Total
|
5,355.7
|
|
3,953.3
|
|
5,011.0
|
|
18.7
|
|
14,338.8
|
|
|||||
|
Residual maturity breakdown of
exposures class as at December 31, 2019
(in millions of $)
|
Up to
12 months |
1 ‑ 5 years
|
More than
5 years |
No specific maturity
|
Total
|
||||||||||
|
Cash
|
63.1
|
|
—
|
|
—
|
|
—
|
|
63.1
|
|
|||||
|
Claims on Sovereigns
|
1,648.8
|
|
22.5
|
|
170.0
|
|
—
|
|
1,841.3
|
|
|||||
|
Claims on Public Sector Entities
|
37.5
|
|
—
|
|
74.9
|
|
—
|
|
112.4
|
|
|||||
|
Claims on Corporates
|
295.4
|
|
198.7
|
|
289.4
|
|
—
|
|
783.5
|
|
|||||
|
Claims on Banks and Securities firms
|
2,148.4
|
|
—
|
|
—
|
|
—
|
|
2,148.4
|
|
|||||
|
Securitizations
|
—
|
|
9.3
|
|
4,405.7
|
|
—
|
|
4,415.0
|
|
|||||
|
Retail loan
|
123.1
|
|
66.6
|
|
79.1
|
|
—
|
|
268.8
|
|
|||||
|
Residential Mortgages
|
265.8
|
|
1,328.4
|
|
1,581.1
|
|
—
|
|
3,175.3
|
|
|||||
|
Commercial Mortgages
|
39.6
|
|
206.8
|
|
403.1
|
|
—
|
|
649.5
|
|
|||||
|
Past Due Loans
|
19.6
|
|
4.4
|
|
33.8
|
|
—
|
|
57.8
|
|
|||||
|
Other Balance Sheet Exposures
|
—
|
|
—
|
|
—
|
|
277.1
|
|
277.1
|
|
|||||
|
Non‑Market Related Off-Balance Sheet Credit exposures
|
451.8
|
|
—
|
|
—
|
|
—
|
|
451.8
|
|
|||||
|
Market Related Off-Balance Sheet Credit Exposures
|
94.8
|
|
—
|
|
—
|
|
—
|
|
94.8
|
|
|||||
|
5,187.9
|
|
1,836.7
|
|
7,037.1
|
|
277.1
|
|
14,338.8
|
|
||||||
The table below details the mappings between the main Fitch, Moody's and S&P external credit assessment institutions used by the Group and the credit quality steps used to determine the risk weightings applied to rated counterparties. Where no external rating is used in the risk weighted assets calculation, the unrated credit quality step applies.
|
Credit quality step
|
|
Fitch's
assessment
|
|
Moody's
assessment
|
|
S&P's
assessment
|
|
Step 1
|
|
AAA to AA–
|
|
Aaa to Aa3
|
|
AAA to AA–
|
|
Step 2
|
|
A+ to A–
|
|
A1 to A3
|
|
A+ to A–
|
|
Step 3
|
|
BBB+ to BBB–
|
|
Baa1 to Baa3
|
|
BBB+ to BBB–
|
|
Step 4
|
|
BB+ to BB–
|
|
Ba1 to Ba3
|
|
BB+ to BB–
|
|
Step 5
|
|
B+ to B–
|
|
B1 to B3
|
|
B+ to B–
|
|
Step 6
|
|
CCC+ and below
|
|
Caa1 and below
|
|
CCC+ and below
|
82
Impairment Provisions
Credit Risk Concentrations
Concentration risk is defined as: any single exposure or group of exposures with the potential to produce losses large enough (relative to the Group's capital, total assets or overall risk level) to threaten the Group's health or ability to maintain core operations. The management of concentration risk is addressed in the first instance by the Group's large exposure policy and related credit guidelines, which require that credit facilities to entities that are affiliated through common ownership or management are aggregated for adjudication and reporting purposes. The policy also defines what constitutes a large exposure and the related reporting requirements. The CRM function also undertakes monitoring and assessment of our exposure to concentration risk, reporting the results of these analyses to the GCC, the GRC and RPCC.
The factors taken into consideration when assessing concentration risk are as follows:
|
•
|
single or linked counterparty;
|
|
•
|
industry or economic sector (e.g., hospitality, property development, commercial office building investment);
|
|
•
|
geographic region;
|
|
•
|
product type;
|
|
•
|
collateral type; and
|
|
•
|
maturity date (whether of the facility or of interest rate fixes).
|
Counterparty Concentrations
Counterparty concentrations is the risk associated with assuming a high level of exposure to a single counterparty, the failure of which could have an adverse impact on the Group.
Large exposures are reviewed quarterly by the GRC and RPCC for the loan portfolio and the treasury/investment portfolios. CRM and Treasury work closely together on daily treasury positions and exceptions.
All large exposures and concentrations in the portfolio are reviewed and agreed by the FIC on a quarterly basis and are reported to the Board as a part of this process. The review of large exposures considers:
|
•
|
facility total;
|
|
•
|
any link with other facilities;
|
|
•
|
total linked facility being within guidelines;
|
|
•
|
borrower risk rating;
|
|
•
|
security value on the facility; and
|
|
•
|
loan-to-value percentage against minimum security covenants.
|
Industry Concentration
Industry concentration encompasses the scenario that a risk factor inherent within an industry is tied to an entire portfolio of accounts or investments; e.g., a portfolio made up of a large number of small individual loans where all the counterparties are hotel operators. We believe that due to the nature of the Group's client base our exposure to the property, insurance and fund sectors could be classified as industry concentration, although geographic and product concentration are the more appropriate risks to measure.
Geographic Concentration
Geographic concentration of the book is monitored as follows. Reports are generated which provide details of all the property loan exposure of the Group. Through this, loans are subdivided into regional exposure. From this, the percentage breakdown per region of the Group's property exposure is analyzed and reported to the GRC and RPCC. Assessment of the exposure allows the committees to decide whether the Group should decline further lending in any area in which it is becoming over-weighted.
Product Concentration
Product concentration is defined in the context of credit risk, as an over-weighting in the portfolio to a given product type, making the Group vulnerable to the impact of a variety of external factors that could either reduce demand for the product itself or lead to an increase in the level of default rates experienced. We operate as a full service bank in Bermuda and the Cayman Islands and aim to satisfy the requirements of our customers in these communities through the range of products and services we offer. Accordingly, there is no dependence or concentration on a single product in these markets outside of the residential mortgage portfolios, which comprised
62.3%
of the Group's loan book as at
December 31, 2019
(compared to 65.4% as at
December 31, 2018
); in Bermuda, residential mortgage lending made up
53.4%
of the Bermuda loan book as at
December 31, 2019
(compared to 57.1% as at
December 31, 2018
), and loans for many purposes (education, business support, family requirements) were made in the form of residential mortgages. Product category analysis confirms that the total lending portfolio is concentrated in the property market; this has been addressed in stress testing performed.
Collateral Concentration
Collateral concentration considers whether the Group's loan book is secured by a limited number of collateral types. An example of this would be when a large value of loans to a diversified group of borrowers is all secured by shares in the same company or by the shares of various companies within the same industry sector. Any decline in the value of these shares or in the performance of the sector as a whole could have an adverse impact on the Group's security position across all affected borrowers. The most relevant example of collateral concentration is the Group's exposure to real estate property values. Ignoring cash-backed facilities, the largest collateral concentrations within the portfolio are to residential and commercial property. The greatest risk with collateral concentration is that the value of the security could be severely reduced. To simulate this, the Group's stress testing process incorporates a scenario in which all real estate collateral is devalued by factors as high as 30%.
83
Credit Risk Mitigation
The Group uses a wide range of techniques to reduce credit risk of its lending. The most basic of these is performing an assessment of the ability of a borrower to service the proposed level of borrowing without distress. However, the risk can be further mitigated by obtaining security for the funds advanced.
Residential Mortgages
Residential property is the Group's main source of collateral and means of mitigating credit risk inherent in the residential mortgage portfolio. All mortgage lending activities are supported by underlying assumptions and estimated values received by independent third parties. All residential property must be insured to cover property risks through a third party.
Commercial
Commercial property is one of the Group's primary sources of collateral and means of mitigating credit risk inherent in its commercial portfolios. Collateral for the majority of commercial loans comprises first legal charges over freehold or long leasehold property but the following may also be taken as security: life insurance policies; credit balances assignments; share guarantees; equitable charges; debentures; chattel mortgages and charges over residential property.
For property-based lending, supporting information such as professional valuations are an important tool to help determine the suitability of the property offered as security and, in the case of investment lending, generating the cash to cover interest and principal payments. All standard documentation is subject to in-house legal review and sign-off in order to ensure that the Group's legal documentation is robust and enforceable. Documentation for large advances may be specifically prepared by independent solicitors. Insurance requirements are always fully considered as part of the application process and the Group ensures that appropriate insurance is taken out to protect the property against an insurable event.
Treasury
Collateral held as security for treasury assets, including investments, is determined by the nature of the instrument. Loans, debt securities, treasury and other eligible bills are generally unsecured with the exception of asset-backed securities and similar instruments, which are secured by pools of financial assets. The International Swaps and Derivatives Association ("ISDA") Master Agreement is the Group's preferred method of documenting derivative activity. It is common in such cases for a Credit Support Annex to be executed in conjunction with the ISDA Master Agreement in order to mitigate credit risk on the derivatives portfolio. Valuations are performed, agreed with the relevant counterparties, and collateral is exchanged to bring the credit exposure within agreed tolerances. From January 1, 2017, the Exposure at Default ("EAD") value to the counterparty is measured under the standardised approach for measuring counterparty credit risk exposures method (previously the Current Exposure Method). The EAD value is derived by adding the gross positive fair value of the contract (replacement cost) to the contracts potential future credit exposure, which is derived by applying a multiple base on the contracts residual maturity to the notional value of the contract, and applying an alpha of 1.4 to the sum of these components.
The following table shows the exposures to counterparty credit risk for derivative contracts as at
December 31, 2019
and
December 31, 2018
:
|
(in millions of $)
|
Gross
Positive
Fair Value of
Contracts
as at
December 31,
2019
|
Potential
Future Credit Exposure as at December 31, 2019 |
Alpha as at December 31, 2019
|
EAD Value
as at December 31, 2019 |
Gross
Positive Fair Value of Contracts as at December 31, 2018 |
Potential
Future Credit Exposure as at December 31, 2018 |
Alpha as at December 31, 2018
|
EAD Value
as at December 31, 2018 |
||||||||||||||||
|
Spot and forward foreign exchange and currency swap contracts
|
32.7
|
|
35.0
|
|
1.4
|
|
94.7
|
|
13.6
|
|
23.0
|
|
1.4
|
|
51.2
|
|
||||||||
Securitizations
The Bank has not, to date, securitized assets that it has originated. The Bank's total exposure to purchased securitization positions as at
December 31, 2019
was
$4.4 billion by market value (compared to $4.1 billion as at
December 31, 2018
), with US Government and federal agencies accounting for the majority of this exposure.
The following table provides an analysis of the Bank's investments in securitization positions by exposure type as at
December 31, 2019
and
December 31, 2018
:
|
Underlying asset type (in millions of $)
|
Exposure Value
as at
December 31,
2019
|
Exposure Value
as at December 31, 2018 |
||||
|
US government and federal agencies
|
4,272.4
|
|
3,828.3
|
|
||
|
Mortgage backed securities — Commercial
|
-
|
|
123.6
|
|
||
|
Mortgage backed securities — Retail
|
129.7
|
|
156.7
|
|
||
|
Asset-backed securities — Student loans
|
12.9
|
|
12.6
|
|
||
|
Total
|
4,415.0
|
|
4,121.2
|
|
||
A combination of ratings published by Fitch, Moody's and S&P are used to derive the external rating to be used under the standardized approach for securitization exposures.
Where more than two credit assessments are available, the two most favorable credit assessments are used and where the two most favorable assessments are different, the less favorable of the two is applied.
84
The following table shows the aggregate amount of the Bank's purchased securitizations as at
December 31, 2019
and
December 31, 2018
broken dow
n by risk weighting:
|
Risk Weight % (in millions of $)
|
Exposure
Value
as at
December 31,
2019
|
Exposure
Value after Credit Risk Mitigation as at December 31, 2019 |
Exposure
Value as at December 31, 2018 |
Exposure
Value after Credit Risk Mitigation as at December 31, 2018 |
||||||||
|
20%
|
4,415.0
|
|
2,035.8
|
|
4,121.2
|
|
2,207.0
|
|
||||
|
50%
|
—
|
|
—
|
|
—
|
|
—
|
|
||||
|
100%
|
—
|
|
—
|
|
—
|
|
—
|
|
||||
|
350%
|
—
|
|
—
|
|
—
|
|
—
|
|
||||
|
Look through to underlying assets
|
—
|
|
—
|
|
—
|
|
—
|
|
||||
|
Total
|
4,415.0
|
|
2,035.8
|
|
4,121.2
|
|
2,207.0
|
|
||||
Operational Risk
In providing our services, we are exposed to operational risk. This is the risk of loss from inadequate or failed internal processes and systems, actions or inactions of people, or from external events. Operational risk is inherent in our activities and can manifest itself in various ways including fraudulent acts, business interruptions, inappropriate behavior of employees, unintentional failure to comply with applicable laws and regulations, cyber-security incidents and privacy breaches or failure of vendors to perform in accordance with their arrangements. These events could result in financial losses, litigation and regulatory fines, as well as other damage to us. Our risk management goal is to keep operational risk at appropriate levels consistent with our risk appetite, financial strength, the characteristics of our businesses, the markets in which we operate and the competitive and regulatory environment to which we are subject.
As we continue to expand our use of technology, we are exposed to various forms of cyber-attacks. We devote significant resources to maintain and regularly upgrade our systems and networks and review the ever changing threat landscape in order to mitigate our exposure to cyber risks. In addition to the policy reviews, we continue to look to implement technology solutions that enhance preventive and detection capabilities and our ability to recover quickly should a successful cyber-attack occur. We assess our third-party vendor controls and have a developed business continuity plan that addresses potential cyber risks. We also maintain insurance coverage that may, subject to policy terms and conditions, cover certain aspects of cyber risks. However, such insurance may be insufficient to cover all losses.
Operational risk is mitigated through internal controls embedded in our business activities and our risk management practices, which are designed to continuously reassess the effectiveness of these controls in order to keep the risk we assume at levels appropriate to our risk appetite as approved by the Board. Data on operational losses and any significant control failures incurred are captured through an incident reporting process. These events are reported to both the GRC and RPCC, which assess the sufficiency of the corrective actions taken by management to prevent recurrence. Both committees also receive regular reporting on actual performance against established risk tolerance metrics.
Capital Adequacy Management
Effective January 1, 2015 the BMA adopted capital and liquidity requirements consistent with Basel III. These requirements are contained within the BMAs "Basel III for Bermuda Banks November 2017 Rule Update" and can be found on their website.
The Group manages its capital both on a total Group basis and, where appropriate, on a legal entity basis. The finance department has the responsibility for measuring, monitoring and reporting capital levels within guidelines and limits established by the RPCC. The management of capital will also involve regional management to ensure compliance with local regulation. In establishing the guidelines and limits for capital, a variety of factors are taken into consideration, including the overall risk of the business in stressed scenarios, regulatory requirements, capital levels relative to our peers, and the impact on our credit ratings.
Capital Assessment and Risk Profiling ("CARP")
Under the requirements of Basel II as implemented by the BMA, the Group undertakes a CARP process, which is an internal assessment of all material risks to determine our capital needs. This internal assessment takes account of the minimum capital requirement and other risks not covered by the minimum capital requirement (Pillar II). Where capital is deemed as not being able to mitigate a particular risk, alternative management actions are identified and described within the CARP. The CARP is presented to the RPCC before being presented to the Board for challenge and approval and then submission to the BMA. The CARP process is performed annually or more frequently should the need arise.
A supervisory assessment process ("SAP") is then undertaken annually by the BMA, which is designed to assess the Group's risk profile as documented in the CARP. This assessment is used to determine and set the Individual Capital Guidance which is the minimum level of capital the Group will be required to hold until the next SAP review is conducted.
85
SUPERVISION AND REGULATION
Bermuda
The Bank is subject to regulation and supervision by the Bermuda Monetary Authority (the "BMA") under:
|
•
|
the Bermuda Monetary Authority Act 1969;
|
|
•
|
the Banks and Deposit Companies Act 1999 (the "BDCA");
|
|
•
|
the Trusts (Regulation of Trust Business) Act 2001;
|
|
•
|
the Investment Business Act 2003;
|
|
•
|
the Exchange Control Regulations 1973;
|
|
•
|
the Corporate Services Provider Business Act 2012; and
|
|
•
|
any applicable code of practice or guidance notes that may be published by the BMA from time to time.
|
The Bank is also subject to regulation by the Minister of Finance in Bermuda under the Companies Act 1981, the Banking (Special Resolution Regime) Act 2016 and the Economic Substance Act 2018. It is also subject to the Deposit Insurance Act 2011 and the Deposit Insurance Rules 2016.
Supervision and Monitoring by the BMA
Our activities are regulated by the BMA and our ability to engage in certain activities is subject to prior approval by the BMA. One of the principal objectives of the BMA is to supervise, regulate and inspect financial institutions which operate in or from within Bermuda and further to promote the financial stability and soundness of such financial institutions. The supervision is primarily for the benefit and protection of the Bank's clients and not for the benefit of our investors. The BMA is also responsible for managing and regulating transactions in foreign currency or gold.
In addition to conducting on-site reviews, the BMA utilizes a comprehensive quarterly statistical return system that enables off-site monitoring of institutions licensed under the BDCA. The statistical system, which follows the standards imposed on banks in the UK by the Financial Conduct Authority and is consistent with Basel Committee Standards, provides the BMA with a detailed breakdown of the Bank's balance sheet and profit-and-loss accounts on both a consolidated and unconsolidated basis. This information enables the BMA to monitor the soundness of the Bank's financial position and ensure that it meets certain capital requirements.
As the Bank's supervisory authority in Bermuda, the BMA is responsible for the consolidated supervision of our worldwide operations. There are also host regulatory bodies performing a similar function to that of the BMA in all major locations in which the Bank operates regulated activities. Many of these local authorities require detailed reporting on the activities of the Bank's subsidiaries located in their jurisdictions. As part of its oversight process, the BMA receives copies of each of these reports on a regular basis and liaises with the regulatory authorities in the respective locations.
From time to time, in the ordinary course of business, the Bank enters into agreements with the BMA under which the Bank agrees to achieve or maintain certain levels of capital and to obtain the BMA's prior approval to take certain corporate actions. Certain actions that may not be taken without prior BMA approval include: (1) creating or increasing the authorized amount of, or issuing any class of shares; (2) repurchasing any class of shares; and (3) entering into a material acquisition.
Under the market disclosure requirements (referred to as Pillar III disclosures) applicable under the Basel III Accord ("Basel III"), the Bank is required to publish information about the risks to which it is exposed. Effective as of January 1, 2015, the BMA adopted capital and liquidity regulatory requirements consistent with Basel III, a framework released by the BCBS. Basel III aims to raise the quality, consistency and transparency of the capital base, limit the build-up of excess leverage and increase capital requirements for the banking sector. Basel III adopts CET1 capital as the predominant form of regulatory capital with the CET1 ratio as a new metric. Basel III also adopts the new LCR and NSFR regimes.
The Basel III regulatory framework adopts a phased implementation approach for Bermuda banks with full implementation on January 1, 2019, consistent with BCBS recommendations. As of January 1, 2019 the Bank is subject to the following requirements:
|
•
|
CET1 as the primary and predominant form of regulatory capital, with a requirement of CET1 of at least 7.0% of RWA, inclusive of a minimum CET1 capital adequacy ratio of 4.5% plus a capital conservation buffer of 2.5%, but excluding the D-SIB surcharge described below. The BMA allowed Bermuda banks to make the one-time irrevocable election to exclude other comprehensive income on their AFS portfolios from CET1 by no later than March 31, 2015;
|
|
•
|
a Tier 1 capital requirement of at least 8.5% of RWA, inclusive of a minimum Tier 1 ratio of 6% and the capital conservation buffer of 2.5% but excluding the D-SIB surcharge described below;
|
|
•
|
a total capital requirement of at least 10.5% of RWA, inclusive of a minimum total capital ratio of 8% and the capital conservation buffer of 2.5% but excluding the D-SIB surcharge described below;
|
|
•
|
the Bank is considered to be a D-SIB and is subject to a 3% surcharge composed of CET1-eligible capital implemented by the BMA effective September 30, 2015. This is based upon its assessment of the extent to which the Bank (individually and collectively with the other Bermuda banks) poses a degree of material systemic risk to the economy of Bermuda due to its role in deposit taking, corporate lending, payment systems and other core economic functions;
|
|
•
|
the inclusion of a countercyclical buffer to be introduced when macro-economic indicators provide an assessment of excessive credit or other pressures building in the banking sector, potentially increasing the Bank's required capital buffer by up to 2.5%;
|
|
•
|
the introduction of a 5% leverage ratio as calculated in accordance with Basel III;
|
|
•
|
an LCR with a minimum requirement of 100%; and
|
|
•
|
a NSFR with a minimum requirement of 100%.
|
The minimum capital ratio requirements set forth above do not reflect additional Pillar II add-on requirements that the BMA may impose upon us as a prudential measure from time to time. As of January 1, 2019 our minimum total capital ratio required by the BMA is 16.3% (inclusive of the minimum required total capital ratio of 10.5% as described above) and our minimum CET1 ratio requirement is 10.0%.
The Bank may from time to time also be subject to additional regulatory requirements imposed by the BMA in its role as Bermuda’s main prudential regulator. In particular, in January 2020, the BMA released Guidance Notes for Relevant Legal Entities, including banks, corporate service providers, trust companies, investment businesses and fund administrators, which require (among other things) these entities to demonstrate good risk management, and to notify the BMA, of any new material outsourcing arrangements. The Bank is required to comply with these Guidance Notes when they come into force on May 1, 2020, and in the interim transitional period the Bank is required to provide the BMA with certain attestations of compliance regarding its existing outsourcing arrangements, and to seek prior approval or provide attestations of compliance of any outsourcing arrangements.
86
Bermuda Monetary Authority Act 1969
The Bermuda Monetary Authority Act 1969 established the BMA as a statutory corporate body responsible for, among other things, supervising, regulating and inspecting any financial institution which operates in or from within Bermuda (which includes the Bank). Specific areas of financial regulation, such as the banking industry, are also the subject of separate, specific legislation (some of which is discussed below), but this specific legislation is nevertheless administered by the BMA in its supervisory capacity. In addition to its supervisory functions, both under the Bermuda Monetary Authority Act 1969 and the specific legislation discussed below, the BMA is empowered to assist foreign regulatory bodies by requiring entities supervised and regulated by the BMA to furnish information on demand to the BMA in connection with foreign regulatory requests.
Banks and Deposit Companies Act 1999
The BDCA prohibits any person from carrying on a deposit-taking business in or from within Bermuda unless that person is a company incorporated in Bermuda and licensed by the BMA under the BDCA. The BDCA provides for three classes of licenses: banking licenses, restricted banking licenses and deposit company licenses. The Bank holds a banking license and a deposit company license. Unless otherwise permitted by the BMA, a company that holds a banking license must provide a range of minimum services to the public in Bermuda, including (without limitation) current accounts in Bermuda dollars, other deposit accounts, loan facilities in Bermuda Dollars, foreign exchange services and credit card or debit card facilities. A company holding a deposit company license typically offers a small range of services but, unless otherwise permitted by the BMA, must also provide some specified services to the public in Bermuda, including (without limitation) savings, deposit or other similar accounts in Bermuda Dollars and loans in Bermuda Dollars secured on mortgages of real property in Bermuda.
As the agency responsible for administering the BDCA, regulating deposit-taking businesses and protecting depositors, the BMA has broad authority to compel companies licensed under the BDCA to take or cease specific actions and comply with informational or access requests. Under the BDCA, the BMA can, or can compel these companies, including us to, among other things, do any or all of the following:
|
•
|
provide such information as the BMA may reasonably require;
|
|
•
|
submit a report prepared by the Bank's auditors or by an accountant or other person with professional skills on any matter about which the BMA could require us to provide information;
|
|
•
|
produce documentation or other information as the BMA may reasonably require; and
|
|
•
|
permit any officer, servant or agent of the BMA, on producing evidence of his authority, to enter the Bank's premises to obtain information and documents.
|
In addition, the BMA has the power to do any or all of the following:
|
•
|
examine, copy or retain any documents relating to the Bank's deposit-taking business;
|
|
•
|
require the Bank to take certain steps or to refrain from adopting or pursuing a particular course of action or to restrict the scope of the Bank's business in a particular way;
|
|
•
|
appoint competent persons to investigate and report to the BMA on the Bank's business or the Bank's ownership and control;
|
|
•
|
restrict the scope of a license or revoke a license; and
|
|
•
|
vary, suspend or revoke the Bank's banking license and to give directions if it feels these are necessary to protect the Bank's depositors.
|
The Bank's failure to comply with any of the statutory requirements set forth in the BDCA could result in civil or criminal penalties.
The Bank is required to report certain transactions to the BMA. These include any transaction or transactions relating to any one person as a result of which the Bank would be exposed to a risk of incurring losses in excess of 10% of the Bank's available capital resources, or where the Bank proposes to enter into a transaction or transactions relating to any one person, which, either alone or together with previous transactions entered into by the Bank in relation to the same person, would result in the Bank being exposed to the risk of incurring losses in excess of 25% of its available capital resources. This also applies where the transaction relates to different persons if they are connected in such a way that the financial soundness of any of them may affect the financial soundness of the others or the same factors may affect the financial soundness of both or all of them. The BMA may extend the scope of this requirement to the Bank's subsidiaries even if these subsidiaries are not licensed under the BDCA as if the transactions and available capital resources of the Bank's subsidiaries were included in the Bank's available capital resources. For the purpose of the foregoing, the transactions which must be reported by the Bank to the BMA are those between the Bank and a person where:
|
(a)
|
that person incurs an obligation to the Bank or as a result of which such person may incur such an obligation;
|
|
(b)
|
the Bank will incur, or as a result of which it may incur, an obligation in the event of that person defaulting on an obligation to a third party; or
|
|
(c)
|
the Bank acquires or incurs any obligation to acquire, or as a result of which it may incur an obligation to acquire, an asset the value of which depends wholly or mainly on that person performing their obligations or otherwise on his financial soundness.
|
The risk of loss attributable to the transaction is, in a case within paragraph (a) or (b), the risk of the person concerned defaulting on the obligation there mentioned and, in a case within paragraph (c), the risk of the person concerned defaulting on the obligations there mentioned or of a deterioration in such person's financial soundness. The Bank's available capital resources may be determined by the BMA, after consultation with it and in accordance with principles published by the BMA, which are currently the Basel III principles described above. It is an offense for the Bank to fail to make the required reports.
Under the BDCA, any person who becomes a significant shareholder of a deposit-taking institution, which is defined to include persons, either individually or with associates, who (i) hold 5% or more of the shares in the institution or another company of which it is a subsidiary company; or (ii) is entitled to exercise, or control the exercise of 5% or more of the voting power at any general meeting of the institution or of another company of which it is such a subsidiary, must notify the BMA in writing of that fact within seven days. Failure to provide the BMA with prompt and appropriate notice would constitute an offense that could result in a fine.
The BDCA prohibits a person from becoming a shareholder controller of any company licensed under the BDCA unless the person provides written notice to the BMA of his intent to do so and the BMA does not object. The definition of shareholder controller is set out in the BDCA but generally refers to a person who, among other things, either alone or with any associate or associates (within the meaning of the BDCA) (i) holds 10% or more of the shares in the licensed institution or another company of which it is a subsidiary company; or (ii) is entitled to exercise, or control the exercise of 10% or more of the voting power at any general meeting of the licensed institution or another company of which it is such a subsidiary. The BDCA distinguishes between shareholder controllers of the following threshold descriptions: "10% shareholder controllers," "20% shareholder controllers," "30% shareholder controllers," "40% shareholder controllers," "50% shareholder controllers," "60% shareholder controllers" and "principal shareholder controllers" who have a 75% or greater interest. A person who intends to become a shareholder controller, or a shareholder controller who intends to increase his shareholding/control, meaning generally, ownership of shares or the ability to exercise or control the exercise of voting rights attached to shares, beyond his present threshold, must provide written notice to the BMA that he intends to do so. It is an offense not to give this notice. The BMA may object to a person's notice of intent to become a shareholder controller of
87
any description or to an existing shareholder controller seeking to increase their control where it appears to the BMA that, among other things, such person is not or is no longer a fit and proper person to be such controller of the institution. If the BMA objects, the BMA will provide such person with written notice of its objection.
Prior to serving a notice of objection, the BMA shall serve the person seeking to become a shareholder controller of any description or existing shareholder controller seeking to increase their control with a preliminary written notice stating that the BMA is considering service on that person of a notice of objection, and that notice shall state among other things, the reasons for the BMA's proposed objection. The statement of the BMA's reasons for their proposed objection will, however, be subject to the BMA's determination that such statement would not involve the disclosure of confidential information, the disclosure of which would be prejudicial to a third party. A person served with a preliminary written notice may, within a period of 28 days beginning with the day on which the notice is served, make written representations to the BMA and the BMA shall take any such representations into account in deciding whether to serve a notice of objection.
If three months pass from the date of giving notice of intent to the BMA without the BMA serving a notice of objection, then the person may become a shareholder controller as requested in the notice of intent. In practice, the BMA's procedure is generally to respond to a shareholder controller notification of intent.
If a person becomes a shareholder controller or increases their shareholding/control in spite of the BMA's objection thereto, if a shareholder controller fails to comply with the foregoing notice requirements or if a shareholder controller continues as such after being given notice of objection to his or her being a shareholder controller, the BMA may take the actions specified in the BDCA, including revoking the relevant license where a 50%, 60% or principal shareholder controller is involved, or mandating that any specified shares become subject to one or more of the following restrictions:
|
•
|
any transfer of or agreement to transfer those shares or, in the case of unissued shares, any transfer of or any agreement to transfer the right to be issued with them, will be void;
|
|
•
|
no voting rights may be exercisable in respect of the shares;
|
|
•
|
no further shares may be issued in right of them or pursuant to any offer made to their holder; or
|
|
•
|
except in liquidation, no payment may be made of any sums due from the institution on the shares, whether in respect of capital or otherwise.
|
A court in Bermuda may, on the application of the BMA, order the sale of any such shares. Any person may appeal to a tribunal constituted under the BDCA for a review of a notice of objection given by the BMA as described above. However, this right of appeal does not apply to a person in any case in which such person has failed to give a notice or has become or continued to be a controller in contravention of the BDCA. In addition, if a person has had its license revoked or has been subject to any of the restrictions set forth above, the tribunal may confirm or reverse the decision which is the subject of the appeal but shall not have power to vary it except:
|
•
|
where the decision was made to impose or vary any restriction, the tribunal may direct the BMA to impose different restrictions or to vary them in a different way; or
|
|
•
|
where the decision was to revoke a license, the tribunal may direct the BMA to restrict it instead.
|
In the event that the BMA imposes any of the restrictions listed above, the restrictions may apply to:
|
•
|
all shares of the institution where the person in question is a shareholder controller that (i) are held by him or any associate of his, and (ii) were not so held immediately before he became such shareholder controller of the institution; and
|
|
•
|
all shares in another company where the person in question became a shareholder controller (i) as a result of the acquisition by him or any associate of his of shares in such other company, and (ii) the shares were not so held before he became a shareholder controller of such institution.
|
A company licensed under the BDCA must give written notice to the BMA in the event that any person has either become or ceased to be a director, controller or senior executive of such licensed company. The written notice is required to be given to the BMA within 14 days beginning with the day on which the licensed company becomes aware of the relevant change in director, controller or senior executive. The definition of "controller" is set out in the BDCA but generally refers to (i) a shareholder controller, a managing director or chief executive officer of the institution or of another company of which it is a subsidiary, or (ii) a person whose duties include directing the actions of the board of directors of the licensed company or of another company of which it is a subsidiary, or (iii) a person whose duties include directing the actions of any shareholder controller of the institution.
Trusts (Regulation of Trust Business) Act 2001
The principal purpose of the Trusts (Regulation of Trust Business) Act 2001 (the "Trusts Business Act"), is to regulate "trust business," which is generally defined as providing the services of a trustee as a business, trade, profession or vocation. Under the Trusts Business Act, a license is required to conduct trust business in or from within Bermuda. Licenses are designated as either "unlimited" or "limited." Only bodies corporate are entitled to obtain unlimited licenses, which allow them to conduct trust business and solicit business from the public generally. Holding a license under the Trust Business Act obliges the licensed undertaking to maintain a physical presence in Bermuda at which the licensed undertaking is directed and managed. A licensed undertaking is also required to hold all client funds separately from its own funds or funds held in respect of any other business and maintain such books of account and other records such that client funds may be readily identified at any time.
At present, the Bank and certain of its subsidiaries hold unlimited licenses issued by the BMA pursuant to the Trusts Business Act. Pursuant to Section 6 of the Trusts Business Act, the BMA has published a Statement of Principles, in accordance with which it is acting or purporting to act with respect to the exercise of its powers under the Trusts Business Act, including (without limitation) the BMA's minimum licensing criteria, the grounds for revocation of licenses, the power to grant, revoke or restrict a license and the power to obtain information or require the production of documents. As at December 31, 2019, the BMA amended the minimum licensing criteria under the Trusts Business Act, such that a licensed undertaking is not regarded as conducting its business in a prudent manner (which is a requirement for licensing) unless it maintains or will maintain adequate liquidity, having regard to the relationship between its assets and its actual and contingent liabilities, to the time at which those liabilities will or may fall due and its assets mature, and to other factors appearing to the BMA to be relevant. In addition, pursuant to Section 7 of the legislation, the BMA published a Code of Practice that provides guidance as to the duties, requirements, procedures, standards and principles to be observed by persons carrying on trust business under the Trusts Business Act.
The BMA's powers under the Trusts Business Act include (without limitation) the power to:
|
•
|
impose conditions on a license with respect to scope and type of business, to protect a client or potential client of a licensee;
|
|
•
|
revoke a license in certain circumstances including if the licensee has not complied with the licensing criteria; and
|
|
•
|
request and obtain information from a licensee to ensure compliance with the Trusts Business Act, and to safeguard the interests of the licensee's clients.
|
The Trusts Business Act prohibits a person from becoming a 10% shareholder controller or a majority shareholder controller of a licensed company, unless such person provides written notice to the BMA of his intent to do so and the BMA does not object. It is an offense not to provide this notice. The definition of shareholder controller is set out in the Trusts Business Act, but generally refers to a person who, among other things, either alone or with any associate or associates (within the meaning of the Trusts Business Act) (i) holds 10% or more of the shares in the licensed company or another company of which it is a subsidiary company; or (ii) is entitled to exercise, or control the
88
exercise of 10% or more of the voting power at any general meeting of the licensed company or another company of which it is such a subsidiary. A "majority shareholder controller" is defined under the Trusts Business Act as a shareholder controller which, among other things, (i) holds 50% or more of the issued and outstanding shares in the licensed company; or (ii) is entitled to exercise, or control the exercise of 50% or more of the voting power at any general meeting of the licensed company.
The BMA may object to a person's notice of intent to become a 10% shareholder controller or majority shareholder controller or may object to an existing shareholder controller of any description where it appears to the BMA that, among other things, such person is not or is no longer a fit and proper person to be such a controller of the licensed company. If the BMA objects, the BMA will provide such person with a written notice of objection. Prior to serving any such notice of objection, the BMA shall serve the person seeking to become a shareholder controller or the existing shareholder controller with a preliminary written notice stating that the BMA is considering service on that person of a notice of objection, stating, among other things, the reasons for the BMA's proposed objection. The statement of the BMA's reasons for its proposed objection will, however, be subject to the BMA's determination that such statement would not involve the disclosure of confidential information, the disclosure of which would be prejudicial to a third party. A person served with a preliminary written notice may, within a period of 28 days beginning with the day on which the notice is served, make written representations to the BMA and the BMA shall take any such representations into account in deciding whether to serve a notice of objection.
If three months pass from the date of notifying the BMA of a new shareholder controller or an increased shareholding/control beyond a shareholder controller's then current threshold, without the BMA serving a notice of objection, then the person may become a shareholder controller as requested in the notice. In practice, the BMA's procedure is generally to respond to a person's shareholder controller notification.
If a person becomes a shareholder controller or increases their shareholding control, in spite of the BMA's objection thereto, if a shareholder controller fails to comply with the foregoing notice requirements or if a shareholder controller continues as such after being given notice of objection to his being a shareholder controller, the BMA may take certain actions, including revoking the relevant license where a shareholder controller holding 50% or more of the shares of the licensed company is involved or mandating that any specified shares become subject to one or more of the following restrictions:
|
•
|
any transfer of or agreement to transfer those shares or, in the case of unissued shares, any transfer of or any agreement to transfer the right to be issued with them, will be void;
|
|
•
|
no voting rights may be exercisable in respect of the shares;
|
|
•
|
no further shares may be issued in right of them or pursuant to any offer made to their holder; or
|
|
•
|
except in liquidation, no payment may be made of any sums due from the licensed company on the shares, whether in respect of capital or otherwise.
|
A court in Bermuda may, on the application of the BMA, order the sale of any such shares. Any person may appeal to a tribunal constituted under the Trusts Business Act for a review of a notice of objection given by the BMA as described above. However, this right of appeal does not apply to a person in any case in which such person has failed to give a notice or has become or continued to be a controller in contravention of the Trusts Business Act. In addition, if a person has had its license revoked or has been subject to any of the restrictions set forth above, the tribunal may confirm or reverse the decision which is the subject of the appeal but shall not have power to vary it except:
|
•
|
where the decision was made to impose different restrictions or vary them in a different way, the tribunal may direct the BMA to impose different restrictions; or
|
|
•
|
where the decision was to revoke a license, the tribunal may direct the BMA to restrict it instead.
|
In the event that the BMA imposes any of the restrictions listed above, the restrictions may apply to:
|
•
|
all shares of the licensed company of which the person in question is a shareholder controller that (i) are held by him or any associate of his, and (ii) were not so held immediately before he became such shareholder controller of the licensed company; and
|
|
•
|
all shares in another company where the person in question became a shareholder controller (i) as a result of the acquisition by him or any associate of his of shares in such other company, and (ii) the shares were not so held before he became a shareholder controller of such licensed company.
|
A company licensed under the Trusts Business Act must give written notice to the BMA in the event that any person has either become or ceased to be a controller or officer of such licensed company. The written notice is required to be given to the BMA within 14 days beginning with the day on which the licensed company becomes aware of the change in controller or officer. The definition of "controller" is set out in the Trusts Business Act but generally refers to (i) a shareholder controller, a managing director or chief executive officer of the licensed company or of another company of which it is a subsidiary; or (ii) a person whose duties include directing the actions of the board of directors of the licensed company or of another company of which it is a subsidiary; or (iii) a person whose duties include directing the actions of any shareholder controller of the licensed company. The definition of "officer" under the Trusts Business Act, includes a director, secretary or any senior executive.
Investment Business Act 2003
The Investment Business Act 2003 (the "Investment Business Act") prohibits any person from carrying on, or purporting to carry on, an investment business in or from within Bermuda unless that person holds a license granted under the Investment Business Act, or is exempted from holding a license. The Investment Business Act defines "investment business" broadly as the business of dealing in investments, arranging deals in investments, managing or offering investments and giving advice on investments.
Under the Investment Business Act, the BMA is given the authority to grant licenses and to supervise license holders. The BMA will only grant a license if it is satisfied that the applicant complies with licensing criteria set out in the Investment Business Act, which include (without limitation) that controllers and senior executives of the applicant are fit and proper persons to carry on such business, the applicant company's business is effectively directed by at least two individuals (unless the BMA otherwise approves), the Board of the applicant has a number of independent directors considered appropriate by the BMA, the applicant's business is conducted in a prudent manner, the position of the applicant in the group does not obstruct effective consolidated supervision and the applicant will carry on the investment business with integrity and professional skill appropriate to the nature and scale of its activities.
At the present time, the Bank's wholly owned subsidiaries Butterfield Trust (Bermuda) Limited, Butterfield Securities (Bermuda) Limited and Butterfield Asset Management Limited hold licenses under the Investment Business Act.
Under the Investment Business Act the BMA may require an accountant's report on a license holder or the appointment of an inspector to carry out an investigation into the affairs of a license holder and/or demand the production of documents or information relating to the investment business of a license holder. The Investment Business Act also grants the BMA broad powers to enforce the provisions of the Investment Business Act, including (without limitation) powers to issue directions, to vary, suspend or cancel a license, to appoint a custodian manager of an offending investment business, to levy fines and to seek from the court injunctions and restitution orders. If the BMA considers that an investment provider knowingly and willfully has breached any condition imposed on its license, the licensing criteria or any other duty or obligation under the Investment Business Act, or has been carrying on investment business in a manner detrimental to the interest of its clients and creditors, or contrary to the public's interests, the BMA may issue a direction of compliance, or vary, suspend or cancel the license of the investment provider, appoint a custodian manager to manage the investment business, impose civil penalties, or publicly censure an investment provider.
89
The Investment Business Act prohibits a person from becoming a 10% shareholder controller or a majority shareholder controller of an investment provider, unless such person provides written notice to the BMA of his intent to do so and the BMA does not object. It is an offense not to provide this notice. The definition of 10% shareholder controller is set out in the Investment Business Act, but generally refers to a person who, among other things, either alone or with any associate or associates (within the meaning of the Investment Business Act) (i) holds 10% or more of the shares in the investment provider or its parent undertaking; or (ii) is entitled to exercise, or control the exercise of 10% or more of the voting power in the investment provider or in the parent undertaking. A "majority shareholder controller" is defined under the Investment Business Act as a shareholder controller which (i) holds 50% or more of the issued and outstanding shares in the investment provider or its parent undertaking; or (ii) is entitled to exercise, or control the exercise of 50% or more of the voting power in the investment provider or in the parent undertaking.
The BMA may object to a person's notice of intent to become a 10% shareholder controller or majority shareholder controller or to an existing shareholder controller of any description where it appears to the BMA that, among other things, such person is not or is no longer a fit and proper person to be such controller of the licensed company. If the BMA objects, the BMA will provide such person with a written notice of objection. Prior to serving any such notice of objection, the BMA serves the person seeking to become a shareholder controller or will serve an existing shareholder controller with a preliminary written notice stating that the BMA is considering service on that person of a notice of objection, stating, among other things, the reasons for the BMA's proposed objection. The statement of the BMA's reasons for their proposed objection will, however, be subject to the BMA's determination that such statement would involve the disclosure of confidential information, the disclosure of which would be prejudicial to a third party. A person served with a preliminary written notice may, within a period of 28 days beginning with the day on which the notice is served, make written representations to the BMA and the BMA shall take any such representations into account in deciding whether to serve a notice of objection.
If three months pass from the date of notifying the BMA of a new shareholder controller or an increased shareholding/control beyond a shareholder controller's then current threshold, without the BMA serving a notice of objection, then the person may become a shareholder controller as requested in the notice. In practice, the BMA's procedure is generally to respond to a person's shareholder controller notification.
If a person becomes a shareholder controller or increases their shareholding/control in spite of the BMA's objection to his becoming a shareholder controller or if a shareholder controller fails to comply with the foregoing notice requirements or if a shareholder controller continues as such after being given notice of objection to his being a shareholder controller, the BMA may take certain actions, including revoking the relevant license where a shareholder controller holding 50% or more of the shares of the licensed company is involved or mandating that any specified shares become subject to one or more of the following restrictions:
|
•
|
any transfer of or agreement to transfer those shares or, in the case of unissued shares, any transfer of or any agreement to transfer the right to be issued with them, will be void;
|
|
•
|
no voting rights may be exercisable in respect of the shares;
|
|
•
|
no further shares may be issued in right of them or pursuant to any offer made to their holder; or
|
|
•
|
except in liquidation, no payment may be made of any sums due from the investment provider on the shares, whether in respect of capital or otherwise.
|
A court in Bermuda may, on the application of the BMA, order the sale of any such shares. Any person may appeal to a tribunal constituted under the Investment Business Act for a review of a notice of objection given by the BMA as described above. However, this right of appeal does not apply to a person in any case in which such person has failed to give a notice or has become or continued to be a controller in contravention of the Investment Business Act. In addition, if a person has had its license revoked or has been subject to any of the restrictions set forth above, the tribunal may confirm or reverse the decision which is the subject of the appeal but shall not have power to vary it except:
|
•
|
where the decision was made to impose or vary any restriction, the tribunal may direct the BMA to impose different restrictions or to vary them in a different way; or
|
|
•
|
where the decision was to revoke a license, the tribunal may direct the BMA to restrict it instead.
|
In the event that the BMA imposes any of the restrictions listed above, the restrictions may apply to:
|
•
|
all shares of the investment provider of which the person in question is a shareholder controller that (i) are held by him or any associate of his; and (ii) were not so held immediately before he became such shareholder controller of the investment provider; and
|
|
•
|
all shares in another company where the person in question became a shareholder controller (i) as a result of the acquisition by him or any associate of his of shares in such other company; and (ii) the shares were not so held before he became a shareholder controller of such investment provider.
|
A company licensed under the Investment Business Act must give written notice to the BMA in the event that any person has either become or ceased to be a controller or officer of such investment provider. The written notice is required to be given to the BMA within 14 days beginning with the day on which the investment provider becomes aware of the change in controller or officer. The definition of "controller" is set out in the Investment Business Act but generally refers to a shareholder controller, a managing director or chief executive officer of the investment provider or of another company of which it is a subsidiary, or a person whose duties include directing the actions of any shareholder controller of the investment provider. The definition of "officer" under the Investment Business Act, includes a director, secretary or any senior executive.
Corporate Service Provider Business Act 2012
The Corporate Service Provider Business Act 2012 (“CSPB”) regulates persons carrying on a corporate service provider business in Bermuda. “Corporate service provider business” in this context means the provision of any of the following services for a profit: (i) acting as a company formation agent; (b) providing nominee services, including (among other things) providing nominee shareholders; (c) providing administrative and secretarial services to companies or partnerships (including, among other things, providing a registered office and maintaining the books and records of a company or partnership); (d) performing functions in the capacity as a resident representative under various Bermuda statutes; and (e) providing any other corporate or administrative services as may be specified in regulations made under the CSPB. Under the CSPB, the Bank or any of its subsidiaries are required to hold a corporate service provider license to lawfully provide corporate services to our customers in Bermuda. Licensing under the CSPB is administered by the BMA. Holding a license under the CSPB obliges the licensed undertaking to maintain a physical presence in Bermuda at which the licensed undertaking is directed and managed. A licensed undertaking is also required to hold all client funds separately from its own funds or funds held in respect of any other business and maintain such books of account and other records such that client funds may be readily identified at any time.
Pursuant to the provisions of the CSPB any person who, together with their associates (within the meaning of the CSPB), intends to become either a shareholder controller or a majority shareholder controller of a CSPB licensed entity, must first serve notice of their intent to do so on the BMA and either receive a notice of non-objection from the BMA, or wait for the expiration of a three month period starting from the date of the notice to the BMA without the BMA having served a written notice of objection. A “shareholder controller” under the CSPB is any person who, either alone or with any associate or associates, (i) holds 10% or more of shares of the licensed entity (if it is a company) or 10% or more of another company of which the licensed entity is a subsidiary; (ii) is entitled to control or control the exercise of 10% or more of the voting power at any general meeting of the licensed entity (if it is a company) or of another company of which the licensed entity is a subsidiary; or (iii) is able to exercise a significant influence over the management of a licensed entity or of another company of which the licensed entity is a subsidiary by virtue of holding shares in or an entitlement to exercise or control
90
the exercise of the voting power at any general meeting of either the licensed entity (if it is a company) or its holding company. A “majority shareholder controller” under the CSPB has the same meaning as limbs (i) and (ii) in the preceding sentence, save that the relevant percentage threshold for ownership is 50% or more.
In addition to the requirement to notify and obtain BMA non-objection (whether express or deemed) of any change in shareholder controller or majority shareholder controller of a CSPB licensed entity, if at any time it appears to the BMA that a person who is a “controller” of any description of a CSPB licensed entity is not a fit and proper person for such role, the BMA may serve a written notice of objection to that controller; provided that, before serving such a notice, the BMA must serve that person with a preliminary written notice stating that the BMA is considering service on that person of a notice of objection, specifying the reasons for which it appears to the BMA why that person is not or is no longer a fit and proper person and advising as to the rights of that person to make written representations to the BMA within 28 days beginning on the day on which such notice is served, and that such written representations shall be taken into account by the BMA in deciding whether to serve a notice of objection. For these purposes a “controller” includes (i) a managing director of a licensed entity or the licensed entity’s holding company; (ii) the CEO of the licensed entity or the licensed entity’s holding company; and (iii) a person in accordance with whose directions or instruction the directors of the licensed entity (or its holding company) are accustomed to act. Upon determining that any individual is not a fit and proper person, the BMA may pass a prohibition order, thereby preventing that individual from exercising any functions in connection with any business requiring licensing under the CSPB. Furthermore, under the CSPB, a licensed entity is required to give written notice to the BMA of any person becoming or ceasing to be a controller or an “officer” (director, company secretary or senior executive) of the licensed entity.
Breaches of the CSPB are punishable by a range of criminal and civil penalties including fines, imprisonment and public censure; breaches can result in the licensed entity losing its license and therefore its ability to conduct corporate service provider business. The BMA is also empowered to restrict a controller’s ability to sell any shares (and exercise any rights in respect of such shares) held by the controller in a CSPB licensed entity if they continue to be or become a controller following a notice of objection from the BMA.
Companies Act 1981
As a local company incorporated in Bermuda, the Bank is subject to the Companies Act 1981 (the "Companies Act"). Under section 114 of the Companies Act, no local company may carry on business of any sort in Bermuda unless, among other things, (i) it complies with the control and ownership requirements set out in Part I of the Third Schedule of the Companies Act; (ii) it is licensed under section 114B of the Companies Act and is carrying on such business in accordance with the terms and conditions imposed in such license; or (iii) its shares are listed on a designated stock exchange and the company is engaged as a business in a material way in a prescribed industry pursuant to section 114(1)(e) of the Companies Act.
In December 2000, the Minister of Finance issued to the Bank a license pursuant to section 114B of the Companies Act allowing the Bank to carry on business in Bermuda without complying with certain provisions of the Third Schedule to the Companies Act. Effective June 10, 2016, the Bank relinquished its section 114B license and carries on business in Bermuda without complying with the provisions of the Third Schedule in reliance upon the exemption in section 114(1)(e) of the Companies Act. The Bank qualifies for this statutory exemption by virtue of (i) the listing of the Bank's shares on the BSX, which is a "designated stock exchange" for the purposes of the Companies Act and (ii) the Bank's material business of banking, which is a "prescribed industry" for the purposes of the Companies Act.
Exchange Control
The Bank is designated as resident in Bermuda for exchange control purposes.
The BMA has given its consent for the issue and free transferability of all of the common shares to and between non-residents of Bermuda for exchange control purposes, provided the Bank's shares remain listed on an appointed stock exchange, which includes the NYSE. Approvals or permissions given by the BMA do not constitute a guarantee by the BMA as to our performance or our creditworthiness. Accordingly, in giving such consent or permissions, the BMA shall not be liable for the financial soundness, performance or default of our business or for the correctness of any opinions or statements expressed in this report.
Financial Crime Regulation
Bermuda has enacted a number of laws relating to combating money laundering and terrorist financing. The Proceeds of Crime Act 1997 (as amended), the Anti-Terrorism (Financial and other Measures) Act 2004, the Proceeds of Crime (Anti-Money Laundering and Anti-Terrorist Supervision and Enforcement) Act 2008 and the Proceeds of Crime (Anti-Money Laundering and Anti-Terrorist Financing) Regulations 2008, the Financial Intelligence Agency Act 2007, and the Anti-Terrorism (Financial and Other Measures) (Businesses in Regulated Sector) Order 2008.
The Bank may be regulated together with its branches and subsidiaries in respect of anti-money laundering and anti-terrorist financing policies and procedures as a “financial group” if so designated by the Bermuda minister responsible for justice. Furthermore, under the Bribery Act 2016 of Bermuda, the Bank may be guilty of an offense if persons associated with the Bank (which can include the Bank’s employees, agents or subsidiaries) bribe another person intending to obtain or retain business for the Bank or to obtain or retain an advantage in the conduct of business for the Bank. It is a defense to such offenses if the Bank proves that it has in place adequate procedures designed to prevent persons associated with the Bank from undertaking such bribery.
Stamp Duty
Stamp duty is a tax in Bermuda imposed on written documents. The governing legislation is the Stamp Duties Act 1976, as amended (the "Stamp Duties Act"). The Stamp Duties Act sets out the instruments that are subject to stamp duty, which generally include certain instruments or documents as specified in the Stamp Duties Act that are executed in Bermuda or, if executed outside of Bermuda, are then brought into Bermuda.
There are certain limited stamp duty exemptions under the Bermuda Stock Exchange Company Act 1992 (the ‘‘BSX Act’’), which extend to local companies, the securities of which are listed on the BSX. The Bank’s common shares are currently listed on the NYSE and BSX. Pursuant to the BSX Act, the provisions of the Stamp Duties Act will not apply to any instrument which relates to (i) a conveyance or transfer on sale, (ii) a conveyance or transfer to effect or having the effect of a voluntary disposition inter vivos, or (iii) any agreement for the lending and borrowing, of any securities which are listed on the BSX. Accordingly, for so long as the common shares of the Bank remain listed on the BSX (and to the extent any other securities issued by the Bank are listed on the BSX), the forgoing stamp duty exemptions under the BSX Act would apply. However, dealings in the Bank’s common shares beyond the limited exemptions under the BSX Act may attract stamp duty under various heads of the Schedule to the Stamp Duties Act. For example, ad valorem stamp duty may be payable (i) where security is granted over shares of the Bank, (ii) where shares of the Bank form part of a deceased’s estate and probate is sought, and (iii) on a share certificate where the share is issued by the Bank for the first time at a premium in excess of the par value thereof.
The Stamp Duties Act prescribes the persons liable to pay the stamp duty, whether the amount of duty is a fixed or ad valorem amount and the time period in which the duty must be paid, depending on the nature of the instrument. The Stamp Duties Act also sets out the consequences for failure to stamp instruments which are subject to duty.
Generally, if a stampable document has been executed in Bermuda or has been executed outside of Bermuda and then brought into Bermuda and stamp duty is not paid, the document is not valid for any purpose (including registration) in Bermuda, until such time as it is stamped. In addition, a stampable document which is not stamped
91
(i) is not admissible in court proceedings in Bermuda, except in criminal proceedings or stamp duty violation prosecutions; and (ii) may not be acted upon, filed, or registered by any public official or by any company. For any instrument which is liable to stamp duty that is not duly stamped, every person who is specified in the Stamp Duties Act as liable for stamping commits an offense.
Limits on Shareholding
Generally, limits are imposed by the Companies Act on the percentage of shares in a local company carrying on business in Bermuda which may be held by persons who are non-Bermudian as that term is defined in the Companies Act. As described above, although the Bank relies on an exemption under section 114(1)(e) of the Companies Act to these ownership requirements and related control requirements, the bye-laws of the Bank currently restrict the voting rights of a person who is not "Bermudian" (as such term is defined in the Companies Act) and who is "interested" (as such term is defined in the bye-laws) in the shares of the Bank which constitute more than 40% of all shares then issued and outstanding is not entitled to vote the shares which are in excess of such 40% interest at any general meeting without the prior written approval of the Minister of Finance.
In addition, there are certain prior approval requirements pursuant to the BDCA, the Trusts Business Act and the Investment Business Act with respect to any person who seeks to become a "shareholder controller" (as defined in each of those Acts) of the Bank.
Deposit Insurance Scheme
Pursuant to the Deposit Insurance Act 2011 and the Deposit Insurance Rules 2016 of Bermuda, a Deposit Insurance Scheme (“DIS”) has come into effect in Bermuda. The DIS is administered by the Bermuda Deposit Insurance Corporation. The DIS is designed to protect the deposits of individuals, charities, unincorporated associations, partnerships, sole proprietors and small businesses by guaranteeing up to $25,000 of their aggregate Bermuda Dollar deposits in the event of a Bermuda deposit taking institution’s failure. The DIS is backed by a Deposit Insurance Fund which is in turn funded from premium contributions that are payable by all banks and credit unions licensed by the BMA . As a bank licensed by the BMA, we are required to be a member of the DIS and pay contributions to the Deposit Insurance Fund. Currently, our premium contribution is calculated by the Bermuda Deposit Insurance Corporation as 0.25% per annum of the average total amount of our Bermuda Dollar deposits that are covered by the DIS guarantee over a rolling three-month period based on information disclosed by us to the Bermuda Deposit Insurance Corporation. Each contribution to the Deposit Insurance Fund is payable every three months in arrears.
Personal Information Protection Act, 2016
Bermuda’s principal data protection legislation is the Personal Information Protection Act 2016 (“PIPA”). PIPA applies to every organization (which includes any individual, entity or public authority) that uses personal information in Bermuda where that personal information is used by automated or other means which form, or are intended to form, part of a structured filing system. For the purposes of PIPA, “personal information” means any information about an identified or identifiable individual (meaning a natural person), and “use” or “using” are very broadly defined and effectively include possessing or carrying out any operation on personal information. The Bank uses and holds individuals’ personal information in Bermuda, so must comply with the provisions of PIPA.
The majority of the operative provisions of PIPA, which include certain personal information privacy rights for individuals and specific obligations on organizations that control the processing of personal information, are not yet in force in Bermuda. The first Bermuda Privacy Commissioner was appointed with effect from January 20, 2020, and this appointment is an important step in bringing the remaining operative provisions of PIPA into force. However, as of February 2020 there is still no clear timetable for the publication of PIPA codes of practice or the actual implementation of the remaining operative provisions.
The Cayman Islands
The Cayman Islands Monetary Authority
("CIMA")
Our activities in the Cayman Islands are monitored by CIMA. CIMA is responsible for currency management, regulation and supervision of the Cayman Islands financial services sector (which includes securities and investments business, banking, insurance and fiduciary services), advice to the Cayman Islands government and cooperation with overseas regulatory authorities. CIMA's principal focus is to promote and maintain a sound financial system in the Cayman Islands and to promote and enhance market confidence, consumer protection and the reputation of the Cayman Islands as a financial center.
CIMA has broad statutory powers of enforcement. These powers are intended to permit CIMA to have access to information held or maintained by a licensee as necessary and to enable CIMA to take appropriate remedial action if a licensee is in default of its obligations under applicable laws.
Relevant Legislation/Regulations
Banks & Trust Companies Law (2020 Revision)
The Banks and Trust Companies Law (2020 Revision) (the "BATCL") provides that it is an offense to conduct banking business or trust business without the appropriate license. Bank of Butterfield (Cayman) Limited holds a category "A" banking license and a trust license, both issued by CIMA.
The BATCL is supplemented by certain regulations which, among other things, prescribe the fees that are payable by licensees and certain information that must be submitted to CIMA in connection with any license application.
Licensees must adhere to certain capital adequacy requirements and must file audited financial statements with CIMA within three months of their financial year-end. Prior written approval of CIMA is required in a number of circumstances including, but are not limited to, the issue, transfer or disposal of any shares, the appointment of a new director or senior officer or where the licensee wishes to conduct business that deviates from its business plan submitted at the time of its license application.
Securities Investment Business Law (2020 Revision), as amended
The Securities Investment Business Law (2020 Revision), as amended (the "SIBL") provides that a person shall not carry on, or purport to carry on, securities investment business in or from the Cayman Islands unless that person is for the time being licensed under SIBL or is exempted from the requirement to hold a license pursuant to SIBL. Butterfield Bank (Cayman) Limited holds a securities investment business license, issued by CIMA, to conduct its business.
SIBL is essentially designed to achieve the licensing and regulation of securities investment providers and applies to (i) any company, foreign company or partnership incorporated or registered in the Cayman Islands and carrying on "securities investment business" anywhere in the world, or (ii) any entity which has a "place of business" in the Cayman Islands through which "securities investment business" is carried on. The entity need not have a physical presence in the Cayman Islands in order for such entity to fall within the ambit of SIBL.
92
Certain activities are explicitly excluded that would otherwise fall within the definition of securities investment business. In addition, SIBL exempts certain persons who are engaged in securities investment business with, among other things, sophisticated or high net worth persons (as such terms are defined in SIBL) from the full licensing requirements of SIBL, provided that they file an annual declaration with CIMA and pay an annual fee.
Insurance Law, 2010 (as amended)
CIMA regulates the insurance industry in the Cayman Islands pursuant to the Insurance Law, 2010 (as amended) (the "IL"). Such regulation includes licensing, ongoing supervision, and enforcement.
Pursuant to the IL, a company is required to hold a license in order to carry on insurance or reinsurance business or business as an insurance agent, insurance broker or insurance manager in or from the Cayman Islands. Bank of Butterfield (Cayman) Limited (which is not itself an insurer) holds an insurance agent license, issued by CIMA, permitting it to solicit domestic business on behalf of not more than one general insurer and one long term insurer.
Companies Law (2020 Revision) as amended
Butterfield Bank (Cayman) Limited is an ordinary resident company incorporated in the Cayman Islands, meaning that, subject to it being licensed under the BATCL, it can carry on business within the Cayman Islands. Butterfield Bank (Cayman) Limited is required to comply with the requirements of the Companies Law (2020 Revision), this being the principal statute governing the incorporation and ongoing operations of the Cayman Islands companies.
Anti-Money Laundering Regulations (2020 Revision); Proceeds of Crime Law (2019 Revision); and Terrorism Law (2018 Revision), each as amended
Butterfield Bank (Cayman) Limited is subject to the Anti-Money Laundering Regulations (2020 Revision) (the "Regulations") made pursuant to the Proceeds of Crime Law (2019 Revision) (the "PCL"), each as amended. The Regulations apply to anyone conducting "relevant financial business" in or from the Cayman Islands intending to form a business relationship or carry out a one-off transaction. The Regulations require a financial service provider to maintain certain anti-money laundering procedures including those for the purposes of verifying the identity and source of funds of an "applicant for business" except in certain circumstances, including where an entity is regulated by a recognized overseas regulatory authority and/or listed on a recognized stock exchange in an approved jurisdiction. In addition, if any person resident in the Cayman Islands knows or suspects, or has reasonable grounds for knowing or suspecting that another person is engaged in criminal conduct, or is involved with terrorism or terrorist property, and the information for that knowledge or suspicion came to their attention in the course of business in the regulated sector, or other trade, profession, business or employment, the person will be required to report such knowledge or suspicion to (i) the Financial Reporting Authority of the Cayman Islands (the "FRA"), pursuant to the PCL, if the disclosure relates to criminal conduct or money laundering; or (ii) a police officer of the rank of constable or higher, or the FRA, pursuant to the Terrorism Law 2018 Revision), if the disclosure relates to involvement with terrorism or terrorist financing and property.
The Cayman Islands Data Protection Law, 2017
The Data Protection Law (the “DPL”) came into force on September 30, 2019 and establishes a framework of rights and duties designed to safeguard individuals’ personal data, balanced against the need of public authorities, businesses and organizations to collect and use personal data for legitimate purposes. The DPL was developed in line with international best practices while ensuring that it reflects the specific needs of the Cayman Islands. It is based substantially on the Data Protection Act, 1998 of the United Kingdom. The DPL defines “personal data” very widely to include any data which enables a living individual to be identified.
In common with most businesses, Butterfield Bank (Cayman) Limited records information in respect of individuals, particularly those who are employees, clients or suppliers, and the obligations under the DPL require a detailed review or establishment of policies and procedures in order to achieve compliance. Non-compliance with the DPL may have serious ramifications.
The DPL is centered on eight data protection principles under which personal data must:
|
•
|
be processed fairly and only when specific conditions are met, including where consent has been given, where there is a legal obligation, or where it is necessary for the performance of a contract to which the data subject is a party. Additional conditions apply in respect of “sensitive personal data” (examples of which include racial or ethnic origin, political opinions, religious beliefs, trade union membership, genetic data, health, sex life and offences);
|
|
•
|
be obtained only for one or more specified lawful purposes, and shall not be further processed in any manner incompatible with such purposes;
|
|
•
|
be adequate, relevant and not excessive in relation to the purpose or purposes for which they are collected or processed;
|
|
•
|
be accurate and, where necessary, kept up to date;
|
|
•
|
not be kept for longer than is necessary for the purpose;
|
|
•
|
be processed in accordance with the rights of individuals as specified under the DPL;
|
|
•
|
be protected by appropriate technical and organizational measures against unauthorized or unlawful processing, and against accidental loss, destruction or damage; and
|
|
•
|
not be transferred abroad unless the country or territory to which it is transferred ensures an adequate level of protection for the rights and freedoms of data subjects in relation to the processing of personal data.
|
Under the DPL, individuals have the right to be informed how personal data is processed and Butterfield Bank (Cayman) Limited is required to provide individuals with a privacy notice in this regard. Individuals also have the right (i) to request access to their personal data, (ii) to request rectification or correction of personal data, (iii) to request that processing of personal data be stopped or restricted and (iv) to require Butterfield Bank (Cayman) Limited to cease processing personal data for direct marketing purposes.
Individuals who believe that their personal data has been handled incorrectly or are not satisfied with responses from Butterfield Bank (Cayman) Limited to any requests made regarding the use of their personal data have a right under the DPL to complain to the Cayman Islands’ Ombudsman.
The Bahamas
The Central Bank of The Bahamas
Butterfield Trust (Bahamas) Limited has been granted a license from the Central Bank of The Bahamas to conduct trust business from within The Bahamas. As the primary regulator of Butterfield Trust (Bahamas) Limited, the Central Bank of The Bahamas is responsible for the regulation and supervision of Butterfield Trust (Bahamas) Limited with respect to all of its operations, corporate governance issues, and compliance with applicable laws and regulations. The Central Bank of The Bahamas' regulations on capital adequacy and the regulatory framework within The Bahamas take into account the recommendations of the BCBS.
93
Relevant Legislation/Regulations
The Banks and Trust Companies Regulation Act and Regulations
The Banks and Trust Companies Regulation Act and Regulations set forth the basic provisions relating to the licensing and operations of banks and trust companies in The Bahamas, as well as the powers of the Central Bank of The Bahamas to supervise and audit the activities of such entities. As it relates to the preservation of confidentiality, the Banks and Trust Companies Regulation Act makes it an offense for certain individuals to disclose without customer consent, inter alia, the identity, assets, liabilities, transactions or accounts of a customer of a licensee, save for in specified circumstances.
The Central Bank of The Bahamas Act and Regulations
The Central Bank of The Bahamas Act provides general provisions relating to the structure and operation of the Central Bank of The Bahamas, the regulatory reporting required to be submitted to the Central Bank of The Bahamas by the licensees and the penalties that may be imposed for failure to comply with the orders of the Central Bank of The Bahamas. From time to time, the Central Bank issues regulations, guidelines and policies which are available on its website.
Financial Intelligence and Reporting
The Financial Intelligence Unit Act provides for the establishment of the financial intelligence unit organization in The Bahamas that is responsible for receiving, analyzing, obtaining and disseminating information which relates to or may relate to the proceeds of offenses under the Proceeds of Crime Act or the Anti-Terrorism Act.
The Financial Transactions Reporting Act and Regulations provides the basic requirements applicable to financial institutions in The Bahamas with respect to verifying the identities of facility holders and bank customers, the obligation to report suspicious transactions to the financial intelligence unit, and minimum record retention policies and procedures.
Data Protection (Privacy of Personal Information) Act
This Data Protection (Privacy of Personal Information) Act makes provision for the protection of the privacy of the personal data of individuals and the regulation of its collection, processing, keeping, use and disclosure.
Other Relevant Legislation
Butterfield Trust (Bahamas) Limited is also subject to various other acts and regulations, including the Proceeds of Crime Act, which sets forth that it is a crime in The Bahamas for a person to conceal, transfer or deal with the proceeds of criminal conduct (such as money laundering) and the Anti-Terrorism Act, which sets forth that it is a crime in The Bahamas for a person to provide or collect funds or provide financial services or make such services available to persons with the intention that such funds or services are to be used in full or in part to carry out a terrorist act. In addition to the laws and regulations set forth above, Butterfield Trust (Bahamas) Limited is also obligated to comply with the guidelines released by the Central Bank of The Bahamas from time to time.
Guernsey
Guernsey Financial Services Commission
Our activities in Guernsey are monitored by the Guernsey Financial Services Commission (the "GFSC") through its Probability Risk and Impact System. The primary objective of the GFSC is to regulate and supervise finance businesses in the Bailiwick of Guernsey ("Guernsey," or the "Bailiwick"). Almost all financial service activities in Guernsey are required to be licensed by the GFSC. Once licensed, the businesses are subject to the regulation, oversight, investigatory, information gathering and enforcement powers of the GFSC.
The various divisions of the GFSC perform regular visits with the purpose of understanding the business and reviewing the risk management and internal control environment (including monitoring and any outsourced functions). Such visits also monitor compliance with applicable law and regulation.
In addition to conducting on-site reviews, the GFSC has a continuing duty to determine whether entities it regulates and the persons who own or run them remain fit and proper. Licensees therefore have a statutory obligation to notify the GFSC of various changes, which are set out in comprehensive rules and regulations. The GFSC also requires financial services businesses to submit periodic returns for statistical analysis and inclusion in thematic studies.
The GFSC has wide powers of enforcement to address shortcomings and breaches by financial services businesses. These range from private warnings and reprimands to revocation and suspension of applicable licenses and consents, fines and referral for criminal prosecution, among others.
The Banking Supervision (Bailiwick of Guernsey) Law, 1994
The Banking Supervision (Bailiwick of Guernsey) Law, 1994 (the "BSL") provides that no person shall in the Bailiwick accept a deposit in the course of carrying on, whether in Guernsey or elsewhere, a deposit-taking business except under the authority of and in accordance with the conditions of a license granted by the GFSC. Butterfield Bank (Guernsey) Limited holds a license under the BSL. In order to be granted a license, a company's business must be carried on with prudence, integrity, professional skills and in a manner which will not tend to bring the Bailiwick into disrepute. The business must also be directed by at least two individuals who are resident in the Bailiwick of Guernsey with appropriate standing and experience and sufficiently independent of each other. Businesses must also adhere to codes, principles, rules and instructions issued from time to time.
Regulation of Fiduciaries, Administration Businesses and Company Directors, etc. (Bailiwick of Guernsey) Law 2000
The Regulation of Fiduciaries, Administration Businesses and Company Directors, etc. (Bailiwick of Guernsey) Law 2000 (the "Guernsey Fiduciaries Law") provides that only a person licensed by the GFSC under the Guernsey Fiduciaries Law can operate fiduciary businesses, which includes:
|
•
|
formation, management and administration or trusts;
|
|
•
|
company or corporate administration;
|
|
•
|
provision of executorship services; and
|
|
•
|
the formation and management of foundations.
|
94
The GFSC can grant two different categories of license, including a full fiduciary license, which can only be granted to a company or a partnership, and a personal fiduciary license. The full fiduciary license covers any director, manager, partner or employee acting in the course of their employment.
The Protection of Investors (Bailiwick of Guernsey) Law, 1987
Under the Protection of Investors (Bailiwick of Guernsey) Law, 1987, as amended (the "POI Law"), a person shall not (subject to certain exemptions) carry on, or hold himself out as carrying on, any controlled investment business in or from within the Bailiwick, except under and in accordance with the terms of a license. For the purposes of the POI Law, a controlled investment includes collective investment schemes and general securities and derivatives. All Guernsey domiciled funds have to be authorized by or registered with the GFSC and be administered by a Guernsey licensed administrator. In addition, open-ended funds must also have a Guernsey licensed custodian.
The Financial Services Commission (Bailiwick of Guernsey) Law, 1987
The Financial Services Commission (Bailiwick of Guernsey) Law, 1987 provides that the general functions of the GFSC are to supervise the finance business in the Bailiwick, to counter financial crime and the financing of terrorism and to maintain confidence in the Bailiwick's reputation as an international finance center.
The Criminal Justice (Proceeds of Crime) (Bailiwick of Guernsey) Law, 1999
The Criminal Justice (Proceeds of Crime) (Bailiwick of Guernsey) Law, 1999 established certain offenses in connection with the proceeds of criminal conduct including concealing of transferring the proceeds of crime, assisting another person to retain the proceeds of criminal conduct, acquisition, possession or use of proceeds of criminal conduct and tipping-off.
The Terrorism and Crime (Bailiwick of Guernsey) Regulations, 2007
The Terrorism and Crime (Bailiwick of Guernsey) Regulations, 2007 provides for a positive obligation on businesses to report internally any suspicions of money laundering. A money laundering reporting officer must be appointed to fulfill this function and to make disclosure to the relevant division of Guernsey's police unit.
Deposit Compensation Scheme, 2008
Pursuant to the Banking Deposit Compensation Scheme (Bailiwick of Guernsey) Ordinance, 2008, a Guernsey DCS is in effect in Guernsey. The Guernsey DCS provides compensation of up to £50,000 per qualifying deposit in the event of the failure of a Guernsey licensed bank. The maximum total amount of compensation is capped at £100 million in any 5 year period. If claims exceed this cap, compensation will be reduced pro rata. The cap also means that compensation in respect of any one bank cannot exceed £100 million. The Guernsey DCS is paid for by Guernsey banks through an annual administration levy and, in the event of a bank failure, a compensation levy.
Data Protection (Bailiwick of Guernsey) Law, 2017
The Data Protection (Bailiwick of Guernsey) Law, 2017 ("DPL 2017") came into force on May 25, 2018 to coincide with the enforcement of the EU's General Data Protection Regulation (EU) 2016/679. The DPL 2017 updated Guernsey's data protection framework to ensure that Guernsey retained its data protection 'adequacy' status with the European Commission.
The DPL 2017 applies to the processing of personal data and provides rights to data subjects (i.e. individuals) and places obligations on data controllers and processors of personal data including, among other matters, in relation to subject access requests, transfers of personal data and notification of data breaches.
The Office of the Data Protection Authority is the independent regulatory authority responsible for the regulatory functions under the DPL 2017, including the ability to levy fines.
Jersey
Butterfield Bank (Jersey) Limited is regulated by the Jersey Financial Services Commission (“JFSC”) to carry on deposit-taking business under The Banking Business (Jersey) Law 1991 (as amended); investment business pursuant to the Financial Services (Jersey) Law 1998 (as amended); fund services business pursuant to the Financial Services (Jersey) Law 1998 (as amended); and money service business pursuant to the Financial Services (Jersey) Law 1998 (as amended).
The JFSC uses four key areas in supervising banks which are the development of regulatory requirements including laws and codes of practice; on-site examinations and meetings; off-site supervision including the analysis of financial information; and international dialogue and liaison with other regulators involved in the supervision of the broader group.
The JFSC has wide powers of enforcement to address shortcomings and breaches by financial services businesses. These range from private warnings and reprimands to revocation and suspension of applicable licenses and consents, fines and referral for criminal prosecution, among others.
Financial Services Commission (Jersey) Law 1998
The Financial Services Commission (Jersey) Law 1998 provides that the JFSC is, among other things, responsible for the supervision and development of financial services in or from within Jersey, preparing and submitting recommendations for legislation regarding financial services, supervising regulated entities, and administering laws such as the Control of Borrowing (Jersey) Law 1947 and the Companies (Jersey) Law 1991. It will also have particular regard to the reduction of risk to the public of financial loss, to protecting and enhancing the reputation and integrity of Jersey, and to the best economic interests of Jersey and the need to counter financial crime.
Banking Business (Jersey) Law 1991
The Banking Business (Jersey) Law 1991 (the "BBL") provides that no person shall carry on or hold themselves out as carrying on a deposit taking business in or from within Jersey unless they are registered under the BBL. Butterfield Bank (Jersey) Limited holds a license under the BBL. In order to be granted a license, the JFSC will consider the integrity, competence and financial standing of a company's business and that it would be in the best interests of persons who may deposit money that the company should be registered. The business must also have a physical presence in Jersey involving meaningful decision making and management, and be subject to supervision by a relevant supervisory authority. Businesses must adhere to secondary legislation and codes issued from time to time. This law also contains provisions regarding notification of principal persons, key persons and shareholders, and sets out further powers of the JFSC.
95
Financial Services (Jersey) Law 1998
This law regulates investment, trust company, general insurance mediation, money service, fund services and alternative investment fund services business. It includes requirements to register if carrying on regulated business, provisions for the supervision of financial services (including requirements to notify of changes to principal persons, key persons and shareholders), and gives the JFSC powers to issue directions and public statements, request information, and issue further orders and regulations. It also sets out the offenses of market manipulation, misleading information and insider dealing.
Collective Investment Funds (Jersey) Law 1988
Under the Collective Investment Funds (Jersey) Law, a person shall not (subject to certain exemptions) hold himself out as being a functionary of a recognized fund in or from within Jersey, except under a permit. For the purposes of this law, a recognized fund is a type of collective investment fund subject to additional regulations. Any person carrying on the business of an unclassified fund must also hold a certificate. This law also contains provisions regarding notification of principal persons, key persons and shareholders, and sets out further powers of the JFSC.
Proceeds of Crime (Jersey) Law 1999 and Terrorism (Jersey) Law 2002
The Proceeds of Crime (Jersey) Law 1999 established certain offenses in connection with the proceeds of criminal conduct including acquiring, using or having possession or control of criminal property, concealing, disguising, converting, transferring or removing such criminal property from Jersey, and tipping off and interference with material.
The Terrorism (Jersey) Law 2002 contains similar offenses regarding using, possessing, providing, collecting or receiving property for the purposes of terrorism, and otherwise dealing with terrorist property.
Both the Proceeds of Crime (Jersey) Law 1999 and the Terrorism (Jersey) Law 2002 provide for a positive obligation on businesses to report any suspicions of money laundering or terrorist financing.
Depositors Compensation Scheme, 2009
Pursuant to the Banking Business (Depositors Compensation) (Jersey) Regulations 2009, the Jersey Bank Depositors Compensation Scheme ("Jersey DCS") is in effect in Jersey. The law covers all "eligible deposits" and, in the event of the failure of a Jersey bank, provides protection of up to £50,000 for deposits placed in Jersey per person, per banking group, for local and international depositors. The maximum liability of the Jersey DCS is capped at £100 million in any 5 year period.
Data Protection (Jersey) Law, 2018 / Data Protection Authority (Jersey) Law, 2018
The Data Protection (Jersey) Law 2018 ("DPJL"), and its companion statute the Data Protection Authority (Jersey) Law 2018 ("DPAJL"), came into force on May 25, 2018 to coincide with implementation of the EU General Data Protection Regulation (EU) 2016/679 ("GDPR"). The DPJL updated Jersey's data protection framework expressly to mirror the GDPR and ensure that Jersey retained its data protection 'adequacy' status with the European Commission.
In outline, the DPJL governs the processing of personal data in Jersey or in relation to Jersey residents; it provides rights to data subjects (i.e. individuals) and places obligations on data controllers and processors of personal data including, among other matters, in relation to subject access requests, transfers of personal data and notification of data breaches. The DPAJL requires any organization which is 'established' in Jersey to be registered with the Jersey Office of the Information Commissioner ("JOIC") and to pay an annual charge.
The JOIC is the independent authority responsible for the regulatory and enforcement functions of the DPJL and DPAJL, including the ability to levy fines.
United Kingdom
Regulatory Regime
Butterfield Mortgages Limited provides UK residential property lending services.
The primary legislation governing the provision of Butterfield UK's services is the Financial Services and Markets Act 2000 ("FSMA") and its secondary regulations. FSMA requires that in order to carry on mortgage and investment services in the UK, a firm must be authorized (or exempt) and have the necessary permissions. Butterfield Mortgages Limited is authorized and has permissions to enter into, advise on and administer regulated mortgage contracts.
Because its permissions are limited to mortgage activities, Butterfield Mortgages Limited is regulated by the Financial Conduct Authority ("
FCA
"). The FCA has responsibility for both prudential and conduct of business regulation of Butterfield Mortgages Limited.
Butterfield Mortgages Limited must comply with the FCA handbook which contains detailed rules and guidance in respect of governance and conduct matters. The FCA's Principles for Business require, among other things, that Butterfield Mortgages Limited conducts its business with integrity and due skill, care and diligence and deal with its regulators in an open and co-operative way. In addition, certain persons occupying senior management functions and certifications at Butterfield Mortgages Limited are subject to statements of principle and a code of practice that describes behaviors expected of persons operating in the regulated sector. The implementation of the senior management and certification regime from December 9, 2019 increases individual accountability to the regulator.
Control
FSMA requires any person seeking to obtain (and in certain circumstances increase) control over Butterfield UK to first get approval from the FCA. A person will become a controller if it holds (itself or with another where they are acting together) (i) 20% or more in the shares of Butterfield UK or in any parent undertaking; or (ii) 20% or more of the voting power in Butterfield UK or any parent.
The Companies Act 2006 requires that UK incorporated companies maintain a register of persons who have significant control over them. A person will be considered to have significant control if it holds (itself or with another where they are acting together) 25% or more of the company's shares or voting rights or has the ability to appoint a majority of the board of directors.
96
Capital
Butterfield UK is subject to capital rules under the FCA's Prudential sourcebook for Mortgage and Home Finance Firms and Insurance Intermediaries handbook ("MIPRU"). The MIPRU capital rules stipulate the minimum level and quality of capital that must be maintained to support the activities carried on.
AML and Financial Crime
Butterfield UK is subject to a range of legislation at a UK and European level requiring it to take steps to detect and prevent potential money laundering, financial crime or terrorist financing. The FCA and HM Treasury have investigatory powers in relation to suspected breaches.
Relevant legislation at the EU level is the Fourth Money Laundering Directive (2015/849) which has been implemented in the UK through The Money Laundering, Terrorist Financing and Transfer of Funds (Information on the Payer) Regulations 2017 ("MLRs 2017") from June 26, 2017.
At the UK level, Butterfield UK must comply with its obligations under the Proceeds of Crime Act 2002, the Terrorism Act 2000 and the Anti-terrorism, Crime and Security Act 2001, Counter-Terrorism Act 2008 (Schedule 7), MLRs 2017 and certain specific obligations the Transfer of Funds (Information on the Payer) Regulations 2007 and certain specific obligations in FSMA (in particular with respect to market abuse and insider dealing) and the FCA Handbook. Together, this legislation requires regulated firms to create appropriate and risk-sensitive policies and procedures in relation to customer due diligence procedures and monitoring of transactions, to avoid financing terrorism or money laundering or facilitating either of these, to avoid dealing with certain persons specified by HM Treasury, and to disclose suspicious activity to the relevant regulatory authorities. In addition, the UK and all entities of the Bank must adhere to the Bribery Act 2010 which has broad extra-territorial reach.
Butterfield UK must also comply with legislation of third countries to the extent that such legislation has extra-territorial effect and is applicable to it. Examples of this are the US PATRIOT Act of 2001 and The Foreign Account Tax Compliance Act ("FATCA") of 2010.
Data Protection Act, 2018
The Data Protection Act 2018 (“DPA”) implements the EU General Data Protection Regulation (2016/679). Butterfield UK is required to have in place compliant policies and procedures to meet the DPA obligations to deal with data appropriately. The DPA applies to any business or person using or holding personal data on individuals within the EU and UK. Breaches of the legislation are criminal offenses and can result in severe penalties. The Information Commissioner’s Office has regulatory and disciplinary powers and breach of the DPA can give rise to financial penalties based on a percentage of annual turnover.
Following the UK leaving the EU on January 31, 2020, the GDPR is incorporated into the UK’s domestic law under The European Union (Withdrawal Agreement) Act 2020 that makes legal provision for ratifying the Brexit Withdrawal Agreement of January 24, 2020 and implementing it into the domestic law of the United Kingdom.
Switzerland
Financial Institutions Act
The Swiss Federal Financial Institutions Act ("FinIA") and the implementing ordinance to the Swiss Federal Financial Institutions Act ("FinIO") entered into force on January 1, 2020. FinIA and FinIO set forth the basic provisions relating to the licensing in Switzerland of financial institutions, which includes trustees and (collective) asset managers but excludes banks and insurance companies as they are already subject to specific legislation. Pursuant to FinIA, Swiss trustees acting on a professional basis in Switzerland or from Switzerland, must obtain a license from the Swiss Financial Market Supervisory Authority ("FINMA") to carry on their trustee-activities. A Swiss branch or a Swiss representative office of a foreign trustee must also obtain a license from FINMA.
FINMA is responsible for granting the license and for taking any enforcement actions. In order to obtain a license from FINMA, a trustee will first need to affiliate to a Supervisory Organisation, which is licensed and supervised by FINMA. The Supervisory Organisation will conduct the day-to-day supervision and perform regular audits of the affiliated trustees. In order to obtain a license, the applicant must further, inter alia, comply with minimum capital requirements, have an appropriate level of own funds, an appropriate organization, qualified executives and generally meet a "fit and proper" requirement.
Existing trustees, including Butterfield Trust (Switzerland) Ltd, must notify FINMA of their intention to apply for a license before June 30, 2020. Butterfield Trust (Switzerland) Ltd will then have until December 31, 2022 to affiliate to a Supervisory Organisation, comply with the licensing requirements as set forth under FinIA and apply for a license to FINMA. During such period, it may continue to provide trustee-services, provided it remains affiliated to a Self-Regulatory Organization for anti-money laundering compliance purposes.
Swiss Anti-Money Laundering Act
The Swiss Federal Act on Combating Money Laundering and Terrorist Financing of 10 October 1997 ("AMLA") and the related implementing ordinances apply to financial intermediaries, which includes trustees. It governs the combating of money laundering and terrorist financing. It ensures the exercise of due diligence by the financial institutions in the conduct of financial transactions. Pursuant to AMLA, financial institutions must affiliate to a recognized Self-Regulatory Organisation or a recognized Supervisory Organisation (see above under Financial Institutions Act) which shall supervise compliance by financial intermediaries of their duties set out in AMLA. Butterfield Trust (Switzerland) Ltd must comply with its obligations under AMLA and is currently affiliated to OAR-G, a Self-Regulatory Organisation licensed and supervised by FINMA.
Swiss Data Protection Act
The Swiss Federal Act on Data Protection of June 19, 1992 ("DPA") and the Ordinance to the Federal Data Protection of June 14, 1993 ("DPO") aims to protect the privacy and the fundamental rights of persons when their data is processed. The DPA and DPO provide for several requirements and limits with respect to data processing in Switzerland as well as the transfer of data outside Switzerland. The data protection legislation applies to any private entity processing data related to individuals or corporate entities. Data processing is defined as any operation with personal data, irrespective of the means applied and the procedure, and in particular the collection, storage, use, revision, disclosure, archiving or destruction of data. The DPA and DPO impose a series of duties on the so-called controller of the database, i.e. the entity that defines the purpose and controls the content of the collected data. The activities of Butterfield Trust (Switzerland) Ltd imply data processing on various data subjects. As a result, it is to comply with the provisions of the DPA when processing data.
The general principles of the Swiss data protection legislation include the obligations to lawfully, accurately and not excessively process data. Further, data processing must be protected by appropriate technical and organizational measures against accidental destruction, loss, theft and any other unauthorized use. The persons or entities whose data are being processed must be granted a right of access to their data if they request so and must have the opportunity to request the correction of the data that is inaccurate.
97
The Swiss Parliament is currently reviewing a proposal to amend the DPA in order to bring it in line with the EU General Data Protection Regulation (EU 2016/679) ("GDPR"). It is expected that these amendments could be enacted by the end of 2020. In a second phase, the Swiss legislator intends to review and amend the DPA in more depth. The GDPR has extra-territorial scope and although Switzerland is not a member of the EU, Swiss companies may under circumstances have to comply with the GDPR if they process personal data of individuals located within the EU.
Singapore
Butterfield (Singapore) Pte. Ltd. (“BSPL”) holds a trust business license issued by the Monetary Authority of Singapore (“MAS”) pursuant to the Trust Companies Act (Chapter 336 of Singapore) ("TCA").
As the integrated financial services regulatory authority in Singapore, the MAS administers (among other financial services related statutes) the TCA and regulates and supervises (among other types of financial institutions) trust business license holders (such as BSPL) in accordance with the TCA and all related subsidiary legislation, notices, guidelines and other regulatory instruments issued by the MAS ("MAS Instruments"). These MAS Instruments cover a wide range of ongoing obligations relating to, inter alia, capital adequacy, audit, conduct of business, confidentiality, anti-money laundering and countering of terrorist financing and also impose approval and/or notification requirements in respect of controllers, directors and key officers.
Under the TCA, the MAS is empowered to conduct inspections and/or investigations of BSPL to ensure that BSPL is in compliance with requirements contained in the MAS Instruments. Where there is a breach, the MAS may pursue a wide range of enforcement sanctions, including private warnings, private or public reprimands, composition offers (i.e. allowing the offense to be compounded by payment of a fine), prohibition orders, suspension or revocation of licenses, civil penalties and criminal prosecution.
United States
Foreign Account Tax Compliance Act (FATCA)
Under FATCA, US federal tax legislation passed in 2010, a 30% withholding tax will be imposed on "withholdable payments" made to non-US financial institutions (including non-US investment funds and certain other non-US financial entities) that fail (or, in some cases, that have 50% affiliates which are also non-US financial institutions that fail) to provide certain information regarding their US accountholders and/or certain US investors (such US accountholders and US investors, "US accountholders") to the IRS. For non-US financial institutions that fail to comply, this withholding will generally apply without regard to whether the beneficial owner of a withholdable payment is a US person or would otherwise be entitled to an exemption from US federal withholding tax. "Withholdable payments" generally include, among other items, payments of US-source interest and dividends. Furthermore, FATCA may also impose withholding on non-US source payments by non-US financial institutions that comply with FATCA to non-US financial institutions that fail to comply with FATCA. However, under proposed Treasury regulations, such withholding will not apply to payments made before the date that is two years after the date on which final regulations defining the term "foreign pass thru payment" are published. In general, non-publicly traded debt and equity interests in investment vehicles will be treated as "accounts" and subject to these reporting requirements. In addition, certain insurance policies and annuities are considered accounts for these purposes.
Some countries, including the Cayman Islands, Guernsey, Jersey, the UK, Singapore, Switzerland and The Bahamas, have entered into, and other countries are expected to enter into, intergovernmental agreements ("IGAs") with the United States to facilitate the type of information reporting required under FATCA. While the existence of IGAs will not eliminate the risk of the withholding described above, these agreements are expected to reduce that risk for financial institutions and investors in countries that have entered into IGAs. IGAs will often require financial institutions in those countries to report some information on their US accountholders to the taxing authorities of those countries, which will then pass the information to the IRS.
The Group closely monitors all present and new legislation that is or will be applicable for its organization, and is continuing to monitor all implications of FATCA and legislation of countries that have entered into IGAs. While monitoring these implications, the Group is and will be in close contact with all of its stakeholders, including its peers and financial industry representative organizations.
The Group has taken all the steps it believes are necessary to comply with current FATCA regulations, including analysis of its group entities and conclusions as to their FATCA classifications, entering into agreements with the US tax authorities (as necessary), identification of reportable accounts, and timely and accurate filing of all required annual FATCA filings, all in accordance with the appropriate IGA. Certain payments to the Group may be subject to withholding under FATCA if, in the future, the Group cannot enter into such agreements or satisfy the requirements thereunder (including as a result of local laws in non-IGA countries prohibiting information-sharing with the IRS, as a result of contracts or local laws prohibiting withholding on certain payments to accountholders, policyholders, annuitants or other investors, or as a result of the failure of accountholders, policyholders, annuitants or other investors to provide requested information). The possibility of such withholding and the need for US accountholders, policyholders, annuitants and investors to provide certain information may adversely affect the sales of certain of the Group's products. In addition, entering into agreements with the IRS and compliance with the terms of such agreements and with FATCA and any regulations or other guidance promulgated thereunder or any legislation promulgated under an IGA may substantially increase the Group's compliance costs.
Office of Foreign Assets Control Regulation
The US Treasury Department's Office of Foreign Assets Control ("OFAC"), administers and enforces economic and trade sanctions against targeted foreign countries and regimes, under authority of various laws, including designated foreign countries, nationals and others. OFAC publishes lists of specially designated targets and countries. OFAC sanctions apply to all transactions that take place in the United States. Transactions that take place outside the United States may become subject to the jurisdiction of the United States and subject to compliance with OFAC sanctions if they involve US persons or payment in US dollars. Such payments typically are cleared through the US Dollar settlement system located in the United States and involve the intermediation of US financial institutions. Although we currently do not have any operations in the United States, our operations may involve transactions with US persons or in US Dollars and as a result, in order to comply with OFAC sanctions, we are responsible for, among other things, blocking any such transactions with designated targets and countries and reporting blocked transactions after their occurrence. Failure to comply with these sanctions could have serious legal and reputational consequences, including causing applicable bank regulatory authorities not to approve merger or acquisition transactions when regulatory approval is required or to prohibit such transactions even if approval is not required.
Anti-Money Laundering and the USA PATRIOT Act
A major focus of worldwide governmental policy on financial institutions in recent years has been aimed at combating money laundering and terrorist financing. In particular, United States anti-money laundering laws and regulations including the USA PATRIOT Act of 2001, applicable to non-US banks with operations in the United States, including banks that engage in transactions outside the United States with US persons or in US Dollars, such as the Bank, impose significant compliance and due diligence obligations. Under these laws and regulations, financial institutions are prohibited from entering into specified financial transactions and account relationships and must use enhanced due diligence procedures in their dealings with certain types of high-risk customers and implement a written customer identification program. Financial institutions
98
must also take certain steps to assist government agencies in detecting and preventing money laundering and report certain types of suspicious transactions. Regulatory authorities routinely examine financial institutions for compliance with these obligations, and failure of a financial institution to maintain and implement adequate programs to combat money laundering and terrorist financing, or to comply with all of the relevant laws or regulations, could have serious legal and reputational consequences for the institution, including causing applicable bank regulatory authorities not to approve merger or acquisition transactions when regulatory approval is required or to prohibit such transactions even if approval is not required. Institutions that violate these obligations can be subject to cease and desist orders, civil money penalties and criminal sanctions.
Future Legislation and Regulation
The above jurisdictions and the other jurisdictions in which we operate may enact legislation from time to time that affects the regulation of the financial services industry or that affect the regulation of financial institutions chartered by or operating in those jurisdictions. These governments and their regulatory agencies also periodically propose and adopt changes to their regulations or change the manner in which existing regulations are applied. The substance or impact of pending or future legislation or regulation, or the application thereof, cannot be predicted, although enactment of the proposed legislation could impact the regulatory structure under which we operate and may significantly increase our costs, impede the efficiency of our internal business processes, require us to increase our regulatory capital and modify our business strategy, and limit our ability to pursue business opportunities in an efficient manner. Our business, financial condition, results of operations or prospects may be adversely affected, perhaps materially, as a result.
Additional Information
The Butterfield Act and our current amended and restated bye-laws have been filed as exhibits to this annual report on Form 20-F. The information contained in these exhibits is incorporated by reference herein.
Information regarding the rights, preferences and restrictions attaching to each class of our common and preferred shares, as well as other information regarding director and shareholder rights and proceedings, is described in the section entitled "Description of Share Capital" in our registration statement on Form F-1 filed with the SEC on February 12, 2017 with the file number 333-216018 and incorporated by reference herein.
99
MANAGEMENT
Board
Our Board oversees the affairs of the Bank. The current Board is composed of ten members, consisting of our Chairman and Chief Executive Officer and nine non-executive directors. The Bank's bye-laws provide that the Board shall consist of not less than six and not more than twelve directors. The Board holds regular meetings five times per year and ad hoc meetings as necessary.
Persons may be proposed for election or appointed as directors at a general meeting either by the Board or by one or more shareholders holding shares which in the aggregate carry not less than 5% of the voting rights in respect of the election of directors. There is only a single class of director and each director holds office until the next annual general meeting.
Prior to the completion of our registered secondary offering on February 28, 2017, Carlyle owned approximately 14% of the Bank's common shares and had the right to nominate two persons for election by the shareholders as directors pursuant to an Amended and Restated Investment Agreement, dated as at August 4, 2016, between Carlyle and us (the "Amended Investment Agreement"). Mr. James Burr was appointed as a director on our Board by Carlyle pursuant to the Amended Investment Agreement. Following the completion of the offering, Carlyle no longer owns any of our common shares and no longer has the right to nominate any persons for election by our shareholders as members of the Board. For more information, see "Major Shareholders and Related Party Transactions—Our Relationship with the Carlyle Group".
As a foreign private issuer we are allowed to follow our "home country" corporate governance practices in lieu of the NYSE governance requirements for NYSE-listed U.S. companies. Notwithstanding this, our Board has determined that, under current NYSE listing standards regarding independence (to which we are not currently subject), and taking into account any applicable committee standards, a majority of our Board, including Alastair Barbour, James Burr, Michael Covell, Caroline Foulger, Mark Lynch, Conor O'Dea, Meroe Park, Pamela Thomas-Graham and John Wright, are independent directors.
As the regulatory environment in which we operate becomes more complex, our governance practices and the structures and methodology we use to operate the Bank continue to be of key strategic significance. With the exception of the Chairman and Chief Executive Officer, our Board is comprised entirely of Directors who are not employees of the Bank. Our Board reviews and oversees the Bank's implementation of corporate governance policies and practices in accordance with prevailing standards. The following table lists the names, positions and date of birth of the Directors of the Bank:
|
Name
|
|
Age
|
|
Position
|
|
Michael Collins
|
|
56
|
|
Chairman and Chief Executive Officer
|
|
Alastair Barbour
|
|
67
|
|
Non-Executive Director
|
|
James Burr
|
|
54
|
|
Non-Executive Director
|
|
Michael Covell
|
65
|
Non-Executive Director
|
||
|
Caroline Foulger
|
|
59
|
|
Non-Executive Director
|
|
Mark Lynch
|
58
|
Non-Executive Director
|
||
|
Conor O'Dea
|
|
60
|
|
Non-Executive Director
|
|
Meroe Park
|
53
|
Non-Executive Director
|
||
|
Pamela Thomas-Graham
|
56
|
Non-Executive Director
|
||
|
John Wright
|
|
78
|
|
Non-Executive Director
|
Each of our directors may be reached at our registered office at: 65 Front Street, Hamilton, HM 12, Bermuda, or by postal mail at P.O. Box HM 195, Hamilton HM AX, Bermuda.
Michael Collins
joined the Board in September of 2015 when he was named Chief Executive Officer of the Bank. He was named Chairman in July of 2017. Prior to this appointment, Mr. Collins was Senior Executive Vice President with responsibility for all of the Bank's client businesses in Bermuda, including Corporate, Private and Retail Banking, as well as the Operations, Custody and Marketing functions in Bermuda and the Cayman Islands. Mr. Collins has over 30 years' experience in financial services, having held progressively senior positions, at Morgan Guaranty Trust Company in New York and later at Bank of Bermuda and HSBC in Bermuda. Before joining the Bank in 2009, Mr. Collins was Chief Operating Officer at HSBC Bank Bermuda. Mr. Collins holds a BA in Economics from Brown University.
James Burr
j
oined the Board in 2016 and was named Lead Independent Director in 2018. Mr. Burr was originally appointed as a Director upon Carlyle's designation pursuant to the Investment Agreement (as defined herein). Presently, Mr. Burr is a Managing Director in the Global Financial Services Group of The Carlyle Group, where he focuses on investing in management buyouts, growth capital opportunities and strategic minority investments in financial services. Prior to joining Carlyle, Mr. Burr served as Corporate Treasurer of Wachovia Bank, where he was responsible for activities relating to funding, investing, risk transference, balance sheet management, liquidity and capital usage. He served in various other roles at Wachovia Bank, including as Assistant Treasurer, Controller of the Corporate and Investment Bank and Management Analyst since 1992. Mr. Burr began his career at Ernst & Young, where he was a certified public accountant focused on banking and computer audit issues. Mr. Burr formerly served on the Board of Directors of Central Pacific Financial Corp.
Alastair Barbour
joined the Board in 2012. He is a Chartered Accountant with more than 25 years of experience providing auditing and advisory services to publicly traded companies, primarily in the financial services industry. Mr. Barbour was employed with KPMG from 1978 until his retirement in 2011. During his time there, he held various positions both locally and overseas. In 1985, he was named Partner at KPMG (Bermuda). Mr. Barbour's most recent position was head of KPMG's Financial Services Group in Scotland. Currently, Mr. Barbour serves as Chairman of Liontrust Asset Management plc and as a Director and Chairman of the Audit Committees of RSA Insurance Group plc and Phoenix Group Holdings plc. Mr. Barbour trained with Peat, Marwick, Mitchell & Co. in London and holds a Bachelor of Science from the University of Edinburgh. He is a Fellow of the Institute of Chartered Accountants in England & Wales.
Michael Covell
joined the Board in 2018. Mr. Covell currently serves as non-executive Chairman of several private companies, including Ascot Lloyd, Sackville Capital and C Le Masurier Limited. Previously, Mr. Covell was Chairman of both the Tilney Group and Hawksford International. He was also a Director of the International Property Securities Exchange and Leeds Castle Foundation. Mr. Covell retired from Goldman Sachs in 2008, where he was a Managing Director of their European Private Wealth Management Division. Prior to Goldman Sachs, he was a senior partner at Rawlinson & Hunter, an international accountancy firm. Mr. Covell is a Fellow of the Institute of Chartered Accountants in England and Wales, and Member of the Society of Trust & Estate Practitioners.
100
Caroline Foulger
joined the Board in 2013. Prior to her retirement in 2012, Ms. Foulger was a Partner with PricewaterhouseCoopers Bermuda, where she led the firm's insurance and public sector groups. She holds directorship positions with several listed and private companies, including Hiscox Ltd. and Oakley Capital Investments Limited. Ms. Foulger graduated with honors, from University College, University of London. Currently, she is either a Fellow or Member of several professional bodies, namely, the Institute of Chartered Accountants in England and Wales, Institute of Chartered Professional Accountants of Bermuda, and the Institute of Directors.
Mark Lynch
joined the Board in 2019, and is an investment manager and analyst with a specialization in financial services. Until June 30, 2019, he was a partner of Boston-based Wellington Management Co., where he had served as the firm’s senior financial services analyst since 1994 and a partner since 1996. He was also a portfolio manager of mutual funds, hedge funds, and institutional portfolios over that period. Prior to joining Wellington, Mr. Lynch was a U.S. regional bank analyst with Lehman Brothers and Bear Stearns. He holds a degree in European History from Harvard College.
Conor O'Dea
joined the Board in 2016 following his retirement as the Group's President & Chief Operating Officer and Managing Director of Butterfield Bank (Cayman) Limited. He joined Butterfield in 1989 and was named Managing Director, Butterfield Bank (Cayman) Limited in 1997. In 2010, he was named Senior Executive Vice President, Caribbean, and in 2011 Senior Executive Vice President, International Banking. Mr. O'Dea is a Chartered Accountant who has worked in the financial services industry in the Cayman Islands and internationally for over 30 years. He is Chairman of Cayman Finance (a financial services industry group) and is a past President of the Cayman Islands Chamber of Commerce and the Cayman Islands Bankers Association. Mr. O’Dea serves as a Director of several listed and private companies, including BF&M Limited and Digicel Cayman Limited. Mr. O’Dea holds a Bachelor of Commerce degree from the University College Dublin and has been a Fellow of Chartered Accountants in Ireland since 1995.
Meroe Park j
oined the Board of Directors in 2017. Currently, Ms. Park serves as the Deputy Secretary and Chief Operating Officer of the Smithsonian. She was most recently the Executive Vice President at the Partnership for Public Service and before that was Executive Director of the United States Central Intelligence Agency (the “CIA”), serving as the Agency’s chief operating officer in its most senior career post. Prior to her retirement in June 2017, Ms. Park was a 27-year career intelligence officer and one of the US Government’s leading professionals. She held increasingly senior positions at the CIA, including Chief of Human Resources and a Senior Mission Support Officer for locations in Eurasia and Western Europe. Ms. Park successfully led key strategic initiatives, including the modernization of the CIA’s technology systems and organizational structure, and the implementation of talent initiatives focused on workforce development and inclusion. Ms. Park also served on the Advisory Board for Chart National Management and on the Board of Managers of Sequoia Solutions LLC, a company that has developed a commercial cloud product for the U.S. government’s classified cloud regions. Ms. Park has earned a number of awards during her career and has twice been the recipient of the Presidential Rank Award, the Executive Branch’s highest honor for government career professionals. She holds a Bachelor of Science degree from Georgetown University, where she is also a Distinguished Executive in Residence.
Pamela Thomas-Graham
joined the Board in 2017. She is the Founder and Chief Executive Officer of Dandelion Chandelier LLC, a private digital media enterprise focused on the intersection of luxury, marketing and technology. Prior to establishing Dandelion Chandelier, Ms. Thomas-Graham spent six years with Credit Suisse where she served as Chief Talent, Branding and Communications Officer, and Chief Marketing and Talent Officer & Head of Private Banking and Wealth Management New Markets. From 2008 to 2010, she was Managing Director of private equity firm, Angelo, Gordon & Company, leading the firm’s investments in the consumer and retail sectors. Before assuming leadership roles in financial services, Ms. Thomas-Graham was Senior Vice President, Global Brand Development and Group President, Apparel Brands at Liz Claiborne (now Kate Spade & Company) where she was responsible for the P&L of 18 global brands. Prior to joining Liz Claiborne, she spent six years at NBC Universal, where she served as President and Chief Executive Officer of CNBC.com, and later President and Chief Operating Officer, and Chairman, President and Chief Executive Officer of CNBC. Ms. Thomas-Graham began her career at global consulting firm McKinsey & Company in 1989, and became the firm’s first African-American female partner in 1995. She serves as a Director for several private and listed companies, including as the Lead Independent Director for Clorox, a Director and member of the Audit Committee of Norwegian Cruise Line Holdings Limited and a Director of Peloton Interactive. Ms. Thomas-Graham holds Bachelor of Arts in Economics, Master of Business Administration, and Doctor of Law degrees from Harvard University.
John Wright
joined the Board in 2002. Mr. Wright served as a non-executive director of Butterfield UK from 2001 through 2014. Mr. Wright retired as chief executive of Clydesdale & Yorkshire Banks in 2001. Mr. Wright’s career in commercial banking spans over 43 years and includes assignments in the UK, India, Sri Lanka, West Africa, Canada, Hong Kong and the United States. He is a visiting Professor at Heriot-Watt University Business School and he serves on the Board of Directors of several public and private U.K. and overseas companies, including as Senior Independent Director of DAMAC Properties, Chairman of the Advisory Board of XM International Associates Limited and Director of Rasmala UK Limited. He is also a past President of the Irish Institute of Bankers and a past Vice President of the Chartered Institute of Bankers in Scotland. Mr. Wright was educated at Daniel Stewarts College Edinburgh.
Executive Management Team
The Group's current executive management team is as follows:
|
Name
|
|
Age
|
|
Position
|
|
Michael Collins
|
|
56
|
|
Chairman and Chief Executive Officer
|
|
Elizabeth Bauman
|
|
59
|
|
Group Head of Human Resources
|
|
Andrew Burns
|
41
|
Group Head of Internal Audit
|
||
|
Siân Dalrymple
|
56
|
Group Head of Compliance
|
||
|
Michael McWatt
|
54
|
Managing Director, Cayman
|
||
|
Shaun Morris
|
|
59
|
|
General Counsel, Group Chief Legal Officer
|
|
Michael Neff
|
56
|
Managing Director, Bermuda and International Wealth
|
||
|
Richard Saunders
|
50
|
Managing Director, Channel Islands and the UK
|
||
|
Michael Schrum
|
|
51
|
|
Group Chief Financial Officer
|
Each member of our executive management team may be reached at our registered office at 65 Front Street, Hamilton, HM 12, Bermuda, or by postal mail at P.O. Box HM 195, Hamilton HM AX, Bermuda.
Elizabeth Bauman
currently serves as Group Head of Human Resources with responsibility for the overall management and development of the Human Resources function. Mrs. Bauman joined the Group in September 2015. She has more than 25 years of progressive leadership experience in financial services with a focus on human resources management. She was previously President of Crestview Business Consulting, providing strategic planning and change management advisory services to clients in several industries. Prior to founding Crestview, Mrs. Bauman held the positions of Chief Administrative Officer and SVP, Human Resources at First Niagara Financial Group and
101
Business Chief Financial Officer (Personal Financial Services), SVP Strategy & Development and SVP Human Resources at HSBC Bank USA. Mrs. Bauman holds a Bachelor of Science degree in Economics from Allegheny College and a Master of Business Administration from State University of New York at Buffalo New York.
Andrew Burns
currently serves as Group Head of Internal Audit. Mr. Burns was named Group Head of Internal Audit in 2016, and became a member of the Group Executive Committee in October 2017. He is responsible for all aspects of the Internal Audit function across the Butterfield Group. Mr. Burns has more than 18 years of progressive leadership experience in the financial services sector, having begun his career with PricewaterhouseCoopers in Australia. He first joined the Group in the Fund Services subsidiary in Bermuda, before transferring to the Internal Audit team in 2007, where he has held progressively senior management roles. Mr. Burns is a Chartered Accountant. He holds a Bachelor of Commerce from the University of Melbourne, Australia.
Siân Dalrymple
currently serves as Group Head of Compliance. Ms. Dalrymple was named to the Group Executive Committee in October 2017 after joining Butterfield in December 2016 as Group Head of Compliance. She has more than 25 years’ experience in compliance management in Europe and Asia. Prior to joining Butterfield, she was Regional Head of Compliance - Asia/Pacific for Deutsche Bank. Her previous roles include progressively senior positions within compliance at leading financial institutions including Bank of America, ABN AMRO, J. Henry Schroder & Co. (now Citi), Société Générale and Guinness Mahon (now Investec).
Michael McWatt
currently serves as Managing Director for Butterfield Bank (Cayman) Limited, with responsibility for the overall operations of the bank in the Cayman Islands. Mr. McWatt joined the Group in 1999 and was appointed Managing Director in 2016. He has held progressively senior leadership positions with the Group, including Deputy Managing Director, EVP Group Head of Community Banking and SVP Group Chief Credit Officer. Mr. McWatt is a career banker with more than 25 years of experience in Canada, Bermuda and the Cayman Islands. He has been with the Group for over 19 years and previously held progressively senior positions in Corporate Banking and Risk Management in Canada. Mr. McWatt holds a BA in Economics from McMaster University, an Honors Commerce Degree from University of Windsor and is a graduate of the Ivey Executive Program at Western University. He is a Director and past president of the Cayman Islands Bankers’ Association and is a Director of Cayman Finance.
Shaun Morris
currently serves as General Counsel and Group Chief Legal Officer. Mr. Morris joined the Group as General Counsel and Group Chief Legal Officer in 2012. From 2005 to 2012, Mr. Morris was the Managing Partner of Appleby's Bermuda Office. Appleby is the largest offshore law and fiduciary group operating in Bermuda. Prior to joining the Group, Mr. Morris spent his entire professional career at Appleby and was a Partner in the Banking and Asset Finance team in Bermuda. In that role, he practiced corporate and commercial law, specializing in shipping, capital markets, mergers & acquisitions and project finance. Mr. Morris holds an MA (Economics) from Dalhousie University in Canada and a Bachelor of Laws from the London School of Economics & Political Science. He is currently a member of the Bermuda Bar Association.
Michael Neff
currently serves as Managing Director of Bermuda and International Wealth, having previously served as the Bank's Group Head of Wealth Management and prior to that Group Head of Asset Management. Mr. Neff has over 30 years’ experience in financial services, having held senior roles in wealth management, commercial banking, client services, and business development functions. He began his career at Chemical Bank’s Private Banking Group where he ultimately served on the Executive Committee and led relationship management across the group. Mr. Neff then led the implementation of the global wealth management client relationship model at Citibank’s Private Bank before leaving to establish AnswerSpace Inc., a financial planning technology consultancy in 1998. He went on to found Monetaire Inc., a leading provider of financial and investment planning software that was acquired by the RiskMetrics Group. At RiskMetrics, he initially served as Global Head of Wealth Management, rising to become Co-Head of the firm’s Global Financial Risk Management business in 2009. Mr. Neff holds a Bachelor of Arts from Middlebury College and a Master of Business Administration from Columbia Business School.
Richard Saunders
currently serves as Managing Director, Channel Islands, with responsibility for Butterfield Bank (Guernsey) Limited, Butterfield Bank (Jersey) Limited and Butterfield Mortgages Limited in London. Mr. Saunders joined the Group in 2001 and was appointed Managing Director in 2015. He has held progressively senior leadership positions with the Group, including Head of European Asset Management. Mr Saunders joined the Butterfield Group Executive Committee in July 2018. He has more than 25 years of progressive management experience, having begun his career at Royal Bank of Canada in Guernsey. Mr. Saunders is a Chartered Member of the London-based Chartered Institute for Securities & Investment and holds a Bachelor’s degree in Mathematics and Sports Science from Loughborough University, England.
Michael Schrum
has served as the Bank’s Group Chief Financial Officer since September 2015. He was previously Chief Financial Officer at HSBC Bank Bermuda. Mr. Schrum has more than 20 years of financial services experience in London, New York and Bermuda, mainly in banking, insurance and tax. He joined HSBC in Bermuda in 2001 and held progressively more senior positions within the bank’s Commercial Banking, Strategy, and Finance divisions. He is a Chartered Financial Analyst and a Fellow of the Institute of Chartered Accountants in England and Wales. Mr. Schrum holds Master’s (University of London) and Bachelor’s (Southern Denmark Business School) degrees in Economics. Mr. Schrum is a Director of Ascendant Group Limited and Chairman of the Bermuda Community Foundation.
Committees of the Board
The Bank's bye-laws authorize the Board to delegate certain of its duties to committees of directors. The principal board committees are the: (1) Audit Committee, (2) Risk Policy & Compliance Committee, (3) Corporate Governance Committee, (4) Compensation & Human Resources Committee, and (5) Executive Committee. Members of committees are appointed by, from and among the non-executive members of the Board (other than the Executive Committee which includes our Chairman and Chief Executive Officer). The responsibilities and compositions of these committees are described below.
Audit Committee
Our Audit Committee, on behalf of the Board, monitors: (1) the integrity of the financial reports and other financial information provided by the Group to any governmental body or the public; (2) the independent auditor's qualifications and independence; (3) the performance of the Group's internal audit function and the independent auditors; (4) compliance with legal and regulatory requirements; (5) the Group's system of internal controls regarding finance, accounting, legal and ethics as established by management and the Board; and (6) the Group's auditing, accounting and financial reporting processes generally. Subject to shareholder approval, the Audit Committee has responsibility for the appointment or replacement of the independent auditor and for the compensation and oversight of the work of the independent auditor. In addition, the Audit Committee is responsible for approving all audit services, internal control-related services and permitted non-audit services. With respect to internal controls, the Audit Committee reviews and evaluates any major issues as to the adequacy of the Bank's internal controls, and any major control deficiencies or changes in internal controls over financial reporting are discussed with the Bank's management and the independent auditor. With respect to financial reporting, the Audit Committee consults with management, the independent auditor and the internal auditors about the integrity of the financial reporting process, reviews significant financial reporting risk exposure and management's responses, reviews significant auditor findings and establishes, reviews procedures for the receipt, retention and treatment of complaints about accounting and auditing matters, and reviews and recommends for the Board's approval the Group's financial reports.
Our Audit Committee consists of five directors that are independent under the NYSE requirements. Each member of the Audit Committee also meets the additional criteria for independence of Audit Committee members set forth in Rule 10A-3(b)(1) under the Exchange Act.
102
The members of the Audit Committee are appointed by the Board upon the recommendation of the Corporate Governance Committee. The Audit Committee's membership is as follows:
|
Name
|
|
Position
|
|
Alastair Barbour
|
|
Chairperson
|
|
Michael Covell
|
|
Member
|
|
Caroline Foulger
|
|
Member
|
|
Mark Lynch
|
Member
|
|
|
Pamela Thomas-Graham
|
Member
|
|
Mr. Barbour and Ms. Foulger each qualify as the Audit Committee financial expert.
Risk Policy & Compliance Committee
The Risk Policy & Compliance Committee, on behalf of the Board, acts as the oversight function in respect to those activities throughout the Group that give rise to credit, market, liquidity, interest rate, operational, cyber security and reputational risks and reviews compliance with laws and regulations. Specifically, the Risk Policy & Compliance Committee assists the Board in fulfilling its responsibilities by overseeing the Group's risk profile and its performance against approved risk appetites and tolerance thresholds. It approves and ensures compliance with the capital allocation model and approves overall insurance coverage for the Group. The Risk Policy & Compliance Committee also reviews the credit risk of the Group with respect to country and financial institution risk, large exposures, reserves and provisioning, off-balance sheet risk and related capital needs, as well as market, interest rate and liquidity risks. The Risk Policy & Compliance Committee monitors operational risks, including cybersecurity risks, material breaches of agreed risk limits, appropriate product risk profiles and senior management policies for identification and management of risk. In doing so, the Risk Policy & Compliance Committee seeks to ensure compliance with all applicable policies and establishes the Group's risk appetite and tolerance.
The Risk Policy & Compliance Committee’s membership is as follows:
|
Name
|
|
Position
|
|
Conor O'Dea
|
Chairperson
|
|
|
James Burr
|
|
Member
|
|
Mark Lynch
|
Member
|
|
|
Meroe Park
|
|
Member
|
|
John Wright
|
|
Member
|
Corporate Governance Committee
The Corporate Governance Committee, on behalf of the Board, reviews the effectiveness and performance of the Board as a whole, each Board committee and the boards and board committees of the Bank's subsidiaries in accordance with the corporate governance guidelines and policies of the Group. This committee acts as the nomination committee for the Board. The principal duties of the Corporate Governance Committee include reviewing and recommending to the Board membership criteria and director nominees, membership of the Board’s committees and matters relating to the performance, diversity and independence of directors. The Corporate Governance Committee oversees questions of director independence and conflicts of interest, induction and ongoing training for directors and the Board’s corporate governance policies and procedures. The Corporate Governance Committee also recommends director compensation and reviews and approves related-party transactions and reviews the Board's performance, the performance and effectiveness of the committees of the Board and the committees of the Bank's subsidiary boards.
The Corporate Governance Committee's membership is as follows:
|
Name
|
|
Position
|
|
Pamela Thomas-Graham
|
|
Chairperson
|
|
Alastair Barbour
|
|
Member
|
|
Michael Covell
|
|
Member
|
Compensation & Human Resources Committee
The Compensation & Human Resources Committee, on behalf of the Board, reviews and approves executive compensation, employee salary ranges, levels and degrees of participation in incentive compensation programs (including bonuses and equity-based incentive plans) and oversees employee development, relations and succession. Specifically, the Compensation & Human Resources Committee evaluates the fairness and effectiveness of the compensation practices implemented by the Group, approves overall compensation packages for executives, provides regular updates on executive compensation to the Board, approves changes in employee salary ranges for employees, approves the criteria and design of the Group's incentive bonus plans and approves changes to the other employee benefit plans. The Compensation & Human Resources Committee also recommends to the Board changes in the Group's equity-based incentive plans and the granting of awards under such plans, reviews and approves changes to our pension plans, reviews periodic management reports on our compensation and benefits, as well as other matters bearing on the relationship between management and employees, while making recommendations to the Board concerning our senior level organization structure and staffing, training and employee development programs.
103
The Compensation & Human Resources Committee's membership is as follows:
|
Name
|
|
Position
|
|
James Burr
|
|
Chairperson
|
|
Meroe Park
|
|
Member
|
|
John Wright
|
Member
|
|
Executive Committee
The Executive Committee may act on behalf of the Board to approve certain matters requiring immediate action in the intervals between regularly scheduled Board meetings when it it is not possible to convene a full Board meeting. The other principal duties of the Executive Committee are to monitor the progress of, and provide guidance on, important Group initiatives. The Executive Committee's membership is comprised of the Chairman and Chief Executive Officer, the chair of the Corporate Governance Committee, the chair of the Audit Committee, the chair of the Risk Policy & Compliance Committee and the chair of the Compensation & Human Resources Committee. The Chairman of the Board serves as the chair of the Executive Committee.
The Executive Committee's membership is as follows:
|
Name
|
|
Position
|
|
Michael Collins
|
|
Chairperson
|
|
James Burr
|
|
Member
|
|
Alastair Barbour
|
|
Member
|
|
Conor O'Dea
|
|
Member
|
|
Pamela Thomas-Graham
|
Member
|
|
Governance of Geographical Segments
Our banking business operates in three geographical segments — Bermuda, the Cayman Islands, and the Channel Islands and the UK— and each geographical segment utilizes operating subsidiary companies of the Bank within these jurisdictions. See "Information on the Company — Our International Network and Group Structure", which presents the corporate structure chart of our principal subsidiaries as at December 31,
2019
. Our principal operating subsidiaries are each regulated by their respective geographical regulator and are fully capitalized as stand-alone operating companies, each with its own board of directors consisting of both executive and non-executive independent directors. Guidance on general corporate governance, board sub-committee structuring, and the various governance policies and procedures of the operating subsidiaries is determined at the Group level.
Current Executive Compensation Arrangements
Senior Management and Director Compensation
In
2019
, senior management included the following executives: Michael Collins, Elizabeth Bauman, Andrew Burns, Si
â
n Dalrymple, Michael McWatt, Shaun Morris, Michael Neff, Richard Saunders and Michael Schrum. Our compensation program is designed to reward and retain senior management and includes base salary, annual short-term cash incentive compensation, long-term equity incentive compensation and miscellaneous employee benefits and fringe benefits (including, among others, executive medical benefits). In
2019
, our compensation program for directors was comprised of an annual cash retainer and an equity grant. None of our directors has entered into service contracts with the Group that provide for benefits upon the termination of their service as a director.
On December 12, 2016, the Board approved a new CEO Stock Ownership Guideline (the "Guideline") which requires the CEO to own a minimum aggregate value of our common shares equal to five times base salary. Eligible stock includes vested shares, unvested restricted shares, and other stock held by the CEO. The intrinsic value of vested or unvested stock options is not considered eligible stock under the Guideline. The CEO complies with this Guideline. If the market value of the CEO’s common stock falls below the Guideline, the CEO must retain 50% of the shares he receives as compensation until he achieves the specified ownership level.
The aggregate amount of compensation, including the value of in-kind benefits, paid to our directors and senior management during fiscal year
2019
was $26.1 million. During
2019
, the Group did not sponsor any deferred compensation plans (other than the equity compensation programs described below) and no amounts were set aside or accrued to provide pension, retirement or similar benefits to directors or senior management, other than employer matching contributions to retirement accounts on terms applicable to employees generally.
Short-Term Incentive Compensation
Senior management participates in our annual discretionary bonus program. Our compensation committee establishes an annual bonus pool based on overall company-wide performance during the applicable fiscal year. Once the compensation committee has approved the pool, the pool is allocated to eligible employees, including senior management, based on the employee's achievement of pre-established performance goals during the applicable fiscal year. Annual bonuses for executives are paid 50% in cash and 50% in the form of restricted stock unit awards that vest in three equal installments on the first three anniversaries of the date of grant.
Equity Compensation
The Group sponsors two equity incentive plans, the 1997 Stock Option Plan for Employees (the "1997 Plan") and the 2010 Omnibus Share Incentive Plan (the "2010 Plan"), in which our senior management and directors have been or are eligible to participate. The Group no longer grants equity awards under the 1997 Plan and all remaining unvested stock options under the 1997 Plan expired in 2019. The Group previously granted options under the 2010 Plan and currently grants performance-vesting restricted stock unit awards under the 2010 Plan. As at
December 31, 2019
, in the aggregate, our members of senior management held no options and 620,166 restricted stock units (assuming that performance with respect to performance-vesting restricted stock unit awards is satisfied at target levels).
Senior management participates in our long-term equity incentive compensation program. Our compensation committee grants annual restricted stock unit awards under our 2010 Plan. Restricted stock unit awards granted in 2015, 2016, 2017, 2018 and 2019 were granted in the form of performance shares, generally vesting upon the achievement of certain performance targets in the three-year period from the effective grant date. Certain members of senior management also participate in our 2010 Executive Stock Purchase Plan, which allows participants to borrow against their common shares and vested options held in a restricted account to purchase common shares.
104
During calendar year
2019
, in the aggregate, our compensation committee granted senior management 297,489 restricted stock units (which includes restricted stock unit awards granted under both the annual bonus program and long-term equity incentive compensation, and assumes that performance with respect to performance-vesting restricted stock unit awards is satisfied at target levels).
The Group may, from time to time, in the future establish or sponsor new equity incentive plans, including to replace any existing plan.
Board Leadership Structure and Qualifications
The Bank must comply with the BMA Corporate Governance Policy, which requires the Bank to appoint board members who have appropriate experience, competencies and personal qualities, including professionalism and personal integrity.
It is the Bank's policy to ensure that all companies within the Group have board members who are fit and proper persons to direct the Bank's business with prudence, integrity and professional skills. The Boards of the Bank and the Bank's subsidiaries are composed of individuals who possess diverse skills, experience and knowledge that are key to understanding the Bank's business and the execution of the Bank's strategies.
The Bank has established guidelines that address the size and composition of its own Board and those of its subsidiaries, and for identifying and selecting suitable candidates for appointment to these boards. The Corporate Governance Committee makes appointment recommendations to the Board and the appointment procedure is formal, rigorous and transparent. Each of the Bank and the Bank's subsidiary Boards are reviewed at least every two years or earlier whenever circumstances dictate in order to assess whether the Board composition is commensurate with the Bank's strategic objective and diversity principles.
In assessing continuity of service on the Board there is a general presumption that individuals should serve for a maximum of 15 years in order that the Board tenure be refreshed. Non-executive directors who have served for a period of more than 15 years are subject to an independent assessment in accordance with applicable legal requirements and regulatory and listing standards.
Board Oversight of Risk Management
The Board believes that effective risk management and control processes are critical to our safety and soundness, our ability to predict and manage the challenges that we face and, ultimately, our long-term corporate success. The Board, both directly and through its committees, is responsible for overseeing our risk management processes, with each of the committees of the Board assuming a different and important role in overseeing the management of the risks we face.
The Risk Policy & Compliance Committee oversees our enterprise-wide risk management framework, including cybersecurity risk, which establishes our overall risk appetite and risk management strategy and enables our management to understand, manage and report on the risks we face. The Risk Policy & Compliance Committee also reviews and oversees policies and practices established by management to identify, assess, measure and manage key risks we face, including the risk appetite metrics developed by management and approved by the Board. The Audit Committee of the Board is responsible for overseeing risks associated with financial, accounting and legal matters (particularly financial reporting, accounting practices and policies, disclosure controls and procedures and internal control over financial reporting), reviewing and discussing generally the identification, assessment, management and control of our risk exposures on an enterprise-wide basis and engaging as appropriate with The Risk Policy & Compliance Committee to assess our enterprise-wide risk framework. The Compensation & Human Resources Committee of the Board has primary responsibility for risks and exposures associated with our compensation policies, plans and practices, regarding both executive compensation and the compensation structure generally. In particular, our Compensation & Human Resources Committee, in conjunction with our Chairman and Chief Executive Officer and Chief Risk Officer and other members of our management as appropriate, reviews our incentive compensation arrangements to ensure these programs are consistent with applicable laws and regulations, including safety and soundness requirements, and do not encourage imprudent or excessive risk-taking by our employees. The Corporate Governance Committee of the Board oversees risks associated with the independence of the Board and potential conflicts of interest.
Our senior management is responsible for implementing and reporting to the Board regarding our risk management processes, including by assessing and managing the risks we face, including strategic, operational, cybersecurity, regulatory, investment and execution risks, on a day-to-day basis. Our senior management is also responsible for creating and recommending to the Board for approval appropriate risk appetite metrics reflecting the aggregate levels and types of risk we are willing to accept in connection with the operation of our business and pursuit of our business objectives.
The role of the Board in our risk oversight is consistent with our leadership structure, with our Chairman and Chief Executive Officer and the other members of senior management having responsibility for assessing and managing our risk exposure, and the Board and its committees providing oversight in connection with those efforts. We believe this division of risk management responsibilities presents a consistent, systemic and effective approach for identifying, managing and mitigating risks throughout our operations.
Code of Conduct and Ethics and Whistleblower Policy
The Board has adopted a Group Code of Conduct and Ethics (the "Code") based upon recommended principles of corporate governance. The Code sets out the guidelines and procedures for establishing a high standard of ethical conduct, accountability and transparency to which all of our employees are expected to comply and which are consistent with our high standards of ethics and core values. The Board, in conjunction with the Corporate Governance Committee and Risk Policy & Compliance Committee, are responsible for administering the Code. The Code is available on our website at www.butterfieldgroup.com.
The Board has adopted a Whistleblower Policy which augments the Code. The policy is designed to serve as a tool to assist employees who believe they have or may have discovered illegal, unethical, or questionable practices to communicate their concerns confidentially and without fear of reprisals. It is also designed to protect the integrity of the Bank's financial reporting and its business dealings.
Foreign Private Issuer Status
The listing rules of the NYSE include certain accommodations with respect to corporate governance requirements that allow foreign private issuers, such as us, to follow "home country" corporate governance practices in lieu of otherwise applicable NYSE corporate governance standards for listed U.S. companies. However, foreign private issuers are required to have an audit committee that satisfies certain of the NYSE standards, including the requirements of the SEC’s Rule 10A-3. Our Audit Committee satisfies such requirements. The NYSE also requires a foreign private issuer to provide certain written affirmations and notices to the NYSE.
SEC rules require foreign private issuers to disclose the significant ways in which their corporate governance practices differ from NYSE listing standards. A description of how our corporate governance practices compare to NYSE listing standards is set forth below:
105
|
•
|
A Majority of Independent Directors
. The NYSE requires the majority of the board of directors of a listed U.S. company to be independent directors pursuant to applicable NYSE standards. As required by our Corporate Governance Guidelines, a majority of our Board is independent according to the NYSE's standards.
|
|
•
|
A Nominating/Corporate Governance Committee
. The NYSE requires a listed U.S. company to have a nominating/corporate governance committee consisting of independent directors as well as a written charter specifying the purpose and responsibilities of the committee. We currently have a Corporate Governance Committee, and the composition of this committee and its written charter are determined pursuant to the NYSE standards. A copy of the charter is available on our website at www.butterfieldgroup.com.
|
|
•
|
A Compensation Committee
. The NYSE requires a listed U.S. company to have a compensation committee consisting of independent directors that also meet additional independence requirements as set forth in the NYSE rules as well as a committee charter specifying the purpose and responsibilities of the committee. We currently have a Compensation & Human Resources Committee, and the composition of this committee and its written charter are determined pursuant to the NYSE standards. A copy of the charter is available on our website at www.butterfieldgroup.com.
|
|
•
|
Executive Sessions
. The NYSE requires that non-management directors meet regularly in executive sessions without management. The NYSE also requires that all independent directors meet in an executive session at least once a year. Our non-management directors meet regularly in executive sessions without management present. In
2019
, the Board held five executive sessions with only our independent directors present.
|
|
•
|
Company Policies
. The NYSE requires a listed U.S. company to adopt and disclose a code of business conduct and corporate governance guidelines that address certain governance standards. As noted above, the Board has adopted the Code. In addition, the Board has adopted Corporate Governance Guidelines that address Board composition and qualifications, director responsibilities, director access to management and the Board’s authority to engage advisors. Furthermore, we have adopted a Corporate Governance Policy that addresses director compensation, director orientation and continuing education, management succession and Board assessments. The Code and the Corporate Governance Guidelines are available on our website at www.butterfieldgroup.com.
|
|
•
|
Shareholder Approval of Equity Compensation Plans
. The NYSE requires a listed U.S company to receive shareholder approval of any equity compensation plans. The Bank does not submit its equity compensation plans to shareholders for approval.
|
We believe that our established corporate governance practice satisfies the NYSE listing standards applicable to foreign private issuers. If at any time we cease to be a "foreign private issuer" under the rules of the NYSE and no other exemptions apply, or if we otherwise so elect, the Board will take any additional actions necessary to comply with NYSE corporate governance rules applicable to listed U.S. companies, subject to a permitted "phase-in" period.
106
MAJOR SHAREHOLDERS AND RELATED-PARTY TRANSACTIONS
The following table sets forth information with respect to the beneficial ownership of our common shares as at February
17,
2020, unless noted otherwise, in each case by: each person or entity known by us to beneficially own 5% or more of our issued and outstanding common shares; each of our directors and executive officers individually; and all of our directors and executive officers as a group. As at February
17,
2020, we had approximately 53 million common shares issued and outstanding.
Under the rules of the Securities and Exchange Commission, a person is deemed to be a "beneficial owner" of a security if that person has or shares "voting power," which includes the power to vote or to direct the voting of such security, or "investment power," which includes the power to dispose of or to direct the disposition of such security. A person is also deemed to be a beneficial owner of any securities of which that person has a right to acquire beneficial ownership within 60 days. Under these rules, more than one person may be deemed to be a beneficial owner of such securities as to which such person has voting or investment power. Except as described in the footnotes below, to our knowledge, each of the persons named in the table below has sole voting and investment power with respect to the common shares beneficially owned, subject to community property laws where applicable.
Unless otherwise noted, the address for each shareholder listed on the table below is: c/o The Bank of N.T. Butterfield & Son Limited, 65 Front Street, Hamilton, HM 12, Bermuda.
|
Name of beneficial owner
|
Number of common shares beneficially owned
|
Beneficial ownership percentage
|
||||
|
Major Shareholders:
|
||||||
|
Davis Selected Advisers, L.P.
(1)
|
3,305,458
|
|
6.00
|
%
|
||
|
Directors and Executive Officers:
|
||||||
|
Alastair Barbour
|
11,692
|
|
*
|
|
||
|
Elizabeth Bauman
(2)
|
30,987
|
|
*
|
|
||
|
Andrew Burns
(3)
|
3,244
|
|
*
|
|
||
|
James F. Burr
(4)
|
2,337
|
|
*
|
|
||
|
Michael Collins
(5)
|
102,088
|
|
*
|
|
||
|
Michael Covell
|
1,433
|
|
*
|
|
||
|
Siân Dalrymple
(6)
|
4,196
|
|
*
|
|
||
|
Caroline Foulger
|
8,865
|
|
*
|
|
||
|
Mark Lynch
(7)
|
19,352
|
|
*
|
|
||
|
Michael McWatt
(8)
|
25,143
|
|
*
|
|
||
|
Shaun Morris
(9)
|
56,839
|
|
*
|
|
||
|
Michael Neff
(10)
|
31,153
|
|
*
|
|
||
|
Conor O'Dea
|
61,595
|
|
*
|
|
||
|
Meroe Park
|
1,868
|
|
*
|
|
||
|
Richard Saunders
(11)
|
5,095
|
|
*
|
|
||
|
Michael Schrum
(12)
|
117,212
|
|
*
|
|
||
|
Pamela Thomas-Graham
|
1,734
|
|
*
|
|
||
|
John R. Wright
(13)
|
11,403
|
|
*
|
|
||
|
All directors and executive officers as a group (18 persons)
|
496,236
|
|
*
|
|
||
|
*
|
Indicates less than 1%
|
|
(1)
|
Based on the Schedule 13G filed on February 13, 2019 by Davis Selected Advisers, L.P., which reported that as at December 31, 2019, Davis Selected Advisers, L.P. beneficially owned 3,305,458 common shares, with sole voting and dispositive power over all such shares. The business address of Davis Selected Advisers, L.P. is 2949 East Elvira Road, Suite 101, Tucson, Arizona 85756.
|
|
(2)
|
Consists of (i) 28,603 ordinary shares and (ii) 2,384 ordinary shares underlying restricted stock that will vest within 60 days of February 17, 2020.
|
|
(3)
|
Consists of (i) 2,150 ordinary shares and (ii) 1,094 ordinary shares underlying restricted stock that will vest within 60 days of February 17, 2020.
|
|
(4)
|
Consists of (i) 1,433 ordinary shares held by Mr. Burr directly and (ii) 904 ordinary shares held by Wells Fargo over which Mr. Burr exercises voting and dispositive control.
|
|
(5)
|
Consists of (i) 80,745 ordinary shares and (ii) 21,343 ordinary shares underlying restricted stock that will vest within 60 days of February 17, 2020.
|
|
(6)
|
Consists of (i) 2,499 ordinary shares and (ii) 1,697 ordinary shares underlying restricted stock that will vest within 60 days of February 17, 2020.
|
|
(7)
|
Consists of (i) 18,552 ordinary shares held by Mr. Lynch directly and (ii) 800 ordinary shares held by a family member over which Mr. Lynch exercises voting and dispositive control
|
|
(8)
|
Consists of (i) 23,357 ordinary shares and (ii) 1,786 ordinary shares underlying restricted stock that will vest within 60 days of February 17, 2020.
|
|
(9)
|
Consists of (i) 54,298 ordinary shares and (ii) 2,541 ordinary shares underlying restricted stock that will vest within 60 days of February 17, 2020.
|
|
(10)
|
Consists (i) 29,199 ordinary shares and (ii) 1,954 ordinary shares underlying restricted stock that will vest within 60 days of February 17, 2020.
|
|
(11)
|
Consists of (i) 3,488 ordinary shares and (ii) 1,607 ordinary shares underlying restricted stock that will vest within 60 days of February 17, 2020.
|
|
(12)
|
Consists of (i) 105,349 ordinary shares and (ii) 11,863 ordinary shares underlying restricted stock that will vest within 60 days of February 17, 2020.
|
|
(13)
|
Consists of 11,403 ordinary shares held jointly with his spouse.
|
The shareholders listed above do not have voting rights that are different from those held by any other holder of common shares of the Bank. As at January 31, 2020, approximately 83% of our common shares were held by holders and/or Custodians of record located in the United States, and there were approximately 240 holders of record of our common shares located in the United States. As at January 31, 2020, approximately 16% of our common shares were held of record by holders located in Bermuda, and there were approximately 4,100 holders of record of our common shares located in Bermuda.
107
Our Relationship with The Carlyle Group
Prior to the completion of our registered secondary offering on February 28, 2017, Carlyle held approximately 14% of our equity voting power along with the right to designate two persons for nomination for election by the shareholders as members of the Board. Following the completion of the offering, Carlyle no longer owns any shares of our common stock and no longer has the right to nominate any persons for election by our shareholders as members of the Board.
Investment Agreement
In connection with the subscription by Carlyle and certain other investors for newly issued common shares and preference shares that have since been converted to our common shares, we entered into an Investment Agreement, dated as at March 2, 2010 (the "Investment Agreement") with Carlyle. The Investment Agreement provides for, among other items, subject to the terms set forth in the Investment Agreement, certain transfer restrictions and Carlyle's right to designate two persons for nomination for election by the shareholders as members of the Board. The Investment Agreement also contained certain standstill and other provisions which have generally expired.
Amended Investment Agreement
Prior to our IPO, in August 2016, we entered into the Amended Investment Agreement with Carlyle.
The Amended Investment Agreement provides that, subject to certain exceptions for ordinary public market trades, Carlyle may not transfer the common shares it holds to any person or group if, to its knowledge, such transferee (directly or together with its affiliates) would own 10% or more of the outstanding voting power in the Bank.
In addition, the Amended Investment Agreement provided that (a) until our common shares held by Carlyle represented less than 10% of our issued and outstanding common shares, Carlyle was entitled to nominate two persons for election as members of the Board and (b) if our common shares held by Carlyle represented less than 10% but at least 5% of our issued and outstanding common shares, Carlyle was entitled to nominate one person for election as a member of the Board (such nominees, "Carlyle Directors"), in each case subject to the Carlyle Directors' satisfaction of legal requirements regarding services as a director. The Amended Investment Agreement provided that we would use our reasonable best efforts to cause the Carlyle Directors to be elected to the Board and would solicit proxies for the Carlyle Directors to the same extent that we do for our other nominees to the Board, and that if requested by Carlyle, one Carlyle Director chosen by Carlyle would be appointed to certain committees and subcommittees of the Board.
Under the terms set forth in the Amended Investment Agreement, until our common shares held by Carlyle represented less than 5% of our issued and outstanding common shares, we also agreed to share certain financial and other information with Carlyle and Carlyle was generally obliged to treat information provided to it as confidential, and to comply with all applicable rules and regulations in relation to the use and disclosure of such information.
As of the completion of our registered secondary offering on February 28, 2017, Carlyle no longer holds any of our issued and outstanding common shares. As such, Carlyle is no longer entitled to the applicable rights set forth above under the Amended Investment Agreement, including the right to nominate persons for election by our shareholders as members of the Board.
This summary does not purport to be a comprehensive description of the Amended Investment Agreement, and is qualified in its entirety by the full text of the Amended Investment Agreement filed as an exhibit to this report.
Transactions with Related Parties and with Directors and Executive Officers
Financing Transactions
Certain directors and executives of the Bank, companies in which they are principal owners and/or members of the board, and trusts in which they are involved, have loans and deposits with the Bank. Loans to directors were made in the ordinary course of business at normal credit terms, including interest rate and collateral requirements. Loans to executives may be eligible for preferential rates. All of these loans were considered performing loans as at
December 31, 2019
and
December 31, 2018
. Loan balances with directors and executives of the Bank, companies in which they are principal owners and/or members of the board, and trusts in which they are involved were as follows:
|
Balance at December 31, 2017
|
30,575
|
|
|
Loans issued during the year
|
77,269
|
|
|
Loan repayments and the effect of changes in the composition of related parties
|
(10,649
|
)
|
|
Balance at December 31, 2018
|
97,195
|
|
|
Loans issued during the year
|
45,602
|
|
|
Loan repayments and the effect of changes in the composition of related parties
|
(104,156
|
)
|
|
Balance at December 31, 2019
|
38,641
|
|
|
Consolidated balance sheets
|
December 31, 2019
|
|
December 31, 2018
|
|
||
|
Deposits
|
12,838
|
|
17,232
|
|
||
|
Year ended December 31
|
||||||
|
Consolidated statement of operations
|
2019
|
2018
|
2017
|
|||
|
Interest and fees on loans
|
1,887
|
|
4,533
|
|
1,100
|
|
108
Certain affiliates of the Bank have loans and deposits with the Bank which were made and are maintained in the ordinary course of business on normal commercial terms. Balances with these parties were as follows:
|
Consolidated balance sheets
|
|
December 31, 2019
|
|
December 31, 2018
|
|
|
|
Loans
|
|
9,888
|
|
10,180
|
|
|
|
Deposits
|
|
342
|
|
352
|
|
|
|
|
|
|
|
|||
|
|
Year ended December 31
|
|||||
|
Consolidated statement of operations
|
2019
|
2018
|
2017
|
|||
|
Interest and fees on loans
|
677
|
|
635
|
|
647
|
|
|
Total non-interest expense
|
1,717
|
|
1,769
|
|
1,939
|
|
Capital Transaction
Up to February 28, 2017, investment partnerships associated with The Carlyle Group held approximately
14%
of the Bank's equity voting power along with the right to designate two persons for nomination for election by the shareholders as members of the Bank’s Board of Directors. On February 28, 2017, as a result of a secondary public offering, the Carlyle Group sold their holdings in the Bank, and as a result, the investment agreement between the Bank and the Carlyle Group was terminated.
Financial Transactions With Related Parties
The Bank holds seed investments in several Butterfield mutual funds, which are managed by a wholly-owned subsidiary of the Bank. These investments are included in equity securities at their fair value and are as follows:
|
Consolidated balance sheets
|
December 31, 2019
|
|
December 31, 2018
|
|
|
|
Equity securities
|
|||||
|
Fair value
|
7,142
|
|
6,176
|
|
|
|
Unrealized gain
|
2,142
|
|
1,176
|
|
|
As at
December 31, 2019
, several Butterfield mutual funds which are managed by a wholly owned subsidiary of the Bank, had loan balances and deposit balances held with the Bank. The Bank also earned asset management revenue and custody and other administration services revenue from funds managed by a wholly-owned subsidiary of the Bank and from directors and executives, companies in which they are principal owners and/or members of the board and trusts in which they are involved, as well as other income from other related parties.
|
Consolidated balance sheets
|
December 31, 2019
|
|
December 31, 2018
|
|
||
|
Loans
|
16
|
|
1,843
|
|
||
|
Deposits
|
3,492
|
|
36,655
|
|
||
|
Year ended December 31
|
||||||
|
Consolidated statement of operations
|
2019
|
2018
|
2017
|
|||
|
Asset management
|
10,273
|
|
9,412
|
|
7,697
|
|
|
Custody and other administration services
|
1,452
|
|
1,376
|
|
1,036
|
|
|
Other non-interest income
|
1,458
|
|
972
|
|
122
|
|
Employment Agreements
The Group has entered into employment agreements with senior management. The compensation paid in
2019
to senior management under the employment agreements is described above under ‘‘Management — Current Executive Compensation Arrangements". The senior management employment agreements generally provide for terms and conditions of employment, including the payment of a base salary, participation in the Group’s short and long-term incentive compensation programs, notice provisions, severance benefits, change in control equity award vesting and participation in the Group’s health, welfare and retirement programs available to all senior executives. For certain members of senior management, the employment agreements also provide for executive life insurance and participation in the Group’s share purchase programs.
Related-Party Transaction Policy
The Board has adopted a written policy governing the review, approval or ratification of transactions between the Bank or any of its subsidiaries and any "related party," which is a person or entity: (1) that controls, is controlled by, or is under common control with the Bank; (2) that is an associate of the Bank; (3) that is a shareholder of the Bank that has significant influence by virtue of its ownership of the Bank; (4) that is a director, executive officer or other key management person at the Bank; or (5) in which a substantial interest in its voting power is held by the persons described in (3) or (4) above. The policy calls for the related-person transactions to be reviewed and, if deemed appropriate, approved or ratified by our Corporate Governance Committee. In determining whether or not to approve or ratify a related-person transaction, our Corporate Governance Committee takes into account, among other factors it deems important, whether the related-person transaction is in our best interests and whether the transaction is on terms no less favorable than terms generally available to an unaffiliated third party under the same or similar circumstances. In the event that a member of our Corporate Governance Committee is not disinterested with respect to the related-person transaction under review, that member may not participate in the review, approval or ratification of that related-person transaction. Approval of the disclosure of any related party transaction included in our financial statements or any other SEC filing is the responsibility of the Audit Committee.
109
CERTAIN TAXATION CONSIDERATIONS
Bermuda Tax Considerations
Under Bermuda law, there are currently no stamp or documentary taxes, duties or similar taxes in connection with a conveyance or transfer on sale, or a conveyance or transfer to effect or having the effect of a voluntary disposition inter vivos or any agreement for the lending and borrowing of the Bank's shares which are listed on the BSX or NYSE.
We are not required by any Bermuda law or regulation to make any deductions or withholdings in Bermuda from any payment we may make in respect of the Bank's shares. However, during 2018 the Bermuda Tax Reform Commission proposed the introduction of a withholding tax on interest and dividend income, amongst other reforms. The Bermuda government has not introduced this tax as yet. If the tax is introduced, there may be an impact on holders of the Bank’s shares, along with an increase in our compliance obligations.
Furthermore, Bermuda currently has no corporate or capital gains taxes.
Material US Federal Income Tax Consequences
This section describes the material US federal income tax consequences of owning and disposing of common shares of the Bank. It applies solely to US shareholders (as defined below) that hold shares as capital assets for US federal income tax purposes. This section does not describe all of the tax consequences that may apply to members of a special class of holders subject to special rules, including:
|
•
|
a dealer in securities or foreign currencies;
|
|
•
|
a regulated investment company;
|
|
•
|
a trader in securities that elects to use a mark-to-market method of accounting for securities holdings;
|
|
•
|
a tax-exempt organization;
|
|
•
|
a bank, an insurance company, or any other financial institution;
|
|
•
|
a person that actually or constructively owns 10% or more, by vote or value, of the Bank;
|
|
•
|
a person that holds the Bank's common shares as part of a straddle or a hedging, conversion, or other risk reduction transaction for US federal income tax purposes;
|
|
•
|
a person that purchases or sells common shares as part of a wash sale for tax purposes;
|
|
•
|
an entity classified as a partnership for US federal income tax purposes; or
|
|
•
|
a person whose functional currency is not the US Dollar.
|
This section is based on the Internal Revenue Code of 1986, as amended (the "IRC"), its legislative history, existing and proposed Treasury regulations, published rulings and court decisions, all as of the date hereof. These laws are subject to change, possibly on a retroactive basis.
If an entity treated as a partnership for US federal income tax purposes holds common shares, the US federal income tax treatment of a partner will generally depend on the status of the partner and the tax treatment of the partnership. A partner in an entity treated as a partnership for US federal income tax purposes holding common shares should consult its tax advisers with regard to the US federal income tax treatment of the ownership and disposition of the Bank's common shares.
Shareholders should consult their own tax advisers regarding the US federal, state and local and foreign and other tax consequences of owning and disposing of the Bank's common shares in their particular circumstances.
Special adverse US federal income tax rules apply if a US shareholder owns shares of a company that is or was treated as a PFIC for US federal income tax purposes for any taxable year during which the US shareholder held such shares. US shareholders should consult their own tax advisers as to the potential application of the PFIC rules to their ownership and disposition of the Bank's common shares.
US Shareholders
For the purposes of this discussion, a "US shareholder" is a beneficial owner of common shares that is:
|
•
|
an individual that is a citizen or resident of the United States,
|
|
•
|
a corporation, or other entity taxable as a corporation, created or organized under the laws of the United States, any state therein or the District of Columbia,
|
|
•
|
an estate whose income is subject to US federal income tax regardless of its source, or
|
|
•
|
a trust if a US court can exercise primary supervision over the trust's administration and one or more US persons are authorized to control all substantial decisions of the trust.
|
Passive Foreign Investment Company Considerations
Special adverse US federal income tax rules apply if a US shareholder holds shares of a company that is treated as a PFIC for any taxable year during which the US shareholder held such shares. This conclusion is a factual determination that is made annually and thus may be subject to change. A foreign corporation will be considered a PFIC with respect to a US Shareholder for any taxable year if (i) at least 75% of its gross income for the taxable year is passive income (the "income test"), or (ii) at least 50% of the value, determined on the basis of a quarterly average, of its assets is attributable to assets that produce or are held for the production of passive income (the "asset test"). Passive income for this purpose generally includes dividends, interest, royalties, rents (other than certain rents and royalties derived in the active conduct of a trade or business), annuities and gains from assets that produce passive income. If a foreign corporation owns at least 25% (by value) of the shares or stock of another corporation, the foreign corporation is treated, for purposes of the PFIC tests, as owning a proportionate share of the other corporation's assets and receiving its proportionate share of the other corporation's income.
Banks generally derive a substantial part of their income from assets that are interest bearing or that otherwise could be considered passive under the PFIC rules. The IRS has issued a notice, and has proposed regulations, that exclude from passive income any income derived in the active conduct of a banking business by a qualifying foreign bank.
Based upon the proportion of our income derived from activities that are "bona fide" banking activities for US federal income tax purposes, we believe that we were not a PFIC for the taxable year ending December 31, 2019 (the latest period for which the determination can be made) and, based further on our present regulatory status under local laws, the present nature of our activities, and the present composition of our assets and sources of income, we do not expect to be a PFIC for the current year or any
110
future years. However, because PFIC status is a factual determination and because there are uncertainties in the application of the relevant rules, there can be no assurances that we will not be a PFIC for any particular year.
If the Bank were a PFIC in any taxable year during which a US shareholder owns the Bank's common shares and the US shareholder does not make a "mark-to-market" election, as discussed below, or a special "purging" election, the Bank generally would continue to be treated as a PFIC with respect to such US shareholder in all succeeding taxable years, regardless of whether the Bank continues to meet the income or asset test discussed above. US shareholders are urged to consult their own tax advisers with respect to the tax consequences to them if the Bank were to become a PFIC for any taxable year in which they own the common shares.
If the Bank is a PFIC for any taxable year during which a US shareholder holds the common shares and the US shareholder does not make a mark-to-market election, as described below, the US shareholder will be subject to special rules with respect to:
•
any gain realized on the sale or other disposition of its common shares; and
|
•
|
any "excess distribution" that the Bank makes to the US shareholder (generally, any distributions to the US shareholder during a single taxable year that are greater than 125% of the average annual distributions received by the US shareholder in respect of its common shares during the three preceding taxable years or, if shorter, the portion of the US shareholder's holding period for the common shares that preceded the current taxable year).
|
Under these rules:
|
•
|
the gain or excess distribution will be allocated ratably over the US shareholder's holding period for the common shares;
|
|
•
|
the amount allocated to the taxable year in which the US shareholder realized the gain or excess distribution and to years before the Bank became a PFIC will be taxed as ordinary income; and
|
|
•
|
the amount allocated to each other taxable year, with certain exceptions, will be subject to additional tax calculated by multiplying the amount allocated to such other taxable year by the highest tax rate in effect for that taxable year for individuals or corporations, as appropriate, and the interest charge generally applicable to underpayments of tax will be imposed in respect of the tax attributable to each such year.
|
Alternatively, if a US shareholder owns shares in a PFIC that are treated as "marketable stock," the US shareholder may make a mark-to-market election. The common shares will be treated as marketable stock if they are regularly traded on a "qualified exchange." For these purposes, the common shares will be considered regularly traded during any calendar year during which it is traded, other than in negligible quantities, on a qualified exchange, which includes the NYSE, on at least 15 days during each calendar quarter. Any trades that have as their principal purpose meeting this requirement will be disregarded.
A US shareholder that makes a mark-to-market election will not be subject to the PFIC rules described above. Instead, the US shareholder will include as ordinary income each year that the Bank is a PFIC the excess, if any, of the fair market value of its common shares at the end of the taxable year over its adjusted basis in the common shares. These amounts of ordinary income will not be eligible for the favorable tax rates applicable to qualified dividend income or long-term capital gains discussed above. The US shareholder will also be allowed to take an ordinary loss in respect of the excess, if any, of the adjusted basis of its common shares over their fair market value at the end of the taxable year that the Bank is a PFIC (but only to the extent of the net amount of income previously included as a result of the mark-to-market election). The US shareholder's basis in its common shares will be adjusted to reflect any such income or loss amounts recognized. Any gain recognized on the sale or other disposition of the common shares in a taxable year when the Bank is a PFIC will be treated as ordinary income and any loss will be treated as an ordinary loss (but only to the extent of the net amount of income previously included as a result of the mark-to-market election). Distributions paid on the common shares will be treated as discussed above under "- Taxation of Dividends".
A mark-to-market election will continue to be in effect for all taxable years in which the Bank is a PFIC and the common shares are treated as marketable stock, and may not be revoked without the consent of the IRS. If the US shareholder makes a mark-to-market election with respect to its common shares, it will be treated as having a new holding period in its common shares beginning on the first day of the first taxable year beginning after the last taxable year for which the mark-to-market election applies. The application of the mark-to-market rules to an investment in a PFIC with a subsidiary that is also a PFIC is not entirely clear; however, there is a significant risk that some or all of such an investment will be subject to the special rules described above that apply if a mark-to-market election is not made, even if a mark-to-market election is made with respect to the parent PFIC. In the event that the Bank is a PFIC, US shareholders are urged to consult their tax advisers regarding the availability of the mark-to-market election, and whether the election would be advisable in the holder's particular circumstances.
The PFIC rules outlined above would also not apply to a US shareholder if such holder were to elect to treat us as a qualified electing fund ("QEF"). An election to treat us as a QEF will not be available, however, if the Bank does not provide the information necessary to make such an election. The Bank will not provide US shareholders with the information necessary to make a QEF election, and thus, the QEF election will not be available with respect to the common shares.
Notwithstanding any election made with respect to the common shares, dividends received with respect to the common shares will not constitute "qualified dividend income" if we are a PFIC (or are treated as a PFIC with respect to the relevant US shareholder) in either the taxable year of the distribution or the preceding taxable year. Dividends that do not constitute qualified dividend income are not eligible for taxation at the reduced tax rate available to certain non-corporate holders described above in "- Taxation of Dividends". Instead, such dividends would be subject to tax at ordinary income rates.
If a US shareholder owns common shares during any taxable year in which we are a PFIC, the US shareholder generally must file annual tax returns (including on Form 8621), for each taxable year that the US shareholder owns the common shares, unless its ownership satisfies a
de minimis
test.
Taxation of Dividends
Subject to the preceding discussion under the heading "— Passive Foreign Investment Company Considerations" above, a US shareholder must include in its gross income as dividends the gross amount of any distribution paid by the Bank to the extent that it is paid out of the Bank's current or accumulated earnings and profits as determined for US federal income tax purposes. Distributions in excess of current and accumulated earnings and profits, as determined for US federal income tax purposes, will be treated as a non-taxable return of capital to the extent of the US shareholder's basis in the common shares of the Bank, causing a reduction in the US shareholder's adjusted basis in such common shares, and thereafter as capital gain. Because the Bank does not maintain calculations of its earnings and profits under US federal income tax principles, it is expected that distributions generally will be reported to US shareholders as dividends.
Dividends paid to certain non-corporate US shareholders by a "qualified foreign corporation" that constitute qualified dividend income are taxable to the shareholder at the preferential rates applicable to long-term capital gains provided that the shareholder holds the shares for more than 60 days during the 121-day period beginning 60 days before the ex-dividend date and meets other holding period requirements. For this purpose, common shares of the Bank will be treated as stock of a "qualified foreign corporation" if the Bank was not a PFIC for the taxable year in which the dividend was paid, or the preceding taxable year and if such common shares are listed on an established securities market in the United States, such as the NYSE. The common shares of the Bank are listed on the NYSE. Accordingly, subject to the preceding discussion under the heading "— Passive Foreign Investment Company Considerations", dividends the Bank pays with respect to the common shares will constitute qualified dividend income, assuming the holding period requirements are met.
111
The dividend will not be eligible for the dividends-received deduction allowed to US corporations in respect of dividends received from other US corporations.
Dividends generally will be treated as foreign source income for US foreign tax credit purposes. Under Section 904(h) of the IRC, however, dividends paid by a foreign corporation that is treated as 50% or more owned, by vote or value, by US persons for US federal income tax purposes may be treated as US source income (rather than foreign source income) for foreign tax credit purposes, to the extent the foreign corporation earns US source income. In general, therefore, the application of Section 904(h) of the IRC may adversely affect a US shareholder's ability to use foreign tax credits. As a result of the listing of the common shares of the Bank on the NYSE, the Bank may be treated as 50% or more owned by US persons for purposes of Section 904(h) of the IRC. US shareholders are strongly urged to consult their own tax advisers regarding the possible impact if Section 904(h) of the IRC should apply.
Taxation of Capital Gains
Subject to the preceding discussion under the heading "— Passive Foreign Investment Company Considerations", a US shareholder that sells or otherwise disposes of common shares of the Bank will recognize capital gain or loss for US federal income tax purposes equal to the difference between the amount that the US shareholder realizes and the US shareholder's tax basis in those common shares. Capital gain of a non-corporate US shareholder is generally taxed at preferential rates where the property is held for more than one year. The gain or loss will be US source income or loss for foreign tax credit limitation purposes. The deduction of capital losses is subject to limitations.
Medicare Tax on Net Investment Income
A US person that is an individual or estate, or a trust that does not fall into a special class of trusts that is exempt from such tax, is subject to a 3.8% tax (the "Medicare tax") on the lesser of (i) the US person's "net investment income" (or "undistributed net investment income" in the case of an estate or trust) for the relevant taxable year and (ii) the excess of the US person's modified adjusted gross income for the taxable year over a certain threshold (which in the case of individuals is between $125,000 and $250,000, depending on the individual's circumstances). A shareholder's net investment income generally includes its dividend income and its net gains from the disposition of shares, unless such dividends or net gains are derived in the ordinary course of the conduct of a trade or business (other than a trade or business that consists of certain passive or trading activities). If a shareholder is a US person that is an individual, estate or trust, the shareholder is urged to consult the shareholder's tax advisers regarding the applicability of the Medicare tax to the shareholder's income and gains in respect of the shareholder's investment in the Bank's common shares.
Information with Respect to Foreign Financial Assets
Owners of "specified foreign financial assets" with an aggregate value in excess of $50,000 (and in some cases, a higher threshold) may be required to file an information report with respect to such assets with their tax returns. "Specified foreign financial assets" include any financial accounts maintained by foreign financial institutions, as well as any of the following, if they are held for investment and not held in accounts maintained by financial institutions: (i) stocks and securities issued by non-US persons, (ii) financial instruments and contracts that have non-US issuers or counterparties and (iii) interests in foreign entities. US shareholders are urged to consult their tax advisers regarding the application of this legislation to their ownership of the Bank's common shares.
Backup Withholding and Information Reporting
Information reporting requirements for a non-corporate US shareholder, on IRS Form 1099, will apply to (i) dividend payments or other taxable distributions made to such US shareholder within the United States, and (ii) the payment of proceeds to such US shareholder from the sale of the Bank's common shares effected at a US office of a broker.
Additionally, backup withholding may apply to such payments to a non-corporate US shareholder that (i) fails to provide an accurate taxpayer identification number, (ii) (in the case of dividend payments) is notified by the IRS that such US shareholder has failed to report all interest and dividends required to be shown on such US shareholder's federal income tax returns, or (iii) in certain circumstances, fails to comply with applicable certification requirements.
A US shareholder may obtain a refund of any amounts withheld under the backup withholding rules that exceed the shareholder's income tax liability by properly filing a refund claim with the IRS.
Payment of proceeds from the sale of shares effected at a foreign office of a broker generally will not be subject to information reporting or backup withholding. However, a sale effected at a foreign office of a broker could be subject to information reporting in the same manner as a sale within the United States, (and in certain cases may be subject to backup withholding as well) if (i) the broker has certain connections to the United States, or (ii) the sale has certain other specified connections with the United States.
Foreign Account Tax Compliance Act Withholding
Pursuant to the FATCA enacted in 2010, a 30% withholding tax will be imposed on certain payments to certain non-US financial institutions that fail to comply with certain information-reporting, account identification, withholding, certification and other FATCA-related requirements in respect of their direct and indirect United States shareholders and/or United States accountholders. To avoid becoming subject to FATCA withholding, we and other non-US financial institutions may be required to report information to the IRS regarding the holders of the common shares and to withhold on a portion of payments under the common shares to certain holders that fail to comply with the relevant information reporting requirements (or the holders of the common shares directly or indirectly through certain non-compliant intermediaries). However, under proposed Treasury regulations, such withholding will not apply to payments made before the date that is two years after the date on which final regulations defining the term "foreign passthru payment" are enacted.
112
ENFORCEMENT OF CIVIL LIABILITIES
The Bank is incorporated under the laws of Bermuda. As a result, the rights of holders of the Bank’s common shares will be governed by Bermuda law, the Butterfield Act and the Bank’s bye-laws. The rights of shareholders under Bermuda law may differ from the rights of shareholders of companies incorporated in other jurisdictions. Some of our directors and some of the named experts referred to in this annual report are not residents of the United States, and a substantial portion of our assets are located outside the United States. As a result, it may be difficult for investors to effect service of process on those persons in the United States or to enforce in the United States judgments obtained in US courts against us or those persons based on the civil liability provisions of the US federal securities laws. However, we may be served with process in the United States with respect to actions against us arising out of or in connection with violations of US federal securities laws relating to offers and sales of common shares made hereby by serving C T Corporation System, 28 Liberty Street, New York, 10005, our US agent irrevocably appointed for that purpose.
It is doubtful whether courts in Bermuda will enforce judgments obtained in other jurisdictions, including the United States, against us or our directors or officers under the securities laws of those jurisdictions, or entertain actions in Bermuda against us or our directors or officers under the securities laws of other jurisdictions.
113
DISCLOSURE CONTROLS AND PROCEDURES
Evaluation of Disclosure Controls and Procedures
As of the end of the period covered by this report, Butterfield carried out an evaluation, under the supervision and with the participation of Butterfield’s management, including our Chairman and Chief Executive Officer and Group Chief Financial Officer, of the effectiveness of the design and operation of Butterfield’s disclosure controls and procedures (as defined in Rule 13a-15(e) under the Exchange Act, to ensure that information required to be disclosed by Butterfield in reports that it files or submits under the Exchange Act, is recorded, processed, summarized and reported within the time periods specified in the SEC’s rules and forms, and that such information is accumulated and communicated to Butterfield’s management, including its Chairman and Chief Executive Officer and Group Chief Financial Officer, as appropriate, to allow for timely decisions regarding required disclosure. Based upon that evaluation, Butterfield’s Chairman and Chief Executive Officer and Group Chief Financial Officer concluded that the design and operation of these disclosure controls and procedures were effective, in all material respects, as of the end of the period covered by this report.
Reports Regarding Internal Controls
Management’s Annual Report on Internal Control over Financial Reporting and the Report of Independent Registered Public Accounting Firm are included on pages F-2 and F-3, respectively.
114
PRINCIPAL ACCOUNTANT FEES AND SERVICES
The following table sets forth for the fiscal years indicated the fees charged by our principal accountant and its associated entities for various services provided during those periods:
|
In millions of $
|
Fiscal Year Ended
|
|||||||
|
Type of Services
|
December 31, 2019
|
December 31, 2018
|
Description of Service
|
|||||
|
Audit services
|
6.5
|
|
7.4
|
|
(1)
|
|||
|
Audit-related services
|
0.1
|
|
—
|
|
(1)
|
|||
|
Tax services
|
—
|
|
—
|
|
(2)
|
|||
|
Other services
|
0.2
|
|
0.2
|
|
(3)
|
|||
|
Total
|
6.8
|
|
7.6
|
|
||||
|
(1)
|
Professional services rendered for the audit and review of the consolidated financial statements of The Bank of N.T. Butterfield & Son Limited and statutory audits of the financial statements of The Bank of N.T. Butterfield & Son Limited and its subsidiaries, compliance with local regulations, review of documents filed with the BMA and the SEC (including services provided by independent experts to the audit firms in connection with the audit).
|
|
(2)
|
Services that are normally performed by the independent accountants, ancillary to audit services.
|
|
(3)
|
The non-audit services required during the years disclosed above were subject to the Audit Committee's pre-approval process pursuant to paragraph (c) (7)(i)(C) of Rule 2-01 of Regulation S-X.
|
Pre-approval Procedures
To ensure PwC's independence, all services provided by PwC have to be pre-approved by the Audit Committee. A pre-approval may be granted either for a specific mandate or in the form of a blanket pre-approval authorizing a limited and well-defined type and amount of services. The Audit Committee reviews and approves a list of blanket pre-approvals annually.
The Audit Committee has delegated pre-approval authority to its Chairman up to a maximum of $500,000 for any engagement, and the Group Chief Financial Officer and Group Head of Finance submit all proposals for services by PwC to the Chairman of the Audit Committee, unless there is a blanket pre-approval in place. The Audit Committee is informed of the approvals granted by its Chairman on a quarterly basis.
115
ISSUER PURCHASES OF EQUITY SECURITIES
The below details purchases made by or on behalf of the issuer or any "affiliated purchaser," as defined in §240.10b-18(a)(3), of shares or other units of any class of the issuer's equity securities that is registered by the issuer pursuant to section 12 of the Exchange Act (15 U.S.C. 78I) during the year ended December 31,
2019
.
From time to time, the Bank, may seek to repurchase and retire equity securities of the Bank, through cash purchase, privately negotiated transactions, or otherwise. Such transactions, if any, depend on prevailing market conditions, our liquidity and capital requirements, contractual restrictions, and other factors. The amounts involved may be material.
As previously reported, on December 6, 2018, the Board approved, with effect from December 10, 2018 to February 29, 2020, a common share repurchase program, authorizing the purchase for treasury of up to
2.5 million
common shares. On December 2, 2019, the Board approved a new $125 million common share repurchase program, authorizing the purchase for treasury of up to
3.5 million
common shares through to February 28, 2021. The new program came into effect on December 20, 2019 following completion of the previous program. In the year ended December 31, 2019, the Bank retired 2,928,788 shares which were previously held as treasury shares as a result of these buy-backs.
The following table summarizes our repurchases of our common shares during the year ended December 31,
2019
.
|
Period
|
Total number of shares purchased
|
Average price paid per share
|
Total number of shares purchased as part of a publicly announced program
|
Maximum number of shares that may yet be purchased under the program
|
|||||
|
January 1 to 31, 2019
|
420,000
|
|
33.72
|
|
420,000
|
|
1,825,788
|
|
|
|
February 1 to 28, 2019
|
365,000
|
|
37.12
|
|
785,000
|
|
1,460,788
|
|
|
|
March 1 to 31, 2019
|
360,000
|
|
37.31
|
|
1,145,000
|
|
1,100,788
|
|
|
|
April 1 to 30, 2019
|
340,000
|
|
36.89
|
|
1,485,000
|
|
760,788
|
|
|
|
October 1 to 31, 2019
|
150,000
|
|
32.58
|
|
1,635,000
|
|
610,788
|
|
|
|
November 1 to 30, 2019
|
383,600
|
|
33.79
|
|
2,018,600
|
|
227,188
|
|
|
|
December 1 to 19, 2019
|
227,188
|
|
35.81
|
|
2,245,788
|
|
—
|
|
|
|
December 20 to 31, 2019
|
48,000
|
|
37.38
|
|
48,000
|
|
3,452,000
|
|
|
116
WHERE YOU CAN FIND MORE INFORMATION
As a foreign private issuer, we are also exempt from the requirements of Regulation FD (Fair Disclosure) which, generally, are meant to ensure that select groups of investors are not privy to specific information about an issuer before other investors. We are, however, still subject to the anti-fraud and anti-manipulation rules of the SEC, such as Rule 10b-5 under the Securities Act. Since many of the disclosure obligations required of us as a foreign private issuer are different than those required by other United States domestic reporting companies, the Bank’s shareholders, potential shareholders and the investing public in general should not expect to receive information about us in the same amount, and at the same time, as information is received from, or provided by, other United States domestic reporting companies. We are liable for violations of the rules and regulations of the SEC which do apply to us as a foreign private issuer, see ‘‘Implications of Being a Foreign Private Issuer’’.
The SEC maintains an internet site at https://www.sec.gov that contains reports and other information regarding issuers that file electronically with the SEC. These SEC filings are also available to the public from commercial document retrieval services.
117
INDEX TO THE FINANCIAL STATEMENTS
|
Audited Consolidated Financial Statements
|
Page
|
|
Management’s Annual Report on Internal Control over Financial Reporting
|
|
|
Report of Independent Registered Public Accounting Firm
|
|
|
Consolidated Balance Sheets as at December 31, 2019 and December 31, 2018
|
|
|
Consolidated Statements of Operations for the Years Ended December 31, 2019, 2018 and 2017
|
|
|
Consolidated Statements of Comprehensive Income for the Years Ended December 31, 2019, 2018 and 2017
|
|
|
Consolidated Statements of Changes in Shareholders’ Equity for the Years Ended December 31, 2019, 2018 and 2017
|
|
|
Consolidated Statements of Cash Flows for the Years Ended December 31, 2019, 2018 and 2017
|
|
|
Notes to the Consolidated Financial Statements for the years ended December 31, 2019, 2018 and 2017
|
|
F- 1
Management’s Annual Report on Internal Control over Financial Reporting
Management of The Bank of N.T. Butterfield & Son Limited (“Butterfield” or the “Bank”) is responsible for establishing and maintaining adequate internal control over financial reporting. Internal control over financial reporting is a process designed by, or under the supervision of, the Bank's principal executive and principal financial officers, or persons performing similar functions, and effected by Butterfield's Board of Directors, management and other personnel, to provide reasonable assurance regarding the reliability of financial reporting and the preparation of financial statements for external purposes in accordance with accounting principles generally accepted in the United States of America.
Butterfield's internal control over financial reporting includes those policies and procedures that (1) pertain to the maintenance of records, that, in reasonable detail, accurately and fairly reflect the transactions and dispositions of the Bank’s assets; (2) provide reasonable assurance that transactions are recorded as necessary to permit preparation of financial statements in accordance with generally accepted accounting principles, and that receipts and expenditures of the Bank are being made only in accordance with authorizations of Butterfield’s management and directors; and (3) provide reasonable assurance regarding prevention or timely detection of unauthorized acquisition, use or disposition of the Bank's assets that could have a material effect on the financial statements.
Because of its inherent limitations, internal control over financial reporting may not prevent or detect misstatements. Also, projections of any evaluation of effectiveness to future periods are subject to the risk that controls may become inadequate because of changes in conditions, or that the degree of compliance with the policies or procedures may deteriorate. Management has completed an assessment of the effectiveness of Butterfield's internal control over financial reporting as at December 31, 2019. In making the assessment, management used the “Internal Control - Integrated Framework (2013)” promulgated by the Committee of Sponsoring Organizations of the Treadway Commission.
On July 15, 2019, the Bank completed the acquisition of ABN AMRO (Channel Islands) Limited (“ABN AMRO Channel Islands”). ABN AMRO Channel Islands' total assets and total net revenues represented approximately 7.4% and 0.7%, respectively of the Bank's total assets and total net revenues as at and for the year ended December 31, 2019. As permitted under SEC guidance, the Bank has excluded ABN AMRO Channel Islands from the Bank's assessment scope for the effectiveness of internal control over financial reporting as at December 31, 2019 because it was acquired by the Bank in a business combination during 2019.
Based upon the assessment performed, management concluded that as at December 31, 2019, Butterfield's internal control over financial reporting was effective. There have been no changes in Butterfield’s internal control over financial reporting that occurred during the period covered by this report which have materially affected or are reasonably likely to materially affect Butterfield’s internal control over financial reporting.
The Bank's internal control over financial reporting as at December 31, 2019, has been audited by PricewaterhouseCoopers Ltd, an independent registered public accounting firm, as stated in their report on page F-3 of this annual report.
|
/s/ Michael Collins
|
|
Michael Collins
|
|
Chairman and Chief Executive Officer
|
|
/s/ Michael Schrum
|
|
Michael Schrum
|
|
Group Chief Financial Officer
|
F- 2
Report of Independent Registered Public Accounting Firm
To the Board of Directors and Shareholders of
The Bank of N.T. Butterfield & Son Limited
Opinions on the Financial Statements and Internal Control over Financial Reporting
We have audited the accompanying consolidated balance sheets of The Bank of N.T. Butterfield & Son Limited and its
subsidiaries (the “Company”) as of December 31, 2019 and 2018, and the related consolidated statements of operations, comprehensive income, changes in shareholders’ equity and cash flows for each of the three years in the period ended December 31, 2019, including the related notes (collectively referred to as the “consolidated financial statements”). We also have audited the Company's internal control over financial reporting as of December 31, 2019, based on criteria established in
Internal Control - Integrated Framework
(2013) issued by the Committee of Sponsoring Organizations of the Treadway Commission (COSO).
In our opinion, the consolidated financial statements referred to above present fairly, in all material respects, the financial position of the Company as of December 31, 2019 and 2018, and the results of its operations and its cash flows for each of the three years in the period ended December 31, 2019 in conformity with accounting principles generally accepted in the United States of America. Also in our opinion, the Company maintained, in all material respects, effective internal control over financial reporting as of December 31, 2019, based on criteria established in
Internal Control - Integrated Framework
(2013) issued by the COSO.
Basis for Opinions
The Company's management is responsible for these consolidated financial statements, for maintaining effective internal control over financial reporting, and for its assessment of the effectiveness of internal control over financial reporting, included in the accompanying Management's Annual Report on Internal Control over Financial Reporting. Our responsibility is to express opinions on the Company’s consolidated financial statements and on the Company's internal control over financial reporting based on our audits. We are a public accounting firm registered with the Public Company Accounting Oversight Board (United States) (PCAOB) and are required to be independent with respect to the Company in accordance with the U.S. federal securities laws and the applicable rules and regulations of the Securities and Exchange Commission and the PCAOB.
We conducted our audits in accordance with the standards of the PCAOB. Those standards require that we plan and perform the audits to obtain reasonable assurance about whether the consolidated financial statements are free of material misstatement, whether due to error or fraud, and whether effective internal control over financial reporting was maintained in all material respects.
Our audits of the consolidated financial statements included performing procedures to assess the risks of material misstatement of the consolidated financial statements, whether due to error or fraud, and performing procedures that respond to those risks. Such procedures included examining, on a test basis, evidence regarding the amounts and disclosures in the consolidated financial statements. Our audits also included evaluating the accounting principles used and significant estimates made by management, as well as evaluating the overall presentation of the consolidated financial statements. Our audit of internal control over financial reporting included obtaining an understanding of internal control over financial reporting, assessing the risk that a material weakness exists, and testing and evaluating the design and operating effectiveness of internal control based on the assessed risk. Our audits also included performing such other procedures as we considered necessary in the circumstances. We believe that our audits provide a reasonable basis for our opinions.
As described in Management’s Annual Report on Internal Control over Financial Reporting, management has excluded ABN AMRO (Channel Islands) Limited (“ABN”) from its assessment of internal control over financial reporting as of December 31, 2019 because it was acquired by the Company in a purchase business combination during 2019. We have also excluded ABN from our audit of internal control over financial reporting. ABN’s total assets and total net revenues excluded from management’s assessment and our audit of internal control over financial reporting represent approximately 7.4% and 0.7%, respectively, of the related consolidated financial statement amounts as of and for the year ended December 31, 2019.
F- 3
Definition and Limitations of Internal Control over Financial Reporting
A company’s internal control over financial reporting is a process designed to provide reasonable assurance regarding the reliability of financial reporting and the preparation of financial statements for external purposes in accordance with generally accepted accounting principles. A company’s internal control over financial reporting includes those policies and procedures that (i) pertain to the maintenance of records that, in reasonable detail, accurately and fairly reflect the transactions and dispositions of the assets of the company; (ii) provide reasonable assurance that transactions are recorded as necessary to permit preparation of financial statements in accordance with generally accepted accounting principles, and that receipts and expenditures of the company are being made only in accordance with authorizations of management and directors of the company; and (iii) provide reasonable assurance regarding prevention or timely detection of unauthorized acquisition, use, or disposition of the company’s assets that could have a material effect on the financial statements.
Because of its inherent limitations, internal control over financial reporting may not prevent or detect misstatements. Also, projections of any evaluation of effectiveness to future periods are subject to the risk that controls may become inadequate because of changes in conditions, or that the degree of compliance with the policies or procedures may deteriorate.
Critical Audit Matters
The critical audit matters communicated below are matters arising from the current period audit of the consolidated financial statements that were communicated or required to be communicated to the audit committee and that (i) relate to accounts or disclosures that are material to the consolidated financial statements and (ii) involved especially challenging, subjective, or complex judgments. The communication of critical audit matters does not alter in any way our opinion on the consolidated financial statements, taken as a whole, and we are not, by communicating the critical audit matters below, providing separate opinions on the critical audit matters or on the accounts or disclosures to which they relate.
A
cquisition of ABN
As described in Notes 2 and 27 to the consolidated financial statements, the Company completed the acquisition of ABN for net
consideration of $201.1 million in 2019, which resulted in $654.5 million and $24.4 million of loans and intangible assets being recorded, respectively. Management applied judgment in estimating the fair value of loans and intangible assets acquired, which involved the use of estimates and assumptions, including the timing and amounts of cash flow projections and discount rates.
The principal considerations for our determination that the acquisition of ABN is a critical audit matter are (i) significant audit effort and judgment were required in evaluating management’s assumptions, including the timing and amounts of cash flow projections and the discount rates; and (ii) the audit effort involved the use of professionals with specialized skill and knowledge to assist in performing the procedures and evaluating the audit evidence.
Addressing the matter involved performing procedures and evaluating audit evidence in connection with forming our overall opinion on the consolidated financial statements. These procedures included testing the effectiveness of controls relating to the acquisition accounting, which included controls over the development of the judgments and assumptions related to the valuation of the loans and intangible assets, including cash flow projections, and discount rates. These procedures also included, among others testing the appropriateness of the valuation models used, the reasonableness of the aforementioned assumptions, the completeness and accuracy of the data provided by management and cash flow projections used to estimate the fair value of the loans and intangible assets, using professionals with specialized skill and knowledge to assist in doing so.
Allowance for Credit Losses
As described in Notes 2 and 6 t
o the consolidated financial statements, management assesses the adequacy of the allowance for credit losses based on evaluations of the loan portfolio utilizing quantitative and qualitative criteria. At December 31, 2019, the allowance for credit losses was $23.6 million on total loans retained of $5.2 billion. As disclosed by management, the allowance is management’s estimate of credit losses incurred in its lending and off-balance sheet credit-related arrangements and comprises the specific and general allowance components. The specific allowance model focuses on the identification of potentially impaired loans on an exposure-by-exposure basis through the Company’s internal risk rating framework. The specific allowance for an individual loan is computed as the difference between the recorded investment in the loan and the present value of expected cash flows and is dependent upon the assumptions on the timing and amounts of the receipt of future cash flows or the fair value of collateral-dependent loans. Management subjectively assesses the adequacy of the general allowance for credit losses and the need for adjustments to the quantitative model estimate, with consideration given to qualitative assumptions such as changes in geographic and external economic factors, changes in the concentrations of the loan
F- 4
portfolio, changes in the trends in volume of past due loans and the effect of environmental factors such as industry conditions not included in the quantitative model estimate.
The principal considerations for our determination that the allowance for credit losses is a critical audit matter are: (i) significant audit effort was required in evaluating management’s assumptions and estimation process; and (ii) there was a high degree of auditor judgment in performing procedures to evaluate the audit evidence available to support the assumptions used by management in developing the estimate, including geographic and external economic factors, changes in the concentrations of the loan portfolio, changes in the trends in volume of past due loans and the effect of environmental factors such as industry conditions not included in the quantitative model estimate.
Addressing the matter involved performing procedures and evaluating audit evidence in connection with forming our overall opinion on the consolidated financial statements. These procedures included testing the effectiveness of controls relating to the Company’s allowance estimation process, which included controls over the assumptions used within management’s qualitative assessment. These procedures also included assessing the appropriateness of the methodology and models, testing the completeness and accuracy of the data used in the estimates and testing the reasonableness of the aforementioned assumptions.
/s/ PricewaterhouseCoopers Ltd.
Hamilton, Bermuda
February 26, 2020
We have served as the Company’s auditor since 1961.
F- 5
The Bank of N.T. Butterfield & Son Limited
Consolidated Balance Sheets
(In thousands of US dollars, except share and per share data)
|
As at
|
||||
|
December 31, 2019
|
|
December 31, 2018
|
|
|
|
Assets
|
||||
|
Cash and demand deposits with banks - Non-interest bearing
|
|
|
|
|
|
Demand deposits with banks - Interest bearing
|
|
|
|
|
|
Cash equivalents - Interest bearing
|
|
|
|
|
|
Cash due from banks
|
|
|
|
|
|
Securities purchased under agreements to resell
|
|
|
|
|
|
Short-term investments
|
|
|
|
|
|
Investment in securities
|
||||
|
Equity securities at fair value
|
|
|
|
|
|
Available-for-sale
|
|
|
|
|
|
Held-to-maturity (fair value: $2,255,987 (2018: $2,036,214))
|
|
|
|
|
|
Total investment in securities
|
|
|
|
|
|
Loans
|
||||
|
Loans
|
|
|
|
|
|
Allowance for credit losses
|
(
|
)
|
(
|
)
|
|
Loans, net of allowance for credit losses
|
|
|
|
|
|
Premises, equipment and computer software, net of accumulated depreciation
|
|
|
|
|
|
Accrued interest
|
|
|
|
|
|
Goodwill
|
|
|
|
|
|
Other Intangible assets, net
|
|
|
|
|
|
Equity method investments
|
|
|
|
|
|
Other real estate owned, net
|
|
|
|
|
|
Other assets
|
|
|
|
|
|
Total assets
|
|
|
|
|
|
Liabilities
|
||||
|
Customer deposits
|
||||
|
Non-interest bearing
|
|
|
|
|
|
Interest bearing
|
|
|
|
|
|
Total customer deposits
|
|
|
|
|
|
Bank deposits
|
|
|
|
|
|
Total deposits
|
|
|
|
|
|
Employee benefit plans
|
|
|
|
|
|
Accrued interest
|
|
|
|
|
|
Other liabilities
|
|
|
|
|
|
Total other liabilities
|
|
|
|
|
|
Long-term debt
|
|
|
|
|
|
Total liabilities
|
|
|
|
|
|
Commitments, contingencies and guarantees (Note 12)
|
|
|
||
|
Shareholders' equity
|
||||
|
Common share capital (BMD 0.01 par; authorized voting ordinary shares 2,000,000,000 and
non-voting ordinary shares 6,000,000,000) issued and outstanding: 53,005,177 (2018: 55,359,218) |
|
|
|
|
|
Additional paid-in capital
|
|
|
|
|
|
Accumulated deficit
|
(
|
)
|
(
|
)
|
|
Less: treasury common shares, at cost: 619,212 (2018: 1,254,212)
|
(
|
)
|
(
|
)
|
|
Accumulated other comprehensive loss
|
(
|
)
|
(
|
)
|
|
Total shareholders’ equity
|
|
|
|
|
|
Total liabilities and shareholders’ equity
|
|
|
|
|
|
/s/ Michael Collins
|
|
Michael Collins
|
|
Chairman of the Board
|
F- 6
The Bank of N.T. Butterfield & Son Limited
Consolidated Statements of Operations
(In thousands of US dollars, except per share data)
|
Year ended
|
||||||
|
December 31, 2019
|
|
December 31, 2018
|
|
December 31, 2017
|
|
|
|
Non-interest income
|
||||||
|
Asset management
|
|
|
|
|
|
|
|
Banking
|
|
|
|
|
|
|
|
Foreign exchange revenue
|
|
|
|
|
|
|
|
Trust
|
|
|
|
|
|
|
|
Custody and other administration services
|
|
|
|
|
|
|
|
Other non-interest income
|
|
|
|
|
|
|
|
Total non-interest income
|
|
|
|
|
|
|
|
Interest income
|
||||||
|
Interest and fees on loans
|
|
|
|
|
|
|
|
Investments (none of the investment securities are intrinsically tax-exempt)
|
||||||
|
Available-for-sale
|
|
|
|
|
|
|
|
Held-to-maturity
|
|
|
|
|
|
|
|
Deposits with banks
|
|
|
|
|
|
|
|
Total interest income
|
|
|
|
|
|
|
|
Interest expense
|
||||||
|
Deposits
|
|
|
|
|
|
|
|
Long-term debt
|
|
|
|
|
|
|
|
Securities sold under agreement to repurchase
|
|
|
|
|
|
|
|
Total interest expense
|
|
|
|
|
|
|
|
Net interest income before provision for credit losses
|
|
|
|
|
|
|
|
Provision for credit recoveries (losses)
|
|
|
|
|
|
|
|
Net interest income after provision for credit losses
|
|
|
|
|
|
|
|
Net gains (losses) on equity securities
|
|
|
(
|
)
|
|
|
|
Net realized gains (losses) on available-for-sale investments
|
|
|
|
|
|
|
|
Net gains (losses) on other real estate owned
|
(
|
)
|
(
|
)
|
(
|
)
|
|
Net other gains (losses)
|
|
|
(
|
)
|
(
|
)
|
|
Total other gains (losses)
|
|
|
(
|
)
|
|
|
|
Total net revenue
|
|
|
|
|
|
|
|
Non-interest expense
|
||||||
|
Salaries and other employee benefits
|
|
|
|
|
|
|
|
Technology and communications
|
|
|
|
|
|
|
|
Professional and outside services
|
|
|
|
|
|
|
|
Property
|
|
|
|
|
|
|
|
Indirect taxes
|
|
|
|
|
|
|
|
Non-service employee benefits expense
|
|
|
|
|
|
|
|
Marketing
|
|
|
|
|
|
|
|
Amortization of intangible assets
|
|
|
|
|
|
|
|
Restructuring costs
|
|
|
|
|
|
|
|
Other expenses
|
|
|
|
|
|
|
|
Total non-interest expense
|
|
|
|
|
|
|
|
Net income before income taxes
|
|
|
|
|
|
|
|
Income tax benefit (expense)
|
|
|
(
|
)
|
(
|
)
|
|
Net income
|
|
|
|
|
|
|
|
Earnings per common share
|
||||||
|
Basic earnings per share
|
|
|
|
|
|
|
|
Diluted earnings per share
|
|
|
|
|
|
|
The accompanying notes are an integral part of these consolidated financial statements.
F- 7
The Bank of N.T. Butterfield & Son Limited
Consolidated Statements of Comprehensive Income
(In thousands of US dollars)
|
Year ended
|
||||||
|
December 31, 2019
|
|
December 31, 2018
|
|
December 31, 2017
|
|
|
|
Net income
|
|
|
|
|
|
|
|
Other comprehensive income (loss), net of taxes
|
||||||
|
Net change in unrealized gains and losses on translation of net investment in foreign operations
|
(
|
)
|
(
|
)
|
|
|
|
Accretion of net unrealized (gains) losses on held-to-maturity investments transferred from available-for-sale investments
|
|
|
|
|
|
|
|
Net change in unrealized gains and losses on available-for-sale investments
|
|
|
(
|
)
|
|
|
|
Employee benefit plans adjustments
|
|
|
|
|
|
|
|
Other comprehensive income (loss), net of taxes
|
|
|
(
|
)
|
|
|
|
Total comprehensive income
|
|
|
|
|
|
|
The accompanying notes are an integral part of these consolidated financial statements.
F- 8
The Bank of N.T. Butterfield & Son Limited
Consolidated Statements of Changes in Shareholders' Equity
|
Year ended
|
||||||||||||
|
December 31, 2019
|
December 31, 2018
|
December 31, 2017
|
||||||||||
|
Number of shares
|
|
In thousands of
US dollars
|
|
Number of shares
|
|
In thousands of
US dollars
|
|
Number of shares
|
|
In thousands of
US dollars |
|
|
|
Common share capital issued and outstanding
|
||||||||||||
|
Balance at beginning of year
|
|
|
|
|
|
|
|
|
|
|
|
|
|
Retirement of shares
|
(
|
)
|
(
|
)
|
—
|
|
—
|
|
—
|
|
—
|
|
|
Issuance of common shares
|
|
|
|
|
|
|
|
|
|
|
|
|
|
Balance at end of year
|
|
|
|
|
|
|
|
|
|
|
|
|
|
Additional paid-in capital
|
||||||||||||
|
Balance at beginning of year
|
|
|
|
|
|
|
||||||
|
Share-based compensation
|
|
|
|
|
|
|
||||||
|
Share-based settlements
|
|
|
|
|
|
|
||||||
|
Retirement of common shares
|
(
|
)
|
—
|
|
—
|
|
||||||
|
Cost of issuance of common shares
|
—
|
|
—
|
|
|
|
||||||
|
Issuance of common shares, net of underwriting discounts and commissions
|
|
|
|
|
|
|
||||||
|
Sale of treasury common shares
|
—
|
|
—
|
|
(
|
)
|
||||||
|
Balance at end of year
|
|
|
|
|
|
|
||||||
|
Accumulated deficit
|
||||||||||||
|
Balance at beginning of year
|
(
|
)
|
(
|
)
|
(
|
)
|
||||||
|
Net income for year
|
|
|
|
|
|
|
||||||
|
Common share cash dividends declared and paid, $1.76 per share (2018: $1.52 per share; 2017: $1.28 per share)
|
(
|
)
|
(
|
)
|
(
|
)
|
||||||
|
Balance at end of year
|
(
|
)
|
(
|
)
|
(
|
)
|
||||||
|
Treasury common shares
|
||||||||||||
|
Balance at beginning of year
|
|
|
(
|
)
|
—
|
|
—
|
|
|
|
(
|
)
|
|
Purchase of treasury common shares
|
|
|
(
|
)
|
|
|
(
|
)
|
—
|
|
—
|
|
|
Sale of treasury common shares
|
—
|
|
—
|
|
—
|
|
—
|
|
(
|
)
|
|
|
|
Share-based settlements
|
—
|
|
—
|
|
—
|
|
—
|
|
(
|
)
|
|
|
|
Retirement of shares
|
(
|
)
|
|
|
—
|
|
—
|
|
—
|
|
—
|
|
|
Balance at end of year
|
|
|
(
|
)
|
|
|
(
|
)
|
|
|
|
|
|
Accumulated other comprehensive income (loss)
|
||||||||||||
|
Balance at beginning of year
|
(
|
)
|
(
|
)
|
(
|
)
|
||||||
|
Other comprehensive income (loss), net of taxes
|
|
|
(
|
)
|
|
|
||||||
|
Balance at end of year
|
(
|
)
|
(
|
)
|
(
|
)
|
||||||
|
Total shareholders' equity
|
|
|
|
|
|
|
||||||
The accompanying notes are an integral part of these consolidated financial statements.
F- 9
The Bank of N.T. Butterfield & Son Limited
(In thousands of US dollars)
|
Year ended
|
||||||
|
December 31, 2019
|
|
December 31, 2018
|
|
December 31, 2017
|
|
|
|
Cash flows from operating activities
|
||||||
|
Net income
|
|
|
|
|
|
|
|
Adjustments to reconcile net income to operating cash flows
|
||||||
|
Depreciation and amortization
|
|
|
|
|
|
|
|
Provision for credit (recovery) losses
|
(
|
)
|
(
|
)
|
(
|
)
|
|
Share-based payments and settlements
|
|
|
|
|
|
|
|
Net realized (gains) losses on available-for-sale investments
|
(
|
)
|
(
|
)
|
(
|
)
|
|
Net (gains) losses on other real estate owned
|
|
|
|
|
|
|
|
(Increase) decrease in carrying value of equity method investments
|
(
|
)
|
(
|
)
|
(
|
)
|
|
Dividends received from equity method investments
|
|
|
|
|
|
|
|
Changes in operating assets and liabilities
|
||||||
|
(Increase) decrease in accrued interest receivable
|
(
|
)
|
|
|
(
|
)
|
|
(Increase) decrease in other assets
|
(
|
)
|
(
|
)
|
|
|
|
Increase (decrease) in accrued interest payable
|
|
|
|
|
|
|
|
Increase (decrease) in employee benefit plans and other liabilities
|
|
|
|
|
|
|
|
Cash provided by (used in) operating activities
|
|
|
|
|
|
|
|
Cash flows from investing activities
|
||||||
|
(Increase) decrease in securities purchased under agreements to resell
|
(
|
)
|
|
|
(
|
)
|
|
Short-term investments other than restricted cash: proceeds from maturities and sales
|
|
|
|
|
|
|
|
Short-term investments other than restricted cash: purchases
|
(
|
)
|
(
|
)
|
(
|
)
|
|
Net change in equity securities at fair value
|
(
|
)
|
|
|
(
|
)
|
|
Available-for-sale investments: proceeds from sale
|
|
|
|
|
|
|
|
Available-for-sale investments: proceeds from maturities and pay downs
|
|
|
|
|
|
|
|
Available-for-sale investments: purchases
|
(
|
)
|
(
|
)
|
(
|
)
|
|
Held-to-maturity investments: proceeds from maturities and pay downs
|
|
|
|
|
|
|
|
Held-to-maturity investments: purchases
|
(
|
)
|
(
|
)
|
(
|
)
|
|
Net (increase) decrease in loans
|
(
|
)
|
(
|
)
|
(
|
)
|
|
Additions to premises, equipment and computer software
|
(
|
)
|
(
|
)
|
(
|
)
|
|
Proceeds from sale of other real estate owned
|
|
|
|
|
|
|
|
Purchase of intangible assets
|
|
|
(
|
)
|
|
|
|
Gross cash received (disbursed for) from business acquisition
|
|
|
(
|
)
|
|
|
|
Cash provided by (used in) investing activities
|
|
|
|
|
(
|
)
|
|
The accompanying notes are an integral part of these consolidated financial statements.
|
||||||
F- 10
The Bank of N.T. Butterfield & Son Limited
Consolidated Statements of Cash Flows
(In thousands of US dollars)
|
Year ended
|
||||||
|
December 31, 2019
|
|
December 31, 2018
|
|
December 31, 2017
|
|
|
|
Cash flows from financing activities
|
||||||
|
Net increase (decrease) in deposits
|
(
|
)
|
(
|
)
|
(
|
)
|
|
Proceeds from issuance of common shares, net of underwriting discounts and commissions
|
|
|
|
|
|
|
|
Issuance of subordinated capital, net of underwriting fees
|
|
|
|
|
|
|
|
Repayment of long-term debt
|
|
|
(
|
)
|
|
|
|
Common shares repurchased
|
(
|
)
|
(
|
)
|
|
|
|
Proceeds from stock option exercises
|
|
|
|
|
|
|
|
Cash dividends paid on common shares
|
(
|
)
|
(
|
)
|
(
|
)
|
|
Cash provided by (used in) financing activities
|
(
|
)
|
(
|
)
|
(
|
)
|
|
Net effect of exchange rates on cash, cash equivalents and restricted cash
|
|
|
|
|
|
|
|
Net increase (decrease) in cash, cash equivalents and restricted cash
|
|
|
|
|
(
|
)
|
|
Cash, cash equivalents and restricted cash: beginning of year
|
|
|
|
|
|
|
|
Cash, cash equivalents and restricted cash: end of year
|
|
|
|
|
|
|
|
Components of cash, cash equivalents and restricted cash at end of year
|
|
|
|
|
|
|
|
Cash due from banks
|
|
|
|
|
|
|
|
Restricted cash included in short-term investments on the consolidated balance sheets
|
|
|
|
|
|
|
|
Total cash, cash equivalents and restricted cash at end of year
|
|
|
|
|
|
|
|
Supplemental disclosure of cash flow information
|
||||||
|
Cash interest paid
|
|
|
|
|
|
|
|
Cash income taxes paid
|
|
|
|
|
|
|
|
Supplemental disclosure of non-cash items
|
||||||
|
Transfer to (out of) other real estate owned
|
(
|
)
|
|
|
|
|
|
Initial recognition of right-of-use assets and operating lease liabilities
|
|
|
|
|
|
|
|
Extinguishment of loan in exchange for available-for-sale investments
|
|
|
|
|
|
|
The accompanying notes are an integral part of these consolidated financial statements.
F- 11
The Bank of N.T. Butterfield & Son Limited
Notes to the Consolidated Financial Statements
(In thousands of US dollars, unless otherwise stated)
The Bank of N.T. Butterfield & Son Limited (“Butterfield”, the “Bank” or the “Company”) is incorporated under the laws of Bermuda and has a banking license under the Banks and Deposit Companies Act, 1999 (“the Act”). Butterfield is regulated by the Bermuda Monetary Authority (“BMA”), which operates in accordance with Basel principles.
Butterfield is a full service bank and wealth manager headquartered in Hamilton, Bermuda. The Bank operates its business through
three
geographic segments: Bermuda, the Cayman Islands, and the Channel Islands and the United Kingdom ("UK"), where its principal banking operations are located and where it offers specialized financial services. Butterfield offers banking services, comprised of retail and corporate banking, and wealth management, which consists of trust, private banking, and asset management. In the Bermuda and Cayman Islands segments, Butterfield offers both banking and wealth management. In the Channel Islands and the UK segment, the Bank offers wealth management and residential property lending. Butterfield also has operations in the jurisdictions of The Bahamas, Canada, Mauritius, Singapore and Switzerland, which are included in our Other segment.
Note 2: Significant accounting policies
The Bank's reporting currency is United States ("US") dollars. Assets, liabilities, revenues and expenses denominated in Bermuda dollars are translated to US dollars at par.
A. Basis of Presentation and Use of Estimates and Assumptions
Critical accounting estimates are those that require management to make subjective or complex judgments about the effect of matters that are inherently uncertain and may change in subsequent periods. Changes that may be required in the underlying assumptions or estimates in these areas could have a material impact on the future financial condition and results of operations. Management believes that the most critical accounting policies upon which the financial condition depends, and which involve the most complex or subjective decisions or assessments, are as follows:
|
•
|
Allowance for credit losses
|
|
•
|
Fair value and impairment of financial instruments
|
|
•
|
Impairment of long-lived assets
|
|
•
|
Impairment of goodwill
|
|
•
|
Employee benefit plans
|
|
•
|
Share-based payments
|
|
•
|
Business combinations
|
B.
Basis of Consolidation
The consolidated financial statements include the accounts of the Company and its wholly-owned subsidiaries (collectively the “Bank”), and those variable interest entities (“VIEs”) where the Company is the primary beneficiary. Intercompany accounts and transactions have been eliminated. VIEs are entities that, by design, either (1) lack sufficient equity to permit the entity to finance its activities without additional subordinated financial support from other parties, or (2) have equity investors that do not have the ability to make significant decisions relating to the entity’s operations through voting rights, or do not have the obligation to absorb the expected losses, or do not have the right to receive the residual returns of the entity.
The Bank is deemed to have a controlling financial interest and is the primary beneficiary of a VIE if it has both the power to direct the activities of the VIE that most significantly impact the VIE economic performance and an obligation to absorb losses or the right to receive benefits that could potentially be significant to the VIE. The determination of whether the Bank meets the criteria to be considered the primary beneficiary of a VIE requires a periodic evaluation of all transactions (such as investments, loans and fee arrangements) with the entity. The Bank performs on-going reassessments of: (1) whether entities previously evaluated under the majority voting-interest framework have become VIEs, based on certain events, and are therefore subject to the VIE consolidation framework; and (2) whether changes in the facts and circumstances regarding the Bank’s involvement with a VIE cause the Bank’s consolidation conclusion to change.
Certain Bank sponsored asset management funds are structured as limited partnerships or limited companies (collectively the “funds”). The funds have various investment strategies (including but not limited to fixed income, equities and fund of funds) and are financed by non-affiliated investors. A subsidiary of the Bank is either the general partner or investment manager to the funds but does not have any significant variable interests in these entities. For those funds where the non-affiliated investors have the ability to remove the subsidiary of the Bank as the general partner or investment manager without cause (i.e. kick out rights), based on a simple majority vote, or the non-affiliated investors have rights to participate in important decisions, the Bank does not consolidate such voting interest entities. In cases where the non-affiliated investors do not have substantive kick out or participating rights, the Bank evaluates the funds as VIEs and consolidates if it is the general partner or investment manager and has a potentially significant interest.
During the three years ended December 31,
2019
,
2018
and
2017
, the Bank had no interests in VIEs where the Bank was considered the primary beneficiary, nor did the Bank have any significant variable interests in a VIE where the Bank was not considered the primary beneficiary. For the variable interests the Bank holds in entities which are not considered VIEs, the Bank utilized the majority voting interest framework. The Bank consolidates these entities where it holds, directly or indirectly, more than 50% of the voting rights or where it exercises control.
Entities where the Bank holds 20% to 50% of the voting rights and/or has the ability to exercise significant influence, other than investments in designated VIEs, are accounted for under the equity method, and the pro rata share of their income (loss) is included in other non-interest income.
F- 12
The Bank of N.T. Butterfield & Son Limited
Notes to the Consolidated Financial Statements (continued)
(In thousands of US dollars, unless otherwise stated)
C.
Foreign Currency Translation
Assets, liabilities, revenues and expenses denominated in Bermuda dollars are translated to US dollars at par. Assets and liabilities of the parent company arising from other foreign currency transactions are translated into US dollars at the rates of exchange prevailing at the balance sheet date. The resulting gains or losses are included in foreign exchange revenue in the consolidated statements of operations.
The assets and liabilities of foreign currency-based subsidiaries are translated at the rate of exchange prevailing on the balance sheet date, while associated revenues and expenses are translated to US dollars at the average rates of exchange prevailing throughout the year. Unrealized translation gains or losses on investments in foreign currency- based subsidiaries are recorded as a separate component of Shareholders' equity within accumulated other comprehensive loss (“AOCL”). Gains and losses on foreign currency-based subsidiaries are recorded in the consolidated statements of operations when the Bank ceases to have a controlling financial interest in a foreign currency-based subsidiary.
D.
Assets Held in Trust or Custody
Securities and properties (other than cash and deposits held with the Bank and its subsidiaries) held in trust, custody, agency or fiduciary capacity for customers are not included in the consolidated balance sheets because the Bank is not the beneficiary of these assets.
E.
Cash Due from Banks
Cash due from banks includes cash on hand, cash items in the process of collection, amounts due from correspondent banks and highly liquid investments that are readily convertible to known amounts of cash and which are subject to an insignificant risk of change in fair value. Such investments are those with a maturity of three months or less from the date of acquisition and include unrestricted term deposits, certificates of deposit and treasury bills.
F.
Securities Purchased Under Agreement to Resell
Securities purchased under agreement to resell are treated as collateralized lending transactions. The obligation to resell is recorded at the value of the cash paid on purchase adjusted for the amortization of the difference between the purchase price and the agreed resell price. The amortization of this amount is recorded as interest income.
G.
Short-Term Investments
Short-term investments have maturities of less than one year from the date of acquisition, are only subject to an insignificant risk of change in fair value and comprise (1) restricted term and demand deposits, and (2) unrestricted term deposits, certificate of deposits and treasury bills with a maturity greater than three months from the date of acquisition.
H. Investments
Equity securities with readily determinable fair values are carried at fair value in the consolidated balance sheets, with unrealized gains and losses included in the consolidated statements of operations as net gains (losses) on equity securities.
Contained within other assets are investments in private equity for which the Bank does not have sufficient rights or ownership interests to follow the equity method of accounting. Unquoted equity investments which are held directly by the Bank and which do not have readily determinable fair values are recorded at cost, less impairment, plus or minus observable price changes from transactions of identical or similar securities.
Equity method investments which include investments whereby the Bank has the ability to influence, but not control, the financial or operating policies of such entities, are accounted for using the equity method of accounting.
Debt securities are classified as trading, available-for-sale (“AFS”) or held-to-maturity (“HTM”).
Investments are classified as trading when management has the intent to sell these investments for profit. Debt securities classified as trading investments are carried at fair value in the consolidated balance sheets, with unrealized gains and losses included in the consolidated statements of operations as net gains (losses) on trading investments. Investments are classified primarily as AFS when used to manage the Bank’s exposure to interest rate and liquidity movements, as well as to make strategic longer-term investments. AFS investments are carried at fair value in the consolidated balance sheets with unrealized gains and losses reported as net increase or decrease to AOCL. Investments that the Bank has the positive intent and ability to hold to maturity are classified as HTM and are carried at amortized cost in the consolidated balance sheets. Unrecognized gains and losses on HTM securities are disclosed in the notes to the consolidated financial statements.
The specific identification method is used to determine realized gains and losses on trading and AFS investments, which are included in net trading gains and losses and net realized gains and losses on AFS investments respectively, in the consolidated statements of operations.
Dividend and interest income, including amortization of premiums and discounts, on securities for which cash flows are not considered uncertain are included in interest income in the consolidated statements of operations. For securities with uncertain cash flows, the investments are accounted for under the cost recovery method, whereby all principal and coupon payments received are applied as a reduction of the amortized cost and carrying amount. Accrual of income is suspended in respect of debt securities that are in default, or from which it is unlikely that future interest payments will be received as scheduled.
Recognition of other-than-temporary impairments
For debt securities, management considers a decline in fair value to be other-than-temporary when it does not expect to recover the entire amortized cost basis of the security. Investments in debt securities in unrealized loss positions are analyzed as part of management’s ongoing assessment of other-than-temporary impairment (“OTTI”). When management intends to sell such securities or it is more likely than not that the Bank will be required to sell the securities before recovering the amortized cost, it recognizes an impairment loss equal to the full difference between the amortized cost basis and the fair value of those securities. When management does not intend to sell or it is more likely than not that the Bank will hold such securities until recovering the amortized cost, management determines whether any credit losses exist to identify any OTTI.
Under certain circumstances, management will perform a qualitative determination and consider a variety of factors, including the length of time and extent to which the fair value has been less than cost; adverse conditions specifically related to the industry, geographic area or financial condition of the issuer or underlying collateral of a security; payment structure of the security; changes to the rating of the security by a rating agency; the volatility of the fair value changes; and changes in fair value of the security after the balance sheet date. Alternatively, management estimates cash flows over the remaining lives of the underlying security to assess whether credit losses exist.
F- 13
The Bank of N.T. Butterfield & Son Limited
Notes to the Consolidated Financial Statements (continued)
(In thousands of US dollars, unless otherwise stated)
In situations where there is a credit loss, only the amount of impairment relating to credit losses on AFS and HTM investments is recognized in net income. For AFS investments, the decrease in fair value relating to factors other than credit losses is recognized in AOCL. Cash flow estimates take into account expectations of relevant market and economic data as of the end of the reporting period, including, for example, underlying loan-level data, and structural features of securitization, such as subordination, excess spread, over collateralization or other forms of credit enhancement. The degree of judgment involved in determining the recoverable value of an investment security is dependent upon the availability of observable market prices or observable market parameters. When observable market prices and parameters do not exist, judgment is necessary to estimate recoverable value which gives rise to added uncertainty in the assessment. The assessment takes into consideration factors such as interest rate changes, movements in credit spreads, default rate assumptions, prepayment assumptions, type and quality of collateral, and market sentiment.
Management's fair valuations may include inputs and assumptions that are less observable or require greater estimation, thereby resulting in values which may be greater or lower than the actual value at which the investments may be ultimately sold or the ultimate cash flows that may be recovered. If the assumptions on which management based its fair valuations change, the Bank may experience additional OTTI or realized losses or gains, and the period-to-period changes in value could vary significantly.
I.
Loans
Loans are reported as the principal amount outstanding, net of allowance for credit losses, unearned income, fair value adjustments arising from hedge accounting and net deferred loan fees. Interest income is recognized over the term of the loan using the effective interest method, or on a basis approximating a level rate of return over the term of the loan, except for loans classified as non-accrual. Prepayments are treated as a reduction of principal outstanding which is recognized upon receipt of payment. Prepayment penalties, if applicable under the terms of the specific loan agreement, are recognized also upon receipt of payment.
Acquired loans
Acquired loans are recorded at fair value at the date of acquisition. No allowance for credit losses is recorded on the acquisition date as the fair value of the acquired assets incorporates assumptions regarding credit risk. Acquired loans with evidence of credit quality deterioration for which it is probable that the Bank will not receive all contractually required payments receivable are accounted for as purchased credit-impaired loans. Generally, acquired loans that meet the Bank's definition for non-accrual status are considered to be credit-impaired.
The excess of the cash flows expected to be collected on purchased credit-impaired loans, measured as of the acquisition date, over the estimated fair value is referred to as the accretable yield and is recognized in interest income over the remaining life of the loan using an effective yield methodology. The difference between contractually required payments as of the acquisition date and the cash flows expected to be collected is referred to as the non-accretable difference which is included as a reduction of the carrying amount of the purchased credit-impaired loans.
The Bank evaluates at each balance sheet date the estimated cash flows and corresponding carrying value of purchased credit-impaired loans in the same manner as for the measurement of impaired loans, as is described below. The Bank evaluates at each balance sheet date whether the carrying value of its purchased credit-impaired loans has decreased and if so, recognizes an allowance for credit losses in its consolidated statements of operations. For any increases in cash flows expected to be collected, the Bank adjusts any prior recorded allowance for purchased credit-impaired loans first, and then the amount of accretable yield recognized on a prospective basis over the purchased credit-impaired loan’s remaining life. Purchased credit-impaired loans are not considered non-performing and continue to have an accretable yield as long as there is a reasonable expectation about the timing and amount of cash flows expected to be collected.
Participated or Assigned Loans
The Bank may act as lead lender on large loans from time to time and may for strategic or commercial reasons, assign portions of such loans to other market participants. Such assignments are without full right of recourse to the Bank as the lead lender and participants/assignees accept all risks and obligations of the ultimate borrower associated with their proportional participation and assignment in such loans. The Bank records the unassigned portion of the principal outstanding in such loans on the consolidated balance sheets and records only its proportional share of interest income on the unassigned portion of the loan in the consolidated statement of operations.
Impaired loans
A loan is considered to be impaired when, based on current information and events, the Bank determines that it will not be able to collect all amounts due according to the original loan contract, including scheduled interest payments. Impaired loans include all non-accruing loans and all loans modified in a troubled debt restructuring (‘‘TDR’’) even if full collectability is expected following the restructuring.
When a loan is identified as impaired, the impairment is measured based on the present value of expected future cash flows, discounted at the loan’s effective interest rate, except when the sole (remaining) source of repayment for the loan is the operation or liquidation of the collateral. In these cases the current fair value of the collateral, less selling costs, is used instead of discounted cash flows.
If the Bank determines that the expected realizable value of the impaired loan is less than the recorded investment in the loan (net of previous charge-offs, deferred loan fees or costs and unamortized premium or discount), impairment is recognized through an allowance estimate. If the Bank determines that part of the allowance is uncollectible, that amount is charged off.
Non-accrual
Commercial, commercial real estate and consumer loans (excluding credit card consumer loans) are placed on non-accrual status if:
|
•
|
in the opinion of management, full payment of principal or interest is in doubt; or
|
|
•
|
principal or interest is 90 days past due.
|
Residential mortgages are placed on non-accrual status immediately if:
|
•
|
in the opinion of management, full payment of principal or interest is in doubt; or
|
|
•
|
when principal or interest is 90 days past due, unless the loan is well secured and any ongoing collection efforts are reasonably expected to result in repayment of all amounts due under the contractual terms of the loan.
|
Interest income on non-accrual loans is recognized only to the extent it is received in cash. Cash received on non-accrual loans where there is no doubt regarding full repayment (no impairment recognized in the form of a specific allowance) is first applied as repayment of the past due principal amount of the loan and secondly to past due interest and fees.
Where there is doubt regarding the ultimate full repayment of the non-accrual loan (impairment recognized in the form of a specific allowance), all cash received is applied to reduce the principal amount of the loan. Interest income on these loans is recognized only after the entire balance receivable is recovered and interest is actually received.
F- 14
The Bank of N.T. Butterfield & Son Limited
Notes to the Consolidated Financial Statements (continued)
(In thousands of US dollars, unless otherwise stated)
Loans are returned to accrual status when:
|
•
|
none of the principal or accrued interest is past due (with certain exceptions as noted below) and the Bank expects repayment of the remaining contractual obligation; or
|
|
•
|
when the loan becomes well secured and in the process of collection.
|
Loans modified in a TDR
A modification of a loan constitutes a TDR when a borrower is experiencing financial difficulty and the modification constitutes a concession from originally agreed terms. If a restructuring is considered a TDR, the Bank is required to make certain disclosures in the notes of the consolidated financial statements and individually evaluate the restructured loan for impairment. The Bank employs various types of concessions when modifying a loan which may include extension of repayment periods, interest rate reductions, principal or interest forgiveness, forbearance, and other actions intended to minimize economic loss and to avoid foreclosure or repossession of collateral.
Commercial and industrial loans modified in a TDR may involve temporary interest-only payments, term extensions, and converting revolving credit lines to term loans. Additional collateral, a co-borrower, or a guarantor may be requested. Commercial mortgage and construction loans modified in a TDR may involve extending the maturity date at an interest rate lower than the current market rate for new debt with similar risk, or substituting or adding a new borrower or guarantor. Construction loans modified in a TDR may also involve extending the interest-only payment period.
Residential mortgage modifications generally involve a short-term forbearance period after which the missed payments are added to the end of the loan term, thereby extending the maturity date. Interest continues to accrue on the missed payments and as a result, the effective yield on the mortgage remains unchanged. As the forbearance period usually involves an insignificant payment delay they typically do not meet the reporting criteria for a TDR.
Automobile loans modified in a TDR are primarily composed of loans where the Bank has lowered monthly payments by extending the term.
When a loan undergoes a TDR, the determination of the loan's accrual versus non-accrual status following the modification depends on several factors. As with the risk rating process, the accrual status decision for such a loan is a separate and distinct process from the loan's TDR analysis and determination. Management considers the following in determining the accrual status of restructured loans:
|
•
|
If the loan was appropriately on accrual status prior to the restructuring, the borrower has demonstrated performance under the previous terms, and the Bank's credit evaluation shows the borrower's capacity to continue to perform under the restructured terms (both principal and interest payments), it is likely that the appropriate conclusion is for the loan to remain on accrual at the time of the restructuring. This evaluation must include consideration of the borrower's sustained historical repayment performance for a reasonable period prior to the date on which the loan was restructured. A sustained period of repayment performance generally would be a minimum of six months and would involve payments of cash or cash equivalents; or
|
|
•
|
If the loan was on non-accrual status before the restructuring, but the Bank's credit evaluation shows the borrower's capacity to meet the restructured terms, the loan would likely remain as non-accrual until the borrower has demonstrated a reasonable period of sustained repayment performance. As noted above, this period generally would be at least six months (thereby providing reasonable assurance as to the ultimate collection of principal and interest in full under the modified terms). Sustained performance before the restructuring may be taken into account.
|
Loans that have been modified in a TDR are restored to accrual status only when interest and principal payments are brought current for a continuous period of six months under the modified terms. However, performance prior to the modification, or significant events that coincide with the modification, are included in assessing whether the borrower can meet the new terms and may result in the loan being returned to accrual status at the time of loan modification or after a shorter performance period. If the borrower’s ability to meet the revised payment schedule is uncertain, the loan remains on non-accrual status.
A loan that is modified in a TDR prior to becoming impaired will be left on accrual status if full collectability in accordance with the restructured terms is expected. The Bank may enter into a TDR for loans that are in default, or at risk of defaulting, even if the loan is not impaired.
A loan that had previously been modified in a TDR and is subsequently refinanced under current underwriting standards at a market rate with no concessionary terms is accounted for as a new loan and is no longer reported as a TDR.
Delinquencies
The entire balance of an account is contractually delinquent if the minimum payment of principal or interest is not received by the specified due date. Delinquency is reported on loans that are more than 30 days past due.
Charge-offs
The Bank recognizes charge-offs when it determines that loans are uncollectible, and this generally occurs when all commercially reasonable means of recovering the loan balance have been exhausted.
Commercial and consumer loans are either fully or partially charged-off down to the fair value of collateral securing the loans when:
|
•
|
management judges the loan to be uncollectible;
|
|
•
|
repayment is expected to be protracted beyond reasonable time frames;
|
|
•
|
the asset has been classified as a loss by either the Bank’s internal loan review process or third party appraisers; or
|
|
•
|
the customer has filed bankruptcy and the loss becomes evident owing to a lack of assets or cash flow.
|
The outstanding balance of commercial and consumer real estate secured loans and residential mortgages that are in excess of the estimated property value, less costs to sell, is charged-off once there is reasonable assurance that such excess outstanding balance is not recoverable.
Credit card consumer loans that are contractually
180
days past due and other consumer loans with an outstanding balance under
$
100,000
that are contractually
180
days past due are generally written off and reported as charge-offs.
J.
Allowance for Credit Losses
The Bank maintains an allowance for credit losses, which in management’s opinion is adequate to absorb all estimated credit-related losses that are incurred in its lending and off-balance sheet credit-related arrangements at the balance sheet date. The allowance for credit losses consists of specific allowances and a general allowance as follows:
F- 15
The Bank of N.T. Butterfield & Son Limited
Notes to the Consolidated Financial Statements (continued)
(In thousands of US dollars, unless otherwise stated)
Specific allowances
Specific allowances are determined on an exposure-by-exposure basis identified through the Bank's internal risk rating framework and reflect the associated estimated credit loss. The specific allowance for an individual loan is computed as the difference between the recorded investment in the loan and the present value of expected future cash flows and is dependent upon the assumptions on the timing and amounts of the receipts or the fair value of collateral-dependent loans. The effective rate of return on the loan is used for discounting the cash flows. However, when foreclosure of a collateral-dependent loan is probable, the Bank measures impairment based on the fair value of the collateral. The Bank considers estimated costs to sell, on a discounted basis, in the measurement of impairment if those costs are expected to reduce the cash flows available to repay or otherwise satisfy the loan. If the measurement of an impaired loan is less than the recorded investment in the loan, then the Bank recognizes impairment by creating an allowance with a corresponding charge to provision for credit losses.
For all commercial and commercial real estate TDRs, the Bank conducts further analysis to determine the probable amount of loss and establishes a specific allowance for the loan, if appropriate. The Bank estimates the impairment amount by comparing the loan’s carrying amount to the estimated present value of its future cash flows or the fair value of its underlying collateral. For collateral-dependent impaired commercial and commercial real estate loans, the excess of the Company’s recorded investment in the loan over the fair value of the collateral, less cost to sell, is charged off to the specific allowance.
For consumer and residential mortgage TDRs that are not collateral-dependent, allowances are developed using the present value of expected future cash flows, compared to the recorded investment in the loans. Expected re-default factors are considered in this analysis. The fair value of collateral is periodically monitored subsequent to the modification.
General allowances
The allowance for credit losses attributed to the remaining portfolio of smaller balance homogeneous loans is established through various analyzes that estimate the incurred loss at the balance sheet date inherent in the lending and off-balance sheet credit-related arrangements portfolios. These analyzes may consider historical default and loss rates, geographic, industry, economic, and other environmental factors. Management may also consider overall portfolio indicators including trends in internally risk rated exposures, delinquent (defined as loans that are more than 30 days past due), non-performing, trends in volumes and terms of loans, cash-basis loans, historical and forecasted write-offs, and a review of industry, geographic and portfolio concentrations, including current developments within those segments. In addition, management may consider the current business strategy and credit process, including lending policies and procedures such as limit setting and compliance, credit approvals, loan underwriting criteria and loan workout procedures.
Goodwill is tested annually for impairment at the reporting unit level, or more frequently if events or circumstances indicate there may be impairment. If the carrying amount of a reporting unit, including the allocated goodwill, exceeds its fair value, goodwill impairment is measured as the excess of the carrying amount of the reporting unit's allocated goodwill over the implied fair value of the goodwill. Other acquired intangible assets with finite lives are amortized on a straight-line basis over their estimated useful lives, not exceeding
15
years. Intangible assets' estimated lives are re-evaluated annually and an impairment test is carried out if certain indicators of impairment exist.
L.
Premises, Equipment and Computer Software
Land is carried at cost. Buildings, equipment and computer software, including leasehold improvements, are carried at cost less accumulated depreciation. The Bank generally computes depreciation using the straight-line method over the estimated useful life of an asset, which is
50
years for buildings, and
three
to
10
years for other equipment. For leasehold improvements the Bank uses the straight-line method over the lesser of the remaining term of the leased facility or the estimated economic life of the improvement. The Bank capitalizes certain costs, including interest cost incurred during the development phase, associated with the acquisition or development of internal use software. Once the software is ready for its intended use, these costs are amortized on a straight-line basis over the software's expected useful life, which is between
five
and
10
years.
Management reviews the recoverability of the carrying amount of premises, equipment and computer software when indicators of impairment exist and an impairment charge is recorded when the carrying amount of the reviewed asset is deemed not recoverable by future expected cash flows to be derived from the use and disposition of the asset. If there is a disposition out of premises, equipment and computer software, a gain is recorded if the difference of the proceeds on disposition is in excess of the assets carrying value. Otherwise, a loss is recorded. If there is an abandonment out of premises, equipment and computer software, the full carrying value of the asset is recognized as a loss.
M.
Other Real Estate Owned
Other real estate owned (“OREO”) comprises real estate property held for sale and commercial and residential real estate properties acquired in partial or total satisfaction of loans acquired through foreclosure proceedings, acceptance of a deed-in-lieu of foreclosure or by taking possession of assets that were used as loan collateral. These properties are initially recorded at fair value less estimated costs to sell the property. If the recorded investment in the loan exceeds the property’s fair value at the time of acquisition, a charge-off is recorded against the specific allowance. If the carrying value of the real estate exceeds the property’s fair value at the time of reclassification, an impairment charge is recorded in the consolidated statements of operations. Subsequent decreases in the property’s fair value below the new cost basis are recorded through the use of a valuation allowance. Subsequent increases in the fair value of a property may be used to reduce the allowance but not below zero. Any operating expenses of the property are recognized through charges to non-interest expense.
N.
Leases
In the normal course of operation, the Bank enters into leasing agreements either as the lessee or the lessor. Starting on January 1, 2019 (the adoption date of the new lease accounting guidance Accounting Standards Update (“ASU”) 2016-02 Leases (Topic 842)), the Bank recognized (prospectively, with no adjustments to prior periods) right-of-use assets and lease liabilities for operating leases and for finance leases. Lease liabilities are measured as the present value of future lease payments, including term renewals that are reasonably certain to occur, discounted using the Bank’s incremental borrowing interest rate. Right-of-use assets are measured as the carrying amount of the related lease liabilities adjusted for: prepaid or accrued lease payments, unamortized lease incentive received, unamortized initial direct costs and any impairment of the right-of-use asset.
On January 1, 2019 the Bank elected the practical expedient: (1) not to reassess whether any expired or existing contracts are or contain leases; (2) not to reassess the lease classification for any expired or existing leases and (3) not to reassess initial direct costs for any existing leases.
The Bank also elected: (1) the practical expedient not to separate lease components from non-lease components for all classes of underlying assets; and (2) the practical expedient not to recognize a right-of-use asset and a lease liability for leases with a term at inception of 12 months or less, including renewal options that are reasonably certain to be exercised (referred to as “short term leases”).
F- 16
The Bank of N.T. Butterfield & Son Limited
Notes to the Consolidated Financial Statements (continued)
(In thousands of US dollars, unless otherwise stated)
O.
Derivatives
All derivatives are recognized on the consolidated balance sheets at their fair value. On the date that the Bank enters into a derivative contract, it designates the derivative as either: a hedge of the fair value of a recognized asset or liability (a fair value hedge); a hedge of a forecasted transaction or the variability of cash flows that are to be received or paid in connection with a recognized asset or liability (a cash flow hedge); a hedge of an exposure to foreign currency risk of a net investment in a foreign operation (a net investment hedge); or, an instrument that is held for trading or non-hedging purposes (a trading or non-hedging derivative instrument).
All instruments utilized as a hedging instrument in a fair value hedge or cash flow hedge must have one or more underlying notional amounts, no or a minimal net initial investment and a provision for net settlement in the contract to meet the definition of a derivative instrument. Instruments utilized as a hedging instrument in a hedge of a net investment in foreign operations may be derivative instruments or non-derivatives.
The changes in the fair value of a derivative that is designated and qualifies as a fair value hedge, along with changes in the fair value of the hedged asset or liability that are attributable to the hedged risk, are recorded in current year earnings.
The changes in the fair value of a derivative that is designated and qualifies as a cash flow hedge, to the extent that the hedge is effective, are recorded in other comprehensive loss ("OCL") and the ineffective portion is recorded in current year earnings. That is, ineffectiveness from a derivative that overcompensates for changes in the hedged cash flows is recorded in earnings. However, the ineffectiveness from a derivative that under compensates is not recorded in earnings.
The changes in the fair value of a derivative that is designated and qualifies as a foreign currency hedge is recorded in either current year earnings or OCL, depending on whether the hedging relationship satisfies the criteria for a fair value or cash flow hedge. If, however, a derivative is used as a hedge of a net investment in a foreign operation, the changes in the derivative’s fair value, to the extent that the derivative is effective as a hedge, are recorded in the cumulative translation adjustment (“CTA”) account within OCL.
Changes in the fair value of trading and non-hedging derivative instruments are reported in current year earnings.
The Bank formally documents all relationships between hedging instruments and hedged items, as well as its risk management objectives and strategies for undertaking various hedge transactions. This process includes linking all derivatives that are designated as fair value, cash flow, or foreign currency hedges to specific assets and liabilities on the consolidated balance sheets or specific firm commitments or forecasted transactions.
The Bank also formally assesses whether the derivatives that are used in hedging transactions have been highly effective in offsetting changes in the fair value or cash flows of hedged items and whether those derivatives may be expected to remain highly effective in future periods.
For those hedge relationships that are terminated, hedge designations that are elected to be removed, forecasted transactions that are no longer expected to occur, or the hedge relationship ceases to be highly effective, the hedge accounting treatment described in the paragraphs above is no longer applied and the end-user derivative is terminated or transferred to the trading designation. For fair value hedges, any changes to the carrying value of the hedged item prior to the discontinuance remain as part of the basis of the asset or liability. When a cash flow hedge is discontinued, the net derivative gain (loss) remains in AOCL unless it is probable that the forecasted transaction will not occur in the originally specified time period.
P.
Collateral
The Bank pledges assets as collateral as required for various transactions involving security repurchase agreements, deposit products and derivative financial instruments. Assets that have been pledged as collateral, including those that can be sold or repledged by the secured party, continue to be reported on the Bank’s consolidated balance sheets under the same line items as non-pledged assets of the same type.
Q.
Employee Benefit Plans
The Bank maintains trusteed pension plans for substantially all employees as either non-contributory defined benefit plans or defined contribution plans. Benefits under the defined benefit plans are based primarily on the employee's years of credited service and average annual salary during the final years of employment as defined in the plans. The Bank also provides post-retirement medical benefits for certain qualifying active and retired Bermuda-based employees.
Expense for the defined benefit pension plans and the post-retirement medical benefits plan is composed of (a) the actuarially determined benefits for the current year's service, (b) imputed interest on the actuarially determined liability of the plan, (c) in the case of the defined benefit pension plans, the expected investment return on the fair value of plan assets and (d) amortization of certain items over the expected average remaining service life of employees in the case of the active defined benefit pension plans, estimated average remaining life expectancy of the inactive participants in the case of the inactive defined benefit pension plans and the expected average remaining service life to full eligibility age of employees covered by the plan in the case of the post-retirement medical benefits plan. The items amortized are amounts arising as a result of experience gains and losses, changes in assumptions, plan amendments and the change in the net pension asset or post-retirement medical benefits liability arising on adoption of revised accounting standards.
For each of the defined benefit pension plans and for the post-retirement medical benefits plan, the assets and liabilities recognized for accounting purposes are reported in other assets and employee benefit plans respectively. The actuarial gains and losses, transition obligation and prior service costs of the defined pension plans and post-retirement medical benefits plan are recognized in OCL net of tax and amortized to net income over the average service period for the active defined benefit pension plans and post-retirement medical benefits plan and average remaining life expectancy for the inactive defined benefit pension plans.
For the defined contribution pension plans, the Bank and participating employees provide an annual contribution based on each participating employee's pensionable earnings. Amounts paid are expensed in the period.
R.
Share-Based Compensation
The Bank engages in equity settled share-based payment transactions in respect of services received from eligible employees. The fair value of the services received is measured by reference to the fair value of the shares or share options granted on the date of the grant. The cost of the employee services received in respect of the shares or share options granted is recognized in the consolidated statements of operations over the shorter of the vesting or service period.
F- 17
The Bank of N.T. Butterfield & Son Limited
Notes to the Consolidated Financial Statements (continued)
(In thousands of US dollars, unless otherwise stated)
The fair value of the options granted is determined using option pricing models, which take into account the exercise price of the option, the current share price, the risk-free interest rate, expected dividend rate, the expected volatility of the share price over the life of the option and other relevant factors. The fair value of unvested share awards is deemed to be the closing price of the publicly traded Bank shares on grant date. The fair value of time vesting conditions are taken into account by adjusting the number of shares or share options included in the measurement of the cost of employee services so that ultimately, the amount recognized in the consolidated statements of operations reflects the number of vested shares or share options. The Bank recognizes compensation cost for awards with performance conditions if and when the Bank concludes that it is probable that the performance condition will be achieved, net of an estimate of pre-vesting forfeitures (e.g., due to termination of employment prior to vesting).
S.
Revenue Recognition
Trust, custody and other administration services fees include fees for private and institutional trust, executorship, and custody services. Asset management fees include fees for investment management, investment advice and brokerage services. Fees are recognized as revenue over the period of the relationship or when the Bank has rendered all services to the clients and is entitled to collect the fee from the client, as long as there are no contingencies associated with the fees.
Banking services fees primarily include fees for letters of credit and other financial guarantees, compensating balances, overdraft facilities and other financial services-related products as well as credit card fees. Letters of credit and other financial guarantees fees are recognized as revenue over the period in which the related guarantee is outstanding. Credit card fees are comprised of merchant discounts, late fees and membership fees, net of interchange and rewards costs. Credit card fees and other fees are recognized in the period in which the service is provided.
Foreign exchange revenue includes fees earned on currency exchange transactions which are recognized when such transactions occur, as well as gains and losses recognized when translating financial instruments held or due in currencies other than the local functional currency at the rates of exchange prevailing at the balance sheet date.
Loan interest income includes the amortization of deferred non-refundable loan origination and commitment fees. These fees are recognized as an adjustment of yield over the life of the related loan. Loan origination and commitment fees are offset by their related direct costs and only the net amounts are deferred and amortized into interest income.
Dividend and interest income, including amortization of premiums and discounts, on securities for which cash flows are not considered uncertain are included in interest income in the consolidated statements of operations. Loans placed on non-accrual status and investments with uncertain cash flows are accounted for under the cost recovery method, whereby all principal, dividends, interest and coupon payments received are applied as a reduction of the amortized cost and carrying amount.
T.
Fair Values
Fair value is defined as the exchange price that would be received for an asset or paid to transfer a liability (an exit price) in the principal or most advantageous market for the asset or liability in an orderly transaction between market participants on the measurement date. The Bank determines the fair values of assets and liabilities based on the fair value hierarchy which requires an entity to maximize the use of observable inputs and minimize the use of unobservable inputs when measuring fair value. The relevant accounting standard describes three levels of inputs that may be used to measure fair value. Investments classified as trading and AFS, and derivative assets and liabilities are recognized in the consolidated balance sheets at fair value.
Level 1, 2 and 3 valuation inputs
Management classifies items that are recognized at fair value on a recurring basis based on the level of inputs used in their respective fair value determination as described below.
Fair value inputs are considered Level 1 when based on unadjusted quoted prices in active markets for identical assets.
Fair value inputs are considered Level 2 when based on inputs other than quoted prices that are observable for the asset or liability either directly or indirectly, including inputs in markets that are not considered to be active.
Fair value inputs are considered Level 3 when based on internally developed models using significant unobservable assumptions involving management's estimations or non-binding bid quotes from brokers.
The following methods and assumptions were used in the determination of the fair value of financial instruments:
Cash due from banks
The carrying amount of cash and demand deposits with banks, being short-term in nature, is deemed to approximate fair value.
Cash equivalents include unrestricted term deposits, certificates of deposits and Treasury bills with a maturity of less than three months from the date of acquisition and the carrying value at cost is considered to approximate fair value because they are short term in nature, bear interest rates that approximate market rates, and generally have negligible credit risk.
Short-term investments
Short-term investments comprise restricted term and demand deposits and unrestricted term deposits, certificates of deposit and treasury bills with less than one year but greater than three months' maturity from the date of acquisition. The carrying value at cost is considered to approximate fair value because they are short term in nature, bear interest rates that approximate market rates, and generally have negligible credit risk.
Equity securities, defined benefit pension plan equity securities, and mutual funds
These include equities and mutual funds. The fair value of listed equity securities is based upon quoted market values. Investments in actively traded mutual funds are based on their published net asset values.
AFS and HTM investments and defined benefit pension plan fixed income securities
The fair values for AFS investments are generally sourced from third parties. The fair value of fixed income securities is based upon quoted market values where available, “evaluated bid” prices provided by third party pricing services (“pricing services”) where quoted market values are not available, or by reference to broker or underwriter bid indications where pricing services do not provide coverage for a particular security. To the extent the Bank believes current trading conditions represent distressed transactions, the Bank may elect to utilize internally generated models. The pricing services typically use market approaches for valuations using primarily Level 2 inputs (in the vast majority of valuations), or some form of discounted cash flow analysis.
F- 18
The Bank of N.T. Butterfield & Son Limited
Notes to the Consolidated Financial Statements (continued)
(In thousands of US dollars, unless otherwise stated)
Pricing services indicate that they will only produce an estimate of fair value if there is objectively verifiable information available to produce a valuation. Standard inputs to the valuations provided by the pricing services listed in approximate order of priority for use when available include: reported trades, benchmark yields, broker/dealer quotes, issuer spreads, two-sided markets, benchmark securities, bids, offers, and reference data. The pricing services may prioritize inputs differently on any given day for any security, and not all inputs listed are available for use in the evaluation process on any given day for each security evaluation. However, the pricing services also monitor market indicators and industry and economic events. When these inputs are not available, pricing services identify “buckets” of similar securities (allocated by asset class types, sectors, sub-sectors, contractual cash flows/structure, and credit rating characteristics) and apply some form of matrix or other modeled pricing to determine an appropriate security value which represents their best estimate as to what a buyer in the marketplace would pay for a security in a current sale.
It is common industry practice to utilize pricing services as a source for determining the fair values of investments where the pricing services are able to obtain sufficient market corroborating information to allow them to produce a valuation at a reporting date. In addition, in the majority of cases, although a value may be obtained from a particular pricing service for a security or class of similar securities, these values are corroborated against values provided by other pricing services. While the Bank receives values for the majority of the investment securities it holds from pricing services, it is ultimately management’s responsibility to determine whether the values received and recorded in the financial statements are representative of appropriate fair value measurements.
Broker/dealer quotations are used to value investments with fixed maturities where prices are unavailable from pricing services due to factors specific to the security such as limited liquidity, lack of current transactions, or trades only taking place in privately negotiated transactions. These are considered Level 3 valuations, as significant inputs utilized by brokers may be difficult to corroborate with observable market data, or sufficient information regarding the specific inputs utilized by the broker was not available to support a Level 2 classification.
For disclosure purposes, HTM investments are fair valued using the same methods described above.
Loans
The majority of loans are variable rate and re-price in response to changes in market rates and hence management estimates that the fair value of loans is not significantly different than their carrying amount. For significant fixed-rate loan exposures, fair value is estimated by discounting the future cash flows, using the current rates at which similar loans would be made to borrowers with similar credit ratings and for the same remaining maturities, of such loans. Management includes the effects of specific provisions raised against individual loans, which factors in a loan's credit quality, as well as accrued interest in determining the fair value of loans.
Accrued interest
The carrying amounts of accrued interest receivable and payable are assumed to approximate their fair values given their short-term nature.
OREO
OREO assets are carried at the lower of cost or fair value less estimated costs to sell. The determination of fair value, which aims at estimating the realizable value of the properties, is based either on third-party appraisals, when available, or on internal valuation models. Appraisals of OREO properties are updated on an annual basis. Where the fair value of the related property is based on an unadjusted appraised value, the OREO is generally classified as Level 2. Where significant adjustments are made to the appraised value, or based on an internally generated valuation model, the OREO is generally classified as Level 3.
Deposits
The fair value of fixed-rate deposits has been estimated by discounting the contractual cash flows, using market interest rates offered at the balance sheet date for deposits of similar terms. The carrying amount of deposits with no stated maturity date is deemed to equate to the fair value.
Long-term debt
The fair value of the long-term debt has been estimated by discounting the contractual cash flows, using current market interest rates.
Derivatives
Derivative contracts can be exchange traded or over-the-counter (“OTC”) derivative contracts and may include forward, swap and option contracts relating to interest rates or foreign currencies. Exchange-traded derivatives typically fall within Level 1 of the fair value hierarchy depending on whether they are deemed to be actively traded or not. OTC derivatives are valued using market transactions and other market evidence whenever possible, including market-based inputs to models, model calibration to market clearing transactions, broker or dealer quotations or alternative pricing sources where an understanding of the inputs utilized in arriving at the valuations is obtained.
Where models are used, the selection of a particular model to value an OTC derivative depends upon the contractual terms and specific risks inherent in the instrument as well as the availability of pricing information in the market. The Bank generally uses similar models to value similar instruments. Valuation models require a variety of inputs, including contractual terms, market prices, yield curves, credit curves, measures of volatility, prepayment rates and correlations of such inputs. For OTC derivatives that trade in liquid markets, such as generic forwards, interest rate swaps and options, model inputs can generally be verified and model selection does not involve significant management judgment.
Goodwill
The fair value of reporting units for which goodwill is recognized is determined when an impairment assessment is performed by discounting estimated future cash flows using discount rates reflecting valuation-date market conditions and risks specific to the reporting unit.
U.
Impairment or Disposal of Long-Lived Assets
Impairment losses are recognized when the carrying amount of a long-lived asset exceeds the sum of the undiscounted cash flows expected from its use and disposal. The impairment recognized is measured as the amount by which the carrying amount of the asset exceeds its fair value. Long-lived assets that are to be disposed of other than by sale are classified and accounted for as held for use until the date of disposal or abandonment. Assets that meet certain criteria are classified as held for sale and are measured at the lower of their carrying amounts or fair value less estimated costs to sell.
V.
Credit-Related Arrangements
In the normal course of business, the Bank enters into various commitments to meet the credit requirements of its customers. Such commitments, which are not included in the consolidated balance sheet, include:
|
•
|
commitments to extend credit, which represent undertakings to make credit available in the form of loans or other financing for specific amounts and maturities, subject to certain conditions;
|
|
•
|
standby letters of credit, which represent irrevocable obligations to make payments to third parties in the event that the customer is unable to meet its financial obligations; and,
|
F- 19
The Bank of N.T. Butterfield & Son Limited
Notes to the Consolidated Financial Statements (continued)
(In thousands of US dollars, unless otherwise stated)
|
•
|
documentary and commercial letters of credit, related primarily to the import of goods by customers, which represent agreements to honor drafts presented by third parties upon completion of specific activities.
|
These credit arrangements are subject to the Bank's normal credit standards and collateral is obtained where appropriate. The contractual amounts for these commitments set out in the table in Note 12 represent the maximum payments the Bank would have to make should the contracts be fully drawn, the counterparty default, and any collateral held prove to be of no value. As many of these arrangements will expire or terminate without being drawn upon or are fully collateralized, the contractual amounts do not necessarily represent future cash requirements. The Bank does not carry any liability for these obligations.
W.
Income Taxes
The Bank uses the asset and liability method of accounting for income taxes. Under this method, deferred income taxes reflect the net tax effect of temporary differences between the consolidated financial statements' carrying amounts of assets and liabilities and their respective tax bases. Accordingly, a deferred income tax asset or liability is determined for each temporary difference based on the enacted tax rates to be in effect on the expected reversal date of the temporary difference. The effect of a change in tax rates on deferred tax assets and liabilities is recognized in income in the period that includes the enactment date.
The Bank records net deferred tax assets to the extent the Bank believes these assets will more likely than not be realized. Net deferred income tax assets or liabilities accumulated as a result of temporary differences are included in other assets or other liabilities, respectively. A valuation allowance is established to reduce deferred income tax assets to the amount more likely than not to be realized. In making such a determination, the Bank considers all available positive and negative evidence, including future reversals of existing taxable temporary differences, projected future taxable income, tax-planning strategies, and results of recent operations. In the event the Bank were to determine that it would be able to realize the deferred income tax assets in the future in excess of their net recorded amount, the Bank would make an adjustment to the deferred tax asset valuation allowance, which would reduce the provision for income taxes.
The Bank records uncertain tax positions on the basis of a two-step process whereby (1) the Bank determines whether it is more likely than not that the tax positions will be sustained based on the technical merits of the position and (2) where those tax positions that meet the more-likely-than-not recognition threshold, the Bank recognizes the largest amount of tax benefit that is greater than 50 percent likely to be realized upon ultimate settlement with the related tax authority.
Income taxes on the consolidated statements of operations include the current and deferred portions of the income taxes. The Bank recognizes accrued interest and penalties related to income taxes in operating expenses. Income taxes applicable to items charged or credited directly to shareholders’ equity are included in such items.
X.
Consolidated Statements of Cash Flows
For the purposes of the consolidated statements of cash flows, cash due from banks include cash on hand, cash items in the process of collection, amounts due from correspondent banks and highly liquid investments that are readily convertible to known amounts of cash and which are subject to an insignificant risk of change in fair value, and restricted cash included in short-term investments on the consolidated balance sheets.
Y.
Earnings Per Share
Earnings per share have been calculated using the weighted average number of common shares outstanding during the year (see also Note
21
). In periods when basic earnings per share is positive, the dilutive effect of share-based compensation plans is calculated using the treasury stock method, whereby the proceeds received from the exercise of share-based awards are assumed to be used to repurchase outstanding common shares, using the quarterly average market price of the Bank’s shares for the period.
Z.
New Accounting Pronouncements
The following accounting developments were issued during the year ended
December 31, 2019
or are accounting standards pending adoption:
In June 2016, the Financial Accounting Standards Board (“FASB”) published ASU 2016-13 Financial Instruments – Credit Losses. The amendments in this update provide a new impairment model, known as the current expected credit loss model (“CECL") that is based on expected losses rather than incurred losses. The amendments in this update are also intended to reduce the complexity and reduce the number of impairment models entities use to account for debt instruments. For public business entities that meet the GAAP definition of a Securities and Exchange Commission (“SEC”) filer, the effective date for this update is for fiscal years beginning after December 15, 2019, including interim periods within those fiscal years. The CECL model is applicable to the measurement of credit losses on financial instruments at amortized cost, including loan receivables and HTM debt securities. It also applies to off-balance sheet credit exposures not accounted for as insurance (loan commitments, standby letters of credit, financial guarantees, and other similar instruments) and net investments in certain leases recognized by a lessor. In addition, the amendments to Topic 326 require credit losses on AFS securities to be presented as a valuation allowance rather than as a direct write-down.
For debt securities, the guidance will be applied prospectively. Existing purchased credit-impaired (“PCI”) assets will be grandfathered and classified as purchased credit deteriorated (“PCD”) assets at the date of adoption. The assets will be grossed up for the allowance for expected credit losses for all PCD assets at the date of adoption and will continue to recognize the noncredit discount in interest income based on the yield of such assets as of the adoption date. For all other assets within the scope of CECL, which are primarily loans for the Bank, a cumulative-effect adjustment will be recognized in retained earnings (accumulated deficit) as of the date of application. Subsequent changes in expected credit losses will be recorded through the respective allowance.
The Bank will apply the provisions of ASU 2016-13 with effect from January 1, 2020. The Bank does not intend to restate comparative information. In addition to the adjustment to opening accumulated deficit and the measurement of expected credit losses, the standard will also result in revisions to accounting policies and procedures, new and additional financial statement note disclosures, changes and amendments to internal control documents, the development of a new risk model and associated methodologies, as discussed above. The new loss model will also require the Bank to collect and maintain attributes as it relates to its financial instruments that are within scope of CECL including fair value of collateral, expected performance over the lifetime of the instrument and reasonable and supportable assumptions about future economic conditions. Changes in the required allowance for credit losses will be recorded in the consolidated statement of operations.
The Bank had previously established a governance process and a working group with multiple members from applicable departments, including credit risk management and finance, to evaluate the requirements of this new standard, to develop a loss model consistent with lifetime expected loss estimates and to design and implement any changes required to current processes. The design and implementation of the new impairment process has been completed with the measurement of expected losses to be primarily based on the product of the respective instrument’s probability of default (“PD”), loss given default (“LGD”), and exposure at default (“EAD”), and historically incurred loss rates, respectively. For AFS securities, any allowance for credit losses is based on an impairment assessment.
The total expected adjustment as at December 31, 2019 resulting from the adoption of this methodology on the opening balance of the Bank’s net equity at January 1, 2020 is an estimated decrease of
$
7.8
million
relating to the Bank's loan portfolio. The Bank will continue to monitor and enhance elements of its impairment process in advance of the financial reporting for the first quarter of 2020.
F- 20
The Bank of N.T. Butterfield & Son Limited
Notes to the Consolidated Financial Statements (continued)
(In thousands of US dollars, unless otherwise stated)
In April 2019 and November 2019, respectively, the FASB published ASU 2019-04 and ASU 2019-11 Codification Improvements to Topic 326, Financial Instruments—Credit Losses affecting a variety of topics including Topic 815, Derivatives and Hedging, Topic 825, Financial Instruments and Sub-topic 805-20, Business Combinations—Identifiable Assets and Liabilities, and Any Noncontrolling Interest. The amendments clarify, correct and improve various aspects of the guidance in the following ASU's related to financial instruments: ASU 2016-01 Financial Instruments—Overall (Subtopic 825-10): Recognition and Measurement of Financial Assets and Liabilities, ASU 2016-13 Financial Instruments—Credit Losses (Topic 326): Measurement of Credit Losses on Financial Instruments, and ASU 2017-12 Derivatives and Hedging (Topic 815): Targeted Improvements to Accounting for Hedging Activities. The amendments relating to ASU 2016-01 are effective for fiscal years beginning after December 15, 2019, including interim periods within those fiscal years, early adoption is permitted and it should be applied on a modified-retrospective transition basis. The amendments relating to ASU 2016-13 are effective as noted in ASU 2016-13. The amendments relating to ASU 2017-12 are effective as noted in ASU 2017-12. Other than the impact of ASU 2016-13 as disclosed above, ASU 2019-04 and ASU 2019-11 are not expected to have a material impact on the Bank's financial statements.
In May 2019, the FASB published ASU 2019-05 Financial Instruments - Credit Losses (Topic 326) - Targeted Transition Relief. The amendments in this update provide targeted transition relief that is an option for, and will be available to, all reporting entities within the scope of Topic 326. It provides entities with an option to irrevocably elect the fair value option in Subtopic 825-10, applied on an instrument-by-instrument basis for eligible instruments that are within the scope of Subtopic 326-20 upon adoption of Topic 326. The fair value option election does not apply to HTM debt securities. The effective date and transition methodology for the amendments in this update are the same as in ASU 2016-13. The Bank has elected not to adopt this elective guidance.
In March 2019, the FASB published ASU 2019-01 Leases (Topic 842) - Codification Improvements. The amendments in this update provide clarification on three issues relating to ASU 2016-02 Leases (Topic 842): (1) determining the fair value of the underlying asset by lessors that are not manufactures or dealers; (2) presentation on the statement of cash flows - sales-type and direct financing leases for all lessors that are depository and lending entities within the scope of Topic 942; and (3) transition disclosures related to Topic 250, Accounting Changes and Error Corrections. The transition and effective date provisions for this update apply to Issue 1 and Issue 2 and are effective for fiscal years beginning after December 15, 2019, and interim periods within those fiscal years, for public business entities. Issue 3 amendments are to the original transition requirements in Topic 842 to clarify that the transition disclosures for Topic 250, paragraphs 250-10-50-1(b)(2) and paragraph 250-10-50-3 are excluded from interim disclosure requirements for Topic 842. The Bank does not anticipate this ASU to have a material impact on the Bank.
In 2019, the classification of certain interest bearing and non-interest bearing cash items was amended and the 2018 classification presented below was revised accordingly.
|
December 31, 2019
|
December 31, 2018
|
|
||
|
Non-interest bearing
|
||||
|
Cash and demand deposits with banks
|
|
|
|
|
|
Interest bearing¹
|
||||
|
Demand deposits with banks
|
|
|
|
|
|
Cash equivalents
|
|
|
|
|
|
Sub-total - Interest bearing
|
|
|
|
|
|
Total cash due from banks
|
|
|
|
|
¹ Interest bearing cash due from banks includes certain demand deposits with banks as at
December 31, 2019
in the amount of
$
439.5
million
(
December 31, 2018
:
$
236.7
million
) that are earning interest at a negligible rate.
|
December 31, 2019
|
December 31, 2018
|
|
||
|
Unrestricted
|
||||
|
Maturing within three months
|
|
|
|
|
|
Maturing between three to six months
|
|
|
|
|
|
Maturing between six to twelve months
|
|
|
|
|
|
Total unrestricted short-term investments
|
|
|
|
|
|
Affected by drawing restrictions related to minimum reserve and derivative margin requirements
|
||||
|
Non-interest earning demand deposits
|
|
|
|
|
|
Interest earning demand and term deposits
|
|
|
|
|
|
Total restricted short-term investments
|
|
|
|
|
|
Total short-term investments
|
|
|
|
|
F- 21
The Bank of N.T. Butterfield & Son Limited
Notes to the Consolidated Financial Statements (continued)
(In thousands of US dollars, unless otherwise stated)
Amortized Cost, Carrying Amount and Fair Value
On the consolidated balance sheets, equity securities and AFS investments are carried at fair value and HTM investments are carried at amortized cost.
|
December 31, 2019
|
December 31, 2018
|
|||||||||||||||
|
Amortized
cost |
|
Gross
unrealized gains |
|
Gross
unrealized losses |
|
Fair value
|
|
Amortized
cost |
|
Gross
unrealized gains |
|
Gross
unrealized losses |
|
Fair value
|
|
|
|
Equity securities
|
||||||||||||||||
|
Mutual funds
|
|
|
|
|
(
|
)
|
|
|
|
|
|
|
(
|
)
|
|
|
|
Total equity securities
|
|
|
|
|
(
|
)
|
|
|
|
|
|
|
(
|
)
|
|
|
|
Available-for-sale
|
||||||||||||||||
|
US government and federal agencies
|
|
|
|
|
(
|
)
|
|
|
|
|
|
|
(
|
)
|
|
|
|
Non-US governments debt securities
|
|
|
|
|
(
|
)
|
|
|
|
|
|
|
(
|
)
|
|
|
|
Corporate debt securities
|
|
|
|
|
|
|
|
|
|
|
|
|
(
|
)
|
|
|
|
Asset-backed securities - Student loans
|
|
|
|
|
(
|
)
|
|
|
|
|
|
|
(
|
)
|
|
|
|
Commercial mortgage-backed securities
|
|
|
|
|
|
|
|
|
|
|
|
|
(
|
)
|
|
|
|
Residential mortgage-backed securities
|
|
|
|
|
(
|
)
|
|
|
|
|
|
|
(
|
)
|
|
|
|
Total available-for-sale
|
|
|
|
|
(
|
)
|
|
|
|
|
|
|
(
|
)
|
|
|
|
Held-to-maturity¹
|
||||||||||||||||
|
US government and federal agencies
|
|
|
|
|
(
|
)
|
|
|
|
|
|
|
(
|
)
|
|
|
|
Total held-to-maturity
|
|
|
|
|
(
|
)
|
|
|
|
|
|
|
(
|
)
|
|
|
Investments with Unrealized Loss Positions
The Bank does not believe that the AFS and HTM investment securities that were in an unrealized loss position as at
December 31, 2019
(and
December 31, 2018
), which were composed of
68
securities representing
23
%
of the AFS and HTM portfolios' carrying value (
December 31, 2018
:
198
and
75
%
, respectively), represent an OTTI. Total gross unrealized losses were
0.8
%
of the fair value of affected securities (
December 31, 2018
:
2.6
%
). Management does not intend to sell and it is likely that management will not be required to sell the securities prior to their anticipated recovery. Unrealized losses were attributable primarily to changes in market interest rates, relative to when the investment securities were purchased, and not due to the credit quality of the investment securities. The issuers continue to make timely principal and interest payments on the securities. The following describes the processes for identifying credit impairment in security types with the most significant unrealized losses as shown in the preceding tables.
Management believes that all the
US government and federal agencies
securities do not have any credit losses, given the explicit and implicit guarantees provided by the US federal government.
Management believes that all the
Non-US governments debt securities
do not have any credit losses, given the explicit guarantee provided by the issuing government.
Investments in
Asset-backed securities - Student loans
are composed primarily of securities collateralized by Federal Family Education Loan Program loans (“FFELP loans”). FFELP loans benefit from a US federal government guarantee of at least 97% of defaulted principal and accrued interest, with additional credit support provided in the form of over-collateralization, subordination and excess spread, which collectively total in excess of 100%. Accordingly, the vast majority of FFELP loan-backed securities are not exposed to traditional consumer credit risk.
Investments in
Residential mortgage-backed securities
relate to
7
securities which are rated
AAA
and possess similar significant credit enhancement as described above. No credit losses were recognized on these securities as the weighted average credit support and the weighted average loan-to-value ratios (“LTV”) range from
11
%
-
22
%
and
54
%
-
63
%
, respectively. Current credit support is significantly greater than any delinquencies experienced on the underlying mortgages.
F- 22
The Bank of N.T. Butterfield & Son Limited
Notes to the Consolidated Financial Statements (continued)
(In thousands of US dollars, unless otherwise stated)
In the following tables, debt securities with unrealized losses that are not deemed to be OTTI are categorized as being in a loss position for "less than 12 months" or "12 months or more" based on the point in time that the fair value most recently declined below the amortized cost basis.
|
Less than 12 months
|
12 months or more
|
|||||||||||
|
December 31, 2019
|
Fair
value
|
|
Gross
unrealized losses |
|
Fair
value
|
|
Gross
unrealized losses |
|
Total
fair value
|
|
Total gross
unrealized losses |
|
|
Available-for-sale securities with unrealized losses
|
||||||||||||
|
US government and federal agencies
|
|
|
(
|
)
|
|
|
(
|
)
|
|
|
(
|
)
|
|
Non-US governments debt securities
|
|
|
(
|
)
|
|
|
(
|
)
|
|
|
(
|
)
|
|
Asset-backed securities - Student loans
|
|
|
|
|
|
|
(
|
)
|
|
|
(
|
)
|
|
Residential mortgage-backed securities
|
|
|
(
|
)
|
|
|
(
|
)
|
|
|
(
|
)
|
|
Total available-for-sale securities with unrealized losses
|
|
|
(
|
)
|
|
|
(
|
)
|
|
|
(
|
)
|
|
Held-to-maturity securities with unrealized losses
|
||||||||||||
|
US government and federal agencies
|
|
|
(
|
)
|
|
|
(
|
)
|
|
|
(
|
)
|
|
Less than 12 months
|
12 months or more
|
|||||||||||
|
December 31, 2018
|
Fair
value
|
|
Gross
unrealized losses |
|
Fair
value
|
|
Gross
unrealized losses |
|
Total
fair value
|
|
Total gross
unrealized losses |
|
|
Available-for-sale securities with unrealized losses
|
||||||||||||
|
US government and federal agencies
|
|
|
(
|
)
|
|
|
(
|
)
|
|
|
(
|
)
|
|
Non-US governments debt securities
|
|
|
|
|
|
|
(
|
)
|
|
|
(
|
)
|
|
Corporate debt securities
|
|
|
(
|
)
|
|
|
(
|
)
|
|
|
(
|
)
|
|
Asset-backed securities - Student loans
|
|
|
|
|
|
|
(
|
)
|
|
|
(
|
)
|
|
Commercial mortgage-backed securities
|
|
|
|
|
|
|
(
|
)
|
|
|
(
|
)
|
|
Residential mortgage-backed securities
|
|
|
(
|
)
|
|
|
(
|
)
|
|
|
(
|
)
|
|
Total available-for-sale securities with unrealized losses
|
|
|
(
|
)
|
|
|
(
|
)
|
|
|
(
|
)
|
|
Held-to-maturity securities with unrealized losses
|
||||||||||||
|
US government and federal agencies
|
|
|
(
|
)
|
|
|
(
|
)
|
|
|
(
|
)
|
Investment Maturities
The following table presents the remaining term to contractual maturity of the Bank’s securities. The actual maturities may differ as certain securities offer prepayment options to the borrowers.
|
Remaining term to maturity
|
||||||||||||||
|
December 31, 2019
|
Within
3 months
|
|
3 to 12
months
|
|
1 to 5
years
|
|
5 to 10
years
|
|
Over
10 years
|
|
No specific or single
maturity
|
|
Carrying
amount
|
|
|
Equity securities
|
||||||||||||||
|
Mutual funds
|
|
|
|
|
|
|
|
|
|
|
|
|
|
|
|
Available-for-sale
|
||||||||||||||
|
US government and federal agencies
|
|
|
|
|
|
|
|
|
|
|
|
|
|
|
|
Non-US governments debt securities
|
|
|
|
|
|
|
|
|
|
|
|
|
|
|
|
Asset-backed securities - Student loans
|
|
|
|
|
|
|
|
|
|
|
|
|
|
|
|
Residential mortgage-backed securities
|
|
|
|
|
|
|
|
|
|
|
|
|
|
|
|
Total available-for-sale
|
|
|
|
|
|
|
|
|
|
|
|
|
|
|
|
Held-to-maturity
|
||||||||||||||
|
US government and federal agencies
|
|
|
|
|
|
|
|
|
|
|
|
|
|
|
|
Total investments
|
|
|
|
|
|
|
|
|
|
|
|
|
|
|
|
Total by currency
|
||||||||||||||
|
US dollars
|
|
|
|
|
|
|
|
|
|
|
|
|
|
|
|
Other
|
|
|
|
|
|
|
|
|
|
|
|
|
|
|
|
Total investments
|
|
|
|
|
|
|
|
|
|
|
|
|
|
|
F- 23
The Bank of N.T. Butterfield & Son Limited
Notes to the Consolidated Financial Statements (continued)
(In thousands of US dollars, unless otherwise stated)
Pledged Investments
The Bank pledges certain US government and federal agencies investment securities to further secure the Bank's issued customer deposit products. The secured party does not have the right to sell or repledge the collateral.
|
December 31, 2019
|
December 31, 2018
|
|||||||
|
Pledged Investments
|
Amortized
cost |
|
Fair
value
|
|
Amortized
cost |
|
Fair
value
|
|
|
Available-for-sale
|
|
|
|
|
|
|
|
|
|
Held-to-maturity
|
|
|
|
|
|
|
|
|
Sale Proceeds and Realized Gains and Losses of AFS Securities
|
Year ended
|
||||||
|
December 31, 2019
|
||||||
|
Sale
proceeds
|
|
Gross realized
gains |
|
Gross realized
(losses) |
|
|
|
US government and federal agencies
|
|
|
|
|
|
|
|
Corporate debt securities
|
|
|
|
|
(
|
)
|
|
Commercial mortgage-backed securities
|
|
|
|
|
(
|
)
|
|
Pass-through note
|
|
|
|
|
|
|
|
Total
|
|
|
|
|
(
|
)
|
|
Year ended
|
||||||
|
December 31, 2018
|
||||||
|
Sale
proceeds |
|
Gross realized
gains |
|
Gross realized
(losses) |
|
|
|
US government and federal agencies
|
|
|
|
|
(
|
)
|
|
Corporate debt securities
|
|
|
|
|
(
|
)
|
|
Commercial mortgage-backed securities
|
|
|
|
|
(
|
)
|
|
Pass-through note
|
|
|
|
|
|
|
|
Total
|
|
|
|
|
(
|
)
|
|
Year ended
|
||||||
|
December 31, 2017
|
||||||
|
Sale
proceeds |
|
Gross realized
gains |
|
Gross realized
(losses) |
|
|
|
Corporate debt securities
|
|
|
|
|
|
|
|
Commercial mortgage-backed securities
|
|
|
|
|
(
|
)
|
|
Pass-through note
|
|
|
|
|
|
|
|
Total
|
|
|
|
|
(
|
)
|
Taxability of Interest Income
None of the investments' interest income have received a specific preferential income tax treatment in any of the jurisdictions in which the Bank owns investments.
F- 24
The Bank of N.T. Butterfield & Son Limited
Notes to the Consolidated Financial Statements (continued)
(In thousands of US dollars, unless otherwise stated)
The principal means of securing residential mortgages, personal, credit card and business loans are entitlements over assets and guarantees. Mortgage loans are generally repayable over periods of up to thirty years and personal and business loans are generally repayable over terms not exceeding five years. Government loans are repayable over a variety of terms which are individually negotiated. Amounts owing on credit cards are revolving and typically a minimum amount is due within 30 days from billing. The effective yield on total loans as at
December 31, 2019
is
4.73
%
(
December 31, 2018
:
5.53
%
).
|
December 31, 2019
|
December 31, 2018
|
|
||
|
Commercial loans
|
||||
|
Government
|
|
|
|
|
|
Commercial and industrial
|
|
|
|
|
|
Commercial overdrafts
|
|
|
|
|
|
Total gross commercial loans
|
|
|
|
|
|
Less specific allowance for credit losses
|
(
|
)
|
(
|
)
|
|
Net commercial loans
|
|
|
|
|
|
|
||||
|
Commercial real estate loans
|
||||
|
Commercial mortgage
|
|
|
|
|
|
Construction
|
|
|
|
|
|
Total gross commercial real estate loans
|
|
|
|
|
|
Less specific allowance for credit losses
|
(
|
)
|
(
|
)
|
|
Net commercial real estate loans
|
|
|
|
|
|
|
||||
|
Consumer loans
|
||||
|
Automobile financing
|
|
|
|
|
|
Credit card
|
|
|
|
|
|
Overdrafts
|
|
|
|
|
|
Other consumer
|
|
|
|
|
|
Total gross consumer loans
|
|
|
|
|
|
Less specific allowance for credit losses
|
(
|
)
|
(
|
)
|
|
Net consumer loans
|
|
|
|
|
|
|
||||
|
Residential mortgage loans
|
|
|
|
|
|
Less specific allowance for credit losses
|
(
|
)
|
(
|
)
|
|
Net residential mortgage loans
|
|
|
|
|
|
|
||||
|
Total gross loans
|
|
|
|
|
|
Less specific allowance for credit losses
|
(
|
)
|
(
|
)
|
|
Less general allowance for credit losses
|
(
|
)
|
(
|
)
|
|
Net loans
|
|
|
|
|
F- 25
The Bank of N.T. Butterfield & Son Limited
Notes to the Consolidated Financial Statements (continued)
(In thousands of US dollars, unless otherwise stated)
Age Analysis of Past Due Loans (Including Non-Accrual Loans)
The following tables summarize the past due status of the loans as at
December 31, 2019
and
December 31, 2018
. The aging of past due amounts are determined based on the contractual delinquency status of payments under the loan and this aging may be affected by the timing of the last business day at period end. Loans less than 30 days past due are included in current loans.
|
December 31, 2019
|
30 - 59
days
|
|
60 - 89
days
|
|
More than 90 days
|
|
Total past
due loans
|
|
Total
current
|
|
Total
loans
|
|
|
Commercial loans
|
||||||||||||
|
Government
|
|
|
|
|
|
|
|
|
|
|
|
|
|
Commercial and industrial
|
|
|
|
|
|
|
|
|
|
|
|
|
|
Commercial overdrafts
|
|
|
|
|
|
|
|
|
|
|
|
|
|
Total commercial loans
|
|
|
|
|
|
|
|
|
|
|
|
|
|
|
||||||||||||
|
Commercial real estate loans
|
||||||||||||
|
Commercial mortgage
|
|
|
|
|
|
|
|
|
|
|
|
|
|
Construction
|
|
|
|
|
|
|
|
|
|
|
|
|
|
Total commercial real estate loans
|
|
|
|
|
|
|
|
|
|
|
|
|
|
|
||||||||||||
|
Consumer loans
|
||||||||||||
|
Automobile financing
|
|
|
|
|
|
|
|
|
|
|
|
|
|
Credit card
|
|
|
|
|
|
|
|
|
|
|
|
|
|
Overdrafts
|
|
|
|
|
|
|
|
|
|
|
|
|
|
Other consumer
|
|
|
|
|
|
|
|
|
|
|
|
|
|
Total consumer loans
|
|
|
|
|
|
|
|
|
|
|
|
|
|
|
||||||||||||
|
Residential mortgage loans
|
|
|
|
|
|
|
|
|
|
|
|
|
|
|
||||||||||||
|
Total gross loans
|
|
|
|
|
|
|
|
|
|
|
|
|
|
December 31, 2018
|
30 - 59
days
|
|
60 - 89
days
|
|
More than 90 days
|
|
Total past
due loans
|
|
Total
current
|
|
Total
loans
|
|
|
Commercial loans
|
||||||||||||
|
Government
|
|
|
|
|
|
|
|
|
|
|
|
|
|
Commercial and industrial
|
|
|
|
|
|
|
|
|
|
|
|
|
|
Commercial overdrafts
|
|
|
|
|
|
|
|
|
|
|
|
|
|
Total commercial loans
|
|
|
|
|
|
|
|
|
|
|
|
|
|
|
||||||||||||
|
Commercial real estate loans
|
||||||||||||
|
Commercial mortgage
|
|
|
|
|
|
|
|
|
|
|
|
|
|
Construction
|
|
|
|
|
|
|
|
|
|
|
|
|
|
Total commercial real estate loans
|
|
|
|
|
|
|
|
|
|
|
|
|
|
|
||||||||||||
|
Consumer loans
|
||||||||||||
|
Automobile financing
|
|
|
|
|
|
|
|
|
|
|
|
|
|
Credit card
|
|
|
|
|
|
|
|
|
|
|
|
|
|
Overdrafts
|
|
|
|
|
|
|
|
|
|
|
|
|
|
Other consumer
|
|
|
|
|
|
|
|
|
|
|
|
|
|
Total consumer loans
|
|
|
|
|
|
|
|
|
|
|
|
|
|
|
||||||||||||
|
Residential mortgage loans
|
|
|
|
|
|
|
|
|
|
|
|
|
|
|
||||||||||||
|
Total gross loans
|
|
|
|
|
|
|
|
|
|
|
|
|
Loans' Credit Quality
The four credit quality classifications set out in the following tables (which exclude purchased credit-impaired loans) are defined below and describe the credit quality of the Bank's lending portfolio. These classifications each encompass a range of more granular, internal credit rating grades assigned.
F- 26
The Bank of N.T. Butterfield & Son Limited
Notes to the Consolidated Financial Statements (continued)
(In thousands of US dollars, unless otherwise stated)
A
pass loan
shall mean a loan that is expected to be repaid as agreed. A loan is classified as pass where the Bank is not expected to face repayment difficulties because the present and projected cash flows are sufficient to repay the debt and the repayment schedule as established by the agreement is being followed.
A
special mention
loan shall mean a loan under close monitoring by the Bank’s management. Loans in this category are currently protected and still performing (current with respect to interest and principal payments), but are potentially weak and present an undue credit risk exposure, but not to the point of justifying a classification of substandard.
A
substandard
loan shall mean a loan whose evident unreliability makes repayment doubtful and there is a threat of loss to the Bank unless the unreliability is averted.
A
non-accrual
loan shall mean either management is of the opinion full payment of principal or interest is in doubt or when principal or interest is 90 days past due and for residential mortgage loans which are not well secured and in the process of collection.
Based on the most recent analysis performed, the credit quality classifications by class of loan is as follows:
|
December 31, 2019
|
Pass
|
|
Special
mention
|
|
Substandard
|
|
Non-accrual
|
|
Total gross
recorded loans
|
|
|
Commercial loans
|
||||||||||
|
Government
|
|
|
|
|
|
|
|
|
|
|
|
Commercial and industrial
|
|
|
|
|
|
|
|
|
|
|
|
Commercial overdrafts
|
|
|
|
|
|
|
|
|
|
|
|
Total commercial loans
|
|
|
|
|
|
|
|
|
|
|
|
|
||||||||||
|
Commercial real estate loans
|
||||||||||
|
Commercial mortgage
|
|
|
|
|
|
|
|
|
|
|
|
Construction
|
|
|
|
|
|
|
|
|
|
|
|
Total commercial real estate loans
|
|
|
|
|
|
|
|
|
|
|
|
|
||||||||||
|
Consumer loans
|
||||||||||
|
Automobile financing
|
|
|
|
|
|
|
|
|
|
|
|
Credit card
|
|
|
|
|
|
|
|
|
|
|
|
Overdrafts
|
|
|
|
|
|
|
|
|
|
|
|
Other consumer
|
|
|
|
|
|
|
|
|
|
|
|
Total consumer loans
|
|
|
|
|
|
|
|
|
|
|
|
|
||||||||||
|
Residential mortgage loans
|
|
|
|
|
|
|
|
|
|
|
|
|
||||||||||
|
Total gross recorded loans
|
|
|
|
|
|
|
|
|
|
|
|
December 31, 2018
|
Pass
|
|
Special
mention
|
|
Substandard
|
|
Non-accrual
|
|
Total gross
recorded loans |
|
|
Commercial loans
|
||||||||||
|
Government
|
|
|
|
|
|
|
|
|
|
|
|
Commercial and industrial
|
|
|
|
|
|
|
|
|
|
|
|
Commercial overdrafts
|
|
|
|
|
|
|
|
|
|
|
|
Total commercial loans
|
|
|
|
|
|
|
|
|
|
|
|
|
||||||||||
|
Commercial real estate loans
|
||||||||||
|
Commercial mortgage
|
|
|
|
|
|
|
|
|
|
|
|
Construction
|
|
|
|
|
|
|
|
|
|
|
|
Total commercial real estate loans
|
|
|
|
|
|
|
|
|
|
|
|
|
||||||||||
|
Consumer loans
|
||||||||||
|
Automobile financing
|
|
|
|
|
|
|
|
|
|
|
|
Credit card
|
|
|
|
|
|
|
|
|
|
|
|
Overdrafts
|
|
|
|
|
|
|
|
|
|
|
|
Other consumer
|
|
|
|
|
|
|
|
|
|
|
|
Total consumer loans
|
|
|
|
|
|
|
|
|
|
|
|
|
||||||||||
|
Residential mortgage loans
|
|
|
|
|
|
|
|
|
|
|
|
|
||||||||||
|
Total gross recorded loans
|
|
|
|
|
|
|
|
|
|
|
F- 27
The Bank of N.T. Butterfield & Son Limited
Notes to the Consolidated Financial Statements (continued)
(In thousands of US dollars, unless otherwise stated)
|
Evaluation of Loans For Impairment
|
December 31, 2019
|
December 31, 2018
|
||||||
|
Individually
evaluated
|
|
Collectively
evaluated
|
|
Individually
evaluated
|
|
Collectively
evaluated
|
|
|
|
Commercial
|
|
|
|
|
|
|
|
|
|
Commercial real estate
|
|
|
|
|
|
|
|
|
|
Consumer
|
|
|
|
|
|
|
|
|
|
Residential mortgage
|
|
|
|
|
|
|
|
|
|
Total gross loans
|
|
|
|
|
|
|
|
|
Changes in General and Specific Allowances For Credit Losses
|
Year ended December 31, 2019
|
||||||||||
|
Commercial
|
|
Commercial
real estate
|
|
Consumer
|
|
Residential
mortgage
|
|
Total
|
|
|
|
Allowances at beginning of year
|
|
|
|
|
|
|
|
|
|
|
|
Provision increase (decrease)
|
|
|
(
|
)
|
|
|
(
|
)
|
(
|
)
|
|
Recoveries
|
|
|
|
|
|
|
|
|
|
|
|
Charge-offs
|
(
|
)
|
|
|
(
|
)
|
(
|
)
|
(
|
)
|
|
Other
|
|
|
|
|
|
|
|
|
|
|
|
Allowances at end of year
|
|
|
|
|
|
|
|
|
|
|
|
Allowances at end of year: individually evaluated for impairment
|
|
|
|
|
|
|
|
|
|
|
|
Allowances at end of year: collectively evaluated for impairment
|
|
|
|
|
|
|
|
|
|
|
|
Year ended December 31, 2018
|
||||||||||
|
Commercial
|
|
Commercial
real estate
|
|
Consumer
|
|
Residential
mortgage
|
|
Total
|
|
|
|
Allowances at beginning of year
|
|
|
|
|
|
|
|
|
|
|
|
Provision increase (decrease)
|
|
|
(
|
)
|
|
|
(
|
)
|
(
|
)
|
|
Recoveries
|
|
|
|
|
|
|
|
|
|
|
|
Charge-offs
|
(
|
)
|
|
|
(
|
)
|
(
|
)
|
(
|
)
|
|
Other
|
|
|
(
|
)
|
|
|
(
|
)
|
(
|
)
|
|
Allowances at end of year
|
|
|
|
|
|
|
|
|
|
|
|
Allowances at end of year: individually evaluated for impairment
|
|
|
|
|
|
|
|
|
|
|
|
Allowances at end of year: collectively evaluated for impairment
|
|
|
|
|
|
|
|
|
|
|
|
Year ended December 31, 2017
|
||||||||||
|
Commercial
|
|
Commercial
real estate
|
|
Consumer
|
|
Residential
mortgage
|
|
Total
|
|
|
|
Allowances at beginning of year
|
|
|
|
|
|
|
|
|
|
|
|
Provision increase (decrease)
|
|
|
(
|
)
|
|
|
(
|
)
|
(
|
)
|
|
Recoveries
|
|
|
|
|
|
|
|
|
|
|
|
Charge-offs
|
(
|
)
|
(
|
)
|
(
|
)
|
(
|
)
|
(
|
)
|
|
Other
|
|
|
|
|
|
|
|
|
|
|
|
Allowances at end of year
|
|
|
|
|
|
|
|
|
|
|
|
Allowances at end of year: individually evaluated for impairment
|
|
|
|
|
|
|
|
|
|
|
|
Allowances at end of year: collectively evaluated for impairment
|
|
|
|
|
|
|
|
|
|
|
F- 28
The Bank of N.T. Butterfield & Son Limited
Notes to the Consolidated Financial Statements (continued)
(In thousands of US dollars, unless otherwise stated)
|
Non-Performing Loans (excluding purchased credit-impaired loans)
|
December 31, 2019
|
December 31, 2018
|
||||||||||
|
Non-accrual
|
|
Past
due more than 90 days and accruing
|
|
Total non-
performing
loans
|
|
Non-accrual
|
|
Past
due more than 90 days and accruing
|
|
Total non-
performing
loans
|
|
|
|
Commercial loans
|
||||||||||||
|
Government
|
|
|
|
|
|
|
|
|
|
|
|
|
|
Commercial and industrial
|
|
|
|
|
|
|
|
|
|
|
|
|
|
Commercial overdrafts
|
|
|
|
|
|
|
|
|
|
|
|
|
|
Total commercial loans
|
|
|
|
|
|
|
|
|
|
|
|
|
|
|
||||||||||||
|
Commercial real estate loans
|
|
|
|
|
|
|
||||||
|
Commercial mortgage
|
|
|
|
|
|
|
|
|
|
|
|
|
|
Construction
|
|
|
|
|
|
|
|
|
|
|
|
|
|
Total commercial real estate loans
|
|
|
|
|
|
|
|
|
|
|
|
|
|
|
||||||||||||
|
Consumer loans
|
|
|
|
|
|
|
||||||
|
Automobile financing
|
|
|
|
|
|
|
|
|
|
|
|
|
|
Credit card
|
|
|
|
|
|
|
|
|
|
|
|
|
|
Overdrafts
|
|
|
|
|
|
|
|
|
|
|
|
|
|
Other consumer
|
|
|
|
|
|
|
|
|
|
|
|
|
|
Total consumer loans
|
|
|
|
|
|
|
|
|
|
|
|
|
|
|
||||||||||||
|
Residential mortgage loans
|
|
|
|
|
|
|
|
|
|
|
|
|
|
|
||||||||||||
|
Total non-performing loans
|
|
|
|
|
|
|
|
|
|
|
|
|
Impaired Loans (excluding purchased credit-impaired loans)
A loan is considered to be impaired when, based on current information and events, the Bank determines that it will not be able to collect all amounts due according to the original loan contract, including scheduled interest payments. Impaired loans include all non-accrual loans and all loans modified in a TDR even if full collectability is expected following the restructuring. During the
year ended December 31, 2019
, the amount of gross interest income that would have been recorded had impaired loans been current was
$
2.7
million
(
December 31, 2018
:
$
2.1
million
;
December 31, 2017
:
$
2.1
million
).
|
Impaired loans with an allowance
|
Gross
recorded
impaired loans
without an
allowance
|
|
Total impaired loans
|
|||||||||||
|
December 31, 2019
|
Gross
recorded loans
|
|
Specific
allowance
|
|
Net loans
|
|
Gross
recorded loans
|
|
Specific
allowance
|
|
Net loans
|
|
||
|
Commercial loans
|
||||||||||||||
|
Commercial and industrial
|
|
|
(
|
)
|
|
|
|
|
|
|
(
|
)
|
|
|
|
Commercial overdrafts
|
|
|
|
|
|
|
|
|
|
|
|
|
|
|
|
Total commercial loans
|
|
|
(
|
)
|
|
|
|
|
|
|
(
|
)
|
|
|
|
|
||||||||||||||
|
Commercial real estate loans
|
||||||||||||||
|
Commercial mortgage
|
|
|
(
|
)
|
|
|
|
|
|
|
(
|
)
|
|
|
|
|
||||||||||||||
|
Consumer loans
|
||||||||||||||
|
Automobile financing
|
|
|
|
|
|
|
|
|
|
|
|
|
|
|
|
Overdrafts
|
|
|
|
|
|
|
|
|
|
|
|
|
|
|
|
Other consumer
|
|
|
(
|
)
|
|
|
|
|
|
|
(
|
)
|
|
|
|
Total consumer loans
|
|
|
(
|
)
|
|
|
|
|
|
|
(
|
)
|
|
|
|
|
||||||||||||||
|
Residential mortgage loans
|
|
|
(
|
)
|
|
|
|
|
|
|
(
|
)
|
|
|
|
|
||||||||||||||
|
Total impaired loans
|
|
|
(
|
)
|
|
|
|
|
|
|
(
|
)
|
|
|
F- 29
The Bank of N.T. Butterfield & Son Limited
Notes to the Consolidated Financial Statements (continued)
(In thousands of US dollars, unless otherwise stated)
|
Impaired loans with an allowance
|
Gross
recorded
impaired loans
without an
allowance
|
|
Total impaired loans
|
|||||||||||
|
December 31, 2018
|
Gross
recorded loans
|
|
Specific
allowance
|
|
Net loans
|
|
Gross
recorded loans
|
|
Specific
allowance
|
|
Net loans
|
|
||
|
Commercial loans
|
||||||||||||||
|
Government
|
|
|
(
|
)
|
|
|
|
|
|
|
(
|
)
|
|
|
|
Commercial and industrial
|
|
|
(
|
)
|
|
|
|
|
|
|
(
|
)
|
|
|
|
Commercial overdrafts
|
|
|
|
|
|
|
|
|
|
|
|
|
|
|
|
Total commercial loans
|
|
|
(
|
)
|
|
|
|
|
|
|
(
|
)
|
|
|
|
|
||||||||||||||
|
Commercial real estate loans
|
||||||||||||||
|
Commercial mortgage
|
|
|
(
|
)
|
|
|
|
|
|
|
(
|
)
|
|
|
|
|
||||||||||||||
|
Consumer loans
|
||||||||||||||
|
Automobile financing
|
|
|
(
|
)
|
|
|
|
|
|
|
(
|
)
|
|
|
|
Overdrafts
|
|
|
|
|
|
|
|
|
|
|
|
|
|
|
|
Other consumer
|
|
|
(
|
)
|
|
|
|
|
|
|
(
|
)
|
|
|
|
Total consumer loans
|
|
|
(
|
)
|
|
|
|
|
|
|
(
|
)
|
|
|
|
|
||||||||||||||
|
Residential mortgage loans
|
|
|
(
|
)
|
|
|
|
|
|
|
(
|
)
|
|
|
|
|
||||||||||||||
|
Total impaired loans
|
|
|
(
|
)
|
|
|
|
|
|
|
(
|
)
|
|
|
Specific allowance excludes
$
0.2
million
recognized relating to purchased credit-impaired loans.
Average Impaired Loan Balances and Related Recognized Interest Income
|
December 31, 2019
|
December 31, 2018
|
December 31, 2017
|
||||||||||
|
Average gross
recorded loans
|
|
Interest income
recognized¹ |
|
Average gross
recorded loans
|
|
Interest income
recognized¹ |
|
Average gross
recorded loans |
|
Interest income
recognized¹ |
|
|
|
Commercial loans
|
||||||||||||
|
Government
|
|
|
|
|
|
|
|
|
|
|
|
|
|
Commercial and industrial
|
|
|
|
|
|
|
|
|
|
|
|
|
|
Commercial overdrafts
|
|
|
|
|
|
|
|
|
|
|
|
|
|
Total commercial loans
|
|
|
|
|
|
|
|
|
|
|
|
|
|
|
||||||||||||
|
Commercial real estate loans
|
||||||||||||
|
Commercial mortgage
|
|
|
|
|
|
|
|
|
|
|
|
|
|
|
||||||||||||
|
Consumer loans
|
||||||||||||
|
Automobile financing
|
|
|
|
|
|
|
|
|
|
|
|
|
|
Overdrafts
|
|
|
|
|
|
|
|
|
|
|
|
|
|
Other consumer
|
|
|
|
|
|
|
|
|
|
|
|
|
|
Total consumer loans
|
|
|
|
|
|
|
|
|
|
|
|
|
|
|
||||||||||||
|
Residential mortgage loans
|
|
|
|
|
|
|
|
|
|
|
|
|
|
|
||||||||||||
|
Total impaired loans
|
|
|
|
|
|
|
|
|
|
|
|
|
¹ All interest income recognized on impaired loans relate to loans previously modified in a TDR.
Troubled Debt Restructuring
As at
December 31, 2019
, the Bank had
no
loans that were modified in a TDR during the preceding 12 months that subsequently defaulted (i.e., 90 days or more past due following a modification). As at
December 31, 2018
, the Bank had
two
residential mortgage loans that were modified in a TDR during the preceding 12 months that subsequently defaulted with a recorded investment of
$
0.8
million
. As at
December 31, 2017
, the Bank had
no
loans that were modified in a TDR during the preceding 12 months that subsequently defaulted.
F- 30
The Bank of N.T. Butterfield & Son Limited
Notes to the Consolidated Financial Statements (continued)
(In thousands of US dollars, unless otherwise stated)
The following table presents loans by class modified as TDRs:
|
Year ended December 31, 2019
|
||||||||
|
Number of
contracts
|
|
Pre-
modification
recorded loans
|
|
Modification:
interest capitalization |
|
Post-
modification
recorded loans
|
|
|
|
Residential mortgage loans
|
|
|
|
|
|
|
|
|
|
Total loans modified in a TDR
|
|
|
|
|
|
|
|
|
|
Year ended December 31, 2018
|
||||||||
|
Number of
contracts |
|
Pre-
modification recorded loans |
|
Modification:
interest capitalization |
|
Post-
modification recorded loans |
|
|
|
Residential mortgage loans
|
|
|
|
|
|
|
|
|
|
Total loans modified in a TDR
|
|
|
|
|
|
|
|
|
|
Year ended December 31, 2017
|
||||||||
|
Number of
contracts
|
|
Pre-
modification
recorded loans
|
|
Modification:
interest capitalization |
|
Post-
modification
recorded loans
|
|
|
|
Commercial real estate loans
|
|
|
|
|
|
|
|
|
|
Residential mortgage loans
|
|
|
|
|
|
|
|
|
|
Total loans modified in a TDR
|
|
|
|
|
|
|
|
|
|
December 31, 2019
|
December 31, 2018
|
|||||||
|
TDRs outstanding
|
Accrual
|
|
Non-accrual
|
|
Accrual
|
|
Non-accrual
|
|
|
Commercial loans
|
|
|
|
|
|
|
|
|
|
Commercial real estate loans
|
|
|
|
|
|
|
|
|
|
Residential mortgage loans
|
|
|
|
|
|
|
|
|
|
Total TDRs outstanding
|
|
|
|
|
|
|
|
|
Purchased Credit-Impaired Loans
The Bank acquired certain credit-impaired loans as part of the November 7, 2014 acquisition of substantially all retail loans of HSBC Bank (Cayman) Limited. The accretable difference (or "accretable yield") represents the excess of a loan's cash flows expected to be collected over the loan's carrying amount.
|
Year ended
|
||||||||
|
December 31, 2019
|
||||||||
|
Contractual
principal
|
|
Non-accretable
difference
|
|
Accretable
difference
|
|
Carrying
amount
|
|
|
|
Balance at beginning of year
|
|
|
(
|
)
|
(
|
)
|
|
|
|
Advances and increases in cash flows expected to be collected
|
|
|
|
|
(
|
)
|
|
|
|
Reductions resulting from repayments
|
(
|
)
|
|
|
|
|
(
|
)
|
|
Increase (reduction) resulting from changes in allowances for credit losses
|
|
|
|
|
|
|
|
|
|
Reductions resulting from charge-offs
|
(
|
)
|
|
|
|
|
(
|
)
|
|
Balance at end of year
|
|
|
(
|
)
|
(
|
)
|
|
|
|
Year ended
|
||||||||
|
December 31, 2018
|
||||||||
|
Contractual
principal
|
|
Non-accretable
difference
|
|
Accretable
difference
|
|
Carrying
amount
|
|
|
|
Balance at beginning of year
|
|
|
(
|
)
|
(
|
)
|
|
|
|
Advances and increases in cash flows expected to be collected
|
|
|
|
|
(
|
)
|
|
|
|
Reductions resulting from repayments
|
(
|
)
|
|
|
|
|
(
|
)
|
|
Increase (reduction) resulting from changes in allowances for credit losses
|
|
|
|
|
|
|
|
|
|
Balance at end of year
|
|
|
(
|
)
|
(
|
)
|
|
|
F- 31
The Bank of N.T. Butterfield & Son Limited
Notes to the Consolidated Financial Statements (continued)
(In thousands of US dollars, unless otherwise stated)
|
Year ended
|
||||||||
|
December 31, 2017
|
||||||||
|
Contractual
principal
|
|
Non-accretable
difference
|
|
Accretable
difference
|
|
Carrying
amount
|
|
|
|
Balance at beginning of year
|
|
|
(
|
)
|
(
|
)
|
|
|
|
Advances and increases in cash flows expected to be collected
|
|
|
|
|
(
|
)
|
|
|
|
Reductions resulting from repayments
|
(
|
)
|
|
|
|
|
(
|
)
|
|
Reductions resulting from changes in allowances for credit losses
|
|
|
(
|
)
|
|
|
(
|
)
|
|
Reductions resulting from charge-offs
|
(
|
)
|
|
|
|
|
(
|
)
|
|
Balance at end of year
|
|
|
(
|
)
|
(
|
)
|
|
|
Concentrations of credit risk in the lending and off-balance sheet credit-related arrangements portfolios arise when a number of customers are engaged in similar business activities, are in the same geographic region, or when they have similar economic features that would cause their ability to meet contractual obligations to be similarly affected by changes in economic conditions. The Bank regularly monitors various segments of its credit risk portfolio to assess potential concentrations of risks and to obtain collateral when deemed necessary. In the Bank's commercial portfolio, risk concentrations are evaluated primarily by industry and by geographic region of loan origination. In the consumer portfolio, concentrations are evaluated primarily by products. Credit exposures include loans, guarantees and acceptances, letters of credit and commitments for undrawn lines of credit. Unconditionally cancellable credit cards and overdraft lines of credit are excluded from the tables below.
The following tables summarize the credit exposure of the Bank by business sector and by geographic region. The on-balance sheet exposure amounts disclosed are net of specific allowances and the off-balance sheet exposure amounts disclosed are gross of collateral held.
|
December 31, 2019
|
December 31, 2018
|
|||||||||||
|
Business sector
|
Loans
|
|
Off-balance
sheet
|
|
Total credit
exposure
|
|
Loans
|
|
Off-balance
sheet
|
|
Total credit
exposure
|
|
|
Banks and financial services
|
|
|
|
|
|
|
|
|
|
|
|
|
|
Commercial and merchandising
|
|
|
|
|
|
|
|
|
|
|
|
|
|
Governments
|
|
|
|
|
|
|
|
|
|
|
|
|
|
Individuals
|
|
|
|
|
|
|
|
|
|
|
|
|
|
Primary industry and manufacturing
|
|
|
|
|
|
|
|
|
|
|
|
|
|
Real estate
|
|
|
|
|
|
|
|
|
|
|
|
|
|
Hospitality industry
|
|
|
|
|
|
|
|
|
|
|
|
|
|
Transport and communication
|
|
|
|
|
|
|
|
|
|
|
|
|
|
Sub-total
|
|
|
|
|
|
|
|
|
|
|
|
|
|
General allowance
|
(
|
)
|
|
|
(
|
)
|
(
|
)
|
|
|
(
|
)
|
|
Total
|
|
|
|
|
|
|
|
|
|
|
|
|
F- 32
The Bank of N.T. Butterfield & Son Limited
Notes to the Consolidated Financial Statements (continued)
(In thousands of US dollars, unless otherwise stated)
|
December 31, 2019
|
December 31, 2018
|
|||||||||||||||
|
Geographic region
|
Cash due from
banks, resell agreements and short-term investments |
|
Loans
|
|
Off-balance
sheet
|
|
Total credit
exposure
|
|
Cash due from
banks, resell agreements and short-term investments |
|
Loans
|
|
Off-balance
sheet
|
|
Total credit
exposure
|
|
|
Australia
|
|
|
|
|
|
|
|
|
|
|
|
|
|
|
|
|
|
Barbados
|
|
|
|
|
|
|
|
|
|
|
|
|
|
|
|
|
|
Belgium
|
|
|
|
|
|
|
|
|
|
|
|
|
|
|
|
|
|
Bermuda
|
|
|
|
|
|
|
|
|
|
|
|
|
|
|
|
|
|
Canada
|
|
|
|
|
|
|
|
|
|
|
|
|
|
|
|
|
|
Cayman
|
|
|
|
|
|
|
|
|
|
|
|
|
|
|
|
|
|
Guernsey
|
|
|
|
|
|
|
|
|
|
|
|
|
|
|
|
|
|
Japan
|
|
|
|
|
|
|
|
|
|
|
|
|
|
|
|
|
|
Jersey
|
|
|
|
|
|
|
|
|
|
|
|
|
|
|
|
|
|
Netherlands
|
|
|
|
|
|
|
|
|
|
|
|
|
|
|
|
|
|
New Zealand
|
|
|
|
|
|
|
|
|
|
|
|
|
|
|
|
|
|
Norway
|
|
|
|
|
|
|
|
|
|
|
|
|
|
|
|
|
|
Saint Lucia
|
|
|
|
|
|
|
|
|
|
|
|
|
|
|
|
|
|
Switzerland
|
|
|
|
|
|
|
|
|
|
|
|
|
|
|
|
|
|
The Bahamas
|
|
|
|
|
|
|
|
|
|
|
|
|
|
|
|
|
|
United Kingdom
|
|
|
|
|
|
|
|
|
|
|
|
|
|
|
|
|
|
United States
|
|
|
|
|
|
|
|
|
|
|
|
|
|
|
|
|
|
Other
|
|
|
|
|
|
|
|
|
|
|
|
|
|
|
|
|
|
Sub-total
|
|
|
|
|
|
|
|
|
|
|
|
|
|
|
|
|
|
General allowance
|
|
|
(
|
)
|
|
|
(
|
)
|
|
|
(
|
)
|
|
|
(
|
)
|
|
Total
|
|
|
|
|
|
|
|
|
|
|
|
|
|
|
|
|
|
December 31, 2019
|
December 31, 2018
|
|||||||||||
|
Category
|
Cost
|
|
Accumulated
depreciation |
|
Net carrying
value |
|
Cost
|
|
Accumulated
depreciation |
|
Net carrying
value |
|
|
Land
|
|
|
|
|
|
|
|
|
|
|
|
|
|
Buildings
|
|
|
(
|
)
|
|
|
|
|
(
|
)
|
|
|
|
Equipment
|
|
|
(
|
)
|
|
|
|
|
(
|
)
|
|
|
|
Computer hardware and software in use
|
|
|
(
|
)
|
|
|
|
|
(
|
)
|
|
|
|
Computer software in development
|
|
|
|
|
|
|
|
|
|
|
|
|
|
Total
|
|
|
(
|
)
|
|
|
|
|
(
|
)
|
|
|
|
Year ended
|
||||||
|
Depreciation charged to operating expenses
|
December 31, 2019
|
|
December 31, 2018
|
|
December 31, 2017
|
|
|
Buildings (included in Property expense)
|
|
|
|
|
|
|
|
Equipment (included in Property expense)
|
|
|
|
|
|
|
|
Computer hardware and software (included in Technology and communication expense)
|
|
|
|
|
|
|
|
Total depreciation charged to operating expenses
|
|
|
|
|
|
|
F- 33
The Bank of N.T. Butterfield & Son Limited
Notes to the Consolidated Financial Statements (continued)
(In thousands of US dollars, unless otherwise stated)
Goodwill
|
Segment
|
||||||||
|
Cayman
|
|
Channel Islands and the UK
|
|
Other
|
|
Total
|
|
|
|
Balance at December 31, 2016
|
|
|
|
|
|
|
|
|
|
Foreign exchange translation adjustment
|
|
|
|
|
|
|
|
|
|
Balance at December 31, 2017
|
|
|
|
|
|
|
|
|
|
Acquisitions during the year
|
|
|
|
|
|
|
|
|
|
Foreign exchange translation adjustment
|
|
|
(
|
)
|
(
|
)
|
(
|
)
|
|
Balance at December 31, 2018
|
|
|
|
|
|
|
|
|
|
Foreign exchange translation adjustment
|
|
|
|
|
|
|
|
|
|
Balance at December 31, 2019
|
|
|
|
|
|
|
|
|
Customer Relationship Intangible Assets
|
December 31, 2019
|
December 31, 2018
|
|||||||||||
|
Business segment
|
Cost
|
|
Accumulated
amortization |
|
Net carrying
amount |
|
Cost
|
|
Accumulated
amortization |
|
Net carrying
amount |
|
|
Bermuda
|
|
|
(
|
)
|
|
|
|
|
(
|
)
|
|
|
|
Cayman
|
|
|
(
|
)
|
|
|
|
|
(
|
)
|
|
|
|
Channel Islands and the UK
|
|
|
(
|
)
|
|
|
|
|
(
|
)
|
|
|
|
Other
|
|
|
(
|
)
|
|
|
|
|
(
|
)
|
|
|
|
Total
|
|
|
(
|
)
|
|
|
|
|
(
|
)
|
|
|
Customer relationships are initially valued based on the present value of net cash flows expected to be derived solely from the recurring customer base existing as at the date of acquisition. Customer relationship intangible assets may or may not arise from contracts.
During the year ended
December 31, 2019
, the Bank acquired
$
24.4
million
new customer intangible assets with an estimated useful life of
15
years through a business acquisition (see
Note 27: Business combinations
). During the year ended
December 31, 2018
, the Bank acquired
$
18.2
million
new customer intangible assets with an estimated useful life of
15
years
, of which
$
16.9
million
was acquired through a business acquisition (see
Note 27: Business combinations
) and
$
1.3
million
via asset acquisitions. During the year ended
December 31, 2017
,
no
new customer intangible assets were acquired. The amortization expense amounted to
$
5.5
million
(
December 31, 2018
:
$
5.1
million
,
December 31, 2017
:
$
4.2
million
) and the foreign exchange translation adjustment decreased the net carrying amount by
$
2.0
million
(
December 31, 2018
: decreased by
$
1.5
million
,
December 31, 2017
: decreased by
$
1.0
million
). The estimated aggregate amortization expense for each of the succeeding five years is
$
5.9
million
.
F- 34
The Bank of N.T. Butterfield & Son Limited
Notes to the Consolidated Financial Statements (continued)
(In thousands of US dollars, unless otherwise stated)
|
By Maturity
|
||||||||||||||||||
|
Demand
|
Total
demand deposits |
|
Term
|
Total
term deposits |
|
|||||||||||||
|
December 31, 2019
|
Non-interest
bearing |
|
Interest
bearing |
|
Within 3
months |
|
3 to 6
months |
|
6 to 12
months |
|
After 12 months
|
|
Total
deposits |
|
||||
|
Customers
|
||||||||||||||||||
|
Demand or less than $100k¹
|
|
|
|
|
|
|
|
|
|
|
|
|
|
|
|
|
|
|
|
Term - $100k or more
|
N/A
|
|
N/A
|
|
—
|
|
|
|
|
|
|
|
|
|
|
|
|
|
|
Total customer deposits
|
|
|
|
|
|
|
|
|
|
|
|
|
|
|
|
|
|
|
|
Banks
|
||||||||||||||||||
|
Demand or less than $100k
|
|
|
|
|
|
|
|
|
|
|
|
|
|
|
|
|
|
|
|
Term - $100k or more
|
N/A
|
|
N/A
|
|
—
|
|
|
|
|
|
|
|
|
|
|
|
|
|
|
Total bank deposits
|
|
|
|
|
|
|
|
|
|
|
|
|
|
|
|
|
|
|
|
|
|
|
|
|
|
|
|
|
|
|||||||||
|
Total deposits
|
|
|
|
|
|
|
|
|
|
|
|
|
|
|
|
|
|
|
|
Demand
|
Total
demand deposits |
|
Term
|
Total
term deposits |
|
|||||||||||||
|
December 31, 2018
|
Non-interest
bearing |
|
Interest
bearing |
|
Within 3
months |
|
3 to 6
months |
|
6 to 12
months |
|
After 12 months
|
|
Total
deposits |
|
||||
|
Customers
|
||||||||||||||||||
|
Demand or less than $100k¹
|
|
|
|
|
|
|
|
|
|
|
|
|
|
|
|
|
|
|
|
Term - $100k or more
|
N/A
|
|
N/A
|
|
—
|
|
|
|
|
|
|
|
|
|
|
|
|
|
|
Total customer deposits
|
|
|
|
|
|
|
|
|
|
|
|
|
|
|
|
|
|
|
|
Banks
|
||||||||||||||||||
|
Demand or less than $100k
|
|
|
|
|
|
|
|
|
|
|
|
|
|
|
|
|
|
|
|
Term - $100k or more
|
N/A
|
|
N/A
|
|
—
|
|
|
|
|
|
|
|
|
|
|
|
|
|
|
Total bank deposits
|
|
|
|
|
|
|
|
|
|
|
|
|
|
|
|
|
|
|
|
|
|
|
|
|
|
|
|
|
|
|||||||||
|
Total deposits
|
|
|
|
|
|
|
|
|
|
|
|
|
|
|
|
|
|
|
¹ The weighted-average interest rate on interest-bearing demand deposits as at
December 31, 2019
is
0.20
%
(
December 31, 2018
:
0.13
%
).
|
By Type and Segment
|
December 31, 2019
|
December 31, 2018
|
||||||||||
|
Payable
on demand
|
|
Payable on a
fixed date
|
|
Total
|
|
Payable
on demand
|
|
Payable on a
fixed date
|
|
Total
|
|
|
|
Bermuda
|
||||||||||||
|
Customers
|
|
|
|
|
|
|
|
|
|
|
|
|
|
Banks
|
|
|
|
|
|
|
|
|
|
|
|
|
|
Cayman
|
||||||||||||
|
Customers
|
|
|
|
|
|
|
|
|
|
|
|
|
|
Banks
|
|
|
|
|
|
|
|
|
|
|
|
|
|
Channel Islands and the UK
|
||||||||||||
|
Customers
|
|
|
|
|
|
|
|
|
|
|
|
|
|
Banks
|
|
|
|
|
|
|
|
|
|
|
|
|
|
Total Customers
|
|
|
|
|
|
|
|
|
|
|
|
|
|
Total Banks
|
|
|
|
|
|
|
|
|
|
|
|
|
|
Total deposits
|
|
|
|
|
|
|
|
|
|
|
|
|
F- 35
The Bank of N.T. Butterfield & Son Limited
Notes to the Consolidated Financial Statements (continued)
(In thousands of US dollars, unless otherwise stated)
The Bank maintains trusteed pension plans including non-contributory defined benefit plans and a number of defined contribution plans, and provides post-retirement medical benefits to its qualifying retirees. The defined benefit provisions under the pension plans are generally based upon years of service and average salary during the relevant years of employment. The defined benefit and post-retirement medical plans are not open to new participants and are non-contributory and the funding required is provided by the Bank, based upon the advice of independent actuaries. The defined benefit pension plans are in the Bermuda, Guernsey and UK jurisdictions and the defined benefit post-retirement medical plan is in Bermuda.
Bermuda Defined Benefit and Post-Retirement Medical Benefit Plan
The Bank amortizes prior service credit resulting from plan amendments that occurred when plan members were active employees, on a linear basis over the expected average remaining service period (to full eligibility) of active members expected to receive benefits under the plan. Such remaining service periods are as follows:
3.1
years for the 2010 plan amendments and
4.6
years for the 2011 plan amendments. Plan amendments occurring in 2014 and 2019 resulted in the recognition of new prior service cost on December 31, 2014 and December 31, 2019 on a plan for which substantially all members are now inactive and, in accordance with GAAP, the Bank has elected to amortize these new prior service costs on a linear basis over
21
years and
16
years
, respectively, which was the average remaining life expectancy of members eligible for benefits under the plan at the time of the amendments.
Guernsey Defined Benefit Pension Plan
Effective October 2014, all the participants of the Guernsey defined benefit pension plan became inactive and in accordance with GAAP, the net actuarial loss of the Guernsey defined benefit pension plan will be amortized over the then estimated average remaining life expectancy of the inactive participants of
39
years. Prior to all of the Guernsey participants being inactive, the net actuarial loss of the Guernsey defined benefit pension plan was amortized to net income over the estimated average remaining service period for active members of
15
years.
UK Defined Benefit Pension Plan
The UK defined benefit pension plan closed to new members effective April 1, 2002 and subsequently closed to further accrual of new benefits effective October 1, 2012. During the years ended December 31, 2018 and 2017, the pension plan settled in cash the liability of several plan members and an insurance policy was purchased in the name of the trustees of the plan to match the liabilities of remaining members who were pensioners as at March 31, 2016.
F- 36
The Bank of N.T. Butterfield & Son Limited
Notes to the Consolidated Financial Statements (continued)
(In thousands of US dollars, unless otherwise stated)
The following table presents the financial position of the Bank’s defined benefit pension plans and the Bank’s post-retirement medical benefit plan, which is unfunded. The Bank measures the benefit obligations and plan assets annually on each December 31 and therefore, the most recent measurement date is
December 31, 2019
.
|
December 31, 2019
|
December 31, 2018
|
December 31, 2017
|
||||||||||
|
Pension
plans |
|
Post-
retirement medical benefit plan |
|
Pension
plans |
|
Post-
retirement medical benefit plan |
|
Pension
plans |
|
Post-
retirement medical benefit plan |
|
|
|
Accumulated benefit obligation at end of year
|
|
|
|
|
|
|
|
|
|
|
|
|
|
Change in projected benefit obligation
|
||||||||||||
|
Projected benefit obligation at beginning of year
|
|
|
|
|
|
|
|
|
|
|
|
|
|
Service cost
|
|
|
|
|
|
|
|
|
|
|
|
|
|
Interest cost
|
|
|
|
|
|
|
|
|
|
|
|
|
|
Benefits paid
|
(
|
)
|
(
|
)
|
(
|
)
|
(
|
)
|
(
|
)
|
(
|
)
|
|
Prior service cost
|
|
|
|
|
|
|
|
|
|
|
|
|
|
Plan amendment
|
|
|
|
|
|
|
|
|
|
|
|
|
|
Settlement and curtailment of liability
|
(
|
)
|
|
|
(
|
)
|
|
|
(
|
)
|
|
|
|
Actuarial (gain) loss
|
|
|
(
|
)
|
(
|
)
|
(
|
)
|
|
|
(
|
)
|
|
Foreign exchange translation adjustment
|
|
|
|
|
(
|
)
|
|
|
|
|
|
|
|
Projected benefit obligation at end of year
|
|
|
|
|
|
|
|
|
|
|
|
|
|
Change in plan assets
|
||||||||||||
|
Fair value of plan assets at beginning of year
|
|
|
|
|
|
|
|
|
|
|
|
|
|
Actual return on plan assets
|
|
|
|
|
(
|
)
|
|
|
|
|
|
|
|
Employer contribution
|
|
|
|
|
|
|
|
|
|
|
|
|
|
Plan settlement
|
(
|
)
|
|
|
(
|
)
|
|
|
(
|
)
|
|
|
|
Benefits paid
|
(
|
)
|
(
|
)
|
(
|
)
|
(
|
)
|
(
|
)
|
(
|
)
|
|
Foreign exchange translation adjustment
|
|
|
|
|
(
|
)
|
|
|
|
|
|
|
|
Fair value of plan assets at end of year
|
|
|
|
|
|
|
|
|
|
|
|
|
|
Amounts recognized in the consolidated balance sheets consist of:
|
||||||||||||
|
Prepaid benefit cost included in other assets
|
|
|
|
|
|
|
|
|
|
|
|
|
|
Accrued pension benefit cost included in employee benefit plans liability
|
|
|
(
|
)
|
|
|
(
|
)
|
(
|
)
|
(
|
)
|
|
Surplus (deficit) of plan assets over projected benefit obligation at measurement date
|
|
|
(
|
)
|
|
|
(
|
)
|
|
|
(
|
)
|
F- 37
The Bank of N.T. Butterfield & Son Limited
Notes to the Consolidated Financial Statements (continued)
(In thousands of US dollars, unless otherwise stated)
|
Year ended
|
|||||||||||||
|
December 31, 2019
|
December 31, 2018
|
December 31, 2017
|
|||||||||||
|
Pension
plans |
|
Post-
retirement medical benefit plan |
|
Pension
plans |
|
Post-
retirement medical benefit plan |
|
Pension
plans |
|
Post-
retirement medical benefit plan |
|
||
|
Amounts recognized in accumulated other comprehensive loss consist of:
|
|||||||||||||
|
Net actuarial gain (loss), excluding deferred taxes
|
(
|
)
|
(
|
)
|
(
|
)
|
(
|
)
|
(
|
)
|
(
|
)
|
|
|
Net prior service credit (cost)
|
(
|
)
|
(
|
)
|
(
|
)
|
(
|
)
|
|
|
(
|
)
|
|
|
Deferred income taxes assets (liabilities)
|
|
|
|
|
|
|
|
|
|
|
|
|
|
|
Net amount recognized in accumulated other comprehensive loss
|
(
|
)
|
(
|
)
|
(
|
)
|
(
|
)
|
(
|
)
|
(
|
)
|
|
|
Annual Benefit Expense
|
|||||||||||||
|
Expense component
|
Line item in the consolidated statements of operations
|
||||||||||||
|
Service cost
|
Salaries and other employee benefits
|
|
|
|
|
|
|
|
|
|
|
|
|
|
Interest cost
|
Non-service employee benefits expense
|
|
|
|
|
|
|
|
|
|
|
|
|
|
Expected return on plan assets
|
Non-service employee benefits expense
|
(
|
)
|
|
|
(
|
)
|
|
|
(
|
)
|
|
|
|
Amortization of net actuarial (gains) losses
|
Non-service employee benefits expense
|
|
|
|
|
|
|
|
|
|
|
|
|
|
Amortization of prior service (credit) loss
|
Non-service employee benefits expense
|
|
|
|
|
|
|
|
|
|
|
(
|
)
|
|
(Gain) loss on settlement
|
Net other gains (losses) / Non-service employee benefits expense
|
|
|
|
|
|
|
|
|
|
|
|
|
|
Defined benefit (income) expense
|
|
|
|
|
|
|
|
|
|
|
|
|
|
|
Defined contribution expense
|
|
|
|
|
|
|
|
|
|
|
|
|
|
|
Total benefit (income) expense
|
|
|
|
|
|
|
|
|
|
|
|
|
|
|
The components of benefit expense (income) other than the service cost component are included in the line item non-service employee benefits expense in the consolidated statements of operations.
|
|||||||||||||
|
Other Changes Recognized in Other Comprehensive Income (Loss)
|
|||||||||||||
|
Net gain (loss) arising during the year
|
(
|
)
|
|
|
(
|
)
|
|
|
|
|
|
|
|
|
Prior service credit (cost) arising during the year
|
|
|
(
|
)
|
(
|
)
|
|
|
|
|
|
|
|
|
Amortization of net actuarial (gains) losses
|
|
|
|
|
|
|
|
|
|
|
|
|
|
|
Amortization of prior service (credit) cost
|
|
|
|
|
|
|
|
|
|
|
(
|
)
|
|
|
Change in deferred taxes
|
|
|
|
|
(
|
)
|
|
|
(
|
)
|
|
|
|
|
Foreign exchange adjustment
|
(
|
)
|
|
|
|
|
|
|
(
|
)
|
|
|
|
|
Total changes recognized in other comprehensive income (loss)
|
(
|
)
|
|
|
(
|
)
|
|
|
|
|
|
|
|
To develop the expected long-term rate of return on the plan assets assumption for each plan, the Bank considered the historical returns and the future expectations for returns for each asset class, as well as the target asset allocations of the assets. The weighted average discount rate used to determine benefit obligations at the end of the year is derived from interest rates on high quality corporate bonds with maturities that match the expected benefit payments.
F- 38
The Bank of N.T. Butterfield & Son Limited
Notes to the Consolidated Financial Statements (continued)
(In thousands of US dollars, unless otherwise stated)
Actuarial Assumptions
|
Year ended
|
||||||||||||
|
December 31, 2019
|
December 31, 2018
|
December 31, 2017
|
||||||||||
|
Pension
plans
|
|
Post-
retirement
medical
benefit plan
|
|
Pension
plans
|
|
Post-
retirement
medical
benefit plan
|
|
Pension
plans |
|
Post-
retirement medical benefit plan |
|
|
|
Actuarial assumptions used to determine annual benefit expense
|
||||||||||||
|
Weighted average discount rate
|
|
%
|
|
%
|
|
%
|
|
%
|
|
%
|
|
%
|
|
Weighted average rate of compensation increases
1
|
|
%
|
N/A
|
|
|
%
|
N/A
|
|
|
%
|
N/A
|
|
|
Weighted average expected long-term rate of return on plan assets
|
|
%
|
N/A
|
|
|
%
|
N/A
|
|
|
%
|
N/A
|
|
|
Weighted average annual medical cost increase rate
|
N/A
|
|
7.5% to 4.5% in 2035
|
|
N/A
|
|
7.7% to 4.5% in 2035
|
|
N/A
|
|
7.8% to 4.5% in 2035
|
|
|
Actuarial assumptions used to determine benefit obligations at end of year
|
||||||||||||
|
Weighted average discount rate
|
|
%
|
|
%
|
|
%
|
|
%
|
|
%
|
|
%
|
|
Weighted average rate of compensation increases
1
|
|
%
|
N/A
|
|
|
%
|
N/A
|
|
|
%
|
N/A
|
|
|
Weighted average annual medical cost increase rate
|
N/A
|
|
7.3% to 4.5% in 2040
|
|
N/A
|
|
7.5% to 4.5% in 2035
|
|
N/A
|
|
7.7% to 4.5% in 2035
|
|
|
1
Only the UK subsidiary plan is impacted by potential future compensation increases.
|
||||||||||||
Investments Policies and Strategies
The pension plans’ assets are managed according to each plan's investment policy statement, which outlines the purpose of the plan, statement of objectives and guidelines and investment policy. The asset allocation is diversified and any use of derivatives is limited to hedging purposes only.
|
December 31, 2019
|
December 31, 2018
|
|||||||
|
Weighted average actual and target asset allocations of the pension plans by asset category
|
Actual
allocation
|
|
Target
allocation
|
|
Actual
allocation
|
|
Target
allocation
|
|
|
Debt securities (including debt mutual funds)
|
|
%
|
|
%
|
|
%
|
|
%
|
|
Equity securities (including equity mutual funds)
|
|
%
|
|
%
|
|
%
|
|
%
|
|
Other
|
|
%
|
|
%
|
|
%
|
|
%
|
|
Total
|
|
%
|
|
%
|
|
%
|
|
%
|
Fair Value Measurements of Pension Plans' Assets
The following table presents the fair value of the plans' assets by category and level of inputs used in their respective fair value determination as described in Note 2: Significant accounting policies, except the level 3 security, for which the valuation determination is described following the below table:
|
December 31, 2019
|
December 31, 2018
|
|||||||||||||||
|
Fair value determination
|
Fair value determination
|
|||||||||||||||
|
Level 1
|
|
Level 2
|
|
Level 3
|
|
Total
fair value
|
|
Level 1
|
|
Level 2
|
|
Level 3
|
|
Total
fair value
|
|
|
|
US government and federal agencies
|
|
|
|
|
|
|
|
|
|
|
|
|
|
|
|
|
|
Non-US governments debt securities
|
|
|
|
|
|
|
|
|
|
|
|
|
|
|
|
|
|
Corporate debt securities
|
|
|
|
|
|
|
|
|
|
|
|
|
|
|
|
|
|
Equity securities and mutual funds
|
|
|
|
|
|
|
|
|
|
|
|
|
|
|
|
|
|
Other
|
|
|
|
|
|
|
|
|
|
|
|
|
|
|
|
|
|
Total fair value of plans' assets
|
|
|
|
|
|
|
|
|
|
|
|
|
|
|
|
|
The Level 3 assets consist of insured annuity policies covering the full pension benefits of certain plan members. The fair value of these policies is deemed equal to the actuarial value of the projected benefit obligation for the insured benefits. At
December 31, 2019
,
26.8
%
(
December 31, 2018
:
32.6
%
) of the assets of the pension plans were mutual funds and equity securities managed or administered by wholly-owned subsidiaries of the Bank. At
December 31, 2019
,
0.6
%
(
December 31, 2018
:
0.6
%
) of the plans' assets were invested in common shares of the Bank.
The investments of the pension funds are diversified across a range of asset classes and are diversified within each asset class. The assets are generally actively managed with the goal of adding some incremental value through security selection and asset allocation.
F- 39
The Bank of N.T. Butterfield & Son Limited
Notes to the Consolidated Financial Statements (continued)
(In thousands of US dollars, unless otherwise stated)
Estimated
2020
Bank contribution to and estimated benefit payments for the next ten years under the pension and post-retirement medical benefit plans are as follows:
|
Pension
plans
|
|
Post-
retirement
medical
benefit plan
|
|
|
|
Estimated Bank contributions for the full year ending December 31, 2020
|
|
|
|
|
|
Estimated benefit payments by year:
|
|
|
||
|
2020
|
|
|
|
|
|
2021
|
|
|
|
|
|
2022
|
|
|
|
|
|
2023
|
|
|
|
|
|
2024
|
|
|
|
|
|
2025-2029
|
|
|
|
|
Commitments
As at
December 31, 2019
, the Bank was committed to expenditures under contract for information technology services sourcing of
$
27.6
million
(
December 31, 2018
:
$
39.2
million
). The Bank funded its expenditures with its own resources and plans to fund those currently in progress with its own resources, which may be obtained through cash on hand, cash flows from operations and issuances of debt and equity securities.
The following table summarizes the Bank's commitments for sourcing, long-term leases and other agreements:
|
Year ending December 31
|
Sourcing
|
|
Other
|
|
Total
|
|
|
2020
|
|
|
|
|
|
|
|
2021
|
|
|
|
|
|
|
|
2022
|
|
|
|
|
|
|
|
2023
|
|
|
|
|
|
|
|
2024
|
|
|
|
|
|
|
|
2025 & thereafter
|
|
|
|
|
|
|
|
Total commitments
|
|
|
|
|
|
|
The Bank enters into contractual commitments to extend credit, normally with fixed expiration dates or termination clauses, at specified rates and for specific purposes. Substantially all of the Bank's commitments to extend credit are contingent upon customers maintaining specific credit standards at the time of loan funding. Management assesses the credit risk associated with certain commitments to extend credit in determining the level of the allowance for possible loan losses.
The Bank has a facility by
one
of its custodians, whereby the Bank may offer up to US
$
200
million
of standby letters of credit to its customers on a fully secured basis. Under the standard terms of the facility, the custodian has the right to set-off against securities held of
110
%
of the utilized facility. At
December 31, 2019
,
$
143.6
million
(
December 31, 2018
:
$
137.4
million
) of standby letters of credit were issued under this facility.
|
Outstanding unfunded commitments to extend credit
|
December 31, 2019
|
|
December 31, 2018
|
|
|
Commitments to extend credit
|
|
|
|
|
|
Documentary and commercial letters of credit
|
|
|
|
|
|
Total unfunded commitments to extend credit
|
|
|
|
|
Credit-Related Arrangements
Standby letters of credit and letters of guarantee are issued at the request of a Bank customer in order to secure the customer’s payment or performance obligations to a third party. These guarantees represent an irrevocable obligation of the Bank to pay the third party beneficiary upon presentation of the guarantee and satisfaction of the documentary requirements stipulated therein, without investigation as to the validity of the beneficiary’s claim against the customer. Generally, the term of the standby letters of credit does not exceed
one year
, while the term of the letters of guarantee does not exceed
four years
. The types and amounts of collateral security held by the Bank for these standby letters of credit and letters of guarantee is generally represented by deposits with the Bank or a charge over assets held in mutual funds.
The Bank considers the fees collected in connection with the issuance of standby letters of credit and letters of guarantee to be representative of the fair value of its obligation undertaken in issuing the guarantee. In accordance with applicable accounting standards related to guarantees, the Bank defers fees collected in connection with the issuance of standby letters of credit and letters of guarantee. The fees are then recognized in income proportionately over the life of the credit agreements.
The following table presents the outstanding financial guarantees. Collateral is shown at estimated market value less selling cost. Where the collateral is cash, it is shown gross including accrued income.
|
December 31, 2019
|
December 31, 2018
|
|||||||||||
|
Outstanding financial guarantees
|
Gross
|
|
Collateral
|
|
Net
|
|
Gross
|
|
Collateral
|
|
Net
|
|
|
Standby letters of credit
|
|
|
|
|
|
|
|
|
|
|
|
|
|
Letters of guarantee
|
|
|
|
|
|
|
|
|
|
|
|
|
|
Total
|
|
|
|
|
|
|
|
|
|
|
|
|
F- 40
The Bank of N.T. Butterfield & Son Limited
Notes to the Consolidated Financial Statements (continued)
(In thousands of US dollars, unless otherwise stated)
Repurchase agreements
The Bank utilizes repurchase agreements and resell agreements (reverse repurchase agreements) to manage liquidity. The risks of these transactions include changes in the fair value in the securities posted or received as collateral and other credit-related events. The Bank manages these risks by ensuring that the collaterals involved are appropriate and by monitoring the value of the securities posted or received as collateral on a daily basis.
As at
December 31, 2019
, the Bank had
13
open positions (
December 31, 2018
:
2
) in resell agreements with a remaining maturity of less than
30
days involving pools of mortgages issued by US federal agencies. The amortized cost of these resell agreements is
$
142.3
million
(
December 31, 2018
:
$
27.3
million
) and are included in securities purchased under agreement to resell on the consolidated balance sheets. As at
December 31, 2019
, there were
no
positions (
December 31, 2018
: no positions) which were offset on the balance sheet to arrive at the carrying value, and there was no collateral amount which was available to offset against the future settlement amount.
Legal Proceedings
There are actions and legal proceedings pending against the Bank and its subsidiaries which arose in the normal course of its business. Management, after reviewing all actions and proceedings pending against or involving the Bank and its subsidiaries, considers that the resolution of these matters would in the aggregate not be material to the consolidated financial position of the Bank, except as noted in the following paragraphs.
As publicly announced, in November 2013, the US Attorney's Office for the Southern District of New York applied for and secured the issuance of so-called John Doe Summonses to
six
US financial institutions with which the Bank had correspondent bank relationships. The Bank has been fully cooperating with the US authorities in their ongoing investigation. Specifically, the Bank has conducted an extensive review and account remediation exercise to determine the US tax compliance status of US person account holders. The review process and results have been shared with the US authorities.
Management believes that as at
December 31, 2019
, a provision of
$
5.5
million
(
December 31, 2018
:
$
5.5
million
), which has been recorded, is appropriate. As the investigation remains ongoing at this time, the timing and terms of the final resolution, including any fines or penalties, remain uncertain and the financial impact to the Bank could exceed the amount of the provision. In this regard, we note that the US authorities have not approved or commented on the adequacy or reasonableness of the estimate. The provision is included on the consolidated balance sheets under other liabilities.
Note
13
:
Leases
The Bank enters into operating lease agreements either as the lessee or the lessor, mostly for office and parking spaces as well as for small office equipment. The terms of the existing leases, including renewal options that are reasonably certain to be exercised, extend up to the year 2035. Certain lease payments will be adjusted during the related lease's term based on movements in the relevant consumer price index. Rental expense for premises leased on a long-term basis for the year ended December 31, 2018 amounted to
$
5.6
million
(December 31, 2017:
$
4.9
million
).
|
Year ended
|
|
|
|
December 31, 2019
|
|
|
|
Lease costs
|
||
|
Operating lease costs
|
|
|
|
Short-term lease costs
|
|
|
|
Sublease (income)
|
(
|
)
|
|
Total net lease cost
|
|
|
|
Operating lease income
|
|
|
|
Other information for the period
|
|
|
|
Right-of-use assets related to new operating lease liabilities
|
|
|
|
Operating cash flows from operating leases
|
|
|
|
Other information at end of period
|
As at December 31, 2019
|
|
|
Operating leases right-of-use assets (included in other assets on the balance sheets)
|
|
|
|
Operating lease liabilities (included in other liabilities on the balance sheets)
|
|
|
|
Weighted average remaining lease term for operating leases (in years)
|
|
|
|
Weighted average discount rate for operating leases
|
|
%
|
|
The following table summarizes the maturity analysis of the Bank's commitments for long-term leases as at December 31, 2019:
|
||
|
Year ending December 31
|
Operating Leases
|
|
|
2020
|
|
|
|
2021
|
|
|
|
2022
|
|
|
|
2023
|
|
|
|
2024
|
|
|
|
2025 & thereafter
|
|
|
|
Total commitments
|
|
|
|
Less: effect of discounting cash flows to their present value
|
(
|
)
|
|
Operating lease liabilities
|
|
|
F- 41
The Bank of N.T. Butterfield & Son Limited
Notes to the Consolidated Financial Statements (continued)
(In thousands of US dollars, unless otherwise stated)
During December 2015, the Bank agreed to commence an orderly wind-down of the deposit taking and investment management businesses in the United Kingdom jurisdiction in the Channel Islands and the UK segment as reflected in management segment reporting described in
Note 16: Segmented information
. In making this determination, the Bank considered the increasing regulatory pressure along with periods of negative profitability and made the determination that an orderly wind-down of the deposit taking and investment management businesses in the UK was prudent for Butterfield as a group. The orderly wind-down was largely completed by the end of 2016 with the change in business operations to mortgage lending services and the change in name from Butterfield Bank (UK) Limited to Butterfield Mortgages Limited. The amounts expensed shown in the following table were included in the consolidated statements of operations as restructuring costs under non-interest expenses.
Related to this orderly wind-down, it was determined that the core banking system utilized in the operations of the UK jurisdiction was impaired (included in premises, equipment and computer software on the consolidated balance sheets). This determination was based upon the realizable value of this software upon completion of the orderly wind-down and was expensed in the year ended December 31, 2015.
|
Total exit costs recognized
|
|
Total amounts paid
|
|
Exit cost liability
|
||||
|
Years 2015 - 2017
|
|
Years 2015 - 2017
|
|
As at December 31, 2019
|
|
As at December 31, 2018
|
|
|
|
Staff redundancy expenses
|
|
|
|
|
|
|
|
|
|
Professional services
|
|
|
|
|
|
|
|
|
|
Lease termination expenses
|
|
|
|
|
|
|
|
|
|
Other expenses
|
|
|
|
|
|
|
|
|
|
Total
|
|
|
|
|
|
|
|
|
|
Year ended
|
||||||
|
|
December 31, 2019
|
|
December 31, 2018
|
|
December 31, 2017
|
|
|
Contractual interest earned
|
|
|
|
|
|
|
|
|
||||||
|
Amortization
|
||||||
|
Amortization of fair value hedge
|
(
|
)
|
(
|
)
|
(
|
)
|
|
Amortization of loan origination fees (net of amortized costs)
|
|
|
|
|
|
|
|
Total loan interest income
|
|
|
|
|
|
|
|
|
||||||
|
Balance of unamortized fair value hedge included in loans as at year end
|
|
|
|
|
|
|
|
Balance of unamortized loan fees included in loans as at year end
|
|
|
|
|
|
|
The Bank is managed by the Group Chief Executive Officer (“CEO”) on a geographic basis. In 2017, the Bank presented
six
segments which included Bermuda, Cayman, Guernsey, Switzerland, The Bahamas and the UK. In 2018, the Bank reassessed the segment reporting as a result of acquisitions which were announced in 2017 and early 2018 and concluded on the following
three
geographic segments: Bermuda, Cayman, and Channel Islands and the UK. The Other segment is composed of several non-reportable operating segments that have been aggregated in accordance with GAAP. Each reportable segment has a managing director who reports to the Group CEO. The Group CEO and the segment managing director have final authority over resource allocation decisions and performance assessment.
The geographic segments reflect this management structure and the manner in which financial information is currently evaluated by the CEO. Segment results are determined based on the Bank's management reporting system, which assigns balance sheet and income statement items to each of the geographic segments. The process is designed around the Bank's organizational and management structure and, accordingly, the results derived are not necessarily comparable with similar information published by other financial institutions. A description of each reportable segment and table of financial results is presented below.
Accounting policies of the reportable segments are the same as those described in Note 2: Significant accounting policies. Transactions between segments are accounted for on an accrual basis and are all eliminated upon consolidation. The Bank generally does not allocate assets, revenues and expenses among its business segments, with the exception of certain corporate overhead expenses and loan participation revenue and expense. Loan participation revenue and expenses are allocated pro-rata based on the percentage of the total loan funded by each jurisdiction participating in the loan.
The
Bermuda
segment provides a full range of retail, commercial and private banking services. Retail services are offered to individuals and small to medium-sized businesses through
three
branch locations and through internet banking, mobile banking, automated teller machines (“ATMs”) and debit cards. Retail services include deposit services, consumer and mortgage lending, credit cards and personal insurance products. Commercial banking includes commercial lending and mortgages, cash management, payroll services, remote banking and letters of credit. Treasury services include money market and foreign exchange activities. Bermuda’s wealth management offering consists of Butterfield Asset Management Limited, which provides investment management, advisory and brokerage services and Butterfield Trust (Bermuda) Limited, which provides trust, estate, company management and custody services. Bermuda is also the location of the Bank's head offices and accordingly, retains the unallocated corporate overhead expenses.
The
Cayman
segment provides a comprehensive range of retail, commercial and private banking services. Retail services are offered to individuals and small to medium-sized businesses through
three
branch locations and through internet banking, mobile banking, ATMs and debit cards. Retail services include deposit services, consumer and mortgage lending, credit cards and property/auto insurance. Commercial banking includes commercial lending and mortgages, cash management, payroll services, remote
F- 42
The Bank of N.T. Butterfield & Son Limited
Notes to the Consolidated Financial Statements (continued)
(In thousands of US dollars, unless otherwise stated)
banking and letters of credit. Treasury services include money market and foreign exchange activities. Cayman’s wealth management offering comprises investment management, advisory and brokerage services and Butterfield Trust (Cayman) Limited, which provides trust, estate and company management.
The
Channel Islands and the UK
segment includes the jurisdictions of Guernsey and Jersey (Channel Islands), and the UK. In the Channel Islands, a broad range of services are provided to private clients and financial intermediaries including private banking and treasury services, internet banking, wealth management and fiduciary services. The UK jurisdiction provides mortgage services for high-value residential properties.
The
Other
segment includes the jurisdictions of The Bahamas, Canada, Mauritius, Singapore and Switzerland. These operating segments individually and collectively do not meet the quantitative threshold for segmented reporting and are therefore aggregated as non-reportable operating segments.
|
Total Assets by Segment
|
December 31, 2019
|
|
December 31, 2018
|
|
|
Bermuda
|
|
|
|
|
|
Cayman
|
|
|
|
|
|
Channel Islands and the UK
|
|
|
|
|
|
Other
|
|
|
|
|
|
Total assets before inter-segment eliminations
|
|
|
|
|
|
Less: inter-segment eliminations
|
(
|
)
|
(
|
)
|
|
Total
|
|
|
|
|
|
2019
|
Net interest income
|
Provision for credit recoveries (losses)
|
|
Non-interest
income
|
|
Net revenue
before gains
and losses
|
|
Gains and
losses
|
|
Total net revenue
|
|
Total
expenses
|
|
Net income
|
|
|||
|
Year ended December 31
|
Customer
|
|
Inter- segment
|
|
||||||||||||||
|
Bermuda
|
|
|
|
|
(
|
)
|
|
|
|
|
|
|
|
|
|
|
|
|
|
Cayman
|
|
|
|
|
|
|
|
|
|
|
|
|
|
|
|
|
|
|
|
Channel Islands and the UK
|
|
|
(
|
)
|
|
|
|
|
|
|
|
|
|
|
|
|
|
|
|
Other
|
|
|
|
|
|
|
|
|
|
|
(
|
)
|
|
|
|
|
(
|
)
|
|
Total before eliminations
|
|
|
|
|
|
|
|
|
|
|
|
|
|
|
|
|
|
|
|
Inter-segment eliminations
|
|
|
|
|
|
|
(
|
)
|
(
|
)
|
|
|
(
|
)
|
(
|
)
|
|
|
|
Total
|
|
|
|
|
|
|
|
|
|
|
|
|
|
|
|
|
|
|
|
2018
|
Net interest income
|
Provision for credit recoveries (losses)
|
|
Non-interest
income
|
|
Net revenue
before gains
and losses
|
|
Gains and
losses
|
|
Total net revenue
|
|
Total
expenses
|
|
Net income
|
|
|||
|
Year ended December 31
|
Customer
|
|
Inter- segment
|
|
||||||||||||||
|
Bermuda
|
|
|
|
|
|
|
|
|
|
|
(
|
)
|
|
|
|
|
|
|
|
Cayman
|
|
|
|
|
|
|
|
|
|
|
|
|
|
|
|
|
|
|
|
Channel Islands and the UK
|
|
|
(
|
)
|
(
|
)
|
|
|
|
|
(
|
)
|
|
|
|
|
|
|
|
Other
|
|
|
|
|
|
|
|
|
|
|
|
|
|
|
|
|
(
|
)
|
|
Total before eliminations
|
|
|
|
|
|
|
|
|
|
|
(
|
)
|
|
|
|
|
|
|
|
Inter-segment eliminations
|
|
|
|
|
|
|
(
|
)
|
(
|
)
|
|
|
(
|
)
|
(
|
)
|
|
|
|
Total
|
|
|
|
|
|
|
|
|
|
|
(
|
)
|
|
|
|
|
|
|
|
2017
|
Net interest income
|
Provision for credit recoveries (losses)
|
|
Non-interest
income
|
|
Net revenue
before gains and losses |
|
Gains and
losses
|
|
Total net revenue
|
|
Total
expenses
|
|
Net income
|
|
|||
|
Year ended December 31
|
Customer
|
|
Inter- segment
|
|
||||||||||||||
|
Bermuda
|
|
|
|
|
|
|
|
|
|
|
|
|
|
|
|
|
|
|
|
Cayman
|
|
|
|
|
|
|
|
|
|
|
(
|
)
|
|
|
|
|
|
|
|
Channel Islands and the UK
|
|
|
(
|
)
|
|
|
|
|
|
|
(
|
)
|
|
|
|
|
|
|
|
Other
|
|
|
|
|
|
|
|
|
|
|
|
|
|
|
|
|
|
|
|
Total before eliminations
|
|
|
|
|
|
|
|
|
|
|
|
|
|
|
|
|
|
|
|
Inter-segment eliminations
|
|
|
|
|
|
|
(
|
)
|
(
|
)
|
|
|
(
|
)
|
(
|
)
|
|
|
|
Total
|
|
|
|
|
|
|
|
|
|
|
|
|
|
|
|
|
|
|
F- 43
The Bank of N.T. Butterfield & Son Limited
Notes to the Consolidated Financial Statements (continued)
(In thousands of US dollars, unless otherwise stated)
The Bank uses derivatives for risk management purposes and to meet the needs of its customers. The Bank’s derivative contracts principally involve OTC transactions that are negotiated privately between the Bank and the counterparty to the contract and include interest rate contracts and foreign exchange contracts.
The Bank may pursue opportunities to reduce its exposure to credit losses on derivatives by entering into International Swaps and Derivatives Association master agreements (“ISDAs”). Depending on the nature of the derivative transaction, bilateral collateral arrangements may be used, as well. When the Bank is engaged in more than one outstanding derivative transaction with the same counterparty, and also has a legally enforceable master netting agreement with that counterparty, the net marked-to-market exposure represents the netting of the positive and negative exposures with that counterparty. When there is a net negative exposure, the Bank regards its credit exposure to the counterparty as being zero. The net marked-to-market position with a particular counterparty represents a reasonable measure of credit risk when there is a legally enforceable master netting agreement between the Bank and that counterparty.
Certain of these agreements contain credit risk-related contingent features in which the counterparty has the option to accelerate cash settlement of the Bank's net derivative liabilities with the counterparty in the event the Bank's credit rating falls below specified levels or the liabilities reach certain levels.
All derivative financial instruments, whether designated as hedges or not, are recorded on the consolidated balance sheets at fair value within other assets or other liabilities. These amounts include the effect of netting. The accounting for changes in the fair value of a derivative in the consolidated statements of operations depends on whether the contract has been designated as a hedge and qualifies for hedge accounting.
Notional Amounts
The notional amounts are not recorded as assets or liabilities on the consolidated balance sheets as they represent the face amount of the contract to which a rate or price is applied to determine the amount of cash flows to be exchanged. Notional amounts represent the volume of outstanding transactions and do not represent the potential gain or loss associated with market risk or credit risk of such instruments. Credit risk is limited to the positive fair value of the derivative instrument, which is significantly less than the notional amount.
Fair Value
Derivative instruments, in the absence of any compensating up-front cash payments, generally have no market value at inception. They obtain value, positive or negative, as relevant interest rates, exchange rates, equity or commodity prices or indices change. The potential for derivatives to increase or decrease in value as a result of the foregoing factors is generally referred to as market risk. Market risk is managed within clearly defined parameters as prescribed by senior management of the Bank. The fair value is defined as the profit or loss associated with replacing the derivative contracts at prevailing market prices.
Risk Management Derivatives
The Bank enters into interest derivative contracts as part of its overall interest rate risk management strategy to minimize significant unplanned fluctuations in earnings that are caused by interest rate volatility. The Bank’s goal is to manage interest rate sensitivity by modifying the repricing or maturity characteristics of certain consolidated balance sheet assets and liabilities so that movements in interest rates do not adversely affect the net interest margin. Derivative instruments that are used as part of the Bank’s risk management strategy include interest rate swap contracts that have indices related to the pricing of specific consolidated balance sheet assets and liabilities. Interest rate swaps generally involve the exchange of fixed and variable-rate interest payments between two parties, based on a common notional principal amount and maturity date. The Bank uses foreign currency derivative instruments to hedge its exposure to foreign currency risk. Certain hedging relationships are formally designated and qualify for hedge accounting as fair value or net investment hedges. Risk management derivatives comprise fair value hedges, net investment hedges and derivatives not formally designated as hedges as described below.
Fair value hedges
consist of designated interest rate swaps and are used to minimize the Bank's exposure to changes in the fair value of assets and liabilities due to movements in interest rates. The Bank previously entered into interest rate swaps to convert its fixed-rate long-term loans to floating-rate loans, and convert fixed-rate deposits to floating-rate deposits. During the year ended December 31, 2011, the Bank canceled its interest rate swaps designated as fair value hedges of loans receivable and therefore discontinued hedge accounting for these financial instruments. The fair value attributable to the hedged loans are accounted for prospectively and are being amortized to net income over the remaining life of each individual loan, which could extend to year 2029, using the effective interest method.
Net investment hedges
includes designated currency swaps and qualifying non-derivative instruments and are used to minimize the Bank’s exposure to variability in the foreign currency translation of net investments in foreign operations. The effective portion of changes in the fair value of the hedging instrument is recognized in AOCL consistent with the related translation gains and losses of the hedged net investment. For net investment hedges, all critical terms of the hedged item and the hedging instrument are matched at inception and on an ongoing basis to minimize the risk of hedge ineffectiveness.
For derivatives designated as net investment hedges, the Bank follows the method based on changes in spot exchange rates. Accordingly:
- The change in the fair value of the derivative instrument that is reported in AOCL (i.e., the effective portion) is determined by the changes in spot exchange rates.
- The change in the fair value of the derivative instrument attributable to changes in the difference between the forward rate and spot rate are excluded from the measure
of the hedge ineffectiveness and that difference is reported directly in the consolidated statements of operations under foreign exchange revenue.
Amounts recorded in AOCL are reclassified to earnings only upon the sale or substantial liquidation of an investment in a foreign subsidiary.
For foreign-currency-denominated debt instruments that are designated as hedges of net investments in foreign operations, the translation gain or loss that is recorded in AOCL is based on the spot exchange rate between the reporting currency of the Bank and the functional currency of the respective subsidiary. See
Note 24: Accumulated other comprehensive loss
for details on the amount recognized into AOCL during the current period from translation gain or loss.
Derivatives not formally designated as hedges
are entered into to manage the interest rate risk of fixed rate deposits and foreign exchange risk of the Bank's exposure. Changes in the fair value of derivative instruments not formally designated as hedges are recognized in foreign exchange income.
Client service derivatives
The Bank enters into foreign exchange contracts and interest rate caps primarily to meet the foreign exchange needs of its customers. Foreign exchange contracts are agreements to exchange specific amounts of currencies at a future date at a specified rate of exchange. Changes in the fair value of client services derivative instruments are recognized in foreign exchange income.
F- 44
The Bank of N.T. Butterfield & Son Limited
Notes to the Consolidated Financial Statements (continued)
(In thousands of US dollars, unless otherwise stated)
The following table shows the aggregate notional amounts of derivative contracts outstanding listed by type and respective gross positive or negative fair values and classified by those used for risk management (sub-classified as hedging and those that do not qualify for hedge accounting), client services and credit derivatives. Fair value of derivatives is recorded in the consolidated balance sheets in other assets and other liabilities. Gross positive fair values are recorded in other assets and gross negative fair values are recorded in other liabilities, subject to netting when master netting agreements are in place.
|
December 31, 2019
|
Derivative instrument
|
Number of contracts
|
|
Notional
amounts
|
|
Gross
positive
fair value
|
|
Gross
negative
fair value
|
|
Net
fair value
|
|
|
Risk management derivatives
|
|||||||||||
|
Net investment hedges
|
Currency swaps
|
|
|
|
|
|
|
(
|
)
|
(
|
)
|
|
Derivatives not formally designated as hedging instruments
|
Currency swaps
|
|
|
|
|
|
|
(
|
)
|
|
|
|
Subtotal risk management derivatives
|
|
|
|
|
|
(
|
)
|
|
|
||
|
Client services derivatives
|
Spot and forward foreign exchange
|
|
|
|
|
|
|
(
|
)
|
|
|
|
|
|||||||||||
|
Total derivative instruments
|
|
|
|
|
|
(
|
)
|
|
|
||
|
December 31, 2018
|
Derivative instrument
|
Number of contracts
|
|
Notional
amounts
|
|
Gross
positive
fair value
|
|
Gross
negative
fair value
|
|
Net
fair value
|
|
|
Risk management derivatives
|
|||||||||||
|
Net investment hedges
|
Currency swaps
|
|
|
|
|
|
|
(
|
)
|
(
|
)
|
|
Derivatives not formally designated as hedging instruments
|
Currency swaps
|
|
|
|
|
|
|
(
|
)
|
(
|
)
|
|
Subtotal risk management derivatives
|
|
|
|
|
|
(
|
)
|
(
|
)
|
||
|
Client services derivatives
|
Spot and forward foreign exchange
|
|
|
|
|
|
|
(
|
)
|
|
|
|
Total derivative instruments
|
|
|
|
|
|
(
|
)
|
|
|
||
In addition to the above, as at
December 31, 2019
foreign denominated deposits of
£
251.4
million
(
December 31, 2018
:
£
124.5
million
) and CHF
0.4
million
(
December 31, 2018
: CHF
0.4
million
) were designated as a hedge of foreign exchange risk associated with the net investment in foreign operations.
We manage derivative exposure by monitoring the credit risk associated with each counterparty using counterparty specific credit risk limits, using master netting arrangements where appropriate and obtaining collateral. The Bank elected to offset in the consolidated balance sheets certain gross derivative assets and liabilities subject to netting agreements.
The Bank also elected not to offset certain derivative assets or liabilities and all collaterals received or paid that the Bank or the counterparties could legally offset in the event of default. In the tables below, these positions are deducted from the net fair value presented in the consolidated balance sheets in order to present the net exposures. The collateral values presented in the following table are limited to the related net derivative asset or liability balance and, accordingly, do not include excess collateral received or paid.
F- 45
The Bank of N.T. Butterfield & Son Limited
Notes to the Consolidated Financial Statements (continued)
(In thousands of US dollars, unless otherwise stated)
|
Gross fair
value recognized |
|
Less: offset
applied
under master
netting
agreements
|
|
Net fair value
presented in the
consolidated
balance sheets
|
|
Less: positions not offset in the consolidated balance sheets
|
||||||
|
December 31, 2019
|
Gross fair value of derivatives
|
|
Cash collateral
received / paid
|
|
Net exposures
|
|
||||||
|
Derivative assets
|
||||||||||||
|
Spot and forward foreign exchange and currency swaps
|
|
|
(
|
)
|
|
|
|
|
(
|
)
|
|
|
|
|
||||||||||||
|
Derivative liabilities
|
||||||||||||
|
Spot and forward foreign exchange and currency swaps
|
|
|
(
|
)
|
|
|
|
|
(
|
)
|
|
|
|
Net positive fair value
|
|
|
||||||||||
|
Gross fair
value recognized |
|
Less: offset
applied
under master
netting
agreements
|
|
Net fair value
presented in the
consolidated
balance sheets
|
|
Less: positions not offset in the consolidated balance sheets
|
||||||
|
December 31, 2018
|
Gross fair value of derivatives
|
|
Cash collateral
received / paid
|
|
Net exposures
|
|
||||||
|
Derivative assets
|
||||||||||||
|
Spot and forward foreign exchange and currency swaps
|
|
|
(
|
)
|
|
|
|
|
(
|
)
|
|
|
|
|
||||||||||||
|
Derivative liabilities
|
||||||||||||
|
Spot and forward foreign exchange and currency swaps
|
|
|
(
|
)
|
|
|
|
|
(
|
)
|
|
|
|
Net positive fair value
|
|
|
||||||||||
The following tables show the location and amount of gains (losses) recorded in either the consolidated statements of operations or consolidated statements of comprehensive income on derivative instruments outstanding.
|
Year ended
|
|||||||
|
Derivative instrument
|
Consolidated statements of operations line item
|
December 31, 2019
|
|
December 31, 2018
|
|
December 31, 2017
|
|
|
Spot and forward foreign exchange
|
Foreign exchange revenue
|
(
|
)
|
(
|
)
|
|
|
|
Currency swaps, not designated as hedge
|
Foreign exchange revenue
|
|
|
|
|
(
|
)
|
|
Currency swaps - net investment hedge
|
Foreign exchange revenue
|
|
|
|
|
(
|
)
|
|
Total net gains (losses) recognized in net income
|
|
|
|
|
(
|
)
|
|
|
Derivative instrument
|
Consolidated statements of comprehensive income line item
|
December 31, 2019
|
|
December 31, 2018
|
|
December 31, 2017
|
|
|
Currency swaps - net investment hedge
|
Net change in unrealized gains and (losses) on translation of net investment in foreign operations
|
(
|
)
|
|
|
(
|
)
|
|
Total net gains (losses) recognized in comprehensive income
|
(
|
)
|
|
|
(
|
)
|
|
The following table presents the financial assets and liabilities that are measured at fair value on a recurring basis. Management classifies these items based on the type of inputs used in their respective fair value determination as described in
Note 2: Significant accounting policies
.
Management reviews the price of each security monthly, comparing market values to expectations and to the prior month’s price. Management's expectations are based upon knowledge of prevailing market conditions and developments relating to specific issuers and/or asset classes held in the investment portfolio. Where there are unusual or significant price movements, or where a certain asset class has performed out-of-line with expectations, the matter is reviewed by management.
Financial instruments in Level 1 include actively traded redeemable mutual funds.
Financial instruments in Level 2 include government debt securities, corporate debt securities, mortgage-backed securities and other asset-backed securities, forward foreign exchange contracts and mutual funds not actively traded.
Financial instruments in Level 3 include asset-backed securities for which the market is relatively illiquid and for which information about actual trading prices is not readily available.
There were no transfers between Level 1 and Level 2 or Level 2 and Level 3 during the year ended
December 31, 2019
and the year ended
December 31, 2018
.
F- 46
The Bank of N.T. Butterfield & Son Limited
Notes to the Consolidated Financial Statements (continued)
(In thousands of US dollars, unless otherwise stated)
|
December 31, 2019
|
December 31, 2018
|
|||||||||||||||
|
Fair value
|
Total carrying
amount /
fair value
|
|
Fair value
|
Total carrying
amount /
fair value
|
|
|||||||||||
|
Level 1
|
|
Level 2
|
|
Level 3
|
|
Level 1
|
|
Level 2
|
|
Level 3
|
|
|||||
|
Items that are recognized at fair value on a recurring basis:
|
||||||||||||||||
|
Financial assets
|
||||||||||||||||
|
Equity securities
|
||||||||||||||||
|
Mutual funds
|
|
|
|
|
|
|
|
|
|
|
|
|
|
|
|
|
|
Total equity securities
|
|
|
|
|
|
|
|
|
|
|
|
|
|
|
|
|
|
|
||||||||||||||||
|
Available-for-sale investments
|
||||||||||||||||
|
US government and federal agencies
|
|
|
|
|
|
|
|
|
|
|
|
|
|
|
|
|
|
Non-US governments debt securities
|
|
|
|
|
|
|
|
|
|
|
|
|
|
|
|
|
|
Corporate debt securities
|
|
|
|
|
|
|
|
|
|
|
|
|
|
|
|
|
|
Asset-backed securities - Student loans
|
|
|
|
|
|
|
|
|
|
|
|
|
|
|
|
|
|
Commercial mortgage-backed securities
|
|
|
|
|
|
|
|
|
|
|
|
|
|
|
|
|
|
Residential mortgage-backed securities
|
|
|
|
|
|
|
|
|
|
|
|
|
|
|
|
|
|
Total available-for-sale
|
|
|
|
|
|
|
|
|
|
|
|
|
|
|
|
|
|
|
||||||||||||||||
|
Other assets - Derivatives
|
|
|
|
|
|
|
|
|
|
|
|
|
|
|
|
|
|
|
||||||||||||||||
|
Financial liabilities
|
||||||||||||||||
|
Other liabilities - Derivatives
|
|
|
|
|
|
|
|
|
|
|
|
|
|
|
|
|
Level 3 Reconciliation
The Level 3 financial instruments, shown as Asset-backed securities - Student loans in the above table, is a federal family education loan program guaranteed student loan security and is valued using a non-binding broker quote. The fair value provided by the broker is based on the last trading price of similar securities but as the market for the security is illiquid, a Level 2 classification is not supported.
The table below summarizes realized and unrealized gains and losses for Level 3 assets still held at the reporting date.
|
December 31, 2019
|
|
December 31, 2018
|
|
December 31, 2017
|
|
|
|
Available-
for-sale investments
|
|
Available-
for-sale investments
|
|
Available-
for-sale investments |
|
|
|
Carrying amount at beginning of year
|
|
|
|
|
|
|
|
Realized and unrealized gains (losses) recognized in other comprehensive income
|
|
|
|
|
|
|
|
Carrying amount at end of year
|
|
|
|
|
|
|
F- 47
The Bank of N.T. Butterfield & Son Limited
Notes to the Consolidated Financial Statements (continued)
(In thousands of US dollars, unless otherwise stated)
|
Items Other Than Those Recognized at Fair Value on a Recurring Basis:
|
|||||||||||||
|
December 31, 2019
|
December 31, 2018
|
||||||||||||
|
Level
|
Carrying
amount
|
|
Fair
value
|
|
Appreciation /
(depreciation)
|
|
Carrying
amount
|
|
Fair
value
|
|
Appreciation /
(depreciation)
|
|
|
|
Financial assets
|
|||||||||||||
|
Cash due from banks
|
Level 1
|
|
|
|
|
|
|
|
|
|
|
|
|
|
Securities purchased under agreements to resel
l
|
Level 2
|
|
|
|
|
|
|
|
|
|
|
|
|
|
Short-term investments
|
Level 1
|
|
|
|
|
|
|
|
|
|
|
|
|
|
Investments held-to-maturity
|
Level 2
|
|
|
|
|
|
|
|
|
|
|
(
|
)
|
|
Loans, net of allowance for credit losses
|
Level 2
|
|
|
|
|
|
|
|
|
|
|
|
|
|
Other real estate owned¹
|
Level 2
|
|
|
|
|
|
|
|
|
|
|
|
|
|
Financial liabilities
|
|||||||||||||
|
Customer deposits
(excluding demand deposits)
|
|||||||||||||
|
Term deposits
|
Level 2
|
|
|
|
|
(
|
)
|
|
|
|
|
(
|
)
|
|
Deposits from banks
|
Level 2
|
|
|
|
|
|
|
|
|
|
|
|
|
|
Long-term debt
|
Level 2
|
|
|
|
|
(
|
)
|
|
|
|
|
(
|
)
|
¹ The current carrying value of OREO is adjusted to fair value only when there is devaluation below carrying value.
The following tables set out the assets, liabilities and shareholders' equity on the date of the earlier of contractual maturity, expected maturity or repricing date. Use of these tables to derive information about the Bank’s interest rate risk position is limited by the fact that customers may choose to terminate their financial instruments at a date earlier than the contractual maturity or repricing date. Examples of this include fixed-rate mortgages, which are shown at contractual maturity but which may pre-pay earlier, and certain term deposits, which are shown at contractual maturity but which may be withdrawn before their contractual maturity subject to prepayment penalties. Investments are shown based on remaining contractual maturities. The remaining contractual principal maturities for mortgage-backed securities (primarily US government agencies) do not consider prepayments. Remaining expected maturities will differ from contractual maturities because borrowers may have the right to prepay obligations before the underlying mortgages mature. In 2019, the classification of certain interest bearing and non-interest bearing cash items was revised. The 2018 table below was revised to conform to current year presentation.
F- 48
The Bank of N.T. Butterfield & Son Limited
Notes to the Consolidated Financial Statements (continued)
(In thousands of US dollars, unless otherwise stated)
|
December 31, 2019
|
Earlier of contractual maturity or repricing date
|
|||||||||||||
|
(in $ millions)
|
Within 3
months
|
|
3 to 6
months
|
|
6 to 12
months
|
|
1 to 5
years
|
|
After
5 years
|
|
Non-interest
bearing funds
|
|
Total
|
|
|
Assets
|
||||||||||||||
|
Cash due from banks
|
|
|
|
|
|
|
|
|
|
|
|
|
|
|
|
Securities purchased under agreement to resell
|
|
|
|
|
|
|
|
|
|
|
|
|
|
|
|
Short-term investments
|
|
|
|
|
|
|
|
|
|
|
|
|
|
|
|
Investments
|
|
|
|
|
|
|
|
|
|
|
|
|
|
|
|
Loans
|
|
|
|
|
|
|
|
|
|
|
|
|
|
|
|
Other assets
|
|
|
|
|
|
|
|
|
|
|
|
|
|
|
|
Total assets
|
|
|
|
|
|
|
|
|
|
|
|
|
|
|
|
Liabilities and shareholders' equity
|
||||||||||||||
|
Shareholders’ equity
|
|
|
|
|
|
|
|
|
|
|
|
|
|
|
|
Demand deposits
|
|
|
|
|
|
|
|
|
|
|
|
|
|
|
|
Term deposits
|
|
|
|
|
|
|
|
|
|
|
|
|
|
|
|
Other liabilities
|
|
|
|
|
|
|
|
|
|
|
|
|
|
|
|
Long-term debt
|
|
|
|
|
|
|
|
|
|
|
|
|
|
|
|
Total liabilities and shareholders' equity
|
|
|
|
|
|
|
|
|
|
|
|
|
|
|
|
Interest rate sensitivity gap
|
(
|
)
|
|
|
(
|
)
|
|
|
|
|
(
|
)
|
|
|
|
Cumulative interest rate sensitivity gap
|
(
|
)
|
(
|
)
|
(
|
)
|
(
|
)
|
|
|
|
|
|
|
|
December 31, 2018
|
Earlier of contractual maturity or repricing date
|
|||||||||||||
|
(in $ millions)
|
Within 3
months
|
|
3 to 6
months
|
|
6 to 12
months
|
|
1 to 5
years
|
|
After
5 years
|
|
Non-interest
bearing funds
|
|
Total
|
|
|
Assets
|
||||||||||||||
|
Cash due from banks
|
|
|
|
|
|
|
|
|
|
|
|
|
|
|
|
Securities purchased under agreement to resell
|
|
|
|
|
|
|
|
|
|
|
|
|
|
|
|
Short-term investments
|
|
|
|
|
|
|
|
|
|
|
|
|
|
|
|
Investments
|
|
|
|
|
|
|
|
|
|
|
|
|
|
|
|
Loans
|
|
|
|
|
|
|
|
|
|
|
|
|
|
|
|
Other assets
|
|
|
|
|
|
|
|
|
|
|
|
|
|
|
|
Total assets
|
|
|
|
|
|
|
|
|
|
|
|
|
|
|
|
Liabilities and shareholders' equity
|
||||||||||||||
|
Shareholders’ equity
|
|
|
|
|
|
|
|
|
|
|
|
|
|
|
|
Demand deposits
|
|
|
|
|
|
|
|
|
|
|
|
|
|
|
|
Term deposits
|
|
|
|
|
|
|
|
|
|
|
|
|
|
|
|
Other liabilities
|
|
|
|
|
|
|
|
|
|
|
|
|
|
|
|
Long-term debt
|
|
|
|
|
|
|
|
|
|
|
|
|
|
|
|
Total liabilities and shareholders' equity
|
|
|
|
|
|
|
|
|
|
|
|
|
|
|
|
Interest rate sensitivity gap
|
(
|
)
|
|
|
(
|
)
|
|
|
|
|
(
|
)
|
|
|
|
Cumulative interest rate sensitivity gap
|
(
|
)
|
(
|
)
|
(
|
)
|
(
|
)
|
|
|
|
|
|
|
F- 49
The Bank of N.T. Butterfield & Son Limited
Notes to the Consolidated Financial Statements (continued)
(In thousands of US dollars, unless otherwise stated)
On May 28, 2003, the Bank issued US
$
125
million
of Subordinated Lower Tier II capital notes. The notes were issued at par and in
two
tranches, namely US
$
78
million
in Series A notes due 2013 and US
$
47
million
in Series B notes due 2018. The issuance was by way of private placement with US institutional investors. The notes were listed on the BSX in the specialist debt securities category. Part of the proceeds of the issue were used to repay the entire amount of the US
$
75
million
outstanding subordinated notes redeemed in July 2003. The notes issued under Series A paid a fixed coupon of
3.94
%
until May 27, 2008 when it was redeemed in whole by the Bank. The Series B notes paid a fixed coupon of
5.15
%
until May 27, 2013 when they became redeemable in whole at the Bank’s option. The Series B notes were priced at a spread of
1.35
%
over the 10-year US Treasury yield. In May 2018, the Bank fully redeemed the 2003 issuance Series B for its nominal value of
$
47
million
.
On June 27, 2005, the Bank issued US
$
150
million
of Subordinated Lower Tier II capital notes. The notes were issued at par in
two
tranches, namely US
$
90
million
in Series A notes due 2015 and US
$
60
million
in Series B notes due 2020. The issuance was by way of private placement with US institutional investors. The notes are listed on the BSX in the specialist debt securities category. The notes issued under Series A paid a fixed coupon of
4.81
%
until July 2, 2010 after which the coupon rate became floating and the principal became redeemable in whole at the Bank's option. The Series B notes paid a fixed coupon of
5.11
%
until July 2, 2015 when they also became redeemable in whole at the Bank’s option. The Series A notes were priced at a spread of
1.00
%
over the five-year US Treasury yield and the Series B notes were priced at a spread of
1.10
%
over the 10-year US Treasury yield. During September 2011, the Bank repurchased a portion of the outstanding
5.11
%
2005 Series B Subordinated notes (“the Note”). The face value of the portion of the Note repurchased was
$
15
million
and the purchase price paid for the repurchase was
$
13.875
million
, which realized a gain of
$
1.125
million
. During January 2014, the Bank fully redeemed the 2005 issuance Series A subordinated debt for its nominal value of
$
90
million
.
On May 27, 2008, the Bank issued US
$
78
million
of Subordinated Lower Tier II capital notes. The notes were issued at par and in
two
tranches, namely US
$
53
million
in Series A notes due 2018 and US
$
25
million
in Series B notes due 2023. The issuance was by way of private placement with US institutional investors. The notes are listed on the BSX in the specialist debt securities category. The proceeds of the issue were used to repay the entire amount of the US
$
78
million
outstanding subordinated notes redeemed in May 2008. The notes issued under Series A paid a fixed coupon of
7.59
%
until May 27, 2013 when they became redeemable in whole at the option of the Bank. In May 2013, the Bank exercised its option to redeem the Series A note outstanding at face value. The Series B notes pay a fixed coupon of
8.44
%
until May 27, 2018 when they became redeemable in whole at the Bank’s option. The Series B notes were priced at a spread of
4.51
%
over the 10-year US Treasury yield.
On May 24, 2018, the Bank issued US
$
75
million
of Subordinated Lower Tier II capital notes. The notes were issued at par and due on June 1, 2028. The issuance was by way of a registered offering with US institutional investors. The notes are listed on the BSX in the specialist debt securities category. The proceeds of the issue were used, among other, to repay the entire amount of the US
$
47
million
outstanding subordinated notes series 2003-B. The notes issued pay a fixed coupon of
5.25
%
until June 1, 2023 when they become redeemable in whole at the option of the Bank. The notes were priced at a spread of
2.27
%
over the 10-year US Treasury yield. The Bank incurred
$
1.8
million
of costs directly related to the issuance of these capital notes. These costs have been capitalized directly against the carrying value of these notes on the balance sheet, and will be amortized over the life of the notes.
In the event the Bank would be in a position to redeem long-term debt, priority would go to the redemption of the higher interest-bearing Series, subject to availability relative to the earliest date the Series is redeemable at the Bank's option.
The following table presents the contractual maturity and interest payments for long-term debt issued by the Bank as at
December 31, 2019
. The interest payments are calculated until contractual maturity using the current London Inter-bank Offered Rate ("LIBOR") rates.
|
Interest payments until contractual maturity
|
||||||||||||||
|
Long-term debt
|
Earliest date redeemable at the Bank's option
|
Contractual maturity date
|
Interest rate until date redeemable
|
|
Interest rate from earliest date redeemable to contractual maturity
|
Principal Outstanding
|
|
Within
1 year
|
|
1 to 5
years
|
|
After
5 years
|
|
|
|
Bermuda
|
||||||||||||||
|
2005 issuance - Series B
|
July 2, 2015
|
July 2, 2020
|
|
%
|
3 months US$ LIBOR + 1.695%
|
|
|
|
|
|
|
|
|
|
|
2008 issuance - Series B
|
May 27, 2018
|
May 27, 2023
|
|
%
|
3 months US$ LIBOR + 4.929%
|
|
|
|
|
|
|
|
|
|
|
2018 issuance
|
June 1, 2023
|
June 1, 2028
|
|
%
|
3 months US$ LIBOR + 2.255%
|
|
|
|
|
|
|
|
|
|
|
Total
|
|
|
|
|
|
|
|
|
|
|
|
|
|
|
|
Unamortized debt issuance costs
|
(
|
)
|
||||||||||||
|
Long-term debt less unamortized debt issuance costs
|
|
|
||||||||||||
F- 50
The Bank of N.T. Butterfield & Son Limited
Notes to the Consolidated Financial Statements (continued)
(In thousands of US dollars, unless otherwise stated)
Earnings per share have been calculated using the weighted average number of common shares outstanding during the year after deduction of the shares held as treasury stock. The dilutive effect of share-based compensation plans was calculated using the treasury stock method, whereby the proceeds received from the exercise of share-based awards are assumed to be used to repurchase outstanding shares, using the average market price of the Bank’s shares for the year. Numbers of shares are expressed in thousands.
During the year ended
December 31, 2019
, options to purchase an average of
0.2
million
(
December 31, 2018
:
0.3
million
,
December 31, 2017
:
0.9
million
) common shares were outstanding. During the year ended
December 31, 2019
, the average number of outstanding awards of unvested common shares was
0.9
million
(
December 31, 2018
:
0.9
million
,
December 31, 2017
:
0.9
million
). Only awards for which the sum of 1) the expense that will be recognized in the future (i.e., the unrecognized expense) and 2) its exercise price, if any, was lower than the average market price of the Bank‘s common shares were considered dilutive and, therefore, included in the computation of diluted earnings per share. An award's unrecognized expense is also considered to be the proceeds the employees would need to pay to purchase accelerated vesting of the awards. For purposes of calculating dilution, such proceeds are assumed to be used by the Bank to buy back common shares at the average market price. The weighted-average number of outstanding awards, net of the assumed weighted-average number of common shares bought back, is included in the number of diluted participating shares.
|
Year ended
|
||||||
|
December 31, 2019
|
|
December 31, 2018
|
|
December 31, 2017
|
||
|
Net income
|
|
|
|
|
|
|
|
Basic Earnings Per Share
|
||||||
|
Weighted average number of common shares issued
|
|
|
|
|
|
|
|
Weighted average number of common shares held as treasury stock
|
(
|
)
|
(
|
)
|
|
|
|
Weighted average number of common shares (in thousands)
|
|
|
|
|
|
|
|
|
||||||
|
Basic Earnings Per Share
|
|
|
|
|
|
|
|
Diluted Earnings Per Share
|
||||||
|
Weighted average number of common shares
|
|
|
|
|
|
|
|
Net dilution impact related to options to purchase common shares
|
|
|
|
|
|
|
|
Net dilution impact related to awards of unvested common shares
|
|
|
|
|
|
|
|
Weighted average number of diluted common shares (in thousands)
|
|
|
|
|
|
|
|
|
||||||
|
Diluted Earnings Per Share
|
|
|
|
|
|
|
The common shares transferred to employees under all share-based payments are either taken from the Bank's common treasury shares or from newly issued shares. All share-based payments are settled by the ultimate parent company which, pursuant to Bermuda law, is not taxed on income. There are
no
income tax benefits in relation to the issue of such shares as a form of compensation.
In conjunction with the 2010 capital raise, the Board of Directors approved the 2010 Omnibus Plan (the "2010 Plan"). Under the 2010 Plan,
5
%
of the Bank’s fully diluted common shares, equal to approximately
2.95
million
shares, were initially available for grant to certain officers in the form of stock options or unvested shares awards. Both types of awards are detailed below. In 2012 and 2016, the Board of Directors approved an increase to the equivalent number of shares allowed to be granted under the 2010 Plan to
5.0
million
and
7.5
million
shares, respectively.
Stock Option Awards
1997 Stock Option Plan
Prior to the capital raise on March 2, 2010, the Bank granted stock options to employees and Directors of the Bank that entitle the holder to purchase
one
common share at a subscription price equal to the market price on the effective date of the grant. Generally, the options granted vest 25 percent at the end of each year for
four years
, however
as a result of the 2010 capital raise, the options granted under the Bank's 1997 Stock Option Plan to employees became fully vested and options awarded to certain executives were surrendered.
2010 Plan
Under the 2010 Plan, options are awarded to Bank employees and executive management, based on predetermined vesting conditions that entitle the holder to purchase
one
common share at a subscription price usually equal to the price of the most recently traded common share when granted and have a term of
10
years. The subscription price is reduced for all special dividends declared by the Bank. Stock option awards granted under the 2010 Plan vest based on
two
specific types of vesting conditions i.e., time and performance conditions, as detailed below:
Time vesting condition
In addition to the time vesting conditions noted above, the options will generally vest immediately:
• by reason of the employee’s death or disability,
• upon termination, by the Bank, of the holder’s employment, unless if in relation with the holder’s misconduct, or
• in limited circumstances and specifically approved by the Board, as stipulated in the holder’s employment contract.
F- 51
The Bank of N.T. Butterfield & Son Limited
Notes to the Consolidated Financial Statements (continued)
(In thousands of US dollars, unless otherwise stated)
In the event of the employee’s resignation, any unvested portion of the awards shall generally be forfeited and any vested portion of the options shall generally remain exercisable during the
90
-day period following the termination date or, if earlier, until the expiration date, and any vested portion of the options not exercised as of the expiration of such period shall be forfeited without any consideration therefore.
Performance vesting condition
|
Changes in Outstanding Stock Option Plans
|
||||||||||||||
|
Number of shares transferable upon exercise (thousands)
|
Weighted average
exercise price ($)
|
Weighted average
remaining life (years)
|
Aggregate
intrinsic value
($ thousands)
|
|
||||||||||
|
Year ended December 31, 2019
|
1997 Stock
Option Plan
|
|
2010 Stock
Option Plan
|
|
Total
|
|
1997 Stock
Option Plan
|
|
2010 Stock
Option Plan
|
|
1997 Stock
Option Plan
|
2010 Stock
Option Plan
|
||
|
Outstanding at beginning of year
|
|
|
|
|
|
|
|
|
|
|
|
|
|
|
|
Exercised
|
|
|
(
|
)
|
(
|
)
|
|
|
|
|
|
|
|
|
|
Expiration at end of plan life
|
(
|
)
|
|
|
(
|
)
|
|
|
|
|
|
|
|
|
|
Outstanding at end of year
|
|
|
|
|
|
|
|
|
|
|
|
|
|
|
|
Vested and exercisable at end of year
|
|
|
|
|
|
|
|
|
|
|
|
|
|
|
|
Number of shares transferable upon exercise (thousands)
|
Weighted average
exercise price ($)
|
Weighted average
remaining life (years)
|
Aggregate
intrinsic value
($ thousands)
|
|
||||||||||
|
Year ended December 31, 2018
|
1997 Stock
Option Plan
|
|
2010 Stock
Option Plan
|
|
Total
|
|
1997 Stock
Option Plan
|
|
2010 Stock
Option Plan
|
|
1997 Stock
Option Plan
|
2010 Stock
Option Plan
|
||
|
Outstanding at beginning of year
|
|
|
|
|
|
|
|
|
|
|
||||
|
Exercised
|
|
|
(
|
)
|
(
|
)
|
|
|
|
|
|
|
||
|
Forfeitures and cancellations
|
(
|
)
|
|
|
(
|
)
|
|
|
|
|
||||
|
Outstanding at end of year
|
|
|
|
|
|
|
|
|
|
|
|
|
|
|
|
Vested and exercisable at end of year
|
|
|
|
|
|
|
|
|
|
|
|
|
||
|
Number of shares transferable upon exercise (thousands)
|
Weighted average
exercise price ($)
|
Weighted average
remaining life (years)
|
Aggregate
intrinsic value
($ thousands)
|
|
||||||||||
|
Year ended December 31, 2017
|
1997 Stock
Option Plan
|
|
2010 Stock
Option Plan
|
|
Total
|
|
1997 Stock
Option Plan
|
|
2010 Stock
Option Plan
|
|
1997 Stock
Option Plan
|
2010 Stock
Option Plan
|
||
|
Outstanding at beginning of year
|
|
|
|
|
|
|
|
|
|
|
||||
|
Exercised
|
|
|
(
|
)
|
(
|
)
|
|
|
|
|
|
|
||
|
Forfeitures and cancellations
|
(
|
)
|
|
|
(
|
)
|
|
|
|
|
||||
|
Outstanding at end of year
|
|
|
|
|
|
|
|
|
|
|
|
|
|
|
|
Vested and exercisable at end of year
|
|
|
|
|
|
|
|
|
|
|
|
|
||
Share-Based Plans
Recipients of unvested share awards are entitled to the related common shares at no cost, at the time the award vests. Recipients of unvested shares may be entitled to receive additional unvested shares having a value equal to the cash dividends that would have been paid had the unvested shares been issued and vested. Such additional unvested shares granted as dividend equivalents are subject to the same vesting schedule and conditions as the underlying unvested shares.
Unvested shares subject only to the time vesting condition generally vest upon retirement, death, disability or upon termination, by the Bank, of the holder’s employment unless if in connection with the holder’s misconduct. Unvested shares subject to both time vesting and performance vesting conditions remain outstanding and unvested upon retirement and will vest only if the performance conditions are met. Unvested shares can also vest in limited circumstances and if specifically approved by the Board, as stipulated in the holder’s employment contract. In all other circumstances, unvested shares are generally forfeited when employment ends.
The grant date weighted average fair value of unvested share awards granted in the years ended
December 31, 2019
,
2018
and
2017
was
$
35.77
,
$
39.25
and
$
31.13
, respectively. The Bank expects to settle these awards by issuing new shares.
Employee Deferred Incentive Plan (“EDIP”)
Under the Bank’s EDIP Plan, shares are awarded to Bank employees and executive management based on the time vesting condition, which states that the shares will vest equally over a
three
-year period from the effective grant date.
Executive Long-Term Incentive Share Plan (“ELTIP”) - Years 2013 - 2019
The 2019 ELTIP was approved on January 14, 2019. Under the Bank’s ELTIP plans for the years 2013 through 2019, performance shares as well as time-vested shares were awarded to executive management. The performance shares will generally vest upon the achievement of certain performance targets in the
three
-year period from the effective grant date. The time-vested shares will generally vest over the
three
-year period from the effective grant date.
F- 52
The Bank of N.T. Butterfield & Son Limited
Notes to the Consolidated Financial Statements (continued)
(In thousands of US dollars, unless otherwise stated)
|
Changes in Outstanding ELTIP and EDIP awards (in thousands of shares transferable upon vesting)
|
||||||||||||
|
Year ended
|
||||||||||||
|
December 31, 2019
|
December 31, 2018
|
December 31, 2017
|
||||||||||
|
EDIP
|
|
ELTIP
|
|
EDIP
|
|
ELTIP
|
|
EDIP
|
|
ELTIP
|
|
|
|
Outstanding at beginning of year
|
|
|
|
|
|
|
|
|
|
|
|
|
|
Granted
|
|
|
|
|
|
|
|
|
|
|
|
|
|
Vested (fair value in 2019: $18.9 million, 2018: $16.0 million, 2017: $10.2 million)
|
(
|
)
|
(
|
)
|
(
|
)
|
(
|
)
|
(
|
)
|
(
|
)
|
|
Forfeitures (resignations, retirements, redundancies)
|
(
|
)
|
(
|
)
|
(
|
)
|
(
|
)
|
(
|
)
|
(
|
)
|
|
Outstanding at end of year
|
|
|
|
|
|
|
|
|
|
|
|
|
|
Share-based Compensation Cost Recognized in Net Income
|
||||||
|
Year ended
|
||||||
|
December 31, 2019
|
December 31, 2018
|
|
December 31, 2017
|
|||
|
EDIP and
ELTIP
|
|
EDIP and
ELTIP
|
|
EDIP and
ELTIP
|
|
|
|
Cost recognized in net income
|
|
|
|
|
|
|
|
Unrecognized Share-based Compensation Cost
|
December 31, 2019
|
December 31, 2018
|
||||
|
Unrecognized cost
|
Weighted average years over which it is expected to be recognized
|
Unrecognized cost
|
Weighted average years over which it is expected to be recognized
|
|||
|
EDIP
|
|
|
|
|
|
|
|
ELTIP
|
||||||
|
Time vesting shares
|
|
|
|
|
|
|
|
Performance vesting shares
|
|
|
|
|
|
|
|
Total unrecognized expense
|
|
|
|
|
||
The Bank initially introduced
two
share buy-back programs on May 1, 2012 as a means to improve shareholder liquidity and facilitate growth in share value. Each program was approved by the Board of Directors for a period of
12
months, in accordance with the regulations of the BSX. The BSX must be advised monthly of shares purchased pursuant to each program.
From time to time the Bank's associates, insiders and insiders' associates as defined by the BSX regulations may sell shares which may result in such shares being repurchased pursuant to each program, provided no more than any such person's pro-rata share of the listed securities is repurchased. Pursuant to the BSX regulations, all repurchases made by any issuer pursuant to a securities repurchase program must be made: (1) in the open market and not by private agreement; and (2) for a price not higher than the last independent trade for a round lot of the relevant class of securities.
Common Share Buy-Back Program
On February 15, 2018, the Board approved, with effect on April 1, 2018, the 2018 common share buy-back program, authorizing the purchase for treasury of up to
1.0
million
common shares.
On December 6, 2018, the Board approved, with effect from December 10, 2018 to February 29, 2020, a common share buy-back program, authorizing the purchase for treasury of up to
2.5
million
common shares.
On December 2, 2019, the Board approved a new
$
125
million
common share repurchase program, authorizing the purchase for treasury of up to
3.5
million
common shares through to February 28, 2021. The new program came into effect on December 20, 2019 following the completion of the previous program.
In the year ended December 31, 2019, the Bank retired
2,928,788
shares which were previously held as Treasury Shares resulting from these buybacks.
|
Year ended December 31
|
|||||||||||||
|
Common share buy-backs
|
2019
|
|
2018
|
|
2017
|
|
2016
|
|
2015
|
|
Total
|
|
|
|
Acquired number of shares (to the nearest 1)
|
|
|
|
|
|
|
|
|
|
|
|
|
|
|
Average cost per common share
|
|
|
|
|
|
|
|
|
|
|
|
|
|
|
Total cost (in US dollars)
|
|
|
|
|
|
|
|
|
|
|
|
|
|
F- 53
The Bank of N.T. Butterfield & Son Limited
Notes to the Consolidated Financial Statements (continued)
(In thousands of US dollars, unless otherwise stated)
|
Unrealized (losses)
on translation of net investment in foreign operations |
|
HTM
investments
|
|
Unrealized
gains (losses) on AFS investments |
|
Employee benefit plans
|
||||||||
|
Year ended December 31, 2019
|
Pension
|
|
Post-retirement
healthcare
|
|
Subtotal -
employee
benefits plans
|
|
Total AOCL
|
|
||||||
|
Balance at beginning of year
|
(
|
)
|
(
|
)
|
(
|
)
|
(
|
)
|
(
|
)
|
(
|
)
|
(
|
)
|
|
Other comprehensive income (loss), net of taxes
|
(
|
)
|
|
|
|
|
(
|
)
|
|
|
|
|
|
|
|
Balance at end of year
|
(
|
)
|
(
|
)
|
|
|
(
|
)
|
(
|
)
|
(
|
)
|
(
|
)
|
|
Unrealized (losses)
on translation of net investment in foreign operations |
|
HTM
investments
|
|
Unrealized
gains (losses) on AFS investments |
|
Employee benefit plans
|
||||||||
|
Year ended December 31, 2018
|
Pension
|
|
Post- retirement
healthcare
|
|
Subtotal -
employee
benefits plans
|
|
Total AOCL
|
|
||||||
|
Balance at beginning of year
|
(
|
)
|
(
|
)
|
(
|
)
|
(
|
)
|
(
|
)
|
(
|
)
|
(
|
)
|
|
Other comprehensive income (loss), net of taxes
|
(
|
)
|
|
|
(
|
)
|
(
|
)
|
|
|
|
|
(
|
)
|
|
Balance at end of year
|
(
|
)
|
(
|
)
|
(
|
)
|
(
|
)
|
(
|
)
|
(
|
)
|
(
|
)
|
|
Unrealized (losses)
on translation of net investment in foreign operations |
|
HTM
investments
|
|
Unrealized
gains (losses) on AFS investments |
|
Employee benefit plans
|
||||||||
|
Year ended December 31, 2017
|
Pension
|
|
Post- retirement
healthcare
|
|
Subtotal -
employee
benefits plans
|
|
Total AOCL
|
|
||||||
|
Balance at beginning of year
|
(
|
)
|
(
|
)
|
(
|
)
|
(
|
)
|
(
|
)
|
(
|
)
|
(
|
)
|
|
Other comprehensive income (loss), net of taxes
|
|
|
|
|
|
|
|
|
|
|
|
|
|
|
|
Balance at end of year
|
(
|
)
|
(
|
)
|
(
|
)
|
(
|
)
|
(
|
)
|
(
|
)
|
(
|
)
|
F- 54
The Bank of N.T. Butterfield & Son Limited
Notes to the Consolidated Financial Statements (continued)
(In thousands of US dollars, unless otherwise stated)
|
Net Change of AOCL Components
|
Year ended
|
||||||||
|
Line item in the consolidated statements of operations, if any
|
December 31, 2019
|
|
December 31, 2018
|
|
December 31, 2017
|
|
|||
|
Net unrealized gains (losses) on translation of net investment in foreign operations adjustments
|
|||||||||
|
Foreign currency translation adjustments
|
N/A
|
|
|
(
|
)
|
|
|
||
|
Gains (loss) on net investment hedge
|
N/A
|
(
|
)
|
|
|
(
|
)
|
||
|
Net change
|
(
|
)
|
(
|
)
|
|
|
|||
|
Held-to-maturity investment adjustments
|
|||||||||
|
Amortization of net gains (losses) to net income
|
Interest income on investments
|
|
|
|
|
|
|
||
|
Net change
|
|
|
|
|
|
|
|||
|
Available-for-sale investment adjustments
|
|||||||||
|
Gross unrealized gains (losses)
|
N/A
|
|
|
(
|
)
|
|
|
||
|
Transfer of realized (gains) losses to net income
|
Net realized gains (losses) on AFS investments
|
(
|
)
|
(
|
)
|
(
|
)
|
||
|
Net change
|
|
|
(
|
)
|
|
|
|||
|
Employee benefit plans adjustments
|
|||||||||
|
Defined benefit pension plan
|
|||||||||
|
Net actuarial gain (loss)
|
N/A
|
(
|
)
|
(
|
)
|
|
|
||
|
Net loss (gain) on settlement reclassified to net income
|
Net other gains (losses)
|
|
|
|
|
|
|
||
|
Prior service credit (cost) arising during the year
|
N/A
|
|
|
(
|
)
|
|
|
||
|
Amortization of net actuarial (gains) losses
|
Non-service employee benefits expense
|
|
|
|
|
|
|
||
|
Change in deferred taxes
|
N/A
|
|
|
(
|
)
|
(
|
)
|
||
|
Amortization of prior service (credit) cost
|
Non-service employee benefits expense
|
|
|
|
|
|
|
||
|
Foreign currency translation adjustments of related balances
|
N/A
|
(
|
)
|
|
|
(
|
)
|
||
|
Net change
|
(
|
)
|
(
|
)
|
|
|
|||
|
Post-retirement healthcare plan
|
|||||||||
|
Net actuarial gain (loss)
|
N/A
|
|
|
|
|
|
|
||
|
Prior service cost
|
N/A
|
(
|
)
|
|
|
—
|
|
||
|
Amortization of net actuarial (gains) losses
|
Non-service employee benefits expense
|
|
|
|
|
|
|
||
|
Amortization of prior service (credit) cost
|
Non-service employee benefits expense
|
|
|
|
|
(
|
)
|
||
|
Net change
|
|
|
|
|
|
|
|||
|
Other comprehensive income (loss), net of taxes
|
|
|
(
|
)
|
|
|
|||
Authorized Capital
On September 16, 2016, the Bank began trading on the New York Stock Exchange under the ticker symbol "NTB". The offering of
12,234,042
common shares consisted of
5,957,447
newly issued common shares sold by Butterfield and
6,276,595
common shares sold by certain selling shareholders, including
1,595,744
common shares sold by certain of the selling shareholders pursuant to the underwriters’ option to purchase additional shares, which was exercised in full prior to the closing.
On July 25, 2016, the Bank’s board of directors approved a consolidation of the existing common shares on the basis of a
10
to 1 ratio, subject to shareholder approval. As a result of this consolidation, effective September 6, 2016 upon shareholder approval, every
10
common shares of par value BM
$
0.01
were consolidated into 1 common share of par value BM
$
0.10
(the “Share Consolidation”).
In addition, as at September 6, 2016, the par value of each issued common share and each authorized but unissued common share was reduced from BM
$
0.10
to BM
$
0.01
and the authorized share capital of the Bank was correspondingly reduced from
2,000,000,000
common shares of par value BM
$
0.10
each,
6,000,000,000
non‑voting ordinary shares of par value BM
$
0.01
each,
110,200,001
preference shares of par value US
$
0.01
each and
50,000,000
preference shares of par value £
0.01
each to
2,000,000,000
common shares of par value BM
$
0.01
each,
6,000,000,000
non‑voting ordinary shares of par value BM
$
0.01
each,
110,200,001
preference shares of par value US
$
0.01
each and
50,000,000
preference shares of par value £
0.01
each, without any payment by the Bank to the holders of the voting ordinary shares in respect thereof (the “Reduction in Par Value” and together with the Share Consolidation, the “Reverse Share Split”). Immediately following the Reduction in Par Value, the Bank repurchased any and all fractions of common shares issued and outstanding from the holders thereof. Prior to the Reverse Share Split, the Bank’s total authorized share capital consisted of (i)
20
billion
common shares of par value BM
$
0.01
, (ii)
6
billion
non‑voting ordinary shares of par value BM
$
0.01
; (iii)
110,200,001
preference shares of par value US
$
0.01
and (iv)
50
million
preference shares of par value
£
0.01
.
F- 55
The Bank of N.T. Butterfield & Son Limited
Notes to the Consolidated Financial Statements (continued)
(In thousands of US dollars, unless otherwise stated)
Dividends Declared
During the year ended
December 31, 2019
, the Bank declared cash dividends of
$
1.76
(
December 31, 2018
:
$
1.52
,
December 31, 2017
:
$
1.28
) for each common share as of the related record dates. On
February 12, 2020
, the Board of Directors declared an interim dividend of
$
0.44
per common share to be paid on
March 11, 2020
to shareholders of record on
February 26, 2020
.
The Bank is required to comply with Section 54 of the Companies Act 1981 issued by the Government of Bermuda (the “Companies Act”) each time a dividend is declared or paid by the Bank and also obtain a letter of no objection from the BMA pursuant to the Banks and Deposit Companies Act 1999 for any dividends declared. The Bank has complied with Section 54 and has obtained BMA's letter of no objection for all dividends declared during the periods presented.
Regulatory Capital
Effective January 1, 2016, the Bank’s regulatory capital is determined in accordance with current Basel III guidelines as issued by the BMA. Basel III adopts Common Equity Tier 1 ("CET1") as the predominant form of regulatory capital with the CET1 ratio as a new metric. Basel III also adopts the new Leverage Ratio regime, which is calculated by dividing Tier 1 capital by an exposure measure. The Leverage Ratio Exposure Measure consists of total assets (excluding items deducted from Tier 1 capital) and certain off-balance sheet items converted into credit exposure equivalents as well as adjustments for derivatives to reflect credit risk and other risks.
The Bank is fully compliant with all regulatory capital requirements to which it is subject, and it maintains capital ratios in excess of regulatory minimums as at
December 31, 2019
and
2018
.
The following table sets forth the Bank's capital adequacy in accordance with the Basel III framework:
|
December 31, 2019
|
December 31, 2018
|
|||||||
|
Actual
|
|
Regulatory minimum
|
|
Actual
|
|
Regulatory minimum
|
|
|
|
Capital
|
||||||||
|
CET 1 capital
|
|
|
N/A
|
|
|
|
N/A
|
|
|
Tier 1 capital
|
|
|
N/A
|
|
|
|
N/A
|
|
|
Tier 2 capital
|
|
|
N/A
|
|
|
|
N/A
|
|
|
Total capital
|
|
|
N/A
|
|
|
|
N/A
|
|
|
Risk Weighted Assets
|
|
|
N/A
|
|
|
|
N/A
|
|
|
Leverage Ratio Exposure Measure
|
|
|
N/A
|
|
|
|
N/A
|
|
|
Capital Ratios (%)
|
||||||||
|
CET 1 capital
|
|
%
|
|
%
|
|
%
|
|
%
|
|
Tier 1 capital
|
|
%
|
|
%
|
|
%
|
|
%
|
|
Total capital
|
|
%
|
|
%
|
|
%
|
|
%
|
|
Leverage ratio
|
|
%
|
|
%
|
|
%
|
|
%
|
The Bank is incorporated in Bermuda, and pursuant to Bermuda law is not taxed on either income or capital gains. The Bank’s subsidiaries in the Cayman Islands and The Bahamas are not subject to any taxes in their respective jurisdictions on either income or capital gains under current law applicable in the respective jurisdictions. The Bank’s subsidiaries in Canada, the United Kingdom, Guernsey, Jersey, Switzerland, Singapore and Mauritius are subject to the tax laws of those jurisdictions.
For the years ended
December 31, 2019
,
2018
, and
2017
, the Bank did not record any unrecognized tax benefits or expenses and has no uncertain tax positions as at
December 31, 2019
,
2018
, and
2017
.
The Bank records income taxes based on the enacted tax laws and rates applicable in the relevant jurisdictions for the years ended
December 31, 2019
,
2018
, and
2017
. For the years ended
December 31, 2019
,
2018
, and
2017
, the Bank did not incur any interest or pay any penalties.
|
Year ended
|
||||||
|
Income taxes in consolidated statements of operations
|
December 31, 2019
|
|
December 31, 2018
|
|
December 31, 2017
|
|
|
Current tax expense
|
|
|
|
|
|
|
|
Deferred tax (recovery) expense
|
(
|
)
|
|
|
|
|
|
Total tax (benefit) expense
|
(
|
)
|
|
|
|
|
F- 56
The Bank of N.T. Butterfield & Son Limited
Notes to the Consolidated Financial Statements (continued)
(In thousands of US dollars, unless otherwise stated)
Reconciliation between the Effective Income Tax Rate and the Statutory Income Tax Rate
|
Year ended
|
||||||||||||
|
December 31, 2019
|
December 31, 2018
|
December 31, 2017
|
||||||||||
|
$
|
|
%
|
|
$
|
|
%
|
|
$
|
|
%
|
|
|
|
Income tax expense in international offices taxed at different rates
|
|
|
|
%
|
|
|
|
%
|
|
|
|
%
|
|
Prior year tax adjustments
|
|
|
|
%
|
(
|
)
|
|
%
|
(
|
)
|
|
%
|
|
Change in valuation allowance
|
(
|
)
|
(
|
)%
|
|
|
|
%
|
|
|
|
%
|
|
Other - net
|
|
|
|
%
|
|
|
|
%
|
|
|
|
%
|
|
Income tax (benefit) expense at effective tax rate
|
(
|
)
|
(
|
)%
|
|
|
|
%
|
|
|
|
%
|
|
Deferred income taxes
|
December 31, 2019
|
|
December 31, 2018
|
|
|
Deferred income tax asset
|
||||
|
Tax loss carried forward
|
|
|
|
|
|
Pension liability
|
|
|
|
|
|
Fixed assets
|
(
|
)
|
(
|
)
|
|
Allowance for compensated absence
|
|
|
|
|
|
Deferred income tax asset before valuation allowance
|
|
|
|
|
|
Less: valuation allowance
|
(
|
)
|
(
|
)
|
|
Net deferred income tax assets
|
|
|
|
|
|
|
||||
|
Deferred income tax liability
|
||||
|
Other
|
(
|
)
|
(
|
)
|
|
Net deferred income tax assets
|
|
|
|
|
Management assesses the available positive and negative evidence to evaluate if sufficient future taxable income will be generated to use the existing deferred tax assets. On the basis of this evaluation, as at
December 31, 2019
, a valuation allowance of
$
4.8
million
(
December 31, 2018
:
$
6.0
million
) has been recognized to record only the portion of the deferred tax asset that more likely than not will be realized. The amount of the deferred tax asset considered realizable, however, could be adjusted if estimates of future taxable income during the carry-forward period change, or if there are changes in the available positive and negative evidence.
The Bank has net taxable loss carry forwards related to the Bank’s international operations of approximately
$
48.1
million
(
December 31, 2018
:
$
34.4
million
). Of these losses available to carry forward,
$
45.6
million
(
December 31, 2018
:
$
34.4
million
) have an indefinite life.
Deutsche Bank’s Global Trust Solutions Acquisition
On March 29, 2018, the Bank concluded the acquisition of Deutsche Bank’s Global Trust Solutions (“GTS”) business, excluding its US operations, for net cash payments of
$
24.7
million
(composed of an initial cash payment of
$
30.2
million
followed by a refund of
$
5.5
million
on May 29, 2018). The refund was received based upon the movement in the number of clients in the GTS portfolio between the time the acquisition was agreed upon and the conclusion of the acquisition, together with an adjustment based upon the net asset values of the companies transferred. Butterfield has taken over the ongoing management and administration of the GTS portfolio, comprising approximately
1,000
trust structures for some
900
private clients. Butterfield has also offered positions to all employees who are fully dedicated to GTS in the Cayman Islands, Guernsey, Switzerland, Singapore and Mauritius. The acquisition was undertaken to enhance the Bank's market presence in the global trust service market.
The Bank incurred transaction expenses related to this acquisition in the amount of
$
3.8
million
, of which
$
1.9
million
were expensed during the year ended December 31, 2018 (including
$
1.0
million
of legal and professional fees) and
$
1.9
million
were expensed during the year ended December 31, 2017 (including
$
1.6
million
of legal and professional fees).
For the year ended December 31, 2018, the amount of revenues and net deficit relating to the acquired GTS operations that were not inextricably merged into the Bank’s operations were
$
6.5
million
and
$
2.9
million
respectively.
The assets acquired consist mainly of: customer relationships intangible assets, goodwill and accounts receivable. The liabilities assumed consist mainly of deferred revenues and accounts payable. Goodwill is made up of expected cash flows to be derived from new business and expected synergies resulting from leveraging existing support services and infrastructure within the Bank. The goodwill arising from the acquisition was allocated to reportable segments as per Note 9: Goodwill and other intangible assets.
F- 57
The Bank of N.T. Butterfield & Son Limited
Notes to the Consolidated Financial Statements (continued)
(In thousands of US dollars, unless otherwise stated)
|
As at March 29, 2018
|
|
|
|
Total consideration transferred
|
|
|
|
|
|
|
|
Assets acquired
|
|
|
|
Cash due from banks
|
|
|
|
Intangible assets (estimated useful life of 15 years)
|
|
|
|
Other assets
|
|
|
|
Total assets acquired
|
|
|
|
|
|
|
|
Liabilities acquired (included in Other liabilities on the balance sheet)
|
|
|
|
|
|
|
|
Excess purchase price (Goodwill)
|
|
|
Disclosure of the unaudited pro forma financial information to present a summary of the combined results of the Bank and GTS acquisition is impracticable for the year ended December 31, 2018. The disclosure is impracticable as the Bank does not have access to the complete historical revenue and expense data as it relates to GTS for the period preceding the acquisition.
Asset Acquisition
On February 15, 2018, the Bank announced that it had entered into an agreement to acquire Deutsche Bank's banking and custody business in the Cayman Islands, Guernsey and Jersey. During the year ended December 31, 2018, the Bank began to onboard certain customer deposits relating to the acquisition, and this activity was completed in the first half of 2019.
ABN AMRO (Channel Islands) Limited Acquisition
On April 25, 2019, the Bank announced that it entered into an agreement to acquire all the outstanding shares of ABN AMRO (Channel Islands) Limited (“ABN AMRO Channel Islands”), the Channel Islands-based banking subsidiary of ABN AMRO Bank N.V. via one of the Bank's subsidiaries, Butterfield Bank (Guernsey) Limited. ABN AMRO Channel Islands offers banking, investment management and custody products to three distinct client groups, including trusts, private clients, and funds.
This agreement is part of the Bank's strategy to grow through acquisitions in offshore markets where the Bank already has scale and expertise in order to create an organization with a widened and diversified offering.
On July 15, 2019, the transaction completed as planned and the aggregate purchase price of
£
160.7
million
(
$
201.1
million
) was paid in cash. During 2020, it is expected that ABN AMRO Channel Islands' business and employees will be integrated with the existing Butterfield Guernsey operations and operate under the Butterfield name. In addition to the figures noted below, on July 15, 2019, ABN AMRO Channel Islands had estimated clients' assets under management and custody of
$
4.7
billion
.
The fair value of the net assets acquired and allocation of purchase price is summarized as follows:
|
As at July 15, 2019
|
|
|
|
Total consideration transferred
|
|
|
|
Assets acquired
|
||
|
Cash due from banks
|
|
|
|
Loans
|
|
|
|
Intangible assets - Customer relationships
|
|
|
|
Other assets
|
|
|
|
Total assets acquired
|
|
|
|
Liabilities assumed
|
||
|
Deposits
|
(
|
)
|
|
Other liabilities
|
(
|
)
|
|
Total liabilities assumed
|
(
|
)
|
|
Excess purchase price (Goodwill)
|
|
|
The acquired customer relationships intangible assets have an estimated finite useful life of
15
years
.
The Bank incurred legal and professional transaction expenses related to this acquisition in the amount of
$
5.4
million
all of which were incurred and expensed during the
year ended December 31, 2019
.
For the period beginning on July 15, 2019 (i.e. acquisition date) to
December 31, 2019
, the amount of revenues and earnings relating to the acquired ABN AMRO Channel Islands operations that were not inextricably merged into the Bank’s operations were
$
13.7
million
and a net income of
$
1.5
million
respectively.
F- 58
The Bank of N.T. Butterfield & Son Limited
Notes to the Consolidated Financial Statements (continued)
(In thousands of US dollars, unless otherwise stated)
The following selected unaudited pro forma financial information has been provided to present a summary of the combined results of the Bank and the acquired ABN AMRO Channel Islands operations, assuming the transaction had been effected on January 1, 2018. The unaudited pro forma data is for informational purposes only and does not necessarily represent results that would have occurred if the transaction had taken place on the basis assumed above. The pro forma financial information has been prepared based on the actual results realized by ABN AMRO Channel Islands from January 1, 2017 to July 15, 2019, and results estimated at the time of acquisition.
|
Year ended
|
|||||
|
Unaudited pro forma financial information
|
December 31, 2019
|
|
December 31, 2018
|
|
|
|
Total net revenue
|
|
|
|
|
|
|
Total non-interest operating (expense)
|
(
|
)
|
(
|
)
|
|
|
Pro forma net income post business combination
|
|
|
|
|
|
Financing Transactions
Certain directors and executives of the Bank, companies in which they are principal owners and/or members of the board, and trusts in which they are involved, have loans and deposits with the Bank. Loans to directors were made in the ordinary course of business at normal credit terms, including interest rate and collateral requirements. Loans to executives may be eligible for preferential rates. All of these loans were considered performing loans as at
December 31, 2019
and
December 31, 2018
.
Loan balances with directors and executives of the Bank, companies in which they are principal owners and/or members of the board, and trusts in which they are involved were as follows:
|
Balance at December 31, 2017
|
|
|
|
Loans issued during the year
|
|
|
|
Loan repayments and the effect of changes in the composition of related parties
|
(
|
)
|
|
Balance at December 31, 2018
|
|
|
|
Loans issued during the year
|
|
|
|
Loan repayments and the effect of changes in the composition of related parties
|
(
|
)
|
|
Balance at December 31, 2019
|
|
|
|
Consolidated balance sheets
|
December 31, 2019
|
|
December 31, 2018
|
|
||
|
Deposits
|
|
|
|
|
||
|
Year ended December 31
|
||||||
|
Consolidated statement of operations
|
2019
|
2018
|
2017
|
|||
|
Interest and fees on loans
|
|
|
|
|
|
|
Certain affiliates of the Bank have loans and deposits with the Bank which were made and are maintained in the ordinary course of business on normal commercial terms. Balances with these parties were as follows:
|
Consolidated balance sheets
|
|
December 31, 2019
|
|
December 31, 2018
|
|
|
|
Loans
|
|
|
|
|
|
|
|
Deposits
|
|
|
|
|
|
|
|
|
|
|
|
|||
|
|
Year ended December 31
|
|||||
|
Consolidated statement of operations
|
2019
|
2018
|
2017
|
|||
|
Interest and fees on loans
|
|
|
|
|
|
|
|
Total non-interest expense
|
|
|
|
|
|
|
Capital Transaction
Up to February 28, 2017, investment partnerships associated with The Carlyle Group held approximately
14
%
of the Bank's equity voting power along with the right to designate
two
persons for nomination for election by the shareholders as members of the Bank’s Board of Directors. On February 28, 2017, as a result of a secondary public offering, the Carlyle Group sold their holdings in the Bank, and as a result, the investment agreement between the Bank and the Carlyle Group was terminated.
Investments
The Bank holds seed investments in several Butterfield mutual funds, which are managed by a wholly-owned subsidiary of the Bank.
These investments are included in equity securities at their fair value and are as follows:
|
Consolidated balance sheets
|
December 31, 2019
|
|
December 31, 2018
|
|
|
|
Equity securities
|
|||||
|
Fair value
|
|
|
|
|
|
|
Unrealized gain
|
|
|
|
|
|
F- 59
The Bank of N.T. Butterfield & Son Limited
Notes to the Consolidated Financial Statements
(In thousands of US dollars, unless otherwise stated)
As at
December 31, 2019
, several Butterfield mutual funds which are managed by a wholly owned subsidiary of the Bank, had loan balances and deposit balances held with the Bank. The Bank also earned asset management revenue and custody and other administration services revenue from funds managed by a wholly-owned subsidiary of the Bank and from directors and executives, companies in which they are principal owners and/or members of the board and trusts in which they are involved, as well as other income from other related parties.
|
Consolidated balance sheets
|
December 31, 2019
|
|
December 31, 2018
|
|
||
|
Loans
|
|
|
|
|
||
|
Deposits
|
|
|
|
|
||
|
Year ended December 31
|
||||||
|
Consolidated statement of operations
|
2019
|
2018
|
2017
|
|||
|
Asset management
|
|
|
|
|
|
|
|
Custody and other administration services
|
|
|
|
|
|
|
|
Other non-interest income
|
|
|
|
|
|
|
F- 60
The Bank of N.T. Butterfield & Son Limited
Notes to the Consolidated Financial Statements (continued)
(In thousands of US dollars, unless otherwise stated)
Condensed financial statements of the Bank of N.T. Butterfield & Son Limited (the ultimate parent company) without consolidation of its subsidiaries were as follows:
|
The Bank of N.T. Butterfield & Son Limited (parent company only)
|
||||
|
Condensed Balance Sheets
|
||||
|
(In thousands of US dollars)
|
||||
|
As at
|
||||
|
December 31, 2019
|
December 31, 2018
|
|||
|
Assets
|
||||
|
Cash and demand deposits with banks - Non-interest-bearing
|
|
|
|
|
|
Demand deposits with banks - Interest-bearing
|
|
|
|
|
|
Cash equivalents - Interest-bearing
|
|
|
|
|
|
Cash due from banks
|
|
|
|
|
|
Securities purchased under agreements to resel
l
|
|
|
|
|
|
Short-term investments
|
|
|
|
|
|
Investment in securities
|
||||
|
Equity securities at fair value
|
|
|
|
|
|
Available-for-sale
|
|
|
|
|
|
Held-to-maturity (fair value: $1,030,183 (2018: $1,076,979))
|
|
|
|
|
|
Total investment in securities
|
|
|
|
|
|
Net assets of subsidiaries - Banks
|
|
|
|
|
|
Net assets of subsidiaries - Non-banks
|
|
|
|
|
|
Loans to third parties, net of allowance for credit losses
|
|
|
|
|
|
Loans to subsidiaries - Banks
|
|
|
|
|
|
Loans to subsidiaries - Non-banks
|
|
|
|
|
|
Accrued interest
|
|
|
|
|
|
Other assets, including premises, equipment and computer software, equity method investments, receivables from subsidiaries and other real estate owned
|
|
|
|
|
|
Total assets
|
|
|
|
|
|
Liabilities
|
||||
|
Customer deposits
|
||||
|
Non-interest bearing
|
|
|
|
|
|
Interest bearing
|
|
|
|
|
|
Total customer deposits
|
|
|
|
|
|
Bank deposits
|
|
|
|
|
|
Total deposits
|
|
|
|
|
|
Employee benefit plans
|
|
|
|
|
|
Accrued interest
|
|
|
|
|
|
Other liabilities, including payables to subsidiaries
|
|
|
|
|
|
Total other liabilities
|
|
|
|
|
|
Long-term debt
|
|
|
|
|
|
Total liabilities
|
|
|
|
|
|
|
||||
|
Total shareholders’ equity
|
|
|
|
|
|
Total liabilities and shareholders’ equity
|
|
|
|
|
F- 61
The Bank of N.T. Butterfield & Son Limited
Notes to the Consolidated Financial Statements (continued)
(In thousands of US dollars, unless otherwise stated)
|
The Bank of N.T. Butterfield & Son Limited (parent company only)
|
||||||
|
Condensed Statements of Operations
|
||||||
|
(In thousands of US dollars)
|
||||||
|
Year ended
|
||||||
|
December 31, 2019
|
December 31, 2018
|
December 31, 2017
|
||||
|
Non-interest income
|
||||||
|
Banking
|
|
|
|
|
|
|
|
Foreign exchange revenue
|
|
|
|
|
|
|
|
Custody and other administration services
|
|
|
|
|
|
|
|
Other non-interest income
|
|
|
|
|
|
|
|
Dividends from subsidiaries - Banks
|
|
|
|
|
|
|
|
Dividends from subsidiaries - Non-banks
|
|
|
|
|
|
|
|
Total non-interest income
|
|
|
|
|
|
|
|
Interest income
|
|
|
|
|||
|
Interest and fees on loans
|
|
|
|
|
|
|
|
Investments
|
|
|
|
|
|
|
|
Deposits with banks
|
|
|
|
|
|
|
|
Total interest income
|
|
|
|
|
|
|
|
Interest expense
|
|
|
|
|||
|
Deposits
|
|
|
|
|
|
|
|
Long-term debt
|
|
|
|
|
|
|
|
Securities sold under agreement to resell
|
|
|
|
|
|
|
|
Total interest expense
|
|
|
|
|
|
|
|
Net interest income before provision for credit losses
|
|
|
|
|
|
|
|
Provision for credit recoveries (losses)
|
(
|
)
|
|
|
|
|
|
Net interest income after provision for credit losses
|
|
|
|
|
|
|
|
Net gains (losses) on equity securities
|
|
|
(
|
)
|
|
|
|
Net realized gains (losses) on available-for-sale investments
|
|
|
|
|
|
|
|
Net gains (losses) on other real estate owned
|
(
|
)
|
(
|
)
|
(
|
)
|
|
Net other gains (losses)
|
|
|
|
|
|
|
|
Total other gains (losses)
|
|
|
|
|
|
|
|
Total net revenue
|
|
|
|
|
|
|
|
Non-interest expense
|
|
|
|
|||
|
Salaries and other employee benefits
|
|
|
|
|
|
|
|
Technology and communications
|
|
|
|
|
|
|
|
Professional and outside services
|
|
|
|
|
|
|
|
Property
|
|
|
|
|
|
|
|
Indirect taxes
|
|
|
|
|
|
|
|
Non-service employee benefits expense
|
|
|
|
|
|
|
|
Marketing
|
|
|
|
|
|
|
|
Amortization of intangible assets
|
|
|
|
|
|
|
|
Other expenses
|
|
|
|
|
|
|
|
Total non-interest expense
|
|
|
|
|
|
|
|
Net income before equity in undistributed earnings of subsidiaries
|
|
|
|
|
|
|
|
Equity in undistributed earnings of subsidiaries
|
(
|
)
|
|
|
|
|
|
Net income
|
|
|
|
|
|
|
|
Other comprehensive income, net of tax
|
|
|
(
|
)
|
|
|
|
Total comprehensive income
|
|
|
|
|
|
|
F- 62
The Bank of N.T. Butterfield & Son Limited
Notes to the Consolidated Financial Statements (continued)
(In thousands of US dollars, unless otherwise stated)
|
The Bank of N.T. Butterfield & Son Limited (parent company only)
|
||||||
|
Condensed Statements of Cash Flows
|
||||||
|
(In thousands of US dollars)
|
||||||
|
Year ended
|
||||||
|
December 31, 2019
|
|
December 31, 2018
|
|
December 31, 2017
|
|
|
|
Cash flows from operating activities
|
||||||
|
Net income
|
|
|
|
|
|
|
|
Adjustments to reconcile net income to operating cash flows
|
|
|||||
|
Depreciation and amortization
|
|
|
|
|
|
|
|
Provision for credit (recovery) losses
|
|
|
(
|
)
|
(
|
)
|
|
Share-based payments and settlements
|
|
|
|
|
|
|
|
Net realized (gains) losses on available-for-sale investments
|
(
|
)
|
(
|
)
|
(
|
)
|
|
Net (gains) losses on other real estate owned
|
|
|
|
|
|
|
|
(Increase) decrease in carrying value of equity method investments
|
(
|
)
|
(
|
)
|
(
|
)
|
|
Dividends received from equity method investment
|
|
|
|
|
|
|
|
Equity in undistributed earnings of subsidiaries
|
|
|
(
|
)
|
(
|
)
|
|
Changes in operating assets and liabilities
|
||||||
|
(Increase) decrease in accrued interest receivable
|
(
|
)
|
(
|
)
|
|
|
|
(Increase) decrease in other assets
|
|
|
(
|
)
|
|
|
|
Increase (decrease) in accrued interest payable
|
|
|
|
|
(
|
)
|
|
Increase (decrease) in employee benefit plans and other liabilities
|
(
|
)
|
(
|
)
|
|
|
|
Cash provided by (used in) operating activities
|
|
|
|
|
|
|
|
Cash flows from investing activities
|
||||||
|
(Increase) decrease in securities purchased under agreement to resell
|
(
|
)
|
|
|
(
|
)
|
|
Short-term investments other than restricted cash: proceeds from maturities and sales
|
|
|
|
|
|
|
|
Short-term investments other than restricted cash: purchases
|
(
|
)
|
(
|
)
|
(
|
)
|
|
Net change in equity securities at fair value
|
(
|
)
|
|
|
(
|
)
|
|
Available-for-sale investments: proceeds from sale
|
|
|
|
|
|
|
|
Available-for-sale investments: proceeds from maturities and pay downs
|
|
|
|
|
|
|
|
Available-for-sale investments: purchases
|
(
|
)
|
(
|
)
|
(
|
)
|
|
Held-to-maturity investments: proceeds from maturities and pay downs
|
|
|
|
|
|
|
|
Held-to-maturity investments: purchases
|
(
|
)
|
(
|
)
|
(
|
)
|
|
Net (increase) decrease in loans to third parties
|
(
|
)
|
|
|
(
|
)
|
|
Net (increase) decrease in loans to bank subsidiaries
|
(
|
)
|
|
|
|
|
|
Net (increase) decrease in loans to non-bank subsidiaries
|
(
|
)
|
|
|
(
|
)
|
|
Additions to premises, equipment and computer software
|
(
|
)
|
(
|
)
|
(
|
)
|
|
Proceeds from sale of other real estate owned
|
|
|
|
|
|
|
|
Injection of capital in subsidiary
|
(
|
)
|
(
|
)
|
(
|
)
|
|
Return of capital from a subsidiary
|
|
|
|
|
|
|
|
Cash provided by (used in) investing activities
|
(
|
)
|
|
|
|
|
F- 63
The Bank of N.T. Butterfield & Son Limited
Notes to the Consolidated Financial Statements (continued)
(In thousands of US dollars, unless otherwise stated)
|
The Bank of N.T. Butterfield & Son Limited (parent company only)
|
||||||
|
Condensed Statements of Cash Flows
|
||||||
|
(In thousands of US dollars)
|
||||||
|
Year ended
|
||||||
|
December 31, 2019
|
|
December 31, 2018
|
|
December 31, 2017
|
|
|
|
Cash flows from financing activities
|
||||||
|
Net increase (decrease) in demand and term deposit liabilities
|
(
|
)
|
(
|
)
|
(
|
)
|
|
Proceeds from issuance of common shares, net of underwriting discounts and commissions
|
|
|
|
|
|
|
|
Issuance of subordinated capital, net of underwriting fees
|
|
|
|
|
|
|
|
Repayment of long-term debt
|
|
|
(
|
)
|
|
|
|
Common shares repurchased
|
(
|
)
|
(
|
)
|
|
|
|
Proceeds from stock option exercises
|
|
|
|
|
|
|
|
Cash dividends paid on common shares
|
(
|
)
|
(
|
)
|
(
|
)
|
|
Cash provided by (used in) financing activities
|
(
|
)
|
(
|
)
|
(
|
)
|
|
Net increase (decrease) in cash, cash equivalent and restricted cash
|
(
|
)
|
|
|
(
|
)
|
|
Cash, cash equivalents and restricted cash: beginning of yea
r
|
|
|
|
|
|
|
|
Cash, cash equivalents and restricted cash: end of yea
r
|
|
|
|
|
|
|
|
Components of cash, cash equivalents and restricted cash at end of yea
r
|
||||||
|
Cash due from banks
|
|
|
|
|
|
|
|
Restricted cash included in short-term investments on the consolidated balance sheets
|
|
|
|
|
|
|
|
Total cash, cash equivalents and restricted cash at end of yea
r
|
|
|
|
|
|
|
|
Supplemental disclosure of cash flow information
|
||||||
|
Cash interest paid
|
|
|
|
|
|
|
|
Supplemental
disclosure of non-cash items
|
||||||
|
Transfer to (out of) other real estate owned
|
|
|
|
|
|
|
|
Initial recognition of right-of-use assets and operating lease liabilities
|
|
|
|
|
|
|
F- 64
The SEC maintains an internet site at https://www.sec.gov that contains reports and other information regarding issuers that file electronically with the SEC. These SEC filings are also available to the public from commercial document retrieval services.
(a) The following documents are filed as exhibits hereto:
|
Exhibit No.
|
Description
|
|
|
|
Amended and Restated Bye-laws of The Bank of N.T. Butterfield & Son Limited (incorporated by reference to Exhibit 1.1 to the registrants Annual Report on Form 20-F for the year ended December 31, 2018)
|
|
|
|
The N.T. Butterfield & Son Bank Act, 1904 (incorporated by reference to Exhibit 3.2 to the registrant’s registration statement on Form F-1, filed on August 4, 2016)
|
|
|
|
Form of Specimen of Common Registered Share Certificate (incorporated by reference to Exhibit 4.1 to the registrant’s registration statement on Form F-1/A, filed on August 30, 2016)
|
|
|
|
Description of Securities
|
|
|
|
Amended and Restated Investment Agreement by and among The Bank of N.T. Butterfield & Son Limited, Carlyle Global Financial Services Partners, L.P., and CGFSP Coinvestment L.P., dated as at August 4, 2016 (incorporated by reference to Exhibit 10.1 to the registrant’s registration statement on Form F-1, filed on August 4, 2016)
|
|
|
|
The Bank of N.T. Butterfield & Son Limited 2010 Omnibus Share Incentive Plan (incorporated by reference to Exhibit 10.2 to the registrant’s registration statement on Form F-1, filed on August 4, 2016)
|
|
|
|
First Amendment to The Bank of N.T. Butterfield & Son Limited 2010 Omnibus Share Incentive Plan (incorporated by reference to Exhibit 99.1 to the registrant’s registration statement on Form S-8, filed on October 27, 2016)
|
|
|
|
Subordinated Debt Securities Indenture between The Bank of N.T. Butterfield & Son Limited and The Bank of New York Mellon Trust Company, N.A., as Trustee, dated as at May 24, 2018 (incorporated by reference to Exhibit 4.1 to the registrant's report on Form 6-K filed on May 24, 2018)
|
|
|
|
First Supplemental Indenture, between The Bank of N.T. Butterfield & Son Limited and The Bank of New York Mellon Trust Company, N.A., as Trustee, dated as at May 24, 2018, to Subordinated Debt Securities Indenture, dated as at May 24, 2018 (incorporated by reference to Exhibit 4.2 to the registrant's report on Form 6-K filed on May 24, 2018)
|
|
|
|
Purchase Agreement, dated April 24, 2019, by and among Bank of N.T. Butterfield & Son Limited, Butterfield Bank (Guernsey) Limited and ABN AMRO (Channel Islands) Limited (incorporated by reference to Exhibit 2.1 to the registrant's report on Form 6-K filed on April 25, 2019)
|
|
|
|
List of Subsidiaries
|
|
|
|
Certification of the Chairman and Chief Executive Officer pursuant to Rule 13a-14(a) or Rule 15d-14(a) under the Securities Exchange Act of 1934
|
|
|
|
Certification of the Chief Financial Officer pursuant to Rule 13a-14(a) or Rule 15d-14(a) under the Securities Exchange Act of 1934
|
|
|
|
Certification of the Chairman and Chief Executive Officer and Chief Financial Officer pursuant to 18 U.S.C. Section 1350, as adopted Pursuant to Section 906 of the Sarbanes-Oxley Act of 2002
|
|
|
|
Consent of PricewaterhouseCoopers Ltd.
|
|
|
100
|
|
The following materials from our annual report on Form 20-F for the year ended December 31, 2019 formatted in XBRL (eXtensible Business Reporting Language): (i) the Consolidated Financial Statements and (ii) the Notes to the Consolidated Financial Statements, tagged as blocks of text and in detail.
|
SIGNATURES
The registrant hereby certifies that it meets all of the requirements for filing on Form 20-F and that it has duly caused and authorized the undersigned to sign this annual report on its behalf.
The Bank of N.T. Butterfield & Son Limited
|
By:
|
/s/ Michael Collins
|
|
Name:
|
Michael Collins
|
|
Title:
|
Chairman and Chief Executive Officer
|
|
Date:
|
February 26, 2020
|
III - 1
TABLE OF CONTENTS
Note 3: Cash Due From BanksNote 4: Short-term InvestmentsNote 12: Credit Related Arrangements, Repurchase Agreements and CommitmentsNote 5: Investment in SecuritiesNote 6: LoansNote 7: Credit Risk ConcentrationsNote 10: Customer Deposits and Deposits From BanksNote 11: Employee Benefit PlansNote 20: Long-term DebtNote 13: LeasesNote 18: Fair Value MeasurementsNote 22: Share-based PaymentsNote 27: Business CombinationsNote 1: Nature Of BusinessNote 2: Significant Accounting PoliciesNote 8: Premises, Equipment and Computer SoftwareNote 9: Goodwill and Other Intangible AssetsNote 14: Exit Cost ObligationsNote 16: Segmented InformationNote 15: Loan Interest IncomeNote 17: Derivative Instruments and Risk ManagementNote 24: Accumulated Other Comprehensive LossNote 19: Interest Rate RiskNote 21: Earnings Per ShareNote 23: Share Buy-back PlansNote 25: Capital StructureNote 26: Income TaxesNote 28: Related Party TransactionsNote 29: Condensed Financial Statements Of The Parent Company OnlyNote 30: Subsequent EventsItem 19. Exhibits