NETGEAR, INC.
10-Ks and 10-Qs
|
|
|
|
|
|
|
|
|
|
|
|
|
|
|
|
|
|
|
|
|
|
|
|
|
|
|
|
|
|
|
|
|
|
|
|
|
|
|
|
|
|
|
|
|
|
|
|
|
|
|
|
|
|
|
|
UNITED STATES SECURITIES AND EXCHANGE COMMISSION
Washington, D.C. 20549
_______________
Form 10-K
|
ANNUAL REPORT PURSUANT TO SECTION 13 OR 15(d) OF THE SECURITIES EXCHANGE ACT OF 1934.
|
|
|
For the fiscal year ended December 31, 2013
|
|
|
TRANSITION REPORT PURSUANT TO SECTION 13 OR 15(d) OF THE SECURITIES EXCHANGE ACT OF 1934.
|
|
|
For the transition period from to
|
|
Commission file number 000-50350
_______________
NETGEAR, Inc.
(Exact name of registrant as specified in its charter)
|
Delaware
|
77-0419172
|
|
(State or other jurisdiction of incorporation or organization)
|
(I.R.S. Employer Identification No.)
|
|
350 East Plumeria Drive,
|
95134
|
|
San Jose, California
|
(Zip Code)
|
|
(Address of principal executive offices)
|
|
Registrant's telephone number, including area code
(408) 907-8000
Securities registered pursuant to Section 12(b) of the Act:
|
Title of each class
|
Name of each exchange on which registered
|
|
|
Common Stock, par value $0.001
|
The NASDAQ Stock Market LLC
|
|
|
(NASDAQ Global Select Market)
|
||
Securities registered pursuant to 12(g) of the Act: None
Indicate by check mark if the registrant is a well-known seasoned issuer, as defined in Rule 405 of the Securities Act. Yes
þ
No
o
Indicate by check mark if the registrant is not required to file reports pursuant to Section 13 or Section 15(d) of the Act. Yes
o
No
þ
Indicate by check mark whether the registrant (1) has filed all reports required to be filed by Section 13 or 15(d) of the Securities Exchange Act of 1934 during the preceding 12 months (or for such shorter period that the registrant was required to file such reports), and (2) has been subject to such filing requirements for the past 90 days. Yes
þ
No
o
Indicate by check mark whether the registrant has submitted electronically and posted on its corporate Website, if any, every Interactive Data File required to be submitted and posted pursuant to Rule 405 of Regulation S-T (§232.405 of this chapter) during the preceding 12 months (or for such shorter period that the registrant was required to submit and post such files). Yes
þ
No
o
Indicate by check mark if disclosure of delinquent filers pursuant to Item 405 of Regulation S-K is not contained herein, and will not be contained, to the best of Registrant's knowledge, in definitive proxy or information statements incorporated by reference in Part III of this Form 10-K or any amendment to this Form 10-K.
þ
Indicate by check mark whether the registrant is a large accelerated filer, an accelerated filer, or a non-accelerated filer, or a smaller reporting company. See definitions of “large accelerated filer,” “accelerated filer” and “smaller reporting company” in Rule 12b-2 of the Exchange Act. (Check one):
|
Large Accelerated filer
|
þ
|
|
Accelerated filer
|
o
|
||
|
Non-Accelerated filer
|
o
|
|
Smaller reporting company
|
o
|
||
Indicate by check mark whether the registrant is a shell company (as defined in Rule 12b-2 of the Act.) Yes
o
No
þ
The aggregate market value of the voting and non-voting common equity held by non-affiliates of the Registrant as of June 30, 2013 was approximately $791.0 million. Such aggregate market value was computed by reference to the closing price of the common stock as reported on the Nasdaq Global Select Market on June 28, 2013 (the last business day of the Registrant's most recently completed fiscal second quarter). Shares of common stock held by each executive officer and director and each entity that owns 5% or more of the outstanding common stock have been excluded in that such persons may be deemed to be affiliates. The determination of affiliate status is not necessarily a conclusive determination for other purposes.
The number of outstanding shares of the registrant's Common Stock, $0.001 par value, was
36,459,944
shares as of February 18, 2014.
DOCUMENTS INCORPORATED BY REFERENCE
Portions of the Proxy Statement for the Registrant's 2013 Annual Meeting of Stockholders are incorporated by reference in Part III of this Form 10-K.
1
TABLE OF CONTENTS
|
PART I
|
||
|
Item 1.
|
||
|
Item 1A.
|
||
|
Item 1B.
|
||
|
Item 2.
|
||
|
Item 3.
|
||
|
Item 4.
|
||
|
PART II
|
||
|
Item 5.
|
||
|
Item 6.
|
||
|
Item 7.
|
||
|
Item 7A.
|
||
|
Item 8.
|
||
|
Item 9.
|
||
|
Item 9A.
|
||
|
Item 9B.
|
||
|
PART III
|
||
|
Item 10.
|
||
|
Item 11.
|
||
|
Item 12.
|
||
|
Item 13.
|
||
|
Item 14.
|
||
|
PART IV
|
||
|
Item 15.
|
||
2
This Annual Report on Form 10-K (“Form 10-K”), including Management’s Discussion and Analysis of Financial Condition and Results of Operations in Part II, Item 7 below, includes forward-looking statements within the meaning of Section 27A of the Securities Act of 1933, as amended, and Section 21E of the Securities Exchange Act of 1934, as amended (the “Exchange Act”). All statements other than statements of historical facts contained in this Form 10-K, including statements regarding our future financial position, business strategy and plans and objectives of management for future operations, are forward-looking statements. The words “believe,” “may,” “will,” “estimate,” “continue,” “anticipate,” “intend,” “should,” “plan,” “expect” and similar expressions, as they relate to us, are intended to identify forward-looking statements. We have based these forward-looking statements largely on our current expectations and projections about future events and financial trends that we believe may affect our financial condition, results of operations, business strategy and financial needs. These forward-looking statements are subject to a number of risks, uncertainties and assumptions described in “Risk Factors” in Part I, Item 1A below, and elsewhere in this Form 10-K, including, among other things: the future growth of the commercial business, retail, and broadband service provider markets; speed of adoption of wireless networking worldwide; our business strategies and development plans; our successful introduction of new products and technologies; future operating expenses and financing requirements; and competition and competitive factors in the commercial business, retail, and broadband service provider markets. In light of these risks, uncertainties and assumptions, the forward-looking events and circumstances discussed in this Form 10-K may not occur and actual results could differ materially from those anticipated or implied in the forward-looking statements. All forward-looking statements in this Form 10-K are based on information available to us as of the date hereof and we assume no obligation to update any such forward-looking statements. The following discussion should be read in conjunction with our consolidated financial statements and the accompanying notes contained in this Form 10-K.
Item 1.
Business
General
We are a global networking company that delivers innovative products to consumers, businesses and service providers. Our business is managed in three specific business units: retail, commercial, and service provider. The retail business unit consists of high performance, dependable and easy-to-use home networking, home video monitoring, storage and digital media products. The commercial business unit consists of business networking, storage and security solutions that bring enterprise class functionality down to small and medium size businesses at an affordable price. The service provider business unit consists of made-to-order and retail proven, whole home networking hardware and software solutions as well as 4G LTE hotspots sold to service providers for sale to their subscribers. We are organized into the following three geographic territories: Americas, Europe, Middle-East and Africa ("EMEA") and Asia Pacific ("APAC"). For further detail, refer to Note 12,
Segment Information, Operations by Geographic Area and Customer Concentration
, in Notes to Consolidated Financial Statements in Item 8 of Part II of this Annual Report on Form 10-K.
We were incorporated in Delaware on January 8, 1996. Our principal executive offices are located at 350 East Plumeria Drive, San Jose, California 95134, and our telephone number at that location is (408) 907-8000. Our website address is www.netgear.com.
In the years ended December 31,
2013
,
2012
, and
2011
, we generated net revenue of
$1.37 billion
,
$1.27 billion
, and
$1.18 billion
, respectively.
Markets
Our mission is to be the innovative leader in connecting the world to the Internet. This includes our goal of being the leading provider of innovative networking products to the consumer, business, and service provider markets. A number of factors are driving today's demand for networking products within these markets. As the number of computing devices, such as smart phones, laptops and tablets, has increased in recent years, networks - especially WiFi networks - are being deployed more broadly in order to share information and resources among users and devices. This information and resource sharing occurs internally, through a local area network, or externally, via the Internet. To take advantage of complex applications, advanced communication capabilities and rich multimedia content, users are upgrading their Internet connections by deploying high-speed broadband access technologies. Users also seek the convenience and flexibility of operating their laptops, smart phones, tablets and related computing devices while accessing their content in a more mobile, or wireless, manner. In addition, market demand for Smart TV products has increased significantly, where users seek to connect their televisions to the Internet and for streaming entertainment. As the usage of networks, including the Internet, has increased, users have become much more focused on the security of their connections and the protection of the data within their networks. And finally, the connected home is becoming a reality with smart devices such as home video monitoring cameras that let users watch over their home from their smart phone.
1
Consumers, businesses and service providers demand a complete set of wired and wireless networking and broadband products that are tailored to their specific needs and budgets and also incorporate the latest networking technologies. These users require the continual introduction of new and refined products and often lack extensive IT resources and technical knowledge. Therefore, they demand 'plug-and-play' or easy-to-install and use products that require little or no maintenance, and customer service and support. We believe that these users also prefer the convenience of obtaining a networking solution from a single company with whom they are familiar; as these users expand their networks, they tend to be loyal purchasers of that brand. In addition, purchasing decisions of users in these markets are also driven by the affordability of networking products. To provide reliable, easy-to-use products at an attractive price, we believe a successful supplier must have a company-wide focus on the unique requirements of these markets, operational discipline and cost-efficient infrastructure and processes that allow for efficient product development, manufacturing and distribution.
Sales Channels
We sell our products through multiple sales channels worldwide, including traditional retailers, online retailers, wholesale distributors, direct market resellers ("DMRs"), value-added resellers ("VARs"), and broadband service providers.
Wholesale Distribution.
Our distribution channel supplies our products to retailers, e-commerce resellers, DMRs, VARs and broadband service providers. We sell directly to our distributors, the largest of which are Ingram Micro, Inc., D&H Distributing Company and Tech Data Corporation.
Retailers.
Our retail channel primarily supplies products that are sold into the consumer market. We sell directly to, or enter into consignment arrangements with, a number of our traditional and online retailers. The remaining traditional retailers, as well as our online retailers, are fulfilled through wholesale distributors. We work directly with our retail channels on market development activities, such as co-advertising, on-line promotions and video demonstrations, instant rebate programs, event sponsorship and sales associate training.
DMRs and VARs.
We primarily sell into the commercial business marketplace through an extensive network of DMRs and VARs. Our DMRs include companies such as CDW and Insight. VARs include our network of registered Powershift Partners, and resellers that are not registered in our Powershift partner program. DMRs and VARs may receive sales incentives, marketing support and other program benefits from us. Our DMRs and VARs generally purchase our products through our wholesale distributors.
Broadband Service Providers.
We also supply our products directly to broadband service providers in the United States and internationally providing cable, DSL and 4G LTE broadband. Service providers supply our products to their business and home subscribers.
The largest portion of our net revenues was derived from Americas sales in the year ended December 31,
2013
. The Americas sales as a percentage of net revenue increased from 53.4% in the year ended December 31, 2012 to 57.7% in the year ended December 31,
2013
. We have continuously committed resources to expanding our international operations and sales channels. Accordingly, we are subject to a number of risks related to international operations such as macroeconomic and microeconomic conditions, geopolitical instability, preference for locally branded products, exchange rate fluctuations, increased difficulty in managing inventory, challenges of staffing and managing foreign operations, the effect of international sales on our tax structure, and changes in local tax laws. See Note 12,
Segment Information, Operations by Geographic Area and Customer Concentration
, in Notes to Consolidated Financial Statements in Item 8 of Part II of this Annual Report on Form 10-K, for further discussion of net revenues by geographic region.
None of our customers accounted for 10% or greater of our net revenue in the years ended December 31, 2013 and 2012. Retail company Best Buy, Inc. and distributor Ingram Micro, Inc. each accounted for 10% or greater of our net revenues in the year ended December 31,
2011
. See Note 12,
Segment Information, Operations by Geographic Area and Customer Concentration
, in Notes to Consolidated Financial Statements in Item 8 of Part II of this Annual Report on Form 10-K, for further details on customer concentrations.
2
Product Offerings
Our product line consists of devices that create and extend wired and wireless networks as well as devices that provide a special function and attach to the network, such as network attached storage, home video monitoring and home automation devices. These products are available in multiple configurations to address the needs of our customers in each geographic region in which our products are sold.
Commercial business networking.
These products are sold primarily in our commercial business unit and include:
|
•
|
Ethernet switches, which are multiple port devices used to network computing devices and peripherals via Ethernet wiring;
|
|
•
|
Wireless controllers and access points, which are devices used to manage and control multiple WiFi base stations on a campus or a facility providing WiFi connections to smart phones, tablets, laptops and other computing devices;
|
|
•
|
Internet security appliances, which provide Internet access through capabilities such as anti-virus and anti-spam; and
|
|
•
|
Unified storage, which delivers file and block based data into a single shared storage system, meeting the demands of small enterprises, education, hospitality and health markets through an easy-to-use interface for managing multiple storage protocols.
|
Broadband access.
Broadband access is a high speed transmission medium such as DOCSIS3, VDSL, ADSL, FTTx or LTE, used to connect to the Internet over public high speed networks. We develop networking products that enable a connection to broadband networks and create whole home WiFi connectivity that are sold in our service provider and retail business units and include:
|
•
|
Gateways, which are routers with integrated modems, for Internet access;
|
|
•
|
Hotspots, which are 3G and 4G LTE WiFi access points that enable people to access the internet on the go, and/or for use at home in place of traditional wired broadband;
|
|
•
|
IP telephony products, used for transmitting voice communications over a network; and
|
|
•
|
Media servers, which store files and multimedia content for access by tablets, laptops, smart phones and other Internet enabled devices.
|
Smart Home Network Connectivity.
Products that create and extend home networks and smart wired and wireless devices that attach to those networks are sold in our service provider and retail business units and include:
|
•
|
Routers, which connect the home or office networks to the Internet via broadband modems;
|
|
•
|
WiFi range extenders, which extend the range of the WiFi home network to eliminate dead zones;
|
|
•
|
Media adapters, which connect TVs, audio players, and game consoles to a network or wirelessly display the contents of your smart phone, laptop or tablet to a big screen TV;
|
|
•
|
Powerline adapters and bridges, which enable devices to be connected to the network over existing electrical wiring;
|
|
•
|
Multimedia over Coax Alliance standard (“MoCA”) adapters and bridges, which enable devices to be connected to the network over existing coaxial wiring;
|
|
•
|
Remote video monitoring systems, which provide wire-free monitoring accessible by smart phone, tablet or PC and MAC;
|
|
•
|
Wireless network interface cards and adapters, which enable devices to be connected to the network wirelessly; and
|
|
•
|
Ethernet network interface cards and adapters, which enable devices to be connected to the network over Ethernet wiring.
|
We design our products to meet the specific needs of the consumer, business and service provider markets, tailoring various elements of the software interface, the product design, including component specification, physical characteristics such as casing,
3
design and coloration, and specific user interface features to meet the needs of these markets. We also leverage many of our technological developments, high volume manufacturing, technical support and engineering infrastructure across our markets to maximize business efficiencies.
Our products that target the business market are generally designed with an industrial appearance, including metal cases and, for some product categories, the ability to mount the product within standard data networking racks. These products typically include higher port counts, higher data transfer rates and other performance characteristics designed to meet the needs of a commercial business user. For example, we offer data transfer rates up to ten gigabits per second for our business products to meet the higher capacity requirements of business users. Some of these products are also designed to support transmission modes such as fiber optic cabling, which is common in more sophisticated business environments. Security requirements within our products for commercial business broadband access include firewall, virtual private network and content threat management capabilities that allow for secure interactions between remote offices and business headquarter locations over the Internet. Our connectivity product offerings for the commercial business market include enhanced security and remote configurability often required in a business setting. Our ReadyNAS
®
family of network attached storage products implements redundant array of independent disks data protection, enabling businesses to store and protect critical data easily, efficiently and intelligently.
Our vision for the home network is about intelligently controlling and monitoring all devices connected to the home network at all times, thus creating a Smart Home. Our focus is to continue to introduce new products into growth areas that form the basis of Smart Homes, such as: the fastest WiFi standards with broadest coverage via latest technology (802.11ac) WiFi routers and repeaters; video streaming players such Push2TV and NeoTV; home network storage products with an easy to use user interface and remote cloud access, higher capacity and resilience; high speed DOCSIS 3.0, xDSL and fiber gateways with more integrated functions; 4G LTE gateways and Air Card hotspots; and home monitoring and automation devices such as our VueZone home monitoring camera system. We continue to announce and introduce new products in these significant growth markets.
Our vision for the commercial network is about increased effectiveness and efficiency of the hybrid cloud access network. We believe small and medium enterprises will continue to move into cloud-based applications, such as: Salesforce.com, Ring Central, LifeSize video conferencing, SuccessFactors, Workday, and others. In addition, we believe these enterprises will move into utility-like on demand computing power supplied by third party data centers. Also, increasingly more enterprises are enabling the BYOD (bring your own device) environment allowing smart phones, tablets, and netbooks to be the business computing devices of choice. These trends will place a greater demand on commercial networks. To meet this demand we are introducing next generation commercial products in rapid pace, such as: Power over Ethernet (PoE) switches, 10 gigabit Ethernet switches, high capacity local and remote unified storage, small to medium capacity campus wireless LAN, and security appliances.
Competition
The consumer, business and service provider markets are intensely competitive and subject to rapid technological change. We expect competition to continue to intensify. Our principal competitors include:
|
•
|
within the consumer markets, companies such as Apple, Asus, Belkin/Linksys, D-Link, Dropcam, Foscam, Logitech, Roku, TP Link, Synology and Western Digital; and
|
|
•
|
within the business markets, companies such as Allied Telesys, Barracuda, Buffalo, Data Robotics, Dell, D-Link, Fortinet, Hewlett-Packard, Huawei, Cisco Systems, QNAP Systems, Seagate Technology, SonicWALL, Synology, WatchGuard and Western Digital; and
|
|
•
|
within the service provider markets, companies such as Actiontec, Arcadyan, ARRIS, AVM, Comtrend, D-Link, Hitron, Huawei, Novatel Wireless, Pace, Sagem, Scientific Atlanta (a Cisco Systems company), Sercomm, SMC Networks, TechniColor, TP-Link, Ubee, Compal Broadband, ZTE and ZyXEL.
|
Other current and potential competitors include numerous local vendors such as Devolo, LEA and AVM in Europe, and Corega and Melco in Japan. Our potential competitors also include other consumer electronics vendors, including LG Electronics, Microsoft, Panasonic, Samsung, Sony, Toshiba and Vizio, who could integrate networking and streaming capabilities into their line of products, such as televisions, set top boxes and gaming consoles, and our channel customers who may decide to offer self-branded networking products. We also face competition from service providers who may bundle a free networking device with their broadband service offering, which would reduce our sales if we are not the supplier of choice to those service providers. In the service provider space, we are also facing significant and increased competition from original design manufacturers, or ODMs, and contract manufacturers ("CMs") who are selling and attempting to sell their products directly to service providers around the world.
4
Many of our existing and potential competitors have longer operating histories, greater name recognition and substantially greater financial, technical, sales, marketing and other resources. As a result, they may have more advanced technology, larger distribution channels, stronger brand names, better customer service and access to more customers than we do. For example, Hewlett-Packard has significant brand name recognition and has an advertising presence substantially greater than ours. Similarly, Cisco Systems is well recognized as a leader in providing networking products to businesses and has substantially greater financial resources than we do. Several of our competitors, such as D-Link, offer a range of products that directly compete with most of our product offerings. Several of our other competitors primarily compete in a more limited manner. For example, Hewlett-Packard sells networking products primarily targeted at larger businesses or enterprises. However, the competitive environment in which we operate changes rapidly. Other companies with significant resources could also become direct competitors, either through acquiring a competitor or through internal efforts.
We believe that the principal competitive factors in the consumer, business and service provider markets for networking products include product breadth, size and scope of the sales channel, brand name, timeliness of new product introductions, product availability, performance, features, functionality and reliability, price, ease-of-installation, maintenance and use, and customer service and support. We believe our products are competitive in these markets based on these factors.
To remain competitive, we must invest significant resources in developing new products and enhancing our current products while continuing to expand our sales channels and maintaining customer satisfaction worldwide.
Research and Development
As of December 31,
2013
, we had 355 employees engaged in research and development. Our success depends on our ability to develop products that meet changing user needs and to anticipate and proactively respond to evolving technology in a timely and cost-effective manner. Accordingly, we have made investments in our research and development department in order to effectively evaluate new third-party technologies, develop new in-house technologies, and develop and test new products. Our research and development employees work closely with our technology and manufacturing partners to bring our products to market in a timely, high quality and cost-efficient manner.
We identify, qualify or self-develop new technologies, and we work closely with our various technology suppliers and manufacturing partners to develop products using one or more of the development methodologies described below.
ODM.
Under the ODM methodology, we define the product concept and specification and recommend the technology selection. We then coordinate with our technology suppliers while they develop the product meeting our specification. On certain new products, one or more subsystems of the design can be done in-house and then integrated with the remaining design pieces from the ODM. Once prototypes are completed, we work with our partners to complete the debugging and systems integration and testing. After completion of the final tests, agency approvals and product documentation, the product is released for production.
In-House Development.
Under the in-house development model, one or more subsystems of the product are designed and developed utilizing the NETGEAR engineering team. Under this model, some of the primary technology is developed in-house. We then work closely with either an ODM or a contract manufacturer ("CM") to complete the development of the entire design, perform the necessary testing, and obtain regulatory approvals before the product is released for production.
OEM.
Under the original equipment manufacturer ("OEM"), methodology, which we use for a limited number of products, we define the product specification and then purchase the product from OEM suppliers that have existing products fitting our design requirements. In some cases, once a technology supplier's product is selected, we work with the OEM supplier to complete the cosmetic changes to fit into our mechanical and packaging design, as well as our documentation and graphical user interface ("GUI") standard. The OEM supplier completes regulatory approvals on our behalf. When all design verification and regulatory testing is completed, the product is released for production.
Our internal research and development efforts focus on developing and improving the usability, reliability, functionality, cost and performance of our products. Our total research and development expenses were
$85.2 million
in
2013
,
$61.1 million
in
2012
and
$48.7 million
in
2011
.
Manufacturing
Our primary manufacturers are Cameo Communications Inc., Delta Networks Incorporated, Hon Hai Precision Industry Co., Ltd., (more commonly known as Foxconn Corporation), Sercomm Corporation, Pegatron Corporation (which was spun out of ASUSTek Computer, Inc. in January 2008) and Wistron New Web Corporation, all of which are headquartered in Taiwan. We also use FLEXTRONICS with headquarters in Singapore and the United States. The actual manufacturing of our products occurs
5
primarily in mainland China and Vietnam, with pilot and low-volume manufacturing in Taiwan on a select basis. We distribute our manufacturing among these key suppliers to avoid excessive concentration with a single supplier. Because substantially all of our manufacturing occurs in mainland China and Vietnam, any disruptions from natural disasters, health epidemics and political, social and economic instability would affect the ability of our manufacturers to manufacture our products. In addition, our manufacturers in China have continued to increase our costs of production, particularly in the recent years. These increased costs have affected our margins and ability to lower prices for our products to stay competitive. If our manufacturers or warehousing facilities are disrupted or destroyed, we would have no other readily available alternatives for manufacturing our products and our business would be significantly impacted. In addition to their responsibility for the manufacturing of our products, our manufacturers purchase all necessary parts and materials to produce complete, finished goods. To maintain quality standards for our suppliers, we have established our own product quality organization based in Hong Kong and mainland China. They are responsible for auditing and inspecting process and product quality on the premises of our ODMs, CMs and OEMs.
We obtain several key components from limited or sole sources. For example, many of the semiconductors and meta materials used in our products are designed for use in our products and are obtained from sole source suppliers on a purchase order basis. In addition, some components that are used in all our products are obtained from limited sources. These components include connector jacks, plastic casings and physical layer transceivers. We also obtain switching fabric semiconductors, which are used in our Ethernet switches and Internet gateway products, wireless local area network chipsets which are used in all of our wireless products and mobile network chipsets which are used in our wireless gateways and hotspots from a limited number of suppliers. Our third party manufacturers generally purchase these components on our behalf on a purchase order basis. If these sources fail to satisfy our supply requirements, our ability to meet scheduled product deliveries would be harmed and we may lose sales and experience increased component costs.
We currently outsource warehousing and distribution logistics to four main third-party providers who are responsible for warehousing, distribution logistics and order fulfillment. In addition, these parties are also responsible for some configuration and re-packaging of our products including bundling components to form kits, inserting appropriate documentation, disk drive configuration, and adding power adapters. APL Logistics Americas, Ltd. in City of Industry, California serves the Americas region, Kerry Logistics Ltd. in Hong Kong serves the Asia Pacific region, DSV Solutions B.V. Netherlands serves the EMEA region, and Agility Logistics Pty Ltd. in Matraville, NSW, Australia serves Australia and New Zealand.
The Dodd-Frank Wall Street Reform and Consumer Protection Act of 2010 Section 1502 (the “Dodd-Frank Act”) requires certain public companies to disclose whether certain minerals, commonly known as “conflict minerals,” are necessary to the functionality or production of a product manufactured by those companies and if those minerals originated in the Democratic Republic of the Congo (DRC) or an adjoining country. The implementation of these requirements by government regulators and our partners and/or customers could adversely affect the sourcing, availability, and pricing of minerals used in the manufacture of certain components used in our products. In addition, the supply-chain due diligence investigation required by the conflict minerals rules will require expenditures of resources and management attention regardless of the results of the investigation.
Sales and Marketing
As of December 31,
2013
, we had
387
employees engaged in sales and marketing. We work directly with our customers on market development activities, such as co-advertising, online promotions and video demonstrations, event sponsorship and sales associate training. We also participate in major industry trade shows and marketing events. Our marketing department is comprised of our channel marketing, product marketing and corporate marketing groups.
Our channel marketing team focuses on working with the sales teams to maximize our participation in channel partner marketing activities and merchandise our products both online and in store.
Our product marketing group focuses on product strategy, product development roadmaps, the new product introduction process, product lifecycle management, demand assessment and competitive analysis. The group works closely with our sales and research and development groups to align our product development roadmap to meet customer technology demands from a strategic perspective. The group also ensures that product development activities, product launches, and ongoing demand and supply planning occur in a well-managed, timely basis in coordination with our development, manufacturing, and sales groups, as well as our ODM, OEM and sales channel partners.
Our corporate marketing group is responsible for defining and building our corporate brand and supporting the business units with creative and marketing strategies and tactics. The group focuses on defining our brand promise and marketing messages on a worldwide basis. This group is also responsible for advertising, public relations, events, social media, the corporate website, email marketing and all creative production for all business units.
6
We conduct most of our international sales and marketing operations through wholly-owned subsidiaries, which operate via sales and marketing subsidiaries and branch offices worldwide.
Customer Support
We design our products with “plug-and-play” ease of use. We respond globally to customer questions through a variety of venues including phone, chat and email. Customers can also get self-help service through the comprehensive knowledgebase and the user forum on our website. Customer support is provided through a combination of a limited number of permanent employees and use of subcontracted, out-sourced resources. Our permanent employees design our technical support database and are responsible for training and managing our outsourced sub-contractors. They also handle escalations from the outsourced resources. We utilize the information gained from customers by our customer support organization to enhance our product offerings, including further simplifying the installation process.
Intellectual Property
We believe that our continued success will depend primarily on the technical expertise, speed of technology implementation, creative skills and management abilities of our officers and key employees, plus ownership of a limited but important set of copyrights, trademarks, trade secrets and patents. We primarily rely on a combination of copyright, trademark and trade secret and patent laws, nondisclosure agreements with employees, consultants and suppliers and other contractual provisions to establish, maintain and protect our proprietary rights. We hold approximately 150 issued United States patents that expire between years 2014 and 2030 and 80 foreign patents that expire between 2014 and 2030. In addition, we currently have approximately 125 pending United States and foreign patent applications related to technology and products offered by us. We also rely on third-party licensors for patented hardware and software license rights in technology that are incorporated into and are necessary for the operation and functionality of our products. Our success will depend in part on our continued ability to have access to these technologies.
We have trade secret rights for our products, consisting mainly of product design, technical product documentation and software. We also own, or have applied for registration of trademarks, in connection with our products in the United States and internationally, including NETGEAR, the NETGEAR logo, AirCard, NETGEAR Green, the NETGEAR Green logo, NETGEAR Digital Entertainer, the NETGEAR Digital Entertainer logo, Genie, Genie+, the Genie logo, ReadyShare, Neo TV, the Neo TV logo, NETGEAR Stora, the NETGEAR Stora logo, Connect with Innovation, ProSafe, RangeMax, ReadyNAS, ReadyDrop, ReadyData, ReadyCloud, ReadyDLNA, Smart Wizard, ProSecure, the ProSecure logo, Push2TV, Ultraline, Proline, Liteline, Envoy Service Management System, Versalink, Wirespeed, Leaf Networks, NeoMedia, Centria, On Networks, Folio, Wifi Works, My Media, Nighthawk, NETGEAR Trek, Overdrive, Overdrive 3G/4G Mobile Hotspot logo, Watcher, Aircard Watcher, Zing Mobile Hotspot, Coach, Mingle, Vue, VueZone, and X-RAID. We have registered a number of Internet domain names that we use for electronic interaction with our customers including dissemination of product information, marketing programs, product registration, sales activities, and other commercial uses.
Seasonal Business
We have historically experienced increased net sales in our third and fourth fiscal quarters as compared to other quarters in our fiscal year due to seasonal demand of consumer markets related to the beginning of the school year and the holiday season. However, because of irregular and significant purchases from customers in other markets, such as the service provider market, this pattern has not been consistent. As such, any pattern should not be considered a reliable indicator of our future net sales or financial performance.
Backlog
We believe the actual amount of order backlog at any particular time is not a meaningful indication of our future business. Our backlog consists of products for which customer purchase orders have been received and that are scheduled or in the process of being scheduled for shipment. While we expect to fulfill the order backlog within the current year, most orders are subject to rescheduling or cancellation with little or no penalties. Because of the possibility of customer changes in product scheduling or order cancellation, our backlog as of any particular date may not be an indicator of net sales for any subsequent period. Accordingly, backlog should not be considered a reliable indicator of our ability to achieve any particular level of revenue or financial performance.
7
Environmental Laws
Our products and manufacturing process are subject to numerous governmental regulations, which cover both the use of various materials as well as environmental concerns. Environmental issues such as pollution and climate change have had significant legislative and regulatory efforts on a global basis, and there are expected to be additional changes to the regulations in these areas. These changes could directly increase the cost of energy, which may have an impact on the way we manufacture products or utilize energy to produce our products. In addition, any new regulations or laws in the environmental area might increase the cost of raw materials we use in our products and the cost of compliance. Other regulations in the environmental area may require us to continue to monitor and ensure proper disposal or recycling of our products. To the best of our knowledge, we maintain compliance with all current government regulations concerning our production processes for all locations in which we operate. Since we operate on a global basis, this is also a complex process that requires continual monitoring of regulations and an ongoing compliance process to ensure that we and our suppliers are in compliance with all existing regulations.
Employees
As of December 31,
2013
, we had
1,029
full-time employees, with
387
in sales, marketing and technical support,
355
in research and development,
143
in operations, and
144
in finance, information systems and administration. We also utilize a number of temporary staff to supplement our workforce. We have never had a work stoppage among our employees and no personnel are represented under collective bargaining agreements.
Long-lived assets
Long-lived assets include purchased intangibles, goodwill and property and equipment. Property and equipment by geographic location are as follows (in thousands):
|
December 31,
2013 |
December 31,
2012 |
December 31,
2011 |
|||||||||
|
United States
|
$
|
10,273
|
|
$
|
9,898
|
|
$
|
9,901
|
|
||
|
Americas (excluding U.S.)
|
2,160
|
|
36
|
|
44
|
|
|||||
|
EMEA
|
914
|
|
1,173
|
|
331
|
|
|||||
|
China
|
11,905
|
|
6,763
|
|
4,909
|
|
|||||
|
APAC (excluding China)
|
1,942
|
|
1,155
|
|
699
|
|
|||||
|
$
|
27,194
|
|
$
|
19,025
|
|
$
|
15,884
|
|
|||
Available Information
Our Annual Report on Form 10-K, Quarterly Reports on Form 10-Q, Current Reports on Form 8-K, and amendments to reports filed pursuant to Sections 13(a) and 15(d) of the Securities Exchange Act of 1934, as amended (the "Exchange Act"), are filed with the Securities Exchange Commission (the "SEC"). We are subject to the informational requirements of the Exchange Act and file or furnish reports, proxy statements, and other information with the SEC. You may read and copy our reports, proxy statements and other information filed by us at the SEC's Public Reference Room located at 100 F Street, N.E., Washington, D.C. 20549. Please call the SEC at 1-800-SEC-0330 for further information about the Public Reference Room. Our filings are also available to the public over the Internet at the SEC's website at
http://www.sec.gov.
Our website provides a link to our SEC filings, which are available on the same day such filings are made. The specific location on the website where these reports can be found is http://investor.netgear.com/sec.cfm. Our website also provides a link to Section 16 filings which are available on the same day as such filings are made. Information contained on these websites is not a part of this Annual Report on Form 10-K.
8
Executive Officers of the Registrant
The following table sets forth the names, ages and positions of our executive officers as of February 7, 2014.
|
Name
|
Age
|
Position
|
|
|
Patrick C.S. Lo
|
57
|
|
Chairman and Chief Executive Officer
|
|
Christine M. Gorjanc
|
57
|
|
Chief Financial Officer
|
|
Jeffrey M. Capone
|
43
|
|
Chief Technical Officer
|
|
Mark G. Merrill
|
59
|
|
Senior Vice President of Advanced Engineering
|
|
Michael P. Clegg
|
53
|
|
Senior Vice President and General Manager of Service Provider Business Unit
|
|
John P. McHugh
|
53
|
|
Senior Vice President and General Manager of Commercial Business Unit
|
|
David S.G. Soares
|
47
|
|
Senior Vice President and General Manager of Retail Business Unit
|
|
Michael F. Falcon
|
57
|
|
Senior Vice President of Worldwide Operations and Support
|
|
Andrew W. Kim
|
43
|
|
Senior Vice President of Corporate Development, General Counsel and Corporate Secretary
|
|
Tamesa T. Rogers
|
40
|
|
Senior Vice President, Human Resources
|
Patrick C.S. Lo
is our co-founder and has served as our Chairman and Chief Executive Officer since March 2002. He also served as temporary General Manager of our Commercial Business Unit from May 2012 until July 2013. Patrick founded NETGEAR with Mark G. Merrill with the singular vision of providing the appliances to enable everyone in the world to connect to the high speed Internet for information, communication, business transactions, education, and entertainment. From 1983 until 1995, Mr. Lo worked at Hewlett-Packard Company, where he served in various management positions in sales, technical support, product management, and marketing in the U.S. and Asia. Mr. Lo was named the Ernst & Young National Technology Entrepreneur of the Year in 2006. Mr. Lo received a B.S. degree in electrical engineering from Brown University.
Christine M. Gorjanc
has served as our Chief Financial Officer since January 2008, Chief Accounting Officer from December 2006 to January 2008 and Vice President, Finance from November 2005 to December 2006. From September 1996 through November 2005, Ms. Gorjanc served as Vice President, Controller, Treasurer and Assistant Secretary for Aspect Communications Corporation, a provider of workforce and customer management solutions. From October 1988 through September 1996, Ms. Gorjanc served as the Manager of Tax for Tandem Computers, Inc., a provider of fault-tolerant computer systems. Prior to that, Ms. Gorjanc served in management positions at Xidex Corporation, a manufacturer of storage devices, and spent eight years in public accounting with a number of accounting firms. Ms. Gorjanc holds a B.A. in Accounting (with honors) from the University of Texas at El Paso and a M.S. in Taxation from Golden Gate University.
Jeffrey M. Capone
serves as our Chief Technology Officer and joined us as Vice President of engineering through the acquisition of Leaf Networks in 2010. As CEO and co-founder of Leaf Networks, Mr. Capone was involved in all aspects of technology and corporate development including product and engineering management, technology licensing, patent filing and general management of the company. Before Leaf Networks, Mr. Capone co-founded Aligo, Inc. and served as the CTO until 2004 where he led the company’s technology vision. Prior to Aligo, Mr. Capone was an assistant professor at Arizona State University and Director of the Network Engineering and Wireless Telecom Laboratory. Mr. Capone's distinctions include the National Science Foundation's CAREER award, numerous IEEE Journal and conference publications. Mr. Capone holds a PhD in Electrical Engineering from Northeastern University.
Mark G. Merrill
is our co-founder and currently serves as our Senior Vice President of Advanced Engineering. In this role, Mr. Merrill continues to guide the emerging market efforts and work closely the RF engineering team to ensure technical leadership of our wireless networking products. Previously, Mr. Merrill served as our Chief Technology Officer from January 2003 to April 2013. From September 1999 to January 2003, he served as Vice President of Engineering and served as Director of Engineering from September 1995 to September 1999. Mr. Merrill received both a B.S. degree and an M.S. degree in Electrical Engineering from Stanford University.
Michael P. Clegg
has served as our Senior Vice President and General Manager of Service Provider Business Unit since August 2005. Prior to joining NETGEAR, Mr. Clegg served as VP Engineering, at Entrisphere (acquired by Ericsson) from February 2003 to January 2005, and COO and CTO at Virtual Access from September 1999 to April 2002. From March 1999 to September 1999, Mr. Clegg served as Vice President DSL Solutions at Fujitsu Telecommunications Europe which acquired the Westell Europe subsidiary, which Mr. Clegg led as Managing Director from May 1995 to September 1999. Prior to May 1995, Mr. Clegg served as Senior Consultant at Scientific Generics (now Sagentia) from December 1989 to April 1994. Mr. Clegg
9
received both a B.S. degree in Electrical Engineering and an M.S. degree in Digital Systems Design from the University of the Witwatersrand, South Africa.
John P. McHugh
serves as our Senior Vice President and General Manager of the Commercial Business Unit, overseeing the development and delivery of the industry’s premiere line of networking and storage solutions for SMB customers. Prior to joining us in July 2013, Mr. McHugh led the commercial networking business units at both Nortel and Hewlett-Packard. During his career, Mr. McHugh has held leadership roles in R&D, Marketing and Manufacturing, as well as having over 12 years of experience in General Management. Mr. McHugh holds a BS degree in Electrical Engineering and in Computer Science from Rose-Hulman Institute of Technology.
David S.G. Soares
has served as our Senior Vice President and General Manager of Retail Business Unit since April 2011, and Senior Vice President of Worldwide Sales from August 2004 to March 2011. Mr. Soares joined us in January 1998, and served as Vice President of EMEA sales from December 2003 to July 2004, EMEA Managing Director from April 2000 to November 2003, United Kingdom and Nordic Regional Manager from February 1999 to March 2000 and United Kingdom Country Manager from January 1998 to January 1999. Prior to joining us, Mr. Soares was at Hayes Microcomputer Products, a manufacturer of dial-up modems, where he was head of their retail, e-commerce and DMR channels in the UK. Mr. Soares attended Ridley College, Ontario Canada.
Michael F. Falcon
has served as our Senior Vice President of Worldwide Operations and Support since January 2009, Senior Vice President of Operations from March 2006 to January 2009, and Vice President of Operations from November 2002 to March 2006. Prior to joining us, Mr. Falcon was at Quantum Corporation, where he served as Vice President of Operations and Supply Chain Management from September 1999 to November 2002, Meridian Data (acquired by Quantum Corporation), where he served as Vice President of Operations from April 1999 to September 1999, and Silicon Valley Group, where he served as Director of Operations, Strategic Planning and Supply Chain Management from February 1989 to April 1999. Prior to February 1989, Mr. Falcon served in management positions at SCI Systems, an electronics manufacturer, Xerox Imaging Systems, a provider of scanning and text recognition solutions, and Plantronics, Inc., a provider of lightweight communication headsets. Mr. Falcon received a B.A. degree in Economics with honors from the University of California, Santa Cruz and has completed coursework in the M.B.A. program at Santa Clara University.
Andrew W. Kim
has served as our Senior Vice President of Corporate Development, General Counsel and Corporate Secretary since July 2013, Vice President, Legal and Corporate Development and Corporate Secretary from October 2008 until July 2013, and as our Associate General Counsel from March 2008 to October 2008. Prior to joining NETGEAR, Mr. Kim served as Special Counsel in the Corporate and Securities Department of Wilson Sonsini Goodrich & Rosati, a private law firm, where he represented public and private technology companies in a wide range of matters, including mergers and acquisitions, debt and equity financing arrangements, securities law compliance and corporate governance from 2000 to 2003 and 2006 to 2008. In between his two terms at Wilson Sonsini Goodrich & Rosati, Mr. Kim served as Partner in the Business and Finance Department of the law firm Schwartz Cooper Chartered in Chicago, Illinois, and was an Adjunct Professor of Entrepreneurship at the Illinois Institute of Technology. Mr. Kim holds a J.D. from Cornell Law School, and received a B.A. degree in history from Yale University.
Tamesa T. Rogers
has served as our Senior Vice President, Human Resources since July 2013, Vice President, Human Resources from January 2009 to July 2013, Director, Worldwide Human Resources from September 2006 to January 2009 and as our Senior Human Resources Manager from December 2003 to September 2006. From March 2000 to December 2003, Ms. Rogers worked at TriNet Employer Group, a professional employer organization, as a Human Resources Manager, providing HR consulting to technology companies throughout Silicon Valley. Prior to TriNet, Ms. Rogers served in various human resources functions in several Northern California companies. Ms. Rogers received a B.A. in Communication Studies from the University of California, Santa Barbara and an M.S. in Counseling from California State University, Hayward.
|
Item 1A.
|
Risk Factors
|
Investing in our common stock involves a high degree of risk. The risks described
below are not exhaustive of the risks that might affect our business. Other risks,
including those we currently deem immaterial, may also impact our business. Any of
the following risks could materially adversely affect our business operations,
results of operations and financial condition and could result in a significant
decline in our stock price.
Before deciding to purchase, hold or sell our common stock, you should carefully consider the risks described in this section. This section should be read in conjunction with the consolidated financial statements and accompanying notes thereto, and Management's Discussion and Analysis of Financial Condition and Results of Operations included in this Annual Report on Form 10-K.
10
We expect our operating results to fluctuate on a quarterly and annual basis, which could cause our stock price to fluctuate or decline.
Our operating results are difficult to predict and may fluctuate substantially from quarter-to-quarter or year-to-year for a variety of reasons, many of which are beyond our control. If our actual results were to fall below our estimates or the expectations of public market analysts or investors, our quarterly and annual results would be negatively impacted and the price of our stock could decline. Other factors that could affect our quarterly and annual operating results include those listed in the risk factors section of this report and others such as:
|
•
|
changes in the pricing policies of or the introduction of new products by us or our competitors;
|
|
•
|
unanticipated shift or decline in profit by geographical region that would adversely impact our tax rate;
|
|
•
|
slow or negative growth in the networking product, personal computer, Internet infrastructure, home electronics and related technology markets, as well as decreased demand for Internet access;
|
|
•
|
operational disruptions, such as transportation delays or failure of our order processing system, particularly if they occur at the end of a fiscal quarter;
|
|
•
|
geopolitical disruption leading to delay or even stoppage of our operations in manufacturing, transportation, technical support and research and development;
|
|
•
|
delay or failure of our service provider customers to purchase at the volumes that they forecast;
|
|
•
|
foreign currency exchange rate fluctuations in the jurisdictions where we transact sales and expenditures in local currency;
|
|
•
|
changes in or consolidation of our sales channels and wholesale distributor relationships or failure to manage our sales channel inventory and warehousing requirements;
|
|
•
|
delay or failure to fulfill orders for our products on a timely basis;
|
|
•
|
allowance for bad debts exposure with our existing customers and new customers, particularly as we expand into new international markets;
|
|
•
|
disruptions or delays related to our financial and enterprise resource planning systems;
|
|
•
|
our inability to accurately forecast product demand, particularly from our service provider sales channel, resulting in increased inventory exposure;
|
|
•
|
component supply constraints from our vendors;
|
|
•
|
unfavorable level of inventory and turns;
|
|
•
|
shift in overall product mix sales from higher to lower margin products, or from one business unit to another, that would adversely impact our margins;
|
|
•
|
terms of our contracts with customers or suppliers that cause us to incur additional expenses or assume additional liabilities;
|
|
•
|
the inability to maintain stable operations by our suppliers and other parties with which we have commercial relationships;
|
|
•
|
delays in the introduction of new products by us or market acceptance of these products;
|
|
•
|
an increase in price protection claims, redemptions of marketing rebates, product warranty and stock rotation returns or allowance for doubtful accounts;
|
|
•
|
litigation involving alleged patent infringement;
|
11
|
•
|
epidemic or widespread product failure, or unanticipated safety issues, in one or more of our products;
|
|
•
|
challenges associated with integrating acquisitions that we make, or with realizing value from our strategic investments in other companies;
|
|
•
|
failure to effectively manage our third party customer support partners which may result in customer complaints and/or harm to the NETGEAR brand;
|
|
•
|
our inability to monitor and ensure compliance with our anti-corruption compliance program and domestic and international anti-corruption laws and regulations, whether in relation to our employees or with our suppliers or customers;
|
|
•
|
labor unrest at facilities managed by our third-party manufacturers;
|
|
•
|
seasonal shifts in end market demand for our products, particularly in our retail business;
|
|
•
|
unanticipated increase in costs, including air freight, associated with shipping and delivery of our products;
|
|
•
|
our failure to implement and maintain the appropriate internal controls over financial reporting which may result in restatements of our financial statements; and
|
|
•
|
any changes in accounting rules.
|
As a result, period-to-period comparisons of our operating results may not be meaningful, and you should not rely on them as an indication of our future performance.
Our stock price may be volatile and your investment in our common stock could suffer a decline in value.
With the continuing uncertainty about economic conditions in Europe, Australia, the United States and elsewhere internationally, there has been significant volatility in the market price and trading volume of securities of technology and other companies, which may be unrelated to the financial performance of these companies. These broad market fluctuations may negatively affect the market price of our common stock.
Some specific factors that may have a significant effect on our common stock market price include:
|
•
|
actual or anticipated fluctuations in our operating results or our competitors' operating results;
|
|
•
|
actual or anticipated changes in the growth rate of the general networking sector, our growth rates or our competitors' growth rates;
|
|
•
|
conditions in the financial markets in general or changes in general economic conditions, including government efforts to stabilize currencies;
|
|
•
|
interest rate or currency exchange rate fluctuations;
|
|
•
|
our ability to report accurate financial results in our periodic reports filed with the SEC;
|
|
•
|
our ability or inability to raise additional capital; and
|
|
•
|
changes in stock market analyst recommendations regarding our common stock, other comparable companies or our industry generally.
|
12
If we fail to continue to introduce or acquire new products that achieve broad market acceptance on a timely basis, we will not be able to compete effectively and we will be unable to increase or maintain net revenue and gross margins.
We operate in a highly competitive, quickly changing environment, and our future success depends on our ability to develop or acquire, and introduce new products that achieve broad market acceptance. Our future success will depend in large part upon our ability to identify demand trends in the commercial business, retail, and service provider markets and quickly develop or acquire, and manufacture and sell products that satisfy these demands in a cost effective manner. In order to differentiate our products from our competitors' products, we must continue to increase our focus and capital investment in research and development, including software development. Successfully predicting demand trends is difficult, and it is very difficult to predict the effect introducing a new product will have on existing product sales. We will also need to respond effectively to new product announcements by our competitors by quickly introducing competitive products.
We recently developed and launched new products worldwide under a new brand as an effort to increase sales in a particular market segment. The new brand products may adversely affect sales of our existing products. Marketing of the new brand may also lead to confusion with our existing customers. We have little to no experience in selling a new brand simultaneously with our existing product portfolio. If we are unable to effectively manage the pricing, marketing, sale and distribution of products under our new brand together with our existing products, our business will be harmed.
In addition, we have acquired companies and technologies in the past and as a result, have introduced new product lines in new markets. We may not be able to successfully manage integration of the new product lines with our existing products. Selling new product lines in new markets will require our management to learn different strategies in order to be successful. We may be unsuccessful in launching a newly acquired product line in new markets which requires management of new suppliers, potential new customers and new business models. Our management may not have the experience of selling in these new markets and we may not be able to grow our business as planned. For example, our recent acquisition of the VueZone product line continues to require significant management effort to successfully scale and launch the products worldwide. Similarly, in April 2013, we completed the acquisition of the AirCard product line from Sierra Wireless. If we are unable to effectively and successfully integrate these new product lines, we may not be able to increase or maintain our sales and our gross margins may be adversely affected.
We have experienced delays and quality issues in releasing new products in the past, which resulted in lower quarterly net revenue than expected. In addition, we have experienced, and may in the future experience, product introductions that fall short of our projected rates of market adoption. Online Internet reviews of our products are increasingly becoming a significant factor in the success of our new product launches, especially in the retail business unit. If we are unable to quickly respond to negative reviews, including end user reviews posted on various prominent online retailers, our ability to sell these products will be harmed. Any future delays in product development and introduction, or product introductions that do not meet broad market acceptance, or unsuccessful launches of newly acquired product lines could result in:
|
•
|
loss of or delay in revenue and loss of market share;
|
|
•
|
negative publicity and damage to our reputation and brand;
|
|
•
|
a decline in the average selling price of our products;
|
|
•
|
adverse reactions in our sales channels, such as reduced shelf space, reduced online product visibility, or loss of sales channel; and
|
|
•
|
increased levels of product returns.
|
Throughout the past couple of years, we have significantly increased the rate of our new product introductions. If we cannot sustain that pace of product introductions, either through rapid innovation or acquisition of new products or product lines, we may not be able to maintain or increase the market share of our products. In addition, if we are unable to successfully introduce or acquire new products with higher gross margins, our net revenue and overall gross margin would likely decline.
Some of our competitors have substantially greater resources than we do, and to be competitive we may be required to lower our prices or increase our sales and marketing expenses, which could result in reduced margins and loss of market share.
We compete in a rapidly evolving and fiercely competitive market, and we expect competition to continue to be intense, including price competition. Our principal competitors in the commercial business market include Allied Telesys, Barracuda, Buffalo, Data Robotics, Dell, D-Link, Fortinet, Hewlett-Packard, Huawei, Cisco Systems, the Linksys line of products under
13
Belkin, QNAP Systems, Seagate Technology, SonicWALL, Synology, TRENDnet, WatchGuard and Western Digital. Our principal competitors in the home market for networking devices and television connectivity products include Amped Wireless, Apple, AsusTEK, Belkin, D-Link, the Linksys line of products under Belkin, Roku, TP-Link and Western Digital. Our principal competitors in the broadband service provider market include Actiontec, ARRIS, Compal Broadband, Comtrend, D-Link, Hitron, Huawei, Motorola, NetComm Wireless, Novatel Wireless, Pace, Sagem, Scientific Atlanta-a Cisco company, SMC Networks, TechniColor, Ubee, ZTE and ZyXEL. Other competitors include numerous local vendors such as Devolo, LEA, AVM and the Hercules brand of Guillemot Corporation in Europe, Corega and Melco in Japan and TP-Link in China. In addition, these local vendors may target markets outside of their local regions and may increasingly compete with us in other regions worldwide. Our potential competitors also include other consumer electronics vendors, including LG Electronics, Microsoft, Panasonic, Samsung, Sony, Toshiba and Vizio, who could integrate networking and streaming capabilities into their line of products, such as televisions, set top boxes and gaming consoles, and our channel customers who may decide to offer self-branded networking products. We also face competition from service providers who may bundle a free networking device with their broadband service offering, which would reduce our sales if we are not the supplier of choice to those service providers. In the service provider space, we are also facing significant and increased competition from original design manufacturers, or ODM's, and contract manufacturers who are selling and attempting to sell their products directly to service providers around the world. In addition, as we expand our product portfolio to include home monitoring cameras and services, we also face competition from incumbents and specialty providers in this space, including Axis Communications, Belkin, D-Link, the Linksys line of products under Belkin, Logitech, Dropcam, and Sercomm.
Many of our existing and potential competitors have longer operating histories, greater name recognition and substantially greater financial, technical, sales, marketing and other resources. These competitors may, among other things, undertake more extensive marketing campaigns, adopt more aggressive pricing policies, obtain more favorable pricing from suppliers and manufacturers, and exert more influence on sales channels than we can. We anticipate that current and potential competitors will also intensify their efforts to penetrate our target markets. For example, price competition is intense in our industry in certain geographical regions and product categories. Many of our competitors in the service provider and retail spaces price their products significantly below our product costs in order to gain market share. Average sales prices have declined in the past and may again decline in the future. These competitors may have more advanced technology, more extensive distribution channels, stronger brand names, greater access to shelf space in retail locations, bigger promotional budgets and larger customer bases than we do. In addition, many of these competitors leverage a broader product portfolio and offer lower pricing as part of a more comprehensive end-to-end solution which we may not have. These companies could devote more capital resources to develop, manufacture and market competing products than we could. Our competitors may also acquire other companies in the market and leverage combined resources to gain market share. For example, in March 2013, Belkin completed its acquisition of the Linksys division from Cisco. Belkin and Linksys are two of our significant competitors. The combined company may have synergies which increase opportunities for Belkin to gain market share, especially in North America. If any of these companies are successful in competing against us, our sales could decline, our margins could be negatively impacted and we could lose market share, any of which could seriously harm our business and results of operations.
Economic conditions are likely to materially adversely affect our revenue and results of operations.
Our business has been and may continue to be affected by a number of factors that are beyond our control such as general geopolitical, economic and business conditions, conditions in the financial markets, and changes in the overall demand for networking products. A severe and/or prolonged economic downturn could adversely affect our customers' financial condition and the levels of business activity of our customers. Continued weakness in, and uncertainty about, global economic conditions continue to cause businesses to postpone spending in response to tighter credit, negative financial news and/or declines in income or asset values, which could have a material negative effect on the demand for networking products.
The recent indications of slow economic growth throughout various regions worldwide, especially in Europe, have presented significant challenges to our business. For example, we believe that decreased demand in Europe adversely impacted our net revenue in all three of our business units during fiscal 2013, relative to prior periods. If conditions in the global economy, including Europe, Australia and the United States, or other key vertical or geographic markets continue to remain weak and uncertain or weaken even further, such conditions could have a material adverse impact on our business, operating results and financial condition. In addition, if we are unable to successfully anticipate changing economic and political conditions, we may be unable to effectively plan for and respond to those changes, which could materially adversely affect our business and results of operations.
In addition, the ongoing economic problems affecting the financial markets and the ongoing uncertainty in global economic conditions have resulted in a number of adverse effects including a low level of liquidity in many financial markets, extreme volatility in credit, equity, currency and fixed income markets, instability in the stock market and high unemployment. For example, the recent challenges faced by the European Union to stabilize some of its member economies, such as Greece, Portugal, Spain, Hungary and even Italy, has had international implications affecting the stability of global financial markets and hindering economies worldwide. Many member nations in the European Union have been addressing the issues with controversial austerity
14
measures. Should the European Union monetary policy measures be insufficient to restore confidence and stability to the financial markets, the recovery of the global economy, including the U.S. and European Union economies where we have a significant presence, could be hindered or reversed, which could have a material adverse effect on us. For example, the aggregate number of resellers of our products decreased during the third quarter of 2012; we believe this was caused by the difficult worldwide economic environment, and especially the difficulties experienced in Europe. There could also be a number of other follow-on effects from these economic developments and negative economic trends on our business, including the inability of customers to obtain credit to finance purchases of our products; customer insolvencies; decreased customer confidence to make purchasing decisions; decreased customer demand; and decreased customer ability to pay their trade obligations.
If we fail to successfully overcome the challenges associated with managing and profitably growing our broadband service provider sales channel, our net revenue and gross profit will be negatively impacted.
We sell a substantial portion of our products through broadband service providers worldwide. Our service provider business unit has accounted for a significant portion of our growth over the last several fiscal quarters. Our service provider business is increasingly becoming a larger proportion of our business, especially after our recent acquisition of the Sierra Wireless AirCard business. The service provider business is challenging and exceptionally competitive. We face a number of challenges associated with penetrating, marketing and selling to the broadband service provider channel that differ from the challenges we have traditionally faced with the other channels. Difficulties and challenges in selling to service providers include a longer sales cycle, more stringent product testing and validation requirements, a higher level of customization demands, requirements that suppliers take on a larger share of the risk with respect to contractual business terms, competition from established suppliers, pricing pressure resulting in lower gross margins, and irregular and unpredictable ordering habits. For example, even if we have a product which a service provider customer may wish to purchase, we may choose not to supply products to the potential service provider customer if the contract requirements, such as service level requirements, penalties, and liability provisions, are too onerous. Accordingly, our business may be harmed and our revenues may be reduced. We have, in exceptional limited circumstances, while still in contract negotiations, shipped products in advance of and subject to agreement on a definitive contract. We do not record revenue from these shipments until a definitive contract exists. There is risk that we do not ultimately close and sign a definitive contract. It this occurs, the timing of revenue recognition is uncertain and our business would be harmed. In addition, we often commence building custom-made products prior to execution of a contract in order to meet the customer's contemplated launch dates and requirements. Service provider products are generally custom-made for a specific customer and may not be salable to other customers or in other channels. If we have pre-built custom-made products but do not come to agreement on a definitive contract, we may be forced to scrap the custom-made products or re-work them at substantial cost and our business would be harmed.
Further, successful engagements with service provider customers requires a constant analysis of technology trends. If we are unable to anticipate technology trends and service provider customer product needs, and to allocate research and development resources to the right projects, we may not be successful in continuing to sell products to service provider customers. In addition, because our service provider customers command significant resources, including for software support, and demand extremely competitive pricing, our ODM's are starting to decline to develop service provider products on an ODM basis. Accordingly, as our ODM's increasingly limit development of our service provider products, our service provider business will be harmed if we cannot replace this with in-house development.
Further, as the deployment of DOCSIS 3.0 technology by broadband service providers continues to mature, we anticipate competing in an extremely price sensitive market and our margins may be affected. Orders from service providers generally tend to be large but sporadic, which causes our revenues from them to fluctuate and challenges our ability to accurately forecast demand from them. In particular, managing inventory and production of our products for our service provider customers is a challenge. Many of our service provider customers have irregular purchasing requirements. These customers may decide to cancel orders for customized products specific to that customer, and we may not be able to reconfigure and sell those products in other channels. In addition, these customers may issue unforecasted orders for products which we may not be able to produce in a timely manner and as such, we may not be able to accept and deliver on such unforecasted orders. In certain cases, we may commit to fixed-price, long term purchase orders, with such orders priced in foreign currencies which could lose value over time in the event of adverse changes in foreign exchange rates. Even if we are selected as a supplier, typically a service provider will also designate a second source supplier, which over time will reduce the aggregate orders that we receive from that service provider. For example, we have been at the forefront of developing and selling DOCSIS 3.0 products to our service provider customers in the past couple of years. As our competitors develop DOCSIS 3.0 products, our service provider customers may use these competitor products as an alternate source for this technology. Our service provider customers may then require us to lower our prices or they may choose to purchase more DOCSIS 3.0 products from our competitors. Accordingly, our business may be harmed and our revenues may be reduced.
If we were to lose a service provider customer for any reason, we may experience a material and immediate reduction in forecasted revenue that may cause us to be below our net revenue and operating margin expectations for a particular period of
15
time and therefore adversely affect our stock price. For example, many of our competitors in the service provider space aggressively price their products in order to gain market share. We may not be able to match the lower prices offered by our competitors. Many of the service provider customers will seek to purchase from the lowest cost provider, notwithstanding that our products may be higher quality or that our products were previously validated for use on their proprietary network. Accordingly, we may lose customers who have lower, more aggressive pricing and our revenues may be reduced. In addition, service providers may choose to prioritize the implementation of other technologies or the roll out of other services than home networking. Weakness in orders from this industry could have a material adverse effect on our business, operating results, and financial condition. We have seen slowdowns in capital expenditures by certain of our service provider customers in the past, and believe there may be potential for similar slowdowns in the future. Any slowdown in the general economy, over supply, consolidation among service providers, regulatory developments and constraint on capital expenditures could result in reduced demand from service providers and therefore adversely affect our sales to them. If we do not successfully overcome these challenges, we will not be able to profitably grow our service provider sales channel and our growth will be slowed.
We rely on a limited number of retailers, wholesale distributors and service provider customers for a substantial portion of our sales, and our net revenue could decline if they refuse to pay our requested prices or reduce their level of purchases or if there is significant consolidation in our customer base which results in fewer customers for our products.
We sell a substantial portion of our products through retailers, including Best Buy Co., Inc. and its affiliates, wholesale distributors, including Ingram Micro, Inc. and Tech Data Corporation, and service providers, including Virgin Media Limited and AT&T. We expect that a significant portion of our net revenue will continue to come from sales to a small number of customers for the foreseeable future. In addition, because our accounts receivable are often concentrated with a small group of purchasers, the failure of any of them to pay on a timely basis, or at all, would reduce our cash flow. We are also exposed to increased credit risk if any one of these limited numbers of customers fails or becomes insolvent. We generally have no minimum purchase commitments or long-term contracts with any of these customers. These purchasers could decide at any time to discontinue, decrease or delay their purchases of our products. If our customers increase the size of their product orders without sufficient lead-time for us to process the order, our ability to fulfill product demands would be compromised. These customers have a variety of suppliers to choose from and therefore can make substantial demands on us, including demands on product pricing and on contractual terms, which often results in the allocation of risk to us as the supplier. Accordingly, the prices that they pay for our products are subject to negotiation and could change at any time. Our ability to maintain strong relationships with our principal customers is essential to our future performance. If any of our major customers reduce their level of purchases or refuse to pay the prices that we set for our products, our net revenue and operating results could be harmed. Our traditional retail customers have faced increased and significant competition from online retailers, and some of these traditional retail customers have increasingly become a smaller portion of our business. If key retail customers continue to reduce their level of purchases, our business could be harmed.
Additionally, if there is consolidation among our customer base, certain customers may be able to command increased leverage in negotiating prices and other terms of sale, which could adversely affect our profitability. In addition, if, as a result of increased leverage, customer pressures require us to reduce our pricing such that our gross margins are diminished, we could decide not to sell our products to a particular customer, which could result in a decrease in our revenue. Consolidation among our customer base may also lead to reduced demand for our products, replacement of our products with those of our competitors and cancellations of orders, each of which would harm our operating results. Consolidation among our service provider customers worldwide may also make it more difficult to grow our service provider business, given the fierce competition for the already limited number of service providers worldwide and the long sales cycles to close deals. For example, in June 2013, Liberty Global, a service provider with operations worldwide, completed its acquisition of Virgin Media Limited, one of our significant customers. Because we have not conducted business with Liberty Global in the past, Virgin Media may be directed by Liberty Global to develop relationships and business with other Liberty Global vendors, many of which are our competitors. Similarly, in July 2013 SoftBank Corp. acquired majority ownership of Sprint Nextel Corp., the parent company of one of our significant customers for AirCard products. If consolidation among our customer base becomes more prevalent, our operating results may be harmed.
We depend on large, recurring purchases from certain significant customers, and a loss, cancellation or delay in purchases by these customers could negatively affect our revenue.
The loss of recurring orders from any of our more significant customers could cause our revenue and profitability to suffer. Our ability to attract new customers will depend on a variety of factors, including the cost-effectiveness, reliability, scalability, breadth and depth of our products. In addition, a change in the mix of our customers, or a change in the mix of direct and indirect sales, could adversely affect our revenue and gross margins.
Although our financial performance may depend on large, recurring orders from certain customers and resellers, we do not generally have binding commitments from them. For example:
16
|
•
|
our reseller agreements generally do not require substantial minimum purchases;
|
|
•
|
our customers can stop purchasing and our resellers can stop marketing our products at any time; and
|
|
•
|
our reseller agreements generally are not exclusive.
|
Further, our revenue may be impacted by significant one-time purchases which are not contemplated to be repeatable. While such purchases are reflected in our financial statements, we do not rely on and do not forecast for continued significant one-time purchases. As a result, lack of repeatable one-time purchases will adversely affect our revenue.
Because our expenses are based on our revenue forecasts, a substantial reduction or delay in sales of our products to, or unexpected returns from, customers and resellers, or the loss of any significant customer or reseller, could harm or otherwise have a negative impact to our operating results. Although our largest customers may vary from period to period, we anticipate that our operating results for any given period will continue to depend on large orders from a small number of customers.
If we do not effectively manage our sales channel inventory and product mix, we may incur costs associated with excess inventory, or lose sales from having too few products.
If we are unable to properly monitor, control and manage our sales channel inventory and maintain an appropriate level and mix of products with our wholesale distributors and within our sales channels, we may incur increased and unexpected costs associated with this inventory. We generally allow wholesale distributors and traditional retailers to return a limited amount of our products in exchange for other products. Under our price protection policy, if we reduce the list price of a product, we are often required to issue a credit in an amount equal to the reduction for each of the products held in inventory by our wholesale distributors and retailers. If our wholesale distributors and retailers are unable to sell their inventory in a timely manner, we might lower the price of the products, or these parties may exchange the products for newer products. Also, during the transition from an existing product to a new replacement product, we must accurately predict the demand for the existing and the new product. For example, in the first quarter of 2013, while transitioning from our existing ReadyNAS product line to our new line of ReadyNAS products, we were not able to execute on the launch of the new product. This led to our inability to have sufficient quantities of the existing line of ReadyNAS products as we had ramped down supply anticipating the transition, which adversely affected our profitability for the quarter.
We determine production levels based on our forecasts of demand for our products. Actual demand for our products depends on many factors, which makes it difficult to forecast. We have experienced differences between our actual and our forecasted demand in the past and expect differences to arise in the future. If we improperly forecast demand for our products we could end up with too many products and be unable to sell the excess inventory in a timely manner, if at all, or, alternatively we could end up with too few products and not be able to satisfy demand. This problem is exacerbated because we attempt to closely match inventory levels with product demand leaving limited margin for error. If these events occur, we could incur increased expenses associated with writing off excessive or obsolete inventory, lose sales, incur penalties for late delivery or have to ship products by air freight to meet immediate demand incurring incremental freight costs above the sea freight costs, a preferred method, and suffering a corresponding decline in gross margins.
Our business is subject to the risks of international operations.
We derive a significant portion of our revenue from international operations. As a result, our financial condition and operating results could be significantly affected by risks associated with international activities, including economic and labor conditions, political instability, tax laws, changes in the value of the U.S. dollar versus local currencies, and natural disasters. Margins on sales of our products in foreign countries, and on sales of products that include components obtained from foreign suppliers, could be materially adversely affected by foreign currency exchange rate fluctuations and by international trade regulations. Additionally, certain foreign countries have complex regulatory requirements as conditions of doing business. For example, the United Kingdom Anti-Bribery Act of 2010 is broad legislation that prohibits bribery and applies to our operations worldwide. This foreign legislation follows in the spirit of the U.S. Foreign Corrupt Practices Act and focuses additional governmental efforts on anticorruption efforts worldwide. Meeting these requirements may increase our operating expenses as we continue to expand internationally.
We obtain several key components from limited or sole sources, and if these sources fail to satisfy our supply requirements or we are unable to properly manage our supply requirements with our third party manufacturers, we may lose sales and experience increased component costs.
Any shortage or delay in the supply of key product components would harm our ability to meet scheduled product deliveries. Many of the semiconductors used in our products are specifically designed for use in our products and are obtained from sole
17
source suppliers on a purchase order basis. In addition, some components that are used in all our products are obtained from limited sources. These components include connector jacks, plastic casings and physical layer transceivers. We also obtain switching fabric semiconductors, which are used in our Ethernet switches and Internet gateway products, and wireless local area network chipsets, which are used in all of our wireless products, from a limited number of suppliers. Semiconductor suppliers have experienced and continue to experience component shortages themselves, such as with substrates used in manufacturing chipsets, which in turn adversely impact our ability to procure semiconductors from them. Our third-party manufacturers generally purchase these components on our behalf on a purchase order basis, and we do not have any contractual commitments or guaranteed supply arrangements with our suppliers. If demand for a specific component increases, we may not be able to obtain an adequate number of that component in a timely manner. In addition, if worldwide demand for the components increases significantly, the availability of these components could be limited. Further, our suppliers may experience financial or other difficulties as a result of uncertain and weak worldwide economic conditions. Other factors which may affect our suppliers' ability to supply components to us include internal management or reorganizational issues, such as roll-out of new equipment which may delay or disrupt supply of previously forecasted components. It could be difficult, costly and time consuming to obtain alternative sources for these components, or to change product designs to make use of alternative components. In addition, difficulties in transitioning from an existing supplier to a new supplier could create delays in component availability that would have a significant impact on our ability to fulfill orders for our products.
We provide our third-party manufacturers with a rolling forecast of demand, which they use to determine our material and component requirements. Lead times for ordering materials and components vary significantly and depend on various factors, such as the specific supplier, contract terms and demand and supply for a component at a given time. Some of our components have long lead times, such as wireless local area network chipsets, switching fabric chips, physical layer transceivers, connector jacks and metal and plastic enclosures. If our forecasts are not timely provided or are less than our actual requirements, our third-party manufacturers may be unable to manufacture products in a timely manner. For example, in the first quarter of 2013, our third party manufacturers were not able to manufacture sufficient quantities of our new line of ReadyNAS products in order to meet demand, adversely affecting our profitability for the quarter. If our forecasts are too high, our third-party manufacturers will be unable to use the components they have purchased on our behalf. The cost of the components used in our products tends to drop rapidly as volumes increase and the technologies mature. Therefore, if our third-party manufacturers are unable to promptly use components purchased on our behalf, our cost of producing products may be higher than our competitors due to an oversupply of higher-priced components. Moreover, if they are unable to use components ordered at our direction, we will need to reimburse them for any losses they incur.
If we are unable to obtain a sufficient supply of components, or if we experience any interruption in the supply of components, our product shipments could be reduced or delayed or our cost of obtaining these components may increase. Component shortages and delays affect our ability to meet scheduled product deliveries, damage our brand and reputation in the market, and cause us to lose sales and market share. For example, component shortages and disruptions in supply in the past have limited our ability to supply all the worldwide demand for our products and our revenue was affected.
Another example relates to the record flooding in Thailand in the third quarter of 2011. Many major manufacturers of hard disk drives and their component suppliers maintain significant operations in Thailand in areas affected by the flooding. These include most, if not all, of our direct and indirect suppliers of hard disk drives for our ReadyNAS product line. All of our major direct and indirect suppliers of hard disk drives informed us that our supply chain would be constrained for an indefinite amount of time, in some cases up to six months. Some therefore declared a force majeure event and have stated that, in addition to and because of the supply constraints, pricing for hard disk drives would increase significantly until they were able to stabilize the situation. As a result, we experienced increased prices in the cost of hard disk drives and ceased accepting any additional orders containing ReadyNAS products with hard disk drives at then current prices and all shipments of ReadyNAS products with hard disk drives were placed on hold. In addition, all sales and marketing promotions involving ReadyNAS products were terminated temporarily. Further, we declared the existence of a force majeure event under our contracts with certain customers. Accordingly, our business was harmed. Certain events or natural disasters that occur in the future may harm our business as well.
If we lose the services of our Chairman and Chief Executive Officer, Patrick C.S. Lo, or our other key personnel, we may not be able to execute our business strategy effectively.
Our future success depends in large part upon the continued services of our key technical, sales, marketing, finance and senior management personnel. In particular, the services of Patrick C.S. Lo, our Chairman and Chief Executive Officer, who has led our company since its inception, are very important to our business. We do not maintain any key person life insurance policies. Our business model requires extremely skilled and experienced senior management who are able to withstand the rigorous requirements and expectations of our business. Our success depends on senior management being able to execute at a very high level. The loss of any of our senior management or other key research, development, sales or marketing personnel, particularly if lost to competitors, could harm our ability to implement our business strategy and respond to the rapidly changing needs of our
18
business. While we have adopted an emergency succession plan for the short term, we have not formally adopted a long term succession plan. As a result, if we suffer the loss of services of any key executive, our long term business results may be harmed. While we believe that we have mitigated some of the business execution and business continuity risk with our recent reorganization into three business units, the loss of any key personnel would still be disruptive and harm our business, especially given that our business is leanly staffed and relies on the expertise and high performance of our key personnel. In addition, because we do not have a formal long term succession plan, we may not be able to have the proper personnel in place to effectively execute our long term business strategy if Patrick Lo or other key personnel retire, resign or are otherwise terminated.
We have been and will be investing increased additional in-house resources on software research and development, which could disrupt our ongoing business and present distinct risks from our historically hardware-centric business.
We plan to continue to evolve our historically hardware-centric business model towards a model that includes more sophisticated software offerings. As such, we will further evolve the focus of our organization towards the delivery of more integrated hardware and software solutions for our customers. While we have invested in software development in the past, we will be expending additional resources in this area in the future. Such endeavors may involve significant risks and uncertainties, including distraction of management from current operations, insufficient revenue to offset liabilities assumed and expenses associated with the strategy, inadequate return on capital, and unidentified issues not discovered in our due diligence. Software development is inherently risky for a company such as ours with a historically hardware-centric business model, and accordingly, our efforts in software development may not be successful. Any increased investment in software research and development may materially adversely affect our financial condition and operating results.
We may spend a proportionately greater amount on software research and development in the future. If we cannot proportionately decrease our cost structure in response to competitive price pressures, our gross margin and, therefore, our profitability could be adversely affected. In addition, if our software solutions, pricing and other factors are not sufficiently competitive, or if there is an adverse reaction to our product decisions, we may lose market share in certain areas, which could adversely affect our revenue and prospects.
Software research and development is complex. We must make long-term investments, develop or obtain appropriate intellectual property and commit significant resources before knowing whether our predictions will accurately reflect customer demand for our products and services. We must accurately forecast mixes of software solutions and configurations that meet customer requirements, and we may not succeed at doing so within a given product's life cycle or at all. Any delay in the development, production or marketing of a new software solution could result in us not being among the first to market, which could further harm our competitive position. In addition, our regular testing and quality control efforts may not be effective in controlling or detecting all quality issues and defects. We may be unable to determine the cause, find an appropriate solution or offer a temporary fix to address defects. Finding solutions to quality issues or defects can be expensive and may result in additional warranty, replacement and other costs, adversely affecting our profits. If new or existing customers have difficulty with our software solutions or are dissatisfied with our services, our operating margins could be adversely affected, and we could face possible claims if we fail to meet our customers' expectations. In addition, quality issues can impair our relationships with new or existing customers and adversely affect our brand and reputation, which could adversely affect our operating results.
As part of growing our business, we have made and expect to continue to make acquisitions. If we fail to successfully select, execute or integrate our acquisitions, then our business and operating results could be harmed and our stock price could decline.
From time to time, we will undertake acquisitions to add new product lines and technologies, gain new sales channels or enter into new sales territories. For example, in June 2012 and June 2013 we acquired select assets of two separate engineering operations in India to enhance our wireless product offerings in our commercial business unit. Additionally in July 2012, we closed the acquisition of privately held AVAAK, Inc., creators of the VueZone® home video monitoring system, and in April 2013, we closed the acquisition of the AirCard business of Sierra Wireless, Inc. The AirCard acquisition represents our largest acquisition, both in terms of consideration and headcount. Acquisitions involve numerous risks and challenges, including but not limited to the following:
|
•
|
integrating the companies, assets, systems, products, sales channels and personnel that we acquire;
|
|
•
|
higher than anticipated acquisition and integration costs and expenses;
|
|
•
|
reliance on third parties to provide transition services for a period of time after closing to ensure an orderly transition of the business;
|
19
|
•
|
growing or maintaining revenues to justify the purchase price and the increased expenses associated with acquisitions;
|
|
•
|
entering into territories or markets with which we have limited or no prior experience;
|
|
•
|
establishing or maintaining business relationships with customers, vendors and suppliers who may be new to us;
|
|
•
|
overcoming the employee, customer, vendor and supplier turnover that may occur as a result of the acquisition;
|
|
•
|
disruption of, and demands on, our ongoing business as a result of integration activities including diversion of management's time and attention from running the day to day operations of our business;
|
|
•
|
inability to implement uniform standards, disclosure controls and procedures, internal controls over financial reporting and other procedures and policies in a timely manner;
|
|
•
|
inability to realize the anticipated benefits of or successfully integrate with our existing business the businesses, products, technologies or personnel that we acquire; and
|
|
•
|
potential post-closing disputes.
|
As part of undertaking an acquisition, we may also significantly revise our capital structure or operational budget, such as issuing common stock that would dilute the ownership percentage of our stockholders, assuming liabilities or debt, utilizing a substantial portion of our cash resources to pay for the acquisition or significantly increasing operating expenses. Our acquisitions have resulted and may in the future result in charges being taken in an individual quarter as well as future periods, which results in variability in our quarterly earnings. In addition, our effective tax rate in any particular quarter may also be impacted by acquisitions. Following the closing of an acquisition, we may also have disputes with the seller regarding contractual requirements and covenants. Any such disputes may be time consuming and distract management from other aspects of our business. In addition, if we continue to increase the pace or size of acquisitions, as we have done since mid-2012, we will have to expend significant management time and effort into the transactions and the integrations and we may not have the proper human resources bandwidth to ensure successful integrations and accordingly, our business could be harmed.
As part of the terms of acquisition, we may commit to pay additional contingent consideration if certain revenue or other performance milestones are met. We are required to evaluate the fair value of such commitments at each reporting date and adjust the amount recorded if there are changes to the fair value.
We cannot ensure that we will be successful in selecting, executing and integrating acquisitions. Particularly with the acquisition of the AirCard business of Sierra Wireless, our management has been heavily focused on executing a successful integration given the size and significance of that acquisition. Failure to manage and successfully integrate acquisitions, especially the AirCard business of Sierra Wireless, could materially harm our business and operating results. In addition, if stock market analysts or our stockholders do not support or believe in the value of the acquisitions that we choose to undertake, our stock price may decline.
The average selling prices of our products typically decrease rapidly over the sales cycle of the product, which may negatively affect our net revenue and gross margins.
Our products typically experience price erosion, a fairly rapid reduction in the average unit selling prices over their respective sales cycles. In order to sell products that have a falling average unit selling price and maintain margins at the same time, we need to continually reduce product and manufacturing costs. To manage manufacturing costs, we must collaborate with our third-party manufacturers to engineer the most cost-effective design for our products. In addition, we must carefully manage the price paid for components used in our products. We must also successfully manage our freight and inventory costs to reduce overall product costs. We also need to continually introduce new products with higher sales prices and gross margins in order to maintain our overall gross margins. If we are unable to manage the cost of older products or successfully introduce new products with higher gross margins, our net revenue and overall gross margin would likely decline.
Changes in tax rates, adverse changes in tax laws or exposure to additional income tax liabilities could affect our future profitability.
Factors that could materially affect our future effective tax rates include but are not limited to:
|
•
|
changes in the regulatory environment;
|
20
|
•
|
changes in accounting and tax standards or practices;
|
|
•
|
changes in the composition of operating income by tax jurisdiction; and
|
|
•
|
our operating results before taxes.
|
We are subject to income taxes in the United States and numerous foreign jurisdictions. Our effective tax rate has fluctuated in the past and may fluctuate in the future. Future effective tax rates could be affected by changes in the composition of earnings in countries with differing tax rates, changes in deferred tax assets and liabilities, or changes in tax laws. Numerous foreign jurisdictions have been influenced by studies performed by the OECD (Organization of Economic Cooperation and Development) and are increasingly active in evaluating changes to their tax laws. The OECD, which represents a coalition of member countries, has issued various white papers addressing tax base erosion and jurisdictional profit shifting (BEPS). Their recommendations are aimed at combatting what they believe is tax avoidance. Changes in tax laws could affect the distribution of our earnings and adversely affect our results.
We are also subject to examination by the Internal Revenue Service, or IRS, and other tax authorities, including state revenue agencies and foreign governments. While we regularly assess the likelihood of favorable or unfavorable outcomes resulting from examinations by the IRS and other tax authorities to determine the adequacy of our provision for income taxes, there can be no assurance that the actual outcome resulting from these examinations will not materially adversely affect our financial condition and operating results. Additionally, the IRS and several foreign tax authorities have increasingly focused attention on intercompany transfer pricing with respect to sales of products and services and the use of intangible assets. Tax authorities could disagree with our intercompany charges, cross-jurisdictional transfer pricing or other matters and assess additional taxes. If we do not prevail in any such disagreements, our profitability may be affected.
We must comply with indirect tax laws in multiple foreign jurisdictions. Audits of our compliance with these rules may result in
additional
liabilities for tax, interest and penalties related to our international operations which would reduce our profitability.
Our international operations are routinely subject to audit by tax authorities in various countries. Many countries have indirect tax systems where the sale and purchase of goods and services are subject to tax based on the transaction value. These taxes are commonly referred to as value-added tax (VAT) or goods and services tax (GST). Failure to comply with these systems can result in the assessment of additional tax, interest and penalties. While we believe we are in compliance with local laws, there is no assurance that foreign tax authorities agree with our reporting positions and upon audit may assess us additional tax, interest and penalties. If this occurs and we cannot successfully defend our position, our profitability will be reduced.
If our goodwill or intangible assets become impaired we may be required to record a significant charge to earnings.
Under generally accepted accounting principles, we review our intangible assets for impairment when events or changes in circumstances indicate the carrying value may not be recoverable. Goodwill is required to be tested for impairment at least annually. Factors that may be considered when determining if the carrying value of our goodwill or intangible assets may not be recoverable include a significant decline in our expected future cash flows or a sustained, significant decline in our stock price and market capitalization.
As a result of our acquisitions, we have significant goodwill and intangible assets recorded on our balance sheet. In addition, significant negative industry or economic trends, such as those that have occurred as a result of the recent economic downturn, including reduced estimates of future cash flows or disruptions to our business could indicate that goodwill or intangible assets might be impaired. If, in any period our stock price decreases to the point where our market capitalization is less than our book value, this too could indicate a potential impairment and we may be required to record an impairment charge in that period. Our valuation methodology for assessing impairment requires management to make judgments and assumptions based on projections of future operating performance. We operate in highly competitive environments and projections of future operating results and cash flows may vary significantly from actual results. As a result, we may incur substantial impairment charges to earnings in our financial statements should an impairment of our goodwill or intangible assets be determined resulting in an adverse impact on our results of operations.
In the fourth fiscal quarter of 2013, we completed our annual impairment test of goodwill and determined no impairment existed as of September 30, 2013. We will continue to test goodwill for impairment at least annually at the business unit level, and more frequently if we become aware of changed conditions or situations since the prior impairment testing that might call into question whether the current balances are fairly recorded. The allocation of goodwill may have greater impact for certain of
21
the business segments, as compared to the other segments. We believe that our service provider business unit may be particularly susceptible to this risk relative to our other two business units, due to its higher dependence on a limited number of customers and the potential impact of losing one or more significant customers. Accordingly, the performance of a business unit may be adversely affected by the allocation of goodwill.
We are subject to, and must remain in compliance with, numerous laws and governmental regulations concerning the manufacturing, use, distribution and sale of our products, as well as any such future laws and regulations. Some of our customers also require that we comply with their own unique requirements relating to these matters. Any failure to comply with such laws, regulations and requirements, and any associated unanticipated costs, may adversely affect our business, financial condition and results of operations.
We manufacture and sell products which contain electronic components, and such components may contain materials that are subject to government regulation in both the locations that we manufacture and assemble our products, as well as the locations where we sell our products. For example, certain regulations limit the use of lead in electronic components. To our knowledge, we maintain compliance with all applicable current government regulations concerning the materials utilized in our products, for all the locations in which we operate. Since we operate on a global basis, this is a complex process which requires continual monitoring of regulations and an ongoing compliance process to ensure that we and our suppliers are in compliance with all existing regulations. There are areas where new regulations have been enacted which could increase our cost of the components that we utilize or require us to expend additional resources to ensure compliance. For example, the SEC passed final rules in August 2012 regarding investigation and disclosure of the use of certain “conflict minerals” in our products. These rules apply to our business, and we are expending significant resources to ensure compliance. If there is an unanticipated new regulation which significantly impacts our use of various components or requires more expensive components, that regulation would have a material adverse impact on our business, financial condition and results of operations.
One area which has a large number of regulations is the environmental compliance. Management of environmental pollution and climate change has produced significant legislative and regulatory efforts on a global basis, and we believe this will continue both in scope and the number of countries participating. These changes could directly increase the cost of energy which may have an impact on the way we manufacture products or utilize energy to produce our products. In addition, any new regulations or laws in the environmental area might increase the cost of raw materials we use in our products. Environmental regulations require us to reduce product energy usage, monitor and exclude an expanding list of restricted substances and to participate in required recover and recycling of our products. While future changes in regulations are certain, we are currently unable to predict how any such changes will impact us and if such impacts will be material to our business. If there is a new law or regulation that significantly increases our costs of manufacturing or causes us to significantly alter the way that we manufacture our products, this would have a material adverse effect on our business, financial condition and results of operations.
Our selling and distribution practices are also regulated in large part by U.S. federal and state as well as foreign antitrust and competition laws and regulations. In general, the objective of these laws is to promote and maintain free competition by prohibiting certain forms of conduct that tend to restrict production, raise prices, or otherwise control the market for goods or services to the detriment of consumers of those goods and services. Potentially prohibited activities under these laws may include unilateral conduct, or conduct undertaken as the result of an agreement with one or more of our suppliers, competitors, or customers. The potential for liability under these laws can be difficult to predict as it often depends on a finding that the challenged conduct resulted in harm to competition, such as higher prices, restricted supply, or a reduction in the quality or variety of products available to consumers. We utilize a number of different distribution channels to deliver our products to the end consumer, and regularly enter agreements with resellers of our products at various levels in the distribution chain that could be subject to scrutiny under these laws in the event of private litigation or an investigation by a governmental competition authority. In addition, many of our products are sold to consumers via the Internet. Many of the competition-related laws that govern these Internet sales were adopted prior to the advent of the Internet, and, as a result, do not contemplate or address the unique issues raised by online sales. New interpretations of existing laws and regulations, whether by courts or by the state, federal, or foreign governmental authorities charged with the enforcement of those laws and regulations, may also impact our business in ways we are currently unable to predict. Any failure on our part or on the part of our employees, agents, distributors or other business partners to comply with the laws and regulations governing competition can result in negative publicity and diversion of management time and effort and may subject us to significant litigation liabilities and other penalties.
In addition to government regulations, many of our customers require us to comply with their own requirements regarding manufacturing, health and safety matters, corporate social responsibility, employee treatment, anti-corruption, use of materials and environmental concerns. Some customers may require us to periodically report on compliance with their unique requirements, and some customers reserve the right to audit our business for compliance. We are increasingly subject to requests for compliance with these customer requirements. For example, there has been significant focus from our customers as well as the press regarding corporate social responsibility policies. We regularly audit our manufacturers; however, any deficiencies in compliance by our
22
manufacturers may harm our business and our brand. In addition, we may not have the resources to maintain compliance with these customer requirements and failure to comply may result in decreased sales to these customers, which may have a material adverse effect on our business, financial condition and results of operations.
We depend substantially on our sales channels, and our failure to maintain and expand our sales channels would result in lower sales and reduced net revenue.
To maintain and grow our market share, net revenue and brand, we must maintain and expand our sales channels. Our sales channels consist of traditional retailers, online retailers, DMRs, VARs, and broadband service providers. Some of these entities purchase our products through our wholesale distributor customers. We generally have no minimum purchase commitments or long-term contracts with any of these third parties.
Traditional retailers have limited shelf space and promotional budgets, and competition is intense for these resources. If the networking sector does not experience sufficient growth, retailers may choose to allocate more shelf space to other consumer product sectors. A competitor with more extensive product lines and stronger brand identity may have greater bargaining power with these retailers. Any reduction in available shelf space or increased competition for such shelf space would require us to increase our marketing expenditures simply to maintain current levels of retail shelf space, which would harm our operating margin. Our traditional retail customers have faced increased and significant competition from online retailers. If we cannot effectively manage our business amongst our online customers and traditional retail customers, our business would be harmed. The recent trend in the consolidation of online retailers and DMR channels has resulted in intensified competition for preferred product placement, such as product placement on an online retailer's Internet home page. Expanding our presence in the VAR channel may be difficult and expensive. We compete with established companies that have longer operating histories and longstanding relationships with VARs that we would find highly desirable as sales channel partners. We also sell products to broadband service providers. Competition for selling to broadband service providers is fierce and intense. Penetrating service provider accounts typically involves a long sales cycle and the challenge of displacing incumbent suppliers with established relationships and field-deployed products. If we are unable to maintain and expand our sales channels, our growth would be limited and our business would be harmed.
We must also continuously monitor and evaluate emerging sales channels. If we fail to establish a presence in an important developing sales channel, our business could be harmed.
We depend on a limited number of third-party manufacturers for substantially all of our manufacturing needs. If these third-party manufacturers experience any delay, disruption or quality control problems in their operations, we could lose market share and our brand may suffer.
All of our products are manufactured, assembled, tested and generally packaged by a limited number of third party manufacturers, including original design manufacturers, or ODMs, and original equipment manufacturers, as well as contract manufacturers. In most cases, we rely on these manufacturers to procure components and, in some cases, subcontract engineering work. Some of our products are manufactured by a single manufacturer. We do not have any long-term contracts with any of our third-party manufacturers. Some of these third-party manufacturers produce products for our competitors. Due to weak economic conditions, the viability of some of these third-party manufacturers may be at risk. Our ODM's are increasingly refusing to work with us on certain projects, such as projects for manufacturing products for our service provider customers. Because our service provider customers command significant resources, including for software support, and demand extremely competitive pricing, our ODMs are starting to refuse to engage on service provider terms. The loss of the services of any of our primary third-party manufacturers could cause a significant disruption in operations and delays in product shipments. Qualifying a new manufacturer and commencing volume production is expensive and time consuming. For example, as a result of both our April 2013 acquisition of the AirCard business from Sierra Wireless, Inc. and our July 2012 acquisition of AVAAK, Inc., we have commenced doing business with two new contract manufacturers. Ensuring that a contract manufacturer is qualified to manufacture our products to our standards is time consuming. In addition, there is no assurance that a contract manufacturer can scale its production of our products at the volumes and in the quality that we require. If a contract manufacturer is unable to do these things, we may have to move production for the products to a new or existing third party manufacturer which would take significant effort and our business may be harmed. In addition, as we contemplate moving manufacturing into different jurisdictions, we will be subject to additional significant challenges in ensuring that quality, processes and costs, among other issues, are consistent with our expectations. For example, while we expect our manufacturers to be responsible for penalties assessed on us because of excessive failures of the products, there is no assurance that we will be able to collect such reimbursements from these manufacturers, which causes us to take on additional risk for potential failures of our products.
Our reliance on third-party manufacturers also exposes us to the following risks over which we have limited control:
23
|
•
|
unexpected increases in manufacturing and repair costs;
|
|
•
|
inability to control the quality and reliability of finished products;
|
|
•
|
inability to control delivery schedules;
|
|
•
|
potential liability for expenses incurred by third-party manufacturers in reliance on our forecasts that later prove to be inaccurate;
|
|
•
|
potential lack of adequate capacity to manufacture all or a part of the products we require; and
|
|
•
|
potential labor unrest affecting the ability of the third-party manufacturers to produce our products.
|
All of our products must satisfy safety and regulatory standards and some of our products must also receive government certifications. Our third party manufacturers are primarily responsible for obtaining most regulatory approvals for our products. If our third party manufacturers fail to obtain timely domestic or foreign regulatory approvals or certificates, we would be unable to sell our products and our sales and profitability could be reduced, our relationships with our sales channel could be harmed, and our reputation and brand would suffer.
Specifically, substantially all of our manufacturing occurs in the Asia Pacific region and any disruptions from natural disasters, health epidemics and political, social and economic instability would affect the ability of our third party manufacturers to manufacture our products. In addition, our third party manufacturers in China have continued to increase our costs of production, particularly in the past couple of years. If these costs continue to increase, it may affect our margins and ability to lower prices for our products to stay competitive. Recent labor unrest in China may also affect our third party manufacturers as workers may strike and cause production delays. If our third party manufacturers fail to maintain good relations with their employees or contractors, and production and manufacturing of our products is affected, then we may be subject to shortages of products and quality of products delivered may be affected. Further, if our manufacturers or warehousing facilities are disrupted or destroyed, we would have no other readily available alternatives for manufacturing our products and our business would be significantly harmed.
As we continue to work with more third party manufacturers on a contract manufacturing basis, we are also exposed to additional risks not inherent in a typical ODM arrangement. Such risks may include our inability to properly source and qualify components for the products, lack of software expertise resulting in increased software defects, and lack of resources to properly monitor the manufacturing process. In our typical ODM arrangement, our ODMs are generally responsible for sourcing the components of the products and warranting that the products will work against a product's specification, including any software specifications. In a contract manufacturing arrangement, we would take on much more, if not all, of the responsibility around these areas. If we are unable to properly manage these risks, our products may be more susceptible to defects and our business would be harmed.
We are currently involved in numerous litigation matters and may in the future become involved in additional litigation, including litigation regarding intellectual property rights, which could be costly and subject us to significant liability.
The networking industry is characterized by the existence of a large number of patents and frequent claims and related litigation regarding infringement of patents, trade secrets and other intellectual property rights. In particular, leading companies in the data communications markets, some of which are our competitors, have extensive patent portfolios with respect to networking technology. From time to time, third parties, including these leading companies, have asserted and may continue to assert exclusive patent, copyright, trademark and other intellectual property rights against us demanding license or royalty payments or seeking payment for damages, injunctive relief and other available legal remedies through litigation. These also include third-party non-practicing entities who claim to own patents or other intellectual property that cover industry standards that our products comply with. If we are unable to resolve these matters or obtain licenses on acceptable or commercially reasonable terms, we could be sued or we may be forced to initiate litigation to protect our rights. The cost of any necessary licenses could significantly harm our business, operating results and financial condition. We may also choose to join defensive patent aggregation services in order to prevent or settle litigation against such non-practicing entities and avoid the associated significant costs and uncertainties of litigation. These patent aggregation services may obtain, or have previously obtained, licenses for the alleged patent infringement claims against us and other patent assets that could be used offensively against us. The costs of such defensive patent aggregation services, while potentially lower than the costs of litigation, may be significant as well. At any time, any of these non-practicing entities, or any other third-party could initiate litigation against us, or we may be forced to initiate litigation against them, which could divert management attention, be costly to defend or prosecute, prevent us from using or selling the challenged technology, require us to design around the challenged technology and cause the price of our stock to decline. In addition, third parties, some
24
of whom are potential competitors, have initiated and may continue to initiate litigation against our manufacturers, suppliers, members of our sales channels or our service provider customers or even end user customers, alleging infringement of their proprietary rights with respect to existing or future products. In the event successful claims of infringement are brought by third parties, and we are unable to obtain licenses or independently develop alternative technology on a timely basis, we may be subject to indemnification obligations, be unable to offer competitive products, or be subject to increased expenses. Finally, consumer class-action lawsuits related to the marketing and performance of our home networking products have been asserted and may in the future be asserted against us. For additional information regarding certain of the lawsuits in which we are involved, see the information set forth under Note 9,
Commitments and Contingencies,
in Notes to Consolidated Financial Statements in Item 8 of Part II of this Annual Report on Form 10-K. If we do not resolve these claims on a favorable basis, our business, operating results and financial condition could be significantly harmed.
We are required to evaluate our internal controls under Section 404 of the Sarbanes-Oxley Act of 2002 and any adverse results from such evaluation, including restatements of our issued financial statements, could impact investor confidence in the reliability of our internal controls over financial reporting.
Pursuant to Section 404 of the Sarbanes-Oxley Act of 2002, we are required to furnish a report by our management on our internal control over financial reporting. Such report must contain among other matters, an assessment of the effectiveness of our internal control over financial reporting as of the end of our fiscal year, including a statement as to whether or not our internal control over financial reporting is effective. This assessment must include disclosure of any material weaknesses in our internal control over financial reporting identified by management. From time to time, we conduct internal investigations as a result of whistleblower complaints. In some instances, the whistleblower complaint may implicate potential areas of weakness in our internal controls. Although all known material weaknesses have been remediated, we cannot be certain that the measures we have taken ensure that restatements will not occur in the future. Execution of restatements create a significant strain on our internal resources and could cause delays in our filing of quarterly or annual financial results, increase our costs and cause management distraction. Restatements may also significantly affect our stock price in an adverse manner.
Continued performance of the system and process documentation and evaluation needed to comply with Section 404 is both costly and challenging. During this process, if our management identifies one or more material weaknesses in our internal control over financial reporting, we will be unable to assert such internal control is effective. If we are unable to assert that our internal control over financial reporting is effective as of the end of a fiscal year or if our independent registered public accounting firm is unable to express an opinion on the effectiveness of our internal control over financial reporting, we could lose investor confidence in the accuracy and completeness of our financial reports, which may have an adverse effect on our stock price.
System security risks, data protection breaches and cyber-attacks could disrupt our internal operations or information technology or networking services provided to customers, and any such disruption could reduce our expected revenue, increase our expenses, damage our reputation and adversely affect our stock price.
Maintaining the security of our computer information systems and communication systems is a critical issue for us and our customers. Hackers may develop and deploy viruses, worms and other malicious software programs that are designed to attack our products and systems, including our internal network, or those of our vendors or customers. Additionally, outside parties may attempt to fraudulently induce our employees or users of our products to disclose sensitive information in order to gain access to our data or our customers' data. We have established a crisis management plan and business continuity program. While we regularly test the plan and the program, there can be no assurance that the plan and program can withstand an actual or serious disruption in our business, including a data protection breach or cyber-attack. While we have established infrastructure and geographic redundancy for our critical systems, our ability to utilize these redundant systems requires further testing and we cannot be assured that such systems are fully functional. For example, much of our order fulfillment process is automated and the order information is stored on our servers. A significant business interruption could result in losses or damages and harm our business. If our computer systems and servers go down at the end of a fiscal quarter, our ability to recognize revenue may be delayed until we are able to utilize back-up systems and continue to process and ship our orders. This could cause our stock price to decline significantly. Moreover, potential breaches of our security measures and the accidental loss, inadvertent disclosure or unapproved dissemination of proprietary information or sensitive or confidential data about us or our customers, including the potential loss or disclosure of such information or data as a result of hacking, fraud, trickery or other forms of deception, could expose us, our customers or the individuals affected to a risk of loss or misuse of this information, result in litigation and potential liability for us, damage our brand and reputation or otherwise harm our business.
In connection with our acquisition of AVAAK, Inc. in July 2012, we expanded our business into offering a comprehensive online service offering with the new VueZone cloud monitoring service. If this cloud service is compromised by hackers, or if customer confidential information is accessed without authorization, our business will be harmed. Furthermore, operating an online cloud service is a new business for us and we may not have the expertise to properly manage risks related to data security and
25
systems security. If we are unable to successfully prevent breaches of security relating to our VueZone service or customer private information, including customer videos and customer personal identification information, management would need to spend increasing amounts of time and effort in this area, and our business would be harmed.
Our business depends on our continued ability to license necessary third-party technology, which we may not be able to do on commercially reasonable terms, if at all.
We license technology from third parties for the development of our products. We have licensed from third parties software, patents and other intellectual property for use in our products and from time to time we may elect or be required to license additional intellectual property. There can be no assurance that we will be able to maintain our third-party licenses or that these licenses or the technologies that are the subject of these licenses will not be the subject of dispute or litigation, or that additional third-party licenses will be available to us on commercially reasonable terms, if at all. The inability to maintain or obtain third-party licenses required for our products or to develop new products and product enhancements could require us to seek to obtain substitute technology of lower quality or performance standards, if such exists, or at greater cost, which could seriously harm our competitive position, revenue and prospects.
The marketability of our AirCard products may suffer if wireless telecommunications operators do not deliver acceptable wireless services.
The success of the AirCard product line depends, in part, on the capacity, affordability, reliability and prevalence of wireless data networks provided by wireless telecommunications operators and on which our AirCard products operate. Currently, various wireless telecommunications operators, either individually or jointly with us, sell our products in connection with the sale of their wireless data services to their customers. Growth in demand for wireless data access may be limited if, for example, wireless telecommunications operators cease or materially curtail operations, fail to offer services that customers consider valuable at acceptable prices, fail to maintain sufficient capacity to meet demand for wireless data access, delay the expansion of their wireless networks and services, fail to offer and maintain reliable wireless network services or fail to market their services effectively.
In addition, the future growth of our AirCard product line depends on the successful deployment of next generation wireless data networks provided by third parties, including those networks for which we are currently developing products. If these next generation networks are not deployed or widely accepted, or if deployment is delayed, there will be no market for the AirCard products we are developing to operate on these networks. If any of these events occurs, or if for any other reason the demand for wireless data access fails to grow, sales of our products will decline or remain stagnant and our business could be harmed.
If our products contain defects or errors, we could incur significant unexpected expenses, experience product returns and lost sales, experience product recalls, suffer damage to our brand and reputation, and be subject to product liability or other claims.
Our products are complex and may contain defects, errors or failures, particularly when first introduced or when new versions are released. The industry standards upon which many of our products are based are also complex, experience change over time and may be interpreted in different manners. Some errors and defects may be discovered only after a product has been installed and used by the end-user. For example, in January 2008, we announced a voluntary recall of a Powerline Ethernet Adapter made for Europe and other countries as a result of a component failure under certain operating conditions.
In addition, epidemic failure clauses are found in certain of our customer contracts, especially contracts with service providers. If invoked, these clauses may entitle the customer to return for replacement or obtain credits for products and inventory, as well as assess liquidated damage penalties and terminate an existing contract and cancel future or then current purchase orders. In such instances, we may also be obligated to cover significant costs incurred by the customer associated with the consequences of such epidemic failure, including freight and transportation required for product replacement and out-of-pocket costs for truck rolls to end user sites to collect the defective products. Costs or payments we make in connection with an epidemic failure may materially adversely affect our results of operations and financial condition. If our products contain defects or errors, or are found to be noncompliant with industry standards, we could experience decreased sales and increased product returns, loss of customers and market share, and increased service, warranty and insurance costs. In addition, our reputation and brand could be damaged, and we could face legal claims regarding our products. A product liability or other claim could result in negative publicity and harm to our reputation, resulting in unexpected expenses and adversely impacting our operating results. For instance, if a third party were able to successfully overcome the security measures in our products, such a person or entity could misappropriate customer data, third party data stored by our customers and other information, including intellectual property. In addition, the operations of our end-user customers may be interrupted. If that happens, affected end-users or others may file actions against us alleging product liability, tort, or breach of warranty claims.
26
If disruptions in our transportation network occur or our shipping costs substantially increase, we may be unable to sell or timely deliver our products and our operating expenses could increase.
We are highly dependent upon the transportation systems we use to ship our products, including surface and air freight. Our attempts to closely match our inventory levels to our product demand intensify the need for our transportation systems to function effectively and without delay. On a quarterly basis, our shipping volume also tends to steadily increase as the quarter progresses, which means that any disruption in our transportation network in the latter half of a quarter will likely have a more material effect on our business than at the beginning of a quarter.
The transportation network is subject to disruption or congestion from a variety of causes, including labor disputes or port strikes, acts of war or terrorism, natural disasters and congestion resulting from higher shipping volumes. For example, in June 2013, a ship carrying containers of our products among its cargo sank, and the shipment was lost. Although covered by insurance, this loss led to delays in delivery and our receipt of payment. Labor disputes among freight carriers and at ports of entry are common, particularly in Europe, and we expect labor unrest and its effects on shipping our products to be a continuing challenge for us. Our international freight is regularly subjected to inspection by governmental entities. If our delivery times increase unexpectedly for these or any other reasons, our ability to deliver products on time would be materially adversely affected and result in delayed or lost revenue as well as customer imposed penalties. In addition, if increases in fuel prices occur, our transportation costs would likely increase. Moreover, the cost of shipping our products by air freight is greater than other methods. From time to time in the past, we have shipped products using extensive air freight to meet unexpected spikes in demand, shifts in demand between product categories, to bring new product introductions to market quickly and to timely ship products previously ordered. If we rely more heavily upon air freight to deliver our products, our overall shipping costs will increase. A prolonged transportation disruption or a significant increase in the cost of freight could severely disrupt our business and harm our operating results.
We are exposed to the credit risk of some of our customers and to credit exposures in weakened markets, which could result in material losses.
A substantial portion of our sales are on an open credit basis, with typical payment terms of 30 to 60 days in the United States and, because of local customs or conditions, longer in some markets outside the United States. We monitor individual customer financial viability in granting such open credit arrangements, seek to limit such open credit to amounts we believe the customers can pay, and maintain reserves we believe are adequate to cover exposure for doubtful accounts.
In the past, there have been bankruptcies amongst our customer base. Although any resulting loss has not been material to date, future losses, if incurred, could harm our business and have a material adverse effect on our operating results and financial condition. To the degree that the recent turmoil in the credit markets makes it more difficult for some customers to obtain financing, our customers' ability to pay could be adversely impacted, which in turn could have a material adverse impact on our business, operating results, and financial condition.
27
We are expanding our operations and infrastructure, which may strain our operations and increase our operating expenses.
We are expanding our operations and pursuing market opportunities both domestically and internationally in order to grow our sales. As a result of the acquisition of the AirCard business of Sierra Wireless, we have added two new locations with over 80 personnel housed at each site, one in Carlsbad, California, and one in Richmond, British Columbia. We expect that this expansion will require enhancements to our existing management information systems, and operational and financial controls. In addition, if we continue to grow, our expenditures will likely be significantly higher than our historical costs. We may not be able to install adequate controls in an efficient and timely manner as our business grows, and our current systems may not be adequate to support our future operations. The difficulties associated with installing and implementing new systems, procedures and controls may place a significant burden on our management, operational and financial resources. In addition, if we grow internationally, we will have to expand and enhance our communications infrastructure. In the second fiscal quarter of 2011, we reorganized our business into three business units: retail, commercial, and service provider. Our reorganization into three business units may cause significant distraction to our management and employees. For example, channel and pricing conflicts may arise in certain territories as each of our business units may engage in selling activities which may benefit that business unit at the expense of another business unit. In addition, disclosures of previously non-public information in connection with our reorganization may also provide our competitors with strategic data which may put us at a competitive disadvantage and harm our business. These new disclosures about our performance may also cause our stock price to decline. As part of this expansion and reorganization, we have also commenced utilizing an alternative customer support model for certain of our end user technical support services. This alternative model permits a customer support agent to attempt to sell additional services and/or products to an end user who calls for technical support. If we are unable to successfully manage this alternative model, our end user customers may become frustrated with the customer experience and cease purchasing our products, and our business would be harmed. If we fail to continue to improve our management information systems, procedures and financial controls or encounter unexpected difficulties during expansion and reorganization, our business could be harmed.
For example, we have invested, and will continue to invest, significant capital and human resources in the design and enhancement of our financial and enterprise resource planning systems, which may be disruptive to our underlying business. We depend on these systems in order to timely and accurately process and report key components of our results of operations, financial position and cash flows. If the systems fail to operate appropriately or we experience any disruptions or delays in enhancing their functionality to meet current business requirements, our ability to fulfill customer orders, bill and track our customers, fulfill contractual obligations, accurately report our financials and otherwise run our business could be adversely affected. Even if we do not encounter these adverse effects, the enhancement of systems may be much more costly than we anticipated. If we are unable to continue to enhance our information technology systems as planned, our financial position, results of operations and cash flows could be negatively impacted.
We invest in companies for both strategic and financial reasons, but may not realize a return on our investments.
We have made, and continue to seek to make, investments in companies around the world to further our strategic objectives and support our key business initiatives. These investments may include equity or debt instruments of public or private companies, and may be non-marketable at the time of our initial investment. We do not restrict the types of companies in which we seek to invest. These companies may range from early-stage companies that are often still defining their strategic direction to more mature companies with established revenue streams and business models. If any company in which we invest fails, we could lose all or part of our investment in that company. If we determine that an other-than-temporary decline in the fair value exists for an equity or debt investment in a public or private company in which we have invested, we will have to write down the investment to its fair value and recognize the related write-down as an investment loss. The performance of any of these investments could result in significant impairment charges and gains (losses) on other equity investments. We must also analyze accounting and legal issues when making these investments. If we do not structure these investments properly, we may be subject to certain adverse accounting issues, such as potential consolidation of financial results.
Furthermore, if the strategic objectives of an investment have been achieved, or if the investment or business diverges from our strategic objectives, we may seek to dispose of the investment. Our non-marketable equity investments in private companies are not liquid, and we may not be able to dispose of these investments on favorable terms or at all. The occurrence of any of these events could harm our results. Gains or losses from equity securities could vary from expectations depending on gains or losses realized on the sale or exchange of securities and impairment charges related to debt instruments as well as equity and other investments.
28
We are exposed to adverse currency exchange rate fluctuations in jurisdictions where we transact in local currency, which could harm our financial results and cash flows.
Because a significant portion of our business is conducted outside the United States, we face exposure to adverse movements in foreign currency exchange rates. These exposures may change over time as business practices evolve, and they could have a material adverse impact on our results of operations, financial position and cash flows. Although a portion of our international sales are currently invoiced in United States dollars, we have implemented and continue to implement for certain countries and customers both invoicing and payment in foreign currencies. Our primary exposure to movements in foreign currency exchange rates relates to non-U.S. dollar denominated sales in Europe, Japan and Australia as well as our global operations, and non-U.S. dollar denominated operating expenses and certain assets and liabilities. In addition, weaknesses in foreign currencies for U.S. dollar denominated sales could adversely affect demand for our products. Conversely, a strengthening in foreign currencies against the U.S. dollar could increase foreign currency denominated costs. As a result we may attempt to renegotiate pricing of existing contracts or request payment to be made in U.S. dollars. We cannot be sure that our customers would agree to renegotiate along these lines. This could result in customers eventually terminating contracts with us or in our decision to terminate certain contracts, which would adversely affect our sales.
We implemented a hedging program in November 2008 to hedge exposures to fluctuations in foreign currency exchange rates as a response to the risks of changes in the value of foreign currency denominated assets and liabilities. We may enter into foreign currency forward contracts or other instruments, the majority of which mature within approximately five months. Our foreign currency forward contracts reduce, but do not eliminate, the impact of currency exchange rate movements. For example, we do not execute forward contracts in all currencies in which we conduct business. In addition, in the second fiscal quarter of 2009, we commenced implementation of a hedging program to reduce the impact of volatile exchange rates on net revenues, gross profit and operating profit for limited periods of time. However, the use of such hedging activities may only offset a portion of the adverse financial effect resulting from unfavorable movements in foreign exchange rates.
We rely upon third parties for technology that is critical to our products, and if we are unable to continue to use this technology and future technology, our ability to develop, sell, maintain and support technologically innovative products would be limited.
We rely on third parties to obtain non-exclusive patented hardware and software license rights in technologies that are incorporated into and necessary for the operation and functionality of most of our products. In these cases, because the intellectual property we license is available from third parties, barriers to entry into certain markets may be lower for potential or existing competitors than if we owned exclusive rights to the technology that we license and use. Moreover, if a competitor or potential competitor enters into an exclusive arrangement with any of our key third-party technology providers, or if any of these providers unilaterally decide not to do business with us for any reason, our ability to develop and sell products containing that technology would be severely limited. If we are shipping products that contain third-party technology that we subsequently lose the right to license, then we will not be able to continue to offer or support those products. In addition, these licenses often require royalty payments or other consideration to the third party licensor. Our success will depend, in part, on our continued ability to access these technologies, and we do not know whether these third-party technologies will continue to be licensed to us on commercially acceptable terms, if at all. If we are unable to license the necessary technology, we may be forced to acquire or develop alternative technology of lower quality or performance standards, which would limit and delay our ability to offer new or competitive products and increase our costs of production. As a result, our margins, market share, and operating results could be significantly harmed.
We also utilize third-party software development companies to develop, customize, maintain and support software that is incorporated into our products. If these companies fail to timely deliver or continuously maintain and support the software, as we require of them, we may experience delays in releasing new products or difficulties with supporting existing products and customers. In addition, if these third-party licensors fail or experience instability, then we may be unable to continue to sell products that incorporate the licensed technologies in addition to being unable to continue to maintain and support these products. We do require escrow arrangements with respect to certain third-party software which entitle us to certain limited rights to the source code, in the event of certain failures by the third party, in order to maintain and support such software. However, there is no guarantee that we would be able to understand and use the source code, as we may not have the expertise to do so. We are increasingly exposed to these risks as we continue to develop and market more products containing third-party software, such as our TV connectivity, security and network attached storage products.
29
If the redemption rate for our end-user promotional programs is higher than we estimate, then our net revenue and gross margin will be negatively affected.
From time to time we offer promotional incentives, including cash rebates, to encourage end-users to purchase certain of our products. Purchasers must follow specific and stringent guidelines to redeem these incentives or rebates. Often qualified purchasers choose not to apply for the incentives or fail to follow the required redemption guidelines, resulting in an incentive redemption rate of less than 100%. Based on historical data, we estimate an incentive redemption rate for our promotional programs. If the actual redemption rate is higher than our estimated rate, then our net revenue and gross margin will be negatively affected.
If we are unable to secure and protect our intellectual property rights, our ability to compete could be harmed.
We rely upon third parties for a substantial portion of the intellectual property that we use in our products. At the same time, we rely on a combination of copyright, trademark, patent and trade secret laws, nondisclosure agreements with employees, consultants and suppliers and other contractual provisions to establish, maintain and protect our intellectual property rights. Despite efforts to protect our intellectual property, unauthorized third parties may attempt to design around, copy aspects of our product design or obtain and use technology or other intellectual property associated with our products. For example, one of our primary intellectual property assets is the NETGEAR name, trademark and logo. We may be unable to stop third parties from adopting similar names, trademarks and logos, particularly in those international markets where our intellectual property rights may be less protected. Furthermore, our competitors may independently develop similar technology or design around our intellectual property. Our inability to secure and protect our intellectual property rights could significantly harm our brand and business, operating results and financial condition.
Our sales and operations in international markets expose us to operational, financial and regulatory risks.
International sales comprise a significant amount of our overall net revenue. International sales were 44% of overall net revenue in fiscal 2013 and 48% in fiscal 2012. We continue to be committed to growing our international sales and while we have committed resources to expanding our international operations and sales channels, these efforts may not be successful. International operations are subject to a number of other risks, including:
|
•
|
political and economic instability, international terrorism and anti-American sentiment, particularly in emerging markets;
|
|
•
|
potential for violations of anti-corruption laws and regulations, such as those related to bribery and fraud;
|
|
•
|
preference for locally branded products, and laws and business practices favoring local competition;
|
|
•
|
exchange rate fluctuations;
|
|
•
|
increased difficulty in managing inventory;
|
|
•
|
delayed revenue recognition;
|
|
•
|
less effective protection of intellectual property;
|
|
•
|
stringent consumer protection and product compliance regulations, including but not limited to the Restriction of Hazardous Substances directive, the Waste Electrical and Electronic Equipment directive and the recently enacted European Ecodesign directive, or EuP, that are costly to comply with and may vary from country to country;
|
|
•
|
difficulties and costs of staffing and managing foreign operations;
|
|
•
|
business difficulties, including potential bankruptcy or liquidation, of any of our worldwide third party logistics providers; and
|
|
•
|
changes in local tax laws or changes in the enforcement, application or interpretation of such laws.
|
While we believe we generally have good relations with our employees, employees in certain jurisdictions have rights which give them certain collective rights. If management must expend significant resources and effort to address and comply with these rights, our business may be harmed. We are also required to comply with local environmental legislation and our customers rely
30
on this compliance in order to sell our products. If our customers do not agree with our interpretations and requirements of new legislation, such as the EuP, they may cease to order our products and our revenue would be harmed.
Governmental regulations of imports or exports affecting Internet security could affect our net revenue.
Any additional governmental regulation of imports or exports or failure to obtain required export approval of our encryption technologies could adversely affect our international and domestic sales. The United States and various foreign governments have imposed controls, export license requirements, and restrictions on the import or export of some technologies, particularly encryption technology. In addition, from time to time, governmental agencies have proposed additional regulation of encryption technology, such as requiring the escrow and governmental recovery of private encryption keys. In response to terrorist activity, governments could enact additional regulation or restriction on the use, import, or export of encryption technology. This additional regulation of encryption technology could delay or prevent the acceptance and use of encryption products and public networks for secure communications, resulting in decreased demand for our products and services. In addition, some foreign competitors are subject to less stringent controls on exporting their encryption technologies. As a result, they may be able to compete more effectively than we can in the United States and the international Internet security market.
We are exposed to credit risk and fluctuations in the market values of our investment portfolio.
Although we have not recognized any material losses on our cash equivalents and short-term investments, future declines in their market values could have a material adverse effect on our financial condition and operating results. Given the global nature of our business, we have investments with both domestic and international financial institutions. Accordingly, we face exposure to fluctuations in interest rates, which may limit our investment income. If these financial institutions default on their obligations or their credit ratings are negatively impacted by liquidity issues, credit deterioration or losses, financial results, or other factors, the value of our cash equivalents and short-term investments could decline and result in a material impairment, which could have a material adverse effect on our financial condition and operating results.
Economic conditions, political events, war, terrorism, public health issues, natural disasters and other circumstances could materially adversely affect us.
Our corporate headquarters are located in Northern California and one of our warehouses is located in Southern California, both of which are regions known for seismic activity. Significantly all of our critical enterprise-wide information technology systems, including our main servers, are currently housed in colocation facilities in Mesa, Arizona. While our critical information technology systems are located at colocation facilities in a different geographic region in the United States, our headquarters and warehouses remain susceptible to seismic activity so long as they are located in California. In addition, substantially all of our manufacturing occurs in two geographically concentrated areas in mainland China, where disruptions from natural disasters, health epidemics and political, social and economic instability may affect the region. If our manufacturers or warehousing facilities are disrupted or destroyed, we would be unable to distribute our products on a timely basis, which could harm our business.
We depend significantly on worldwide economic conditions and their impact on consumer spending levels, which have recently deteriorated significantly in many countries and regions, including without limitation the United States, and may remain depressed for the foreseeable future. Factors that could influence the levels of consumer spending include increases in fuel and other energy costs, conditions in the residential real estate and mortgage markets, labor and healthcare costs, access to credit, consumer confidence and other macroeconomic factors affecting consumer spending behavior.
In addition, war, terrorism, geopolitical uncertainties, public health issues, and other business interruptions have caused and could cause damage or disruption to international commerce and the global economy, and thus could have a strong negative effect on us, our suppliers, logistics providers, manufacturing vendors and customers. Our business operations are subject to interruption by natural disasters, fire, power shortages, terrorist attacks, and other hostile acts, labor disputes, public health issues, and other events beyond our control. For example, labor disputes at manufacturing facilities in China occurred in 2010 and have led to workers going on strike. The recent trend of labor unrest could materially affect our third-party manufacturers' abilities to manufacture our products. In addition, all of our major direct and indirect suppliers of hard disk drives have been affected by record flooding in Thailand in the third fiscal quarter of 2011, and they informed us that our supply chain would be constrained for an indefinite amount of time, up to six months in some cases. Some therefore declared a force majeure event and have stated that, in addition to and because of the supply constraints, pricing for hard disk drives would increase significantly until they were able to stabilize the situation. As a result, we experienced increased prices in the cost of hard disk drives and ceased accepting any orders containing ReadyNAS products with hard disk drives. In addition, all sales and marketing promotions involving ReadyNAS products were terminated temporarily. Further, we declared the existence of a force majeure event under our contracts with certain customers. Accordingly, our business was harmed. Furthermore, earthquakes and resultant nuclear threats and tsunamis in Japan
31
in March 2011 caused some disruption to our supply of raw materials and components for our products and impacted our operating results in Japan.
Such events could decrease demand for our products, make it difficult or impossible for us to make and deliver products to our customers or to receive components from our suppliers, and create delays and inefficiencies in our supply chain. Should major public health issues, including pandemics, arise, we could be negatively affected by more stringent employee travel restrictions, additional limitations in freight services, governmental actions limiting the movement of products between regions, delays in production ramps of new products, and disruptions in the operations of our manufacturing vendors and component suppliers.
|
Item 1B.
|
Unresolved Staff Comments
|
None.
|
Item 2.
|
Properties
|
Our principal administrative, sales, marketing and research and development facilities currently occupy approximately 142,700 square feet in an office complex in San Jose, California, under a lease that expires in March 2018.
Our international headquarters occupy approximately 10,000 square feet in an office complex in Cork, Ireland, under a lease entered into in February 2006 and expiring in December 2026. Our international sales personnel are based out of local sales offices or home offices in Austria, Australia, Belgium, Canada, China, Czech Republic, Denmark, France, Germany, Hong Kong, India, Italy, Japan, Korea, Luxembourg, Poland, Russia, Singapore, Spain, Sweden, Switzerland, the Netherlands, the United Arab Emirates, and the United Kingdom. We also have operations personnel using a leased facility in Hong Kong. We also maintain research and development facilities in Atlanta, Carlsbad, Chicago, Beijing and Nanjing China, Richmond B.C., and in Taipei, Taiwan. From time to time we consider various alternatives related to our long-term facilities needs. While we believe our existing facilities provide suitable space for our operations and are adequate to meet our immediate needs, it may be necessary to lease additional space to accommodate future growth. We have invested in internal capacity and strategic relationships with outside manufacturing vendors as needed to meet anticipated demand for our products.
We use third parties to provide warehousing services to us, consisting of facilities in Southern California, Australia, Hong Kong and the Netherlands.
|
Item 3.
|
Legal Proceedings
|
The information set forth under the heading "Litigation and Other Legal Matters" in Note 9,
Commitments and Contingencies
, in Notes to Consolidated Financial Statements in Item 8 of Part II of this Annual Report on Form 10-K, is incorporated herein by reference. For additional discussion of certain risks associated with legal proceedings, see Item 1A,
Risk Factors
.
|
Item 4.
|
Mine Safety Disclosures
|
Not applicable.
|
Item 5.
|
Market for Registrant’s Common Equity, Related Stockholder Matters and Issuer Purchases of Equity Securities
|
Market Information
Our common stock has been quoted under the symbol “NTGR” on the Nasdaq National Market from July 31, 2003 to July 1, 2006, and on the Nasdaq Global Select Market since then. Prior to that time, there was no public market for our common stock. The following table sets forth for the indicated periods the high and low intraday sales prices for our common stock on the Nasdaq
32
markets. Such information reflects interdealer prices, without retail markup, markdown or commission, and may not represent actual transactions.
|
Fiscal Year Ended December 31, 2012
|
High
|
Low
|
||||
|
First Quarter
|
$
|
43.44
|
|
$
|
34.08
|
|
|
Second Quarter
|
40.08
|
|
28.98
|
|
||
|
Third Quarter
|
40.42
|
|
28.68
|
|
||
|
Fourth Quarter
|
39.48
|
|
32.48
|
|
||
|
Fiscal Year Ended December 31, 2013
|
High
|
Low
|
||||
|
First Quarter
|
$
|
40.97
|
|
$
|
32.10
|
|
|
Second Quarter
|
34.25
|
|
26.82
|
|
||
|
Third Quarter
|
33.90
|
|
28.13
|
|
||
|
Fourth Quarter
|
33.45
|
|
28.21
|
|
||
Company Performance
Notwithstanding any statement to the contrary in any of our previous or future filings with the SEC, the following information relating to the price performance of our common stock shall not be deemed “filed” with the SEC or “soliciting material” under the Exchange Act and shall not be incorporated by reference into any such filings.
The following graph shows a comparison from December 31, 2008 through December 31, 2013 of cumulative total return for our common stock, the Nasdaq Composite Index and the Nasdaq Computer Index. Such returns are based on historical results and are not intended to suggest future performance. Data for the Nasdaq Composite Index and the Nasdaq Computer Index assume reinvestment of dividends. We have never paid dividends on our common stock and have no present plans to do so.
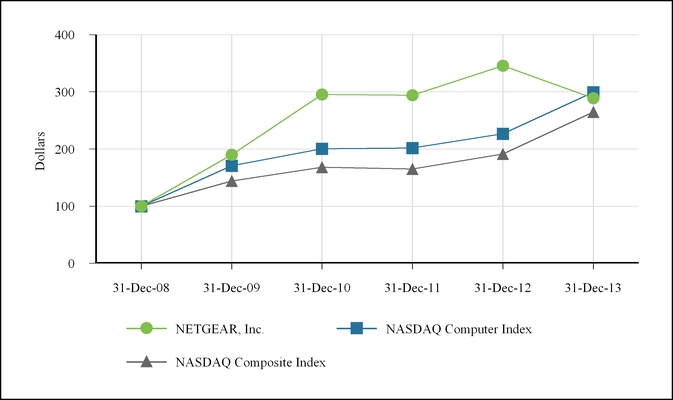
33
|
December 31, 2008
|
|
December 31, 2009
|
|
December 31, 2010
|
|
December 31, 2011
|
|
December 31, 2012
|
|
December 31, 2013
|
|
||||||||||||
|
NETGEAR, Inc.
|
$
|
100.00
|
|
$
|
190.10
|
|
$
|
295.18
|
|
$
|
294.22
|
|
$
|
345.57
|
|
$
|
288.69
|
|
|||||
|
NASDAQ Computer Index
|
$
|
100.00
|
|
$
|
170.82
|
|
$
|
200.62
|
|
$
|
201.60
|
|
$
|
226.76
|
|
$
|
299.19
|
|
|||||
|
NASDAQ Composite Index
|
$
|
100.00
|
|
$
|
143.89
|
|
$
|
168.22
|
|
$
|
165.19
|
|
$
|
191.47
|
|
$
|
264.84
|
|
|||||
Holders of Common Stock
On February 20, 2014, there were 23 stockholders of record.
The number of record holders is based upon the actual number of holders registered on our books at such date and does not include holders of shares in “street names” or persons, partnerships, associations, corporations or other entities identified in security position listings maintained by depository trust companies.
Dividend Policy
We have never declared or paid cash dividends on our capital stock. We do not anticipate paying cash dividends in the foreseeable future.
Repurchase of Equity Securities by the Company
|
Period
|
Total Number of
Shares Purchased (2)
|
Average Price Paid per Share
|
Total Number of Shares Purchased as Part of Publicly Announced Plans or Programs (1)
|
Maximum Number of Shares that May Yet Be Purchased Under the Plans or Programs
|
|||||||||
|
September 30, 2013 - October 27, 2013
|
—
|
|
$
|
—
|
|
—
|
|
4,831,220
|
|
||||
|
October 28, 2013 - November 24, 2013
|
1,534,319
|
|
$
|
31.31
|
|
1,534,319
|
|
3,296,901
|
|
||||
|
November 25, 2013 - December 31, 2013
|
470,613
|
|
$
|
32.00
|
|
470,613
|
|
2,826,288
|
|
||||
|
Total
|
2,004,932
|
|
$
|
31.47
|
|
2,004,932
|
|
||||||
|
(1)
|
On October 21, 2008, the Board of Directors authorized the repurchase of up to 6.0 million shares of our outstanding common stock. Under this authorization, the timing and actual number of shares subject to repurchase are at the discretion of management and are contingent on a number of factors, such as levels of cash generation from operations, cash requirements for acquisitions and the price of our common stock. During the year ended December 31,
2013
, the Company repurchased 2.0 million shares, or approximately $63.1 million of common stock under this authorization. During the years ended December 31,
2012
and
2011
, the Company did not repurchase any shares under this authorization.
|
|
(2)
|
We did not repurchase any shares to help administratively facilitate the withholding and subsequent remittance of personal income and payroll taxes for individuals receiving RSUs during the three months ended December 31,
2013
. During the three months ended December 31, 2012, we repurchased 917 shares, or approximately $34,000 of common stock, respectively, to help facilitate tax withholding for RSUs.
|
34
|
Item 6.
|
Selected Financial Data
|
The following selected consolidated financial data are qualified in their entirety, and should be read in conjunction with, the consolidated financial statements and related notes thereto, and “Management's Discussion and Analysis of Financial Condition and Results of Operations” included elsewhere in this Form 10-K.
We derived the selected consolidated statement of operations data for the years ended December 31,
2013
,
2012
and
2011
and the selected consolidated balance sheet data as of December 31,
2013
and
2012
from our audited consolidated financial statements appearing elsewhere in this Form 10-K. We derived the selected consolidated statement of operations data for the years ended December 31,
2010
and
2009
and the selected consolidated balance sheet data as of December 31,
2011
,
2010
and
2009
from our audited consolidated financial statements, which are not included in this Form 10-K. Historical results are not necessarily indicative of results to be expected for future periods.
|
|
Year Ended December 31,
|
|||||||||||||||||||
|
2013 (1)
|
2012
|
2011
|
2010
|
2009
|
||||||||||||||||
|
(In thousands, except per share data)
|
||||||||||||||||||||
|
Net revenue
|
$
|
1,369,633
|
|
$
|
1,271,921
|
|
$
|
1,181,018
|
|
$
|
902,052
|
|
$
|
686,595
|
|
|||||
|
Cost of revenue (3)
|
976,018
|
|
888,368
|
|
811,572
|
|
602,805
|
|
480,195
|
|
||||||||||
|
Gross profit
|
393,615
|
|
383,553
|
|
369,446
|
|
299,247
|
|
206,400
|
|
||||||||||
|
Operating expenses:
|
||||||||||||||||||||
|
Research and development (3)
|
85,168
|
|
61,066
|
|
48,699
|
|
39,972
|
|
30,056
|
|
||||||||||
|
Sales and marketing (3)
|
153,804
|
|
149,766
|
|
154,562
|
|
131,570
|
|
106,162
|
|
||||||||||
|
General and administrative (3)
|
48,915
|
|
45,027
|
|
39,423
|
|
36,220
|
|
32,727
|
|
||||||||||
|
Restructuring and other charges
|
5,335
|
|
1,190
|
|
2,094
|
|
(88
|
)
|
809
|
|
||||||||||
|
Technology license arrangements
|
—
|
|
—
|
|
—
|
|
—
|
|
2,500
|
|
||||||||||
|
Litigation reserves, net
|
5,354
|
|
390
|
|
(201
|
)
|
211
|
|
2,080
|
|
||||||||||
|
Impairment of Intangibles
|
2,000
|
|
—
|
|
—
|
|
—
|
|
—
|
|
||||||||||
|
Total operating expenses
|
300,576
|
|
257,439
|
|
244,577
|
|
207,885
|
|
174,334
|
|
||||||||||
|
Income from operations
|
93,039
|
|
126,114
|
|
124,869
|
|
91,362
|
|
32,066
|
|
||||||||||
|
Interest income
|
400
|
|
498
|
|
477
|
|
426
|
|
629
|
|
||||||||||
|
Other income (expense), net
|
(457
|
)
|
2,670
|
|
(1,136
|
)
|
(564
|
)
|
(128
|
)
|
||||||||||
|
Income before income taxes
|
92,982
|
|
129,282
|
|
124,210
|
|
91,224
|
|
32,567
|
|
||||||||||
|
Provision for income taxes
|
37,765
|
|
42,743
|
|
32,842
|
|
40,315
|
|
23,234
|
|
||||||||||
|
Net income
|
$
|
55,217
|
|
$
|
86,539
|
|
$
|
91,368
|
|
$
|
50,909
|
|
$
|
9,333
|
|
|||||
|
Net income per share:
|
||||||||||||||||||||
|
Basic (2)
|
$
|
1.44
|
|
$
|
2.27
|
|
$
|
2.46
|
|
$
|
1.44
|
|
$
|
0.27
|
|
|||||
|
Diluted (2)
|
$
|
1.42
|
|
$
|
2.23
|
|
$
|
2.41
|
|
$
|
1.41
|
|
$
|
0.27
|
|
|||||
|
(1)
|
Includes the impact of AirCard acquisition. Refer to Note 2
Business Acquisitions
in Notes to Consolidated Financial Statements in Item 8 of Part II of this Annual Report on Form 10-K.
|
|
(2)
|
Information regarding calculation of per share data is described in Note 6,
Net Income Per Share
, in Notes to Consolidated Financial Statements in Item 8 of Part II of this Annual Report on Form 10-K.
|
35
|
(3)
|
Stock-based compensation expense was allocated as follows:
|
|
|
Year Ended December 31,
|
|||||||||||||||||||
|
2013
|
2012
|
2011
|
2010
|
2009
|
||||||||||||||||
|
(In thousands)
|
||||||||||||||||||||
|
Cost of revenue
|
$
|
1,577
|
|
$
|
1,347
|
|
$
|
999
|
|
$
|
913
|
|
$
|
959
|
|
|||||
|
Research and development
|
3,943
|
|
2,787
|
|
2,476
|
|
2,271
|
|
1,973
|
|
||||||||||
|
Sales and marketing
|
5,379
|
|
4,751
|
|
5,136
|
|
4,710
|
|
4,147
|
|
||||||||||
|
General and administrative
|
6,563
|
|
5,487
|
|
5,151
|
|
4,307
|
|
3,945
|
|
||||||||||
|
|
As of December 31,
|
|||||||||||||||||||
|
2013
|
2012
|
2011
|
2010
|
2009
|
||||||||||||||||
|
(In thousands)
|
||||||||||||||||||||
|
Cash, cash equivalents and short-term investments
|
$
|
248,154
|
|
$
|
376,877
|
|
$
|
353,695
|
|
$
|
270,737
|
|
$
|
247,100
|
|
|||||
|
Working capital
|
$
|
500,028
|
|
$
|
603,279
|
|
$
|
525,268
|
|
$
|
413,321
|
|
$
|
339,116
|
|
|||||
|
Total assets
|
$
|
1,093,930
|
|
$
|
1,034,569
|
|
$
|
971,370
|
|
$
|
780,321
|
|
$
|
633,121
|
|
|||||
|
Total current liabilities
|
$
|
300,083
|
|
$
|
260,930
|
|
$
|
308,961
|
|
$
|
254,723
|
|
$
|
195,609
|
|
|||||
|
Total non-current liabilities
|
$
|
20,064
|
|
$
|
19,028
|
|
$
|
23,652
|
|
$
|
25,162
|
|
$
|
23,359
|
|
|||||
|
Total stockholders' equity
|
$
|
773,783
|
|
$
|
754,611
|
|
$
|
638,757
|
|
$
|
500,436
|
|
$
|
414,153
|
|
|||||
36
|
Item 7.
|
Management’s Discussion and Analysis of Financial Condition and Results of Operations
|
You should read the following discussion of our financial condition and results of operations together with the audited consolidated financial statements and notes to the financial statements included elsewhere in this Form 10-K. This discussion contains forward-looking statements that involve risks and uncertainties. The forward-looking statements are not historical facts, but rather are based on current expectations, estimates, assumptions and projections about our industry, business and future financial results. Our actual results could differ materially from the results contemplated by these forward-looking statements due to a number of factors, including those discussed under “Risk Factors” in Part I, Item 1A above.
Business and Executive Overview
We are a global networking company that delivers innovative products to consumers, businesses and service providers. Our products are built on a variety of proven technologies such as wireless, Ethernet and powerline, with a focus on reliability and ease-of-use. Our product line consists of wired and wireless devices that enable networking, broadband access and network connectivity. These products are available in multiple configurations to address the needs of our end-users in each geographic region in which our products are sold.
We operate in three specific business segments: retail, commercial, and service provider.
Each business unit is managed by a Senior Vice President/General Manager. We believe this structure enables us to better focus our efforts on our core customer segments and allows us to be more nimble and opportunistic as a company overall. The retail business unit is focused on individual consumers and consists of high performance, dependable and easy-to-use home networking, home video monitoring, storage and digital media products. The commercial business unit is focused on small and medium size businesses and consists of business networking, storage and security solutions that bring enterprise class functionality at an affordable price. The service provider business unit is focused on the service provider market and consists of made-to-order and retail proven, whole home networking hardware and software solutions, as well as 4G LTE hotspots sold to service providers for sale to their subscribers.
We conduct business across three geographic regions: Americas, Europe, Middle-East and Africa (“EMEA”) and Asia Pacific (“APAC”).
Our service provider business has grown substantially over the years, particularly as a result of acquisitions, and it is difficult to ascertain a seasonal pattern given that the business is less predictable than our other core businesses. The commercial business, consumer, and broadband service provider markets are intensely competitive and subject to rapid technological change. We believe that the principal competitive factors in the retail, commercial, and service provider markets for networking products include product breadth, size and scope of the sales channel, brand name, timeliness of new product introductions, product availability, performance, features, functionality and reliability, ease-of-installation, maintenance and use, and customer service and support. To remain competitive, we believe we must continue to aggressively invest resources in developing new products and enhancing our current products while continuing to expand our channels and maintaining customer satisfaction worldwide.
We sell our networking products through multiple sales channels worldwide, including traditional retailers, online retailers, wholesale distributors, direct market resellers (“DMRs”), value-added resellers (“VARs”), and broadband service providers. Our retail channel includes traditional retail locations domestically and internationally, such as Best Buy, Costco, Fry’s Electronics, K-mart, Radio Shack, Sears, Staples, Target, Wal-Mart, Argos (U.K.), Dixons (U.K.), PC World (U.K.), MediaMarkt (Germany, Austria), Dick Smith (Australia), JB HiFi (Australia), Elkjop (Norway) and Lenovo (China). Online retailers include Amazon.com, Dell, Newegg.com and Buy.com. Our DMRs include CDW Corporation, Insight Corporation and PC Connection in domestic markets and Misco throughout Europe. In addition, we also sell our products through broadband service providers, such as multiple system operators (“MSOs”), DSL, and other broadband technology operators domestically and internationally. Some of these retailers and broadband service providers purchase directly from us, while others are fulfilled through wholesale distributors around the world. A substantial portion of our net revenue to date has been derived from a limited number of wholesale distributors and retailers, including Ingram Micro and Best Buy. We expect that these wholesale distributors and retailers will continue to contribute a significant percentage of our net revenue for the foreseeable future.
In
2013
, we continued to grow the business. On April 2, 2013, we acquired the select assets and operations of the Sierra Wireless, Inc. AirCard business ("AirCard"), including customer relationships, certain intellectual property, inventory and property and equipment. We added 161 AirCard employees as a result of the acquisition. We believe the AirCard acquisition will accelerate the mobile initiative of our service provider business unit to become a global leader in providing the latest in LTE data networking access devices. The acquisition qualified as a business combination and was accounted for using the acquisition method of accounting. On June 21, 2013, we acquired certain assets and operations of Arada Systems, Inc. (“Arada”). We believe the Arada acquisition will bolster our wireless product offerings in our commercial business unit and strengthen our market position in the small to medium size campus wireless LAN market. The acquisition qualified as a business combination and was accounted for using the acquisition method of accounting.
37
During the fourth quarter of 2013, we incurred a restructuring charge of appropriately $3.2 million related to the consolidation of certain teams and locations to drive efficiencies and realign resources to better focus on key growth markets. As always, we remain focused on long term growth driven by our mission to connect everyone to the high speed Internet. We will continue to invest in the growth markets of the Smart Home, access networks for cloud computing and LTE gateways.
We experienced revenue growth of
7.7%
during fiscal year
2013
. The increase in net revenue was primarily attributable to increased sales of our mobile products acquired through our acquisition of AirCard, home security monitoring and automation products, and switches, partially offset by a decrease in sales of our broadband gateways. On a geographic basis, net revenue increased in the Americas and APAC regions, and decreased in the EMEA region. On a segment basis, net revenues from all business units increased. The increase in service provider business unit net revenue was largely driven by our mobile products acquired through our acquisition of AirCard. The increase in commercial business unit net revenue was primarily due to increased sales of our switches. The increase in retail business unit net revenue was primarily due to increased sales of our multimedia products.
Looking forward, we expect to see continued success in our retail business unit, driven by sales of our high-end AC WiFi router, which will expand to both Europe and Asia, and our two new range extenders, which will be introduced worldwide in the first quarter of 2014. We also expect to see growth in our commercial business unit, driven by our 10Gig and PoE switches as well as high end storage products. In addition, we remain positive on the product opportunities from combining AirCard’s engineering strength in LTE and NETGEAR’s strength in WiFi.
Critical Accounting Policies and Estimates
Our consolidated financial statements have been prepared in accordance with accounting principles generally accepted in the United States of America and pursuant to the rules and regulations of the SEC. The preparation of these financial statements requires management to make assumptions, judgments and estimates that can have a significant impact on the reported amounts of assets, liabilities, revenues and expenses. We base our estimates on historical experience and on various other assumptions believed to be applicable and reasonable under the circumstances. Actual results could differ significantly from these estimates. These estimates may change as new events occur, as additional information is obtained and as our operating environment changes. On a regular basis we evaluate our assumptions, judgments and estimates and make changes accordingly. We also discuss our critical accounting estimates with the Audit Committee of the Board of Directors. Note 1,
The Company and Summary of Significant Accounting Policies
, of the Notes to Consolidated Financial Statements of this Annual Report on Form 10-K describes the significant accounting policies used in the preparation of the consolidated financial statements. We have listed below our critical accounting policies that we believe to have the greatest potential impact on our consolidated financial statements. Historically, our assumptions, judgments and estimates relative to our critical accounting policies have not differed materially from actual results.
Revenue Recognition
Refer to Note 1,
The Company and Summary of Significant Accounting Policies
, of the Notes to Consolidated Financial Statements of this Annual Report on Form 10-K for a discussion of our revenue recognition policies. Revenue from product sales is generally recognized at the time the product is shipped, provided that persuasive evidence of an arrangement exists, title and risk of loss has transferred to the customer, the selling price is fixed or determinable and collection of the related receivable is reasonably assured. Currently, for some of our customers, title passes to the customer upon delivery to the port or country of destination, upon their receipt of the product, or upon the customer’s resale of the product. At the end of each fiscal quarter, we estimate and defer revenue related to product where title has not transferred. The revenue continues to be deferred until such time that title passes to the customer. We have not made any material changes in the accounting methodology we use to estimate deferred revenue related to product where title has not transferred. We do not believe there will be a material change in the future estimates or assumptions used in our estimate of deferred revenue. We assess collectability based on a number of factors, including general economic and market conditions, past transaction history with the customer, and the creditworthiness of the customer. If we determine that collection of the corresponding receivable is not reasonably assured, we defer the revenue until receipt of payment.
Allowances for Product Warranties, Returns due to Stock Rotation, Sales Incentives and Doubtful Accounts
Our standard warranty obligation to our direct customers generally provides for a right of return of any product for a full refund in the event that such product is not merchantable or is found to be damaged or defective. At the time revenue is recognized, an estimate of future warranty returns is recorded to reduce revenue in the amount of the expected credit or refund to be provided to our direct customers. At the time we record the reduction to revenue related to warranty returns, we include within cost of revenue a write-down to reduce the carrying value of such products to net realizable value. Our standard warranty obligation to end-users provides for replacement of a defective product for one or more years. Factors that affect the warranty obligation include
38
product failure rates, material usage, and service delivery costs incurred in correcting product failures. The estimated cost associated with fulfilling the warranty obligation to end-users is recorded in cost of revenue. Because our products are manufactured by third-party manufacturers, in certain cases we have recourse to the third-party manufacturer for replacement or credit for the defective products. We give consideration to amounts recoverable from our third-party manufacturers in determining our warranty liability. Our estimated allowances for product warranties can vary from actual results and we may have to record additional revenue reductions or charges to cost of revenue, which could materially impact our financial position and results of operations.
In addition to warranty-related returns, certain distributors and retailers generally have the right to return product for stock rotation purposes. Upon shipment of the product, we reduce revenue for an estimate of potential future stock rotation returns related to the current period product revenue. We analyze historical returns, channel inventory levels, current economic trends and changes in customer demand for our products when evaluating the adequacy of the allowance for sales returns, namely stock rotation returns. Our estimated allowances for returns due to stock rotation can vary from actual results and we may have to record additional revenue reductions, which could materially impact our financial position and results of operations.
We accrue for sales incentives as a marketing expense if we receive an identifiable benefit in exchange and can reasonably estimate the fair value of the identifiable benefit received; otherwise, it is recorded as a reduction of revenues. Our estimated provisions for sales incentives can vary from actual results and we may have to record additional expenses or additional revenue reductions dependent on the classification of the sales incentive.
We maintain an allowance for doubtful accounts for estimated losses resulting from the inability of our customers to make required payments. We regularly perform credit evaluations of our customers’ financial condition and consider factors such as historical experience, credit quality, age of the accounts receivable balances, and geographic or country-specific risks and economic conditions that may affect a customer’s ability to pay. The allowance for doubtful accounts is reviewed quarterly and adjusted if necessary based on our assessments of our customers’ ability to pay. If the financial condition of our customers should deteriorate or if actual defaults are higher than our historical experience, additional allowances may be required, which could have an adverse impact on operating expenses.
Valuation of Inventory
We value our inventory at the lower of cost or market, cost being determined using the first-in, first-out method. We continually assess the value of our inventory and will periodically write down its value for estimated excess and obsolete inventory based upon assumptions about future demand and market conditions. On a quarterly basis, we review inventory quantities on hand and on order under non-cancelable purchase commitments, including consignment inventory, in comparison to our estimated forecast of product demand for the next nine months to determine what inventory, if any, are not saleable. Our analysis is based on the demand forecast but takes into account market conditions, product development plans, product life expectancy and other factors. Based on this analysis, we write down the affected inventory value for estimated excess and obsolescence charges. At the point of loss recognition, a new, lower cost basis for that inventory is established, and subsequent changes in facts and circumstances do not result in the restoration or increase in that newly established cost basis. As demonstrated during prior years, demand for our products can fluctuate significantly. If actual demand is lower than our forecasted demand and we fail to reduce our manufacturing accordingly, we could be required to write down additional inventory, which would have a negative effect on our gross profit.
Goodwill
Goodwill represents the purchase price over estimated fair value of net assets of businesses acquired in a business combination. Goodwill acquired in a business combination is not amortized, but instead tested for impairment at least annually during the fourth quarter. Should certain events or indicators of impairment occur between annual impairment tests, we will perform the impairment test as those events or indicators occur. Examples of such events or circumstances include the following: a significant decline in our expected future cash flows; a sustained, significant decline in our stock price and market capitalization; a significant adverse change in the business climate; and slower growth rates.
Goodwill is tested for impairment at the reporting unit level by first performing a qualitative assessment to determine whether it is more likely than not (that is, a likelihood of more than 50%) that the fair value of the reporting unit is less than its carrying value. The qualitative assessment considers the following factors: macroeconomic conditions, industry and market considerations, cost factors, overall company financial performance, events affecting the reporting units, and changes in our share price. If the reporting unit does not pass the qualitative assessment, then we estimate our fair value and compare the fair value with the carrying value of our net assets. If the fair value is greater than the carrying value of our net assets, then no impairment results. If the fair value is less than our carrying value, then we would determine the fair value of the goodwill by comparing the implied fair value to the carrying value of the goodwill in the same manner as if we were being acquired in a business combination. Specifically, we
39
would allocate the fair value to all of our assets and liabilities, including any unrecognized intangible assets, in a hypothetical analysis that would calculate the implied fair value of goodwill. If the implied fair value of goodwill is less than the recorded goodwill, an impairment charge would be recorded to earnings in the Consolidated Statements of Operations.
In the fourth fiscal quarter of 2013, we completed the annual impairment test of goodwill. Due to the increase in goodwill in fiscal year 2013 as a result of our acquisitions, we elected to bypass the qualitative assessment and proceed directly to estimating the fair value of net assets for each reporting unit. The fair value of the business units was determined placing an equal weighting of 50 percent on the income approach and market approach indications of value. Under the income approach, the fair value of an asset is based on the value of the estimated cash flows that the asset can be expected to generate in the future. These estimated future cash flows were discounted to arrive at their respective fair values. Under the market approach, the fair value of the unit is based on an analysis of financial data for publicly traded companies engaged in the same or similar lines of business. We compared the fair value of the reporting units to the reporting unit’s carrying value and determined that goodwill was not impaired since the estimated fair values of each of the reporting units exceeded the carrying values. The excess of fair value over carrying amount for each of our reporting units ranged from approximately 15% to approximately 219% of carrying amounts. The service provider business unit has the lowest excess of fair value over carrying amount at 15%. In order to evaluate the sensitivity of the estimated fair values of our reporting units in the goodwill impairment test, we applied a hypothetical 10% decrease to the fair values of each reporting unit. This hypothetical 10% decrease resulted in a lowest excess of fair value over carrying amount of approximately 4% for service provider business unit. We will continue to monitor goodwill on an annual basis as of the beginning of our fourth fiscal quarter and whenever events or changes in circumstances, such as significant adverse changes in business climate or operating results, changes in management's business strategy or significant declines in our stock price, indicate that there may be potential indicator of impairment. No goodwill impairment was recognized in the years ended December 31, 2013, 2012 or 2011.
We do not believe it is likely that there will be a material change in the estimates or assumptions we use to test for impairment losses on goodwill. However, if the actual results are not consistent with our estimates or assumptions, we may be exposed to an impairment charge that could be material.
Intangible assets
Purchased intangible assets with finite lives are amortized using the straight-line method over the estimated economic lives of the assets, which range from four to ten years. Finite-lived intangible assets are reviewed for impairment whenever events or changes in circumstances indicate that the carrying amount of such assets may not be recoverable. Determination of recoverability is based on an estimate of undiscounted future cash flows resulting from the use of the asset and its eventual disposition.
Purchased intangible assets determined to have indefinite useful lives are not amortized. Indefinite-lived intangible assets are reviewed for impairment at least annually during the fourth quarter and whenever events or changes in circumstances indicate that the carrying amount of such assets may not be recoverable. Measurement of an impairment loss for indefinite-lived assets that management expects to hold and use is based on the fair value of the asset. Indefinite-lived assets to be disposed of are reported at the lower of carrying amount or fair value less costs to sell. The carrying value of the asset is reviewed on a regular basis for the existence of facts, both internal and external, that may suggest impairment.
In the third quarter of 2013, we recorded an impairment charge of $2.0 million related to the abandonment of certain IPR&D projects acquired in AirCard acquisition.
In the fourth fiscal quarter of 2013, we completed the annual impairment test of indefinite-lived intangible assets. We assessed whether it was more likely than not (that is, a likelihood of more than 50%) the carrying amount of our indefinite-lived intangible assets may not be recoverable from their undiscounted cash flows by considering the following factors: macroeconomic conditions, industry and market considerations, cost factors, overall company financial performance, events affecting the reporting units, and changes in our share price. Based on these factors , we determined that it is not more likely than not that there were events or changes in circumstances that indicated that the carrying amount of our indefinite-lived intangible assets may not be recoverable from their undiscounted cash flows, and therefore performing the first step of the two-step impairment test for each reporting unit was unnecessary. No impairments to our indefinite-lived assets were recognized resulting from the annual impairment tests in the years ended December 31, 2013, 2012 and 2011.
We will continue to evaluate the carrying value of our indefinite-lived assets and if we determine in the future that there is a potential further impairment, we may be required to record additional charges to earnings which could affect our financial results.
40
Property and equipment, net
Property and equipment are stated at historical cost, less accumulated depreciation. We will perform an impairment test if certain events or indicators of impairment occur. Examples of such events or circumstances include the following: a significant decline in our expected future cash flows; a sustained, significant decline in our stock price and market capitalization; a significant adverse change in the business climate; and slower growth rates. Recoverability of assets to be held and used is measured by comparing the carrying amount of an asset to the estimated undiscounted future cash flows expected to be generated by the asset. If the carrying amount of the asset exceeds its estimated undiscounted future net cash flows, an impairment charge is recognized by the amount by which the carrying amount of the asset exceeds the fair value of the asset. The carrying value of the asset is reviewed on a regular basis for the existence of facts, both internal and external, that may suggest impairment. Charges related to the impairment of property and equipment were not material in the years ended December 31,
2013
,
2012
and
2011
.
Income Taxes
We account for income taxes under an asset and liability approach. Under this method, income tax expense is recognized for the amount of taxes payable or refundable for the current year. In addition, deferred tax assets and liabilities are recognized for the expected future tax consequences of temporary differences resulting from different treatments for tax versus accounting of certain items, such as accruals and allowances not currently deductible for tax purposes. These differences result in deferred tax assets and liabilities, which are included within the consolidated balance sheet. We must then assess the likelihood that our deferred tax assets will be recovered from future taxable income and to the extent we believe that recovery is not more likely than not, we must establish a valuation allowance. As of December 31,
2013
, we believe that all of our deferred tax assets are recoverable; however, if there were a change in our ability to recover our deferred tax assets, we would be required to take a charge in the period in which we determined that recovery was not more likely than not.
Uncertain tax provisions are recognized under guidance that provides that a company should use a more-likely-than-not recognition threshold based on the technical merits of the income tax position taken. Income tax positions that meet the more-likely-than-not recognition threshold should be measured in order to determine the tax benefit to be recognized in the financial statements. We include interest expense and penalties related to uncertain tax positions as additional tax expense.
41
Results of Operations
The following table sets forth the Consolidated Statements of Operations and the percentage change from the preceding year for the periods indicated:
|
|
Year Ended December 31,
|
||||||||||||||||
|
|
2013
|
% Change
|
2012
|
% Change
|
2011
|
||||||||||||
|
|
(In thousands, except percentage data)
|
||||||||||||||||
|
Net revenue
|
$
|
1,369,633
|
|
7.7
|
%
|
$
|
1,271,921
|
|
7.7
|
%
|
$
|
1,181,018
|
|
||||
|
Cost of revenue
|
976,018
|
|
9.9
|
%
|
888,368
|
|
9.5
|
%
|
811,572
|
|
|||||||
|
Gross profit
|
393,615
|
|
2.6
|
%
|
383,553
|
|
3.8
|
%
|
369,446
|
|
|||||||
|
Operating expenses:
|
|||||||||||||||||
|
Research and development
|
85,168
|
|
39.5
|
%
|
61,066
|
|
25.4
|
%
|
48,699
|
|
|||||||
|
Sales and marketing
|
153,804
|
|
2.7
|
%
|
149,766
|
|
(3.1
|
)%
|
154,562
|
|
|||||||
|
General and administrative
|
48,915
|
|
8.6
|
%
|
45,027
|
|
14.2
|
%
|
39,423
|
|
|||||||
|
Restructuring and other charges
|
5,335
|
|
348.3
|
%
|
1,190
|
|
(43.2
|
)%
|
2,094
|
|
|||||||
|
Litigation reserves, net
|
5,354
|
|
**
|
|
390
|
|
**
|
|
(201
|
)
|
|||||||
|
Impairment charges
|
2,000
|
|
**
|
|
—
|
|
**
|
|
—
|
|
|||||||
|
Total operating expenses
|
300,576
|
|
16.8
|
%
|
257,439
|
|
5.3
|
%
|
244,577
|
|
|||||||
|
Income from operations
|
93,039
|
|
(26.2
|
)%
|
126,114
|
|
1.0
|
%
|
124,869
|
|
|||||||
|
Interest income
|
400
|
|
(19.7
|
)%
|
498
|
|
4.4
|
%
|
477
|
|
|||||||
|
Other income (expense), net
|
(457
|
)
|
(117.1
|
)%
|
2,670
|
|
**
|
|
(1,136
|
)
|
|||||||
|
Income before income taxes
|
92,982
|
|
(28.1
|
)%
|
129,282
|
|
4.1
|
%
|
124,210
|
|
|||||||
|
Provision for income taxes
|
37,765
|
|
(11.6
|
)%
|
42,743
|
|
30.1
|
%
|
32,842
|
|
|||||||
|
Net income
|
$
|
55,217
|
|
(36.2
|
)%
|
$
|
86,539
|
|
(5.3
|
)%
|
$
|
91,368
|
|
||||
** Percentage change not meaningful.
The following table sets forth the Consolidated Statements of Operations, expressed as a percentage of net revenue, for the periods presented:
|
|
Year Ended December 31,
|
|||||||
|
|
2013
|
2012
|
2011
|
|||||
|
Net revenue
|
100
|
%
|
100
|
%
|
100
|
%
|
||
|
Cost of revenue
|
71.3
|
|
69.8
|
|
68.7
|
|
||
|
Gross margin
|
28.7
|
|
30.2
|
|
31.3
|
|
||
|
Operating expenses:
|
||||||||
|
Research and development
|
6.2
|
|
4.8
|
|
4.1
|
|
||
|
Sales and marketing
|
11.2
|
|
11.9
|
|
13.1
|
|
||
|
General and administrative
|
3.6
|
|
3.5
|
|
3.3
|
|
||
|
Restructuring and other charges
|
0.4
|
|
0.1
|
|
0.2
|
|
||
|
Litigation reserves, net
|
0.4
|
|
0.0
|
|
0.0
|
|
||
|
Impairment charges
|
0.1
|
|
—
|
|
—
|
|
||
|
Total operating expenses
|
21.9
|
|
20.3
|
|
20.7
|
|
||
|
Income from operations
|
6.8
|
|
9.9
|
|
10.6
|
|
||
|
Interest income
|
0.0
|
|
0.1
|
|
0.0
|
|
||
|
Other income (expense), net
|
0.0
|
|
0.2
|
|
(0.1
|
)
|
||
|
Income before income taxes
|
6.8
|
|
10.2
|
|
10.5
|
|
||
|
Provision for income taxes
|
2.8
|
|
3.4
|
|
2.8
|
|
||
|
Net income
|
4.0
|
%
|
6.8
|
%
|
7.7
|
%
|
||
Net Revenue
42
Our net revenue consists of gross product shipments, less allowances for estimated returns for stock rotation and warranty, price protection, end-user customer rebates and other sales incentives deemed to be a reduction of net revenue and net changes in deferred revenue.
|
Year Ended December 31,
|
|||||||||||||||||
|
2013
|
% Change
|
2012
|
% Change
|
2011
|
|||||||||||||
|
(In thousands, except percentage data)
|
|||||||||||||||||
|
Total net revenue
|
$
|
1,369,633
|
|
7.7
|
%
|
$
|
1,271,921
|
|
7.7
|
%
|
$
|
1,181,018
|
|
||||
2013 vs 2012
Net revenue increased
$97.7 million
, or
7.7%
, to
$1.37 billion
for the year ended
December 31, 2013
, from
$1.27 billion
for the year ended
December 31, 2012
. The increase in net revenue was primarily attributable to increased sales of our mobile products acquired through our acquisition of AirCard, home security monitoring and automation products, and switches, partially offset by a decrease in sales of our broadband gateways. We experienced an increase in revenues in the Americas and APAC regions, and a decrease in EMEA. In addition, our service provider, retail and commercial business increased year-over-year.
2012 vs 2011
Net revenue increased $90.9 million, or 7.7%, to $1.27 billion for the year ended December 31, 2012, from $1.18 billion for the year ended December 31, 2011. The increase in net revenue was primarily attributable to increased sales of broadband gateway products and home wireless products, partially offset by a decrease in sales of our network storage products.
Refer to "Net Revenue by Geographic Region" and "Segment Information" for further discussion of net revenue by geographic region and segment respectively.
Net Revenue by Geographic Region
|
|
Year Ended December 31,
|
||||||||||||||||
|
|
2013
|
% Change
|
2012
|
% Change
|
2011
|
||||||||||||
|
|
(In thousands, except percentage data)
|
||||||||||||||||
|
Americas
|
$
|
789,318
|
|
16.2
|
%
|
$
|
679,419
|
|
15.7
|
%
|
$
|
587,056
|
|
||||
|
Percentage of net revenue
|
57.7
|
%
|
53.4
|
%
|
49.7
|
%
|
|||||||||||
|
EMEA
|
$
|
412,688
|
|
(9.8
|
)%
|
$
|
457,724
|
|
(4.2
|
)%
|
$
|
477,713
|
|
||||
|
Percentage of net revenue
|
30.1
|
%
|
36.0
|
%
|
40.4
|
%
|
|||||||||||
|
APAC
|
$
|
167,627
|
|
24.4
|
%
|
$
|
134,778
|
|
15.9
|
%
|
$
|
116,249
|
|
||||
|
Percentage of net revenue
|
12.2
|
%
|
10.6
|
%
|
9.8
|
%
|
|||||||||||
2013 vs 2012
The increase in Americas net revenue was primarily attributable to increased sales of our mobile products acquired through our acquisition of AirCard, home security monitoring and automation products, and switches, partially offset by a decrease in sales of our broadband gateways. The decrease in EMEA net revenue was primarily attributable to a decrease in sales of our broadband gateways and home wireless products. The decrease in sales of our broadband gateways is partially due to the consolidation among cable operators in Europe in the second half of 2013. The increase in APAC was primarily attributable to increased sales of our mobile products acquired through our acquisition of AirCard, home wireless products, and switches, partially offset by a decrease in sales of our broadband gateways.
Americas continues to represent the largest percentage of our net revenues, and APAC increased as a percentage of revenue, primarily due to growth in the region. EMEA decreased as a percentage of revenues as we continued to see macroeconomic weakness in the European market.
43
2012 vs 2011
The increase in Americas net revenue was primarily driven by our retail products and sales to our service provider customers. The decrease in EMEA net revenue was primarily attributable to a decrease in sales of our commercial products and, to a lesser extent, a decrease in sales of our retail products, primarily driven by a challenging economic environment in Europe. The increase in APAC net revenue was primarily attributable to increased sales to our service provider customers.
Cost of Revenue and Gross Margin
Cost of revenue consists primarily of the following: the cost of finished products from our third party manufacturers; overhead costs, including purchasing, product planning, inventory control, warehousing and distribution logistics; third-party software licensing fees; inbound freight; warranty costs associated with returned goods; write-downs for excess and obsolete inventory and amortization expense of certain acquired intangibles. We outsource our manufacturing, warehousing and distribution logistics. We believe this outsourcing strategy allows us to better manage our product costs and gross margin. Our gross margin can be affected by a number of factors, including fluctuation in foreign exchange rates, sales returns, changes in average selling prices, end-user customer rebates and other sales incentives, and changes in our cost of goods sold due to fluctuations in prices paid for components, net of vendor rebates, warranty and overhead costs, inbound freight, conversion costs and charges for excess or obsolete inventory. The following table presents costs of revenue and gross margin, for the periods indicated:
|
|
Year Ended December 31,
|
||||||||||||||||
|
|
2013
|
% Change
|
2012
|
% Change
|
2011
|
||||||||||||
|
|
(In thousands, except percentage data)
|
||||||||||||||||
|
Cost of revenue
|
$
|
976,018
|
|
9.9
|
%
|
$
|
888,368
|
|
9.5
|
%
|
$
|
811,572
|
|
||||
|
Gross margin percentage
|
28.7
|
%
|
30.2
|
%
|
31.3
|
%
|
|||||||||||
2013 vs 2012
Cost of revenue increased
$87.7 million
, or
9.9%
, to
$976.0 million
for the year ended
December 31, 2013
, from
$888.4 million
for the year ended
December 31, 2012
. Our gross margin decreased to
28.7%
for the year ended
December 31, 2013
, from
30.2%
for the year ended
December 31, 2012
.
The decrease in gross margin percentage was primarily attributable to relatively faster growth in revenue from service providers, which generally carries lower gross margins than our other products. Sales to service providers increased as a percentage of net revenue to 40.0% in the year ended December 31, 2013, compared to 36.1% in the year ended December 31, 2012, which was primarily attributable to our acquisition of AirCard. Also contributing to the decrease in gross margin were increases of $4.0 million in intangibles amortization expense, primarily attributable to assets acquired from AirCard and Arada and $3.5 million increase in freight costs, as well as $3.3 million in excess and obsolete inventory charges.
2012 vs 2011
Cost of revenue increased $76.8 million, or 9.5%, to $888.4 million for the year ended December 31, 2012, from $811.6 million for the year ended December 31, 2011. Our gross margin decreased to 30.2% for the year ended December 31, 2012, from 31.3% for the year ended December 31, 2011.
The decrease in gross margin was primarily attributable to relatively faster growth in our revenue from service providers, which generally carries lower gross margins than our other products. Sales to service providers increased as a percentage of net revenue to 36.1% in the year ended December 31, 2012, compared to 31.1% in the year ended December 31, 2011.
44
Operating Expenses
Research and Development Expense
Research and development expenses consist primarily of personnel expenses, payments to suppliers for design services, safety and regulatory testing, product certification expenditures to qualify our products for sale into specific markets, prototypes and other consulting fees. Research and development expenses are recognized as they are incurred. We have invested in building our research and development organization to enhance our ability to introduce innovative and easy-to-use products. In the future, we expect research and development expenses will increase in absolute dollars and as a percentage of revenue as we broaden our core competencies and expand into new software and networking product technologies. The following table presents research and development expense, for the periods indicated:
|
|
Year Ended December 31,
|
||||||||||||||||
|
|
2013
|
% Change
|
2012
|
% Change
|
2011
|
||||||||||||
|
|
(In thousands, except percentage data)
|
||||||||||||||||
|
Research and development expense
|
$
|
85,168
|
|
39.5
|
%
|
$
|
61,066
|
|
25.4
|
%
|
$
|
48,699
|
|
||||
|
Percentage of net revenue
|
6.2
|
%
|
4.8
|
%
|
4.1
|
%
|
|||||||||||
2013 vs 2012
Research and development expenses increased
$24.1 million
, or
39.5%
, to
$85.2 million
for the year ended
December 31, 2013
, from
$61.1 million
for the year ended
December 31, 2012
. Additionally, research and development expenses increased as a percentage of net revenue to 6.2% for the year ended
December 31, 2013
, from 4.8% for the year ended
December 31, 2012
. These increases were primarily due to significant growth in research and development headcount as a result of our acquisitions during the second quarter of 2013. Personnel and facility-related expenses increased by $22.9 million, and expenses related to projects and outside professional services also increased by $2.3 million. These increases were partially offset by a decrease in variable compensation of $0.9 million. Research and development headcount increased by
104
employees to
355
employees at
December 31, 2013
compared to
251
employees at
December 31, 2012
.
2012 vs 2011
Research and development expenses increased $12.4 million, or 25.4%, to $61.1 million for the year ended December 31, 2012, from $48.7 million for the year ended December 31, 2011. The increase was primarily attributable to higher personnel-related expenses of $7.1 million attributable to headcount growth and increased expenses of $6.0 million primarily related to our increased investment in research and development projects for software development, and acquisition-related research and development. These expenses were offset by a benefit of $3.0 million due to a decrease in variable compensation. Research and development headcount increased by 27 employees to 251 employees at December 31, 2012 compared to 224 employees at December 31, 2011. Furthermore, the increase was attributable to higher facilities expenses of $2.1 million, primarily related to our acquisition-related expansions.
Sales and Marketing Expense
Sales and marketing expenses consist primarily of advertising, trade shows, corporate communications and other marketing expenses, product marketing expenses, outbound freight costs, personnel expenses for sales and marketing staff and technical support expenses. The following table presents sales and marketing expense, for the periods indicated:
|
|
Year Ended December 31,
|
||||||||||||||||
|
|
2013
|
% Change
|
2012
|
% Change
|
2011
|
||||||||||||
|
|
(In thousands, except percentage data)
|
||||||||||||||||
|
Sales and marketing expense
|
$
|
153,804
|
|
2.7
|
%
|
$
|
149,766
|
|
(3.1
|
)%
|
$
|
154,562
|
|
||||
|
Percentage of net revenue
|
11.2
|
%
|
11.9
|
%
|
13.1
|
%
|
|||||||||||
45
2013 vs 2012
Sales and marketing expenses increased
$4.0 million
, or
2.7%
, to
$153.8 million
for the year ended
December 31, 2013
, from
$149.8 million
for the year ended
December 31, 2012
. Sales and marketing expense as a percentage of net revenue was relatively flat for the year ended
December 31, 2013
as compared to the year ended
December 31, 2012
. The change in sales and marketing expense was due to increases of $6.4 million in amortization of intangible assets, largely related to intangible assets acquired from AirCard, and $1.1 million in personnel and facility related expenses. These increases were partially offset by decreases of $1.7 million in variable compensation expenses, $0.7 million in projects and outside professional services, $0.6 million in marketing expenses and $0.5 million in freight costs. Sales and marketing headcount increased by
35
employees to
387
employees at
December 31, 2013
compared to
352
employees at
December 31, 2012
.
2012 vs 2011
Sales and marketing expenses decreased $4.8 million, or 3.1%, to $149.8 million for the year ended December 31, 2012, from $154.6 million for the year ended December 31, 2011. The decrease was primarily due to a decrease in marketing costs of $3.1 million, as we shifted our marketing efforts towards activities that were deemed to be a reduction in net revenue and away from operating expense related marketing, and freight expenses of $1.8 million. Payroll-related expenses, excluding stock-based compensation, were relatively flat year-over-year, as an increase of $3.8 million in personnel-related costs due to increased annual headcount were offset by a decrease of $3.8 million in variable compensation. Sales and marketing headcount decreased by 5 employees to 352 employees at December 31, 2012 compared to 357 employees at December 31, 2011.
General and Administrative
General and administrative expenses consist of salaries and related expenses for executives, finance and accounting, human resources, information technology, professional fees, allowance for doubtful accounts and other general corporate expenses. The following table presents general and administrative expense, for the periods indicated:
|
|
Year Ended December 31,
|
||||||||||||||||
|
|
2013
|
% Change
|
2012
|
% Change
|
2011
|
||||||||||||
|
|
(In thousands, except percentage data)
|
||||||||||||||||
|
General and administrative expense
|
$
|
48,915
|
|
8.6
|
%
|
$
|
45,027
|
|
14.2
|
%
|
$
|
39,423
|
|
||||
|
Percentage of net revenue
|
3.6
|
%
|
3.5
|
%
|
3.3
|
%
|
|||||||||||
2013 vs 2012
General and administrative expenses increased
$3.9 million
, or
8.6%
, to
$48.9 million
for the year ended
December 31, 2013
, from
$45.0 million
for the year ended
December 31, 2012
. General and administrative expenses as a percentage of net revenue were relatively flat for the year ended
December 31, 2013
as compared to the year ended
December 31, 2012
. The increase in general and administration expenses was primarily attributable to a $3.9 million increase in outside legal services due to additional litigation and merger and acquisition activity, and a $1.4 million increase in personnel and facility-related expenses. These increases were partially offset by a $1.2 million decrease in variable compensation. General and administrative headcount increased by
16
employees to
144
employees at
December 31, 2013
compared to
128
employees at
December 31, 2012
.
2012 vs 2011
General and administrative expenses increased $5.6 million, or 14.2%, to $45.0 million for the year ended December 31, 2012, from $39.4 million for the year ended December 31, 2011. The increase was primarily due to an increase in outside professional services of $6.2 million largely attributable to acquisition and litigation related activities and an increase of $1.9 million in facility-related expenses. These increases were partially offset by a decrease in personnel-related expenses of $3.3 million, primarily related to the decrease in variable compensation. General and administrative headcount increased by 14 employees to 128 employees at December 31, 2012 compared to 114 employees at December 31, 2011.
Restructuring and Other Charges
2013 vs 2012
46
Restructuring and other charges increased
$4.1 million
, or
348.3%
to an expense of
$5.3 million
during the year ended
December 31, 2013
, from
$1.2 million
for year ended
December 31, 2012
. Of the $5.3 million restructuring and other charges incurred, $3.3 million was incurred in the fourth quarter of 2013 related to the consolidation of certain teams and locations to drive efficiencies and realign resources to better focus on key growth markets, $1.9 million is for transition costs related to the AirCard acquisition, and $0.2 million is related to an office lease exit liability related to the AVAAK acquisition. In addition, the Company recorded a restructuring adjustment of $94,000 to decrease the previously recorded severance liabilities.
2012 vs 2011
Restructuring and other charges decreased $0.9 million, or 43.2% to an expense of $1.2 million during the year ended December 31, 2012, from $2.1 million for year ended December 31, 2011. The expense of $1.2 million was primarily due to employee severance attributable to the consolidation of product groups and the consolidation of the EMEA sales team within our commercial business unit.
For a further discussion of restructuring and other charges, refer to Note 4,
Restructuring and Other Charges
, in the Notes to Consolidated Financial Statements in Item 8 of Part II of this Annual Report on Form 10-K.
Litigation Reserves and Payments
During the year ended
December 31, 2013
, we recorded a litigation reserve of
$5.4 million
for estimated costs primarily related to the Ericsson and Ruckus litigation.
During the year ended December 31, 2012, we recorded a litigation reserve of $0.4 million for estimated costs related to the settlement of potential lawsuits or lawsuits already filed against us.
For a detailed discussion of our litigation matters, refer to Note 9,
Commitments and Contingencies
, in Notes to Consolidated Financial Statements in Item 8 of Part II of this Annual Report on Form 10-K.
Impairment Charges
We recorded an impairment charge of $2.0 million during the year ended
December 31, 2013
, as compared to no impairment charges in the year ended
December 31, 2012
, related to the abandonment of certain IPR&D projects acquired in the AirCard acquisition. Refer to Note 2,
Business Acquisitions
and the Intangibles section of Note 3,
Balance Sheet Components
, in Notes to Consolidated Financial Statements in Item 8 of Part II of this Annual Report on Form 10-K for further discussion.
Interest Income and Other Income (Expense)
Interest income represents amounts earned on our cash, cash equivalents and short-term investments. Other income (expense), net, primarily represents gains and losses on transactions denominated in foreign currencies and other miscellaneous income and expenses. The following table presents interest income and other income, net, for the periods indicated:
|
|
Year Ended December 31,
|
||||||||||||||||
|
|
2013
|
% Change
|
2012
|
% Change
|
2011
|
||||||||||||
|
|
(In thousands, except percentage data)
|
||||||||||||||||
|
Interest income
|
$
|
400
|
|
(19.7
|
)%
|
$
|
498
|
|
4.4
|
%
|
$
|
477
|
|
||||
|
Other income (expense), net
|
(457
|
)
|
(117.1
|
)%
|
2,670
|
|
**
|
|
(1,136
|
)
|
|||||||
|
Total interest income and other income, net
|
$
|
(57
|
)
|
(101.8
|
)%
|
$
|
3,168
|
|
**
|
|
$
|
(659
|
)
|
||||
** Percentage change not meaningful.
2013 vs 2012
Interest income decreased
$98,000
, or
19.7%
, to
$400,000
for the year ended
December 31, 2013
, from
$498,000
for the year ended
December 31, 2012
. The decrease in interest income was primarily due to the decrease in our cash balance, attributable to the AirCard and Arada acquisitions in the second quarter of 2013 and repurchase of shares in the fourth quarter of 2013.
Other income (expense), net, decreased
$3.1 million
to expense of
$0.5 million
for the year ended
December 31, 2013
, from income of
$2.7 million
for year ended
December 31, 2012
. The decrease was primarily attributable to a $3.1 million gain on sale
47
of cost method investment recognized in the year ended December 31, 2012, as compared to no gains recognized during the year ended December 31, 2013. For details of our hedging program and related foreign currency contracts, refer to Note 5,
Derivative Financial Instruments
, in Notes to Consolidated Financial Statements in Item 8 of Part II of this Annual Report on Form 10-K for further discussion.
2012 vs 2011
Interest income increased $21,000, or 4.4%, to $498,000 for the year ended December 31, 2012, from $477,000 for the year ended December 31, 2011. The increase in interest income was primarily attributable to an increase in our average balance of cash, cash equivalents, and short-term investments during the year ended December 31, 2012, as compared to the year ended December 31, 2011, which was partially offset by falling interest rates.
Other income and expense, net, increased $3.8 million to income of $2.7 million for the year ended December 31, 2012, from expense of $1.1 million for year ended December 31, 2011. The increase was primarily attributable to the $3.1 million gain on the sale of a cost method investment. In addition, our foreign currency hedging program reduced volatility associated with hedged currency exchange rate movements during the year ended December 31, 2012.
Provision for Income Taxes
2013 vs 2012
Provision for income taxes decreased by
$5.0 million
, resulting in a provision of
$37.8 million
for the year ended
December 31, 2013
, compared to a provision of
$42.7 million
for the year ended
December 31, 2012
. The effective tax rate increased to
40.6%
for the year ended
December 31, 2013
from
33.1%
for the year ended
December 31, 2012
. The decrease in tax was mainly due to lower consolidated pretax income. The effective tax rate for both periods differed from the statutory rate of 35% due to earnings from foreign jurisdictions, state taxes, tax credits and non-deductible expenses. For the year ended December 31, 2013, tax on earnings from foreign operations increased the effective tax rate by 3.9 percentage points compared to a decrease of 4.8 percentage points for 2012. The increase in the effective tax rate from earnings of foreign operations in 2013 compared to 2012 resulted from the tax effect of non-deductible losses in foreign jurisdictions where no benefit can be claimed as well as increases in accruals for uncertain tax positions in foreign jurisdictions. The tax rate increase was partially offset by the recognition of a tax benefit for the 2012 U.S. federal research credit. On January 2, 2013 the American Taxpayer Relief Act of 2012 reinstated the research credit, retroactive to January 1, 2012. Accordingly, the entire benefit for the 2012 research credit of approximately $822,000 was recognized in 2013.
2012 vs 2011
Provision for income taxes increased $9.9 million, resulting in a provision of $42.7 million for the year ended December 31, 2012, compared to a provision of $32.8 million for the year ended December 31, 2011. The effective tax rate increased to 33.1% for the year ended December 31, 2012 from 26.4% for the year ended December 31, 2011. The effective tax rate for both periods differed from the statutory rate of 35% due to earnings from foreign jurisdictions, state taxes and other non-deductible expenses. Non-deductible expenses in the year ended December 31, 2012 included certain stock based compensation. For the year ended December 31, 2012, tax on earnings from foreign operations reduced the effective tax rate by 4.8 percentage points compared to 9.5 percentage points for 2011. The increase in the effective tax rate from earnings of foreign operations in 2012 compared to 2011 resulted from a decrease in the profitability of international operations located in tax jurisdictions with rates below 35%. Additionally, the effective tax rate was higher due to the expiration of tax laws providing for the US federal research credit for the year ended December 31, 2012. Tax rate increases were partially offset by a reduction in accruals for uncertain tax positions as a result of the completion of a tax audit by the US Internal Revenue Service.
Net Income
2013 vs 2012
Net income decreased
$31.3 million
to
$55.2 million
for the year ended
December 31, 2013
, from
$86.5 million
for the year ended
December 31, 2012
. This decrease was primarily due to a decrease of $3.2 million in other income, and an increase in operating expenses of $43.1 million, primarily attributable to acquisition-related activity and increased investments in research and development. These changes were partially offset by an increase of $10.1 million in gross profits and a decrease in the provision for income taxes of $5.0 million.
48
2012 vs 2011
Net income decreased $4.9 million to $86.5 million for the year ended December 31, 2012, from $91.4 million for the year ended December 31, 2011. This decrease was primarily attributable to an increase in the provision for income tax of $9.9 million, partially offset by an increase of $3.8 million in other income and expense, net, and operating income of $1.2 million.
Segment Information
A description of our products and services, as well as segment financial data, for each segment can be found in Note 12,
Segment Information, Operations by Geographic Area and Customer Concentration
, in Notes to Consolidated Financial Statements in Item 8 of Part II of this Annual Report on Form 10-K. Future changes to our organizational structure or business may result in changes to the reportable segments disclosed.
Segment contribution income includes all product line segment net revenues less the related cost of sales, research and development, and sales and marketing costs. Contribution income is used, in part, to evaluate the performance of, and allocate resources to, each of the segments. Certain operating expenses are not allocated to segments because they are separately managed at the corporate level. These unallocated indirect costs include corporate costs, such as corporate research and development, general and administrative costs, stock-based compensation expenses, amortization of intangibles, acquisition-related expenses, restructuring costs, litigation reserves, impairment charges, and interest and other income (expense), net.
A reconciliation of segment contribution income to income before income taxes can be found in Note 12,
Segment Information, Operations by Geographic Area and Customer Concentration
, in Notes to Consolidated Financial Statements in Item 8 of Part II of this Annual Report on Form 10-K.
Retail
|
Year Ended December 31,
|
|||||||||||||||||
|
2013
|
% Change
|
2012
|
% Change
|
2011
|
|||||||||||||
|
( in thousands, except percentage data)
|
|||||||||||||||||
|
Net revenue
|
$
|
509,924
|
|
1.0
|
%
|
$
|
504,797
|
|
4.8
|
%
|
$
|
481,795
|
|
||||
|
Percentage of net revenue
|
37.3
|
%
|
39.7
|
%
|
40.8
|
%
|
|||||||||||
|
Contribution income
|
73,418
|
|
(15.4
|
)%
|
86,808
|
|
6.4
|
%
|
81,589
|
|
|||||||
|
Contribution margin
|
14.4
|
%
|
17.2
|
%
|
16.9
|
%
|
|||||||||||
2013 vs 2012
Net revenue in the retail business unit increased
$5.1 million
, or
1.0%
, to
$509.9 million
for the year ended
December 31, 2013
, from
$504.8 million
for the year ended
December 31, 2012
. The increase was primarily due to increased sales of our multimedia products, home security monitoring and automation products, and mobile products, partially offset by a decrease in home wireless products. Contribution income decreased
$13.4 million
, or
15.4%
, to
$73.4 million
for the year ended
December 31, 2013
, from
$86.8 million
for the year ended
December 31, 2012
. The decrease was primarily due to increased cost of revenues driven by an increase in freight and warranty costs, and an unfavorable product mix.
2012 vs 2011
The retail business unit experienced an increase in revenue from 2011 to 2012. The increase was primarily driven by an increase in revenue from sales of our home wireless products, partially offset by a decrease in sales of our powerline, home storage and broadband gateways products. The retail business unit experienced strong revenue growth in the Americas region and moderate growth in the APAC region; however these increases were partially offset by a decrease in net revenues from sales in the EMEA region, as the region continued to experience macroeconomic weakness in the European market. The increase in contribution income was primarily due to revenue growth, which was partially offset by an increase in operating expenses, primarily driven by investments in research and development, as well as product management and marketing costs.
49
Commercial
|
Year Ended December 31,
|
|||||||||||||||||
|
2013
|
% Change
|
2012
|
% Change
|
2011
|
|||||||||||||
|
( in thousands, except percentage data)
|
|||||||||||||||||
|
Net revenue
|
$
|
311,261
|
|
1.1
|
%
|
$
|
307,945
|
|
(7.1
|
)%
|
$
|
331,439
|
|
||||
|
Percentage of net revenue
|
22.7
|
%
|
24.2
|
%
|
28.1
|
%
|
|||||||||||
|
Contribution income
|
66,506
|
|
(1.9
|
)%
|
67,826
|
|
(9.3
|
)%
|
74,746
|
|
|||||||
|
Contribution margin
|
21.4
|
%
|
22.0
|
%
|
22.6
|
%
|
|||||||||||
2013 vs 2012
Net revenue in the commercial business unit increased
$3.3 million
, or
1.1%
, to
$311.3 million
for the year ended
December 31, 2013
, from
$307.9 million
for the year ended
December 31, 2012
. The increase is primarily attributable to increased sales of our switches, partially offset by a decrease in sales of our wireless products. Contribution income decreased
$1.3 million
, or
1.9%
, to
$66.5 million
for the year ended
December 31, 2013
, from
$67.8 million
for the year ended
December 31, 2012
. The decrease was primarily attributable to increased cost of revenues driven by increased freight and warranty costs. The decrease in contribution income as a result of the increase in cost of revenues was partially offset by a benefit from decreased sales and marketing and research and development costs.
2012 vs 2011
The commercial business unit experienced a decrease in net revenue from 2011 to 2012. The decrease was primarily experienced in the EMEA region, as the region continued to experience macroeconomic weakness in the European market. Net revenues from sales in the Americas and APAC regions remained relatively flat. On a product-level, the decrease was primarily attributable to a decrease in sales from our network storage product line. Contribution income also decreased, primarily due to the decline in revenue out-pacing the savings from decreases in our costs of revenue and operating expenses. Net revenue decreased by 7.1%, while costs of revenue and operating expenses decreased by 6.5% and 6.3% respectively. The decrease in costs of revenue was primarily attributable to the decrease in net revenues and a more favorable air/sea freight mix. The decrease in our commercial business unit's operating expenses was primarily due to a decrease in sales and marketing cost, partially offset by an increase in research and development costs.
Service Provider
|
Year Ended December 31,
|
|||||||||||||||||
|
2013
|
% Change
|
2012
|
% Change
|
2011
|
|||||||||||||
|
( in thousands, except percentage data)
|
|||||||||||||||||
|
Net revenue
|
$
|
548,448
|
|
19.4
|
%
|
$
|
459,179
|
|
24.9
|
%
|
$
|
367,784
|
|
||||
|
Percentage of net revenue
|
40.0
|
%
|
36.1
|
%
|
31.1
|
%
|
|||||||||||
|
Contribution income
|
51,620
|
|
26.5
|
%
|
40,794
|
|
24.4
|
%
|
32,797
|
|
|||||||
|
Contribution margin
|
9.4
|
%
|
8.9
|
%
|
8.9
|
%
|
|||||||||||
2013 vs 2012
Net revenue in the service provider business unit increased
$89.3 million
, to
$548.4 million
for the year ended
December 31, 2013
, from
$459.2 million
for the year ended
December 31, 2012
. The increase is primarily attributed to increased sales of our mobile products as a result of the AirCard acquisition and home security monitoring and automation products, partially offset by a decrease in sales of our broadband gateways. The decrease in sales of our broadband gateways is partially due to the consolidation among cable operators in Europe in the second half of 2013. Contribution income increased
$10.8 million
, or
26.5%
, to
$51.6 million
for the year ended
December 31, 2013
, from
$40.8 million
for the year ended
December 31, 2012
. The increase is primarily due to an increase in gross profit, largely attributable to revenue growth, partially offset by an increase in excess and obsolete inventory charges and increased research and development costs.
50
2012 vs 2011
The service provider business unit experienced strong net revenue growth from 2011 to 2012. The increase was primarily attributable to sales growth of our broadband gateway products, primarily driven by service provider demand for our Docsis 3.0 products, and to a lesser extent, the acquisition of the Customer Networking Solutions division of Westell Technologies, Inc. Contribution income remained in line with revenue growth, with net revenue increasing by 24.9%, while costs of revenue and operating expenses increased by 25.2% and 22.3% respectively. The increase in costs of revenue was primarily due to revenue growth and the increase in operating expenses was primarily attributable to increased investments in research and development.
Liquidity and Capital Resources
As of
December 31, 2013
, we had cash, cash equivalents and short-term investments totaling
$248.2 million
.
Our cash and cash equivalents balance decreased from
$149.0 million
as of December 31,
2012
to
$143.0 million
as of December 31,
2013
. Our short-term investments, which represent the investment of funds available for current operations, decreased from
$227.8 million
as of December 31,
2012
to
$105.1 million
as of December 31,
2013
. The decrease in cash and cash equivalents and short-term investments are mainly attributable to the AirCard and Arada acquisitions in the second quarter of 2013 and repurchase of shares in the fourth quarter of 2013. Operating activities during the year ended December 31,
2013
, generated cash of
$86.9 million
. Investing activities during the year ended December 31,
2013
used
$39.7 million
, mainly due to the payments made in connection with business acquisitions of
$147.2 million
, primarily related to the AirCard acquisition, and purchases of property and equipment of
$18.1 million
, offset by net proceeds of
$121.9 million
from maturities of short-term investments. During the year ended December 31,
2013
, financing activities used
$53.2 million
, primarily due to the repurchase of common stock, partially offset by the issuance of our common stock upon exercise of stock options and our employee stock purchase program, as well as the excess tax benefit from exercises and cancellations of stock options.
Our days sales outstanding as of December 31,
2013
was 69 days, a decrease from 76 days as of December 31,
2012
, as a result of our continuous efforts to manage collections.
Our accounts payable increased from
$87.3 million
at December 31,
2012
to
$114.5 million
at December 31,
2013
, primarily as a result of timing of payments.
Inventory increased from
$174.9 million
at December 31,
2012
to
$224.5 million
at December 31,
2013
. Ending inventory turns decreased to 4.6 turns in the three months ended December 31,
2013
, from 5.0 turns in the three months ended December 31,
2012
.
We enter into foreign currency forward-exchange contracts, which typically mature in three to five months, to hedge a portion of our exposure to foreign currency fluctuations of foreign currency-denominated revenue, costs of revenue, certain operating expenses, receivables, payables, and cash balances. We record on the consolidated balance sheet at each reporting period the fair value of our forward-exchange contracts and record any fair value adjustments in our Consolidated Statements of Operations and in our Consolidated Balance Sheets. Gains and losses associated with currency rate changes on hedge contracts that are non-designated under the authoritative guidance for derivatives and hedging are recorded within other income (expense), net, offsetting foreign exchange gains and losses on our monetary assets and liabilities. Gains and losses associated with currency rate changes on hedge contracts that are designated cash flow hedges under the authoritative guidance for derivatives and hedging are recorded within cumulative other comprehensive income until the related revenue, costs of revenue, or expenses are recognized.
On June 21, 2013, we acquired certain assets and operations of Arada, a privately-held company that develops, licenses, and provides solutions for the next generation of uses of Wi-Fi, for total purchase consideration of $5.3 million in cash. We believe the acquisition will bolster our wireless product offerings in our commercial business unit and strengthen our market position in the small to medium size campus wireless LAN market.
On April 2, 2013, we paid $140.0 million of the aggregate purchase price and completed the acquisition of select assets and operations of the Sierra Wireless, Inc. AirCard business, including several customer relationships, a world-class LTE engineering team, certain intellectual property, inventory and fixed assets. We believe this acquisition will accelerate the mobile initiative of the service provider business unit to become a global leader in providing the latest in LTE data networking access devices.
On October 21, 2008, the Board of Directors authorized management to repurchase up to 6.0 million shares of our outstanding common stock. Under this authorization, the timing and actual number of shares subject to repurchase are at the discretion of management and are contingent on a number of factors, such as levels of cash generation from operations, cash requirements for
51
acquisitions and the price of our common stock. During the year ended December 31, 2013, we repurchased and retired 2.0 million shares or $63.1 million of common stock under this authorization and we did not repurchase any shares during the years ended December 31,
2012
or
2011
.
We also repurchased approximately
14,000
shares, or
$0.5 million
of common stock under a repurchase program to help administratively facilitate the withholding and subsequent remittance of personal income and payroll taxes for individuals receiving RSUs during the year ended
December 31, 2013
. Similarly, during the years ended
December 31, 2012
and
December 31, 2011
, we repurchased approximately
22,000
shares and
25,000
shares, respectively, or
$0.9 million
and
$0.9 million
of common stock, respectively, under the same program to help facilitate tax withholding for RSUs. These shares were retired upon repurchase.
Based on our current plans and market conditions, we believe that our existing cash, cash equivalents and short-term investments will be sufficient to satisfy our anticipated cash requirements for the foreseeable future. However, we cannot be certain that our planned levels of revenue, costs and expenses will be achieved. If our operating results fail to meet our expectations or if we fail to manage our inventory, accounts receivable or other assets, we could be required to seek additional funding through public or private financings or other arrangements. In addition, as we continue to expand our product offerings, channels and geographic presence, we may require additional working capital. In such event, adequate funds may not be available when needed or may not be available on favorable or commercially acceptable terms, which could have a negative effect on our business and results of operations.
Backlog
As of December 31,
2013
, we had a backlog of approximately $139.4 million, compared to approximately $104.6 million as of December 31,
2012
, primarily due to product demand required in the future. Our backlog consists of products for which customer purchase orders have been received and that are scheduled or in the process of being scheduled for shipment. While we expect to fulfill the order backlog within the current year, most orders are subject to rescheduling or cancellation with little or no penalties. Because of the possibility of customer changes in product scheduling or order cancellation, our backlog as of any particular date may not be an indicator of net sales for any succeeding period.
Contractual Obligations and Off-Balance Sheet Arrangements
Contractual Obligations
The following table describes our commitments to settle non-cancelable lease and purchase commitments as of December 31,
2013
(in thousands).
|
Less Than
|
1-3
|
3-5
|
More Than
|
||||||||||||||||
|
1 Year
|
Years
|
Years
|
5 Years
|
Total
|
|||||||||||||||
|
Operating leases
|
$
|
2,987
|
|
$
|
15,248
|
|
$
|
9,726
|
|
$
|
5,988
|
|
$
|
33,949
|
|
||||
|
Purchase obligations
|
187,348
|
|
—
|
|
—
|
|
—
|
|
187,348
|
|
|||||||||
|
$
|
190,335
|
|
$
|
15,248
|
|
$
|
9,726
|
|
$
|
5,988
|
|
$
|
221,297
|
|
|||||
We lease office space, cars and equipment under non-cancelable operating leases with various expiration dates through December 2026. Rent expense in the years ended
December 31, 2013
,
2012
, and
2011
was
$9.9 million
,
$7.6 million
and
$7.0 million
, respectively. The terms of some of the office leases provide for rental payments on a graduated scale. We recognize rent expense on a straight-line basis over the lease period, and have accrued for rent expense incurred but not paid. The amounts presented are consistent with contractual terms and are not expected to differ significantly, unless a substantial change in our headcount needs requires us to exit an office facility early or expand our occupied space.
We enter into various inventory-related purchase agreements with suppliers. Generally, under these agreements, 50% of the orders are cancelable by giving notice 46 to 60 days prior to the expected shipment date and 25% of orders are cancelable by giving notice 31 to 45 days prior to the expected shipment date. Orders are not cancelable within 30 days prior to the expected shipment date. At
December 31, 2013
, we had
$187.3 million
in non-cancelable purchase commitments with suppliers. We expect to sell all products for which we have committed purchases from suppliers.
As of December 31,
2013
and December 31,
2012
, we had $14.6 million and $13.8 million, respectively, of total gross unrecognized tax benefits and related interest. The timing of any payments that could result from these unrecognized tax benefits will depend upon a number of factors. The unrecognized tax benefits have been excluded from the contractual obligations table
52
because reasonable estimates cannot be made of whether, or when, any cash payments for such items might occur. The possible reduction in liabilities for uncertain tax positions in multiple jurisdictions that may impact the statement of operations in the next 12 months is approximately $2.8 million, excluding the interest, penalties and the effect of any related deferred tax assets or liabilities.
Off-Balance Sheet Arrangements
As of December 31,
2013
, we did not have any off-balance sheet arrangements as defined in Item 303(a)(4)(ii) of Regulation S-K.
Recent Accounting Pronouncements
See Note 1,
The Company and Summary of Significant Accounting Policies
, in Notes to Consolidated Financial Statements in Item 8 of Part II of this Annual Report on Form 10-K, for a full description of recent accounting pronouncements, including the expected dates of adoption and estimated effects on financial condition and results of operations, which are hereby incorporated by reference.
|
Item 7A.
|
Quantitative and Qualitative Disclosures About Market Risk
|
Interest Rate Risk
We do not use derivative financial instruments in our investment portfolio. We have an investment portfolio of fixed income securities that are classified as “available-for-sale” securities. These securities, like all fixed income instruments, are subject to interest rate risk and will fall in value if market interest rates increase. We attempt to limit this exposure by investing primarily in highly rated short-term securities. Our investment policy requires investments to be rated triple-A with the objective of minimizing the potential risk of principal loss. Due to the short duration and conservative nature of our investment portfolio, a movement of 10% by market interest rates would not have a material impact on our operating results and the total value of the portfolio over the next fiscal year. We monitor our interest rate and credit risks, including our credit exposure to specific rating categories and to individual issuers. There were no impairment charges on our investments during fiscal
2013
.
Foreign Currency Transaction Risk
We invoice some of our international customers in foreign currencies including, but not limited to, the Australian dollar, British pound, euro, and Japanese yen. As the customers that are currently invoiced in local currency become a larger percentage of our business, or to the extent we begin to bill additional customers in foreign currencies, the impact of fluctuations in foreign exchange rates could have a more significant impact on our results of operations. For those customers in our international markets that we continue to sell to in U.S. dollars, an increase in the value of the U.S. dollar relative to foreign currencies could make our products more expensive and therefore reduce the demand for our products. Such a decline in the demand for our products could reduce sales and negatively impact our operating results. Certain operating expenses of our foreign operations require payment in the local currencies.
We are exposed to risks associated with foreign exchange rate fluctuations due to our international sales and operating activities. These exposures may change over time as business practices evolve and could negatively impact our operating results and financial condition. We began using foreign currency forward contract derivatives in the fourth quarter of 2008 to partially offset our business exposure to foreign exchange risk on our foreign currency denominated assets and liabilities. Additionally, in the second quarter of 2009 we began entering into certain foreign currency forward contracts that have been designated as cash flow hedges under the authoritative guidance for derivatives and hedging to partially offset our business exposure to foreign exchange risk on portions of our anticipated foreign currency revenue, costs of revenue, and certain operating expenses. The objective of these foreign currency forward contracts is to reduce the impact of currency exchange rate movements on our operating results by offsetting gains and losses on the forward contracts with increases or decreases in foreign currency transactions. The contracts are marked-to-market on a monthly basis with gains and losses included in other income (expense), net in the Consolidated Statements of Operations, and in cumulative other comprehensive income on the Consolidated Balance Sheets. We do not use foreign currency contracts for speculative or trading purposes. Hedging of our balance sheet and anticipated cash flow exposures may not always be effective to protect us against currency exchange rate fluctuations. In addition, we do not fully hedge our balance sheet and anticipated cash flow exposures, leaving us at risk to foreign exchange gains and losses on the un-hedged exposures. If there were an adverse movement in exchange rates, we might suffer significant losses. See Note 5,
Derivative Financial Instruments,
of the Notes to Consolidated Financial Statements for additional disclosure on our foreign currency contracts, which are hereby incorporated by reference into this Part II, Item 7A.
53
As of December 31,
2013
, we had net assets in various local currencies. A hypothetical 10% movement in foreign exchange rates would result in an after-tax positive or negative impact of $279,000 to net income, net of our hedged position, at December 31,
2013
. Actual future gains and losses associated with our foreign currency exposures and positions may differ materially from the sensitivity analyses performed as of December 31,
2013
due to the inherent limitations associated with predicting the foreign currency exchange rates, and our actual exposures and positions. For the year ended December 31,
2013
, 12% of total net revenue was denominated in a currency other than the U.S. dollar.
54
|
Item 8.
|
Financial Statements and Supplementary Data
|
Report of Independent Registered Public Accounting Firm
To the Board of Directors and Stockholders of NETGEAR, Inc.:
In our opinion, the consolidated financial statements listed in the index appearing under Item 15(a) (1) present fairly, in all material respects, the financial position of NETGEAR, Inc. and its subsidiaries at December 31,
2013
and December 31,
2012
, and the results of their operations and their cash flows for each of the three years in the period ended December 31,
2013
in conformity with accounting principles generally accepted in the United States of America. In addition, in our opinion, the financial statement schedule listed in the index appearing under Item 15(a)(2)
presents fairly, in all material respects, the information set forth therein when read in conjunction with the related consolidated financial statements. Also in our opinion, the Company maintained, in all material respects, effective internal control over financial reporting as of December 31,
2013
, based on criteria established in
Internal Control - Integrated Framework (1992)
issued by the Committee of Sponsoring Organizations of the Treadway Commission (COSO). The Company's management is responsible for these financial statements and financial statement schedule, for maintaining effective internal control over financial reporting and for its assessment of the effectiveness of internal control over financial reporting, included in Management's Report on Internal Control over Financial Reporting under Item 9A. Our responsibility is to express opinions on these financial statements, on the financial statement schedule, and on the Company's internal control over financial reporting based on our integrated audits. We conducted our audits in accordance with the standards of the Public Company Accounting Oversight Board (United States). Those standards require that we plan and perform the audits to obtain reasonable assurance about whether the financial statements are free of material misstatement and whether effective internal control over financial reporting was maintained in all material respects. Our audits of the financial statements included examining, on a test basis, evidence supporting the amounts and disclosures in the financial statements, assessing the accounting principles used and significant estimates made by management, and evaluating the overall financial statement presentation. Our audit of internal control over financial reporting included obtaining an understanding of internal control over financial reporting, assessing the risk that a material weakness exists, and testing and evaluating the design and operating effectiveness of internal control based on the assessed risk. Our audits also included performing such other procedures as we considered necessary in the circumstances. We believe that our audits provide a reasonable basis for our opinions.
A company's internal control over financial reporting is a process designed to provide reasonable assurance regarding the reliability of financial reporting and the preparation of financial statements for external purposes in accordance with generally accepted accounting principles. A company's internal control over financial reporting includes those policies and procedures that (i) pertain to the maintenance of records that, in reasonable detail, accurately and fairly reflect the transactions and dispositions of the assets of the company; (ii) provide reasonable assurance that transactions are recorded as necessary to permit preparation of financial statements in accordance with generally accepted accounting principles, and that receipts and expenditures of the company are being made only in accordance with authorizations of management and directors of the company; and (iii) provide reasonable assurance regarding prevention or timely detection of unauthorized acquisition, use, or disposition of the company's assets that could have a material effect on the financial statements.
Because of its inherent limitations, internal control over financial reporting may not prevent or detect misstatements. Also, projections of any evaluation of effectiveness to future periods are subject to the risk that controls may become inadequate because of changes in conditions, or that the degree of compliance with the policies or procedures may deteriorate.
/s/ PricewaterhouseCoopers LLP
San Jose, CA
February 25, 2014
55
NETGEAR, INC.
CONSOLIDATED BALANCE SHEETS
(In thousands, except share and per share data)
|
December 31,
2013 |
December 31,
2012 |
||||||
|
ASSETS
|
|||||||
|
Current assets:
|
|||||||
|
Cash and cash equivalents
|
$
|
143,009
|
|
$
|
149,032
|
|
|
|
Short-term investments
|
105,145
|
|
227,845
|
|
|||
|
Accounts receivable, net
|
266,484
|
|
256,014
|
|
|||
|
Inventories
|
224,456
|
|
174,903
|
|
|||
|
Deferred income taxes
|
27,239
|
|
22,691
|
|
|||
|
Prepaid expenses and other current assets
|
33,778
|
|
33,724
|
|
|||
|
Total current assets
|
800,111
|
|
864,209
|
|
|||
|
Property and equipment, net
|
27,194
|
|
19,025
|
|
|||
|
Intangibles, net
|
84,118
|
|
27,621
|
|
|||
|
Goodwill
|
155,916
|
|
100,880
|
|
|||
|
Other non-current assets
|
26,591
|
|
22,834
|
|
|||
|
Total assets
|
$
|
1,093,930
|
|
$
|
1,034,569
|
|
|
|
LIABILITIES AND STOCKHOLDERS’ EQUITY
|
|||||||
|
Current liabilities:
|
|||||||
|
Accounts payable
|
$
|
114,531
|
|
$
|
87,310
|
|
|
|
Accrued employee compensation
|
16,551
|
|
18,338
|
|
|||
|
Other accrued liabilities
|
143,218
|
|
126,255
|
|
|||
|
Deferred revenue
|
24,496
|
|
27,645
|
|
|||
|
Income taxes payable
|
1,287
|
|
1,382
|
|
|||
|
Total current liabilities
|
300,083
|
|
260,930
|
|
|||
|
Non-current income taxes payable
|
13,804
|
|
13,735
|
|
|||
|
Other non-current liabilities
|
6,260
|
|
5,293
|
|
|||
|
Total liabilities
|
320,147
|
|
279,958
|
|
|||
|
Commitments and contingencies (Note 9)
|
|
|
|
|
|||
|
Stockholders’ equity:
|
|||||||
|
Preferred stock: $0.001 par value; 5,000,000 shares authorized; none issued or outstanding
|
—
|
|
—
|
|
|||
|
Common stock: $0.001 par value; 200,000,000 shares authorized; shared issued and outstanding: 36,839,522 and 38,341,644 at December 31, 2013 and 2012, respectively
|
37
|
|
38
|
|
|||
|
Additional paid-in capital
|
421,901
|
|
394,427
|
|
|||
|
Cumulative other comprehensive income
|
69
|
|
4
|
|
|||
|
Retained earnings
|
351,776
|
|
360,142
|
|
|||
|
Total stockholders’ equity
|
773,783
|
|
754,611
|
|
|||
|
Total liabilities and stockholders’ equity
|
$
|
1,093,930
|
|
$
|
1,034,569
|
|
|
The accompanying notes are an integral part of these consolidated financial statements.
56
NETGEAR, INC.
CONSOLIDATED STATEMENTS OF OPERATIONS
(In thousands, except per share data)
|
|
Year Ended December 31,
|
|||||||||||
|
2013
|
2012
|
2011
|
||||||||||
|
Net revenue
|
$
|
1,369,633
|
|
$
|
1,271,921
|
|
$
|
1,181,018
|
|
|||
|
Cost of revenue
|
976,018
|
|
888,368
|
|
811,572
|
|
||||||
|
Gross profit
|
393,615
|
|
383,553
|
|
369,446
|
|
||||||
|
Operating expenses:
|
||||||||||||
|
Research and development
|
85,168
|
|
61,066
|
|
48,699
|
|
||||||
|
Sales and marketing
|
153,804
|
|
149,766
|
|
154,562
|
|
||||||
|
General and administrative
|
48,915
|
|
45,027
|
|
39,423
|
|
||||||
|
Restructuring and other charges
|
5,335
|
|
1,190
|
|
2,094
|
|
||||||
|
Litigation reserves, net
|
5,354
|
|
390
|
|
(201
|
)
|
||||||
|
Impairment charges
|
2,000
|
|
—
|
|
—
|
|
||||||
|
Total operating expenses
|
300,576
|
|
257,439
|
|
244,577
|
|
||||||
|
Income from operations
|
93,039
|
|
126,114
|
|
124,869
|
|
||||||
|
Interest income
|
400
|
|
498
|
|
477
|
|
||||||
|
Other (expense) income, net
|
(457
|
)
|
2,670
|
|
(1,136
|
)
|
||||||
|
Income before income taxes
|
92,982
|
|
129,282
|
|
124,210
|
|
||||||
|
Provision for income taxes
|
37,765
|
|
42,743
|
|
32,842
|
|
||||||
|
Net income
|
$
|
55,217
|
|
$
|
86,539
|
|
$
|
91,368
|
|
|||
|
Net income per share:
|
||||||||||||
|
Basic
|
$
|
1.44
|
|
$
|
2.27
|
|
$
|
2.46
|
|
|||
|
Diluted
|
$
|
1.42
|
|
$
|
2.23
|
|
$
|
2.41
|
|
|||
|
Weighted average shares outstanding used to compute net income per share:
|
||||||||||||
|
Basic
|
38,379
|
|
38,057
|
|
37,121
|
|
||||||
|
Diluted
|
38,948
|
|
38,747
|
|
37,932
|
|
||||||
The accompanying notes are an integral part of these consolidated financial statements.
57
NETGEAR, INC.
CONSOLIDATED STATEMENTS OF COMPREHENSIVE INCOME
(In thousands)
|
|
Year Ended December 31,
|
|||||||||||
|
|
2013
|
2012
|
2011
|
|||||||||
|
Net income
|
$
|
55,217
|
|
$
|
86,539
|
|
$
|
91,368
|
|
|||
|
Other comprehensive income (loss), before tax:
|
||||||||||||
|
Unrealized gain (loss) on derivative instruments
|
89
|
|
(30
|
)
|
(267
|
)
|
||||||
|
Unrealized (loss) gain on available-for-sale securities
|
(40
|
)
|
16
|
|
17
|
|
||||||
|
Other comprehensive income (loss), before tax
|
49
|
|
(14
|
)
|
(250
|
)
|
||||||
|
Tax benefit (expense) related to items of other comprehensive income
|
16
|
|
(5
|
)
|
(8
|
)
|
||||||
|
Other comprehensive income (loss), net of tax
|
65
|
|
(19
|
)
|
(258
|
)
|
||||||
|
Comprehensive income
|
$
|
55,282
|
|
$
|
86,520
|
|
$
|
91,110
|
|
|||
The accompanying notes are an integral part of these consolidated financial statements.
58
NETGEAR, INC.
CONSOLIDATED STATEMENTS OF STOCKHOLDERS' EQUITY
(In thousands)
|
Common Stock
|
||||||||||||||||||||||
|
Shares
|
Amount
|
Additional Paid-In Capital
|
Cumulative Other Comprehensive Income (Loss)
|
Retained Earnings
|
Total
|
|||||||||||||||||
|
Balance at December 31, 2010
|
36,173
|
|
$
|
36
|
|
$
|
316,108
|
|
$
|
281
|
|
$
|
184,011
|
|
$
|
500,436
|
|
|||||
|
Change in unrealized gains and losses on available-for-sale securities, net of tax
|
—
|
|
—
|
|
—
|
|
9
|
|
—
|
|
9
|
|
||||||||||
|
Change in unrealized gains and losses on derivatives, net of tax
|
—
|
|
—
|
|
—
|
|
(267
|
)
|
—
|
|
(267
|
)
|
||||||||||
|
Net income
|
—
|
|
—
|
|
—
|
|
—
|
|
91,368
|
|
91,368
|
|
||||||||||
|
Stock-based compensation expense
|
—
|
|
—
|
|
13,727
|
|
—
|
|
—
|
|
13,727
|
|
||||||||||
|
Purchase and retirement of common stock
|
(25
|
)
|
—
|
|
—
|
|
—
|
|
(926
|
)
|
(926
|
)
|
||||||||||
|
Issuance of common stock under stock-based compensation plans
|
1,499
|
|
2
|
|
30,889
|
|
—
|
|
—
|
|
30,891
|
|
||||||||||
|
Tax benefit from exercises and cancellations of stock options
|
—
|
|
—
|
|
3,519
|
|
—
|
|
—
|
|
3,519
|
|
||||||||||
|
Balance at December 31, 2011
|
37,647
|
|
38
|
|
364,243
|
|
23
|
|
274,453
|
|
638,757
|
|
||||||||||
|
Change in unrealized gains and losses on available-for-sale securities, net of tax
|
—
|
|
—
|
|
—
|
|
11
|
|
—
|
|
11
|
|
||||||||||
|
Change in unrealized gains and losses on derivatives, net of tax
|
—
|
|
—
|
|
—
|
|
(30
|
)
|
—
|
|
(30
|
)
|
||||||||||
|
Net income
|
—
|
|
—
|
|
—
|
|
—
|
|
86,539
|
|
86,539
|
|
||||||||||
|
Stock-based compensation expense
|
—
|
|
—
|
|
14,366
|
|
—
|
|
—
|
|
14,366
|
|
||||||||||
|
Purchase and retirement of common stock
|
(22
|
)
|
—
|
|
—
|
|
—
|
|
(850
|
)
|
(850
|
)
|
||||||||||
|
Issuance of common stock under stock-based compensation plans
|
717
|
|
—
|
|
14,697
|
|
—
|
|
—
|
|
14,697
|
|
||||||||||
|
Tax benefit from exercises and cancellations of stock options
|
—
|
|
—
|
|
1,121
|
|
—
|
|
—
|
|
1,121
|
|
||||||||||
|
Balance at December 31, 2012
|
38,342
|
|
38
|
|
394,427
|
|
4
|
|
360,142
|
|
754,611
|
|
||||||||||
|
Change in unrealized gains and losses on available-for-sale securities, net of tax
|
—
|
|
—
|
|
—
|
|
(24
|
)
|
—
|
|
(24
|
)
|
||||||||||
|
Change in unrealized gains and losses on derivatives, net of tax
|
—
|
|
—
|
|
—
|
|
89
|
|
—
|
|
89
|
|
||||||||||
|
Net income
|
—
|
|
—
|
|
—
|
|
—
|
|
55,217
|
|
55,217
|
|
||||||||||
|
Stock-based compensation expense
|
—
|
|
—
|
|
17,419
|
|
—
|
|
—
|
|
17,419
|
|
||||||||||
|
Purchase and retirement of common stock
|
(2,018
|
)
|
(1
|
)
|
—
|
|
—
|
|
(63,583
|
)
|
(63,584
|
)
|
||||||||||
|
Issuance of common stock under stock-based compensation plans
|
516
|
|
—
|
|
9,626
|
|
—
|
|
—
|
|
9,626
|
|
||||||||||
|
Tax benefit from exercises and cancellations of stock options
|
—
|
|
—
|
|
429
|
|
—
|
|
—
|
|
429
|
|
||||||||||
|
Balance at December 31, 2013
|
36,840
|
|
$
|
37
|
|
$
|
421,901
|
|
$
|
69
|
|
$
|
351,776
|
|
$
|
773,783
|
|
|||||
The accompanying notes are an integral part of these consolidated financial statements.
59
NETGEAR, INC.
(In thousands)
|
|
Year Ended December 31,
|
||||||||||
|
2013
|
2012
|
2011
|
|||||||||
|
Cash flows from operating activities:
|
|||||||||||
|
Net income
|
$
|
55,217
|
|
$
|
86,539
|
|
$
|
91,368
|
|
||
|
Adjustments to reconcile net income to net cash provided by operating activities:
|
|||||||||||
|
Depreciation and amortization
|
32,854
|
|
16,775
|
|
14,735
|
|
|||||
|
Purchase premium amortization/discount accretion on investments, net
|
1,103
|
|
2,490
|
|
986
|
|
|||||
|
Non-cash stock-based compensation
|
17,462
|
|
14,372
|
|
13,762
|
|
|||||
|
Income tax benefit associated with stock option exercises
|
428
|
|
1,121
|
|
3,519
|
|
|||||
|
Gain on sale of cost method investment
|
—
|
|
(3,126
|
)
|
—
|
|
|||||
|
Excess tax benefit from stock-based compensation
|
(767
|
)
|
(1,552
|
)
|
(3,672
|
)
|
|||||
|
Impairment charges
|
2,000
|
|
—
|
|
—
|
|
|||||
|
Deferred income taxes
|
(7,927
|
)
|
(2,545
|
)
|
(4,621
|
)
|
|||||
|
Changes in assets and liabilities, net of effect of acquisitions:
|
|||||||||||
|
Accounts receivable
|
(10,470
|
)
|
5,317
|
|
(34,576
|
)
|
|||||
|
Inventories
|
(46,679
|
)
|
(10,590
|
)
|
(30,039
|
)
|
|||||
|
Prepaid expenses and other assets
|
(4,615
|
)
|
2,619
|
|
(7,935
|
)
|
|||||
|
Accounts payable
|
36,250
|
|
(30,615
|
)
|
28,131
|
|
|||||
|
Accrued employee compensation
|
(1,787
|
)
|
(8,782
|
)
|
2,765
|
|
|||||
|
Other accrued liabilities
|
15,070
|
|
3,444
|
|
9,374
|
|
|||||
|
Deferred revenue
|
(1,211
|
)
|
(12,680
|
)
|
12,555
|
|
|||||
|
Income taxes payable
|
(26
|
)
|
(7,744
|
)
|
(342
|
)
|
|||||
|
Net cash provided by operating activities
|
86,902
|
|
55,043
|
|
96,010
|
|
|||||
|
Cash flows from investing activities:
|
|||||||||||
|
Purchases of short-term investments
|
(153,464
|
)
|
(369,939
|
)
|
(228,871
|
)
|
|||||
|
Proceeds from maturities of short-term investments
|
275,406
|
|
284,418
|
|
227,669
|
|
|||||
|
Purchase of property and equipment
|
(18,050
|
)
|
(14,762
|
)
|
(8,211
|
)
|
|||||
|
Payments for patents
|
(275
|
)
|
(1,400
|
)
|
—
|
|
|||||
|
Cost method investments
|
3,890
|
|
—
|
|
—
|
|
|||||
|
Payments made in connection with business acquisitions, net of cash acquired
|
(147,240
|
)
|
(28,625
|
)
|
(37,509
|
)
|
|||||
|
Net cash used in investing activities
|
(39,733
|
)
|
(130,308
|
)
|
(46,922
|
)
|
|||||
|
Cash flows from financing activities:
|
|||||||||||
|
Purchase and retirement of common stock
|
(63,585
|
)
|
(850
|
)
|
(926
|
)
|
|||||
|
Proceeds from exercise of stock options
|
7,487
|
|
12,700
|
|
29,139
|
|
|||||
|
Proceeds from issuance of common stock under employee stock purchase plan
|
2,139
|
|
1,997
|
|
1,752
|
|
|||||
|
Excess tax benefit from stock-based compensation
|
767
|
|
1,552
|
|
3,672
|
|
|||||
|
Net cash (used) provided by financing activities
|
(53,192
|
)
|
15,399
|
|
33,637
|
|
|||||
|
Net (decrease) increase in cash and cash equivalents
|
(6,023
|
)
|
(59,866
|
)
|
82,725
|
|
|||||
|
Cash and cash equivalents, at beginning of period
|
149,032
|
|
208,898
|
|
126,173
|
|
|||||
|
Cash and cash equivalents, at end of period
|
$
|
143,009
|
|
$
|
149,032
|
|
$
|
208,898
|
|
||
|
Supplemental Cash Flow Information:
|
|||||||||||
|
Cash paid for income taxes
|
$
|
45,982
|
|
$
|
52,403
|
|
$
|
34,365
|
|
||
The accompanying notes are an integral part of these consolidated financial statements.
60
The Company
NETGEAR, Inc. (“NETGEAR” or the “Company”) was incorporated in Delaware in January 1996. The Company is a global networking company that delivers innovative products to consumers, businesses and service providers. The Company's products are built on a variety of proven technologies such as wireless, Ethernet and powerline, with a focus on reliability and ease-of-use. The product line consists of wired and wireless devices that enable networking, broadband access and network connectivity. These products are available in multiple configurations to address the needs of the end-users in each geographic region in which the Company's products are sold.
The Company operates in three specific business segments: retail, commercial, and service provider. Each business unit is managed by a Senior Vice President/General Manager. The Company believes this structure enables it to better focus its efforts on the Company's core customer segments and allows it to be more nimble and opportunistic as a company overall. The retail business unit is focused on individual consumers and consists of high performance, dependable and easy-to-use home networking, home video monitoring, storage and digital media products. The commercial business unit is focused on small and medium size businesses and consists of business networking, storage and security solutions that bring enterprise class functionality at an affordable price. The service provider business unit is focused on the service provider market and consists of made-to-order and retail proven, whole home networking hardware and software solutions, as well as 4G LTE hotspots sold to service providers for sale to their subscribers.
The Company sells networking products through multiple sales channels worldwide, including traditional retailers, online retailers, wholesale distributors, direct market resellers (“DMRs”), value-added resellers (“VARs”), and broadband service providers.
Basis of presentation
The accompanying consolidated financial statements include the accounts of the Company and its wholly owned subsidiaries. All inter-company accounts and transactions have been eliminated in the consolidation of these subsidiaries.
Fiscal periods
The Company's fiscal year begins on January 1 of the year stated and ends on December 31 of the same year. The Company reports its results on a fiscal quarter basis rather than on a calendar quarter basis. Under the fiscal quarter basis, each of the first three fiscal quarters ends on the Sunday closest to the calendar quarter end, with the fourth quarter ending on December 31.
Use of estimates
The preparation of financial statements in conformity with accounting principles generally accepted in the United States of America requires management to make estimates and assumptions that affect the reported amounts of assets and liabilities and disclosure of contingent assets and liabilities at the date of the financial statements and the reported amounts of revenues and expenses during the reported period. Actual results could differ from those estimates.
Cash and cash equivalents
The Company considers all highly liquid investments with an original maturity at the time of purchase of three months or less to be cash equivalents. The Company deposits cash and cash equivalents with high credit quality financial institutions.
Short-term investments
Short-term investments are partially comprised of marketable securities that consist of government securities with an original maturity or a remaining maturity at the time of purchase, of greater than three months and no more than 12 months. The marketable securities are held in the Company's name with one high quality financial institution, which acts as the Company's custodian and investment manager. These marketable securities are classified as available-for-sale securities in accordance with the provisions of the authoritative guidance for investments and are carried at fair value with unrealized gains and losses reported as a separate component of stockholders' equity.
61
Short-term investments are also comprised of marketable securities related to deferred compensation under the Company’s Deferred Compensation Plan. Mutual funds are the only investments allowed in the Company's Deferred Compensation Plan and the investments are held in a grantor trust formed by the Company. The Company has classified these investments as trading securities as the grantor trust actively manages the asset allocation to match the participants’ notional fund allocations. These securities are recorded at fair market value with unrealized gains and losses included in other income (expense), net.
Certain risks and uncertainties
The Company's products are concentrated in the networking industry, which is characterized by rapid technological advances, changes in customer requirements and evolving regulatory requirements and industry standards. The success of the Company depends on management's ability to anticipate and/or to respond quickly and adequately to technological developments in its industry, changes in customer requirements, or changes in regulatory requirements or industry standards. Any significant delays in the development or introduction of products could have a material adverse effect on the Company's business and operating results.
The Company relies on a limited number of third parties to manufacture all of its products. If any of the Company's third-party manufacturers cannot or will not manufacture its products in required volumes, on a cost-effective basis, in a timely manner, or at all, the Company will have to secure additional manufacturing capacity. Any interruption or delay in manufacturing could have a material adverse effect on the Company's business and operating results.
Derivative financial instruments
The Company uses foreign currency forward contracts to manage the exposures to foreign exchange risk related to expected future cash flows on certain forecasted revenue, costs of revenue, operating expenses, and on certain existing assets and liabilities. Foreign currency forward contracts generally mature within
five
months of inception. Under its foreign currency risk management strategy, the Company utilizes derivative instruments to reduce the impact of currency exchange rate movements on the Company's operating results by offsetting gains and losses on the forward contracts with increases or decreases in foreign currency transactions. The company does not use derivative financial instruments for speculative purposes.
The Company accounts for its derivative instruments as either assets or liabilities and records them at fair value. Derivatives that are not defined as hedges in the authoritative guidance for derivatives and hedging must be adjusted to fair value through earnings. For derivative instruments that hedge the exposure to variability in expected future cash flows that are designated as cash flow hedges, the effective portion of the gain or loss on the derivative instrument is reported as a component of cumulative other comprehensive income in stockholders' equity and reclassified into earnings in the same period or periods during which the hedged transaction affects earnings. The ineffective portion of the gain or loss on the derivative instrument is recognized in current earnings. To receive hedge accounting treatment, cash flow hedges must be highly effective in offsetting changes to expected future cash flows on hedged transactions. For derivatives designated as cash flow hedges, changes in the time value are excluded from the assessment of hedge effectiveness and are recognized in earnings.
Concentration of credit risk
Financial instruments that potentially subject the Company to a concentration of credit risk consist of cash and cash equivalents, short-term investments and accounts receivable. The Company believes that there is minimal credit risk associated with the investment of its cash and cash equivalents and short-term investments, due to the restrictions placed on the type of investment that can be entered into under the Company's investment policy. The Company's short-term investments consist of investment-grade securities, and the Company's cash and investments are held and managed by recognized financial institutions.
The Company's customers are primarily distributors as well as retailers and broadband service providers who sell or distribute the products to a large group of end-users. The Company maintains an allowance for doubtful accounts for estimated losses resulting from the inability of the Company's customers to make required payments. The Company regularly performs credit evaluations of the Company's customers' financial condition and considers factors such as historical experience, credit quality, age of the accounts receivable balances, geographic or country-specific risks and current economic conditions that may affect customers' ability to pay, and, generally, requires no collateral from its customers. The Company secures credit insurance for certain customers in international and domestic markets.
As of
December 31, 2013
and 2012,
Best Buy, Inc.
represented
21%
and
22%
of the Company's total accounts receivable respectively.
62
The Company is exposed to credit loss in the event of nonperformance by counterparties to the foreign currency forward contracts used to mitigate the effect of foreign currency exchange rate changes. The Company believes the counterparties for its outstanding contracts are large, financially sound institutions and thus, the Company does not anticipate nonperformance by these counterparties. However, given the recent, unprecedented turbulence in the financial markets, the failure of additional counterparties is possible.
Fair value measurements
The carrying amounts of the Company's financial instruments, including cash equivalents, short-term investments, accounts receivable, and accounts payable approximate their fair values due to their short maturities. Foreign currency forward contracts are recorded at fair value based on observable market data. See Note 13,
Fair Value Measurements,
of the Notes to Consolidated Financial Statements for disclosures regarding fair value measurements in accordance with the authoritative guidance for fair value measurements and disclosures.
Cost method investments
As of
December 31, 2013
and
December 31, 2012
, the carrying value of the Company's cost method investments was
$1.3 million
. These investments are included in other non-current assets in the consolidated balance sheets and are carried at cost, adjusted for any impairment, because the Company does not have a controlling interest and does not have the ability to exercise significant influence over these companies. The Company monitors these investments for impairment on a quarterly basis, and adjusts carrying value for any impairment charges recognized. There were
no
impairments recognized in the years ended
December 31, 2013
and
December 31, 2012
. Realized gains and losses on these investments are reported in other income (expense), net in the consolidated statements of operations. In the third fiscal quarter of 2012 the Company recognized a gain of
$3.1 million
on the partial sale of one of its cost method investments.
Allowance for doubtful accounts
The Company maintains an allowance for doubtful accounts for estimated losses resulting from the inability of its customers to make required payments. The Company regularly performs credit evaluations of its customers' financial condition and considers factors such as historical experience, credit quality, age of the accounts receivable balances, and geographic or country-specific risks and economic conditions that may affect a customer's ability to pay. The allowance for doubtful accounts is reviewed quarterly and adjusted if necessary based on the Company's assessments of its customers' ability to pay. If the financial condition of the Company's customers should deteriorate or if actual defaults are higher than the Company's historical experience, additional allowances may be required, which could have an adverse impact on operating expenses.
Inventories
Inventories consist primarily of finished goods which are valued at the lower of cost or market, with cost being determined using the first-in, first-out method. The Company writes down its inventories based on estimated excess and obsolete inventories determined primarily by future demand forecasts. At the point of loss recognition, a new, lower cost basis for that inventory is established, and subsequent changes in facts and circumstances do not result in the restoration or increase in that newly established cost basis.
Property and equipment, net
Property and equipment are stated at historical cost, less accumulated depreciation. Depreciation is computed using the straight-line method over the estimated useful lives of the assets as follows:
|
Computer equipment
|
2 years
|
|
Furniture and fixtures
|
5 years
|
|
Software
|
2-5 years
|
|
Machinery and equipment
|
2-3 years
|
|
Leasehold improvements
|
Shorter of the lease term or 5 years
|
63
Recoverability of assets to be held and used is measured by comparing the carrying amount of an asset to the estimated undiscounted future cash flows expected to be generated by the asset. If the carrying amount of the asset exceeds its estimated undiscounted future net cash flows, an impairment charge is recognized by the amount by which the carrying amount of the asset exceeds the fair value of the asset. The carrying value of the asset is reviewed on a regular basis for the existence of facts, both internal and external, that may suggest impairment. Charges related to the impairment of property and equipment were not material in the years ended December 31,
2013
,
2012
and
2011
.
Goodwill
Goodwill represents the purchase price over estimated fair value of net assets of businesses acquired in a business combination. Goodwill acquired in a business combination is not amortized, but instead tested for impairment at least annually during the fourth quarter. Should certain events or indicators of impairment occur between annual impairment tests, the Company will perform the impairment test as those events or indicators occur. Examples of such events or circumstances include the following: a significant decline in the Company’s expected future cash flows; a sustained, significant decline in the Company’s stock price and market capitalization; a significant adverse change in the business climate; and slower growth rates.
Goodwill is tested for impairment at the reporting unit level by first performing a qualitative assessment to determine whether it is more likely than not (that is, a likelihood of more than 50%) that the fair value of the reporting unit is less than its carrying value. The qualitative assessment considers the following factors: macroeconomic conditions, industry and market considerations, cost factors, overall company financial performance, events affecting the reporting units, and changes in the Company's share price. If the reporting unit does not pass the qualitative assessment, then the Company estimates its fair value and compare the fair value with the carrying value of its net assets. If the fair value is greater than the carrying value of its net assets, then no impairment results. If the fair value is less than its carrying value, then it would determine the fair value of the goodwill by comparing the implied fair value to the carrying value of the goodwill in the same manner as if the Company were being acquired in a business combination. Specifically, the Company would allocate the fair value to all of our assets and liabilities, including any unrecognized intangible assets, in a hypothetical analysis that would calculate the implied fair value of goodwill. If the implied fair value of goodwill is less than the recorded goodwill, an impairment charge would be recorded to earnings in the Consolidated Statements of Operations.
In the fourth fiscal quarter of 2013, we completed the annual impairment test of goodwill. Due to the increase in goodwill in fiscal year 2013 as a result of our acquisitions, we elected to bypass the qualitative assessment and proceed directly to estimating the fair value of net assets for each reporting unit. The fair value of the business units was determined placing an equal weighting of 50 percent on the income approach and market approach indications of value. Under the income approach, the fair value of an asset is based on the value of the estimated cash flows that the asset can be expected to generate in the future. These estimated future cash flows were discounted to arrive at their respective fair values. Under the market approach, the fair value of the unit is based on an analysis of financial data for publicly traded companies engaged in the same or similar lines of business. We compared the fair value of the reporting units to the reporting unit’s carrying value and determined that goodwill was not impaired since the estimated fair values of each of the reporting units exceeded the carrying values. The excess of fair value over carrying amount for each of our reporting units ranged from approximately
15%
to approximately
219%
of carrying amounts. The service provider business unit has the lowest excess of fair value over carrying amount at
15%
. In order to evaluate the sensitivity of the estimated fair values of our reporting units in the goodwill impairment test, we applied a hypothetical 10% decrease to the fair values of each reporting unit. This hypothetical 10% decrease resulted in a lowest excess of fair value over carrying amount of approximately
4%
for service provider business unit. We will continue to monitor goodwill on an annual basis as of the beginning of our fourth fiscal quarter and whenever events or changes in circumstances, such as significant adverse changes in business climate or operating results, changes in management's business strategy or significant declines in our stock price, indicate that there may be potential indicator of impairment.
No
goodwill impairment was recognized in the years ended
December 31, 2013
,
2012
or
2011
.
Intangible assets
Purchased intangible assets with finite lives are amortized using the straight-line method over the estimated economic lives of the assets, which range from
four
to
ten
years. Finite-lived intangible assets are reviewed for impairment whenever events or changes in circumstances indicate that the carrying amount of such assets may not be recoverable. Determination of recoverability is based on an estimate of undiscounted future cash flows resulting from the use of the asset and its eventual disposition.
64
Purchased intangible assets determined to have indefinite useful lives are not amortized. Indefinite-lived intangible assets are reviewed for impairment at least annually during the fourth quarter and whenever events or changes in circumstances indicate that the carrying amount of such assets may not be recoverable. Measurement of an impairment loss for indefinite-lived assets that management expects to hold and use is based on the fair value of the asset. Indefinite-lived assets to be disposed of are reported at the lower of carrying amount or fair value less costs to sell. The carrying value of the asset is reviewed on a regular basis for the existence of facts, both internal and external, that may suggest impairment.
In the fourth fiscal quarter of 2013, the Company completed the annual impairment test of indefinite-lived long-lived assets. The Company assessed whether it was more likely than not (that is, a likelihood of more than 50%) the carrying amount of its indefinite-lived intangible assets may not be recoverable from their undiscounted cash flows by considering the following factors: macroeconomic conditions, industry and market considerations, cost factors, overall company financial performance, events affecting the reporting units, and changes in our share price. Based on these factors , the Company determined that it is not more likely than not that there were events or changes in circumstances that indicated that the carrying amount of our indefinite-lived intangible assets may not be recoverable from their undiscounted cash flows, and therefore performing the first step of the two-step impairment test for each reporting unit was unnecessary.
No
impairments to the indefinite-lived assets were recognized resulting from the annual impairment tests in the years ended
December 31, 2013
,
2012
and
2011
.
In the third quarter of 2013, the Company recorded an impairment charge of
$2.0 million
related to the abandonment of certain IPR&D projects acquired in the AirCard acquisition.
No
other impairments to long-lived assets were recognized in the years ended
December 31, 2013
,
2012
and
2011
Product warranties
The Company provides for estimated future warranty obligations at the time revenue is recognized. The Company's standard warranty obligation to its direct customers generally provides for a right of return of any product for a full refund in the event that such product is not merchantable or is found to be damaged or defective. At the time revenue is recognized, an estimate of future warranty returns is recorded to reduce revenue in the amount of the expected credit or refund to be provided to its direct customers. At the time the Company records the reduction to revenue related to warranty returns, the Company includes within cost of revenue a write-down to reduce the carrying value of such products to net realizable value. The Company's standard warranty obligation to its end-users provides for replacement of a defective product for
one
or more years. Factors that affect the warranty obligation include product failure rates, material usage, and service delivery costs incurred in correcting product failures. The estimated cost associated with fulfilling the Company's warranty obligation to end-users is recorded in cost of revenue. Because the Company's products are manufactured by third-party manufacturers, in certain cases the Company has recourse to the third-party manufacturer for replacement or credit for the defective products. The Company gives consideration to amounts recoverable from its third-party manufacturers in determining its warranty liability. Changes in the Company's warranty liability, which is included as a component of “Other accrued liabilities” in the consolidated balance sheets, are as follows (in thousands):
|
Year Ended December 31,
|
|||||||
|
2013
|
2012
|
||||||
|
Balance as of beginning of the period
|
$
|
46,659
|
|
$
|
44,846
|
|
|
|
Provision for warranty liability made during the period
|
69,755
|
|
61,985
|
|
|||
|
Settlements made during the period
|
(67,660
|
)
|
(60,172
|
)
|
|||
|
Balance at end of period
|
$
|
48,754
|
|
$
|
46,659
|
|
|
Revenue recognition
Revenue from product sales is generally recognized at the time the product is shipped provided that persuasive evidence of an arrangement exists, title and risk of loss has transferred to the customer, the selling price is fixed or determinable and collection of the related receivable is reasonably assured. Currently, for some of the Company's customers, title passes to the customer upon delivery to the port or country of destination, upon their receipt of the product, or upon the customer's resale of the product. At the end of each fiscal quarter, the Company estimates and defers revenue related to product where title has not transferred. The revenue continues to be deferred until such time that title passes to the customer. The Company assesses collectability based on a number of factors, including general economic and market conditions, past transaction history with the customer, and the creditworthiness of the customer. If the Company determines that collection of the fee is not reasonably assured, then the Company defers the fee and recognizes revenue upon receipt of payment.
65
The Company has an insignificant amount of product offerings with multiple elements. The Company's multiple-element product offerings include networking hardware with embedded software, various software subscription services, and support, which are considered separate units of accounting. In general, the networking hardware with embedded software is delivered up front, while the subscription services and support are delivered over the subscription and support period. The Company allocates revenue to the software deliverables and the non-software deliverables (including software deliverables which function together with hardware deliverables to provide the product's essential functionality) based upon their relative selling price. Revenue allocated to each unit of accounting is then recognized when persuasive evidence of an arrangement exists, title and risk of loss has transferred to the customer, the selling price is fixed or determinable and collection of the related receivable is reasonably assured.
When applying the relative selling price method, the Company determines the selling price for each deliverable using vendor-specific objective evidence ("VSOE") of fair value of the deliverable, or when VSOE of fair value is unavailable, its best estimate of selling price (“ESP”), as the Company has determined it is unable to establish third-party evidence of selling price for the deliverables. In determining VSOE, the Company requires that a substantial majority of the selling prices for a deliverable sold on a stand-alone basis fall within a reasonably narrow pricing range, generally evidenced by approximately 80% of such historical stand-alone transactions falling within +/-15% of the median price. The Company determines ESP for a deliverable by considering multiple factors including, but not limited to, market conditions, competitive landscape, internal costs, gross margin objectives and pricing practices. The objective of ESP is to determine the price at which the Company would transact a sale if the deliverable were sold on a stand-alone basis. The determination of ESP is made through consultation with and formal approval by the Company's management, taking into consideration the go-to-market strategy.
Certain distributors and retailers generally have the right to return product for stock rotation purposes. Upon shipment of the product, the Company reduces revenue for an estimate of potential future product warranty and stock rotation returns related to the current period product revenue. Management analyzes historical returns, channel inventory levels, current economic trends and changes in customer demand for the Company's products when evaluating the adequacy of the allowance for sales returns, namely warranty and stock rotation returns. Revenue on shipments is also reduced for estimated price protection and sales incentives deemed to be contra-revenue under the authoritative guidance for revenue recognition.
Sales incentives
The Company accrues for sales incentives as a marketing expense if it receives an identifiable benefit in exchange and can reasonably estimate the fair value of the identifiable benefit received; otherwise, it is recorded as a reduction to revenues. As a consequence, the Company records a substantial portion of its channel marketing costs as a reduction of revenue.
The Company records estimated reductions to revenues for sales incentives at the later of when the related revenue is recognized or when the program is offered to the customer or end consumer.
Shipping and handling fees and costs
The Company includes shipping and handling fees billed to customers in net revenue. Shipping and handling costs associated with inbound freight are included in cost of revenue. In cases where the Company gives a freight allowance to the customer for their own inbound freight costs, such costs are appropriately recorded as a reduction in net revenue. Shipping and handling costs associated with outbound freight are included in sales and marketing expenses and totaled
$11.6 million
,
$12.1 million
and
$13.9 million
in the years ended
December 31, 2013
,
2012
and
2011
respectively.
Research and development
Costs incurred in the research and development of new products are charged to expense as incurred.
Advertising costs
Advertising costs are expensed as incurred. Total advertising and promotional expenses were
$18.0 million
,
$19.0 million
, and
$21.7 million
in the years ended
December 31, 2013
,
2012
and
2011
respectively.
66
Income taxes
The Company accounts for income taxes under an asset and liability approach. Under this method, income tax expense is recognized for the amount of taxes payable or refundable for the current year. In addition, deferred tax assets and liabilities are recognized for the expected future tax consequences of temporary differences resulting from different treatment for tax versus accounting for certain items, such as accruals and allowances not currently deductible for tax purposes. These differences result in deferred tax assets and liabilities, which are included within the consolidated balance sheet. The Company must then assess the likelihood that the Company's deferred tax assets will be recovered from future taxable income and to the extent the Company believes that recovery is not more likely than not, the Company must establish a valuation allowance.
In the ordinary course of business there is inherent uncertainty in assessing the Company's income tax positions. The Company assesses its tax positions and records benefits for all years subject to examination based on management's evaluation of the facts, circumstances and information available at the reporting date. For those tax positions where it is more likely than not that a tax benefit will be sustained, the Company records the largest amount of tax benefit with a greater than 50 percent likelihood of being realized upon ultimate settlement with a taxing authority that has full knowledge of all relevant information. For those income tax positions where it is not more likely than not that a tax benefit will be sustained, no tax benefit has been recorded in the financial statements. Where applicable, associated interest and penalties have also been recognized as a component of income tax expense.
Computation of net income per share
Basic net income per share is computed by dividing net income by the weighted average number of common shares outstanding for the period. Diluted net income per share reflects the additional dilution from potential issuances of common stock, such as stock issuable pursuant to the exercise of stock options and awards. Potentially dilutive shares are excluded from the computation of diluted net income per share when their effect is anti-dilutive.
Stock-based compensation
The Company measures stock-based compensation at the grant date based on the fair value of the award. The fair value of stock options is estimated using the Black-Scholes option pricing model. Estimated compensation cost relating to restricted stock units (“RSUs”) is based on the closing fair market value of the Company’s common stock on the date of grant. The fair value of Employee Stock Purchase Plan (“ESPP”) is based on the 15% discount at purchase, since the price of the shares is determined at the purchase date.
The compensation expense for equity awards is reduced by an estimate for forfeitures and is recognized over the vesting period of the award under a graded vesting method. In addition, the Company will recognize an excess benefit from stock-based compensation in equity based on the difference between tax expense computed with consideration of the windfall deduction and without consideration of the windfall deduction. In addition, the Company accounts for the indirect effects of stock-based compensation on the research tax credit and the foreign tax credit in the income statement. See Note 11,
Employee Benefit Plans
, of the Notes to Consolidated Financial Statements for a further discussion on stock-based compensation.
Comprehensive income
Comprehensive income consists of net income and other gains and losses affecting stockholder's equity that the Company excluded from net income, including gains and losses related to fair value of short-term investments and the effective portion of cash flow hedges that were outstanding as of the end of the year.
Foreign currency translation
The Company's functional currency is the U.S. dollar for all of its international subsidiaries. Foreign currency transactions of international subsidiaries are re-measured into U.S. dollars at the end-of-period exchange rates for monetary assets and liabilities, and historical exchange rates for non-monetary assets. Expenses are re-measured at average exchange rates in effect during each period, except for expenses related to non-monetary assets, which are re-measured at historical exchange rates. Revenue is re-measured at average exchange rates in effect during each period. Gains and losses arising from foreign currency transactions are included in total comprehensive income and were a net loss of
$1.6 million
for the year ended
December 31, 2013
, a net gain of
$0.2 million
for the year ended
December 31, 2012
and a net gain of
$0.1 million
for the year ended
December 31, 2011
.
67
Recent accounting pronouncements
In March 2013, the FASB issued ASU 2013-05, "Foreign Currency Matters," which provides the standards for parent's accounting for the cumulative translation adjustment upon derecognition of certain subsidiaries or groups of assets within a foreign entity or of an investment in a foreign entity. ASU 2013-05 is effective for reporting periods beginning after December 15, 2013. The Company will adopt this standard in the first quarter of 2014 and it does not expect the adoption to have a significant impact on its financial position, results of operations or cash flows.
In July 2013, the FASB issued ASU 2013-11, "Income Taxes," which provides explicit guidance on the financial statement presentation of an unrecognized tax benefit when a net operating loss carryforward or a tax credit carryforward exists. Under the new standard update, the Company’s unrecognized tax benefit, or a portion of an unrecognized tax benefit, should be presented in the financial statements as a reduction to a deferred tax asset for a net operating loss carryforward or a tax credit carryforward. ASU 2013-11 is effective for the Company beginning in the first quarter fiscal 2014 and applied prospectively or retroactively with early adoption permitted. The Company has adopted ASU 2013-11 during the three months ended December 31, 2013 on a prospective basis. It does not have a significant impact on the Company's financial position, results of operations or cash flows.
Arada Systems, Inc.
On
June 21, 2013
, the Company acquired certain assets and operations of Arada Systems, Inc. (“Arada”), a privately-held company that develops, licenses, and provides solutions for the next generation of uses of Wi-Fi, for total purchase consideration of
$5.2 million
in cash. The Company believes the acquisition will bolster its wireless product offerings in its commercial business unit and strengthen its market position in the small to medium size campus wireless LAN market. The Company paid
$4.2 million
of the aggregate purchase price in the second quarter of 2013, and expects to pay the remaining
$1.1 million
, less amounts used to satisfy certain claims, twelve months after the closing of the acquisition.
The acquisition qualified as a business combination and was accounted for using the acquisition method of accounting. The results of Arada have been included in the consolidated financial statements since the date of acquisition. Pro forma results of operations for the acquisition are not presented as the financial impact to the Company's consolidated results of operations is not material.
The allocation of the purchase price was as follows (in thousands):
|
Property and equipment, net
|
$
|
15
|
|
|
Intangible assets, net
|
4,040
|
|
|
|
Goodwill
|
1,195
|
|
|
|
Total purchase price
|
$
|
5,250
|
|
The fair values for tangible and intangible assets acquired and liabilities assumed were based on estimates of their fair values as of the acquisition date. These estimates are subject to revision, which may result in adjustments to the values presented above. We expect to finalize these amounts within twelve months from the acquisition date.
Of the
$1.2 million
of goodwill recorded on the acquisition of Arada, approximately
$0.7 million
and
$1.2 million
are deductible for U.S. federal and state income tax purposes, respectively. The goodwill recognized, which was assigned to the Company's commercial business unit, is primarily attributable to expected synergies resulting from the acquisition.
The Company designated
$4.0 million
of the acquired intangible assets as technology. The value was calculated based on the present value of the future estimated cash flows derived from estimated savings attributable to the existing technology and discounted at
21.5%
. The acquired existing technology is being amortized over its estimated useful life of
five years
.
AirCard Division of Sierra Wireless, Inc.
On
April 2, 2013
, the Company completed the acquisition of select assets and operations of the Sierra Wireless, Inc. AirCard business ("AirCard"), including customer relationships, a world-class LTE engineering team, certain intellectual property, inventory and property and equipment. The Company believes this acquisition will accelerate the mobile initiative of the service provider business unit to become a global leader in providing the latest in LTE data networking access devices.
68
The Company paid
$140.0 million
of the aggregate purchase price in the second quarter of 2013. The acquisition qualified as a business combination and was accounted for using the acquisition method of accounting. The results of AirCard have been included in the consolidated financial statements since the date of acquisition. Revenue and earnings for AirCard as of the acquisition date are not presented as the business was fully integrated into the service provider business unit subsequent to the acquisition and therefore impracticable for the Company to quantify.
The allocation of the purchase price was as follows (in thousands):
|
Inventories
|
$
|
2,874
|
|
|
Prepaid expenses
|
9,030
|
|
|
|
Other assets
|
3,226
|
|
|
|
Property and equipment, net
|
7,455
|
|
|
|
Intangible assets, net
|
69,700
|
|
|
|
Goodwill
|
53,841
|
|
|
|
Liabilities assumed
|
(6,096
|
)
|
|
|
Total purchase price
|
$
|
140,030
|
|
In the third quarter of 2013, the Company made an adjustment of
$0.5 million
to goodwill related to revised inventory estimates. The fair values for tangible and intangible assets acquired and liabilities assumed are based on estimates of their fair values as of the acquisition date. These estimates are subject to revision, which may result in adjustments to the values presented above. We expect to finalize these amounts within twelve months from the acquisition date.
Of the
$53.8 million
of goodwill recorded on the acquisition of AirCard, approximately
$36.6 million
,
$2.3 million
and
$53.8 million
is deductible for U.S. federal, Canadian, and U.S. state income tax purposes, respectively. The goodwill recognized, which was assigned to the Company's service provider business unit, is primarily attributable to expected synergies resulting from the acquisition.
The Company designated
$16.3 million
of the acquired intangible assets as technology. The value was calculated based on the present value of the future estimated cash flows derived from estimated savings attributable to the existing technology and discounted at
10.0%
. The acquired technology is being amortized over its estimated useful life of
four years
.
The Company designated
$40.5 million
of the acquired intangible assets as customer relationships. The value was calculated based on the present value of the future estimated cash flows derived from projections of future operations attributable to existing customer relationships and discounted at
12.0%
. The acquired customer relationships are being amortized over an estimated useful life of
eight years
The Company designated
$2.3 million
of the acquired intangible assets as non-compete agreements. The value was calculated based on the present value of the future estimated cash flows derived from projections of future operations attributable to the non-compete agreements and discounted at
12.0%
. The acquired agreements are being amortized over an estimated useful life of
five years
.
The Company designated
$1.1 million
of the acquired intangible assets as backlog. The value was calculated based on the present value of the future contractual revenue and discounted at
10.0%
. The acquired backlog was fully amortized in the second quarter of 2013.
The Company acquired
$9.5 million
in in-process research and development (“IPR&D”) projects. The value was calculated based on the present value of future estimated cash flows discounted at
13.0%
, derived from projections of future revenues attributable to the assets, expected economic life of the assets, and royalty rates. The IPR&D acquired is considered indefinite lived intangible assets until research and development efforts associated with the projects are completed or abandoned. The most significant of the acquired IPR&D projects relate to multimode LTE technologies, Mobile Hot Spot, USB dongle, and Module form factors. As of December 31, 2013,
$7.4 million
of the acquired IPR&D has reached technical feasibility and was reclassified to definite-lived intangibles and with an estimated useful life of
four
years. In addition, the Company recorded an impairment charge of
$2.0 million
in the third quarter of 2013, related to the abandonment of certain IPR&D projects acquired. The Company expects to complete the remaining
$0.1 million
in IPR&D projects, at an estimated cost of
$0.2 million
, by the second quarter of 2014.
69
Pro forma financial information
The unaudited pro forma financial information in the table below summarizes the combined results of our operations and those of AirCard for the periods shown as though the acquisition of AirCard occurred as of the beginning of the fiscal year 2012. The pro forma financial information for the periods presented includes the accounting effects of the business combination, including adjustments to the amortization of intangible assets, fair value of acquired inventory, acquisition-related costs, integration expenses and related tax effects of these adjustments, where applicable. This information is for informational purposes only, is subject to a number of estimates, assumptions and other uncertainties, and may not be indicative of the results of operations that would have been achieved if the acquisition had taken place at January 1, 2012.
The unaudited pro forma financial information is as follows (in thousands):
|
|
Years Ended
|
||||||
|
|
December 31,
2013 |
December 31,
2012 |
|||||
|
(in millions)
|
|||||||
|
Revenue
|
$
|
1,415
|
|
$
|
1,519
|
|
|
|
Net income
|
$
|
57
|
|
$
|
89
|
|
|
AVAAK, Inc.
On
July 2, 2012
, the Company acquired
100%
of the voting equity interests of AVAAK, Inc. (“AVAAK”), a privately-held company that developed wire-free video networking products for total purchase consideration of
$24.0 million
in cash. The Company believes the acquisition will bolster its retail business unit product offerings and expand its presence into the smart home market. The Company paid
$21.6 million
of the aggregate purchase price in the third quarter of 2012, and the remaining
$2.4 million
was paid in the third quarter of 2013.
The acquisition qualified as a business combination and was accounted for using the acquisition method of accounting. The results of AVAAK have been included in the consolidated financial statements since the date of acquisition. Pro forma results of operations for the acquisition are not presented as the financial impact to the Company's consolidated results of operations is not material.
The allocation of the purchase price was as follows (in thousands):
|
Net tangible assets acquired
|
$
|
172
|
|
|
Deferred tax assets, net
|
5,937
|
|
|
|
Intangible assets, net
|
6,000
|
|
|
|
Goodwill
|
11,895
|
|
|
|
Total consideration
|
$
|
24,004
|
|
None
of the goodwill recognized related to AVAAK is deductible for income tax purposes. The goodwill recognized, which was assigned to the Company's retail business unit, is primarily attributable to expected synergies resulting from the acquisition.
In connection with the acquisition, the Company recorded
$5.9 million
of deferred tax assets net of deferred tax liabilities. The deferred tax assets arise from the tax benefit of the estimated net operating losses as of the date of the acquisition after consideration of limitations on the use under U.S. Internal Revenue Code section 382. The deferred tax assets are reduced by deferred tax liabilities recorded for the book basis in intangible assets and in-process research and development ("IPR&D") for which the Company has no tax basis.
The Company designated
$2.3 million
of the acquired intangible assets as technology. The value was calculated based on the present value of the future estimated cash flows derived from estimated savings attributable to the existing technology and discounted at
14.0%
. The acquired existing technology is being amortized over its estimated useful life of
five years
.
The Company designated
$0.3 million
of the acquired intangible assets as customer relationships. The value was calculated based on the present value of the future estimated cash flows derived from projections of future operations attributable to existing customer relationships and discounted at
14.0%
. The acquired customer relationships are being amortized over an estimated useful life of
five years
.
70
The Company designated
$1.4 million
of the acquired intangible assets as trade name and trademarks. The value was calculated based on the present value of the future estimated cash flows derived from projections of future operations attributable to existing trade name and trademarks and discounted at
16.0%
. The acquired trade name and trademarks are being amortized over an estimated useful life of
five years
.
In addition,
$2.0 million
of the consideration paid represents the fair value of acquired IPR&D projects. The IPR&D acquired is considered indefinite lived intangible assets until research and development efforts associated with the projects are completed or abandoned. The most significant of the acquired IPR&D projects relate to camera technology and applications. As of the first fiscal quarter of 2013, all of the acquired IPR&D had reached technical feasibility and was reclassified to definite intangibles with an estimated useful life of
four
years.
Firetide, Inc.
On
June 4, 2012
, the Company acquired certain intellectual property of Firetide, Inc. (“Firetide”) for an aggregate purchase price of
$7.2 million
in cash. The acquisition included intangible assets that existed at the closing date, including IP contracts, technology assets, business technology, and goodwill. The Company believes the acquisition will bolster its wireless product offerings in its commercial business unit and strengthen its market position in the small to medium size campus wireless LAN market.
The acquisition qualified as a business combination and was accounted for using the acquisition method of accounting. The results of Firetide have been included in the consolidated financial statements since the date of acquisition. Pro forma results of operations for the acquisition are not presented as the financial impact to the Company's consolidated results of operations is not material.
The Company paid
$6.6 million
of the aggregate purchase price in the second quarter of 2012, and the remaining
$0.6 million
was paid in the second fiscal quarter of 2013. The ongoing costs of developing these assets subsequent to the date of acquisition have been included in the consolidated financial statements since the date of acquisition. The historical results of operations related to the acquired assets prior to the acquisition were not material to the Company’s results of operations.
The allocation of the purchase price was as follows (in thousands):
|
Intangible assets, net
|
$
|
4,159
|
|
|
Goodwill
|
3,041
|
|
|
|
Total consideration
|
$
|
7,200
|
|
Of the
$3.0 million
of goodwill recorded on the acquisition of Firetide, approximately
$1.6 million
and
$3.0 million
is deductible for U.S. federal and state income tax purposes, respectively. The goodwill recognized, which was assigned to the Company's commercial business unit, is primarily attributable to expected synergies and the assembled workforce of Firetide.
The Company designated the
$4.2 million
in acquired intangible assets as technology. The value was calculated based on the present value of the future estimated cash flows derived from estimated savings attributable to the existing technology and discounted at
22.0%
. The acquired existing technology is being amortized over its estimated useful life of
five years
.
71
Short-Term Investments
|
As of
|
|||||||||||||||||||||||||||||||
|
December 31, 2013
|
December 31, 2012
|
||||||||||||||||||||||||||||||
|
Cost
|
Unrealized Gain
|
Unrealized Loss
|
Estimated Fair Value
|
Cost
|
Unrealized Gain
|
Unrealized Loss
|
Estimated Fair Value
|
||||||||||||||||||||||||
|
U.S. Treasuries
|
$
|
104,595
|
|
$
|
7
|
|
$
|
(1
|
)
|
$
|
104,601
|
|
$
|
225,016
|
|
$
|
48
|
|
$
|
(2
|
)
|
$
|
225,062
|
|
|||||||
|
Certificates of Deposits
|
159
|
|
—
|
|
—
|
|
159
|
|
2,783
|
|
—
|
|
—
|
|
2,783
|
|
|||||||||||||||
|
Mutual Funds
|
385
|
|
—
|
|
—
|
|
385
|
|
—
|
|
—
|
|
—
|
|
—
|
|
|||||||||||||||
|
Total
|
$
|
105,139
|
|
$
|
7
|
|
$
|
(1
|
)
|
$
|
105,145
|
|
$
|
227,799
|
|
$
|
48
|
|
$
|
(2
|
)
|
$
|
227,845
|
|
|||||||
The Company’s marketable securities are classified as available-for-sale consisting of government securities and trading securities consisting of mutual funds. All the securities are with an original maturity or remaining maturity at the time of purchase of greater than
three months
and no more than
12 months
. Accordingly,
none
of the short-term investments have unrealized losses greater than 12 months.
Cost Method Investments
As of December 31,
2013
and December 31,
2012
, the carrying value of the Company's cost method investments was
$1.3 million
. These investments are included in other non-current assets in the consolidated balance sheets and are carried at cost, adjusted for any impairment, because the Company does not have a controlling interest and does not have the ability to exercise significant influence over these companies. The Company monitors these investments for impairment on a quarterly basis, and adjusts carrying value for any impairment charges recognized. There were
no
impairments recognized in the years ended
December 31, 2013
and
December 31, 2012
. Realized gains and losses on these investments are reported in other income (expense), net in the consolidated statements of operations. In the third fiscal quarter of 2012 the Company recognized a gain of
$3.1 million
on the partial sale of one of its cost method investments. No other gains or losses were recorded in the years ended
December 31, 2013
and
December 31, 2012
.
Accounts receivable, net
|
As of
|
|||||||
|
December 31,
2013 |
December 31,
2012 |
||||||
|
Gross accounts receivable
|
$
|
289,479
|
|
$
|
276,084
|
|
|
|
Allowance for doubtful accounts
|
(1,255
|
)
|
(1,256
|
)
|
|||
|
Allowance for sales returns
|
(17,467
|
)
|
(17,031
|
)
|
|||
|
Allowance for price protection
|
(4,273
|
)
|
(1,783
|
)
|
|||
|
Total allowances
|
(22,995
|
)
|
(20,070
|
)
|
|||
|
Total accounts receivable, net
|
$
|
266,484
|
|
$
|
256,014
|
|
|
72
Inventories
|
As of
|
|||||||
|
December 31,
2013 |
December 31,
2012 |
||||||
|
Raw materials
|
$
|
8,676
|
|
$
|
4,447
|
|
|
|
Work-in-process
|
6,233
|
|
—
|
|
|||
|
Finished goods
|
209,547
|
|
170,456
|
|
|||
|
Total inventories
|
$
|
224,456
|
|
$
|
174,903
|
|
|
The Company records provisions for excess and obsolete inventory based on forecasts of future demand. While management believes the estimates and assumptions underlying its current forecasts are reasonable, there is risk that additional charges may be necessary if current forecasts are greater than actual demand.
Property and equipment, net
|
As of
|
|||||||
|
December 31,
2013 |
December 31,
2012 |
||||||
|
Computer equipment
|
$
|
8,527
|
|
$
|
7,290
|
|
|
|
Furniture, fixtures and leasehold improvements
|
14,019
|
|
12,761
|
|
|||
|
Software
|
25,722
|
|
21,521
|
|
|||
|
Machinery and equipment
|
50,656
|
|
31,694
|
|
|||
|
Construction in progress
|
21
|
|
385
|
|
|||
|
Total property and equipment, gross
|
98,945
|
|
73,651
|
|
|||
|
Accumulated depreciation and amortization
|
(71,751
|
)
|
(54,626
|
)
|
|||
|
Total property and equipment, net
|
$
|
27,194
|
|
$
|
19,025
|
|
|
Depreciation and amortization expense pertaining to property and equipment was
$17.3 million
,
$11.9 million
and
$9.9 million
for the years ended December 31,
2013
,
2012
and
2011
, respectively.
Intangibles, net
The following tables present details of the Company’s purchased intangible assets:
|
|
Gross
|
Accumulated Amortization
|
Net
|
||||||||
|
December 31, 2013
|
|||||||||||
|
Technology
|
$
|
60,999
|
|
$
|
(29,593
|
)
|
$
|
31,406
|
|
||
|
Customer contracts and relationships
|
56,500
|
|
(9,120
|
)
|
47,380
|
|
|||||
|
Other
|
10,545
|
|
(5,313
|
)
|
5,232
|
|
|||||
|
Finite-lived intangibles, net
|
128,044
|
|
(44,026
|
)
|
84,018
|
|
|||||
|
Indefinite-lived intangible assets
|
100
|
|
—
|
|
100
|
|
|||||
|
Total purchased intangible assets, net
|
$
|
128,144
|
|
$
|
(44,026
|
)
|
$
|
84,118
|
|
||
73
|
|
Gross
|
Accumulated Amortization
|
Net
|
||||||||
|
December 31, 2012
|
|||||||||||
|
Technology
|
$
|
32,259
|
|
$
|
(22,065
|
)
|
$
|
10,194
|
|
||
|
Customer contracts and relationships
|
16,000
|
|
(3,301
|
)
|
12,699
|
|
|||||
|
Other
|
6,870
|
|
(3,142
|
)
|
3,728
|
|
|||||
|
Finite-lived intangibles, net
|
55,129
|
|
(28,508
|
)
|
26,621
|
|
|||||
|
Indefinite-lived intangible assets
|
1,000
|
|
—
|
|
1,000
|
|
|||||
|
Total purchased intangible assets, net
|
$
|
56,129
|
|
$
|
(28,508
|
)
|
$
|
27,621
|
|
||
The Company purchased finite-lived intangible assets of
$64.2 million
and indefinite-lived assets of
$9.5 million
, as a result of its acquisition of AirCard and Arada during the second quarter of 2013. For further discussion regarding the AirCard and Arada acquisitions, see Note 2,
Business Acquisitions
. In addition, the Company purchased
$0.3 million
in patents during the second quarter of 2013.
As of
December 31, 2013
, the Company had
$0.1 million
in indefinite-lived intangible assets. This balance relates to the remaining IPR&D assets acquired in connection with the Company's acquisition of AirCard. IPR&D assets represent IPR&D projects that have not reached technical feasibility and are required to be classified as indefinite-lived assets until the successful completion or abandonment of the associated research and development efforts. Accordingly, during the development period after the date of acquisition, these assets will not be amortized. When the asset reaches technical feasibility, the Company will determine the useful life of the asset, reclassify the asset out of IPR&D, and begin amortization. Development costs incurred after acquisition on acquired IPR&D projects are expensed as incurred. As of
December 31, 2013
,
$7.4 million
of the IPR&D had reached technical feasibility and as a result, was reclassified from IPR&D to technology. In addition, $2.0 million of IPR&D projects were abandoned during the third quarter of 2013. The Company expects to complete the remaining IPR&D by the second quarter of 2014, for an estimated future cost to complete of
$0.2 million
.
Amortization of purchased intangible assets in the years ended December 31,
2013
,
2012
and
2011
was
$15.5 million
,
$4.9 million
and
$4.8 million
, respectively. In the year ended December 31, 2013, the Company recorded an impairment charge of
$2.0 million
due to the abandonment of IPR&D discussed above.
No
impairment charges were recorded in the years ended December 31,
2012
and
2011
.
Estimated amortization expense related to finite-lived intangibles for each of the next five years and thereafter is as follows:
|
Year Ending December 31,
|
Amount
|
||
|
2014
|
$
|
17,875
|
|
|
2015
|
17,258
|
|
|
|
2016
|
16,896
|
|
|
|
2017
|
11,361
|
|
|
|
2018
|
7,859
|
|
|
|
Thereafter
|
12,769
|
|
|
|
Total expected amortization expense
|
$
|
84,018
|
|
Goodwill
The changes in the carrying amount of goodwill during the years ended
December 31, 2013
and
2012
are as follows:
74
|
Retail
|
Commercial
|
Service Provider
|
Total
|
|||||||||||||
|
Goodwill at December 31, 2011
|
$
|
33,546
|
|
$
|
32,043
|
|
$
|
20,355
|
|
$
|
85,944
|
|
||||
|
Goodwill acquired during the period
|
11,895
|
|
3,041
|
|
—
|
|
14,936
|
|
||||||||
|
Goodwill at December 31, 2012
|
45,441
|
|
35,084
|
|
20,355
|
|
100,880
|
|
||||||||
|
Goodwill acquired during the period
|
—
|
|
1,195
|
|
53,841
|
|
55,036
|
|
||||||||
|
Goodwill at December 31, 2013
|
$
|
45,441
|
|
$
|
36,279
|
|
$
|
74,196
|
|
$
|
155,916
|
|
||||
During
2013
, the Company recorded goodwill of
$55.0 million
, related to its acquisitions of AirCard and Arada, including an adjustment of
$0.5 million
to goodwill, related to a change in the estimated fair value of inventory acquired in the AirCard acquisition. Refer to Note 2,
Business Acquisitions
, for additional information regarding the Company's acquisitions.
There were
no
impairments to goodwill in the years ended December 31,
2013
,
2012
and
2011
. Refer to Note 1,
The Company and Summary of Significant Accounting Policies
, for additional information regarding the Company's goodwill impairment assessment.
Other non-current assets
|
As of
|
|||||||
|
December 31, 2013
|
December 31, 2012
|
||||||
|
Non-current deferred income taxes
|
$
|
20,235
|
|
$
|
16,856
|
|
|
|
Cost method investment
|
1,322
|
|
1,322
|
|
|||
|
Other
|
5,034
|
|
4,656
|
|
|||
|
Total other non-current assets
|
$
|
26,591
|
|
$
|
22,834
|
|
|
Other accrued liabilities
|
As of
|
|||||||
|
December 31,
2013 |
December 31,
2012 |
||||||
|
Sales and marketing programs
|
$
|
47,941
|
|
$
|
43,652
|
|
|
|
Warranty obligation
|
48,754
|
|
46,659
|
|
|||
|
Freight
|
5,790
|
|
4,457
|
|
|||
|
Other
|
40,733
|
|
31,487
|
|
|||
|
Total other accrued liabilities
|
$
|
143,218
|
|
$
|
126,255
|
|
|
75
The Company accounts for its restructuring plans under the authoritative guidance for exit or disposal activities. The Company presents expenses related to restructuring and other charges as a separate line item in its Consolidated Statements of Operations.
During the year ended
December 31, 2013
, the Company incurred restructuring and other charges of
$5.4 million
. Restructuring charges consisted of
$3.3 million
in severance costs related to the consolidation of certain teams and locations during the fourth quarter of 2013, and
$0.2 million
related to an office lease exit liability related to the AVAAK acquisition. Other charges consisted of
$1.9 million
in transition costs related to the AirCard acquisition. In addition, the Company recorded a restructuring adjustment of
$94,000
to decrease the previously recorded severance liability for an office lease exit related to the AVAAK acquisition and the consolidation of product groups within the commercial business units. The Company expects to pay the remaining cost related to restructuring over the next three months. Refer to Note 2,
Business Acquisitions
for additional information regarding the AirCard and AVAAK acquisitions. During the year ended December 31, 2012, the Company incurred
$1.2 million
in restructuring costs for employee severance related to the consolidation of product groups within our commercial business unit.
The following tables provide a summary of accrued restructuring and other charges activity:
|
Accrued Restructuring and Other Charges at December 31, 2012
|
Additions
|
Cash Payments
|
Adjustments
|
Accrued Restructuring and Other Charges at December 31, 2013
|
|||||||||||||||
|
(In thousands)
|
|||||||||||||||||||
|
Restructuring
|
$
|
999
|
|
$
|
3,537
|
|
$
|
(3,429
|
)
|
$
|
(94
|
)
|
$
|
1,013
|
|
||||
|
Acquisition transition costs
|
—
|
|
1,892
|
|
(1,882
|
)
|
—
|
|
10
|
|
|||||||||
|
Restructuring and other charges
|
$
|
999
|
|
$
|
5,429
|
|
$
|
(5,311
|
)
|
$
|
(94
|
)
|
$
|
1,023
|
|
||||
|
Accrued Restructuring and Other Charges at December 31, 2011
|
Additions
|
Cash Payments
|
Adjustments
|
Accrued Restructuring and Other Charges at December 31, 2012
|
|||||||||||||||
|
(In thousands)
|
|||||||||||||||||||
|
Restructuring
|
$
|
—
|
|
$
|
1,190
|
|
$
|
(191
|
)
|
$
|
—
|
|
$
|
999
|
|
||||
The Company’s subsidiaries have had, and will continue to have material future cash flows, including revenue and expenses, which are denominated in currencies other than the Company’s functional currency. The Company and all its subsidiaries designate the U.S. dollar as the functional currency. Changes in exchange rates between the Company’s functional currency and other currencies in which the Company transacts business will cause fluctuations in cash flow expectations and cash flow realized or settled. Accordingly, the Company uses derivatives to mitigate its business exposure to foreign exchange risk. The Company enters into foreign currency forward contracts in Australian dollars, British pounds, Euros, and Japanese yen to manage the exposures to foreign exchange risk related to expected future cash flows on certain forecasted revenue, costs of revenue, operating expenses and existing assets and liabilities. The Company does not enter into derivatives transactions for trading or speculative purposes.
The Company’s foreign currency forward contracts do not contain any credit-risk-related contingent features. The Company is exposed to credit losses in the event of nonperformance by the counter-parties of its forward contracts. The Company enters into derivative contracts with high-quality financial institutions and limits the amount of credit exposure to any one counter-party. In addition, the derivative contracts typically mature in less than
six
months and the Company continuously evaluates the credit standing of its counter-party financial institutions. The counter-parties to these arrangements are large highly rated financial institutions and the Company does not consider non-performance a material risk.
The Company may choose not to hedge certain foreign exchange exposures for a variety of reasons, including, but not limited to, immateriality, accounting considerations and the prohibitive economic cost of hedging particular exposures. There can be no assurance the hedges will offset more than a portion of the financial impact resulting from movements in foreign exchange rates. The Company’s accounting policies for these instruments are based on whether the instruments are designated as hedge or non-hedge instruments in accordance with the authoritative guidance for derivatives and hedging. The Company records all
76
derivatives on the balance sheet at fair value. The effective portions of cash flow hedges are recorded in other comprehensive income until the hedged item is recognized in earnings. Derivatives that are not designated as hedging instruments and the ineffective portions of its designated hedges are adjusted to fair value through earnings in other income (expense), net in the consolidated statement of operations.
The fair values of the Company’s derivative instruments and the line items on the consolidated balance sheet to which they were recorded as of
December 31, 2013
, and
December 31, 2012
, are summarized as follows (in thousands):
|
Derivative Assets
|
Balance Sheet
Location
|
Fair value at December 31, 2013
|
Balance Sheet
Location
|
Fair value at December 31, 2012
|
||||||||
|
Derivative assets not designated as hedging instruments
|
Prepaid expenses and other current assets
|
$
|
842
|
|
Prepaid expenses and other current assets
|
$
|
1,142
|
|
||||
|
Derivative assets designated as hedging
instruments
|
Prepaid expenses and other current assets
|
63
|
|
Prepaid expenses and other current assets
|
2
|
|
||||||
|
Total
|
$
|
905
|
|
$
|
1,144
|
|
||||||
|
Derivative Liabilities
|
Balance Sheet
Location
|
Fair value at December 31, 2013
|
Balance Sheet
Location
|
Fair value at December 31, 2012
|
||||||||
|
Derivative liabilities not designated as hedging instruments
|
Other accrued liabilities
|
$
|
(368
|
)
|
Other accrued liabilities
|
$
|
(1,616
|
)
|
||||
|
Derivative liabilities designated as hedging instruments
|
Other accrued liabilities
|
(13
|
)
|
Other accrued liabilities
|
(3
|
)
|
||||||
|
Total
|
$
|
(381
|
)
|
$
|
(1,619
|
)
|
||||||
For details of the Company’s fair value measurements, see Note 13,
Fair Value Measurements.
Offsetting Derivative Assets and Liabilities
The Company has entered into master netting arrangements which allow net settlements under certain conditions. Although netting is permitted, it is currently the Company's policy and practice to record all derivative assets and liabilities on a gross basis in the condensed consolidated balance sheets.
The following tables set forth the offsetting of derivative assets as of
December 31, 2013
and
December 31, 2012
(in thousands):
|
As of December 31, 2013
|
Gross Amounts Not Offset in the Condensed Consolidated Balance Sheets
|
|||||||||||||||||||||||
|
Gross Amounts of Recognized Assets
|
Gross Amounts Offset in the Condensed Consolidated Balance Sheets
|
Net Amounts Of Assets Presented in the Condensed Consolidated Balance Sheets
|
Financial Instruments
|
Cash Collateral Pledged
|
Net Amount
|
|||||||||||||||||||
|
Barclays
|
$
|
905
|
|
$
|
—
|
|
$
|
905
|
|
$
|
(287
|
)
|
$
|
—
|
|
$
|
618
|
|
||||||
|
Wells Fargo Bank
|
—
|
|
—
|
|
—
|
|
—
|
|
—
|
|
—
|
|
||||||||||||
|
Total
|
$
|
905
|
|
$
|
—
|
|
$
|
905
|
|
$
|
(287
|
)
|
$
|
—
|
|
$
|
618
|
|
||||||
77
|
As of December 31, 2012
|
Gross Amounts Not Offset in the Condensed Consolidated Balance Sheets
|
|||||||||||||||||||||||
|
Gross Amounts of Recognized Assets
|
Gross Amounts Offset in the Condensed Consolidated Balance Sheets
|
Net Amounts Of Assets Presented in the Condensed Consolidated Balance Sheets
|
Financial Instruments
|
Cash Collateral Pledged
|
Net Amount
|
|||||||||||||||||||
|
Barclays
|
$
|
1,107
|
|
$
|
—
|
|
$
|
1,107
|
|
$
|
(1,107
|
)
|
$
|
—
|
|
$
|
—
|
|
||||||
|
Wells Fargo Bank
|
37
|
|
—
|
|
37
|
|
(37
|
)
|
—
|
|
—
|
|
||||||||||||
|
Total
|
$
|
1,144
|
|
$
|
—
|
|
$
|
1,144
|
|
$
|
(1,144
|
)
|
$
|
—
|
|
$
|
—
|
|
||||||
The following tables set forth the offsetting of derivative liabilities as of
December 31, 2013
and
December 31, 2012
(in thousands):
|
As of December 31, 2013
|
Gross Amounts Not Offset in the Condensed Consolidated Balance Sheets
|
|||||||||||||||||||||||
|
Gross Amounts of Recognized Liabilities
|
Gross Amounts Offset in the Condensed Consolidated Balance Sheets
|
Net Amounts Of Liabilities Presented in the Condensed Consolidated Balance Sheets
|
Financial Instruments
|
Cash Collateral Pledged
|
Net Amount
|
|||||||||||||||||||
|
Barclays
|
$
|
287
|
|
$
|
—
|
|
$
|
287
|
|
$
|
(287
|
)
|
$
|
—
|
|
$
|
—
|
|
||||||
|
Wells Fargo Bank
|
94
|
|
—
|
|
94
|
|
—
|
|
—
|
|
94
|
|
||||||||||||
|
Total
|
$
|
381
|
|
$
|
—
|
|
$
|
381
|
|
$
|
(287
|
)
|
$
|
—
|
|
$
|
94
|
|
||||||
|
As of December 31, 2012
|
Gross Amounts Not Offset in the Condensed Consolidated Balance Sheets
|
|||||||||||||||||||||||
|
Gross Amounts of Recognized Liabilities
|
Gross Amounts Offset in the Condensed Consolidated Balance Sheets
|
Net Amounts Of Liabilities Presented in the Condensed Consolidated Balance Sheets
|
Financial Instruments
|
Cash Collateral Pledged
|
Net Amount
|
|||||||||||||||||||
|
Barclays
|
$
|
1,401
|
|
$
|
—
|
|
$
|
1,401
|
|
$
|
(1,107
|
)
|
$
|
—
|
|
$
|
294
|
|
||||||
|
Wells Fargo Bank
|
218
|
|
—
|
|
218
|
|
(37
|
)
|
—
|
|
181
|
|
||||||||||||
|
Total
|
$
|
1,619
|
|
$
|
—
|
|
$
|
1,619
|
|
$
|
(1,144
|
)
|
$
|
—
|
|
$
|
475
|
|
||||||
Cash flow hedges
To help manage the exposure of operating margins to fluctuations in foreign currency exchange rates, the Company hedges a portion of its anticipated foreign currency revenue, costs of revenue and certain operating expenses. These hedges are designated at the inception of the hedge relationship as cash flow hedges under the authoritative guidance for derivatives and hedging. Effectiveness is tested at least quarterly both prospectively and retrospectively using regression analysis to ensure that the hedge relationship has been effective and is likely to remain effective in the future. The Company typically hedges portions of its anticipated foreign currency exposure for
three
to
five
months. The Company enters into about
five
forward contracts per quarter with an average size of about
$7 million
USD equivalent related to its cash flow hedging program.
The Company expects to reclassify to earnings all of the amounts recorded in other comprehensive income ("OCI") associated with its cash flow hedges over the next
12
months. OCI associated with cash flow hedges of foreign currency revenue is recognized as a component of net revenue in the same period as the related revenue is recognized. OCI associated with cash flow hedges of foreign currency costs of revenue and operating expenses are recognized as a component of cost of revenue and operating expense in the same period as the related costs of revenue and operating expenses are recognized.
Derivative instruments designated as cash flow hedges must be de-designated as hedges when it is probable the forecasted hedged transaction will not occur within the designated hedge period or if not recognized within
60
days following the end of the
78
hedge period. Deferred gains and losses in other comprehensive income associated with such derivative instruments are reclassified immediately into earnings through other income and expense. Any subsequent changes in fair value of such derivative instruments also are reflected in current earnings unless they are re-designated as hedges of other transactions. The Company did not recognize any material net gains or losses related to the loss of hedge designation on discontinued cash flow hedges during the years ended December 31,
2013
,
2012
and
2011
.
The effects of the Company’s derivative instruments on OCI and the consolidated statement of operations for the years ended December 31,
2013
,
2012
and
2011
are summarized as follows (in thousands):
|
Derivatives Designated as Hedging Instruments
|
Year Ended December 31, 2013
|
|||||||||||||||
|
Gain or (Loss)
Recognized in
OCI -
Effective
Portion (a)
|
Location of
Gain or (Loss)
Reclassified from OCI
into Income - Effective
Portion
|
Gain or (Loss)
Reclassified
from
OCI into
Income -
Effective
Portion (a)
|
Location of
Gain or (Loss)
Recognized in
Income and
Excluded from
Effectiveness Testing
|
Amount of Gain or (Loss) Recognized in
Income and
Excluded from
Effectiveness Testing
|
||||||||||||
|
Cash flow hedges:
|
||||||||||||||||
|
Foreign currency forward contracts
|
$
|
775
|
|
Net revenue
|
$
|
844
|
|
Other income (expense), net
|
$
|
(117
|
)
|
|||||
|
Foreign currency forward contracts
|
—
|
|
Cost of revenue
|
(9
|
)
|
Other income (expense), net
|
—
|
|
||||||||
|
Foreign currency forward contracts
|
—
|
|
Operating expenses
|
(149
|
)
|
Other income (expense), net
|
—
|
|
||||||||
|
Total
|
$
|
775
|
|
$
|
686
|
|
$
|
(117
|
)
|
|||||||
|
Derivatives Designated as
Hedging Instruments
|
Year Ended December 31, 2012
|
|||||||||||||||
|
Gain or (Loss)
Recognized in
OCI -
Effective
Portion (a)
|
Location of
Gain or (Loss)
Reclassified from OCI
into Income - Effective
Portion
|
Gain or (Loss)
Reclassified
from
OCI into
Income -
Effective
Portion (a)
|
Location of
Gain or (Loss)
Recognized in
Income and
Excluded from
Effectiveness Testing
|
Amount of Gain or (Loss) Recognized in
Income and
Excluded from
Effectiveness Testing
|
||||||||||||
|
Cash flow hedges:
|
||||||||||||||||
|
Foreign currency forward contracts
|
$
|
164
|
|
Net revenue
|
$
|
262
|
|
Other income (expense), net
|
$
|
(158
|
)
|
|||||
|
Foreign currency forward contracts
|
—
|
|
Cost of revenue
|
(1
|
)
|
Other income (expense), net
|
—
|
|
||||||||
|
Foreign currency forward contracts
|
—
|
|
Operating expenses
|
(67
|
)
|
Other income (expense), net
|
—
|
|
||||||||
|
Total
|
$
|
164
|
|
$
|
194
|
|
$
|
(158
|
)
|
|||||||
79
|
Derivatives Designated as
Hedging Instruments
|
Year Ended December 31, 2011
|
|||||||||||||||
|
Gain or (Loss)
Recognized in
OCI -
Effective
Portion (a)
|
Location of
Gain or (Loss)
Reclassified from OCI
into Income - Effective
Portion
|
Gain or (Loss)
Reclassified
from
OCI into
Income -
Effective
Portion (a)
|
Location of
Gain or (Loss)
Recognized in
Income and
Excluded from
Effectiveness Testing
|
Amount of Gain or (Loss) Recognized in
Income and
Excluded from
Effectiveness Testing
|
||||||||||||
|
Cash flow hedges:
|
||||||||||||||||
|
Foreign currency forward contracts
|
$
|
542
|
|
Net revenue
|
$
|
967
|
|
Other income (expense), net
|
$
|
(310
|
)
|
|||||
|
Foreign currency forward contracts
|
—
|
|
Cost of revenue
|
(4
|
)
|
Other income (expense), net
|
—
|
|
||||||||
|
Foreign currency forward contracts
|
—
|
|
Operating expenses
|
(154
|
)
|
Other income (expense), net
|
—
|
|
||||||||
|
Total
|
$
|
542
|
|
$
|
809
|
|
$
|
(310
|
)
|
|||||||
|
(a)
|
Refer to Note 10,
Stockholders' Equity
, which summarizes the cumulative other comprehensive income activity related to derivatives.
|
The Company
did not recognize any
net gain or loss related to the ineffective portion of cash flow hedges during the years ended December 31,
2013
,
2012
and
2011
.
Non-designated hedges
The Company enters into non-designated hedges under the authoritative guidance for derivatives and hedging to manage the exposure of non-functional currency monetary assets and liabilities held on its financial statements to fluctuations in foreign currency exchange rates, as well as to reduce volatility in other income and expense. The non-designated hedges are generally expected to offset the changes in value of its net non-functional currency asset and liability position resulting from foreign exchange rate fluctuations. Foreign currency denominated accounts receivable and payable are hedged with non-designated hedges when the related anticipated foreign revenue and expenses are recognized in the Company’s financial statements. The Company also hedges certain non-functional currency monetary assets and liabilities that may not be incorporated into the cash flow hedge program. The Company adjusts its non-designated hedges monthly and enters into about
13
non-designated derivatives per quarter. The average size of its non-designated hedges is about
$2 million
USD equivalent and these hedges normally range from
one
to
five
months in duration.
The effects of the Company’s derivatives not designated as hedging instruments in other income (expense), net in the consolidated statements of operations for the years ended December 31,
2013
and
2012
, are as follows (in thousands):
|
Derivatives Not Designated as Hedging Instruments
|
Location of Gains or (Losses)
Recognized in Income on Derivative
|
Amount of Gains or (Losses)
Recognized in Income on Derivative
|
||||||
|
Year Ended December 31, 2013
|
Year Ended December 31, 2012
|
|||||||
|
Foreign currency forward contracts
|
Other (expense) income, net
|
458
|
|
$
|
(502
|
)
|
||
Basic net income per share is computed by dividing the net income for the period by the weighted average number of common shares outstanding during the period. Diluted net income per share is computed by dividing the net income for the period by the weighted average number of shares of common stock and potentially dilutive common stock outstanding during the period. Potentially dilutive common shares include outstanding stock options and unvested restricted stock awards, which are reflected in diluted net income per share by application of the treasury stock method. Under the treasury stock method, the amount that the employee must pay for exercising stock options, the amount of stock-based compensation cost for future services that the Company has not yet recognized, and the estimated tax benefit that would be recorded in additional paid-in capital upon exercise are assumed to be used to repurchase shares.
80
Net income per share for the years ended December 31,
2013
,
2012
and
2011
are as follows (in thousands, except per share data):
|
|
Year Ended
|
|||||||||||
|
|
December 31,
2013 |
December 31,
2012 |
December 31,
2011 |
|||||||||
|
Net income
|
$
|
55,217
|
|
$
|
86,539
|
|
$
|
91,368
|
|
|||
|
Weighted average shares outstanding:
|
||||||||||||
|
Basic
|
38,379
|
|
38,057
|
|
37,121
|
|
||||||
|
Dilutive potential common shares
|
569
|
|
690
|
|
811
|
|
||||||
|
Total diluted
|
38,948
|
|
38,747
|
|
37,932
|
|
||||||
|
Basic net income per share
|
$
|
1.44
|
|
$
|
2.27
|
|
$
|
2.46
|
|
|||
|
Diluted net income per share
|
$
|
1.42
|
|
$
|
2.23
|
|
$
|
2.41
|
|
|||
Common stock equivalents excluded from net income per diluted share because their effect would have been anti-dilutive totaled
2.8 million
,
2.6 million
and
2.0 million
shares for the years ended December 31,
2013
,
2012
and
2011
, respectively.
Other income (expense), net consisted of the following (in thousands):
|
Year Ended December 31,
|
|||||||||||
|
2013
|
2012
|
2011
|
|||||||||
|
Foreign currency transaction (loss) gain, net
|
$
|
(1,592
|
)
|
$
|
204
|
|
$
|
131
|
|
||
|
Foreign currency contract gain (loss), net
|
341
|
|
(660
|
)
|
(1,267
|
)
|
|||||
|
Other
|
794
|
|
3,126
|
|
—
|
|
|||||
|
Total
|
$
|
(457
|
)
|
$
|
2,670
|
|
$
|
(1,136
|
)
|
||
Income before income taxes consists of the following (in thousands):
|
Year Ended December 31,
|
|||||||||||
|
2013
|
2012
|
2011
|
|||||||||
|
United States
|
$
|
91,318
|
|
$
|
102,159
|
|
$
|
79,318
|
|
||
|
International
|
1,664
|
|
27,123
|
|
44,892
|
|
|||||
|
Total
|
$
|
92,982
|
|
$
|
129,282
|
|
$
|
124,210
|
|
||
81
|
Year Ended December 31,
|
|||||||||||
|
2013
|
2012
|
2011
|
|||||||||
|
Current:
|
|||||||||||
|
U.S. Federal
|
$
|
30,989
|
|
$
|
34,666
|
|
$
|
27,415
|
|
||
|
State
|
3,751
|
|
4,555
|
|
3,319
|
|
|||||
|
Foreign
|
11,224
|
|
6,097
|
|
6,760
|
|
|||||
|
45,964
|
|
45,318
|
|
37,494
|
|
||||||
|
Deferred:
|
|||||||||||
|
U.S. Federal
|
(6,741
|
)
|
(2,069
|
)
|
(3,151
|
)
|
|||||
|
State
|
(1,164
|
)
|
(588
|
)
|
(713
|
)
|
|||||
|
Foreign
|
(294
|
)
|
82
|
|
(788
|
)
|
|||||
|
(8,199
|
)
|
(2,575
|
)
|
(4,652
|
)
|
||||||
|
Total
|
$
|
37,765
|
|
$
|
42,743
|
|
$
|
32,842
|
|
||
Net deferred tax assets consist of the following (in thousands):
|
Year Ended December 31,
|
|||||||
|
2013
|
2012
|
||||||
|
Deferred Tax Assets:
|
|||||||
|
Accruals and allowances
|
$
|
24,488
|
|
$
|
20,738
|
|
|
|
Net operating loss carryforwards
|
7,069
|
|
7,837
|
|
|||
|
Stock-based compensation
|
11,061
|
|
8,133
|
|
|||
|
Deferred rent
|
1,963
|
|
2,258
|
|
|||
|
Deferred revenue
|
1,535
|
|
1,552
|
|
|||
|
Tax credit carryforwards
|
1,183
|
|
1,410
|
|
|||
|
Acquired intangible assets
|
1,791
|
|
—
|
|
|||
|
Other
|
—
|
|
261
|
|
|||
|
49,090
|
|
42,189
|
|
||||
|
Deferred Tax Liabilities:
|
|||||||
|
Acquired intangible assets
|
—
|
|
(1,107
|
)
|
|||
|
Depreciation and amortization
|
(1,514
|
)
|
(1,535
|
)
|
|||
|
Other
|
(102
|
)
|
—
|
|
|||
|
(1,616
|
)
|
(2,642
|
)
|
||||
|
Net deferred tax assets
|
47,474
|
|
39,547
|
|
|||
|
Current portion
|
27,239
|
|
22,691
|
|
|||
|
Non-current portion
|
20,235
|
|
16,856
|
|
|||
|
Net deferred tax assets
|
$
|
47,474
|
|
$
|
39,547
|
|
|
82
Management's judgment is required in determining the Company's provision for income taxes, its deferred tax assets and any valuation allowance recorded against its deferred tax assets. In management's judgment it is more likely than not that such assets will be realized in the future as of
December 31, 2013
, and as such
no
valuation allowance has been recorded against the Company's deferred tax assets.
The effective tax rate differs from the applicable U.S. statutory federal income tax rate as follows:
|
Year Ended December 31,
|
||||||||
|
2013
|
2012
|
2011
|
||||||
|
Tax at federal statutory rate
|
35.0
|
%
|
35.0
|
%
|
35.0
|
%
|
||
|
State, net of federal benefit
|
2.2
|
%
|
2.1
|
%
|
1.5
|
%
|
||
|
Impact of international operations
|
3.9
|
%
|
(4.8
|
)%
|
(9.5
|
)%
|
||
|
Stock-based compensation
|
1.8
|
%
|
0.6
|
%
|
—
|
%
|
||
|
Tax credits
|
(1.9
|
)%
|
0.1
|
%
|
(0.7
|
)%
|
||
|
Others
|
(0.4
|
)%
|
0.1
|
%
|
0.1
|
%
|
||
|
Provision for income taxes
|
40.6
|
%
|
33.1
|
%
|
26.4
|
%
|
||
Income tax benefits in the amount of
$0.4 million
,
$1.1 million
and
$3.5 million
related to stock options were credited to additional paid-in capital during the years ended
December 31, 2013
,
2012
, and
2011
, respectively. As a result of changes in fair value of available for sale securities, income tax benefit of
$16,000
, tax expense of
$5,000
and
$8,000
was recorded in comprehensive income related to the years ended
December 31, 2013
,
2012
, and
2011
, respectively.
As of
December 31, 2013
, the Company has approximately
$20.2 million
and
$0.1 million
of acquired federal and state net operating loss carry forwards as well as
$0.7 million
of California tax credits carryforwards. All of these losses and
$0.1 million
of these credits are subject to annual usage limitations under Internal Revenue Code Section 382. The federal losses expire in different years beginning in fiscal
2021
. The state loss begins to expire in fiscal
2015
. The state tax credit carryforwards have no expiration.
The Company files income tax returns in the U.S. federal jurisdiction and various state, local, and foreign jurisdictions. With few exceptions, the Company is no longer subject to U.S. federal, state, local, or foreign income tax examinations for years before 2008. In 2011, the US federal Internal Revenue Service (IRS) commenced an audit of the Company's
2008
and
2009
tax years. The audit was completed in October 2012, and all issues under examination by the IRS were effectively settled. In November, 2012, the Italian Tax Authority (ITA) commenced an audit of the Company’s 2004 through 2011 tax years, and has subsequently extended audit procedures to include the 2012 tax year. The Company has limited audit activity in various states and other foreign jurisdictions. Due to the uncertain nature of ongoing tax audits, the Company has recorded its liability for uncertain tax positions as part of its long-term liability as payments cannot be anticipated over the next 12 months. The existing tax positions of the Company continue to generate an increase in the liability for uncertain tax positions. The liability for uncertain tax positions may be reduced for liabilities that are settled with taxing authorities or on which the statute of limitations could expire without assessment from tax authorities. The possible reduction in liabilities for uncertain tax positions resulting from the expiration of statutes of limitation in multiple jurisdictions in the next 12 months is approximately
$2.8 million
, excluding the interest, penalties and the effect of any related deferred tax assets or liabilities.
83
A reconciliation of the beginning and ending amount of gross unrecognized tax benefits (“UTB”) is as follows (in thousands):
|
Federal, State, and Foreign Tax
|
|||
|
Gross UTB Balance at December 31, 2010
|
$
|
18,432
|
|
|
Additions based on tax positions related to the current year
|
1,795
|
|
|
|
Additions for tax positions of prior years
|
1,015
|
|
|
|
Settlements
|
(179
|
)
|
|
|
Reductions for tax positions of prior years
|
(2
|
)
|
|
|
Reductions due to lapse of applicable statutes
|
(3,699
|
)
|
|
|
Adjustments due to foreign exchange rate movement
|
(27
|
)
|
|
|
Gross UTB Balance at December 31, 2011
|
17,335
|
|
|
|
Additions based on tax positions related to the current year
|
711
|
|
|
|
Additions for tax positions of prior years
|
956
|
|
|
|
Settlements
|
(2,620
|
)
|
|
|
Reductions for tax positions of prior years
|
(3,590
|
)
|
|
|
Reductions due to lapse of applicable statutes
|
(449
|
)
|
|
|
Adjustments due to foreign exchange rate movement
|
(4
|
)
|
|
|
Gross UTB Balance at December 31, 2012
|
12,339
|
|
|
|
Additions based on tax positions related to the current year
|
1,866
|
|
|
|
Additions for tax positions of prior years
|
4,106
|
|
|
|
Settlements
|
(3,134
|
)
|
|
|
Reductions for tax positions of prior years
|
(1,163
|
)
|
|
|
Reductions due to lapse of applicable statutes
|
(1,314
|
)
|
|
|
Adjustments due to foreign exchange rate movement
|
43
|
|
|
|
Gross UTB Balance at December 31, 2013
|
$
|
12,743
|
|
The total amount of net UTB that, if recognized would affect the effective tax rate as of
December 31, 2013
is
$11.8 million
. The ending net UTB results from adjusting the gross balance at
December 31, 2013
for items such as U.S. federal and state deferred tax, foreign tax credits, interest, and deductible taxes. The net UTB is included as a component of non-current income taxes payable within the consolidated balance sheet.
The Company recognizes interest and penalties accrued related to unrecognized tax benefits in income tax expense. During the years ended
December 31, 2013
,
2012
, and
2011
, total interest and penalties expensed were
$446,000
,
$74,000
and
$30,000
, respectively. As of
December 31, 2013
and
December 31, 2012
, accrued interest and penalties on a gross basis was
$2.1 million
and
$1.8 million
, respectively. Included in accrued interest are amounts related to tax positions for which the ultimate deductibility is highly certain but for which there is uncertainty about the timing of such deductibility. Because of the impact of deferred tax accounting, other than interest, the impact of any uncertain tax benefits related to temporary differences would not affect the annual effective tax rate but would accelerate the payment of cash to the taxing authority to an earlier period.
With the exception of those foreign sales subsidiaries for which deferred tax has been provided, the Company intends to indefinitely reinvest foreign earnings. These earnings were approximately
$60.5 million
and
$63.4 million
as of
December 31, 2013
and
December 31, 2012
, respectively. Because of the availability of U.S. foreign tax credits, it is not practicable to determine the income tax liability that would be payable if such earnings were not indefinitely reinvested.
Leases
The Company leases office space, cars and equipment under non-cancelable operating leases with various expiration dates through
December 2026
. Rent expense in the years ended,
December 31, 2013
,
2012
, and
2011
was
$9.9 million
,
$7.6 million
84
and
$7.0 million
, respectively. The terms of some of the Company’s office leases provide for rental payments on a graduated scale. The Company recognizes rent expense on a straight-line basis over the lease period, and has accrued for rent expense incurred but not paid.
Future minimum lease payments under non-cancelable operating leases are as follows (in thousands):
|
Year Ending December 31,
|
|||
|
2014
|
$
|
2,987
|
|
|
2015
|
9,242
|
|
|
|
2016
|
6,005
|
|
|
|
2017
|
5,028
|
|
|
|
2018
|
4,697
|
|
|
|
Thereafter
|
5,990
|
|
|
|
Total minimum lease payments
|
$
|
33,949
|
|
Employment Agreements
The Company has signed various employment agreements with key executives pursuant to which, if their employment is terminated without cause, such employees are entitled to receive their base salary (and commission or bonus, as applicable) for 52 weeks (for the Chief Executive Officer), 39 weeks (for the Senior Vice President of Worldwide Operations and Support) and up to 26 weeks (for other key executives). Such employees will also continue to have stock options vest for up to a
one
-year period following such termination without cause. If a termination without cause or resignation for good reason occurs within
one year
of a change in control, such employees are entitled to full acceleration (for the Chief Executive Officer) and up to
two years
acceleration (for other key executives) of any unvested portion of his or her equity awards.
Purchase Obligations
The Company has entered into various inventory-related purchase agreements with suppliers. Generally, under these agreements,
50%
of orders are cancelable by giving notice
46
to
60
days prior to the expected shipment date and
25%
of orders are cancelable by giving notice
31
to
45
days prior to the expected shipment date. Orders are non-cancelable within
30 days
prior to the expected shipment date. At
December 31, 2013
, the Company had
$187.3 million
in non-cancelable purchase commitments with suppliers. The Company establishes a loss liability for all products it does not expect to sell for which it has committed purchases from suppliers. Such losses have not been material to date.
Guarantees and Indemnifications
The Company, as permitted under Delaware law and in accordance with its Bylaws, indemnifies its officers and directors for certain events or occurrences, subject to certain limits, while the officer or director is or was serving at the Company’s request in such capacity. The term of the indemnification period is for the officer’s or director’s lifetime. The maximum amount of potential future indemnification is unlimited; however, the Company has a Director and Officer Insurance Policy that limits its exposure and enables it to recover a portion of any future amounts paid. As a result of its insurance policy coverage, the Company believes the fair value of these indemnification agreements is minimal. Accordingly, the Company has
no
liabilities recorded for these agreements as of
December 31, 2013
.
In its sales agreements, the Company typically agrees to indemnify its direct customers, distributors and resellers for any expenses or liability resulting from claimed infringements of patents, trademarks or copyrights of third parties. The terms of these indemnification agreements are generally perpetual any time after execution of the agreement. The maximum amount of potential future indemnification is unlimited. The Company believes the estimated fair value of these agreements is minimal. Accordingly, the Company has
no
liabilities recorded for these agreements as of
December 31, 2013
.
Litigation and Other Legal Matters
The Company is involved in disputes, litigation, and other legal actions, including, but not limited to, the matters described below. In all cases, at each reporting period, the Company evaluates whether or not a potential loss amount or a potential range
85
of loss is probable and reasonably estimable under the provisions of the authoritative guidance that addresses accounting for contingencies. In such cases, the Company accrues for the amount, or if a range, the Company accrues the low end of the range as a component of legal expense in litigation reserves. The Company monitors developments in these legal matters that could affect the estimate the Company had previously accrued. In relation to such matters, the Company currently believes that there are no existing claims or proceedings that are likely to have a material adverse effect on its financial position within the next twelve months, or the outcome of these matters is currently not determinable. There are many uncertainties associated with any litigation, and these actions or other third-party claims against the Company may cause the Company to incur costly litigation and/or substantial settlement charges. In addition, the resolution of any intellectual property litigation may require the Company to make royalty payments, which could have an adverse effect in future periods. If any of those events were to occur, the Company's business, financial condition, results of operations, and cash flows could be adversely affected. The actual liability in any such matters may be materially different from the Company's estimates, which could result in the need to adjust the liability and record additional expenses.
Ruckus Wireless v. NETGEAR Inc.
On May 5, 2008, a lawsuit was filed against the Company by Ruckus Wireless (“Ruckus”), a developer of Wi-Fi technology, in the U.S. District Court, Northern District of California (case number C08-2310-PJH (“NETGEAR I”)). Ruckus alleges that the Company infringes U.S. Patent Nos. 7,358,912 ("the '912 Patent") and 7,193,562 ("the '562 Patent") in the course of deploying Wi-Fi antenna array technology in its WPN824 RangeMax wireless router. Ruckus also sued Rayspan Corporation alleging similar claims of patent infringement. The Company filed its answer to the lawsuit in the third quarter of 2008. The Company and Rayspan Corporation jointly filed a request for
inter partes
reexamination of the Ruckus patents with the USPTO on September 4, 2008. The Court issued a stay of the litigation while the reexaminations proceeded in the USPTO. On November 28, 2008, a reexamination was ordered with respect to claims 11-17 of the '562 Patent, but denied with respect to claims 1-10 and 18-36. On December 17, 2008, the defendants jointly filed a petition to challenge the denial of reexamination of claims 1-10 and 18-36 of the '562 Patent. In July 2009, the petition was denied, and the remaining claims 11-17 were confirmed by the USPTO. On December 2, 2008, reexamination was granted with regard to the '912 Patent. In early October 2009, the Company received an Action Closing Prosecution in the reexamination of the '912 Patent. All the claims of the '912 Patent, with the exception of the unchallenged claims 7 and 8, were finally rejected by the USPTO. On October 30, 2009, Ruckus submitted an “after-final” amendment in the '912 Patent reexamination proceeding. The Company's comments to Ruckus' “after-final” amendment were submitted on November 30, 2009. On December 1, 2009, the Court found that bifurcating the '562 Patent from the '912 Patent and commencing litigation on the '562 Patent while the USPTO reexamination process and appeals are still pending would be an inefficient use of the Court's resources. Accordingly, the Court ruled that the litigation stay should remain in effect. On September 12, 2010, the Company filed the rebuttal brief in its appeals of the USPTO's rulings during the reexamination of the '562 Patent, and the Company requested an oral hearing with the Board of Appeals at the USPTO to discuss this brief. On September 13, 2010, Ruckus filed a notice of appeal of the '912 Patent to appeal the adverse rulings it received from the USPTO in the reexamination of this patent. The Company filed a respondent's brief in the '912 Patent case on January 24, 2011. An oral hearing in the '562 case was set for February 1, 2011, but the Company decided to cancel it and let the USPTO decide the '562 case based solely on the previously submitted papers. On May 13, 2011, the USPTO indicated that the Company was successful in its appeal of the examiner's previous decision to allow claims 11-17 in the '562 reexamination, and the USPTO Board of Appeals reversed the examiner's decision and declared those claims invalid. On June 13, 2011, Ruckus submitted a request for rehearing by the Board of Appeals of its decision to reject claims 11-17 of the '562 Patent. On September 28, 2011, the Board of Patent Appeals and Interferences denied Ruckus's request for a rehearing in the '562 Patent reexamination case. Ruckus did not timely file a notice of appeal to the Court of Appeals for the Federal Circuit appealing the USPTO's cancellation of claims 11-17 of the '562 patent. Therefore, a reexamination certificate will issue with claims 11-17 cancelled and claims 1-10 and 18-36 confirmed.
On November 4, 2009, Ruckus filed a complaint in the U.S. District Court, Northern District of California (case number C09-5271-PJH (“NETGEAR II”)), alleging the Company and Rayspan Corporation infringed a patent that is related to the patents previously asserted against the Company and Rayspan Corporation by Ruckus, as discussed above. The asserted patent in the second case was U.S. Patent No. 7,525,486 entitled “Increased wireless coverage patterns.” As with the previous Ruckus action, the WPN824 RangeMax wireless router was the alleged infringing device. The Company challenged the sufficiency of Ruckus's complaint and moved to dismiss the complaint. Ruckus opposed this motion. The Court partially agreed with the Company's motion and ordered Ruckus to submit a new complaint, which Ruckus did. The initial case management conference occurred on February 11, 2010. On March 25, 2010, the Court ordered a stay until the completion of the reexamination proceedings instigated on the patents in NETGEAR I.
Ruckus and the Company in December 2012 requested that the stay of the California actions be lifted. This request to lift the stay was predicated on Ruckus's Withdrawal of Appeal and Cancellation of Claims ("Withdrawal") of the '912 Patent that was
86
on appeal in re-examination at the USPTO and that was asserted by Ruckus in NETGEAR I. Through the filing of the Withdrawal, Ruckus announced its intent to withdraw and its actual withdrawal of its appeal of claims 1, 4-9-14, 18, 19, and 22-29 in re-examination (the "Appealed Claims"), and Ruckus further announced its intent to cancel and its actual cancellation of claims 30-31 in re-examination (the "Cancelled Claims"). Claims 2, 3, 15-17, 20, and 21 had previously been cancelled during re-examination (the "Previously Cancelled Claims"). Because the Appealed Claims and the Cancelled Claims represented the entirety of the claims remaining for consideration in re-examination, and the Previously Cancelled Claims are no longer of record in the offensive case by Ruckus against the Company, there are no remaining claims for re-examination in the '912 Patent and the '912 Patent cannot be asserted against the Company. Thus, the Company and Ruckus requested that the Court lift the stay of this litigation and calendar a case management conference. The case management conference occurred on January 3, 2013. At that time, the Court scheduled a claim construction hearing for August 2013. The parties to the lawsuit - the Company, Rayspan, and Ruckus - also agreed that Ruckus's
two
offensive cases against the Company and Rayspan should be consolidated because the cases involve similar complaints and common questions of law and fact and doing so would advance the interests of judicial economy.
Ruckus served its infringement contentions on the Company on January 17, 2013, and the Company's invalidity contentions were served on Ruckus on March 4, 2013. On March 5, 2013, Ruckus and Rayspan filed a stipulation with proposed order dismissing Rayspan from the case, and, on March 6, 2013, the Court dismissed with prejudice Rayspan. On March 14, 2013, Ruckus filed its Second Amended Complaint, as ordered by the Court. Ruckus did not add any patents, but attempted to add claims of breach of contract and misappropriation of trade secrets by the Company. The Company believed that Ruckus contravened the Court's order that there should not be a “substantial change” in the Second Amended Complaint by adding the breach of contract and misappropriation of trade secrets claims to the lawsuit. Consequently, the Company filed a Motion to Strike the newly added claims. On May 22, 2013, the Court granted the Company's motion to strike the state law claims of trade secret misappropriation and breach of contract from the Second Amended Complaint. On June 10, 2013, Ruckus filed its Motion for Leave to Amend and File its Third Amended Complaint, adding back the trade secret misappropriation and breach of contract claim. The Company responded on June 24, 2013, and the parties orally argued the motion and response on July 24, 2013. On July 29, 2013, the Court denied Ruckus's Motion for Leave to Amend and File its Third Amended Complaint, meaning the Court would not allow Ruckus to bring its breach of contract claims or trade secret misappropriation claims because they were time barred.
In May 2013, the parties filed their Joint Claim Construction Statement where the parties indicated to the Court the disputed claim language, the parties' competing constructions, and the evidence in support of the parties' positions. Ruckus then filed its opening claim construction brief on June 18, 2013 and the Company filed its reply on July 1, 2013. The parties gave a claim construction tutorial to the Court on August 16, 2013, and, on August 28, 2013, the parties argued their proposed claim constructions before the Court. On December 16, 2013, the Court denied Ruckus’s attempt to strike the Company’s invalidity arguments and issued its claim construction order. On January 31, 2014, the Company and Ruckus entered into a settlement agreement that settled all outstanding litigation between the parties thereby concluding this litigation.
On November 19, 2010, the Company filed suit against Ruckus in the U.S. District Court, District of Delaware for infringement of
four
of the Company's patents. The Company alleged that Ruckus's manufacture, use, sale or offers for sale within the United States or importation into the United States of products, including wireless communication products, infringed United States Patent Nos. 5,812,531, 6,621,454, 7,263,143, and 5,507,035, all owned by the Company. The Company granted Ruckus an extension to file its answer to the Company's suit, and on January 11, 2011, Ruckus filed a motion to dismiss the Company's suit based on insufficient pleadings. The Company filed its response to Ruckus's motion on January 31, 2011. In addition, on May 6, 2011, Ruckus filed a motion to transfer venue to the Northern District of California. The Court denied Ruckus' motion to transfer the case to the Northern District of California and granted the Company leave to file an amended complaint rather than address the Ruckus motion to dismiss based on insufficient pleadings. The Company filed the proposed amended complaint. Nevertheless, Ruckus filed a second motion to dismiss based on insufficient pleadings by the Company. On March 28, 2012, the Delaware District Court in a memorandum opinion and order denied Ruckus's second motion to dismiss. A scheduling conference occurred April 18, 2012, and the Company submitted its initial disclosures in the case on May 15, 2012. On May 31, 2012, Ruckus filed its third motion to dismiss, asserting that the Company cannot sustain its indirect infringement and willfulness allegations without pleading pre-suit knowledge of the patents. The Company responded to Ruckus's motion to dismiss on June 18, 2012. The Court released the schedule for the case on June 8, 2012 with Claim Construction and Summary Judgment Hearings scheduled for August 9, 2013 and a ten day jury trial scheduled for October 21, 2013. On July 13, 2012, the Company added to its complaint against Ruckus an allegation of infringement of patent number 6,512,480 (“System and method for narrow beam antenna diversity in an RF data transmission system”) by Ruckus's ZoneFlex and MediaFlex products. The Company and Ruckus participated in a court-ordered mediation on September 13, 2012 in Delaware, and the parties did not come to an agreement to settle the litigation pending between the parties. Fact discovery closed on December 14, 2012 and expert discovery also closed. In addition, all claim construction and summary judgment briefing was finished. On August 9, 2013 the parties argued their claim construction and summary judgment briefing before the Court. On September 30, 2013, the Court dismissed the asserted claims of three of the Company’s five patents
87
in suit because the Court agreed with Ruckus’s summary judgment motions that the claims were indefinite. The Court also released its claim construction rulings the same day. As a result of the Court’s rulings,
two
patents (6,631,454 and 7,263,143) and
five
claims remained standing against Ruckus for the trial that began on October 22, 2013 and ended on October 31, 2013. At the conclusion of the trial, a jury rendered a verdict that the
two
patent and
five
claims were not infringed by Ruckus, as the Company had contended, and that the patents were not invalid, as Ruckus has contended. On January 31, 2014, the Company and Ruckus entered into a settlement agreement that settled all outstanding litigation between the parties thereby concluding this litigation.
On June 19, 2013, Ruckus filed a complaint in Delaware accusing NETGEAR of infringing United States Patent No. 8,031,129 (“the '129 Patent”) and United States Patent No. 8,150,470 (“the '470 Patent”). Ruckus accused the Company of infringing the '129 Patent by making, using, offering to sell, selling, and/or importing products, such as the Company's N600 Wireless Dual Band Routers (WNDR3400). Ruckus also accused the Company of knowingly and actively inducing infringement of the '129 Patent. Ruckus accused the Company of infringing the '470 Patent by making, using, offering to sell, selling, and/or importing products, such as NETGEAR's N600 Wireless Dual Band Gigabit Routers (WNDR3800). Ruckus also accused the Company of knowingly and actively inducing infringement of the '470 Patent. On August 26, 2013, Ruckus filed an amended complaint that dropped its claims of induced and willful infringement that were in the original complaint. The Company filed its answer to Ruckus’s complaint on October 15, 2013, and asserted that Ruckus’s patents were invalid and not infringed by the Company. On January 31, 2014, the Company and Ruckus entered into a settlement agreement that settled all outstanding litigation between the parties thereby concluding this litigation.
The settlement did not have a material financial impact to the Company.
Northpeak Wireless, LLC v. NETGEAR, Inc.
In October 2008, a lawsuit was filed against the Company and
30
other companies by Northpeak Wireless, LLC (“Northpeak”) in the U.S. District Court, Northern District of Alabama. Northpeak alleges that the Company's 802.11b compatible products infringe certain claims of U.S. Patent Nos. 4,977,577 ("the '577 Patent") and 5,987,058 ("the '058 Patent"). The Company filed its answer to the lawsuit in the fourth quarter of 2008. On January 21, 2009, the District Court granted a motion to transfer the case to the U.S. District Court, Northern District of California. In August 2009, the parties stipulated to a litigation stay pending a reexamination request to the USPTO on the asserted patents. The reexaminations of the patents are proceeding. In March 2011, the USPTO confirmed the validity of the asserted claims of the '577 Patent over certain prior art references. In April 2011, the USPTO issued a final office action rejecting both asserted claims of the '058 Patent as being obvious in light of the prior art. In March 2013, the Board of Patent Appeals and Interferences of the USPTO affirmed the rejection of both asserted claims of the '058 Patent. The case remains stayed by stipulation, and no trial date has been set. The Company does not expect there to be a material financial impact to the Company because of this litigation matter.
Ericsson v. NETGEAR, Inc.
On September 14, 2010, Ericsson Inc. and Telefonaktiebolaget LM Ericsson (collectively “Ericsson”) filed a patent infringement lawsuit against the Company and defendants D-Link Corporation, D-Link Systems, Inc., Acer, Inc., Acer America Corporation, and Gateway, Inc. in the U.S. District Court, Eastern District of Texas alleging that the defendants infringe certain Ericsson patents. The Company has been accused of infringing
eight
U.S. patents: 5,790,516; 6,330,435; 6,424,625; 6,519,223; 6,772,215; 5,987,019; 6,466,568; and 5,771,468 ("the '468 Patent"). Ericsson generally alleges that the Company and the other defendants have infringed and continue to infringe the Ericsson patents through the defendants' IEEE 802.11-compliant products. In addition, Ericsson alleged that the Company infringed the claimed methods and apparatuses of the '468 Patent through the Company's PCMCIA routers. The Company filed its answer to the Ericsson complaint on December 17, 2010 where it asserted the affirmative defenses of noninfringement and invalidity of the asserted patents. On March 1, 2011, the defendants filed a motion to transfer venue to the District Court for the Northern District of California and their memorandum of law in support thereof. On March 21, 2011, Ericsson filed its opposition to the motion, and on April 1, 2011, defendants filed their reply to Ericsson's opposition to the motion to transfer. On June 8, 2011, Ericsson filed an amended complaint that added Dell, Toshiba and Belkin as defendants. At the status conference held on Jun 9, 2011, the Court set a Markman hearing for June 28, 2012 and trial for June 3, 2013. On June 14, 2011, Ericsson submitted its infringement contentions against the Company. On September 29, 2011, the Court denied the defendants' motion to transfer venue to the Northern District of California. In advance of the Markman hearing, the parties on March 9, 2012 exchanged proposed constructions of claim terms and on April 9, 2012 filed the Joint Claim Construction Statement with the District Court. On May 8, 2012, Ericsson submitted its opening Markman brief and on June 1, 2012 the defendants submitted their responsive Markman brief. Ericsson's Reply Markman brief was submitted June 15, 2012, and on June 28, 2012 the Markman hearing was held in the Eastern District of Texas. On June 21, 2012, Ericsson dismissed the '468 Patent (“Multi-
88
purpose base station”) with prejudice and gave the Company a covenant not to sue as to products in the marketplace now or in the past. On June 22, 2012, Intel filed its Complaint in Intervention, meaning that Intel became an official defendant in the Ericsson case. The parties thereafter completed fact discovery and exchanged expert reports. During the exchange of the expert reports, Ericsson dropped the '516 patent (the OFDM “pulse shaping” patent). In addition, Ericsson dropped the '223 Patent (packet discard patent) against all the defendants' products, except for those products that use Intel chips. Thus, Ericsson has now dropped the '468 Patent (wireless base station), the '516 Patent (OFDM pulse shaping), and the '223 Patent (packet discard patent) for all non-Intel products. The
five
remaining patents are all only asserted against 802.11-compliant products.
At a Court ordered mediation in Dallas on January 15, 2013, the parties did not come to an agreement to settle the litigation. On March 8, 2013, the parties received the Markman (claim construction) Order in response to the claim construction briefing and claim construction hearing.
A jury trial in the Ericsson case occurred in the Eastern District of Texas from June 3 through June 13, 2013. After hearing the evidence, the jury found no infringement of the '435 and '223 patents, and the jury found infringement of claim 1 of the '625 patent, claims 1 and 5 of the '568 patent, and claims 1 and 2 of the '215 patent. The jury also found that there was no willful infringement by any defendant. Additionally, the jury found no invalidity of the asserted claims of the '435 and '625 patents. The jury assessed the following damages against the defendants: D-Link:
$435,000
; NETGEAR:
$3,555,000
; Acer/Gateway:
$1,170,000
; Dell:
$1,920,000
; Toshiba:
$2,445,000
; Belkin:
$600,000
. The damages awards equate to
15 cent
s per unit for each accused 802.11 device sold by each defendant. Thus, unless the defendants' various appeals are successful, the Company will likely have a
15 cent
per unit obligation on its 802.11 devices until 2016 (when one infringed patent in suit expires),
10 cent
per unit obligation from 2016 through 2018 (when a second infringed patent in suit expires), and a
5 cent
per unit obligation from 2018 through 2020 (when the third and last infringed patent in suit expires).
The Company and other defendants submitted various post-trial motions and briefs to the Court for its consideration, including motions and briefs for judgment as a matter of law in favor of defendants on non-infringement and invalidity of the patents in suit and for a reduction in damages, and the defendants have also moved for a new trial. These motions were argued before the Court on July 16, 2013. On August 6, 2013, the Court issued its orders on the various JMOL's (“Judgment as a Matter of Law”) and other post-trial motions. The Court denied all the defendants’ motions and set the reasonable and nondiscriminatory (RAND) royalty rate for the infringed patents equivalent to the jury verdict of
15 cents
per unit.
After negotiations, Ericsson and the Company agreed to the following as collateral while the appeal of the verdict, Court’s rulings, and the RAND royalty rate are pending. Ericsson will forego collecting the
$3,555,000
verdict plus various fees (Prejudgment interest of
$224,141
; Post-judgment interest of
$336
per day; Costs of
$41,667
) assigned to the Company pending appeal, so long as a Company representative declares and provides Ericsson with adequate quarterly assurances that the judgment can still be paid. For the ongoing royalties of 15 cents per 802.11n or 802.11ac device sold by the company that the jury and Court awarded, the Company will place the ongoing royalty amount into the Court’s registry (escrow account) and will give Ericsson a corresponding royalty report until the Company’s appeals of the jury verdict, the Court’s orders, and the RAND royalty rate are exhausted.
On December 16, 2013, the defendants submitted their appeal brief to the Federal Circuit. Ericsson’s reply brief is due on February 20, 2014. The defendants estimate that the appeals process will take about 18 months from the jury’s verdict to run its course. The Company accrued and expensed the
$3,555,000
in damages during the second quarter of 2013 to satisfy the verdict.
NETGEAR, Inc. v. Innovatio IP Ventures LLC.
On November 16, 2011, the Company filed a declaratory judgment action in the District of Delaware for non-infringement and invalidity of
17
WiFi-related patents brought in the approximately
15
actions throughout the United States by Innovatio IP Ventures LLC (“Innovatio”) against end user customers of the Company and other companies. Shortly after filing the declaratory judgment action, the Company filed a response supporting Cisco Systems, Inc.'s ("Cisco") and Motorola Solutions, Inc.'s ("Motorola") Motion to Transfer for Coordinated Pretrial Proceedings Pursuant to 28 U.S.C. § 1407 that was before the United States Judicial Panel on Multidistrict Litigation (“JPML”). On December 28, 2011, the JPML issued an order transferring the Innovatio actions throughout the United States, including the Company's declaratory judgment action, to the United States District Court for the Northern District of Illinois. Thus, the Company's declaratory judgment action and approximately
15
other similar cases will now proceed in the Northern District of Illinois in a consolidated fashion. On July 10, 2012, Innovatio answered the Declaratory Judgment Complaint filed by the Company with various counterclaims, cross claims, and affirmative defenses. In its answer, Innovatio accused the Company of infringing
six
WiFi-related patents in addition to the
17
WiFi-related patents on which the Company brought its declaratory judgment action of non-infringement and invalidity. The Company filed its answer to
89
Innovatio's various counterclaims, cross claims, and affirmative defenses on August 3, 2012. In addition, on October 1, 2012, Cisco, Motorola and the Company filed an amended complaint alleging racketeering, fraud, interference with contract, unfair business practices, and conspiracy, among other things, against Innovatio. On February 4, 2013, the Court dismissed the offensive claims of Cisco, Motorola, and the Company that alleged Innovatio was engaging in racketeering, fraud, and unfair business practices by demanding licensing fees from hotels, cafes and other businesses but left intact claims against Innovatio that allege breach of contract with respect to Innovatio's fair, reasonable, and nondiscriminatory (FRAND) royalty obligations. The parties have already exchanged their Final Infringement, Unenforceability and Invalidity Contentions and Damages contentions.
The Court has implemented special damages-focused proceedings prior to proceeding to the liability or infringement phase of the case. Accordingly, the parties on July 18 and July 19, 2013 participated in a bench trial on essentiality. Because the plaintiff and defendants disagree as to whether approximately 230 patent claims asserted by Innovatio are essential to practicing the 802.11 standard, this bench trial was held to determine whether those claims are essential. Essential claims are subject to FRAND royalty obligations, and such royalty obligations are generally subject to lower rates than Innovatio is currently demanding from the parties it is accusing of infringing its patents. On July 26, 2013, the Court issued an order deeming all claim essential. The Court reviewed various arguments on the IEEE's definition of “Essential Patent Claims” and found that essential patent claims are those which are necessary to implement mandatory or optional features but also can cover items not explicitly required by the standard -- either “enabling” technologies or items that are technically and commercially necessary to implement the standard. The Court confirmed its previous holding that the prospective licensee has the burden of proving essentiality, and that the analysis should be performed on a claim by claim basis, as opposed to a patent by patent basis. The Court then held a bench trial, which began on September 9, 2013, and ended on September 19, 2013, to determine what the FRAND royalty rate would be on the patents and claims earlier found to be essential by the Court. The Court ruled on September 25, 2013 that the FRAND royalty for Innovatio's standard-essential Wi-Fi patents would be 9.56 cents per unit, far lower than the several dollars per unit that Innovatio had sought. Innovatio’s method would have valued the patents at rates ranging from
$3.39
per unit for a wireless router to
$16.17
per unit for a tablet. The Court also determined that the correct royalty base for making a FRAND determination is the price of the Wi-Fi chip embedded in each product, finding the patents made up a small part of the value of the chip. Innovatio had said the rate should be based on the selling price for accused products, which could run to hundreds of dollars and lead to royalties of many dollars per unit. The Court concluded that Innovatio's expert witnesses presented "no legally sound and factually credible method" for calculating the FRAND rate based on the price of the whole product, leaving it no choice but to base its analysis on the price of the chip.
On November 22, 2013, during a court-ordered mediation, Innovatio and the Company agreed to settle the case for a payment from the Company to Innovatio in return for a fully-paid-up license to the patents in suit, their foreign counterparts, and any other patents that Innovatio currently holds. The settlement did not have a material financial impact to the Company.
U.S. Ethernet Innovation, LLC v. NETGEAR, Inc.
On June 22, 2012, U.S. Ethernet Innovations, LLC (“USEI”) sued the Company in the District Court for the Eastern District of Texas, alleging infringement of certain of its Ethernet-related patents: U.S. Patent Numbers 5,732,094 (“Method for automatic initiation of data transmission”); 5,434,872 (“Apparatus for automatic initiation of data transmission”); 5,299,313 (“Network interface with host independent buffer management”) and 5,530,874 (“Network adapter with an indication signal mask and an interrupt signal mask”). USEI is a patent holding entity with a nominal office in the Eastern District of Texas. The accused products include products such as the “Netgear RT311 Internet Gateway Router.” The Company received an extension until August 17, 2012 to answer the complaint. USEI has sued, in addition to the Company, the following companies on the same and other of its Ethernet-related patents: Ricoh Americas Corporation, TRENDnet, Inc., Xerox Corporation, Konica Minolta Business Solutions U.S.A., Inc., Freescale Semiconductor, Inc., Sharp Electronics Corporation, Digi International Inc., NetSilicon, Inc., Epson America, Inc., Cirrus Logic, Inc., Yamaha Corporation of America, Control4 Corporation, Samsung Electronics Co., Ltd., Samsung Electronics America, Inc., Samsung Telecommunications America, LLC, Samsung Austin Semiconductor, LLC, Oki Data Americas, Inc., STMicroelectronics N.V., and STMicroelectronics, Inc. (collectively, “Defendants”).
The Company received a further extension to answer the complaint and answered on September 4, 2012 via a 12(b)(6) motion to dismiss the complaint for various reasons, including a lack of pleading specificity. USEI responded to the Company's motion to dismiss under Rule 12(b)(6) on September 21, 2012. The Company submitted its Reply in Support of its Motion to Dismiss on October 1, 2012.
USEI served its infringement contentions on the Company on October 10, 2012. The Company filed its transfer motion for a transfer to the Northern District of California and supporting declarations on November 16, 2012. On December 3, 2012, Defendants filed their joint invalidity contentions.
90
Because the Eastern District of Texas's preferred time for deciding motions to transfer is after the Markman hearing, the defendants filed a motion to stay the litigation pending the result of the Eastern District of Texas's decisions on the motion to transfer on January 29, 2013.
The Court has consolidated for discovery purposes USEI's cases against the aforementioned defendants and scheduled a consolidated Markman hearing for April 4, 2013 for the asserted patents. The Court also indicated that the court would consider any of Defendants' transfer motions as soon as possible.
On March 27, 2013, the Court issued a Memorandum Opinion and Order granting the Company's motion to transfer to the United States District Court for the Northern District of California, effective on April 16, 2013. In response, on April, 12, 2013, USEI filed a motion for clarification and/or reconsideration of the venue order. Specifically, USEI seeks to delay the transfer until the Markman order in the Eastern District of Texas case becomes final under the guise that it is more efficient to allow the Texas court to construe the terms. The Company opposed USEI's motion. The mediation in this case that was scheduled for May 15, 2013 was cancelled.
On May 16, 2013, the Court in the Eastern District of Texas denied USEI's motion to reconsider the timing of transfer. Also, the Court sent notice that the Eastern District of Texas case is closed, and instructed the clerk to transfer the case immediately.
On June 28, 2013, the new Court in the case of USEI against the Company (the District Court for the Northern District of California), held a combined Case Management Conference for the Company's newly transferred case and the case USEI has previously instigated against several other defendants, including several Ethernet chip manufacturers. At this Case Management Conference, the Court commented that the chip manufacturers should go to trial first. The Court also ruled that the Company is going to join on the same schedule as the other defendants and allowed the Company to file a new motion to dismiss with the citation of supplemental Northern District of California authority.
One additional patent is asserted against the Company that is not asserted against the other Northern District of California defendants (the '874 Patent). The Court agreed that, if USEI and the Company cannot resolve '874 Patent claim construction issues, the Court will build in dates to the litigation schedule for doing so (i.e. a limited claim construction hearing on terms of the '874 Patent).
In July 2013, the Company filed a new motion to dismiss, as specifically allowed by the Court at the initial case management conference in the Northern District of California. On August 12, 2013, the Court granted the Company’s motion to dismiss, but the Court granted USEI leave to amend its complaint. On August 26, 2013, USEI submitted its Amended Complaint, and on September 9, 2013, the Company filed its Answer and Counterclaims of noninfringement and invalidity of the patents in suit.
On November 12, 2013, during a court ordered mediation, USEI and the Company agreed to settle the case for a payment from the Company to USEI in return for a fully-paid-up license to the patents in suit, their foreign counterparts, and any other patents that USEI currently holds. The settlement did not have a material financial impact to the Company.
ReefEdge Networks, LLC v. NETGEAR, Inc.
On September 17, 2012, the Company was sued by ReefEdge Networks, LLC, a non-practicing entity. The Company received an extension from the plaintiff until November 8, 2012 to answer the complaint and answered the complaint on that date.
The complaint alleges that NETGEAR infringes
three
related patents: 6,633,761 B1; 6,975,864 B2; 7,197,308 B2. In general terms, these asserted patents involve seamlessly handing-off portable wireless devices from one access point to another so as to provide roaming within a wireless network.
The complaint specifically accuses the Company's ProSafe wireless controller of infringing these three patents. On August 15, 2012, ReefEdge filed complaints in Delaware against Aruba Networks Inc., Cisco Systems Inc., Meru Networks Inc., and Ruckus Wireless Inc. alleging infringement of the same three patents. In the second tranche of lawsuits, ReefEdge sued--in addition to the Company-Brocade Communications Systems, Inc., Extreme Networks Inc., ADTRAN, Inc., Alcatel-Lucent Inc., D-Link Systems, Inc., Enterasys Networks, Inc., Motorola Solutions Inc., CDW Corporation, Avaya Inc., and ZyXEL Communications Corporation. The Company has hired defense counsel and is evaluating ReefEdge's allegations. During the third quarter of 2013, the Company submitted its initial disclosures to ReefEdge and also produced its core technical documents to ReefEdge. Discovery is ongoing. It is too early to reasonably estimate any financial impact to the Company because of this litigation matter.
91
Pragmatus Telecom, LLC v. NETGEAR, Inc.
On December 6, 2012, Pragmatus Telecom, LLC (“Pragmatus”), filed a lawsuit against the Company asserting that the Company's use of a system “to provide live chat service over the Internet” infringes U.S. Patent Nos. 6,311,231, 6,668,286, and 7,159,043 ("'231 patent", "'286 patent", and "'043 patent", respectively).
The '231 patent is entitled "Method and System for Coordinating Data and Voice Communications via Customer Contact,” the '286 patent is entitled "Method and System for Coordinating Data and Voice Communications via Customer Contact Channel Changing System Over IP," and the '043 patent is entitled "Method and System for Coordinating Data and Voice Communications via Contact Channel Changing System," The patents very generally allegedly relate to “live chat" services of companies, which can give customers the ability to exchange text messages with a virtual or real customer support person. It appears that most companies named in the various lawsuits by Pragmatus license the “live chat” technology and software from a third-party supplier. A few of these third-party suppliers have been named in some of the over
100
lawsuits filed by Pragmatus in California, Delaware, and the Eastern District of Texas, and
two
third-party suppliers of text-chat (LivePerson and LogMeIn) have filed declaratory judgment actions on the patents in suit in Delaware. There is a pending reexamination on
one
of the three asserted patents.
Pragmatus and the Company agreed to extend the deadline for the Company to answer or otherwise respond to Pragmatus's complaint until February 11, 2013. The Company answered the complaint on that day by denying Pragmatus's infringement allegations and requesting a declaratory judgment by the Court that the patents in suit are not infringed and invalid. On February 20, 2013, the Company filed a motion to stay the case, and, on March 6, 2013, Pragmatus filed its opposition to the Company's motion to stay the case. The Company filed its reply on March 13, 2013. On May 14, 2013, the Court granted the Company's motion to stay “pending final exhaustion of all pending reexamination proceedings.” On June 22, 2013, both the '231 and '286 patents, which were the two asserted patents against the Company that were put into reexam by the defendants in a parallel Delaware action and the basis of the stay in the Pragmatus' case against the Company, emerged from reexam. In addition, the Delaware court lifted the stay in the Pragmatus cases pending in Delaware. The parties submitted a status report to the Court in January of 2014 indicating that: (1) the ‘231 Patent emerged from reexamination with all claims confirmed, and all rights of appeal have been exhausted; (2) the request for reexamination of the ‘043 Patent was denied; and (3) all claims of the ’286 patent were confirmed during reexamination, but the reexamination requestor appealed the examiner’s decision and the matter is now on appeal. The parties have asked the Court to lift the stay of the case and set a case management conference and an early neutral evaluation.
It is too early to reasonably estimate any financial impact to the Company because of this litigation matter.
Freeny v. NETGEAR, Inc.
On April 29, 2013, the Company and several other companies, including Apple, ASUSTek, Belkin, Buffalo, D-Link, IC Intracom, Ruckus, TP-Link, Vizio, and Western Digital, were sued in separate actions in the Eastern District of Texas by Charles C. Freeny III, Bryan E. Freeny, and James P. Freeny. The complaint alleges that dual-band wireless routers infringe U.S. Patent No. 7,110,744. The patent lists Charles Freeny as the inventor. Mr. Freeny's sons, Charles III and Bryan, now own the '744 patent, as Mr. Freeny is deceased. On June 21, 2013, the Company's answer and counterclaims were timely filed with the Court. The initial status conference was held on August 8, 2013. At the status conference, the Markman hearing was scheduled for August 7, 2014, and the trial date was set for April 6, 2015.
On August 2, 2013, Freeny produced its initial infringement contentions to the Company. The Company’s initial disclosures were given to Freeny on September 23, 2013, and, on October 10, 2013, the Company produced initial technical documents, as required by the Court’s local rules. Discovery is ongoing.
It is too early to reasonably estimate any financial impact to the Company because of this litigation matter.
Concinnitas v. NETGEAR, Inc.
On May 2, 2013, the Company was added to an existing case against Sierra Wireless America, Inc. and Sierra Wireless S.A. that was brought by Concinnitas, LLC and George W. Hindman in the Eastern District of Texas. The accused products will be the Company's Aircard products that it acquired from Sierra Wireless. On July 20, 2013, the Company's answer and counterclaims were timely filed with the Court. The Court set an initial scheduling conference for September 5, 2013, and at that conference the Court consolidated Concinnitas’s case against the Company with Concinnitas’s case against Samsung for discovery and claims construction purposes. Based on the date of the scheduling conference, Concinnitas’s infringement contentions were submitted on August 30, 2013, and the Company’s invalidity contentions and technical document production were submitted on October 17,
92
2013. On December 19, 2013, the Company and Concinnitas settled the lawsuit for a payment from the Company to Concinnitas. The settlement grants the Company a license to the patent in suit - US Patent 7,805,542 “Mobile Unit Attached in a Mobile Environment That Fully Restricts Access to Data Received Via Wireless Signal to a Separate Computer in the Mobile Environment” and two related patents - US Patent 6,324,592 “Apparatus and Method For a Mobile Computer Architecture and Input/Output Management Systems” and US Patent 7,165,123 “Apparatus and Method for I/O Management in a Mobile Environment Wherein Access to Data From a Wireless Signal is Restricted Based on a Persistent Unique Hardware Identification.” The settlement payment has been made, and did not have a material financial impact to the Company.
NETGEAR, Inc. v. ASUS
On July 22, 2013, the Company filed a complaint against ASUSTEK COMPUTER, INC. and ASUS COMPUTER INTERNATIONAL, INC. (collectively “ASUS”) seeking permanent injunctive relief, damages and declaratory relief for false advertising in violation of the Lanham Act, damages for tortious interference with the Company's prospective business relations, injunctive relief for unfair competition in violation of California Business and Professions Code, injunctive relief for false advertising pursuant to California Business and Professions Code, damages and injunctive relief pursuant the Sherman Antitrust Act, and various forms of declaratory relief.
The Company has asserted that contrary to ASUS's representations to the Federal Communications Commission (“FCC”), ASUS's wireless routers, including without limitation models RT-N65U and RT-AC66U, produce power outputs far in excess of those represented to the FCC, produce power outputs that exceed FCC maximum output levels, unlawfully cause interference with adjacent bandwidths (potentially including critically important navigation, communications, and safety devices), and operate in a manner that has never been accurately reported to the FCC. The Company contends that ASUS's representations that its RT-N65U and RT-AC66U wireless routers are FCC compliant are false, and are made with the intent to deceive potential consumers. The Company further contends that ASUS's misrepresentations regarding compliance of its wireless routers with the FCC regulations constitute unfair competition and false advertising, tortuously interfere with the Company's prospective business advantage, and have harmed the Company because the Company has lost expected sales due to such wrongful conduct and misrepresentations by ASUS.
After a series of extensions to answer the complaint granted by the Company to Asus, on September 3, 2013, Asus filed a motion to dismiss the complaint. Asus’s motion was generally based on the following arguments: a) the Company’s claims are preempted by FCC regulations; b) the Company is improperly seeking a private cause of action for violation of FCC regulations that create no such cause of action; c) the Company’s claims should be stayed or dismissed in deference to the primary jurisdiction of the FCC; and d) the Company fails to allege with sufficient specificity the nature of defendants' wrongful conduct nor how that conduct caused injury to the Company.
On October 7, 2013, the Company responded to Asus’s motion to dismiss by arguing that: a) the defendants violated unambiguous FCC regulations, thus, the Company's claims are in harmony, not conflict, with the FCC's regulatory goals; b) the Company’s damages arise not from defendants' private, regulatory dealings with the FCC, but rather from Asus’s conduct in the marketplace -- a realm regulated not by the FCC but by the courts; c) the Court should be allowed to adjudicate garden variety claims of false advertising, unfair competition, and deceptive trade practices that in no way implicate complex regulatory interpretations or policy judgments; and d) the complaint pleads facts in exacting detail.
On December 12, 2013, the Court refused to dismiss the Company’s antitrust and false advertising suit against Asus by denying Asus’s motion, thereby indicating that proceeding with the case would not violate the FCC’s authority. Discovery in this case has commenced.
Spansion LLC v. NETGEAR, Inc.
On August 1, 2013, Spansion LLC (“Spansion”) filed a section 337 complaint with the U.S. International Trade Commission (“ITC”) naming: the Company; Belkin International, Inc. (“Belkin”); ASUSTek Computer Inc. and Asus Computer International (collectively, “Asus”); D-Link Corporation and D-Link System, Inc. (collectively, “D-Link”); Nintendo Co., Ltd. and Nintendo of America, Inc. (collectively, “Nintendo”); and Macronix America, Inc., Macronix Asia Limited, and Macronix (Hong Kong) Co., Ltd. (collectively “Macronix”), as proposed respondents. The Complaint is styled Certain Flash Memory Chips and Products Containing the Same. Spansion is seeking a general exclusion order, or in the alternative a limited exclusion order, as well as a cease and desist order.
93
Spansion has asserted six patents related to the manufacture, structure, and operation of flash memory cells, as well as security protection systems for flash memory devices:
|
•
|
US Patent No. 6,369,416 “Semiconductor Device with Contacts Having a Sloped Profile
|
|
•
|
US Patent No. 6,459,625 “Three Metal Process for Optimizing Layout Density”
|
|
•
|
US Patent No. 6,731,536 “Password and Dynamic Protection of Flash Memory Data”
|
|
•
|
US Patent No. 6,900,124 “Patterning for Elliptical Vss Contact on Flash Memory
|
|
•
|
US Patent No. 7,018,922 “Patterning for Elongated Vss Contact on Flash Memory
|
|
•
|
US Patent No. 7,151,027 “Method and Device for Reducing Interface Area of a Memory Device”
|
Four of the asserted patents, the '416, '625, '124, and '922 patents, were previously asserted by Spansion in the 337-TA-735 Investigation against Samsung, Apple, Nokia, PNY, RIM, and Transcend. ITC records indicate the 735 Investigation terminated based on settlement agreements prior to the hearing on the merits.
The accused products are identified as flash memory chips manufactured and sold by Macronix, as well as downstream products which contain the accused Macronix flash memory chips. The Complaint specifically identifies the Company WNR1000 wireless router, as an exemplary accused product, but makes clear that Spansion intends to expand the scope of accused products to include additional products, if any, which contain the accused Macronix flash memory chips.
In addition, on August 1, 2013, Spansion filed a parallel similar complaint against the same parties in the Northern District of California. Discovery in the ITC case has commenced and is ongoing, and the Northern District of California case has been stayed pending the outcome of the ITC case.
It is too early to reasonably estimate any financial impact to the Company because of this litigation matter.
Garnet Digital v. NETGEAR, Inc.
On September 9, 2013, the Company was sued in the Eastern District of Texas by a non-practicing entity named Garnet Digital (“Garnet”) that is based in Texas. There is one asserted patent, U.S. Pat. No. 5,379,421, which is directed to an interactive terminal for the access of remote database information. Garnet is alleging infringement by the Company by its products or systems, such as the NTV200, that are responsive to output signals from a telephone.
The patent has previously been litigated against Apple, Samsung, RIM, and a number of other wireless companies in Eastern Texas and the ITC. Garnet’s lawsuit against the Company is one of multiple cases filed by Garnet in the Eastern District of Texas Other defendants sued by Garnet in the Eastern District of Texas include: Boxee, D-Link Systems, Logitech, Roku, TiVo, DirecTV, DISH Network, Verizon, AT&T, Comcast, Panasonic, Western Digital, Pioneer, Yamaha, Denon, D&M Holdings, Marantz, and Onkyo. The Company answered the complaint on December 9, 2013 by asserting various affirmative defenses. In February of 2014, the court consolidated the Company’s case with the other pending Garnet Digital cases in the Eastern District of Texas, but the Court has not yet set a scheduling conference.
It is too early to reasonably estimate any financial impact to the Company because of this litigation matter.
Penovia LLC v. NETGEAR, Inc.
On September 27, 2013, a non-practicing entity named Penovia LLC (“Penovia”) filed suit against the Company in the Eastern District of Texas. Penovia asserts the Company’s wireless routers infringe U.S. Patent No. 5,822,221 (the “’221 patent”), entitled “Office Machine Monitoring Device.” Penovia’s complaint specifically names the DGN2000 Wireless-N product as an example of an infringing product. Penovia admits in the complaint that the ’221 patent expired on October 13, 2010, due to a lapse in maintenance fee payments. Consequently, Penovia seeks damages for an approximately
three
year period of time starting six years before the filing date of the complaint, September 27, 2007, and ending on October 13, 2010. Penovia has asserted the ’221 patent in
22
cases, all in the Eastern District of Texas. Penovia filed
nine
cases on May 21, 2013, and filed the remainder on September 27, 2013. The Company filed its answer on November 26, 2014 - asserting various affirmative defenses. On December 23, 2013 received Penovia’s infringement contentions.
It is too early to reasonably estimate any financial impact to the Company because of this litigation matter.
94
Innovative Wireless Solutions LLC v. NETGEAR, Inc.
In November of 2013, Innovative Wireless Solutions filed a new wave of suits targeting
14
wireless router and networking companies, Adtran, Arris, Aruba Networks, Belkin, Buffalo Technology, Engenius Technologies, Fortinet, IC Intracom, Motorola Solutions, SMC Networks, Ubiquiti Networks, Western Digital, and Zoom Telephonics. Previously, in April of 2013, Innovative Wireless had filed 41 suits targeting hotels and restaurant chains over wireless Internet services. The Company was sued on November 6, 2013 in the District of Delaware.
The three patents-in-suit (5,912,895 entitled “Information network access apparatus and methods for communicating information packets via telephone lines” ( the “‘895 Patent”); 6,327,264 entitled “Information network access apparatus and methods for communicating information packets via telephone lines” ( the “’264 Patent”); and 6,587,473 entitled “Information network access apparatus and methods for communicating information packets via telephone lines” ( the “‘473 Patent”) originally were part of a portfolio of Nortel Networks’ patents before they reached Innovative Wireless in March 2013.
The Company filed its answer on January 13, 2014, asserting various affirmative defenses. It is too early to reasonably estimate any financial impact to the Company because of this litigation matter.
IP Indemnification Claims
In its sales agreements, the Company typically agrees to indemnify its direct customers, distributors and resellers (the “Indemnified Parties”) for any expenses or liability resulting from claimed infringements by the Company's products of patents, trademarks or copyrights of third parties that are asserted against the Indemnified Parties, subject to customary carve outs. The terms of these indemnification agreements are generally perpetual after execution of the agreement. The maximum amount of potential future indemnification is generally unlimited. From time to time, the Company receives requests for indemnity and may choose to assume the defense of such litigation asserted against the Indemnified Parties.
Environmental Regulation
The European Union (“EU”) enacted the Waste Electrical and Electronic Equipment Directive, which makes producers of electrical goods, including home and commercial business networking products, financially responsible for specified collection, recycling, treatment and disposal of past and future covered products. The deadline for the individual member states of the EU to transpose the directive into law in their respective countries was August 13, 2004 (such legislation, together with the directive, the “WEEE Legislation”). Producers participating in the market were financially responsible for implementing these responsibilities under the WEEE Legislation beginning in August 13, 2005. The Company adopted the authoritative guidance for asset retirement and environmental obligations in the third quarter of fiscal 2005 and has determined that its effect did not have a material impact on the Company's consolidated results of operations and financial position for years ended December 31, 2013 and 2012. The WEEE Directive was recast on July 24, 2012, published on August 13, 2012, and was implemented by all member states on February 14, 2014. The Company expects no material impact on its consolidated results of operations and financial positions due to this recasting. Similar WEEE Legislation has been or may be enacted in other jurisdictions, including in the United States, Canada, Mexico, China, India, Australia and Japan. The Company continues to monitor WEEE Legislation and similar legislation in other jurisdictions as individual countries issue their implementation guidance. The Company believes it has met the applicable requirements of current WEEE Legislation and similar legislation in other jurisdictions, to the extent implementation requirements has been published.
Additionally, the EU enacted the Restriction of Hazardous Substances Directive (“RoHS Legislation”), the REACH Regulation, Packaging Directive and the Battery Directive. EU RoHS Legislation, along with similar legislation in China, requires manufacturers to ensure certain substances, including polybrominated biphenyls (“PBD”), polybrominated diphenyl ethers (“PBDE”), mercury, cadmium, hexavalent chromium and lead (except for allowed exempted materials and applications), are below specified maximum concentration values in certain products put on the market after July 1, 2006. The RoHS Directive was recast on July 21, 2011 and went into force on January 3, 2013. This did not have a material impact on the Company's consolidated results of operations and financial position. The REACH Regulation requires manufacturers to ensure the published lists of substances of very high concern in certain products are below specified maximum concentration values. The Battery Directive controls use of certain types of battery technology in certain products and requires mandatory marking. The Company believes it has met the requirements of the RoHS Directive Legislation, the REACH Regulation and the Battery Directive Legislation.
Additionally, the EU enacted the Energy Using Product (“EuP”) Directive, which came into force in August 2007. The EuP Directive required manufacturers of certain products to meet minimum energy efficiency performance requirements. These
95
requirements were documented in EuP implementing measures issued for specific product categories. The implementing measures affecting the Company's products are minimum power supply efficiencies and may include required equipment standby modes, which also reduce energy consumption. The EuP Directive was repealed in November 2009 and replaced by the Energy Related Products ("ErP") Directive, which includes the same implementing measures of the former EuP Directive and new implementing measures applicable to the Company's products. The Company is in compliance with applicable implementing measures of the ErP Directives since it came into force.
Additionally, in 2010, the U. S. Congress passed the Dodd-Frank Wall Street Reform and Consumer Protection Act. Pursuant to Section 1502 of the Dodd-Frank Act, in August 2012, the U.S. Securities and Exchange Commission adopted Rule 13p-1 under the Securities Exchange Act of 1934, as amended. Rule 13p-1 is commonly known as the “Conflict Minerals Rule.” This rule is intended to address human rights violations arising from the forced labor, child labor, rape, murder and other hostilities related to mining operations in Africa, namely in the eastern Democratic Republic of the Congo (“DRC”) and nearby regions. This rule requires public companies to make disclosures regarding whether specified minerals in company products are sourced from the DRC or its surrounding countries (covered countries) in an effort to encourage companies to obtain these minerals from sources that do not directly or indirectly finance or benefit armed groups operating in these countries. The specified minerals, referred to as conflict minerals, are Tin, Tungsten, Tantalum and Gold, which are necessary in the manufacture of electronics components and equipment. Publicly traded companies, such as the Company, will be required to disclose certain information concerning the origin of conflict minerals contained in their products. In addition, the Organization for Economic Co-operation and Development (“OECD”) has published Due Diligence Guidance for Responsible Supply Chains of Minerals from Conflict-Affected and High-Risk Areas. The Company intends to utilize this internationally recognized OECD framework to conduct any required due diligence under the Conflict Minerals Rule. The Company is currently in the process of assessing compliance and does not believe there will be any material financial or business impact on the Company as a result.
Common Stock Repurchase Programs
In October 21, 2008, the Company’s Board of Directors authorized management to repurchase up to
6.0 million
shares of the Company’s outstanding common stock. Under this authorization, the timing and actual number of shares subject to repurchase are at the discretion of management and are contingent on a number of factors, such as levels of cash generation from operations, cash requirements for acquisitions and the price of the Company’s common stock. The Company repurchased
2.0 million
shares or
$63.1 million
of common stock under this authorization during the year ended
December 31, 2013
. The Company did not repurchase any shares under this authorization during the years ended
December 31, 2012
and
2011
.
The Company repurchased approximately
14,000
shares, or
$0.5 million
of common stock under a repurchase program to help administratively facilitate the withholding and subsequent remittance of personal income and payroll taxes for individuals receiving RSUs during the year ended
December 31, 2013
. Similarly, during the years ended
December 31, 2012
and
December 31, 2011
, the Company repurchased approximately
22,000
shares and
25,000
shares, respectively, or
$0.9 million
and
$0.9 million
of common stock, respectively, under the same program to help facilitate tax withholding for RSUs.
These shares were retired upon repurchase. The Company’s policy related to repurchases of its common stock is to charge the excess of cost over par value to retained earnings. All repurchases were made in compliance with Rule 10b-18 under the Securities Exchange Act of 1934, as amended.
96
Cumulative Other Comprehensive Income, Net
The following table sets forth the changes in accumulated other comprehensive income by component, net of tax, during the years ended
December 31, 2013
and
2012
(in thousands):
|
Gains and losses on available for sale securities
|
Gains and losses on derivatives
|
Total
|
|||||||||
|
Beginning balance as of December 31, 2011
|
$
|
17
|
|
$
|
6
|
|
$
|
23
|
|
||
|
Other comprehensive (loss) income before reclassifications
|
11
|
|
164
|
|
175
|
|
|||||
|
Amounts reclassified from accumulated other comprehensive loss
|
—
|
|
(194
|
)
|
(194
|
)
|
|||||
|
Net current period other comprehensive (loss) income
|
11
|
|
(30
|
)
|
(19
|
)
|
|||||
|
Beginning balance as of December 31, 2012
|
$
|
28
|
|
$
|
(24
|
)
|
$
|
4
|
|
||
|
Other comprehensive (loss) income before reclassifications
|
(24
|
)
|
775
|
|
751
|
|
|||||
|
Amounts reclassified from accumulated other comprehensive loss
|
—
|
|
(686
|
)
|
(686
|
)
|
|||||
|
Net current period other comprehensive (loss) income
|
(24
|
)
|
89
|
|
65
|
|
|||||
|
Ending balance as of December 31, 2013
|
$
|
4
|
|
$
|
65
|
|
$
|
69
|
|
||
The following tables provide details about significant amounts reclassified out of each component of accumulated other comprehensive income for the years ended
December 31, 2013
and
2012
(in thousands):
|
Details about Accumulated Other Comprehensive Income Components
|
Year Ended December 31, 2013
|
Year Ended December 31, 2012
|
||||||||||
|
Amount Reclassified from AOCI
|
Affected Line Item in the Statement of Operations
|
Amount Reclassified from AOCI
|
Affected Line Item in the Statement of Operations
|
|||||||||
|
Gains and losses on cash flow hedge:
|
||||||||||||
|
Foreign currency forward contracts
|
$
|
844
|
|
Net revenue
|
$
|
262
|
|
Net revenue
|
||||
|
Foreign currency forward contracts
|
(9
|
)
|
Cost of revenue
|
(1
|
)
|
Cost of revenue
|
||||||
|
Foreign currency forward contracts
|
(149
|
)
|
Operating expenses
|
(67
|
)
|
Operating expenses
|
||||||
|
686
|
|
Total before tax
|
194
|
|
Total before tax
|
|||||||
|
—
|
|
Tax expense (1)
|
—
|
|
Tax expense (1)
|
|||||||
|
$
|
686
|
|
Total, net of tax
|
$
|
194
|
|
Total, net of tax
|
|||||
|
(1)
|
Under our tax structure all hedging gains and losses from derivative contracts are ultimately borne by a legal entity in a jurisdiction with no income tax.
|
2000 Stock Option Plan
In April 2000, the Company adopted the 2000 Stock Option Plan (the “2000 Plan”). The 2000 Plan provides for the granting of stock options to employees and consultants of the Company. Options granted under the 2000 Plan may be either incentive stock options (“ISOs”) or nonqualified stock options (“NSOs”). ISOs may be granted only to Company employees (including officers and directors who are also employees). NSOs may be granted to Company employees, directors and consultants. A total of
7,350,000
shares of Common Stock have been reserved for issuance under the 2000 Plan.
Options under the 2000 Plan may be granted for periods of up to
ten years
, provided, however, that (i) the exercise price of an ISO and NSO shall not be less than the estimated fair value of the underlying stock on the date of grant and (ii) the exercise price of an ISO and NSO granted to a 10% shareholder shall not be less than
110%
of the estimated fair value of the underlying stock on the date of grant. To date, options granted generally vest over
four years
.
As discussed below, in April 2003, all remaining shares reserved but not issued under the 2000 Plan were transferred to the 2003 Stock Plan.
2003 Stock Plan
97
In April 2003, the Company adopted the 2003 Stock Plan (the “2003 Plan”). The 2003 Plan provides for the granting of stock options to employees and consultants of the Company. Options granted under the 2003 Plan may be either ISOs or NSOs. ISOs may be granted only to Company employees (including officers and directors who are also employees). NSOs may be granted to Company employees, directors and consultants. The Company has reserved
750,000
shares of Common Stock plus any shares which were reserved but not issued under the 2000 Plan as of the date of the approval of the 2003 Plan. The number of shares which were reserved but not issued under the 2000 Plan that were transferred to the Company’s 2003 Plan were
615,290
, which when combined with the shares reserved for the Company’s 2003 Plan total
1,365,290
shares reserved under the Company’s 2003 Plan as of the date of transfer. Any options cancelled under either the 2000 Plan or the 2003 Plan are returned to the pool available for grant. During the second quarter of 2013, the Company's 2003 Stock Plan expired and the remaining unissued
62,791
reserved shares were retired accordingly.
Options under the 2003 Plan may be granted for periods of up to
ten years
, provided, however, that (i) the exercise price of an ISO and NSO shall not be less than the estimated fair value of the underlying stock on the date of grant and (ii) the exercise price of an ISO and NSO granted to a 10% shareholder shall not be less than
110%
of the estimated fair value of the underlying stock on the date of grant. To date, options granted generally vest over
four years
, with the first tranche vesting at the end of
12 months
and the remaining shares underlying the option vesting monthly over the remaining
three years
. In fiscal 2005, certain options granted under the 2003 Plan immediately vested and were exercisable on the date of grant, and the shares underlying such options were subject to a resale restriction which expires at a rate of
25%
per year.
2006 Long Term Incentive Plan
In April 2006, the Company adopted the 2006 Long Term Incentive Plan (the “2006 Plan”), which was approved by the Company’s stockholders at the 2006 Annual Meeting of Stockholders on May 23, 2006. The 2006 Plan provides for the granting of stock options, stock appreciation rights, restricted stock, performance awards and other stock awards, to eligible directors, employees and consultants of the Company. Upon the adoption of the 2006 Plan, the Company reserved
2,500,000
shares of common stock for issuance under the 2006 Plan. In June 2008, the Company adopted amendments to the 2006 Plan which increased the number of shares of the Company’s common stock that may be issued under the 2006 plan by an additional
2,500,000
shares. In July 2010, the Company adopted amendments to the 2006 Plan which increased the number of shares of the Company’s common stock that may be issued under the 2006 plan by an additional
1,500,000
shares. In June 2012, the Company adopted amendments to the 2006 Plan which increased the number of shares of the Company’s common stock that may be issued under the 2006 plan by an additional
3,000,000
shares. In addition, RSUs granted under the 2006 Plan on or after June 6, 2012 are counted against shares authorized under the plan as
1.58
shares of common stock for each share subject to such award. As of
December 31, 2013
,
1,366,297
shares were reserved for future grants under the 2006 Plan.
Options granted under the 2006 Plan may be either ISOs or NSOs. ISOs may be granted only to Company employees (including officers and directors who are also employees). NSOs may be granted to Company employees, directors and consultants. Options may be granted for periods of up to ten years, provided, however, that (i) the exercise price of an ISO and NSO shall not be less than the estimated fair value of the underlying stock on the date of grant and (ii) the exercise price of an ISO and NSO granted to a 10% shareholder shall not be less than
110%
of the estimated fair value of the underlying stock on the date of grant. Options granted under the 2006 Plan generally vest over
four years
, with the first tranche vesting at the end of
12 months
and the remaining shares underlying the option vesting monthly over the remaining
three years
.
Stock appreciation rights may be granted under the 2006 Plan subject to the terms specified by the plan administrator, provided that the term of any such right may not exceed
ten
(10) years from the date of grant. The exercise price generally cannot be less than the fair market value of the Company’s common stock on the date the stock appreciation right is granted.
Restricted stock awards may be granted under the 2006 Plan subject to the terms specified by the plan administrator. The period over which any restricted award may fully vest is generally no less than
three
(3) years. Restricted stock awards are non-vested stock awards that may include grants of restricted stock or grants of restricted stock units (“RSUs”). Restricted stock awards are independent of option grants and are generally subject to forfeiture if employment terminates prior to the release of the restrictions. During that period, ownership of the shares cannot be transferred. Restricted stock has the same voting rights as other common stock and is considered to be currently issued and outstanding. RSUs do not have the voting rights of common stock, and the shares underlying the RSUs are not considered issued and outstanding. The Company expenses the cost of the restricted stock awards, which is determined to be the fair market value of the shares at the date of grant, ratably over the period during which the restrictions lapse.
98
Performance awards may be in the form of performance shares or performance units. A performance share means an award denominated in shares of Company common stock and a performance unit means an award denominated in units having a dollar value or other currency, as determined by the plan administrator. The plan administrator will determine the number of performance awards that will be granted and will establish the performance goals and other conditions for payment of such performance awards. The period of measuring the achievement of performance goals will be a minimum of
twelve
(12) months.
Other stock-based awards may be granted under the 2006 Plan subject to the terms specified by the plan administrator. Other stock-based awards may include dividend equivalents, restricted stock awards, or amounts which are equivalent to all or a portion of any federal, state, local, domestic or foreign taxes relating to an award, and may be payable in shares, cash, other securities or any other form of property as the plan administrator may determine.
In the event of a change in control of the Company, all awards under the 2006 Plan vest in full and all outstanding performance shares and performance units will be paid out upon transfer.
Any shares of common stock subject to an award that is forfeited, settled in cash, expires or is otherwise settled without the issuance of shares shall again be available for awards under the 2006 Plan. Additionally, any shares that are tendered by a participant of the 2006 Plan or retained by the Company as full or partial payment to the Company for the purchase of an award or to satisfy tax withholding obligations in connection with an award shall no longer again be made available for issuance under the 2006 Plan.
Employee Stock Purchase Plan
The Company sponsors an Employee Stock Purchase Plan (the “ESPP”), pursuant to which eligible employees may contribute up to
10%
of compensation, subject to certain income limits, to purchase shares of the Company’s common stock. Employees may purchase stock semi-annually at a price equal to
85%
of the fair market value on the purchase date. Since the price of the shares is determined at the purchase date, the Company recognizes expense based on the
15%
discount at purchase. For the years ended
December 31, 2013
,
2012
, and
2011
, ESPP compensation expense was
$420,000
,
$371,000
and
$354,000
, respectively. As of
December 31, 2013
,
307,500
shares were reserved for future grants under the ESPP.
Option Activity
Stock options activity under the stock option plans during the year ended
December 31, 2013
was as follows:
|
Outstanding Options
|
||||||||||||
|
Number of
Shares
|
Weighted Average
Exercise Price Per
Share
|
Weighted
Average
Remaining
Contractual
Term
|
Aggregate
Intrinsic
Value
|
|||||||||
|
(In thousands)
|
(In dollars)
|
(In years)
|
(In thousands)
|
|||||||||
|
December 31, 2012
|
4,324
|
|
$
|
29.29
|
|
|||||||
|
Granted
|
503
|
|
33.45
|
|
||||||||
|
Exercised
|
(352
|
)
|
21.28
|
|
||||||||
|
Cancelled
|
(249
|
)
|
34.27
|
|
||||||||
|
Expired
|
(61
|
)
|
33.78
|
|
||||||||
|
December 31, 2013
|
4,165
|
|
$
|
30.11
|
|
6.5
|
$
|
16,376
|
|
|||
|
As of December 31, 2013:
|
||||||||||||
|
Vested and expected to vest
|
4,008
|
|
$
|
29.98
|
|
6.4
|
$
|
16,282
|
|
|||
|
Exercisable Options
|
2,695
|
|
$
|
28.29
|
|
5.5
|
$
|
15,245
|
|
|||
The aggregate intrinsic values in the table above represent the total pre-tax intrinsic values (the difference between the Company’s closing stock price on the last trading day of
2013
and the exercise price, multiplied by the number of shares underlying the in-the-money options) that would have been received by the option holders had all option holders exercised their options on
99
December 31,
2013
. This amount changes based on the fair market value of the Company’s stock. Total intrinsic value of options exercised for the year ended
December 31, 2013
,
2012
, and
2011
was
$4.2 million
,
$8.1 million
and
$21.8 million
, respectively.
The total fair value of options vested during the years ended
December 31, 2013
,
2012
, and
2011
was
$13.0 million
,
$11.1 million
and
$9.8 million
, respectively.
The following table summarizes significant ranges of outstanding and exercisable stock options as of
December 31, 2013
:
|
Options Outstanding
|
Options Exercisable
|
||||||||||||||
|
Range of Exercise Prices
|
Shares
Outstanding
|
Weighted-
Average
Remaining
Contractual
Life
|
Weighted-
Average
Exercise
Price Per
Share
|
Shares
Exercisable
|
Weighted-
Average
Exercise
Price Per
Share
|
||||||||||
|
(In thousands)
|
(In years)
|
(In dollars)
|
(In thousands)
|
(In dollars)
|
|||||||||||
|
$ 9.26 - $22.68
|
903
|
|
4.73
|
$
|
18.27
|
|
873
|
|
$
|
18.18
|
|
||||
|
$23.25 - $31.31
|
849
|
|
5.73
|
29.58
|
|
617
|
|
29.23
|
|
||||||
|
$31.59 - $33.83
|
1,203
|
|
8.23
|
33.12
|
|
423
|
|
33.25
|
|
||||||
|
$33.92 - $38.01
|
959
|
|
6.72
|
35.56
|
|
629
|
|
35.39
|
|
||||||
|
$38.16 - $40.01
|
251
|
|
6.40
|
39.25
|
|
153
|
|
39.25
|
|
||||||
|
$9.26 - $40.01
|
4,165
|
|
6.50
|
$
|
30.11
|
|
2,695
|
|
$
|
28.29
|
|
||||
RSU Activity
RSU activity under during the year ended
December 31, 2013
was as follows:
|
Outstanding RSUs
|
||||||||||||
|
Number of
Shares
|
Weighted Average
Grant Date Fair Value Per
Share
|
Weighted
Average
Remaining
Contractual
Term
|
Aggregate
Intrinsic Value |
|||||||||
|
(In thousands)
|
(In dollars)
|
(In years)
|
(In thousands)
|
|||||||||
|
December 31, 2012
|
112
|
|
$
|
28.36
|
|
|||||||
|
RSUs granted
|
744
|
|
29.20
|
|
||||||||
|
RSUs vested
|
(85
|
)
|
34.04
|
|
||||||||
|
RSUs cancelled
|
(40
|
)
|
28.19
|
|
||||||||
|
December 31, 2013
|
731
|
|
$
|
29.40
|
|
1.61
|
$
|
24,072
|
|
|||
Total intrinsic value of RSUs, or the release date fair value of RSUs, vested during the years ended
December 31, 2013
,
2012
and
2011
was
$2.9 million
,
$3.7 million
and
$4.4 million
, respectively. The total fair value or RSUs, or the grant date fair value of RSUs, vested during the years ended
December 31, 2013
,
2012
and
2011
was
$2.3 million
,
$3.0 million
and
$2.6 million
, respectively.
Valuation and Expense Information
The Company measures stock-based compensation at the grant date based on the fair value of the award. Estimated compensation cost relating to restricted stock units (“RSUs”) is based on the closing fair market value of the Company’s common stock on the date of grant. The fair value of Employee Stock Purchase Plan (“ESPP”) is based on the 15% discount at purchase, since the price of the shares is determined at the purchase date. The fair value of each option award is estimated on the date of grant using a Black-Scholes-Merton option valuation model that uses the assumptions noted in the following table. The estimated expected term of options granted is derived from historical data on employee exercise and post-vesting employment termination behavior. The risk free interest rate is based on the implied yield currently available on U.S. Treasury securities with a remaining
100
term commensurate with the estimated expected term. Expected volatility is based on historical volatility over the most recent period commensurate with the estimated expected term.
The following table sets forth the weighted-average assumptions used to fair value option grants during the years ended
December 31, 2013
,
2012
and
2011
based on its historical experience:
|
|
Year Ended December 31,
|
|||||||
|
|
2013
|
2012
|
2011
|
|||||
|
Expected life (in years)
|
4.4
|
|
4.4
|
|
4.4
|
|
||
|
Risk-free interest rate
|
0.72
|
%
|
0.64
|
%
|
1.63
|
%
|
||
|
Expected volatility
|
48.05
|
%
|
52.09
|
%
|
50.31
|
%
|
||
|
Dividend yield
|
—
|
|
—
|
|
—
|
|
||
The weighted average estimated fair value of options granted during the years ended
December 31, 2013
,
2012
and
2011
was
$13.29
,
$13.99
and
$14.29
, respectively.
The following table sets forth the total stock-based compensation expense resulting from stock options, restricted stock awards, and the Employee Stock Purchase Plan included in the Company’s Consolidated Statements of Operations (in thousands):
|
Year Ended December 31,
|
|||||||||||
|
2013
|
2012
|
2011
|
|||||||||
|
Cost of revenue
|
$
|
1,577
|
|
$
|
1,347
|
|
$
|
999
|
|
||
|
Research and development
|
3,943
|
|
2,787
|
|
2,476
|
|
|||||
|
Sales and marketing
|
5,379
|
|
4,751
|
|
5,136
|
|
|||||
|
General and administrative
|
6,563
|
|
5,487
|
|
5,151
|
|
|||||
|
Total
|
$
|
17,462
|
|
$
|
14,372
|
|
$
|
13,762
|
|
||
The Company recognizes these compensation costs net of the estimated forfeitures on a straight-line basis over the requisite service period of the award, which is generally the option vesting term of
four years
.
Total stock-based compensation cost capitalized in inventory was less than
$0.5 million
in each of the years ended
December 31, 2013
,
2012
and
2011
.
As of
December 31, 2013
,
$16.7 million
of total unrecognized compensation cost related to stock options is expected to be recognized over a weighted-average period of
2.3 years
. As of
December 31, 2013
,
$14.0 million
of total unrecognized compensation cost related to non-vested RSUs is expected to be recognized over a weighted-average period of
3.0 years
.
401(k) Plan
In April 2000, the Company adopted the NETGEAR 401(k) Plan to which employees may contribute up to
100%
of salary subject to the legal maximum. In the first quarter of 2012, the Company began matching
50%
of contributions for employees that remain active with the company through the end of the fiscal year, up to a maximum of
$6,000
in employee contributions. During the years ended
December 31, 2013
and
2012
the Company recognized
$1.0 million
and
$0.7 million
, respectively, in expenses related to the 401(k) match. No match was offered in 2011 and thus
no
expenses were recorded related to matching employee contributions during that year.
Operating segments are components of an enterprise about which separate financial information is available and is regularly evaluated by management, namely the Chief Operating Decision Maker (“CODM”) of an organization, in order to determine operating and resource allocation decisions. By this definition, the Company operates in
three
specific business units: retail, commercial, and service provider. The retail business unit consists of high performance, dependable and easy-to-use home
101
networking, home video monitoring, storage and digital media products. The commercial business unit consists of business networking, storage and security solutions that bring enterprise class functionality down to the small and medium size business at an affordable price. The service provider business unit consists of made-to-order and retail proven, whole home networking hardware and software solutions as well as 4G LTE hotspots sold to service providers for sale to their subscribers. Each business unit is managed by a Senior Vice President/General Manager. The Company believes this structure enables it to better focus its efforts on the Company's core customer segments and allows it to be more nimble and opportunistic as a company overall.
The results of the reportable segments are derived directly from the Company's management reporting system. The results are based on the Company's method of internal reporting and are not necessarily in conformity with accounting principles generally accepted in the United States. Management measures the performance of each segment based on several metrics, including contribution income. Segment contribution income includes all product line segment revenues less the related cost of sales, research and development and sales and marketing costs. Contribution income is used, in part, to evaluate the performance of, and allocate resources to, each of the segments. Certain operating expenses are not allocated to segments because they are separately managed at the corporate level. These unallocated indirect costs include corporate costs, such as corporate research and development, general and administrative costs, stock-based compensation expenses, amortization of intangibles, acquisition-related integration costs, restructuring costs, litigation reserves and interest and other income (expense), net. The Company does not evaluate operating segments using discrete asset information.
Financial information for each reportable segment and a reconciliation of segment contribution income to income before income taxes is as follows (in thousands, except percentage
data):
|
|
Year Ended December 31,
|
||||||||||
|
|
2013
|
2012
|
2011
|
||||||||
|
Net revenues:
|
|||||||||||
|
Retail
|
$
|
509,924
|
|
$
|
504,797
|
|
$
|
481,795
|
|
||
|
Commercial
|
311,261
|
|
307,945
|
|
331,439
|
|
|||||
|
Service provider
|
548,448
|
|
459,179
|
|
367,784
|
|
|||||
|
Total net revenues
|
$
|
1,369,633
|
|
$
|
1,271,921
|
|
$
|
1,181,018
|
|
||
|
Contribution income:
|
|||||||||||
|
Retail
|
$
|
73,418
|
|
$
|
86,808
|
|
$
|
81,589
|
|
||
|
Retail contribution margin
|
14.4
|
%
|
17.2
|
%
|
16.9
|
%
|
|||||
|
Commercial
|
66,506
|
|
67,826
|
|
74,746
|
|
|||||
|
Commercial contribution margin
|
21.4
|
%
|
22.0
|
%
|
22.6
|
%
|
|||||
|
Service Provider
|
51,620
|
|
40,794
|
|
32,797
|
|
|||||
|
Service Provider contribution margin
|
9.4
|
%
|
8.9
|
%
|
8.9
|
%
|
|||||
|
Total segment contribution income
|
191,544
|
|
195,428
|
|
189,132
|
|
|||||
|
Corporate and unallocated costs
|
(51,629
|
)
|
(47,766
|
)
|
(43,301
|
)
|
|||||
|
Amortization of intangible assets (1)
|
(15,217
|
)
|
(4,763
|
)
|
(4,658
|
)
|
|||||
|
Stock-based compensation expense
|
(17,462
|
)
|
(14,372
|
)
|
(13,762
|
)
|
|||||
|
Restructuring and other charges
|
(5,335
|
)
|
(1,190
|
)
|
(2,094
|
)
|
|||||
|
Acquisition-related expense (2)
|
(940
|
)
|
(833
|
)
|
(40
|
)
|
|||||
|
Impact to cost of sales from acquisition accounting adjustments to inventory
|
(568
|
)
|
—
|
|
(609
|
)
|
|||||
|
Litigation reserves, net
|
(5,354
|
)
|
(390
|
)
|
201
|
|
|||||
|
Impairment of intangibles
|
(2,000
|
)
|
—
|
|
—
|
|
|||||
|
Interest income
|
400
|
|
498
|
|
477
|
|
|||||
|
Other income (expense), net
|
(457
|
)
|
2,670
|
|
(1,136
|
)
|
|||||
|
Income before income taxes
|
$
|
92,982
|
|
$
|
129,282
|
|
$
|
124,210
|
|
||
________________________________
|
(1)
|
Amount excludes amortization expense related to patents within purchased intangible assets in costs of revenues.
|
102
|
(2)
|
These acquisition-related charges were expensed in the period incurred and reported in the Company's consolidated statements of operations within cost of revenues and operating expense.
|
The Company conducts business across
three
geographic regions: Americas, Europe, Middle-East and Africa (“EMEA”) and Asia Pacific ("APAC'). Net revenue by geography comprises gross revenue less such items as end-user customer rebates and other sales incentives deemed to be a reduction of net revenue per the authoritative guidance for revenue recognition, sales returns and price protection. For reporting purposes revenue is attributed to each geographic region based on the location of the customer.
The following table shows net revenue by geography for the periods indicated (in thousands):
|
|
Year Ended December 31,
|
||||||||||
|
|
2013
|
2012
|
2011
|
||||||||
|
United States
|
$
|
769,357
|
|
$
|
660,998
|
|
$
|
570,143
|
|
||
|
Americas (excluding U.S.)
|
19,961
|
|
18,421
|
|
16,913
|
|
|||||
|
United Kingdom
|
142,729
|
|
184,404
|
|
165,522
|
|
|||||
|
EMEA (excluding U.K.)
|
269,959
|
|
273,320
|
|
312,191
|
|
|||||
|
APAC
|
167,627
|
|
134,778
|
|
116,249
|
|
|||||
|
Total net revenue
|
$
|
1,369,633
|
|
$
|
1,271,921
|
|
$
|
1,181,018
|
|
||
No single customer accounted for greater than 10% of net revenues in the years ended December 31, 2013 and 2012. For the year ended December 31, 2011, retailer, Best Buy Inc. and distributor, Ingram Micro, Inc. represented approximately
11%
and
10%
of net revenues respectively.
Property and equipment by geographic location are as follows (in thousands):
|
December 31,
2013 |
December 31,
2012 |
||||||
|
United States
|
$
|
10,273
|
|
$
|
9,898
|
|
|
|
Americas (excluding U.S.)
|
2,160
|
|
36
|
|
|||
|
EMEA
|
914
|
|
1,173
|
|
|||
|
China
|
11,905
|
|
6,763
|
|
|||
|
APAC (excluding China)
|
1,942
|
|
1,155
|
|
|||
|
$
|
27,194
|
|
$
|
19,025
|
|
||
The Company determines the fair values of its financial instruments based on a fair value hierarchy, which requires an entity to maximize the use of observable inputs and minimize the use of unobservable inputs when measuring fair value. The classification of a financial asset or liability within the hierarchy is based upon the lowest level input that is significant to the fair value measurement. The fair value hierarchy prioritizes the inputs into three levels that may be used to measure fair value:
Level 1: Unadjusted quoted prices in active markets that are accessible at the measurement date for identical, unrestricted assets or liabilities;
Level 2: Quoted prices in markets that are not active, or inputs which are observable, either directly or indirectly, for substantially the full term of the asset or liability;
Level 3: Prices or valuation techniques that require inputs that are both significant to the fair value measurement and unobservable (i.e., supported by little or no market activity).
103
The following tables summarize assets and liabilities measured at fair value on a recurring basis as of
December 31, 2013
and
2012
(in thousands):
|
|
As of December 31, 2013
|
||||||||||||||
|
|
Total
|
Quoted market
prices in active
markets
(Level 1)
|
Significant
other
observable
inputs
(Level 2)
|
Significant
unobservable
inputs
(Level 3)
|
|||||||||||
|
Cash equivalents-money-market funds
|
$
|
31,295
|
|
$
|
31,295
|
|
$
|
—
|
|
$
|
—
|
|
|||
|
Available-for-sale securities-Treasuries (1)
|
104,601
|
|
104,601
|
|
—
|
|
—
|
|
|||||||
|
Available-for-sale securities-Certificates of Deposit (1)
|
159
|
|
159
|
|
—
|
|
—
|
|
|||||||
|
Trading securities - Mutual Funds (1)
|
385
|
|
385
|
|
—
|
|
—
|
|
|||||||
|
Foreign currency forward contracts (2)
|
905
|
|
—
|
|
905
|
|
—
|
|
|||||||
|
Total assets measured at fair value
|
$
|
137,345
|
|
$
|
136,440
|
|
$
|
905
|
|
$
|
—
|
|
|||
|
(1)
|
Included in short-term investments on the Company's consolidated balance sheet.
|
|
(2)
|
Included in prepaid expenses and other current assets on the Company's consolidated balance sheet.
|
|
|
As of December 31, 2013
|
||||||||||||||
|
|
Total
|
Quoted market
prices in active
markets
(Level 1)
|
Significant
other
observable
inputs
(Level 2)
|
Significant
unobservable
inputs
(Level 3)
|
|||||||||||
|
Foreign currency forward contracts (3)
|
$
|
(381
|
)
|
$
|
—
|
|
$
|
(381
|
)
|
$
|
—
|
|
|||
|
Total liabilities measured at fair value
|
$
|
(381
|
)
|
$
|
—
|
|
$
|
(381
|
)
|
$
|
—
|
|
|||
|
(3)
|
Included in other accrued liabilities on the Company's consolidated balance sheet.
|
|
|
As of December 31, 2012
|
||||||||||||||
|
|
Total
|
Quoted market
prices in active
markets
(Level 1)
|
Significant
other
observable
inputs
(Level 2)
|
Significant
unobservable
inputs
(Level 3)
|
|||||||||||
|
Cash equivalents-money-market funds
|
$
|
3,061
|
|
$
|
3,061
|
|
$
|
—
|
|
$
|
—
|
|
|||
|
Available-for-sale securities-Treasuries (1)
|
225,062
|
|
225,062
|
|
—
|
|
—
|
|
|||||||
|
Available-for-sale securities-Certificates of Deposit (1)
|
2,783
|
|
2,783
|
|
—
|
|
—
|
|
|||||||
|
Foreign currency forward contracts (2)
|
1,144
|
|
—
|
|
1,144
|
|
—
|
|
|||||||
|
Total assets measured at fair value
|
$
|
232,050
|
|
$
|
230,906
|
|
$
|
1,144
|
|
$
|
—
|
|
|||
|
(1)
|
Included in short-term investments on the Company's consolidated balance sheet.
|
|
(2)
|
Included in prepaid expenses and other current assets on the Company's consolidated balance sheet.
|
|
|
As of December 31, 2012
|
||||||||||||||
|
|
Total
|
Quoted market
prices in active
markets
(Level 1)
|
Significant
other
observable
inputs
(Level 2)
|
Significant
unobservable
inputs
(Level 3)
|
|||||||||||
|
Foreign currency forward contracts (3)
|
$
|
(1,619
|
)
|
$
|
—
|
|
$
|
(1,619
|
)
|
$
|
—
|
|
|||
|
Total liabilities measured at fair value
|
$
|
(1,619
|
)
|
$
|
—
|
|
$
|
(1,619
|
)
|
$
|
—
|
|
|||
|
(3)
|
Included in other accrued liabilities on the Company's consolidated balance sheet.
|
104
The Company's investments in cash equivalents and available-for-sale securities are classified within Level 1 of the fair value hierarchy because they are valued based on quoted market prices in active markets. The Company enters into foreign currency forward contracts with only those counterparties that have long-term credit ratings of A+/A2 or higher. The Company's foreign currency forward contracts are classified within Level 2 of the fair value hierarchy as they are valued using pricing models that take into account the contract terms as well as currency rates and counterparty credit rates. The Company verifies the reasonableness of these pricing models using observable market data for related inputs into such models. Additionally, the Company includes an adjustment for non-performance risk in the recognized measure of fair value of derivative instruments. At
December 31, 2013
and
December 31, 2012
, the adjustment for non-performance risk did not have a material impact on the fair value of the Company's foreign currency forward contracts. The carrying value of non-financial assets and liabilities measured at fair value in the financial statements on a recurring basis, including accounts receivable and accounts payable, approximate fair value due to their short maturities.
QUARTERLY FINANCIAL DATA
(In thousands, except per share amounts)
(Unaudited)
The following table presents unaudited quarterly financial information for each of the Company’s last eight quarters. This information has been derived from the Company’s unaudited financial statements and has been prepared on the same basis as the audited Consolidated Financial Statements appearing elsewhere in this Annual Report on Form 10-K. In the opinion of management, all necessary adjustments, consisting only of normal recurring adjustments, have been included to state fairly the quarterly results.
|
December 31,
2013 |
September 29,
2013 |
June 30,
2013 |
March 31,
2013 |
|||||||||
|
Net revenue
|
$
|
356,620
|
|
$
|
361,895
|
|
$
|
357,719
|
|
$
|
293,399
|
|
|
Gross profit
|
$
|
100,789
|
|
$
|
101,659
|
|
$
|
103,430
|
|
$
|
87,737
|
|
|
Provision for income taxes
|
$
|
11,712
|
|
$
|
10,364
|
|
$
|
7,144
|
|
$
|
8,545
|
|
|
Net income
|
$
|
11,432
|
|
$
|
14,457
|
|
$
|
13,985
|
|
$
|
15,343
|
|
|
Net income per share—basic
|
$
|
0.30
|
|
$
|
0.37
|
|
$
|
0.36
|
|
$
|
0.40
|
|
|
Net income per share—diluted
|
$
|
0.30
|
|
$
|
0.37
|
|
$
|
0.36
|
|
$
|
0.39
|
|
|
December 31,
2012 |
September 30,
2012 |
July 1,
2012 |
April 1,
2012 |
|||||||||
|
Net revenue
|
$
|
310,436
|
|
$
|
315,210
|
|
$
|
320,655
|
|
$
|
325,620
|
|
|
Gross profit
|
$
|
91,378
|
|
$
|
97,688
|
|
$
|
94,638
|
|
$
|
99,849
|
|
|
Provision for income taxes
|
$
|
12,325
|
|
$
|
9,920
|
|
$
|
9,933
|
|
$
|
10,565
|
|
|
Net income
|
$
|
16,079
|
|
$
|
23,791
|
|
$
|
21,522
|
|
$
|
25,147
|
|
|
Net income per share—basic
|
$
|
0.42
|
|
$
|
0.62
|
|
$
|
0.57
|
|
$
|
0.67
|
|
|
Net income per share—diluted
|
$
|
0.41
|
|
$
|
0.61
|
|
$
|
0.56
|
|
$
|
0.65
|
|
105
|
Item 9.
|
Changes in and Disagreements With Accountants on Accounting and Financial Disclosure
|
None.
|
Item 9A.
|
Controls and Procedures
|
Management’s Report on Internal Control Over Financial Reporting
Our management is responsible for establishing and maintaining adequate internal control over financial reporting (as defined in Rule 13a-15(f) under the Exchange Act). Because of its inherent limitations, internal control over financial reporting may not prevent or detect misstatements. Also, projections of any evaluation of effectiveness to future periods are subject to the risk that controls may become inadequate because of changes in conditions, or that the degree of compliance with the policies or procedures may deteriorate.
Our management, including our Chief Executive Officer and Chief Financial Officer, conducted an evaluation of the effectiveness of our internal control over financial reporting as of
December 31, 2013
. In making this assessment, our management used the criteria established in
Internal Control—Integrated Framework (1992)
, issued by The Committee of Sponsoring Organizations of the Treadway Commission (COSO). Based on management’s assessment using those criteria, our management concluded that our internal control over financial reporting was effective as of
December 31, 2013
. The effectiveness of our internal control over financial reporting as of
December 31, 2013
has been audited by PricewaterhouseCoopers LLP, an independent registered public accounting firm, as stated in their report which is included in this Annual Report on Form 10-K.
Changes in Internal Control Over Financial Reporting
There was no change in our internal control over financial reporting that occurred during the
fourth
quarter of fiscal year
2013
that has materially affected, or is reasonably likely to materially affect, our internal control over financial reporting.
Evaluation of Disclosure Controls and Procedures
Based on an evaluation under the supervision and with the participation of our management (including our Chief Executive Officer and Chief Financial Officer), our Chief Executive Officer and Chief Financial Officer have concluded that our disclosure controls and procedures as defined in Rules 13a-15(e) and 15d-15(e) under the Exchange Act were effective as of the end of the period covered by this Annual Report on Form 10-K to ensure that information required to be disclosed by us in reports that we file or submit under the Exchange Act is (i) recorded, processed, summarized and reported within the time periods specified in the SEC’s rules and forms and (ii) accumulated and communicated to our management, including our Chief Executive Officer and Chief Financial Officer, as appropriate to allow timely decisions regarding required disclosure.
|
Item 9B.
|
Other Information
|
None.
Certain information required by Part III is incorporated herein by reference from our proxy statement related to our 2014 Annual Meeting of Stockholders, which we intend to file no later than 120 days after the end of the fiscal year covered by this Form 10-K.
|
Item 10.
|
Directors, Executive Officers and Corporate Governance
|
The information required by this Item concerning our directors, executive officers, standing committees and procedures by which stockholders may recommend nominees to our Board of Directors, is incorporated by reference to the sections of our Proxy Statement under the headings “Information Concerning the Nominees and Incumbent Nominees,” “Board and Committee Meetings,” “Audit Committee” and “Section 16(a) Beneficial Ownership Reporting Compliance,” and to the information contained in the section captioned “Executive Officers of the Registrant” included under Part I of this Annual Report on Form 10-K.
106
We have adopted a Code of Ethics that applies to our Chief Executive Officer and senior financial officers, as required by the SEC. The current version of our Code of Ethics can be found on our Internet site at http://www.netgear.com. Additional information required by this Item regarding our Code of Ethics is incorporated by reference to the information contained in the section captioned “Corporate Governance Policies and Practices” in our Proxy Statement.
We intend to satisfy the disclosure requirement under Item 5.05 of Form 8-K regarding an amendment to, or waiver from, a provision of our Code of Ethics by posting such information on our website at http://www.netgear.com within four business days following the date of such amendment or waiver.
|
Item 11.
|
Executive Compensation
|
The information required by this Item is incorporated by reference to the sections of our Proxy Statement under the headings “Compensation Discussion and Analysis,” “Executive Compensation,” “Director Compensation,” “Fiscal Year 2013 Director Compensation,” “Compensation Committee Interlocks and Insider Participation,” and “Report of the Compensation Committee of the Board of Directors.”
|
Item 12.
|
Security Ownership of Certain Beneficial Owners and Management and Related Stockholder Matters
|
The additional information required by this Item is incorporated by reference to the information contained in the section captioned “Equity Compensation Plan Information” in our Proxy Statement.
The additional information required by this Item is incorporated by reference to the information contained in the section captioned “Security Ownership of Certain Beneficial Owners and Management” in our Proxy Statement.
|
Item 13.
|
Certain Relationships and Related Transactions, and Director Independence
|
The information required by this Item is incorporated by reference to the information contained in the section captioned “Election of Directors” and “Related Party Transactions” in our Proxy Statement.
|
Item 14.
|
Principal Accounting Fees and Services
|
The information required by this Item related to audit fees and services is incorporated by reference to the information contained in the section captioned “Ratification of Appointment of Independent Registered Public Accounting Firm” appearing in our Proxy Statement.
107
|
Item 15.
|
Exhibits, Financial Statement Schedule
|
(a) The following documents are filed as part of this report:
(1) Financial Statements.
|
Page
|
|
|
Report of Independent Registered Public Accounting Firm
|
|
|
Consolidated Balance Sheets as of December 31, 2013 and 2012
|
|
|
Consolidated Statements of Operations for the three years ended December 31, 2013, 2012 and 2011
|
|
|
Consolidated Statements of Comprehensive Income for the three years ended December 31, 2013, 2012 and 2011
|
|
|
Consolidated Statements of Stockholders’ Equity for the three years ended December 31, 2013, 2012 and 2011
|
|
|
Consolidated Statements of Cash Flows for the three years ended December 31, 2013, 2012 and 2011
|
|
|
Notes to Consolidated Financial Statements
|
|
|
Quarterly Financial Data (unaudited)
|
|
|
Management’s Report on Internal Control Over Financial Reporting
|
|
(2) Financial Statement Schedule.
The following financial statement schedule of NETGEAR, Inc. for the fiscal years ended December 31,
2013
,
2012
and
2011
is filed as part of this Form 10-K and should be read in conjunction with the Consolidated Financial Statements of NETGEAR, Inc.
Schedule II—Valuation and Qualifying Accounts
(In thousands)
|
Balance at
Beginning
of Year
|
Additions
|
Deductions
|
Balance
at End of
Year
|
||||||||||||
|
Allowance for doubtful accounts:
|
|||||||||||||||
|
Year ended December 31, 2013
|
$
|
1,256
|
|
$
|
277
|
|
$
|
(278
|
)
|
$
|
1,255
|
|
|||
|
Year ended December 31, 2012
|
1,335
|
|
43
|
|
(122
|
)
|
1,256
|
|
|||||||
|
Year ended December 31, 2011
|
1,481
|
|
(21
|
)
|
(125
|
)
|
1,335
|
|
|||||||
|
Allowance for sales returns and product warranty:
|
|||||||||||||||
|
Year ended December 31, 2013
|
63,690
|
|
104,810
|
|
(102,279
|
)
|
66,221
|
|
|||||||
|
Year ended December 31, 2012
|
58,206
|
|
100,806
|
|
(95,322
|
)
|
63,690
|
|
|||||||
|
Year ended December 31, 2011
|
50,786
|
|
86,310
|
|
(78,890
|
)
|
58,206
|
|
|||||||
|
Allowance for price protection:
|
|||||||||||||||
|
Year ended December 31, 2013
|
1,783
|
|
8,352
|
|
(5,862
|
)
|
4,273
|
|
|||||||
|
Year ended December 31, 2012
|
3,930
|
|
9,925
|
|
(12,072
|
)
|
1,783
|
|
|||||||
|
Year ended December 31, 2011
|
3,147
|
|
15,688
|
|
(14,905
|
)
|
3,930
|
|
|||||||
(3) Exhibits.
The exhibits listed in the accompanying Index to Exhibits are filed or incorporated by reference as part of this report.
108
SIGNATURES
Pursuant to the requirements of Section 13 or 15(d) of the Securities Exchange Act of 1934, the Registrant has duly caused this Annual Report to be signed on its behalf by the undersigned, thereunto duly authorized, in the City of San Jose, State of California, on the 25th day of February 2014.
|
NETGEAR, INC.
|
|
|
By: /s/ PATRICK C.S. LO
|
|
|
Patrick C.S. Lo
|
|
|
Chairman of the Board and Chief Executive Officer
|
|
POWER OF ATTORNEY
KNOW ALL PERSONS BY THESE PRESENTS, that each person whose signature appears below constitutes and appoints Patrick C.S. Lo and Christine M. Gorjanc, and each of them, his attorneys-in-fact, each with the power of substitution, for him in any and all capacities, to sign any and all amendments to this Report on Form 10-K and to file the same, with exhibits thereto and other documents in connection therewith, with the Securities and Exchange Commission, hereby ratifying and confirming all that each of said attorneys-in-fact, or his substitute or substitutes, may do or cause to be done by virtue hereof.
Pursuant to the requirements of the Securities Exchange Act of 1934, this report has been signed below by the following persons on behalf of the Registrant and in the capacities and on the dates indicated:
|
Signature
|
|
Title
|
|
Date
|
|
/S/ PATRICK C.S. LO
|
|
Chairman of the Board and Chief Executive Officer
|
|
February 25, 2014
|
|
Patrick C.S. Lo
|
(Principal Executive Officer)
|
|||
|
/S/ CHRISTINE M. GORJANC
|
|
Chief Financial Officer
|
|
February 25, 2014
|
|
Christine M. Gorjanc
|
(Principal Financial and Accounting Officer)
|
|||
|
/S/ JOCELYN CARTER-MILLER
|
|
Director
|
|
February 25, 2014
|
|
Jocelyn Carter-Miller
|
||||
|
/S/ RALPH E. FAISON
|
|
Director
|
|
February 25, 2014
|
|
Ralph E. Faison
|
||||
|
/S/ A. TIMOTHY GODWIN
|
|
Director
|
|
February 25, 2014
|
|
A. Timothy Godwin
|
||||
|
/S/ JEF GRAHAM
|
|
Director
|
|
February 25, 2014
|
|
Jef Graham
|
||||
|
/S/ LINWOOD A. LACY, JR.
|
|
Director
|
|
February 25, 2014
|
|
Linwood A. Lacy, Jr.
|
||||
|
/S/ GREGORY J. ROSSMANN
|
|
Director
|
|
February 25, 2014
|
|
Gregory J. Rossmann
|
||||
|
/S/ BARBARA V. SCHERER
|
|
Director
|
|
February 25, 2014
|
|
Barbara V. Scherer
|
||||
|
/S/ JULIE A. SHIMER
|
|
Director
|
|
February 25, 2014
|
|
Julie A. Shimer
|
||||
109
INDEX TO EXHIBITS
|
Exhibit Number
|
Description
|
|
2.1**
|
Asset Purchase Agreement, dated as of September 22, 2008, by and among CP Secure International Holding Limited, the stockholders thereof and the registrant(1)
|
|
3.3
|
Amended and Restated Certificate of Incorporation of the registrant(2)
|
|
3.5
|
Amended and Restated Bylaws of the registrant(2)
|
|
4.1
|
Form of registrant's common stock certificate(2)
|
|
10.1
|
Form of Indemnification Agreement for directors and officers(2)
|
|
10.2#
|
2000 Stock Option Plan and forms of agreements thereunder(2)
|
|
10.3#
|
2003 Stock Plan and forms of agreements thereunder, as amended (3)
|
|
10.4#
|
2003 Employee Stock Purchase Plan, as amended (4)
|
|
10.5#
|
Offer Letter, dated December 3, 1999, between the registrant and Patrick C.S. Lo(2)
|
|
10.8#
|
Offer Letter, dated December 9, 1999, between the registrant and Mark G. Merrill(2)
|
|
10.9#
|
Employment Agreement, dated November 4, 2002, between the registrant and Michael F. Falcon(2)
|
|
10.10#
|
Employment Agreement, dated January 6, 2003, between the registrant and Charles T. Olson(2)
|
|
10.12#
|
Employment Agreement, dated November 16, 2005, between the registrant and Christine M. Gorjanc(5)
|
|
10.14*
|
Distributor Agreement, dated March 1, 1997, between the registrant and Tech Data Product Management, Inc.(2)
|
|
10.15*
|
Distributor Agreement, dated March 1, 1996, between the registrant and Ingram Micro Inc., as amended by Amendment dated October 1, 1996 and Amendment No. 2 dated July 15, 1998(2)
|
|
10.24*
|
Warehousing Agreement, dated July 5, 2001, between the registrant and APL, Logistics Americas, Ltd.(2)
|
|
10.25*
|
Distribution Operation Agreement, dated April 27, 2001, between the registrant and DSV Solutions B.V. (formerly Furness Logistics BV)(2)
|
|
10.26*
|
Distribution Operation Agreement, dated December 1, 2001, between the registrant and Kerry Logistics (Hong Kong) Limited(2)
|
|
10.33#
|
2006 Long Term Incentive Plan and forms of agreements thereunder(6)
|
|
10.34
|
Agreement and Plan of Merger, dated as of July 26, 2006, by and among the registrant, SKJM Holdings Corporation, SkipJam Corp., Michael Spilo, Jonathan Daub, Francis Refol, Dennis Aldover and Zhicheng Qiu(7)
|
|
10.35
|
Asset Purchase Agreement, dated as of January 28, 2013, by and among the registrant, NETGEAR Holdings Limited, NETGEAR International Limited, NETGEAR Canada Limited, NETGEAR Australia PTY, LTD, Sierra Wireless, Inc., Sierra Wireless, Inc., Sierra Wireless America, Inc. and Sierra Wireless (Australia) PTY LTD(8)
|
|
10.41**
|
Agreement and Plan of Merger, dated as of May 2, 2007, by and among the registrant, NAS Holdings Corporation, Infrant Technologies, Inc., certain Infrant shareholders thereof, and Paul Tien as the Holders Representative (9)
|
|
10.44
|
Office Lease, dated as of September 25, 2007, by and between the registrant and BRE/Plumeria, LLC (10)
|
|
10.45
|
First Amendment to Office Lease, dated as of April 23, 2008, by and between the registrant and BRE/Plumeria, LLC (11)
|
|
10.46#
|
Amended and Restated 2006 Long-Term Incentive Plan (12)
|
|
10.47#
|
NETGEAR, Inc. Executive Bonus Plan (12)
|
|
10.49#
|
Amendment to Employment Agreement, dated December 29, 2008, between the registrant and Michael F. Falcon (13)
|
|
10.50#
|
Amendment to Employment Agreement, dated December 31, 2008, between the registrant and Christine Gorjanc (13)
|
|
10.51#
|
Amendment to Offer Letter, dated December 23, 2008, between the registrant and Patrick Lo (13)
|
|
10.52#
|
Amendment to Offer Letter, dated December 28, 2008, between the registrant and Mark Merrill (13)
|
|
10.53#
|
Amendment to Employment Agreement, dated December 24, 2008, between the registrant and Chuck Olson (13)
|
|
10.54#
|
Amendment to Employment Agreement, dated December 30, 2008, between the registrant and Michael Werdann (13)
|
|
10.55#
|
Amendment #2 to Employment Agreement, dated September 21, 2009, between the registrant and Christine Gorjanc (14)
|
|
10.56#
|
Change of Control and Severance Agreement dated March 31, 2011 by and between NETGEAR, Inc. and David Soares (15)
|
|
10.57#
|
Change of Control and Severance Agreement dated January 25, 2012, by and between NETGEAR, Inc. and Michael Clegg (16)
|
|
10.58#
|
NETGEAR, Inc. Deferred Compensation Plan (17)
|
|
10.59#
|
NETGEAR, Inc. Executive Bonus Plan, as amended and restated April 1, 2013 (18)
|
110
|
10.60#
|
Employment Agreement, dated July 8, 2013, between NETGEAR, Inc. and John McHugh (19)
|
|
21.1
|
List of subsidiaries and affiliates
|
|
23.1
|
Consent of PricewaterhouseCoopers LLP, Independent Registered Public Accounting Firm
|
|
24.1
|
Power of Attorney (included on signature page)
|
|
31.1
|
Certification of Chief Executive Officer pursuant to Securities Exchange Act Rules 13a-14(a) / 15d-14(a), as adopted pursuant to Section 302 of the Sarbanes-Oxley Act of 2002
|
|
31.2
|
Certification of Chief Financial Officer pursuant to Securities Exchange Act Rules 13a-14(a) / 15d-14(a), as adopted pursuant to Section 302 of the Sarbanes-Oxley Act of 2002
|
|
32.1
|
Certification of Chief Executive Officer pursuant to 18 U.S.C. Section 1350, as adopted pursuant to Section 906 of the Sarbanes-Oxley Act of 2002
|
|
32.2
|
Certification of Chief Financial Officer pursuant to 18 U.S.C. Section 1350, as adopted pursuant to Section 906 of the Sarbanes-Oxley Act of 2002
|
|
101.INS***
|
XBRL Instance Document
|
|
101.SCH***
|
XBRL Taxonomy Extension Schema Document
|
|
101.CAL***
|
XBRL Taxonomy Extension Calculation Linkbase Document
|
|
101.DEF***
|
XBRL Taxonomy Extension Definition Linkbase Document
|
|
101.LAB***
|
XBRL Taxonomy Extension Label Linkbase Document
|
|
101.PRE***
|
XBRL Taxonomy Extension Presentation Linkbase Document
|
111
|
#
|
Indicates management contract or compensatory plan or arrangement.
|
|
*
|
Confidential treatment has been granted as to certain portions of this Exhibit.
|
|
**
|
Registrant hereby agrees to furnish a copy of the omitted schedules and exhibits to the Securities and Exchange Commission upon its request.
|
|
***
|
XBRL (Extensible Business Reporting Language) information is furnished and not filed or a part of a registration statement or prospectus for purpose of Section 11 or 12 of the Securities Act of 1933, as amended, is deemed not filed for purposes of Section 18 of the Securities Exchange Act of 1934, as amended, and otherwise is not subject to liability under these sections.
|
|
(1)
|
Incorporated by reference to the exhibit bearing the same number filed with the Registrant's Current Report on Form 8-K filed on September 23, 2008 with the Securities and Exchange Commission.
|
|
(2)
|
Incorporated by reference to an exhibit filed with the Registrant's Registration Statement on Form S-1 (Registration Statement 333-104419), which the Securities and Exchange Commission declared effective on July 30, 2003.
|
|
(3)
|
Incorporated by reference to Exhibit 10.3 of the Registrant's Annual Report on Form 10-K filed on February 26, 2013 with the Securities and Exchange Commission.
|
|
(4)
|
Incorporated by reference to Exhibit 10.4 of the Registrant's Annual Report on Form 10-K filed on February 26, 2013 with the Securities and Exchange Commission.
|
|
(5)
|
Incorporated by reference to Exhibit 10.32 of the Registrant's Current Report on Form 8-K filed on November 22, 2005 with the Securities and Exchange Commission.
|
|
(6)
|
Incorporated by reference to the copy included in the Registrant's Proxy Statement for the 2006 Annual Meeting of Stockholders filed on April 21, 2006 with the Securities and Exchange Commission.
|
|
(7)
|
Incorporated by reference to Exhibit 2.1 of the Registrant's Current Report on Form 8-K filed on July 27, 2006 with the Securities and Exchange Commission.
|
|
(8)
|
Incorporated by reference to Exhibit 10.35 of the Registrant's Annual Report on Form 10-K filed on February 26, 2013 with the Securities and Exchange Commission.
|
|
(9)
|
Incorporated by reference to Exhibit 2.1 of the Registrant's Current Report on Form 8-K filed on May 3, 2007 with the Securities and Exchange Commission.
|
|
(10)
|
Incorporated by reference to Exhibit 10.1 of the Registrant's Current Report on Form 8-K filed on September 27, 2007 with the Securities and Exchange Commission.
|
|
(11)
|
Incorporated by reference to Exhibit 10.1 of the Registrant's Quarterly Report on Form 10-Q filed on May 9, 2008 with the Securities and Exchange Commission.
|
|
(12)
|
Incorporated by reference to the copy included in the Registrant's Proxy Statement for the 2008 Annual Meeting of Stockholders filed on April 28, 2008 with the Securities and Exchange Commission.
|
|
(13)
|
Incorporated by reference to the copy included in the Registrant's Annual Report on Form 10-K filed on March 4, 2009 with the Securities and Exchange Commission.
|
|
(14)
|
Incorporated by reference to Exhibit 10.1 of the Registrant's Current Report on Form 8-K filed on September 21, 2009 with the Securities and Exchange Commission.
|
|
(15)
|
Incorporated by reference to Exhibit 10.1 of the Registrant's Current Report on Form 8-K filed on April 4, 2011 with the Securities and Exchange Commission.
|
|
(16)
|
Incorporated by Reference to Exhibit 10.11 of the Registrant's Quarterly Report on Form 10-Q filed on May 7, 2013 with the Securities and Exchange Commission.
|
|
(17)
|
Incorporated by reference to Exhibit 10.1 of the Registrant's Current Report on Form 8-K filed on April 5, 2013 with the Securities and Exchange Commission.
|
|
(18)
|
Incorporated by reference to Appendix A of the Registrant's Definitive Proxy Statement filed on April 16, 2013 with the Securities and Exchange Commission.
|
|
(19)
|
Incorporated by reference to Exhibit 10.1 of the Registrant's Current Report on Form 8-K filed on July 11, 2013 with the Securities and Exchange Commission.
|
112
TABLE OF CONTENTS
Part IItem 1. BusinessItem 1A. Risk FactorsItem 1B. Unresolved Staff CommentsItem 2. PropertiesItem 3. Legal ProceedingsItem 4. Mine Safety DisclosuresPart IIItem 5. Market For Registrant S Common Equity, Related Stockholder Matters and Issuer Purchases Of Equity SecuritiesItem 6. Selected Financial DataItem 7. Management S Discussion and Analysis Of Financial Condition and Results Of OperationsItem 7A. Quantitative and Qualitative Disclosures About Market RiskItem 8. Financial Statements and Supplementary DataNote 1. The Company and Summary Of Significant Accounting PoliciesNote 2. Business AcquisitionsNote 3. Balance Sheet Components (in Thousands)Note 4. Restructuring and Other ChargesNote 5. Derivative Financial InstrumentsNote 6. Net Income Per ShareNote 7. Other (expense) Income, NetNote 8. Income TaxesNote 9. Commitments and ContingenciesNote 10. Stockholders EquityNote 11. Employee Benefit PlansNote 12. Segment Information, Operations By Geographic Area and Customer ConcentrationNote 13. Fair Value MeasurementsItem 9. Changes in and Disagreements with Accountants on Accounting and Financial DisclosureItem 9A. Controls and ProceduresItem 9B. Other InformationPart IIIItem 10. Directors, Executive Officers and Corporate GovernanceItem 11. Executive CompensationItem 12. Security Ownership Of Certain Beneficial Owners and Management and Related Stockholder MattersItem 13. Certain Relationships and Related Transactions, and Director IndependenceItem 14. Principal Accounting Fees and ServicesPart IVItem 15. Exhibits, Financial Statement Schedule