NETGEAR, INC.
10-Ks and 10-Qs
|
|
|
|
|
|
|
|
|
|
|
|
|
|
|
|
|
|
|
|
|
|
|
|
|
|
|
|
|
|
|
|
|
|
|
|
|
|
|
|
|
|
|
|
|
|
|
|
|
|
|
|
|
|
|
|
UNITED STATES SECURITIES AND EXCHANGE COMMISSION
Washington, D.C. 20549
_______________
Form 10-K
|
þ
|
ANNUAL REPORT PURSUANT TO SECTION 13 OR 15(d) OF THE SECURITIES EXCHANGE ACT OF 1934.
|
|
For the fiscal year ended December 31, 2017
|
|
|
or
|
|
|
o
|
TRANSITION REPORT PURSUANT TO SECTION 13 OR 15(d) OF THE SECURITIES EXCHANGE ACT OF 1934.
|
|
For the transition period from to
|
|
Commission file number 000-50350
_______________
NETGEAR, Inc.
(Exact name of registrant as specified in its charter)
|
Delaware
|
77-0419172
|
|
(State or other jurisdiction of incorporation or organization)
|
(I.R.S. Employer Identification No.)
|
|
350 East Plumeria Drive,
|
95134
|
|
San Jose, California
|
(Zip Code)
|
|
(Address of principal executive offices)
|
|
Registrant's telephone number, including area code
(408) 907-8000
Securities registered pursuant to Section 12(b) of the Act:
|
Title of each class
|
Name of each exchange on which registered
|
|
|
Common Stock, par value $0.001
|
The NASDAQ Stock Market LLC
|
|
|
(NASDAQ Global Select Market)
|
||
Securities registered pursuant to 12(g) of the Act: None
Indicate by check mark if the registrant is a well-known seasoned issuer, as defined in Rule 405 of the Securities Act. Yes
þ
No
o
Indicate by check mark if the registrant is not required to file reports pursuant to Section 13 or Section 15(d) of the Act. Yes
o
No
þ
Indicate by check mark whether the registrant (1) has filed all reports required to be filed by Section 13 or 15(d) of the Securities Exchange Act of 1934 during the preceding 12 months (or for such shorter period that the registrant was required to file such reports), and (2) has been subject to such filing requirements for the past 90 days. Yes
þ
No
o
Indicate by check mark whether the registrant has submitted electronically and posted on its corporate Website, if any, every Interactive Data File required to be submitted and posted pursuant to Rule 405 of Regulation S-T (§232.405 of this chapter) during the preceding 12 months (or for such shorter period that the registrant was required to submit and post such files). Yes
þ
No
o
Indicate by check mark if disclosure of delinquent filers pursuant to Item 405 of Regulation S-K is not contained herein, and will not be contained, to the best of Registrant's knowledge, in definitive proxy or information statements incorporated by reference in Part III of this Form 10-K or any amendment to this Form 10-K.
þ
Indicate by check mark whether the registrant is a large accelerated filer, an accelerated filer, a non-accelerated filer, a smaller reporting company, or an emerging growth company. See definition of “large accelerated filer,” “accelerated filer,” “smaller reporting company”, and "emerging growth company" in Rule 12b-2 of the Exchange Act.
|
Large accelerated filer
|
þ
|
|
Accelerated filer
|
o
|
||
|
Non-accelerated filer
|
o
|
|
Smaller reporting company
|
o
|
||
|
Emerging growth company
|
o
|
|||||
|
If an emerging growth company, indicate by check mark if the registrant has elected not to use the extended transition period for complying with any new or revised financial accounting standards provided pursuant to Section 13(a) of the Exchange Act.
o
|
||||||
Indicate by check mark whether the registrant is a shell company (as defined in Rule 12b-2 of the Act.) Yes
o
No
þ
The aggregate market value of the voting and non-voting common equity held by non-affiliates of the Registrant as of
July 2, 2017
was approximately
$848.2 million
. Such aggregate market value was computed by reference to the closing price of the common stock as reported on the Nasdaq Global Select Market on
June 30, 2017
(the last business day of the Registrant's most recently completed fiscal second quarter). Shares of common stock held by each executive officer and director and each entity that owns 5% or more of the outstanding common stock have been excluded in that such persons may be deemed to be affiliates. The determination of affiliate status is not necessarily a conclusive determination for other purposes.
The number of outstanding shares of the registrant's Common Stock, $0.001 par value, was
31,381,182
shares as of
February 9, 2018
.
DOCUMENTS INCORPORATED BY REFERENCE
Portions of the Proxy Statement for the Registrant's 2018 Annual Meeting of Stockholders are incorporated by reference in Part III of this Form 10-K.
TABLE OF CONTENTS
|
PART I
|
||
|
Item 1.
|
||
|
Item 1A.
|
||
|
Item 1B.
|
||
|
Item 2.
|
||
|
Item 3.
|
||
|
Item 4.
|
||
|
PART II
|
||
|
Item 5.
|
||
|
Item 6.
|
||
|
Item 7.
|
||
|
Item 7A.
|
||
|
Item 8.
|
||
|
Item 9.
|
||
|
Item 9A.
|
||
|
Item 9B.
|
||
|
PART III
|
||
|
Item 10.
|
||
|
Item 11.
|
||
|
Item 12.
|
||
|
Item 13.
|
||
|
Item 14.
|
||
|
PART IV
|
||
|
Item 15.
|
||
|
Item 16.
|
||
This Annual Report on Form 10-K (“Form 10-K”), including Management’s Discussion and Analysis of Financial Condition and Results of Operations in Part II, Item 7 below, includes forward-looking statements within the meaning of Section 27A of the Securities Act of 1933, as amended, and Section 21E of the Securities Exchange Act of 1934, as amended (the “Exchange Act”). All statements other than statements of historical facts contained in this Form 10-K, including statements regarding our future financial position, business strategy and plans and objectives of management for future operations, are forward-looking statements. The words “believe,” “may,” “will,” “estimate,” “continue,” “anticipate,” “intend,” “should,” “plan,” “expect” and similar expressions, as they relate to us, are intended to identify forward-looking statements. We have based these forward-looking statements largely on our current expectations and projections about future events and financial trends that we believe may affect our financial condition, results of operations, business strategy and financial needs. These forward-looking statements are subject to a number of risks, uncertainties and assumptions described in “Risk Factors” in Part I, Item 1A below, and elsewhere in this Form 10-K, including, among other things: future demand for our products may be lower than anticipated; consumers may choose not to adopt our new product offerings or adopt competing products; the actual price, performance and ease of use of our products may not meet the price, performance and ease of use requirements of consumers; our dependence on certain significant customers; our reliance on a limited number of third-party suppliers and manufacturers; new cyber threats may challenge the effectiveness or threaten the security of our products; our business strategies and development plans may not be successful; and our plan to separate our Arlo business through the potential initial public offering of Arlo Technologies, Inc. (“Arlo”) and the subsequent distribution of our remaining holdings of Arlo common stock. In light of these risks, uncertainties and assumptions, the forward-looking events and circumstances discussed in this Form 10-K may not occur and actual results could differ materially from those anticipated or implied in the forward-looking statements. All forward-looking statements in this Form 10-K are based on information available to us as of the date hereof, such information may be limited or incomplete, and we assume no obligation to update any such forward-looking statements. These statements are inherently uncertain and investors are cautioned not to unduly rely upon these statements. The following discussion should be read in conjunction with our consolidated financial statements and the accompanying notes contained in this Form 10-K.
Item 1.
Business
General
We are a global company that delivers innovative networking and Internet connected products to consumers and growing businesses. In the first fiscal quarter of 2017, our Chief Operating Decision Maker requested changes to the information that he regularly reviews for purposes of allocating resources and assessing performance. By consequence, we reorganized our operating segment structure, resulting in a change to our reportable segments. Beginning with fiscal year 2017, we operate and report in the following three segments: Arlo, Connected Home, and Small and Medium Business ("SMB"). The Arlo segment is focused on intelligent internet-connected products for consumers and businesses that provide security and safety. The Connected Home segment is focused on consumers and consists of high-performance, dependable and easy-to-use LTE and WiFi internet networking solutions. The SMB segment is focused on small and medium-sized businesses and consists of business networking, storage and security solutions that bring enterprise-class functionality to small and medium-sized businesses at an affordable price. The prior-year segment financial results have been recast to conform to the reportable segment structure effective on January 1, 2017. None of the changes impact previously reported consolidated net revenue, income from operations, net income per share, total assets, or stockholders’ equity. We are organized into the following three geographic territories: Americas; Europe, Middle-East and Africa ("EMEA") and Asia Pacific ("APAC"). For further detail, refer to Note 11,
Segment Information,
in Notes to Consolidated Financial Statements in Item 8 of Part II of this Annual Report on Form 10-K.
We were incorporated in Delaware on January 8, 1996. Our principal executive offices are located at 350 East Plumeria Drive, San Jose, California 95134, and our telephone number at that location is (408) 907-8000. Our website address is www.netgear.com.
In the years ended December 31,
2017
,
2016
, and
2015
, we generated net revenue of
$1.41 billion
,
$1.33 billion
, and
$1.30 billion
, respectively.
Markets
Our mission is to be the innovative leader in connecting the world to the internet. Our goal includes being the provider of industry-leading networking and smart connected products for consumers, business, and the service provider markets. There are a number of factors that are driving today's demand for networking products within these markets. The ever-growing number
1
of internet connected devices, such as smart phones, laptops, tablets and the advent of Smart Home and Internet-of-Things devices has increased the need for more robust networking solutions. The internet has enabled information and resource sharing via both local area networks, and more broadly via the internet. To take advantage of complex applications, advanced communication capabilities and rich multimedia content, internet connections are being upgraded by deploying high-speed broadband access technologies. Users also seek the convenience and flexibility of operating their laptops, smart phones, tablets and related computing devices while accessing their content in a more mobile, or wireless, manner. Increased market demand for Smart Home and internet-connected products, such as Smart TVs, game consoles, HD streaming players, security cameras, thermostats, smoke detectors, etc., continue to drive new innovations in networking. As a result, the need and desire for more convenience, speed, coverage range, and reliability of an in-home WiFi network has become a greater priority among households as well as businesses.
Consumers, businesses and service providers demand a complete set of both wired and wireless networking and broadband products that are tailored to their specific needs and budgets, while incorporating the latest networking technologies. Although these users desire the continual introduction of new advanced technologies, they often lack technical knowledge and resources. Therefore, a seamless 'plug-and-play' or easy-to-install experience with little to no customer service and support is the expected norm. We have also observed that this audience prefers the convenience of obtaining a networking solution from a single company and we have seen that they tend to be loyal purchasers of a brand with which they have had a good experience. Purchasing decisions in these markets are driven by the affordability and reliability of the products. To provide reliable, easy-to-use products at an attractive price, we believe a successful supplier must have a company-wide focus on the unique requirements of these markets, operational discipline and a cost-efficient infrastructure with processes that allow for efficient product development, manufacturing and distribution.
Sales Channels
We sell our products through multiple sales channels worldwide, including wholesale distributors, traditional and online retailers, direct market resellers ("DMRs"), value-added resellers ("VARs"), and broadband service providers.
Wholesale Distribution.
Our distribution channel supplies our products to retailers, e-commerce resellers, DMRs, VARs and broadband service providers. We sell directly to our distributors, the largest of which are Ingram Micro, Inc., D&H Distributing Company and Tech Data Corporation.
Retailers.
Our retail channel primarily supplies products that are sold into the consumer market. However, increasingly we are seeing products designed for small and medium-sized businesses move through these channels. We sell directly to, or enter into consignment arrangements with, a number of our traditional and online retailers. The remaining traditional retailers, as well as our online retailers, are fulfilled through wholesale distributors. We work directly with our retail channels on market development activities, such as co-advertising, on-line promotions and video demonstrations, instant rebate programs, event sponsorship and sales associate training. Our largest retailers include Best Buy Co., Inc., Amazon.com, Inc. and their affiliates.
DMRs and VARs.
We sell into the business marketplace through an extensive network of DMRs and VARs. Our DMRs include companies such as CDW and Insight. VARs include our network of registered NETGEAR Solution Partners. DMRs and VARs may receive sales incentives, marketing support and other program benefits from us. Our DMRs and VARs generally purchase our products through our wholesale distributors.
Broadband Service Providers.
We also supply our products directly to broadband service providers in the United States and internationally providing cable, DSL and 4G LTE broadband. Service providers supply our products to their business and home subscribers. Our largest broadband service providers include Telstra and AT&T.
The largest portion of our net revenues was derived from Americas sales in the year ended December 31,
2017
. Americas sales as a percentage of net revenue increased from
66.5%
in the year ended December 31,
2016
to
68.1%
in the year ended December 31,
2017
. We have continuously committed resources to our international operations and sales channels. Accordingly, we are subject to a number of risks related to international operations such as macroeconomic and microeconomic conditions, geopolitical instability, preference for locally branded products, exchange rate fluctuations, increased difficulty in managing inventory, challenges of staffing and managing foreign operations, the effect of international sales on our tax structure, and changes in local tax laws. For further information regarding these risks, refer to Item 1A, Risk Factors of Part I of this Annual Report on Form 10-K.
Best Buy Co., Inc. and affiliates and Amazon and affiliates accounted for 10% or more of net revenue for the year ended
2
December 31, 2017 and 2016, respectively. Best Buy Co., Inc. and affiliates accounted for 10% or more of net revenue for the year ended December 31, 2015.
Refer to Note 11,
Segment Information
, in Notes to Consolidated Financial Statements in Item 8 of Part II of this Annual Report on Form 10-K, for further discussion of operations by geographic area, for details on long-lived assets by geographic area, and for further details on significant customers.
Product Offerings
Our products are built on a variety of proven technologies such as wireless (WiFi and LTE), Ethernet and powerline, with a focus on reliability and ease-of-use. Our product line consists of devices that create and extend wired and wireless networks as well as devices that provide a special function and attach to the network, such as Internet Protocol (“IP”) security cameras and home automation devices and services. These products are available in multiple configurations to address the changing needs of our customers in each geographic region in which our products are sold.
Smart Home / Connected Home / Broadband access.
Products that create and extend wired and wireless networks in homes and small businesses to connect devices to the internet, enable connection to broadband networks, as well as devices that provide remote, secure monitoring of homes and businesses. These products are sold primarily via brick and mortar retail, e-commerce, and service provider channels and include:
|
•
|
Remote video security systems, which provide remote video and audio monitoring and recordings, accessible by smart phones, tablets or PCs and MACs through WiFi or LTE;
|
|
•
|
Broadband modems, which are devices that convert the broadband signals into Ethernet data that feeds Internet into homes and offices. We provide modems that connect to DOCSIS 3.x, xDSL, FTTx, and 4G LTE;
|
|
•
|
WiFi Gateways, which are WiFi routers with an integrated broadband modem, for broadband Internet access;
|
|
•
|
WiFi Hotspots, which create mobile WiFi Internet access that utilizes 3G and 4G LTE data networks for use on the go, and at home in place of traditional wired broadband, Internet access;
|
|
•
|
WiFi routers and home WiFi Systems, which create a local area network (LAN) for home or office computer, mobile and Smart Devices to connect and share a broadband Internet connection;
|
|
•
|
WiFi range extenders, which extend the range of an existing WiFi network to eliminate WiFi dead spots;
|
|
•
|
Powerline adapters and bridges, which extend wired and WiFi Internet connections to any AC outlet using existing electrical wiring; and
|
|
•
|
WiFi network adapters, which enable computing devices to be connected to the network via WiFi.
|
Small and Medium business solutions.
These products are sold into the small and medium business marketplace through an extensive network of DMRs and VARs, and increasingly through brick and mortar retail and e-commerce channels and include:
|
•
|
Ethernet switches, which are multiple port devices used to network computing devices and peripherals via Ethernet wiring;
|
|
•
|
Wireless controllers and access points, which are devices used to manage and control multiple WiFi base stations on a campus or a facility providing WiFi connections to smart phones, tablets, laptops and other computing devices;
|
|
•
|
Unified storage, which delivers file and block based data into a single shared storage system, meeting the demands of small enterprises, education, hospitality and health markets through an easy-to-use interface for managing multiple storage protocols; and
|
|
•
|
Internet security appliances, which provide internet access through capabilities such as anti-virus and anti-spam.
|
3
We design our products and services to meet the specific needs of the consumer, business and service provider markets, tailoring various elements of the software interface, the product design, including component specification, physical characteristics such as casing, design and coloration, and specific user interface features to meet the needs of these markets. We also leverage many of our technological developments, high volume manufacturing, technical support and engineering infrastructure across our markets to maximize business efficiencies.
Our products that target the business market are generally designed with an industrial appearance, including metal cases and, for some product categories, the ability to mount the product within standard data networking racks as well as unique mounting solutions for other uses. These products typically include higher port counts, higher data transfer rates and other performance characteristics designed to meet the needs of a business user. For example, we offer data transfer rates up to ten gigabits per second for our business products to meet the higher capacity requirements of business users. Some of these products are also designed to support transmission modes such as fiber optic cabling, which is common in more sophisticated business environments. Security requirements within our products for business broadband access include firewall, virtual private network and content threat management capabilities that allow for secure interactions between remote offices and business headquarter locations over the internet. Our connectivity product offerings for the business market include enhanced security and remote configurability often required in a business setting. Our ReadyNAS
®
family of network attached storage products implements redundant arrays of independent disks data protection, enabling businesses to store and protect critical data easily, efficiently and intelligently.
Our vision for the home network is about intelligently controlling and monitoring all devices connected to the home network at all times, thus creating a Smart Environment. Our focus is to continue to introduce new products and services into growth areas that form the basis of Smart Homes, such as: the fastest WiFi standards with broadest coverage via latest technology (802.11ac) WiFi routers and home WiFi systems; high speed DOCSIS 3.1, xDSL and fiber gateways with more integrated functions; 4G LTE gateways and mobile hotspots; smart home cameras; smart home lights and other automation devices. We continue to announce and introduce new products in these key markets.
Our vision for the business network is to increase the effectiveness and efficiency of the hybrid cloud access network. We believe small and medium-sized enterprises will continue to move into cloud-based applications, such as: Salesforce.com, Ring Central, Zoom video conferencing, SuccessFactors, Workday, and others. In addition, we believe these enterprises will move into utility-like on demand computing power supplied by third party data centers. Also, increasingly more enterprises are enabling the BYOD (bring your own device) environment allowing smart phones, tablets, and netbooks to be the business computing devices of choice. These trends will place a greater demand on business networks. To meet this demand we are introducing next generation commercial products in rapid pace, such as: Power over Ethernet (PoE) switches, Multi-gigabit Ethernet switches, high capacity local and remote unified storage, small to medium capacity campus wireless LAN, and security appliances.
Competition
The consumer, business and service provider markets are intensely competitive and subject to rapid technological change. We expect competition to continue to intensify. Our principal competitors include:
|
•
|
within the consumer markets, companies such as Amazon.com, Apple, ARRIS, ASUS, Belkin/Linksys, Canary, Devolo, D-Link, Eero, Google, Logitech, Luma, Google, Ring, Samsung, Swann, Synology, Symantec, TP Link, and Western Digital;
|
|
•
|
within the business markets, companies such as Allied Telesys, Barracuda, Buffalo, Cisco Systems, Dell, D-Link, Fortinet, Hewlett-Packard Enterprise, Huawei, QNAP Systems, Seagate Technology, SonicWall, Synology, TP Link, Ubiquiti, WatchGuard and Western Digital; and
|
|
•
|
within the service provider markets, companies such as Actiontec, Airties, Arcadyan, ARRIS, ASUS, AVM, Canary, Compal Broadband, D-Link, Eero, Franklin, Google, Hitron, Huawei, Novatel Wireless, Plume, Sagem, Sercomm, SMC Networks, TechniColor, TP-Link, Ubee, ZTE and ZyXEL.
|
Our potential competitors include other consumer electronics vendors, including LG Electronics, Microsoft, Panasonic, Sony, Toshiba and Vizio, who could integrate networking and streaming capabilities into their line of products, such as televisions, set top boxes and gaming consoles, and our channel customers who may decide to offer self-branded networking products. We also face competition from service providers who bundle a free networking device with their broadband service offering, which
4
would reduce our sales if we are not the supplier of choice to those service providers. In the service provider space, we also face significant and increased competition from original design manufacturers ("ODMs") and contract manufacturers ("CMs") who are selling and attempting to sell their products directly to service providers around the world.
Many of our existing and potential competitors have longer operating histories, greater name recognition and substantially greater financial, technical, sales, marketing and other resources. As a result, they may have more advanced technology, larger distribution channels, stronger brand names, better customer service and access to more customers than we do. For example, Hewlett-Packard Enterprise has significant brand name recognition and has an advertising presence substantially greater than ours. Similarly, Cisco Systems and Google are well recognized as leaders in providing networking products to businesses and have substantially greater financial resources than we do. Several of our competitors, such as TP-Link, offer a range of products that directly compete with most of our product offerings. Several of our other competitors primarily compete in a more limited manner. For example, Hewlett-Packard sells networking products primarily targeted at larger businesses or enterprises. However, the competitive environment in which we operate changes rapidly. Other companies with significant resources could also become direct competitors, either through acquiring a competitor or through internal efforts.
We believe that the principal competitive factors in the consumer, business and service provider markets for networking products include product breadth, size and scope of the sales channel, brand name, timeliness of new product introductions, product availability, performance, features, functionality and reliability, price, ease-of-installation, maintenance and use, and customer service and support. We believe our products are competitive in these markets based on these factors.
To remain competitive, we must invest significant resources in developing new products and enhancing our current products while continuing to expand our sales channels and maintaining customer satisfaction worldwide.
Research and Development
Our success depends on our ability to develop products that meet changing user needs and to anticipate and proactively respond to evolving technology in a timely and cost-effective manner. Accordingly, we have made investments in our research and development department in order to effectively evaluate existing and new third-party technologies, develop existing and new in-house technologies, and develop and test new products and services. Our research and development employees work closely with our technology and manufacturing partners to bring our products to market in a timely, high quality and cost-efficient manner.
We identify, qualify or self-develop new technologies to develop products using one or more of the methodologies described below.
ODM.
Under the ODM methodology, we define the product concept and specification and recommend the technology selection. We then coordinate with our technology suppliers while they develop the product meeting our specification. On certain new products, one or more subsystems of the design can be done in-house and then integrated with the remaining design pieces from the ODM. Once prototypes are completed, we work with our partners to complete the debugging and systems integration and testing. After completion of the final tests, agency approvals and product documentation, the product is released for production.
In-House Development.
Under the in-house development model, one or more subsystems of the product are designed and developed utilizing the NETGEAR engineering team. Under this model, some of the primary technology is developed in-house. We then work closely with either an ODM or a Joint Development Manufacturer ("JDM") to complete the development of the entire design, perform the necessary testing, and obtain regulatory approvals before the product is released for production.
Our total research and development expenses were
$94.6 million
in 2017,
$89.4 million
in 2016 and
$86.5 million
in 2015.
Manufacturing
Our primary manufacturers are Cloud Network Technology (more commonly known as Foxconn Corporation), Delta Networks Incorporated, Wistron NeWeb Corporation, and Pegatron Corporation, all of which are headquartered in Taiwan. We also use Sky Light Industrial Ltd., which is headquartered in Hong Kong. The actual manufacturing of our products occurs primarily in mainland China and Vietnam, with pilot and low-volume manufacturing in Taiwan on a select basis. We distribute our manufacturing among these key suppliers to avoid excessive concentration with a single supplier. However, there has been an increase in supplier concentration since 2015. Because substantially all of our manufacturing occurs in mainland China and
5
Vietnam, any disruptions from natural disasters, health epidemics and political, social and economic instability would affect the ability of our manufacturers to manufacture our products. In addition, our manufacturers in China have continued to increase our costs of production, particularly in the recent years. These increased costs have affected our margins and ability to lower prices for our products to stay competitive. If our manufacturers or warehousing facilities are disrupted or destroyed, we would have no other readily available alternatives for manufacturing our products and our business would be significantly impacted. In addition to their responsibility for the manufacturing of our products, our manufacturers purchase all necessary parts and materials to produce complete, finished goods. To maintain quality standards for our suppliers, we have established our own product quality organization based in Hong Kong and mainland China. They are responsible for auditing and inspecting process and product quality on the premises of our ODMs and JDMs.
We obtain several key components from limited or sole sources. For example, many of the semiconductors and metamaterials used in our products are designed specifically for our products and are obtained from sole source suppliers on a purchase order basis. In addition, some components that are used in our products are obtained from limited sources. These components include connector jacks, plastic casings and physical layer transceivers. From a limited number of suppliers, we obtain switching fabric semiconductors, which are used in our Ethernet switches and internet gateway products; wireless local area network chipsets which are used in our wireless products and mobile network chipsets which are used in our wireless gateways and hotspots. Our third party manufacturers generally purchase these components on our behalf on a purchase order basis. If these sources fail to satisfy our supply requirements, our ability to meet scheduled product deliveries would be harmed and we may lose sales and experience increased component costs.
We currently outsource warehousing and distribution logistics to four main third-party providers who are responsible for warehousing, distribution logistics and order fulfillment. In addition, these parties are also responsible for some configuration and re-packaging of our products including bundling components to form kits, inserting appropriate documentation, disk drive configuration, and adding power adapters. APL Logistics Americas, Ltd. in City of Industry, California serves the Americas region, Kerry Logistics Ltd. in Hong Kong serves the Asia Pacific region, DSV Solutions B.V. Netherlands serves the EMEA region, and Brightstar Logistics Pty Ltd. in Melbourne, VIC, Australia serves Australia and New Zealand.
Sales and Marketing
We work directly with our customers on market development activities, such as co-advertising, online promotions and video demonstrations, event sponsorship and sales associate training. We also participate in major industry trade shows and marketing events. Our marketing department is comprised of our channel marketing, product marketing and corporate marketing groups.
Our channel marketing team focuses on working with the sales teams to maximize our participation in channel partner marketing activities and merchandise our products both online and in store.
Our product marketing group focuses on product strategy, product development roadmaps, the new product introduction process, product lifecycle management, demand assessment and competitive analysis. The group works closely with our sales and research and development groups to align our product development roadmap to meet customer technology demands from a strategic perspective. The group also ensures that product development activities, product launches, and ongoing demand and supply planning occur in a well-managed, timely basis in coordination with our development, manufacturing, and sales groups, as well as our ODM and sales channel partners.
Our corporate marketing group is responsible for defining and building our corporate brand and supporting the business units with creative and marketing strategies and tactics. The group focuses on defining our brand promise and marketing messages on a worldwide basis. This group is also responsible for driving the social media and online marketing strategy, public relations, install base marketing programs, community engagement programs, sponsorships and events, and corporate websites worldwide, as well as creative production for all product categories.
We conduct most of our international sales and marketing operations through wholly-owned subsidiaries, which operate via sales and marketing subsidiaries and branch offices worldwide.
Customer Support
We design our products with ease-of-use top of mind. We respond globally to customer inquiries through a variety of channels including phone, chat, community, social, and email. Customers can also get self-help service through the comprehensive
6
knowledgebase and the user forum from our website. Customer support is provided through a combination of a limited number of permanent employees and use of subcontracted, out-sourced resources. Our permanent employees design our technical support database and are responsible for training and managing our outsourced sub-contractors. They also handle escalations from the outsourced resources. We utilize the information gained from customers by our customer support organization to enhance our product offerings, including further simplifying the installation process.
Intellectual Property
We believe that our continued success will depend primarily on the technical expertise, speed of technology implementation, creative skills and management abilities of our officers and key employees, plus ownership of a limited but important set of copyrights, trademarks, trade secrets and patents. We primarily rely on a combination of copyright, trademark, trade secret, and patent laws, nondisclosure agreements with employees, consultants and suppliers and other contractual provisions to establish, maintain and protect our proprietary rights. We hold approximately 190 issued United States patents that expire between years 2018 and 2037 and 90 foreign patents that expire between 2018 and 2034. In addition, we currently have approximately 95 pending United States and foreign patent applications related to technology and products offered by us. We also rely on third-party licensors for patented hardware and software license rights in technology that are incorporated into and are necessary for the operation and functionality of our products. Our success will depend in part on our continued ability to have access to these technologies.
We have trade secret rights for our products, consisting mainly of product design, technical product documentation and software. We also own, or have applied for registration of trademarks, in connection with our products in the United States and internationally, including NETGEAR, AirCard, AirCard Enabled, Around Town, Arlo, Arlo Q, Arlo logo, Orbi, Genie, Genie+, the Genie logo, ReadyShare, Neo TV, the Neo TV logo, ProSafe, RangeMax, ReadyNAS, ReadyDrop, ReadyData, ReadyCloud, ReadyDLNA, ReadyRecover, ProSecure, the ProSecure logo, Push2TV, Streampro, Centria, My Media, Nighthawk, Nighthawk x4, Nighthawk x6, Overdrive, Overdrive 3G/4G Mobile Hotspot logo, Zing Mobile Hotspot, Mingle, Vue, VueZone, Ufast, NETGEAR Insight, NETGEAR UP, VIZN, FASTLANE, FASTLANE3, Every Angle Covered, Placemeter, the Placemeter logo, and X-RAID.
We have registered a number of internet domain names that we use for electronic interaction with our customers including dissemination of product information, marketing programs, product registration, sales activities, and other commercial uses.
Seasonal Business
We have historically experienced increased net sales in our third and fourth fiscal quarters as compared to the first and second quarters in our fiscal year due to seasonal demand from consumer markets primarily relating to the beginning of the school year and the holiday season. This pronounced seasonality has been previously offset by irregular and significant purchases from customers in other markets, such as the service provider market. As the proportion of our revenue derived from consumer focused products grows relative to our overall business, the impact of the seasonally high third and fourth fiscal quarters shall become more pronounced than experienced in prior years.
Backlog
We believe the actual amount of order backlog at any particular time is not a meaningful indication of our future business. Our backlog consists of products for which customer purchase orders have been received that are scheduled or in the process of being scheduled for shipment. While we expect to fulfill the order backlog within the current year, most orders are subject to rescheduling or cancellation with little or no penalties. Because of the possibility of customer changes in product scheduling or order cancellation, our backlog as of any particular date may not be an indicator of net sales for any subsequent period. Accordingly, backlog should not be considered a reliable indicator of our ability to achieve any particular level of revenue or financial performance.
Environmental Laws
Our products and manufacturing process are subject to numerous governmental regulations, which cover both the use of various materials as well as environmental concerns. Environmental issues such as pollution and climate change have had significant legislative and regulatory efforts on a global basis, and there are expected to be additional changes to the regulations in these areas. These changes could directly increase the cost of energy, which may have an impact on the way we manufacture products or utilize energy to produce our products. In addition, any new regulations or laws in the environmental area might
7
increase the cost of raw materials we use in our products and the cost of compliance. Other regulations in the environmental area may require us to continue to monitor and ensure proper disposal or recycling of our products. To the best of our knowledge, we maintain compliance with all current government regulations concerning our production processes for all locations in which we operate. Since we operate on a global basis, this is also a complex process that requires continual monitoring of regulations and an ongoing compliance process to ensure that we and our suppliers are in compliance with all existing regulations.
Employees
As of December 31,
2017
, we had
1,008
full-time employees, with
334
in sales, marketing and technical support,
359
in research and development,
137
in operations, and
178
in finance, information systems and administration. We also utilize a number of temporary staff to supplement our workforce. We have never had a work stoppage among our employees and no personnel are represented under collective bargaining agreements.
Available Information
Our Annual Report on Form 10-K, Quarterly Reports on Form 10-Q, Current Reports on Form 8-K, and amendments to reports filed pursuant to Sections 13(a) and 15(d) of the Securities Exchange Act of 1934, as amended (the "Exchange Act"), are filed with the Securities Exchange Commission (the "SEC"). We are subject to the informational requirements of the Exchange Act and file or furnish reports, proxy statements, and other information with the SEC. You may read and copy our reports, proxy statements and other information filed by us at the SEC's Public Reference Room located at 100 F Street, N.E., Washington, D.C. 20549. Please call the SEC at 1-800-SEC-0330 for further information about the Public Reference Room. Our filings are also available to the public over the Internet at the SEC's website at
http://www.sec.gov.
Our website provides a link to our SEC filings, which are available free of charge on the same day such filings are made. The specific location on the website where these reports can be found is http://investor.netgear.com/sec.cfm. Our website also provides a link to Section 16 filings which are available free of charge on the same day as such filings are made. Information contained on these websites is not a part of this Annual Report on Form 10-K.
Executive Officers of the Registrant
The following table sets forth the names, ages and positions of our executive officers as of February 10, 2018.
|
Name
|
Age
|
Position
|
|
|
Patrick C.S. Lo
|
61
|
|
Chairman and Chief Executive Officer
|
|
Christine M. Gorjanc
|
61
|
|
Chief Financial Officer
|
|
Patrick J. Collins III
|
46
|
|
Senior Vice President, Arlo Products and Services
|
|
Michael F. Falcon
|
61
|
|
Chief Operations Officer
|
|
David J. Henry
|
45
|
|
Senior Vice President, Connected Home Products and Services
|
|
Andrew W. Kim
|
47
|
|
Senior Vice President of Corporate Development, General Counsel and Corporate Secretary
|
|
John P. McHugh
|
57
|
|
Senior Vice President, SMB Products and Services
|
|
Mark G. Merrill
|
63
|
|
Chief Technology Officer
|
|
Tamesa T. Rogers
|
44
|
|
Senior Vice President, Human Resources
|
|
Michael A. Werdann
|
49
|
|
Senior Vice President of Worldwide Sales
|
Patrick C.S. Lo
is our co-founder and has served as our Chairman and Chief Executive Officer since March 2002. He previously served as interim general manager of our former retail business unit and as interim general manager of our former service provider business unit. Patrick founded NETGEAR with Mark G. Merrill with the singular vision of providing the appliances to enable everyone in the world to connect to the high speed Internet for information, communication, business transactions, education, and entertainment. From 1983 until 1995, Mr. Lo worked at Hewlett-Packard Company, where he served in various management positions in sales, technical support, product management, and marketing in the U.S. and Asia. Mr. Lo was named the Ernst & Young National Technology Entrepreneur of the Year in 2006. Mr. Lo received a B.S. degree in electrical engineering from Brown University.
8
Christine M. Gorjanc
has served as our Chief Financial Officer since January 2008, Chief Accounting Officer from December 2006 to January 2008 and Vice President, Finance from November 2005 to December 2006. From September 1996 through November 2005, Ms. Gorjanc served as Vice President, Controller, Treasurer and Assistant Secretary for Aspect Communications Corporation, a provider of workforce and customer management solutions. From October 1988 through September 1996, Ms. Gorjanc served as the Manager of Tax for Tandem Computers, Inc., a provider of fault-tolerant computer systems. Prior to that, Ms. Gorjanc served in management positions at Xidex Corporation, a manufacturer of storage devices, and spent eight years in public accounting with a number of accounting firms. Ms. Gorjanc is a member of the Board of Directors of Invitae Corporation. Ms. Gorjanc holds a B.A. in Accounting (with honors) from the University of Texas at El Paso and a M.S. in Taxation from Golden Gate University.
Patrick J. Collins III
h
as served as our Senior Vice President of Arlo Products and Services since January 2017. He has been with NETGEAR since June 2008, most recently serving as our Senior Vice President of Smart Home Products from January 2016 to December 2016, Vice President of Home Automation Products from March 2014 to January 2016, Chief Information Officer from November 2012 to March 2014, and Vice President of Information Technology from October 2010 to November 2012. Prior to NETGEAR, Mr. Collins held leadership positions in the consulting services groups of Oracle Corporation and Computer Sciences Corporation. Mr. Collins received a B.S. degree in Computer Information Systems from Alvernia University.
Michael F. Falcon
has served as our Chief Operations Officer since November 2017, Senior Vice President of Worldwide Operations and Support from January 2009 to November 2017, Senior Vice President of Operations from March 2006 to January 2009, and Vice President of Operations from November 2002 to March 2006. Prior to joining us, Mr. Falcon was at Quantum Corporation, where he served as Vice President of Operations and Supply Chain Management from September 1999 to November 2002, Meridian Data (acquired by Quantum Corporation), where he served as Vice President of Operations from April 1999 to September 1999, and Silicon Valley Group, where he served as Director of Operations, Strategic Planning and Supply Chain Management from February 1989 to April 1999. Prior to February 1989, Mr. Falcon served in management positions at SCI Systems, an electronics manufacturer, Xerox Imaging Systems, a provider of scanning and text recognition solutions, and Plantronics, Inc., a provider of lightweight communication headsets. Mr. Falcon received a B.A. degree in Economics with honors from the University of California, Santa Cruz and has completed coursework in the M.B.A. program at Santa Clara University.
David J. Henry
has served as our Senior Vice President of Connected Home Products and Services since January 2017. He has worldwide responsibility for both Product Marketing and Engineering of our home networking products, encompassing product strategy, development and delivery. He has been with NETGEAR since July 2004, most recently serving as our Senior Vice President of Home Networking from January 2016 to December 2016, Vice President of Product Management of our retail business unit from March 2011 to January 2016 and as our Senior Director of Product Marketing from October 2010 to March 2011. Prior to NETGEAR, Mr. Henry was a senior product manager for the high technology vertical application at Siebel Systems (acquired by Oracle Corporation). His professional experience also includes business process and information technology consulting with Deloitte Consulting. Mr. Henry received a B.S. degree in Electrical Engineering, with an emphasis on Signal Processing, from the University of Washington and an M.B.A. from the Stanford Graduate School of Business.
Andrew W. Kim
has served as our Senior Vice President of Corporate Development, General Counsel and Corporate Secretary since July 2013, Vice President, Legal and Corporate Development and Corporate Secretary from October 2008 until July 2013, and as our Associate General Counsel from March 2008 to October 2008. Prior to joining NETGEAR, Mr. Kim served as Special Counsel in the Corporate and Securities Department of Wilson Sonsini Goodrich & Rosati, a private law firm, where he represented public and private technology companies in a wide range of matters, including mergers and acquisitions, debt and equity financing arrangements, securities law compliance and corporate governance from 2000 to 2003 and 2006 to 2008. In between his two terms at Wilson Sonsini Goodrich & Rosati, Mr. Kim served as Partner in the Business and Finance Department of the law firm Schwartz Cooper Chartered in Chicago, Illinois, and was an Adjunct Professor of Entrepreneurship at the Illinois Institute of Technology. Mr. Kim holds a J.D. from Cornell Law School, and received a B.A. degree in history from Yale University.
John P. McHugh
has served as our Senior Vice President of SMB Products and Services since January 2017, overseeing the development and delivery of the industry’s premiere line of networking and storage solutions for SMB customers. He previously served as our Senior Vice President and General Manager of the Commercial Business Unit from July 2013 to December 2016. Prior to joining us in July 2013, Mr. McHugh led the commercial networking business at both Nortel and Hewlett-Packard. During his career, Mr. McHugh has held leadership roles in R&D, Marketing and Manufacturing, as well as having over 12 years of experience in General Management. Mr. McHugh holds a BS degree in Electrical Engineering and in Computer Science from Rose-Hulman Institute of Technology.
9
Mark G. Merrill
is our co-founder and has served as our Chief Technology Officer since March 2015. In this role, Mr. Merrill continues to guide the emerging market efforts and work closely with the RF engineering team to ensure technical leadership of our wireless networking products. Previously, Mr. Merrill served as our Senior Vice President of Advanced Engineering from February 2013 to February 2015 and as our Chief Technology Officer from January 2003 to April 2013. From September 1999 to January 2003, he served as Vice President of Engineering and served as Director of Engineering from September 1995 to September 1999. Mr. Merrill received both a B.S. degree and an M.S. degree in Electrical Engineering from Stanford University.
Tamesa T. Rogers
has served as our Senior Vice President, Human Resources since July 2013, Vice President, Human Resources from January 2009 to July 2013, Director, Worldwide Human Resources from September 2006 to January 2009 and as our Senior Human Resources Manager from December 2003 to September 2006. From March 2000 to December 2003, Ms. Rogers worked at TriNet Employer Group, a professional employer organization, as a Human Resources Manager, providing HR consulting to technology companies throughout Silicon Valley. Prior to TriNet, Ms. Rogers served in various human resources functions in several Northern California companies. Ms. Rogers received a B.A. in Communication Studies from the University of California, Santa Barbara and an M.S. in Counseling from California State University, Hayward.
Michael A. Werdann
has served as our Senior Vice President of Worldwide Sales since October 2015, Worldwide Senior Vice President of Sales for Consumer Products from March 2015 to October 2015 and Vice President of Americas Sales from December 2003 to March 2015. Since joining us in 1998, Mr. Werdann has served as our United States Director of Sales, E-Commerce and DMR from December 2002 to December 2003 and as our Eastern Regional Sales Director from October 1998 to December 2002. Prior to joining us, Mr. Werdann worked for three years at Iomega Corporation, a computer hardware company, as a Sales Director for the value added reseller sector. Mr. Werdann holds a B.S. Degree in Communications from Seton Hall University.
|
Item 1A.
|
Risk Factors
|
Investing in our common stock involves a high degree of risk. The risks described
below are not exhaustive of the risks that might affect our business. Other risks,
including those we currently deem immaterial, may also impact our business. Any of
the following risks could materially adversely affect our business operations,
results of operations and financial condition and could result in a significant
decline in our stock price.
Before deciding to purchase, hold or sell our common stock, you should carefully consider the risks described in this section. This section should be read in conjunction with the consolidated financial statements and accompanying notes thereto, and Management's Discussion and Analysis of Financial Condition and Results of Operations included in this Annual Report on Form 10-K.
We expect our operating results to fluctuate on a quarterly and annual basis, which could cause our stock price to fluctuate or decline.
Our operating results are difficult to predict and may fluctuate substantially from quarter-to-quarter or year-to-year for a variety of reasons, many of which are beyond our control. If our actual results were to fall below our estimates or the expectations of public market analysts or investors, our quarterly and annual results would be negatively impacted and the price of our stock could decline. Other factors that could affect our quarterly and annual operating results include those listed in the risk factors section of this report and others such as:
|
•
|
changes in the pricing policies of or the introduction of new products by us or our competitors;
|
|
•
|
introductions of new technologies and changes in consumer preferences that result in either unanticipated or unexpectedly rapid product category shifts;
|
|
•
|
slow or negative growth in the networking product, personal computer, Internet infrastructure, smart home, home electronics and related technology markets, as well as decreased demand for Internet access;
|
|
•
|
seasonal shifts in end market demand for our products, particularly in our Connected Home and Arlo business segments;
|
|
•
|
delays in the introduction of new products by us or market acceptance of these products;
|
10
|
•
|
unanticipated decreases or delays in purchases of our products by our significant traditional and online retail customers;
|
|
•
|
component supply constraints from our vendors;
|
|
•
|
unanticipated increase in costs, including air freight, associated with shipping and delivery of our products;
|
|
•
|
shift in overall product mix sales from higher to lower margin products, or from one business segment to another, that would adversely impact our margins;
|
|
•
|
foreign currency exchange rate fluctuations in the jurisdictions where we transact sales and expenditures in local currency;
|
|
•
|
the inability to maintain stable operations by our suppliers and other parties with which we have commercial relationships;
|
|
•
|
discovery of security vulnerabilities in our products, services or systems, leading to negative publicity, decreased demand or potential liability;
|
|
•
|
unfavorable level of inventory and turns;
|
|
•
|
changes in or consolidation of our sales channels and wholesale distributor relationships or failure to manage our sales channel inventory and warehousing requirements;
|
|
•
|
delay or failure to fulfill orders for our products on a timely basis;
|
|
•
|
delay or failure of our service provider customers to purchase at the volumes that they forecast;
|
|
•
|
changes in tax rates or adverse changes in tax laws that expose us to additional income tax liabilities;
|
|
•
|
changes in international trade policy and potential U.S. tax overhaul that adversely affect customs, tax or duty rates, including consequences of the "Brexit" process in the United Kingdom;
|
|
•
|
operational disruptions, such as transportation delays or failure of our order processing system, particularly if they occur at the end of a fiscal quarter;
|
|
•
|
disruptions or delays related to our financial and enterprise resource planning systems;
|
|
•
|
our inability to accurately forecast product demand, resulting in increased inventory exposure;
|
|
•
|
allowance for bad debts exposure with our existing customers and new customers, particularly as we expand into new international markets;
|
|
•
|
geopolitical disruption, including sudden changes in immigration policies, leading to disruption in our workforce or delay or even stoppage of our operations in manufacturing, transportation, technical support and research and development;
|
|
•
|
terms of our contracts with customers or suppliers that cause us to incur additional expenses or assume additional liabilities;
|
|
•
|
an increase in price protection claims, redemptions of marketing rebates, product warranty and stock rotation returns or allowance for doubtful accounts;
|
|
•
|
litigation involving alleged patent infringement;
|
|
•
|
epidemic or widespread product failure, or unanticipated safety issues, in one or more of our products;
|
|
•
|
any changes in accounting rules, including the potential impact of our adoption of new revenue recognition standards;
|
11
|
•
|
challenges associated with integrating acquisitions that we make, or with realizing value from our strategic investments in other companies;
|
|
•
|
failure to effectively manage our third party customer support partners, which may result in customer complaints and/or harm to the NETGEAR brand;
|
|
•
|
our inability to monitor and ensure compliance with our anti-corruption compliance program and domestic and international anti-corruption laws and regulations, whether in relation to our employees or with our suppliers or customers;
|
|
•
|
labor unrest at facilities managed by our third-party manufacturers;
|
|
•
|
unanticipated shift or decline in profit by geographical region that would adversely impact our tax rate; and
|
|
•
|
our failure to implement and maintain the appropriate internal controls over financial reporting which may result in restatements of our financial statements.
|
As a result, period-to-period comparisons of our operating results may not be meaningful, and you should not rely on them as an indication of our future performance.
Our stock price may be volatile and your investment in our common stock could suffer a decline in value.
There has been significant volatility in the market price and trading volume of securities of technology and other companies, which may be unrelated to the financial performance of these companies. These broad market fluctuations may negatively affect the market price of our common stock.
Some specific factors that may have a significant effect on our common stock market price include:
|
•
|
actual or anticipated fluctuations in our operating results or our competitors' operating results;
|
|
•
|
actual or anticipated changes in the growth rate of the general networking sector, our growth rates or our competitors' growth rates;
|
|
•
|
conditions in the financial markets in general or changes in general economic conditions, including government efforts to stabilize currencies;
|
|
•
|
actual or anticipated changes in governmental regulation, including taxation and tariff policies;
|
|
•
|
interest rate or currency exchange rate fluctuations;
|
|
•
|
our ability to forecast or report accurate financial results; and
|
|
•
|
changes in stock market analyst recommendations regarding our common stock, other comparable companies or our industry generally.
|
Our plan to separate into two independent, publicly traded companies is subject to various risks and uncertainties and may not be completed in accordance with the expected plans or anticipated timeline, or at all, and will involve significant time, expense and management attention, any of which could negatively impact our businesses, financial condition, results of operations and prospects.
On February 6, 2018, we announced that our Board of Directors has unanimously approved the pursuit of a separation of our Arlo business from NETGEAR (the “Separation”). The Separation is expected to be effected through an initial public offering (“IPO”) of newly issued shares of the common stock of Arlo Technologies, Inc. (“Arlo”), which will hold our Arlo business. We expect Arlo to issue less than 20% of its common stock in the IPO, with NETGEAR to retain the remaining interest. We expect Arlo to confidentially submit a draft registration statement with the SEC in the first half of 2018, with the IPO to be completed in the second half of 2018.
12
We currently intend that, following the expiration of the IPO, we will complete the Separation by distributing the shares of Arlo common stock we then hold to our stockholders in a manner generally intended to qualify as tax-free to our stockholders for U.S. federal income tax purposes (the “Distribution”).
The Separation, including the IPO and the Distribution, will be subject to market, tax and legal considerations, final approval by our Board of Directors and other customary requirements.
As the majority stockholder of Arlo following the IPO, we could be adversely affected if the assets and resources of Arlo are insufficient on a standalone basis, or if Arlo encounters difficulties in acquiring or integrating additional assets or resources to conduct its business. In addition, other unanticipated developments, including difficulty in separating the assets and resources of our Arlo business from the rest of our assets and resources, changes to the competitive environment for Arlo’s or our respective businesses, possible delays in obtaining or failure to obtain tax opinions, regulatory or other approvals or clearances to approve or facilitate the Separation, including the IPO and the Distribution, uncertainty in financial markets and other challenges in executing the Separation, including the IPO and the Distribution, as planned, could delay or prevent the IPO or the Distribution, or cause the Separation, including the IPO and the Distribution to occur on terms or conditions that are different or less favorable than expected.
We expect that the process of completing the Separation, including the IPO and the Distribution, will be time-consuming and involve significant costs and expenses, which may be significantly higher than those currently anticipated and may not yield a discernible benefit if the Separation, including the IPO and the Distribution, is not completed. Furthermore, the time and energy required from our senior management and other employees to plan and execute the Separation may lead to increased costs, increased expenses, negative effects on relationships with business partners, suppliers, and customers, disruptions in operations and ultimately harm our businesses, financial condition, results of operations and prospects. We may also experience difficulty attracting, retaining and motivating employees during the pendency of the Separation, including the IPO and the Distribution, which could also harm our businesses, financial condition, results of operations and prospects.
If the Separation, including the IPO and the Distribution, is completed, there is a further risk that the sum of the value of the two independent, publicly traded companies will be less than the value of NETGEAR before the Separation. There is also a risk that we may not be able to achieve the full strategic, operational and financial benefits to us and our Arlo business that are anticipated to result from the Separation, including the IPO and the Distribution, or that such benefits may be delayed or not occur at all.
This Annual Report on Form 10-K does not constitute an offer to sell or a solicitation of an offer to buy securities, and shall not constitute an offer, solicitation or sale in any jurisdiction in which such offer, solicitation or sale would be unlawful prior to registration or qualification under the securities laws of that jurisdiction.
Some of our competitors have substantially greater resources than we do, and to be competitive we may be required to lower our prices or increase our sales and marketing expenses, which could result in reduced margins or loss of market share.
We compete in a rapidly evolving and fiercely competitive market, and we expect competition to continue to be intense, including price competition. Our principal competitors in the home market for networking and smart home devices include Amazon.com, Apple, Arris, ASUS, Belkin/Linksys, Devolo, D-Link, Eero, Google, Logitech, Luma, Google, Ring, Samsung, Swann, Synology, Symantec, TP-Link and Western Digital. Our principal competitors in the business market include Allied Telesys, Barracuda, Buffalo, Cisco Systems, Dell, D-Link, Fortinet, Hewlett-Packard Enterprise, Huawei, QNAP Systems, Seagate Technology, SonicWall, Synology, TP-Link, Ubiquiti, WatchGuard and Western Digital. Our principal competitors in the broadband service provider market include Actiontec, Airties, Arcadyan, ARRIS, ASUS, AVM, Canary, Compal Broadband, D-Link, Eero, Franklin, Google, Hitron, Huawei, Novatel Wireless, Plume, Sagem, Sercomm, SMC Networks, TechniColor, TP-Link, Ubee, ZTE and ZyXEL. Other competitors include numerous local vendors such as Xiaomi in China, and Buffalo in Japan. In addition, these local vendors may target markets outside of their local regions and may increasingly compete with us in other regions worldwide. Our potential competitors also include other consumer electronics vendors, including LG Electronics, Microsoft, Panasonic, Sony, Toshiba and Vizio, who could integrate networking and streaming capabilities into their line of products, such as televisions, set top boxes and gaming consoles, and our channel customers who may decide to offer self-branded networking products. We also face competition from service providers who may bundle a free networking device with their broadband service offering, which would reduce our sales if we are not the supplier of choice to those service providers. In the service provider space, we are also facing significant and increased competition from original design manufacturers, or ODMs, and contract manufacturers who are selling and attempting to sell their products directly to service providers around the world.
13
Many of our existing and potential competitors have longer operating histories, greater name recognition and substantially greater financial, technical, sales, marketing and other resources. These competitors may, among other things, undertake more extensive marketing campaigns, adopt more aggressive pricing policies, obtain more favorable pricing from suppliers and manufacturers, and exert more influence on sales channels than we can. In addition, certain competitors may have different business models, such as integrated manufacturing capabilities, that may allow them to achieve cost savings and to compete on the basis of price. Other competitors may have fewer resources, but may be more nimble in developing new or disruptive technology or in entering new markets. We anticipate that current and potential competitors will also intensify their efforts to penetrate our target markets. For example, price competition is intense in our industry in certain geographical regions and product categories. Many of our competitors in the service provider and retail spaces price their products significantly below our product costs in order to gain market share. Average sales prices have declined in the past and may again decline in the future. These competitors may have more advanced technology, more extensive distribution channels, stronger brand names, greater access to shelf space in retail locations, bigger promotional budgets and larger customer bases than we do. In addition, many of these competitors leverage a broader product portfolio and offer lower pricing as part of a more comprehensive end-to-end solution which we may not have. These companies could devote more capital resources to develop, manufacture and market competing products than we could. Our competitors may also acquire other companies in the market and leverage combined resources to gain market share. If any of these companies are successful in competing against us, our sales could decline, our margins could be negatively impacted and we could lose market share, any of which could seriously harm our business and results of operations.
If we fail to continue to introduce or acquire new products that achieve broad market acceptance on a timely basis, we will not be able to compete effectively and we will be unable to increase or maintain net revenue and gross margins.
We operate in a highly competitive, quickly changing environment, and our future success depends on our ability to develop or acquire, and introduce new products that achieve broad market acceptance. Our future success will depend in large part upon our ability to identify demand trends in the consumer, business and service provider markets, and to quickly develop or acquire, and manufacture and sell products that satisfy these demands in a cost-effective manner. In order to differentiate our products from our competitors' products, we must continue to increase our focus and capital investment in research and development, including software development. For example, we have committed a substantial amount of resources to the development, manufacture, marketing and sale of our Nighthawk home networking products, Arlo Smart security cameras and Orbi WiFi system, and to introducing additional and improved models in these lines. If these products do not continue to maintain or achieve widespread market acceptance, or if we are unsuccessful in capitalizing on other smart home market opportunities, our future growth may be slowed and our financial results could be harmed. Also, as the mix of our business increasingly includes new products and services that require additional investment, this shift may adversely impact our margins, at least in the near-term. Successfully predicting demand trends is difficult, and it is very difficult to predict the effect that introducing a new product will have on existing product sales. We will also need to respond effectively to new product announcements by our competitors by quickly introducing competitive products.
In addition, we have acquired companies and technologies in the past and as a result, have introduced new product lines in new markets. We may not be able to successfully manage integration of the new product lines with our existing products. Selling new product lines in new markets will require our management to learn different strategies in order to be successful. We may be unsuccessful in launching a newly acquired product line in new markets which requires management of new suppliers, potential new customers and new business models. Our management may not have the experience of selling in these new markets and we may not be able to grow our business as planned. For example, in 2013, we acquired the AirCard product line from Sierra Wireless. Similarly, we acquired certain technology and intellectual property in connection with our acquisition of AVAAK, Inc. in 2012 that was key to the development of our Arlo Smart security camera products. If we are unable to effectively and successfully further develop these new product lines, we may not be able to increase or maintain our sales and our gross margins may be adversely affected.
We have experienced delays and quality issues in releasing new products in the past, which resulted in lower quarterly net revenue than expected. In addition, we have experienced, and may in the future experience, product introductions that fall short of our projected rates of market adoption. Online Internet reviews of our products are increasingly becoming a significant factor in the success of our new product launches, especially in our Connected Home and Arlo business segments. If we are unable to quickly respond to negative reviews, including end user reviews posted on various prominent online retailers, our ability to sell these products will be harmed. Any future delays in product development and introduction, or product introductions that do not meet broad market acceptance, or unsuccessful launches of new product lines could result in:
|
•
|
loss of or delay in revenue and loss of market share;
|
|
•
|
negative publicity and damage to our reputation and brand;
|
14
|
•
|
a decline in the average selling price of our products;
|
|
•
|
adverse reactions in our sales channels, such as reduced shelf space, reduced online product visibility, or loss of sales channel; and
|
|
•
|
increased levels of product returns.
|
Throughout the past few years, we have significantly increased the rate of our new product introductions. If we cannot sustain that pace of product introductions, either through rapid innovation or acquisition of new products or product lines, we may not be able to maintain or increase the market share of our products. In addition, if we are unable to successfully introduce or acquire new products with higher gross margins, or if we are unable to improve the margins on our previously introduced and rapidly growing product lines, our net revenue and overall gross margin would likely decline.
We rely on a limited number of traditional and online retailers, wholesale distributors and service provider customers for a substantial portion of our sales, and our net revenue could decline if they refuse to pay our requested prices or reduce their level of purchases or if there is significant consolidation in our customer base that results in fewer customers for our products.
We sell a substantial portion of our products through traditional and online retailers, including Best Buy Co., Inc., Amazon.com, Inc. and their affiliates, wholesale distributors, including Ingram Micro, Inc. and Tech Data Corporation, and service providers, such as AT&T. We expect that a significant portion of our net revenue will continue to come from sales to a small number of customers for the foreseeable future. In addition, because our accounts receivable are often concentrated with a small group of purchasers, the failure of any of them to pay on a timely basis, or at all, would reduce our cash flow. We are also exposed to increased credit risk if any one of these limited numbers of customers fails or becomes insolvent. We generally have no minimum purchase commitments or long-term contracts with any of these customers. These purchasers could decide at any time to discontinue, decrease or delay their purchases of our products. If our customers increase the size of their product orders without sufficient lead-time for us to process the order, our ability to fulfill product demands would be compromised. These customers have a variety of suppliers to choose from and therefore can make substantial demands on us, including demands on product pricing and on contractual terms, which often results in the allocation of risk to us as the supplier. Accordingly, the prices that they pay for our products are subject to negotiation and could change at any time. Our ability to maintain strong relationships with our principal customers is essential to our future performance. If any of our major customers reduce their level of purchases or refuse to pay the prices that we set for our products, our net revenue and operating results could be harmed. Furthermore, some of our customers are also our competitors in certain product categories, which could negatively influence their purchasing decisions. Our traditional retail customers have faced increased and significant competition from online retailers, and some of these traditional retail customers have increasingly become a smaller portion of our business. If key retail customers continue to reduce their level of purchases, our business could be harmed.
Additionally, concentration and consolidation among our customer base may allow certain customers to command increased leverage in negotiating prices and other terms of sale, which could adversely affect our profitability. If, as a result of increased leverage, customer pressures require us to reduce our pricing such that our gross margins are diminished, we could decide not to sell our products to a particular customer, which could result in a decrease in our revenue. Consolidation among our customer base may also lead to reduced demand for our products, elimination of sales opportunities, replacement of our products with those of our competitors and cancellations of orders, each of which would harm our operating results. Consolidation among our service provider customers worldwide may also make it more difficult to grow our service provider business, given the fierce competition for the already limited number of service providers worldwide and the long sales cycles to close deals. If consolidation among our customer base becomes more prevalent, our operating results may be harmed.
We obtain several key components from limited or sole sources, and if these sources fail to satisfy our supply requirements or we are unable to properly manage our supply requirements with our third-party manufacturers, we may lose sales and experience increased component costs.
Any shortage or delay in the supply of key product components would harm our ability to meet scheduled product deliveries. Many of the semiconductors used in our products are specifically designed for use in our products and are obtained from sole source suppliers on a purchase order basis. In addition, some components that are used in all our products are obtained from limited sources. These components include connector jacks, plastic casings and physical layer transceivers. We also obtain switching fabric semiconductors, which are used in our Ethernet switches and Internet gateway products, and wireless local area network chipsets, which are used in all of our wireless products, from a limited number of suppliers. Semiconductor suppliers have experienced and continue to experience component shortages themselves, such as with substrates used in manufacturing chipsets, which in turn adversely impact our ability to procure semiconductors from them. Our third-party manufacturers generally
15
purchase these components on our behalf on a purchase order basis, and we do not have any contractual commitments or guaranteed supply arrangements with our suppliers. If demand for a specific component increases, we may not be able to obtain an adequate number of that component in a timely manner. In addition, if worldwide demand for the components increases significantly, the availability of these components could be limited. Further, our suppliers may experience financial or other difficulties as a result of uncertain and weak worldwide economic conditions. Other factors which may affect our suppliers' ability or willingness to supply components to us include internal management or reorganizational issues, such as roll-out of new equipment which may delay or disrupt supply of previously forecasted components, or industry consolidation and divestitures, which may result in changed business and product priorities among certain suppliers. It could be difficult, costly and time consuming to obtain alternative sources for these components, or to change product designs to make use of alternative components. In addition, difficulties in transitioning from an existing supplier to a new supplier could create delays in component availability that would have a significant impact on our ability to fulfill orders for our products.
We provide our third-party manufacturers with a rolling forecast of demand, which they use to determine our material and component requirements. Lead times for ordering materials and components vary significantly and depend on various factors, such as the specific supplier, contract terms and demand and supply for a component at a given time. Some of our components have long lead times, such as wireless local area network chipsets, switching fabric chips, physical layer transceivers, connector jacks and metal and plastic enclosures. If our forecasts are not timely provided or are less than our actual requirements, our third-party manufacturers may be unable to manufacture products in a timely manner. If our forecasts are too high, our third-party manufacturers will be unable to use the components they have purchased on our behalf. The cost of the components used in our products tends to drop rapidly as volumes increase and the technologies mature. Therefore, if our third-party manufacturers are unable to promptly use components purchased on our behalf, our cost of producing products may be higher than our competitors due to an oversupply of higher-priced components. Moreover, if they are unable to use components ordered at our direction, we will need to reimburse them for any losses they incur.
If we are unable to obtain a sufficient supply of components, or if we experience any interruption in the supply of components, our product shipments could be reduced or delayed or our cost of obtaining these components may increase. Component shortages and delays affect our ability to meet scheduled product deliveries, damage our brand and reputation in the market, and cause us to lose sales and market share. For example, component shortages and disruptions in supply in the past have limited our ability to supply all the worldwide demand for our products, and our revenue was affected. At times we have elected to use more expensive transportation methods, such as air freight, to make up for manufacturing delays caused by component shortages, which reduces our margins. In addition, at times sole suppliers of highly specialized components have provided components that were either defective or did not meet the criteria required by our customers, resulting in delays, lost revenue opportunities and potentially substantial write-offs.
We depend on large, recurring purchases from certain significant customers, and a loss, cancellation or delay in purchases by these customers could negatively affect our revenue.
The loss of recurring orders from any of our more significant customers could cause our revenue and profitability to suffer. Our ability to attract new customers will depend on a variety of factors, including the cost-effectiveness, reliability, scalability, breadth and depth of our products. In addition, a change in the mix of our customers, or a change in the mix of direct and indirect sales, could adversely affect our revenue and gross margins.
Although our financial performance may depend on large, recurring orders from certain customers and resellers, we do not generally have binding commitments from them. For example:
|
•
|
our reseller agreements generally do not require substantial minimum purchases;
|
|
•
|
our customers can stop purchasing and our resellers can stop marketing our products at any time; and
|
|
•
|
our reseller agreements generally are not exclusive.
|
Further, our revenue may be impacted by significant one-time purchases which are not contemplated to be repeatable. While such purchases are reflected in our financial statements, we do not rely on and do not forecast for continued significant one-time purchases. As a result, lack of repeatable one-time purchases will adversely affect our revenue.
Because our expenses are based on our revenue forecasts, a substantial reduction or delay in sales of our products to, or unexpected returns from, customers and resellers, or the loss of any significant customer or reseller, could harm or otherwise have a negative impact to our operating results. Although our largest customers may vary from period to period, we anticipate that our operating results for any given period will continue to depend on large orders from a small number of customers.
16
We depend on a limited number of third-party manufacturers for substantially all of our manufacturing needs. If these third-party manufacturers experience any delay, disruption or quality control problems in their operations, we could lose market share and our brand may suffer.
All of our products are manufactured, assembled, tested and generally packaged by a limited number of third-party manufacturers, including original design manufacturers, or ODMs, and original equipment manufacturers, as well as contract manufacturers. In most cases, we rely on these manufacturers to procure components and, in some cases, subcontract engineering work. Some of our products are manufactured by a single manufacturer. For example, we currently rely on a single manufacturer for certain of our Arlo Smart security cameras. We do not have any long-term contracts with any of our third-party manufacturers. Some of these third-party manufacturers produce products for our competitors. Due to changing economic conditions, the viability of some of these third-party manufacturers may be at risk. Our ODMs are increasingly refusing to work with us on certain projects, such as projects for manufacturing products for our service provider customers. Because our service provider customers command significant resources, including for software support, and demand extremely competitive pricing, our ODMs are starting to refuse to engage on service provider terms. The loss of the services of any of our primary third-party manufacturers could cause a significant disruption in operations and delays in product shipments. Qualifying a new manufacturer and commencing volume production is expensive and time consuming. Ensuring that a contract manufacturer is qualified to manufacture our products to our standards is time consuming. In addition, there is no assurance that a contract manufacturer can scale its production of our products at the volumes and in the quality that we require. If a contract manufacturer is unable to do these things, we may have to move production for the products to a new or existing third party manufacturer which would take significant effort and our business may be harmed. In addition, as we contemplate moving manufacturing into different jurisdictions, we will be subject to additional significant challenges in ensuring that quality, processes and costs, among other issues, are consistent with our expectations. For example, while we expect our manufacturers to be responsible for penalties assessed on us because of excessive failures of the products, there is no assurance that we will be able to collect such reimbursements from these manufacturers, which causes us to take on additional risk for potential failures of our products.
Our reliance on third-party manufacturers also exposes us to the following risks over which we have limited control:
|
•
|
unexpected increases in manufacturing and repair costs;
|
|
•
|
inability to control the quality and reliability of finished products;
|
|
•
|
inability to control delivery schedules;
|
|
•
|
potential liability for expenses incurred by third-party manufacturers in reliance on our forecasts that later prove to be inaccurate;
|
|
•
|
potential lack of adequate capacity to manufacture all or a part of the products we require; and
|
|
•
|
potential labor unrest affecting the ability of the third-party manufacturers to produce our products.
|
All of our products must satisfy safety and regulatory standards and some of our products must also receive government certifications. Our third party manufacturers are primarily responsible for obtaining most regulatory approvals for our products. If our third party manufacturers fail to obtain timely domestic or foreign regulatory approvals or certificates, we would be unable to sell our products and our sales and profitability could be reduced, our relationships with our sales channel could be harmed, and our reputation and brand would suffer.
Specifically, substantially all of our manufacturing occurs in the Asia Pacific region and any disruptions from natural disasters, health epidemics and political, social and economic instability would affect the ability of our third party manufacturers to manufacture our products. In addition, our third party manufacturers in China have continued to increase our costs of production, particularly in the past couple of years. If these costs continue to increase, it may affect our margins and ability to lower prices for our products to stay competitive. Labor unrest in China may also affect our third party manufacturers as workers may strike and cause production delays. If our third party manufacturers fail to maintain good relations with their employees or contractors, and production and manufacturing of our products is affected, then we may be subject to shortages of products and quality of products delivered may be affected. Further, if our manufacturers or warehousing facilities are disrupted or destroyed, we would have no other readily available alternatives for manufacturing our products and our business would be significantly harmed.
As we continue to work with more third party manufacturers on a contract manufacturing basis, we are also exposed to additional risks not inherent in a typical ODM arrangement. Such risks may include our inability to properly source and qualify
17
components for the products, lack of software expertise resulting in increased software defects, and lack of resources to properly monitor the manufacturing process. In our typical ODM arrangement, our ODMs are generally responsible for sourcing the components of the products and warranting that the products will work against a product's specification, including any software specifications. In a contract manufacturing arrangement, we would take on much more, if not all, of the responsibility around these areas. If we are unable to properly manage these risks, our products may be more susceptible to defects and our business would be harmed.
Product security vulnerabilities, data protection breaches and cyber-attacks could disrupt our products or services, and any such disruption could increase our expenses, damage our reputation, harm our business and adversely affect our stock price.
Our products and services may contain unknown security vulnerabilities. For example, the firmware, software and open source software that we or our manufacturing partners have installed on our products may be susceptible to hacking or misuse. In addition, we offer a comprehensive online cloud management service paired with our Arlo Smart security cameras. If malicious actors compromise this cloud service, or if customer confidential information is accessed without authorization, our business will be harmed. Operating an online cloud service is a relatively new business for us and we may not have the expertise to properly manage risks related to data security and systems security. We rely on third-party providers for a number of critical aspects of our cloud services and customer support, including web hosting services, billing and payment processing, and consequently we do not maintain direct control over the security or stability of the associated systems. Our management has spent increasing amounts of time, effort and expense in this area, and in the event of the discovery of a significant product security vulnerability, we would incur additional substantial expenses and our business would be harmed. If we or our third-party providers are unable to successfully prevent breaches of security relating to our products, services or customer private information, including customer videos and customer personal identification information, or if these third-party systems failed for other reasons, it could result in litigation and potential liability for us, damage our brand and reputation, or otherwise harm our business.
If we do not effectively manage our sales channel inventory and product mix, we may incur costs associated with excess inventory, or lose sales from having too few products.
If we are unable to properly monitor, control and manage our sales channel inventory and maintain an appropriate level and mix of products with our wholesale distributors and within our sales channels, we may incur increased and unexpected costs associated with this inventory. We generally allow wholesale distributors and traditional retailers to return a limited amount of our products in exchange for other products. Under our price protection policy, if we reduce the list price of a product, we are often required to issue a credit in an amount equal to the reduction for each of the products held in inventory by our wholesale distributors and retailers. If our wholesale distributors and retailers are unable to sell their inventory in a timely manner, we might lower the price of the products, or these parties may exchange the products for newer products. Also, during the transition from an existing product to a new replacement product, we must accurately predict the demand for the existing and the new product.
We determine production levels based on our forecasts of demand for our products. Actual demand for our products depends on many factors, which makes it difficult to forecast. We have experienced differences between our actual and our forecasted demand in the past and expect differences to arise in the future. If we improperly forecast demand for our products we could end up with too many products and be unable to sell the excess inventory in a timely manner, if at all, or, alternatively we could end up with too few products and not be able to satisfy demand. This problem is exacerbated because we attempt to closely match inventory levels with product demand leaving limited margin for error. If these events occur, we could incur increased expenses associated with writing off excessive or obsolete inventory, lose sales, incur penalties for late delivery or have to ship products by air freight to meet immediate demand incurring incremental freight costs above the sea freight costs, a preferred method, and suffering a corresponding decline in gross margins.
System security risks, data protection breaches and cyber-attacks could disrupt our internal operations or information technology systems, and any such disruption could reduce our expected revenue, increase our expenses, damage our reputation and adversely affect our stock price.
Maintaining the security of our computer information systems and communication systems is a critical issue for us and our customers. Malicious actors may develop and deploy viruses and other advanced persistent threats that are designed to attack our systems, including our internal network, or those of our vendors or customers. Additionally, outside parties may attempt to fraudulently induce our employees to disclose sensitive information in order to gain access to our information technology systems, our data or our customers' data. We have established a crisis management plan and business continuity program. While we regularly test the plan and the program, there can be no assurance that the plan and program can withstand an actual or serious disruption in our business, including a data protection breach or cyber-attack. While we have established infrastructure and geographic redundancy for our critical systems, our ability to utilize these redundant systems requires further testing and we
18
cannot be assured that such systems are fully functional. For example, much of our order fulfillment process is automated and the order information is stored on our servers. A significant business interruption could result in losses or damages and harm our business. If our computer systems and servers go down at the end of a fiscal quarter, our ability to recognize revenue may be delayed until we are able to utilize back-up systems and continue to process and ship our orders. This could cause our stock price to decline significantly.
We devote considerable internal and external resources to network security, data encryption and other security measures to protect our systems and customer data, but these security measures cannot provide absolute security. In addition, many jurisdictions strictly regulate data privacy and protection and may impose significant penalties for failure to comply with these requirements. For example, the European Union's General Data Protection Regulation ("GDPR"), scheduled to take effect in May 2018, has required us to expend significant time and resources to prepare for compliance. Potential breaches of our security measures and the accidental loss, inadvertent disclosure or unapproved dissemination of proprietary information or sensitive or confidential data about us, our employees or our customers, including the potential loss or disclosure of such information or data as a result of hacking, fraud, social engineering or other forms of deception, could expose us, our customers or the individuals affected to a risk of loss or misuse of this information, result in litigation and potential liability for us, subject us to significant governmental fines, damage our brand and reputation, or otherwise harm our business. In addition, the cost and operational consequences of implementing further data protection measures could be significant.
We are exposed to adverse currency exchange rate fluctuations in jurisdictions where we transact in local currency, which could harm our financial results and cash flows.
Because a significant portion of our business is conducted outside the United States, we face exposure to adverse movements in foreign currency exchange rates. These exposures may change over time as business practices evolve, and they could have a material adverse impact on our results of operations, financial position and cash flows. Although a portion of our international sales are currently invoiced in United States dollars, we have implemented and continue to implement for certain countries and customers both invoicing and payment in foreign currencies. Our primary exposure to movements in foreign currency exchange rates relates to non-U.S. dollar denominated sales in Europe, Japan and Australia as well as our global operations, and non-U.S. dollar denominated operating expenses and certain assets and liabilities. In addition, weaknesses in foreign currencies for U.S. dollar denominated sales could adversely affect demand for our products. Conversely, a strengthening in foreign currencies against the U.S. dollar could increase foreign currency denominated costs. As a result we may attempt to renegotiate pricing of existing contracts or request payment to be made in U.S. dollars. We cannot be sure that our customers would agree to renegotiate along these lines. This could result in customers eventually terminating contracts with us or in our decision to terminate certain contracts, which would adversely affect our sales.
We hedge our exposure to fluctuations in foreign currency exchange rates as a response to the risk of changes in the value of foreign currency-denominated assets and liabilities. We may enter into foreign currency forward contracts or other instruments, the majority of which mature within approximately five months. Our foreign currency forward contracts reduce, but do not eliminate, the impact of currency exchange rate movements. For example, we do not execute forward contracts in all currencies in which we conduct business. In addition, we hedge to reduce the impact of volatile exchange rates on net revenue, gross profit and operating profit for limited periods of time. However, the use of these hedging activities may only offset a portion of the adverse financial effect resulting from unfavorable movements in foreign exchange rates.
If we fail to overcome the challenges associated with managing our broadband service provider sales channel, our net revenue and gross profit will be negatively impacted.
We sell a significant number of products through broadband service providers worldwide. However, the service provider sales channel is challenging and exceptionally competitive. Difficulties and challenges in selling to service providers include a longer sales cycle, more stringent product testing and validation requirements, a higher level of customization demands, requirements that suppliers take on a larger share of the risk with respect to contractual business terms, competition from established suppliers, pricing pressure resulting in lower gross margins, and irregular and unpredictable ordering habits. For example, rigorous service provider certification processes may delay our sale of new products, or our products ultimately may fail these tests. In either event, we may lose some or all of the amounts we expended in trying to obtain business from the service provider, as well as lose the business opportunity altogether. In addition, even if we have a product which a service provider customer may wish to purchase, we may choose not to supply products to the potential service provider customer if the contract requirements, such as service level requirements, penalties, and liability provisions, are too onerous. Accordingly, our business may be harmed and our revenues may be reduced. We have, in exceptional limited circumstances, while still in contract negotiations, shipped products in advance of and subject to agreement on a definitive contract. We do not record revenue from these shipments until a definitive contract exists. There is risk that we do not ultimately close and sign a definitive contract. If this occurs, the timing of revenue recognition is uncertain and our business would be harmed. In addition, we often commence building custom-made products
19
prior to execution of a contract in order to meet the customer's contemplated launch dates and requirements. Service provider products are generally custom-made for a specific customer and may not be salable to other customers or in other channels. If we have pre-built custom-made products but do not come to agreement on a definitive contract, we may be forced to scrap the custom-made products or re-work them at substantial cost and our business would be harmed.
Further, successful engagements with service provider customers requires a constant analysis of technology trends. If we are unable to anticipate technology trends and service provider customer product needs, and to allocate research and development resources to the right projects, we may not be successful in continuing to sell products to service provider customers. In addition, because our service provider customers command significant resources, including for software support, and demand extremely competitive pricing, certain ODMs have declined to develop service provider products on an ODM basis. Accordingly, as our ODMs increasingly limit development of our service provider products, our service provider business will be harmed if we cannot replace this capability with alternative ODMs or in-house development.
Orders from service providers generally tend to be large but sporadic, which causes our revenues from them to fluctuate and challenges our ability to accurately forecast demand from them. In particular, managing inventory and production of our products for our service provider customers is a challenge. Many of our service provider customers have irregular purchasing requirements. These customers may decide to cancel orders for customized products specific to that customer, and we may not be able to reconfigure and sell those products in other channels. These cancellations could lead to substantial write-offs. In addition, these customers may issue unforecasted orders for products which we may not be able to produce in a timely manner and as such, we may not be able to accept and deliver on such unforecasted orders. In certain cases, we may commit to fixed-price, long term purchase orders, with such orders priced in foreign currencies which could lose value over time in the event of adverse changes in foreign exchange rates. Even if we are selected as a supplier, typically a service provider will also designate a second source supplier, which over time will reduce the aggregate orders that we receive from that service provider. Further, as the technology underlying our products deployed by broadband service providers matures and more competitors offer alternative products with similar technology, we anticipate competing in an extremely price sensitive market and our margins may be affected. If we are unable to introduce new products with sufficiently advanced technology to attract service provider interest in a timely manner, our service provider customers may then require us to lower our prices, or they may choose to purchase products from our competitors. If this occurs, our business would be harmed and our revenues would be reduced.
If we were to lose a service provider customer for any reason, we may experience a material and immediate reduction in forecasted revenue that may cause us to be below our net revenue and operating margin expectations for a particular period of time and therefore adversely affect our stock price. For example, many of our competitors in the service provider space aggressively price their products in order to gain market share. We may not be able to match the lower prices offered by our competitors, and we may choose to forgo lower-margin business opportunities. Many of the service provider customers will seek to purchase from the lowest cost provider, notwithstanding that our products may be higher quality or that our products were previously validated for use on their proprietary network. Accordingly, we may lose customers who have lower, more aggressive pricing, and our revenues may be reduced. In addition, service providers may choose to prioritize the implementation of other technologies or the roll out of other services than home networking. Weakness in orders from this industry could have a material adverse effect on our business, operating results, and financial condition. We have seen slowdowns in capital expenditures by certain of our service provider customers in the past, and believe there may be potential for similar slowdowns in the future. Any slowdown in the general economy, over supply, consolidation among service providers, regulatory developments and constraint on capital expenditures could result in reduced demand from service providers and therefore adversely affect our sales to them. If we do not successfully overcome these challenges, we will not be able to profitably manage our service provider sales channel and our financial results will be harmed.
The average selling prices of our products typically decrease rapidly over the sales cycle of the product, which may negatively affect our net revenue and gross margins.
Our products typically experience price erosion, a fairly rapid reduction in the average unit selling prices over their respective sales cycles. In order to sell products that have a falling average unit selling price and maintain margins at the same time, we need to continually reduce product and manufacturing costs. To manage manufacturing costs, we must collaborate with our third-party manufacturers to engineer the most cost-effective design for our products. In addition, we must carefully manage the price paid for components used in our products. We must also successfully manage our freight and inventory costs to reduce overall product costs. We also need to continually introduce new products with higher sales prices and gross margins in order to maintain our overall gross margins. If we are unable to manage the cost of older products or successfully introduce new products with higher gross margins, our net revenue and overall gross margin would likely decline.
We depend substantially on our sales channels, and our failure to maintain and expand our sales channels would result in lower sales and reduced net revenue.
20
To maintain and grow our market share, net revenue and brand, we must maintain and expand our sales channels. Our sales channels consist of traditional retailers, online retailers, DMRs, VARs, and broadband service providers. Some of these entities purchase our products through our wholesale distributor customers. We generally have no minimum purchase commitments or long-term contracts with any of these third parties.
Traditional retailers have limited shelf space and promotional budgets, and competition is intense for these resources. If the networking sector does not experience sufficient growth, retailers may choose to allocate more shelf space to other consumer product sectors. A competitor with more extensive product lines and stronger brand identity may have greater bargaining power with these retailers. Any reduction in available shelf space or increased competition for such shelf space would require us to increase our marketing expenditures simply to maintain current levels of retail shelf space, which would harm our operating margin. Our traditional retail customers have faced increased and significant competition from online retailers. If we cannot effectively manage our business amongst our online customers and traditional retail customers, our business would be harmed. The recent trend in the consolidation of online retailers and DMR channels has resulted in intensified competition for preferred product placement, such as product placement on an online retailer's Internet home page. Expanding our presence in the VAR channel may be difficult and expensive. We compete with established companies that have longer operating histories and longstanding relationships with VARs that we would find highly desirable as sales channel partners. In addition, our efforts to realign or consolidate our sales channels may cause temporary disruptions in our product sales and revenue, and these changes may not result in the expected longer-term benefits.
We also sell products to broadband service providers. Competition for selling to broadband service providers is fierce and intense. Penetrating service provider accounts typically involves a long sales cycle and the challenge of displacing incumbent suppliers with established relationships and field-deployed products. If we are unable to maintain and expand our sales channels, our growth would be limited and our business would be harmed.
We must also continuously monitor and evaluate emerging sales channels. If we fail to establish a presence in an important developing sales channel, our business could be harmed.
If we lose the services of our Chairman and Chief Executive Officer, Patrick C.S. Lo, or our other key personnel, we may not be able to execute our business strategy effectively.
Our future success depends in large part upon the continued services of our key technical, sales, marketing, finance and senior management personnel. In particular, the services of Patrick C.S. Lo, our Chairman and Chief Executive Officer, who has led our company since its inception, are very important to our business. We do not maintain any key person life insurance policies. Our business model requires extremely skilled and experienced senior management who are able to withstand the rigorous requirements and expectations of our business. Our success depends on senior management being able to execute at a very high level. The loss of any of our senior management or other key research, development, sales or marketing personnel, particularly if lost to competitors, could harm our ability to implement our business strategy and respond to the rapidly changing needs of our business. While we have adopted an emergency succession plan for the short term, we have not formally adopted a long term succession plan. As a result, if we suffer the loss of services of any key executive, our long term business results may be harmed. While we believe that we have mitigated some of the business execution and business continuity risk with our organization into three business segments with separate leadership teams, the loss of any key personnel would still be disruptive and harm our business, especially given that our business is leanly staffed and relies on the expertise and high performance of our key personnel. In addition, because we do not have a formal long term succession plan, we may not be able to have the proper personnel in place to effectively execute our long term business strategy if Mr. Lo or other key personnel retire, resign or are otherwise terminated.
Changes in tax rates, adverse changes in tax laws or exposure to additional income tax liabilities could affect our future profitability.
Factors that could materially affect our future effective tax rates include but are not limited to:
|
•
|
changes in the regulatory environment;
|
|
•
|
changes in accounting and tax standards or practices;
|
|
•
|
changes in the composition of operating income by tax jurisdiction; and
|
|
•
|
our operating results before taxes.
|
21
We are subject to income taxes in the United States and numerous foreign jurisdictions. Our effective tax rate has fluctuated in the past and may fluctuate in the future. Future effective tax rates could be affected by changes in the composition of earnings in countries with differing tax rates, changes in deferred tax assets and liabilities, or changes in tax laws. Foreign jurisdictions have increased the volume of tax audits of multinational corporations. Further, many countries, have either changed or are considering changes to their tax laws. These changes are largely punitive to U.S. multinational corporations. Changes in tax laws could affect the distribution of our earnings, result in double taxation and adversely affect our results. On December 22, 2017, the Tax Cuts and Jobs Act of 2017 (the “Tax Act”) was signed into law making significant changes to the Internal Revenue Code. In particular, sweeping changes were made to the taxation of foreign operations. Changes include, but are not limited to, a corporate tax rate decrease from 35% to 21% effective for tax years beginning after December 31, 2017, the transition of U.S international taxation from a worldwide tax system to a territorial system, and a one-time transition tax on the mandatory deemed repatriation of cumulative foreign earnings as of December 31, 2017. Additionally, new provisions were added to mitigate the potential erosion of the US tax base and to discourage use of low tax jurisdictions to own intellectual property and other valuable intangible assets. While these provisions were intended to prevent specific perceived taxpayer abuse, they may have adverse, unexpected consequences to many taxpayers. At this time, Treasury has not yet issued Regulations on how these laws should be applied and how the underlying calculations are to be prepared. As there is little to no guidance at this time on the preparation of these complex calculations, significant estimates and judgment are required in assessing the consequences. The company is still quantifying the effects of the tax law change. As we complete our analysis and prepare necessary data, and interpret any additional guidance, we may make adjustments to provisional amounts that we have recorded that may materially impact our provision for income taxes in the period in which the adjustments are made. We urge our stockholders to consult with their legal and tax advisors with respect to the legislation and potential tax consequences of investing in our stock.
In addition to the impact of the Tax Act on our federal taxes, the US law may impact the taxation in other jurisdictions such as state income taxes. The various state legislatures have not had sufficient time to respond to the Tax Act. Accordingly it is uncertain as to how the laws will apply in the various state jurisdictions. Additionally, other foreign governing bodies may enact changes in their tax laws in reaction to the Tax Act that could result in changes to our global tax position and materially affect our financial position.
We have been audited by the Italian Tax Authority (ITA) for the 2004 through 2012 tax years. The ITA examination included an audit of income, gross receipts and value-added taxes. Currently, we are in litigation with the ITA for the 2004 through 2012 years. If we are unsuccessful in defending our tax positions, our profitability will be reduced.
The United Kingdom HMRC (Her Majesty’s Revenue and Customs) began an inquiry regarding the application of UK Diverted Profits Tax (DPT), a law which took effect as of April 1, 2015. In assessing the whether they believe the Company is subject to the DPT legislation, UK HMRC has expanded its review to include overall transfer pricing for 2014 through 2016. If we are unsuccessful in defending our positions, our profitability will be reduced.
We received notice from the French Tax Administration on December 21, 2017 of their intent to audit our 2015 and 2016 tax filings for corporate income tax and value-added taxes. While we believe that we have reported and paid the appropriate amount of tax, if we are unsuccessful in defending our positions, our profitability could be reduced.
We are also subject to examination by the Internal Revenue Service, or IRS, and other tax authorities, including state revenue agencies and other foreign governments. While we regularly assess the likelihood of favorable or unfavorable outcomes resulting from examinations by the IRS and other tax authorities to determine the adequacy of our provision for income taxes, there can be no assurance that the actual outcome resulting from these examinations will not materially adversely affect our financial condition and operating results. Additionally, the IRS and several foreign tax authorities have increasingly focused attention on intercompany transfer pricing with respect to sales of products and services and the use of intangibles. Tax authorities could disagree with our intercompany charges, cross-jurisdictional transfer pricing or other matters and assess additional taxes. If we do not prevail in any such disagreements, our profitability may be affected.
Global economic conditions could materially adversely affect our revenue and results of operations.
Our business has been and may continue to be affected by a number of factors that are beyond our control, such as general geopolitical, economic and business conditions, conditions in the financial markets, and changes in the overall demand for networking and smart home products. A severe and/or prolonged economic downturn could adversely affect our customers' financial condition and the levels of business activity of our customers. Weakness in, and uncertainty about, global economic conditions may cause businesses to postpone spending in response to tighter credit, negative financial news and/or declines in income or asset values, which could have a material negative effect on the demand for networking products.
22
In the recent past, slow economic growth throughout various regions worldwide, especially in Europe, presented significant challenges to our business. In addition, current economic challenges in China, including any global economic ramifications of these challenges, may continue to put negative pressure on global economic conditions. If conditions in the global economy, including Europe, China, Australia and the United States, or other key vertical or geographic markets remain uncertain or deteriorate, such conditions could have a material adverse impact on our business, operating results and financial condition. If we are unable to successfully anticipate changing economic and political conditions, we may be unable to effectively plan for and respond to those changes, which could materially adversely affect our business and results of operations.
In addition, the economic problems affecting the financial markets and the uncertainty in global economic conditions resulted in a number of adverse effects including a low level of liquidity in many financial markets, extreme volatility in credit, equity, currency and fixed income markets, instability in the stock market and high unemployment. For example, the challenges faced by the European Union to stabilize some of its member economies, such as Greece, Portugal, Spain, Hungary and even Italy, have had international implications affecting the stability of global financial markets and hindering economies worldwide. Many member nations in the European Union have been addressing the issues with controversial austerity measures. In addition, the potential consequences of the "Brexit" process in the United Kingdom have led to significant uncertainty in the region. Should the European Union monetary policy measures be insufficient to restore confidence and stability to the financial markets, or should the United Kingdom's "Brexit" decision lead to additional economic or political instability, the recovery of the global economy, including the U.S. and European Union economies where we have a significant presence, could be hindered or reversed, which could have a material adverse effect on us. There could also be a number of other follow-on effects from these economic developments and negative economic trends on our business, including the inability of customers to obtain credit to finance purchases of our products; customer insolvencies; decreased customer confidence to make purchasing decisions; decreased customer demand; and decreased customer ability to pay their trade obligations.
Our sales and operations in international markets expose us to operational, financial and regulatory risks.
International sales comprise a significant amount of our overall net revenue. International sales were approximately 34% of overall net revenue in fiscal year 2017 and approximately 36% of overall net revenue in fiscal year 2016. We continue to be committed to growing our international sales, and while we have committed resources to expanding our international operations and sales channels, these efforts may not be successful. International operations are subject to a number of other risks, including:
|
•
|
exchange rate fluctuations;
|
|
•
|
political and economic instability, international terrorism and anti-American sentiment, particularly in emerging markets;
|
|
•
|
potential for violations of anti-corruption laws and regulations, such as those related to bribery and fraud;
|
|
•
|
preference for locally branded products, and laws and business practices favoring local competition;
|
|
•
|
potential consequences of, and uncertainty related to, the "Brexit" process in the United Kingdom, which could lead to additional expense and complexity in doing business there;
|
|
•
|
increased difficulty in managing inventory;
|
|
•
|
delayed revenue recognition;
|
|
•
|
less effective protection of intellectual property;
|
|
•
|
stringent consumer protection and product compliance regulations, including but not limited to the Restriction of Hazardous Substances directive, the Waste Electrical and Electronic Equipment directive and the European Ecodesign directive, or EuP, that are costly to comply with and may vary from country to country;
|
|
•
|
difficulties and costs of staffing and managing foreign operations;
|
|
•
|
business difficulties, including potential bankruptcy or liquidation, of any of our worldwide third party logistics providers; and
|
|
•
|
changes in local tax and customs duty laws or changes in the enforcement, application or interpretation of such laws.
|
23
While we believe we generally have good relations with our employees, employees in certain jurisdictions have rights which give them certain collective rights. If management must expend significant resources and effort to address and comply with these rights, our business may be harmed. We are also required to comply with local environmental legislation and our customers rely on this compliance in order to sell our products. If our customers do not agree with our interpretations and requirements of new legislation, they may cease to order our products and our revenue would be harmed.
We must comply with indirect tax laws in multiple jurisdictions, as well as complex customs duty regimes worldwide. Audits of our compliance with these rules may result in additional liabilities for taxes, duties, interest and penalties related to our international operations which would reduce our profitability.
Our operations are routinely subject to audit by tax authorities in various countries. Many countries have indirect tax systems where the sale and purchase of goods and services are subject to tax based on the transaction value. These taxes are commonly referred to as value-added tax (VAT) or goods and services tax (GST). In addition, the distribution of our products subjects us to numerous complex customs regulations, which frequently change over time. Failure to comply with these systems and regulations can result in the assessment of additional taxes, duties, interest and penalties. While we believe we are in compliance with local laws, there is no assurance that tax and customs authorities agree with our reporting positions and upon audit may assess us additional taxes, duties, interest and penalties. If this occurs and we cannot successfully defend our position, our profitability will be reduced.
If our products contain defects or errors, we could incur significant unexpected expenses, experience product returns and lost sales, experience product recalls, suffer damage to our brand and reputation, and be subject to product liability or other claims.
Our products are complex and may contain defects, errors or failures, particularly when first introduced or when new versions are released. The industry standards upon which many of our products are based are also complex, experience change over time and may be interpreted in different manners. Some errors and defects may be discovered only after a product has been installed and used by the end-user.
In addition, epidemic failure clauses are found in certain of our customer contracts, especially contracts with service providers. If invoked, these clauses may entitle the customer to return for replacement or obtain credits for products and inventory, as well as assess liquidated damage penalties and terminate an existing contract and cancel future or then current purchase orders. In such instances, we may also be obligated to cover significant costs incurred by the customer associated with the consequences of such epidemic failure, including freight and transportation required for product replacement and out-of-pocket costs for truck rolls to end user sites to collect the defective products. Costs or payments we make in connection with an epidemic failure may materially adversely affect our results of operations and financial condition. If our products contain defects or errors, or are found to be noncompliant with industry standards, we could experience decreased sales and increased product returns, loss of customers and market share, and increased service, warranty and insurance costs. In addition, defects in, or misuse of, certain of our products could cause safety concerns, including the risk of property damage or personal injury. If any of these events occurred, our reputation and brand could be damaged, and we could face product liability or other claims regarding our products, resulting in unexpected expenses and adversely impacting our operating results. For instance, if a third party were able to successfully overcome the security measures in our products, such a person or entity could misappropriate customer data, third party data stored by our customers and other information, including intellectual property. In addition, the operations of our end-user customers may be interrupted. If that happens, affected end-users or others may file actions against us alleging product liability, tort, or breach of warranty claims.
We have been and will be investing increased additional in-house resources on software research and development, which could disrupt our ongoing business and present distinct risks from our historically hardware-centric business.
We plan to continue to evolve our historically hardware-centric business model towards a model that includes more sophisticated software offerings. As such, we will further evolve the focus of our organization towards the delivery of more integrated hardware and software solutions for our customers. While we have invested in software development in the past, we will be expending additional resources in this area in the future. Such endeavors may involve significant risks and uncertainties, including distraction of management from current operations, insufficient revenue to offset liabilities assumed and expenses associated with the strategy, inadequate return on capital, and unidentified issues not discovered in our due diligence. Software development is inherently risky for a company such as ours with a historically hardware-centric business model, and accordingly, our efforts in software development may not be successful. Any increased investment in software research and development may materially adversely affect our financial condition and operating results.
24
We may spend a proportionately greater amount on software research and development in the future. If we cannot proportionately decrease our cost structure in response to competitive price pressures, our gross margin and, therefore, our profitability could be adversely affected. In addition, if our software solutions, pricing and other factors are not sufficiently competitive, or if there is an adverse reaction to our product decisions, we may lose market share in certain areas, which could adversely affect our revenue and prospects.
Software research and development is complex. We must make long-term investments, develop or obtain appropriate intellectual property and commit significant resources before knowing whether our predictions will accurately reflect customer demand for our products and services. We must accurately forecast mixes of software solutions and configurations that meet customer requirements, and we may not succeed at doing so within a given product's life cycle or at all. Any delay in the development, production or marketing of a new software solution could result in us not being among the first to market, which could further harm our competitive position. In addition, our regular testing and quality control efforts may not be effective in controlling or detecting all quality issues and defects. We may be unable to determine the cause, find an appropriate solution or offer a temporary fix to address defects. Finding solutions to quality issues or defects can be expensive and may result in additional warranty, replacement and other costs, adversely affecting our profits. If new or existing customers have difficulty with our software solutions or are dissatisfied with our services, our operating margins could be adversely affected, and we could face possible claims if we fail to meet our customers' expectations. In addition, quality issues can impair our relationships with new or existing customers and adversely affect our brand and reputation, which could adversely affect our operating results.
We are currently involved in numerous litigation matters and may in the future become involved in additional litigation, including litigation regarding intellectual property rights, which could be costly and subject us to significant liability.
The networking industry is characterized by the existence of a large number of patents and frequent claims and related litigation regarding infringement of patents, trade secrets and other intellectual property rights. In particular, leading companies in the data communications markets, some of which are our competitors, have extensive patent portfolios with respect to networking technology. From time to time, third parties, including these leading companies, have asserted and may continue to assert exclusive patent, copyright, trademark and other intellectual property rights against us demanding license or royalty payments or seeking payment for damages, injunctive relief and other available legal remedies through litigation. These also include third-party non-practicing entities who claim to own patents or other intellectual property that cover industry standards that our products comply with. If we are unable to resolve these matters or obtain licenses on acceptable or commercially reasonable terms, we could be sued or we may be forced to initiate litigation to protect our rights. The cost of any necessary licenses could significantly harm our business, operating results and financial condition. We may also choose to join defensive patent aggregation services in order to prevent or settle litigation against such non-practicing entities and avoid the associated significant costs and uncertainties of litigation. These patent aggregation services may obtain, or have previously obtained, licenses for the alleged patent infringement claims against us and other patent assets that could be used offensively against us. The costs of such defensive patent aggregation services, while potentially lower than the costs of litigation, may be significant as well. At any time, any of these non-practicing entities, or any other third-party could initiate litigation against us, or we may be forced to initiate litigation against them, which could divert management attention, be costly to defend or prosecute, prevent us from using or selling the challenged technology, require us to design around the challenged technology and cause the price of our stock to decline. In addition, third parties, some of whom are potential competitors, have initiated and may continue to initiate litigation against our manufacturers, suppliers, members of our sales channels or our service provider customers or even end user customers, alleging infringement of their proprietary rights with respect to existing or future products. In the event successful claims of infringement are brought by third parties, and we are unable to obtain licenses or independently develop alternative technology on a timely basis, we may be subject to indemnification obligations, be unable to offer competitive products, or be subject to increased expenses. Finally, consumer class-action lawsuits related to the marketing and performance of our home networking products have been asserted and may in the future be asserted against us. For additional information regarding certain of the lawsuits in which we are involved, see the information set forth in Note 8,
Commitments and Contingencies,
in the Notes to Consolidated Financial Statements in Item 8 of Part II of this Annual Report on Form 10-K. If we do not resolve these claims on a favorable basis, our business, operating results and financial condition could be significantly harmed.
As part of growing our business, we have made and expect to continue to make acquisitions. If we fail to successfully select, execute or integrate our acquisitions, then our business and operating results could be harmed and our stock price could decline.
From time to time, we will undertake acquisitions to add new product lines and technologies, gain new sales channels or enter into new sales territories. For example, on November 30, 2016 we acquired Placemeter, Inc., a leader in computer vision analytics, to enhance our Arlo product and service offerings. Additionally in April 2013, we closed the acquisition of the AirCard business of Sierra Wireless, Inc., which was our largest acquisition, both in terms of consideration and headcount. Acquisitions involve numerous risks and challenges, including but not limited to the following:
25
|
•
|
integrating the companies, assets, systems, products, sales channels and personnel that we acquire;
|
|
•
|
higher than anticipated acquisition and integration costs and expenses;
|
|
•
|
reliance on third parties to provide transition services for a period of time after closing to ensure an orderly transition of the business;
|
|
•
|
growing or maintaining revenues to justify the purchase price and the increased expenses associated with acquisitions;
|
|
•
|
entering into territories or markets with which we have limited or no prior experience;
|
|
•
|
establishing or maintaining business relationships with customers, vendors and suppliers who may be new to us;
|
|
•
|
overcoming the employee, customer, vendor and supplier turnover that may occur as a result of the acquisition;
|
|
•
|
disruption of, and demands on, our ongoing business as a result of integration activities including diversion of management's time and attention from running the day to day operations of our business;
|
|
•
|
inability to implement uniform standards, disclosure controls and procedures, internal controls over financial reporting and other procedures and policies in a timely manner;
|
|
•
|
inability to realize the anticipated benefits of or successfully integrate with our existing business the businesses, products, technologies or personnel that we acquire; and
|
|
•
|
potential post-closing disputes.
|
As part of undertaking an acquisition, we may also significantly revise our capital structure or operational budget, such as issuing common stock that would dilute the ownership percentage of our stockholders, assuming liabilities or debt, utilizing a substantial portion of our cash resources to pay for the acquisition or significantly increasing operating expenses. Our acquisitions have resulted and may in the future result in charges being taken in an individual quarter as well as future periods, which results in variability in our quarterly earnings. In addition, our effective tax rate in any particular quarter may also be impacted by acquisitions. Following the closing of an acquisition, we may also have disputes with the seller regarding contractual requirements and covenants. Any such disputes may be time consuming and distract management from other aspects of our business. In addition, if we increase the pace or size of acquisitions, we will have to expend significant management time and effort into the transactions and the integrations and we may not have the proper human resources bandwidth to ensure successful integrations and accordingly, our business could be harmed.
As part of the terms of acquisition, we may commit to pay additional contingent consideration if certain revenue or other performance milestones are met. We are required to evaluate the fair value of such commitments at each reporting date and adjust the amount recorded if there are changes to the fair value.
We cannot ensure that we will be successful in selecting, executing and integrating acquisitions. Failure to manage and successfully integrate acquisitions could materially harm our business and operating results. In addition, if stock market analysts or our stockholders do not support or believe in the value of the acquisitions that we choose to undertake, our stock price may decline.
26
We are subject to, and must remain in compliance with, numerous laws and governmental regulations concerning the manufacturing, use, distribution and sale of our products, as well as any such future laws and regulations. Some of our customers also require that we comply with their own unique requirements relating to these matters. Any failure to comply with such laws, regulations and requirements, and any associated unanticipated costs, may adversely affect our business, financial condition and results of operations.
We manufacture and sell products which contain electronic components, and such components may contain materials that are subject to government regulation in both the locations that we manufacture and assemble our products, as well as the locations where we sell our products. For example, certain regulations limit the use of lead in electronic components. To our knowledge, we maintain compliance with all applicable current government regulations concerning the materials utilized in our products, for all the locations in which we operate. Since we operate on a global basis, this is a complex process which requires continual monitoring of regulations and an ongoing compliance process to ensure that we and our suppliers are in compliance with all existing regulations. There are areas where new regulations have been enacted which could increase our cost of the components that we utilize or require us to expend additional resources to ensure compliance. For example, the SEC's “conflict minerals” rules apply to our business, and we are expending significant resources to ensure compliance. The implementation of these requirements by government regulators and our partners and/or customers could adversely affect the sourcing, availability, and pricing of minerals used in the manufacture of certain components used in our products. In addition, the supply-chain due diligence investigation required by the conflict minerals rules will require expenditures of resources and management attention regardless of the results of the investigation. If there is an unanticipated new regulation which significantly impacts our use of various components or requires more expensive components, that regulation would have a material adverse impact on our business, financial condition and results of operations.
One area which has a large number of regulations is the environmental compliance. Management of environmental pollution and climate change has produced significant legislative and regulatory efforts on a global basis, and we believe this will continue both in scope and the number of countries participating. These changes could directly increase the cost of energy which may have an impact on the way we manufacture products or utilize energy to produce our products. In addition, any new regulations or laws in the environmental area might increase the cost of raw materials we use in our products. Environmental regulations require us to reduce product energy usage, monitor and exclude an expanding list of restricted substances and to participate in required recover and recycling of our products. While future changes in regulations are certain, we are currently unable to predict how any such changes will impact us and if such impacts will be material to our business. If there is a new law or regulation that significantly increases our costs of manufacturing or causes us to significantly alter the way that we manufacture our products, this would have a material adverse effect on our business, financial condition and results of operations.
Our selling and distribution practices are also regulated in large part by U.S. federal and state as well as foreign antitrust and competition laws and regulations. In general, the objective of these laws is to promote and maintain free competition by prohibiting certain forms of conduct that tend to restrict production, raise prices, or otherwise control the market for goods or services to the detriment of consumers of those goods and services. Potentially prohibited activities under these laws may include unilateral conduct, or conduct undertaken as the result of an agreement with one or more of our suppliers, competitors, or customers. The potential for liability under these laws can be difficult to predict as it often depends on a finding that the challenged conduct resulted in harm to competition, such as higher prices, restricted supply, or a reduction in the quality or variety of products available to consumers. We utilize a number of different distribution channels to deliver our products to the end consumer, and regularly enter agreements with resellers of our products at various levels in the distribution chain that could be subject to scrutiny under these laws in the event of private litigation or an investigation by a governmental competition authority. In addition, many of our products are sold to consumers via the Internet. Many of the competition-related laws that govern these Internet sales were adopted prior to the advent of the Internet, and, as a result, do not contemplate or address the unique issues raised by online sales. New interpretations of existing laws and regulations, whether by courts or by the state, federal or foreign governmental authorities charged with the enforcement of those laws and regulations, may also impact our business in ways we are currently unable to predict. Any failure on our part or on the part of our employees, agents, distributors or other business partners to comply with the laws and regulations governing competition can result in negative publicity and diversion of management time and effort and may subject us to significant litigation liabilities and other penalties.
In addition to government regulations, many of our customers require us to comply with their own requirements regarding manufacturing, health and safety matters, corporate social responsibility, employee treatment, anti-corruption, use of materials and environmental concerns. Some customers may require us to periodically report on compliance with their unique requirements, and some customers reserve the right to audit our business for compliance. We are increasingly subject to requests for compliance with these customer requirements. For example, there has been significant focus from our customers as well as the press regarding corporate social responsibility policies. Recently, a number of jurisdictions have adopted public disclosure requirements on related topics, including labor practices and policies within companies' supply chains. We regularly audit our manufacturers; however, any deficiencies in compliance by our manufacturers may harm our business and our brand. In addition, we may not have the
27
resources to maintain compliance with these customer requirements and failure to comply may result in decreased sales to these customers, which may have a material adverse effect on our business, financial condition and results of operations.
If our goodwill or intangible assets become impaired we may be required to record a significant charge to earnings.
Under generally accepted accounting principles, we review our intangible assets for impairment when events or changes in circumstances indicate the carrying value may not be recoverable. Goodwill is required to be tested for impairment at least annually. Factors that may be considered when determining if the carrying value of our goodwill or intangible assets may not be recoverable include a significant decline in our expected future cash flows or a sustained, significant decline in our stock price and market capitalization.
As a result of our acquisitions, we have significant goodwill and intangible assets recorded on our balance sheets. In addition, significant negative industry or economic trends, such as those that have occurred as a result of the recent economic downturn, including reduced estimates of future cash flows or disruptions to our business could indicate that goodwill or intangible assets might be impaired. If, in any period our stock price decreases to the point where our market capitalization is less than our book value, this too could indicate a potential impairment and we may be required to record an impairment charge in that period. Our valuation methodology for assessing impairment requires management to make judgments and assumptions based on projections of future operating performance. The estimates used to calculate the fair value of a reporting unit change from year to year based on operating results and market conditions. Changes in these estimates and assumptions could materially affect the determination of fair value and goodwill impairment for each reporting unit. We operate in highly competitive environments and projections of future operating results and cash flows may vary significantly from actual results. As a result, we may incur substantial impairment charges to earnings in our financial statements should an impairment of our goodwill or intangible assets be determined resulting in an adverse impact on our results of operations.
We are required to evaluate our internal controls under Section 404 of the Sarbanes-Oxley Act of 2002 and any adverse results from such evaluation, including restatements of our issued financial statements, could impact investor confidence in the reliability of our internal controls over financial reporting.
Pursuant to Section 404 of the Sarbanes-Oxley Act of 2002, we are required to furnish a report by our management on our internal control over financial reporting. Such report must contain among other matters, an assessment of the effectiveness of our internal control over financial reporting as of the end of our fiscal year, including a statement as to whether or not our internal control over financial reporting is effective. This assessment must include disclosure of any material weaknesses in our internal control over financial reporting identified by management. From time to time, we conduct internal investigations as a result of whistleblower complaints. In some instances, the whistleblower complaint may implicate potential areas of weakness in our internal controls. Although all known material weaknesses have been remediated, we cannot be certain that the measures we have taken ensure that restatements will not occur in the future. Execution of restatements create a significant strain on our internal resources and could cause delays in our filing of quarterly or annual financial results, increase our costs and cause management distraction. Restatements may also significantly affect our stock price in an adverse manner.
Continued performance of the system and process documentation and evaluation needed to comply with Section 404 is both costly and challenging. During this process, if our management identifies one or more material weaknesses in our internal control over financial reporting, we will be unable to assert such internal control is effective. If we are unable to assert that our internal control over financial reporting is effective as of the end of a fiscal year or if our independent registered public accounting firm is unable to express an opinion on the effectiveness of our internal control over financial reporting, we could lose investor confidence in the accuracy and completeness of our financial reports, which may have an adverse effect on our stock price.
If disruptions in our transportation network occur or our shipping costs substantially increase, we may be unable to sell or timely deliver our products, and our operating expenses could increase.
We are highly dependent upon the transportation systems we use to ship our products, including surface and air freight. Our attempts to closely match our inventory levels to our product demand intensify the need for our transportation systems to function effectively and without delay. On a quarterly basis, our shipping volume also tends to steadily increase as the quarter progresses, which means that any disruption in our transportation network in the latter half of a quarter will likely have a more material effect on our business than at the beginning of a quarter.
The transportation network is subject to disruption or congestion from a variety of causes, including labor disputes or port strikes, acts of war or terrorism, natural disasters and congestion resulting from higher shipping volumes. Labor disputes among freight carriers and at ports of entry are common, particularly in Europe, and we expect labor unrest and its effects on shipping our products to be a continuing challenge for us. A port worker strike, work slow-down or other transportation disruption in Long
28
Beach, California, where we have a significant distribution center, could significantly disrupt our business. For example, a series of work stoppages and slow-downs arising from labor disputes at the Long Beach port and other West Coast ports, particularly in the first quarter of 2015, negatively impacted our ability to timely deliver certain product shipments to the United States and resulted in additional transportation expense. Our international freight is regularly subjected to inspection by governmental entities. If our delivery times increase unexpectedly for these or any other reasons, our ability to deliver products on time would be materially adversely affected and result in delayed or lost revenue as well as customer imposed penalties. In addition, if increases in fuel prices occur, our transportation costs would likely increase. Moreover, the cost of shipping our products by air freight is greater than other methods. From time to time in the past, we have shipped products using extensive air freight to meet unexpected spikes in demand, shifts in demand between product categories, to bring new product introductions to market quickly and to timely ship products previously ordered. If we rely more heavily upon air freight to deliver our products, our overall shipping costs will increase. A prolonged transportation disruption or a significant increase in the cost of freight could severely disrupt our business and harm our operating results.
We are exposed to the credit risk of some of our customers and to credit exposures in weakened markets, which could result in material losses.
A substantial portion of our sales are on an open credit basis, with typical payment terms of 30 to 60 days in the United States and, because of local customs or conditions, longer in some markets outside the United States. We monitor individual customer financial viability in granting such open credit arrangements, seek to limit such open credit to amounts we believe the customers can pay, and maintain reserves we believe are adequate to cover exposure for doubtful accounts.
In the past, there have been bankruptcies amongst our customer base, and certain of our customers’ businesses face financial challenges that put them at risk of future bankruptcies. Although losses resulting from customer bankruptcies have not been material to date, any future bankruptcies could harm our business and have a material adverse effect on our operating results and financial condition. To the degree that turmoil in the credit markets makes it more difficult for some customers to obtain financing, our customers' ability to pay could be adversely impacted, which in turn could have a material adverse impact on our business, operating results, and financial condition.
Expansion of our operations and infrastructure may strain our operations and increase our operating expenses.
We have expanded our operations and are pursuing market opportunities both domestically and internationally in order to grow our sales. This expansion has required enhancements to our existing management information systems, and operational and financial controls. In addition, if we continue to grow, our expenditures would likely be significantly higher than our historical costs. We may not be able to install adequate controls in an efficient and timely manner as our business grows, and our current systems may not be adequate to support our future operations. The difficulties associated with installing and implementing new systems, procedures and controls may place a significant burden on our management, operational and financial resources. In addition, if we grow internationally, we will have to expand and enhance our communications infrastructure. If we fail to continue to improve our management information systems, procedures and financial controls or encounter unexpected difficulties during expansion and reorganization, our business could be harmed.
For example, we have invested, and will continue to invest, significant capital and human resources in the design and enhancement of our financial and enterprise resource planning systems, which may be disruptive to our underlying business. We depend on these systems in order to timely and accurately process and report key components of our results of operations, financial position and cash flows. If the systems fail to operate appropriately or we experience any disruptions or delays in enhancing their functionality to meet current business requirements, our ability to fulfill customer orders, bill and track our customers, fulfill contractual obligations, accurately report our financials and otherwise run our business could be adversely affected. Even if we do not encounter these adverse effects, the enhancement of systems may be much more costly than we anticipated. If we are unable to continue to enhance our information technology systems as planned, our financial position, results of operations and cash flows could be negatively impacted.
We invest in companies for both strategic and financial reasons, but may not realize a return on our investments.
We have made, and continue to seek to make, investments in companies around the world to further our strategic objectives and support our key business initiatives. These investments may include equity or debt instruments of public or private companies, and may be non-marketable at the time of our initial investment. We do not restrict the types of companies in which we seek to invest. These companies may range from early-stage companies that are often still defining their strategic direction to more mature companies with established revenue streams and business models. If any company in which we invest fails, we could lose all or part of our investment in that company. If we determine that an other-than-temporary decline in the fair value exists for an equity or debt investment in a public or private company in which we have invested, we will have to write down the investment to its
29
fair value and recognize the related write-down as an investment loss. The performance of any of these investments could result in significant impairment charges and gains (losses) on other equity investments. We must also analyze accounting and legal issues when making these investments. If we do not structure these investments properly, we may be subject to certain adverse accounting issues, such as potential consolidation of financial results.
Furthermore, if the strategic objectives of an investment have been achieved, or if the investment or business diverges from our strategic objectives, we may seek to dispose of the investment. Our non-marketable equity investments in private companies are not liquid, and we may not be able to dispose of these investments on favorable terms or at all. The occurrence of any of these events could harm our results. Gains or losses from equity securities could vary from expectations depending on gains or losses realized on the sale or exchange of securities and impairment charges related to debt instruments as well as equity and other investments.
We rely upon third parties for technology that is critical to our products, and if we are unable to continue to use this technology and future technology, our ability to develop, sell, maintain and support technologically innovative products would be limited.
We rely on third parties to obtain non-exclusive patented hardware and software license rights in technologies that are incorporated into and necessary for the operation and functionality of most of our products. In these cases, because the intellectual property we license is available from third parties, barriers to entry into certain markets may be lower for potential or existing competitors than if we owned exclusive rights to the technology that we license and use. Moreover, if a competitor or potential competitor enters into an exclusive arrangement with any of our key third-party technology providers, or if any of these providers unilaterally decide not to do business with us for any reason, our ability to develop and sell products containing that technology would be severely limited. If we are shipping products that contain third-party technology that we subsequently lose the right to license, then we will not be able to continue to offer or support those products. In addition, these licenses often require royalty payments or other consideration to the third party licensor. Our success will depend, in part, on our continued ability to access these technologies, and we do not know whether these third-party technologies will continue to be licensed to us on commercially acceptable terms, if at all. If we are unable to license the necessary technology, we may be forced to acquire or develop alternative technology of lower quality or performance standards, which would limit and delay our ability to offer new or competitive products and increase our costs of production. As a result, our margins, market share, and operating results could be significantly harmed.
We also utilize third-party software development companies to develop, customize, maintain and support software that is incorporated into our products. If these companies fail to timely deliver or continuously maintain and support the software, as we require of them, we may experience delays in releasing new products or difficulties with supporting existing products and customers. In addition, if these third-party licensors fail or experience instability, then we may be unable to continue to sell products that incorporate the licensed technologies in addition to being unable to continue to maintain and support these products. We do require escrow arrangements with respect to certain third-party software which entitle us to certain limited rights to the source code, in the event of certain failures by the third party, in order to maintain and support such software. However, there is no guarantee that we would be able to understand and use the source code, as we may not have the expertise to do so. We are increasingly exposed to these risks as we continue to develop and market more products containing third-party software, such as our TV connectivity, security and network attached storage products.
If we are unable to secure and protect our intellectual property rights, our ability to compete could be harmed.
We rely upon third parties for a substantial portion of the intellectual property that we use in our products. At the same time, we rely on a combination of copyright, trademark, patent and trade secret laws, nondisclosure agreements with employees, consultants and suppliers and other contractual provisions to establish, maintain and protect our intellectual property rights. Despite efforts to protect our intellectual property, unauthorized third parties may attempt to design around, copy aspects of our product design or obtain and use technology or other intellectual property associated with our products. For example, one of our primary intellectual property assets is the NETGEAR name, trademark and logo. We may be unable to stop third parties from adopting similar names, trademarks and logos, particularly in those international markets where our intellectual property rights may be less protected. Furthermore, our competitors may independently develop similar technology or design around our intellectual property. Our inability to secure and protect our intellectual property rights could significantly harm our brand and business, operating results and financial condition.
Political events, war, terrorism, public health issues, natural disasters, sudden changes in trade and immigration policies, and other circumstances could materially adversely affect us.
Our corporate headquarters are located in Northern California and one of our warehouses is located in Southern California, both of which are regions known for seismic activity. Substantially all of our critical enterprise-wide information technology
30
systems, including our main servers, are currently housed in colocation facilities in Mesa, Arizona. While our critical information technology systems are located at colocation facilities in a different geographic region in the United States, our headquarters and warehouses remain susceptible to seismic activity so long as they are located in California. In addition, substantially all of our manufacturing occurs in two geographically concentrated areas in mainland China, where disruptions from natural disasters, health epidemics and political, social and economic instability may affect the region. If our manufacturers or warehousing facilities are disrupted or destroyed, we would be unable to distribute our products on a timely basis, which could harm our business.
In addition, war, terrorism, geopolitical uncertainties, public health issues, sudden changes in trade and immigration policies, and other business interruptions have caused and could cause damage or disruption to international commerce and the global economy, and thus could have a strong negative effect on us, our suppliers, logistics providers, manufacturing vendors and customers. Our business operations are subject to interruption by natural disasters, fire, power shortages, terrorist attacks and other hostile acts, labor disputes, public health issues, and other events beyond our control. For example, labor disputes at manufacturing facilities in China have led to workers going on strike, and labor unrest could materially affect our third-party manufacturers' abilities to manufacture our products.
Such events could decrease demand for our products, make it difficult or impossible for us to make and deliver products to our customers or to receive components from our suppliers, and create delays and inefficiencies in our supply chain. Should major public health issues, including pandemics, arise, we could be negatively affected by more stringent employee travel restrictions, additional limitations in freight services, governmental actions limiting the movement of products between regions, delays in production ramps of new products, and disruptions in the operations of our manufacturing vendors and component suppliers.
Governmental regulations of imports or exports affecting Internet security could affect our net revenue.
Any additional governmental regulation of imports or exports or failure to obtain required export approval of our encryption technologies could adversely affect our international and domestic sales. The United States and various foreign governments have imposed controls, export license requirements, and restrictions on the import or export of some technologies, particularly encryption technology. In addition, from time to time, governmental agencies have proposed additional regulation of encryption technology, such as requiring the escrow and governmental recovery of private encryption keys. In response to terrorist activity, governments could enact additional regulation or restriction on the use, import, or export of encryption technology. This additional regulation of encryption technology could delay or prevent the acceptance and use of encryption products and public networks for secure communications, resulting in decreased demand for our products and services. In addition, some foreign competitors are subject to less stringent controls on exporting their encryption technologies. As a result, they may be able to compete more effectively than we can in the United States and the international Internet security market.
We are exposed to credit risk and fluctuations in the market values of our investment portfolio.
Although we have not recognized any material losses on our cash equivalents and short-term investments, future declines in their market values could have a material adverse effect on our financial condition and operating results. Given the global nature of our business, we have investments with both domestic and international financial institutions. Accordingly, we face exposure to fluctuations in interest rates, which may limit our investment income. If these financial institutions default on their obligations or their credit ratings are negatively impacted by liquidity issues, credit deterioration or losses, financial results, or other factors, the value of our cash equivalents and short-term investments could decline and result in a material impairment, which could have a material adverse effect on our financial condition and operating results.
31
|
Item 1B.
|
Unresolved Staff Comments
|
None.
|
Item 2.
|
Properties
|
Our principal administrative, sales, marketing and research and development facilities currently occupy approximately 142,700 square feet in an office complex in San Jose, California, under a lease that expires in
September 2025
.
Our international headquarters occupy approximately 15,000 square feet in an office complex in Cork, Ireland, under a lease that expires in
December 2026
. Our international sales personnel are based out of local sales offices or home offices in Austria, Australia, Belgium, Canada, China, Denmark, France, Germany, Hong Kong, India, Ireland, Italy, Japan, Korea, Poland, Russia, Singapore, Spain, Sweden, Switzerland, the Netherlands, the United Arab Emirates, and the United Kingdom. We also have operations personnel using a leased facility in Hong Kong and Suzhou and utilizes the Guangzhou branch office in conjunction with an office in Tangxia. We also maintain research and development facilities in Carlsbad (US), Beijing and Nanjing (China), Richmond B.C. (Canada), Taipei (Taiwan), and Bangalore (India). From time to time we consider various alternatives related to our long-term facilities needs. While we believe our existing facilities provide suitable space for our operations and are adequate to meet our immediate needs, it may be necessary to lease additional space to accommodate future growth. We have invested in internal capacity and strategic relationships with outside manufacturing vendors as needed to meet anticipated demand for our products.
We use third parties to provide warehousing services to us, consisting of facilities in Southern California, Australia, Hong Kong and the Netherlands.
|
Item 3.
|
Legal Proceedings
|
The information set forth under the heading "Litigation and Other Legal Matters" in Note 8,
Commitments and Contingencies
, in Notes to Consolidated Financial Statements in Item 8 of Part II of this Annual Report on Form 10-K, is incorporated herein by reference. For additional discussion of certain risks associated with legal proceedings, see Item 1A,
Risk Factors
.
|
Item 4.
|
Mine Safety Disclosures
|
Not applicable.
32
|
Item 5.
|
Market for Registrant’s Common Equity, Related Stockholder Matters and Issuer Purchases of Equity Securities
|
Market Information
Our common stock is publicly traded on the Nasdaq Global Select Market ("Nasdaq") under the symbol "NTGR". The following table sets forth for the indicated periods the high and low intraday sales prices per share for our common stock on the Nasdaq. Such information reflects interdealer prices, without retail markup, markdown or commission, and may not represent actual transactions.
|
Year Ended December 31,
|
|||||||||||||
|
2017
|
2016
|
||||||||||||
|
High
|
Low
|
High
|
Low
|
||||||||||
|
First Quarter
|
$
|
58.50
|
|
$
|
48.50
|
|
$
|
41.30
|
|
$
|
33.39
|
|
|
|
Second Quarter
|
53.10
|
|
41.50
|
|
48.80
|
|
38.25
|
|
|||||
|
Third Quarter
|
51.90
|
|
42.65
|
|
60.82
|
|
46.94
|
|
|||||
|
Fourth Quarter
|
61.35
|
|
44.20
|
|
60.25
|
|
48.35
|
|
|||||
Holders of Common Stock
On February 13, 2018, there were 19 stockholders of record.
The number of record holders is based upon the actual number of holders registered on our books at such date and does not include holders of shares in “street names” or persons, partnerships, associations, corporations or other entities identified in security position listings maintained by depository trust companies.
Dividend Policy
We have never declared or paid cash dividends on our capital stock. We do not anticipate paying cash dividends in the foreseeable future.
Repurchase of Equity Securities by the Company
|
Period
|
Total Number of
Shares Purchased
(2)
|
Average Price Paid per Share
|
Total Number of Shares Purchased as Part of Publicly Announced Plans or Programs
(1)
|
Maximum Number of Shares that May Yet Be Purchased Under the Plans or Programs
|
|||||||||
|
October 2, 2017 - October 29, 2017
|
298,107
|
|
$
|
50.32
|
|
298,107
|
|
2,214,617
|
|
||||
|
October 30, 2017 - November 26, 2017
|
261,226
|
|
$
|
44.87
|
|
257,154
|
|
1,957,463
|
|
||||
|
November 27, 2017 - December 31, 2017
|
3,961
|
|
$
|
52.46
|
|
—
|
|
1,957,463
|
|
||||
|
Total
|
563,294
|
|
$
|
47.81
|
|
555,261
|
|
||||||
_________________________
|
(1)
|
On April 25, 2017, the Board of Directors authorized the repurchase of up to 3.0 million shares of our outstanding common stock which, at the time of authorization, were incremental to the remaining shares under the Company's previous share repurchase program. This plan does not have an expiration date. During the three months ended December 31, 2017, we repurchased and retired, reported based on trade date, approximately 0.6 million shares of common stock at a cost of $26.5 million under the Company's common stock repurchase program authorized by the Board of Directors.
|
|
(2)
|
During the three months ended December 31, 2017, we repurchased and retired, as reported on trade date, approximately 8,000 shares of common stock at a cost of $0.4 million to help facilitate tax withholding for RSUs.
|
Recent Sales of Unregistered Securities
None.
33
Stock Performance Graph
Notwithstanding any statement to the contrary in any of our previous or future filings with the SEC, the following information relating to the price performance of our common stock shall not be deemed “filed” with the SEC or “soliciting material” under the Exchange Act and shall not be incorporated by reference into any such filings.
The following graph shows a comparison from December 31, 2012 through December 31, 2017 of cumulative total return for our common stock, the Nasdaq Composite Index and the Nasdaq Computer Index. Such returns are based on historical results and are not intended to suggest future performance. Data for the Nasdaq Composite Index and the Nasdaq Computer Index assume reinvestment of dividends. We have never paid dividends on our common stock and have no present plans to do so.
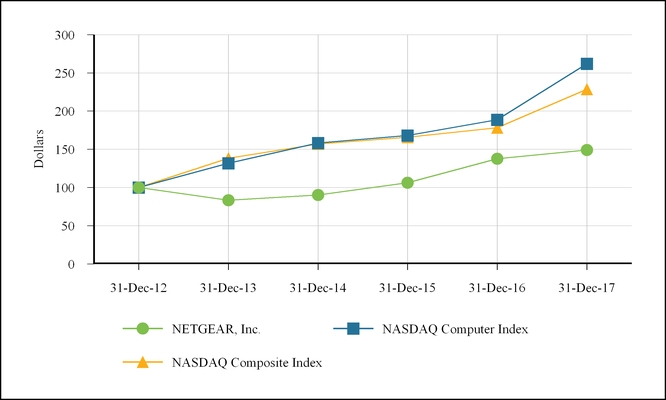
34
|
Item 6.
|
Selected Financial Data
|
The following selected consolidated financial data are qualified in their entirety, and should be read in conjunction with the consolidated financial statements and related notes thereto, and “
Management's Discussion and Analysis of Financial Condition and Results of Operations
” in Item 7 of Part II of this Annual Report on Form 10-K.
We derived the selected consolidated statements of operations data for the years ended December 31,
2017
,
2016
and
2015
and the selected consolidated balance sheets data as of December 31,
2017
and
2016
from our audited consolidated financial statements in Item 8 of Part II of this Annual Report on Form 10-K. We derived the selected consolidated statements of operations data for the years ended December 31,
2014
and
2013
and the selected consolidated balance sheets data as of December 31,
2015
,
2014
and
2013
from our audited consolidated financial statements, which are not included in this Annual Report on Form 10-K. Historical results are not necessarily indicative of results to be expected for future periods.
|
|
Year Ended December 31,
|
|||||||||||||||||||
|
2017
|
2016
|
2015
|
2014
|
2013
|
||||||||||||||||
|
(In thousands, except per share data)
|
||||||||||||||||||||
|
Net revenue
|
$
|
1,406,920
|
|
$
|
1,328,298
|
|
$
|
1,300,695
|
|
$
|
1,393,515
|
|
$
|
1,369,633
|
|
|||||
|
Cost of revenue
(2)
|
1,010,878
|
|
916,113
|
|
933,016
|
|
995,597
|
|
976,018
|
|
||||||||||
|
Gross profit
|
396,042
|
|
412,185
|
|
367,679
|
|
397,918
|
|
393,615
|
|
||||||||||
|
Operating expenses:
|
||||||||||||||||||||
|
Research and development
(2)
|
94,603
|
|
89,367
|
|
86,499
|
|
90,902
|
|
85,168
|
|
||||||||||
|
Sales and marketing
(2)
|
158,168
|
|
150,355
|
|
146,794
|
|
157,017
|
|
153,804
|
|
||||||||||
|
General and administrative
(2)
|
56,421
|
|
54,482
|
|
45,313
|
|
46,552
|
|
48,915
|
|
||||||||||
|
Restructuring and other charges
|
97
|
|
3,881
|
|
6,398
|
|
2,209
|
|
5,335
|
|
||||||||||
|
Litigation reserves, net
|
176
|
|
73
|
|
(2,682
|
)
|
(1,011
|
)
|
5,354
|
|
||||||||||
|
Goodwill impairment charges
|
—
|
|
—
|
|
—
|
|
74,196
|
|
—
|
|
||||||||||
|
Intangibles impairment charges
|
—
|
|
—
|
|
—
|
|
—
|
|
2,000
|
|
||||||||||
|
Total operating expenses
|
309,465
|
|
298,158
|
|
282,322
|
|
369,865
|
|
300,576
|
|
||||||||||
|
Income from operations
|
86,577
|
|
114,027
|
|
85,357
|
|
28,053
|
|
93,039
|
|
||||||||||
|
Interest income
|
2,113
|
|
1,163
|
|
295
|
|
253
|
|
400
|
|
||||||||||
|
Other income (expense), net
|
2,024
|
|
(121
|
)
|
(88
|
)
|
2,455
|
|
(457
|
)
|
||||||||||
|
Income before income taxes
|
90,714
|
|
115,069
|
|
85,564
|
|
30,761
|
|
92,982
|
|
||||||||||
|
Provision for income taxes
|
71,278
|
|
39,218
|
|
36,980
|
|
21,973
|
|
37,765
|
|
||||||||||
|
Net income
|
$
|
19,436
|
|
$
|
75,851
|
|
$
|
48,584
|
|
$
|
8,788
|
|
$
|
55,217
|
|
|||||
|
Net income per share:
|
||||||||||||||||||||
|
Basic
(1)
|
$
|
0.61
|
|
$
|
2.32
|
|
$
|
1.47
|
|
$
|
0.25
|
|
$
|
1.44
|
|
|||||
|
Diluted
(1)
|
$
|
0.59
|
|
$
|
2.25
|
|
$
|
1.44
|
|
$
|
0.24
|
|
$
|
1.42
|
|
|||||
_________________________
|
(1)
|
Information regarding calculation of per share data is described in Note 5,
Net Income Per Share
, in Notes to Consolidated Financial Statements in Item 8 of Part II of this Annual Report on Form 10-K.
|
35
|
(2)
|
Stock-based compensation expense was allocated as follows:
|
|
|
Year Ended December 31,
|
|||||||||||||||||||
|
2017
|
2016
|
2015
|
2014
|
2013
|
||||||||||||||||
|
(In thousands)
|
||||||||||||||||||||
|
Cost of revenue
|
$
|
2,005
|
|
$
|
1,740
|
|
$
|
1,566
|
|
$
|
2,037
|
|
$
|
1,577
|
|
|||||
|
Research and development
|
4,927
|
|
4,075
|
|
3,451
|
|
4,916
|
|
3,943
|
|
||||||||||
|
Sales and marketing
|
5,959
|
|
5,065
|
|
5,022
|
|
6,168
|
|
5,379
|
|
||||||||||
|
General and administrative
|
9,256
|
|
8,069
|
|
6,786
|
|
6,893
|
|
6,563
|
|
||||||||||
|
|
As of December 31,
|
|||||||||||||||||||
|
2017
|
2016
|
2015
|
2014
|
2013
|
||||||||||||||||
|
(In thousands)
|
||||||||||||||||||||
|
Cash, cash equivalents and short-term investments
|
$
|
329,796
|
|
$
|
365,982
|
|
$
|
278,266
|
|
$
|
257,129
|
|
$
|
248,154
|
|
|||||
|
Working capital
|
$
|
591,228
|
|
$
|
606,132
|
|
$
|
505,371
|
|
$
|
518,849
|
|
$
|
500,028
|
|
|||||
|
Total assets
|
$
|
1,208,564
|
|
$
|
1,184,456
|
|
$
|
1,050,569
|
|
$
|
1,048,687
|
|
$
|
1,093,930
|
|
|||||
|
Total current liabilities
|
$
|
424,436
|
|
$
|
356,653
|
|
$
|
315,772
|
|
$
|
304,116
|
|
$
|
300,083
|
|
|||||
|
Total non-current liabilities
|
$
|
53,643
|
|
$
|
30,984
|
|
$
|
26,087
|
|
$
|
23,006
|
|
$
|
20,064
|
|
|||||
|
Total stockholders' equity
|
$
|
730,485
|
|
$
|
796,819
|
|
$
|
708,710
|
|
$
|
721,565
|
|
$
|
773,783
|
|
|||||
36
|
Item 7.
|
Management’s Discussion and Analysis of Financial Condition and Results of Operations
|
You should read the following discussion of our financial condition and results of operations together with the audited consolidated financial statements and notes to the financial statements included elsewhere in this Form 10-K. This discussion contains forward-looking statements that involve risks and uncertainties. The forward-looking statements are not historical facts, but rather are based on current expectations, estimates, assumptions and projections about our industry, business and future financial results. Our actual results could differ materially from the results contemplated by these forward-looking statements due to a number of factors, including those discussed under “Risk Factors” in Part I, Item 1A above.
Business and Executive Overview
We are a global company that delivers innovative networking and Internet connected products to consumers and growing businesses. Our products are built on a variety of proven technologies such as wireless (WiFi and LTE), Ethernet and powerline, with a focus on reliability and ease-of-use. Our product line consists of devices that create and extend wired and wireless networks as well as devices that provide a special function and attach to the network, such as IP security cameras and home automation devices and services. These products are available in multiple configurations to address the changing needs of our customers in each geographic region in which our products are sold.
In the first fiscal quarter of 2017, our Chief Operating Decision Maker requested changes to the information that he regularly reviews for purposes of allocating resources and assessing performance. By consequence, we reorganized our operating segment structure, resulting in a change to our reportable segments. The former Service Provider segment was integrated into the current segments which are organized by product groups. Beginning with fiscal year 2017, we operate and report in three segments: Arlo, Connected Home, and Small and Medium Business ("SMB"). For additional information on the changes in the reportable segments, refer to Note 11, Segment Information, in the Notes to Consolidated Financial Statements in Item 8 of Part II of this Annual Report on Form 10-K.
We believe that this structure reflects our current operational and financial management, and provides the best structure for us to focus on growth opportunities while maintaining financial discipline. Each segment contains leadership focused on the product development efforts, both from a product marketing and engineering standpoint, to service the unique needs of their customers. The Arlo segment is focused on intelligent internet-connected products for consumers and businesses that provide security and safety. The Connected Home segment is focused on consumers and consists of high-performance, dependable and easy-to-use LTE and WiFi internet networking solutions. The SMB segment is focused on small and medium-sized businesses and consists of business networking, storage and security solutions that bring enterprise-class functionality to small and medium-sized businesses at an affordable price. We conduct business across three geographic regions: Americas; Europe, Middle-East and Africa (“EMEA”) and Asia Pacific (“APAC”).
The markets in which all of our segments operate are intensely competitive and subject to rapid technological change. We believe that the principal competitive factors in the consumer and small and medium-sized businesses markets for networking products include product breadth, size and scope of the sales channel, brand name, timeliness of new product introductions, product availability, performance, features, functionality and reliability, ease-of-installation, maintenance and use, security, and customer service and support. To remain competitive, we believe we must continue to aggressively invest resources in developing new products and enhancing our current products while continuing to expand our channels and maintaining customer satisfaction worldwide. Among these investments is an enhanced focus on cybersecurity relating to our products and systems, as the threat of cyber-attacks and exploitation of potential security vulnerabilities in our industry is on the rise and is increasingly a significant consumer concern.
We sell our products through multiple sales channels worldwide, including traditional retailers, online retailers, wholesale distributors, direct market resellers (“DMRs”), value-added resellers (“VARs”), and broadband service providers. Our retail channel includes traditional retail locations domestically and internationally, such as Best Buy, Costco, Fry’s Electronics, Staples, Target, Wal-Mart, Argos (U.K.), PC World (U.K.), MediaMarkt (Europe), Darty (France), JB HiFi (Australia), Elkjop (Norway) and Sunning and Guomei (China). Online retailers include Amazon.com worldwide, Newegg.com (US), JD.com and Alibaba (China), as well as NBB.com (Germany) and Coolblue.com (Netherlands). Our DMRs include CDW Corporation, Insight Corporation and PC Connection in domestic markets and Misco throughout Europe. In addition, we also sell our products through broadband service providers, such as multiple system operators (“MSOs”), xDSL, and other broadband technology operators domestically and internationally. Some of these retailers and broadband service providers purchase directly from us, while others are fulfilled through wholesale distributors around the world. A substantial portion of our net revenue to date has been derived
37
from a limited number of wholesale distributors and retailers. We expect that these wholesale distributors and retailers will continue to contribute a significant percentage of our net revenue for the foreseeable future.
We experienced an increase of
5.9%
in net revenue while income from operations fell
24.1%
in fiscal 2017 compared to fiscal 2016. The increase in net revenue was attributable to the performance of our Arlo segment which experienced net revenue growth of
100.8%
, partially offset by declines in both Connected Home and SMB of
9.8%
and
9.7%
, respectively. The increase in Arlo segment net revenue was mainly driven by our Arlo Smart security cameras which experienced strong end user demand in a fast growing market and was assisted by new product introductions. The decrease in Connected Home net revenue was primarily due to broadband modem and gateway, home wireless, and powerline product categories. SMB net revenue declined across all product categories compared to the prior year period with the greatest decline experienced in switches. Income from operations fell
$27.5 million
as a result of contribution income declines in both Connected Home and SMB, offset by contribution income increases in the Arlo segment. The increase in Arlo contribution income was due to the significant growth in net revenue not being met with proportionate increases in operating expenditures. Contribution income declines in Connected Home and SMB were as a result of lower gross profit attainment, due in part to higher investment in channel promotional activities as well as increased sales returns.
On a geographic basis, net revenue increased in the Americas and EMEA and declined in APAC during fiscal 2017 compared to fiscal 2016. The increase in Americas net revenue was primarily driven by higher gross shipments of our Arlo Smart security cameras, mobile and home wireless products, partially offset by declines in gross shipments of broadband modem and gateway products and switches. The increase in EMEA was primarily driven by increased gross shipments of our Arlo Smart security cameras, home wireless, switches, and mobile products, partially offset by a reduction in gross shipments of broadband modem and gateway and powerline products. APAC net revenue decreased due to a decline in gross shipments of our broadband modem and gateway products, partially offset by increased gross shipments of mobile products and Arlo Smart security cameras.
Looking forward, we expect strong growth in our Arlo segment driven by increasing demand for our Arlo Smart security cameras as well as through the introductions of new product categories and services, while we move forward with our planned separation of the Arlo business. For details on our planned separation of the Arlo business, refer to
Note 14, Subsequent Event
, in Notes to Consolidated Financial Statements in Item 8 of Part II of this Annual Report on Form 10-K. We also expect growth in our SMB segment driven by sales of our 10Gig, PoE, web-managed and app-managed switches and rackmount storage products. We are targeting low single digit growth in our Connected Home segment compared with the same period of the prior year. We expect service provider net revenue to be approximately $50 to $55 million per quarter and anticipate an increased share of this revenue will be derived from Arlo in fiscal 2018. In addition, we expect a shift in consumer preference away from single point WiFi routers to whole Home WiFi Systems which may require increased marketing and promotional expenditures to achieve similar levels of market share as we have experienced in the WiFi router category.
Critical Accounting Policies and Estimates
Our consolidated financial statements have been prepared in accordance with accounting principles generally accepted in the United States of America and pursuant to the rules and regulations of the U.S. Securities and Exchange Commission ("SEC"). The preparation of these financial statements requires management to make assumptions, judgments and estimates that can have a significant impact on the reported amounts of assets, liabilities, revenues and expenses. We base our estimates on historical experience and on various other assumptions believed to be applicable and reasonable under the circumstances. Actual results could differ significantly from these estimates. These estimates may change as new events occur, as additional information is obtained and as our operating environment changes. On a regular basis we evaluate our assumptions, judgments and estimates and make changes accordingly. We also discuss our critical accounting estimates with the Audit Committee of the Board of Directors. Note 1,
The Company and Summary of Significant Accounting Policies
, in Notes to Consolidated Financial Statements in Item 8 of Part II of this Annual Report on Form 10-K describes the significant accounting policies used in the preparation of the consolidated financial statements. We have listed below our critical accounting policies that we believe to have the greatest potential impact on our consolidated financial statements. Historically, our assumptions, judgments and estimates relative to our critical accounting policies have not differed materially from actual results.
38
Revenue Recognition
Revenue from product sales is generally recognized at the time the product is shipped provided that persuasive evidence of an arrangement exists, title and risk of loss has transferred to the customer, the selling price is fixed or determinable and collection of the related receivable is reasonably assured. Currently, for some of our customers, title passes to the customer upon delivery to the port or country of destination, upon their receipt of the product, or upon the customer's resale of the product. At the end of each fiscal quarter, we estimate and defer revenue related to product where title has not transferred. The revenue continues to be deferred until such time that title passes to the customer. We assess collectability based on a number of factors, including general economic and market conditions, past transaction history with the customer, and the creditworthiness of the customer. If we determine that collection is not reasonably assured, then revenue is deferred until receipt of the payment from the customer.
We have product offerings with multiple elements. Our multiple-element product offerings include hardware with free services, networking hardware with embedded software, various software subscription services, and support, which are considered separate units of accounting. In general, the hardware and networking hardware with embedded software are delivered up front, while the free services are delivered over the stated service period, or the estimated useful life. The subscription services and support are delivered over the subscription and support period whether included in a multiple-element offering or not. We allocate revenue to the deliverables based upon their relative selling price. Revenue allocated to each unit of accounting is then recognized when persuasive evidence of an arrangement exists, title and risk of loss has transferred to the customer, the selling price is fixed or determinable and collection of the related receivable is reasonably assured.
When applying the relative selling price method, we determine the selling price for each deliverable using vendor-specific objective evidence ("VSOE") of fair value of the deliverable, or when VSOE of fair value is unavailable, its best estimate of selling price (“ESP”), as we have determined it is unable to establish third-party evidence of selling price for the deliverables. In determining VSOE, we require that a substantial majority of the selling prices for a deliverable sold on a stand-alone basis fall within a reasonably narrow pricing range, generally evidenced by approximately 80% of such historical stand-alone transactions falling within +/-15% of the median price. We determine ESP for a deliverable by considering multiple factors including, but not limited to, market conditions, competitive landscape, internal costs, gross margin objectives and pricing practices. The objective of ESP is to determine the price at which we would transact a sale if the deliverable were sold on a stand-alone basis. The determination of ESP is made through consultation with and formal approval by our management, taking into consideration the go-to-market strategy.
We have not made any material changes in the accounting methodology we use to estimate deferred revenue related to product where title has not transferred. Our estimated deferred revenue can vary from actual results and we may have to record additional deferred revenue, which could materially impact our financial position and results of operations.
Allowances for Warranty Obligations, Returns due to Stock Rotation, Sales Incentives and Doubtful Accounts
Our standard warranty obligation to our direct customers generally provides for a right of return of any product for a full refund in the event that such product is not merchantable or is found to be damaged or defective. At the time revenue is recognized, an estimate of future warranty returns is recorded to reduce revenue in the amount of the expected credit or refund to be provided to our direct customers. At the time we record the reduction to revenue related to warranty returns, we include within cost of revenue a write-down to reduce the carrying value of such products to net realizable value. Our standard warranty obligation to end-users provides for replacement of a defective product for one or more years. Factors that affect the warranty obligation include product failure rates, material usage, and service delivery costs incurred in correcting product failures. The estimated cost associated with fulfilling the warranty obligation to end-users is recorded in cost of revenue. Because our products are manufactured by third-party manufacturers, in certain cases we have recourse to the third-party manufacturer for replacement or credit for the defective products. We give consideration to amounts recoverable from our third-party manufacturers in determining our warranty liability. Our estimated allowances for product warranties can vary from actual results and we may have to record additional revenue reductions or charges to cost of revenue, which could materially impact our financial position and results of operations.
In addition to warranty-related returns, certain distributors and retailers generally have the right to return product for stock rotation purposes. Upon shipment of the product, we reduce revenue for an estimate of potential future stock rotation returns related to the current period product revenue. We analyze historical returns, channel inventory levels, current economic trends and changes in customer demand for our products when evaluating the adequacy of the allowance for sales returns, namely stock
39
rotation returns. Our estimated allowances for returns due to stock rotation can vary from actual results and we may have to record additional revenue reductions, which could materially impact our financial position and results of operations.
We accrue for sales incentives as a marketing expense if we receive an identifiable benefit in exchange and can reasonably estimate the fair value of the identifiable benefit received; otherwise, it is recorded as a reduction of revenues. Our estimated provisions for sales incentives can vary from actual results and we may have to record additional expenses or additional revenue reductions dependent on the classification of the sales incentive.
We maintain an allowance for doubtful accounts for estimated losses resulting from the inability of our customers to make required payments. We regularly perform credit evaluations of our customers’ financial condition and consider factors such as historical experience, credit quality, age of the accounts receivable balances, and geographic or country-specific risks and economic conditions that may affect a customer’s ability to pay. The allowance for doubtful accounts is reviewed quarterly and adjusted if necessary based on our assessments of our customers’ ability to pay. If the financial condition of our customers should deteriorate or if actual defaults are higher than our historical experience, additional allowances may be required, which could have an adverse impact on operating expenses.
Valuation of Inventory
We value our inventory at the lower of cost and net realizable value, cost being determined using the first-in, first-out method. We continually assess the value of our inventory and will periodically write down its value for estimated excess and obsolete inventory based upon assumptions about future demand and market conditions. On a quarterly basis, we review inventory quantities on hand and on order under non-cancelable purchase commitments, including consignment inventory, in comparison to our estimated forecast of product demand for the next nine months to determine what inventory, if any, are not saleable. Our analysis is based on the demand forecast but takes into account market conditions, product development plans, product life expectancy and other factors. Based on this analysis, we write down the affected inventory value for estimated excess and obsolescence charges. At the point of loss recognition, a new, lower cost basis for that inventory is established, and subsequent changes in facts and circumstances do not result in the restoration or increase in that newly established cost basis. As demonstrated during prior years, demand for our products can fluctuate significantly. If actual demand is lower than our forecasted demand and we fail to reduce our manufacturing accordingly, we could be required to write down the value of additional inventory, which would have a negative effect on our gross profit.
Goodwill
Goodwill represents the purchase price over estimated fair value of net assets of businesses acquired in a business combination. Goodwill acquired in a business combination is not amortized, but instead tested for impairment at least annually on the first day of the fourth quarter. Should certain events or indicators of impairment occur between annual impairment tests, we will perform the impairment test as those events or indicators occur. Examples of such events or circumstances include the following: a significant decline in our expected future cash flows, a sustained, significant decline in our stock price and market capitalization, a significant adverse change in the business climate, and slower growth rates. In the first fiscal quarter of 2017, we reorganized our operating segment structure resulting in a change to our reportable segments. Goodwill was reallocated to the reportable segments using a relative fair value approach. As a result, we completed assessments of any potential goodwill impairment for all reportable segments immediately prior to and after the reallocation and determined that no impairment existed.
Starting from the fourth fiscal quarter of 2017, we early adopted ASU 2017-04, "Intangibles-Goodwill and Other: Simplifying the Test for Goodwill Impairment".
Goodwill is tested for impairment at the reporting unit level by first performing a qualitative assessment to determine whether it is more likely than not (that is, a likelihood of more than 50%) that the fair value of the reporting unit is less than its carrying value. The qualitative assessment considers the following factors: macroeconomic conditions, industry and market considerations, cost factors, overall company financial performance, events affecting the reporting units, and changes in our share price. If the reporting unit does not pass the qualitative assessment, we estimate our fair value and compare the fair value with the carrying value of the reporting unit, including goodwill. If the fair value is greater than the carrying value of our reporting unit, no impairment results. If the fair value is less than the carrying value, an impairment loss is recognized for the amount that the carrying amount of a reporting unit, including goodwill, exceeds its fair value, limited to the total amount of goodwill allocated to that reporting unit. The impairment charge would be recorded to earnings in the consolidated statements of operations.
40
We completed the annual impairment test of goodwill as of the first day of the fourth fiscal quarter of 2017, or October 2,
2017
. We identified the reporting units for the purpose of goodwill impairment testing as Arlo, Connected Home, and SMB. We performed a qualitative test for goodwill impairment of the three reporting units as of October 2, 2017. Based upon the results of the qualitative testing, the respective fair values of the three reporting units were substantially in excess of these reporting units’ carrying values. We believe that it is more-likely-than-not that the fair value of these reporting units are greater than their respective carrying values and therefore performing the next step of impairment test for these reporting units was unnecessary. No goodwill impairment was recognized for our reporting units in the years ended December 31,
2017
,
2016
or
2015
.
For Arlo, Connected Home, and SMB reporting units, we do not believe it is likely that there will be a material change in the estimates or assumptions we use to test for impairment losses on goodwill. However, if the actual results are not consistent with our estimates or assumptions, we may be exposed to a future impairment charge that could be material.
Long Lived Assets Excluding Goodwill
Our long lived assets include goodwill, purchased intangibles with finite lives and property and equipment. Purchased intangibles with finite lives are amortized using the straight-line method over the estimated economic lives of the assets, which range from three to ten years. Property and equipment are stated at historical cost, less accumulated depreciation. Long lived assets are reviewed for impairment whenever events or changes in circumstances indicate that the carrying amount of such assets may not be recoverable. Examples of such events or circumstances include the following: a significant decrease in the market price of the asset, a significant decline in our expected future cash flows, significant changes or planned changes in our use of the assets, a sustained, significant decline in our stock price and market capitalization and a significant adverse change in the business climate.
D
etermination of recoverability is based on an estimate of undiscounted future cash flows resulting from the use of the asset and its eventual disposition. If the carrying amount of the asset exceeds its estimated undiscounted future net cash flows, an impairment charge is recognized in the amount by which the carrying amount of the asset exceeds the fair value of the asset. The carrying value of the asset is reviewed on a regular basis for the existence of facts, both internal and external, that may suggest impairment.
During the year ended December 31, 2017, there were no events or changes in circumstances that indicated the carrying amount of our finite-lived assets may not be recoverable from their undiscounted cash flows. Consequently, we did not perform an impairment test. We also reviewed the depreciation and amortization policies for the long-lived asset groups and ensured the remaining useful lives are appropriate. We did not record any impairments to intangibles during the years ended
December 31, 2017
,
2016
and
2015
. The carrying value of property and equipment asset is reviewed on a regular basis for the existence of facts, both internal and external, that may suggest impairment. Charges related to the impairment of property and equipment were insignificant for the years ended December 31,
2017
,
2016
and
2015
.
We will continue to evaluate the carrying value of our long-lived assets and if we determine in the future that there is a potential further impairment, we may be required to record additional charges to earnings which could affect our financial results.
Income Taxes
We account for income taxes under an asset and liability approach. Under this method, income tax expense is recognized for the amount of taxes payable or refundable for the current year. In addition, deferred tax assets and liabilities are recognized for the expected future tax consequences of temporary differences resulting from different treatments for tax versus accounting of certain items, such as accruals and allowances not currently deductible for tax purposes. These differences result in deferred tax assets and liabilities, which are included within the consolidated balance sheets. We must then assess the likelihood that our deferred tax assets will be recovered from future taxable income and to the extent we believe that recovery is not more likely than not, we must establish a valuation allowance. Our assessment considers the recognition of deferred tax assets on a jurisdictional basis. Accordingly, in assessing our future taxable income on a jurisdictional basis, we consider the effect of its transfer pricing policies on that income. We have placed a valuation allowance against California deferred tax assets since the recovery of the assets is uncertain. We believe that all of our other deferred tax assets are recoverable; however, if there were a change in our ability to recover our deferred tax assets, we would be required to take a charge in the period in which we determined that recovery was not more likely than not.
Uncertain tax provisions are recognized under guidance that provides that a company should use a more-likely-than-not recognition threshold based on the technical merits of the income tax position taken. Income tax positions that meet the more-
41
likely-than-not recognition threshold should be measured in order to determine the tax benefit to be recognized in the financial statements. We include interest expense and penalties related to uncertain tax positions as additional tax expense.
On December 22, 2017, the Tax Cuts and Jobs Act of 2017 (the “Tax Act”) was signed into law making significant changes to the Internal Revenue Code. Changes include, but are not limited to, a corporate tax rate decrease from 35% to 21% effective for tax years beginning after December 31, 2017, the transition of U.S international taxation from a worldwide tax system to a territorial system, and a one-time transition tax on the mandatory deemed repatriation of cumulative foreign earnings as of December 31, 2017. The recently enacted Tax Act significantly changed how the US taxes corporations. At this time, significant judgment is required in implementing the law due to the lack of sufficient interpretive guidance. Computations required are complex and data intensive. As guidance becomes available, we will adjust our calculations and will adjust provisional amounts that we have recorded in our tax provision.
Results of Operations
The following table sets forth, for the periods presented, the consolidated statements of operations data, which is derived from the accompanying consolidated financial statements:
|
|
Year Ended December 31,
|
|||||||||||||||||||
|
|
2017
|
2016
|
2015
|
|||||||||||||||||
|
|
(In thousands, except percentage data)
|
|||||||||||||||||||
|
Net revenue
|
$
|
1,406,920
|
|
100.0
|
%
|
$
|
1,328,298
|
|
100.0
|
%
|
$
|
1,300,695
|
|
100.0
|
%
|
|||||
|
Cost of revenue
|
1,010,878
|
|
71.9
|
%
|
916,113
|
|
69.0
|
%
|
933,016
|
|
71.7
|
%
|
||||||||
|
Gross profit
|
396,042
|
|
28.1
|
%
|
412,185
|
|
31.0
|
%
|
367,679
|
|
28.3
|
%
|
||||||||
|
Operating expenses:
|
||||||||||||||||||||
|
Research and development
|
94,603
|
|
6.7
|
%
|
89,367
|
|
6.7
|
%
|
86,499
|
|
6.7
|
%
|
||||||||
|
Sales and marketing
|
158,168
|
|
11.2
|
%
|
150,355
|
|
11.3
|
%
|
146,794
|
|
11.2
|
%
|
||||||||
|
General and administrative
|
56,421
|
|
4.0
|
%
|
54,482
|
|
4.1
|
%
|
45,313
|
|
3.5
|
%
|
||||||||
|
Restructuring and other charges
|
97
|
|
0.0
|
%
|
3,881
|
|
0.3
|
%
|
6,398
|
|
0.5
|
%
|
||||||||
|
Litigation reserves, net
|
176
|
|
0.0
|
%
|
73
|
|
0.0
|
%
|
(2,682
|
)
|
(0.2
|
)%
|
||||||||
|
Total operating expenses
|
309,465
|
|
21.9
|
%
|
298,158
|
|
22.4
|
%
|
282,322
|
|
21.7
|
%
|
||||||||
|
Income from operations
|
86,577
|
|
6.2
|
%
|
114,027
|
|
8.6
|
%
|
85,357
|
|
6.6
|
%
|
||||||||
|
Interest income
|
2,113
|
|
0.1
|
%
|
1,163
|
|
0.1
|
%
|
295
|
|
0.0
|
%
|
||||||||
|
Other income (expense), net
|
2,024
|
|
0.1
|
%
|
(121
|
)
|
0.0
|
%
|
(88
|
)
|
0.0
|
%
|
||||||||
|
Income before income taxes
|
90,714
|
|
6.4
|
%
|
115,069
|
|
8.7
|
%
|
85,564
|
|
6.6
|
%
|
||||||||
|
Provision for income taxes
|
71,278
|
|
5.0
|
%
|
39,218
|
|
3.0
|
%
|
36,980
|
|
2.9
|
%
|
||||||||
|
Net income
|
$
|
19,436
|
|
1.4
|
%
|
$
|
75,851
|
|
5.7
|
%
|
$
|
48,584
|
|
3.7
|
%
|
|||||
Net Revenue by Geographic Region
Our net revenue consists of gross product shipments and service revenue, less allowances for estimated sales returns for stock rotation and warranty, price protection, end-user customer rebates and other channel sales incentives deemed to be a reduction of net revenue per the authoritative guidance for revenue recognition, and net changes in deferred revenue.
We conduct business across three geographic regions: Americas, EMEA and APAC. For reporting purposes revenue is attributed to each geographic region based upon the location of the customer.
42
|
|
Year Ended December 31,
|
||||||||||||||||
|
|
2017
|
% Change
|
2016
|
% Change
|
2015
|
||||||||||||
|
|
(In thousands, except percentage data)
|
||||||||||||||||
|
Americas
|
$
|
958,064
|
|
8.4
|
%
|
$
|
883,648
|
|
10.8
|
%
|
$
|
797,746
|
|
||||
|
Percentage of net revenue
|
68.1
|
%
|
66.5
|
%
|
61.4
|
%
|
|||||||||||
|
EMEA
|
$
|
253,885
|
|
3.5
|
%
|
$
|
245,405
|
|
(23.7
|
)%
|
$
|
321,714
|
|
||||
|
Percentage of net revenue
|
18.0
|
%
|
18.5
|
%
|
24.7
|
%
|
|||||||||||
|
APAC
|
$
|
194,971
|
|
(2.1
|
)%
|
$
|
199,245
|
|
9.9
|
%
|
$
|
181,235
|
|
||||
|
Percentage of net revenue
|
13.9
|
%
|
15.0
|
%
|
13.9
|
%
|
|||||||||||
|
Total net revenue
|
$
|
1,406,920
|
|
5.9
|
%
|
$
|
1,328,298
|
|
2.1
|
%
|
$
|
1,300,695
|
|
||||
2017 vs 2016
The increase in Americas net revenue for the year ended December 31, 2017 compared to the prior year was due to higher gross shipments of our Arlo Smart security cameras, partially offset by declines in gross shipments of broadband modem and gateway products and switches. Net revenue was negatively impacted by channel promotion activities and sales returns deemed to be a reduction of revenue increasing disproportionately compared to the prior year periods. Arlo segment net revenue experienced year over year growth of 98.5% for the year ended December 31, 2017. We continue to experience robust end user demand for our Arlo products and service this demand through new product introductions. Connected Home net revenue fell 8.6% compared to the prior year, predominantly due to significant declines in net revenue from our service provider customers. The fall in service provider net revenue is as a result of decisions taken by management in fiscal 2015 and 2016 to reduce focus on sales to certain service provider customers. SMB net revenue fell 16.4% compared to the prior year. The decline in SMB net revenue was due to a combination of lower gross shipments of switches combined with increased investment in channel promotional activities and higher proportionate sales returns compared to the prior year period.
EMEA net revenue increased for the year ended December 31, 2017, compared to the prior year, driven by increased gross shipments of our Arlo Smart security cameras, partially offset by declines in gross shipments of our broadband modem and gateway and powerline products. Arlo net revenue increased 107.2% compared to the prior year period. Connected Home and SMB net revenue declined by 16.4% and 3.9%, respectively, mainly due to declines in gross shipments of the aforementioned product categories. Additionally, Connected Home net revenue was further impacted by increases in channel promotional activities and provisions for sales returns compared to the prior year period.
APAC net revenue decreased for the year ended December 31, 2017, compared to the prior year period. The decrease was primarily attributable to lower gross shipments of our broadband modem and gateway products, partially offset by higher gross shipments of mobile products and Arlo Smart security cameras.
2016 vs 2015
The increase in Americas net revenue for the year ended December 31, 2016 compared to the prior year was primarily driven by increases in gross shipments of our Arlo Smart security cameras, broadband modem and gateway products and switches. The increase was partially offset by a fall in gross shipments of mobile hotspots to service provider customers. In addition, the increase in gross shipments to non-service provider customers was offset in part by higher channel promotion activities expenditure deemed to be a reduction of revenue under the authoritative guidance for revenue recognition. We experienced strong end user demand for our Arlo Smart security cameras, Nighthawk home networking products and Orbi WiFi systems. Service provider net revenue fell versus the prior year period as we continue to prioritize profitability with respect to service provider business opportunities.
The decrease in EMEA net revenue for the year ended December 31, 2016 compared to the prior year was primarily driven by the decline in net revenue from our service provider customers. The steps taken to restructure our former service provider segment in the first and second quarter of 2015 and again in the first quarter of 2016 were primarily responsible for the fall, resulting in reductions of gross shipments of broadband modem and gateway and home wireless products. The decline in net revenue from service provider customers was partially offset by growth in both our Arlo and SMB segments net revenue from non-service provider customers which saw an increase in gross shipments of Arlo Smart security cameras and switches.
43
The increase in APAC net revenue for the year ended December 31, 2016 compared to the prior year was primarily driven by increases in gross shipments of our broadband modem gateway products, switches, home wireless products, and Arlo Smart security cameras, partially offset by reductions in gross shipments of mobile hotspots and network storage products. The increased net revenue was due to improved performance across all three segments with the majority of growth coming from our SMB segment.
Cost of Revenue and Gross Margin
Cost of revenue consists primarily of the following: the cost of finished products from our third party manufacturers; overhead costs, including purchasing, product planning, inventory control, warehousing and distribution logistics; third-party software licensing fees; inbound freight; warranty costs associated with returned goods; write-downs for excess and obsolete inventory; amortization expense of certain acquired intangibles; and costs attributable to the provision of service offerings.
We outsource our manufacturing, warehousing and distribution logistics. We believe this outsourcing strategy allows us to better manage our product costs and gross margin. Our gross margin can be affected by a number of factors, including fluctuation in foreign exchange rates, sales returns, changes in average selling prices, end-user customer rebates and other channel sales incentives, and changes in our cost of goods sold due to fluctuations in prices paid for components, net of vendor rebates, warranty and overhead costs, inbound freight and duty, conversion costs, charges for excess or obsolete inventory and amortization of acquired intangibles. The following table presents costs of revenue and gross margin, for the periods indicated:
|
|
Year Ended December 31,
|
||||||||||||||||
|
|
2017
|
% Change
|
2016
|
% Change
|
2015
|
||||||||||||
|
|
(In thousands, except percentage data)
|
||||||||||||||||
|
Cost of revenue
|
$
|
1,010,878
|
|
10.3
|
%
|
$
|
916,113
|
|
(1.8
|
)%
|
$
|
933,016
|
|
||||
|
Gross margin percentage
|
28.1
|
%
|
31.0
|
%
|
28.3
|
%
|
|||||||||||
2017 vs 2016
Cost of revenue increased for the year ended December 31, 2017 due primarily to net revenue increasing compared to the prior year period.
Gross margin decreased for the year ended December 31, 2017 compared to the prior year. The decline in gross margin was mainly attributable to increased channel promotional expenditure deemed to be contra-revenue under authoritative guidance for revenue recognition, and increased provision for sales return and warranty expense disproportionate to net revenue as our mix has shifted towards retail.
2016 vs 2015
Cost of revenue decreased for the year ended December 31, 2016 compared to the prior year due primarily to the shift in net revenue away from our service provider customers toward the non-service provider customers. Cost of revenue associated with non-service provider business products represents a lower proportion of net revenue than service provider business products. In fiscal 2016, this net revenue shift was further assisted by improved gross margin performance of the SMB segment, mainly driven by improved gross margin achievement on switch product lines.
Gross margin increased for the year ended December 31, 2016 compared to the prior year due primarily to the shift in segment net revenue mix from service provider customers to non-service provider customers. Net revenue from service provider customers decreased as a percentage of net revenue to 20.6% for the year ended December 31, 2016, compared to 32.4% in the prior year. To a lesser extent, the gross margin in fiscal 2016 was positively impacted by higher gross margin yield and higher net revenue performance in the SMB segment.
44
For fiscal 2018, we expect gross margins to be in line or slightly improve from fiscal 2017. Forecasting future gross margin percentages is difficult, and there are a number of risks related to our ability to maintain or improve our current gross margin levels. Our cost of revenues as a percentage of revenues can vary significantly based upon a number of factors such as the following: uncertainties surrounding revenue levels, including future pricing and/or potential discounts as a result of the economy or in response to the strengthening of the U.S. dollar in our international markets, and related production level variances; competition; changes in technology; changes in product mix; variability of stock-based compensation costs; royalties to third parties; fluctuations in freight, duty and repair costs; manufacturing and purchase price variances; changes in prices on commodity components; warranty costs; and the timing of sales, particularly to service provider customers.
Operating Expenses
Research and Development
Research and development expense consists primarily of personnel expenses, payments to suppliers for design services, safety and regulatory testing, product certification expenditures to qualify our products for sale into specific markets, prototypes and other consulting fees. Research and development expenses are recognized as they are incurred. We have invested in building our research and development organization to enhance our ability to introduce innovative and easy-to-use products. The following table presents research and development expense, for the periods indicated:
|
|
Year Ended December 31,
|
||||||||||||||||
|
|
2017
|
% Change
|
2016
|
% Change
|
2015
|
||||||||||||
|
|
(In thousands, except percentage data)
|
||||||||||||||||
|
Research and development expense
|
$
|
94,603
|
|
5.9
|
%
|
$
|
89,367
|
|
3.3
|
%
|
$
|
86,499
|
|
||||
2017 vs 2016
Research and development expense increased for the year ended December 31, 2017 compared to the prior year period, due to increased spending of $5.4 million in engineering projects and outside professional services, $2.4 million in personnel-related expenditures, and $2.5 million in IT and facility allocations, partially offset by a reduction in variable compensation of $4.8 million. The increased expenditures on engineering projects and outside professional services are due to continuous investment in strategic focus areas. Research and development headcount increased from 331 as of December 31, 2016 to 359 as of December 31, 2017. The increase in research and development headcount was attributable to Arlo and shared service engineering which added 32 and 12, respectively, offset by declines to both Connected Home and SMB.
2016 vs 2015
Research and development expense increased for the year ended December 31, 2016 compared to the prior year period. The increase was attributable to increases in variable compensation of $3.5 million and personnel-related expenditures of $1.1 million, partially offset by a $1.7 million reduction in outside engineering services mainly associated with our service provider customers on a year over year basis. Headcount decreased by six from 337 as of December 31, 2015 to 331 as of December 31, 2016. The fall in headcount was attributable to our Connected Home segment which experienced a reduction of 37 positions year over year. The fall was offset primarily by headcount additions to Arlo which added 24 positions compared with 2015.
We believe that innovation and technological leadership is critical to our future success, and we are committed to continuing a significant level of research and development to develop new technologies and products to combat competitive pressures. We continue to invest in research and development to expand our Arlo product offerings and services, grow our cloud platform capabilities, and connected home products portfolio including services, expand our 10Gig, PoE, web-managed and app-managed switches, and develop innovative WiFi and LTE Advanced coverage solutions. For fiscal 2018, we expect research and development expenses to grow in absolute dollars as we allocate resources to help accelerate growth in key strategic areas, and as we work towards the planned separation of the Arlo business which will result in dis-synergies, mainly associated with duplicate hiring. Research and development expenses will fluctuate depending on the timing and number of development activities in any given quarter and could vary significantly as a percentage of revenue, depending on actual revenues achieved in any given quarter.
45
Sales and Marketing Expense
Sales and marketing expense consists primarily of advertising, trade shows, corporate communications and other marketing expenses, product marketing expenses, outbound freight costs, amortization of certain intangibles, personnel expenses for sales and marketing staff and technical support expenses. The following table presents sales and marketing expense, for the periods indicated:
|
|
Year Ended December 31,
|
||||||||||||||||
|
|
2017
|
% Change
|
2016
|
% Change
|
2015
|
||||||||||||
|
|
(In thousands, except percentage data)
|
||||||||||||||||
|
Sales and marketing expense
|
$
|
158,168
|
|
5.2
|
%
|
$
|
150,355
|
|
2.4
|
%
|
$
|
146,794
|
|
||||
2017 vs 2016
Sales and marketing expense increased for the year ended December 31, 2017 compared to the prior year, primarily attributable to an increase in marketing expenditures of $9.8 million and personnel-related expenditures of $2.1 million, partially offset by a reduction of $1.6 million in variable compensation and lower outside professional services of $1.3 million. The increased marketing spend was incurred to support new product introductions and brand marketing campaigns, primarily relating to Arlo and Consumer Home products. Sales and marketing headcount increased from 318 as of December 31, 2016 to 334 as of December 31, 2017.
2016 vs 2015
Sales and marketing expense increased for the year ended December 31, 2016 compared to the prior year due primarily to increases in product marketing expenditure of $5.1 million, variable compensation and personnel-related expenditures of $1.5 million partially offset by a reduction in outside professional service of $2.4 million and a reduction in freight expenses of $1.2 million. The increased marketing spend was incurred to support new product introductions and brand marketing campaigns primarily associated with our Nighthawk, Arlo, and Orbi product lines.
We expect our sales and marketing expense to grow in absolute dollars for fiscal year 2018. We expect to continue to invest in brand marketing to strengthen our competitive position in fast growing product categories. In addition, the planned separation of the Arlo business will result in dis-synergies, mainly associated with duplicate hiring. Expenses may fluctuate depending on revenue levels achieved as certain expenses, such as commissions, are determined based upon the revenues achieved. Forecasting sales and marketing expenses as a percentage of revenues is highly dependent on expected revenue levels and could vary significantly depending on actual revenues achieved in any given quarter. Marketing expenses will also fluctuate depending upon the timing, extent and nature of marketing programs.
General and Administrative Expense
General and administrative expense consists of salaries and related expenses for executives, finance and accounting, human resources, information technology, professional fees, including legal costs associated with defending claims against us, allowance for doubtful accounts and other general corporate expenses. The following table presents general and administrative expense, for the periods indicated:
|
|
Year Ended December 31,
|
||||||||||||||||
|
|
2017
|
% Change
|
2016
|
% Change
|
2015
|
||||||||||||
|
|
(In thousands, except percentage data)
|
||||||||||||||||
|
General and administrative expense
|
$
|
56,421
|
|
3.6
|
%
|
$
|
54,482
|
|
20.2
|
%
|
$
|
45,313
|
|
||||
2017 vs 2016
General and administrative expense increased slightly for the year ended December 31, 2017 compared to the prior year, mainly due to higher legal and professional services of $3.4 million and personnel-related expenditures of $1.8 million, substantially offset by a reduction in variable compensation costs of $3.6 million. The higher legal and professional services were primarily attributable to expenses incurred in relation to segment changes, the adoption of new revenue guidance, and our
46
planned separation of the Arlo business. General and administrative headcount increased to 178 employees as of December 31, 2017 from 161 employees as of December 31, 2016.
2016 vs 2015
General and administrative expense increased for the year ended December 31, 2016 compared to the prior year mainly due to increases in personnel-related costs of $3.0 million, variable compensation costs of $2.7 million, legal and professional services of $1.5 million. The increase was also attributable to higher costs associated with IT and facility allocation of $1.7 million. The increase in personnel expenses was primarily driven by increases in stock based compensation expense of $1.3 million. Headcount increased by 6 to 161 employees at December 31, 2016 compared to 155 employees at December 31, 2015.
We expect our general and administrative expenses to grow in absolute dollars in fiscal 2018 as we work towards the planned separation of the Arlo business, which will result in one-time expenses relating to third-party advisory and consulting services, and dis-synergies, mainly associated with duplicate hiring. The general and administrative expenses could fluctuate depending on a number of factors, including the level and timing of expenditures associated with litigation defense costs in connection with the litigation described in Note 8,
Commitments and Contingencies,
in Notes to Consolidated Financial Statements in Item 8 of Part II of this Annual Report on Form 10-K. Future general and administrative expense increases or decreases in absolute dollars are difficult to predict due to the lack of visibility of certain costs, including legal costs associated with defending claims against us, as well as legal costs associated with asserting and enforcing our intellectual property portfolio and other factors.
Restructuring and Other Charges
|
|
Year Ended December 31,
|
||||||||||||||||
|
|
2017
|
% Change
|
2016
|
% Change
|
2015
|
||||||||||||
|
|
(In thousands, except percentage data)
|
||||||||||||||||
|
Restructuring and other charges
|
$
|
97
|
|
(97.5
|
)%
|
$
|
3,881
|
|
(39.3
|
)%
|
$
|
6,398
|
|
||||
No significant restructuring and other charges were recognized during fiscal 2017 and the last two quarters of fiscal 2016. Restructuring and other charges recognized in the second fiscal quarter of 2016 related primarily to severance as headcount reductions occurred within our former commercial segment. The headcount reductions were implemented in line with channel shift and changing buying behaviors being experienced in relation to our former commercial business unit products. Restructuring and other charges recognized in the first fiscal quarter of 2016, and the first and second fiscal quarter of 2015 respectively related to actions to resize our former service provider segment and supporting functions. The actions were taken to match the reduced revenue outlook and to concentrate resources on LTE Advanced and long-term profitable accounts. Charges incurred in these periods primarily related to severance, other one-time termination benefits and other associated costs.
Restructuring actions are subject to significant risks, including delays in implementing expense control programs or workforce reductions and the failure to meet operational targets due to the loss of employees, all of which would impair our ability to achieve anticipated cost reductions. If we do not achieve anticipated cost reductions, our financial results could be negatively impacted. For further discussion of restructuring and other charges, refer to Note 13,
Restructuring and Other Charges,
in Notes to Consolidated Financial Statements in Item 8 of Part II of this Annual Report on Form 10-K.
Litigation Reserves, Net
**Percentage data not meaningful
|
|
Year Ended December 31,
|
|||||||||||||||
|
|
2017
|
% Change
|
2016
|
% Change
|
2015
|
|||||||||||
|
|
(In thousands, except percentage data)
|
|||||||||||||||
|
Litigation reserves, net
|
$
|
176
|
|
141.1
|
%
|
$
|
73
|
|
**
|
$
|
(2,682
|
)
|
||||
No significant litigation reserves or benefits were recognized in fiscal 2017 and fiscal 2016. By contrast, we recognized a benefit of $2.7 million during the year ended December 31, 2015 resulting from adjustments recorded to release litigation reserves previously accrued associated with the Ericsson patent litigation matter. For a detailed discussion of our litigation matters, refer to Note 8,
Commitments and Contingencies
, in Notes to Consolidated Financial Statements in Item 8 of Part II of this Annual Report on Form 10-K.
47
Interest Income and Other Income (Expense), Net
Interest income represents amounts earned on our cash, cash equivalents and short-term investments. Other income (expense), net primarily represents gains and losses on transactions denominated in foreign currencies and other miscellaneous income and expenses. The following table presents interest income and other income (expense), net for the periods indicated:
|
|
Year Ended December 31,
|
||||||||||||||||
|
|
2017
|
% Change
|
2016
|
% Change
|
2015
|
||||||||||||
|
|
(In thousands, except percentage data)
|
||||||||||||||||
|
Interest income
|
$
|
2,113
|
|
81.7
|
%
|
$
|
1,163
|
|
**
|
|
$
|
295
|
|
||||
|
Other income (expense), net
|
2,024
|
|
**
|
|
(121
|
)
|
37.5
|
%
|
(88
|
)
|
|||||||
|
Total
|
$
|
4,137
|
|
**
|
|
$
|
1,042
|
|
**
|
|
$
|
207
|
|
||||
** Percentage change not meaningful.
2017 vs 2016
Interest income increased for the year ended December 31, 2017 compared to the prior year due to increased yields on short term investments. Other income (expense), net increased for the year ended December 31, 2017 compared to the prior year due primarily to higher foreign currency transaction gains, partially offset by losses recognized relating to foreign currency forward contracts. Our foreign currency hedging program effectively reduced volatility associated with hedged currency exchange rate movements in fiscal 2017. For a detailed discussion of our hedging program and related foreign currency contracts, refer to Note 4,
Derivative Financial Instruments
, in Notes to Consolidated Financial Statements in Item 8 of Part II of this Annual Report on Form 10-K.
2016 vs 2015
Interest income increased for the year ended December 31, 2016 compared to the prior year due to increases in both short term investment average balances and yields obtained on such balances being more favorable than the prior year periods. Our foreign currency hedging program effectively reduced volatility associated with hedged currency exchange rate movements in fiscal 2016.
Interest income and other income (expense), net will fluctuate due to changes in interest rates and returns on our cash, cash equivalents and short-term investments, any future impairment of investments, foreign currency rate fluctuations on hedged exposures, fluctuations in costs associated with our hedging program, gains and losses on asset disposals and timing of non-income based taxes and license fees. The cash balance could also decrease depending upon the amount of cash used in our stock repurchase activity, any future acquisitions and other factors which would also impact our interest income.
Provision for Income Taxes
|
|
Year Ended December 31,
|
||||||||||||||||
|
|
2017
|
% Change
|
2016
|
% Change
|
2015
|
||||||||||||
|
|
(In thousands, except percentage data)
|
||||||||||||||||
|
Provision for income taxes
|
$
|
71,278
|
|
81.7
|
%
|
$
|
39,218
|
|
6.1
|
%
|
$
|
36,980
|
|
||||
|
Effective tax rate
|
78.6
|
%
|
34.1
|
%
|
43.2
|
%
|
|||||||||||
2017 vs 2016
On December 22, 2017, the U.S. government enacted comprehensive tax legislation commonly referred to as the Tax Act. The increase in the effective tax rate and the income tax provision for the year ended December 31, 2017 compared to the prior year was largely resulting from the newly passed Tax Act, where the company had to take into account the effects of a reduction in tax rates from 35% to 21% on its deferred tax assets and liabilities and to record a one-time transition tax. After the enactment of the Tax Act, the SEC issued Staff Accounting Bulletin No. 118 ("SAB 118") to address the application of US GAAP in situations when a registrant does not have the necessary information available, prepared, or analyzed (including computations) in reasonable detail to complete the accounting for certain income tax effects of the Tax Act. We have calculated an estimate of the impact of the Tax Act in our year end income tax provision in accordance with our understanding of the Tax Act and guidance
48
available as of the date of this filing and as a result have recorded $48.3 million as additional income tax expense in the fourth fiscal quarter of 2017, the period in which the legislation was enacted. The provisional amount related to the remeasurement of certain deferred tax assets and liabilities, based on the rates at which they are expected to reverse in the future, was $26.6 million. The provisional amount related to the one-time transition tax on the mandatory deemed repatriation of foreign earnings was $21.7 million.
In accordance with SAB 118, we have determined that the $21.7 million of current tax expense recorded in connection with the transition tax on the mandatory deemed repatriation of foreign earnings was a provisional amount and a reasonable estimate at December 31, 2017. As further guidance is issued by Treasury, additional work may be necessary to ensure earnings as required by the calculations are properly determined. Additionally, as a result of the Tax Act, we have not completed our evaluation of our indefinite reinvestment assertion with regard to foreign earnings under ASC 740-30. As a result, deferred tax liabilities may be increased or decreased during the period allowed under SAB 118. Further, no estimate can currently be made and no provisional amounts were recorded in the financial statements for the impact of the Global Intangible Low-Taxed Income (“GILTI”) provision of the Tax Act. The GILTI provision imposes taxes on foreign earnings in excess of a deemed return on tangible assets. This tax is effective for us after the end of the current fiscal year. However, we are evaluating whether deferred taxes should be recorded in relation to the GILTI provisions or if the tax should be recorded in the period in which it occurs. Based on the current interpretation, we may choose either method as an accounting policy election. We have not yet decided on the accounting policy related to GILTI and will only do so after completion of an analysis. Any subsequent adjustment to any of these amounts will be recorded to current tax expense during the measurement period provided under SAB 118.
In addition to the impact of the Tax Act, the increase in the effective tax rate and income tax provision for the year ended December 31, 2017 compared to the prior year, was partially offset by a reversal of uncertain tax positions and related interest of $3.4 million from the completion of tax audits and the lapsing of statutes of limitation. Further, tax expense for the December 31, 2016 period included a $1.8 million non-recurring tax benefit related to a change in estimate during fiscal 2016.
We adopted ASU 2016-09, “Improvements to Employee Share-Based Payment Accounting" on January 1, 2017, which requires excess tax benefits or deficiencies to be reflected in the consolidated statements of operations as a component of the provision for income taxes whereas they previously were recorded in equity. Total excess tax benefits recognized in the year ended December 31, 2017 and 2016 was $2.7 million and $3.0 million, respectively.
2016 vs 2015
Provision for income taxes increased for the year ended December 31, 2016 compared to the prior year due primarily to higher pretax income. The effective tax rate for the years ended December 31, 2016 and 2015 differed from the U.S. statutory rate of 35% each year due to earnings from foreign jurisdictions, state taxes, tax credits and non-deductible expenses. For the year ended December 31, 2016, tax on earnings from foreign operations decreased the effective tax rate by 2.7 percentage points compared to an increase of 7.1 percentage points for 2015. The decrease in the effective tax rate from earnings of foreign operations in 2016 compared to 2015 resulted from the 2015 tax effect of non-deductible losses in a foreign jurisdictions where no benefit can be claimed.
We are subject to income taxes in the U.S. and numerous foreign jurisdictions. Our future foreign tax rate could be affected by changes in the composition in earnings in countries with tax rates differing from the U.S. federal rate. We are under examination in various U.S. and foreign jurisdictions.
Segment Information
Beginning with fiscal year 2017, we operate and report in three segments: Arlo, Connected Home, and SMB. Prior year financial results have been recast to conform to the reportable segment structure effective on January 1, 2017. Additional information on the changes to the reportable segments, a description of our products and services, as well as segment financial data, for each segment and a reconciliation of segment contribution income to income before income taxes can be found in Note 11,
Segment Information
, in Notes to Consolidated Financial Statements in Item 8 of Part II of this Annual Report on Form 10-K.
49
Arlo
|
Year Ended December 31,
|
|||||||||||||||||
|
2017
|
% Change
|
2016
|
% Change
|
2015
|
|||||||||||||
|
(in thousands, except percentage data)
|
|||||||||||||||||
|
Net revenue
|
$
|
378,413
|
|
100.8
|
%
|
$
|
188,469
|
|
105.7
|
%
|
$
|
91,636
|
|
||||
|
Percentage of net revenue
|
26.9
|
%
|
14.2
|
%
|
7.0
|
%
|
|||||||||||
|
Contribution income
|
29,591
|
|
**
|
|
(5,218
|
)
|
**
|
|
(126
|
)
|
|||||||
|
Contribution margin
|
7.8
|
%
|
(2.8
|
)%
|
(0.1
|
)%
|
|||||||||||
** Percentage change not meaningful.
2017 vs 2016
Arlo segment net revenue increased significantly for the year ended December 31, 2017 compared to the prior year. The rapid expansion of the smart camera market combined with the introduction of our Arlo Pro and recently launched Arlo Pro 2 smart cameras was mainly responsible for the year over year increase. We continue to experience strong end user demand across all regions for our Arlo product line and we expect demand within the smart camera market to continue to be robust.
Contribution income increased significantly for the year ended December 31, 2017 compared with contribution loss in the prior year. The improved profitability was mainly as a result of increased net revenue not being met with proportionate increases in operating expenditures.
2016 vs 2015
Arlo segment net revenue increased significantly for the year ended December 31, 2016 compared to the prior year. The rapid expansion of the smart camera market combined with the introduction of our latest generation of Arlo Smart security cameras was responsible for the year over year increase. We experienced strong end user demand across all regions for our Arlo product line.
Contribution loss increased for the year ended December 31, 2016 compared to the prior year, primarily due to an increase in our investments in research and development and marketing spend which was incurred to support new product introductions and brand marketing campaigns.
Connected Home
|
Year Ended December 31,
|
|||||||||||||||||
|
2017
|
% Change
|
2016
|
% Change
|
2015
|
|||||||||||||
|
(in thousands, except percentage data)
|
|||||||||||||||||
|
Net revenue
|
$
|
762,069
|
|
(9.8
|
)%
|
$
|
844,818
|
|
(9.9
|
)%
|
$
|
937,215
|
|
||||
|
Percentage of net revenue
|
54.2
|
%
|
63.6
|
%
|
72.1
|
%
|
|||||||||||
|
Contribution income
|
101,993
|
|
(33.1
|
)%
|
152,560
|
|
25.3
|
%
|
121,745
|
|
|||||||
|
Contribution margin
|
13.4
|
%
|
18.1
|
%
|
13.0
|
%
|
|||||||||||
2017 vs 2016
Connected Home segment net revenue decreased for the year ended December 31, 2017 compared to the prior year. The decrease in Connected Home net revenue was primarily due to broadband modem and gateway, home wireless and powerline product categories, partially offset by increased net revenue from mobile products. The fall in broadband gateways was experienced across both service provider and non-service provider channels, while the fall in home wireless related solely to service provider customers. In total, net revenue from service provider customers fell $59.8 million compared to the prior year period. Geographically, net revenue fell across all regions.
50
Contribution income decreased for the year ended December 31, 2016 compared to the prior year, primarily due to lower net revenue and gross margin attainment. Gross margin was negatively affected by increases in channel promotional activities deemed to be contra-revenue under authoritative guidance for revenue recognition and increases in provision for sales return and warranty expense disproportionate to net revenue in the prior year period. The increase in channel promotional expenditure is as a result of competitive shifts in the home wireless landscape with the development of the WiFi mesh market. This has required additional investment to establish a dominate position.
2016 vs 2015
Connected Home segment net revenue decreased for the year ended December 31, 2016 compared to the prior year. The decrease was primarily due to lower gross shipments of broadband modem and gateway, mobile, and home wireless products to our service provider customers. The decrease was partially offset by increased gross shipments of broadband modem and gateway, and home wireless products to our non-service provider customers. Geographically, net revenue fell in EMEA and Americas regions and grew in APAC region. Declines in service provider net revenue of $145.9 million adversely impacted geographic performance.
Contribution income increased for the year ended December 31, 2016 compared to the prior year. The higher profitability was mainly attributable to gross margin improvement as a result of lower freight and duty costs, along with a decrease in research and development expenditures resulted from reductions of our headcount.
SMB
|
Year Ended December 31,
|
|||||||||||||||||
|
2017
|
% Change
|
2016
|
% Change
|
2015
|
|||||||||||||
|
(in thousands, except percentage data)
|
|||||||||||||||||
|
Net revenue
|
$
|
266,438
|
|
(9.7
|
)%
|
$
|
295,011
|
|
8.5
|
%
|
$
|
271,844
|
|
||||
|
Percentage of net revenue
|
18.9
|
%
|
22.2
|
%
|
20.9
|
%
|
|||||||||||
|
Contribution income
|
65,392
|
|
(13.3
|
)%
|
75,461
|
|
34.4
|
%
|
56,156
|
|
|||||||
|
Contribution margin
|
24.5
|
%
|
25.6
|
%
|
20.7
|
%
|
|||||||||||
2017 vs 2016
SMB segment net revenue decreased for the year ended December 31, 2017 compared to the prior year. SMB experienced a decline in net revenue across all regions and all product categories led by switches. Contribution income decreased for the year ended December 31, 2017 compared to the prior year, primarily due to lower net revenue and gross margin attainment. Increased sales returns and channel promotion activities deemed to be a reduction of net revenue were contributing factors in the decline of net revenue and gross margin attainment compared to the prior year periods.
2016 vs 2015
SMB segment net revenue increased for the year ended December 31, 2016 compared to the prior year, primarily attributable to increased gross shipments of switches, partially offset by a reduction in gross shipments of network storage products. We experienced growth in all three geographic regions experiencing double digit growth in APAC and strong single digit growth in the Americas and EMEA, respectively.
Contribution income increased for the year ended December 31, 2016 compared to the prior year, primarily due to growth in both net revenue and gross margin yield. In addition, the growth in net revenue did not require corresponding investment in operating expense resulting in greater contribution income return.
Liquidity and Capital Resources
Our principal sources of liquidity are cash, cash equivalents, short-term investments, and cash generated from operations. Our cash equivalents and short-term investments are comprised primarily of money-market funds, U.S. treasury securities, and certificates of deposits. As of
December 31, 2017
, we had cash, cash equivalents and short-term investments totaling
$329.8 million
. Our cash and cash equivalents balance decreased from
$240.5 million
as of December 31,
2016
to
$202.9 million
as of
51
December 31,
2017
. Our short-term investments, which represent the investment of funds available for current operations, slightly increased from
$125.5 million
as of December 31,
2016
to
$126.9 million
as of December 31,
2017
.
As of December 31, 2017, 38% of our cash and cash equivalents and short-term investments were outside of the U.S., which were subject to U.S. taxes starting in 2018 as a result of the Tax Act due to the one-time transition tax on un-repatriated earnings. The cash and cash equivalents and short-term investments balances outside of the U.S. are subject to fluctuation based on the settlement of intercompany balances.
The following table presents our cash flows for the periods presented.
|
Year Ended December 31,
|
|||||||||||
|
2017
|
2016
|
2015
|
|||||||||
|
(In thousands)
|
|||||||||||
|
Net cash provided by operating activities
|
$
|
87,524
|
|
$
|
118,181
|
|
$
|
111,150
|
|
||
|
Net cash provided by (used in) investing activities
|
(19,818
|
)
|
(48,759
|
)
|
5,957
|
|
|||||
|
Net cash used in financing activities
|
(105,304
|
)
|
(10,899
|
)
|
(76,396
|
)
|
|||||
|
Net cash increase (decrease)
|
$
|
(37,598
|
)
|
$
|
58,523
|
|
$
|
40,711
|
|
||
We adopted ASU 2016-09 in the first fiscal quarter of 2017 on a retrospective basis and reflected adjustments of $3.0 million and $0.8 million to both operating and financing activities for fiscal year 2016 and 2015, respectively. For a detailed discussion of the impacts on our cash flows statements upon the adoption, refer to "
Accounting Pronouncement Recently Adopted"
in Note 1,
The
Company and Summary of Significant Accounting Policies,
in Notes to Consolidated Financial Statements in Item 8 of Part II of this Annual Report on Form 10-K.
Operating activities
Net cash provided by operating activities decreased by $30.7 million for fiscal 2017 as compared to fiscal 2016, due primarily to unfavorable working capital movements coupled with lower net income.
Our days sales outstanding ("DSO") increased to
95
days as of December 31,
2017
as compared to
77
days as of December 31,
2016
. The increase was attributable to the timing of gross shipments and seasonal dating programs with customers making up a higher revenue proportion year over year. Our accounts payable slightly decreased from
$112.4 million
as of December 31,
2016
to
$111.9 million
as of December 31,
2017
, primarily as a result of timing of payments. Inventory decreased from
$247.9 million
as of December 31,
2016
to
$245.9 million
as of December 31,
2017
. Ending inventory turns of
4.8
turns in the three months ended December 31,
2017
up from
4.2
turns in the three months ended December 31,
2016
.
Net cash provided by operating activities increased by $7.0 million for fiscal 2016 as compared to fiscal 2015, due primarily to an increase in net income offset by unfavorable working capital.
Our days sales outstanding ("DSO") remained flat at 77 days as of December 31, 2016 and December 31, 2015. Historically, we grant limited payment term extensions to key retail partners to support holiday season demand. Payment term extensions were granted in both the fourth quarter of 2016 and 2015 respectively. Our accounts payable increased from $90.5 million as of December 31, 2015 to $112.4 million at December 31, 2016, primarily as a result of timing of payments. Inventory increased from $213.1 million as of December 31, 2015 to $247.9 million as of December 31, 2016. Ending inventory turns of 4.2 turns in the three months ended December 31, 2016 down from 4.8 turns in the three months ended December 31, 2015.
Investing activities
Net cash used in investing activities was $19.8 million for fiscal 2017 as compared to $48.8 million in fiscal 2016, primarily due to lower purchase of short-term investments along with higher proceeds from maturities of short-term investments, and lower payments made in connection with business acquisition of Placemeter which occurred in 2016, partially offset by an increase in cost method investments and higher capital expenditures.
52
Net cash used in investing activities was $48.8 million for fiscal 2016 as compared to cash generated $6.0 million in fiscal 2015, primarily resulting from more purchase of short-term investments along with less proceeds from maturities of short-term investments, and payment relating to business acquisition of Placemeter.
Financing activities
Net cash used in financing activities increased in fiscal 2017 as compared to fiscal 2016, primarily due to increased repurchases of common stock, coupled with less proceeds from the issuance of common stock upon exercise of stock options.
Net cash used in financing activities decreased in fiscal 2016 as compared to fiscal 2015, primarily due to less repurchases of common stock, partially offset by less proceeds from the issuance of common stock upon exercise of stock options.
From time to time, the Company’s Board of Directors has authorized programs under which the Company may repurchase shares of its common stock. Under the authorizations, the timing and actual number of shares subject to repurchase are at the discretion of management and are contingent on a number of factors, such as levels of cash generation from operations, cash requirements for acquisitions and the price of the Company’s common stock. As of
December 31, 2017
,
2.0 million
shares remained authorized for repurchase under the repurchase program. During the years ended
December 31, 2017
,
2016
, and
2015
, we repurchased and retired, reported based on trade date,
2.4 million
,
0.9 million
, and
3.8 million
shares of common stock at a cost of
$113.2 million
,
$38.3 million
, and
$117.7 million
, respectively. We also repurchased and retired, reported based on trade date, approximately
135,000
,
105,000
, and
85,000
shares of common stock at a cost of
$6.4 million
,
$4.7 million
, and
$2.6 million
, to help administratively facilitate the withholding and subsequent remittance of personal income and payroll taxes for individuals receiving RSUs. For a detailed discussion of our common stock repurchases, refer to Note 9,
Stockholders’ Equity
, in Notes to Consolidated Financial Statements in Item 8 of Part II of this Annual Report on Form 10-K.
We enter into foreign currency forward-exchange contracts, which typically mature within
eleven
months, to hedge a portion of our exposure to foreign currency fluctuations of foreign currency-denominated revenue, costs of revenue, certain operating expenses, receivables, payables, and cash balances. We record on the consolidated balance sheets at each reporting period the fair value of our forward-exchange contracts and record any fair value adjustments in our consolidated statements of operations and in our consolidated balance sheets. Gains and losses associated with currency rate changes on hedge contracts that are non-designated under the authoritative guidance for derivatives and hedging are recorded within other income (expense), net, offsetting foreign exchange gains and losses on our monetary assets and liabilities. Gains and losses associated with currency rate changes on hedge contracts that are designated cash flow hedges under the authoritative guidance for derivatives and hedging are recorded within accumulated other comprehensive income until the related revenue, costs of revenue, or expenses are recognized.
Based on our current plans and market conditions, we believe that our existing cash, cash equivalents and short-term investments, together with cash generated from operations, will be sufficient to satisfy our anticipated cash requirements for at least the next twelve months. However, we may require or desire additional funds to support our operating expenses and capital requirements or for other purposes, such as acquisitions, and may seek to raise such additional funds through public or private equity financing or from other sources. We cannot assure you that additional financing will be available at all or that, if available, such financing would be obtainable on terms favorable to us and would not be dilutive. Our future liquidity and cash requirements will depend on numerous factors, including the introduction of new products and potential acquisitions of related businesses or technology.
Backlog
As of December 31,
2017
, we had a backlog of approximately $52.9 million, compared to approximately $74.6 million as of December 31,
2016
, primarily due to product demand required in the future. Our backlog consists of products for which customer purchase orders have been received and that are scheduled or in the process of being scheduled for shipment. While we expect to fulfill the order backlog within the current year, most orders are subject to rescheduling or cancellation with minimal penalties. Because of the possibility of customer changes in product scheduling or order cancellation, our backlog as of any particular date may not be an indicator of net revenue for any succeeding period.
53
Contractual Obligations
The following table summarizes our non-cancelable operating lease commitments, purchase obligations, and the Tax Act payables as of December 31,
2017
:
|
Payments due by period
|
|||||||||||||||||||
|
Less Than
|
1-3
|
3-5
|
More Than
|
||||||||||||||||
|
Total
|
1 Year
|
Years
|
Years
|
5 Years
|
|||||||||||||||
|
(In thousands)
|
|||||||||||||||||||
|
Operating leases
|
$
|
47,008
|
|
$
|
8,924
|
|
$
|
19,525
|
|
$
|
11,049
|
|
$
|
7,510
|
|
||||
|
Purchase obligations
|
153,122
|
|
153,122
|
|
—
|
|
—
|
|
—
|
|
|||||||||
|
Tax Act payables
|
21,692
|
|
$
|
4,173
|
|
$
|
3,047
|
|
$
|
3,047
|
|
$
|
11,425
|
|
|||||
|
$
|
221,822
|
|
$
|
166,219
|
|
$
|
22,572
|
|
$
|
14,096
|
|
$
|
18,935
|
|
|||||
We lease office space, cars and equipment under non-cancelable operating leases with various expiration dates through
December 2026
. Rent expense in the years ended December 31,
2017
,
2016
, and
2015
was
$10.1 million
,
$9.5 million
and
$9.8 million
, respectively. The terms of some of the office leases provide for rental payments on a graduated scale. We recognize rent expense on a straight-line basis over the lease period, and have accrued for rent expense incurred but not paid. The amounts presented are consistent with contractual terms and are not expected to differ significantly, unless a substantial change in our headcount needs requires us to exit an office facility early or expand our occupied space.
We enter into various inventory-related purchase agreements with suppliers. Generally, under these agreements, 50% of the orders are cancelable by giving notice 46 to 60 days prior to the expected shipment date and 25% of orders are cancelable by giving notice 31 to 45 days prior to the expected shipment date. Orders are not cancelable within 30 days prior to the expected shipment date. As of December 31,
2017
, we had
$153.1 million
in non-cancelable purchase obligations with suppliers. We expect to sell all products for which we have committed purchases from suppliers.
As of December 31, 2017, we had estimated long term liability of $17.5 million related to a one-time transaction tax that resulted from the passage of the Tax Act payable in eight annual installments starting April 2018. The first payment of this installment is treated as current payable. The installment amount will be 8% of the total balance due each year for the first five years. Then it will increase to 15%, 20% and 25% for the 6
th
, 7
th
and 8
th
year, respectively. This provisional amount is subject to change based on additional guidance from and interpretations by U.S. regulatory and standard-setting bodies and changes in assumptions.
As of December 31,
2017
and
2016
, we had $15.9 million and $16.6 million, respectively, of total gross unrecognized tax benefits and related interest and penalties. The timing of any payments that could result from these unrecognized tax benefits will depend upon a number of factors. The unrecognized tax benefits have been excluded from the contractual obligations table because reasonable estimates cannot be made of whether, or when, any cash payments for such items might occur. The possible reduction in liabilities for uncertain tax positions in multiple jurisdictions that may impact the statements of operations in the next 12 months is approximately $0.9 million, excluding the interest, penalties and the effect of any related deferred tax assets or liabilities.
Off-Balance Sheet Arrangements
As of December 31,
2017
, we did not have any off-balance sheet arrangements as defined in Item 303(a)(4)(ii) of SEC Regulation S-K.
Recent Accounting Pronouncements
For a complete description of recent accounting pronouncements, including the expected dates of adoption and estimated effects on financial condition and results of operations, refer to Note 1,
The Company and Summary of Significant Accounting Policies
, in Notes to Consolidated Financial Statements in Item 8 of Part II of this Annual Report on Form 10-K.
54
|
Item 7A.
|
Quantitative and Qualitative Disclosures About Market Risk
|
Interest Rate Risk
We do not use derivative financial instruments in our investment portfolio. We have an investment portfolio of fixed income securities that are classified as available-for-sale securities. These securities, like all fixed income instruments, are subject to interest rate risk and will fall in value if market interest rates increase. We attempt to limit this exposure by investing primarily in highly rated short-term securities. Our investment policy requires investments to be rated triple-A with the objective of minimizing the potential risk of principal loss. Due to the short duration and conservative nature of our investment portfolio, a hypothetical movement of 10% in interest rates would not have a material impact on our operating results and the total value of the portfolio over the next fiscal year. We monitor our interest rate and credit risks, including our credit exposure to specific rating categories and to individual issuers. There were no impairment charges on our investments during fiscal
2017
.
Foreign Currency Exchange Rate Risk
We invoice some of our international customers in foreign currencies including, but not limited to, the Australian dollar, British pound, euro, Canadian dollar, and Japanese yen. As the customers that are currently invoiced in local currency become a larger percentage of our business, or to the extent we begin to bill additional customers in foreign currencies, the impact of fluctuations in foreign currency exchange rates could have a more significant impact on our results of operations. For those customers in our international markets that we continue to sell to in U.S. dollars, an increase in the value of the U.S. dollar relative to foreign currencies could make our products more expensive and therefore reduce the demand for our products. Such a decline in the demand for our products could reduce sales and negatively impact our operating results. Certain operating expenses of our foreign operations require payment in the local currencies.
We are exposed to risks associated with foreign exchange rate fluctuations due to our international sales and operating activities. These exposures may change over time as business practices evolve and could negatively impact our operating results and financial condition. Additionally, we enter into certain foreign currency forward contracts that have been designated as cash flow hedges under the authoritative guidance for derivatives and hedging to partially offset our business exposure to foreign currency exchange rate risk on portions of our anticipated foreign currency net revenue, cost of revenue, and certain operating expenses. The objective of these foreign currency forward contracts is to reduce the impact of currency exchange rate movements on our operating results by offsetting gains and losses on the forward contracts with increases or decreases in foreign currency transactions. The contracts are marked-to-market on a monthly basis with gains and losses included in other income (expense), net in the consolidated statements of operations or in accumulated other comprehensive income on the consolidated balance sheets which are further reclassified from other comprehensive income to revenue, cost of revenue, or operating expenses when the underlying hedged items are recognized. We also use foreign currency forward contracts to partially offset our business exposure to foreign currency exchange rate risk associated with our foreign currency denominated assets and liabilities. These non-designated hedges are carried at fair value with adjustments to fair value recorded to other income (expense), net in our consolidated statements of operations.
We do not use foreign currency contracts for speculative or trading purposes. Hedging of our balance sheet and anticipated cash flow exposures may not always be effective to protect us against currency exchange rate fluctuations. In addition, we do not fully hedge our balance sheets and anticipated cash flow exposures, leaving us at risk to foreign exchange gains and losses on the un-hedged exposures. If there were an adverse movement in exchange rates, we might suffer significant losses. For additional disclosure on our foreign currency contracts, refer to Note 4,
Derivative Financial Instruments,
in Notes to Consolidated Financial Statements in Item 8 of Part II of this Annual Report on Form 10-K.
As of December 31,
2017
, we had net assets in various local currencies. A hypothetical 10% movement in foreign exchange rates would result in a before-tax positive or negative impact of $0.4 million net income, net of our hedged position at December 31,
2017
. Actual future gains and losses associated with our foreign currency exposures and positions may differ materially from the sensitivity analyses performed as of December 31,
2017
due to the inherent limitations associated with predicting the foreign currency exchange rates, and our actual exposures and positions. For the year ended December 31,
2017
, 22% of total net revenue was denominated in a currency other than the U.S. dollar.
55
|
Item 8.
|
Financial Statements and Supplementary Data
|
Report of Independent Registered Public Accounting Firm
To the Board of Directors and Stockholders of NETGEAR, Inc.:
Opinions on the Financial Statements and Internal Control over Financial Reporting
We have audited the consolidated financial statements, including the related notes, as listed in the index appearing under Item 15 (a) (1), and the financial statement schedule listed in the index appearing under Item 15 (a) (2) of NETGEAR, Inc. and its subsidiaries (collectively referred to as the “consolidated financial statements”). We also have audited the Company’s internal control over financial reporting as of December 31, 2017, based on criteria established in Internal Control - Integrated Framework (2013) issued by the Committee of Sponsoring Organizations of the Treadway Commission (COSO).
In our opinion, the consolidated financial statements referred to above present fairly, in all material respects, the financial position of the Company as of December 31, 2017 and December 31, 2016 and the results of their operations and their cash flows for each of the three years in the period ended December 31, 2017 in conformity with accounting principles generally accepted in the United States of America. Also in our opinion, the Company maintained, in all material respects, effective internal control over financial reporting as of December 31, 2017, based on criteria established in Internal Control - Integrated Framework (2013) issued by the COSO.
Basis for Opinions
The Company's management is responsible for these consolidated financial statements, for maintaining effective internal control over financial reporting, and for its assessment of the effectiveness of internal control over financial reporting, included in Management’s Report on Internal Control over Financial Reporting appearing under Item 9A. Our responsibility is to express opinions on the Company’s consolidated financial statements and on the Company's internal control over financial reporting based on our audits. We are a public accounting firm registered with the Public Company Accounting Oversight Board (United States) ("PCAOB") and are required to be independent with respect to the Company in accordance with the U.S. federal securities laws and the applicable rules and regulations of the Securities and Exchange Commission and the PCAOB.
We conducted our audits in accordance with the standards of the PCAOB. Those standards require that we plan and perform the audits to obtain reasonable assurance about whether the consolidated financial statements are free of material misstatement, whether due to error or fraud, and whether effective internal control over financial reporting was maintained in all material respects.
Our audits of the consolidated financial statements included performing procedures to assess the risks of material misstatement of the consolidated financial statements, whether due to error or fraud, and performing procedures that respond to those risks. Such procedures included examining, on a test basis, evidence regarding the amounts and disclosures in the consolidated financial statements. Our audits also included evaluating the accounting principles used and significant estimates made by management, as well as evaluating the overall presentation of the consolidated financial statements. Our audit of internal control over financial reporting included obtaining an understanding of internal control over financial reporting, assessing the risk that a material weakness exists, and testing and evaluating the design and operating effectiveness of internal control based on the assessed risk. Our audits also included performing such other procedures as we considered necessary in the circumstances. We believe that our audits provide a reasonable basis for our opinions.
Definition and Limitations of Internal Control over Financial Reporting
A company’s internal control over financial reporting is a process designed to provide reasonable assurance regarding the reliability of financial reporting and the preparation of financial statements for external purposes in accordance with generally accepted accounting principles. A company’s internal control over financial reporting includes those policies and procedures that (i) pertain to the maintenance of records that, in reasonable detail, accurately and fairly reflect the transactions and dispositions of the assets of the company; (ii) provide reasonable assurance that transactions are recorded as necessary to permit preparation of financial statements in accordance with generally accepted accounting principles, and that receipts and expenditures of the
56
company are being made only in accordance with authorizations of management and directors of the company; and (iii) provide reasonable assurance regarding prevention or timely detection of unauthorized acquisition, use, or disposition of the company’s assets that could have a material effect on the financial statements.
Because of its inherent limitations, internal control over financial reporting may not prevent or detect misstatements. Also, projections of any evaluation of effectiveness to future periods are subject to the risk that controls may become inadequate because of changes in conditions, or that the degree of compliance with the policies or procedures may deteriorate.
/s/ PricewaterhouseCoopers LLP
San Jose, CA
February 16, 2018
We have served as the Company’s auditor since 2002.
57
NETGEAR, INC.
CONSOLIDATED BALANCE SHEETS
(In thousands, except share and per share data)
|
As of
|
|||||||
|
December 31, 2017
|
December 31, 2016
|
||||||
|
ASSETS
|
|||||||
|
Current assets:
|
|||||||
|
Cash and cash equivalents
|
$
|
202,870
|
|
$
|
240,468
|
|
|
|
Short-term investments
|
126,926
|
|
125,514
|
|
|||
|
Accounts receivable, net
|
412,798
|
|
313,839
|
|
|||
|
Inventories
|
245,894
|
|
247,862
|
|
|||
|
Prepaid expenses and other current assets
|
27,176
|
|
35,102
|
|
|||
|
Total current assets
|
1,015,664
|
|
962,785
|
|
|||
|
Property and equipment, net
|
20,660
|
|
19,473
|
|
|||
|
Intangibles, net
|
24,988
|
|
37,899
|
|
|||
|
Goodwill
|
85,463
|
|
85,463
|
|
|||
|
Other non-current assets
|
61,789
|
|
78,836
|
|
|||
|
Total assets
|
$
|
1,208,564
|
|
$
|
1,184,456
|
|
|
|
LIABILITIES AND STOCKHOLDERS’ EQUITY
|
|||||||
|
Current liabilities:
|
|||||||
|
Accounts payable
|
$
|
111,915
|
|
$
|
112,436
|
|
|
|
Accrued employee compensation
|
27,752
|
|
33,096
|
|
|||
|
Other accrued liabilities
|
222,470
|
|
170,674
|
|
|||
|
Deferred revenue
|
55,284
|
|
35,301
|
|
|||
|
Income taxes payable
|
7,015
|
|
5,146
|
|
|||
|
Total current liabilities
|
424,436
|
|
356,653
|
|
|||
|
Non-current income taxes payable
|
31,544
|
|
15,119
|
|
|||
|
Other non-current liabilities
|
22,099
|
|
15,865
|
|
|||
|
Total liabilities
|
478,079
|
|
387,637
|
|
|||
|
Commitments and contingencies (Note 8)
|
|
|
|
|
|||
|
Stockholders’ equity:
|
|||||||
|
Preferred stock: $0.001 par value; 5,000,000 shares authorized; none issued or outstanding
|
—
|
|
—
|
|
|||
|
Common stock: $0.001 par value; 200,000,000 shares authorized; shares issued and outstanding: 31,319,578 and 32,958,444 as of December 31, 2017 and 2016, respectively
|
31
|
|
33
|
|
|||
|
Additional paid-in capital
|
603,137
|
|
566,307
|
|
|||
|
Accumulated other comprehensive income (loss)
|
(851
|
)
|
1,938
|
|
|||
|
Retained earnings
|
128,168
|
|
228,541
|
|
|||
|
Total stockholders’ equity
|
730,485
|
|
796,819
|
|
|||
|
Total liabilities and stockholders’ equity
|
$
|
1,208,564
|
|
$
|
1,184,456
|
|
|
The accompanying notes are an integral part of these consolidated financial statements.
58
NETGEAR, INC.
CONSOLIDATED STATEMENTS OF OPERATIONS
(In thousands, except per share data)
|
|
Year Ended December 31,
|
|||||||||||
|
2017
|
2016
|
2015
|
||||||||||
|
Net revenue
|
$
|
1,406,920
|
|
$
|
1,328,298
|
|
$
|
1,300,695
|
|
|||
|
Cost of revenue
|
1,010,878
|
|
916,113
|
|
933,016
|
|
||||||
|
Gross profit
|
396,042
|
|
412,185
|
|
367,679
|
|
||||||
|
Operating expenses:
|
||||||||||||
|
Research and development
|
94,603
|
|
89,367
|
|
86,499
|
|
||||||
|
Sales and marketing
|
158,168
|
|
150,355
|
|
146,794
|
|
||||||
|
General and administrative
|
56,421
|
|
54,482
|
|
45,313
|
|
||||||
|
Restructuring and other charges
|
97
|
|
3,881
|
|
6,398
|
|
||||||
|
Litigation reserves, net
|
176
|
|
73
|
|
(2,682
|
)
|
||||||
|
Total operating expenses
|
309,465
|
|
298,158
|
|
282,322
|
|
||||||
|
Income from operations
|
86,577
|
|
114,027
|
|
85,357
|
|
||||||
|
Interest income
|
2,113
|
|
1,163
|
|
295
|
|
||||||
|
Other income (expense), net
|
2,024
|
|
(121
|
)
|
(88
|
)
|
||||||
|
Income before income taxes
|
90,714
|
|
115,069
|
|
85,564
|
|
||||||
|
Provision for income taxes
|
71,278
|
|
39,218
|
|
36,980
|
|
||||||
|
Net income
|
$
|
19,436
|
|
$
|
75,851
|
|
$
|
48,584
|
|
|||
|
Net income per share:
|
||||||||||||
|
Basic
|
$
|
0.61
|
|
$
|
2.32
|
|
$
|
1.47
|
|
|||
|
Diluted
|
$
|
0.59
|
|
$
|
2.25
|
|
$
|
1.44
|
|
|||
|
Weighted average shares used to compute net income per share:
|
||||||||||||
|
Basic
|
32,097
|
|
32,758
|
|
33,161
|
|
||||||
|
Diluted
|
33,044
|
|
33,728
|
|
33,788
|
|
||||||
The accompanying notes are an integral part of these consolidated financial statements.
59
NETGEAR, INC.
CONSOLIDATED STATEMENTS OF COMPREHENSIVE INCOME
(In thousands)
|
|
Year Ended December 31,
|
|||||||||||
|
|
2017
|
2016
|
2015
|
|||||||||
|
Net income
|
$
|
19,436
|
|
$
|
75,851
|
|
$
|
48,584
|
|
|||
|
Other comprehensive income (loss), before tax:
|
||||||||||||
|
Unrealized gains (losses) on derivative instruments
|
(3,068
|
)
|
2,187
|
|
—
|
|
||||||
|
Unrealized gains (losses) on available-for-sale securities
|
(115
|
)
|
33
|
|
(56
|
)
|
||||||
|
Other comprehensive income (loss), before tax
|
(3,183
|
)
|
2,220
|
|
(56
|
)
|
||||||
|
Tax benefit (provision) related to derivative instruments
|
352
|
|
(273
|
)
|
—
|
|
||||||
|
Tax benefit (provision) related to available-for-sale securities
|
42
|
|
(12
|
)
|
21
|
|
||||||
|
Other comprehensive income (loss), net of tax
|
(2,789
|
)
|
1,935
|
|
(35
|
)
|
||||||
|
Comprehensive income
|
$
|
16,647
|
|
$
|
77,786
|
|
$
|
48,549
|
|
|||
The accompanying notes are an integral part of these consolidated financial statements.
60
NETGEAR, INC.
CONSOLIDATED STATEMENTS OF STOCKHOLDERS' EQUITY
(In thousands)
|
Common Stock
|
||||||||||||||||||||||
|
Shares
|
Amount
|
Additional Paid-In Capital
|
Accumulated Other Comprehensive Income (Loss)
|
Retained Earnings
|
Total
|
|||||||||||||||||
|
Balance as of December 31, 2014
|
34,709
|
|
$
|
35
|
|
$
|
454,144
|
|
$
|
38
|
|
$
|
267,348
|
|
$
|
721,565
|
|
|||||
|
Change in unrealized gains and losses on available-for-sale securities, net of tax
|
—
|
|
—
|
|
—
|
|
(35
|
)
|
—
|
|
(35
|
)
|
||||||||||
|
Net income
|
—
|
|
—
|
|
—
|
|
—
|
|
48,584
|
|
48,584
|
|
||||||||||
|
Stock-based compensation expense
|
—
|
|
—
|
|
16,813
|
|
—
|
|
—
|
|
16,813
|
|
||||||||||
|
Repurchases of common stock
|
(3,770
|
)
|
(4
|
)
|
—
|
|
—
|
|
(117,676
|
)
|
(117,680
|
)
|
||||||||||
|
Restricted stock unit withholdings
|
(85
|
)
|
—
|
|
—
|
|
—
|
|
(2,629
|
)
|
(2,629
|
)
|
||||||||||
|
Issuance of common stock under stock-based compensation plans
|
1,747
|
|
2
|
|
44,323
|
|
—
|
|
—
|
|
44,325
|
|
||||||||||
|
Income tax impact associated with stock option exercises
|
—
|
|
—
|
|
(2,233
|
)
|
—
|
|
—
|
|
(2,233
|
)
|
||||||||||
|
Balance as of December 31, 2015
|
32,601
|
|
$
|
33
|
|
$
|
513,047
|
|
$
|
3
|
|
$
|
195,627
|
|
$
|
708,710
|
|
|||||
|
Change in unrealized gains and losses on available-for-sale securities, net of tax
|
—
|
|
—
|
|
—
|
|
21
|
|
—
|
|
21
|
|
||||||||||
|
Change in unrealized gains and losses on derivatives, net of tax
|
—
|
|
—
|
|
—
|
|
1,914
|
|
—
|
|
1,914
|
|
||||||||||
|
Net income
|
—
|
|
—
|
|
—
|
|
—
|
|
75,851
|
|
75,851
|
|
||||||||||
|
Stock-based compensation expense
|
—
|
|
—
|
|
19,180
|
|
—
|
|
—
|
|
19,180
|
|
||||||||||
|
Repurchases of common stock
|
(894
|
)
|
(1
|
)
|
—
|
|
—
|
|
(38,251
|
)
|
(38,252
|
)
|
||||||||||
|
Restricted stock unit withholdings
|
(105
|
)
|
—
|
|
—
|
|
—
|
|
(4,686
|
)
|
(4,686
|
)
|
||||||||||
|
Issuance of common stock under stock-based compensation plans
|
1,356
|
|
1
|
|
31,626
|
|
—
|
|
—
|
|
31,627
|
|
||||||||||
|
Income tax impact associated with stock option exercises
|
—
|
|
—
|
|
2,454
|
|
—
|
|
—
|
|
2,454
|
|
||||||||||
|
Balance as of December 31, 2016
|
32,958
|
|
$
|
33
|
|
$
|
566,307
|
|
$
|
1,938
|
|
$
|
228,541
|
|
$
|
796,819
|
|
|||||
|
Change in unrealized gains and losses on available-for-sale securities, net of tax
|
—
|
|
—
|
|
—
|
|
(73
|
)
|
—
|
|
(73
|
)
|
||||||||||
|
Change in unrealized gains and losses on derivatives, net of tax
|
—
|
|
—
|
|
—
|
|
(2,716
|
)
|
—
|
|
(2,716
|
)
|
||||||||||
|
Net income
|
—
|
|
—
|
|
—
|
|
—
|
|
19,436
|
|
19,436
|
|
||||||||||
|
Stock-based compensation expense
|
—
|
|
|
22,147
|
|
—
|
|
—
|
|
22,147
|
|
|||||||||||
|
Repurchases of common stock
|
(2,378
|
)
|
(2
|
)
|
—
|
|
—
|
|
(113,159
|
)
|
(113,161
|
)
|
||||||||||
|
Restricted stock unit withholdings
|
(135
|
)
|
—
|
|
—
|
|
—
|
|
(6,415
|
)
|
(6,415
|
)
|
||||||||||
|
Issuance of common stock under stock-based compensation plans
|
875
|
|
—
|
|
14,356
|
|
—
|
|
—
|
|
14,356
|
|
||||||||||
|
Cumulative-effect adjustment from adoption of ASU 2016-09
|
—
|
|
—
|
|
327
|
|
—
|
|
(235
|
)
|
92
|
|
||||||||||
|
Balance as of December 31, 2017
|
31,320
|
|
$
|
31
|
|
$
|
603,137
|
|
$
|
(851
|
)
|
$
|
128,168
|
|
$
|
730,485
|
|
|||||
The accompanying notes are an integral part of these consolidated financial statements.
61
NETGEAR, INC.
(In thousands)
|
|
Year Ended December 31,
|
||||||||||
|
2017
|
2016
|
2015
|
|||||||||
|
Cash flows from operating activities:
|
|||||||||||
|
Net income
|
$
|
19,436
|
|
$
|
75,851
|
|
$
|
48,584
|
|
||
|
Adjustments to reconcile net income to net cash provided by operating activities:
|
|||||||||||
|
Depreciation and amortization
|
26,094
|
|
31,993
|
|
35,850
|
|
|||||
|
Purchase premium amortization/discount accretion on investments, net
|
46
|
|
167
|
|
(57
|
)
|
|||||
|
Non-cash stock-based compensation
|
22,147
|
|
18,949
|
|
16,825
|
|
|||||
|
Income tax impact associated with stock option exercises
|
—
|
|
2,454
|
|
(2,233
|
)
|
|||||
|
Deferred income taxes
|
21,836
|
|
(2,723
|
)
|
(710
|
)
|
|||||
|
Changes in assets and liabilities, net of effect of acquisitions:
|
|||||||||||
|
Accounts receivable
|
(98,959
|
)
|
(23,206
|
)
|
(14,952
|
)
|
|||||
|
Inventories
|
1,967
|
|
(34,744
|
)
|
9,765
|
|
|||||
|
Prepaid expenses and other assets
|
5,161
|
|
5,932
|
|
560
|
|
|||||
|
Accounts payable
|
(784
|
)
|
21,327
|
|
(14,990
|
)
|
|||||
|
Accrued employee compensation
|
(5,345
|
)
|
5,228
|
|
6,280
|
|
|||||
|
Other accrued liabilities
|
57,650
|
|
6,907
|
|
29,987
|
|
|||||
|
Deferred revenue
|
19,982
|
|
6,176
|
|
(2,496
|
)
|
|||||
|
Income taxes payable
|
18,293
|
|
3,870
|
|
(1,263
|
)
|
|||||
|
Net cash provided by operating activities
|
87,524
|
|
118,181
|
|
111,150
|
|
|||||
|
Cash flows from investing activities:
|
|||||||||||
|
Purchases of short-term investments
|
(136,556
|
)
|
(144,271
|
)
|
(110,316
|
)
|
|||||
|
Proceeds from maturities of short-term investments
|
135,549
|
|
115,291
|
|
130,273
|
|
|||||
|
Purchases of property and equipment
|
(13,674
|
)
|
(10,972
|
)
|
(14,000
|
)
|
|||||
|
Purchases of cost method investments
|
(4,400
|
)
|
—
|
|
—
|
|
|||||
|
Payments made in connection with business acquisitions, net of cash acquired
|
(737
|
)
|
(8,807
|
)
|
—
|
|
|||||
|
Net cash provided by (used in) investing activities
|
(19,818
|
)
|
(48,759
|
)
|
5,957
|
|
|||||
|
Cash flows from financing activities:
|
|||||||||||
|
Repurchases of common stock
|
(113,161
|
)
|
(38,252
|
)
|
(117,680
|
)
|
|||||
|
Restricted stock unit withholdings
|
(6,415
|
)
|
(4,686
|
)
|
(2,629
|
)
|
|||||
|
Proceeds from exercise of stock options
|
9,508
|
|
28,147
|
|
40,928
|
|
|||||
|
Proceeds from issuance of common stock under employee stock purchase plan
|
4,764
|
|
3,892
|
|
2,985
|
|
|||||
|
Net cash used in financing activities
|
(105,304
|
)
|
(10,899
|
)
|
(76,396
|
)
|
|||||
|
Net increase (decrease) in cash and cash equivalents
|
(37,598
|
)
|
58,523
|
|
40,711
|
|
|||||
|
Cash and cash equivalents, at beginning of year
|
240,468
|
|
181,945
|
|
141,234
|
|
|||||
|
Cash and cash equivalents, at end of year
|
$
|
202,870
|
|
$
|
240,468
|
|
$
|
181,945
|
|
||
|
Supplemental Cash Flow Information:
|
|||||||||||
|
Cash paid for income taxes
|
$
|
32,090
|
|
$
|
35,149
|
|
$
|
40,273
|
|
||
The accompanying notes are an integral part of these consolidated financial statements.
62
The Company
NETGEAR, Inc. (“NETGEAR” or the “Company”) was incorporated in Delaware in January 1996. The Company is a global company that delivers innovative networking and Internet connected products to consumers and growing businesses. The Company's products are built on a variety of proven technologies such as wireless (WiFi and LTE), Ethernet and powerline, with a focus on reliability and ease-of-use. The product line consists of devices that create and extend wired and wireless networks as well as devices that provide a special function and attach to the network, such as IP security cameras and home automation devices and services. These products are available in multiple configurations to address the changing needs of the customers in each geographic region in which the Company's products are sold.
Beginning with fiscal year 2017, the Company operates and reports in three segments: Arlo, Connected Home, and Small and Medium Business ("SMB"). The Company believes that this structure reflects its current operational and financial management, and provides the best structure for the Company to focus on growth opportunities while maintaining financial discipline. Each segment contains leadership focused on the product development efforts, both from a product marketing and engineering standpoint, to service the unique needs of their customers. Arlo segment focuses on intelligent internet-connected products for consumers and businesses that provide security and safety; Connected Home segment focuses on consumers and consists of high-performance, dependable and easy-to-use LTE and WiFi internet networking solutions; and SMB segment focuses on small and medium-sized businesses and consists of business networking, storage and security solutions that bring enterprise-class functionality to small and medium-sized businesses at an affordable price.
The Company sells networking products through multiple sales channels worldwide, including traditional retailers, online retailers, wholesale distributors, direct market resellers (“DMRs”), value-added resellers (“VARs”), and broadband service providers.
Reclassification
In the first fiscal quarter of 2017, the Company reorganized its operating segment structure resulting in a change to its reportable segments. This change primarily impacted Goodwill in Note 3,
Balance Sheet Components
and Note 11,
Segment Information
. The prior-year segment financial information has been reclassified to conform to the current-year presentation. None of the changes impact previously reported consolidated net revenue, income from operations, net income per share, total assets, or stockholders’ equity. Refer to Note 11,
Segment Information
, for a further discussion of the segment reorganization.
In the first fiscal quarter of 2017, the Company elected to apply the presentation requirements for cash flows related to excess tax benefits retrospectively to all periods presented upon adoption of ASU 2016-09. Refer to "
Accounting Pronouncement Recently Adopted"
within this Note for a further discussion of the impact from the adoption of ASU 2016-09.
Basis of presentation
The accompanying consolidated financial statements include the accounts of the Company and its wholly owned subsidiaries. All inter-company accounts and transactions have been eliminated in the consolidation of these subsidiaries.
Fiscal periods
The Company's fiscal year begins on January 1 of the year stated and ends on December 31 of the same year. The Company reports its results on a fiscal quarter basis rather than on a calendar quarter basis. Under the fiscal quarter basis, each of the first three fiscal quarters ends on the Sunday closest to the calendar quarter end, with the fourth quarter ending on December 31.
Use of estimates
The preparation of financial statements in conformity with U.S. generally accepted accounting principles ("GAAP") requires management to make estimates and assumptions that affect the reported amounts of assets and liabilities and disclosure of contingent assets and liabilities at the date of the financial statements and the reported amounts of revenues and expenses during the reported period. Actual results could differ from those estimates.
63
Cash and cash equivalents
The Company considers all highly liquid investments with an original maturity or a remaining maturity at the time of purchase of three months or less to be cash equivalents. The Company deposits cash and cash equivalents with high credit quality financial institutions.
Short-term investments
Short-term investments are partially comprised of marketable securities that consist of government securities with an original maturity or a remaining maturity at the time of purchase, of greater than three months and no more than 12 months. The marketable securities are held in the Company's name with one high quality financial institution, which acts as the Company's custodian and investment manager. These marketable securities are classified as available-for-sale securities in accordance with the provisions of the authoritative guidance for investments and are carried at fair value with unrealized gains and losses reported as a separate component of stockholders' equity.
Short-term investments are also comprised of marketable securities related to deferred compensation under the Company’s Deferred Compensation Plan. Mutual funds are the only investments allowed in the Company's Deferred Compensation Plan and the investments are held in a grantor trust formed by the Company. The Company has classified these investments as trading securities as the grantor trust actively manages the asset allocation to match the participants’ notional fund allocations. These securities are recorded at fair market value with unrealized gains and losses included in other income (expense), net.
Certain risks and uncertainties
The Company's products are concentrated in the networking and smart connected industries, which are characterized by rapid technological advances, changes in customer requirements and evolving regulatory requirements and industry standards. The success of the Company depends on management's ability to anticipate and/or to respond quickly and adequately to such changes. Any significant delays in the development or introduction of products could have a material adverse effect on the Company's business and operating results.
The Company relies on a limited number of third parties to manufacture all of its products. If any of the Company's third-party manufacturers cannot or will not manufacture its products in required volumes, on a cost-effective basis, in a timely manner, or at all, the Company will have to secure additional manufacturing capacity. Any interruption or delay in manufacturing could have a material adverse effect on the Company's business and operating results.
Derivative financial instruments
The Company uses foreign currency forward contracts to manage the exposures to foreign exchange risk related to expected future cash flows on certain forecasted revenue, costs of revenue, operating expenses, and on certain existing assets and liabilities. Foreign currency forward contracts generally mature within
eleven
months of inception. Under its foreign currency risk management strategy, the Company utilizes derivative instruments to reduce the impact of currency exchange rate movements on the Company's operating results by offsetting gains and losses on the forward contracts with increases or decreases in foreign currency transactions. The company does not use derivative financial instruments for speculative purposes.
The Company accounts for its derivative instruments as either assets or liabilities and records them at fair value. Derivatives that are not defined as hedges in the authoritative guidance for derivatives and hedging must be adjusted to fair value through earnings. For derivative instruments that hedge the exposure to variability in expected future cash flows that are designated as cash flow hedges, the effective portion of the gain or loss on the derivative instrument is reported as a component of accumulated other comprehensive income in stockholders' equity and reclassified into earnings in the same period or periods during which the hedged transaction affects earnings. The ineffective portion of the gain or loss on the derivative instrument is recognized in current earnings. To receive hedge accounting treatment, cash flow hedges must be highly effective in offsetting changes to expected future cash flows on hedged transactions. For derivatives designated as cash flow hedges, changes in the time value are excluded from the assessment of hedge effectiveness and are recognized in earnings.
Concentration of credit risk
Financial instruments that potentially subject the Company to a concentration of credit risk consist of cash and cash equivalents, short-term investments and accounts receivable. The Company believes that there is minimal credit risk associated with the
64
investment of its cash and cash equivalents and short-term investments, due to the restrictions placed on the type of investment that can be entered into under the Company's investment policy. The Company's short-term investments consist of investment-grade securities, and the Company's cash and investments are held and managed by recognized financial institutions.
The Company's customers are primarily distributors as well as retailers and broadband service providers who sell or distribute the products to a large group of end-users. The Company maintains an allowance for doubtful accounts for estimated losses resulting from the inability of the Company's customers to make required payments. The Company regularly performs credit evaluations of the Company's customers' financial condition and considers factors such as historical experience, credit quality, age of the accounts receivable balances, geographic or country-specific risks and current economic conditions that may affect customers' ability to pay. The Company does not require collateral from its customers. The Company secures credit insurance for certain customers in international and domestic markets.
As of
December 31, 2017
and
2016
,
Best Buy, Inc.
and affiliates accounted for
35%
and
38%
of the Company's total accounts receivable, respectively. Amazon and affiliates accounted for
12%
and
11%
of the Company's total accounts receivable as of
December 31, 2017
and
2016
, respectively. No other customers accounted for 10% or greater of the Company's total accounts receivable.
The Company is exposed to credit loss in the event of nonperformance by counterparties to the foreign currency forward contracts used to mitigate the effect of foreign currency exchange rate changes. The Company believes the counterparties for its outstanding contracts are large, financially sound institutions and thus, the Company does not anticipate nonperformance by these counterparties. In the event of turbulence or the onset of a financial crisis in financial markets, the failure of additional counterparties cannot be ruled out.
Fair value measurements
The carrying amounts of the Company's financial instruments, including cash equivalents, short-term investments, accounts receivable, and accounts payable approximate their fair values due to their short maturities. Foreign currency forward contracts are recorded at fair value based on observable market data. Refer to Note 12,
Fair Value Measurements,
in Notes to Consolidated Financial Statements for disclosures regarding fair value measurements in accordance with the authoritative guidance for fair value measurements and disclosures.
Allowance for doubtful accounts
The Company maintains an allowance for doubtful accounts for estimated losses resulting from the inability of its customers to make required payments. The Company regularly performs credit evaluations of its customers' financial condition and considers factors such as historical experience, credit quality, age of the accounts receivable balances, and geographic or country-specific risks and economic conditions that may affect a customer's ability to pay. The allowance for doubtful accounts is reviewed quarterly and adjusted if necessary based on the Company's assessments of its customers' ability to pay. If the financial condition of the Company's customers should deteriorate or if actual defaults are higher than the Company's historical experience, additional allowances may be required, which could have an adverse impact on operating expenses.
Inventories
Inventories consist primarily of finished goods which are valued at the lower of cost and net realizable value, with cost being determined using the first-in, first-out method. The Company writes down its inventories based on estimated excess and obsolete inventories determined primarily by the demand forecast but takes into account market conditions, product development plans, product life expectancy and other factors. At the point of loss recognition, a new, lower cost basis for that inventory is established, and subsequent changes in facts and circumstances do not result in the restoration or increase of the newly established cost basis.
65
Property and equipment, net
Property and equipment are stated at historical cost, less accumulated depreciation. Depreciation is computed using the straight-line method over the estimated useful lives of the assets as follows:
|
Computer equipment
|
2 years
|
|
Furniture and fixtures
|
5 years
|
|
Software
|
2-5 years
|
|
Machinery and equipment
|
2-3 years
|
|
Leasehold improvements
|
Shorter of the lease term or 5 years
|
Recoverability of assets to be held and used is measured by comparing the carrying amount of an asset to the estimated undiscounted future cash flows expected to be generated by the asset. If the carrying amount of the asset exceeds its estimated undiscounted future cash flows, an impairment charge is recognized in the amount by which the carrying amount of the asset exceeds the fair value of the asset. The carrying value of the asset is reviewed on a regular basis for the existence of facts, both internal and external, that may suggest impairment. Charges related to the impairment of property and equipment were insignificant for the years ended
December 31, 2017
,
2016
and
2015
.
Goodwill
Goodwill represents the purchase price over estimated fair value of net assets of businesses acquired in a business combination. Goodwill acquired in a business combination is not amortized, but instead tested for impairment at least annually on the first day of the fourth quarter. Should certain events or indicators of impairment occur between annual impairment tests, the Company performs the impairment test as those events or indicators occur. Examples of such events or circumstances include the following: a significant decline in the Company’s expected future cash flows; a sustained, significant decline in the Company’s stock price and market capitalization; a significant adverse change in the business climate; and slower growth rates.
Goodwill is tested for impairment at the reporting unit level by first performing a qualitative assessment to determine whether it is more likely than not (that is, a likelihood of more than 50%) that the fair value of the reporting unit is less than its carrying value. The qualitative assessment considers the following factors: macroeconomic conditions, industry and market considerations, cost factors, overall company financial performance, events affecting the reporting units, and changes in the Company's share price. If the reporting unit does not pass the qualitative assessment, the Company estimates its fair value and compares the fair value with the carrying value of its reporting unit, including goodwill. If the fair value is greater than the carrying value of its reporting unit, no impairment is recorded. If the fair value is less than the carrying value, an impairment loss is recognized for the amount that the carrying amount of a reporting unit, including goodwill, exceeds its fair value, limited to the total amount of goodwill allocated to that reporting unit. The impairment charge would be recorded to earnings in the consolidated statements of operations.
In the first fiscal quarter of 2017, the Company reorganized its operating segment structure resulting in a change to its reportable segments. The Company identified the reporting units for the purpose of goodwill impairment testing as Arlo, Connected Home, and SMB reporting units. The Company did not recognize any goodwill impairment charges during the years ended
December 31, 2017
,
2016
and
2015
. Refer to
Goodwill
in Note 3,
Balance Sheet Components,
for further discussions on its goodwill impairment testing relating to the segment change and its annual goodwill impairment testing.
Intangibles, net
Purchased intangibles with finite lives are amortized using the straight-line method over the estimated economic lives of the assets, which range from
three
to
ten
years. Finite-lived intangibles are reviewed for impairment whenever events or changes in circumstances indicate that the carrying amount of such assets may not be recoverable. Determination of recoverability is based on an estimate of undiscounted future cash flows resulting from the use of the asset and its eventual disposition.
During the years ended
December 31, 2017
, there were no events or changes in circumstances that indicated the carrying amount of our finite-lived assets may not be recoverable from their undiscounted cash flows. Consequently, we did not perform an impairment test. The Company recorded no impairments to intangibles during the years ended
December 31, 2017
,
2016
and
2015
.
66
Warranty obligations
The Company provides for estimated future warranty obligations at the time revenue is recognized. The Company's standard warranty obligation to its direct customers generally provides for a right of return of any product for a full refund in the event that such product is not merchantable or is found to be damaged or defective. At the time revenue is recognized, an estimate of future warranty returns is recorded to reduce revenue in the amount of the expected credit or refund to be provided to its direct customers. At the time the Company records the reduction to revenue related to warranty returns, the Company includes within cost of revenue a write-down to reduce the carrying value of such products to net realizable value. The Company's standard warranty obligation to its end-users provides for replacement of a defective product for
one
or more years. Factors that affect the warranty obligation include product failure rates, material usage, and service delivery costs incurred in correcting product failures. The estimated cost associated with fulfilling the Company's warranty obligation to end-users is recorded in cost of revenue. Because the Company's products are manufactured by third-party manufacturers, in certain cases the Company has recourse to the third-party manufacturer for replacement or credit for the defective products. The Company gives consideration to amounts recoverable from its third-party manufacturers in determining its warranty liability.
Revenue recognition
Revenue from product sales is generally recognized at the time the product is shipped provided that persuasive evidence of an arrangement exists, title and risk of loss has transferred to the customer, the selling price is fixed or determinable and collection of the related receivable is reasonably assured. Currently, for some of the Company's customers, title passes to the customer upon delivery to the port or country of destination, upon their receipt of the product, or upon the customer's resale of the product. At the end of each fiscal quarter, the Company estimates and defers revenue related to product where title has not transferred. The revenue continues to be deferred until such time that title passes to the customer. The Company assesses collectability based on a number of factors, including general economic and market conditions, past transaction history with the customer, and the creditworthiness of the customer. If the Company determines that collection is not reasonably assured, then revenue is deferred until receipt of the payment from the customer.
The Company has product offerings with multiple elements. The Company's multiple-element product offerings include hardware with free services, networking hardware with embedded software, various software subscription services, and support, which are considered separate units of accounting. In general, the hardware and networking hardware with embedded software are delivered up front, while the free services are delivered over the stated service period, or the estimated useful life. The subscription services and support are delivered over the subscription and support period whether included in a multiple-element offering or not. The Company allocates revenue to the deliverables based upon their relative selling price. Revenue allocated to each unit of accounting is then recognized when persuasive evidence of an arrangement exists, title and risk of loss has transferred to the customer, the selling price is fixed or determinable and collection of the related receivable is reasonably assured.
When applying the relative selling price method, the Company determines the selling price for each deliverable using vendor-specific objective evidence ("VSOE") of fair value of the deliverable, or when VSOE of fair value is unavailable, its best estimate of selling price (“ESP”), as the Company has determined it is unable to establish third-party evidence of selling price for the deliverables. In determining VSOE, the Company requires that a substantial majority of the selling prices for a deliverable sold on a stand-alone basis fall within a reasonably narrow pricing range, generally evidenced by approximately 80% of such historical stand-alone transactions falling within +/-15% of the median price. The Company determines ESP for a deliverable by considering multiple factors including, but not limited to, market conditions, competitive landscape, internal costs, gross margin objectives and pricing practices. The objective of ESP is to determine the price at which the Company would transact a sale if the deliverable were sold on a stand-alone basis. The determination of ESP is made through consultation with and formal approval by the Company's management, taking into consideration the go-to-market strategy.
Certain distributors and retailers generally have the right to return product for stock rotation purposes. Upon shipment of the product, the Company reduces revenue for an estimate of potential future product warranty and stock rotation returns related to the current period product revenue. Management analyzes historical returns, channel inventory levels, current economic trends and changes in customer demand for the Company's products when evaluating the adequacy of the allowance for sales returns, namely warranty and stock rotation returns. Revenue on shipments is also reduced for estimated price protection and sales incentives deemed to be contra-revenue under the authoritative guidance for revenue recognition.
67
Sales incentives
The Company accrues for sales incentives as a marketing expense if it receives an identifiable benefit in exchange and can reasonably estimate the fair value of the identifiable benefit received; otherwise, it is recorded as a reduction to revenues. As a consequence, the Company records a substantial portion of its channel marketing costs as a reduction of revenue.
The Company records estimated reductions to revenues for sales incentives at the later of when the related revenue is recognized or when the program is offered to the customer or end consumer.
Shipping and handling fees and costs
The Company includes shipping and handling fees billed to customers in net revenue. Shipping and handling costs associated with inbound freight are included in cost of revenue. In cases where the Company gives a freight allowance to the customer for their own inbound freight costs, such costs are appropriately recorded as a reduction in net revenue. Shipping and handling costs associated with outbound freight are included in sales and marketing expenses and totaled
$9.4 million
,
$9.2 million
and
$10.4 million
in the years ended
December 31, 2017
,
2016
and
2015
respectively.
Research and development
Costs incurred in the research and development of new products are charged to expense as incurred.
Advertising costs
Advertising costs are expensed as incurred. Total advertising and promotional expenses were
$33.3 million
,
$24.5 million
, and
$19.4 million
in the years ended
December 31, 2017
,
2016
and
2015
respectively.
Income taxes
The Company accounts for income taxes under an asset and liability approach. Under this method, income tax expense is recognized for the amount of taxes payable or refundable for the current year. In addition, deferred tax assets and liabilities are recognized for the expected future tax consequences of temporary differences resulting from different treatment for tax versus accounting for certain items, such as accruals and allowances not currently deductible for tax purposes. These differences result in deferred tax assets and liabilities, which are included within the consolidated balance sheets. The Company must then assess the likelihood that the Company's deferred tax assets will be recovered from future taxable income and to the extent the Company believes that recovery is not more likely than not, the Company must establish a valuation allowance. The Company’s assessment considers the recognition of deferred tax assets on a jurisdictional basis. Accordingly, in assessing its future taxable income on a jurisdictional basis, the Company considers the effect of its transfer pricing policies on that income.
In the ordinary course of business there is inherent uncertainty in assessing the Company's income tax positions. The Company assesses its tax positions and records benefits for all years subject to examination based on management's evaluation of the facts, circumstances and information available at the reporting date. For those tax positions where it is more likely than not that a tax benefit will be sustained, the Company records the largest amount of tax benefit with a greater than 50 percent likelihood of being realized upon ultimate settlement with a taxing authority that has full knowledge of all relevant information. For those income tax positions where it is not more likely than not that a tax benefit will be sustained, no tax benefit has been recorded in the financial statements. Where applicable, associated interest and penalties have also been recognized as a component of income tax expense.
Net income per share
Basic net income per share is computed by dividing the net income for the period by the weighted average number of common shares outstanding during the period. Diluted net income per share is computed by dividing the net income for the period by the weighted average number of shares of common stock and potentially dilutive common stock outstanding during the period. Potentially dilutive common shares include common shares issuable upon exercise of stock options, vesting of restricted stock awards, and issuances of shares under the Employee Stock Purchase Plan, which are reflected in diluted net income per share by application of the treasury stock method. Potentially dilutive common shares are excluded from the computation of diluted net income per share when their effect is anti-dilutive.
68
Stock-based compensation
The Company measures stock-based compensation at the grant date based on the fair value of the award. The fair value of stock options and the shares offered under the Employee Stock Purchase Plan is estimated using the Black-Scholes option pricing model. Estimated compensation cost relating to restricted stock units (“RSUs”) is based on the closing fair market value of the Company’s common stock on the date of grant.
The compensation expense for equity awards is recognized over the vesting period of the award under a graded vesting method. Upon the adoption of ASU 2016-09, the Company elected to account for forfeitures as they occur, rather than estimating expected forfeitures. Additionally, upon the adoption, the Company prospectively recorded all excess tax benefits and tax deficiencies arising from stock awards vesting or settlement as income tax expense or benefit rather than in equity. Refer to
Recent accounting pronouncements
below for a further discussion of the impact from the adoption of ASU 2016-09, and refer to Note 10,
Employee Benefit Plans,
for a further discussion on stock-based compensation.
Comprehensive income
Comprehensive income consists of net income and other gains and losses affecting stockholder's equity that the Company excluded from net income, including gains and losses related to fair value of short-term investments and the effective portion of cash flow hedges that were outstanding as of the end of the year.
Foreign currency translation and re-measurement
The Company's functional currency is the U.S. dollar for all of its international subsidiaries. Foreign currency transactions of international subsidiaries are re-measured into U.S. dollars at the end-of-period exchange rates for monetary assets and liabilities, and at historical exchange rates for non-monetary assets. Revenue is re-measured at average exchange rates in effect during each period. Expenses are re-measured at average exchange rates in effect during each period, except for expenses related to non-monetary assets, which are re-measured at historical exchange rates. Gains and losses arising from foreign currency transactions are included in Other income (expense), net.
Recent accounting pronouncements
Accounting Pronouncement Recently Adopted
In March 2016, the Financial Accounting Standards Board ("FASB") issued ASU 2016-09, "Improvements to Employee Share-Based Payment Accounting" (Topic 718), which simplifies the accounting for share-based payment transactions. The new guidance requires excess tax benefits and tax deficiencies to be recorded in the income statement when stock awards vest or are settled. In addition, cash flows related to excess tax benefits will no longer be separately classified as an inflow from financing activities with a corresponding outflow from operating activities but will be classified along with other income tax cash flows as an operating activity. The standard also allows the entity to repurchase more of an employee’s vesting shares for tax withholding purposes without triggering liability accounting, clarifies that all cash payments made to tax authorities on an employee’s behalf for withheld shares should be presented as a financing activity on the cash flows statement, and provides an accounting policy election to account for forfeitures as they occur. The new guidance became effective for the Company in the first fiscal quarter of 2017.
Upon adoption on January 1, 2017, the Company prospectively recorded all excess tax benefits and tax deficiencies arising from stock awards vesting or settlement as income tax expense or benefit rather than in equity. For the years ended December 31, 2017, the impact of the adoption was the recognition of
$2.7 million
excess tax benefits as a component of the provision for income taxes. The Company elected to account for forfeitures as they occur, rather than estimating expected forfeitures, which resulted in net cumulative-effect adjustment of
$0.2 million
decrease to retained earnings as of January 1, 2017. The Company elected to apply the presentation requirements for cash flows related to excess tax benefits retrospectively to all periods presented, which resulted in an increase to both net cash provided by operating activities and net cash used in financing activities of
$3.0 million
and
$0.8 million
for the years ended December 31, 2016 and 2015, respectively, on the consolidated statements of cash flows. The presentation requirement for cash flows related to employee taxes paid for withheld shares had no impact to any of the periods presented on the consolidated statements of cash flows since the Company has historically been presented such cash flows as a financing activity.
69
Accounting Pronouncements Not Yet Effective
In May 2014, the FASB issued ASU 2014-09, "Revenue from Contracts with Customers" (Topic 606), which was further updated in March, April, May and December 2016. The guidance in this update supersedes the revenue recognition requirements in Topic 605, "Revenue Recognition". Under the new guidance, an entity should recognize revenue to depict the transfer of promised goods or services to customers in an amount that reflects the consideration to which the entity expects to be entitled in exchange for those goods or services. The guidance also specifies the accounting for some costs to obtain or fulfill a contract with a customer. An entity should apply the amendments in the update either retrospectively to each prior reporting period presented (full retrospective method) or retrospectively with the cumulative effect of initially applying this update recognized at the date of initial application (modified retrospective method). On July 9, 2015, the FASB concluded to delay the effective date of the new revenue standard by one year. ASU 2014-09 is effective for the Company beginning in the first fiscal quarter of 2018 and early adoption is permitted.
The Company will adopt the new standard effective January 1, 2018 electing to utilize the modified retrospective approach resulting in a cumulative-effect adjustment to retained earnings. The impact upon adoption will be based upon open contracts existing at that date. The Company has identified major revenue streams, performed an analysis of its contracts to evaluate the impact of the standard, drafted its accounting policies and does not expect the adoption to have a material impact to the nature and timing of its revenues, results of operations, cash flows and statement of financial position. The Company is in the process of finalizing the cumulative effect adjustments, expects to make an adjustment to reduce the balance of retained earnings in the range of
$10 million
to
$15 million
before consideration of tax effects, primarily related to the establishment of a liability for yet to be committed sales incentives as of the adoption date, offset by a net reduction in outstanding deferred revenue balances. Under Topic 605, these incentives are recognized as a reduction of revenue at the later of when the related revenue is recognized or when the program is offered to the channel partner. Applying Topic 606, where customary business practice of providing such incentives is determined, there is a timing difference and will require the Company upon adoption to record an estimate of yet to be committed future sales incentives with respect to revenue already recognized. In addition, the Company has determined that the presentation of certain reserve balances currently shown net within accounts receivable will be presented as refund liabilities within current liabilities upon adoption.
In January 2016, the FASB issued ASU 2016-01, “Recognition and Measurement of Financial Assets and Financial Liabilities" (Subtopic 825-10), which addresses certain aspects of recognition, measurement, presentation and disclosure of financial instruments. This guidance requires equity investments to be measured at fair value with changes in fair value recognized in net income. This guidance simplifies the impairment assessment of equity investments without readily determinable fair values by requiring a qualitative assessment to identify impairment. This guidance also clarifies that an entity should evaluate the need for a valuation allowance on a deferred tax asset related to available-for-sale securities in combination with the entity’s other deferred tax assets.
The Company expects to adopt the new guidance in the first fiscal quarter of 2018, when it is effective for the Company. The Company is currently evaluating the impact the guidance will have on its financial statements and related disclosures, including accounting policies and processes. To date, the Company believes the most significant impact will be that the adoption of the new guidance could increase the volatility of its other income (expense), net, as a result of the re-measurement of its equity securities that are classified as cost method investments under the current guidance upon the occurrence of observable price changes and impairments.
In February 2016, FASB issued ASU 2016-02, "Leases" (Topic 842), which requires lessees to recognize on the balance sheets a right-of-use asset, representing its right to use the underlying asset for the lease term, and a corresponding lease liability for all leases with terms greater than twelve months. The liability will be equal to the present value of lease payments while the right-of-use asset will be based on the liability, subject to adjustment, such as for initial direct costs. In addition, ASU 2016-02 expands the disclosure requirements for lessees. Upon adoption, the Company will be required to record a lease asset and lease liability related to its operating leases. ASU 2016-02 will be applied using a modified retrospective transition method and is effective for the Company in the first fiscal quarter of 2019, with early adoption permitted. The Company does not expect to early adopt the new guidance. The Company has appointed a project team and is in the process of evaluating the impact the new standard will have on its consolidated financial statements. The Company expects to complete the impact assessment process by the end of the third fiscal quarter of 2018, and to complete the implementation process, including adding procedures and evaluating necessary disclosures, prior to the first fiscal quarter of 2019.
In June 2016, the FASB issued ASU 2016-13, "Measurement of Credit Losses on Financial Instruments" (Topic 326), which replaces the incurred-loss impairment methodology and requires immediate recognition of estimated credit losses expected to occur for most financial assets, including trade receivables. Credit losses on available-for-sale debt securities with unrealized losses will be recognized as allowances for credit losses limited to the amount by which fair value is below amortized cost. ASU 2016-13
70
is effective for the Company beginning in the first fiscal quarter of 2020 and early adoption is permitted.
T
he Company continues to assess the potential impact of the new guidance, but does not expect it to have material impacts on its financial position, results of operations or cash flows.
In October 2016, the FASB issued ASU 2016-16, "Income Taxes: Intra-Entity Transfers of Assets Other Than Inventory" (Topic 740), which requires the recognition of the income tax consequences of an intra-entity transfer of an asset, other than inventory, when the transfer occurs. This removes the exception to postpone recognition until the asset has been sold to an outside party. ASU 2016-16 is effective for the Company in the first fiscal quarter of 2018 and early adoption is permitted. The Company does not plan to early adopt the guidance. Upon adoption, the Company anticipates the recognition of a deferred tax asset estimated at
$21.0 million
resulting from differences in the tax basis of assets and the consolidated book basis of assets resulting from intra-entity transfers of intangible assets. Other than the recognition of the deferred tax asset that will be established in retained earnings upon adoption, the Company estimates that adoption of the standard will increase tax expense by an approximate
$0.7 million
annually. The Company does not anticipate it to have a material impact on its cash flows.
In January 2017, the FASB issued ASU 2017-04, "Intangibles-Goodwill and Other: Simplifying the Test for Goodwill Impairment" (Topic 350), which simplifies the subsequent measurement of goodwill by removing Step 2 of goodwill impairment test that requires the determination of the fair value of individual assets and liabilities of a reporting unit. The new guidance requires goodwill impairment to be measured as the amount by which a reporting unit’s carrying value exceeds its fair value, not to exceed the carrying amount of goodwill. ASU 2017-04 will be applied prospectively and is effective for the Company in the first fiscal quarter of 2020, with early adoption permitted. The Company early adopted the guidance during the fourth fiscal quarter of 2017, prior to its annual testing of goodwill impairment. There was no impact on its consolidated financial position, results of operations or cash flows as a result of the adoption.
In August 2017, the FASB issued ASU 2017-12, "Derivatives and Hedging: Targeted Improvements to Accounting for Hedging Activities" (Topic 815), which expands and refines hedge accounting for both non-financial and financial risk components and aligns the recognition and presentation of the effects of the hedging instrument and the hedged item in the financial statements. The guidance also makes certain targeted improvements to simplify the application of hedge accounting guidance and ease the administrative burden of hedge documentation requirements and assessing hedge effectiveness. ASU 2017-12 is effective for the Company in the first fiscal quarter of 2019 and early adoption is permitted. Entities should apply the guidance to existing cash flow and net investment hedge relationships using a modified retrospective approach with a cumulative effect adjustment recorded to opening retained earnings on the date of adoption. The guidance also provides transition relief to make it easier for entities to apply certain amendments to existing hedges where the hedge documentation needs to be modified. The Company expects to early adopt the guidance in fiscal 2018 and does not expect the adoption of this guidance will have material impact on its financial position, results of operations and cash flows.
With the exception of the new standards discussed above, there have been no other new accounting pronouncements that have significance, or potential significance, to the Company's financial position, results of operations and cash flows.
Placemeter, Inc.
On
November 30, 2016
, the Company acquired Placemeter, Inc. ("Placemeter"), an industry leader in computer vision analytics, for total purchase consideration of
$9.6 million
. The Company believes Placemeter’s engineering talent will add great value to NETGEAR’s Arlo Smart security team, and their proprietary computer vision algorithms will help to build leading video analytics solutions for the Arlo platform.
The Company paid
$8.8 million
of the aggregate purchase price in the fourth fiscal quarter of 2016 and paid the remaining
$0.8 million
in the first fiscal quarter of 2017. The acquisition qualified as a business combination and was accounted for using the acquisition method of accounting. The results of Placemeter have been included in the consolidated financial statements since the date of acquisition. Pro forma results of operations for the acquisition are not presented as the financial impact to the Company's consolidated results of operations is not material.
71
The allocation of the purchase price was as follows (in thousands):
|
Cash and cash equivalents
|
$
|
8
|
|
|
Accounts receivable
|
11
|
|
|
|
Prepaid expenses and other current assets
|
130
|
|
|
|
Property and equipment
|
83
|
|
|
|
Intangibles
|
6,000
|
|
|
|
Goodwill
|
3,742
|
|
|
|
Accounts payable
|
(40
|
)
|
|
|
Other accrued liabilities
|
(74
|
)
|
|
|
Deferred tax liabilities
|
(308
|
)
|
|
|
Total purchase price
|
$
|
9,552
|
|
The $3.7 million of goodwill recorded on the acquisition of Placemeter is not deductible for U.S. federal or U.S. state income tax purposes. The goodwill recognized, which was assigned to the Company's former retail segment upon acquisition and was allocated to the Arlo segment under its current reporting structure, is primarily attributable to expected synergies resulting from the acquisition.
In connection with the acquisition, the Company recorded $0.3 million of deferred tax liabilities net of deferred tax assets. The deferred tax liabilities were recorded for the book basis of intangible assets for which the Company has no tax basis. The deferred tax liabilities are reduced by the tax benefit of the net operating losses as of the date of the acquisition after consideration of limitations on the use under U.S. Internal Revenue Code section 382.
The Company designated
$5.5 million
of the acquired intangibles as software technology and a further
$0.2 million
of the acquired intangibles as database. The valuations were arrived at using the replacement cost method, with consideration having been given to the estimated time, investment and resources required to recreate the acquired intangibles. A discount rate of
15.0%
was used in the valuation of each intangible. The acquired intangibles are being amortized over an estimated useful life of
four years
.
The Company designated
$0.3 million
of the acquired intangibles as non-compete agreements. The value was calculated based on the present value of the future estimated cash flows derived from projections of future operations attributable to the non-compete agreements and discounted at
20.0%
. The acquired agreements are being amortized over an estimated useful life of
three years
.
Available-for-sale short-term investments
|
As of
|
|||||||||||||||||||||||||||||||
|
December 31, 2017
|
December 31, 2016
|
||||||||||||||||||||||||||||||
|
Cost
|
Unrealized Gain
|
Unrealized Loss
|
Estimated Fair Value
|
Cost
|
Unrealized Gain
|
Unrealized Loss
|
Estimated Fair Value
|
||||||||||||||||||||||||
|
(In thousands)
|
|||||||||||||||||||||||||||||||
|
U.S. treasuries
|
$
|
124,816
|
|
$
|
—
|
|
$
|
(146
|
)
|
$
|
124,670
|
|
$
|
123,869
|
|
$
|
9
|
|
$
|
(40
|
)
|
$
|
123,838
|
|
|||||||
|
Certificates of deposits
|
162
|
|
—
|
|
—
|
|
162
|
|
148
|
|
—
|
|
—
|
|
148
|
|
|||||||||||||||
|
Total
|
$
|
124,978
|
|
$
|
—
|
|
$
|
(146
|
)
|
$
|
124,832
|
|
$
|
124,017
|
|
$
|
9
|
|
$
|
(40
|
)
|
$
|
123,986
|
|
|||||||
The Company’s short-term investments are primarily comprised of marketable securities that are classified as available-for-sale and consist of government securities with an original maturity or remaining maturity at the time of purchase of greater than
three months
and no more than
twelve months
. Accordingly, none of the available-for-sale securities have unrealized losses greater than 12 months.
72
Cost method investments
The carrying value of the Company's cost method investments was
$4.5 million
and
$0.1 million
as of December 31,
2017
and
2016
, respectively. These investments are accounted under the cost method because the Company does not have a controlling interest or the ability to exercise significant influence over these companies and these investments do not have readily determinable fair values. These investments are included in other non-current assets in the consolidated balance sheets and are carried at cost, adjusted for any impairment. The Company monitors these investments for impairment on a quarterly basis, and adjusts carrying value for any impairment charges recognized. There were no impairments recognized during the years ended December 31,
2017
,
2016
and
2015
, respectively. Realized gains and losses on these investments are reported in other income (expense), net in the consolidated statements of operations. The Company did not recognize any material realized gains or losses during the years ended December 31,
2017
,
2016
and
2015
, respectively.
Accounts receivable, net
|
As of
|
|||||||
|
December 31, 2017
|
December 31, 2016
|
||||||
|
(In thousands)
|
|||||||
|
Gross accounts receivable
|
$
|
437,891
|
|
$
|
333,080
|
|
|
|
Allowance for doubtful accounts
|
(1,257
|
)
|
(1,255
|
)
|
|||
|
Allowance for sales returns
|
(20,189
|
)
|
(13,506
|
)
|
|||
|
Allowance for price protection
|
(3,647
|
)
|
(4,480
|
)
|
|||
|
Total allowances
|
(25,093
|
)
|
(19,241
|
)
|
|||
|
Total accounts receivable, net
|
$
|
412,798
|
|
$
|
313,839
|
|
|
Inventories
|
As of
|
|||||||
|
December 31, 2017
|
December 31, 2016
|
||||||
|
(In thousands)
|
|||||||
|
Raw materials
|
$
|
4,465
|
|
$
|
4,596
|
|
|
|
Finished goods
|
241,429
|
|
243,266
|
|
|||
|
Total inventories
|
$
|
245,894
|
|
$
|
247,862
|
|
|
The Company records provisions for excess and obsolete inventory based on forecasts of future demand. While management believes the estimates and assumptions underlying its current forecasts are reasonable, there is risk that additional charges may be necessary if current forecasts are greater than actual demand.
Property and equipment, net
|
As of
|
|||||||
|
December 31, 2017
|
December 31, 2016
|
||||||
|
(In thousands)
|
|||||||
|
Computer equipment
|
$
|
10,114
|
|
$
|
10,557
|
|
|
|
Furniture, fixtures and leasehold improvements
|
21,640
|
|
20,827
|
|
|||
|
Software
|
28,997
|
|
28,663
|
|
|||
|
Machinery and equipment
|
62,490
|
|
63,446
|
|
|||
|
Total property and equipment, gross
|
123,241
|
|
123,493
|
|
|||
|
Accumulated depreciation and amortization
|
(102,581
|
)
|
(104,020
|
)
|
|||
|
Total property and equipment, net
|
$
|
20,660
|
|
$
|
19,473
|
|
|
73
Depreciation and amortization expense pertaining to property and equipment was
$13.2 million
,
$14.6 million
and
$18.1 million
for the years ended December 31,
2017
,
2016
and
2015
, respectively.
Intangibles, net
|
As of December 31, 2017
|
As of December 31, 2016
|
||||||||||||||||||||||
|
|
Gross
|
Accumulated Amortization
|
Net
|
Gross
|
Accumulated Amortization
|
Net
|
|||||||||||||||||
|
(In thousands)
|
|||||||||||||||||||||||
|
Technology
|
$
|
66,599
|
|
$
|
(62,172
|
)
|
$
|
4,427
|
|
$
|
66,599
|
|
$
|
(57,381
|
)
|
$
|
9,218
|
|
|||||
|
Customer contracts and relationships
|
56,500
|
|
(37,430
|
)
|
19,070
|
|
56,500
|
|
(30,375
|
)
|
26,125
|
|
|||||||||||
|
Other
|
11,045
|
|
(9,554
|
)
|
1,491
|
|
11,045
|
|
(8,489
|
)
|
2,556
|
|
|||||||||||
|
Total intangibles, net
|
134,144
|
|
(109,156
|
)
|
24,988
|
|
$
|
134,144
|
|
$
|
(96,245
|
)
|
$
|
37,899
|
|
||||||||
Amortization of purchased intangibles in the years ended
December 31, 2017
,
2016
and
2015
was
$12.9 million
,
$17.0 million
and
$17.3 million
, respectively.
No
impairment charges were recorded in the years ended
December 31, 2017
,
2016
and
2015
.
As of December 31, 2017, estimated amortization expense related to finite-lived intangibles for each of the next five years and thereafter is as follows (in thousands):
|
2018
|
$
|
9,396
|
|
|
2019
|
7,544
|
|
|
|
2020
|
6,622
|
|
|
|
2021
|
1,413
|
|
|
|
2022
|
13
|
|
|
|
Total estimated amortization expense
|
$
|
24,988
|
|
Goodwill
As discussed in Note 11,
Segment Information
, during the first fiscal quarter of 2017, the Company's Chief Operating Decision Maker requested changes in the information that he regularly reviews for purposes of allocating resources and assessing performance. With these changes, the Company revised its reportable segments. Beginning with fiscal year 2017, the Company operates and reports in three segments: Arlo, Connected Home, and SMB. Goodwill was reallocated to the reportable segments using a relative fair value approach. As a result, the Company completed assessments of any potential goodwill impairment for all reportable segments immediately prior to and after the reallocation and determined that no impairment existed.
The changes in the carrying amount of goodwill during the years ended
December 31, 2017
and
2016
are as follows:
|
Old Segments
|
New Segments
|
|||||||||||||||||||||||||||||||
|
Retail
|
Commercial
|
Service Provider
|
Total
|
Arlo
|
Connected Home
|
SMB
|
Total
|
|||||||||||||||||||||||||
|
(In thousands)
|
||||||||||||||||||||||||||||||||
|
As of December 31, 2015
|
$
|
45,442
|
|
$
|
36,279
|
|
$
|
—
|
|
$
|
81,721
|
|
$
|
—
|
|
$
|
—
|
|
$
|
—
|
|
$
|
—
|
|
||||||||
|
Goodwill from acquisition of Placemeter
|
3,742
|
|
—
|
|
—
|
|
3,742
|
|
—
|
|
—
|
|
—
|
|
—
|
|
||||||||||||||||
|
As of December 31, 2016
|
49,184
|
|
36,279
|
|
—
|
|
85,463
|
|
—
|
|
—
|
|
—
|
|
—
|
|
||||||||||||||||
|
Relative fair value approach
|
(49,184
|
)
|
(36,279
|
)
|
—
|
|
(85,463
|
)
|
21,149
|
|
28,035
|
|
36,279
|
|
85,463
|
|
||||||||||||||||
|
As of January 1, 2017
|
—
|
|
—
|
|
—
|
|
—
|
|
21,149
|
|
28,035
|
|
36,279
|
|
85,463
|
|
||||||||||||||||
|
As of December 31, 2017
|
$
|
—
|
|
$
|
—
|
|
$
|
—
|
|
$
|
—
|
|
$
|
21,149
|
|
$
|
28,035
|
|
$
|
36,279
|
|
$
|
85,463
|
|
||||||||
74
In the fourth fiscal quarter of
2017
, the Company early adopted ASU 2017-04 "Intangibles-Goodwill and Other: Simplifying the Test for Goodwill Impairment" and completed the annual impairment test of goodwill. The test was performed as of the first day of the fourth quarter, or October 2, 2017.
The Company performed a qualitative test for goodwill impairment of the Arlo, Connected Home, and SMB reporting units as of October 2, 2017. Based upon the results of the qualitative testing, the respective fair values of these reporting units were substantially in excess of their carrying values. The Company believes it is more-likely-than-not that the fair value of these reporting units are greater than their respective carrying values and therefore performing the next step of the impairment test for these reporting units was unnecessary.
No
goodwill impairment was recognized in the years ended
December 31, 2017
,
2016
or
2015
. Accumulated goodwill impairment charges for the years ended
December 31, 2017
and
2016
, was
$74.2 million
and
$74.2 million
, respectively.
Other non-current assets
|
As of
|
|||||||
|
December 31, 2017
|
December 31, 2016
|
||||||
|
(In thousands)
|
|||||||
|
Non-current deferred income taxes
|
$
|
49,468
|
|
$
|
70,859
|
|
|
|
Other
|
12,321
|
|
7,977
|
|
|||
|
Total other non-current assets
|
$
|
61,789
|
|
$
|
78,836
|
|
|
Other accrued liabilities
|
As of
|
|||||||
|
December 31, 2017
|
December 31, 2016
|
||||||
|
(In thousands)
|
|||||||
|
Sales and marketing programs
|
$
|
96,153
|
|
$
|
74,330
|
|
|
|
Warranty obligation
|
75,824
|
|
58,520
|
|
|||
|
Freight
|
10,567
|
|
8,980
|
|
|||
|
Other
|
39,926
|
|
28,844
|
|
|||
|
Total other accrued liabilities
|
$
|
222,470
|
|
$
|
170,674
|
|
|
The Company’s subsidiaries have had, and will continue to have material future cash flows, including revenue and expenses, which are denominated in currencies other than the Company’s functional currency. The Company and all its subsidiaries designate the U.S. dollar as the functional currency. Changes in exchange rates between the Company’s functional currency and other currencies in which the Company transacts business will cause fluctuations in cash flow expectations and cash flow realized or settled. Accordingly, the Company uses derivatives to mitigate its business exposure to foreign exchange risk. The Company enters into foreign currency forward contracts in Australian dollars, British pounds, Euros, Canadian dollar, and Japanese yen to manage the exposures to foreign exchange risk related to expected future cash flows on certain forecasted revenue, costs of revenue, operating expenses and existing assets and liabilities. The Company does not enter into derivatives transactions for trading or speculative purposes.
The Company’s foreign currency forward contracts do not contain any credit-risk-related contingent features. The Company is exposed to credit losses in the event of nonperformance by the counter-parties of its forward contracts. The Company enters into derivative contracts with high-quality financial institutions and limits the amount of credit exposure to any one counter-party. In addition, the derivative contracts typically mature in less than
eleven
months and the Company continuously evaluates the credit standing of its counter-party financial institutions. The counter-parties to these arrangements are large highly rated financial institutions and the Company does not consider non-performance a material risk.
75
The Company may choose not to hedge certain foreign exchange exposures for a variety of reasons, including, but not limited to, materiality, accounting considerations and the prohibitive economic cost of hedging particular exposures. There can be no assurance the hedges will offset more than a portion of the financial impact resulting from movements in foreign exchange rates. The Company’s accounting policies for these instruments are based on whether the instruments are designated as hedge or non-hedge instruments in accordance with the authoritative guidance for derivatives and hedging. The Company records all derivatives on the balance sheets at fair value. The effective portions of cash flow hedges are recorded in other comprehensive income ("OCI") until the hedged item is recognized in earnings. Derivatives that are not designated as hedging instruments and the ineffective portions of its designated hedges are adjusted to fair value through earnings in other income (expense), net in the consolidated statements of operations.
The fair values of the Company’s derivative instruments and the line items on the consolidated balance sheets to which they were recorded as of
December 31, 2017
, and
2016
, are summarized as follows:
|
Balance Sheets
Location
|
December 31,
|
Balance Sheets
Location
|
December 31,
|
|||||||||||||||
|
2017
|
2016
|
2017
|
2016
|
|||||||||||||||
|
(In thousands)
|
(In thousands)
|
|||||||||||||||||
|
Derivative contracts not designated as hedging instruments
|
Prepaid expenses and other current assets
|
$
|
1,314
|
|
$
|
5,873
|
|
Other accrued liabilities
|
$
|
7,128
|
|
$
|
1,002
|
|
||||
|
Derivative contracts designated as hedging instruments
|
Prepaid expenses and other current assets
|
485
|
|
2,890
|
|
Other accrued liabilities
|
1,064
|
|
703
|
|
||||||||
|
Total
|
$
|
1,799
|
|
$
|
8,763
|
|
$
|
8,192
|
|
$
|
1,705
|
|
||||||
Refer to Note 12,
Fair Value Measurements,
in Notes to Consolidated Financial Statements for detailed disclosures regarding fair value measurements in accordance with the authoritative guidance for fair value measurements and disclosures.
Offsetting Derivative Assets and Liabilities
The Company has entered into master netting arrangements which allow net settlements under certain conditions. Although netting is permitted, it is currently the Company's policy and practice to record all derivative assets and liabilities on a gross basis in the consolidated balance sheets.
76
The following tables set forth the offsetting of derivative assets as of
December 31, 2017
and
2016
:
|
As of December 31, 2017
|
Gross Amounts Not Offset in the Consolidated Balance Sheets
|
|||||||||||||||||||||||
|
Gross Amounts of Recognized Assets
|
Gross Amounts Offset in the Consolidated Balance Sheets
|
Net Amounts Of Assets Presented in the Consolidated Balance Sheets
|
Financial Instruments
|
Cash Collateral Pledged
|
Net Amount
|
|||||||||||||||||||
|
(In thousands)
|
||||||||||||||||||||||||
|
Bank of America
|
$
|
1,664
|
|
$
|
—
|
|
$
|
1,664
|
|
$
|
(1,664
|
)
|
$
|
—
|
|
$
|
—
|
|
||||||
|
Wells Fargo
|
135
|
|
—
|
|
135
|
|
(135
|
)
|
—
|
|
—
|
|
||||||||||||
|
Total
|
$
|
1,799
|
|
$
|
—
|
|
$
|
1,799
|
|
$
|
(1,799
|
)
|
$
|
—
|
|
$
|
—
|
|
||||||
|
As of December 31, 2016
|
Gross Amounts Not Offset in the Consolidated Balance Sheets
|
|||||||||||||||||||||||
|
Gross Amounts of Recognized Assets
|
Gross Amounts Offset in the Consolidated Balance Sheets
|
Net Amounts Of Assets Presented in the Consolidated Balance Sheets
|
Financial Instruments
|
Cash Collateral Pledged
|
Net Amount
|
|||||||||||||||||||
|
(In thousands)
|
||||||||||||||||||||||||
|
J.P. Morgan Chase
|
$
|
1,492
|
|
$
|
—
|
|
$
|
1,492
|
|
$
|
(442
|
)
|
$
|
—
|
|
$
|
1,050
|
|
||||||
|
Wells Fargo
|
7,271
|
|
—
|
|
7,271
|
|
(1,263
|
)
|
—
|
|
6,008
|
|
||||||||||||
|
Total
|
$
|
8,763
|
|
$
|
—
|
|
$
|
8,763
|
|
$
|
(1,705
|
)
|
$
|
—
|
|
$
|
7,058
|
|
||||||
The following tables set forth the offsetting of derivative liabilities as of
December 31, 2017
and
2016
:
|
As of December 31, 2017
|
Gross Amounts Not Offset in the Consolidated Balance Sheets
|
|||||||||||||||||||||||
|
Gross Amounts of Recognized Liabilities
|
Gross Amounts Offset in the Consolidated Balance Sheets
|
Net Amounts Of Liabilities Presented in the Consolidated Balance Sheets
|
Financial Instruments
|
Cash Collateral Pledged
|
Net Amount
|
|||||||||||||||||||
|
(In thousands)
|
||||||||||||||||||||||||
|
Bank of America
|
$
|
7,815
|
|
$
|
—
|
|
$
|
7,815
|
|
$
|
(1,664
|
)
|
$
|
—
|
|
$
|
6,151
|
|
||||||
|
Wells Fargo
|
377
|
|
—
|
|
377
|
|
(135
|
)
|
—
|
|
242
|
|
||||||||||||
|
Total
|
$
|
8,192
|
|
$
|
—
|
|
$
|
8,192
|
|
$
|
(1,799
|
)
|
$
|
—
|
|
$
|
6,393
|
|
||||||
|
As of December 31, 2016
|
Gross Amounts Not Offset in the Consolidated Balance Sheets
|
|||||||||||||||||||||||
|
Gross Amounts of Recognized Liabilities
|
Gross Amounts Offset in the Consolidated Balance Sheets
|
Net Amounts Of Liabilities Presented in the Consolidated Balance Sheets
|
Financial Instruments
|
Cash Collateral Pledged
|
Net Amount
|
|||||||||||||||||||
|
(In thousands)
|
||||||||||||||||||||||||
|
J.P. Morgan Chase
|
$
|
442
|
|
$
|
—
|
|
$
|
442
|
|
$
|
(442
|
)
|
$
|
—
|
|
$
|
—
|
|
||||||
|
Wells Fargo
|
1,263
|
|
—
|
|
1,263
|
|
(1,263
|
)
|
—
|
|
—
|
|
||||||||||||
|
Total
|
$
|
1,705
|
|
$
|
—
|
|
$
|
1,705
|
|
$
|
(1,705
|
)
|
$
|
—
|
|
$
|
—
|
|
||||||
Cash flow hedges
To help manage the exposure of operating margins to fluctuations in foreign currency exchange rates, the Company hedges a portion of its anticipated foreign currency revenue, costs of revenue and certain operating expenses. These hedges are designated
77
at the inception of the hedge relationship as cash flow hedges under the authoritative guidance for derivatives and hedging. Effectiveness is tested at least quarterly both prospectively and retrospectively using regression analysis to ensure that the hedge relationship has been effective and is likely to remain effective in the future. The Company typically hedges portions of its anticipated foreign currency exposure less than
eleven
months. The Company enters into about
10
forward contracts per quarter with an average size of approximately
$8.0 million
USD equivalent related to its cash flow hedging program.
The Company expects to reclassify to earnings all of the amounts recorded in OCI associated with its cash flow hedges over the next
12
months. OCI associated with cash flow hedges of foreign currency revenue is recognized as a component of net revenue in the same period as the related revenue is recognized. OCI associated with cash flow hedges of foreign currency costs of revenue and operating expenses are recognized as a component of cost of revenue and operating expense in the same period as the related costs of revenue and operating expenses are recognized.
Derivative instruments designated as cash flow hedges must be de-designated as hedges when it is probable the forecasted hedged transaction will not occur within the designated hedge period or if not recognized within
60
days following the end of the hedge period. Deferred gains and losses in OCI associated with such derivative instruments are reclassified immediately into earnings through other income (expense), net. Any subsequent changes in the fair value of such derivative instruments are reflected in current earnings unless they are re-designated as hedges of other transactions. The Company did not recognize any material net gains or losses related to the loss of hedge designation on discontinued cash flow hedges during the years ended December 31,
2017
,
2016
and
2015
.
The pre-tax effects of the Company’s derivative instruments on OCI and the consolidated statements of operations for the years ended December 31,
2017
,
2016
and
2015
are summarized as follows:
|
Derivatives Designated as
Hedging Instruments
|
Year Ended December 31, 2017
|
|||||||||||||||
|
Gains (Losses)
Recognized in
OCI -
Effective
Portion
|
Location of
Gains (Losses)
Reclassified from OCI
into Income - Effective
Portion
|
Gains (Losses)
Reclassified
from
OCI into
Income -
Effective
Portion
(1)
|
Location of
Gains (Losses)
Recognized in
Income and
Excluded from
Effectiveness Testing
|
Amount of Gains (Losses) Recognized in
Income and
Excluded from
Effectiveness Testing
|
||||||||||||
|
(In thousands)
|
||||||||||||||||
|
Cash flow hedges:
|
||||||||||||||||
|
Foreign currency forward contracts
|
$
|
(10,692
|
)
|
Net revenue
|
$
|
(8,693
|
)
|
Other income (expense), net
|
$
|
1,587
|
|
|||||
|
Foreign currency forward contracts
|
—
|
|
Cost of revenue
|
18
|
|
Other income (expense), net
|
—
|
|
||||||||
|
Foreign currency forward contracts
|
—
|
|
Operating expenses
|
1,051
|
|
Other income (expense), net
|
—
|
|
||||||||
|
Total
|
$
|
(10,692
|
)
|
$
|
(7,624
|
)
|
$
|
1,587
|
|
|||||||
_________________________
(1)
Refer to Note 9,
Stockholders' Equity
, which summarizes the accumulated other comprehensive income activity related to derivatives.
78
|
Derivatives Designated as
Hedging Instruments
|
Year Ended December 31, 2016
|
|||||||||||||||
|
Gains (Losses)
Recognized in
OCI -
Effective
Portion
|
Location of
Gains (Losses)
Reclassified from OCI
into Income - Effective
Portion
|
Gains (Losses)
Reclassified
from
OCI into
Income -
Effective
Portion
(1)
|
Location of
Gains (Losses)
Recognized in
Income and
Excluded from
Effectiveness Testing
|
Amount of Gains (Losses) Recognized in
Income and
Excluded from
Effectiveness Testing
|
||||||||||||
|
(In thousands)
|
||||||||||||||||
|
Cash flow hedges:
|
||||||||||||||||
|
Foreign currency forward contracts
|
$
|
3,007
|
|
Net revenue
|
$
|
1,100
|
|
Other income (expense), net
|
$
|
365
|
|
|||||
|
Foreign currency forward contracts
|
—
|
|
Cost of revenue
|
(6
|
)
|
Other income (expense), net
|
—
|
|
||||||||
|
Foreign currency forward contracts
|
—
|
|
Operating expenses
|
(274
|
)
|
Other income (expense), net
|
—
|
|
||||||||
|
Total
|
$
|
3,007
|
|
$
|
820
|
|
$
|
365
|
|
|||||||
_________________________
|
(1)
|
Refer to Note 9,
Stockholders' Equity
, which summarizes the accumulated other comprehensive income activity related to derivatives.
|
|
Derivatives Designated as
Hedging Instruments
|
Year Ended December 31, 2015
|
|||||||||||||||
|
Gains (Losses)
Recognized in
OCI -
Effective
Portion
|
Location of
Gains (Losses)
Reclassified from OCI
into Income - Effective
Portion
|
Gains (Losses)
Reclassified
from
OCI into
Income -
Effective
Portion
(1)
|
Location of
Gains (Losses)
Recognized in
Income and
Excluded from
Effectiveness Testing
|
Amount of Gains (Losses) Recognized in
Income and
Excluded from
Effectiveness Testing
|
||||||||||||
|
(In thousands)
|
||||||||||||||||
|
Cash flow hedges:
|
||||||||||||||||
|
Foreign currency forward contracts
|
$
|
453
|
|
Net revenue
|
$
|
462
|
|
Other income (expense), net
|
$
|
(52
|
)
|
|||||
|
Foreign currency forward contracts
|
—
|
|
Cost of revenue
|
6
|
|
Other income (expense), net
|
—
|
|
||||||||
|
Foreign currency forward contracts
|
—
|
|
Operating expenses
|
(15
|
)
|
Other income (expense), net
|
—
|
|
||||||||
|
Total
|
$
|
453
|
|
$
|
453
|
|
$
|
(52
|
)
|
|||||||
_________________________
|
(1)
|
Refer to Note 9,
Stockholders' Equity
, which summarizes the accumulated other comprehensive income activity related to derivatives.
|
The Company did not recognize any material net gains or losses related to the ineffective portion of cash flow hedges during the years ended December 31,
2017
,
2016
and
2015
.
Non-designated hedges
The Company enters into non-designated hedges under the authoritative guidance for derivatives and hedging to manage the exposure of non-functional currency monetary assets and liabilities held on its financial statements to fluctuations in foreign currency exchange rates, as well as to reduce volatility in other income and expense. The non-designated hedges are generally expected to offset the changes in value of its net non-functional currency asset and liability position resulting from foreign exchange rate fluctuations. Foreign currency denominated accounts receivable and payable are hedged with non-designated hedges when the related anticipated foreign revenue and expenses are recognized in the Company’s financial statements. The Company also hedges certain non-functional currency monetary assets and liabilities that may not be incorporated into the cash flow hedge program. The Company adjusts its non-designated hedges monthly and enters into about
ten
non-designated derivatives per quarter. The average size of its non-designated hedges is approximately
$2.0 million
USD equivalent and these hedges normally range from
one
to
three
months in duration.
79
The effects of the Company’s derivatives not designated as hedging instruments in other income (expense), net in the consolidated statements of operations for the years ended December 31,
2017
,
2016
and
2015
, are as follows:
|
Year ended December 31,
|
|||||||||
|
Derivatives Not Designated as Hedging Instruments
|
Location of Gains (Losses)
Recognized in Income on Derivative
|
2017
|
2016
|
2015
|
|||||
|
(In thousands)
|
|||||||||
|
Foreign currency forward contracts
|
Other income (expense), net
|
(6,945
|
)
|
3,789
|
|
$
|
4,956
|
|
|
Basic net income per share is computed by dividing the net income for the period by the weighted average number of common shares outstanding during the period. Diluted net income per share is computed by dividing the net income for the period by the weighted average number of shares of common stock and potentially dilutive common stock outstanding during the period. Potentially dilutive common shares include common shares issuable upon exercise of stock options, vesting of restricted stock awards, and issuances of shares under the ESPP, which are reflected in diluted net income per share by application of the treasury stock method. Potentially dilutive common shares are excluded from the computation of diluted net income per share when their effect is anti-dilutive.
Net income per share for the years ended
December 31, 2017
,
2016
and
2015
was as follows:
|
|
Year Ended December 31,
|
|||||||||||
|
|
2017
|
2016
|
2015
|
|||||||||
|
(In thousands, except per share data)
|
||||||||||||
|
Numerator:
|
||||||||||||
|
Net income
|
$
|
19,436
|
|
$
|
75,851
|
|
$
|
48,584
|
|
|||
|
Denominator:
|
||||||||||||
|
Weighted average common shares - basic
|
32,097
|
|
32,758
|
|
33,161
|
|
||||||
|
Potentially dilutive common share equivalent
|
947
|
|
970
|
|
627
|
|
||||||
|
Weighted average common shares - dilutive
|
33,044
|
|
33,728
|
|
33,788
|
|
||||||
|
Basic net income per share
|
$
|
0.61
|
|
$
|
2.32
|
|
$
|
1.47
|
|
|||
|
Diluted net income per share
|
$
|
0.59
|
|
$
|
2.25
|
|
$
|
1.44
|
|
|||
|
Anti-dilutive employee stock-based awards, excluded
|
279
|
|
258
|
|
1,807
|
|
||||||
Other income (expense), net consisted of the following:
|
Year Ended December 31,
|
|||||||||||
|
2017
|
2016
|
2015
|
|||||||||
|
(In thousands)
|
|||||||||||
|
Foreign currency transaction gain (loss), net
|
$
|
7,238
|
|
$
|
(3,835
|
)
|
$
|
(5,114
|
)
|
||
|
Foreign currency contract gain (loss), net
|
(5,358
|
)
|
4,154
|
|
4,904
|
|
|||||
|
Other
|
144
|
|
(440
|
)
|
122
|
|
|||||
|
Total
|
$
|
2,024
|
|
$
|
(121
|
)
|
$
|
(88
|
)
|
||
80
Income before income taxes and the provision for income taxes consisted of the following:
|
Year Ended December 31,
|
|||||||||||
|
2017
|
2016
|
2015
|
|||||||||
|
(In thousands)
|
|||||||||||
|
United States
|
$
|
57,989
|
|
$
|
88,748
|
|
$
|
88,681
|
|
||
|
International
|
32,725
|
|
26,321
|
|
(3,117
|
)
|
|||||
|
Total
|
$
|
90,714
|
|
$
|
115,069
|
|
$
|
85,564
|
|
||
|
Year Ended December 31,
|
|||||||||||
|
2017
|
2016
|
2015
|
|||||||||
|
(In thousands)
|
|||||||||||
|
Current:
|
|||||||||||
|
U.S. Federal
|
$
|
40,532
|
|
$
|
33,267
|
|
$
|
30,970
|
|
||
|
State
|
4,463
|
|
2,693
|
|
3,139
|
|
|||||
|
Foreign
|
4,305
|
|
6,278
|
|
6,105
|
|
|||||
|
49,300
|
|
42,238
|
|
40,214
|
|
||||||
|
Deferred:
|
|||||||||||
|
U.S. Federal
|
23,005
|
|
(2,052
|
)
|
(2,645
|
)
|
|||||
|
State
|
(288
|
)
|
441
|
|
134
|
|
|||||
|
Foreign
|
(739
|
)
|
(1,409
|
)
|
(723
|
)
|
|||||
|
21,978
|
|
(3,020
|
)
|
(3,234
|
)
|
||||||
|
Total
|
$
|
71,278
|
|
$
|
39,218
|
|
$
|
36,980
|
|
||
Net deferred tax assets consisted of the following:
|
Year Ended December 31,
|
|||||||
|
2017
|
2016
|
||||||
|
(In thousands)
|
|||||||
|
Deferred Tax Assets:
|
|||||||
|
Accruals and allowances
|
$
|
23,661
|
|
$
|
32,303
|
|
|
|
Net operating loss carryforwards
|
3,317
|
|
6,358
|
|
|||
|
Stock-based compensation
|
6,015
|
|
8,250
|
|
|||
|
Deferred rent
|
1,977
|
|
3,002
|
|
|||
|
Deferred revenue
|
2,740
|
|
1,957
|
|
|||
|
Tax credit carryforwards
|
974
|
|
1,543
|
|
|||
|
Acquired intangibles
|
14,907
|
|
21,871
|
|
|||
|
Depreciation and amortization
|
1,185
|
|
1,160
|
|
|||
|
Total deferred tax assets
|
54,776
|
|
76,444
|
|
|||
|
Deferred Tax Liabilities:
|
|||||||
|
Depreciation and amortization
|
—
|
|
—
|
|
|||
|
Other
|
(126
|
)
|
(991
|
)
|
|||
|
Total deferred tax liabilities
|
(126
|
)
|
(991
|
)
|
|||
|
Valuation Allowance
(1)
|
(5,182
|
)
|
(4,594
|
)
|
|||
|
Net deferred tax assets
|
$
|
49,468
|
|
$
|
70,859
|
|
|
_________________________
|
(1)
|
Valuation allowance is presented gross. The valuation allowance net of the federal tax effect is
$4.1 million
and
$3.0 million
for the years ended December 31,
2017
and
2016
, respectively.
|
81
Management's judgment is required in determining the Company's provision for income taxes, its deferred tax assets and any valuation allowance recorded against its deferred tax assets. As of December 31,
2017
, a valuation allowance of
$5.2 million
was placed against California deferred tax assets since the recovery of the assets is uncertain. There was a valuation allowance of
$4.6 million
placed against deferred tax assets as of December 31,
2016
. Accordingly, the valuation allowance increased
$0.6 million
during
2017
. In management's judgment it is more likely than not that the remaining deferred tax assets will be realized in the future as of December 31,
2017
, and as such no valuation allowance has been recorded against the remaining deferred tax assets.
The effective tax rate differs from the applicable U.S. statutory federal income tax rate as follows:
|
Year Ended December 31,
|
||||||||
|
2017
|
2016
|
2015
|
||||||
|
Tax at federal statutory rate
|
35.0
|
%
|
35.0
|
%
|
35.0
|
%
|
||
|
State, net of federal benefit
|
1.1
|
%
|
1.8
|
%
|
2.6
|
%
|
||
|
Impact of international operations
|
(6.4
|
)%
|
(2.7
|
)%
|
7.1
|
%
|
||
|
Stock-based compensation
|
(0.9
|
)%
|
1.2
|
%
|
(0.4
|
)%
|
||
|
Tax credits
|
(1.6
|
)%
|
(0.9
|
)%
|
(1.2
|
)%
|
||
|
Impact of the Tax Act
|
53.3
|
%
|
—
|
%
|
—
|
%
|
||
|
Others
|
(1.9
|
)%
|
(0.3
|
)%
|
0.1
|
%
|
||
|
Provision for income taxes
|
78.6
|
%
|
34.1
|
%
|
43.2
|
%
|
||
Income tax benefits (provision) in the amount of
$2.5 million
and
$(2.2) million
related to stock options were credited to additional paid-in capital during the years ended December 31,
2016
, and
2015
, respectively. On January 1, 2017, the Company adopted ASU 2016-09, "Improvements to Employee Share-Based Payment Accounting" (Topic 718) upon which all income tax benefits are recorded in income tax expense. As a result of changes in fair value of available-for-sale securities and foreign currency hedging, income tax (provision) benefits of
$0.4 million
,
$(0.3) million
and
$21,000
were recorded in comprehensive income related to the years ended December 31,
2017
,
2016
, and
2015
, respectively.
As of December 31,
2017
, the Company has approximately
$15.8 million
of acquired federal net operating loss carry forwards as well as
$3.1 million
of California tax credits carryforwards. All of the losses are subject to annual usage limitations under Internal Revenue Code Section 382. The federal losses expire in different years beginning in fiscal
2021
. The California tax credit carryforwards have no expiration.
On December 22, 2017, the Tax Cuts and Jobs Act of 2017 (the “Tax Act”) was signed into law making significant changes to the Internal Revenue Code. Changes include, but are not limited to, a corporate tax rate decrease from 35% to 21% effective for tax years beginning after December 31, 2017, the transition of U.S international taxation from a worldwide tax system to a territorial system, and a one-time transition tax on the mandatory deemed repatriation of cumulative foreign earnings as of December 31, 2017. The Company has calculated an estimate of the impact of the Tax Act in is year end income tax provision in accordance with its understanding of the Tax Act and guidance available as of the date of this filing and as a result has recorded
$48.3 million
as additional income tax expense in the fourth fiscal quarter of 2017, the period in which the legislation was enacted. The provisional amount related to the remeasurement of certain deferred tax assets and liabilities, based on the rates at which they are expected to reverse in the future, was
$26.6 million
. The provisional amount related to the one-time transition tax on the mandatory deemed repatriation of foreign earnings was
$21.7 million
.
On December 22, 2017, Staff Accounting Bulletin No. 118 ("SAB 118") was issued to address the application of US GAAP in situations when a registrant does not have the necessary information available, prepared, or analyzed (including computations) in reasonable detail to complete the accounting for certain income tax effects of the Tax Act. In accordance with SAB 118, the Company has determined that the
$21.7 million
of current tax expense recorded in connection with the transition tax on the mandatory deemed repatriation of foreign earnings was a provisional amount and a reasonable estimate at December 31, 2017. As further guidance is issued by Treasury, additional work may be necessary to ensure earnings as required by the calculations are properly determined. Additionally, as a result of the Tax Act, the Company has not completed its evaluation of its indefinite reinvestment assertion with regard to foreign earnings under ASC 740-30. As a result, deferred tax liabilities may be increased or decreased during the period allowed under SAB 118. Further, no estimate can currently be made and no provisional amounts were recorded in the financial statements for the impact of the Global Intangible Low-Taxed Income (“GILTI”) provision of the Tax Act. The GILTI provision imposes taxes on foreign earnings in excess of a deemed return on tangible assets. This tax is effective
82
for the Company after the end of the current fiscal year. However, the company is evaluating whether deferred taxes should be recorded in relation to the GILTI provisions or if the tax should be recorded in the period in which it occurs. Based on the current interpretation, the company may choose either method as an accounting policy election. The Company has not yet decided on the accounting policy related to GILTI and will only do so after completion of an analysis. Any subsequent adjustment to any of these amounts will be recorded to current tax expense during the measurement period provided under SAB 118.
The Company files income tax returns in the U.S. federal jurisdiction and various state, local, and foreign jurisdictions. With few exceptions, the Company is no longer subject to U.S. federal, state, or local income tax examinations for years before 2013. During August 2017, the U.S. federal Internal Revenue Service (IRS) completed its audit of the tax year ended December 31, 2014 without change. The Company is no longer subject to foreign income tax examinations before 2004. The Italian Tax Authority (ITA) has audited the Company’s
2004
through
2012
tax years. The Company is currently in litigation with the ITA with respect to all of these years. In August 2017, the German Tax Authority (GTA) completed its examination of the Company’s
2008
and
2013
tax years without change. During 2016, the United Kingdom HMRC (Her Majesty’s Revenue and Customs) initiated an audit of the Company’s
2014
and 2015 tax years. They have since added the
2016
year to their query. Additionally, in December, 2017 the French Tax Authority commenced an audit of the Company’s
2015
and
2016
tax years. The Company has limited audit activity in various states and other foreign jurisdictions. Due to the uncertain nature of ongoing tax audits, the Company has recorded its liability for uncertain tax positions as part of its long-term liability as payments cannot be anticipated over the next 12 months. The existing tax positions of the Company continue to generate an increase in the liability for uncertain tax positions. The liability for uncertain tax positions may be reduced for liabilities that are settled with taxing authorities or on which the statute of limitations could expire without assessment from tax authorities. The possible reduction in liabilities for uncertain tax positions resulting from the expiration of statutes of limitation in multiple jurisdictions in the next 12 months is approximately
$0.9 million
, excluding the interest, penalties and the effect of any related deferred tax assets or liabilities.
A reconciliation of the beginning and ending amount of gross unrecognized tax benefits (“UTB”) is as follows:
|
Federal, State, and Foreign Tax
|
|||
|
(In thousands)
|
|||
|
Balance as of December 31, 2014
|
$
|
13,364
|
|
|
Additions based on tax positions related to the current year
|
1,608
|
|
|
|
Additions for tax positions of prior years
|
228
|
|
|
|
Settlements
|
(199
|
)
|
|
|
Reductions for tax positions of prior years
|
(302
|
)
|
|
|
Reductions due to lapse of applicable statutes
|
(1,053
|
)
|
|
|
Adjustments due to foreign exchange rate movement
|
(816
|
)
|
|
|
Balance as of December 31, 2015
|
12,830
|
|
|
|
Additions based on tax positions related to the current year
|
1,523
|
|
|
|
Additions for tax positions of prior years
|
45
|
|
|
|
Reductions for tax positions of prior years
|
(237
|
)
|
|
|
Reductions due to lapse of applicable statutes
|
(627
|
)
|
|
|
Adjustments due to foreign exchange rate movement
|
(569
|
)
|
|
|
Balance as of December 31, 2016
|
$
|
12,965
|
|
|
Additions based on tax positions related to the current year
|
938
|
|
|
|
Additions for tax positions of prior years
|
32
|
|
|
|
Reductions for tax positions of prior years
|
(1,477
|
)
|
|
|
Reductions due to lapse of applicable statutes
|
(899
|
)
|
|
|
Adjustments due to foreign exchange rate movement
|
1,008
|
|
|
|
Balance as of December 31, 2017
|
$
|
12,567
|
|
The total amount of net UTB that, if recognized would affect the effective tax rate as of December 31,
2017
is
$10.4 million
. The ending net UTB results from adjusting the gross balance at December 31,
2017
for items such as U.S. federal and state deferred tax, interest, and deductible taxes. The net UTB is included as a component of non-current income taxes payable within the consolidated balance sheets.
83
The Company recognizes interest and penalties accrued related to unrecognized tax benefits in income tax expense. During the years ended December 31,
2017
,
2016
, and
2015
, total interest and penalties expensed were
$(0.4) million
,
$0.6 million
and
$0.1 million
, respectively. As of December 31,
2017
and
2016
, accrued interest and penalties on a gross basis was
$3.3 million
and
$3.6 million
, respectively. Included in accrued interest are amounts related to tax positions for which the ultimate deductibility is highly certain but for which there is uncertainty about the timing of such deductibility.
The Company continues to permanently reinvest its earnings overseas but is in the process of evaluating this position in light of the Tax Act. The earnings were approximately
$175.0 million
and
$154.2 million
as of December 31,
2017
and
2016
, respectively. Due to the impact of the Tax Act, no additional U.S. taxes are anticipated on these earnings.
Leases
The Company leases office space, cars and equipment under operating leases, with various expiration dates through
December 2026
. Rent expense in the years ended of
December 31, 2017
,
2016
, and
2015
was
$10.1 million
,
$9.5 million
, and
$9.8 million
, respectively. The terms of some of the Company’s office leases provide for rental payments on a graduated scale. The Company recognizes rent expense on a straight-line basis over the lease period, and has accrued for rent expense incurred but not paid.
As of December 31, 2017, future minimum lease payments under non-cancelable operating leases are as follows (in thousands):
|
2018
|
$
|
8,924
|
|
|
2019
|
7,718
|
|
|
|
2020
|
6,092
|
|
|
|
2021
|
5,715
|
|
|
|
2022
|
5,638
|
|
|
|
Thereafter
|
12,921
|
|
|
|
Total future minimum lease payments
|
$
|
47,008
|
|
Purchase Obligations
The Company has entered into various inventory-related purchase agreements with suppliers. Generally, under these agreements,
50%
of orders are cancelable by giving notice
46
to
60
days prior to the expected shipment date and
25%
of orders are cancelable by giving notice
31
to
45
days prior to the expected shipment date. Orders are non-cancelable within
30 days
prior to the expected shipment date. As of
December 31, 2017
, the Company had approximately
$153.1 million
in non-cancelable purchase commitments with suppliers. The Company establishes a loss liability for all products it does not expect to sell for which it has committed purchases from suppliers. Such losses have not been material to date. From time to time the Company’s suppliers procure unique complex components on the Company's behalf. If these components do not meet specified technical criteria or are defective, the Company should not be obligated to purchase the materials. However, disputes may arise as a result and significant resources may be spent resolving such disputes.
84
Warranty obligations
Changes in the Company's warranty liability, which is included in other accrued liabilities in the consolidated balance sheets, are as follows:
|
Year Ended December 31,
|
|||||||||||
|
2017
|
2016
|
2015
|
|||||||||
|
(In thousands)
|
|||||||||||
|
Balance at the beginning of the year
|
$
|
58,520
|
|
$
|
56,706
|
|
$
|
44,888
|
|
||
|
Provision for warranty obligations made during the year
|
131,263
|
|
87,570
|
|
80,085
|
|
|||||
|
Settlements made during the year
|
(113,959
|
)
|
(85,756
|
)
|
(68,267
|
)
|
|||||
|
Balance at the end of year
|
$
|
75,824
|
|
$
|
58,520
|
|
$
|
56,706
|
|
||
Guarantees and Indemnifications
The Company, as permitted under Delaware law and in accordance with its Bylaws, indemnifies its officers and directors for certain events or occurrences, subject to certain limits, while the officer or director is or was serving at the Company’s request in such capacity. The term of the indemnification period is for the officer’s or director’s lifetime. The maximum amount of potential future indemnification is unlimited; however, the Company has a Director and Officer Insurance Policy that enables it to recover a portion of any future amounts paid. As a result of its insurance policy coverage, the Company believes the fair value of each indemnification agreement is minimal. Accordingly, the Company has
no
liabilities recorded for these agreements as of
December 31, 2017
.
In its sales agreements, the Company typically agrees to indemnify its direct customers, distributors and resellers (the “Indemnified Parties”) for any expenses or liability resulting from claimed infringements by the Company's products of patents, trademarks or copyrights of third parties that are asserted against the Indemnified Parties, subject to customary carve outs. The terms of these indemnification agreements are generally perpetual after execution of the agreement. The maximum amount of potential future indemnification is generally unlimited. From time to time, the Company receives requests for indemnity and may choose to assume the defense of such litigation asserted against the Indemnified Parties. Accordingly, the Company has
no
liabilities recorded for these agreements as of
December 31, 2017
.
Employment Agreements
The Company has signed various employment agreements with key executives pursuant to which, if their employment is terminated without cause, such employees are entitled to receive their base salary (and commission or bonus, as applicable) for 52 weeks (for the Chief Executive Officer), 39 weeks (for the Senior Vice President of Worldwide Operations and Support) and up to 26 weeks (for other key executives). Such employees will also continue to have equity awards vest for up to a
one
-year period following such termination without cause. If a termination without cause or resignation for good reason occurs within
one
year of a change in control, such employees are entitled to full acceleration (for the Chief Executive Officer) and up to
two
years acceleration (for other key executives) of any unvested portion of his or her equity awards. The Company has
no
liabilities recorded for these agreements as of
December 31, 2017
.
Litigation and Other Legal Matters
The Company is involved in disputes, litigation, and other legal actions, including, but not limited to, the matters described below. In all cases, at each reporting period, the Company evaluates whether or not a potential loss amount or a potential range of loss is probable and reasonably estimable under the provisions of the authoritative guidance that addresses accounting for contingencies. In such cases, the Company accrues for the amount, or if a range, the Company accrues the low end of the range, only if there is not a better estimate than any other amount within the range, as a component of legal expense within litigation reserves, net. The Company monitors developments in these legal matters that could affect the estimate the Company had previously accrued. In relation to such matters, the Company currently believes that there are
no
existing claims or proceedings that are likely to have a material adverse effect on its financial position within the next
twelve
months, or the outcome of these matters is currently not determinable. There are many uncertainties associated with any litigation, and these actions or other third-party claims against the Company may cause the Company to incur costly litigation and/or substantial settlement charges. In addition, the resolution of any intellectual property litigation may require the Company to make royalty payments, which could have an adverse effect in
85
future periods. If any of those events were to occur, the Company's business, financial condition, results of operations, and cash flows could be adversely affected. The actual liability in any such matters may be materially different from the Company's estimates, which could result in the need to adjust the liability and record additional expenses.
Ericsson v. NETGEAR, Inc.
On September 14, 2010, Ericsson Inc. and Telefonaktiebolaget LM Ericsson (collectively “Ericsson”) filed a patent infringement lawsuit against the Company and defendants D-Link Corporation, D-Link Systems, Inc., Acer, Inc., Acer America Corporation, and Gateway, Inc. in the U.S. District Court, Eastern District of Texas alleging that the defendants infringe certain Ericsson patents. The Company has been accused of infringing
eight
U.S. patents: 5,790,516 (the “‘516 Patent”); 6,330,435 (the “‘435 Patent”); 6,424,625 (the “‘625 Patent”); 6,519,223 (the “‘223 Patent”); 6,772,215 (the “‘215 Patent”); 5,987,019 (the “‘019 Patent”); 6,466,568 (the “‘568 Patent”); and 5,771,468 (the “'468 Patent"). Ericsson generally alleged that the Company and the other defendants infringe the Ericsson patents through the defendants' IEEE 802.11-compliant products. In addition, Ericsson alleged that the Company infringed the claimed methods and apparatuses of the '468 Patent through the Company's PCMCIA routers. On June 22, 2012, Intel filed its Complaint in Intervention, meaning that Intel also became a defendant. During litigation, Ericsson (a) dismissed the '468 Patent with prejudice and gave the Company a covenant not to sue as to products in the marketplace now or in the past, (b) dropped the '516 Patent and (c) dropped the '223 Patent, except for those products that use Intel chips.
A jury trial occurred in the Eastern District of Texas from June 3 through June 13, 2013. After hearing the evidence, the jury found no infringement of the '435 and '223 Patents, and the jury found infringement of claim 1 of the '625 Patent, claims 1 and 5 of the '568 Patent, and claims 1 and 2 of the '215 Patent. The jury also found that there was no willful infringement by any defendant. Additionally, the jury found no invalidity of the asserted claims of the '435 and '625 Patents. The jury assessed the following damages against the defendants: D-Link:
$435,000
; NETGEAR:
$3,555,000
; Acer/Gateway:
$1,170,000
; Dell:
$1,920,000
; Toshiba:
$2,445,000
; Belkin:
$600,000
. The damages awards equated to
15
cents per unit for each accused 802.11 device sold by each defendant (
5
cents per patent).
The Company and other defendants appealed the jury verdict. On December 4, 2014, the Federal Circuit issued its opinion and order in the appeal. The Federal Circuit vacated the entirety of the
$3.6 million
jury verdict against the Company and other defendants’ damages awards and also vacated the ongoing
15 cent
s per unit royalty verdict, finding that the District Court had not properly instructed the jury on royalty rates and Ericsson’s licensing promises.
While the Federal Circuit found the district court had inadequate jury instructions, it held that there was enough evidence for the jury to find infringement of two claims of U.S. Patent Number 6,466,568 and two claims of U.S. Patent Number 6,772,215, but reversed the lower court’s decision not to grant a noninfringement judgment as a matter of law regarding the third patent, U.S. Patent Number 6,424,625, finding that no reasonable jury could find that the ‘625 Patent was infringed by the defendants. The case was remanded for further proceedings.
In September 2013, Broadcom filed petitions in the USPTO at the Patent Trial and Appeal Board (PTAB) seeking inter partes review (“IPR”) of Ericsson’s three patents that the jury found were infringed by the Company and other defendants. On March 6, 2015, the PTAB invalidated all the claims of these three patents that were asserted against the Company and other defendants, ruling these claims were anticipated or obvious in light of prior art. This PTAB decision comes on top of the Federal Circuit decision (a) vacating the jury verdict after finding that the district court had not properly instructed the jury on royalty rates and Ericsson’s licensing promises, and (b) ruling that no reasonable jury could have found the ‘625 Patent infringed. Accordingly, the Company has reversed the accruals related to this case.
Ericsson appealed the PTAB’s Broadcom IPR decision to the Federal Circuit and also requested that the PTAB reconsider its decision. The PTAB denied Ericsson’s request for reconsideration. On appeal to the Federal Circuit, Ericsson argued that the PTAB’s determination that Broadcom had timely filed its IPR petitions was improper and that the PTAB should not have invalidated the claims of the '625 Patent, the '568 Patent, and '215 Patent. The Federal Circuit upheld the invalidity of the patents’ claims, as previously determined by the PTAB, and ruled that Ericsson could not appeal the timeliness of Broadcom’s IPR petitions. Ericsson petitioned the Federal Circuit for an en banc rehearing of the Federal Circuit's panel decision that Broadcom was timely in bringing its IPRs, and the Federal Circuit agreed to the en banc rehearing. On January 8, 2018, the Federal Circuit sitting en banc ruled that the timeliness of Broadcom’s IPR petitions was an appealable issue. The case will now go back to the original Federal Circuit panel to decide what to do - if there are enough facts on the record, the panel could decide the timeliness issue outright, or send the case back to the PTAB to conduct discovery on whether Broadcom should be time barred. The present status of the case continues to be that the Company does not infringe any valid Ericsson patent.
86
Agenzia Entrate Provincial Revenue Office 1 of Milan v. NETGEAR International, Inc.
In November 2012, the Italian tax police began a comprehensive tax audit of NETGEAR International, Inc.’s Italian Branch. The scope of the audit initially was from
2004
through 2011 and was subsequently expanded to include
2012
. The tax audit encompassed Corporate Income Tax (IRES), Regional Business Tax (IRAP) and Value-Added Tax (VAT). In December 2013, December 2014, August 2015, and December 2015 an assessment was issued by Inland Revenue Agency, Provincial Head Office No. 1 of Milan-Auditing Department (Milan Tax Office) for the 2004 tax year, the 2005 through 2007 tax years, the 2008 through 2010 tax years, and the 2011 through 2012 tax years, respectively.
In May 2014, the Company filed with the Provincial Tax Court of Milan an appeal brief, including a Request for Hearing in Open Court and Request for Suspension of the Tax Assessment for the 2004 year. The hearing was held and decision was issued on December 19, 2014. The Tax Court decided in favor of the Company and nullified the assessment by the Inland Revenue Agency for 2004. The Inland Revenue Agency appealed the decision of the Tax Court on June 12, 2015. The Company filed its counter appeal with respect to the 2004 year during September 2015. On February 26, 2016, the Regional Tax Court conducted the appeals hearing for the 2004 year, ruling in favor of the Company. On June 13, 2016, the Inland Revenue Agency appealed the decision to the Supreme Court. The Company filed a counter appeal on July 23, 2016 and is awaiting scheduling of the hearing.
In June 2015, the Company filed with the Provincial Tax Court of Milan an appeal brief including a Request for Hearing in Open Court and Request for Suspension of the Tax Assessment for the 2005 through 2006 tax years. The hearing for suspension was held and the Request for Suspension of payment was granted. The hearing for the validity of the tax assessment for 2005 and 2006 was held in December 2015 with the Provincial Tax Court issuing its decision in favor of the Company. The Inland Revenue Agency filed its appeal with the Regional Tax Court. The Company filed its counter brief on September 30, 2016 and the hearing was held on March 22, 2017. A decision favorable to the Company was issued by the Court on July 5, 2017. The Italian Tax Authority has appealed the decision to the Supreme Court and Netgear has responded with a counter appeal brief on December 3, 2017.
The hearing for the validity of the tax assessment for 2007 was held on March 10, 2016 with the Provincial Tax Court who issued its decision in favor of the Company on April 7, 2016. The Inland Revenue Agency has filed its appeal to the Regional Tax Court and the Company has submitted its counter brief. The hearing was held on November 17, 2017. Netgear is waiting on a decision to be issued.
With respect to 2008 through 2010, the Company filed its appeal briefs with the Provincial Tax Court in October 2015 and the hearing for the validity of the tax assessments was held on April 21, 2016. A decision favorable to the Company was issued on May 12, 2016. The Inland Revenue Agency has filed its appeal to the Regional Tax Court. The Company filed its counter brief on February 5, 2017 and awaits the scheduling of the hearing.
With respect to 2011 through 2012, the Company has filed its appeal brief on February 26, 2016 with the Provincial Tax Court to contest the relevant tax assessments. The hearing for suspension was held and the Request for Suspension of payment was granted. On October 13, 2016, the Company filed its final brief with the Provincial Tax Court. The hearing was held on October 24, 2016 and a decision favorable to the Company was issued by the Court. The Inland Revenue Agency appealed the decision before the Regional Tax Court on April 19, 2017. The Company filed its counter brief on June 16, 2017 and awaits the scheduling of the hearing.
With regard to all tax years, it is too early to reasonably estimate any financial impact to the Company resulting from this litigation matter.
Via Vadis v. NETGEAR, Inc.
On August 22, 2014, the Company was sued by Via Vadis, LLC and AC Technologies, S.A. (“Via Vadis”), in the Western District of Texas. The complaint alleges that the Company’s ReadyNAS and Stora products “with built-in BitTorrent software" allegedly infringe three related patents of Via Vadis (U.S. Patent Nos. 7,904,680, RE40, 521, and 8,656,125). Via Vadis filed similar complaints against Belkin, Buffalo, Blizzard, D-Link, and Amazon.
By referring to “built-in BitTorrent software,” the Company believes that the complaint is referring to the BitTorrent Sync application, which was released by BitTorrent Inc. in spring of 2014. At a high-level, the application allows file synchronization across multiple devices by storing the underlying files on multiple local devices, rather than on a centralized server. The Company’s ReadyNAS products do not include BitTorrent software when sold. The BitTorrent application is provided as one of a multitude
87
of potential download options, but the software itself is not included on the Company’s devices when shipped. Therefore, the only viable allegation at this point is an indirect infringement allegation.
On November 10, 2014, the Company answered the complaint denying that it infringes the patents in suit and also asserting the affirmative defenses that the patents in suit are invalid and barred by the equitable doctrines of laches, waiver, and/or estoppel.
On February 6, 2015, the Company filed its motion to transfer venue from the Western District of Texas to the Northern District of California with the Court; on February 13, 2015, Via Vadis filed its opposition to the Company’s motion to transfer; and on February 20, 2015, the Company filed its reply brief on its motion to transfer. In early April 2015, the Company received the plaintiff’s infringement contentions, and on June 12, 2015, the defendants served invalidity contentions. On July 30, 2015, the Court granted the Company’s motion to transfer venue to the Northern District of California. In addition, the Company learned that Amazon and Blizzard filed petitions for the inter partes reviews (“IPRs”) for the patents in suit. On October 30, 2015, the Company and Via Vadis filed a joint stipulation requesting that the Court vacate all deadlines and enter a stay of all proceedings in the case pending the Patent Trial and Appeal Board’s final non-appealable decision on the IPRs initiated by Amazon and Blizzard. On November 2, 2015, the Court granted the requested stay. On March 8, 2016, the Patent Trial and Appeal Board issued written decisions instituting the IPRs jointly filed by Amazon and Blizzard. In early March of 2017, The Patent Trial and Appeal Board (PTAB) issued various decisions regarding Amazon’s and Blizzard’s IPRs of the patents in suit. One of the IPRs of the '125 patent resulted in a finding by the PTAB that Amazon and Blizzard had had failed to show invalidity. The second IPR on the '125 patent, however, resulted in cancellation of all claims asserted in Via Vadis’s suit against the Company. Reissue '521 did not have any claims found invalid by the PTAB, and some dependent claims of the '680 patent survived the IPRs, and some claims of the '680 patent were canceled. The Northern District of California case against the Company remains stayed.
It is too early to reasonably estimate any financial impact to the Company resulting from this litigation matter.
Chrimar Systems, Inc. v NETGEAR, Inc.
On July 1, 2015, the Company was sued by a non-practicing entity named Chrimar Systems, Inc., doing business as CMS Technologies and Chrimar Holding Company, LLC (collectively, “CMS”), in the Eastern District of Texas for allegedly infringing
four
patents-U.S. Patent Nos. 8,155,012 (the “'012 Patent”), entitled “System and method for adapting a piece of terminal equipment”; 8,942,107 (the “'107 Patent”), entitled “Piece of ethernet terminal equipment”; 8,902,760 (the “'760 Patent”), entitled “Network system and optional tethers”; and 9,019,838 (the “'838 Patent”), entitled “Central piece of network equipment” (collectively “patents-in-suit”).
The patents-in-suit relate to using or embedding an electrical DC current or signal into an existing Ethernet communication link in order to transmit additional data about the devices on the communication link, and the specifications for the patents are identical. It appears that CMS has approximately
40
active cases in the Eastern District of Texas, as well as some cases in the Northern District of California on the patents-in-suit and the parent patent to the patents-in-suit.
The Company answered the complaint on September 15, 2015. On November 24, 2015, CMS served its infringement contentions on the Company, and CMS is generally attempting to assert that the patents in suit cover the Power over Ethernet standard (802.3af and 802.3at) used by certain of the Company's products.
On December 3, 2015, the Company filed with the Court a motion to transfer venue to the District Court for the Northern District of California and their memorandum of law in support thereof. On December 23, 2015, CMS filed its response to the Company’s motion to transfer, and, on January 8, 2016, the Company filed its reply brief in support of its motion to transfer venue. On January 15, 2016, the Court granted the Company’s motion to transfer venue to the District Court for the Northern District of California. The initial case management conference in the Northern District of California occurred on May 13, 2016, and on August 19, 2016, the parties exchanged preliminary claim constructions and extrinsic evidence. On August 26, 2016, the Company and three defendants in other Northern District of California CMS cases (Juniper Networks, Inc., Ruckus Wireless, Inc., and Fortinet, Inc.) submitted motions to stay their cases. The defendants in part argued that stays were appropriate pending the resolution of the currently-pending IPRs of the patents-in-suit before the Patent Trial and Appeal Board (PTAB), including four IPR Petitions filed by Juniper. On September 9, 2016, CMS submitted its opposition to the motions to stay the cases. On September 26, 2016, the Court ordered the cases stayed in their entirety, until the PTAB reaches institution decisions with respect to Juniper’s four pending IPR petitions. Juniper’s four IPR petitions were instituted by the PTAB in January 2017, and the Company subsequently moved to join the IPR petitions as an “understudy” to Juniper, only assuming a more active role in the petitions in the event Juniper settles with CMS. For all four patents in suit against the Company, the PTAB ordered that (a) the Petitioners’ (the Company, Ruckus, and Brocade) Motion for Joinder to the Juniper IPRs is granted; (b) the Petitioners IPRs are instituted on the same grounds
88
as in the Juniper ‘IPRs and Petitioners are joined with the Juniper IPRs; and (c) all further filings by Petitioners in the joined proceedings will be in the Juniper IPRs. On December 21, 2017, the PTAB issued the first of the four Final Written Decisions in the IPRs filed by the Company on the patents in suit, ruling that the claims of the ‘107 Patent asserted by Chrimar were invalid. This was quickly followed by two more Final Written Decisions -- on January 3, 2018, the ’838 patent’s asserted claims were ruled invalid, and on January 23, 2018 the ‘012 patent’s asserted claims were ruled invalid. Chrimar has 30 days from each Final Written Decision to seek a rehearing at the PTAB and 63 days from each to file an appeal. The PTAB has yet to rule on the ‘760 patent, and the Company expects that ruling in a few months. The Northern District of California CMS cases remain stayed in their entirety by the Court.
It is too early to reasonably estimate any financial impact to the Company resulting from this litigation matter.
Tessera v. NETGEAR, Inc.
On May 23, 2016, Tessera Technologies, Inc., Tessera, Inc., and Invensas Corp. (collectively, “Tessera”) filed a complaint requesting that the U.S. International Trade Commission (“Commission”) commence an investigation pursuant to Section 337 by reason of alleged infringement of certain patent claims by the Company and other respondents. On June 20, 2016, the Commission issued the related Notice of Investigation, and the Investigation was instituted on June 24, 2016.
The Tessera complaint alleges that the following respondents unlawfully import into the U.S., sell for importation, and/or sell within the U.S. after importation certain semiconductor devices, semiconductor device packages, and products containing the same that infringe one or more claims of U.S. Patent Nos. 6,856,007 (the ‘007 patent), 6,849,946 (the ‘946 patent), and 6,133,136 (the ‘136 patent) (collectively, the “asserted patents”): Broadcom Limited of Singapore; Broadcom Corp. of Irvine, California; Avago Technologies Limited of Singapore; Avago Technologies U.S. Inc. of San Jose, California; Arista Networks, Inc. of Santa Clara, California; ARRIS International plc of Suwanee, Georgia; ARRIS Group, Inc. of Suwanee, Georgia; ARRIS Technology, Inc. of Horsham, Pennsylvania; ARRIS Enterprises LLC of Suwanee, Georgia; ARRIS Solutions, Inc. of Suwanee, Georgia; Pace Ltd. (formerly Pace plc) of England; Pace Americas, LLC of Boca Raton, Florida; Pace USA, LLC of Boca Raton, Florida; ASUSTeK Computer Inc. of Taiwan; ASUS Computer International of Fremont, California; Comcast Cable Communications, LLC of Philadelphia, Pennsylvania; Comcast Cable Communications Management, LLC of Philadelphia, Pennsylvania; Comcast Business Communications, LLC of Philadelphia, Pennsylvania; HTC Corp. of Taiwan; HTC America, Inc. of Bellevue, Washington; Technicolor S.A. of France; Technicolor USA, Inc. of Indianapolis, Indiana; Technicolor Connected Home USA LLC of Indianapolis, Indiana; and the Company.
According to the complaint, the asserted patents generally relate to semiconductor packaging technology. In particular, the ‘007 patent relates to a compact and economical semiconductor chip assembly that includes a packaged semiconductor chip, a chip carrier with a metallic thermal conductor, and a circuit panel with a thermal conductor mounting. The ‘946 patent relates to a semiconductor layout configuration and method that results in a more efficient planarization process for a semiconductor chip. Lastly, the ‘136 patent relates to a structure for metal interconnects used in semiconductor packaging.
In the complaint, Tessera states that the respondents import and sell products that infringe the asserted patents. In particular, the complaint refers to multiple categories of accused semiconductor products associated with Broadcom and asserts that the remaining respondents import and sell products that contain these infringing Broadcom semiconductor products. Tessera requested that the Commission issue a permanent limited exclusion order and a permanent cease and desist order directed at the respondents and related entities.
Concurrently with the filing of the instant ITC complaint, Tessera also filed a complaint against Broadcom Corp. in the U.S. District Court for the District of Delaware alleging infringement of the asserted patents. The Company has not been sued in Delaware or any other jurisdiction other than the ITC.
The Company stipulated to certain facts regarding its importation and inventory of Broadcom-based products in return for various relief from discovery, such as reduced depositions and discovery responses in the ITC case. As per the ITC schedule, the parties exchanged direct exhibits and witness statements on February 20, 2017; rebuttal exhibits and witness statements on March 3, 2017; pre-trial briefs on March 9, 2017; and Motions in limine on March 13, 2017. The 5-day evidentiary hearing before the ITC Administrative Law Judge (“ALJ”) commenced on March 27, 2017 and ended on March 31, 2017. The ITC rules provide for possible closing arguments before the ALJ after post-hearing briefing, which were submitted on April 19, 2017. Reply post-trial briefs were submitted on May 1, 2017.
89
On June 30, 2017 the ALJ released the Initial Determination based on the 5-day evidentiary hearing and related briefing. For the ‘946 patent, the ALJ found the four (4) claims infringed and valid, and that there is a domestic industry. For the ‘136 patent, the ALJ found the nine (9) claims were infringed and valid, but no domestic industry. For the ‘007 patent, the ALJ found (1) one claim infringed by the Company and Technicolor, claims 13 and 16 not infringed, all three asserted claims invalid, including the one claim found to be infringed, and no domestic industry.
In summary, the ALJ found a violation of section 337 of the Tariff Act due to infringement by the Company and other respondents of the ‘946 patent, but not as to the ‘136 patent or ‘007 patent. There is no violation with respect to the ‘136 patent even though it was found to be infringed and valid by the ALJ because Tessera could not show a domestic industry.
On August 2, 2017, the Company and other respondents filed their Public Interest Statements with the ITC and also submitted briefing to the ITC indicating why the adverse findings for the respondents of the Initial Determination should be reviewed.
On August 10, 2017, the Commission extended the target date for the investigation from October 30, 2017 to December 1, 2017 and also extended the date for determination of whether to review the Initial Determination from August 31, 2017 to September 29, 2017, and, on that date, the Commission determined to review essentially all issues on the ’946 and ’136 patents, and none of the issues for the ’007 patent. Thus, the asserted claims of the ‘007 patent have been ruled invalid, and the ‘007 patent is out of the investigation.
On October 13, 2017, the respondents and Tessera submitted their Opening Submissions to the Commission. These Opening Submissions included opening briefs on infringement and invalidity topics, opening briefs on remedy, opening briefs on the public interest, opening briefs on bonding, and public interest submissions by the public. The Reply Submissions to the opening briefs were submitted on October 23, 2017.
On December 12, 2017, Tessera and Broadcom reached a verbal agreement to settle all the litigation matters between the two companies. As part of the settlement, Broadcom received a license for itself and its customers, including the Company, to Tessera’s portfolio of semiconductor manufacturing patents, including the three patents in the ITC action. On December 15, 2017, the ITC respondents, including the Company, entered into a written settlement agreement with Tessera, whereby dismissal of the ITC action was agreed upon. As part of the settlement agreement, the parties admitted no wrongdoing or violation of law. On December 19, 2017, the ITC granted the parties’ joint motion to terminate the ITC action.
This litigation matter did not have a material financial impact on the Company.
Realtime Data v. NETGEAR, Inc.
On February 27, 2017, the Company was sued in the Eastern District of Texas by Realtime Data LLC (“Realtime”), which claims to do business as “Ixo.” The complaint includes
four
(4) asserted patents:
|
•
|
US 9,054,728, Data compression systems and methods;
|
|
•
|
US 7,415,530, System and methods for accelerated data storage and retrieval;
|
|
•
|
US 9,116,908, System and methods for accelerated data storage and retrieval; and
|
|
•
|
US 8,717,204, Methods for encoding and decoding data
|
The accused products specifically include the Company’s “ReadyDATA RD5200, RDD516, ReadyRECOVER” products. Generally, the complaint alleges that the asserted patents are directed to various compression / decompression algorithms and systems and is directed at the Company’s ReadyDATA, ReadyNAS, and ReadyRECOVER products.
Realtime has filed several patent suits over the last few years and the asserted patents have gone through various rounds of litigation and IPRs. In this particular tranche of Realtime lawsuits, Realtime also sued Array Networks, Barracuda Networks, Carbonite, Circadence, Comm Vault, Exinda and Snacor.
The Company received an extension until May 8, 2017 to answer the complaint and answered the complaint on that date. On August 15, 2017, the Company filed its motion to transfer venue for convenience from the Eastern District of Texas to the Northern District of California. On September 19, 2017, the plaintiff filed its Opposition to the Company’s motion to transfer venue. On October 11, 2017, the Eastern District of Texas granted the Company’s motion to transfer venue to the Northern District of California.
90
The litigation was officially transferred to the Northern District of California, and the initial case management conference occurred before the Court on December 14, 2017. At a subsequent scheduling conference on January 25, 2018, the Court sua sponte stayed the cases brought by Realtime against Barracuda, Riverbed, and the Company until June 14, 2018 and set another scheduling conference for June 14, 2018 when the Court will evaluate whether the stay should be extended based on the results of at least one IPR of the patents in suit. On January 12, 2018, Realtime served its infringement contentions, which were the same as Realtime had previously served in the Eastern District of Texas prior to transfer of the case to California.
It is too early to reasonably estimate any financial impact to the Company resulting from this litigation matter.
Vivato v. NETGEAR, Inc.
On April 19, 2017, the Company was sued by XR Communications (d/b/a) Vivato (“Vivato”) in the United States District Court, Central District of California.
Based on its complaint, Vivato purports to be a research and development and product company in the Wi-Fi area, but it appears that Vivato is not currently a manufacturer of commercial products. The
three
(3) patents that Vivato asserts against the Company are U.S. Patent Nos. 7,062,296, 7,729,728, and 6,611,231. The ’296 and ’728 patents are entitled “Forced Beam Switching in Wireless Communication Systems Having Smart Antennas.” The ’231 patent is entitled “Wireless Packet Switched Communication Systems and Networks Using Adaptively Steered Antenna Arrays.” Vivato also has recently asserted the same patents in the Central District of California against D-Link, Ruckus, and Aruba, among others.
According to the complaint, the accused products include WiFi access points and routers supporting MU-MIMO, including without limitation access points and routers utilizing the IEEE 802.11ac-2013 standard. The accused technology is standards-based, and more specifically, based on the transmit beamforming technology in the 802.11ac Wi-Fi standard.
The Company answered an amended complaint on July 7, 2017. In its answer, the Company objected to venue and recited that objection as a specific affirmative defense, so as to expressly reserve the same. The Company also raised several other affirmative defenses in its answer.
On August 28, 2017, the Company submitted its initial disclosures to the plaintiff. The initial scheduling conference was on October 2, 2017, and the Court set five day jury trial for March 19, 2019 for the leading Vivato/D-Link case, meaning the Company’s trial date will be at some point after March 19, 2019. Discovery in this case is ongoing.
It is too early to reasonably estimate any financial impact to the Company resulting from this litigation matter.
Hera Wireless v. NETGEAR, Inc.
On July 14, 2017, the Company was sued by Sisvel (via Hera Wireless) in the District of Delaware on
three
related patents allegedly covering the 802.11n standard. Similar complaints were filed against Amazon, ARRIS, Belkin, Buffalo, and Roku. On December 12, 2017, the Company answered the complaint, denying why each claim limitation of the patents in suit were allegedly met and asserting various affirmative defenses, including invalidity and noninfringement. A proposed joint Scheduling Order was submitted to the Court on January 24, 2018 with trial proposed for March of 2020. Discovery is ongoing.
It is too early to reasonably estimate any financial impact to the Company resulting from this litigation matter.
MyMail v. NETGEAR, Inc.
On August 25, 2017, the non-practicing entity MyMail Ltd. (“MyMail”) sued the Company for patent infringement in the District of Delaware. This is MyMail’s third round of cases, starting in November 2016, and, in this round, MyMail also filed against Ricoh, Panasonic, Acer, and TCL Communications.
MyMail is accusing essentially all the Company’s routers and range extenders of infringing claim 5 of U.S. Patent 8,732,318 (the ‘318 patent), entitled “Method of Connecting a User to a Network.” Claim 5 of the ’318 Patent describes a method for modifying network access information and then accessing the network using the modified information. MyMail is specifically accusing the Wi-Fi Protected Setup (WPS) function of the accused routers and range extenders.
91
On December 7, 2017, the Company answered the complaint. In addition to denying that each claim limitation of patents in suit is met, the Company also asserted various affirmative defenses, including invalidity and noninfringement. The parties submitted their jointly proposed scheduling order to the Court on January 11, 2018, which the Court generally adopted in its Scheduling Order of January 17, 2018. The Scheduling Order set the trial to begin on December 2, 2019. Discovery is ongoing.
It is too early to reasonably estimate any financial impact to the Company resulting from this litigation matter.
Environmental Regulation
The Company is required to comply and is currently in compliance with the European Union ("EU") and other Directives on the Restrictions of the use of Certain Hazardous Substances in Electrical and Electronic Equipment (“RoHS”), Waste Electrical and Electronic Equipment ("WEEE") requirements, Energy Using Product (“EuP”) requirements, the REACH Regulation, Packaging Directive and the Battery Directive.
The Company is subject to various federal, state, local, and foreign environmental laws and regulations, including those governing the use, discharge, and disposal of hazardous substances in the ordinary course of our manufacturing process. The Company believes that its current manufacturing and other operations comply in all material respects with applicable environmental laws and regulations; however, it is possible that future environmental legislation may be enacted or current environmental legislation may be interpreted to create an environmental liability with respect to its facilities, operations, or products. See further discussion of the business risks associated with environmental legislation under the risk titled, "We are subject to, and must remain in compliance with, numerous laws and governmental regulations concerning the manufacturing, use, distribution and sale of our products, as well as any such future laws and regulations. Some of our customers also require that we comply with their own unique requirements relating to these matters. Any failure to comply with such laws, regulations and requirements, and any associated unanticipated costs, may adversely affect our business, financial condition and results of operations." in Item 1A Risk Factors Part I of this Annual Report on Form 10-K.
Stock Repurchases
On October 21, 2008, October 17, 2014, July 21, 2015 and April 25, 2017, the Company’s Board of Directors authorized management to repurchase up to
6.0 million
,
3.0 million
,
3.0 million
and
3.0 million
shares of the Company’s outstanding common stock, respectively, which, at the time of authorization, were incremental to the remaining shares under the share repurchase programs. Under the authorizations, the Company may repurchase shares of its common stock, depending on market conditions, in the open market or through privately negotiated transactions. The timing and actual number of shares subject to repurchase are at the discretion of management and are contingent on a number of factors, such as levels of cash generation from operations, cash requirements for acquisitions and the price of the Company’s common stock. As of
December 31, 2017
,
2.0 million
shares remained authorized for repurchase under the repurchase program. The Company repurchased, reported based on trade date, approximately
2.4 million
shares of common stock at a cost of
$113.2 million
during the year ended
December 31, 2017
. During the years ended
December 31, 2016
and
2015
, the Company repurchased and retired, reported based on trade date, approximately
0.9 million
shares of common stock at a cost of
$38.3 million
and approximately
3.8 million
shares of common stock at a cost of
$117.7 million
, respectively.
The Company repurchased, as reported based on trade date, approximately
135,000
shares of common stock at a cost of
$6.4 million
, to help administratively facilitate the withholding and subsequent remittance of personal income and payroll taxes for individuals receiving RSUs during the year ended
December 31, 2017
. Similarly, during the years ended
December 31, 2016
and
2015
, the Company repurchased approximately
105,000
shares of common stock at a cost of
$4.7 million
and
85,000
shares of common stock at a cost of
$2.6 million
, respectively, to help facilitate tax withholding for RSUs.
These shares were retired upon repurchase. The Company’s policy related to repurchases of its common stock is to charge the excess of cost over par value to retained earnings. All repurchases were made in compliance with Rule 10b-18 under the Securities Exchange Act of 1934, as amended.
92
Accumulated Other Comprehensive Income (Loss)
The following table sets forth the changes in accumulated other comprehensive income ("AOCI") by component during the years ended
December 31, 2017
,
2016
and
2015
:
|
Unrealized gains (losses) on available-for-sale securities
|
Unrealized gains (losses) on derivatives
|
Estimated tax benefit (provision)
|
Total
|
||||||||||||
|
(In thousands)
|
|||||||||||||||
|
Balance as of December 31, 2014
|
$
|
(8
|
)
|
$
|
43
|
|
$
|
3
|
|
$
|
38
|
|
|||
|
Other comprehensive income (loss) before reclassifications
|
(56
|
)
|
453
|
|
21
|
|
418
|
|
|||||||
|
Less: Amount reclassified from accumulated other comprehensive income
|
—
|
|
453
|
|
—
|
|
453
|
|
|||||||
|
Net current period other comprehensive income (loss)
|
(56
|
)
|
—
|
|
21
|
|
(35
|
)
|
|||||||
|
Balance as of December 31, 2015
|
$
|
(64
|
)
|
$
|
43
|
|
$
|
24
|
|
$
|
3
|
|
|||
|
Other comprehensive income (loss) before reclassifications
|
33
|
|
3,007
|
|
(572
|
)
|
2,468
|
|
|||||||
|
Less: Amount reclassified from accumulated other comprehensive income
|
—
|
|
820
|
|
(287
|
)
|
533
|
|
|||||||
|
Net current period other comprehensive income (loss)
|
33
|
|
2,187
|
|
(285
|
)
|
1,935
|
|
|||||||
|
Balance as of December 31, 2016
|
$
|
(31
|
)
|
$
|
2,230
|
|
$
|
(261
|
)
|
$
|
1,938
|
|
|||
|
Other comprehensive income (loss) before reclassifications
|
(115
|
)
|
(10,692
|
)
|
3,062
|
|
(7,745
|
)
|
|||||||
|
Less: Amount reclassified from accumulated other comprehensive income
|
—
|
|
(7,624
|
)
|
2,668
|
|
(4,956
|
)
|
|||||||
|
Net current period other comprehensive income (loss)
|
(115
|
)
|
(3,068
|
)
|
394
|
|
(2,789
|
)
|
|||||||
|
Balance as of December 31, 2017
|
$
|
(146
|
)
|
$
|
(838
|
)
|
$
|
133
|
|
$
|
(851
|
)
|
|||
The following tables provide details about significant amounts reclassified out of each component of accumulated other comprehensive income for the years ended
December 31, 2017
,
2016
and
2015
:
|
Year Ended December 31,
|
||||||||||||||||||
|
Details about Accumulated Other Comprehensive Income Components
|
2017
|
2016
|
2015
|
|||||||||||||||
|
Amount Reclassified from AOCI
|
Affected Line Item in the Statements of Operations
|
Amount Reclassified from AOCI
|
Affected Line Item in the Statements of Operations
|
Amount Reclassified from AOCI
|
Affected Line Item in the Statements of Operations
|
|||||||||||||
|
(In thousands)
|
||||||||||||||||||
|
Gains (losses) on cash flow hedge:
|
||||||||||||||||||
|
Foreign currency forward contracts
|
$
|
(8,693
|
)
|
Net revenue
|
$
|
1,100
|
|
Net revenue
|
$
|
462
|
|
Net revenue
|
||||||
|
Foreign currency forward contracts
|
18
|
|
Cost of revenue
|
(6
|
)
|
Cost of revenue
|
6
|
|
Cost of revenue
|
|||||||||
|
Foreign currency forward contracts
|
1,051
|
|
Operating expenses
|
(274
|
)
|
Operating expenses
|
(15
|
)
|
Operating expenses
|
|||||||||
|
(7,624
|
)
|
Total before tax
|
820
|
|
Total before tax
|
453
|
|
Total before tax
|
||||||||||
|
2,668
|
|
Tax impact
|
(287
|
)
|
Tax impact
|
—
|
|
Tax impact
(1)
|
||||||||||
|
$
|
(4,956
|
)
|
Total, net of tax
|
$
|
533
|
|
Total, net of tax
|
$
|
453
|
|
Total, net of tax
|
|||||||
_________________________
|
(1)
|
Under the Company's 2015 tax structure, all hedging gains and losses from derivative contracts were ultimately borne by a legal entity in a jurisdiction with no income tax.
|
93
2003 Stock Plan
In April 2003, the Company adopted the 2003 Stock Plan (the “2003 Plan”). The 2003 Plan provided for the granting of stock options to employees and consultants of the Company. During the second fiscal quarter of 2013, the Company's 2003 Stock Plan expired. No further equity awards can be granted under the 2003 Plan. Outstanding awards under the 2003 Stock Plan remain subject to the terms and conditions of the 2003 plan.
2006 Long Term Incentive Plan
In April 2006, the Company adopted the 2006 Long Term Incentive Plan (the “2006 Plan”). The 2006 Plan provides for the granting of stock options, stock appreciation rights, restricted stock, performance awards and other stock awards, to eligible directors, employees and consultants of the Company. The Company's 2006 Plan expired on
April 13, 2016
by its terms. No further equity awards can be granted under the 2006 Plan. Outstanding awards under the 2006 Stock Plan remain subject to the terms and conditions of the 2006 plan.
2016 Equity Incentive Plan
In April 2016, the Company's Board of Directors adopted the 2016 Equity Incentive Plan (the "2016 Plan") which was approved by the Company's stockholders at the 2016 Annual Meeting of Stockholders on June 3, 2016. The 2016 Plan provides for the granting of stock options, stock appreciation rights, restricted stock, restricted stock units, performance shares and performance units to eligible directors, employees and consultants of the Company. Award vesting periods for this plan are generally
four years
. The maximum aggregate number of shares that may be issued under the 2016 Plan is
2.5 million
Shares, plus (i) any shares that were available for grant under the Company’s 2006 Plan as of immediately prior to the 2006 Plan's expiration by its terms, which was
699,827
shares, plus (ii) any shares granted under the 2006 Plan that expire, are forfeited to or repurchased by the Company. As of
December 31, 2017
, approximately
1.9 million
shares were reserved for future grants under the 2016 Plan.
Options granted under the 2016 Plan may be either incentive stock options or nonstatutory stock options. Incentive stock options (“ISO”) may be granted only to Company employees (including officers and directors who are also employees). Nonstatutory stock options (“NSO”) may be granted to Company employees, directors and consultants. Options may be granted for periods of up to ten years and at prices no less than the estimated fair value of the common stock on the date of grant. In addition, the exercise price of an ISO granted to a 10% shareholder shall not be less than
110%
of the estimated fair value of the shares on the date of grant. Options granted under the 2016 Plan generally vest over four years, the first tranche at the end of
twelve months
and the remaining shares underlying the option vesting monthly over the remaining
three years
.
Stock Appreciation Rights may be granted under the 2016 Plan subject to the terms specified by the plan administrator, provided that the term of any such right may not exceed
ten years
from the date of grant. The exercise price may not be less than the fair market value of the Company’s common stock on the date of grant.
Restricted stock awards may be granted under the 2016 Plan subject to the terms specified by the plan administrator. The period over which any restricted award may fully vest is generally no less than
three years
. Restricted stock awards are nonvested stock awards that may include grants of restricted stock or grants of restricted stock units. Restricted stock awards are rights to acquire or purchase shares that generally are subject to transferability and forfeitability restrictions for a specified period. Restricted stock has the same voting rights as other common stock and is considered to be currently issued and outstanding. Restricted stock units do not have the voting rights of common stock, and the shares underlying the restricted stock units are not considered issued and outstanding. The Company expenses the cost of the restricted stock awards, which is determined to be the fair market value of the shares at the date of grant, ratably over the period during which the restrictions lapse.
Performance units and performance shares are awards that result in a payment to a participant only if specified performance objectives or other vesting provisions are achieved during a specified performance period. Each performance unit will have an initial value established by the Administrator on or before the grant date. Each performance share will have an initial value equal to the fair market value of a share on the grant date. The plan administrator will determine the number of performance awards that will be granted and will establish the performance goals and other conditions for payment of such performance awards. The period of measuring the achievement of performance goals will be specified by an award agreement.
Other stock or cash awards may be granted under the 2016 Plan subject to the terms specified by the plan administrator.
94
Any shares subject to restricted stock, restricted stock units, performance units, or performance shares awarded under the 2016 Plan will be counted against the shares available for issuance under the 2016 Plan as one and fifty-eight hundredths (1.58) shares for every one share subject to such awards. Any shares of common stock subject to an award that is forfeited, settled in cash, expires or is otherwise settled without the issuance of shares shall again be available for awards under the 2016 Plan. Additionally, any shares that are tendered by a participant of the 2016 Plan or retained by the Company as full or partial payment to the Company for the purchase of an award or to satisfy tax withholding obligations in connection with an award shall no longer again be made available for issuance under the 2016 Plan.
Employee Stock Purchase Plan
The Company sponsors an Employee Stock Purchase Plan (the “ESPP”), pursuant to which eligible employees may contribute up to
10%
of compensation, subject to certain income limits, to purchase shares of the Company’s common stock. Prior to February 16, 2016, employees could purchase stock semi-annually at a price equal to
85%
of the fair market value on the purchase date. Beginning February 16, 2016, the terms of the plan include a look-back feature that enables employees to purchase stock semi-annually at a price equal to
85%
of the lesser of the fair market value at the beginning of the offering period or the purchase date. The duration of each offering period is generally six-months. In April 2016, the Company approved an amendment to the plan to increase the number of shares of common stock authorized for sale under the plan by
1.0 million
shares to a total of
2.0 million
shares. For the years ended
December 31, 2017
,
2016
, and
2015
, the Company recognized ESPP compensation expense of
$1.5 million
,
$1.3 million
and
$0.5 million
, respectively. Employees purchased
111,000
shares of common stock at an average exercise price of
$43.00
in fiscal
2017
. As of
December 31, 2017
,
0.9 million
shares were reserved for future issuance under the ESPP.
Option Activity
Stock option activity during the year ended
December 31, 2017
was as follows:
|
Number of
Shares
|
Weighted Average
Exercise Price Per
Share
|
Weighted
Average
Remaining
Contractual
Term
|
Aggregate
Intrinsic
Value
|
|||||||||
|
(In thousands)
|
(In dollars)
|
(In years)
|
(In thousands)
|
|||||||||
|
Outstanding as of December 31, 2016
|
1,884
|
|
$
|
31.14
|
|
|||||||
|
Granted
|
348
|
|
43.07
|
|
||||||||
|
Exercised
|
(352
|
)
|
27.23
|
|
||||||||
|
Expired
|
(1
|
)
|
31.70
|
|
||||||||
|
Outstanding as of December 31, 2017
|
1,879
|
|
$
|
34.08
|
|
6.13
|
$
|
46,346
|
|
|||
|
As of December 31, 2017
|
||||||||||||
|
Vested and expected to vest
|
1,879
|
|
$
|
34.08
|
|
6.13
|
$
|
46,346
|
|
|||
|
Exercisable Options
|
1,205
|
|
$
|
30.94
|
|
4.72
|
$
|
33,512
|
|
|||
The aggregate intrinsic values in the table above represent the total pre-tax intrinsic values (the difference between the Company’s closing stock price on the last trading day of
2017
and the exercise price, multiplied by the number of shares underlying the in-the-money options) that would have been received by the option holders had all option holders exercised their options on December 31,
2017
. This amount changes based on the fair market value of the Company’s stock. Total intrinsic value of options exercised for the year ended
December 31, 2017
,
2016
, and
2015
was
$7.7 million
,
$14.5 million
and
$11.4 million
, respectively.
The total fair value of options vested during the years ended
December 31, 2017
,
2016
, and
2015
was
$3.8 million
,
$4.2 million
and
$6.5 million
, respectively.
95
The following table summarizes significant ranges of outstanding and exercisable stock options as of
December 31, 2017
:
|
Options Outstanding
|
Options Exercisable
|
||||||||||||||
|
Range of Exercise Prices
|
Shares
Outstanding
|
Weighted-
Average
Remaining
Contractual
Life
|
Weighted-
Average
Exercise
Price Per
Share
|
Shares
Exercisable
|
Weighted-
Average
Exercise
Price Per
Share
|
||||||||||
|
(In thousands)
|
(In years)
|
(In dollars)
|
(In thousands)
|
(In dollars)
|
|||||||||||
|
$10.69 - $31.28
|
435
|
|
4.55
|
$
|
24.55
|
|
334
|
|
$
|
22.50
|
|
||||
|
$31.31 - $32.54
|
443
|
|
5.50
|
32.19
|
|
410
|
|
32.16
|
|
||||||
|
$32.55 - $39.53
|
651
|
|
5.84
|
36.93
|
|
459
|
|
35.93
|
|
||||||
|
$40.01 - $42.70
|
330
|
|
9.39
|
42.68
|
|
2
|
|
40.01
|
|
||||||
|
$49.20 - $49.20
|
20
|
|
9.80
|
49.20
|
|
—
|
|
—
|
|
||||||
|
$10.69 - $49.20
|
1,879
|
|
6.13
|
$
|
34.08
|
|
1,205
|
|
$
|
30.94
|
|
||||
RSU Activity
RSU activity during the year ended
December 31, 2017
was as follows:
|
Number of
Shares
|
Weighted Average
Grant Date Fair Value Per
Share
|
Weighted
Average
Remaining
Contractual
Term
|
Aggregate
Intrinsic Value |
|||||||||
|
(In thousands)
|
(In dollars)
|
(In years)
|
(In thousands)
|
|||||||||
|
Outstanding as of December 31, 2016
|
996
|
|
$
|
36.22
|
|
|||||||
|
Granted
|
618
|
|
49.45
|
|
||||||||
|
Vested
|
(412
|
)
|
35.46
|
|
||||||||
|
Cancelled
|
(72
|
)
|
44.16
|
|
||||||||
|
Outstanding as of December 31, 2017
|
1,130
|
|
$
|
43.22
|
|
1.43
|
$
|
66,390
|
|
|||
Total intrinsic value of RSUs, or the release date fair value of RSUs, vested during the years ended
December 31, 2017
,
2016
and
2015
was
$19.5 million
,
$15.4 million
and
$8.9 million
, respectively. The total fair value or RSUs, or the grant date fair value of RSUs, vested during the years ended
December 31, 2017
,
2016
and
2015
was
$14.6 million
,
$10.8 million
and
$8.8 million
, respectively.
Valuation and Expense Information
The Company measures stock-based compensation at the grant date based on the estimated fair value of the award. Estimated compensation cost relating to RSUs is based on the closing fair market value of the Company’s common stock on the date of grant. Prior to February 16, 2016, the fair value of ESPP is based on the
15%
discount at purchase, since the price of the shares is determined at the purchase date. The fair value of options granted and the shares offered under the ESPP commencing February 16, 2016 is estimated on the date of grant using a Black-Scholes-Merton option valuation model that uses the assumptions noted in the following table. The estimated expected term of options granted is derived from historical data on employee exercise and post-vesting employment termination behavior. The risk free interest rate of options granted and the shares offered under the ESPP is based on the implied yield currently available on U.S. Treasury securities with a remaining term commensurate with the estimated expected term. Expected volatility of options granted and the shares offered under the ESPP is based on historical volatility over the most recent period commensurate with the estimated expected term.
96
The following table sets forth the weighted-average assumptions used to estimate the fair value option grants during the years ended
December 31, 2017
,
2016
and
2015
and purchase rights granted under the ESPP commencing February 16, 2016 during the years ended December 31,
2017
and
2016
:
|
|
Year Ended December 31,
|
|||||||||||||||
|
|
2017
|
2016
|
2015
|
2017
|
2016
|
2015
|
||||||||||
|
Stock Options
|
ESPP
|
|||||||||||||||
|
Expected life (in years)
|
4.4
|
|
4.4
|
|
4.5
|
|
0.5
|
|
0.5
|
|
N/A
|
|||||
|
Risk-free interest rate
|
1.66
|
%
|
1.28
|
%
|
1.44
|
%
|
0.93
|
%
|
0.43
|
%
|
N/A
|
|||||
|
Expected volatility
|
31.6
|
%
|
35.4
|
%
|
39.3
|
%
|
29.7
|
%
|
38.3
|
%
|
N/A
|
|||||
|
Dividend yield
|
—
|
|
—
|
|
—
|
|
—
|
|
—
|
|
N/A
|
|||||
The weighted average estimated fair value of options granted during the years ended
December 31, 2017
,
2016
and
2015
was
$12.35
,
$12.28
and
$10.83
, respectively.
The following table sets forth stock-based compensation expense resulting from stock options, restricted stock awards, and the Employee Stock Purchase Plan included in the Company’s consolidated statements of operations:
|
Year Ended December 31,
|
|||||||||||
|
2017
|
2016
|
2015
|
|||||||||
|
(In thousands)
|
|||||||||||
|
Cost of revenue
|
$
|
2,005
|
|
$
|
1,740
|
|
$
|
1,566
|
|
||
|
Research and development
|
4,927
|
|
4,075
|
|
3,451
|
|
|||||
|
Sales and marketing
|
5,959
|
|
5,065
|
|
5,022
|
|
|||||
|
General and administrative
|
9,256
|
|
8,069
|
|
6,786
|
|
|||||
|
Total
|
$
|
22,147
|
|
$
|
18,949
|
|
$
|
16,825
|
|
||
The Company recognizes these compensation costs on a straight-line basis over the requisite service period of the award, which is generally the award vesting term of
four years
. Upon the adoption of ASU 2016-09, the Company elected to account for forfeitures as they occur, rather than estimating expected forfeitures. Refer to
recently adopted accounting pronouncement
under Note 1,
The Company and Summary of Significant Accounting Policies,
for a further discussion of the impact from the adoption of ASU 2016-09.
Total stock-based compensation cost capitalized in inventory was less than
$0.5 million
in the years ended
December 31, 2017
,
2016
and
2015
.
As of
December 31, 2017
,
$7.4 million
of unrecognized compensation cost related to stock options is expected to be recognized over a weighted-average period of
2.6
years. As of
December 31, 2017
,
$37.2 million
of unrecognized compensation cost related to unvested RSUs is expected to be recognized over a weighted-average period of
2.5
years.
401(k) Plan
In April 2000, the Company adopted the NETGEAR 401(k) Plan to which employees may contribute up to
100%
of salary subject to the legal maximum. In the first fiscal quarter of 2012, the Company began matching
50%
of contributions for employees that remain active with the Company through the end of the fiscal year, up to a maximum of
$6,000
in employee contributions. During the years ended
December 31, 2017
,
2016
and
2015
the Company recognized
$1.0 million
,
$1.0 million
and
$0.9 million
, respectively, in expenses related to the 401(k) match.
97
Operating segments are components of an enterprise about which separate financial information is available and is regularly evaluated by management, namely the Chief Operating Decision Maker (“CODM”) of an organization, in order to determine operating and resource allocation decisions. By this definition, the Company has identified its CEO as the CODM.
In the first fiscal quarter of 2017, the Company's CODM requested changes to the information that he regularly reviews for purposes of allocating resources and assessing performance. The Company reorganized its operating segment structure, resulting in a change to its reportable segments. The former Service Provider segment was integrated into the current segments which are organized by product groups. Beginning with fiscal year 2017, the Company operates and reports in
three
segments: Arlo, Connected Home, and Small and Medium Business ("SMB"):
•
Arlo: Focused on intelligent internet-connected products for consumers and businesses that provide security and safety;
|
•
|
Connected Home: Focused on consumers and consists of high-performance, dependable and easy-to-use LTE and WiFi internet networking solutions; and
|
|
•
|
SMB: Focused on small and medium-sized businesses and consists of business networking, storage and security solutions that bring enterprise-class functionality to small and medium-sized businesses at an affordable price.
|
The Company believes that this structure reflects its current operational and financial management, and provides the best structure for the Company to focus on growth opportunities while maintaining financial discipline. Each segment contains leadership focused on the product development efforts, both from a product marketing and engineering standpoint, to service the unique needs of their customers.
The results of the reportable segments are derived directly from the Company’s management reporting system. The results are based on the Company’s method of internal reporting and are not necessarily in conformity with accounting principles generally accepted in the United States. Management measures the performance of each segment based on several metrics, including contribution income. Segment contribution income includes all product line segment revenues less the related cost of sales, research and development and sales and marketing costs. Contribution income is used, in part, to evaluate the performance of, and allocate resources to, each of the segments. Certain operating expenses are not allocated to segments because they are separately managed at the corporate level. These unallocated indirect costs include corporate costs, such as corporate research and development, corporate marketing expense and general and administrative costs, amortization of intangibles, stock-based compensation expense, restructuring and other charges, losses on inventory commitments due to restructuring, litigation reserves, net, interest income and other income (expense), net. The CODM does not evaluate operating segments using discrete asset information.
98
Financial information for each reportable segment and a reconciliation of segment contribution income to income before income taxes is as follows
:
|
|
Year Ended December 31,
|
||||||||||
|
|
2017
|
2016 *
|
2015 *
|
||||||||
|
(In thousands, except percentage data)
|
|||||||||||
|
Net revenue:
|
|||||||||||
|
Arlo
|
$
|
378,413
|
|
$
|
188,469
|
|
$
|
91,636
|
|
||
|
Connected Home
|
762,069
|
|
844,818
|
|
937,215
|
|
|||||
|
SMB
|
266,438
|
|
295,011
|
|
271,844
|
|
|||||
|
Total net revenue
|
$
|
1,406,920
|
|
$
|
1,328,298
|
|
$
|
1,300,695
|
|
||
|
Contribution income (loss):
|
|||||||||||
|
Arlo
|
$
|
29,591
|
|
$
|
(5,218
|
)
|
$
|
(126
|
)
|
||
|
Arlo contribution margin
|
7.8
|
%
|
(2.8
|
)%
|
(0.1
|
)%
|
|||||
|
Connected Home
|
101,993
|
|
152,560
|
|
121,745
|
|
|||||
|
Connected Home contribution margin
|
13.4
|
%
|
18.1
|
%
|
13.0
|
%
|
|||||
|
SMB
|
65,392
|
|
75,461
|
|
56,156
|
|
|||||
|
SMB contribution margin
|
24.5
|
%
|
25.6
|
%
|
20.7
|
%
|
|||||
|
Total segment contribution income
|
196,976
|
|
222,803
|
|
177,775
|
|
|||||
|
Corporate and unallocated costs
|
(75,382
|
)
|
(69,140
|
)
|
(54,501
|
)
|
|||||
|
Amortization of intangibles
(1)
|
(12,597
|
)
|
(16,733
|
)
|
(16,969
|
)
|
|||||
|
Stock-based compensation expense
|
(22,147
|
)
|
(18,949
|
)
|
(16,825
|
)
|
|||||
|
Restructuring and other charges
|
(97
|
)
|
(3,881
|
)
|
(6,398
|
)
|
|||||
|
Losses on inventory commitments due to restructuring
|
—
|
|
—
|
|
(407
|
)
|
|||||
|
Litigation reserves, net
|
(176
|
)
|
(73
|
)
|
2,682
|
|
|||||
|
Interest income
|
2,113
|
|
1,163
|
|
295
|
|
|||||
|
Other income (expense), net
|
2,024
|
|
(121
|
)
|
(88
|
)
|
|||||
|
Income before income taxes
|
$
|
90,714
|
|
$
|
115,069
|
|
$
|
85,564
|
|
||
_________________________
|
(1)
|
Amount excludes amortization expense related to patents within purchased intangibles in cost of revenue.
|
* Prior year financial information for each reportable segment has been recast to conform to the current reportable segment structure effective on January 1, 2017.
The following table shows net revenue from service provider customers within each of the reportable segments for the periods indicated:
|
|
Year Ended December 31,
|
||||||||||
|
|
2017
|
2016
|
2015
|
||||||||
|
(In thousands)
|
|||||||||||
|
Arlo
|
$
|
20,795
|
|
$
|
19,758
|
|
$
|
18,585
|
|
||
|
Connected Home
|
190,186
|
|
249,980
|
|
395,900
|
|
|||||
|
SMB
|
3,268
|
|
4,175
|
|
6,997
|
|
|||||
|
Total service provider net revenue
|
$
|
214,249
|
|
$
|
273,913
|
|
$
|
421,482
|
|
||
99
Operations by Geographic Area
The Company conducts business across three geographic regions: Americas, Europe, Middle-East and Africa (“EMEA”) and Asia Pacific ("APAC"). Net revenue consists of gross product shipments and service revenue, less allowances for estimated sales returns for stock rotation and warranty, price protection, end-user customer rebates and other channel sales incentives deemed to be a reduction of net revenue per the authoritative guidance for revenue recognition, and net changes in deferred revenue. For reporting purposes revenue is attributed to each geographic region based on the location of the customer.
The following table shows net revenue by geography for the years ended
December 31, 2017
,
2016
and
2015
:
|
|
Year Ended December 31,
|
||||||||||
|
|
2017
|
2016
|
2015
|
||||||||
|
(In thousands)
|
|||||||||||
|
United States (U.S.)
|
$
|
927,952
|
|
$
|
855,796
|
|
$
|
779,361
|
|
||
|
Americas (excluding U.S.)
|
30,112
|
|
27,852
|
|
18,385
|
|
|||||
|
EMEA
|
253,885
|
|
245,405
|
|
321,714
|
|
|||||
|
APAC
|
194,971
|
|
199,245
|
|
181,235
|
|
|||||
|
Total net revenue
|
$
|
1,406,920
|
|
$
|
1,328,298
|
|
$
|
1,300,695
|
|
||
Long-lived assets by Geographic Area
Long-lived assets include purchased intangibles, goodwill and property and equipment. The Company's property and equipment are located in the following geographic locations:
|
As of
|
|||||||||||
|
December 31, 2017
|
December 31, 2016
|
December 31, 2015
|
|||||||||
|
(In thousands)
|
|||||||||||
|
United States
|
$
|
9,216
|
|
$
|
9,542
|
|
$
|
9,832
|
|
||
|
Canada
|
1,807
|
|
2,745
|
|
3,586
|
|
|||||
|
EMEA
|
141
|
|
210
|
|
468
|
|
|||||
|
China
|
6,803
|
|
5,219
|
|
6,562
|
|
|||||
|
APAC (excluding China)
|
2,693
|
|
1,757
|
|
1,936
|
|
|||||
|
Total property and equipment, net
|
$
|
20,660
|
|
$
|
19,473
|
|
$
|
22,384
|
|
||
Significant Customers
Two customers, primarily within the Arlo and Connected Home segments, accounted for
19%
and
14%
of net revenue in the year ended December 31,
2017
, respectively. Two customers, primarily within the Arlo and Connected Home segments, accounted for
17%
and
12%
of net revenue in the year ended December 31, 2016, respectively. One customer, primarily within the Arlo and Connected Home segments, accounted for
15%
of net revenue in the year ended December 31, 2015.
The Company determines the fair values of its financial instruments based on a fair value hierarchy, which requires an entity to maximize the use of observable inputs and minimize the use of unobservable inputs when measuring fair value. The classification of a financial asset or liability within the hierarchy is based upon the lowest level input that is significant to the fair value measurement. The fair value hierarchy prioritizes the inputs into three levels that may be used to measure fair value:
Level 1: Unadjusted quoted prices in active markets that are accessible at the measurement date for identical, unrestricted assets or liabilities;
100
Level 2: Quoted prices in markets that are not active, or inputs which are observable, either directly or indirectly, for substantially the full term of the asset or liability;
Level 3: Prices or valuation techniques that require inputs that are both significant to the fair value measurement and unobservable (i.e., supported by little or no market activity).
The following tables summarize assets and liabilities measured at fair value on a recurring basis as of
December 31, 2017
and
2016
:
|
|
As of December 31, 2017
|
||||||||||||||
|
|
Total
|
Quoted market
prices in active
markets
(Level 1)
|
Significant
other
observable
inputs
(Level 2)
|
Significant
unobservable
inputs
(Level 3)
|
|||||||||||
|
(In thousands)
|
|||||||||||||||
|
Assets:
|
|||||||||||||||
|
Cash equivalents: money-market funds
|
$
|
12,606
|
|
$
|
12,606
|
|
$
|
—
|
|
$
|
—
|
|
|||
|
Available-for-sale securities: U.S. treasuries
(1)
|
124,670
|
|
124,670
|
|
—
|
|
—
|
|
|||||||
|
Available-for-sale securities: certificates of deposit
(1)
|
162
|
|
162
|
|
—
|
|
—
|
|
|||||||
|
Trading securities: mutual funds
(1)
|
2,094
|
|
2,094
|
|
—
|
|
—
|
|
|||||||
|
Foreign currency forward contracts
(2)
|
1,799
|
|
—
|
|
1,799
|
|
—
|
|
|||||||
|
Total assets measured at fair value
|
$
|
141,331
|
|
$
|
139,532
|
|
$
|
1,799
|
|
$
|
—
|
|
|||
|
Liabilities:
|
|||||||||||||||
|
Foreign currency forward contracts
(3)
|
$
|
8,192
|
|
$
|
—
|
|
$
|
8,192
|
|
$
|
—
|
|
|||
|
Total liabilities measured at fair value
|
$
|
8,192
|
|
$
|
—
|
|
$
|
8,192
|
|
$
|
—
|
|
|||
_________________________
|
(1)
|
Included in short-term investments on the Company's consolidated balance sheets.
|
|
(2)
|
Included in prepaid expenses and other current assets on the Company's consolidated balance sheets.
|
|
(3)
|
Included in other accrued liabilities on the Company's consolidated balance sheets.
|
|
|
As of December 31, 2016
|
||||||||||||||
|
|
Total
|
Quoted market
prices in active
markets
(Level 1)
|
Significant
other
observable
inputs
(Level 2)
|
Significant
unobservable
inputs
(Level 3)
|
|||||||||||
|
(In thousands)
|
|||||||||||||||
|
Assets:
|
|||||||||||||||
|
Cash equivalents: money-market funds
|
$
|
17,027
|
|
$
|
17,027
|
|
$
|
—
|
|
$
|
—
|
|
|||
|
Available-for-sale securities: U.S. treasuries
(1)
|
123,838
|
|
123,838
|
|
—
|
|
—
|
|
|||||||
|
Available-for-sale securities: certificates of deposit
(1)
|
148
|
|
148
|
|
—
|
|
—
|
|
|||||||
|
Trading securities: mutual funds
(1)
|
1,528
|
|
1,528
|
|
—
|
|
—
|
|
|||||||
|
Foreign currency forward contracts
(2)
|
8,763
|
|
—
|
|
8,763
|
|
—
|
|
|||||||
|
Total assets measured at fair value
|
$
|
151,304
|
|
$
|
142,541
|
|
$
|
8,763
|
|
$
|
—
|
|
|||
|
Liabilities:
|
|||||||||||||||
|
Foreign currency forward contracts
(3)
|
$
|
1,705
|
|
$
|
—
|
|
$
|
1,705
|
|
$
|
—
|
|
|||
|
Total liabilities measured at fair value
|
$
|
1,705
|
|
$
|
—
|
|
$
|
1,705
|
|
$
|
—
|
|
|||
_________________________
|
(1)
|
Included in short-term investments on the Company's consolidated balance sheets.
|
|
(2)
|
Included in prepaid expenses and other current assets on the Company's consolidated balance sheets.
|
|
(3)
|
Included in other accrued liabilities on the Company's consolidated balance sheets.
|
101
The Company's investments in cash equivalents and available-for-sale securities are classified within Level 1 of the fair value hierarchy because they are valued based on quoted market prices in active markets. The Company enters into foreign currency forward contracts with only those counterparties that have long-term credit ratings of A-/A3 or higher. The Company's foreign currency forward contracts are classified within Level 2 of the fair value hierarchy as they are valued using pricing models that take into account the contract terms as well as currency rates and counterparty credit rates. The Company verifies the reasonableness of these pricing models using observable market data for related inputs into such models. Additionally, the Company includes an adjustment for non-performance risk in the recognized measure of fair value of derivative instruments. As of
December 31, 2017
and
2016
, the adjustment for non-performance risk did not have a material impact on the fair value of the Company's foreign currency forward contracts. The carrying value of non-financial assets and liabilities measured at fair value in the financial statements on a recurring basis, including accounts receivable and accounts payable, approximate fair value due to their short maturities.
The Company accounts for its restructuring plans under the authoritative guidance for exit or disposal activities. The Company presents expenses related to restructuring and other charges as a separate line item in the consolidated statements of operations. Accrued restructuring and other charges are classified within other accrued liabilities in the consolidated balance sheets.
No significant restructuring and other charges were recognized in fiscal 2017 and the last two quarters of fiscal 2016. Restructuring and other charges recognized in the second fiscal quarter of 2016 related primarily to severance as headcount reductions occurred within the former commercial segment. The headcount reductions were implemented in line with channel shift and changing buying behaviors being experienced for the former commercial business unit products. Restructuring and other charges recognized in the first fiscal quarter of 2016, and the first and second fiscal quarter of 2015 respectively related to actions to resize the former service provider segment and supporting functions. The actions were taken to match the reduced revenue outlook and to concentrate resources on LTE Advanced and long-term profitable accounts. Charges incurred in these periods primarily related to severance, other one-time termination benefits and other associated costs. Amounts attributable to lease contract termination charges will be paid over the remaining lease term until
January 2022
.
The following table provides a summary of accrued restructuring and other charges activity for the years ended
December 31, 2017
,
2016
and
2015
:
|
Employee termination charges
|
Lease contract termination and other charges
|
Total
|
|||||||||
|
(In thousands)
|
|||||||||||
|
Balance as of December 31, 2014
|
$
|
316
|
|
$
|
—
|
|
$
|
316
|
|
||
|
Additions
(1)
|
4,689
|
|
1,257
|
|
5,946
|
|
|||||
|
Cash payments
|
(4,992
|
)
|
(4
|
)
|
(4,996
|
)
|
|||||
|
Balance as of December 31, 2015
|
13
|
|
1,253
|
|
1,266
|
|
|||||
|
Additions
(1)
|
3,128
|
|
629
|
|
3,757
|
|
|||||
|
Cash payments
|
(2,941
|
)
|
(480
|
)
|
(3,421
|
)
|
|||||
|
Adjustments
|
(194
|
)
|
—
|
|
(194
|
)
|
|||||
|
Balance as of December 31, 2016
|
6
|
|
1,402
|
|
1,408
|
|
|||||
|
Additions
|
—
|
|
97
|
|
97
|
|
|||||
|
Cash payments
|
—
|
|
(370
|
)
|
(370
|
)
|
|||||
|
Balance as of December 31, 2017
|
$
|
6
|
|
$
|
1,129
|
|
$
|
1,135
|
|
||
_________________________
|
(1)
|
Total restructuring and other charges recognized in the Company's consolidated statements of operations for the years ended December 31, 2016 and 2015 included non-cash charges and adjustments, net of
$0.3 million
and
$0.5 million
, respectively. These amounts have been excluded from the table above.
|
102
On February 6, 2018, the Company announced that its Board of Directors has unanimously approved the pursuit of a separation of its Arlo business from NETGEAR. The separation is expected to be effected through an initial public offering (“IPO”) of newly issued shares of the common stock of Arlo Technologies, Inc. (“Arlo”), which will hold the Arlo business. The Company expects Arlo to issue less than 20% of its common stock in the IPO, which is expected to be completed in the second half of fiscal 2018, with NETGEAR to retain the remaining interest. The Company currently intends that, following the IPO, it will distribute the shares of Arlo common stock then held by NETGEAR to NETGEAR’s stockholders in a manner generally intended to qualify as tax-free to NETGEAR’s stockholders for U.S. federal income tax purposes. The Company also announced that it expects Matthew McRae to serve as Arlo’s Chief Executive Officer upon the completion of the IPO.
The separation of the Arlo business, including the IPO and distribution, will be subject to market, tax and legal considerations, final approval by the Company’s Board of Directors and other customary requirements. Refer to Item 1A, Risk Factors of Part I of this Annual Report on Form 10-K for various risks and uncertainties associated with the planned separation.
103
QUARTERLY FINANCIAL DATA
(In thousands, except per share amounts)
(Unaudited)
The following table presents unaudited quarterly financial information for each of the Company’s last eight quarters. This information has been derived from the Company’s unaudited financial statements and has been prepared on the same basis as the audited consolidated financial statements appearing elsewhere in this Annual Report on Form 10-K. In the opinion of management, all necessary adjustments, consisting only of normal recurring adjustments, have been included to state fairly the quarterly results.
|
December 31,
2017 |
October 1,
2017 |
July 2,
2017 |
April 2,
2017 |
|||||||||
|
Net revenue
|
$
|
397,057
|
|
$
|
355,483
|
|
$
|
330,723
|
|
$
|
323,657
|
|
|
Gross profit
|
$
|
104,079
|
|
$
|
103,095
|
|
$
|
91,936
|
|
$
|
96,932
|
|
|
Provision for income taxes
|
$
|
52,600
|
|
$
|
5,767
|
|
$
|
5,376
|
|
$
|
7,535
|
|
|
Net income (loss)
|
$
|
(31,934
|
)
|
$
|
20,794
|
|
$
|
14,582
|
|
$
|
15,994
|
|
|
Net income (loss) per share—basic
|
$
|
(1.02
|
)
|
$
|
0.66
|
|
$
|
0.45
|
|
$
|
0.49
|
|
|
Net income (loss) per share—diluted
|
$
|
(1.02
|
)
|
$
|
0.64
|
|
$
|
0.44
|
|
$
|
0.47
|
|
|
December 31,
2016 |
October 2,
2016 |
July 3,
2016 |
April 3,
2016 |
|||||||||
|
Net revenue
|
$
|
367,929
|
|
$
|
338,458
|
|
$
|
311,655
|
|
$
|
310,256
|
|
|
Gross profit
|
$
|
110,710
|
|
$
|
103,122
|
|
$
|
97,788
|
|
$
|
100,565
|
|
|
Provision for income taxes
|
$
|
11,754
|
|
$
|
9,144
|
|
$
|
9,427
|
|
$
|
8,893
|
|
|
Net income
|
$
|
22,109
|
|
$
|
21,119
|
|
$
|
16,034
|
|
$
|
16,589
|
|
|
Net income per share—basic
|
$
|
0.67
|
|
$
|
0.64
|
|
$
|
0.49
|
|
$
|
0.51
|
|
|
Net income per share—diluted
|
$
|
0.65
|
|
$
|
0.62
|
|
$
|
0.48
|
|
$
|
0.50
|
|
104
|
Item 9.
|
Changes in and Disagreements With Accountants on Accounting and Financial Disclosure
|
None.
|
Item 9A.
|
Controls and Procedures
|
Management’s Report on Internal Control Over Financial Reporting
Our management is responsible for establishing and maintaining adequate internal control over financial reporting (as defined in Rule 13a-15(f) under the Exchange Act). Because of its inherent limitations, internal control over financial reporting may not prevent or detect misstatements. Also, projections of any evaluation of effectiveness to future periods are subject to the risk that controls may become inadequate because of changes in conditions, or that the degree of compliance with the policies or procedures may deteriorate.
Our management, including our Chief Executive Officer and Chief Financial Officer, conducted an evaluation of the effectiveness of our internal control over financial reporting as of
December 31, 2017
. In making this assessment, our management used the criteria established in Internal Control-Integrated Framework (2013), issued by The Committee of Sponsoring Organizations of the Treadway Commission (COSO). Based on management’s assessment using those criteria, our management concluded that our internal control over financial reporting was effective as of
December 31, 2017
. The effectiveness of our internal control over financial reporting as of
December 31, 2017
has been audited by PricewaterhouseCoopers LLP, an independent registered public accounting firm, as stated in their report which is included in this Annual Report on Form 10-K.
Changes in Internal Control Over Financial Reporting
Except for the implementation of certain internal controls related to the adoption of the new revenue recognition standard (Topic 606), there were no changes in our internal control over financial reporting that occurred during the
fourth
fiscal quarter of
2017
that has materially affected, or is reasonably likely to materially affect, our internal control over financial reporting. The company implemented new controls as part of its effort to adopt Topic 606. The adoption of Topic 606 required the implementation of new accounting processes which changed the company’s internal controls over revenue recognition and financial reporting. We implemented these internal controls to ensure we adequately evaluated our contracts and properly assessed the impact of the new revenue recognition standard on our financial statements to facilitate its adoption. The company has completed the design of these controls and they have been implemented as of January 1, 2018.
Evaluation of Disclosure Controls and Procedures
Based on an evaluation under the supervision and with the participation of our management (including our Chief Executive Officer and Chief Financial Officer), our Chief Executive Officer and Chief Financial Officer have concluded that our disclosure controls and procedures as defined in Rules 13a-15(e) and 15d-15(e) under the Exchange Act were effective as of the end of the period covered by this Annual Report on Form 10-K to ensure that information required to be disclosed by us in reports that we file or submit under the Exchange Act is (i) recorded, processed, summarized and reported within the time periods specified in the SEC’s rules and forms and (ii) accumulated and communicated to our management, including our Chief Executive Officer and Chief Financial Officer, as appropriate to allow timely decisions regarding required disclosure.
|
Item 9B.
|
Other Information
|
None.
105
Certain information required by Part III is incorporated herein by reference from our proxy statement related to our
2018
Annual Meeting of Stockholders, which we intend to file no later than 120 days after the end of the fiscal year covered by this Form 10-K.
|
Item 10.
|
Directors, Executive Officers and Corporate Governance
|
The information required by this Item concerning our directors, executive officers, standing committees and procedures by which stockholders may recommend nominees to our Board of Directors, is incorporated by reference to the sections of our Proxy Statement under the headings “Information Concerning the Nominees and Incumbent Nominees,” “Board and Committee Meetings,” “Audit Committee” and “Section 16(a) Beneficial Ownership Reporting Compliance,” and to the information contained in the section captioned “Executive Officers of the Registrant” included under Part I of this Annual Report on Form 10-K.
We have adopted a Code of Ethics that applies to our Chief Executive Officer and senior financial officers, as required by the SEC. The current version of our Code of Ethics can be found on our Internet site at http://www.netgear.com. Additional information required by this Item regarding our Code of Ethics is incorporated by reference to the information contained in the section captioned “Corporate Governance Policies and Practices” in our Proxy Statement.
We intend to satisfy the disclosure requirement under Item 5.05 of Form 8-K regarding an amendment to, or waiver from, a provision of our Code of Ethics by posting such information on our website at http://www.netgear.com within four business days following the date of such amendment or waiver.
|
Item 11.
|
Executive Compensation
|
The information required by this Item is incorporated by reference to the sections of our Proxy Statement under the headings “Compensation Discussion and Analysis,” “Executive Compensation,” “Director Compensation,” “Fiscal Year
2017
Director Compensation,” “Compensation Committee Interlocks and Insider Participation,” and “Report of the Compensation Committee of the Board of Directors.”
|
Item 12.
|
Security Ownership of Certain Beneficial Owners and Management and Related Stockholder Matters
|
The additional information required by this Item is incorporated by reference to the information contained in the section captioned “Equity Compensation Plan Information” in our Proxy Statement.
The additional information required by this Item is incorporated by reference to the information contained in the section captioned “Security Ownership of Certain Beneficial Owners and Management” in our Proxy Statement.
|
Item 13.
|
Certain Relationships and Related Transactions, and Director Independence
|
The information required by this Item is incorporated by reference to the information contained in the section captioned “Election of Directors” and “Related Party Transactions” in our Proxy Statement.
|
Item 14.
|
Principal Accounting Fees and Services
|
The information required by this Item related to audit fees and services is incorporated by reference to the information contained in the section captioned “Ratification of Appointment of Independent Registered Public Accounting Firm” appearing in our Proxy Statement.
106
|
Item 15.
|
Exhibits, Financial Statement Schedules
|
(a) The following documents are filed as part of this report:
(1) Financial Statements.
The following consolidated financial statements of NETGEAR, Inc. are filed as part of this Annual Report on Form 10-K in Item 8,
Financial Statements and Supplementary Data
.
|
Page
|
|
|
Report of Independent Registered Public Accounting Firm
|
|
|
Consolidated Balance Sheets as of December 31, 2017 and 2016
|
|
|
Consolidated Statements of Operations for the three years ended December 31, 2017, 2016 and 2015
|
|
|
Consolidated Statements of Comprehensive Income for the three years ended December 31, 2017, 2016 and 2015
|
|
|
Consolidated Statements of Stockholders’ Equity for the three years ended December 31, 2017, 2016 and 2015
|
|
|
Consolidated Statements of Cash Flows for the three years ended December 31, 2017, 2016 and 2015
|
|
|
Notes to Consolidated Financial Statements
|
|
|
Quarterly Financial Data (unaudited)
|
|
(2) Financial Statement Schedules.
Schedule II—Valuation and Qualifying Accounts
|
Balance at
Beginning
of Year
|
Additions
|
Deductions
|
Balance
at End of
Year
|
||||||||||||
|
(In thousands)
|
|||||||||||||||
|
Allowance for doubtful accounts:
|
|||||||||||||||
|
Year ended December 31, 2017
|
$
|
1,255
|
|
$
|
100
|
|
$
|
(98
|
)
|
$
|
1,257
|
|
|||
|
Year ended December 31, 2016
|
1,255
|
|
60
|
|
(60
|
)
|
1,255
|
|
|||||||
|
Year ended December 31, 2015
|
1,255
|
|
35
|
|
(35
|
)
|
1,255
|
|
|||||||
|
Allowance for sales returns and warranty:
|
|||||||||||||||
|
Year ended December 31, 2017
|
$
|
72,026
|
|
$
|
172,493
|
|
$
|
(148,506
|
)
|
$
|
96,013
|
|
|||
|
Year ended December 31, 2016
|
72,609
|
|
109,494
|
|
(110,077
|
)
|
72,026
|
|
|||||||
|
Year ended December 31, 2015
|
62,376
|
|
105,987
|
|
(95,754
|
)
|
72,609
|
|
|||||||
|
Allowance for price protection:
|
|||||||||||||||
|
Year ended December 31, 2017
|
$
|
4,480
|
|
$
|
7,764
|
|
$
|
(8,597
|
)
|
$
|
3,647
|
|
|||
|
Year ended December 31, 2016
|
2,125
|
|
12,239
|
|
(9,884
|
)
|
4,480
|
|
|||||||
|
Year ended December 31, 2015
|
1,806
|
|
7,467
|
|
(7,148
|
)
|
2,125
|
|
|||||||
All other schedules have been omitted because they are not required, not applicable, or the required information is otherwise included.
107
(3) Exhibits.
INDEX TO EXHIBITS
|
Incorporated by Reference
|
||||||||||
|
Exhibit Number
|
Exhibit Description
|
Form
|
Date
|
Number
|
Filed Herewith
|
|||||
|
10-K
|
2/26/2013
|
10.35
|
||||||||
|
10-Q
|
8/4/2017
|
3.1
|
||||||||
|
10-Q
|
8/4/2017
|
3.2
|
||||||||
|
S-1/A
|
7/14/2003
|
4.1
|
||||||||
|
S-1
|
4/10/2003
|
10.1
|
||||||||
|
10-K
|
2/26/2013
|
10.3
|
||||||||
|
S-8
|
6/3/2016
|
99.1
|
||||||||
|
S-8
|
6/3/2016
|
99.2
|
||||||||
|
S-8
|
6/6/2014
|
4.3
|
||||||||
|
8-K
|
4/5/2013
|
10.1
|
||||||||
|
DEF14A
|
4/16/2013
|
Appendix A
|
||||||||
|
S-1/A
|
4/21/2003
|
10.25
|
||||||||
|
S-1/A
|
4/21/2003
|
10.26
|
||||||||
|
S-1/A
|
4/21/2003
|
10.27
|
||||||||
|
8-K
|
9/27/2007
|
10.1
|
||||||||
|
10-Q
|
5/9/2008
|
10.1
|
||||||||
|
10-K
|
2/19/2016
|
10.11B
|
||||||||
|
S-1
|
4/10/2003
|
10.5
|
||||||||
|
10-K
|
3/4/2009
|
10.51
|
||||||||
|
S-1
|
4/10/2003
|
10.8
|
||||||||
|
10-K
|
3/4/2009
|
10.52
|
||||||||
|
S-1
|
4/10/2003
|
10.10
|
||||||||
|
10-K
|
3/4/2009
|
10.49
|
||||||||
|
8-K
|
11/22/2005
|
10.32
|
||||||||
|
10-K
|
3/4/2009
|
10.50
|
||||||||
|
8-K
|
9/21/2009
|
10.1
|
||||||||
|
10-Q
|
5/6/2014
|
10.1
|
||||||||
|
8-K
|
7/11/2013
|
10.1
|
||||||||
|
10-K
|
3/4/2009
|
10.54
|
||||||||
|
10-K
|
2/19/2016
|
10.21
|
||||||||
|
10-K
|
2/24/2017
|
10.19
|
||||||||
|
X
|
||||||||||
|
X
|
||||||||||
|
X
|
||||||||||
108
|
X
|
||||||||||
|
X
|
||||||||||
|
X
|
||||||||||
|
X
|
||||||||||
|
101.INS
|
XBRL Instance Document
|
X
|
||||||||
|
101.SCH
|
XBRL Taxonomy Extension Schema Document
|
X
|
||||||||
|
101.CAL
|
XBRL Taxonomy Extension Calculation Linkbase Document
|
X
|
||||||||
|
101.DEF
|
XBRL Taxonomy Extension Definition Linkbase Document
|
X
|
||||||||
|
101.LAB
|
XBRL Taxonomy Extension Label Linkbase Document
|
X
|
||||||||
|
101.PRE
|
XBRL Taxonomy Extension Presentation Linkbase Document
|
X
|
||||||||
|
#
|
Indicates management contract or compensatory plan or arrangement.
|
|||||||||
|
*
|
Confidential treatment has been granted as to certain portions of this Exhibit.
|
|||||||||
|
Item 16.
|
Form 10-K Summary
|
None.
109
SIGNATURES
Pursuant to the requirements of Section 13 or 15(d) of the Securities Exchange Act of 1934, the Registrant has duly caused this Annual Report to be signed on its behalf by the undersigned, thereunto duly authorized, in the City of San Jose, State of California, on the 16th day of February 2018.
|
NETGEAR, INC.
|
|
|
By: /s/ PATRICK C.S. LO
|
|
|
Patrick C.S. Lo
|
|
|
Chairman of the Board and Chief Executive Officer
|
|
110
POWER OF ATTORNEY
KNOW ALL PERSONS BY THESE PRESENTS, that each person whose signature appears below constitutes and appoints Patrick C.S. Lo and Christine M. Gorjanc, and each of them, his attorneys-in-fact, each with the power of substitution, for him in any and all capacities, to sign any and all amendments to this Report on Form 10-K and to file the same, with exhibits thereto and other documents in connection therewith, with the Securities and Exchange Commission, hereby ratifying and confirming all that each of said attorneys-in-fact, or his substitute or substitutes, may do or cause to be done by virtue hereof.
Pursuant to the requirements of the Securities Exchange Act of 1934, this report has been signed below by the following persons on behalf of the Registrant and in the capacities and on the dates indicated:
|
Signature
|
|
Title
|
|
Date
|
|
/S/ PATRICK C.S. LO
|
|
Chairman of the Board and Chief Executive Officer
|
|
February 16, 2018
|
|
Patrick C.S. Lo
|
(Principal Executive Officer)
|
|||
|
/S/ CHRISTINE M. GORJANC
|
|
Chief Financial Officer
|
|
February 16, 2018
|
|
Christine M. Gorjanc
|
(Principal Financial and Accounting Officer)
|
|||
|
/S/ JOCELYN CARTER-MILLER
|
|
Director
|
|
February 16, 2018
|
|
Jocelyn Carter-Miller
|
||||
|
/S/ RALPH E. FAISON
|
|
Director
|
|
February 16, 2018
|
|
Ralph E. Faison
|
||||
|
/S/ JEF GRAHAM
|
|
Director
|
|
February 16, 2018
|
|
Jef Graham
|
||||
|
/S/ GREGORY J. ROSSMANN
|
|
Director
|
|
February 16, 2018
|
|
Gregory J. Rossmann
|
||||
|
/S/ BARBARA V. SCHERER
|
|
Director
|
|
February 16, 2018
|
|
Barbara V. Scherer
|
||||
|
/S/ JULIE A. SHIMER
|
|
Director
|
|
February 16, 2018
|
|
Julie A. Shimer
|
||||
|
/S/ GRADY K. SUMMERS
|
Director
|
February 16, 2018
|
||
|
Grady K. Summers
|
||||
|
/S/ THOMAS H. WAECHTER
|
|
Director
|
|
February 16, 2018
|
|
Thomas H. Waechter
|
||||
111
TABLE OF CONTENTS
Part IItem 1. BusinessItem 1A. Risk FactorsItem 1B. Unresolved Staff CommentsItem 2. PropertiesItem 3. Legal ProceedingsItem 4. Mine Safety DisclosuresPart IIItem 5. Market For Registrant S Common Equity, Related Stockholder Matters and Issuer Purchases Of Equity SecuritiesItem 6. Selected Financial DataItem 7. Management S Discussion and Analysis Of Financial Condition and Results Of OperationsNote 14, Subsequent EventItem 7A. Quantitative and Qualitative Disclosures About Market RiskItem 8. Financial Statements and Supplementary DataNote 1. The Company and Summary Of Significant Accounting PoliciesNote 2. Business AcquisitionNote 3. Balance Sheet ComponentsNote 4. Derivative Financial InstrumentsNote 5. Net Income Per ShareNote 6. Other Income (expense), NetNote 7. Income TaxesNote 8. Commitments and ContingenciesNote 9. Stockholders EquityNote 10. Employee Benefit PlansNote 11. Segment InformationNote 12. Fair Value MeasurementsNote 13. Restructuring and Other ChargesNote 14. Subsequent EventItem 9. Changes in and Disagreements with Accountants on Accounting and Financial DisclosureItem 9A. Controls and ProceduresItem 9B. Other InformationPart IIIItem 10. Directors, Executive Officers and Corporate GovernanceItem 11. Executive CompensationItem 12. Security Ownership Of Certain Beneficial Owners and Management and Related Stockholder MattersItem 13. Certain Relationships and Related Transactions, and Director IndependenceItem 14. Principal Accounting Fees and ServicesPart IVItem 15. Exhibits, Financial Statement SchedulesItem 16. Form 10-k Summary