NU SKIN ENTERPRISES, INC.
10-Ks and 10-Qs
|
|
|
|
|
|
|
|
|
|
|
|
|
|
|
|
|
|
|
|
|
|
|
|
|
|
|
|
|
|
|
|
|
|
|
|
|
|
|
|
|
|
|
|
|
|
|
|
|
|
|
|
|
|
|
|
UNITED STATES
SECURITIES AND EXCHANGE COMMISSION
Washington, D.C. 20549
FORM 10-K
(Mark One)
| ☑ |
ANNUAL REPORT PURSUANT TO SECTION 13 OR 15(d) OF THE SECURITIES EXCHANGE ACT OF 1934
|
For the fiscal year ended December 31, 2016
or
| ☐ |
TRANSITION REPORT PURSUANT TO SECTION 13 OR 15(d) OF THE SECURITIES EXCHANGE ACT OF 1934
|
For the transition period from ________ to ________
Commission file number: 001-12421

|
NU SKIN ENTERPRISES, INC.
|
||||
|
(Exact name of registrant as specified in its charter)
|
||||
|
Delaware
|
87-0565309
|
|||
|
(State or other jurisdiction of incorporation or organization)
|
75 WEST CENTER STREET
PROVO, UTAH 84601
|
(IRS Employer Identification No.)
|
||
|
(Address of principal executive offices, including zip code)
|
||||
Registrant's telephone number, including area code: (801) 345-1000
Securities registered pursuant to Section 12(b) of the Act:
|
Title of each class
|
Name of exchange on which registered
|
|
Class A Common Stock, $.001 par value
|
New York Stock Exchange
|
Securities registered pursuant to Section 12(g) of the Act: None
Indicate by check mark if the registrant is a well-known seasoned issuer, as defined in Rule 405 of the Securities Act. Yes
☑
No
☐
Indicate by check mark if the registrant is not required to file reports pursuant to Section 13 or Section 15(d) of the Act. Yes
☐
No
☑
Indicate by check mark whether the Registrant: (1) has filed all reports required to be filed by Section 13 or 15(d) of the Securities Exchange Act of 1934 during the preceding 12 months (or for such shorter period that the Registrant was required to file such reports), and (2) has been subject to such filing requirements for the past 90 days. Yes
☑
No
☐
Indicate by check mark whether the Registrant has submitted electronically and posted on its corporate Website, if any, every Interactive Data File required to be submitted and posted pursuant to Rule 405 of Regulation S-T (§232.405 of this chapter) during the preceding 12 months (or for such shorter period that the Registrant was required to submit and post such files). Yes
☑
No
☐
Indicate by check mark if disclosure of delinquent filers pursuant to Item 405 of Regulation S-K (§229.405 of this chapter) is not contained herein, and will not be contained, to the best of the Registrant's knowledge, in definitive proxy or information statements incorporated by reference in Part III of this Form 10-K or any amendment to this Form 10-K.
☑
Indicate by check mark whether the Registrant is a large accelerated filer, an accelerated filer, a non-accelerated filer, or a smaller reporting company. See the definitions of "large accelerated filer," "accelerated filer," and "smaller reporting company" in Rule 12b-2 of the Exchange Act.
|
Large accelerated filer
☑
|
Accelerated filer
☐
|
|
|
Non-accelerated filer
☐
(Do not check if a smaller reporting company)
|
Smaller Reporting Company
☐
|
Indicate by check mark whether the Registrant is a shell company (as defined in Rule 12b-2 of the Act). Yes
☐
No
☑
Based on the closing sales price of the Class A common stock on the New York Stock Exchange on June 30, 2016, the last business day of the Registrant's second fiscal quarter, the aggregate market value of the voting stock held by non-affiliates of the Registrant was approximately $2.51 billion. All executive officers and directors of the Registrant, and all stockholders holding more than 10% of the Registrant's outstanding voting stock other than institutional investors, such as registered investment companies, eligible to file beneficial ownership reports on Schedule 13G, have been deemed, solely for the purpose of the foregoing calculation, to be "affiliates" of the Registrant.
As of January 31, 2017, 52,569,172 shares of the Registrant's Class A common stock, $.001 par value per share, and no shares of the Registrant's Class B common stock, $.001 par value per share, were outstanding.
Documents incorporated by reference
. Portions of the Registrant's Definitive Proxy Statement for the Registrant's 2017 Annual Meeting of Stockholders are incorporated by reference in Part III of this report. The Definitive Proxy Statement or an amendment to this Form 10-K will be filed with the Securities and Exchange Commission within 120 days after the Registrant's fiscal year end.
TABLE OF CONTENTS
|
PART I
|
-1-
|
||
|
ITEM 1.
|
-1-
|
||
|
-2-
|
|||
|
-5-
|
|||
|
-9-
|
|||
|
-9-
|
|||
|
-17-
|
|||
|
-18-
|
|||
|
-18-
|
|||
|
-18-
|
|||
|
ITEM 1A.
|
-19-
|
||
|
ITEM 1B.
|
-42-
|
||
|
ITEM 2.
|
-42-
|
||
|
ITEM 3.
|
-42-
|
||
|
ITEM 4.
|
-43-
|
||
|
PART II
|
-43-
|
||
|
ITEM 5.
|
-43-
|
||
|
ITEM 6.
|
-46-
|
||
|
ITEM 7.
|
-47-
|
||
|
ITEM 7A.
|
-67-
|
||
|
ITEM 8.
|
-68-
|
||
|
ITEM 9.
|
-109-
|
||
|
ITEM 9A.
|
-109-
|
||
|
ITEM 9B.
|
-110-
|
||
|
PART III
|
-110-
|
||
|
ITEM 10.
|
-110-
|
||
|
ITEM 11.
|
-110-
|
||
|
ITEM 12.
|
-110-
|
||
|
ITEM 13.
|
-110-
|
||
|
ITEM 14.
|
-110-
|
||
|
PART IV
|
-110-
|
||
|
ITEM 15.
|
-110-
|
||
|
ITEM 16.
|
-115-
|
||
|
-116-
|
|||
-i-
FORWARD-LOOKING STATEMENTS
THIS ANNUAL REPORT ON FORM 10-K, IN PARTICULAR "ITEM 1. BUSINESS" AND "ITEM 7. MANAGEMENT'S DISCUSSION AND ANALYSIS OF FINANCIAL CONDITION AND RESULTS OF OPERATION," CONTAINS FORWARD-LOOKING STATEMENTS WITHIN THE MEANING OF SECTION 27A OF THE SECURITIES ACT OF 1933, AS AMENDED, AND SECTION 21E OF THE SECURITIES EXCHANGE ACT OF 1934, AS AMENDED, THAT REPRESENT OUR CURRENT EXPECTATIONS AND BELIEFS. ALL STATEMENTS OTHER THAN STATEMENTS OF HISTORICAL FACT ARE "FORWARD-LOOKING STATEMENTS" FOR PURPOSES OF FEDERAL AND STATE SECURITIES LAWS AND INCLUDE, BUT ARE NOT LIMITED TO, STATEMENTS OF MANAGEMENT'S EXPECTATIONS REGARDING OUR PERFORMANCE, INITIATIVES, STRATEGIES, PRODUCTS, PRODUCT INTRODUCTIONS AND OFFERINGS, FUTURE MANAGEMENT, GROWTH, OPPORTUNITIES AND RISKS; STATEMENTS OF PROJECTIONS REGARDING FUTURE SALES, EXPENSES, OPERATING RESULTS, TAXES AND DUTIES, CAPITAL EXPENDITURES, SOURCES AND USES OF CASH, FOREIGN CURRENCY FLUCTUATIONS OR DEVALUATIONS, AND OTHER FINANCIAL ITEMS; STATEMENTS OF MANAGEMENT'S EXPECTATIONS AND BELIEFS REGARDING OUR MARKETS; STATEMENTS REGARDING THE PAYMENT OF FUTURE DIVIDENDS AND STOCK REPURCHASES; STATEMENTS REGARDING THE OUTCOME OF LITIGATION AND OTHER LEGAL MATTERS; ACCOUNTING ESTIMATES AND ASSUMPTIONS; STATEMENTS OF BELIEF; AND STATEMENTS OF ASSUMPTIONS UNDERLYING ANY OF THE FOREGOING. IN SOME CASES, YOU CAN IDENTIFY THESE STATEMENTS BY FORWARD-LOOKING WORDS SUCH AS "BELIEVE," "EXPECT," "PROJECT," "ANTICIPATE," "ESTIMATE," "COMMIT," "INTEND," "PLAN," "TARGETS," "LIKELY," "WILL," "WOULD," "COULD," "MAY," "MIGHT," THE NEGATIVE OF THESE WORDS AND OTHER SIMILAR WORDS. WE UNDERTAKE NO OBLIGATION TO PUBLICLY UPDATE OR REVISE ANY FORWARD-LOOKING STATEMENT, WHETHER AS A RESULT OF NEW INFORMATION, FUTURE EVENTS OR OTHERWISE, EXCEPT AS REQUIRED BY LAW. WE CAUTION AND ADVISE READERS THAT THESE STATEMENTS ARE BASED ON ASSUMPTIONS THAT MAY NOT BE REALIZED AND INVOLVE RISKS AND UNCERTAINTIES THAT COULD CAUSE ACTUAL RESULTS TO DIFFER MATERIALLY FROM THE EXPECTATIONS AND BELIEFS CONTAINED HEREIN. FOR A SUMMARY OF THESE RISKS, SEE "ITEM 1A – RISK FACTORS."
In this Annual Report on Form 10-K, references to "dollars" and "$" are to United States dollars.
Nu Skin, Pharmanex and ageLOC are our trademarks. The italicized product names used in this Annual Report on Form 10-K are product names and also, in certain cases, our trademarks.
PART I
Founded more than 30 years ago, Nu Skin Enterprises, Inc. develops and distributes innovative consumer products, offering a comprehensive line of premium-quality beauty and wellness solutions in approximately 50 markets worldwide. In 2016, our revenue of $2.2 billion was primarily generated by our two category brands: our beauty and personal care category brand known as Nu Skin and our nutritional products category brand, Pharmanex. We have also leveraged our scientific expertise in the area of anti-aging to develop our ageLOC brand that features innovative products in both of these categories.
We operate in the direct selling channel, primarily utilizing person-to-person marketing to promote and sell our products.
About 90% of our revenue came from outside of the United States in 2016, with approximately 28% of our revenue coming from Mainland China, our largest revenue market. Given the size of our international operations, our results, as reported in U.S. dollars, are often impacted by foreign currency fluctuations. In addition, our results can be impacted by global economic, political, demographic and business trends and conditions.
Our operations are subject to various laws and regulations globally, particularly with respect to our product categories and our distribution channel. See "Risk Factors" for a more detailed description of the risks associated with our business.
-1-
We offer a branded, differentiated product platform. We believe our innovative approach to product development and distribution provides us with a competitive advantage in anti-aging and direct selling. We develop and distribute innovative, premium-quality anti-aging personal care products and nutritional supplements under our Nu Skin and Pharmanex category brands, respectively. Over the last several years, we have introduced new Nu Skin personal care products and Pharmanex nutritional supplements under our ageLOC anti-aging brand. Our research and product development is focused on understanding the sources of aging, including the influence of certain ingredients on gene expression, and utilizing that knowledge in our development of anti-aging products. We believe that our acquired and licensed technologies, research collaborations and in-house research expertise enable us to introduce innovative, proprietary products. We source and produce nearly all our proprietary products through trusted third parties, except in Mainland China, where we manufacture our own products.
During 2015 and 2016, and continuing into 2017, we launched our
ageLOC Youth
nutritional supplement and our
ageLOC Me
customized skin care system. Beginning in the second half of 2017 and continuing into 2018, we plan to launch
ageLOC LumiSpa
, which is a treatment and cleansing device that promotes smooth and healthy skin.
Product Categories
We have two primary product categories, each operating under its own brand. We market our premium-quality personal care products under the Nu Skin category brand and our science-based nutritional supplements under the Pharmanex category brand. Over the last several years, we have introduced new Pharmanex nutritional supplements and Nu Skin personal care products under our ageLOC anti-aging brand.
Presented below are the U.S. dollar amounts and associated revenue percentages from the sale of Nu Skin and Pharmanex products for the years ended December 31, 2014, 2015, and 2016. This table should be read in conjunction with the information presented in the section entitled "Management's Discussion and Analysis of Financial Condition and Results of Operations," which discusses the factors impacting revenue trends and the costs associated with generating the aggregate revenue presented.
Revenue by Product Category
(U.S. dollars in millions)
(1)
|
Year Ended December 31,
|
||||||||||||||||||||||||
|
Product Category
|
2014
|
2015
|
2016
|
|||||||||||||||||||||
|
Nu Skin
|
$
|
1,562.6
|
60.8
|
%
|
$
|
1,363.5
|
60.7
|
%
|
$
|
1,308.2
|
59.3
|
%
|
||||||||||||
|
Pharmanex
|
1,000.3
|
38.9
|
877.9
|
39.1
|
892.7
|
40.4
|
||||||||||||||||||
|
Other
(2)
|
6.6
|
0.3
|
5.6
|
0.2
|
6.9
|
0.3
|
||||||||||||||||||
|
$
|
2,569.5
|
100.0
|
%
|
$
|
2,247.0
|
100.0
|
%
|
$
|
2,207.8
|
100.0
|
%
|
|||||||||||||
| (1) |
In 2016, 91% of our sales were transacted in foreign currencies that were then converted to U.S. dollars for financial reporting purposes at weighted-average exchange rates. Foreign currency fluctuations negatively impacted reported revenue by approximately 2% in 2016 compared to 2015 and 8% in 2015 compared to 2014.
|
| (2) |
We currently offer a limited number of other products and services, including household products and technology services.
|
-2-
Nu Skin.
Our strategy for the Nu Skin category brand is to leverage our distribution channel to strengthen Nu Skin's position as an innovative leader in the anti-aging personal care market. We are committed to continuously improving and evolving our product formulations to develop and incorporate innovative and proven ingredients. Our primary categories in this product line are core skin care systems and targeted treatment products that address specific skin needs. We formulate these products with ingredients that are scientifically proven to provide visible results. Products in this category include our
ageLOC Me
customized skin care system,
ageLOC Spa
systems and
ageLOC Transformation
anti-aging skin care system. Our ageLOC skin care products accounted for 29% of our total revenue and 49% of Nu Skin product category sales in 2016. We also offer our Epoch® products, which feature botanical ingredients derived from renewable sources, and a number of other cosmetic, personal care and hair care products.
Pharmanex.
Our strategy for the Pharmanex category brand is to continue to introduce innovative, substantiated anti-aging products based on research and development and quality manufacturing. Direct selling has proven to be an effective method of marketing our high-quality supplements because our sales force can personally educate consumers on the quality and benefits of our products, differentiating them from our competitors' offerings. This product line includes our
ageLOC Youth
nutritional supplement,
ageLOC TR90
weight management and body shaping system and
LifePak
nutritional supplements.
ageLOC Youth
was our largest nutritional product in terms of revenue in 2016, representing approximately 9% of our total revenue and approximately 23% of Pharmanex revenue. We also offer a number of other anti-aging nutritional solutions and weight management products.
Product Development
We are committed to developing and marketing innovative products. We have several products in development, including next-generation skin care products and nutritional supplements. Our research and product development is focused on understanding the sources of aging, including the influence of certain ingredients on gene expression, and utilizing that knowledge in product development.
Our research and product development activities include:
•
Internal research, product development and quality testing;
•
Joint research projects, collaborations and clinical studies;
•
Identification and assessment of technologies for potential licensing arrangements; and
•
Acquisition of technologies.
We maintain research and product development facilities in the United States and Mainland China. We also contract with third parties for clinical studies and collaborate on basic research projects with researchers from universities and other research institutions in the United States and Asia, whose staffs include scientists with basic research expertise in, among others, natural product chemistry, biochemistry, dermatology, pharmacology and clinical studies. Our expenses for
i
nternal research and development activities and joint research projects and collaborations were $18.9 million, $20.1 million and $24.3 million in 2014, 2015 and 2016, respectively.
-3-
We also work to identify and assess innovative technologies developed by third parties for potential licensing or supply arrangements. Because of the nature of our distribution channel, which allows us to provide a high level of product information on a person-to-person basis, we often have third parties who are interested in licensing innovative technologies to us to incorporate into our products and commercialize through our distribution channel. Licensing arrangements allow us to leverage the research activities of third parties that have resulted in demonstrated technologies, without all of the upfront costs and uncertainty associated with internal development. We have also invested in acquisitions to supplement our research capabilities and to acquire technologies, including our acquisition of Pharmanex in 1998; the license and acquisition of the technology underlying our
BioPhotonic Scanner
, a non-invasive tool that measures the level of carotenoid anti-oxidants in skin; and the acquisition of assets related to the genetic sources of aging from LifeGen Technologies, LLC. We incur expenses for royalties and amortization for previous technology-related acquisitions.
Intellectual Property
Our major trademarks are registered in the United States and in each country where we operate or have plans to operate, and we consider trademark protection to be very important to our business. Our major trademarks include Nu Skin®, our fountain logos, Pharmanex®, ageLOC®, LifePak®, Galvanic Spa®, TR90®, Epoch®, and ageLOC Me®. In addition, a number of our products, including our facial spas,
ageLOC Body Spa
,
LumiSpa
,
TR90
,
Tru Face Essence Ultra
and
Pharmanex BioPhotonic Scanner
, are based on proprietary technologies, some of which are patented or licensed from third parties. We also rely on patents and trade secret protection to protect our proprietary formulas and other proprietary information for our ageLOC products and other products.
Sourcing and Production
Nu Skin.
For markets other than Mainland China, we acquire ingredients and contract production of nearly all our Nu Skin personal care products from third-party suppliers and manufacturers. In Mainland China, we operate manufacturing facilities where we produce the majority of our personal care products sold in Mainland China, and some products exported to other markets.
We procure our
ageLOC Spa
systems and our
Tru Face Essence
products from single vendors who own or control the product formulations, ingredients, or other intellectual property rights associated with these products. We maintain good relationships with these vendors and do not anticipate termination of these relationships in the near term. However, to continue offering these product categories following any termination of our relationship with these vendors, we would need to develop and manufacture alternative products and source them from other vendors. We also acquire ingredients and products from two other suppliers that manufactured products representing more than 10% of our Nu Skin personal care purchases in 2016. We maintain a good relationship with these suppliers and do not anticipate that any party will terminate these relationships in the near term. In the event we become unable to source any products or ingredients from these suppliers, we believe that we would be able to produce or replace those products or substitute ingredients. We also have ongoing relationships with secondary and tertiary suppliers. Please refer to "Risk Factors—The loss of suppliers or shortages in ingredients could harm our business" for a discussion of risks and uncertainties associated with our supplier relationships and with the sourcing of raw materials and ingredients.
Pharmanex.
For markets other than Mainland China, we source most of our Pharmanex nutritional supplements from third-party suppliers and manufacturers. In Mainland China, we operate manufacturing facilities where we produce the majority of our nutritional supplements sold in Mainland China and herbal extracts used to produce other products sold globally.
-4-
Four of our suppliers manufactured products representing more than 10% of our Pharmanex nutritional supplement purchases in 2016. We maintain a good relationship with these suppliers and do not anticipate that any party will terminate these relationships in the near term. In the event we become unable to source any products or ingredients from these suppliers or from our other vendors, we believe that we would be able to produce or replace those products or substitute ingredients. We also have ongoing relationships with secondary and tertiary suppliers. Please refer to "Risk Factors—The loss of suppliers or shortages in ingredients could harm our business" for a discussion of certain risks and uncertainties associated with our supplier relationships, as well as with the sourcing of raw materials and ingredients.
We operate in the direct selling channel, primarily utilizing person-to-person marketing to promote and sell our products. These personal marketing efforts are supported by various mediums, including our marketing content, websites, events and social business solutions. We believe our distribution channel is an effective vehicle to distribute our products because:
| • |
our sales force can educate consumers about our products face-to-face, which we believe is more effective for differentiating our products than using traditional mass-media advertising;
|
| • |
our distribution channel allows for actual product demonstrations and trial by potential consumers;
|
| • |
our distribution channel allows our sales force to provide personal testimonials of product efficacy; and
|
| • |
as compared to other distribution methods, our sales force has the opportunity to provide consumers higher levels of service and encourage repeat purchases.
|
The manner in which we operate our distribution channel can vary from market to market based on regulatory and socio-economic conditions. While our person-to-person marketing philosophy remains consistent globally, various aspects of our business may differ from market-to-market, including product mix and pricing, compensation structure, access to distribution outlets or product stores, the manner of getting products to consumers, product claims, branding and product formulations. For example, in Mainland China we have implemented a distinct hybrid business model that utilizes retail stores, sales employees, independent direct sellers and independent marketers to market our products.
Given that members of our sales force are independent contractors in most markets, we do not control or direct their promotional efforts. We do, however, require that our sales force abide by policies and procedures that require them to act in an ethical and consumer-protective manner and in compliance with applicable laws and regulations. As a member of direct selling associations globally, Nu Skin promotes and abides by the industry's code of ethics and consumer protective standards to support and protect those who sell and purchase its products through the direct selling channel.
Consumers and Sales Network
Our distribution channel is composed of two primary groups: our consumer group—individuals who buy our products primarily for personal or family consumption; and our sales network—individuals who personally buy, use and resell products, and who also find new consumers, and recruit, train and develop new sellers. We strive to develop both our consumer group and our sales network. Our strategy for growing our consumer group is to offer high-quality, innovative products that provide demonstrable benefits. Our strategy for growing our sales network is to provide a meaningful business opportunity for those persons who demonstrate the ability to develop both a consumer group and a team of sellers, including through sales compensation and incentives.
-5-
To monitor the growth trends in our consumer group, we track the number of persons who purchased products directly from the company during the previous three months ("Customers," or previously referred to as "Actives"). We believe a significant majority of Customers purchase our products primarily for personal or family consumption but are not actively pursuing the opportunity we offer to generate income by marketing and reselling products. To monitor the growth in our sales network, we track the number of independent distributors, and sales employees and independent marketers in China, who achieve certain qualification requirements
("
Sales Leaders"). The following chart sets forth information concerning our Customers and Sales Leaders for the last three years.
Total Number of Customers and Sales Leaders by Region
|
As of December 31, 2014
|
As of December 31, 2015
|
As of December 31, 2016
|
||||||||||||||||||||||
|
Customers
|
Sales Leaders
|
Customers
|
Sales Leaders
|
Customers
|
Sales Leaders
|
|||||||||||||||||||
|
Greater China
|
393,000
|
24,537
|
223,000
|
27,064
|
248,000
|
26,625
|
||||||||||||||||||
|
North Asia
|
391,000
|
17,478
|
366,000
|
17,415
|
329,000
|
16,330
|
||||||||||||||||||
|
South Asia/Pacific
|
124,000
|
8,458
|
119,000
|
10,476
|
116,000
|
7,584
|
||||||||||||||||||
|
Americas
|
186,000
|
7,471
|
176,000
|
8,708
|
166,000
|
6,683
|
||||||||||||||||||
|
EMEA
|
114,000
|
4,065
|
110,000
|
3,912
|
129,000
|
4,405
|
||||||||||||||||||
|
Total
|
1,208,000
|
62,009
|
994,000
|
67,575
|
988,000
|
61,627
|
||||||||||||||||||
Global Direct Selling Channel
Outside of Mainland China, individuals can elect to participate in our business as follows:
| • |
"Distributor-Direct Consumers"—Individuals who purchase products directly from an independent distributor at a price established by the distributor.
|
| • |
"Company-Direct Consumers"—Individuals who purchase products directly from the company. These consumers are typically referred by a distributor. These consumers generally have the opportunity to
purchase
at a discount if they participate in our subscription and/or loyalty programs. These individuals do not have the right to build a Nu Skin business by reselling product or by recruiting others.
|
| • |
"Basic Distributors"—Distributors who purchase products at a discount for personal or family use or for resale to other consumers. These individuals are not eligible to receive compensation on a multi-level basis unless they elect to qualify as a Sales Leader under our global sales compensation plan. We consider these individuals to be part of our consumer group, as we believe a significant majority of these distributors are purchasing products for personal use and not actively recruiting others, and their purchasing levels are similar to our "Company-Direct Consumers."
|
| • |
"Sales Leaders and Qualifiers"—Distributors who have qualified or are trying to qualify as a Sales Leader. These are the distributors who have made an election to try to qualify as a Sales Leader and are actively recruiting consumers and distributors and building a sales network under our global sales compensation plan, and constitute our sales network.
|
-6-
To become a distributor in most of our markets, an individual signs a distributor agreement and receives a distributor portfolio, which is free in most markets. In some markets, we charge a small fee that is limited to our costs related to the distributor portfolio. The distributor portfolio generally consists of documentation concerning the business, including copies of the sales compensation plan, distributor compensation summary, distributor policies and procedures and other documentation, but does not include products. There are no requirements to purchase products to become a distributor, and no commissions are paid on any fee for the distributor portfolio.
We offer a generous product return policy. With some exceptions based on local regulations, we offer a return policy that allows our distributors to return unopened and unused product for up to 12 months subject to a 10% restocking fee. Distributors are not required to terminate their distributorship to return product. Actual product returns have
historically been less than 5% of annual revenue. We believe our generous return policy minimizes the financial risks associated with being a distributor.
In addition to our product return policy, we strive to be as consumer protective as possible. We seek to ensure that those who use our products or participate in our business opportunity are treated fairly and are not misled by inappropriate product or earnings claims.
There are two fundamental ways in which our distributors can earn money:
| • |
by reselling products purchased from the company to consumers
; and
|
| • |
through commissions earned on the sale of products under our global sales compensation plan.
|
We believe that our global sales compensation plan, which has been implemented in each of our markets except Mainland China, is among the most generous sales compensation plans in the direct selling industry and is one of our competitive advantages. Our Sales Leaders can receive commissions under our global sales compensation plan for product sales from the company to their own network of consumers as well as for product sales from the company to other Sales Leaders and their consumer groups. This type of sales compensation is often referred to as "multi-level" compensation. Commissions are based on the sale and consumption of our products. Our sales force is not required to recruit or sponsor others, and we do not pay any commissions for recruiting or sponsoring. While all of our distributors can sponsor others at any time, our Sales Leaders and those in qualification to become Sales Leaders are those who generally are actively sponsoring others. Pursuant to our global sales compensation plan, we pay consolidated commissions in a Sales Leader's home country, in local currency, for product sales in the Sales Leader's own consumer group and for product sales in the Sales Leader's organization of Sales Leaders across other geographic markets.
Mainland China Business Model
Because of restrictions on direct selling and multi-level commissions in Mainland China, we have implemented a business model for that market that is different from the business model we use in our other markets. We have structured our business model in Mainland China based on several factors: the guidance we have received from government officials, our interpretation of applicable regulations, our understanding of the practices of other international direct selling companies operating in Mainland China, and our understanding as to how regulators are interpreting and enforcing the regulations.
In Mainland China, we utilize sales employees to sell products through our retail stores and website, independent direct sellers who can sell away from our stores where we have obtained direct selling licenses, and independent marketers who are licensed business owners authorized to sell our products either at their own approved premises or through our stores. We rely heavily on our ability to attract new consumers and promote repeat purchases through our sales employees, independent direct sellers and independent marketers, and to educate our sales force about our products through frequent training meetings.
-7-
Our sales employees, independent direct sellers and independent marketers in Mainland China do not participate in our global sales compensation plan, but are instead compensated according to a separate compensation model established for Mainland China. Sales employees, independent direct sellers and independent marketers earn bonuses or commissions based on their product sales. In addition, sales employees receive a salary, and independent marketers receive a service fee, both of which are reviewed and adjusted quarterly.
Please refer to "Business – Regulation" and "Risk Factors" for a discussion of risks and uncertainties associated with our business in Mainland China.
Our global sales compensation plan and our Mainland China business model, including our related know-how, processes and systems, play a significant role in helping us to attract and incentivize our sales force. We have strategically developed and refined our global sales compensation plan and our Mainland China business model to distinguish the business opportunity that we offer from those of other companies and to provide us with a competitive advantage.
Sales Incentives, Meetings, Recognition and Training
An important part of our distribution channel is motivating our Sales Leaders and recognizing their achievements. We hold regular meetings and events globally in order to recognize Sales Leaders who have achieved various levels of success in our business. These meetings also allow the company and key Sales Leaders to provide training to other Sales Leaders. We utilize a variety of sales incentives such as incentive trips to motivate Sales Leaders. In addition to rewarding performance, incentive trips provide Sales Leaders and the company opportunities to share best practices, generate alignment of Sales Leaders around key initiatives, and provide a high level of motivation and team building among Sales Leaders.
Product Launch Process
We use a variety of methods to launch our products, enabling us to tailor the launch process to the specific market and the specific product. Prior to making a product generally available for purchase in a market, we typically do a promotional offering of the product, such as a preview of the product to our key Sales Leaders in the market, a limited-time offer, or other type of promotion. In a limited-time offer, a product is sold for a limited time, often in limited quantities, before being taken off the market for a short period of time, after which the product becomes generally available for purchase in the market. We refer to this entire process, beginning with the Sales Leader preview, limited-time offer or other promotion through general availability of the product, as a product launch or our launch process.
Sales Leader previews, limited-time offers and other promotions may generate significant activity and a high level of purchasing, which can result in a higher-than-normal increase in revenue during the quarter and can skew year-over-year and sequential comparisons. We believe our product launch process also attracts new people to our business, helping drive growth in our Sales Leaders and Customers through increased consumer trial.
Please refer to "Risk Factors" for more information on risks related to our product launch process.
Beginning in the second half of 2017 and continuing into 2018, we plan to launch our
ageLOC LumiSpa
treatment and cleansing device.
-8-
We currently sell and distribute our products in approximately 50 markets. We have divided our markets into five geographic regions: Greater China, North Asia, South Asia/Pacific, Americas, and Europe, Middle East and Africa ("EMEA"). The following table sets forth the revenue for each of the geographic regions for the years ended December 31, 2014, 2015 and 2016:
|
Year Ended December 31,
|
||||||||||||||||||||||||
|
(U.S. dollars in millions)
|
2014
|
2015
|
2016
|
|||||||||||||||||||||
|
Greater China
|
$
|
948.5
|
37
|
%
|
$
|
771.6
|
34
|
%
|
$
|
794.4
|
36
|
%
|
||||||||||||
|
North Asia
|
783.0
|
30
|
686.5
|
31
|
692.7
|
31
|
||||||||||||||||||
|
South Asia/Pacific
|
328.4
|
13
|
322.0
|
14
|
296.8
|
13
|
||||||||||||||||||
|
Americas
|
329.0
|
13
|
329.7
|
15
|
276.6
|
13
|
||||||||||||||||||
|
EMEA
|
180.6
|
7
|
137.2
|
6
|
147.3
|
7
|
||||||||||||||||||
|
$
|
2,569.5
|
100
|
%
|
$
|
2,247.0
|
100
|
%
|
$
|
2,207.8
|
100
|
%
|
|||||||||||||
Additional comparative revenue and related financial information is presented in the tables captioned "Segment Information" in Note 19 to our consolidated financial statements.
Our business is subject to various laws and regulations globally, particularly with respect to our direct selling business models and our product categories. In addition, as a United States entity operating through subsidiaries in foreign jurisdictions, we are subject to foreign exchange control, transfer pricing and customs laws that regulate the flow of funds between us and our subsidiaries and for product purchases, management services and contractual obligations, such as the payment of sales commissions.
As is the case with most companies in our industry, we receive inquiries from time to time from government regulatory authorities regarding the nature of our business and other issues, such as compliance with local direct selling, transfer pricing, customs, taxation, foreign exchange control, securities and other laws. Negative publicity related to government inquiries into our operations in the United States in the early 1990s, in South Korea in the late 1990s and in Mainland China in 2014 has negatively impacted our business.
Direct Selling Regulations
Direct selling is regulated by various national, state and local government agencies in the United States and foreign countries. These laws and regulations are generally intended to prevent fraudulent or deceptive schemes, including "pyramid" schemes, which compensate participants
primarily
for recruiting additional participants
without significant emphasis on product sales to consumers.
The laws and regulations in our current markets generally:
| • |
impose requirements related to order cancellations, product returns, inventory buy-backs and cooling-off periods for our sales force and consumers;
|
| • |
require us, or our sales force, to register with government agencies;
|
| • |
impose limits on the amount of sales compensation we can pay;
|
| • |
impose reporting requirements; and
|
| • |
require that we ensure, among other things, that our sales force maintains levels of product sales to qualify to receive commissions and that our sales force is compensated for sales of products and not for recruiting others.
|
-9-
The laws and regulations governing direct selling may be modified or reinterpreted from time to time, which may cause us to change our
sales
compensation and business models.
In almost all of our markets, regulations are subject to discretionary interpretation by regulators and judicial authorities.
There is often ambiguity and uncertainty with respect to the state of direct selling and anti-pyramiding laws and regulations. In the United States, for example, federal law provides law enforcement agencies, such as the Federal Trade Commission ("FTC"), broad latitude in policing unfair or deceptive trade practices, but does not provide a bright-line test for identifying a pyramid scheme. Recent settlements between the FTC and other direct selling companies and comments by FTC officials have addressed inappropriate earnings and lifestyle claims and the importance of focusing on customers. These developments have created a level of ambiguity as to the proper interpretation of the law and related court decisions. For example, in 2015, the FTC took aggressive actions against a multi-level marketing company, alleging an illegal business model and inappropriate earnings claims. We have taken additional steps to educate our distributors on proper earnings claims. If our distributors make improper claims, or if regulators determine we are making any improper claims, this could lead to an FTC investigation and could harm our business.
In 2016, the FTC entered into a settlement with another multi-level marketing company, requiring the company to modify its business model, including basing sales compensation and qualification only on sales to retail and preferred customers and on purchases by a distributor for personal consumption within allowable limits. Although this settlement does not represent judicial precedent or a new FTC rule, FTC officials have indicated that the industry should look at this settlement, and the principles underlying its specific measures, for guidance. If the requirements in this settlement lead to new industry standards or new rules, our business could be impacted and we may need to amend our global sales compensation plan. With a majority of our revenue in the United States coming from sales to retail and preferred customers, we believe that we can demonstrate consumer demand for our products, but we continue to monitor developments to assess whether we should make any changes to our business or global sales compensation plan in light of this guidance. If we are required to make changes or if the FTC seeks to enforce similar measures in the industry, either through rulemaking or an enforcement action against our company, our business could be harmed.
The regulatory environment in Mainland China is particularly complex and continues to evolve. Mainland China's direct selling and anti-pyramiding regulations contain various restrictions, including a prohibition on the payment of multi-level compensation. The regulations are subject to discretionary interpretation by provincial and local level regulators as well as local customs and practices.
Regulators continue to act cautiously as they monitor the development of direct selling in Mainland China. As of January 31, 2017, we have obtained direct selling licenses in 34 cities in 22 provinces and municipalities in Mainland China. In order to expand our direct selling model into additional provinces
,
we currently must obtain a series of approvals from the local Department of Commerce in such provinces, the Shanghai Municipal Commission of Commerce (our supervisory authority), as well as the State Ministry of Commerce ("MOFCOM"), which is the national governmental authority overseeing direct selling. In the course of obtaining these approvals, the respective authorities under MOFCOM must also consult and seek opinions on our business operations from the Ministry of Public Security and the Administration for Industry and Commerce at both provincial and State levels.
-10-
Our operations in Mainland China are subject to significant government and media scrutiny and investigations. At times, investigations and other regulatory actions have limited our ability to conduct business in certain locations in Mainland China, and have resulted in a few cases where we have paid fines. For example, following a number of negative media stories published in January 2014, we received inquiries from various government regulators in Mainland China asking us to respond to a number of allegations relating to our business practices, products and business model. In response to this media scrutiny and government review, we voluntarily took a number of actions in Mainland China, including temporarily suspending our business meetings, temporarily suspending acceptance of applications for any new sales representatives, and extending our product refund and return policies. The adverse publicity and suspension of business meetings and acceptance of applications had a significant negative impact on our revenue and the number of Sales Leaders and Customers in the region. We face a risk that future investigations and other regulatory actions may result in fines, revocation of licenses or other significant sanctions.
Several countries, including China, South Korea, Indonesia and Vietnam, impose limits on the amount of commissions we can pay to our sales force. For example, under regulations in Mainland China, direct selling companies may pay independent direct sellers in Mainland China up to a maximum 30% of the revenue they generate through their own sales of products to consumers. Additionally, in South Korea, local regulations limit sales compensation to 35% of our total revenue in South Korea. We have implemented various measures to comply with these limits, including adjusting the commissionable value of some of our products in this market.
In some countries, regulations applicable to the activities of our Sales Leaders may affect our business because we are, or regulators may assert that we are, responsible for our Sales Leaders' conduct. In these countries, regulators may request or require that we take steps to ensure that our Sales Leaders comply with local regulations. For example, in Japan, we have taken steps to comply with strict requirements regarding how distributors approach prospective customers. In addition, in 2013, we changed our distributor sign-up process in Japan and expanded our distributor education, training and compliance efforts to address concerns expressed by Japanese regulatory agencies. We continue to be cautious in our promotional activities in Japan
,
and we frequently meet with regulatory and consumer agencies regarding our ongoing distributor education, training and compliance efforts.
Our sales force is required to comply with work authorization and other local legal requirements prior to working in a country. Some markets, including Mainland China and Vietnam, also prohibit or restrict participation of foreigners in direct selling activities. We have implemented policies that are designed to comply with these regulations and inform our sales force regarding the types of activities that are not permitted. However, we cannot assure that actions of our sales force will not violate local laws or regulations or our policies.
Please refer to "Risk Factors" for more information on regulatory and other risks associated with our business in Mainland China, South Korea, Japan
,
the United States and other markets.
Product Regulations
Our Nu Skin and Pharmanex products and related promotional and marketing activities are subject to extensive government regulation by numerous federal, state and local government agencies and authorities, including the Food and Drug Administration (the "FDA"), the FTC, the Consumer Product Safety Commission, the Department of Agriculture, United States and State Attorneys General and other state regulatory agencies in the United States, as well as the food and drug administrations in Mainland China and Taiwan, the Ministry of Food and Drug Safety in South Korea, the Ministry of Health, Labour and Welfare in Japan and similar government agencies in all other markets in which we operate. In the United States, the FDA, in particular, regulates the formulation, manufacture and labeling of over-the-counter ("OTC") drugs, cosmetics, dietary supplements, and devices such as those distributed by us.
-11-
Regulation of Personal Care Products in the United States
.
Our personal care products are subject to various laws and regulations that regulate cosmetic and personal care products and set forth regulations that among other things determine whether a product can be marketed as a "cosmetic" or requires further approval as an OTC drug. In the United States, the regulation of cosmetic content and labeling is under the primary jurisdiction of the FDA. Cosmetics are not subject to pre-market approval by the FDA, but their ingredients and their label and labeling content are regulated by the FDA, and it is the burden of those who sell cosmetics to ensure that they are safe for use as directed and not adulterated or misbranded. The labeling of cosmetic products is subject to the requirements of the Federal Food, Drug
,
and Cosmetic Act ("FDCA"), the Fair Packaging and Labeling Act and other FDA regulations.
The FDCA defines cosmetics by their intended use, as "articles intended to be rubbed, poured, sprinkled, or sprayed on, introduced into, or otherwise applied to the human body . . . for cleansing, beautifying, promoting attractiveness, or altering the appearance." Among the products included in this definition are skin moisturizers, perfumes, lipsticks, fingernail polishes, eye and facial makeup preparations, shampoos, permanent waves, hair colors, toothpastes and deodorants, as well as material intended for use as a component of a cosmetic product. A product may be considered a drug if it is intended for use in the diagnosis, cure, mitigation, treatment, or prevention of disease, or is intended to affect the structure or any function of the body ("structure/function claims"). A product's intended use can be inferred from marketing or product claims
,
and regulators may consider the marketing claims of our sales force. Structure/function claims are generally prohibited for cosmetic products as are disease prevention and treatment claims. The FDA prohibits certain ingredients from being included in cosmetic products. It is possible that cosmetic product ingredients now commonly in use that are derived from nanotechnology or other scientific advancements may be restricted or prohibited in the future as more is learned about such ingredients
.
In recent years, the FDA has issued warning letters to many cosmetic companies alleging improper structure/function claims regarding their cosmetic products, including, for example, product claims regarding gene activity, cellular rejuvenation, and rebuilding collagen. Cosmetic companies confront difficulty in determining whether a claim would be considered by the FDA to be an improper structure/function claim. Given this difficulty, and our research and product development focus on the sources of aging and the influence of certain ingredients on gene expression, there is a risk that we could receive a warning letter, be required to modify our product claims or take other actions to satisfy the FDA if the FDA determines any of our marketing materials contain improper structure/function claims for our cosmetic products. In addition, plaintiffs' lawyers have filed class action lawsuits against some of our competitors after our competitors received these FDA warning letters. There can be no assurance that we will not be subject to government actions or lawsuits, which could harm our business.
Certain products, such as sunscreens and acne treatments, are classified as OTC drugs (and cosmetics, depending on claims) and have specific ingredient, labeling and manufacturing requirements. OTC drug products may be marketed if they conform to the requirements of an FDA-established OTC drug monograph that is applicable to that drug. Drug products not conforming to monograph requirements require an approved New Drug Application ("NDA") before marketing may begin. Under these provisions, if the agency were to find that a product or ingredient of one of our OTC drug products is not generally recognized as safe and effective or is not included in a final monograph that is applicable to one of our OTC drug products, we may be required to reformulate or cease marketing that product until it is the subject of an approved NDA or until the time, if ever, that the monograph is amended to include such product. The labeling of these products is subject to the requirements of the FDCA and the Fair Packaging and Labeling Act and other FDA regulations.
-12-
Regulation of Personal Care Products in Other Markets
.
The other markets in which we operate have similar regulations. In Mainland China, personal care products are placed into one of two categories, "special-purpose cosmetics" and "non-special-purpose cosmetics." Products in both categories require submission of formulas and other information with the health authorities, and certain products require human clinical studies. The product registration process for personal care products in Mainland China is unpredictable and generally takes from nine to 18 months to complete. However, in some cases, product registration in Mainland China has taken several years. In Japan, the Ministry of Health, Labour and Welfare regulates the sale and distribution of cosmetics and requires us to have an import business license and to register each personal care product imported into Japan. In Taiwan, all "medicated" cosmetic products require registration. The sale of cosmetic products is regulated in the European Union (the "EU") under the EU Cosmetics Directive, which requires a uniform application for foreign companies making personal care product sales. Similar regulations in any of our markets may limit our ability to import products or utilize key ingredients or technologies globally and may delay product launches while the registration and approval process is pending. Changing regulations may require us to stop selling, discontinue or reformulate and re-register products in order to sell those products.
Regulation of Nutritional Products in the United States
.
Our Pharmanex dietary supplement products are also subject to applicable regulations of government agencies in the markets in which we operate. In the United States, we generally market our nutritional products as conventional foods or dietary supplements. The FDA has jurisdiction over this regulatory area. The FDA imposes specific requirements for the labels and labeling of food and dietary supplements, including the requirements of the Food Allergen Labeling and Consumer Protection Act of 2004
,
which mandates declaration of the presence of major food allergens. In addition, the Public Health Security and Bioterrorism Preparedness and Response Act of 2002 contains requirements with regard to the sale and importation of food products in the United States.
The FDA Food Safety Modernization Act ("FSMA"), which was signed into law in 2011, also increased the FDA's authority with respect to food safety and is considered one of the most significant changes to the FDCA with respect to strengthening the U.S. food safety system in recent years
.
It enables the FDA to focus more on preventing food safety problems rather than primarily reacting to problems after they occur. The law also provides the FDA with new enforcement authorities designed to achieve higher rates of compliance with prevention- and risk-based food safety standards and to better respond to and contain problems when they do occur. The law also gives the FDA important new tools to hold imported foods to the same standards as domestic foods and directs the FDA to build an integrated national food safety system in partnership with state and local authorities. As the agency finalizes regulations pursuant to FSMA, there is likely to be increased regulatory scrutiny with respect to food and nutritional supplements, and such scrutiny is likely to continue
.
The FDA regulates dietary supplements principally under the Dietary Supplement Health and Education Act of 1994 ("DSHEA"). DSHEA formally defines what may be sold as a dietary supplement, defines statements of nutritional support and the conditions under which they may lawfully be used, and includes provisions that permit the FDA to regulate manufacturing practices and labeling claims applicable to dietary supplements. Because the majority of our Pharmanex products are regulated under DSHEA, we are generally not required to obtain regulatory approval prior to introducing a dietary supplement into the United States market.
Generally, under DSHEA, dietary ingredients that were on the market before October 15, 1994 may be used in dietary supplements without notifying the FDA. However, a "new" dietary ingredient (i.e., a dietary ingredient that was not marketed in the U.S. before October 15, 1994) must be the subject of a new dietary ingredient notification submitted to the FDA unless the ingredient has been "present in the food supply as an article used for food" without having been "chemically altered." A new dietary ingredient notification must provide the FDA with evidence of a "history of use or other evidence of safety" which establishes that use of the dietary ingredient "will reasonably be expected to be safe." A new dietary ingredient notification must be submitted to the FDA at least 75 days before the new dietary ingredient can be marketed. Under DSHEA, the FDA may seek to remove from the market any new dietary ingredient that the FDA determines to be unsafe. In addition, the FDA may also deem a dietary supplement an unapproved drug where the marketing claims made in connection with the sale or promotion of the product effectively place it in the drug category.
-13-
Regulation of Nutritional Products Globally.
In our foreign markets, dietary supplements are generally regulated by similar government agencies, such as the China Food and Drug Administration, the South Korea Ministry of Food and Drug Safety; the Japan Ministry of Health, Labour and Welfare and the Taiwan Department of Health. We typically market our Pharmanex products in international markets as foods or health foods under applicable regulatory regimes. In the event a product, or an ingredient in a product, is classified as a drug or pharmaceutical product in any market, we will generally not be able to distribute that product in that market through our distribution channel because of pre-market approvals and strict regulations applicable to drug and pharmaceutical products. Mainland China also has highly restrictive nutritional supplement product regulations. Products marketed as "health foods" are subject to extensive laboratory and clinical analysis by government authorities, and the product registration process in Mainland China generally takes one to two years, but may be substantially longer. In some cases it has taken us four years or longer to obtain product registrations. We market both "health foods" and "general foods" in Mainland China. There is some risk associated with the common practice in Mainland China of marketing a product as a "general food" while seeking "health food" classification. If government officials feel the categorization of our products is inconsistent with product claims, ingredients or function, this could end or limit our ability to market such products in Mainland China in their current form. In addition, we are not permitted to market or sell "general foods" through our direct sales channel in Mainland China and any efforts by our independent direct sellers to do so could result in negative publicity, fines and other government sanctions being imposed against us.
The markets in which we operate all have varied regulations that distinguish foods and nutritional health supplements from "drugs" or "pharmaceutical products." Because of the varied regulations, some products or ingredients that are recognized as a "food" in certain markets may be treated as a "pharmaceutical" in other markets. In Japan, for example, if a specified ingredient is not listed as a "food" by the Ministry of Health and Welfare, we must either modify the product to eliminate or substitute that ingredient, or petition the government to treat such ingredient as a food. We experience similar issues in our other markets. This is particularly a challenge in Europe, where regulations often still differ from state to state, despite EU regulations designed to harmonize the laws of EU member states. As a result, we must often modify the ingredients and/or the levels of ingredients in our products for certain markets, or create unique formulations for multiple markets. In some circumstances, the regulations in foreign markets may require us to obtain regulatory approval prior to introduction of a new product or limit our use of certain ingredients altogether. Because of negative publicity associated with some adulterated or misbranded supplements, including pharmaceutical drugs marketed as dietary supplements, there has been an increased movement in the United States and other markets to expand the regulation of dietary supplements, which could impose additional restrictions or requirements in the future. In general, the regulatory environment is becoming more complex with increasingly stricter regulations each year.
Manufacturing Process.
In 2008, and as updated more recently under the regulations implementing the Food Safety Modernization Act, the FDA established regulations to require current good manufacturing practices for dietary supplements and food products in the United States. The regulations ensure that dietary supplements and food products are produced in a quality manner, do not contain contaminants or impurities, and are accurately labeled. The regulations include requirements for establishing quality control procedures for us and our vendors and suppliers, designing and constructing manufacturing plants, and testing ingredients and finished products throughout our supply chain. The regulations also include requirements for record keeping and handling consumer product complaints. If dietary supplements or food products contain contaminants or allergens or do not contain the type or quantity of dietary ingredient they are represented to contain, the FDA would consider those products to be adulterated or misbranded. Our business is subject to additional FDA regulations, such as new dietary ingredient regulations and adverse event reporting regulations that require us to document and track adverse events and report serious adverse events that involve hospitalization or death associated with consumers' use of certain of our products. Compliance with these regulations has increased, and may further increase, the cost of manufacturing and selling certain of our products as we incur internal costs, oversee and inspect more aspects of third party manufacturing and work with our vendors to assure they are in compliance and maintain accurate recordkeeping to establish controls
.
Failure to comply with good manufacturing practices could also result in product recalls.
-14-
Advertising and Product Claims.
Most of our major markets also regulate advertising and product claims regarding the efficacy of products and require adequate and reliable scientific substantiation of all claims. In most of our foreign markets, we are typically not able to make any "medicinal" claims with respect to our Pharmanex products. In some cases, such regulations may limit our ability to inform consumers of some of the benefits our products offer.
In the United States, the FDA generally prohibits disease diagnosis, prevention and treatment claims when made for a dietary supplement. DSHEA, however, permits substantiated, truthful and non-misleading "statements of nutritional support" to be included in labeling for dietary supplements without FDA pre-approval.
Such statements may describe how a particular dietary ingredient affects the structure, function or general well-being of the body, or the mechanism of action by which a dietary ingredient may affect the structure, function or well-being of the body, but such statements may not state that a dietary supplement will reduce the risk or incidence of a disease unless such claim has been reviewed and approved by the FDA. In addition, the FDA permits companies to use FDA-approved full and qualified health claims for products containing specific ingredients that meet stated requirements.
A company that uses a statement of nutritional support in labeling must possess evidence substantiating that the statement is truthful and not misleading. In 2004, the FDA issued guidance, paralleling an earlier guidance from the FTC, defining a manufacturer's obligations to substantiate structure/function claims. Such statements, when used in labeling, must also be submitted to the FDA no later than thirty days after first marketing the product with the statement that they possess the necessary evidence and must be accompanied by an FDA mandated label disclaimer that "This statement has not been evaluated by the FDA. This product is not intended to diagnose, treat, cure or prevent any disease." There can be no assurance, however, that the FDA or FTC will not determine that a particular statement of nutritional support that we want to use is an unacceptable disease claim or an unauthorized nutrient-disease relationship claim otherwise permitted with FDA approval as a "health claim" or that such claims have competent and reliable scientific evidence. Such a determination might prevent the use of such a claim or result in additional FDA enforcement.
We are aware of media reports regarding dietary supplements, which call for the repeal or amendment of DSHEA. Individuals or groups that are opposed to supplements or question their safety or efficacy may attempt to use these media reports to propose legislation intended to amend or repeal DSHEA. Some of the legislative proposals may include variations on premarket approval, enhanced premarket safety or substantiation required and changing the definition of a "dietary ingredient" to remove either botanicals or selected classes of ingredients now treated as dietary ingredients.
-15-
Most of the other markets in which we operate have not adopted legislation like DSHEA
,
and we may be subject to more restrictive limitations on the claims we can make about our products in these markets. For example, in Japan, our nutritional supplements are marketed as food products, which significantly limits our ability to make claims regarding these products. If marketing materials produced or used by us or our sales force globally make claims that exceed the scope of allowed claims for nutritional supplements
,
the FDA or other regulatory authorities could deem our products to be unapproved drugs. In Mainland China, we also face significant restrictions on our ability to make product claims regarding the efficacy of our products. In a series of articles in 2014, prominent media outlets in Mainland China questioned some of the product claims made by our sales people and the scientific basis of these claims. This resulted in significant negative media attention for us. Such attention could harm consumers' perception of our business and our products and could negatively impact the registration, licensing status and sales of our products.
The FTC, which exercises primary jurisdiction over the advertising of all of our products in the United States, has instituted enforcement actions against dietary supplement, food, and cosmetic companies for
,
among other things, deceptive advertising and lack of adequate scientific substantiation for claims. We also face limitations on our use of the scientific experts who have helped us develop and test some of our products. In the United States, for example, the FTC's Guides Concerning the Use of Endorsements and Testimonials in Advertising may restrict marketing to those results obtained by a "typical" consumer and require disclosure of any material connections between an endorser and the company or products they are endorsing. In Mainland China, some media outlets have questioned the nature and extent of our connections with our Scientific Advisory Board and others who have helped in developing our scientific approach or testing our products. This negative publicity could harm consumers' perception of our business and our products, which could negatively impact our revenue. We cannot be sure that the FTC, or comparable foreign agencies, will not question our advertising or other operations in the future.
In recent years, the FTC has initiated numerous investigations of and actions against companies that sell dietary supplements and cosmetic products. The FTC has issued guidance to assist companies in understanding and complying with its substantiation requirement. The FTC may enforce compliance with the law in a variety of ways, both administratively and judicially, using compulsory process, cease and desist orders, and injunctions. FTC enforcement can result in consent decrees or orders requiring, among other things, injunctive provisions, corrective advertising, consumer redress, and such other relief as the agency deems necessary to protect the public. Violation of these consent decrees or orders could result in substantial financial or other penalties. No assurance can be given that the FTC will not question our advertising or other operations in the United States in the future. Any action in the future by the FTC could materially and adversely affect our ability to successfully market our products in the United States.
In the United States, we are also subject to a consent decree with the FTC and various agreements with state regulatory agencies arising out of investigations that occurred in the early 1990s of certain alleged unsubstantiated product and earnings claims made by our distributors. The consent decree requires us to, among other things, supplement our procedures to enforce our policies, not allow our distributors to make earnings representations without making certain average earnings disclosures and not allow our distributors to make unsubstantiated product claims.
The FTC could initiate an enforcement action to the extent the FTC determines that our advertising or promotional practices are deceptive or contrary to the requirements of the consent decree.
Regulation of Medical Devices.
In 2014, our facial spa was cleared for marketing through the 510(k) process with the FDA as a medical device with cosmetic benefit. Medical devices are highly regulated by the FDA. Manufacturers of medical devices must register and list their products with the FDA annually
,
whether they are located domestically or overseas. Foreign jurisdictions may take note of the fact that we have registered a medical device in the U.S. and require us to register in their market as well. The FDA has broad regulatory powers in the areas of clinical testing, manufacturing and labeling of medical devices. Medical devices must be labeled in accordance with the FDA's general device labeling requirements and whatever particular label requirements the FDA may designate for that type of device.
-16-
In addition, medical device manufacturers must adhere to certain "good manufacturing practices" in accordance with the FDA's Quality System Regulation, which regulates the manufacture of medical devices, prescribes record-keeping procedures and provides for the routine inspection of facilities for compliance with such regulations. If in connection with these inspections, the FDA believes the manufacturer has failed to comply with applicable regulations and/or procedures, it may issue observations that would necessitate prompt corrective action. If the FDA inspection observations are not addressed and/or corrective action taken in a timely manner and to the FDA's satisfaction, the FDA may issue a Warning Letter (which would similarly necessitate prompt corrective action) and/or proceed directly to other forms of enforcement action. Failure to respond timely to FDA inspection observations, a Warning Letter or other notice of noncompliance and to promptly come into compliance could result in the FDA bringing enforcement action against us, which could include the shutdown of our production facilities, denial of importation rights to the U.S. for products manufactured in overseas locations and criminal and civil fines.
Our
Pharmanex BioPhotonic Scanner
and our
ageLOC Spa
systems
are subject to the regulations of various health, consumer
-
protection and other government authorities around the world. These regulations vary from market to market and affect whether our products are required to be registered as medical devices, the claims that can be made with respect to these products, who can use them, and where they can be used. We have been required to register our
ageLOC Spa
systems
as medical devices in a few markets. We have been subject to regulatory inquiries in the United States, Japan and other countries with respect to the status of the
Pharmanex BioPhotonic Scanner
as a non-medical device. Any determination that medical device clearance is required for one of our products, in a market where we currently market and sell such product as a cosmetic or non-medical device, could require us to expend significant time and resources in order to meet the additional stringent standards imposed on medical device companies or prevent us from marketing the product. Please refer to "Risk Factors" f
or more information on the regulatory risks associated with our
Pharmanex BioPhotonic Scanner
and our
ageLOC Spa
systems
.
Direct Selling
We compete with other direct selling organizations, some of which have a longer operating history, and greater visibility, name recognition and financial resources than we do. The leading global direct selling companies are Amway, Avon Products, Herbalife and Mary Kay. We also compete with other local direct selling companies. For example, the leading direct selling companies in Mainland China are Perfect and Infinitus. We compete with these companies to attract and retain our sales force and consumers based on the strength of our product offerings, sales compensation, multiple business opportunities, management and international operations.
Products
The markets for our Nu Skin and Pharmanex products are highly competitive. Our competitors include a broad array of marketers of personal care and nutritional products and pharmaceutical companies, many of which have longer operating histories and greater name recognition and financial resources than we do. We compete in these markets by emphasizing the innovation, value and premium quality of our products and the convenience of our distribution system.
-17-
As of December 31, 2016, we had approximately 4,650 full- and part-time employees worldwide. This does not include approximately 27,600 sales employees in our Mainland China operations. Although we have statutory employee representation obligations in certain countries, our employees are generally not represented by labor unions except where expressly required by law. We believe that our relationship with our employees is good, and we do not foresee a shortage in qualified personnel necessary to operate our business.
Our website address is www.nuskinenterprises.com. We make available, free of charge on the Investor Relations portion of our website, ir.nuskin.com, our annual reports on Form 10-K, quarterly reports on Form 10-Q, current reports on Form 8-K, and amendments to those reports filed or furnished pursuant to Section 13(a) or 15(d) of the Securities Exchange Act of 1934 as soon as reasonably practicable after we electronically file such material with, or furnish it to, the Securities and Exchange Commission.
We also use the Investor Relations portion of our website, ir.nuskin.com, as a channel of distribution of additional Company information that may be deemed material. Accordingly, investors should monitor this channel, in addition to following our press releases, Securities and Exchange Commission filings and public conference calls and webcasts. The contents of our website shall not be deemed to be incorporated herein by reference.
Our executive officers as of January 31, 2017 are as follows:
|
Name
|
Age
|
Position
|
||
|
Steven J. Lund
|
63
|
Executive Chairman of the Board
|
||
|
M. Truman Hunt
|
57
|
President and Chief Executive Officer
|
||
|
Ritch N. Wood
|
51
|
Chief Financial Officer
|
||
|
Joseph Y. Chang
|
64
|
Chief Scientific Officer and Executive Vice President of Product Development
|
||
|
Ryan S. Napierski
|
43
|
President of Global Sales and Operations
|
||
|
D. Matthew Dorny
|
52
|
General Counsel and Secretary
|
Steven J. Lund
has served as Executive Chairman of our board of directors since May 2012. Mr. Lund previously served as Vice Chairman of our board of directors from September 2006 to May 2012 and as President, Chief Executive Officer and a member of our board of directors from 1996, when we went public, until 2003. Mr. Lund was a founding stockholder of our company. Mr. Lund is a trustee of the Nu Skin Force for Good Foundation, a charitable organization established in 1996 by our company to help encourage and drive the philanthropic efforts of our company and its sales force and employees to enrich the lives of others. Mr. Lund worked as an attorney in private practice prior to joining our company as Vice President and General Counsel. He received a B.A. degree from Brigham Young University and a J.D. degree from Brigham Young University's J. Reuben Clark Law School.
M. Truman Hunt
has served as our President and Chief Executive Officer since 2003. He also joined our board of directors when he was named Chief Executive Officer. Mr. Hunt has served in various positions with our company since 1994, including Executive Vice President from 2001 to 2003 and General Counsel from 1996 to 2003. From 2005 until 2008, Mr. Hunt served as chairman of the World Federation of Direct Selling Associations, a global trade association for the direct selling industry. Mr. Hunt also served as chairman of the board of directors for the United States Direct Selling Association from 2014 to 2015. He received a B.S. degree from Brigham Young University and a J.D. degree from the University of Utah.
-18-
Ritch N. Wood
has served as our Chief Financial Officer since November 2002. Prior to this appointment, Mr. Wood served as Vice President, Finance from July 2002 to November 2002 and Vice President, New Market Development from 2001 to 2002. Mr. Wood joined our company in 1993 and has served in various capacities. Prior to joining us, he worked for the accounting firm of Grant Thornton LLP. Mr. Wood earned a B.S. and a Master of Accountancy degree from Brigham Young University.
Joseph Y. Chang
has served as our Chief Scientific Officer and Executive Vice President of Product Development since 2006. Dr. Chang served as President of our Pharmanex division from 2000 to 2006. Dr. Chang served as Vice President of Clinical Studies and Pharmacology of Pharmanex from 1997 until 2000. Dr. Chang has over 35 years of pharmaceutical experience. He received a B.S. degree from Portsmouth University and a Ph.D. degree from the University of London.
Ryan S. Napierski
has served as President of Global Sales and Operations since September 2015. Prior to serving in this position, he served as President of our North Asia region since June 2014 and as President of Nu Skin Japan since June 2010. Mr. Napierski has fulfilled multiple leadership positions for Nu Skin since joining our company in 1995. Mr. Napierski has a Bachelor's degree in business, a Master's degree in business administration from Duke University and a Master's degree in international business from Goethe Universitat in Germany.
D. Matthew Dorny
has served as our General Counsel and Secretary since 2003. Mr. Dorny previously served as Assistant General Counsel from 1998 to 2003. Prior to joining us, Mr. Dorny was a securities and business attorney in private practice in Salt Lake City, Utah. Mr. Dorny received B.A., M.B.A. and J.D. degrees from the University of Utah.
As previously disclosed, in December 2016 Mr. Hunt notified our company that he will step down as the Chief Executive Officer and President of our company. When our company names a new Chief Financial Officer, Mr. Wood, our current Chief Financial Officer, will become our Chief Executive Officer, Mr. Napierski will become the President of our company, and Mr. Hunt will become Vice Chairman of our board of directors. Mr. Hunt will not stand for re-election to our board of directors at our 2017 Annual Meeting of Stockholders.
We face a number of substantial risks. Our business, financial condition or results of operations could be harmed by any of these risks. The trading price of our common stock could decline due to any of these risks, which should be considered together with the other items in this Annual Report on Form 10-K, including Item 1. "Business" and Item 7. "Management's Discussion and Analysis of Financial Condition and Results of Operations."
Inability of products and other initiatives to gain or maintain
sales force
and market acceptance could harm our business.
Our operating results could be adversely affected if our products, business opportunities, and other initiatives do not generate sufficient enthusiasm and economic benefit to retain our existing consumers and sales force or to attract new consumers and people interested in joining our sales force. Potential factors affecting the attractiveness of our products, business opportunities, and other initiatives include, among other items, perceived product quality and value, product exclusivity or effectiveness, economic success in our business opportunity, adverse media attention or regulatory restrictions on claims.
-19-
In addition, our ability to develop and introduce new products could be impacted by, among other items, government regulations, the inability to attract and retain qualified research and development staff, the termination of third-party research and collaborative arrangements, intellectual property of competitors that may limit our ability to offer innovative products or that challenge our own intellectual property, or problems related to manufacturing or quality control, and difficulties in anticipating changes in consumer tastes and buying preferences.
For example, in the second half of 2013, we introduced our
ageLOC TR90
weight management and body shaping system. The
TR90
system was designed to promote healthy weight loss and body composition rather than to rapidly maximize gross weight loss. Unrealistic product expectations and weight-loss goals, non-compliance with the
TR90
weight management program and misunderstandings of the
TR90
approach to healthy weight loss and body composition contributed to some reports of consumer dissatisfaction with the
TR90
program. Our operating results could be adversely impacted if
TR90
or any of our other products fail to gain or maintain sales force and market acceptance.
In addition, in our more mature markets, one of the challenges we face is keeping Sales Leaders with established businesses and high-income levels motivated and actively engaged in business building activities and in developing new Sales Leaders. There can be no assurance that our initiatives will continue to generate excitement among our
sales force
in the long-term or that planned initiatives will be successful in maintaining
sales force
activity and productivity or in motivating Sales Leaders to remain engaged in business building and developing new Sales Leaders. Some initiatives may have unanticipated negative impacts on our
sales force
, particularly changes to our
sales
compensation plans. The introduction of a new product or key initiative can also negatively impact other product lines to the extent our Sales Leaders focus their efforts on the new product or initiative. In addition, if any of our products fails to gain acceptance, we could see an increase in product returns.
Challenges to the form of our network marketing system could harm our business.
We may be subject to challenges by government regulators regarding the form of our network marketing system. Legal and regulatory requirements concerning the direct selling industry generally do not include "bright line" rules and are inherently fact-based and subject to interpretation. As a result, regulators and courts have discretion in their application of these laws and regulations, and the enforcement or interpretation of these laws and regulations by government agencies or courts can change. Recent settlements between the FTC and other direct selling companies and comments by FTC officials have addressed inappropriate earnings and lifestyle claims and the importance of focusing on customers. These developments have created a level of ambiguity as to the proper interpretation of the law and related court decisions. Any adverse rulings or legal actions could impact our business if direct selling laws or anti-pyramid laws are interpreted more narrowly or in a manner that results in additional burdens or restrictions on direct selling companies. For example, in 2015, the FTC took aggressive actions against a multi-level marketing company, alleging an illegal business model and inappropriate earnings claims. We have taken additional steps to educate our distributors on proper earnings claims. If our distributors make improper claims, or if regulators determine we are making any improper claims, this could lead to an FTC investigation and could harm our business.
In 2016, the FTC entered into a settlement with another multi-level marketing company, requiring the company to modify its business model, including basing sales compensation and qualification only on sales to retail and preferred customers and on purchases by a distributor for personal consumption within allowable limits. Although this settlement does not represent judicial precedent or a new FTC rule, FTC officials have indicated that the industry should look at this settlement, and the principles underlying its specific measures, for guidance. If the requirements in this settlement lead to new industry standards or new rules, our business could be impacted and we may need to amend our global sales compensation plan. With a majority of our revenue in the United States coming from sales to retail and preferred customers, we believe that we can demonstrate consumer demand for our products, but we continue to monitor developments to assess whether we should make any changes to our business or global sales compensation plan in light of this guidance. If we are required to make changes or if the FTC seeks to enforce similar measures in the industry, either through rulemaking or an enforcement action against our company, our business could be harmed.
-20-
We could also be subject to challenges by private parties in civil actions. We are aware of recent civil actions against some of our competitors in the United States, which have and may in the future result in significant settlements. Allegations by short sellers directed at us and our competitors regarding the legality of multi-level marketing in various markets have also created intense public scrutiny of us and our industry. Our business has also been subject to formal and informal inquiries from various government regulatory authorities in the past regarding our business and our compliance with local laws and regulations. All of these actions and any future scrutiny of us or our industry could generate negative publicity or further regulatory actions that could result in fines, restrict our ability to conduct our business in our various markets, enter into new markets, motivate our sales force and attract consumers.
Currency exchange rate fluctuations could impact our financial results.
In 2016, approximately 91% of our sales occurred in markets outside of the United States in each market's respective local currency. We purchase inventory primarily in the United States in U.S. dollars. In preparing our financial statements, we translate revenue and expenses in our markets outside the United States from their local currencies into U.S. dollars using weighted average exchange rates. If the U.S. dollar strengthens relative to local currencies, our reported revenue, gross profit and net income will likely be reduced. For example, foreign currency fluctuations negatively impacted reported revenue by approximately 2% in 2016 compared to 2015 and by approximately 8% in 2015 compared to 2014.
Foreign currency fluctuations can also result in losses and gains resulting from translation of foreign currency denominated balances on our balance sheet. Although we may engage in transactions intended to reduce our exposure to foreign currency fluctuations, there can be no assurance that these transactions will be effective. Complex global political and economic dynamics can affect exchange rate fluctuations. For example, significant foreign currency fluctuations occurred as a result of the June 2016 referendum in the United Kingdom in which voters approved an exit from the European Union. In addition, members of the current U.S. presidential administration have expressed antipathy toward some international trade agreements and have suggested the implementation of tariffs, border taxes or other measures that could impact the level of trade between the U.S. and other countries. Any such proposal or measure could impact the value of the U.S. dollar. It is difficult to predict future fluctuations and the effect these fluctuations may have upon future reported results or our overall financial condition.
Difficult economic conditions could harm our business.
Global economic conditions continue to be challenging. Difficult economic conditions could adversely affect our business by causing a decline in demand for our products, particularly if the economic conditions are prolonged or worsen. In addition, such economic conditions may adversely impact access to capital for us and our suppliers, may decrease the ability of our sales force and consumers to obtain or maintain credit cards, and may otherwise adversely impact our operations and overall financial condition. For example, certain economic indicators cause uncertainty regarding the potential for growth in Mainland China's economy. Declines in economic conditions in Mainland China could negatively impact our business and revenue in that market and in other markets globally.
-21-
Improper sales force actions that violate laws or regulations could harm our business.
Sales force activities that violate applicable laws or regulations could result in government or third-party actions against us, which could harm our business.
For example, in 2014, allegations were made by various media outlets that certain of our sales representatives in Mainland China failed to adequately follow and enforce our policies and regulations. In response to these and other allegations, our Audit Committee commenced an internal review and Chinese regulators commenced a review of our business in Mainland China. In response to this media scrutiny and government review, we voluntarily took a number of actions in Mainland China, including temporarily suspending our business meetings, temporarily suspending acceptance of applications for any new sales representatives, and extending our product refund and return policies. The adverse publicity and suspension of business meetings and acceptance of applications had a significant negative impact on our revenue and the number of Sales Leaders and Customers in the region, and our business in Mainland China still has not fully recovered from these events. For example, as of December 31, 2016, we had approximately 22,000 Sales Leaders in Mainland China, compared to approximately 49,000 as of December 31, 2013. Similar or more extreme actions by government agencies in Mainland China in the future could have a significant adverse impact on our business and results of operations.
The direct selling industry in Japan continues to experience regulatory and media scrutiny, and other direct selling companies have been suspended from sponsoring activities in the past. Japan imposes strict requirements regarding how distributors approach prospective customers. Over the last few years, we have from time to time received warnings from regulatory agencies in certain prefectures about the number of general inquiries and complaints about us and our distributors. In 2013, we changed our distributor sign-up process in Japan and expanded our distributor compliance, education and training efforts in Japan to address concerns expressed by Japanese regulatory agencies. However, we cannot be certain that our efforts will successfully prevent regulatory actions against us, including fines, suspensions or other sanctions, or that the company and the direct selling industry will not receive further negative media attention, all of which could harm our business.
Except in Mainland China, members of our sales force are not employees and act independently of us. The most significant area of risk for such activities relates to improper product claims and claims regarding the business opportunity of joining our sales force. We implement strict policies and procedures to ensure our
sales force
complies with legal requirements. However, given the size of our
sales force
, we experience problems from time to time. For example, product claims made by some of our
sales force
in 1990 and 1991 led to a United States Federal Trade Commission ("FTC") investigation that resulted in our entering into a consent agreement with the FTC and various agreements with state regulatory agencies. In addition, rulings by the South Korean Federal Trade Commission and by judicial authorities against us and other companies in South Korea indicate that vicarious liability may be imposed on us for the criminal activity of our
sales force
. We have also seen an increase in the use of social media by
our sales force
, and an increase in sales aids and promotional material produced by
our sales force
in some markets, increasing the burden on us to monitor compliance of such materials, and increasing the risk that such materials could contain problematic claims in violation of our policies and applicable regulations. As we expand internationally, our
sales force
often attempts to anticipate which markets we will open in the future and begin marketing and sponsoring activities in markets where we are not qualified to conduct business. We could face fines, suspensions or other legal action if our
sales force
violates applicable laws and regulations, and our reputation and brand could be negatively impacted
.
-22-
If our business practices or policies or the actions of our sales force are deemed to be in violation of applicable local regulations regarding foreigners, then we could be sanctioned and/or required to change our business model, which could significantly harm our business.
Our sales force is required to comply with work authorization and other local legal requirements prior to working in a country. Some markets, including Mainland China and Vietnam, also prohibit or restrict participation of foreigners in direct selling activities. We have implemented policies that are designed to comply with these regulations and inform our sales force regarding the types of activities that are not permitted. However, we cannot assure that actions of our sales force will not violate local laws or regulations or our policies. If our business practices or policies or the actions of our sales force are deemed to be in violation of applicable regulations as they may be interpreted or enforced, then we could be sanctioned and/or required to change our business model, which could result in adverse publicity and significantly harm our business.
If we are unable to retain our existing sales force and recruit additional people to join our sales force, our revenue will not increase and may even decline.
Our products are primarily marketed by our sales force and we depend on them to generate virtually all of our revenue. Our sales force may terminate their services at any time, and, like most direct selling companies, we experience relatively high turnover among our sales force from year to year. People who join our company to purchase our products for personal consumption or for short-term income goals frequently only stay with us for a short time. Sales Leaders who have committed time and effort to build a sales organization will generally stay for longer periods. Our sales force has highly variable levels of training, skills and capabilities. To increase our revenue, we must increase the number of and/or the productivity of our sales force
.
We have experienced periodic declines in both Sales Leaders and Customers in the past and could experience such declines again in the future. If our initiatives do not drive growth in both our Sales Leaders and Customers, our operating results could be harmed. While we take many steps to help train, motivate and retain our sales force, we cannot accurately predict how the number and productivity of our sales force may fluctuate because we rely primarily upon our Sales Leaders to find new consumers, and to find, train and develop new Sales Leaders. Our operating results could be harmed if we, and our Sales Leaders, do not generate sufficient interest in our business and its products to retain and motivate our existing sales force and attract new people to join our sales force.
The number and productivity of our sales force could be harmed by several additional factors, including:
|
•
|
any adverse publicity regarding us, our products, our distribution channel, or our competitors;
|
|
•
|
lack of interest in, dissatisfaction with, or the technical failure of, existing or new products;
|
|
•
|
lack of compelling products or income opportunities, including through our sales compensation plans;
|
|
•
|
any negative public perception of our products and their ingredients;
|
|
•
|
any negative public perception of our sales force and direct selling businesses in general;
|
|
•
|
our actions to enforce our policies and procedures;
|
|
•
|
any regulatory actions or charges against us or others in our industry;
|
|
•
|
general economic and business conditions;
|
|
•
|
recruiting efforts of our competitors; and
|
|
•
|
potential saturation or maturity levels in a given country or market which could negatively impact our ability to attract and retain our sales force in such market.
|
-23-
The loss of key Sales Leaders could negatively impact our growth and our revenue.
As of December 31, 2016, we had a global network of approximately 988,000 Customers. More than 61,000 of our Customers were Sales Leaders. As of December 31, 2016, approximately 640
Sales Leaders occupied the highest level under our global
sales
compensation plan, and in Mainland China we have approximately 260 key Sales Leaders who play a significant role in managing our sales force in that market. These Sales Leaders, together with their extensive sales networks, generate substantially all of our revenue. As a result, the loss of a high-level Sales Leader or a group of leading Sales Leaders, whether by their own choice or through disciplinary actions by us for violations of our policies and procedures, could negatively impact our growth and our revenue.
Our operations in Mainland China are subject to significant government scrutiny, and we could be subject to fines or other penalties.
Our operations in Mainland China are subject to significant regulatory scrutiny. The legal system in Mainland China provides government authorities broad latitude to conduct investigations and many Chinese regulations, including those governing our business, are subject to significant interpretation, which may vary from jurisdiction to jurisdiction. Because of significant government concerns in Mainland China regarding improper direct selling activities, government regulators closely scrutinize activities of direct selling companies and activities that resemble direct selling. The government in Mainland China continues to inspect and interview the direct selling industry on a regular basis, which has and may continue to increase regulatory scrutiny of the industry and our business. Government regulators frequently make inquiries into our business activities and investigate complaints from consumers and others regarding our business. Some of these inquiries and investigations in the past have resulted in the payment of fines by us or members of our sales force, interruption of sales activities at stores and warnings. We continuously face the risk of new regulatory inquiries and investigations, and any determination that our operations or activities, or the activities of our sales employees, independent direct sellers or independent marketers, are not in compliance with applicable regulations could result in substantial fines, extended interruptions of business, and termination of necessary licenses and permits, including our direct selling and other licenses, all of which could harm our business.
We work diligently to train our sales force in Mainland China on how our Mainland China business model differs from our global business model. However, Sales Leaders in Mainland China may attend regional and global events or interact with Sales Leaders from other markets. Because our global model varies significantly from our Mainland China business model, mistakes may be made as to how those working in Mainland China should promote the business in Mainland China. These mistakes by our sales force may lead to government reviews and investigations of our operations in Mainland China. For example, as a result of allegations that, among other things, certain of our sales force in Mainland China failed to adequately follow and enforce our policies and regulations, in 2014 Chinese regulators commenced a review of our business model and operations in Mainland China. For a further description of these matters, see "We may become involved in legal proceedings and other matters that, if adversely adjudicated or settled, could adversely affect our financial results." In response to media scrutiny and this government review, we voluntarily took a number of actions in Mainland China, including temporarily suspending our business meetings, temporarily suspending acceptance of applications for any new sales representatives, and extending our product refund and return policies. The adverse publicity and suspension of business meetings and acceptance of applications had a significant negative impact on our revenue and the number of Sales Leaders and Customers in the region. Further media and regulatory scrutiny and investigations in Mainland China, and any further actions taken by us or by regulators, could negatively impact our revenue, sales force and business in this market, including the interruption of sales activities, loss of licenses, and the imposition of fines, and any other adverse actions or events.
-24-
If direct selling regulations in Mainland China are modified, interpreted or enforced in a manner that results in negative changes to our business model or the imposition of a range of potential penalties, our business would be significantly negatively impacted.
The government of Mainland China has adopted direct selling and anti-pyramiding regulations that impose significant restrictions and limitations on the way we do business. Most notably, the regulations prohibit multi-level compensation, which is the basis of how we compensate our sales force outside of Mainland China. The regulations also prohibit foreigners from participating in direct selling in Mainland China. We have structured our business model in Mainland China based on several factors: the guidance we have received from government officials, our interpretation of applicable regulations, our understanding of the practices of other international direct selling companies operating in Mainland China, and our understanding as to how regulators are interpreting and enforcing the regulations.
In Mainland China, we utilize sales employees to sell products through our retail stores and website, independent direct sellers who can sell away from our stores where we have obtained direct selling licenses, and independent marketers who are licensed business owners authorized to sell our products either at their own approved premises or through our stores.
We generally compensate our Sales Leaders at a level that is competitive with other direct selling companies in the market and reflective of the compensation of our Sales Leaders globally. The nature of the political, regulatory and legal systems in Mainland China gives regulatory agencies at both the local and central levels of government broad discretion to interpret and enforce regulations as they deem appropriate to promote social order. We face a risk that regulators may change the way in which they currently interpret and enforce the direct selling regulations, or that such regulations may be modified
.
If our business practices are deemed to be in violation of applicable regulations as they may be interpreted or enforced, in particular our use of the sales productivity of a Sales Leader and the sales representatives that such Sales Leader leads and supervises in setting his/her salary on a quarterly basis, then we could be sanctioned and/or required to change our business model, either of which could significantly harm our business.
Our ability to expand our business in Mainland China could be negatively impacted if we are unable to obtain additional necessary national and local government approvals in Mainland China.
As of January 31, 2017, we have obtained direct selling licenses in 34 cities in 22 provinces and municipalities in Mainland China. In order to expand our direct selling model into additional provinces, we currently must obtain a series of approvals from district, city, provincial and national government agencies with respect to each province in which we wish to expand. The process for obtaining the necessary government approvals to conduct direct selling continues to evolve and is lengthy, as we are required to work with a large number of provincial, city, district and national government authorities. The complexity of the approval process as well as the government's continued cautious approach as direct selling develops in Mainland China makes it difficult to predict the timeline for obtaining these approvals. Furthermore, any media or regulatory scrutiny of our business in Mainland China could increase the time and difficulty we may face in obtaining additional licenses. If media or regulatory scrutiny of our business in Mainland China results in significant delays in obtaining licenses elsewhere in Mainland China, or if the current processes for obtaining approvals are delayed further for any reason or are changed or interpreted differently than currently understood, our ability to receive direct selling licenses in Mainland China and our growth prospects in this market, could be negatively impacted.
-25-
If we are not able to register products for sale in Mainland China, our business could be harmed.
We face lengthy timelines with respect to product registrations in Mainland China. The process for obtaining product permits and licenses may require extended periods of time that may prevent us from launching new product initiatives in Mainland China on the same timelines as other markets around the world. For example, products marketed in Mainland China as "health foods" are subject to extensive laboratory and clinical analysis by government authorities, and the product registration process in Mainland China generally takes one to two years, but may be substantially longer. We market both "health foods" and "general foods" in Mainland China. There is some risk associated with the common practice in Mainland China of marketing a product as a "general food" while seeking "health food" classification. If government officials feel the categorization of our products is inconsistent with product claims, ingredients or function, this could end or limit our ability to market such products in Mainland China in their current form.
As we expand our direct selling channel, we face additional product marketing restrictions, compared to our retail store channel. Under applicable direct selling regulations in Mainland China, we can only register our own manufactured products for direct selling and we are not permitted to market or sell "general foods" through our direct sales channel. Some products have traditionally been manufactured by third parties. If we cannot successfully implement our own manufacturing of these products, we will not be able to sell these products through the direct sales channel. Any efforts by our independent direct sellers to market and sell general food products or third-party manufactured products we currently sell through our retail stores could result in negative publicity, fines and other government sanctions being imposed against us.
Our business could be negatively impacted if we fail to execute our product launch process or ongoing product sales due to difficulty in forecasting or increased pressure on our supply chain, information systems and management.
Prior to making a product generally available for purchase in a market, we typically do a promotional offering of the product, such as a preview of the product to our key Sales Leaders in the market, a limited-time offer, or other type of promotion. Sales Leader previews, limited-time offers and other promotions may generate significant activity and a high level of purchasing, which can result in a higher-than-normal increase in revenue during the quarter and can skew year-over-year and sequential comparisons.
We may experience difficulty
effectively managing growth associated with these offers and may face
increased risk of improper sales force activities and related government scrutiny. In addition, the size and condensed schedule of these product launches increases pressure on our supply chain and order processing systems. If we are unable to accurately forecast sales levels in each market for product launches or ongoing product sales, obtain sufficient ingredients or produce a sufficient supply to meet demand, we may incur higher expedited shipping costs and we may temporarily run out of stock of certain products, which could negatively impact the enthusiasm of our sales force and consumers. Conversely, if demand does not meet our expectations for a product launch or ongoing product sales or if we change our planned launch strategies or initiatives, we could incur inventory write-downs. For example, in 2014 and 2015, we incurred inventory write-downs of $50.0 million and $37.9 million, respectively, which primarily resulted from reduced sales expectations primarily in our Greater China region. Any additional write-down of inventory in any of our markets would negatively impact our gross margins. Although our previous limited-time offers have not materially affected our product return rate, these events may increase our product return rate in the future. If we fail to effectively forecast or manage our supply chain and information systems in the product launch process or for ongoing product sales, our reputation and profitability could be negatively impacted.
-26-
If our
ageLOC Spa
systems or
Pharmanex BioPhotonic
Scanner
are determined to be medical devices in a particular geographic market or if our sales force uses these products for medical purposes or makes improper medical claims, our ability to continue to market and distribute such tools could be harmed, and we could face legal or regulatory actions.
One of our strategies is to market unique and innovative products and tools that allow our sales force to distinguish our products, including our
ageLOC Spa
systems or
Pharmanex BioPhotonic
Scanner
. Any determination by regulatory authorities in our markets that these products must receive clearance or be registered as medical devices could restrict our ability to import or sell the product in such market until registration is obtained. While we have not been required to register our
ageLOC Spa
systems or
Pharmanex BioPhotonic Scanner
as medical devices in most of our markets, we have registered our facial spa as a medical device in Indonesia, Thailand and Colombia. In addition, we have received clearance from the United States Food and Drug Administration to market a facial spa device for over-the-counter use. There have been legislative proposals in Singapore and Malaysia relating to the regulation of medical devices that could affect the way we market our
ageLOC Spa
systems and
Pharmanex BioPhotonic Scanner
in these countries. In addition, if our sales force attempts to import or export products from one market to another in violation of our policy or is making medical claims regarding our products or using our products to perform medical diagnoses or other activities limited to licensed professionals or approved medical devices (in markets where the product is not approved), it could negatively impact our ability to market or sell these products and subject us to legal or regulatory actions. For example, in January 2016, our Taiwan subsidiary received a notification of charges related to alleged violations of local law by our Taiwan subsidiary and certain employees and Taiwan distributors. The notice alleges that
ageLOC Spa
devices were inappropriately sold in Taiwan in 2011 and 2012. Our Taiwan subsidiary has never sold the
ageLOC Spa
device in Taiwan, and has vigorously contested these charges in the proceedings that have been held to date. The local law that was in effect at the time of the alleged violations provided that the alleged violations carry a maximum fine payable by our Taiwan subsidiary of up to NT$100,000 (approximately US$3,000). In addition, individuals involved could face similar fines and possible jail sentences of up to three years.
Where necessary, obtaining medical device registrations and clearances could require us to provide documentation concerning product manufacturing and clinical utility, to make design, specification and manufacturing process modifications to meet standards imposed on medical device companies, and to modify our marketing claims regarding the registered product. While we successfully obtained clearance to market a facial spa device for over-the-counter use in the United States, and registered a facial spa unit as a medical device in Indonesia, Thailand and Colombia, because medical device regulations vary widely from country to country, there can be no assurance we will not face challenges or delays in obtaining clearance in other markets, or that we will be able to make any required modifications or provide documentation necessary to obtain clearance. If we obtain such medical device clearance in order to sell a product in one market, such clearance may be used as precedent for requiring similar approval for the product in another market, or for similar products in the same market. These additional requirements could increase the cost associated with manufacturing and selling these products as non-medical devices in such markets.
-27-
Laws and regulations may prohibit or severely restrict direct selling and cause our revenue and profitability to decline, and regulators could adopt new regulations that harm our business.
Various government agencies throughout the world regulate direct sales practices. Laws and regulations in Japan, South Korea and Mainland China are particularly stringent and subject to broad discretion in enforcement by regulators. These laws and regulations are generally intended to prevent fraudulent or deceptive schemes, often referred to as "pyramid schemes," that compensate participants primarily for recruiting additional participants without significant emphasis on product sales to consumers. The laws and regulations in our current markets often:
|
•
|
impose requirements related to order cancellations, product returns, inventory buy-backs and cooling-off periods for
our sales force
and consumers;
|
|
•
|
require us, or our
sales force
, to register with government agencies;
|
|
•
|
impose limits on the amount of sales compensation we can pay;
|
|
•
|
impose reporting requirements; and
|
|
•
|
require that we ensure, among other things, that our sales force maintain levels of product sales to qualify to receive commissions and that our sales force is compensated primarily for selling products and not for recruiting others.
|
Complying with these widely varying and sometimes inconsistent rules and regulations can be difficult, time-consuming and expensive, and may require significant resources. The laws and regulations governing direct selling are modified from time to time, and, like other direct selling companies, we are subject from time to time to government inquiries and investigations in our various markets related to our direct selling activities. This can require us to make changes to our business model and aspects of our sales compensation plan in the markets impacted by such changes and investigations. In addition, countries where we currently do business could change their laws or regulations to prohibit direct selling. If we are unable to continue business in existing markets or commence operations in new markets because of these laws, our revenue and profitability may decline.
Limits on the amount of sales compensation we pay could inhibit our ability to attract and retain our sales force, negatively impact our revenue and cause regulatory risks.
Several countries, including Mainland China, South Korea, Indonesia and Vietnam, impose limits on the amount of sales compensation we can pay to our sales force. For example, under regulations in Mainland China, direct selling companies may pay independent direct sellers in Mainland China up to a maximum 30% of the revenue they generate through their own sales of products to consumers. Additionally, in South Korea, local regulations limit sales compensation to 35% of our total revenue in South Korea. These regulations limit the incentive for people to join our sales force and may reduce our ability to differentiate ourselves from our competitors in attracting and retaining our sales force.
In addition, we have been required to modify our sales compensation plan in certain countries, including South Korea
,
from time to time to remain in compliance with applicable sales compensation limits. Because sales compensation, as a percentage of revenue, can fluctuate as sales force productivity fluctuates, we may be required to make further changes to stay within applicable sales compensation limits or may be at risk of exceeding them. In addition, which revenues and expenses are within the scope of these regulations is not always clear, and interpretation and enforcement of these laws are subject to change, which could require us to make further changes or result in non-compliance with these regulations. Any failure to keep sales compensation within the limits in Mainland China, South Korea, Indonesia, Vietnam or any other country that imposes a sales compensation limit could result in fines or other sanctions, including suspensions
.
-28-
Government regulations and private party actions relating to the marketing and advertising of our products and services may restrict, inhibit or delay our ability to sell our products and harm our business.
Government authorities regulate advertising and product claims regarding the efficacy and benefits of our products. These regulatory authorities typically require adequate and reliable scientific substantiation to support any marketing claims. What constitutes such reliable scientific substantiation can vary widely from market to market and there is no assurance that the research and development efforts that we undertake to support our claims will be deemed adequate for any particular product or claim. If we are unable to show adequate and reliable scientific substantiation for our product claims, or our marketing materials or the marketing materials of our
sales force
make claims that exceed the scope of allowed claims for dietary supplements, cosmetics or tools that we offer, the FDA or other regulatory authorities could take enforcement action requiring us to revise our marketing materials, amend our claims or stop selling certain products, which could harm our business.
For example, in recent years, the FDA has issued warning letters to many cosmetic companies alleging improper structure/function claims regarding their cosmetic products, including, for example, product claims regarding gene activity, cellular rejuvenation, and rebuilding collagen. There is a degree of subjectivity in determining whether a claim is an improper structure/function claim. Given this subjectivity and our research and development focus on the sources of aging and the influence of certain ingredients on gene expression, there is a risk that we could receive a warning letter, be required to modify our product claims or take other actions to satisfy the FDA if the FDA determines any of our marketing materials include improper structure/function claims for our cosmetic products. In addition, plaintiffs' lawyers have filed class action lawsuits against some of our competitors after our competitors received these FDA warning letters. There can be no assurance that we will not be subject to government actions or class action lawsuits, which could harm our business.
In 2009 in the United States, the FTC approved revisions to its Guides Concerning the Use of Endorsements and Testimonials in Advertising ("Guides") that require disclosure of material connections between an endorser and the company they are endorsing and generally do not allow marketing using atypical results. Our
sales force
has historically used testimonials and "before and after" photos to market and sell some of our popular products such as
our
ageLOC Spa
systems
and
ageLOC Transformation
anti-aging skin care system. We intend to continue to use testimonials for our popular products, including weight management products. In highly regulated and scrutinized product categories such as weight management, i
f we or our
sales force
fails to comply with the Guides or makes improper product claims, the FTC could bring an enforcement action against us and we could be fined and/or forced to alter our marketing materials.
Regulations governing the registration or pre-approval of our products could harm our business.
Our products are subject to numerous domestic and foreign government agencies' and authorities' laws and extensive regulations governing the ingredients and products that may be marketed without pre-market approval and/or registration as a drug or medical device. Many of these laws and regulations involve a high level of subjectivity, are inherently fact-based and subject to interpretation, and vary significantly from market to market. These laws and regulations can also limit the claims we can make regarding our products and often restrict our ability to introduce products or ingredients into one or more markets.
At times these laws and regulations may delay or prevent us altogether from launching a product in a market, require us to reformulate a product or limit or amend the claims made regarding a product. If these laws and regulations further restrict, inhibit or delay our ability to introduce or market our products or limit the claims we are able to make regarding our products, our business may be harmed.
-29-
For example, in the United States some legislators and industry critics have pushed for years to increase regulatory authority by the FDA over nutritional supplements. In 2011, the FDA proposed draft guidance to clarify the FDA's interpretation of the dietary ingredient notification requirements, and in August 2016, the FDA issued a revised draft guidance that superseded the 2011 version. This draft guidance is not final yet but appears to indicate that the FDA is expanding its definition of what is considered a "new dietary ingredient" in the United States. The industry has worked with the FDA for several years, providing comments to the FDA to modify this guidance. While still in flux, if enacted in final form as proposed, this guidance could impose new and significant regulatory barriers for our nutritional supplement products or unique ingredients, which could delay or inhibit our ability to formulate, introduce and sell nutritional supplements as we have in the past.
We face similar pressures in our other markets, including Europe, which continues to set new limits on acceptable maximum levels of various vitamins and minerals. In Europe, for example, we are unable to market supplements that contain ingredients that were not marketed in Europe prior to May 1997 ("novel foods") without going through an extensive registration and pre-market approval process.
Such regulations in any given market can also limit our ability to import products and can delay product launches as we go through the registration and approval process for those products. Furthermore, if we fail to comply with these regulations, we could face enforcement action
,
and we could be fined or forced to alter or stop selling our products.
The FDA does not have a pre-market approval system for cosmetics. However, cosmetic products may become subject to more extensive regulation in the future. These events could interrupt the marketing and sale of our products, severely damage our brand reputation and image in the marketplace, increase the cost of our products, cause us to fail to meet customer expectations or cause us to be unable to deliver merchandise in sufficient quantities or of sufficient quality to our stores, any of which could result in lost sales, which could have a material adverse effect on our business, financial condition, profitability and cash flows.
New regulations governing the introduction, marketing and sale of our products to consumers could harm our business.
Our operations could be harmed if new laws or regulations are enacted that restrict our ability to market or distribute our products or impose additional burdens or requirements on us in order to continue selling our products. In addition, the adoption of new regulations or changes in the interpretations of existing regulations may result in significant compliance costs or discontinuation of product sales and may impair the marketability of our products, resulting in significant loss of net sales.
We have observed a general increase in regulatory activity and activism in the United States and across many markets globally where we operate and the regulatory landscape is becoming more complex with increasingly strict requirements. If this trend continues, we may find it necessary to alter some of the ways we have traditionally marketed our products in order to stay in compliance with a changing regulatory landscape and this could add to the costs of our operations and/or have an adverse impact on our business.
We cannot predict the nature of any future laws, regulations, interpretations, or applications, nor can we determine what effect additional governmental regulations or administrative orders, when and if promulgated, would have on our business. Future changes could include requirements for the reformulation of certain products to meet new standards, the recall or discontinuation of certain products that cannot be reformulated, additional record keeping, expanded documentation of the properties of certain products, expanded or different labeling, and additional scientific substantiation. Any or all of these requirements could have a material adverse effect on our business, financial condition, and operating results.
-30-
Our operations could be harmed if we fail to comply with Good Manufacturing Practices.
In the United States, FDA regulations on Good Manufacturing Practices and Adverse Event Reporting requirements for the nutritional supplement industry require us and our vendors to maintain good manufacturing processes, including stringent vendor qualifications, ingredient identification, manufacturing controls and record keeping.
Good Manufacturing Practices also apply to our OTC drugs, devices and conventional foods, and Adverse Event Reporting requirements apply to OTC drugs and devices.
The ingredient identification requirement, which requires us to confirm the levels, identity and potency of ingredients listed on our product labels within a narrow range, is particularly burdensome and difficult for us with respect to our product formulations, which contain many different ingredients. We are also required to report serious adverse events associated with consumer use of our products. Potential FDA responses to any such report could include injunctions, product withdrawals, recalls, product seizures, fines, or criminal prosecutions. Our operations could be harmed if regulatory authorities make determinations that we, or our vendors, are not in compliance with these regulations or public reporting of adverse events harms our reputation for quality and safety. A finding of noncompliance may result in administrative warnings, penalties or actions impacting our ability to continue selling certain products. In addition, c
ompliance with these regulations has increased and may further increase the cost of manufacturing certain of our products as we work with our vendors to assure they are qualified and in compliance. Failure to comply with Good Manufacturing Practices could also result in product recalls. For example, we recently had a recall of three minor products in the United States based on labeling issues for those products. Our business could be harmed in the future if we are required to recall any product.
The loss of suppliers or shortages in ingredients could harm our business.
We acquire ingredients and products from third-party suppliers and manufacturers. A loss of any of these suppliers and any difficulties in finding or transitioning to alternative suppliers could harm our business. In addition, we obtain some of our products, including our
ageLOC
Spa
systems and
Tru Face Essence
products from sole suppliers that own or control the product formulations, ingredients or other intellectual property rights associated with such products. We also license the right to distribute some of our products from third parties. In the event we are unable to renew these contracts, we may need to discontinue some products or develop substitute products, which could harm our revenue. In addition, if we experience supply shortages or regulatory impediments with respect to the raw materials and ingredients we use in our products, we may need to seek alternative supplies or suppliers and may experience difficulties in finding ingredients that are comparable in quality and price. For example, some of our nutritional products, including
g3
juice and
ageLOC Youth
(
Youthspan
or
Y-Span
in some markets) incorporate unique natural ingredients that are only harvested once a year and may have limited global supplies. If demand exceeds forecasts, we may have difficulties in obtaining additional supplies to meet the excess demand until the next growing season. If we are unable to successfully respond to such issues, our business could be harmed.
Production difficulties, quality control problems
,
inaccurate forecasting and reliance on third-party suppliers could harm our business.
Production difficulties, quality control problems, inaccurate forecasting and our reliance on third party suppliers to manufacture and deliver products that meet our specifications in a timely manner could harm our business. Occasionally, we have experienced production difficulties with respect to our products, including the availability of raw materials and products that do not meet our specifications and quality control standards. These production difficulties and quality problems have in the past, and could in the future, result in stock outages or shortages in our markets with respect to such products, harm our sales, or create inventory write-downs for unusable products.
Our
ageLOC Me
customized skin care system includes multiple new product formulations and a new proprietary hands-free dispenser. By gathering information from consumers through a series of questions on a mobile-device app,
ageLOC Me
enables consumers to personalize a daily regimen based on individual preferences and skin care needs. It is possible that the product formulations, dispenser and degree of customization will not meet consumers' expectations and customization might not be compatible with consumers' skin sensitivities and selected preferences. The system contains a large number of SKUs, and there is a degree of unpredictability in forecasting inventory needs globally due to the complexity and number of customized cartridges available. During the initial launch of
ageLOC Me
, we experienced production difficulties and a slightly higher return and complaint rates. Although these issues have been addressed, any problems with
ageLOC Me
or our other products could lead to an increase in product returns or stock-outs and negatively impact our reputation, revenue and profitability.
-31-
Product diversion may have a negative impact on our business.
We see our products being sold through online or other distribution channels in certain markets. Although we continually take steps to control product diversion, including for products sold in Mainland China, this activity continues to be a challenge. Product diversion causes confusion regarding our distribution channels and negatively impacts the ability of our
sales force
to sell our products. It also creates a negative impression regarding the viability of the business opportunity for our
sales force
, which can harm our ability to recruit new people to join our
sales force
. Product diversion schemes may also involve illegal importation, investment or other activities and harm our brand if gray market or counterfeit goods are passed off as our own. If we are unable to effectively address this issue or if diversion increases, our business could be harmed.
Changes to our sales compensation plans could be viewed negatively by some of our
sales force
, could fail to achieve desired long-term results and have a negative impact on revenue.
Our
sales
compensation plans include some components that differ from market to market. We modify components of our
sales
compensation plans from time to time to keep our
sales
compensation plans competitive and attractive to our existing
sales force
and people interested in joining our
sales force
, to address changing market dynamics, to provide incentives to
our sales force
that we believe will help grow our business, to conform to local regulations and to address other business needs. Because of the size of our sales force and the complexity of our
sales
compensation plans, it is difficult to predict how such changes will be viewed by
our sales force
and whether such changes will achieve their desired results. For example, certain changes we made to our
sales
compensation plan in the past, which were successful in several markets, did not achieve anticipated results in certain other markets and negatively impacted our business.
In addition, we have been required to modify our sales compensation plan in certain countries, including South Korea
,
from time to time to remain in compliance with applicable sales compensation limits
.
Changes to reduce sales compensation have had a negative impact on the sales force in the past and could in the future.
Adverse publicity concerning our business, marketing plan, products or people could harm our business and reputation.
Growth in our sales force and consumers and our results of operations can be particularly impacted by adverse publicity regarding us, the nature of our direct selling business models, our products or the actions of our sales force and employees. Given the nature of our operations and our continuous need to recruit and retain consumers and members of our sales force, we are particularly vulnerable to adverse publicity. Specifically, we are susceptible to adverse publicity concerning:
-32-
|
•
|
suspicions about the legality and ethics of network marketing;
|
|
•
|
continued media or regulatory scrutiny regarding our business in Mainland China;
|
|
•
|
the safety or effectiveness of ingredients in our or our competitors' products;
|
|
•
|
inquiries, investigations, fines, legal actions, or mandatory or voluntary product recalls involving us, our competitors
,
or our respective products;
|
|
•
|
the actions of our current or former sales force and employees; and
|
|
•
|
public perceptions of the direct selling industry or the nutritional or personal care industry generally.
|
In addition, these issues have previously resulted in negative publicity and have harmed our business. Critics of our industry, short sellers and other individuals who want to pursue an agenda have in the past and may in the future utilize the Internet, the press and other means to publish criticisms of the industry, our company and our competitors, or make allegations regarding our business and operations, or the business and operations of our competitors. We or others in our industry may receive similar negative publicity or allegations in the future, and it may harm our business and reputation.
We may become involved in legal proceedings and other matters that, if adversely adjudicated or settled, could adversely affect our financial results.
We have been, and may again become in the future, party to litigation, investigations or other legal matters. For example, in 2014, we were named as a defendant in a purported class action complaint relating to negative media and regulatory scrutiny of our business in Mainland China and as a nominal defendant in a shareholder derivative suit relating to the same issues. Also, beginning in 2014, we were in discussions with the Securities and Exchange Commission ("SEC"), which discussions were focused on a charitable donation we made in China in 2013 and issues related thereto. In April 2015, the SEC informed us that it was initiating a non-public, formal investigation into these issues. We also have been involved in two separate disputes with customs authorities in Japan with respect to customs assessments on several of our products. Although we settled the purported class action, shareholder derivative action and SEC investigation during 2016 and the Japan courts reached decisions on the customs disputes in 2013 and 2016 (we have appealed the 2016 decision), these matters were, and any future matters that we may become involved in may be, expensive and time consuming. In general, litigation claims could result in settlements or damages that could significantly affect financial results. It is not possible to predict the final resolution of any litigation to which we may become party, and the impact of these matters on our business, results of operations and financial condition could be material.
Please refer to Item 3. "Legal Proceedings" for more information regarding the 2016 Japan customs matter
.
Non-compliance with anti-corruption laws could harm our business.
Our international operations are subject to anti-corruption laws, including the Foreign Corrupt Practices Act (the "FCPA"). Allegations that we are not in compliance with anti-corruption laws may require us to dedicate time and resources to an internal investigation of the allegations or may result in a government investigation. Any determination that our operations or activities are not in compliance with existing anti-corruption laws or regulations could result in the imposition of substantial fines and other penalties from U.S. or other regulatory entities, who have recently brought a number of enforcement actions against companies with extensive international operations. For example, in 2014, one of our competitors entered into a large settlement with U.S. regulators related to allegations that its employees violated the FCPA in Mainland China and other markets. Additionally, in September 2016, we reached a resolution with the SEC, in which the SEC found that our books and records and internal controls related to a charitable contribution in China in 2013 were insufficient, and we agreed to pay $765,688 to the SEC. In agreeing to this settlement, we neither admitted nor denied the SEC's findings. Although we have implemented additional anti-corruption policies, controls and training globally to prevent similar situations from arising in the future, we cannot be certain that these efforts will be effective. As a result, we may face fines or penalties in the future under the FCPA or other anti-corruption laws.
-33-
Our ability to conduct business in international markets may be affected by political, legal, tax and regulatory risks.
Our ability to capitalize on growth in new international markets and to maintain the current level of operations in our existing international markets is exposed to risks associated with our international operations, including:
|
•
|
the possibility that a government might ban or severely restrict our sales compensation and business models;
|
|
•
|
the possibility that local civil unrest, political instability or changes in diplomatic or trade relationships might disrupt our operations in an international market;
|
|
•
|
the lack of well-established or reliable legal systems in certain areas where we operate;
|
|
•
|
the presence of high inflation in the economies of international markets in which we operate;
|
|
•
|
the possibility that a government authority might impose legal, tax, customs, or other financial burdens on us or our
sales force
, due, for example, to the structure of our operations in various markets;
|
|
•
|
the possibility that a government authority might challenge the status of our
sales force
as independent contractors or impose employment or social taxes on our
sales force
; and
|
|
•
|
the possibility that governments may impose currency remittance restrictions limiting our ability to repatriate cash.
|
We depend on our key personnel, and the loss of the services provided by any of our executive officers or other key employees could harm our business and results of operations.
Our success depends to a significant degree upon the continued contributions of our senior and regional management, many of whom would be difficult to replace. Our senior and regional management employees may voluntarily terminate their employment with us at any time. In addition, we need to continue to attract and develop qualified management personnel to sustain growth in our markets. If we are not able to successfully retain existing personnel and identify, hire and integrate new personnel, our business and growth prospects could be harmed.
-34-
Government authorities may question our tax or customs positions or change their laws in a manner that could increase our effective tax rate or otherwise harm our business.
As a U.S. company doing business globally, we are subject to all applicable tax and customs laws, including those relating to intercompany pricing regulations and transactions between our corporate entities in the jurisdictions in which we do business. Periodically, we are audited by tax and customs authorities around the world. If authorities challenge our tax or customs positions, including those regarding transfer pricing and customs valuation and classification, we may be subject to penalties, interest and payment of back taxes or customs duties. Since tax rates vary from country to country, any tax assessments might also impact the ability to fully utilize foreign tax credits on our U.S. consolidated tax return. The tax and customs laws in each jurisdiction are continually changing and are further subject to interpretation by the local government agencies. We have experienced increased efforts by customs authorities in some countries to reclassify our products or otherwise increase the level of duties we pay on our products. Despite our best efforts to be aware of and comply with tax and customs laws, including changes to and interpretations thereof, there is a potential risk that the local authorities may argue that we are out of compliance. Such situations may require that we defend our positions and/or adjust our operating procedures in response to such changes. Any or all of these potential risks may increase our effective tax rate, increase our overall tax costs or otherwise harm our business.
We may be held responsible for certain taxes or assessments relating to the activities of our independent distributors, which could harm our financial condition and operating results.
Generally, our independent distributors are subject to taxation in their country of residency. In some jurisdictions, government agencies impose an obligation on us to collect taxes and to maintain appropriate records. Furthermore, in some jurisdictions, we are subject to the risk of being responsible for social security and similar taxes with respect to our independent distributors. In the event that local laws and regulations, or the interpretation of local laws and regulations, change to require us to treat our independent distributors as employees, or that our independent distributors are deemed by local regulatory authorities in one or more of the jurisdictions in which we operate to be our employees rather than independent contractors under existing laws and interpretations, we may be held responsible for social security and related taxes in those jurisdictions, plus any related assessments and penalties, which could harm our financial condition and operating results. If our independent distributors were deemed to be employees rather than independent contractors, we would also face the risk of increased liability for their actions.
The loss of or a disruption in our manufacturing and distribution operations could adversely affect our business.
As of December 31, 2016, our principal properties consisted of our corporate headquarters and other office locations, distribution centers and warehouses, research and development centers, manufacturing facilities, retail stores and service centers located in many of our markets. Additionally, we also use third party manufacturers to manufacture many of our key products. As a company engaged in manufacturing, distribution and research and development on a global scale, we are subject to the risks inherent in such activities, including industrial accidents, environmental events, fires, strikes and other labor or industrial disputes, disruptions in logistics or information systems, loss or impairment of key manufacturing or distribution sites, import and export restrictions or delays, product quality control, safety, licensing requirements and other regulatory or government issues, as well as natural disasters, pandemics, border disputes, acts of terrorism and other external factors over which we have no control. For example, the earthquake and tsunami in 2011 disrupted our operations in Japan and negatively impacted our operating results. These risks may be exacerbated by our efforts to increase facility consolidation covering our manufacturing, distribution and supply footprints or if we are unable to successfully enhance our disaster recovery planning. The loss of, or damage to, any of our facilities or centers, or that of our third party manufacturers could have a material adverse effect on our business, results of operations and financial condition.
-35-
Disruptions to transportation channels that we use to distribute our products to international warehouses may adversely affect our margins and profitability in those markets.
We may experience disruptions to the transportation channels used to distribute our products, including increased airport and shipping port congestion, a lack of transportation capacity, increased fuel expenses, import or export controls or delays, and labor disputes or shortages. Disruptions in our container shipments may result in increased costs, including the additional use of airfreight to meet demand. Congestion to ports can affect previously negotiated contracts with shipping companies, resulting in unexpected increases in shipping costs and reduction in our profitability.
Our markets are intensely competitive and market conditions and the strengths of competitors may harm our business.
The markets for our products are intensely competitive. Our results of operations may be harmed by market conditions and competition in the future. Many competitors have much greater name recognition and financial resources than we have, which may give them a competitive advantage. For example, our Nu Skin products compete directly with branded, premium retail products. We also compete with other direct selling organizations. Because of regulatory restrictions concerning claims about the efficacy of personal care products and dietary supplements, we may have difficulty differentiating our products from our competitors' products, and competing products entering the personal care and nutritional market could harm our revenue. In addition, our business may be negatively impacted if we fail to adequately adapt to trends in consumer behavior and technologies.
We also compete with other direct selling companies to attract and retain our
sales force
and consumers. Some of these competitors have longer operating histories and greater visibility, name recognition and financial resources than we do. Some of our competitors have also adopted and could continue to adopt some of our successful business strategies, including our global
sales
compensation plan. Consequently, to successfully compete in this industry, and attract and retain our
sales force
and consumers, we must ensure that our business opportunities and
sales
compensation plans are financially rewarding. We believe we have significant competitive advantages, but we cannot assure that we will be able to continue to successfully compete in this industry.
We may incur product liability claims that could harm our business.
We sell a variety of different products for human consumption and use, including cosmetics, dietary supplements, conventional foods, OTC drugs and devices. Our cosmetics, dietary supplements and conventional foods are not generally subject to pre-market approval or registration processes so we cannot rely upon a government safety panel to qualify or approve our products for use, and some ingredients may not have long histories of human consumption or use. We rely upon published and unpublished safety information including clinical studies on ingredients used in our products and conduct our own clinical and safety studies on some key ingredients and products, but not all products. A product may be safe for the general population when consumed or used as directed but could cause an adverse reaction for some individuals, such as a person who has a health condition or allergies or who is taking a prescription medication. While we include what we believe are adequate instructions and warnings and we have historically had low numbers of reported reactions, previously unknown adverse reactions could occur. If we discover that our products are causing adverse reactions, or if we determine that any of our employees have not properly handled reports of adverse reactions, we could suffer further adverse publicity or government sanctions.
-36-
As a result of the type of products that we sell, we may be subject to various product liability claims, including that the products fail to meet quality or manufacturing specifications, contain contaminants, include inadequate instructions as to their proper use, include inadequate warnings concerning side effects and interactions with other substances or for persons with health conditions or allergies, or cause adverse reactions or side effects. Consumer protection laws and regulations governing our business continue to expand, and in some states such as California, class-action lawsuits based on increasingly novel theories of liability are expanding. Product liability claims could increase our costs, and adversely affect our business and financial results. As we continue to offer an increasing number of new products through larger scale, limited-time offers our product liability risk may increase.
If our
sales force
or employees provide improper or inappropriate advice regarding our products, their use or safety, we may be subject to additional product liability.
We have generally elected to self-insure our product liability risks. We continue to periodically evaluate whether we can and should obtain product liability insurance. Based upon our current approach to product liability risk management, if any of our products are found to cause any injury or damage or we become subject to product liability claims, we will be subject to the full amount of liability associated with any injuries or damages. This liability could be substantial and may exceed our existing reserves and harm our business.
Our intellectual property may infringe on the rights of others, resulting in costly litigation
.
In recent years, there has been significant litigation in the United States involving patents and other intellectual property rights. In particular, there has been an increase in the filing of suits alleging infringement of intellectual property rights, which pressure defendants into entering settlement arrangements quickly to dispose of such suits, regardless of their merit. Other companies or individuals may allege that we, or our
sales force
, consumers, licensees or other parties indemnified by us infringe on their intellectual property rights. Even if we believe that such claims are without merit, defending such intellectual property litigation can be costly, distract management's attention and resources, and the outcome is inherently uncertain. Claims of intellectual property infringement also might require us to redesign affected products, enter into costly settlement or license agreements, pay costly damage awards, or face a temporary or permanent injunction prohibiting us from marketing or selling certain of our products. Any of these results may adversely affect our financial condition.
If we are unable to protect our intellectual property rights, our ability to compete could be negatively impacted.
The market for our products depends to a significant extent upon the value associated with our product innovations and our brand equity. We rely upon patent, copyright, trademark and trade secret laws in the United States and similar laws in other countries, and non-disclosure, confidentiality and other types of agreements with our employees,
sales force
, consumers, suppliers and other parties, to establish, maintain and enforce our intellectual property rights. Despite these measures, any of our intellectual property rights could be challenged, invalidated, circumvented or misappropriated, or such intellectual property rights may not be sufficient to permit us to provide competitive advantages, which could result in costly product redesign efforts, discontinuance of certain product offerings or other competitive harm. In addition, the laws of certain foreign countries where we have significant business, including markets such as Mainland China, do not protect our intellectual property rights to the same extent as the laws of the United States. The costs required to protect our patents and trademarks may be substantial or even not practical. We have filed patent and trademark applications to protect our intellectual property rights in our new technologies, however, there can be no assurance that our patent and trademark applications will be approved and issue, that any patents and trademarks issued will adequately protect our intellectual property, or that such patents and trademarks will not be challenged by third parties or found by a judicial authority to be invalid or unenforceable. Moreover, many of our products rely on technologies developed or licensed by third parties, and we may not be able to obtain or continue to obtain licenses and technologies from these third parties on reasonable terms or at all.
-37-
To enforce and protect our intellectual property rights, we may initiate litigation against third parties, such as patent and trademark infringement suits or interference proceedings and seek indemnification by contract or otherwise. Any lawsuits that we initiate could be expensive, take significant time and divert management's attention from other business concerns, and we may ultimately fail to prevail or recover on any indemnification claim. Litigation also puts our patents at risk of being invalidated or interpreted narrowly and our patent applications at risk of not issuing. Additionally, we may provoke third parties to assert claims against us. We may not prevail in any lawsuits that we initiate and the damages or other remedies awarded, if any, may not be commercially valuable. The occurrence of any of these events may adversely affect our financial condition or diminish our investments in this area.
If we are unable to protect the confidentiality of our proprietary information and know-how, the value of our products could be adversely affected.
In addition to patented technology, we rely on our unpatented proprietary technology, trade secrets, processes and know-how. Despite these measures, any of our intellectual property rights could be challenged, invalidated, circumvented or misappropriated. We generally seek to protect this information by confidentiality, non-disclosure and assignment of invention agreements with our employees, consultants, scientific advisors and third parties. Our employees may leave to work for competitors. Our distributors or Sales Leaders may seek other opportunities. These agreements may be breached, and we may not have adequate remedies for any such breach. In addition, our trade secrets may be disclosed to or otherwise become known or be independently developed by competitors. To the extent that our current or former employees, distributors, Sales Leaders, consultants or contractors use intellectual property owned by others in their work for us, disputes may arise as to the rights in related or resulting know-how and inventions. If, for any of the above reasons, our intellectual property is disclosed or misappropriated, it would harm our ability to protect our rights and adversely affect our financial condition.
We may be subject to claims that we, or our employees, have inadvertently or otherwise used or disclosed alleged trade secrets or other proprietary information of our employees' former employers.
We employ individuals who were previously employed at other personal care product or nutritional supplement companies, including our competitors or potential competitors. To the extent that our employees are involved in research areas that are similar to those in which they were involved with their former employers, we may be subject to claims that such employees have inadvertently or otherwise used or disclosed the alleged trade secrets or other proprietary information of the former employers. Litigation may be necessary to defend against such claims.
-38-
We will be required to repay the $210.0 million principal amount of our Convertible Notes in cash upon maturity or conversion, which may adversely affect our liquidity.
Our Convertible Notes mature in 2020 and are currently convertible at the holder's discretion at a conversion rate as of January 31, 2017 of 21.5054 per $1,000 principal amount of Convertible Notes (which represented a conversion price of $46.50 per share). Upon conversion, we are required to settle the Convertible Notes in cash with respect to the principal amount of Convertible Notes converted and any accrued and unpaid interest to such date, and in shares of our common stock with respect to any additional amounts. For more information about the Convertible Notes, see Item 7. "Management's Discussion and Analysis of Financial Condition and Results of Operations – Liquidity and Capital Resources" and Note 9 to the financial statements included in this report.
There can be no assurance that we will have sufficient financial resources, or will be able to arrange financing on favorable terms, or at all, to pay the amount of cash due upon conversion or maturity of the Convertible Notes. In addition, agreements governing any debt we have at the time such payments become due may restrict our ability to make each of the required cash payments even if we have sufficient funds to make them. If we fail to repay the Convertible Notes, to pay special interest, if any, due on the Convertible Notes, or to pay the amount of cash due upon maturity or conversion, we will be in default under the indenture governing the Convertible Notes, which in turn may result in the acceleration of other indebtedness we may then have. If the repayment of the other indebtedness were to be accelerated, we may not have sufficient funds to repay that indebtedness and to pay the amount of cash due upon maturity or conversion of the Convertible Notes. Furthermore, the use of cash to repay the Convertible Notes may adversely affect our liquidity and limit our ability to take advantage of unanticipated opportunities, to make acquisitions of other businesses or companies or to respond to changing business conditions or unanticipated competitive pressures. Any weakening of, or other adverse developments in, the U.S. or global credit markets could affect our ability to manage our debt obligations and our ability to access future debt.
In addition, if the Convertible Notes are converted we may be required to issue shares of our common stock to settle amounts due above the principal amount of the Convertible Notes, which may have a dilutive impact on holders of our common stock. Furthermore, the issuance of such shares of our common stock, any sales of shares of our common stock issuable upon such conversion of the Convertible Notes or the perception that such issuance or sales could occur could adversely affect the trading prices of our common stock. Because the number of shares of our common stock due upon conversion depends on the trading price of our common stock at the time the Convertible Notes are converted we cannot predict the extent of any dilutive or trading price impact related to the conversion of the Convertible Notes.
Any future acquisitions may expose us to additional risks.
From time to time we review acquisition prospects that would complement our current product offerings, increase the size and geographic scope of our operations or otherwise offer growth and operating efficiency opportunities. The financing for any of these acquisitions could dilute the interests of our stockholders, result in an increase in our indebtedness or both. Acquisitions may entail numerous risks, including:
|
•
|
difficulties in assimilating acquired operations or products, including the loss of key employees from acquired businesses and disruption to our direct selling channel;
|
|
•
|
diversion of management's attention from our core business;
|
|
•
|
adverse effects on existing business relationships with our suppliers,
sales force
or consumers; and
|
|
•
|
risks associated with entering markets in which we have limited or no prior experience.
|
Our failure to successfully complete the integration of any acquired business could have a material adverse effect on our business, financial condition and operating results. In addition, there can be no assurance that we will be able to identify suitable acquisition candidates or consummate acquisitions on favorable terms.
A failure of our internal controls over financial reporting or our compliance efforts could harm our stock price and our financial and operating results or could result in fines or penalties.
We have implemented internal controls to help ensure the accuracy of our financial reporting and have implemented compliance policies and programs to help ensure that our employees and
sales force
comply with applicable laws and regulations. Our internal audit team regularly audits our internal controls and various aspects of our business and compliance program, and we regularly assess the effectiveness of our internal controls. There can be no assurance, however, that our internal or external assessments and audits will identify all significant deficiencies or material weaknesses in our internal controls. A failure to correct a deficiency in internal controls could result in the ongoing deficiency being reclassified and disclosed as a material weakness. If a material weakness results in a material misstatement of our financial results, we would be required to restate our financial statements. For example, for the first three quarters of 2014, our management concluded that we did not maintain effective controls over the presentation and disclosure of hyper-inflationary accounting for our Venezuela subsidiary. As a result of this material weakness, we decided to restate our consolidated financial statements for the first quarter of 2014.
From time to time, we initiate further investigations into our business operations based on the results of our internal and external audits or on complaints, questions or allegations made by employees or other parties regarding our business practices and operations. In addition, our business and operations may be investigated by applicable government authorities. In the event any of these investigations identify material violations of applicable laws by our employees or our
sales force
, we could be subject to adverse publicity, fines, penalties or loss of licenses or permits.
System failures could harm our business.
With global operations and a complex sales compensation plan, our business is highly dependent on efficiently functioning information technology systems. Our systems may be damaged or disrupted by fires, floods, earthquakes or other natural disasters, telecommunications failures, break-ins, sabotage, intentional acts of vandalism and similar misconduct. We have adopted and implemented a Business Continuity/Disaster Recovery Plan. Our data is archived and stored at third-party secure sites and we have recovery sites for certain critical data and operations. Growth in our business could also strain our systems. There can be no assurance that our systems will not be significantly damaged or disrupted or that our systems will be adequate to meet our future business needs or that a system failure will not significantly damage the Company's reputation.
-39-
Cyber security risks and the failure to maintain the integrity of company, employee, sales force or guest data could expose us to data loss, litigation and liability, and our reputation could be significantly harmed.
We collect and retain large volumes of company, employee, sales force and guest data, including credit card numbers and other personally identifiable information, for business purposes, including for transactional and promotional purposes, and our various information technology systems enter, process, summarize and report such data. The integrity and protection of this data is critical to our business. We are subject to significant security and privacy regulations, as well as requirements imposed by the credit card industry. Maintaining compliance with these evolving regulations and requirements could be difficult and may increase our expenses. In addition, a penetrated or compromised data system or the intentional, inadvertent or negligent release, misuse or disclosure of data could result in theft, loss or fraudulent or unlawful use of company, employee, sales force or guest data which could negatively impact our results and reputation, disrupt our operations, or result in remedial and other costs, fines or lawsuits.
Epidemics and other crises could negatively impact our business.
Due to the person-to-person nature of direct selling, our results of operations could be harmed if the fear of a communicable and rapidly spreading disease or other crises such as natural disasters result in travel restrictions or cause people to avoid group meetings or gatherings or interaction with other people. It is difficult to predict the impact on our business, if any, of the emergence of new epidemics or other crises. In addition, most of our Pharmanex nutritional supplement revenue is generated from products that are encapsulated in bovine- and/or porcine-sourced gel capsules. If we experience production difficulties, quality control problems or shortages in supply in connection with bovine or porcine related health concerns, this could result in additional risk of product shortages or write-downs of inventory. We may be unable to introduce our products in some markets if we are unable to obtain the necessary regulatory approvals or if any product ingredients are prohibited, which could harm our business.
The market price of our Class A common stock is subject to significant fluctuations due to a number of factors that are beyond our control.
Our Class A common stock closed at $40.98 per share on January 3
0
, 2015 and closed at $51.88 per share on January 31, 2017. During this two-year period, our Class A common stock traded as low as $23.51 per share and as high as $66.04 per share. Many factors, including some we may be unable to control, could cause the market price of our Class A common stock to fall. Some of these factors include:
|
•
|
fluctuations in our operating results;
|
|
•
|
government investigations of our business;
|
|
•
|
adverse publicity related to our business, products, industry or competitors;
|
|
•
|
the sale of shares of Class A common stock by significant stockholders;
|
|
•
|
general trends in the market for our products;
|
|
•
|
acquisitions by us or our competitors;
|
|
•
|
economic or currency exchange issues in markets in which we operate;
|
|
•
|
changes in estimates of our operating performance or changes in recommendations by securities analysts;
|
|
•
|
speculative trading, including short selling and options trading; and
|
|
•
|
general business and political conditions.
|
Broad market fluctuations could also lower the market price of our Class A common stock regardless of our actual operating performance.
-40-
Some of the markets in which we operate may become highly inflationary, which could negatively impact our financial position, results of operations or cash flows.
In some of our markets, we face risks associated with high levels of inflation. High levels of inflation and currency devaluations in any of our markets could negatively impact our balance sheet and results of operations.
The functional currency in countries that are designated as highly inflationary economies under U.S. generally accepted accounting principles is the U.S. dollar, and transactions denominated in the local currency are remeasured as if the functional currency were the U.S. dollar. The remeasurement of local currencies into U.S. dollars creates translation adjustments, which are included in the consolidated statements of operations. For example, during 2014 and 2015, we recorded $46.3 million and $10.2 million, respectively, of non-cash foreign currency charges related to the devaluation of the Venezuela currency. During the third quarter of 2016, we ceased business operations in Venezuela. Although we did not operate in any country other than Venezuela that was considered to have a highly inflationary economy during the periods ended December 31, 2014, 2015 and 2016, other countries, including Argentina and Ukraine, have experienced weakening currencies, and it is currently possible that such countries may be so designated in the future. Our Venezuela, Argentina and Ukraine subsidiaries' net sales revenue each represented less than 1% of consolidated net sales revenue during each of the periods ended December 31, 2014, 2015 and 2016.
Some of the markets in which we operate have currency controls in place, which may restrict our repatriation of cash.
If foreign governments restrict transfers of cash out of their country and control exchange rates, we may be limited as to the timing and amount of cash we can repatriate and may not be able to repatriate cash at beneficial exchange rates, which could have a material adverse effect on our financial position, results of operations or cash flows.
We typically fund the cash requirements of our operations in the U.S. through intercompany charges for products, license fees and corporate services. However, in some markets such as Mainland China, where we have lower intercompany charges, we may be unable to repatriate cash from current operations in the form of dividends until we file the necessary statutory financial statements for the relevant period. As of December 31, 2016, we had $86.5 million in cash denominated in Chinese RMB. Currency exchange restrictions in Venezuela also impeded our Venezuela subsidiary's ability to obtain U.S. dollars to pay for imported products or to repatriate dividends to the United States. We ceased business operations in Venezuela in the third quarter of 2016.
-41-
None.
Our principal properties consist of the following:
Offices
We have administrative offices at our corporate headquarters in Provo, Utah, and in various markets, including in Shanghai, China.
Distribution Centers
We distribute our products through distribution centers and warehouses in many of our markets, including in Provo, Utah; Shanghai, China; Chungcheong buk-do, Korea; Venlo, Netherlands; and Tokyo, Japan.
Research and Development Centers
We operate research and development centers in Provo, Utah, and in Shanghai, China.
Manufacturing Facilities
We operate manufacturing facilities in Mainland China.
Retail Stores, Service Centers, Walk-in Centers and Pick-up Locations
We operate walk-in centers and pick-up locations in many of our markets. We also operate retail stores and service centers in Mainland China.
We own our corporate headquarters buildings, distribution center and research and development center located in Provo, Utah; the structure and improvements of our administrative offices in Shanghai, China; our distribution center in Chungcheong buk-do, Korea; and a few other minor facilities. We currently lease the other properties described above. We believe that our existing and planned facilities are adequate for our current operations in each of our existing markets.
As previously disclosed, we are currently involved in a dispute related to customs assessments by Yokohama Customs on several of our products for the period of October 2006 through September 2009 in connection with post-importation audits, as well as the disputed portion of our import duties from October 2009 to the present, which we have or will hold in bond or pay under protest (we were previously required to post a bond or make a deposit to secure any additional duties that may have been due and payable on current imports, but we are no longer required to do so). Additional assessments related to any prior period are barred by applicable statutes of limitations
.
The issue in this case is whether a United States entity utilizing a commissionaire agent in Japan to import its products can use the manufacturer's invoice pursuant to the transaction value method under the World Trade Organization Customs Valuation Agreement or whether it must use one of the alternative valuation methods provided in that agreement, and, if an alternative method must be used, what the allowable deductions would be in determining the proper valuation. Following our review of the assessments and after consulting with legal and customs advisors, we believe that use of the manufacturer's invoice is the appropriate valuation method and that the additional assessments are improper and are not supported by applicable customs laws because they are based on an alternative valuation method. We filed letters of protest with the applicable Customs authorities, which were rejected. We then appealed the matter to the Ministry of Finance in Japan, which denied our administrative appeal in the second quarter of 2011. We pursued the matter in Tokyo District Court, which in February 2016 issued its ruling upholding the additional customs assessments. As a result of the District Court's decision, we recorded a charge of $31.4 million in the first quarter of 2016. This charge was a non-cash item because we were previously required to pay the assessments. This charge represents the full amount that was disputed, including assessments for the period of October 2006 through September 2009 in connection with post-importation audits, as well as the disputed portion of our import duties from October 2009 to the date of the District Court's decision. We have appealed the District Court's decision to the Tokyo High Court. We anticipate that additional disputed duties will be limited going forward as we purchase a majority of the affected products in Japan from a Japanese company that purchases and imports the products from the manufacturers.
-42-
From time to time, we are involved in other legal proceedings arising in the ordinary course of business. We believe that the resolution of these matters will not have a negative material effect on our consolidated financial position, results of operations or liquidity.
Not applicable.
PART II
| ITEM 5. |
Our Class A common stock is listed on the New York Stock Exchange ("NYSE") and trades under the symbol "NUS." The following table is based upon the information available to us and sets forth the range of the high and low sales prices for our Class A common stock for the quarterly periods during 2015 and 2016 based upon quotations on the NYSE.
|
Quarter Ended
|
High
|
Low
|
||||||
|
March 31, 2015
|
$
|
62.63
|
$
|
39.26
|
||||
|
June 30, 2015
|
62.87
|
47.02
|
||||||
|
September 30, 2015
|
49.92
|
38.00
|
||||||
|
December 31, 2015
|
47.53
|
31.15
|
||||||
|
Quarter Ended
|
High
|
Low
|
||||||
|
March 31, 2016
|
$
|
38.90
|
$
|
23.51
|
||||
|
June 30, 2016
|
47.65
|
36.78
|
||||||
|
September 30, 2016
|
65.15
|
44.95
|
||||||
|
December 31, 2016
|
66.04
|
46.35
|
||||||
The market price of our Class A common stock is subject to significant fluctuations in response to variations in our actual and expected operating results, demand for our products, general trends in our industry, economic and currency exchange issues in the foreign markets in which we operate and other factors, many of which are not within our control. In addition, broad market fluctuations, as well as general economic, business, regulatory and political conditions may adversely affect the market for our Class A common stock, regardless of our performance.
-43-
The closing price of our Class A common stock on January 31, 2017, was $51.88. The approximate number of holders of record of our Class A common stock as of January 31, 2017 was 360. This number of holders of record does not represent the actual number of beneficial owners of shares of our Class A common stock because shares are frequently held in "street name" by securities dealers and others for the benefit of individual owners who have the right to vote their shares.
Dividends
We declared and paid a $0.35 per share dividend for Class A common stock each quarter in 2015 and a $0.355 per share dividend for Class A common stock each quarter in 2016. The board of directors has approved an increased quarterly cash dividend of $0.36 per share of Class A common stock to be paid on March 15, 2017, to stockholders of record on February 27, 2017. Annually, this would increase the dividend to $1.44 from $1.42 in the prior year. Currently, we anticipate that our board of directors will continue to declare quarterly cash dividends and that the cash flows from operations will be sufficient to fund our future dividend payments. However, the continued declaration of dividends is subject to the discretion of our board of directors and will depend upon various factors, including our net earnings, financial condition, cash requirements, future prospects and other relevant factors.
Purchases of Equity Securities by the Issuer
|
(a)
|
(b)
|
(c)
|
(d)
|
|||||
|
Period
|
Total Number
of Shares Purchased
|
Average Price
Paid per Share
|
Total Number of Shares
Purchased as Part
of Publicly Announced
Plans or Programs
|
Approximate Dollar Value of
Shares that May Yet
Be Purchased Under
the Plans or Programs
(in millions)
(1)
|
||||
|
October 1 – 31, 2016
|
1,449,136
|
$ 64.20
|
1,449,136
|
$ 312.3
|
||||
|
November 1 – 30, 2016
|
1,676,062
|
56.37
|
1,676,062
|
217.8
|
||||
|
December 1 – 31, 2016
|
359,693
|
50.07
|
359,693
|
199.7
|
||||
|
Total
|
3,484,891
|
58.97
|
3,484,891
|
| (1) |
In October 2015, we announced that our board of directors approved a stock repurchase plan. Under this plan, our board of directors authorized the repurchase of up to $500.0 million of our outstanding Class A common stock on the open market or in privately negotiated transactions.
|
Stock Performance Graph
Set forth below is a line graph comparing the cumulative total stockholder return (stock price appreciation plus dividends) on our Class A common stock with the cumulative total return of the S&P 500 Index and a market-weighted index of publicly traded peers (the "Peer Group") for the period from December 31, 2011 through December 31, 2016. The graph assumes that $100 was invested in each of the Class A common stock, the S&P 500 Index and the index of publicly traded peers on December 31, 2011 and that all dividends were reinvested. The Peer Group consists of the following companies, which compete in our industry and product categories: Avon Products, Inc., The Estée Lauder Companies Inc., Tupperware Brands Corporation, Herbalife Ltd., USANA Health Sciences, Inc., Nature's Sunshine Products, Inc., Weight Watchers International, Inc. and Mannatech, Inc. Elizabeth Arden, Inc. was included in the Peer Group that was disclosed in our Annual Report on Form 10-K for the fiscal year ended December 31, 2015 but is no longer a publicly traded company.
-44-
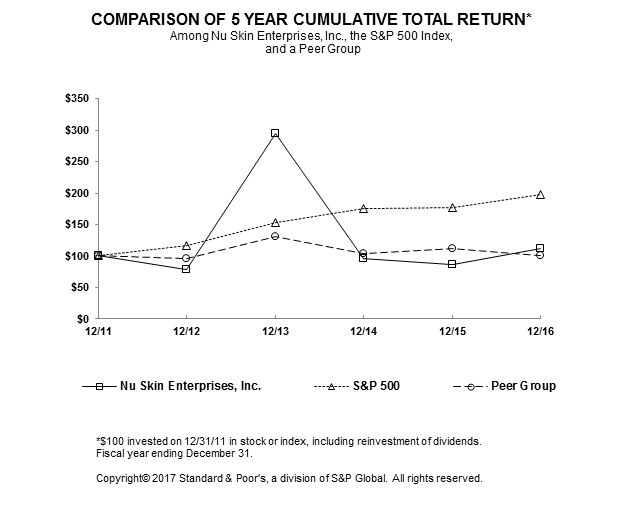
|
Measured Period
|
Nu Skin
|
S&P 500 Index
|
Peer Group Index
|
|||||||||
|
December 31, 2011
|
$
|
100.00
|
$
|
100.00
|
$
|
100.00
|
||||||
|
December 31, 2012
|
77.63
|
116.00
|
95.14
|
|||||||||
|
December 31, 2013
|
295.00
|
153.58
|
131.30
|
|||||||||
|
December 31, 2014
|
95.74
|
174.60
|
104.16
|
|||||||||
|
December 31, 2015
|
85.67
|
177.01
|
111.04
|
|||||||||
|
December 31, 2016
|
111.71
|
198.18
|
100.38
|
|||||||||
The Stock Performance Graph above shall not be deemed to be "soliciting material" or to be "filed" with the U.S. Securities and Exchange Commission or subject to the liabilities of Section 18 under the Securities Exchange Act of 1934 as amended (the "Exchange Act"). In addition, it shall not be deemed incorporated by reference by any statement that incorporates this Annual Report on Form 10-K by reference into any filing under the Securities Act of 1933 (the "Securities Act") or the Exchange Act, except to the extent that we specifically incorporate this information by reference.
-45-
The following selected consolidated financial data as of and for the years ended December 31, 2012, 2013, 2014, 2015 and 2016 have been derived from the audited consolidated financial statements:
|
Year Ended December 31,
|
||||||||||||||||||||
|
2012
|
2013
|
2014
|
2015
|
2016
|
||||||||||||||||
|
(U.S. dollars in thousands, except per share data and cash dividends)
|
||||||||||||||||||||
|
Income Statement Data
:
|
||||||||||||||||||||
|
Revenue
|
$
|
2,132,257
|
$
|
3,176,718
|
$
|
2,569,495
|
$
|
2,247,047
|
$
|
2,207,797
|
||||||||||
|
Cost of sales
|
353,152
|
505,806
|
478,434
|
(1)
|
489,510
|
(
1)
(2
)
|
500,457
|
(
2)
(3)
|
||||||||||||
|
Gross profit
|
1,779,105
|
2,670,912
|
2,091,061
|
1,757,537
|
1,707,340
|
|||||||||||||||
|
Operating expenses:
|
||||||||||||||||||||
|
Selling expenses
|
932,812
|
1,476,772
|
1,116,572
|
951,372
|
922,083
|
|||||||||||||||
|
General and administrative expenses
|
505,449
|
640,028
|
622,301
|
561,463
|
(2)
|
554,153
|
(2)
|
|||||||||||||
|
Total operating expenses
|
1,438,261
|
2,116,800
|
1,738,873
|
1,512,835
|
1,476,236
|
|||||||||||||||
|
Operating income
|
340,844
|
554,112
|
352,188
|
244,702
|
231,104
|
|||||||||||||||
|
Other income (expense), net
|
4,398
|
2,828
|
(53,681
|
)
(4)
|
(32,743
|
)
(4)
|
(18,265
|
)
|
||||||||||||
|
Income before provision for income taxes
|
345,242
|
556,940
|
298,507
|
211,959
|
212,839
|
|||||||||||||||
|
Provision for income taxes
|
123,597
|
192,052
|
109,331
|
78,913
|
69,753
|
|||||||||||||||
|
Net income
|
$
|
221,645
|
$
|
364,888
|
$
|
189,176
|
$
|
133,046
|
$
|
143,086
|
||||||||||
|
Net income per share:
|
||||||||||||||||||||
|
Basic
|
$
|
3.66
|
$
|
6.23
|
$
|
3.20
|
$
|
2.29
|
$
|
2.58
|
||||||||||
|
Diluted
|
$
|
3.52
|
$
|
5.94
|
$
|
3.11
|
$
|
2.25
|
$
|
2.55
|
||||||||||
|
Weighted-average common shares outstanding (000s):
|
||||||||||||||||||||
|
Basic
|
60,600
|
58,606
|
59,073
|
57,997
|
55,412
|
|||||||||||||||
|
Diluted
|
63,025
|
61,448
|
60,887
|
59,057
|
56,097
|
|||||||||||||||
|
Balance Sheet Data
(at end of period)
:
|
||||||||||||||||||||
|
Cash and cash equivalents and current investments
|
$
|
333,403
|
$
|
547,127
|
$
|
300,208
|
$
|
303,725
|
$
|
368,126
|
||||||||||
|
Working capital
|
268,500
|
341,542
|
416,338
|
298,795
|
315,326
|
|||||||||||||||
|
Total assets
|
1,124,807
|
1,821,062
|
1,614,434
|
1,505,843
|
1,474,045
|
|||||||||||||||
|
Current portion of long-term debt
|
39,019
|
67,824
|
82,770
|
67,849
|
82,727
|
|||||||||||||||
|
Long-term debt
|
154,963
|
113,852
|
164,567
|
181,745
|
334,165
|
|||||||||||||||
|
Stockholders' equity
|
590,612
|
858,619
|
942,438
|
825,621
|
664,070
|
|||||||||||||||
|
Cash dividends declared per share
|
0.80
|
1.20
|
1.38
|
1.40
|
1.42
|
|||||||||||||||
|
Supplemental Operating Data
(at end of period)
:
|
||||||||||||||||||||
|
Approximate number of Customers
(5)
|
946,000
|
1,335,000
|
1,208,000
|
994,000
|
988,000
|
|||||||||||||||
|
Number of Sales Leaders
(6)
|
51,790
|
102,117
|
62,009
|
67,575
|
61,627
|
|||||||||||||||
| (1) |
Includes write-downs of inventory of $50.0 million and $37.9 million in 2014 and 2015, respectively, resulting primarily from reduced sales expectations primarily in our Greater China region.
|
| (2) |
Reflects the reclassification of $31.5 million in 2015 and $33.5 million in 2016 in overhead expenses from general and administrative expense to cost of sales.
|
| (3) |
Includes a non-cash Japan customs expense of $31.4 million.
|
| (4) |
Includes $46.3 million and $10.2 million of foreign currency charges in 2014 and 2015, respectively, related to the devaluation of the Venezuela currency.
|
| (5) |
"Customers," previously referred to as "Actives," are persons who purchased products directly from the company during the previous three months.
|
| (6) |
"Sales Leaders" are independent distributors, and sales employees and independent marketers in China, who achieve certain qualification requirements.
|
-46-
The following discussion of our financial condition and results of operations should be read in conjunction with the consolidated financial statements and related notes, which are included in this Annual Report on Form 10-K.
Business Overview
Our Products
Founded more than 30 years ago, Nu Skin Enterprises, Inc. develops and distributes innovative consumer products, offering a comprehensive line of premium-quality beauty and wellness solutions in approximately 50 markets worldwide
. In 2016, our revenue of $2.2 billion was primarily generated by our two category brands: our beauty and personal care category brand known as Nu Skin and our nutritional products category brand, Pharmanex. We have also leveraged our scientific expertise in the area of anti-aging to develop our ageLOC brand that features innovative products in both of these categories. We operate in the direct selling channel, primarily utilizing person-to-person marketing to promote and sell our products.
Our Global Operations
Nu Skin's operations span approximately 50 markets with approximately 91% of our 2016 revenue coming from outside of the United States. Given the size of our international operations, our results, as reported in U.S. dollars, are often impacted by foreign currency fluctuations. In addition, our results can be impacted by global economic, political, demographic and business trends and conditions.
A Global Network of Sales Leaders and Customers
As of December 31, 2016, we had approximately 988,000 persons who purchased products directly from the company during the previous three months ("Customers," or previously referred to as "Actives"). We believe a significant majority of Customers purchase our products primarily for personal or family consumption but are not actively pursuing the opportunity to generate income by marketing and reselling products.
Our revenue is highly influenced by the number and productivity of our Sales Leaders. Sales Leaders are independent distributors, and sales employees and independent marketers in China, who achieve certain qualification requirements.
We have been successful in attracting and motivating our sales force by:
•
developing and marketing innovative, technologically and scientifically advanced products;
| • |
providing compelling initiatives and strong support; and
|
| • |
offering an attractive sales compensation structure.
|
Our global sales force helps us to rapidly introduce products and penetrate our markets with modest up-front promotional expense. We rely on our sales force to create consumer demand for our products, as opposed to a traditional approach of advertising-generated consumer awareness. Our approach is particularly effective with products that benefit from education and demonstration. Similar to other companies in our industry, we experience relatively high turnover among our sales force.
-47-
To enhance customer retention, we have developed product subscription and loyalty programs that provide incentives for consumers to commit to purchase a specific amount of product on a monthly basis. All purchases under these programs are subject to our standard product payment and return policies. We believe these subscription and loyalty programs have improved consumer retention, have had a stabilizing impact on revenue and have helped generate recurring sales.
Product Innovation
Our sales force markets and sells our products, and attracts others to the opportunity, based on the distinguishing benefits and innovative characteristics of our products. As a result, it is vital to our business that we continuously leverage our scientific expertise and product development resources to introduce innovative beauty and wellness products.
Since 2008, we have focused on the development of products under our ageLOC brand, an innovative line of anti-aging solutions that feature skin treatment and nutritional products. The ageLOC brand has generated more than $6 billion in cumulative sales since its 2008 introduction. This anti-aging line includes such products as our
ageLOC Me
customized skin care system,
ageLOC Spa
systems and gels,
ageLOC Youth
nutritional supplement, and
ageLOC
TR90
weight management system. Beginning in the second half of 2017 and continuing into 2018, we plan to launch our
ageLOC LumiSpa
treatment and cleansing device.
Any delays or difficulties in introducing compelling products or attractive initiatives or tools into our markets may have a negative impact on our revenue and our number of Customers and Sales Leaders.
Our Product Launch Process
We use a variety of methods to launch our products, enabling us to tailor the launch process to the specific market and the specific product. Prior to making a product generally available for purchase in a market, we typically do a promotional offering of the product, such as a preview of the product to our key Sales Leaders in the market, a limited-time offer, or other type of promotion. Sales Leader previews, limited-time offers and other promotions may generate significant activity and a high level of purchasing, which can result in a higher-than-normal increase in revenue during the quarter and can skew year-over-year and sequential comparisons. We believe our product launch process also attracts new people to our business, helping drive growth in our Sales Leaders and Customers through increased consumer trial.
We may experience difficulty effectively managing growth associated with these limited-time offers and may face increased risk of improper sales force activities and related government scrutiny. In addition, the size and condensed schedule of these product launches increases pressure on our supply chain and order processing systems. If we are unable to accurately forecast sales levels in each market for product launches or ongoing product sales, obtain sufficient ingredients or produce a sufficient supply to meet demand, we may incur higher expedited shipping costs and we may temporarily run out of stock of certain products, which could negatively impact the enthusiasm of our sales force and consumers. Conversely, if demand does not meet our expectations for a product launch or ongoing product sales or if we change our planned launch strategies or initiatives, we could incur inventory write-downs. For example, in 2014 and 2015, we incurred inventory write-downs of $50.0 million and $37.9 million, respectively, which primarily resulted from reduced sales expectations primarily in our Greater China region. Any additional write-down of inventory in any of our markets would negatively impact our gross margins. Although our previous limited-time offers have not materially affected our product return rate, these events may increase our product return rate in the future. If we fail to effectively forecast or manage our supply chain and information systems in the product launch process or for ongoing product sales, our reputation and profitability could be negatively impacted.
-48-
Income Statement Presentation
We report revenue in five geographic regions and we translate revenue from each market's local currency into U.S. dollars using weighted-average exchange rates. The following table sets forth revenue information by region for the periods indicated. This table should be reviewed in connection with the information presented under "Results of Operations," which describes selling expenses and other costs associated with generating the aggregate revenue presented.
Revenue by Region
|
Year Ended December 31,
|
||||||||||||||||||||||||
|
(U.S. dollars in millions)
|
2014
|
2015
|
2016
|
|||||||||||||||||||||
|
Greater China
|
$
|
948.5
|
37
|
%
|
$
|
771.6
|
34
|
%
|
$
|
794.4
|
36
|
%
|
||||||||||||
|
North Asia
|
783.0
|
30
|
686.5
|
31
|
692.7
|
31
|
||||||||||||||||||
|
South Asia/Pacific
|
328.4
|
13
|
322.0
|
14
|
296.8
|
13
|
||||||||||||||||||
|
Americas
|
329.0
|
13
|
329.7
|
15
|
276.6
|
13
|
||||||||||||||||||
|
EMEA
|
180.6
|
7
|
137.2
|
6
|
147.3
|
7
|
||||||||||||||||||
|
$
|
2,569.5
|
100
|
%
|
$
|
2,247.0
|
100
|
%
|
$
|
2,207.8
|
100
|
%
|
|||||||||||||
Cost of sales primarily consists of:
•
cost of products purchased from third-party vendors;
•
costs of self-manufactured products;
•
cost of adjustments to inventory carrying value;
•
freight cost of shipping products to
our sales force
and import duties for the products; and
•
royalties and related expenses for licensed technologies.
We source the majority of our products from third-party vendors. Under direct selling regulations in Mainland China, we are required to manufacture the products we distribute through independent direct sellers in Mainland China. Cost of sales and gross profit, on a consolidated basis, may fluctuate as a result of changes in the ratio between self-manufactured products and products sourced from third-party vendors. In addition, because we purchase a significant amount of our goods in U.S. dollars and recognize revenue in local currencies, our gross margin is subject to exchange rate risks. Because our gross margins vary from product to product and due to higher pricing in some markets, changes in product mix and geographic revenue mix can impact our gross margin on a consolidated basis.
Selling expenses are our most significant expense and are classified as operating expenses. Selling expenses include sales commissions paid to our
sales force
, special incentives, costs for incentive trips and other rewards, as well as wages, benefits, bonuses and other labor and unemployment expenses we pay to our sales force in Mainland China. Selling expenses do not include amounts we pay to our sales force based on their personal purchases; rather, such amounts are reflected as reductions to revenue. Our global
sales
compensation plan, which we employ in all our markets except Mainland China, is an important factor in our ability to attract and retain
our
Sales Leaders. Under our global sales compensation plan, Sales Leaders can earn "multi-level" compensation, where they earn commissions
for product sales to their consumer groups as well as the product sales made through the sales network they have developed and trained.
We do not pay commissions on sales materials. Small fluctuations occur in the amount of commissions paid as the Customers and Sales Leaders change from month to month. However, with approximately 988,000 Customers and 61,627 Sales Leaders, the fluctuation in the overall payout is relatively small. Selling expenses as a percentage of revenue typically increase in connection with a limited-time offer due to growth in the number of Sales Leaders qualifying for increased sales compensation and promotional incentives. From time to time, we make modifications and enhancements to our global
sales
compensation plan in an effort to help motivate
our sales force
and develop leadership characteristics, which can have an impact on selling expenses.
-49-
Outside of Mainland China, distributors also have the opportunity to make profits by purchasing products from us at a discount and selling them to consumers with a mark-up. We do not account for, nor pay, additional commissions on these mark-ups received by distributors. In many markets, we also allow individuals who are not part of our sales force, whom we refer to as "preferred customers," to buy products directly from us at a discount. We pay commissions on preferred customer purchases to the referring member of our sales force.
General and administrative expenses include:
•
wages and benefits;
•
rents and utilities;
•
depreciation and amortization;
•
promotion and advertising;
•
professional fees;
•
travel;
•
research and development; and
•
other operating expenses.
Labor expenses are the most significant portion of our general and administrative expenses. Promotion and advertising expenses include costs of
sales force
conventions held in various markets worldwide, which we expense in the period in which they are incurred. Because our various
sales force
conventions are not held during each fiscal year, or in the same period each year, their impact on our general and administrative expenses may vary from year to year and from quarter to quarter. For example, we held our global convention in October 2015 and will have another global convention in the fall of 2017 as we currently plan to hold a global convention every other year. In addition, we hold regional conventions and conventions in our major markets at different times during the year. These conventions have significant expenses associated with them. Because we have not incurred expenses for these conventions during every fiscal year or in comparable interim periods, year-over-year comparisons have been impacted accordingly.
Provision for income taxes depends on the statutory tax rates in each of the jurisdictions in which we operate. For example, statutory tax rates in 2016 were approximately 16.5% in Hong Kong, 17.0% in Taiwan, 22.7% in South Korea, 37.3% in Japan and 25.0% in Mainland China. We are subject to taxation in the United States at the statutory corporate federal tax rate of 35%, and we pay taxes in multiple states within the United States at various tax rates. Our overall effective tax rate was 32.8% for the year ended December 31, 2016.
-50-
Critical Accounting Policies
The following critical accounting policies and estimates should be read in conjunction with our audited consolidated financial statements and related Notes thereto. Management considers our critical accounting policies to be the recognition of revenue, accounting for income taxes and accounting for intangible assets. In each of these areas, management makes estimates based on historical results, current trends and future projections.
Revenue
. We recognize revenue when products are shipped, which is when title and risk of loss pass to the purchaser of the products. With some exceptions based on local regulations, we offer a return policy that allows our sales force to return unopened and unused product for up to 12 months subject to a 10% restocking fee. Reported revenue is net of returns, which have historically been less than 5% of annual revenue. A reserve for product returns is accrued based on historical experience. We classify selling discounts as a reduction of revenue.
Through our product subscription and loyalty programs, which vary from market to market, participants who commit to purchase on a monthly basis receive a discount from suggested retail or wholesale prices, as applicable. We apply this discount at the time of each purchase and not through a larger discount on the initial purchase. Participants may cancel their commitment at any time, however some markets charge a one-time early cancellation fee. All purchases under these programs are subject to our standard product payment and return policies. In accordance with ASC 605-50, we classify selling discounts and rebates, as a reduction of revenue at the time the sale is recorded.
Income Taxes
. We account for income taxes in accordance with the Income Taxes Topic of the Financial Accounting Standards Codification
.
This Topic establishes financial accounting and reporting standards for the effects of income taxes that result from an enterprise's activities during the current and preceding years. We take an asset and liability approach for financial accounting and reporting of income taxes. We pay income taxes in many foreign jurisdictions based on the profits realized in those jurisdictions, which can be significantly impacted by terms of intercompany transactions between Nu Skin affiliates around the world. Deferred tax assets and liabilities are created in this process. As of December 31, 2016, we had net deferred tax assets of $35.1 million. We net these deferred tax assets and deferred tax liabilities by jurisdiction. Valuation allowances are established when necessary to reduce deferred tax assets to the amounts expected to be ultimately realized. These net deferred tax assets assume sufficient future earnings will exist for their realization, and are calculated using anticipated tax rates. In certain foreign jurisdictions, valuation allowances have been recorded against the deferred tax assets specifically related to use of net operating losses. When we determine that there is sufficient taxable income to utilize the net operating losses, the valuation allowances will be released. In the event we were to determine that we would not be able to realize all or part of our net deferred tax assets in the future, an adjustment to the deferred tax assets would be charged to earnings in the period such determination was made.
We evaluate our indefinite reinvestment assertions with respect to foreign earnings for each period. Other than earnings we intend to reinvest indefinitely, we accrue for the U.S. federal and state income taxes applicable to the earnings. For all foreign earnings, we accrue the applicable foreign income taxes. We intend to utilize the offshore earnings to fund foreign investments, specifically capital expenditures. Undistributed earnings that we have indefinitely reinvested aggregate to $70.0 million and $70.0 million as of December 31, 2016 and 2015, respectively. If this amount were repatriated to the United States, the amount of incremental taxes would be approximately $7.6 million.
-51-
The company files income tax returns in the U.S. federal jurisdiction, and in various state and foreign jurisdictions. The company is no longer subject to tax examinations from the IRS for all years for which tax returns have been filed before 2011. With a few exceptions, we are no longer subject to state and local income tax examination by tax authorities for the years before 2011. In 2009, we entered into a voluntary program with the IRS called Compliance Assurance Process ("CAP"). The objective of CAP is to contemporaneously work with the IRS to achieve federal tax compliance and resolve all or most of the issues prior to filing of the tax return. We have elected to participate in the CAP program for 2017 and may elect to continue participating in CAP for future tax years; we may withdraw from the program at any time. In major foreign jurisdictions, we are generally not subject to income tax examinations for years before 2010. However, statutes in certain countries may be as long as ten years for transfer pricing related issues. Along with the IRS examination of 2011, we are currently under examination in certain foreign jurisdictions; however, the outcomes of those reviews are not yet determinable.
Our unrecognized tax benefits are related to multiple foreign and domestic jurisdictions. There are potential changes in unrecognized tax benefits from the multiple jurisdictions in which we operate, as well as the expiration of various statutes of limitation and possible completion of tax examinations; however, we do not anticipate that our total unrecognized tax benefits will significantly change over the next 12 months.
At December 31, 2016, we had $5.3 million in unrecognized tax benefits of which $1.0 million, if recognized, would affect the effective tax rate. In comparison, at December 31, 2015, we had $7.8 million in unrecognized tax benefits of which $0.9 million, if recognized, would affect the effective tax rate. We recognized approximately $0.4 million in interest and penalties during the year ended December 31, 2015 and a benefit of $0.8 million in interest and penalties during the year ended December 31, 2016. We had approximately $1.3 million, $1.7 million and $0.9 million of accrued interest and penalties related to uncertain tax positions at December 31, 2014, 2015 and 2016, respectively. Interest and penalties related to uncertain tax positions are recognized as a component of income tax expense.
We are subject to regular audits by federal, state and foreign tax authorities. These audits may result in additional tax liabilities. We account for such contingent liabilities in accordance with relevant accounting standards and believe we have appropriately provided for income taxes for all years. Several factors drive the calculation of our tax reserves. Some of these factors include: (i) the expiration of various statutes of limitations; (ii) changes in tax law and regulations; (iii) issuance of tax rulings; and (iv) settlements with tax authorities. Changes in any of these factors may result in adjustments to our reserves, which would impact our reported financial results.
Intangible Assets
. Acquired intangible assets may represent indefinite-lived assets, determinable-lived intangibles or goodwill. Of these, only the costs of determinable-lived intangibles are amortized to expense over their estimated life. The value of indefinite-lived intangible assets and residual goodwill is not amortized, but is tested at least annually for impairment. Our impairment testing for goodwill is performed separately from our impairment testing of indefinite-lived intangibles. We test goodwill for impairment, at least annually, by reviewing the book value compared to the fair value at the reportable unit level. Beginning in 2011, we had the option to perform a qualitative assessment to determine whether further impairment testing is necessary or to perform a quantitative assessment by comparing the fair value of a reporting unit to its carrying amount, including goodwill. Under the qualitative assessment, an entity is not required to calculate the fair value of a reporting unit unless the entity determines that it is more likely than not that its fair value is less than its carrying amount. If under the quantitative assessment the fair value of a reporting unit is less than its carrying amount, then the amount of the impairment loss, if any, must be measured. We used the quantitative assessment for all periods presented. Considerable management judgment is necessary to measure fair value. We did not recognize any impairment charges for goodwill or intangible assets during the periods presented.
-52-
Results of Operations
The following table sets forth our operating results as a percentage of revenue for the periods indicated:
|
Year Ended December 31,
|
||||||||||||
|
2014
|
2015
|
2016
|
||||||||||
|
Revenue
|
100.0
|
%
|
100.0
|
%
|
100.0
|
%
|
||||||
|
Cost of sales
|
18.6
|
21.8
|
22.7
|
|||||||||
|
Gross profit
|
81.4
|
78.2
|
77.3
|
|||||||||
|
Operating expenses:
|
||||||||||||
|
Selling expenses
|
43.5
|
42.3
|
41.7
|
|||||||||
|
General and administrative expenses
|
24.2
|
25.0
|
25.1
|
|||||||||
|
Total operating expenses
|
67.7
|
67.3
|
66.8
|
|||||||||
|
Operating income
|
13.7
|
10.9
|
10.5
|
|||||||||
|
Other income (expense), net
|
(2.1
|
)
|
(1.5
|
)
|
(0.8
|
)
|
||||||
|
Income before provision for income taxes
|
11.6
|
9.4
|
9.7
|
|||||||||
|
Provision for income taxes
|
4.2
|
3.5
|
3.2
|
|||||||||
|
Net income
|
7.4
|
%
|
5.9
|
%
|
6.5
|
%
|
||||||
2016 Compared to 2015
Overview
Revenue in 2016 decreased 2% to $2.21 billion from $2.25 billion in 2015, with foreign currency fluctuations negatively impacting revenue 2%. As of the end of the fourth quarter of 2016, Sales Leaders and Customers were down 9% and 1%, respectively, compared to the prior year. Earnings per share for 2016 were $2.55, compared to $2.25 for 2015.
In 2016, our Mainland China business generated 8% revenue growth, or 14% revenue growth on a local-currency basis, compared to 2015. Revenue in our EMEA region also increased 7%, reflecting the success of Sales Leader social media initiatives in certain markets of that region. These gains were offset by declines in our Americas and South Asia/Pacific regions as we experienced a decline in Sales Leaders in these regions.
During 2015 and 2016, and continuing into 2017, we launched
our
ageLOC Youth
nutritional supplement and our
ageLOC Me
customized skin care system
across our markets. These products have generated more than $500 million in cumulative sales through the end of 2016, with more than $400 million generated during 2016. We expect that our revenue will continue to be positively impacted by new product launches. Beginning in the second half of 2017 and continuing into 2018, we plan to launch our
ageLOC LumiSpa
treatment and cleansing device.
The year-over-year increase in our earnings per share primarily reflects slightly lower selling expenses as a percentage of revenue, a reduction in foreign-currency charges, and lower weighted-average shares outstanding in 2016 due to approximately $247 million in share repurchases during 2016.
-53-
Revenue
Greater China
. The following table sets forth revenue for the Greater China region and its principal markets (U.S. dollars in millions):
|
2015
|
2016
|
Change
|
||||||||||
|
Mainland China
|
$
|
565.5
|
$
|
610.4
|
8%
|
|
||||||
|
Taiwan/Hong Kong
|
206.1
|
184.0
|
(11%)
|
|
||||||||
|
Greater China total
|
$
|
771.6
|
$
|
794.4
|
3%
|
|
||||||
Foreign currency fluctuations negatively impacted revenue in the Greater China region by 5% in 2016 compared to 2015. Sales Leaders and Customers in the region decreased 2% and increased 11%, respectively, in the fourth quarter of 2016 compared to the prior-year period.
The year-over-year revenue increase in the region reflects approximately $79 million in revenue generated by a limited-time offer of
ageLOC Me
during the second and third quarters of 2016. The results of this limited-time offer were strong, particularly in Mainland China, where revenue grew 8%, or 14% on a local-currency basis, in 2016. There were no significant limited-time offers in the region during 2015, but revenue in 2015 was positively impacted by small previews of
ageLOC Me
to key Sales Leaders in the region and of
ageLOC Youth
in Hong Kong.
Sales Leaders and Customers in Mainland China increased 5% and 23%, respectively, compared to the fourth quarter of 2015, primarily driven by the limited-time offer of
ageLOC Me
. Sales Leaders and Customers in Taiwan were down 16% and 8%, respectively, and Sales Leaders and Customers in Hong Kong were down 36% and 13%, respectively. These decreases in Taiwan and Hong Kong reflect continued softness that we have seen for the last several quarters in these markets. We also believe that recent allegations and media scrutiny regarding the alleged improper importation and sale of
ageLOC Body Spa
devices in Taiwan in 2011 and 2012 may have negatively impacted our sales force and reputation in that market and may continue to do so. For more information, see Item 1A. Risk Factors—"If our
ageLOC Spa
systems or
Pharmanex BioPhotonic Scanner
are determined to be medical devices in a particular geographic market or if our sales force uses these products for medical purposes or makes improper medical claims, our ability to continue to market and distribute such tools could be harmed, and we could face legal or regulatory actions."
We currently plan to make
ageLOC Me
generally available for purchase in this region during the first quarter of 2017.
North Asia
. The following table sets forth revenue for the North Asia region and its principal markets (U.S. dollars in millions):
|
2015
|
2016
|
Change
|
||||||||||
|
South Korea
|
$
|
422.3
|
$
|
413.7
|
(2%)
|
|
||||||
|
Japan
|
264.2
|
279.0
|
6%
|
|
||||||||
|
North Asia total
|
$
|
686.5
|
$
|
692.7
|
1%
|
|
||||||
Revenue in the region for 2016 was favorably impacted 3% by foreign-currency fluctuations compared to 2015.
-54-
Revenue in South Korea was down 2% on a year-over-year basis, reflecting a negative foreign-currency impact of 2%. Local-currency revenue in this market was even with the prior year despite increased limited-time offer sales during 2016; during the third quarter of 2016, we generated approximately $49 million in revenue from a limited-time offer of a local variation of
ageLOC Youth
in this market, compared to approximately $18 million generated from a limited-time offer of
ageLOC Me
in this market in the prior year. Our Sales Leaders and Customers in South Korea decreased 1% and 11%, respectively, compared to the prior-year period. Although the limited-time offer in this market generated an increase in Sales Leaders during the third quarter of 2016, it did not generate a similar increase in Customers. We made
ageLOC Youth
generally available for purchase in South Korea during the fourth quarter of 2016.
Revenue in Japan increased 6% on a year-over-year basis, reflecting a positive foreign-currency impact of 11%. On a local-currency basis, revenue declined 5%. Sales Leaders and Customers in Japan decreased 13% and 10%, respectively, in the fourth quarter of 2016 compared to the prior-year period. In the fourth quarter of 2015, a limited-time offer of
ageLOC Me
generated an increased level of Sales Leader activity. The year-over-year declines in local-currency revenue, Sales Leaders and Customers reflect the absence of any limited-time offers in this market during 2016, the challenging regulatory environment and continued softness in this market. We made
ageLOC Youth
generally available for purchase in Japan during the fourth quarter of 2016.
South Asia/Pacific
. The following table sets forth revenue for the South Asia/Pacific region (U.S. dollars in millions):
|
2015
|
2016
|
Change
|
||||||||||
|
South Asia/Pacific
|
$
|
322.0
|
$
|
296.8
|
(8%)
|
|
||||||
Foreign currency fluctuations negatively impacted revenue in the South Asia/Pacific region by 2% in 2016 compared to the prior year. Sales Leaders and Customers in the region decreased 28% and 3%, respectively, compared to the fourth quarter of 2015.
The year-over-year comparisons for this region reflect declines in our revenue, Sales Leaders and Customers in Thailand as well as the majority of the region, partially offset by strong growth in Australia. The year-over-year comparisons also reflect decreased limited-time offer activity in the region. We generated approximately $35 million of revenue from a limited-time offer of
ageLOC Youth
during the second quarter of 2016, compared to approximately $48 million of revenue from a limited-time offer of
ageLOC Youth
during the second half of 2015.
On a sequential basis, Sales Leaders increased 5% from the third quarter to the fourth quarter of 2016, and Customers remained even.
Americas
. The following table sets forth revenue for the Americas region (U.S. dollars in millions):
|
2015
|
2016
|
Change
|
||||||||||
|
United States/Canada
|
$
|
284.9
|
$
|
244.9
|
(14%)
|
|
||||||
|
Latin America
|
44.8
|
31.7
|
(29%)
|
|
||||||||
|
Americas total
|
$
|
329.7
|
$
|
276.6
|
(16%)
|
|
||||||
Foreign currency fluctuations negatively impacted revenue in the Americas region by 3% in 2016 compared to 2015.
Sales Leaders and Customers in the region decreased 23% and 6%, respectively,
in the fourth quarter of 2016 compared to the prior-year period
.
-55-
The declines in revenue, Sales Leaders and Customers in the region are partially attributable to a limited-time offer of
ageLOC Youth
in the fourth quarter of 2015, which generated approximately $21 million in revenue. We did not have any limited-time offers in this region during 2016. On a sequential basis, Sales Leaders remained even from the third quarter to the fourth quarter of 2016, and Customers decreased 3%.
Our 2016 results for the Americas region also reflect softness in this region. Revenue in the United States decreased 17% compared to 2015. Elsewhere in the region, revenue growth in Canada, our second-largest market by revenue in this region, was more than offset by declines in parts of Latin America.
During January 2017, we ceased business operations in Guatemala, Honduras, El Salvador and Costa Rica. Together, these markets accounted for less than 1% of our 2016 consolidated revenue.
EMEA
. The following table sets forth revenue for the Europe, Middle East and Africa ("EMEA") region (U.S. dollars in millions):
|
2015
|
2016
|
Change
|
||||||||||
|
EMEA
|
$
|
137.2
|
$
|
147.3
|
7%
|
|
||||||
Foreign currency fluctuations negatively impacted revenue in the EMEA region by 1% in 2016 compared to 2015. Sales Leaders and Customers in the region increased 13% and 17%, respectively, in the fourth quarter of 2016 compared to the fourth quarter of 2015. The year-over-year increases in revenue, Sales Leaders and Customers reflect the success of Sales Leader social media initiatives in certain markets of the region. We also made increased use of seasonal promotions in 2016.
Gross profit
Gross profit as a percentage of revenue in 2016 decreased to 77.3% compared to 78.2% in 2015. The decline is due to a non-cash Japan customs expense of $31.4 million in the first quarter of 2016, partially offset by lower inventory write-downs in 2016 compared to 2015. In the third quarter of 2015, we incurred a $37.9 million write-down of inventory primarily in our Greater China region. For more information about the 2016 Japan customs expense and the 2015 inventory write-down, see Notes 23 and 2, respectively, to the consolidated financial statements contained in this report.
Selling expenses
Selling expenses as a percentage of revenue decreased to 41.7% in 2016, compared to 42.3% in 2015. The decline in s
elling expenses as a percentage of revenue primarily reflects the decline in our Sales Leaders, as well as other normal fluctuations in our sales compensation.
General and administrative expenses
General and administrative expenses decreased to $554.2 million in 2016, compared to $561.5 million in 2015. As a percentage of revenue, general and administrative expenses increased to 25.1% in 2016 from 25.0% in 2015.
Other income (expense), net
Other income (expense), net
was $18.3 million of expense in 2016, compared to $32.7 million of expense in 2015. The decrease in expense primarily reflects a decrease of $18.4 million in foreign-currency charges, partially offset by a $7.7 million increase in interest expense primarily due to the convertible debt that we issued in the second quarter of 2016.
-56-
Provision for income taxes
Provision for income taxes decreased to $69.8 million in 2016 from $78.9 million in 2015. The effective tax rate decreased to 32.8% in 2016 from 37.2% of pre-tax income in 2015.
The year-over-year decrease in the effective tax rate for 2016 is a result of the substantial liquidation of our business operations in Venezuela, which resulted in the recognition of a previously unrecognized deferred tax asset. The year-over-year comparisons also reflect an increased tax rate in the third quarter of 2015, which was due largely to lower-than-anticipated profits in Greater China caused by the inventory charge we incurred in that quarter. The lower-than-anticipated profits prevented us from recognizing a deferred tax asset associated with Greater China in 2015, but it was recognized in 2016. These declines in our effective tax rate were partially offset by the negative impact of a change in tax law that was enacted in December 2016 related to the taxation of foreign currency translation gains or losses arising from qualified business units.
Net income
As a result of the foregoing factors, net income in 2016 increased to $143.1 million, compared to $133.0 million in 2015.
2015 Compared to 2014
Overview
Revenue in 2015 decreased 13% to $2.2 billion from $2.6 billion in 2014, with foreign currency fluctuations negatively impacting revenue 8%. Sales Leaders and Customers were up 9% and down 18%, respectively, compared to the prior year. Earnings per share for 2015 were $2.25, compared to $3.11 for 2014.
The year-over-year comparisons were affected by limited-time offer activity in 2014 and the lack of major new product initiatives through the first half of 2015. Limited-time offers of our
ageLOC Tru Face Essence Ultra
anti-aging skin care serum and our
ageLOC TR90
weight management and body shaping system generated approximately $194 million in revenue during 2014. Following the launch of
ageLOC TR90
in 2013 and the beginning of 2014, we did not have any major new product initiatives until the second half of 2015, which presented challenges in our ability to grow the business. Revenue generated from limited-time offers of
ageLOC Youth
in our South Asia/Pacific and Americas regions and
ageLOC Me
in our North Asia region during 2015 totaled approximately $96 million.
Foreign currency fluctuations negatively impacted our 2015 revenue by 8% on a consolidated basis, compared to 2014. In addition, our 2015 earnings per share reflected a first-quarter charge of $10.2 million related to a new foreign exchange mechanism for the Venezuela currency and foreign currency
translation expenses of $17.0 million
. In 2014, we similarly incurred a charge of $46.3 million related to the Venezuela currency. For more information regarding these items, please see "—Other income (expense), net."
Our earnings per share also reflected inventory write-downs of $37.9 million in 2015 and $50.0 million in 2014. Both of these write-downs of estimated surplus inventory resulted from reduced sales expectations primarily in our Greater China region.
-57-
Revenue
Greater China
. The following table sets forth revenue for the Greater China region and its principal markets (U.S. dollars in millions):
|
2014
|
2015
|
Change
|
||||||||||
|
Mainland China
|
$
|
675.1
|
$
|
565.5
|
(16%)
|
|
||||||
|
Taiwan/Hong Kong
|
273.4
|
206.1
|
(25%)
|
|
||||||||
|
Greater China total
|
$
|
948.5
|
$
|
771.6
|
(19%)
|
|
||||||
Foreign currency fluctuations negatively impacted revenue in the Greater China region by 2% in 2015.
The year-over-year revenue decline reflected approximately $130.5 million in revenue in this region in 2014 generated by limited-time offers of
ageLOC Tru Face Essence Ultra
and
ageLOC TR90
, consisting of $80.8 million in Mainland China and $49.7 million in Taiwan and Hong Kong. Although there were no significant limited-time offers in the region during 2015, revenue was positively impacted by small previews of
ageLOC Me
to key Sales Leaders in the region, and
ageLOC Youth
in Hong Kong, during the fourth quarter.
The year-over-year revenue decline for the region also reflected the disruption of our business in Mainland China and subsequent loss of Sales Leaders in 2014. We believe our business in Mainland China stabilized in 2015. For example, on a sequential basis, revenue in Mainland China for the fourth quarter of 2015 was 4% higher than the third quarter of 2015.
Sales Leaders in Mainland China increased 16% and Customers decreased 52% compared to 2014. Sales Leaders and Customers in Taiwan were down 14% and 18%, respectively, compared to 2014. Sales Leaders in Hong Kong were up 6% and Customers were down 19% compared to 2014. The decrease in Customers across the region reflected promotional activity that took place during the fourth quarter of 2014. On a sequential basis, Sales Leaders and Customers in the region increased 8% and 6%, respectively, from September 30, 2015 to December 31, 2015.
We believe that allegations and media scrutiny regarding the alleged improper importation and sale of
ageLOC Body Spa
devices in Taiwan in 2011 and 2012 may have negatively impacted our sales force and reputation in that market. For more information, see Item 1A. Risk Factors—"If our
ageLOC Spa
systems or
Pharmanex BioPhotonic Scanner
are determined to be medical devices in a particular geographic market or if our sales force uses these products for medical purposes or makes improper medical claims, our ability to continue to market and distribute such tools could be harmed, and we could face legal or regulatory actions."
North Asia
. The following table sets forth revenue for the North Asia region and its principal markets (U.S. dollars in millions):
|
2014
|
2015
|
Change
|
||||||||||
|
South Korea
|
$
|
467.7
|
$
|
422.3
|
(10%)
|
|
||||||
|
Japan
|
315.3
|
264.2
|
(16%)
|
|
||||||||
|
North Asia total
|
$
|
783.0
|
$
|
686.5
|
(12%)
|
|
||||||
-58-
Revenue in the region for 2015 was negatively impacted approximately 9% by foreign currency fluctuations, compared to 2014. Foreign currency fluctuations negatively impacted revenue 7% and 12% in South Korea and Japan, respectively.
Local-currency revenue in South Korea was down 3% on a year-over-year basis. This decline reflects approximately $39 million in revenue in 2014 generated by limited-time offers of
ageLOC Tru Face Essence Ultra
and
TR90
. During 2015, we did not have a major product introduction in South Korea until the fourth quarter, when we introduced
ageLOC Me
in a limited-time offer, generating approximately $18 million in sales. Revenue from this limited-time offer was lower than our internal goals. We believe our bundling of the device with an optional 12-month product commitment may have contributed to these lower-than-expected results. We also believe that the results may have reflected softness in the South Korea market. Our Sales Leaders and Customers in South Korea decreased 2% and 8%, respectively, compared to the prior year.
Local-currency revenue in Japan decreased 4% on a year-over-year basis, reflecting challenges related to the difficult direct selling environment in Japan and the lack of a major product introduction until the fourth quarter of 2015. Our limited-time offer of
ageLOC Me
in December generated an increased level of Sales Leader activity. Sales Leaders in Japan increased 2% and Customers decreased 5% compared to 2014. The regulatory environment in Japan continues to be challenging.
South Asia/Pacific
. The following table sets forth revenue for the South Asia/Pacific region (U.S. dollars in millions):
|
2014
|
2015
|
Change
|
||||||||||
|
South Asia/Pacific
|
$
|
328.4
|
$
|
322.0
|
(2%)
|
|
||||||
Foreign currency fluctuations negatively impacted revenue in the South Asia/Pacific region by 12% in 2015 compared to the prior year. Local-currency revenue in the region grew on a year-over-year basis, reflecting approximately $48 million of revenue generated by a limited-time offer of
ageLOC Youth
during the second half of 2015. There were no significant limited-time offer sales in this region during the prior year.
Sales Leaders
in the region increased 24%
, driven primarily by the limited-time offer of
ageLOC Youth
,
and Customers decreased 4% in 2015 compared to the prior year.
Americas
. The following table sets forth revenue for the Americas region (U.S. dollars in millions):
|
2014
|
2015
|
Change
|
||||||||||
|
United States/Canada
|
$
|
272.4
|
$
|
284.9
|
5%
|
|
||||||
|
Latin America
|
56.6
|
44.8
|
(21%)
|
|
||||||||
|
Americas total
|
$
|
329.0
|
$
|
329.7
|
*
|
|||||||
* Less than 1%
The year-over-year revenue comparison for this region reflected approximately $21 million of revenue generated by a limited-time offer of
ageLOC Youth
in the United States and Canada during the fourth quarter of 2015, compared to approximately $10 million in limited-time offer sales of
ageLOC TR90
in the region during 2014.
-59-
Local-currency revenue growth throughout the region in 2015 was offset by a negative impact of approximately 13% from foreign currency fluctuations. Revenue in Canada, our largest market by revenue in this region outside of the United States, grew by 14% on a local-currency basis but declined by 1% on a reported basis, compared to 2014. Similarly, revenue in Latin America grew by 43% on a local-currency basis but declined by 21% on a reported basis, compared to 2014.
Sales Leaders in the Americas region increased 17%, driven primarily by the fourth-quarter limited-time offer of
ageLOC Youth
, and Customers decreased 5%, compared to the prior year.
EMEA
. The following table sets forth revenue for the Europe, Middle East and Africa ("EMEA") region (U.S. dollars in millions):
|
2014
|
2015
|
Change
|
||||||||||
|
EMEA
|
$
|
180.6
|
$
|
137.2
|
(24%)
|
|
||||||
Foreign currency fluctuations negatively impacted revenue in the EMEA region by 16% in 2015 compared to the prior year. The year-over-year revenue decline in EMEA was impacted
by 2014
limited-time offers of
TR90
, which generated revenue of approximately $8 million in the region in 2014. There were no limited-time offers in the region in 2015. Revenue was also negatively impacted by a year-over-year decline of 4% in both Sales Leaders and Customers, which we believe was due in part to a lack of major new product initiatives.
Gross profit
Gross profit as a percentage of revenue in 2015 decreased to 78.2% compared to 81.4% in 2014. The decline is due to the negative impact of foreign currency fluctuations, increased promotional activity, the 2015 reclassification of certain overhead expenses related to warehousing and shipping products from general and administrative expense to cost of sales, and an increase in inventory-related overhead expenses in 2015 as a result of increased inventory turnover. The amount that was reclassified from general and administrative expense to cost of sales for 2015 was $31.5 million. We did not revise prior-period financial statements because the reclassification was not material to the prior periods.
Gross profit in both 2014 and 2015 was also negatively impacted by inventory write-downs of $50.0 million in 2014 and $37.9 million in 2015. Both of these write-downs of estimated surplus inventory resulted from reduced sales expectations primarily in our Greater China region. Any additional write-down of inventory in any of our markets would negatively impact our gross margin.
Selling expenses
Selling expenses as a percentage of revenue decreased to 42.3% in 2015, compared to 43.5% in 2014.
Selling expenses as a percentage of revenue in 2015 were lower due to a reduction in the number of Sales Leaders qualifying for incentive trips and other promotional incentives based on 2015 results. In addition, the salaries of our sales employees in Mainland China are fixed for a three-month period of time, until they are adjusted during a quarterly evaluation process. Consequently, our selling expenses as a percentage of revenue were relatively high in the first quarter of 2014 because a portion of our sales compensation remained fixed while our revenue was negatively impacted by the voluntary measures we took in Mainland China during that quarter.
-60-
General and administrative expenses
General and administrative expenses decreased to $561.5 million in 2015, compared to $622.3 million in 2014. This decrease was due to the 2015 reclassification of overhead expenses from general and administrative expense into cost of sales as discussed under "Gross profit" above. General and administrative expenses also declined on a year-over-year basis due to a decline of $17.0 million in expenses related to promotions and advertising and a decline of $10.1 million in stock-based compensation expense.
Other income (expense), net
Other income (expense), net
was $32.7 million of expense in 2015, compared to $53.7 million of expense in 2014. These expenses reflect
non-cash foreign currency charges of $10.2 million in the first quarter of 2015 and $46.3 million in the first half 2014 resulting from the impact of the devaluation of the Venezuela currency on the monetary assets and liabilities of our Venezuela entity. We also incurred foreign currency translation expenses of $17.0 million in 2015. In 2014, we incurred
a charge of $7.4 million related to the prepayment of debt,
partially offset by approximately $7.0 million in tax incentives related to our China headquarters.
Provision for income taxes
Provision for income taxes decreased to $78.9 million in 2015 from $109.3 million in 2014. The effective tax rate increased to 37.2% in 2015 from 36.6% of pre-tax income in 2014.
The year-over-year increase in the effective tax rate for 2015 was due largely to the lower than anticipated profits in China caused by the charge to inventory. Consequently, a deferred tax asset associated with China could not be recognized, thereby impacting the annual effective tax rate.
Net income
As a result of the foregoing factors, net income in 2015 decreased to $133.0 million, compared to $189.2 million in 2014.
Liquidity and Capital Resources
Historically, our principal uses of cash have included operating expenses, particularly selling expenses, and working capital (principally inventory purchases), as well as capital expenditures, stock repurchases, dividends, debt repayment and the development of operations in new markets. We have at times incurred long-term debt in order to fund strategic transactions and stock repurchases. We typically generate positive cash flow from operations due to favorable margins and have generally relied on cash from operations to fund operating activities. We generated $275.3 million in cash from operations during 2016, compared to $322.1 million in cash from operations during 2015. This decrease in cash generated from operations during 2016 reflects the payment of a significant amount of items that were accrued as of the end of 2015, particularly commissions based on limited-time offers during December 2015.
As of December 31, 2016, cash and cash equivalents, including current investments, were $368.1 million compared to $303.7 million as of December 31, 2015. This increase in cash and cash equivalents primarily reflects our cash from operations, partially offset by dividend payments, long-term debt repayments and purchases of property and equipment. We also repurchased approximately $247 million of our common stock during 2016, primarily using the approximately $200 million in proceeds from our issuance of convertible debt. Working capital as of December 31, 2016 was $315.3 million compared to $298.8 million as of December 31, 2015. The increase in working capital was primarily due to our higher cash balance at the end of 2016 compared to 2015.
-61-
Capital expenditures in 2016 totaled $50.2 million, and we anticipate capital expenditures of approximately $60 million for 2017. We expect that the capital expenditures in 2017 will be primarily related to:
•
the expansion and upgrade of facilities in our various markets; and
| • |
purchases and expenditures for computer systems and equipment, software, and application development.
|
In June 2016, we issued $210.0 million principal amount of convertible 4.75% senior notes, due 2020 (the "Convertible Notes") to Ping An ZQ China Growth Opportunity Limited ("Ping An ZQ") at face value. Net proceeds on the issuance of the Convertible Notes were $203 million. We used the proceeds for repurchasing common stock throughout the remainder of 2016. The Convertible Notes are senior unsecured obligations of the Company and rank equal in right of payment to all senior unsecured indebtedness of the Company. Interest on the Convertible Notes is payable semiannually in cash on June 15 and December 15, and the Convertible Notes mature on June 15, 2020, subject to earlier conversion. Although the stated interest rate on the Convertible Notes is 4.75%, interest on this debt is expensed on our income statement at a rate of approximately 7.1%, reflecting the amortization of a debt discount resulting from approximately $6.3 million in issuance costs and approximately $10.9 million of the principal amount that is allocated to equity due to the conversion option. As of December 16, 2016, the Convertible Notes became convertible at the holder's discretion at a conversion rate of 21.5054 per $1,000 principal amount of Convertible Notes (which represents an initial conversion price of $46.50 per share), in each case subject to customary anti-dilution adjustments. As of January 31, 2017, the conversion price remained at $46.50 per share. Upon conversion, we intend to settle the Convertible Notes in cash with respect to the principal amount of Convertible Notes converted and any accrued and unpaid interest to such date, and in shares of our common stock with respect to any additional amounts.
Upon a change in control of the Company (as defined in the indenture governing the Convertible Notes) or the failure of our common stock to be listed on certain stock exchanges, the holders of the Convertible Notes may require that we repurchase all or part of the principal amount of the Convertible Notes at a purchase price equal to 108% of the principal amount plus accrued and unpaid interest. In addition, we may redeem all or part of the principal amount of the Convertible Notes, at our option, at a purchase price equal to the principal amount plus accrued and unpaid interest, provided that the closing trading price of our common stock exceeds 180% of the then-current conversion price for 20 or more trading days in the 30 consecutive trading day period preceding our exercise of this redemption right (including the last three such trading days). The Convertible Notes are subject to customary events of default, which may result in the acceleration of the maturity of the Convertible Notes.
Our Credit Agreement (the "Credit Agreement") with various financial institutions, and Bank of America, N.A. as administrative agent, provides for a $127.5 million term loan facility, a 6.6 billion Japanese yen term loan facility and a $187.5 million revolving credit facility, each with a term of five years ending in October 2019. The Credit Agreement requires that we maintain a consolidated leverage ratio not exceeding 2.25 to 1.00 and a consolidated interest coverage ratio of no less than 3.00 to 1.00. As of December 31, 2016, we had debt pursuant to the Credit Agreement of $203.8 million. See Note 9 to the consolidated financial statements contained in this report for further information regarding the Credit Agreement, Convertible Notes and other debt.
-62-
Our board of directors has approved a stock repurchase plan authorizing us to repurchase up to $500 million of our outstanding shares of Class A common stock on the open market or in private transactions. The repurchases are used primarily for strategic initiatives and to offset dilution from our equity incentive plans and from conversion of the Convertible Notes. During 2016, we repurchased approximately 4.5 million shares of Class A common stock under this plan for $247.2 million. At December 31, 2016, $199.7 million was available for repurchases under the stock repurchase plan.
Our board of directors declared and paid cash dividends on our Class A common stock of $0.355 per share during each quarter of 2016. These quarterly cash dividends totaled approximately $78.4 million. The board of directors has approved an increased quarterly cash dividend of $0.36 per share of Class A common stock to be paid on March 15, 2017, to stockholders of record on February 27, 2017. Annually, this would increase the dividend to $1.44 from $1.42 in 2016. Currently, we anticipate that our board of directors will continue to declare quarterly cash dividends and that the cash flows from operations will be sufficient to fund our future dividend payments. However, the continued declaration of dividends is subject to the discretion of our board of directors and will depend upon various factors, including our net earnings, financial condition, cash requirements, future prospects and other relevant factors.
As of December 31, 2016 and 2015, we held $368.1 million and $303.7 million, respectively, in cash and cash equivalents, including current investments. These amounts include $283.5 million and $241.4 million as of December 31, 2016 and 2015, respectively, held in our operations outside of the U.S. Substantially all of our non-U.S. cash and cash equivalents are readily convertible into U.S. dollars or other currencies, subject to procedural or other requirements in certain countries as described below.
We typically fund the cash requirements of our operations in the U.S. through intercompany dividends and intercompany charges for products, use of intangible property, and corporate services. Some markets impose government-approval or other requirements for the repatriation of dividends. For example, in Mainland China, we are unable to repatriate cash from current operations in the form of dividends until we file the necessary statutory financial statements for the relevant period. As of December 31, 2016, we had $86.5 million in cash denominated in Chinese RMB. We also have intercompany loan arrangements with some of our markets, including Mainland China, that allow us to access available cash. We currently plan to repatriate undistributed earnings from our non-U.S. operations as necessary, considering the cash needs of our non-U.S. operations and the cash needs of our U.S. operations for dividends, stock repurchases, capital investments, debt repayment and strategic transactions. Except for partial indefinite reinvestment in two jurisdictions, we have not designated our investments as indefinitely reinvested, but rather have these funds available for our operations in the U.S. as needed. Any repatriation of non-U.S. earnings requires payment of U.S. taxes in accordance with applicable U.S. tax rules and regulations. Accordingly, we have accrued the necessary U.S. taxes related to the funds that are not indefinitely reinvested.
We currently believe that existing cash balances, future cash flows from operations and existing lines of credit will be adequate to fund our cash needs on both a short- and long-term basis. The majority of our historical expenses have been variable in nature and as such, a potential reduction in the level of revenue would reduce our cash flow needs. In the event that our current cash balances, future cash flow from operations and current lines of credit are not sufficient to meet our obligations or strategic needs, we would consider raising additional funds in the debt or equity markets or restructuring our current debt obligations. Additionally, we would consider realigning our strategic plans, including a reduction in capital spending, stock repurchases or dividend payments.
-63-
Non-GAAP Financial Measures
Local-currency revenue growth is a non-GAAP financial measure that removes the impact of fluctuations in foreign-currency exchange rates, thereby facilitating period-to-period comparisons of the company's performance. It is calculated by translating the current period's revenue at the same average exchange rates in effect during the applicable prior-year period and then comparing this amount to the prior-year period's revenue.
Contractual Obligations and Contingencies
The following table sets forth payments due by period for fixed contractual obligations as of December 31, 2016 (U.S. dollars in thousands):
|
Total
|
2017
|
2018-2019
|
2020-2021
|
Thereafter
|
||||||||||||||||
|
Long-term debt obligations
(1)
|
$
|
435,178
|
$
|
82,727
|
$
|
142,451
|
$
|
210,000
|
$
|
--
|
||||||||||
|
Interest payable
|
48,955
|
16,729
|
27,654
|
4,572
|
--
|
|||||||||||||||
|
Operating lease obligations
|
120,217
|
36,180
|
51,311
|
17,599
|
15,127
|
|||||||||||||||
|
Financing obligations
|
5,841
|
631
|
1,320
|
1,388
|
2,502
|
|||||||||||||||
|
Purchase obligations
|
163,472
|
131,974
|
18,533
|
11,511
|
1,454
|
|||||||||||||||
|
Other long-term liabilities reflected
on the balance sheet
(2)
|
76,799
|
9,211
|
5,894
|
5,183
|
56,511
|
|||||||||||||||
|
Total
|
$
|
850,462
|
$
|
277,452
|
$
|
247,163
|
$
|
250,253
|
$
|
75,594
|
||||||||||
| (1) |
The carrying value of the debt reflects the amounts stated in the above table less a debt discount of $18.3 million.
|
| (2) |
The timing of the commitments in Other long-term liabilities reflected on the balance sheet is uncertain and represents management's best estimate.
|
Contingent Liabilities
Please refer to Note 20 to the consolidated financial statements contained in this report for information regarding our contingent liabilities.
Seasonality and Cyclicality
In addition to general economic factors, we are impacted by seasonal factors and trends such as major cultural events and vacation patterns. For example, most Asian markets celebrate their respective local New Year in the first quarter, which generally has a negative impact on that quarter. We believe that direct selling is also generally negatively impacted during the third quarter, when many individuals, including our sales force, traditionally take vacations.
Prior to making a product generally available for purchase in a market, we typically do a promotional offering of the product, such as a preview of the product to our key Sales Leaders in the market, a limited-time offer, or other type of promotion. Sales Leader previews, limited-time offers and other promotions may generate significant activity and a high level of purchasing, which can result in a higher-than-normal increase in revenue during the quarter and can skew year-over-year and sequential comparisons.
-64-
Customers and Sales Leaders
The following table provides information concerning the number of Customers and Sales Leaders as of the dates indicated. "Customers," previously referred to as "Actives," are persons who have purchased products directly from the Company during the three months ended as of the date indicated. "Sales Leaders" are independent distributors, and sales employees and independent marketers in China, who achieve certain qualification requirements.
|
As of December 31, 2014
|
As of December 31, 2015
|
As of December 31, 2016
|
||||||||||||||||||||||
|
Customers
|
Sales Leaders
|
Customers
|
Sales Leaders
|
Customers
|
Sales Leaders
|
|||||||||||||||||||
|
Greater China
|
393,000
|
24,537
|
223,000
|
27,064
|
248,000
|
26,625
|
||||||||||||||||||
|
North Asia
|
391,000
|
17,478
|
366,000
|
17,415
|
329,000
|
16,330
|
||||||||||||||||||
|
South Asia/Pacific
|
124,000
|
8,458
|
119,000
|
10,476
|
116,000
|
7,584
|
||||||||||||||||||
|
Americas
|
186,000
|
7,471
|
176,000
|
8,708
|
166,000
|
6,683
|
||||||||||||||||||
|
EMEA
|
114,000
|
4,065
|
110,000
|
3,912
|
129,000
|
4,405
|
||||||||||||||||||
|
Total
|
1,208,000
|
62,009
|
994,000
|
67,575
|
988,000
|
61,627
|
||||||||||||||||||
Quarterly Results
The following table sets forth selected unaudited quarterly data for the periods shown (U.S. dollars in millions, except per share amounts):
|
2015
|
2016
|
|||||||||||||||||||||||||||||||
|
1
st
Quarter
|
2
nd
Quarter
|
3
rd
Quarter
|
4
th
Quarter
|
1
st
Quarter
|
2
nd
Quarter
|
3
rd
Quarter
|
4
th
Quarter
|
|||||||||||||||||||||||||
|
Revenue
|
$
|
543.3
|
$
|
560.2
|
$
|
571.3
|
$
|
572.2
|
$
|
471.8
|
$
|
600.5
|
$
|
604.2
|
$
|
531.3
|
||||||||||||||||
|
Gross profit
|
438.3
|
449.9
|
418.6
|
450.8
|
334.0
|
472.3
|
478.3
|
422.8
|
||||||||||||||||||||||||
|
Operating income
|
68.6
|
71.8
|
42.5
|
61.7
|
8.1
|
79.8
|
82.4
|
60.8
|
||||||||||||||||||||||||
|
Net income
|
36.3
|
44.7
|
16.3
|
35.8
|
3.3
|
44.7
|
56.9
|
38.2
|
||||||||||||||||||||||||
|
Net income per share:
|
||||||||||||||||||||||||||||||||
|
Basic
|
0.62
|
0.76
|
0.28
|
0.63
|
0.06
|
0.80
|
1.02
|
0.71
|
||||||||||||||||||||||||
|
Diluted
|
0.60
|
0.75
|
0.28
|
0.62
|
0.06
|
0.79
|
0.98
|
0.69
|
||||||||||||||||||||||||
Recent Accounting Pronouncements
A description of new accounting pronouncements is contained in Note 2 of the Notes to consolidated financial statements.
Currency Risk and Exchange Rate Information
A majority of our revenue and many of our expenses are recognized outside of the United States, except for inventory purchases, a significant portion of which are primarily transacted in U.S. dollars from vendors in the United States. The local currency of each of our Subsidiaries' primary markets is considered the functional currency with the exception of our Asia product-distribution subsidiary in Singapore and our Venezuela subsidiary. All revenue and expenses are translated at weighted-average exchange rates for the periods reported. Therefore, our reported revenue and earnings will be positively impacted by a weakening of the U.S. dollar and will be negatively impacted by a strengthening of the U.S. dollar. Given the large portion of our business derived from outside of the United States, any strengthening of the U.S. dollar negatively impacts reported revenue and profits, whereas a weakening of the U.S. dollar positively impacts our reported revenue and profits. Given the uncertainty of exchange rate fluctuations, it is difficult to predict the effect of these fluctuations on our future business, product pricing and results of operations or financial condition. During 2015 and 2016, the strengthening of the U.S. dollar against other currencies significantly impacted our financial results.
-65-
Foreign exchange risk is managed in certain jurisdictions through the use of foreign currency debt. Included in the cumulative translation adjustment are $1.4 million, zero and zero of pretax net gains for the years ended December 31, 2014, 2015 and 2016, respectively, from Japanese yen borrowings.
Additionally, we may seek to reduce our exposure to fluctuations in foreign currency exchange rates through the use of foreign currency exchange contracts and through intercompany loans of foreign currency. We do not use derivative financial instruments for trading or speculative purposes. We regularly monitor our foreign currency risks and periodically take measures to reduce the impact of foreign exchange fluctuations on our operating results. As of December 31, 2016, we held non-designated mark-to-market forward derivative contracts to hedge foreign denominated intercompany positions or third-party foreign debt with notional amounts of 11.5 billion South Korean won ($9.5 million), compared to 500.0 million Japanese yen, 9.0 million Canadian dollars and 5.8 billion South Korean won ($4.2 million, $6.5 million and $4.9 million, respectively) as of December 31, 2015. Gains and losses related to non-designated derivative contracts are recorded as part of Other Income (Expense). In addition, we held forward contracts designated as foreign currency cash flow hedges with notional amounts totaling approximately 1.4 billion Japanese yen ($12.0 million) as of December 31, 2016, compared to 1.9 billion Japanese yen and 15.0 million euros ($15.8 million and 16.3 million, respectively) as of December 31, 2015, to hedge forecasted foreign-currency-denominated intercompany transactions. Because of our foreign exchange contracts at December 31, 2016, the impact of a 10% appreciation or 10% depreciation of the U.S. dollar against the Japanese yen, the South Korean won or the euro would not represent a material potential loss in fair value, earnings or cash flows against these contracts. This potential loss does not consider the underlying foreign currency transaction or translation exposures to which we are subject.
Following are the weighted-average currency exchange rates of U.S. $1 into local currency for each of our international or foreign markets in which revenue exceeded U.S. $5.0 million for at least one of the quarters listed:
|
2015
|
2016 | |||||||||||||||||||||||||||||||
|
1
st
Quarter
|
2
nd
Quarter
|
3
rd
Quarter
|
4
th
Quarter
|
1
st
Quarter
|
2
nd
Quarter
|
3
rd
Quarter
|
4
th
Quarter
|
|||||||||||||||||||||||||
|
Argentina
|
8.7
|
9.0
|
9.2
|
10.0
|
14.7
|
14.2
|
15.0
|
15.5
|
||||||||||||||||||||||||
|
Australia
|
1.3
|
1.3
|
1.4
|
1.4
|
1.4
|
1.3
|
1.3
|
1.3
|
||||||||||||||||||||||||
|
Canada
|
1.2
|
1.2
|
1.3
|
1.3
|
1.4
|
1.3
|
1.3
|
1.3
|
||||||||||||||||||||||||
|
Eurozone countries
|
0.9
|
0.9
|
0.9
|
0.9
|
0.9
|
0.9
|
0.9
|
0.9
|
||||||||||||||||||||||||
|
Hong Kong
|
7.8
|
7.8
|
7.8
|
7.8
|
7.8
|
7.8
|
7.8
|
7.8
|
||||||||||||||||||||||||
|
Indonesia
|
12,826
|
13,144
|
14,066
|
13,767
|
13,505
|
13,270
|
13,129
|
13,243
|
||||||||||||||||||||||||
|
Japan
|
119.2
|
121.4
|
122.1
|
121.5
|
115.1
|
107.7
|
102.4
|
109.6
|
||||||||||||||||||||||||
|
Mainland China
|
6.2
|
6.2
|
6.3
|
6.4
|
6.5
|
6.5
|
6.7
|
6.8
|
||||||||||||||||||||||||
|
Malaysia
|
3.6
|
3.7
|
4.2
|
4.3
|
4.2
|
4.0
|
4.1
|
4.3
|
||||||||||||||||||||||||
|
Philippines
|
44.4
|
44.7
|
46.4
|
46.9
|
47.2
|
46.5
|
47.1
|
49.2
|
||||||||||||||||||||||||
|
Singapore
|
1.4
|
1.3
|
1.4
|
1.4
|
1.4
|
1.4
|
1.4
|
1.4
|
||||||||||||||||||||||||
|
South Korea
|
1,100.7
|
1,097.8
|
1,170.0
|
1,159.1
|
1,200.5
|
1,162.6
|
1,122.8
|
1,159.7
|
||||||||||||||||||||||||
|
Taiwan
|
31.5
|
30.8
|
32.1
|
32.6
|
33.1
|
32.4
|
31.7
|
31.8
|
||||||||||||||||||||||||
|
Thailand
|
32.6
|
33.3
|
35.5
|
35.8
|
35.6
|
35.2
|
34.8
|
35.4
|
||||||||||||||||||||||||
-66-
The information required by Item 7A of Form 10-K is incorporated herein by reference from the information contained in Item 7. "Management's Discussion and Analysis of Financial Condition and Results of Operations – Currency Risk and Exchange Rate Information" and Note 17 to the consolidated financial statements contained in this report.
-67-
|
1.
Financial Statements
. Set forth below is the index to the Financial Statements included in this Item 8:
|
||
|
Page
|
||
|
Consolidated Balance Sheets at December 31, 2015 and 2016
|
69
|
|
|
Consolidated Statements of Income for the years ended December 31, 2014, 2015 and 2016
|
70
|
|
|
Consolidated Statements of Comprehensive Income for the years ended December 31, 2014, 2015 and 2016
|
71
|
|
|
Consolidated Statements of Stockholders' Equity for the years ended December 31, 2014, 2015 and 2016
|
72
|
|
|
Consolidated Statements of Cash Flows for the years ended December 31, 2014, 2015 and 2016
|
73
|
|
|
Notes to Consolidated Financial Statements
|
74
|
|
|
Report of Independent Registered Public Accounting Firm
|
108
|
|
|
2.
Financial Statement Schedules
: Financial statement schedules have been omitted because they are not required or are not applicable, or because the required information is shown in the financial statements or notes thereto.
|
||
-68-
NU SKIN ENTERPRISES, INC.
Consolidated Balance Sheets
(U.S. dollars in thousands)
|
December 31,
|
||||||||
|
2015
|
2016
|
|||||||
|
ASSETS
|
||||||||
|
Current assets
|
||||||||
|
Cash and cash equivalents
|
$
|
289,354
|
$
|
357,246
|
||||
|
Current investments
|
14,371
|
10,880
|
||||||
|
Accounts receivable
|
35,464
|
31,199
|
||||||
|
Inventories, net
|
265,256
|
249,936
|
||||||
|
Prepaid expenses and other
|
101,947
|
65,076
|
||||||
|
706,392
|
714,337
|
|||||||
|
Property and equipment, net
|
454,537
|
444,732
|
||||||
|
Goodwill
|
112,446
|
114,954
|
||||||
|
Other intangible assets, net
|
67,009
|
63,553
|
||||||
|
Other assets
|
165,459
|
136,469
|
||||||
|
Total assets
|
$
|
1,505,843
|
$
|
1,474,045
|
||||
|
LIABILITIES AND STOCKHOLDERS' EQUITY
|
||||||||
|
Current liabilities
|
||||||||
|
Accounts payable
|
$
|
28,832
|
$
|
41,261
|
||||
|
Accrued expenses
|
310,916
|
275,023
|
||||||
|
Current portion of long-term debt
|
67,849
|
82,727
|
||||||
|
407,597
|
399,011
|
|||||||
|
Long-term debt
|
181,745
|
334,165
|
||||||
|
Other liabilities
|
90,880
|
76,799
|
||||||
|
Total liabilities
|
680,222
|
809,975
|
||||||
|
Commitments and contingencies (Notes 10 and 20)
|
||||||||
|
Stockholders' equity
|
||||||||
|
Class A common stock – 500 million shares authorized, $.001 par value, 90.6 million shares issued
|
91
|
91
|
||||||
|
Additional paid-in capital
|
419,921
|
439,635
|
||||||
|
Treasury stock, at cost – 34.6 million and 38.0 million shares
|
(1,017,063
|
)
|
(1,250,123
|
)
|
||||
|
Accumulated other comprehensive loss
|
(71,269
|
)
|
(84,122
|
)
|
||||
|
Retained earnings
|
1,493,941
|
1,558,589
|
||||||
|
825,621
|
664,070
|
|||||||
|
Total liabilities and stockholders' equity
|
$
|
1,505,843
|
$
|
1,474,045
|
||||
The accompanying notes are an integral part of these consolidated financial statements.
-69-
NU SKIN ENTERPRISES, INC.
Consolidated Statements of Income
(U.S. dollars in thousands, except per share amounts)
|
Year Ended December 31,
|
||||||||||||
|
2014
|
2015
|
2016
|
||||||||||
|
Revenue
|
$
|
2,569,495
|
$
|
2,247,047
|
$
|
2,207,797
|
||||||
|
Cost of sales
|
478,434
|
489,510
|
500,457
|
|||||||||
|
Gross profit
|
2,091,061
|
1,757,537
|
1,707,340
|
|||||||||
|
Operating expenses:
|
||||||||||||
|
Selling expenses
|
1,116,572
|
951,372
|
922,083
|
|||||||||
|
General and administrative expenses
|
622,301
|
561,463
|
554,153
|
|||||||||
|
Total operating expenses
|
1,738,873
|
1,512,835
|
1,476,236
|
|||||||||
|
Operating income
|
352,188
|
244,702
|
231,104
|
|||||||||
|
Other income (expense), net (Note 22)
|
(53,681
|
)
|
(32,743
|
)
|
(18,265
|
)
|
||||||
|
Income before provision for income taxes
|
298,507
|
211,959
|
212,839
|
|||||||||
|
Provision for income taxes
|
109,331
|
78,913
|
69,753
|
|||||||||
|
Net income
|
$
|
189,176
|
$
|
133,046
|
$
|
143,086
|
||||||
|
Net income per share:
|
||||||||||||
|
Basic
|
$
|
3.20
|
$
|
2.29
|
$
|
2.58
|
||||||
|
Diluted
|
$
|
3.11
|
$
|
2.25
|
$
|
2.55
|
||||||
|
Weighted-average common shares outstanding (000s):
|
||||||||||||
|
Basic
|
59,073
|
57,997
|
55,412
|
|||||||||
|
Diluted
|
60,887
|
59,057
|
56,097
|
|||||||||
The accompanying notes are an integral part of these consolidated financial statements.
-70-
NU SKIN ENTERPRISES, INC.
Consolidated Statements of Comprehensive Income
(U.S. dollars in thousands)
|
Year Ended December 31,
|
||||||||||||
|
2014
|
2015
|
2016
|
||||||||||
|
Net income
|
$
|
189,176
|
$
|
133,046
|
$
|
143,086
|
||||||
|
Other comprehensive income:
|
||||||||||||
|
Foreign currency translation adjustment, net of taxes of $420, $114 and $2,483, respectively
|
(5,113
|
)
|
(18,967
|
)
|
(13,127
|
)
|
||||||
|
Net unrealized gains/(losses) on foreign currency cash flow hedges, net of taxes of $(869),
$(325) and $784, respectively
|
|
1,578
|
590
|
(1,423
|
)
|
|||||||
|
Less: Reclassification adjustment for realized losses/(gains) in current earnings, net of taxes
of $968, $756 and $(935), respectively
|
(1,758
|
)
|
(1,371
|
)
|
1,697
|
|||||||
|
(5,293
|
)
|
(19,748
|
)
|
(12,853
|
)
|
|||||||
|
Comprehensive income
|
$
|
183,883
|
$
|
113,298
|
$
|
130,233
|
||||||
The accompanying notes are an integral part of these consolidated financial statements.
-71-
NU SKIN ENTERPRISES, INC.
Consolidated Statements of Stockholders' Equity
(U.S. dollars in thousands)
|
Class A
Common Stock
|
Additional
Paid-in Capital
|
Treasury
Stock
|
Accumulated
Other
Comprehensive
Loss
|
Retained
Earnings
|
Total
|
|||||||||||||||||||
|
Balance at January 1, 2014
|
$
|
91
|
$
|
397,383
|
$
|
(826,904
|
)
|
$
|
(46,228
|
)
|
$
|
1,334,277
|
$
|
858,619
|
||||||||||
|
Net income
|
—
|
—
|
—
|
—
|
189,176
|
189,176
|
||||||||||||||||||
|
Other comprehensive income, net of tax
|
—
|
—
|
—
|
(5,293
|
)
|
—
|
(5,293
|
)
|
||||||||||||||||
|
Repurchase of Class A common stock (Note 11)
|
—
|
—
|
(45,724
|
)
|
—
|
—
|
(45,724
|
)
|
||||||||||||||||
|
Exercise of employee stock options (0.8 million
shares)/vesting of stock awards
|
—
|
(12,440
|
)
|
10,020
|
—
|
—
|
(2,420
|
)
|
||||||||||||||||
|
Excess tax benefit from equity awards
|
—
|
11,947
|
—
|
—
|
—
|
11,947
|
||||||||||||||||||
|
Stock-based compensation
|
—
|
17,504
|
—
|
—
|
—
|
17,504
|
||||||||||||||||||
|
Cash dividends
|
—
|
—
|
—
|
—
|
(81,371
|
)
|
(81,371
|
)
|
||||||||||||||||
|
Balance at December 31, 2014
|
91
|
414,394
|
(862,608
|
)
|
(51,521
|
)
|
1,442,082
|
942,438
|
||||||||||||||||
|
Net income
|
—
|
—
|
—
|
—
|
133,046
|
133,046
|
||||||||||||||||||
|
Other comprehensive income, net of tax
|
—
|
—
|
—
|
(19,748
|
)
|
—
|
(19,748
|
)
|
||||||||||||||||
|
Repurchase of Class A common stock (Note 11)
|
—
|
—
|
(164,094
|
)
|
—
|
—
|
(164,094
|
)
|
||||||||||||||||
|
Exercise of employee stock options (0.7 million
shares)/vesting of stock awards
|
—
|
(6,324
|
)
|
9,639
|
—
|
—
|
3,315
|
|||||||||||||||||
|
Excess tax benefit from equity awards
|
—
|
4,451
|
—
|
—
|
—
|
4,451
|
||||||||||||||||||
|
Stock-based compensation
|
—
|
7,400
|
—
|
—
|
—
|
7,400
|
||||||||||||||||||
|
Cash dividends
|
—
|
—
|
—
|
—
|
(81,187
|
)
|
(81,187
|
)
|
||||||||||||||||
|
Balance at December 31, 2015
|
91
|
419,921
|
(1,017,063
|
)
|
(71,269
|
)
|
1,493,941
|
825,621
|
||||||||||||||||
|
Net income
|
—
|
—
|
—
|
—
|
143,086
|
143,086
|
||||||||||||||||||
|
Other comprehensive income, net of tax
|
—
|
—
|
—
|
(12,853
|
)
|
—
|
(12,853
|
)
|
||||||||||||||||
|
Repurchase of Class A common stock (Note 11)
|
—
|
—
|
(247,208
|
)
|
—
|
—
|
(247,208
|
)
|
||||||||||||||||
|
Exercise of employee stock options (1.1 million
shares)/vesting of stock awards
|
—
|
159
|
14,148
|
—
|
—
|
14,307
|
||||||||||||||||||
|
Excess tax benefit from equity awards
|
—
|
3,840
|
—
|
—
|
—
|
3,840
|
||||||||||||||||||
|
Stock-based compensation
|
—
|
8,890
|
—
|
—
|
—
|
8,890
|
||||||||||||||||||
|
Equity component of convertible note
issuance (net)
|
—
|
6,825
|
—
|
—
|
—
|
6,825
|
||||||||||||||||||
|
Cash dividends
|
—
|
—
|
—
|
—
|
(78,438
|
)
|
(78,438
|
)
|
||||||||||||||||
|
Balance at December 31, 2016
|
$
|
91
|
$
|
439,635
|
$
|
(1,250,123
|
)
|
$
|
(84,122
|
)
|
$
|
1,558,589
|
$
|
664,070
|
||||||||||
The accompanying notes are an integral part of these consolidated financial statements.
-72-
NU SKIN ENTERPRISES, INC.
Consolidated Statements of Cash Flows
(U.S. dollars in thousands)
|
Year Ended December 31,
|
||||||||||||
|
2014
|
2015
|
2016
|
||||||||||
|
Cash flows from operating activities:
|
||||||||||||
|
Net income
|
$
|
189,176
|
$
|
133,046
|
$
|
143,086
|
||||||
|
Adjustments to reconcile net income to net cash provided
by operating activities:
|
||||||||||||
|
Depreciation and amortization
|
54,924
|
71,365
|
72,397
|
|||||||||
|
Japan customs expense
|
─
|
─
|
31,355
|
|||||||||
|
Foreign currency (gains)/losses
|
53,828
|
27,235
|
8,863
|
|||||||||
|
Stock-based compensation
|
17,504
|
7,400
|
8,890
|
|||||||||
|
Deferred taxes
|
10,399
|
17,362
|
(17,652
|
)
|
||||||||
|
Changes in operating assets and liabilities:
|
||||||||||||
|
Accounts receivable
|
30,766
|
(2,246
|
)
|
3,357
|
||||||||
|
Inventories, net
|
(16,518
|
)
|
59,652
|
9,801
|
||||||||
|
Prepaid expenses and other
|
(25,167
|
)
|
13,572
|
37,789
|
||||||||
|
Other assets
|
(16,219
|
)
|
(15,752
|
)
|
(3,969
|
)
|
||||||
|
Accounts payable
|
(45,953
|
)
|
(4,297
|
)
|
13,443
|
|||||||
|
Accrued expenses
|
(309,180
|
)
|
15,902
|
(33,624
|
)
|
|||||||
|
Other liabilities
|
(24
|
)
|
(1,130
|
)
|
1,527
|
|||||||
|
Net cash provided by (used in) operating activities
|
(56,464
|
)
|
322,109
|
275,263
|
||||||||
|
Cash flows from investing activities:
|
||||||||||||
|
Purchases of property and equipment
|
(101,476
|
)
|
(56,622
|
)
|
(50,221
|
)
|
||||||
|
Proceeds on investment sales
|
27,328
|
11,526
|
18,132
|
|||||||||
|
Purchases of investments
|
(17,522
|
)
|
(15,750
|
)
|
(17,080
|
)
|
||||||
|
Acquisitions
|
─
|
─
|
(8,692
|
)
|
||||||||
|
Net cash used in investing activities
|
(91,670
|
)
|
(60,846
|
)
|
(57,861
|
)
|
||||||
|
Cash flows from financing activities:
|
||||||||||||
|
Payment of cash dividends
|
(81,371
|
)
|
(81,187
|
)
|
(78,438
|
)
|
||||||
|
Repurchase of shares of common stock
|
(45,724
|
)
|
(164,094
|
)
|
(247,208
|
)
|
||||||
|
Exercise of employee stock options and taxes paid related to the net shares settlement of stock awards
|
(2,420
|
)
|
3,315
|
14,307
|
||||||||
|
Income tax benefit of equity awards
|
11,801
|
5,337
|
5,651
|
|||||||||
|
Payments on long-term debt
|
(333,803
|
)
|
(35,508
|
)
|
(56,151
|
)
|
||||||
|
Payment of debt issuance costs
|
(5,739
|
)
|
─
|
(6,596
|
)
|
|||||||
|
Proceeds from long-term debt
|
416,180
|
36,217
|
233,721
|
|||||||||
|
Net cash used in financing activities
|
(41,076
|
)
|
(235,920
|
)
|
(134,714
|
)
|
||||||
|
Effect of exchange rate changes on cash
|
(47,528
|
)
|
(24,404
|
)
|
(14,796
|
)
|
||||||
|
Net increase (decrease) in cash and cash equivalents
|
(236,738
|
)
|
939
|
67,892
|
||||||||
|
Cash and cash equivalents, beginning of period
|
525,153
|
288,415
|
289,354
|
|||||||||
|
Cash and cash equivalents, end of period
|
$
|
288,415
|
$
|
289,354
|
$
|
357,246
|
||||||
The accompanying notes are an integral part of these consolidated financial statements.
-73-
NU SKIN ENTERPRISES, INC.
Notes to Consolidated Financial Statements
1.
The Company
Nu Skin Enterprises, Inc. (the "Company") is a leading, global direct selling company that develops and distributes premium-quality, innovative personal care products and nutritional supplements that are sold worldwide under the Nu Skin and Pharmanex brands and a small number of other products and services. Over the last several years, the Company has introduced new Pharmanex nutritional supplements and Nu Skin personal care products under its ageLOC anti-aging brand. The Company reports revenue from five geographic regions: Greater China, which consists of Mainland China, Hong Kong, Macau and Taiwan; North Asia, which consists of Japan and South Korea; South Asia/Pacific, which consists of Australia, Brunei, French Polynesia, Indonesia, Malaysia, New Caledonia, New Zealand, the Philippines, Singapore, Thailand and Vietnam; Americas, which consists of the United States, Canada and Latin America; and Europe, Middle East and Africa ("EMEA"), which consists of several markets in Europe as well as Israel, Russia, Ukraine and South Africa (the Company's subsidiaries operating in these countries in each region are collectively referred to as the "Subsidiaries").
2.
Summary of Significant Accounting Policies
Consolidation
The consolidated financial statements include the accounts of the Company and the Subsidiaries. All significant intercompany accounts and transactions are eliminated in consolidation.
Use of estimates
The preparation of these financial statements, in conformity with accounting principles generally accepted in the United States of America, required management to make estimates and assumptions that affected the reported amounts of assets and liabilities, and disclosure of contingent assets and liabilities, at the date of the financial statements and the reported amounts of revenue and expenses during the reporting period. Actual results may differ from these estimates.
Cash and cash equivalents
Cash equivalents are short-term, highly liquid instruments with original maturities of 90 days or less.
Inventories
Inventories consist primarily of merchandise purchased for resale and are stated at the lower of standard cost or market, using a standard cost method which approximates the first-in, first-out method. The Company had adjustments to its inventory carrying value totaling $20.7 million and $8.0 million as of December 31, 2015 and 2016, respectively. The Company incurred a $37.9 million write-down of estimated surplus inventory primarily in the Greater China region in the third quarter of 2015 due to reduced expectations for future product sales.
-74-
NU SKIN ENTERPRISES, INC.
Notes to Consolidated Financial Statements
|
December 31,
|
||||||||
|
2015
|
2016
|
|||||||
|
Raw materials
|
$
|
114,193
|
$
|
108,276
|
||||
|
Finished goods
|
151,063
|
141,660
|
||||||
|
$
|
265,256
|
$
|
249,936
|
|||||
Adjustments to inventories consist of the following (U.S. dollars in thousands):
|
2014
|
2015
|
2016
|
||||||||||
|
Beginning balance, adjustments to inventory carrying value
|
$
|
5,934
|
$
|
56,034
|
$
|
20,744
|
||||||
|
Additions
|
77,379
|
38,605
|
24,906
|
|||||||||
|
Write-offs
|
(27,279
|
)
|
(73,895
|
)
|
(37,655
|
)
|
||||||
|
Ending balance, adjustments to inventory carrying value
|
$
|
56,034
|
$
|
20,744
|
$
|
7,995
|
||||||
Property and equipment
Property and equipment are stated at cost less accumulated depreciation. Depreciation is recorded using the straight-line method over the following estimated useful lives:
|
Buildings
|
39 years
|
|||
|
Furniture and fixtures
|
5 - 7 years
|
|||
|
Computers and equipment
|
3 - 5 years
|
|||
|
Leasehold improvements
|
Shorter of estimated useful life or lease term
|
|||
|
Scanners
|
3 years
|
|||
|
Vehicles
|
3 - 5 years
|
Expenditures for maintenance and repairs are charged to expense as incurred. When an asset is sold or otherwise disposed of, the cost and associated accumulated depreciation are removed from the accounts and the resulting gain or loss is recognized in the statement of income. Property and equipment are reviewed for impairment whenever events or changes in circumstances indicate that the carrying amount of such assets may not be recoverable. An impairment loss is recognized if the carrying amount of the asset exceeds its fair value.
Goodwill and other intangible assets
Goodwill is recorded when the cost of acquired businesses exceeds the fair value of the identifiable net assets acquired. Goodwill and intangible assets with indefinite useful lives are not amortized, but are assessed for impairment annually on June 30. In addition, impairment testing is conducted when events occur or circumstances change that would more likely than not reduce the fair value of a reporting unit below its carrying amount. Goodwill and intangible assets with indefinite useful lives would be written down to fair value if considered impaired. Guidance under Accounting Standards Codification ("ASC") 350,
Intangibles - Goodwill and Other
, requires an entity to test goodwill for impairment on at least an annual basis. The Company had the option to perform a qualitative assessment to determine whether further impairment testing is necessary or to perform a quantitative assessment by comparing the fair value of a reporting unit to its carrying amount, including goodwill. Under the qualitative assessment, an entity is not required to calculate the fair value of a reporting unit unless the entity determines that it is more likely than not that its fair value is less than its carrying amount. If under the quantitative assessment the fair value of a reporting unit is less than its carrying amount, then the amount of the impairment loss, if any, must be measured. The Company used the quantitative assessment for all periods presented. Intangible assets with finite useful lives are amortized to their estimated residual values over such finite lives using the straight-line method and reviewed for impairment whenever events or circumstances warrant such a review.
-75-
NU SKIN ENTERPRISES, INC.
Notes to Consolidated Financial Statements
No impairment charges were recorded for goodwill or intangibles during the periods presented.
Revenue recognition
Revenue is recognized when products are shipped, which is when title and risk of loss pass to the purchaser of the products. A reserve for product returns is accrued based on historical experience totaling $7.8 million and $6.1 million as of December 31, 2015 and 2016, respectively. During the years ended December 31, 2014, 2015 and 2016, the Company recorded sales returns of $83.6 million, $65.6 million and $61.2 million, respectively. The Company generally requires cash or credit card payment at the point of sale. Accounts receivable generally represents amounts due from credit card companies and are generally collected within a few days of the purchase. As such, the Company has determined that no allowance for doubtful accounts is necessary. Amounts received prior to shipment of products and title passage to the purchaser of the products are recorded as deferred revenue. The Company's sales compensation plans generally do not provide rebates or selling discounts for purchasing its products and services. The Company classifies selling discounts and rebates, if any, as a reduction of revenue at the time the sale is recorded.
Through the Company's product subscription and loyalty programs, which can vary from market to market, participants who commit to purchases on a monthly basis receive a discount from suggested retail or wholesale prices, as applicable. The Company applies this discount at the time of each purchase and not through a larger discount on the initial purchase. Participants may cancel their commitment at any time, however some markets charge a one-time early cancellation fee. All purchases under these programs are subject to the Company's standard product payment and return policies. In accordance with ASC 605-50, the Company classifies selling discounts and rebates, as a reduction of revenue at the time the sale is recorded.
Shipping and handling costs
Shipping and handling costs are recorded as cost of sales and are expensed as incurred.
Advertising expenses
Advertising costs are expensed as incurred. Advertising expense incurred for the years ended December 31, 2014, 2015 and 2016 totaled $19.6 million, $11.0 million and $15.9 million, respectively.
Selling expenses
Selling expenses are the Company's most significant expense and are classified as operating expenses. Selling expenses include distributor commissions as well as wages, benefits, bonuses and other labor and unemployment expenses the Company pays to its sales force in Mainland China. In each of the Company's markets, except Mainland China, Sales Leaders can earn "multi-level" compensation under the Company's global sales compensation plan, including commissions for product sales to their consumer groups as well as the product sales made through the sales network they have developed and trained. The Company does not pay commissions on sales materials.
-76-
NU SKIN ENTERPRISES, INC.
Notes to Consolidated Financial Statements
Research and development
Research and development costs are expensed as incurred and are included in general and administrative expenses in the accompanying consolidated statements of income and totaled $18.9 million, $20.1 million and $24.3 million in 2014, 2015 and 2016, respectively.
Deferred tax assets and liabilities
The Company accounts for income taxes in accordance with the Income Taxes Topic of the Financial Accounting Standards Codification. These standards establish financial accounting and reporting standards for the effects of income taxes that result from an enterprise's activities during the current and preceding years. The Company takes an asset and liability approach for financial accounting and reporting of income taxes. The Company pays income taxes in many foreign jurisdictions based on the profits realized in those jurisdictions, which can be significantly impacted by terms of intercompany transactions between the Company and its foreign affiliates. Deferred tax assets and liabilities are created in this process. The Company has netted these deferred tax assets and deferred tax liabilities by jurisdiction. Valuation allowances are established when necessary to reduce deferred tax assets to the amounts expected to be ultimately realized.
Uncertain tax positions
The Company files income tax returns in the U.S. federal jurisdiction, and in various state and foreign jurisdictions. The Company is no longer subject to tax examinations from the IRS for all years for which tax returns have been filed before 2011. With a few exceptions, the Company is no longer subject to state and local income tax examination by tax authorities for the years before 2011. In 2009, the Company entered into a voluntary program with the IRS called Compliance Assurance Process ("CAP"). The objective of CAP is to contemporaneously work with the IRS to achieve federal tax compliance and resolve all or most of the issues prior to filing of the tax return. The Company has elected to participate in the CAP program for 2017 and may elect to continue participating in CAP for future tax years; the Company may withdraw from the program at any time. In major foreign jurisdictions, the Company is generally no longer subject to income tax examinations for years before 2010. However, statutes in certain countries may be as long as ten years for transfer pricing related issues. Along with the IRS examination of 2011, the Company is currently under examination in certain foreign jurisdictions; however, the outcomes of those reviews are not yet determinable.
-77-
NU SKIN ENTERPRISES, INC.
Notes to Consolidated Financial Statements
|
2014
|
2015
|
2016
|
||||||||||
|
Gross balance at January 1
|
$
|
7,484
|
$
|
5,987
|
$
|
7,772
|
||||||
|
Increases related to prior year tax positions
|
─
|
1,677
|
185
|
|||||||||
|
Increases related to current year tax positions
|
2,700
|
1,119
|
918
|
|||||||||
|
Settlements
|
─
|
─
|
(3,369
|
)
|
||||||||
|
Decreases due to lapse of statutes of limitations
|
(4,106
|
)
|
(667
|
)
|
(252
|
)
|
||||||
|
Currency adjustments
|
(91
|
)
|
(344
|
)
|
36
|
|||||||
|
Gross balance at December 31
|
$
|
5,987
|
$
|
7,772
|
$
|
5,290
|
||||||
At December 31, 2016, the Company had $5.3 million in unrecognized tax benefits of which $1.0 million, if recognized, would affect the effective tax rate. In comparison, at December 31, 2015, the Company had $7.8 million in unrecognized tax benefits of which $0.9 million, if recognized, would affect the effective tax rate. The Company's unrecognized tax benefits relate to multiple foreign and domestic jurisdictions. There are potential changes in unrecognized tax benefits from the multiple jurisdictions in which the Company operates, as well as the expiration of various statutes of limitation and possible completion of tax examinations; however, the Company does not anticipate that total unrecognized tax benefits will significantly change over the next 12 months.
During the years ended December 31, 2014, 2015 and 2016, the Company recognized $0.4 million, $0.4 million and $(0.8) million, respectively in interest and penalties expenses/(benefits). The Company had $1.3 million, $1.7 million and $0.9 million of accrued interest and penalties related to uncertain tax positions at December 31, 2014, 2015 and 2016, respectively. Interest and penalties related to uncertain tax positions are recognized as a component of income tax expense.
Net income per share
Net income per share is computed based on the weighted-average number of common shares outstanding during the periods presented. Additionally, diluted earnings per share data gives effect to all potentially dilutive common shares that were outstanding during the periods presented (Note 11).
Foreign currency translation
A significant portion of the Company's business operations occur outside of the United States. The local currency of each of the Company's Subsidiaries is considered its functional currency, except for the Company's subsidiaries in Singapore and Venezuela where the U.S. dollar is used. All assets and liabilities are translated into U.S. dollars at exchange rates existing at the balance sheet dates, revenue and expenses are translated at weighted-average exchange rates and stockholders' equity is recorded at historical exchange rates. The resulting foreign currency translation adjustments are recorded as a separate component of stockholders' equity in the consolidated balance sheets and transaction gains and losses are included in other income and expense in the consolidated financial statements. Net of tax, the accumulated other comprehensive loss related to the foreign currency translation adjustments are $52.6 million (net of tax of $10.8 million), $71.6 million (net of tax of $10.9 million) and $84.7 million (net of tax of $13.4 million), at December 31, 2014, 2015 and 2016, respectively.
-78-
NU SKIN ENTERPRISES, INC.
Notes to Consolidated Financial Statements
Classification of Venezuela as a Highly Inflationary Economy and Devaluation of Its Currency
The Company commenced operations in Venezuela in 2007, where it markets a variety of personal care and nutritional products. Total assets in Venezuela as of December 31, 2015 and 2016 are $7.9 million and zero, of which $4.3 million and zero are monetary assets in each year, respectively. The Venezuela subsidiary also had a $33.7 million and zero intercompany balance to its parent company as of December 31, 2015 and 2016, respectively, with respect to charges for inventory, commissions, license fees and service fees. The Company imports all of its products into Venezuela from the United States. Venezuela represents a very small portion of the Company's overall business with sales during 2014, 2015 and 2016 representing approximately 1.0%, 0.2% and 0.1% of the Company's overall revenue, respectively.
Since 2010, Venezuela has been considered a highly inflationary economy. A country is considered to have a highly inflationary economy if it has a cumulative inflation rate of approximately 100% or more over a three-year period as well as other qualitative factors including historic inflation rate trends (increasing and decreasing), the capital intensiveness of the operation and other pertinent economic factors. The functional currency in highly inflationary economies is required to be the functional currency of the entity's parent company (which for the Company's Venezuela subsidiary is the U.S. dollar), and transactions denominated in the local currency are remeasured to the functional currency. The remeasurement of bolivars into U.S. dollars creates foreign currency transaction gains or losses, which the Company includes in its consolidated statement of income.
The Venezuela subsidiary did not transition to highly inflationary status until the first quarter of 2014. As a result, the Company continued to account for the Venezuela subsidiary as a bolivar functional currency entity, rather than a U.S. dollar functional currency entity. In the first quarter of 2014, the Company began to account for this subsidiary as highly inflationary, and therefore changed the functional currency of the entity to the U.S. dollar. The consolidated statement of income for the year ended December 31, 2014, includes an out-of-period adjustment of $6.3 million to correct this error as it was not deemed to be material to the current or prior period financial statements.
During the first quarter of 2014, two new foreign exchange mechanisms ("SICAD I" and "SICAD II") became available in Venezuela. As of March 31, 2014, the Company determined it would be most appropriate for it to utilize the SICAD I rate, which was approximately 10.7 bolivars per U.S. dollar. As a result of the adoption of this rate during the period ended March 31, 2014, the Company recorded a $14.7 million charge in Other Income (Expense) to reflect foreign currency transaction losses on its net monetary assets denominated in bolivar, which is reflected in the year ended December 31, 2014.
As of June 30, 2014, the Company determined that it would be most appropriate for it to utilize the SICAD II rate, which was approximately 50 bolivars per U.S. dollar, as the Company had not been successful in getting approval under SICAD I and believed the SICAD II rate better reflected the rate at which the Company would be able to convert bolivars to U.S. dollars. As a result of the adoption of this rate during the three months ended June 30, 2014, the Company recorded an additional $25.3 million charge in Other Income (Expense) to reflect additional foreign currency translation losses on its net monetary assets denominated in bolivar, which is reflected in the year ended December 31, 2014.
In the first quarter of 2015, a new foreign exchange mechanism ("SIMADI") was announced, which utilizes a variable exchange rate that was approximately 193 bolivars per U.S. dollar as of March 31, 2015. As a result of this new exchange mechanism, in 2015, the Company recorded charges totaling $10.2 million in other income (expense) to reflect additional foreign currency translation losses on its net monetary assets denominated in bolivars.
-79-
NU SKIN ENTERPRISES, INC.
Notes to Consolidated Financial Statements
Fair value of financial instruments
The carrying value of financial instruments including cash and cash equivalents, accounts receivable and accounts payable approximate fair values due to the short-term nature of these instruments. The Company's current investments as of December 31, 2016 include certificates of deposits and pre-refunded municipal bonds that are classified by management as held-to-maturity as the Company had the positive intent and ability to hold to maturity. The carrying value of these current investments approximate fair values due to the short-term nature of these instruments. As of December 31, 2015 and 2016, the long-term debt fair value is $252.4 million and $497.4 million, respectively. The estimated fair value of the Company's debt is based on interest rates available for debt with similar terms and remaining maturities. The fair value of the Convertible Note is highly dependent upon the Company's stock price at the valuation date. The Company has classified these instruments as Level 2 in the fair value hierarchy. Fair value estimates are made at a specific point in time, based on relevant market information.
The FASB Codification defines fair value as the price that would be received to sell an asset or paid to transfer a liability in the principal or most advantageous market for the asset or liability in an orderly transaction between market participants at the measurement date. On a quarterly basis, the Company measures at fair value certain financial assets, including cash equivalents. Accounting standards specify a hierarchy of valuation techniques based on whether the inputs to those valuation techniques are observable or unobservable. Observable inputs reflect data obtained from independent sources, while unobservable inputs reflect the Company's market assumptions. These two types of inputs have created the following fair-value hierarchy:
▪ Level 1 – quoted prices in active markets for identical assets or liabilities;
▪ Level 2 – inputs, other than the quoted prices in active markets, that are observable either directly or indirectly;
▪ Level 3 – unobservable inputs based on the Company's own assumptions.
Accounting standards permit companies, at their option, to measure many financial instruments and certain other items at fair value. The Company has elected not to apply the fair value option to existing eligible items.
-80-
NU SKIN ENTERPRISES, INC.
Notes to Consolidated Financial Statements
Stock-based compensation
All share-based payments, including grants of stock options and restricted stock units, are required to be recognized in the Company's financial statements based upon their respective grant date fair values. The Black-Scholes option-pricing model is used to estimate the fair value of stock options. The determination of the fair value of stock options is affected by the Company's stock price and a number of assumptions, including expected volatility, expected life, risk-free interest rate and expected dividends. The Company uses historical volatility as the expected volatility assumption required in the Black-Scholes model. The expected life of the stock options is based on historical data trended into the future. The risk-free interest rate assumption is based on observed interest rates appropriate for the expected terms of the Company's stock options. The fair value of the Company's restricted stock units is based on the closing market price of its stock on the date of grant less the Company's expected dividend yield. The Company
recognizes stock-based compensation net of any estimated forfeitures over the requisite service period of the award.
The total compensation expense related to equity compensation plans was $17.5 million, $7.4 million and $8.9 million for the years ended December 31, 2014, 2015 and 2016, respectively. In 2014, 2015 and 2016, these amounts reflect the reversal of $4.7 million, $7.6 million and $9.6 million, respectively, for certain performance based awards that were no longer expected to vest. For the years ended December 31, 2014, 2015 and 2016, all stock-based compensation expense was recorded within general and administrative expenses.
Reporting comprehensive income
Comprehensive income is defined as the change in equity of a business enterprise during a period from transactions and other events and circumstances from non-owner sources, and it includes all changes in equity during a period except those resulting from investments by owners and distributions to owners.
Accounting for derivative instruments and hedging activities
The Company recognizes all derivatives as either assets or liabilities, with the instruments measured at fair value.
Portions of the Company's Japanese yen borrowings prior to its October 2014 refinancing were designated, and were effective as, economic hedges of the net investment in its foreign operations. Accordingly, foreign currency transaction gains or losses due to spot rate fluctuations on these debt instruments were included in foreign currency translation adjustments within other comprehensive income. Included in the cumulative translation adjustment are $1.4 million, zero and zero pretax net gains for the years ended December 31, 2014, 2015 and 2016, respectively, from Japanese yen borrowings.
Additionally, the Company's Subsidiaries enter into significant transactions with each other and third parties that may not be denominated in the respective Subsidiaries' functional currencies. The Company regularly monitors its foreign currency risks and seeks to reduce its exposure to fluctuations in foreign exchange rates using foreign currency exchange contracts and through certain intercompany loans of foreign currency.
-81-
NU SKIN ENTERPRISES, INC.
Notes to Consolidated Financial Statements
Hedge effectiveness is assessed at inception and throughout the life of the hedge to ensure the hedge qualifies for hedge accounting treatment. Changes in fair value associated with hedge ineffectiveness, if any, are recorded in the results of operations currently. In the event that an anticipated transaction is no longer likely to occur, the Company recognizes the change in fair value of the derivative in its results of operations currently.
Changes in the fair value of derivatives are recorded in current earnings or accumulated other comprehensive loss, depending on the intended use of the derivative and its resulting designation. The gains and losses in accumulated other comprehensive loss stemming from these derivatives will be reclassified into earnings in the period during which the hedged forecasted transaction affects earnings. The fair value of the receivable and payable amounts related to these unrealized gains and losses is classified as other current assets and liabilities. The Company does not use such derivative financial instruments for trading or speculative purposes. Gains and losses on certain intercompany loans of foreign currency are recorded as other income and expense in the consolidated statements of income.
Recent accounting pronouncements
In May 2014, the FASB issued ASU No. 2014-09,
Revenue from Contracts with Customers (Topic 606)
. The new revenue recognition standard provides a five-step analysis of transactions to determine when and how revenue is recognized. The core principle is that a company should recognize revenue to depict the transfer of promised goods or services to customers in an amount that reflects the consideration to which the entity expects to be entitled in exchange for those goods or services. This ASU is effective for annual periods beginning after December 15, 2017. As the Company evaluates the impact of this ASU, the more significant changes that the Company has identified relate to the current method of accruing its loyalty points program from a cost provision method to a deferred revenue method in accordance with the new guidance. The Company is continuing to evaluate the impact this ASU, and related amendments and interpretive guidance, will have on its consolidated financial statements. The Company plans to adopt this ASU beginning in Q1 2018 with a cumulative adjustment to retained earnings as opposed to retrospectively adjusting prior periods.
In August 2014, the FASB issued ASU No. 2014-15,
Presentation of Financial Statements — Going Concern (Subtopic 205-40).
The purpose of this ASU is to incorporate into U.S. GAAP management's responsibility to evaluate whether there is substantial doubt about an entity's ability to continue as a going concern within one year after the date that the financial statements are issued, and to provide related footnote disclosures. This ASU was effective for the fiscal year ended December 31, 2016 and did not have a significant impact on the Company's consolidated financial statements or the accompanying disclosures.
In April 2015, the FASB issued ASU 2015-03,
Interest - Imputation of Interest (Subtopic 835-30): Simplifying the Presentation of Debt Issuance Costs
. This guidance requires that debt issuance costs be presented as a direct reduction to the carrying amount of the related debt in the balance sheet rather than as a deferred charge, consistent with the presentation of discounts on debt. ASU 2015-15,
Interest - Imputation of Interest (Subtopic 835-30): Presentation and Subsequent Measurement of Debt Issuance Costs associated with Line-of-Credit Arrangements
, was issued in August 2015 to clarify that the U.S. Securities and Exchange Commission ("SEC") staff would not object to an entity deferring and presenting debt issuance costs related to a line-of-credit arrangement as an asset and subsequently amortizing the deferred debt issuance costs ratably over the term of the line-of-credit arrangement, regardless of whether there are any outstanding borrowings on the line-of-credit arrangement. This ASU was effective for the fiscal year ended December 31, 2016 and did not have a significant impact on the Company's consolidated financial statements.
In July 2015, the FASB issued ASU 2015-11,
Inventory (Topic 330): Simplifying the Measurement of Inventory
. This guidance requires an entity to measure inventory at the lower of cost and net realizable value, rather than at the lower of cost or market. The guidance is effective for interim and annual periods beginning after December 15, 2016, and is to be applied prospectively. Early adoption is permitted. The adoption of this guidance is not expected to have a significant impact on the Company's consolidated financial statements.
-82-
NU SKIN ENTERPRISES, INC.
Notes to Consolidated Financial Statements
In February 2016, the FASB issued ASU 2016-02,
Leases (Subtopic 842)
. ASU 2016-02 will require companies to recognize lease assets and lease liabilities on the balance sheet and disclose key information about leasing arrangements. For public companies, this standard is effective for annual reporting periods beginning after December 15, 2018, and early adoption is permitted. The Company is currently evaluating the impact of this standard on its consolidated financial position, results of operations, and cash flows.
In March 2016, the FASB issued ASU 2016-09,
Stock Compensation (Topic 718): Improvements to Employee Share-Based Payment Accounting
. The objective of this update is to simplify several aspects of the accounting for employee share-based payment transactions, including the income tax consequences, classification of awards as either equity or liabilities, and classification on the statement of cash flows. This ASU is effective for fiscal years beginning after December 15, 2016, including interim periods within those fiscal years. Early adoption is permitted. The Company is currently evaluating the new guidance to determine the impact it may have on its consolidated financial statements.
In the second half of 2016, the FASB issued ASU Nos. 2016-15,
Statement of Cash Flows (Topic 230): Classification of Certain Cash Receipts and Cash Payments
, and 2016-18,
Statement of Cash Flows (Topic 230): Restricted Cash.
The objective of these updates is to reduce the diversity in practice in the classification of certain cash receipts and cash payments, and the presentation of restricted cash within an entity's statement of cash flows, respectively. These ASUs are effective for interim and annual fiscal periods beginning after December 15, 2017. Early adoption is permitted. The adoption of this guidance is not expected to have a material impact on the Company's consolidated financial statements.
In January 2017, the FASB issued ASU 2017-01,
Business Combinations (Topic 805): Clarifying the Definition of a
Business. This guidance revises the definition of a business as it relates to acquisitions, disposals, goodwill impairments and consolidations. This ASU is effective for annual periods beginning after December 15, 2017. Early adoption is permitted. The adoption of this guidance is not expected to have a material impact on the Company's consolidated financial statements.
In January 2017, the FASB issued ASU 2017-04,
Intangibles – Goodwill and Other (Topic 350): Simplifying the Test for Goodwill Impairment
.
This guidance simplifies the required test of goodwill for impairment by eliminating Step 2 from the goodwill impairment test. If a company determines in Step 1 of the goodwill impairment test that the carrying value of goodwill is less than the fair value, an impairment in that amount should be recorded to the income statement, rather than proceeding to Step 2. This ASU is effective for interim and annual impairment tests in fiscal years beginning after December 15, 2019. Early adoption is permitted. The adoption of this guidance is not expected to have a material impact on the Company's consolidated financial statements.
-83-
NU SKIN ENTERPRISES, INC.
Notes to Consolidated Financial Statements
3.
Prepaid Expenses and Other
Prepaid expenses and other consist of the following (U.S. dollars in thousands):
|
December 31,
|
||||||||
|
2015
|
2016
|
|||||||
|
Deferred charges
|
$
|
14,940
|
$
|
9,319
|
||||
|
Prepaid income taxes
|
40,407
|
6,799
|
||||||
|
Prepaid inventory and import costs
|
10,573
|
10,857
|
||||||
|
Prepaid rent, insurance and other occupancy costs
|
11,590
|
13,398
|
||||||
|
Prepaid promotion and event cost
|
4,486
|
4,126
|
||||||
|
Prepaid other taxes
|
4,146
|
4,778
|
||||||
|
Forward contracts
|
485
|
1,371
|
||||||
|
Deposits
|
1,513
|
1,079
|
||||||
|
Other
|
13,807
|
13,349
|
||||||
|
$
|
101,947
|
$
|
65,076
|
|||||
4.
Property and Equipment
Property and equipment are comprised of the following (U.S. dollars in thousands):
|
December 31,
|
||||||||
|
2015
|
2016
|
|||||||
|
Land
|
$
|
33,610
|
$
|
33,158
|
||||
|
Buildings
|
272,208
|
266,436
|
||||||
|
Construction in progress
(1)
|
7,827
|
31,124
|
||||||
|
Furniture and fixtures
|
81,274
|
82,194
|
||||||
|
Computers and equipment
|
141,079
|
143,014
|
||||||
|
Leasehold improvements
|
116,120
|
109,863
|
||||||
|
Scanners
|
11,805
|
10,578
|
||||||
|
Vehicles
|
2,207
|
2,090
|
||||||
|
666,130
|
678,457
|
|||||||
|
Less: accumulated depreciation
|
(211,593
|
)
|
(233,725
|
)
|
||||
|
$
|
454,537
|
$
|
444,732
|
|||||
| (1) |
Construction in progress includes $0.7 million and $25.8 million as of December 31, 2015 and 2016, respectively, of eligible capitalized internal-use software development costs which will be reclassified to computers and equipment when placed into service.
|
Depreciation of property and equipment totaled $46.5 million, $61.6 million and $60.8 million for the years ended December 31, 2014, 2015 and 2016, respectively.
-84-
NU SKIN ENTERPRISES, INC.
Notes to Consolidated Financial Statements
5.
Goodwill and Other Intangible Assets
Goodwill and other intangible assets consist of the following (U.S. dollars in thousands):
|
Carrying Amount at
December 31,
|
||||||||
|
Goodwill and indefinite life intangible assets:
|
2015
|
2016
|
||||||
|
Goodwill
|
$
|
112,446
|
$
|
114,954
|
||||
|
Trademarks and trade names
|
24,599
|
24,599
|
||||||
|
Other indefinite lived intangibles
|
—
|
3,763
|
||||||
|
$
|
137,045
|
$
|
143,316
|
|||||
|
December 31, 2015
|
December 31, 2016
|
||||||||||||||||
|
Finite life intangible assets:
|
Gross Carrying Amount
|
Accumulated Amortization
|
Gross Carrying Amount
|
Accumulated Amortization
|
Weighted-average
Amortization Period
|
||||||||||||
|
Scanner technology
|
$
|
46,482
|
$
|
33,590
|
$
|
46,482
|
$
|
36,624
|
18 years
|
||||||||
|
Developed technology
|
22,500
|
17,558
|
22,500
|
18,383
|
20 years
|
||||||||||||
|
Distributor network
|
11,598
|
11,096
|
11,598
|
11,598
|
15 years
|
||||||||||||
|
Trademarks
|
2,409
|
879
|
2,592
|
1,011
|
15 years
|
||||||||||||
|
Other
|
45,315
|
22,771
|
46,219
|
26,584
|
8 years
|
||||||||||||
|
$
|
128,304
|
$
|
85,894
|
$
|
129,391
|
$
|
94,200
|
15 years
|
|||||||||
Amortization of finite-life intangible assets totaled $8.4 million, $8.6 million and $8.4 million for the years ended December 31, 2014, 2015 and 2016, respectively. In the year ended December 31, 2015, the Company wrote-off approximately $12.0 million of fully amortized intangible assets.
The estimated annual amortization expense for each of the five succeeding fiscal years are as follows (U.S. dollars in thousands):
|
Year Ending December 31,
|
||||
|
2017
|
$
|
8,460
|
||
|
2018
|
8,650
|
|||
|
2019
|
8,480
|
|||
|
2020
|
4,160
|
|||
|
2021
|
2,730
|
|||
All of the Company's goodwill is based in the U.S. Goodwill and indefinite life intangible assets are not amortized, rather they are subject to annual impairment tests. Annual impairment tests were completed resulting in no impairment charges for any of the periods shown. Finite life intangibles are amortized over their useful lives unless circumstances occur that cause the Company to revise such lives or review such assets for impairment.
6.
Other Assets
Other assets consist of the following (U.S. dollars in thousands):
|
December 31,
|
||||||||
|
2015
|
2016
|
|||||||
|
Deferred taxes
|
$
|
40,373
|
$
|
35,752
|
||||
|
Deposits for noncancelable operating leases
|
39,016
|
38,858
|
||||||
|
Deposit for customs assessment
|
35,424
|
—
|
||||||
|
Cash surrender value for life insurance policies
|
27,292
|
32,286
|
||||||
|
Other
|
23,354
|
29,573
|
||||||
|
$
|
165,459
|
$
|
136,469
|
|||||
-85-
NU SKIN ENTERPRISES, INC.
Notes to Consolidated Financial Statements
7.
Accrued Expenses
Accrued expenses consist of the following (U.S. dollars in thousands):
|
December 31,
|
||||||||
|
2015
|
2016
|
|||||||
|
Accrued sales force commissions and other payments
|
$
|
166,273
|
$
|
126,153
|
||||
|
Accrued other taxes
|
35,922
|
31,748
|
||||||
|
Accrued payroll and other employee expenses
|
24,390
|
25,412
|
||||||
|
Accrued payable to vendors
|
40,914
|
28,456
|
||||||
|
Accrued royalties
|
9,701
|
4,767
|
||||||
|
Sales return reserve
|
7,752
|
6,125
|
||||||
|
Deferred revenue
|
6,644
|
13,494
|
||||||
|
Other
|
19,320
|
38,868
|
||||||
|
$
|
310,916
|
$
|
275,023
|
|||||
8.
Other Liabilities
Other liabilities consist of the following (U.S. dollars in thousands):
|
December 31,
|
||||||||
|
2015
|
2016
|
|||||||
|
Deferred tax liabilities
|
$
|
16,177
|
$
|
643
|
||||
|
Reserve for other tax liabilities
|
9,463
|
6,264
|
||||||
|
Reserve for customs assessment
|
3,600
|
—
|
||||||
|
Liability for deferred compensation plan
|
33,456
|
36,730
|
||||||
|
Pension plan benefits reserve
|
4,859
|
5,631
|
||||||
|
Build to suit – financing obligation
|
10,238
|
9,543
|
||||||
|
Deferred rent and deferred tenant incentives
|
6,336
|
5,952
|
||||||
|
Asset retirement obligation
|
4,682
|
5,682
|
||||||
|
Other
|
2,069
|
6,354
|
||||||
|
$
|
90,880
|
$
|
76,799
|
|||||
9.
Long-Term Debt
Credit Agreement
On October 9, 2014, the Company entered into a Credit Agreement (the "Credit Agreement") with various financial institutions, and Bank of America, N.A. as administrative agent. The Credit Agreement provides for a $127.5 million term loan facility, a 6.6 billion Japanese yen term loan facility and a $187.5 million revolving credit facility, each with a term of five years. On October 10, 2014, the Company drew the full amount of the term loan facilities, and as of December 31, 2015 and 2016, the Company had an outstanding balance of $47.5 million on the revolving credit facility. Any additional amounts drawn under the revolving credit facility will bear interest at rates that will be determined in accordance with the Credit Agreement. The Credit Agreement requires that the Company maintains a consolidated leverage ratio not exceeding 2.25 to 1.00 and a consolidated interest coverage ratio of no less than 3.00 to 1.00. The Company believes these covenants provide it with greater flexibility to pay dividends and repurchase stock. The Company is in compliance with its debt covenants.
-86-
NU SKIN ENTERPRISES, INC.
Notes to Consolidated Financial Statements
On June 16, 2016, the Company issued $210.0 million of convertible senior notes (the "Convertible Notes") in a private offering to a Chinese investor (the "Holder"). The Convertible Notes are senior unsecured obligations which will rank equal in right of payment to all senior unsecured indebtedness of the Company, and will rank senior in right of payment to any indebtedness that is contractually subordinated to the Convertible Notes. Interest on the Convertible Notes is payable semiannually in arrears on June 15 and December 15 of each year, beginning on December 15, 2016 at a rate of 4.75% per annum.
The Convertible Notes mature on June 15, 2020, unless repurchased or converted prior to maturity. Prior to the stated maturity date, the Company may, at its option, redeem all or part of the Convertible Notes at a price equal to 100% of the principal amount thereof, plus accrued and unpaid interest, if any, provided that its common stock share price is equal to or exceeds 180% of the applicable conversion price for 20 or more trading days (including the final three trading days) in the 30 consecutive trading days prior to the Company's exercise of such redemption right. The Holder of the Convertible Notes may, at its option, cause the Company to repurchase all of such Holder's Convertible Notes or any portion thereof that is equal to $1,000 in principal amount or multiples of $1,000 upon a change in control or a termination of trading of the Company's common stock, as those terms are defined in the indenture governing the Convertible Notes. In addition, each holder of the Convertible Notes shall have the right, at such holder's option, to convert all or any portion thereof that is equal to $1,000 in principal amount or multiples of $1,000 at any time beginning six calendar months following June 16, 2016, at the then-applicable conversion rate. Upon conversion by the Holder, the Convertible Notes will be settled in cash with respect to principal and any accrued and unpaid interest to such date and in the Company's common shares with respect to any additional amounts, based on the applicable conversion rate at such time. The Convertible Notes had an initial conversion rate of 21.5054 common shares per $1,000 principal amount of the Convertible Notes (which is equal to an initial conversion price of approximately $46.50 per common share). Throughout the term of the Convertible Notes, the conversion rate may be adjusted upon the occurrence of certain specified events.
Of the $210.0 million in proceeds received from the issuance of the Convertible Notes, $199.1 million was allocated to long-term debt (the "Liability Component") and $10.9 million was allocated to additional paid-in-capital (the "Equity Component") within the Company's consolidated balance sheet. The Liability Component was calculated by measuring the fair value of a similar debt instrument that does not have an associated conversion feature. The amount allocated to the Equity Component, which represents the conversion option, was calculated by deducting the fair value of the Liability Component from the par value of the Convertible Notes. The Company determined that the conversion option does not require separate accounting treatment as a derivative instrument because it is both indexed to the Company's own stock and would be classified in stockholders' equity if freestanding. The Equity Component will not be remeasured as long as it continues to meet the conditions for equity classification. The excess of the principal amount of the Liability Component over its carrying amount (the "Debt Discount") will be amortized to interest expense over the term of the Convertible Notes. As a result, the Liability Component will be accreted up to the Convertible Notes' $210.0 million face value, resulting in additional non-cash interest expense being recognized within the Company's consolidated statement of income. The effective interest rate on the Convertible Notes is approximately 7.1% per annum.
-87-
NU SKIN ENTERPRISES, INC.
Notes to Consolidated Financial Statements
|
December 31,
2016
|
||||
|
Principal
|
$
|
210,000
|
||
|
Unamortized debt discount (conversion option)
|
(9,622
|
)
|
||
|
Total long-term debt, net
|
200,378
|
|||
|
Unamortized debt discount (issuance costs)
|
(5,506
|
)
|
||
|
Net carrying amount
|
$
|
194,872
|
||
The net carrying amount of the Liability Component was recorded to long-term debt within the Company's consolidated balance sheet.
The Company incurred approximately $6.6 million of issuance costs related to the issuance of the Convertible Notes. Of the $6.6 million in issuance costs incurred, $6.3 million and $0.3 million were recorded to deferred financing cost and additional paid-in capital, respectively, in proportion to the allocation of the proceeds of the Convertible Notes. The $6.3 million recorded to deferred financing cost on the Company's consolidated balance sheet as a reduction of long-term debt is being amortized over the contractual term of the Convertible Notes using the effective interest method.
During the year ended December 31, 2016, the Company recognized $7.5 million in interest expense related to the Convertible Notes, which included $5.4 million of contractual interest and $2.1 million in amortization of debt issuance costs and in amortization of the Debt Discount.
-88-
NU SKIN ENTERPRISES, INC.
Notes to Consolidated Financial Statements
|
Facility or
Arrangement
|
Original Principal Amount
|
Balance as of
December 31, 2015
|
Balance as of
December 31, 2016
(1)(2)
|
Interest Rate
|
Repayment terms
|
|||||
|
Credit Agreement term loan facility:
|
||||||||||
|
U.S. dollar
denominated:
|
$127.5 million
|
$118.7 million
|
$108.4 million
|
Variable 30 day: 3.52%
|
One half of the principal amount payable in increasing quarterly installments over a five-year period beginning on December 31, 2014, with the remainder payable at the end of the five-year term.
|
|||||
|
Japanese yen
denominated:
|
6.6 billion yen
|
6.1 billion yen ($51.1 million as of December 31, 2015)
|
5.6 billion yen ($47.9 million as of December 31, 2016)
|
Variable 30 day: 2.75%
|
One half of the principal amount payable in increasing quarterly installments over a five-year period beginning on December 31, 2014, with the remainder payable at the end of the five-year term.
|
|||||
|
Credit Agreement revolving credit facility:
|
||||||||||
|
$47.5 million
|
$47.5 million
|
Variable 30 day: 3.52%
|
Revolving line of credit expires October 2019.
|
|||||||
|
Korean subsidiary loan:
|
$20.0 million
|
$20.0 million
|
$10.0 million
|
1.12%
|
Remaining balance payable on March 16, 2018.
|
|||||
|
Japan subsidiary loan:
|
2.0 billion yen
|
2.0 billion yen ($16.6 million as of December 31, 2015)
|
1.3 billion yen ($11.4 million as of December 31, 2016)
|
0.66%
|
Payable in semi-annual installments over three years that began on January 31, 2016.
|
|||||
| Convertible note |
$210.0 million
|
—
|
$210.0 million
|
4.75%
|
Principal amount payable on June 15, 2020.
|
| (1) |
As of December 31, 2016, the current portion of the Company's debt (i.e. becoming due in the next 12 months) included $13.5 million of the balance of its U.S. dollar denominated debt under the Credit Agreement facility, $6.0 million of the balance of its Japanese yen-denominated debt under the Credit Agreement facility, $10.0 million of the Korea subsidiary loan and $5.7 million of the Japan subsidiary loan. The Company has classified the $47.5 million borrowed under the revolving line of credit and the $10.0 million of the Korea subsidiary loan as short term because it is the Company's intention to use the line of credit to borrow and pay back funds over short periods of time as well as pay off the Korea subsidiary loan in 2017.
|
| (2) |
The carrying value of the debt reflects the amounts stated in the above table less a debt discount of $12.8 million and debt issuance costs of $5.5 million (consisting of $15.1 million related to the Convertible Note and $3.2 million related to the credit agreement), which is not reflected in this table.
|
-89-
NU SKIN ENTERPRISES, INC.
Notes to Consolidated Financial Statements
Maturities of all long-term debt at December 31, 2016, based on the year-end exchange rate, are as follows (U.S. dollars in thousands):
|
Year Ending December 31,
|
||||
|
2017
|
$
|
82,727
|
||
|
2018
|
29,840
|
|||
|
2019
|
112,611
|
|||
|
2020
|
210,000
|
|||
|
2021
|
─
|
|||
|
Thereafter
|
─
|
|||
|
Total
(1)
|
$
|
435,178
|
||
| (1) |
The carrying value of the debt reflects the amounts stated in the above table less a debt discount of $18.3 million, which is not reflected in this table.
|
10.
Lease and Financing Obligations
In 2014, the Company's subsidiary in South Korea entered into a lease agreement (the "Lease") with a third-party landlord for a new regional headquarters. As part of the Lease, the landlord agreed to renovate an existing building (the "Existing Building") and construct a new building (the "New Building") adjacent to the Existing Building. The Lease provided that when such renovations and construction were completed, the Company and the landlord would enter into a new lease agreement (the "New Lease") for the Existing Building and the New Building.
In April 2015, the Company and the landlord entered into the New Lease on terms generally consistent with the 2014 lease. The New Lease term is for the period May 1, 2015 through April 30, 2025, with an option to extend the agreement for 10 years.
The Company accounts for its lease of the Existing Building as an operating lease. As an inducement to enter into the Lease, the landlord agreed to make certain improvements on behalf of the Company to the Existing Building. The improvements have been accounted for by the Company as a tenant incentive.
The Company has concluded that it is the deemed owner (for accounting purposes only) of the New Building during the construction period under build-to-suit lease accounting. Construction of the New Building began in June 2014 and was completed in June 2015. During the construction period, the Company recorded estimated project construction costs as a construction in progress asset in "Property and equipment, net" and a corresponding long-term liability in "Other liabilities," respectively, in its consolidated balance sheets. In addition, the amounts that the Company has paid or incurred for normal tenant improvements were also recorded to the construction-in-progress asset.
-90-
NU SKIN ENTERPRISES, INC.
Notes to Consolidated Financial Statements
Lease payments attributed to the New Building are allocated between principal and interest expense using the effective interest method. The principal portion of the lease payment attributed to the New Building is reflected as a principal reduction of the financing obligation. In addition, the asset, which represents the total estimated cost of construction of the New Building at the end of the construction period, is being depreciated over the initial ten-year term of the New Lease to its expected residual value. At the conclusion of the New Lease, the Company will de-recognize both the net book value of the asset and the unamortized portion of the financing obligation. The amount of asset depreciation and financing obligation amortization is structured at the outset such that the remaining residual book value of the asset is equal to the remaining financing obligation at the end of the lease term.
As of December 31, 2015, the Company had recognized $19.9 million as the value of the New Building offset by accumulated depreciation of $0.3 million and a financing obligation in the amount of $10.6 million, net of a $9.3 million deposit paid directly to the landlord, as part of Other liabilities in its consolidated balance sheet. As of December 31, 2016, the Company had recognized $18.9 million as the value of the New Building offset by accumulated depreciation of $0.8 million and a financing obligation of $10.0 million, net of a $9.1 million deposit paid directly to the landlord, as part of other liabilities in its consolidated balance sheet.
As of December 31, 2015, the tenant incentive asset and deferred tenant incentive liability associated with the Existing Building totaled $5.6 million and $5.1 million, respectively. As of December 31, 2016, the tenant incentive asset and deferred tenant incentive liability associated with the Existing Building totaled $4.9 million and $4.5 million, respectively.
In addition to the lease arrangements described above, the Company leases office space and computer hardware under noncancelable long-term operating leases. Most leases include renewal options of at least three years.
-91-
NU SKIN ENTERPRISES, INC.
Notes to Consolidated Financial Statements
|
Year Ending December 31,
|
Operating Leases
|
Financing Obligations
|
||||||
|
2017
|
$
|
36,180
|
$
|
631
|
||||
|
2018
|
30,001
|
650
|
||||||
|
2019
|
21,310
|
670
|
||||||
|
2020
|
11,602
|
690
|
||||||
|
2021
|
5,997
|
698
|
||||||
|
Thereafter
|
15,127
|
2,502
|
||||||
|
Total minimum lease payments
|
$
|
120,217
|
$
|
5,841
|
||||
Rent expense for operating leases totaled $52.3 million, $52.4 million, and $48.2 million for the years ended December 31, 2014, 2015 and 2016, respectively. Interest expense associated with the financing obligations was zero, $0.1 million and $0.2 million for the years ended December 31, 2014, 2015 and 2016, respectively
.
11.
Capital Stock
The Company's authorized capital stock consists of 25 million shares of preferred stock, par value $.001 per share, 500 million shares of Class A common stock, par value $.001 per share, and 100 million shares of Class B common stock, par value $.001 per share. The shares of Class A common stock and Class B common stock are identical in all respects, except for voting rights and certain conversion rights and transfer restrictions, as follows: (1) each share of Class A common stock entitles the holder to one vote on matters submitted to a vote of the Company's stockholders and each share of Class B common stock entitles the holder to ten votes on each such matter; (2) stock dividends of Class A common stock may be paid only to holders of Class A common stock and stock dividends of Class B common stock may be paid only to holders of Class B common stock; (3) if a holder of Class B common stock transfers such shares to a person other than a permitted transferee, as defined in the Company's Certificate of Incorporation, such shares will be converted automatically into shares of Class A common stock; and (4) Class A common stock has no conversion rights; however, each share of Class B common stock is convertible into one share of Class A common stock, in whole or in part, at any time at the option of the holder. All outstanding Class B shares have been converted to Class A shares. As of December 31, 2015 and 2016, there were no preferred or Class B common shares outstanding.
Weighted-average common shares outstanding
The following is a reconciliation of the weighted-average common shares outstanding for purposes of computing basic and diluted net income per share (in thousands):
|
Year Ended December 31,
|
||||||||||||
|
2014
|
2015
|
2016
|
||||||||||
|
Basic weighted-average common shares outstanding
|
59,073
|
57,997
|
55,412
|
|||||||||
|
Effect of dilutive securities:
Stock awards and options
|
1,814
|
1,060
|
683
|
|||||||||
|
Convertible note
|
—
|
—
|
2
|
|||||||||
|
Diluted weighted-average common shares outstanding
|
60,887
|
59,057
|
56,097
|
|||||||||
-92-
NU SKIN ENTERPRISES, INC.
Notes to Consolidated Financial Statements
Repurchases of common stock
In 1998, the Company's board of directors approved a stock repurchase plan authorizing the Company to repurchase $10.0 million of its outstanding shares of Class A common stock on the open market or in private transactions. The Company's board from time to time increased the amount authorized under the 1998 stock repurchase plan, including an increase of $400.0 million announced in August 2013. In October 2015, the Company's board terminated the 1998 stock repurchase plan and approved a new repurchase plan with an initial authorization amount of $500.0 million. The repurchases are used primarily for strategic initiatives and to offset dilution from the Company's equity incentive plans and from conversion of the Convertible Notes. During the years ended December 31, 2014, 2015 and 2016, the Company repurchased 0.8 million, 3.8 million and 4.5 million shares of Class A common stock for an aggregate price of $45.7 million, $164.1 million and $247.2 million, respectively. At December 31, 2016, $199.7 million was available for repurchases under the 2015 stock repurchase plan.
12.
Stock–Based Compensation
At December 31, 2016, the Company had the following stock-based employee compensation plans:
Equity Incentive Plans
In April 2010, the Company's Board of Directors approved the Nu Skin Enterprises, Inc. 2010 Omnibus Incentive Plan (the "2010 Omnibus Incentive Plan"). This plan was approved by the Company's stockholders at the Company's 2010 Annual Meeting of Stockholders held in May 2010. The 2010 Omnibus Incentive Plan provides for granting of a variety of equity based awards including stock options, stock appreciation rights, restricted stock, restricted stock units, other share based awards, performance cash, performance shares and performance units to executives, other employees, independent consultants and directors of the Company and its subsidiaries. Options granted under the 2010 Omnibus Incentive Plan are generally non-qualified stock options, but the 2010 Omnibus Incentive Plan permits some stock options granted to qualify as "incentive stock options" under the U.S. Internal Revenue Code. The exercise price of a stock option generally is equal to the fair market value of the Company's common stock on the stock option grant date. The contractual term of a stock option granted under the 2010 Omnibus Incentive Plan is seven years. Currently, all shares issued upon the exercise of stock options are from the Company's treasury shares. Subject to certain adjustments, 7.0 million shares were authorized for issuance under the 2010 Omnibus Incentive Plan. On June 3, 2013, the Company's stockholders approved an Amended and Restated 2010 Omnibus Incentive Plan, which among other things increased the number of shares available for awards by 3.2 million shares. On May 24, 2016, the Company's stockholders approved a Second Amended and Restated 2010 Omnibus Incentive Plan, which among other things increased the number of shares available for awards by 3.8 million shares.
In July 2013, the compensation committee of the board of directors approved the grant of performance stock options to certain key employees under the Amended and Restated 2010 Omnibus Incentive Plan. Vesting for the options is performance based, with the options vesting in four installments if the Company's earnings per share equal or exceed the four established performance levels, measured in terms of diluted earnings per share. One fourth of the options will vest upon earnings per share meeting or exceeding the first performance level, one fourth of the options will vest upon earnings per share meeting or exceeding the second performance level, one fourth of the options will vest upon earnings per share meeting or exceeding the third performance level and one fourth of the options will vest upon earnings per share meeting or exceeding the fourth performance level. The unvested options will terminate upon the Company's failure to meet certain performance thresholds for each of years 2013 through 2019. In addition, all unvested options will terminate on March 30, 2020.
-93-
NU SKIN ENTERPRISES, INC.
Notes to Consolidated Financial Statements
The Company has also issued other performance-based awards to a limited number of participants that similarly vest, or become eligible for vesting, upon achievement of various performance targets.
The fair value of stock option awards was estimated using the Black-Scholes option-pricing model with the following assumptions and weighted-average fair values as follows:
|
December 31,
|
|||||
|
Stock Options
:
|
2014
|
2015
|
2016
|
||
|
Weighted average grant date fair value of grants
|
$ 23.01
|
$ 16.26
|
$ 12.59
|
||
|
Risk-free interest rate
(1)
|
1.7%
|
1.7%
|
1.4%
|
||
|
Dividend yield
(2)
|
1.9%
|
2.1%
|
2.3%
|
||
|
Expected volatility
(3)
|
45.4%
|
46.8%
|
47.9%
|
||
|
Expected life in months
(4)
|
62 months
|
65 months
|
68 months
|
||
| (1) |
The risk-free interest rate is based upon the rate on a zero coupon U.S. Treasury bill, for periods within the contractual life of the option, in effect at the time of the grant.
|
| (2) |
The dividend yield is based on the average of historical stock prices and actual dividends paid.
|
| (3) |
Expected volatility is based on the historical volatility of the Company's stock price, over a period similar to the expected life of the option.
|
| (4) |
The expected term of the option is based on the historical employee exercise behavior, the vesting terms of the respective option, and a contractual life of either seven or ten years.
|
-94-
NU SKIN ENTERPRISES, INC.
Notes to Consolidated Financial Statements
|
Shares
(in thousands)
|
Weighted-average Exercise Price
|
Weighted- average Remaining Contractual Term
(in years)
|
Aggregate Intrinsic Value
(in thousands)
|
|||||||||||||
|
Options activity – service based
|
||||||||||||||||
|
Outstanding at December 31, 2015
|
1,469.7
|
$
|
32.85
|
|||||||||||||
|
Granted
|
1,465.9
|
34.59
|
||||||||||||||
|
Exercised
|
(660.2
|
)
|
11.56
|
|||||||||||||
|
Forfeited/cancelled/expired
|
(68.4
|
)
|
47.27
|
|||||||||||||
|
Outstanding at December 31, 2016
|
2,207.0
|
39.93
|
5.07
|
27,021
|
||||||||||||
|
Exercisable at December 31, 2016
|
650.1
|
48.95
|
2.46
|
6,381
|
||||||||||||
|
Options activity – performance based
|
||||||||||||||||
|
Outstanding at December 31, 2015
|
3,598.7
|
$
|
61.10
|
|||||||||||||
|
Granted
|
739.1
|
34.24
|
||||||||||||||
|
Exercised
|
(385.7
|
)
|
30.47
|
|||||||||||||
|
Forfeited/cancelled/expired
|
(226.2
|
)
|
72.74
|
|||||||||||||
|
Outstanding at December 31, 2016
|
3,725.9
|
58.23
|
3.45
|
24,970
|
||||||||||||
|
Exercisable at December 31, 2016
|
900.5
|
31.67
|
0.96
|
14,760
|
||||||||||||
|
Options activity – all options
|
||||||||||||||||
|
Outstanding at December 31, 2015
|
5,068.4
|
$
|
52.91
|
|||||||||||||
|
Granted
|
2,205.0
|
34.48
|
||||||||||||||
|
Exercised
|
(1,045.9
|
)
|
18.54
|
|||||||||||||
|
Forfeited/cancelled/expired
|
(294.6
|
)
|
66.82
|
|||||||||||||
|
Outstanding at December 31, 2016
|
5,932.9
|
51.42
|
4.05
|
51,991
|
||||||||||||
|
Exercisable at December 31, 2016
|
1,550.6
|
38.91
|
1.59
|
21,141
|
||||||||||||
The aggregate intrinsic value in the table above represents the total pretax intrinsic value (the difference between the Company's closing stock price on the last trading day of the respective years and the exercise price, multiplied by the number of in-the-money options) that would have been received by the option holders had all option holders exercised their options on December 31, 2016. This amount varies based on the fair market value of the Company's stock. The total fair value of options vested was $4.2 million of expense, $2.8 million of income and $1.0 million of income, net of tax, for the years ended December 31, 2014, 2015 and 2016, respectively.
Cash proceeds, tax benefits and intrinsic value related to total stock options exercised during 2014, 2015 and 2016, were as follows (U.S. dollars in thousands):
|
December 31,
|
||||||||||||
|
2014
|
2015
|
2016
|
||||||||||
|
Cash proceeds from stock options exercised
|
$
|
11,042
|
$
|
13,041
|
$
|
15,707
|
||||||
|
Tax benefit realized for stock options exercised
|
11,947
|
4,451
|
3,840
|
|||||||||
|
Intrinsic value of stock options exercised
|
17,159
|
12,085
|
30,587
|
|||||||||
-95-
NU SKIN ENTERPRISES, INC.
Notes to Consolidated Financial Statements
Nonvested restricted stock awards as of December 31, 2016 and changes during the year ended December 31, 2016 were as follows:
|
Number of Shares
(in thousands)
|
Weighted-average Grant Date Fair Value
|
|||||||
|
Nonvested at December 31, 2015
|
662.2
|
$
|
60.87
|
|||||
|
Granted
|
220.9
|
39.62
|
||||||
|
Vested
|
(210.3
|
)
|
58.20
|
|||||
|
Forfeited
|
(76.4
|
)
|
63.34
|
|||||
|
Nonvested at December 31, 2016
|
596.4
|
53.62
|
||||||
The Company recognizes stock-based compensation on a straight-line basis, except for performance based awards for which expense is recognized using a graded-attribution method if the results are materially different than the straight-line method. As of December 31, 2016, there was $16.8 million of unrecognized stock-based compensation expense related to nonvested restricted stock awards. That cost is expected to be recognized over a weighted-average period of 2.2 years. As of December 31, 2016, there was $18.8 million of unrecognized stock-based compensation expense related to nonvested stock option awards. That cost is expected to be recognized over a weighted-average period of 2.7 years.
13.
Fair Value
The carrying value of financial instruments including cash and cash equivalents, accounts receivable and accounts payable approximate fair values due to the short-term nature of these instruments. The Company's current investments as of December 31, 2016 include certificates of deposits and pre-refunded municipal bonds that are classified by management as held-to-maturity as the Company had the positive intent and ability to hold to maturity. The carrying value of these current investments approximate fair values due to the short-term nature of these instruments. The Company has classified these instruments as Level 2 in the fair value hierarchy. Fair value estimates are made at a specific point in time, based on relevant market information.
The following tables present the fair value hierarchy for those assets and liabilities measured at fair value on a recurring basis (U.S. dollars in thousands):
|
Fair Value at December 31, 2015
|
||||||||||||||||
|
Level 1
|
Level 2
|
Level 3
|
Total
|
|||||||||||||
|
Financial assets (liabilities):
|
||||||||||||||||
|
Cash equivalents and current investments
|
$
|
47,121
|
$
|
─
|
$
|
─
|
$
|
47,121
|
||||||||
|
Forward contracts
|
─
|
485
|
─
|
485
|
||||||||||||
|
Life insurance contracts
|
─
|
─
|
27,292
|
27,292
|
||||||||||||
|
Total
|
$
|
47,121
|
$
|
485
|
$
|
27,292
|
$
|
74,898
|
||||||||
-96-
NU SKIN ENTERPRISES, INC.
Notes to Consolidated Financial Statements
|
Fair Value at December 31, 2016
|
||||||||||||||||
|
Level 1
|
Level 2
|
Level 3
|
Total
|
|||||||||||||
|
Financial assets (liabilities):
|
||||||||||||||||
|
Cash equivalents and current investments
|
$
|
50,307
|
$
|
─
|
$
|
─
|
$
|
50,307
|
||||||||
|
Other long term assets
|
2,782
|
─
|
─
|
2,782
|
||||||||||||
|
Forward contracts
|
─
|
1,371
|
─
|
1,371
|
||||||||||||
|
Life insurance contracts
|
─
|
─
|
32,286
|
32,286
|
||||||||||||
|
Total
|
$
|
53,089
|
$
|
1,371
|
$
|
32,286
|
$
|
86,746
|
||||||||
The following methods and assumptions were used to determine the fair value of each class of assets and liabilities recorded at fair value in the consolidated balance sheets:
Cash equivalents and current investments:
Cash equivalents and current investments primarily consist of highly rated money market funds with maturities of three months or less, and are purchased daily at par value with specified yield rates. Due to the high ratings and short-term nature of the funds, the Company considers all cash equivalents and current investments as Level 1. Current investments include $14.4 million and $10.9 million as of December 31, 2015 and 2016, respectively, that is restricted for the Company's voluntary participation in a consumer protection cooperative in South Korea.
Forward contracts:
To hedge foreign currency risks, the Company uses foreign currency exchange forward contracts, where possible and practical. These forward contracts are valued using standard valuation formulas with assumptions about foreign currency exchange rates derived from existing exchange rates as discussed in Note 17, "Derivative Financial Instruments".
Life insurance contracts:
ASC 820 preserves practicability exceptions to fair value measurements provided by other applicable GAAP. The guidance in ASC 715-30-35-60 allows a reporting entity, as a practical expedient, to use cash surrender value or conversion value as an expedient for fair value when it is present. Accordingly, the Company determines the fair value of its life insurance contracts as the cash-surrender value of life insurance policies held in its Rabbi Trust as disclosed in Note 16, "Executive Deferred Compensation Plan".
The following table provides a summary of changes in fair value of the Company's Level 3 marketable securities (U.S. dollars in thousands):
|
Life Insurance Contracts
|
2015
|
2016
|
||||||
|
Beginning balance at January 1
|
$
|
26,280
|
$
|
27,292
|
||||
|
Actual return on plan assets:
|
||||||||
|
Relating to assets still held at the reporting date
|
(1,597
|
)
|
2,196
|
|||||
|
Purchases and issuances
|
3,025
|
3,051
|
||||||
|
Sales and settlements
|
(416
|
)
|
(252
|
)
|
||||
|
Transfers into Level 3
|
─
|
─
|
||||||
|
Ending balance at December 31
|
$
|
27,292
|
$
|
32,287
|
||||
-97-
NU SKIN ENTERPRISES, INC.
Notes to Consolidated Financial Statements
14.
Income Taxes
Consolidated income before provision for income taxes consists of the following for the years ended December 31, 2014, 2015 and 2016 (U.S. dollars in thousands):
|
2014
|
2015
|
2016
|
||||||||||
|
U.S.
|
$
|
184,476
|
$
|
134,473
|
$
|
(19,119
|
)
|
|||||
|
Foreign
|
114,031
|
77,486
|
231,958
|
|||||||||
|
Total
|
$
|
298,507
|
$
|
211,959
|
$
|
212,839
|
||||||
The provision for current and deferred taxes for the years ended December 31, 2014, 2015 and 2016 consists of the following (U.S. dollars in thousands):
|
2014
|
2015
|
2016
|
||||||||||
|
Current
|
||||||||||||
|
Federal
|
$
|
37,402
|
$
|
6,328
|
$
|
─
|
||||||
|
State
|
2,095
|
1,483
|
(718
|
)
|
||||||||
|
Foreign
|
48,904
|
50,403
|
70,652
|
|||||||||
|
88,401
|
58,214
|
69,934
|
||||||||||
|
Deferred
|
||||||||||||
|
Federal
|
(380
|
)
|
16,556
|
(27,171
|
)
|
|||||||
|
State
|
444
|
(674
|
)
|
1,104
|
||||||||
|
Foreign
|
20,866
|
4,817
|
25,886
|
|||||||||
|
20,930
|
20,699
|
(181
|
)
|
|||||||||
|
Provision for income taxes
|
$
|
109,331
|
$
|
78,913
|
$
|
69,753
|
||||||
The Company's foreign taxes paid are high relative to foreign operating income and the Company's U.S. taxes paid are low relative to U.S. operating income due largely to the flow of funds among the Company's Subsidiaries around the world. As payments for services, management fees, license arrangements and royalties are made from the Company's foreign affiliates to other company affiliates or its corporate headquarters, these payments often incur withholding and other forms of tax that are generally creditable for U.S. tax purposes. Therefore, these payments lead to increased foreign effective tax rates and lower U.S. effective tax rates. Variations occur in the Company's foreign and U.S. effective tax rates from year to year depending on several factors. These factors include the impact of global transfer prices, the timing and level of remittances from foreign affiliates, profits and losses in various markets, the valuation of deferred tax assets or liabilities, or changes in tax laws, regulations, accounting principles, or interpretations thereof.
-98-
NU SKIN ENTERPRISES, INC.
Notes to Consolidated Financial Statements
The principal components of deferred taxes are as follows (U.S. dollars in thousands):
|
Year Ended December 31,
|
||||||||
|
2015
|
2016
|
|||||||
|
Deferred tax assets:
|
||||||||
|
Inventory differences
|
$
|
5,222
|
$
|
2,521
|
||||
|
Foreign tax credit and other foreign benefits
|
86,729
|
145,169
|
||||||
|
Stock-based compensation
|
13,842
|
11,470
|
||||||
|
Accrued expenses not deductible until paid
|
46,597
|
32,796
|
||||||
|
Foreign currency exchange
|
8,976
|
4,826
|
||||||
|
Net operating losses
|
10,994
|
9,584
|
||||||
|
Capitalized research and development
|
1,632
|
358
|
||||||
|
Exchange gains and losses
|
55,643
|
─
|
||||||
|
Other
|
964
|
1,063
|
||||||
|
Gross deferred tax assets
|
230,599
|
207,787
|
||||||
|
Deferred tax liabilities:
|
||||||||
|
Foreign currency exchange
|
─
|
105
|
||||||
|
Intangibles step-up
|
|
13,607
|
12,107
|
|||||
|
Overhead allocation to inventory
|
5,101
|
4,820
|
||||||
|
Amortization of intangibles
|
18,733
|
19,091
|
||||||
|
Foreign outside basis in controlled foreign corporation
|
84,434
|
106,846
|
||||||
|
Other
|
35,257
|
20,572
|
||||||
|
Gross deferred tax liabilities
|
157,132
|
163,541
|
||||||
|
Valuation allowance
|
(49,271
|
)
|
(9,137
|
)
|
||||
|
Deferred taxes, net
|
$
|
24,196
|
$
|
35,109
|
||||
At December 31, 2016, the Company had foreign operating loss carryforwards of $31.3 million for tax purposes, which will be available to offset future taxable income. If not used, $9.8 million of carryforwards will expire between 2017 and 2026, while $21.5 million do not expire. A valuation allowance has been placed on foreign operating loss carryforwards of $29.8 million. In addition, the company had foreign tax credit carryforwards of $55.7 million which will expire between 2025 and 2026. The Company uses the tax law ordering approach when determining when excess tax benefits have been realized.
The valuation allowance primarily represents amounts for foreign operating loss carryforwards and unrealized foreign exchange losses for which it is more likely than not some portion or all of the deferred tax asset will not be realized. In making such determination, the Company considers all available positive and negative evidence, including future reversals of existing taxable temporary difference, projected future taxable income, tax planning strategies and recent financial operations. When the Company determines that there is sufficient taxable income to utilize the net operating losses, the valuation will be released which would reduce the provision for income taxes.
-99-
NU SKIN ENTERPRISES, INC.
Notes to Consolidated Financial Statements
The deferred tax asset valuation adjustments for the years ended December 31, 2014, 2015 and 2016 are as follows (U.S. dollars in thousands):
|
Year Ended December 31,
|
||||||||||||
|
2014
|
2015
|
2016
|
||||||||||
|
Balance at the beginning of period
|
$
|
10,803
|
$
|
35,999
|
$
|
49,271
|
||||||
|
Additions charged to cost and expenses
|
28,687
|
12,948
|
692
|
|||||||||
|
Decreases
|
(3,546
|
)
(1)
|
(2,943
|
)
(1)
|
(40,442
|
)
(4)
|
||||||
|
Adjustments
|
55
|
(2)
|
3,267
|
(2)
|
(384
|
)
(2)
|
||||||
|
Balance at the end of the period
|
$
|
35,999
|
(3)
|
$
|
49,271
|
(3)
|
$
|
9,137
|
||||
| (1) |
Decreases in valuation allowance due to lapse in statute of limitation of the net operating losses carryforward which had no impact to the income statement.
|
| (2) |
Represents the net currency effects of translating valuation allowances at current rates of exchange.
|
| (3) |
The increase was due primarily to the deferred tax assets created by the unrealized loss in Venezuela for which the Company set up a full valuation allowance.
|
| (4) |
Decrease in valuation allowance due to lapse in statute of limitation of the net operating losses carryforward and due to the write off of Venezuelan deferred tax assets, which had no impact to the income statement.
|
The components of deferred taxes, net on a jurisdiction basis are as follows (U.S. dollars in thousands):
|
Year Ended December 31,
|
||||||||
|
2015
|
2016
|
|||||||
|
Net current deferred tax assets
|
$
|
─
|
$
|
─
|
||||
|
Net noncurrent deferred tax assets
|
40,373
|
35,752
|
||||||
|
Total net deferred tax assets
|
40,373
|
35,752
|
||||||
|
Net current deferred tax liabilities
|
─
|
─
|
||||||
|
Net noncurrent deferred tax liabilities
|
16,177
|
643
|
||||||
|
Total net deferred tax liabilities
|
16,177
|
643
|
||||||
|
Deferred taxes, net
|
$
|
24,196
|
$
|
35,109
|
||||
The Company is subject to regular audits by federal, state and foreign tax authorities. These audits may result in proposed assessments that may result in additional tax liabilities.
-100-
NU SKIN ENTERPRISES, INC.
Notes to Consolidated Financial Statements
The actual tax rate for the years ended December 31, 2014, 2015 and 2016 compared to the statutory U.S. Federal tax rate is as follows:
|
Year Ended December 31,
|
||||||||||||
|
2014
|
2015
|
2016
|
||||||||||
|
Income taxes at statutory rate
|
35.00
|
%
|
35.00
|
%
|
35.00
|
%
|
||||||
|
Foreign tax rate differential
|
─
|
.92
|
(1.98
|
)
|
||||||||
|
Non-deductible expenses
|
0.12
|
0.09
|
0.11
|
|||||||||
|
Controlled foreign corporation losses
|
1.48
|
1.09
|
(2.63
|
)
|
||||||||
|
Section 987 implementation
|
─
|
─
|
2.69
|
|||||||||
|
Other
|
0.03
|
0.13
|
(0.42
|
)
|
||||||||
|
36.63
|
%
|
37.23
|
%
|
32.77
|
%
|
|||||||
The effective tax rate for 2015 was impacted largely due to the lower than anticipated profits in China caused by a charge to inventory. Consequently, a deferred tax asset associated with China could not be recognized, thereby impacting the annual effective tax rate. The year-over-year decrease in the effective tax rate for 2016 was due to a benefit for the deferred tax asset previously not recognized by China in 2015 being recognized in 2016, and other tax benefits being recognized due to ceasing business operations in Venezuela. These benefits were partially offset by a change in tax law that was enacted in December 2016 related to the taxation of foreign currency translation gains or losses arising from qualified business units.
The cumulative amount of undistributed earnings of the Company's non-U.S. Subsidiaries held for indefinite reinvestment is approximately $50.0 million, $70.0 million and $70.0 million at December 31, 2014, 2015 and 2016, respectively. If this amount were repatriated to the United States, the amount of incremental taxes would be approximately $7.6 million.
15.
Employee Benefit Plan
The Company has a 401(k) defined contribution plan which permits participating employees to defer up to a maximum of 100% of their compensation, subject to limitations established by the Internal Revenue Service. Employees age 18 and older are eligible to contribute to the plan starting the first day of employment. After completing at least one day of service, employees are eligible to receive matching contributions from the Company. In 2014, 2015, and 2016 the Company matched employees' base pay up to 4% each year. The Company's matching contributions cliff vest after two years of service. The Company recorded compensation expense of $2.7 million, $2.8 million and $2.8 million for the years ended December 31, 2014, 2015 and 2016, respectively, related to its contributions to the plan. The Company may make additional discretionary contributions to the plan of up to 10% of employees' base pay. The Company's discretionary contributions vest 20% per year for an employee's first five years of service. For the years ended December 31, 2014, 2015 and 2016 the Company did not make any additional discretionary contributions.
The Company has a defined benefit pension plan for its employees in Japan. All employees of Nu Skin Japan, after certain years of service, are entitled to pension plan benefits when they terminate employment with Nu Skin Japan. The accrued pension liability was $5.8 million, $4.8 million and $5.6 million as of December 31, 2014, 2015 and 2016, respectively. Although Nu Skin Japan has not specifically funded this obligation, as it is not required to do so, Nu Skin Japan believes it maintains adequate cash balances for this defined benefit pension plan. The Company recorded pension expense of $0.9 million, $0.7 million and $0.9 million for the years ended December 31, 2014, 2015 and 2016, respectively.
-101-
NU SKIN ENTERPRISES, INC.
Notes to Consolidated Financial Statements
16.
Executive Deferred Compensation Plan
The Company has an executive deferred compensation plan for select management personnel. Under this plan, the Company may make a contribution of up to 10% of a participant's salary. In addition, each participant has the option to defer a portion of their compensation up to a maximum of 80% of their base salary and 100% of their bonuses. Participant contributions are immediately vested. Company contributions vest 50% after ten years of service and 5% each year of service thereafter. In addition, any unvested company contributions will fully vest on the earlier of: (a) the participant attaining 60 years of age; and (b) death or disability.
The Company recorded compensation expense of $0.3 million, $2.3 million and $1.5 million for the years ended December 31, 2014, 2015 and 2016, respectively, related to its contributions to the plan. The total long-term deferred compensation liability under the deferred compensation plan was $33.5 million and $36.7 million for the years ended December 31, 2015 and 2016, respectively, related to its contributions to the plan and is included in other long-term liabilities.
All benefits under the deferred compensation plan are unsecured obligations of the Company. The Company has contributed assets to a "rabbi trust" for the payment of benefits under the deferred compensation plan. As the assets of the trust are available to satisfy the claims of general creditors if the Company becomes insolvent, the amounts held in the trust are accounted for as an investment on the Company's consolidated balance sheet of $27.3 million and $32.3 million for the years ended December 31, 2015 and 2016, respectively.
17.
Derivative Financial Instruments
The Company enters into non-designated foreign currency derivatives, primarily comprised of foreign currency forward contracts, for which hedge accounting does not apply. The changes in the fair market value of these non-designated derivatives are included in other income/expense in the Company's consolidated statements of income. The Company uses non-designated foreign currency derivatives to hedge foreign-currency-denominated intercompany transactions and to partially mitigate the impact of foreign-currency fluctuations. The fair value of the non-designated foreign currency derivatives is based on third-party quotes that management considered when determining the fair value.
As of December 31, 2016, the Company held non-designated derivative contracts with notional amounts of 11.5 billion South Korean won ($9.5 million) and 500.0 million Japanese yen, 5.8 billion South Korean won and 9.0 million Canadian dollars ($4.2 million, $4.9 million and $6.5 million, respectively) as of December 31, 2015. The fair values of these non-designated derivative contracts were zero and $0.5 million as of December 31, 2015 and 2016, respectively. The contracts held at December 31, 2016 have maturities through March 2017, and accordingly, all gains and losses on non-designated derivative contracts will be recognized in current earnings over the next 3 months.
-102-
NU SKIN ENTERPRISES, INC.
Notes to Consolidated Financial Statements
The following table summarizes gains (losses) related to derivative instruments not designated as hedging instruments during the years ended December 31, 2015 and 2016 (U.S. dollars in thousands):
|
Amount of Gain (Loss)
Recognized in Income
|
|||||||||||||
|
Year Ended December 31,
|
|||||||||||||
|
Derivatives not designated as
hedging instruments:
|
Location of
Gain (Loss) Recognized in Income
|
2014
|
2015
|
2016
|
|||||||||
|
Foreign currency contracts
|
Other income (expense)
|
$
|
—
|
$
|
38
|
$
|
39
|
||||||
The Company designates as cash-flow hedges those foreign currency forward contracts it enters to hedge forecasted intercompany transactions that are subject to foreign currency exposures. Changes in the fair value of these forward contracts designated as cash-flow hedges are recorded as a component of accumulated other comprehensive income (loss) within shareholders' equity (deficit), and are recognized in the consolidated statement of income during the period which approximates the time the hedged transaction is settled.
As of December 31, 2016, the Company held forward contracts designated as foreign currency cash flow hedges with notional amounts totaling 1.4 billion Japanese yen ($12.0 million), and 1.9 billion Japanese yen and 15.0 million euros ($15.8 million and $16.3 million, respectively) as of December 31, 2015 to hedge forecasted foreign-currency-denominated intercompany transactions. The fair value of these hedges were $0.5 million and $0.9 million as of December 31, 2015 and 2016, respectively. The contracts held at December 31, 2016 have maturities through June 2017, and accordingly, all unrealized gains and losses on foreign currency cash flow hedges included in accumulated other comprehensive loss will be recognized in current earnings over the next 6 months.
The following table summarizes gains (losses) related to derivative instruments recorded in other comprehensive income (loss) during the years ended December 31, 2015 and 2016 (U.S. dollars in thousands):
|
Amount of Gain (Loss)
Recognized in Other
Comprehensive Loss
|
||||||||||||
|
Year Ended December 31,
|
||||||||||||
|
Derivatives designated as hedging instruments:
|
2014
|
2015
|
2016
|
|||||||||
|
Foreign currency forward contracts related to intercompany
license fee, product sales, and selling expense hedges |
$
|
1,578
|
$
|
590
|
$
|
(1,423
|
)
|
|||||
-103-
NU SKIN ENTERPRISES, INC.
Notes to Consolidated Financial Statements
The following table summarizes gains (losses) relating to derivative instruments reclassified from accumulated other comprehensive loss into income during the years ended December 31, 2015 and 2016 (U.S. dollars in thousands):
|
Amount of Gain (Loss) Reclassified
from Accumulated Other
Comprehensive Loss into Income
|
|||||||||||||
|
Year Ended December 31,
|
|||||||||||||
|
Derivatives designated as hedging instruments:
|
Location of Gain (Loss)
Reclassified from Accumulated
Other Comprehensive Loss into Income
|
2014
|
2015
|
2016
|
|||||||||
|
Foreign currency forward contracts related to
intercompany license fees and product
sales hedges
|
Revenue
|
$
|
2,725
|
$
|
1,731
|
$
|
(1,088
|
)
|
|||||
|
Foreign currency forward contracts related
to intercompany selling expense hedges
|
Selling expenses
|
$
|
—
|
$
|
397
|
$
|
(1,544
|
)
|
|||||
As of December 31, 2015 and 2016, there were $0.3 million and $0.6 million, respectively, of unrealized gains/(losses) included in accumulated other comprehensive loss related to foreign currency cash flow hedges. The remaining $71.6 million and $84.7 million as of December 31, 2015 and 2016, respectively, in accumulated other comprehensive loss are related to cumulative translation adjustments. The Company assesses hedge effectiveness at least quarterly. During the years ended December 31, 2015 and 2016, all hedges were determined to be effective.
The Company reports its derivatives at fair value as either other current assets or accrued expenses within its consolidated balance sheet. See Note 13, "Fair Value".
18.
Supplemental Cash Flow Information
Cash paid for interest totaled $5.3 million, $7.0 million and $11.6 million for the years ended December 31, 2014, 2015 and 2016, respectively. Cash paid for income taxes totaled $171.4 million, $49.8 million and $40.9 million for the years ended December 31, 2014, 2015 and 2016, respectively.
For the year ended December 31, 2014, the Company had non-cash charges associated with the accounting of its Nu Skin Korea building lease increasing both fixed assets by $19.4 million and long-term liabilities by $16.7 million, and decreasing long-term assets by $2.7 million.
19.
Segment Information
The Company operates in a single operating segment by selling products through a global network of independent distributors that operates in a seamless manner from market to market, except for its operations in Mainland China. In Mainland China, the Company utilizes sales employees, independent direct sellers and independent marketers to distribute its products. Independent direct sellers can sell away from the Company's stores where the Company has obtained a direct selling license to do so. Independent marketers are licensed business owners who are authorized to sell the Company's products either at their own approved premises or through the Company's stores. Selling expenses are the Company's largest expense comprised of sales compensation and incentives paid to its sales force. The Company manages its business primarily by managing its sales force. The Company does not use profitability reports on a regional or divisional basis for making business decisions. However, the Company does report revenue in five geographic regions: Greater China, North Asia, South Asia/Pacific, Americas and EMEA.
-104-
NU SKIN ENTERPRISES, INC.
Notes to Consolidated Financial Statements
Revenue generated in each of these regions is set forth below (U.S. dollars in thousands):
|
Year Ended December 31,
|
||||||||||||
|
2014
|
2015
|
2016
|
||||||||||
|
Greater China
|
$
|
948,523
|
$
|
771,667
|
$
|
794,393
|
||||||
|
North Asia
|
782,985
|
686,555
|
692,738
|
|||||||||
|
South Asia/Pacific
|
328,388
|
321,971
|
296,758
|
|||||||||
|
Americas
|
329,027
|
329,668
|
276,590
|
|||||||||
|
EMEA
|
180,572
|
137,186
|
147,318
|
|||||||||
|
Total
|
$
|
2,569,495
|
$
|
2,247,047
|
$
|
2,207,797
|
||||||
Revenue generated by each of the Company's product lines is set forth below (U.S. dollars in thousands):
|
Year Ended December 31,
|
||||||||||||
|
2014
|
2015
|
2016
|
||||||||||
|
Nu Skin
|
$
|
1,562,595
|
$
|
1,363,539
|
$
|
1,308,135
|
||||||
|
Pharmanex
|
1,000,279
|
877,924
|
892,738
|
|||||||||
|
Other
|
6,621
|
5,584
|
6,924
|
|||||||||
|
Total
|
$
|
2,569,495
|
$
|
2,247,047
|
$
|
2,207,797
|
||||||
Additional information as to the Company's operations in the most significant geographical areas is set forth below (U.S. dollars in thousands):
|
Year Ended December 31,
|
||||||||||||
|
Revenue:
|
2014
|
2015
|
2016
|
|||||||||
|
Mainland China
|
$
|
675,082
|
$
|
565,527
|
$
|
610,414
|
||||||
|
South Korea
|
467,720
|
422,341
|
413,696
|
|||||||||
|
Japan
|
315,265
|
264,214
|
279,042
|
|||||||||
|
United States
|
230,767
|
243,748
|
201,239
|
|||||||||
|
December 31,
|
||||||||
|
Long-lived assets:
|
2015
|
2016
|
||||||
|
Mainland China
|
$
|
110,839
|
$
|
97,867
|
||||
|
South Korea
|
48,702
|
41,545
|
||||||
|
Japan
|
13,587
|
11,517
|
||||||
|
United States
|
271,057
|
283,868
|
||||||
20.
Commitments and Contingencies
The Company is subject to government regulations pertaining to product formulation, labeling and packaging, product claims and advertising, and the Company's direct selling system. The Company is also subject to the jurisdiction of numerous foreign tax and customs authorities. Any assertions or determination that either the Company or the Company's sales force is not in compliance with existing statutes, laws, rules or regulations could have a material adverse effect on the Company's operations. In addition, in any country or jurisdiction, the adoption of new statutes, laws, rules or regulations or changes in the interpretation of existing statutes, laws, rules or regulations could have a material adverse effect on the Company and its operations. Although management believes that the Company is in compliance in all material respects with the statutes, laws, rules and regulations of every jurisdiction in which it operates, no assurance can be given that the Company's compliance with applicable statutes, laws, rules and regulations will not be challenged by foreign authorities or that such challenges will not have a material adverse effect on the Company's financial position or results of operations or cash flows. The Company and its Subsidiaries are defendants in litigation, investigations and other proceedings involving various matters. In the opinion of the Company's management, based upon advice of its counsel handling such litigation, investigations and other proceedings, adverse outcomes, if any, will not likely result in a material effect on the Company's consolidated financial condition, results of operations or cash flows.
-105-
NU SKIN ENTERPRISES, INC.
Notes to Consolidated Financial Statements
21.
Dividends per Share
Quarterly cash dividends for the years ended December 31, 2015 and 2016 totaled $81.2 million and $78.4 million or $0.35 per share in all quarters of 2015 and $0.355 for all quarters of 2016. The board of directors has declared a quarterly cash dividend of $0.36 per share for all classes of common stock to be paid on March 15, 2017 to stockholders of record on February 27, 2017.
22.
Other Income (Expense), Net
Other income (expense), net
was $53.7 million, $32.7 million and $18.3 million of expense in 2014, 2015 and 2016, respectively. In 2014, a $46.3 million foreign currency charge was recognized by the Company related to the impact of the devaluation of the Venezuelan currency on monetary assets and liabilities of its Venezuela entity and a charge of $7.4 million was recorded related to the prepayment of debt during the fourth quarter of 2014. In 2015, the Company recorded a charge of $10.2 million related to a new foreign exchange mechanism for Venezuela currency and incurred foreign currency translation expenses of $17.0 million. Other income (expense), net also includes $5.7 million, $7.9 million and $15.6 million in interest expense during 2014, 2015 and 2016, respectively. The Company cannot estimate the degree to which its operations will be impacted in the future, but it remains subject to these currency risks. However, the majority of these transaction losses are non-cash, non-operating losses.
23.
Cost of Sales
In February 2016, the Tokyo District Court issued its ruling on a dispute between the Company and the customs authorities in Japan. The District Court upheld previous customs assessments related to the importation of several of the Company's products into Japan.
As a result of the District Court's decision, the Company recorded a charge of $31.4 million to cost of sales in the first quarter of 2016. This is a non-cash item because the Company was previously required to pay the assessments. This charge represents the full amount that was disputed, including assessments for the period of October 2006 through September 2009 in connection with post-importation audits, as well as the disputed portion of the Company's import duties from October 2009 to the date of the District Court's decision. The Company has appealed this decision to the Tokyo High Court.
-106-
NU SKIN ENTERPRISES, INC.
Notes to Consolidated Financial Statements
In the first quarter of 2016, the Company purchased 70% of Vertical Eden, LLC, an early-stage company in the warehouse growing market, based in Alpine, Utah, for $3.3 million in cash and contingent consideration valued at $1.5 million. The purchase of Vertical Eden includes specialized technology in remote programming and management of the entire crop growing cycle. As a result of this acquisition, the Company recorded approximately $4.4 million of intangible assets which are being amortized over the useful lives of 3 to 7 years. The Company has also recorded $2.5 million of goodwill. Due to the insignificance of the transaction to the Company's consolidated financial statements, the Company has not separately presented the $2.1 million non-controlling interest related to this acquisition, but has included it in other liabilities and has included the net income (loss) attributable to the non-controlling interest in other income (expense).
-107-
Report of Independent Registered Public Accounting Firm
To the Board of Directors and Stockholders of Nu Skin Enterprises, Inc.:
In our opinion, the accompanying
consolidated balance sheets and the related consolidated statements of income, comprehensive income, stockholders' equity, and cash flows present fairly, in all material respects, the financial position of Nu Skin Enterprises, Inc. and its subsidiaries
at December 31, 2016
and 2015, and the results of their operations and their cash flows for each of the three years in the period ended December 31, 2016
in conformity with accounting principles generally accepted in the United States of America.
Also in our opinion, the Company maintained, in all material respects, effective internal control over financial reporting as of December 31, 2016, based on criteria established in
Internal Control - Integrated Framework
(2013) issued by the Committee of Sponsoring Organizations of the Treadway Commission (COSO).
The Company's management is responsible for these financial statements, for maintaining effective internal control over financial reporting and for its assessment of the effectiveness of internal control over financial reporting
, included in Management's Report on Internal Control over Financial Reporting appearing in Item 9A.
Our responsibility is to express opinions on these financial statements and on the Company's internal control over financial reporting based on our
integrated audits.
We conducted our
audits i
n accordance with the standards of the Public Company Accounting Oversight Board (United States). Those standards require that we plan and perform the audits to obtain reasonable assurance about whether the financial statements are free of material misstatement and whether effective internal control over financial reporting was maintained in all material respects. Our audits of the financial statements included examining, on a test basis, evidence supporting the amounts and disclosures in the financial statements, assessing the accounting principles used and significant estimates made by management, and evaluating the overall financial statement presentation. Our audit of internal control over financial reporting included obtaining an understanding of internal control over financial reporting, assessing the risk that a material weakness exists, and testing and evaluating the design and operating effectiveness of internal control based on the assessed risk. Our audits also included performing such other procedures as we considered necessary in the circumstances. We believe that our audits provide a reasonable basis for our opinions.
A company's internal control over financial reporting is a process designed to provide reasonable assurance regarding the reliability of financial reporting and the preparation of financial statements for external purposes in accordance with generally accepted accounting principles. A company's internal control over financial reporting includes those policies and procedures that (i) pertain to the maintenance of records that, in reasonable detail, accurately and fairly reflect the transactions and dispositions of the assets of the company; (ii) provide reasonable assurance that transactions are recorded as necessary to permit preparation of financial statements in accordance with generally accepted accounting principles, and that receipts and expenditures of the company are being made only in accordance with authorizations of management and directors of the company; and (iii) provide reasonable assurance regarding prevention or timely detection of unauthorized acquisition, use, or disposition of the company's assets that could have a material effect on the financial statements.
Because of its inherent limitations, internal control over financial reporting may not prevent or detect misstatements. Also, projections of any evaluation of effectiveness to future periods are subject to the risk that controls may become inadequate because of changes in conditions, or that the degree of compliance with the policies or procedures may deteriorate.
/s/ PricewaterhouseCoopers LLP
Salt Lake City, Utah
February 27, 2017
-108-
None.
Evaluation of Disclosure Controls and Procedures
.
Under the supervision and with the participation of our management, including our Chief Executive Officer and Chief Financial Officer, we evaluated the effectiveness of the design and operation of our disclosure controls and procedures (as such term is defined in Rule 13a-15(e) under the Securities Exchange Act of 1934, as amended (the "Exchange Act")). Disclosure controls and procedures are the controls and other procedures that we designed to ensure that we record, process, summarize and report in a timely manner the information we must disclose in reports that we file with or submit to the Securities and Exchange Commission under the Exchange Act, and they include, without limitation, controls and procedures designed to ensure that such information is accumulated and communicated to our management, including our Chief Executive Officer and Chief Financial Officer, as appropriate to allow timely decisions regarding required disclosure. Based on this evaluation, our Chief Executive Officer and our Chief Financial Officer concluded that our disclosure controls and procedures were effective as of December 31, 2016.
Management's Report on Internal Control over Financial Reporting.
Our management is responsible for establishing and maintaining adequate internal control over financial reporting. Internal control over financial reporting is defined in Rule 13a-15(f) under the Exchange Act as a process designed by, or under the supervision of, our Chief Executive Officer and Chief Financial Officer and effected by our board of directors, management and other personnel, to provide reasonable assurance regarding the reliability of financial reporting and the preparation of financial statements for external purposes in accordance with generally accepted accounting principles and includes those policies and procedures that:
| • |
pertain to the maintenance of records that, in reasonable detail, accurately and fairly reflect the transactions and dispositions of our assets;
|
| • |
provide reasonable assurance that transactions are recorded as necessary to permit preparation of financial statements in accordance with generally accepted accounting principles, and that our receipts and expenditures are being made only in accordance with authorization of management and directors; and
|
| • |
provide reasonable assurance regarding prevention or timely detection of unauthorized acquisition, use or disposition of our assets that could have a material effect on the financial statements.
|
Because of its inherent limitations, internal control over financial reporting may not prevent or detect misstatements. Also, projections of any evaluation of effectiveness to future periods are subject to the risk that controls may become inadequate because of changes in conditions, or that the degree of compliance with the policies or procedures may deteriorate.
Under the supervision and with the participation of our management, including our Chief Executive Officer and Chief Financial Officer, we assessed, as of December 31, 2016, the effectiveness of our internal control over financial reporting. This assessment was based on criteria established in the framework
Internal Control-Integrated Framework
(2013) issued by the Committee of Sponsoring Organizations of the Treadway Commission. Based on our assessment, our management concluded that our internal control over financial reporting was effective as of December 31, 2016.
-109-
The effectiveness of our internal control over financial reporting as of December 31, 2016, has been audited by PricewaterhouseCoopers LLP, an independent registered public accounting firm, as stated in their report which appears herein.
Changes in Internal Control over Financial Reporting
.
There was no change during the fiscal quarter ended December 31, 2016 in our internal control over financial reporting (as such term is defined in Rule 13a-15(f) under the Exchange Act) that materially affected, or is reasonably likely to materially affect, our internal control over financial reporting.
None.
The information required by Items 10, 11, 12, 13 and 14 of Part III will be included in an amendment to this Annual Report on Form 10-K or incorporated by reference to our Definitive Proxy Statement for our 2017 Annual Meeting of Stockholders to be filed with the Securities and Exchange Commission within 120 days after our fiscal year end, except for certain information required by Item 10 with respect to our executive officers which is set forth under Item 1. "Business" of this Annual Report on Form 10-K.
PART IV
Documents filed as part of this Form 10-K:
| 1. |
Financial Statements
. See Index to Consolidated Financial Statements under Item 8 of Part II.
|
| 2. |
Financial Statement Schedules
. N/A
|
| 3. |
Exhibits
. References to the "Company" shall mean Nu Skin Enterprises, Inc. Unless otherwise noted, the SEC file number for exhibits incorporated by reference is 001‑12421.
|
-110-
|
3.1
|
Amended and Restated Certificate of Incorporation of the Company (incorporated by reference to Exhibit 3.1 to the Company's Registration Statement on Form S-1 filed September 16, 1996, file no. 333-12073).
|
|
3.2
|
Certificate of Amendment to the Amended and Restated Certificate of Incorporation (incorporated by reference to Exhibit 3.2 to the Company's Annual Report on Form 10-K for the year ended December 31, 2009, filed March 1, 2010).
|
|
3.3
|
Certificate of Designation, Preferences and Relative Participating, Optional and Other Special Rights of Preferred Stock and Qualifications, Limitations and Restrictions Thereof (incorporated by reference to Exhibit 3.3 to the Company's Annual Report on Form 10-K for the year ended December 31, 2004, filed March 15, 2005).
|
|
3.4
|
Third Amended and Restated Bylaws of Nu Skin Enterprises, Inc. (incorporated by reference to Exhibit 3.1 to the Company's Current Report on Form 8-K filed February 12, 2015).
|
|
4.1
|
Specimen Form of Stock Certificate for Class A Common Stock (incorporated by reference to Exhibit 4.1 to the Company's Amendment No. 1 to Registration Statement on Form S-3 filed July 8, 2002, file no. 333-90716).
|
|
4.2
|
Specimen Form of Stock Certificate for Class B Common Stock (incorporated by reference to Exhibit 4.2 to the Company's Registration Statement on Form S-1 filed September 16, 1996, file no. 333-12073).
|
|
4.3
|
Indenture, dated as of June 16, 2016, by and between Nu Skin Enterprises, Inc. and The Bank of New York Mellon Trust Company, N.A., as trustee (including the form of 4.75% Convertible Senior Notes Due 2020) (incorporated by reference to Exhibit 4.1 to the Company's Current Report on Form 8-K filed June 21, 2016).
|
|
10.1
|
Credit Agreement among the Company, various financial institutions, and Bank of America, N.A. as administrative agent, dated as of October 9, 2014 (incorporated by reference to Exhibit 10.1 to the Company's Current Report on Form 8-K October 15, 2014).
|
|
10.2
|
Amendment No. 1 to the Credit Agreement, dated as of October 9, 2014, among the Company, various financial institutions, and Bank of America, N.A. as administrative agent, dated as of May 14, 2015 (incorporated by reference to Exhibit 10.1 to the Company's Current Report on Form 8-K filed May 19, 2015)
.
|
|
10.3
|
Investment Agreement, by and among the Company and Ping An ZQ China Growth Opportunity Limited, dated as of June 14, 2016 (incorporated by reference to Exhibit 10.2 to the Company's Quarterly Report on Form 10-Q for the quarterly period ended June 30, 2016, filed August 5, 2016).
|
|
*#10.4
|
Amended and Restated Nu Skin Enterprises, Inc. Deferred Compensation Plan, effective as of January 1, 2015.
|
|
#10.5
|
Nu Skin Enterprises, Inc. 2006 Stock Incentive Plan (incorporated by reference to Exhibit 10.1 to the Company's Current Report on Form 8-K filed on June 1, 2006).
|
-111-
|
#10.6
|
Amendment to the 2006 Stock Incentive Plan (incorporated by reference to Exhibit 10.3 to the Company's Quarterly Report on Form 10-Q for the quarter ended June 30, 2013, filed August 5, 2013).
|
|
#10.7
|
Form of Master Stock Option Agreement (2006 Plan) (incorporated by reference to Exhibit 10.10 to the Company's Quarterly Report on Form 10-Q for the quarterly period ended September 30, 2006, filed November 9, 2006).
|
|
#10.8
|
Form of Master Stock Option Agreement (2006 Plan Performance Option (U.S.)) (incorporated by reference to Exhibit 10.54 to the Company's Annual Report on Form 10-K for the year ended December 31, 2007, filed February 29, 2008).
|
|
#10.9
|
Form of Master Stock Option Agreement for Directors (2006 Plan) (incorporated by reference to Exhibit 10.59 to the Company's Annual Report on Form 10-K for the year ended December 31, 2008, filed February 27, 2009).
|
|
#10.10
|
Form of Director Restricted Stock Unit Agreement (2006 Plan) (incorporated by reference to Exhibit 10.4 to the Company's Quarterly Report on Form 10-Q for the quarter ended June 30, 2007, filed August 9, 2007).
|
|
#10.11
|
Form of Master Restricted Stock Unit Agreement (2006 Plan) (incorporated by reference to Exhibit 10.11 to the Company's Quarterly Report on Form 10-Q for the quarterly period ended September 30, 2006, filed November 9, 2006).
|
|
#10.12
|
Nu Skin Enterprises, Inc. 2010 Omnibus Incentive Plan ("2010 Plan") (incorporated by reference to Exhibit 10.1 to the Company's Current Report on Form 8-K filed on June 2, 2010).
|
|
#10.13
|
Form of 2010 Plan U.S. Stock Option Master Agreement and Grant Notice (incorporated by reference to Exhibit 10.1 to the Company's Current Report on Form 8-K filed on July 2, 2010).
|
|
#10.14
|
Form of 2010 Plan U.S. Restricted Stock Unit Master Agreement and Grant Notice (incorporated by reference to Exhibit 10.3 to the Company's Current Report on Form 8-K filed on July 2, 2010).
|
|
#10.15
|
Form of 2010 Plan U.S. Performance Stock Option Master Agreement and Grant Notice (incorporated by reference to Exhibit 10.54 to the Company's Annual Report on Form 10-K for the year ended December 31, 2010, filed February 23, 2011).
|
|
#10.16
|
Form of 2010 Plan U.S. Performance Restricted Stock Unit Master Agreement and Grant Notice (incorporated by reference to Exhibit 10.2 to the Company's Current Report on Form 8-K filed on July 2, 2010).
|
|
#10.17
|
Form of 2010 Plan Director Stock Option Master Agreement and Grant Notice (incorporated by reference to Exhibit 10.7 to the Company's Quarterly Report on Form 10-Q for the quarterly period ended June 30, 2010, filed August 9, 2010).
|
-112-
|
#10.18
|
Form of 2010 Plan Director Restricted Stock Unit Master Agreement and Grant Notice (incorporated by reference to Exhibit 10.8 to the Company's Quarterly Report on Form 10-Q for the quarterly period ended June 30, 2010, filed August 9, 2010).
|
|
#10.19
|
Amended and Restated Nu Skin Enterprises, Inc. 2010 Omnibus Incentive Plan ("Amended & Restated 2010 Plan") (incorporated by reference to Exhibit 10.1 to the Company's Current Report on Form 8-K filed on June 7, 2013).
|
|
#10.20
|
Form of Amended & Restated 2010 Plan Stock Option Grant Agreement (incorporated by reference to Exhibit 10.25 to the Company's Annual Report on Form 10-K for the year ended December 31, 2014, filed March 2, 2015).
|
|
#10.21
|
Form of Amended & Restated 2010 Plan Restricted Stock Unit Grant Agreement (incorporated by reference to Exhibit 10.26 to the Company's Annual Report on Form 10-K for the year ended December 31, 2014, filed March 2, 2015).
|
|
*#10.22
|
Form of Amended & Restated 2010 Plan Performance Stock Option Grant Agreement.
|
|
*#10.23
|
Form of Amended & Restated 2010 Plan Performance Restricted Stock Unit Grant Agreement.
|
|
#10.24
|
Form of Amended & Restated 2010 Plan Director Stock Option Grant Agreement (incorporated by reference to Exhibit 10.29 to the Company's Annual Report on Form 10-K for the year ended December 31, 2014, filed March 2, 2015).
|
|
#10.25
|
Form of Amended & Restated 2010 Plan Director Restricted Stock Unit Grant Agreement (incorporated by reference to Exhibit 10.30 to the Company's Annual Report on Form 10-K for the year ended December 31, 2014, filed March 2, 2015).
|
|
#10.26
|
Second Amended and Restated Nu Skin Enterprises, Inc. 2010 Omnibus Incentive Plan ("Second Amended and Restated 2010 Plan") (incorporated by reference to Exhibit 10.1 to the Company's Current Report on Form 8-K filed May 24, 2016).
|
|
*#10.27
|
Form of Second Amended & Restated 2010 Plan Stock Option Grant Agreement.
|
|
*#10.28
|
Form of Second Amended & Restated 2010 Plan Restricted Stock Unit Grant Agreement.
|
|
*#10.29
|
Form of Second Amended & Restated 2010 Plan Performance Stock Option Grant Agreement.
|
|
*#10.30
|
Form of Second Amended & Restated 2010 Plan Performance Restricted Stock Unit Grant Agreement.
|
|
*#10.31
|
Form of Second Amended & Restated 2010 Plan Director Stock Option Grant Agreement.
|
|
*#10.32
|
Form of Second Amended & Restated 2010 Plan Director Restricted Stock Unit Grant Agreement.
|
|
*#10.33
|
Form of Second Amended & Restated 2010 Plan Foreign Director Stock Option Grant Agreement.
|
-113-
|
*#10.34
|
Form of Second Amended & Restated 2010 Plan Foreign Director Restricted Stock Unit Grant Agreement.
|
|
#10.35
|
Nu Skin Enterprises, Inc. 2009 Key Employee Death Benefit Plan (incorporated by reference to Exhibit 10.58 to the Company's Annual Report on Form 10-K for the year ended December 31, 2010, filed February 23, 2011).
|
|
#10.36
|
Form of Indemnification Agreement between the Company and its executive officers and directors (incorporated by reference to Exhibit 10.1 to the Company's Quarterly Report on Form 10-Q for the quarterly period ended September 30, 2016, filed November 4, 2016).
|
|
#10.37
|
Employment Agreement, effective as of April 16, 2015, between the Company and Joseph Y. Chang (incorporated by reference to Exhibit 10.1 to the Company's Current Report on Form 8-K filed April 20, 2015).
|
|
#10.38
|
Settlement and Release Agreement dated October 14, 2015 between the Company and Daniel R. Chard (incorporated by reference to Exhibit 10.1 to the Company's Current Report on Form 8-K filed October 16, 2015).
|
|
*#10.39
|
Form of Key Employee Covenants.
|
|
*21.1
|
Subsidiaries of the Company.
|
|
*23.1
|
Consent of PricewaterhouseCoopers LLP.
|
|
*31.1
|
Certification by M. Truman Hunt, President and Chief Executive Officer, pursuant to Rule 13a-14(a) of the Securities Exchange Act of 1934, as adopted pursuant to Section 302 of the Sarbanes-Oxley Act of 2002.
|
|
*31.2
|
Certification by Ritch N. Wood, Chief Financial Officer, pursuant to Rule 13a-14(a) of the Securities Exchange Act of 1934, as adopted pursuant to Section 302 of the Sarbanes-Oxley Act of 2002.
|
|
*32.1
|
Certification by M. Truman Hunt, President and Chief Executive Officer, pursuant to Section 1350, Chapter 63 of Title 18, United States Code, as adopted pursuant to Section 906 of the Sarbanes-Oxley Act of 2002.
|
|
*32.2
|
Certification by Ritch N. Wood, Chief Financial Officer, pursuant to Section 1350, Chapter 63 of Title 18, United States Code, as adopted pursuant to Section 906 of the Sarbanes-Oxley Act of 2002.
|
|
*101.INS
|
XBRL Instance Document
|
|
*101.SCH
|
XBRL Taxonomy Extension Schema Document
|
|
*101.CAL
|
XBRL Taxonomy Extension Calculation Linkbase Document
|
|
*101.DEF
|
XBRL Taxonomy Extension Definition Linkbase Document
|
-114-
|
*101.LAB
|
XBRL Taxonomy Extension Label Linkbase Document
|
|
*101.PRE
|
XBRL Taxonomy Extension Presentation Linkbase Document
|
* Filed or furnished herewith.
# Management contract or compensatory plan or arrangement.
None.
-115-
Pursuant to the requirements of Section 13 or 15(d) of the Securities Exchange Act of 1934, the Registrant has duly caused this report to be signed on its behalf by the undersigned, thereunto duly authorized on February 27, 2017.
NU SKIN ENTERPRISES, INC.
|
By:
|
/s/M. Truman Hunt
|
|
|
|
M. Truman Hunt
|
|
|
|
President and Chief Executive Officer
|
|
Pursuant to the requirements of the Securities Exchange Act of 1934, this report has been signed below by the following persons on behalf of the Registrant and in the capacities indicated on February 27, 2017.
|
Signatures
|
Capacity in Which Signed
|
|
|
/s/ Steven J. Lund
|
Executive Chairman of the Board
|
|
|
Steven J. Lund
|
||
|
/s/ M. Truman Hunt
|
President, Chief Executive Officer and Director
|
|
|
M. Truman Hunt
|
(Principal Executive Officer)
|
|
|
/s/ Ritch N. Wood
|
Chief Financial Officer
|
|
|
Ritch N. Wood
|
(Principal Financial Officer and Accounting Officer)
|
|
|
/s/ Nevin N. Andersen
|
Director
|
|
|
Nevin N. Andersen
|
||
|
/s/ Daniel W. Campbell
|
Director
|
|
|
Daniel W. Campbell
|
||
|
/s/ Andrew D. Lipman
|
Director
|
|
|
Andrew D. Lipman
|
||
|
/s/ Neil H. Offen
|
Director
|
|
|
Neil H. Offen
|
||
|
/s/ Thomas R. Pisano
|
Director
|
|
|
Thomas R. Pisano
|
||
|
/s/ Zheqing Shen
|
Director
|
|
|
Zheqing Shen
|
||
|
/s/ Edwina D. Woodbury
|
Director
|
|
|
Edwina D. Woodbury
|
-116-
TABLE OF CONTENTS
Part IItem 1. BusinessItem 1A. Risk FactorsItem 1B. Unresolved Staff CommentsItem 2. PropertiesItem 3. Legal ProceedingsItem 4. Mine Safety DisclosuresPart IIItem 5. Market For Registrant's Common Equity, Related Stockholder Matters and Issuer Purchases Of Equity SecuritiesItem 6. Selected Financial DataItem 7. Management's Discussion and Analysis Of Financial Condition and Results Of OperationsItem 7A. Quantitative and Qualitative Disclosures About Market RiskItem 8. Financial Statements and Supplementary DataItem 9. Changes in and Disagreements with Accountants on Accounting and Financial DisclosureItem 9A. Controls and ProceduresItem 9B. Other InformationPart IIIPart IVItem 15. Exhibits and Financial Statement SchedulesItem 16. Form 10-k Summary