NVIDIA CORP
10-Ks and 10-Qs
|
|
|
|
|
|
|
|
|
|
|
|
|
|
|
|
|
|
|
|
|
|
|
|
|
|
|
|
|
|
|
|
|
|
|
|
|
|
|
|
|
|
|
|
|
|
|
|
|
|
|
|
|
|
|
|
UNITED STATES
SECURITIES AND EXCHANGE COMMISSION
Washington, D.C. 20549
________________
FORM 10-K
|
[x]
|
ANNUAL REPORT PURSUANT TO SECTION 13 OR 15(d) OF THE SECURITIES EXCHANGE ACT OF 1934
|
|
|
For the fiscal year ended January 30, 2011
|
OR
|
[_]
|
TRANSITION REPORT PURSUANT TO SECTION 13 OR 15(d) OF THE SECURITIES EXCHANGE ACT OF 1934
|
Commission file number: 0-23985

NVIDIA CORPORATION
(Exact name of registrant as specified in its charter)
|
Delaware
|
94-3177549
|
|
(State or other jurisdiction of
|
(I.R.S. Employer
|
|
Incorporation or Organization)
|
Identification No.)
|
2701 San Tomas Expressway
Santa Clara, California 95050
(408) 486-2000
(Address, including zip code, and telephone number, including area code, of principal executive offices)
Securities registered pursuant to Section 12(b) of the Act:
|
Title of each class
|
Name of each exchange on which registered
|
|
Common Stock, $0.001 par value per share
|
The NASDAQ Global Select Market
|
Securities registered pursuant to Section 12(g) of the Act:
None
Indicate by check mark if the registrant is a well-known seasoned issuer, as defined in Rule 405 of the Securities Act.
Yes
x
No
o
Indicate by check mark if the registrant is not required to file reports pursuant to Section 13 or Section 15(d) of the Act.
Yes
o
No
x
Indicate by check mark whether the registrant (1) has filed all reports required to be filed by Section 13 or 15(d) of the Securities Exchange Act of 1934 during the preceding 12 months (or for such shorter period that the registrant was required to file such reports), and (2) has been subject to such filing requirements for the past 90 days.
Yes
x
No
o
Indicate by check mark whether the registrant has submitted electronically and posted on its corporate Web site, if any, every Interactive Data File required to be submitted and posted pursuant to Rule 405 of Regulation S-T (§232.405 of this chapter) during the preceding 12 months (or for such shorter period that the registrant was required to submit and post such files).
Yes
x
No
o
Indicate by check mark if disclosure of delinquent filers pursuant to Item 405 of Regulation S-K (§ 229.405 of this chapter) is not contained herein, and will not be contained, to the best of registrant’s knowledge, in definitive proxy or information statements incorporated by reference in Part III of this Form 10-K or any amendment to this Form 10-K.
o
Indicate by check mark whether the registrant is a large accelerated filer, an accelerated filer, a non-accelerated filer, or a smaller reporting company. See definitions of “large accelerated filer,” “accelerated filer” and “smaller reporting company” in Rule 12b-2 of the Exchange Act. (Check one):
|
Large accelerated filer
x
|
Accelerated filer
o
|
|
Non-accelerated filer
o
(Do not check if a smaller reporting company)
|
Smaller reporting company
o
|
Indicate by check mark whether the registrant is a shell company (as defined in Rule 12b-2 of the Act).
Yes
o
No
x
The aggregate market value of the voting stock held by non-affiliates of the registrant as of August 1, 2010 was approximately $5.0 billion (based on the closing sales price of the registrant’s common stock as reported by the NASDAQ Global Select Market, on July 30, 2010). This calculation excludes approximately 26,130,043 shares held by directors and executive officers of the registrant. This calculation does not exclude shares held by such organizations whose ownership exceeds 5% of the registrant’s outstanding common stock that have represented to the registrant that they are registered investment advisers or investment companies registered under section 8 of the Investment Company Act of 1940.
The number of shares of common stock outstanding as of March 10, 2011 was 591.4 million.
DOCUMENTS INCORPORATED BY REFERENCE
Portions of the registrant’s Proxy Statement for its 2011 Annual Meeting of Stockholders to be filed with the Securities and Exchange Commission by April 6, 2011 are incorporated by reference.
NVIDIA CORPORATION
TABLE OF CONTENTS
|
Page
|
||
|
|
||
|
|
|
3
|
|
|
|
11
|
|
|
|
25
|
|
|
|
25
|
|
|
|
26
|
|
|
Removed
and Reserved
|
29
|
|
|
||
|
|
|
30
|
|
|
|
33
|
|
|
|
34
|
|
|
|
52
|
|
|
|
53
|
|
|
|
53
|
|
|
|
53
|
|
|
|
53
|
|
|
||
|
|
|
54
|
|
|
|
54
|
|
|
|
54
|
|
|
|
55
|
|
|
|
55
|
|
|
||
|
|
|
56
|
|
|
95
|
2
Forward-Looking Statements
This Annual Report on Form 10-K contains forward-looking statements within the meaning of Section 27A of the Securities Act of 1933, as amended, and Section 21E of the Securities Exchange Act of 1934, as amended, which are subject to the “safe harbor” created by those sections. Forward-looking statements are based on our management’s beliefs and assumptions and on information currently available to our management. In some cases, you can identify forward-looking statements by terms such as “may,” “will,” “should,” “could,” “goal,” “would,” “expect,” “plan,” “anticipate,” “believe,” “estimate,” “project,” “predict,” “potential” and similar expressions intended to identify forward-looking statements. These statements involve known and unknown risks, uncertainties and other factors, which may cause our actual results, performance, time frames or achievements to be materially different from any future results, performance, time frames or achievements expressed or implied by the forward-looking statements. We discuss many of these risks, uncertainties and other factors in this Annual Report on Form 10-K in greater detail under the heading “Risk Factors.” Given these risks, uncertainties and other factors, you should not place undue reliance on these forward-looking statements. Also, these forward-looking statements represent our estimates and assumptions only as of the date of this filing. You should read this Annual Report on Form 10-K completely and with the understanding that our actual future results may be materially different from what we expect. We hereby qualify our forward-looking statements by these cautionary statements. Except as required by law, we assume no obligation to update these forward-looking statements publicly, or to update the reasons actual results could differ materially from those anticipated in these forward-looking statements, even if new information becomes available in the future.
All references to “NVIDIA,” “we,” “us,” “our” or the “Company” mean NVIDIA Corporation and its subsidiaries, except where it is made clear that the term means only the parent company.
© 2011 NVIDIA Corporation. All rights reserved. NVIDIA, the NVIDIA logo, 3D Vision, CUDA, GeForce, NVIDIA Fermi, Quadro Tesla and Tegra are trademarks and/or registered trademarks of NVIDIA Corporation in the U.S. and other countries
Our Company
NVIDIA Corporation invented the graphics processing unit, or GPU, in 1999. Since then, we have strived to set new standards in visual computing with interactive graphics available on devices ranging from tablets and smart phones to notebooks and workstations. Our expertise in programmable GPUs and computer-systems technology has led to breakthroughs in parallel processing which make supercomputing less expensive and widely accessible. We are strategically investing in three major areas – visual computing, high performance computing and mobile computing. We serve the visual computing market with our consumer GeForce graphics products and professional Quadro graphics products; the high performance computing market with our Tesla computing solutions products; and the mobile computing market with our Tegra system-on-chip products.
We have three primary financial reporting segments – GPU, Professional Solutions Business, or PSB and Consumer Products Business, or CPB. During fiscal years 2010 and 2009, we operated and reported four major product-line operating segments: the GPU business, the PSB, the media and communications processor, or MCP business, and the CPB. However, during the first quarter of fiscal year 2011, we began reporting internally the results of our former MCP segment along with the results of our GPU segment to reflect the way we manage the GPU business.
Our GPU business is comprised primarily of our GeForce discrete and chipset products which support desktop and notebook personal computers, or PCs, plus memory products. Our PSB is comprised of our Quadro professional workstation products and other professional graphics products, including our NVIDIA Tesla high-performance computing products. Our CPB is comprised of our Tegra mobile products which support tablets, smartphones, personal media players, or PMPs, internet television, automotive navigation, and other similar devices. CPB also includes license, royalty, other revenue and associated costs related to video game consoles and other digital consumer electronics devices. Original equipment manufacturers, or OEMs, original design manufacturers, or ODMs, add-in-card manufacturers, system builders and consumer electronics companies worldwide utilize our processors as a core component of their entertainment, business and professional solutions.
We were incorporated in California in April 1993 and reincorporated in Delaware in April 1998. Our headquarter facilities are in Santa Clara, California. Our web address is
www.nvidia.com
. The contents of our website are not a part of this Form 10-K.
3
GPU Business
Our GPU business is comprised primarily of our GeForce discrete and chipset products that support desktop and notebook PCs, plus memory products. Our GPU business is focused on Microsoft Windows and Apple PC platforms. GeForce GPUs power PCs made by or distributed by most PC OEMs in the world for desktop PCs, notebook PCs, and PCs loaded with Windows Media Center and other media extenders such as the Apple TV. GPUs enhance the user experience for playing video games, editing photos, viewing and editing videos and high-definition, or HD, movies.
We believe we are in an era where visual computing is becoming increasingly important to consumers and other end users of our products. Our strategy is to promote the GeForce brand as one of the most important processors due to its technology leadership, increasing programmability, and impressive content experience it enables. In fiscal year 2011, our strategy was to extend our architectural and technology advantage with our GeForce GPUs.
During fiscal year 2011, we took the computational capabilities of our GPUs to a new level with the launch of our Fermi architecture. Fermi GPUs are designed to excel at tessellation, the key feature of DirectX 11, and to allow game developers to increase the level of physics realism via our PhysX API. Our flagship product for the desktop, the GeForce GTX 480, was followed by a complete line-up of 400-series GPUs. Later in the year, we refreshed them with our 500-series GPUs, which significantly increased the performance of the products they replaced while fitting into similar power envelopes. We also launched 400M- and 500M- series GPUs for notebooks, along with our Optimus technology, which switches invisibly between discrete GPU and integrated graphics controller depending on the user’s activities. By doing so, NVIDIA Optimus provides notebook users with the battery life of integrated graphics, but with the gaming performance of a discrete graphics processor. PC manufacturers also are expected to launch hundreds of new PCs that use these new GeForce GPUs paired with Intel’s Sandy Bridge CPUs.
During fiscal year 2011, we also announced our plans to develop a custom central processing unit, or CPU, that will use the ARM instruction set. These CPU cores will be integrated into future generation GPUs for PCs, servers, and supercomputers.
These CPU cores will be integrated into future generation processors for PCs, servers, and supercomputers. PC manufacturers also are expected to launch hundreds of new PCs that use NVIDIA® GeForce GPUs paired with the new generation of Intel Corporation’s Sandy Bridge CPUs.
During fiscal year 2011, we also began shipments of the GeForce 320M chipset to Apple for incorporation into their latest 13-inch MacBook notebooks. The 320M delivers up to an 80% performance increase over the previous GeForce 9400M GPU.
Professional Solutions Business
Our PSB is comprised of our Quadro professional workstation products and other professional graphics products, including our Tesla high-performance computing products. Our Quadro brand products are designed to deliver the highest possible level of graphics performance and application compatibility for the professional industry. Quadro products are recognized by many as the standard for professional graphics solutions needed to solve many of the world’s most complex visual computing challenges in the manufacturing, entertainment, medical, science, and aerospace industries. Quadro products are fully certified by several software developers for professional workstation applications and are designed to deliver the graphics performance and precision required by professional applications.
There has been in recent years an increasing level of global adoption of the computer-aided design approach of product creation. We have achieved a leading position in the professional graphics category by providing innovative GPU technology, software, and tools that integrate the capabilities of our GPU with a broad array of visualization products.
During fiscal year 2011, our Quadro business benefitted from the strength of our Fermi architecture with the launch of the Quadro 2000 midrange GPU and the Quadro 600 entry-level GPU. These professional graphics solutions put the computational and visualization benefits of our Fermi architecture within reach of all engineers, designers and animators, with the Quadro 2000 delivering significantly higher performance compared to leading computer aided design, or CAD applications and the Quadro 600 positioned at a competitive price/performance point.
During fiscal year 2011, demand for our workstation products continued to recover, fueled by demand from enterprise customers and new growth markets like video editing. During SIGRRAPH 2010, we introduced new Quadro GPU products based on our Fermi architecture and 3D Vision Pro, a new 3D stereoscopic solution that empowers engineers, designers, architects and computational chemists who work with complex 3D designs to experience a rich, reliable 3D viewing for large scale visualization environments. The new Quadro GPUs deliver performance that is up to five times faster for 3D applications and up to eight times faster for computational simulation than our previous Quadro generation products. We also announced that a range of NVIDIA Quadro professional graphics solutions are certified by Adobe Systems Incorporated for Adobe Creative Suite 5 software, which provides real-time video editing and effects processing of Adobe Premiere Pro CS5.
Our Tesla supercomputing business continued to make progress with key project wins not only in our core market segments, but also with traction in a number of new focus areas. A notable achievement this fiscal year was the unveiling of the Tianhe-1A supercomputer at HPC 2010 China. The system uses more than 7,000 Tesla M2050 GPUs, is three-times more energy efficient than an equivalent CPU-only system and takes up half as much floor space.
4
Consumer Products Business
Our CPB is comprised of our Tegra mobile products that support smartphones, smartbooks, tablets, personal media players, or PMPs, internet television, automotive navigation, and other similar devices. CPB also includes license, royalty, other revenue and associated costs related to video game consoles and other digital consumer electronics devices.
Our mobile strategy is to create a system-on-a-chip that enables entertainment and web experiences that end users enjoy on a PC. NVIDIA Tegra mobile products implement design techniques, both inside the chips and at the system level, which result in high performance and long battery life. These technologies enhance visual display capabilities, improve connectivity, and minimize chip and system-level power consumption.
During fiscal year 2011, we continued to see promising signs in our Tegra business, helped by the widespread consumer adoption of the Android operating system. Tegra shipment volumes began to ramp up late in the fourth quarter of fiscal year 2011 and we expect the momentum to continue into the first quarter of fiscal year 2012, fueled by the production release of Android-based smartphone and tablet products. During fiscal year 2011, we had multiple Tegra 2 design wins in both tablets and smartphones. Our customers including Acer Inc., Dell Inc., LG Electronics Inc. and Motorola Solutions, Inc. announced a number of products incorporating the Tegra 2 mobile processor. We also demonstrated our next-generation mobile processor, the world’s first quad-core mobile processor, at Mobile World Congress.
During fiscal year 2011, we announced that Volkswagen AG and Audi AG will use our next-generation Tegra starting in 2012. In addition to this, we announced that BMW will use our GPUs for infotainment systems in next-generation cars worldwide. Tesla™ Motors will also incorporate Tegra processors to power the infotainment, navigation and instrument cluster in its Roadster Model S.
Our Strategy
We are committed to bringing the best experience to the end user through our innovative hardware and software offerings. We design our products to enable customers in the visual computing, high-performance computing and mobile computing markets to build products that deliver state-of-the-art features and capabilities, performance, compatibility and power efficiency while maintaining competitive pricing and profitability. Our business strategy leverages our ability to design and develop programmable GPUs, system I/O processors, system-on-chip processors, application programming interfaces for multiple operating systems, and application programming tools and middle-ware to provide our customers with platforms that allow superior performance and utility beyond the base capability. We believe that by developing hardware and software platforms that provide superior performance and address the key requirements of each of the product categories we serve, we will raise the capability of each system and further accelerate its adoption. We combine scalable architectural technology with mass market economies-of-scale to deliver a complete family of products that span from professional workstations, to consumer PCs to tablets and smartphones.
Our objective is to be the leading supplier of programmable, high-performance GPUs and ultra-low power mobile system-on-a-chip products. A fundamental strategy is to actively recruit the industry’s best 3D graphics and HD video, microprocessor, networking and communications engineers, and we believe that we have assembled an exceptionally experienced and talented engineering team. Our current focus is on the desktop PC, professional workstation, notebook PC, high-performance computing, and application processor product lines, and we plan to expand into other product lines. Our strategy to achieve this objective includes the following key elements:
Sustain Technology and Product Leadership in Visual Computing.
We believe that ongoing investment in research and development in 3D graphics and image processing is critical to the development and enhancement of innovative products and technologies. We are focused on using our advanced engineering capabilities to accelerate the quality and performance of 3D graphics, image processing, and computational graphics to raise and change the user experience for both consumer entertainment and professional visualization applications. Our research and development strategy is to focus on concurrently developing multiple generations of GPUs, including GPUs for high-performance computing, and mobile and consumer products using independent design teams. As we have in the past, we intend to use this strategy to achieve new levels of graphics, networking and communications features and performance and ultra-low power designs, enabling our customers to achieve superior performance in their products.
5
Revolutionize High Performance Computing with CUDA and Tesla.
Tesla is a family of GPU computing products that delivers processing capabilities for high-performance computing applications. NVIDIA CUDA is a general purpose parallel computing architecture that leverages the parallel compute engine in NVIDIA GPUs to solve many complex computational problems in a fraction of the time required on a CPU. Our CUDA parallel processing architecture can accelerate compute-intensive applications by significant multiples over that of a CPU alone. We are working with developers around the world who have adopted and written application programs for the CUDA architecture using various high-level programming languages, which can then be run at significant execution speeds on a CUDA-enabled GPU. With CUDA, we are able to speed up general purpose compute-intensive applications as we do for 3D graphics processing. Developers are able to speed-up algorithms in areas ranging from nano molecular dynamics to image processing, medical image reconstruction and derivatives modeling for financial risk analysis. We are also working with universities around the world that teach parallel programming with CUDA as well as with many PC OEMs that offer high performance computing solutions with Tesla for use by their customers around the world. Researchers also use CUDA to accelerate their time-to-discovery, and many popular off-the-shelf software packages are now CUDA accelerated.
Advance Mobile Computing with Best-in-Class Ultra-Low Power System-On-Chip Processors.
We believe the synergy created by the combination of 3D graphics, HD video and the Internet will fundamentally change the way people work, learn, communicate and play. We believe that our expertise in HD graphics and system architecture positions us to help drive this transformation. We are using our expertise in the processing and transmission of high-bandwidth digital media to develop products designed to address the requirements of high-bandwidth concurrent multimedia. By developing 3D graphics, HD video and media communications solutions that provide superior performance and address the key requirements of these platforms, we believe that we will accelerate the adoption of next generation smart phones and tablets.
Use Our Intellectual Property and Resources to Enter into License and Development Contracts.
From time to time, we expect to enter into license and royalty arrangements that may require significant customization of our intellectual property components.
Sales and Marketing
Our worldwide sales and marketing strategy is key to our objective to become the leading supplier of programmable, high-performance GPUs and ultra-low power mobile system-on-a-chip products. Our sales and marketing teams work closely with each industry’s respective OEMs, ODMs, system builders, motherboard manufacturers, add-in board manufacturers and industry trendsetters, collectively referred to as our Channel, to define product features, performance, price and timing of new products. Members of our sales team have a high level of technical expertise and product and industry knowledge to support the competitive and complex design win process. We also employ a highly skilled team of application engineers to assist our Channel in designing, testing and qualifying system designs that incorporate our products. We believe that the depth and quality of our design support are keys to improving our Channel’s time-to-market, maintaining a high level of customer satisfaction within our Channel and fostering relationships that encourage customers to use the next generation of our products.
In the segments we serve that purchase our GPUs, the sales process involves achieving key design wins with leading OEMs and major system builders and supporting the product design into high volume production with key ODMs, motherboard manufacturers and add-in board manufacturers. These design wins in turn influence the retail and system builder channel that is serviced by add-in board and motherboard manufacturers. Our distribution strategy is to work with a number of leading independent contract equipment manufacturers, or CEMs, ODMs, motherboard manufacturers, add-in board manufacturers and distributors, each of which have relationships with a broad range of major OEMs and/or strong brand name recognition in the retail channel. In the CPB segment that we serve, the sales process primarily involves achieving key design wins directly with the leading handheld OEMs and supporting the product design into high-volume production. Currently, we sell a significant portion of our processors directly to distributors, CEMs, ODMs, motherboard manufacturers and add-in board manufacturers, which then sell boards and systems with our products to leading OEMs, retail outlets and a large number of system builders.
Although as a result of our Channel strategy, a small number of our customers represent the majority of our revenue, their end customers include a large number of OEMs and system builders throughout the world. Sales to our largest customer, Quanta Computer Incorporated, accounted for 12% of our total revenue for fiscal year 2011.
To encourage software title developers and publishers to develop games optimized for platforms utilizing our products, we seek to establish and maintain strong relationships in the software development community. Engineering and marketing personnel interact with and visit key software developers to promote and discuss our products, as well as to ascertain product requirements and solve technical problems. Our developer program makes certain that our products are available to developers prior to volume availability in order to encourage the development of software titles that are optimized for our products.
6
Backlog
Our sales are primarily made pursuant to standard purchase orders. The quantity of products purchased by our customers as well as our shipment schedules are subject to revisions that reflect changes in both the customers’ requirements and in manufacturing availability. The semiconductor industry is characterized by short lead time orders and quick delivery schedules. In light of industry practice and experience, we believe that only a small portion of our backlog is non-cancelable and that the dollar amount associated with the non-cancelable portion is not significant.
Seasonality
Our industry is largely focused on the consumer products market. Historically, we have seen stronger revenue in the second half of our fiscal year than in the first half of our fiscal year, primarily due to back-to-school and holiday demand. While we anticipate that this historical seasonal trend will resume, there can be no assurance of this trend. For example, revenue in the second half of fiscal year 2011 decreased by 5% compared with the first half of fiscal year 2011 primarily due to weakness in end consumer markets, while revenue in the second half of fiscal year 2010 grew by 31% compared with the first half of fiscal year 2010.
Manufacturing
Fabless Manufacturing Strategy
We do not directly manufacture semiconductor wafers used for our products. Instead, we utilize what is known as a fabless manufacturing strategy for all of our product-line operating segments whereby we employ world-class suppliers for all phases of the manufacturing process, including wafer fabrication, assembly, testing and packaging. This strategy uses the expertise of industry-leading suppliers that are certified by the International Organization for Standardization, or ISO, in such areas as fabrication, assembly, quality control and assurance, reliability and testing. In addition, this strategy allows us to avoid many of the significant costs and risks associated with owning and operating manufacturing operations. Our suppliers are also responsible for procurement of most of the raw materials used in the production of our products. As a result, we can focus our resources on product design, additional quality assurance, marketing and customer support.
We utilize industry-leading suppliers, such as Taiwan Semiconductor Manufacturing Company Limited, or TSMC, and United Microelectronics Corporation, or UMC, to produce our semiconductor wafers. We then utilize independent subcontractors, such as Advanced Semiconductor Engineering, Inc., Amkor Technology, JSI Logistics Ltd., King Yuan Electronics Co., Ltd., Siliconware Precision Industries Company Ltd., and STATS ChipPAC Incorporated to perform assembly, testing and packaging of most of our products. We purchase substrates from Nanya Technology Corporation, IbidenCo., Ltd. and Unimicron Technology Corporation.
We typically receive semiconductor products from our subcontractors, perform incoming quality assurance and then ship the semiconductors to CEMs, distributors, motherboard and add-in board manufacturer customers from our third-party warehouse in Hong Kong. Generally, these manufacturers assemble and test the boards based on our design kit and test specifications, and then ship the products to retailers, system builders or OEMs as motherboard and add-in board solutions.
Inventory and Working Capital
Our management focuses considerable attention on managing our inventories and other working-capital-related items. We manage inventories by communicating with our customers and then using our industry experience to forecast demand on a product-by-product basis. We then place manufacturing orders for our products that are based on forecasted demand. The quantity of products actually purchased by our customers as well as shipment schedules are subject to revisions that reflect changes in both the customers’ requirements and in manufacturing availability. We generally maintain substantial inventories of our products because the semiconductor industry is characterized by short lead time orders and quick delivery schedules.
Our existing cash and marketable securities balances increased by 44% at the end of fiscal year 2011 compared with the end of fiscal year 2010. We believe that these balances and our anticipated cash flows from operations will be sufficient to meet our operating, acquisition and capital requirements for at least the next twelve months.
7
Research and Development
We believe that the continued introduction of new and enhanced products designed to deliver leading 3D graphics, HD video, audio, ultra-low power consumption, and system-on-chip architectures is essential to our future success. Our research and development strategy is to focus on concurrently developing multiple generations of GPUs, including GPUs for high-performance computing, and mobile and consumer products using independent design teams. Our research and development efforts are performed within specialized groups consisting of software engineering, hardware engineering, very large scale integration design engineering, process engineering, architecture and algorithms. These groups act as a pipeline designed to allow the efficient simultaneous development of multiple generations of products.
A critical component of our product development effort is our partnerships with leaders in the CAD industry. We invest significant resources in the development of relationships with industry leaders, often assisting these companies in the product definition of their new products. We believe that forming these relationships and utilizing next-generation development tools to design, simulate and verify our products will help us remain at the forefront of the 3D graphics market and develop products that utilize leading-edge technology on a rapid basis. We believe this approach assists us in meeting the new design schedules of PC OEM and other manufacturers.
As of January 30, 2011, we had 4,161 full-time employees engaged in research and development. During fiscal years 2011, 2010 and 2009, we incurred research and development expense of $848.8 million, $908.9 million and $855.9 million, respectively.
Competition
The market for our products is intensely competitive and is characterized by rapid technological change, evolving industry standards and declining average selling prices. We believe that the principal competitive factors in this market are performance, breadth of product offerings, access to customers and distribution channels, software support, conformity to industry standard Application Programming Interfaces, or APIs, manufacturing capabilities, processor pricing, and total system costs. We believe that our ability to remain competitive will depend on how well we are able to anticipate the features and functions that customers will demand and whether we are able to deliver consistent volumes of our products at acceptable levels of quality and at competitive prices. We expect competition to increase from both existing competitors and new market entrants with products that may be less costly than ours, or may provide better performance or additional features not provided by our products. In addition, it is possible that new competitors or alliances among competitors could emerge and acquire significant market share.
A significant source of competition comes from companies that provide or intend to provide GPUs and mobile and consumer products. Some of our competitors may have greater marketing, financial, distribution and manufacturing resources than we do and may be more able to adapt to customer or technological changes.
Our current competitors include the following:
|
·
|
suppliers of GPUs, including chipsets that incorporate 3D graphics functionality as part of their existing solutions, such as Advanced Micro Devices, or AMD, Intel, Matrox Electronics Systems Ltd., Silicon Integrated Systems, and VIA Technologies, Inc.;
|
|
·
|
suppliers of system-on-a-chip products that support tablets, smartphones, PMPs, internet television, automotive navigation and other similar devices, such as AMD, ARM Holdings plc, Broadcom Corporation, Freescale Semiconductor Inc., Fujitsu Limited, Imagination Technologies Ltd., Intel, Marvell Technology Group Ltd., NEC Corporation, Qualcomm Incorporated, Renesas Technology Corp., Samsung Electronics Co. Ltd., Seiko Epson Corporation, STMicroelectronics, Texas Instruments Incorporated, and Toshiba America Electronic Components, Inc.; and
|
|
·
|
licensors of graphics technologies such as ARM Holdings plc, and Imagination Technologies Group plc.
|
If and to the extent we offer products in new markets, we may face competition from existing competitors as well as from companies with which we currently do not compete. We expect substantial competition from both Intel’s and AMD’s strategy of selling platform solutions, including integrating a CPU and a GPU on the same chip or same package, as evidenced by AMD’s announcement of its Fusion processors and Intel’s announcement of its family of CPUs codenamed Sandy Bridge. If AMD and Intel continue to pursue platform solutions and integrated CPUs, we may not be able to successfully compete and our business would be negatively impacted.
8
Patents and Proprietary Rights
We rely primarily on a combination of patents, trademarks, trade secrets, employee and third-party nondisclosure agreements and licensing arrangements to protect our intellectual property in the United States and internationally. Our currently issued patents have expiration dates from April 5th, 2011 to January 29, 2031. We have numerous patents issued, allowed and pending in the United States and in foreign jurisdictions. Our patents and pending patent applications primarily relate to our products and the technology used in connection with our products. We also rely on international treaties, organizations and foreign laws to protect our intellectual property. The laws of certain foreign countries in which our products are or may be manufactured or sold, including various countries in Asia, may not protect our products or intellectual property rights to the same extent as the laws of the United States. This makes the possibility of piracy of our technology and products more likely. We continuously assess whether and where to seek formal protection for particular innovations and technologies based on such factors as:
|
·
|
the location in which our products are manufactured;
|
|
·
|
our strategic technology or product directions in different countries;
|
|
·
|
the degree to which intellectual property laws exist and are meaningfully enforced in different jurisdictions; and
|
|
·
|
the commercial significance of our operations and our competitors’ operations in particular countries and regions.
|
Our pending patent applications and any future applications may not be approved. In addition, any issued patents may not provide us with competitive advantages or may be challenged by third parties. The enforcement of patents by others may harm our ability to conduct our business. Others may independently develop substantially equivalent intellectual property or otherwise gain access to our trade secrets or intellectual property. Our failure to effectively protect our intellectual property could harm our business. We have licensed technology from third parties for incorporation in some of our products and for defensive reasons, and expect to continue to enter into such license agreements. These licenses may result in royalty payments to third parties, the cross licensing of technology by us or payment of other consideration. If these arrangements are not concluded on commercially reasonable terms, our business could suffer.
Employees
As of January 30, 2011 we had 6,029 employees, 4,161 of whom were engaged in research and development and 1,868 of whom were engaged in sales, marketing, operations and administrative positions. We believe our relationships with our employees are good.
Financial Information by Business Segment and Geographic Data
Our Chief Executive Officer, who is considered to be our chief operating decision maker, or CODM, reviews financial information presented on an operating segment basis for purposes of making operating decisions and assessing financial performance. During the last several fiscal years, we have operated and reported four major product-line operating segments to our CODM: the GPU business, the PSB, the MCP business, and the CPB. However, during the first quarter of fiscal year 2011, we began reporting internally the results of our former MCP segment along with the results of our GPU segment to reflect the way we manage the GPU business. Comparative periods presented reflect this change.
Our GPU business is comprised primarily of our GeForce discrete and chipset products which support desktop and notebook personal computers, or PCs, plus memory products. Our PSB is comprised of our Quadro professional workstation products and other professional graphics products, including our NVIDIA Tesla high-performance computing products. Our CPB is comprised of our Tegra mobile products which support tablets, smartphones, PMPs, internet television, automotive navigation, and other similar devices. CPB also includes license, royalty, other revenue and associated costs related to video game consoles and other digital consumer electronics devices. OEMs, ODMs, add-in-card manufacturers, system builders and consumer electronics companies worldwide utilize our processors as a core component of their entertainment, business and professional solutions.
The “All Other” category includes non-recurring charges and benefits that we do not allocate to our operating segments as these items are not included in the segment operating performance measures evaluated by our CODM. During the year ended January 30, 2011, we entered into a new six-year cross licensing agreement with Intel and also mutually agreed to settle all outstanding legal disputes. For accounting purposes, the fair valued benefit prescribed to the settlement portion was $57.0 million and was considered a non-recurring benefit for the fiscal year 2011. Please refer to Note 4 of these Notes to the Consolidated Financial Statements in Part IV, Item 15 of this Form 10-K for further discussion regarding the patent cross license agreement with Intel. Non-recurring charges related to our cash tender offer to purchase certain employee stock options were $140.2 million for the year ended January 31, 2010. Please refer to Note 2 of the Notes to the Consolidated Financial Statements in Part IV, Item 15 of this Form 10-K for further discussion regarding the cash tender offer. During the year ended January 25, 2009, we recorded a non- recurring charge of $26.9 million for restructuring and other charges associated with the termination of a development contract related to a new campus construction project we had put on hold. Please refer to Note 6 of the Notes to the Consolidated Financial Statements in Part IV, Item 15 of this Form 10-K for further discussion regarding the restructuring and other charges.
Our CODM does not review any information regarding total assets on an operating segment basis. Operating segments do not record intersegment revenue, and, accordingly, there is none to be reported. The accounting policies for segment reporting are the same as for NVIDIA as a whole. The information included in Note 17 of the Notes to the Consolidated Financial Statements in Part IV, Item 15 of this Form 10-K, including financial information by business segment and revenue and long-lived assets by geographic region, is hereby incorporated by reference.
9
Executive Officers of the Registrant
The following sets forth certain information regarding our executive officers, their ages and their positions as of February 28, 2011:
|
Name
|
Age
|
Position
|
||
|
Jen-Hsun Huang
|
48
|
President, Chief Executive Officer and Director
|
||
|
David L. White
|
55
|
Executive Vice President and Chief Financial Officer
|
||
|
Ajay K. Puri
|
56
|
Executive Vice President, Worldwide Sales
|
||
|
David M. Shannon
|
55
|
Executive Vice President, General Counsel and Secretary
|
||
|
Debora Shoquist
|
56
|
Executive Vice President, Operations
|
Jen-Hsun Huang
co-founded NVIDIA in April 1993 and has served as its President, Chief Executive Officer and a member of the Board of Directors since its inception. From 1985 to 1993, Mr. Huang was employed at LSI Logic Corporation, a computer chip manufacturer, where he held a variety of positions, most recently as Director of Coreware, the business unit responsible for LSI’s “system-on-a-chip” strategy. From 1983 to 1985, Mr. Huang was a microprocessor designer for Advanced Micro Devices, Inc., a semiconductor company. Mr. Huang holds a B.S.E.E. degree from Oregon State University and an M.S.E.E. degree from Stanford University.
David L. White
joined NVIDIA in February 2009 as Executive Vice President and Chief Financial Officer. From August 2004 to February 2009, Mr. White served as the Executive Vice President of Finance and Chief Financial Officer of Sanmina-SCI Corporation, a global provider of customized, integrated electronics manufacturing services to original equipment manufacturers in the communications, enterprise computing and medical industries and various other end markets. From 2003 to 2004, Mr. White was Senior Vice President and Chief Financial Officer of Asyst Technologies, Inc., a provider of integrated hardware and software automation solutions that enhance semiconductor and flat-panel display manufacturing productivity. Mr. White served as President and Chief Executive Officer of Candescent Technologies Corporation, a developer of field emission display technology for next-generation thin flat-panel displays, and held various other positions, from 1995 to 2002. Mr. White holds a B.S. degree from Brigham Young University and an M.B.A. from the University of Washington.
Ajay K. Puri
joined NVIDIA in December 2005 as Senior Vice President, Worldwide Sales and became Executive Vice President, Worldwide Sales in January 2009. Prior to NVIDIA, he held positions in sales, marketing, and general management over a 22-year career at Sun Microsystems, Inc. Mr. Puri previously held marketing, management consulting, and product development positions at Hewlett-Packard Company, Booz Allen Hamilton Inc., and Texas Instruments Incorporated. Mr. Puri holds an M.B.A. degree from Harvard University, an M.S.E.E. degree from the California Institute of Technology and a B.S.E.E. degree from the University of Minnesota.
David M. Shannon
joined NVIDIA in August 2002 as Vice President and General Counsel. Mr. Shannon became Secretary of NVIDIA in April 2005, a Senior Vice President in December 2005 and an Executive Vice President in January 2009. From 1993 to 2002, Mr. Shannon held various counsel positions at Intel, including the most recent position of Vice President and Assistant General Counsel. Mr. Shannon also practiced for eight years in the law firm of Gibson Dunn and Crutcher, focusing on complex commercial and high-technology related litigation. Mr. Shannon holds B.A. and J.D. degrees from Pepperdine University.
Debora Shoquist
joined NVIDIA in September 2007 as Senior Vice President of Operations and became Executive Vice President of Operations in January 2009. From 2004 to 2007, Ms. Shoquist served as Senior Vice President of Operations at JDS Uniphase Corporation, a provider of communications test and measurement solutions and optical products for the telecommunications industry. From 2002 to 2004, she served as Senior Vice President and General Manager of the Electro-Optics business at Coherent, Inc., a manufacturer of commercial and scientific laser equipment. Her experience includes her role at Quantum Corporation as the President of the Personal Computer Hard Disk Drive Division. Her experience also includes senior roles at Hewlett-Packard Corporation. She holds a B.S degree in Electrical Engineering from Kansas State University and a B.S. degree in Biology from Santa Clara University.
10
Available Information
Our Annual Report on Form 10-K, quarterly reports on Form 10-Q, current reports on Form 8-K and, if applicable, amendments to those reports filed or furnished pursuant to Section 13(a) of the Securities Exchange Act of 1934, or the Exchange Act, are available free of charge on or through our web site, http://www.nvidia.com, as soon as reasonably practicable after we electronically file such material with, or furnish it to, the Securities and Exchange Commission, or the SEC. Our web site and the information on it or connected to it is not a part of this Form 10-K.
In evaluating NVIDIA and our business, the following factors should be considered in addition to the other information in this Annual Report on Form 10-K. Before you buy our common stock, you should know that making such an investment involves some risks including, but not limited to, the risks described below. Additionally, any one of the following risks could seriously harm our business, financial condition and results of operations, which could cause our stock price to decline. Additional risks and uncertainties not presently known to us or that we currently deem immaterial may also impair our business operations.
Risks Related to Our Business, Industry and Partners
Our business results could be adversely affected if the identification and development of new products is delayed or unsuccessful.
In order to maintain or improve our financial results, we will need to continue to identify and develop new products and enhancements to our existing products in a timely and cost-effective manner. The process of developing new products and services and enhancing existing products and services is highly complex, costly and uncertain, and any failure by us to anticipate customers’ changing needs and emerging technology trends could significantly harm our market. We must make long-term investments and commit significant resources before knowing whether our predictions will accurately reflect customer demand for our new products and technologies. It is possible that our development efforts will not be successful and that our new technologies will not result in meaningful revenues. Even if we introduce new and enhanced products to the market, we may not be able to achieve market acceptance of them in a timely manner.
Our ability to successfully develop and deliver new products will depend on various factors, including our ability to:
|
·
|
Effectively identify and capitalize upon opportunities in new markets;
|
|
·
|
Timely complete and introduce new products and technologies;
|
|
·
|
Transition our semiconductor products to increasingly smaller line width geometries; and
|
|
·
|
Obtain sufficient foundry capacity and packaging materials.
|
We occasionally have experienced delays in completing the development and introduction of new products and product enhancements, and we could experience delays in the future. In addition, in the past, we have been unable to successfully manage product transitions from older to newer products resulting in obsolete inventory. Our failure to successfully develop and introduce new products and technologies or identify new uses for existing or future products, could result in rapidly declining average selling prices, reduced demand for our products or loss of market share any of which could harm our competitive position and cause our revenue, gross margin and overall financial results to suffer.
If we are unable to achieve market acceptance and design wins for our products and technologies, our results of operations and competitive position will be harmed.
The success of our business depends to a significant extent on our ability to achieve market acceptance of our new products and enhancements to our existing products and identify and enter new markets. The market for our product and technologies has been characterized by unpredictable and sometimes rapid shifts in the popularity of products, often caused by the publication of competitive industry benchmark results, changes in pricing of dynamic random-access memory devices and other changes in the total system cost of add-in boards, as well as by severe price competition and by frequent new technology and product introductions. Broad market acceptance is difficult to achieve and such market acceptance, if achieved, is difficult to sustain due to intense competition and frequent new technology and product introductions. If we do not successfully achieve or maintain market acceptance for our products and enhancements or identify and enter new markets, our ability to compete and maintain or increase revenues will suffer.
11
Additionally, there can be no assurance that the industry will continue to demand new products with improved standards, features or performance. If our customers, original equipment manufacturers, or OEMs, original design manufacturers, or ODMs, add-in-card and motherboard manufacturers, system builders and consumer electronics companies, do not continue to design products that require more advanced or efficient processors and/or the market does not continue to demand new products with increased performance, features, functionality or standards, sales of our products could decline and the markets for our products could shrink. Decreased sales of our products for these markets could negatively impact our revenue and our financial results.
We believe achieving design wins, which entails having our existing and future products chosen for hardware components or subassemblies designed by OEMs, or ODMs, add-in board and motherboard manufacturers is an integral part of our future success. Our OEM, ODM, and add-in board and motherboard manufacturers’ customers typically introduce new system configurations as often as twice per year, typically based on spring and fall design cycles or in connection with trade shows. Accordingly, when our customers are making their design decisions, our existing products must have competitive performance levels or we must timely introduce new products in order to be included in our customers’ new system configurations. This requires that we:
|
·
|
anticipate the features and functionality that customers and consumers will demand;
|
|
·
|
incorporate those features and functionalities into products that meet the exacting design requirements of our customers;
|
|
·
|
price our products competitively; and
|
|
·
|
introduce products to the market within our customers’ limited design cycles
|
If OEMs, ODMs, and add-in board and motherboard manufacturers do not include our products in their systems, they will typically not use our products in their systems until at least the next design configuration. Therefore, we endeavor to develop close relationships with our OEMs and ODMs, in an attempt to better anticipate and address customer needs in new products so that we will achieve design wins.
Our ability to achieve design wins also depends in part on our ability to identify and be compliant with evolving industry standards. Unanticipated changes in industry standards could render our products incompatible with products developed by major hardware manufacturers and software developers. If our products are not in compliance with prevailing industry standards, we may not be designed into our customers’ product designs. However, to be compliant with changes to industry standards, we may have to invest significant time and resources to redesign our products which could negatively impact our gross margin or operating results. If we are unable to achieve new design wins for existing or new customers, we may lose market share and our operating results would be negatively impacted.
If we are unable to compete in the markets for our products, our financial results will be adversely impacted.
The market for our products, specifically the GPU and mobile and consumer markets are extremely competitive, and we expect competition to intensify as current competitors expand their product offerings, industry standards continue to evolve and others realize the market potential of mobile and consumer products and services. Our current competitors include the following, some of which have greater financial, technical and management resources than us:
|
·
|
suppliers of GPUs, including chipsets, that incorporate 3D graphics functionality as part of their existing solutions, such as Advanced Micro Devices Inc., or AMD, Intel Corporation, or Intel, Matrox Electronics Systems Ltd., Silicon Integrated Systems, or SIS, and
VIA
Technologies, Inc.;
|
|
·
|
suppliers of system-on-a-chip products that support tablets, netbooks, PNDs, PMPs, PDAs, cellular phones, handheld devices or embedded devices such as AMD, Broadcom Corporation, Freescale Semiconductor, Inc., Fujitsu Limited, Imagination Technologies Ltd., Intel,
Marvell
Technology Group Ltd., NEC Corporation, Qualcomm Incorporated, Renesas Technology Corp., Samsung Electronics Co., Ltd., Seiko Epson Corporation, STMicroelectronics, Texas Instruments Incorporated, and Toshiba America Electronic Components, Inc.; and
|
|
·
|
licensors of graphics technologies such as ARM Holdings plc, and Imagination Technologies Group plc. |
We expect competition to increase from both existing competitors and new market entrants with products that may be less costly than ours, or may provide better performance or additional features not provided by our products. In addition, it is possible that new competitors or alliances among competitors could emerge and acquire significant market share. Furthermore, competitors with greater financial resources may be able to offer lower prices than us, or they may offer additional products, services or other incentives that we may not be able to match. In addition, many of our competitors operate and maintain their own fabrication facilities and have longer operating histories, greater name recognition, larger customer bases, and greater sales, marketing and distribution resources than we do.
Our ability to compete will depend on, among other factors, our ability to:
|
·
|
continue to keep pace with technological developments;
|
|
·
|
develop and introduce new products, services, technologies and enhancements on a timely basis;
|
|
·
|
become a preferred partner for operating system platforms, such as Android and Windows Mobile;
|
|
·
|
transition our semiconductor products to increasingly smaller line width geometries;
|
|
·
|
obtain sufficient foundry capacity and packaging materials; and
|
|
·
|
succeed in significant foreign markets, such as China and India.
|
If we are unable to compete in our current or new markets, demand for our products could decrease which could cause our revenue to decline and our financial results to suffer
.
12
We expect substantial competition from both Intel’s and AMD’s strategy of selling platform solutions, such as the success Intel achieved with its Centrino platform solution. AMD is also shipping a platform solution. Additionally, Intel and AMD have each announced its intention to integrate a central processing unit, or CPU, and a GPU on the same chip, as evidenced by AMD’s announcement of its Fusion processor project and Intel’s introduction of Sandy Bridge products. If AMD and Intel continue to pursue platform solutions, we may not be able to successfully compete and our business would be negatively impacted.
If new consumer products and technologies which incorporate our products do not achieve market acceptance, our business could be negatively impacted.
The success of our business also depends on market acceptance of new consumer products and technologies, such as smartphones, smartbooks, tablets and other similar consumer electronics devices, which contain our products. As markets for these new consumer products emerge, we may encounter new sources of competition as well as customers who have different requirements than those in the PC business. If market acceptance of such products and technologies is not attained, our ability to compete and maintain or increase revenues will be adversely affected.
Our ability to be successful in emerging consumer product markets depends in part on our ability to cultivate new industry relationships in these market segments. As the number and variety of Internet-connected devices increase, we will need to improve the functionality of our products to succeed in these new markets, which may require significant time and resources on our part to design our products which could negatively impact our business.
We sell our products to a small number of customers and our business could suffer if we lose any of these customers.
We receive a significant amount of our revenue from a limited number of customers. Aggregate sales to customers in excess of 10% of total revenue for fiscal year 2011, was 12% from one customer. Aggregate sales to customers in excess of 10% were approximately 12% of our total revenue from one customer for fiscal year 2010. Sales to our largest customers have fluctuated significantly from period to period primarily due to the timing and number of design wins with each customer, as well as the continued diversification of our customer base as we expand into new markets, and will likely continue to fluctuate dramatically in the future. Our operating results in the foreseeable future will continue to depend on sales to a relatively small number of customers, as well as the ability of these customers to sell products that incorporate our products.
In the future, these customers may decide not to purchase our products at all, purchase fewer products than they did in the past, or alter their purchasing patterns in some other way, particularly because:
|
·
|
substantially all of our sales are made on a purchase order basis, which permits our customers to cancel, change or delay product purchase commitments with little or no notice to us and without penalty;
|
|
·
|
our customers may develop their own solutions;
|
|
·
|
our customers may purchase products from our competitors; or
|
|
·
|
our customers may discontinue sales or lose market share in the markets for which they purchase our products.
|
The loss of any of our large customers or a significant reduction in sales we make to them would likely harm our financial condition and results of operations.
If we fail to appropriately scale our operations in response to changes in demand for our existing products or to the demand for new products requested by our customers, our business and profitability could be materially and adversely affected.
To achieve our business objectives, it may be necessary from time to time for us to expand or contract our operations. In the future, we may not be able to scale our workforce and operations in a sufficiently timely manner to respond effectively to changes in demand for our existing products or to the demand for new products requested by our customers. In that event, we may be unable to meet competitive challenges or exploit potential market opportunities, and our current or future business could be materially and adversely affected. Conversely, if we expand our operations and workforce too rapidly in anticipation of increased demand for our products, and such demand does not materialize at the pace at which we expected, the rate of increase in our costs and operating expenses may exceed the rate of increase in our revenue, which would adversely affect our results of operations. In addition, if such demand does not materialize at the pace which we expect, we may be required to scale down our business through expense and headcount reductions as well as facility consolidations or closures that could result in restructuring charges that would materially and adversely affect our results of operations. Because many of our expenses are fixed in the short-term or are incurred in advance of anticipated sales, we may not be able to decrease our expenses in a timely manner to offset any decrease in customer demand. If customer demand does not increase as anticipated, our profitability could be adversely affected due to our higher expense levels.
Our past growth has placed, and any future long-term growth is expected to continue to place, a significant strain on our management personnel, systems and resources. To implement our current business and product plans, we will need to continue to expand, train, manage and motivate our workforce. All of these endeavors require substantial management effort. If we are unable to effectively manage our expanding operations, we may be unable to scale our business quickly enough to meet competitive challenges or exploit potential market opportunities, or conversely, we may scale our business too quickly and the rate of increase in our costs and expenses may exceed the rate of increase in our revenue, either of which would materially and adversely affect our results of operations.
13
We depend on foundries to manufacture our products and these third parties may not be able to satisfy our manufacturing requirements, which would harm our business.
We do not manufacture the silicon wafers used for our products and do not own or operate a wafer fabrication facility. Instead, we are dependent on industry-leading foundries, such as Taiwan Semiconductor Manufacturing Company Limited, or TSMC, to manufacture our semiconductor wafers using their fabrication equipment and techniques. A substantial portion of our wafers are supplied by TSMC. The foundries, which have limited capacity, also manufacture products for other semiconductor companies, including some of our competitors. Since we do not have long-term commitment contracts with any of these foundries, they do not have an obligation to provide us with any minimum quantity of product at any time except as may be provided in a specific purchase order. Most of our products are only manufactured by one foundry at a time. In times of high demand, the foundries could choose to prioritize their capacity for other companies, reduce or eliminate deliveries to us, or increase the prices that they charge us. If we are unable to meet customer demand due to reduced or eliminated deliveries or have to increase the prices of our products, we could lose sales to customers, which would negatively impact our revenue and our reputation.
Because the lead-time needed to establish a strategic relationship with a new manufacturing partner and achieve initial production could be over a year, we do not have an alternative source of supply for our products. In addition, the time and effort to qualify a new foundry would result in additional expense, diversion of resources, and could result in lost sales, any of which would negatively impact our financial results. We believe that long-term market acceptance for our products will depend on reliable relationships with the third-party manufacturers we use to ensure adequate product supply and competitive pricing to respond to customer demand.
If our third-party foundries are not able to transition to new manufacturing process technologies or develop, obtain or successfully implement high quality, leading-edge process technologies our operating results and gross margin could be adversely affected.
We use the most advanced manufacturing process technology appropriate for our products that is available from our third-party foundries. As a result, we continuously evaluate the benefits of migrating our products to smaller geometry process technologies in order to improve performance and reduce costs. We believe this strategy will help us remain competitive. Our current product families are manufactured using 0.15 micron, 0.14 micron, 0.13 micron, 0.11 micron, 90 nanometer, 65 nanometer, 55 nanometer and 40 nanometer process technologies. Manufacturing process technologies are subject to rapid change and require significant expenditures for research and development, which could negatively impact our operating expenses and gross margin.
We have experienced difficulty in migrating to new manufacturing processes in the past and, consequently, have suffered reduced yields, delays in product deliveries and increased expense levels. We may face similar difficulties, delays and expenses as we continue to transition our new products to smaller geometry processes. Moreover, we are dependent on our third-party manufacturers to invest sufficient funds in new manufacturing processes in order to have ample capacity for all of their customers and to develop the processes in a timely manner. Our product cycles may also depend on our third-party manufacturers migrating to smaller geometry processes successfully and in time for us to meet our customer demands. Some of our competitors own their manufacturing facilities and may be able to move to a new state of the art manufacturing process more quickly or more successfully than our manufacturing partners. If our suppliers fall behind our competitors in manufacturing processes, the development and customer demand for our products and the use of our products could be negatively impacted. If we are forced to use larger geometric processes in manufacturing a product than our competition, our gross margin may be reduced. The inability by us or our third-party manufacturers to effectively and efficiently transition to new manufacturing process technologies may adversely affect our operating results and our gross margin.
We cannot be certain that our third-party foundries will be able to develop, obtain or successfully implement high quality, leading-edge process technologies needed to manufacturer our products profitably or on a timely basis or that our competitors (including those that own their own manufacturing facilities) will not develop such high quality, leading-edge process technologies earlier. If our third party-foundries experience manufacturing inefficiencies, we may fail to achieve acceptable yields or experience product delivery delays. If our third-party foundries fall behind our competitors (including those that own their own manufacturing facilities), the development and customer demand for our products and the use of our products could be negatively impacted. Additionally, we cannot be certain that our third-party foundries will manufacture our products at a price that is competitive to what our competitors pay. If our third-party foundries do not charge us a competitive price, our operating results and gross margin will be negatively impacted.
Failure to achieve expected manufacturing yields for our products could negatively impact our financial results and damage our reputation.
Manufacturing yields for our products are a function of product design, which is developed largely by us, and process technology, which typically is proprietary to the manufacturer. Low yields may result from either product design or process technology failure. We do not know a yield problem exists until our design is manufactured. When a yield issue is identified, the product is analyzed and tested to determine the cause. As a result, yield problems may not be identified until well into the production process. Resolution of yield problems requires cooperation by, and communication between, us and the manufacturer. Because of our potentially limited access to wafer foundry capacity, decreases in manufacturing yields could result in an increase in our costs and force us to allocate our available product supply among our customers. Lower than expected yields could potentially harm customer relationships, our reputation and our financial results.
14
Global economic conditions may adversely affect our business and financial results.
Our operations and performance depend significantly on worldwide economic conditions. Uncertainty about current global economic conditions poses a continuing risk to our business as consumers and businesses have postponed spending in response to tighter credit, negative financial news and/or declines in income or asset values, which have reduced the demand for our products.
Other factors that could depress demand for our products in the future include conditions in the residential real estate and mortgage markets, expectations for inflation, labor and healthcare costs, access to credit, consumer confidence, and other macroeconomic factors affecting consumer and business spending behavior. These and other economic factors have reduced demand for our products in the past and could further harm our business, financial condition and operating results.
Our business is cyclical in nature and has experienced severe downturns that have, and may in the future harm our business and financial results.
Our business is directly affected by market conditions in the highly cyclical semiconductor industry. The semiconductor industry has been adversely affected by many factors, including the global downturn, ongoing efforts by our customers to reduce their spending, diminished product demand, increased inventory levels, lower average selling prices, uncertainty regarding long-term growth rates and underlying financial health and increased competition. These factors, could, among other things, limit our ability to maintain or increase our sales or recognize revenue and in turn adversely affect our business, operating results and financial condition. If our actions to reduce our operating expenses to sufficiently offset these factors when they occur are unsuccessful, our operating results will suffer.
Our failure to estimate customer demand properly could adversely affect our financial results.
We manufacture our products based on forecasts of customer demand in order to have shorter shipment lead times and quicker delivery schedules for our customers. As a result, we may build inventories for anticipated periods of growth which do not occur or may build inventory anticipating demand for a product that does not materialize. In forecasting demand, we make multiple assumptions any of which may prove to be incorrect. Situations that may result in excess or obsolete inventory include:
|
·
|
changes in business and economic conditions, including downturns in the semiconductor industry and/or overall economy;
|
|
·
|
changes in consumer confidence caused by changes in market conditions, including changes in the credit market, expectations for inflation, and energy prices;
|
|
·
|
if there were a sudden and significant decrease in demand for our products;
|
|
·
|
if there were a higher incidence of inventory obsolescence because of rapidly changing technology and customer requirements;
|
|
·
|
if we fail to estimate customer demand properly for our older products as our newer products are introduced; or
|
|
·
|
if our competition were to take unexpected competitive pricing actions.
|
Any inability to sell products to which we have devoted resources could harm our business. In addition, cancellation or deferral of customer purchase orders could result in our holding excess inventory, which could adversely affect our gross margin and restrict our ability to fund operations. Additionally, because we often sell a substantial portion of our products in the last month of each quarter, we may not be able to reduce our inventory purchase commitments in a timely manner in response to customer cancellations or deferrals. We could be subject to excess or obsolete inventories and be required to take corresponding inventory write-downs and/or a reduction in average selling prices if growth slows or does not materialize, or if we incorrectly forecast product demand, which could negatively impact our financial results.
Conversely, if we underestimate our customers’ demand for our products, our third party manufacturing partners may not have adequate lead-time or capacity to increase production for us meaning that we may not be able to obtain sufficient inventory to fill our customers’ orders on a timely basis. Even if we are able to increase production levels to meet customer demand, we may not be able to do so in a cost effective or timely manner. Inability to fulfill our customers’ orders on a timely basis, or at all, could damage our customer relationships, result in lost revenue, cause a loss in market share, impact our customer relationships or damage our reputation, any of which could adversely impact our business.
15
Because our gross margin for any period depends on a number of factors, our failure to forecast changes in any of these factors could adversely affect our gross margin.
We are focused on improving our gross margin. Our gross margin for any period depends on a number of factors, including:
|
·
|
the mix of our products sold;
|
|
·
|
average selling prices;
|
|
·
|
introduction of new products;
|
|
·
|
product transitions;
|
|
·
|
sales discounts;
|
|
·
|
unexpected pricing actions by our competitors;
|
|
·
|
the cost of product components; and
|
|
·
|
the yield of wafers produced by the foundries that manufacture our products.
|
If we do not correctly forecast the impact of any of the relevant factors on our business, there may not be any actions we can take or we may not be able to take any possible actions in time to counteract any negative impact on our gross margin. In addition, if we are unable to meet our gross margin target for any period or the target set by analysts, the trading price of our common stock may decline.
Our revenue may fluctuate while our operating expenses are relatively fixed, which makes our results difficult to predict and could cause our results to fall short of expectations.
Demand for many of our revenue components fluctuates and is difficult to predict, and our operating expenses are relatively fixed and largely independent of revenue. Therefore, it is difficult for us to accurately forecast revenue and profits or losses in any particular period. Our operating expenses, which are comprised of research and development expenses and sales, general and administrative expenses represented 33% and 38% of our total revenue for fiscal years 2011 and 2010 respectively. Since we often recognize a substantial portion of our revenue in the last month of each quarter, we may not be able to adjust our operating expenses in a timely manner in response to any unanticipated revenue shortfalls in any quarter. Further, some of our operating expenses, like stock-based compensation expense, can only be adjusted over a longer period of time and cannot be reduced during a quarter. If we are unable to reduce operating expenses quickly in response to any revenue shortfalls, our financial results will be negatively impacted.
Any one or more of the risks discussed in this Annual Report on Form 10-K or other factors could prevent us from achieving our expected future revenue or net income. Accordingly, we believe that period-to-period comparisons of our results of operations should not be relied upon as an indication of future performance. Similarly, the results of any quarterly or full fiscal year period are not necessarily indicative of results to be expected for a subsequent quarter or a full fiscal year. As a result, it is possible that in some quarters our operating results could be below the expectations of securities analysts or investors, which could cause the trading price of our common stock to decline. We believe that our quarterly and annual results of operations may continue to be affected by a variety of factors that could harm our revenue, gross profit and results of operations.
Any difficulties in collecting accounts receivable, including from foreign customers, could harm our operating results and financial condition.
Our accounts receivable are highly concentrated and make us vulnerable to adverse changes in our customers’ businesses, and to downturns in the industry and the worldwide economy. We recorded approximately 17% of our accounts receivable balance from two customers at January 30, 2011.
Difficulties in collecting accounts receivable could materially and adversely affect our financial condition and results of operations. These difficulties are heightened during periods when economic conditions worsen. We continue to work directly with more foreign customers and it may be difficult to collect accounts receivable from them. We maintain an allowance for doubtful accounts for estimated losses resulting from the inability of our customers to make required payments. This allowance consists of an amount identified for specific customers and an amount based on overall estimated exposure. If the financial condition of our customers were to deteriorate, resulting in an impairment in their ability to make payments, additional allowances may be required, we may be required to defer revenue recognition on sales to affected customers, and we may be required to pay higher credit insurance premiums, any of which could adversely affect our operating results. In the future, we may have to record additional reserves or write-offs and/or defer revenue on certain sales transactions which could negatively impact our financial results.
We obtain credit insurance over the purchasing credit extended to certain customers. As a result of the tightening of the credit markets, we may not be able to acquire credit insurance on the credit we extend to these customers or in amounts that we deem sufficient. While we have procedures to monitor and limit exposure to credit risk on our accounts receivable, there can be no assurance such procedures will effectively limit our credit risk or avoid losses, which could harm our financial condition or operating results.
16
We may not be able to attract and retain qualified employees which could negatively impact our business.
Our future success and ability to compete is substantially dependent on our ability to identify, hire, train and retain highly qualified key personnel. The market for key employees in the technology industry can be competitive. None of our key employees is bound by an employment agreement, meaning our relationships with all of our key employees are at will. The loss of the services of any of our other key employees without an adequate replacement or our inability to hire new employees as needed could delay our product development efforts, harm our ability to sell our products or otherwise negatively impact our business.
In addition, we rely on stock-based awards as a means for recruiting, motivating and retaining highly skilled talent. If the value of such stock awards does not appreciate as measured by the performance of the price of our common stock or if our share-based compensation otherwise ceases to be viewed as a valuable benefit, our ability to attract, retain, and motivate employees could be weakened, which could harm our results of operations.
We are dependent on third parties for assembly, testing and packaging of our products, which reduce our control over the delivery schedule, product quantity or product quality.
Our products are assembled, tested and packaged by independent subcontractors, such as Advanced Semiconductor Engineering, Inc., Amkor Technology, JSI Logistics, Ltd., King Yuan Electronics Co., Siliconware Precision Industries Co. Ltd., and ChipPAC. As a result, we do not directly control our product delivery schedules, product quantity, or product quality. All of these subcontractors assemble, test and package products for other companies, including some of our competitors. Since we do not have long-term agreements with our subcontractors, when demand for subcontractors to assemble, test or package products is high, our subcontractors may decide to prioritize the orders of other customers over our orders. Since the time required to qualify a different subcontractor to assemble, test or package our products can be lengthy, if we have to find a replacement subcontractor we could experience significant delays in shipments of our products, product shortages, a decrease in the quality of our products, or an increase in product cost. Any product shortages or quality assurance problems could increase the costs of manufacture, assembly or testing of our products, which could cause our gross margin and revenue to decline.
We rely on third-party vendors to supply software development tools to us for the development of our new products and we may be unable to obtain the tools necessary to develop or enhance new or existing products.
We rely on third-party software development tools to assist us in the design, simulation and verification of new products or product enhancements. To bring new products or product enhancements to market in a timely manner, or at all, we need software development tools that are sophisticated enough or technologically advanced enough to complete our design, simulations and verifications. In the past, we have experienced delays in the introduction of products as a result of the inability of then available software development tools to fully simulate the complex features and functionalities of our products. In the future, the design requirements necessary to meet consumer demands for more features and greater functionality from our products may exceed the capabilities of available software development tools. Unavailability of software development tools may result in our missing design cycles or losing design wins, either of which could result in a loss of market share or negatively impact our operating results.
Because of the importance of software development tools to the development and enhancement of our products, a critical component of our product development efforts is our partnerships with leaders in the computer-aided design industry, including Cadence Design Systems, Inc. and Synopsys, Inc. We have invested significant resources to develop relationships with these industry leaders and have often assisted them in the definition of their new products. We believe that forming these relationships and utilizing next-generation development tools to design, simulate and verify our products will help us remain at the forefront of the 3D graphics, communications and networking segments and develop products that utilize leading-edge technology on a rapid basis. If these relationships are not successful, we may be unable to develop new products or product enhancements in a timely manner, which could result in a loss of market share, a decrease in revenue or negatively impact our operating results.
We are dependent on the personal computer market and its rate of growth in the future may have a negative impact on our business.
We derive and expect to continue to derive the majority of our revenue from the sale or license of products for use in the desktop personal computer, or PC, and notebook PC markets, including professional workstations. A reduction in sales of PCs, or a reduction in the growth rate of PC sales, may reduce demand for our products. These changes in demand could be large and sudden. Since PC manufacturers often build inventories during periods of anticipated growth, they may be left with excess inventories if growth slows or if they incorrectly forecast product transitions. In these cases, PC manufacturers may abruptly suspend substantially all purchases of additional inventory from suppliers like us until their excess inventory has been absorbed, which would have a negative impact on our financial results.
17
If our products contain significant defects our financial results could be negatively impacted, our reputation could be damaged and we could lose market share.
Our products are complex and may contain defects or experience failures due to any number of issues in design, fabrication, packaging, materials and/or use within a system. If any of our products or technologies contains a defect, compatibility issue or other error, we may have to invest additional research and development efforts to find and correct the issue. Such efforts could divert our engineers’ attention from the development of new products and technologies and could increase our operating costs and reduce our gross margin. In addition, an error or defect in new products or releases or related software drivers after commencement of commercial shipments could result in failure to achieve market acceptance or loss of design wins. Also, we may be required to reimburse customers, including our customers’ costs to repair or replace products in the field. A product recall or a significant number of product returns could be expensive, damage our reputation, could result in the shifting of business to our competitors and could result in litigation against us. Costs associated with correcting defects, errors, bugs or other issues could be significant and could materially harm our financial results. During fiscal years 2011, 2010 and 2009, we recorded net warranty charges of $466.4 million against cost of revenue to cover anticipated customer warranty, repair, return, replacement and other costs arising from a weak die/packaging material set used in certain versions of our previous generation MCP and GPU products shipped after July 2008 and used in notebook configurations. Please see the risk entitled “
We are subject to litigation arising from alleged defects in our previous generation MCP and GPU products, which if determined adversely to us, could harm our business”
for further information regarding this product defect.
We may have to invest more resources in research and development than anticipated, which could increase our operating expenses and negatively impact our operating results.
If new competitors, technological advances by existing competitors, our entry into new markets, or other competitive factors require us to invest significantly greater resources than anticipated in our research and development efforts, our operating expenses would increase. Our engineering and technical resources included 4,161full-time employees as of January 30, 2011, 3,940 employees as of January 31, 2010 and 3,772 employees as of January 25, 2009, respectively. Research and development expenditures were $848.8 million, $908.9 million and $855.9 million for the fiscal years 2011, 2010 and 2009, respectively. Research and development expenses included stock-based compensation expense of $57.9 million, $151.8 million and $98.0 million for the fiscal years 2011, 2010 and 2009, respectively. Also included in research and development expense for fiscal year 2010 is stock-based compensation of $90.5 million related to the purchase of certain outstanding options that were tendered in March 2009. If we are required to invest significantly greater resources than anticipated in research and development efforts without a corresponding increase in revenue, our operating results could decline. Research and development expenses are likely to fluctuate from time to time to the extent we make periodic incremental investments in research and development and these investments may be independent of our level of revenue which could negatively impact our financial results. In order to remain competitive, we anticipate that we will continue to devote substantial resources to research and development, and we expect these expenses to increase in absolute dollars in the foreseeable future due to the increased complexity and the greater number of products under development.
We are subject to risks associated with international operations which may harm our business.
We conduct our business worldwide. Our semiconductor wafers are manufactured, assembled, tested and packaged by third-parties located outside of the United States and other Americas. We generated 83%, 84% and 87% of our revenue for fiscal years 2011, 2010 and 2009, respectively, from sales to customers outside the United States and other Americas. As of January 30, 2011, we have offices in 16 countries outside of the United States. The manufacture, assembly, test and packaging of our products outside of the United States, operation of offices outside of the United States, and sales to customers internationally subjects us to a number of risks, including:
|
·
|
international economic and political conditions, such as political tensions between countries in which we do business;
|
|
·
|
unexpected changes in, or impositions of, legislative or regulatory requirements;
|
|
·
|
complying with a variety of foreign laws;
|
|
·
|
differing legal standards with respect to protection of intellectual property and employment practices;
|
|
·
|
cultural differences in the conduct of business;
|
|
·
|
inadequate local infrastructure that could result in business disruptions;
|
|
·
|
exporting or importing issues related to export or import restrictions, tariffs, quotas and other trade barriers and restrictions;
|
|
·
|
financial risks such as longer payment cycles, difficulty in collecting accounts receivable and fluctuations in currency exchange rates;
|
|
·
|
imposition of additional taxes and penalties; and
|
|
·
|
other factors beyond our control such as terrorism, civil unrest, war and diseases such as severe acute respiratory syndrome and the Avian flu.
|
If sales to any of our customers outside of the United States and other Americas are delayed or cancelled because of any of the above factors, our revenue may be negatively impacted.
18
Our international operations in Australia, China, Finland, France, Germany, Hong Kong, India, Japan, Korea, Russia, Singapore, Sweden, Switzerland, Taiwan, and the United Kingdom are subject to many of the above listed risks. Difficulties with our international operations, including finding appropriate staffing and office space, may divert management’s attention and other resources any of which could negatively impact our operating results.
The economic conditions in our primary overseas markets, particularly in Asia, may negatively impact the demand for our products abroad. All of our international sales to date have been denominated in United States dollars. Accordingly, an increase in the value of the United States dollar relative to foreign currencies could make our products less competitive in international markets or require us to assume the risk of denominating certain sales in foreign currencies. We anticipate that these factors will impact our business to a greater degree as we further expand our international business activities.
Conditions outside the control of our independent subcontractors and manufacturers may impact their business operations and thereby adversely interrupt our manufacturing and sales processes.
The economic, market, social, and political situations in countries where certain independent subcontractors and manufacturers are located are unpredictable, can be volatile, and can have a significant impact on our business because we may be unable to obtain or distribute product in a timely manner. Market and political conditions, including currency fluctuation, terrorism, political strife, war, labor disruption, and other factors, including climate change, natural or man-made disasters, adverse changes in tax laws, tariff, import or export quotas, power and water shortages, or interruption in air transportation, in areas where our independent subcontractors and manufacturers are located could also have a severe negative impact on our operating capabilities. For example, because we rely heavily on TSMC to produce a significant portion of our silicon wafers, earthquakes, typhoons or other natural disasters in Taiwan and Asia could limit our wafer supply and thereby harm our business, financial condition, and operational results.
We may not be able to realize the potential financial or strategic benefits of business acquisitions or strategic investments, which could hurt our ability to grow our business, develop new products or sell our products.
We have acquired and invested in other businesses that offered products, services and technologies that we believe will help expand or enhance our existing products and business. We may enter into future acquisitions of, or investments in, businesses, in order to complement or expand our current businesses or enter into a new business market. Negotiations associated with an acquisition or strategic investment could divert management’s attention and other company resources. Any of the following risks associated with past or future acquisitions or investments could impair our ability to grow our business, develop new products, our ability to sell our products, and ultimately could have a negative impact on our growth or our financial results:
|
·
|
difficulty in combining the technology, products, operations or workforce of the acquired business with our business;
|
|
·
|
difficulty in operating in a new or multiple new locations;
|
|
·
|
disruption of our ongoing businesses or the ongoing business of the company we invest in or acquire;
|
|
·
|
difficulty in realizing the potential financial or strategic benefits of the transaction;
|
|
·
|
difficulty in maintaining uniform standards, controls, procedures and policies;
|
|
·
|
disruption of or delays in ongoing research and development efforts;
|
|
·
|
diversion of capital and other resources;
|
|
·
|
assumption of liabilities;
|
|
·
|
diversion of resources and unanticipated expenses resulting from litigation arising from potential or actual business acquisitions or investments;
|
|
·
|
difficulties in entering into new markets in which we have limited or no experience and where competitors in such markets have stronger positions; and
|
|
·
|
impairment of relationships with employees and customers, or the loss of any of our key employees or customers our target’s key employees or customers, as a result of our acquisition or investment.
|
In addition, the consideration for any future acquisition could be paid in cash, shares of our common stock, the issuance of convertible debt securities or a combination of cash, convertible debt and common stock. If we make an investment in cash or use cash to pay for all or a portion of an acquisition, our cash reserves would be reduced which could negatively impact the growth of our business or our ability to develop new products. However, if we pay the consideration with shares of common stock, or convertible debentures, the holdings of our existing stockholders would be diluted. The significant decline in the trading price of our common stock would make the dilution to our stockholders more extreme and could negatively impact our ability to pay the consideration with shares of common stock or convertible debentures. We cannot forecast the number, timing or size of future strategic investments or acquisitions, or the effect that any such investments or acquisitions might have on our operations or financial results.
19
Our investment portfolio may become impaired by deterioration of the capital markets.
Our cash equivalent and short-term investment portfolio as of January 30, 2011 consisted of cash and cash equivalents, commercial paper, mortgage-backed securities issued by Government-sponsored enterprises, money market funds and debt securities of corporations, municipalities and the United States government and its agencies. We follow an established investment policy and set of guidelines, designed to preserve principal, minimize risk, monitor and help mitigate our exposure to interest rate and credit risk. The policy sets forth credit quality standards and limits our exposure to any one issuer, as well as our maximum exposure to various asset classes, variety of financial instruments, consisting principally of cash and cash equivalents, commercial paper, mortgage-backed securities issued by Government-sponsored enterprises, money market funds and debt securities of corporations, municipalities and the United States government and its agencies.
Should financial market conditions worsen in the future, investments in some financial instruments may pose risks arising from market liquidity and credit concerns. In addition, any deterioration of the capital markets could cause our other income and expense to vary from expectations. As of January 30, 2011, we had no material impairment charges associated with our short-term investment portfolio, and although we believe our current investment portfolio has very little risk of material impairment, we cannot predict future market conditions or market liquidity, or credit availability, and can provide no assurance that our investment portfolio will remain materially unimpaired.
Risks Related to Regulatory, Legal, Our Common Stock and Other Matters
We are subject to litigation arising from alleged defects in our previous generation MCP and GPU products, which if determined adversely to us, could harm our business.
During fiscal years 2011, 2010 and 2009 we recorded cumulative net warranty charges of $475.9 million, of which $466.4 million has been charged against cost of revenue, to cover anticipated customer warranty, repair, return, replacement and other costs arising from a weak die/packaging material set used in certain versions of our previous generation MCP and GPU products shipped after July 2008 and used in notebook configurations. The previous generation MCP and GPU products that are impacted were included in a number of notebook products that were shipped and sold in significant quantities. Certain notebook configurations of these MCP and GPU products are failing in the field at higher than normal rates. Testing suggests a weak material set of die/package combination, system thermal management designs, and customer use patterns are contributing factors for these failures. We have worked with our customers to develop and have made available for download a software driver to cause the system fan to begin operation at the powering up of the system and reduce the thermal stress on these chips. We have also recommended to our customers that they consider changing the thermal management of the products in their notebook system designs. We intend to fully support our customers in their repair and replacement of these impacted products that fail, and their other efforts to mitigate the consequences of these failures.
We continue to not see any abnormal failure rates in any systems using NVIDIA products other than certain notebook configurations. However, we are continuing to test and otherwise investigate other products. There can be no assurance that we will not discover defects in other products.
In September, October and November 2008, several putative securities class action lawsuits were filed against us, asserting various claims related to the impacted MCP and GPU products. Such lawsuits could result in the diversion of management’s time and attention away from business operations, which could harm our business. In addition, the costs of defense and any damages resulting from this litigation, a ruling against us, or a settlement of the litigation could adversely affect our cash flow and financial results.
We are a party to other litigation, including patent litigation, which, if determined adversely to us, could adversely affect our cash flow and financial results.
We are a party to other litigation as both a defendant and as a plaintiff. For example, we are engaged in litigation with Rambus Inc. and with parties related to our acquisition of 3dfx in 2001. Please refer to Note 13 of these Notes to the Consolidated Financial Statements in Part IV, Item 15 of this Form 10-K for further detail on these lawsuits. There can be no assurance that any litigation to which we are a party will be resolved in our favor. Any claim that is successfully decided against us may cause us to pay substantial damages, including punitive damages, and other related fees or prevent us from selling or importing certain of our products. Regardless of whether lawsuits are resolved in our favor or if we are the plaintiff or the defendant in the litigation, any lawsuits to which we are a party will likely be expensive and time consuming to defend or resolve. Such lawsuits could also harm our relationships with existing customers and result in the diversion of management’s time and attention away from business operations, which could harm our business. Costs of defense and any damages resulting from litigation, a ruling against us, or a settlement of the litigation could adversely affect our cash flow and financial results.
20
Changes in United States tax legislation regarding our foreign earnings could materially impact our business.
Currently, a majority of our revenue is generated from customers located outside the United States, and a significant portion of our assets, including employees, are located outside the United States. United States income taxes and foreign withholding taxes have not been provided on undistributed earnings for certain non-United States subsidiaries, because such earnings are intended to be indefinitely reinvested in the operations of those subsidiaries. Throughout the period of President Obama’s administration and as recently as on February 14, 2011 with the release of the administration’s fiscal year 2012 budget, the White House has proposed various international tax legislation, some of which, if enacted into law would substantially reduce our ability to defer United States taxes on such indefinitely reinvested non-United States earnings, eliminate certain tax deductions until foreign earnings are repatriated to the United States and/or otherwise cause the total tax cost of U.S. multinational corporations to increase. If these or similar proposals are constituted into legislation in the current or future year(s), they could have a negative impact on our financial position and results of operations.
Our operating results may be adversely affected if we are subject to unexpected tax liabilities.
We are subject to taxation by a number of taxing authorities both in the United States and throughout the world. Tax rates vary among the jurisdictions in which we operate. Significant judgment is required in determining our provision for our income taxes as there are many transactions and calculations where the ultimate tax determination is uncertain. Although we believe our tax estimates are reasonable, any of the below could cause our effective tax rate to be materially different than that which is reflected in historical income tax provisions and accruals:
|
●
|
the jurisdictions in which profits are determined to be earned and taxed;
|
|
●
|
adjustments to estimated taxes upon finalization of various tax returns;
|
|
●
|
changes in available tax credits;
|
|
●
|
changes in share-based compensation expense;
|
|
●
|
changes in tax laws, the interpretation of tax laws either in the United States or abroad or the issuance of new interpretative accounting guidance related to uncertain transactions and calculations where the tax treatment was previously uncertain; and
|
|
●
|
the resolution of issues arising from tax audits with various tax authorities.
|
Should additional taxes be assessed as a result of any of the above, our operating results could be adversely affected. In addition, our future effective tax rate could be adversely affected by changes in the mix of earnings in countries with differing statutory tax rates, changes in tax laws or changes in the interpretation of tax laws.
Litigation to defend against alleged infringement of intellectual property rights or to enforce our intellectual property rights and the outcome of such litigation could result in substantial costs to us.
We expect that as the number of issued hardware and software patents increases and as competition intensifies, the volume of intellectual property infringement claims and lawsuits may increase. We may in the future become involved in lawsuits or other legal proceedings alleging patent infringement or other intellectual property rights violations by us or by our customers that we have agreed to indemnify them for certain claims of infringement.
An unfavorable ruling in any such intellectual property related litigation could include significant damages, invalidation of a patent or family of patents, indemnification of customers, payment of lost profits, or, when it has been sought, injunctive relief.
In addition, in the future, we may need to commence litigation or other legal proceedings in order to:
|
●
|
assert claims of infringement of our intellectual property;
|
|
●
|
enforce our patents;
|
|
●
|
protect our trade secrets or know-how; or
|
|
●
|
determine the enforceability, scope and validity of the propriety rights of others.
|
If we have to initiate litigation in order to protect our intellectual property, our operating expenses may increase which could negatively impact our operating results. Our failure to effectively protect our intellectual property could harm our business.
If infringement claims are made against us or our products are found to infringe a third parties’ patent or intellectual property, we or one of our indemnified customers may have to seek a license to the third parties’ patent or other intellectual property rights. However, we may not be able to obtain licenses at all or on terms acceptable to us particularly from our competitors. If we or one of our indemnified customers is unable to obtain a license from a third party for technology that we use or that is used in one of our products, we could be subject to substantial liabilities or have to suspend or discontinue the manufacture and sale of one or more of our products. We may also have to make royalty or other payments, or cross license our technology. If these arrangements are not concluded on commercially reasonable terms, our business could be negatively impacted. Furthermore, the indemnification of a customer may increase our operating expenses which could negatively impact our operating results.
21
Our ability to compete will be harmed if we are unable to adequately protect our intellectual property.
We rely primarily on a combination of patents, trademarks, trade secrets, employee and third-party nondisclosure agreements, and licensing arrangements to protect our intellectual property in the United States and internationally. We have numerous patents issued, allowed and pending in the United States and in foreign jurisdictions. Our patents and pending patent applications primarily relate to our products and the technology used in connection with our products. We also rely on international treaties, organizations and foreign laws to protect our intellectual property. The laws of certain foreign countries in which our products are or may be manufactured or sold, including various countries in Asia, may not protect our products or intellectual property rights to the same extent as the laws of the United States. This makes the possibility of piracy of our technology and products more likely. We continuously assess whether and where to seek formal protection for particular innovations and technologies based on such factors as:
|
·
|
the commercial significance of our operations and our competitors’ operations in particular countries and regions;
|
|
·
|
the location in which our products are manufactured;
|
|
·
|
our strategic technology or product directions in different countries; and
|
|
·
|
the degree to which intellectual property laws exist and are meaningfully enforced in different jurisdictions.
|
Our pending patent applications and any future applications may not be approved. In addition, any issued patents may not provide us with competitive advantages or may be challenged by third parties. The enforcement of patents by others may harm our ability to conduct our business. Others may independently develop substantially equivalent intellectual property or otherwise gain access to our trade secrets or intellectual property. Our failure to effectively protect our intellectual property could harm our business.
Government investigations and inquiries from regulatory agencies could lead to enforcement actions, fines or other penalties and could result in litigation against us.
In the past, we have been subject to government investigations and inquiries from regulatory agencies such as the Department of Justice and the SEC. We may be subject to government investigations and receive additional inquiries from regulatory agencies in the future, which may lead to enforcement actions, fines or other penalties.
In addition, litigation has often been brought against a company in connection with the announcement of a government investigation or inquiry from a regulatory agency. Such lawsuits could result in the diversion of management’s time and attention away from business operations, which could harm our business. In addition, the costs of defense and any damages resulting from litigation, a ruling against us, or a settlement of the litigation could adversely affect our cash flow and financial results.
We are subject to the risks of owning real property.
During fiscal year 2009, we purchased real property in Santa Clara, California that includes approximately 25 acres of land and ten commercial buildings. We also own real property in China and India. We have limited experience in the ownership and management of real property and are subject to the risks of owning real property, including:
|
·
|
the possibility of environmental contamination and the costs associated with mitigating any environmental problems;
|
|
·
|
adverse changes in the value of these properties, due to interest rate changes, changes in the market in which the property is located, or other factors;
|
|
·
|
the risk of loss if we decide to sell and are not able to recover all capitalized costs;
|
|
·
|
increased cash commitments for the possible construction of a campus;
|
|
·
|
the possible need for structural improvements in order to comply with zoning, seismic and other legal or regulatory requirements;
|
|
·
|
increased operating expenses for the buildings or the property or both;
|
|
·
|
possible disputes with third parties, such as neighboring owners or others, related to the buildings or the property or both; and
|
|
·
|
the risk of financial loss in excess of amounts covered by insurance, or uninsured risks, such as the loss caused by damage to the buildings as a result of earthquakes, floods and or other natural disasters.
|
22
Expensing employee equity compensation adversely affects our operating results and could also adversely affect our competitive position.
Since inception, we have used equity through our equity incentive plans and our employee stock purchase program as a fundamental component of our compensation packages. We believe that these programs directly motivate our employees and, through the use of vesting, encourage our employees to remain with us.
We record compensation expense for stock options, restricted stock units and our employee stock purchase plan using the fair value of those awards in accordance with generally accepted accounting principles in United States of America, or U.S. GAAP. Stock-based compensation expense was $100.4 million, $107.1 million and $162.7 million for the fiscal years 2011, 2010 and 2009, respectively, related to on-going vesting of equity awards, which negatively impacted our operating results. Additionally, in March 2009, we completed a cash tender offer to purchase certain employee stock options. A total of 28.5 million options were tendered under the offer for an aggregate cash purchase price of $78.1 million, in exchange for the cancellation of the eligible options. As a result of the tender offer, we incurred a charge of $140.2 million consisting of the remaining unamortized stock based compensation expense associated with the unvested portion of the options tendered in the offer, stock-based compensation expense resulting from amounts paid in excess of the fair value of the underlying options, plus associated payroll taxes and professional fees. We believe that expensing employee equity compensation will continue to negatively impact our operating results.
To the extent that expensing employee equity compensation makes it more expensive to grant stock options and restricted stock units or to continue to have an employee stock purchase program, we may decide to incur increased cash compensation costs. In addition, actions that we may take to reduce stock-based compensation expense that may be more severe than any actions our competitors may implement and may make it difficult to attract retain and motivate employees, which could adversely affect our competitive position as well as our business and operating results.
We may be required to record a charge to earnings if our goodwill or amortizable intangible assets become impaired, which could negatively impact our operating results.
Under U.S. GAAP, we review our amortizable intangible assets and goodwill for impairment when events or changes in circumstances indicate the carrying value may not be recoverable. Goodwill is tested for impairment at least annually. The carrying value of our goodwill or amortizable assets from acquisitions may not be recoverable due to factors such as a decline in stock price and market capitalization, reduced estimates of future cash flows and slower growth rates in our industry or in any of our business units. Estimates of future cash flows are based on an updated long-term financial outlook of our operations. However, actual performance in the near-term or long-term could be materially different from these forecasts, which could impact future estimates. For example, if one of our business units does not meet its near-term and longer-term forecasts, the goodwill assigned to the business unit could be impaired. We may be required to record a charge to earnings in our financial statements during a period in which an impairment of our goodwill or amortizable intangible assets is determined to exist, which may negatively impact our results of operations.
Our stock price continues to be volatile and investors may suffer losses.
Our stock has at times experienced substantial price volatility as a result of variations between our actual and anticipated financial results, announcements by us and our competitors, or uncertainty about current global economic conditions. The stock market as a whole also has experienced extreme price and volume fluctuations that have affected the market price of many technology companies in ways that may have been unrelated to these companies’ operating performance.
In the past, securities class action litigation has often been brought against a company following periods of volatility in the market price of its securities. For example, following our announcement in July 2008 that we would take a charge against cost of revenue to cover anticipated costs and expenses arising from a weak die/packaging material set in certain versions of our previous generation MCP and GPU products and that we were revising financial guidance for our second fiscal quarter of 2009, the trading price of our common stock declined. In September, October and November 2008, several putative class action lawsuits were filed against us relating to this announcement. Please refer to Note 13 of these Notes to the Consolidated Financial Statements in Part IV, Item 15 of this Form 10-K for further information regarding these lawsuits. Due to changes in the potential volatility of our stock price, we may be the target of securities litigation in the future. Such lawsuits could result in the diversion of management’s time and attention away from business operations, which could harm our business. In addition, the costs of defense and any damages resulting from litigation, a ruling against us, or a settlement of the litigation could adversely affect our cash flow and financial results.
23
Our failure to comply with any applicable environmental regulations could result in a range of consequences, including fines, suspension of production, excess inventory, sales limitations, and criminal and civil liabilities.
We are subject to various state, federal and international laws and regulations governing the environment, including restricting the presence of certain substances in electronic products and making producers of those products financially responsible for the collection, treatment, recycling and disposal of those products. Although our management systems are designed to maintain compliance, we cannot assure you that we have been or will be at all times in complete compliance with such laws and regulations. If we violate or fail to comply with any of them, a range of consequences could result, including fines, import/export restrictions, sales limitations, criminal and civil liabilities or other sanctions. We could also be held liable for any and all consequences arising out of exposure to hazardous materials used, stored, released, disposed of by us or located at, under or emanating from our facilities or other environmental or natural resource damage.
Environmental laws are complex, change frequently and have tended to become more stringent over time. For example, the European Union and China are two among a growing number of jurisdictions that have enacted in recent years restrictions on the use of lead, among other chemicals, in electronic products. These regulations affect semiconductor packaging. There is a risk that the cost, quality and manufacturing yields of lead-free products may be less favorable compared to lead-based products or that the transition to lead-free products may produce sudden changes in demand, which may result in excess inventory.
There is also a movement to improve the transparency and accountability concerning the supply of minerals coming from the conflict zones of the Democratic Republic of Congo. New U.S. legislation includes disclosure requirements regarding the use of “conflict” minerals mined from the Democratic Republic of Congo and adjoining countries and procedures regarding a manufacturer’s efforts to prevent the sourcing of such “conflict” minerals. The implementation of these requirements could affect the sourcing and availability of minerals used in the manufacture of semiconductor devices. As a result, there may only be a limited pool of suppliers who provide conflict free metals, and we cannot assure you that we will be able to obtain products in sufficient quantities or at competitive prices. Also, since our supply chain is complex, we may face reputational challenges with our customers and other stockholders if we are unable to sufficiently verify the origins for all metals used in our products.
Future environmental legal requirements may become more stringent or costly and our compliance costs and potential liabilities arising from past and future releases of, or exposure to, hazardous substances may harm our business and our reputation.
While we believe that we have adequate internal control over financial reporting, if we or our independent registered public accounting firm determines that we do not, our reputation may be adversely affected and our stock price may decline.
Section 404 of the Sarbanes-Oxley Act of 2002 requires our management to report on, and our independent registered public accounting firm to audit, the effectiveness of our internal control structure and procedures for financial reporting. We have an ongoing program to perform the system and process evaluation and testing necessary to comply with these requirements. However, the manner in which companies and their independent public accounting firms apply these requirements and test companies’ internal controls remains subject to some judgment. To date, we have incurred, and we expect to continue to incur, increased expense and to devote additional management resources to Section 404 compliance. Despite our efforts, if we identify a material weakness in our internal controls, there can be no assurance that we will be able to remediate that material weakness in a timely manner, or that we will be able to maintain all of the controls necessary to determine that our internal control over financial reporting is effective. In the event that our chief executive officer, chief financial officer or our independent registered public accounting firm determine that our internal control over financial reporting is not effective as defined under Section 404, investor perceptions of us may be adversely affected and could cause a decline in the market price of our stock.
Changes in financial accounting standards or interpretations of existing standards could affect our reported results of operations
.
We prepare our consolidated financial statements in conformity with U.S GAAP. These principles are constantly subject to review and interpretation by the SEC and various bodies formed to interpret and create appropriate accounting principles. A change in these principles can have a significant effect on our reported results and may even retroactively affect previously reported transactions. Additionally, changes in existing accounting rules or practices, including the possible conversion to unified international accounting standards, could have a significant adverse effect on our results of operations or the manner in which we conduct our business.
Provisions in our certificate of incorporation, our bylaws and our agreement with Microsoft could delay or prevent a change in control.
Our certificate of incorporation and bylaws contain provisions that could make it more difficult for a third party to acquire a majority of our outstanding voting stock. These provisions include the following:
|
·
|
the ability of our Board to create and issue preferred stock without prior stockholder approval;
|
|
·
|
the prohibition of stockholder action by written consent;
|
|
·
|
a classified Board; and
|
|
·
|
advance notice requirements for director nominations and stockholder proposals.
|
On March 5, 2000, we entered into an agreement with Microsoft in which we agreed to develop and sell graphics chips and to license certain technology to Microsoft and its licensees for use in the Xbox. Under the agreement, if an individual or corporation makes an offer to purchase shares equal to or greater than 30% of the outstanding shares of our common stock, Microsoft may have first and last rights of refusal to purchase the stock. The Microsoft provision and the other factors listed above could also delay or prevent a change in control of NVIDIA.
24
Not applicable.
Our headquarters complex is located in Santa Clara, California. During fiscal year 2009, we purchased property that includes approximately 25 acres of land and ten commercial buildings in Santa Clara, California for approximately $194.8 million. Our original plans for the purchased property included constructing a new campus on the site. We are currently re-evaluating those plans. Additionally, our corporate campus is comprised of eight other leased buildings with six used primarily as office buildings, one used primarily as warehouse space, and the other remaining used primarily as lab space. We also entered into a lease for data center space in Santa Clara in fiscal year 2009.
Outside of Santa Clara, we lease space in Marina Del Rey and San Francisco, California; Austin, Texas; Beaverton, Oregon; Bedford and Marion, Massachusetts; Bellevue and Bothell, Washington; Madison, Alabama; Durham, North Carolina; Greenville, South Carolina; Salt Lake City, Utah; St. Louis, Missouri; Fort Collins and Boulder, Colorado; and Charlottesville, VA. These facilities are used as design centers and/or sales and administrative offices.
Outside of the United States, we lease space in HsinChu City, Taiwan; Tokyo, Japan; Seoul, Korea; Beijing, China; Shatin, Hong Kong; Mumbai, India; Courbevoie, France; Moscow, Russia; Berlin and Munich, Germany; Helsinki, Finland; Theale and London, United Kingdom; Melbourne, Australia; Singapore; Uppsala, Sweden; and Zurich, Switzerland. These facilities are used primarily to support our customers and operations and as sales and administrative offices. We also lease spaces in Wuerselen, Germany; Shenzhen, China; Taipei City, Taiwan; and Bangalore and Pune, India, which are used primarily as design centers. Additionally, we own buildings in Hyderabad, India and Shanghai, China which are being used primarily as research and development centers.
We believe that we currently have sufficient facilities to conduct our operations for the next twelve months, although we expect to lease additional facilities throughout the world as our business requires. For additional information regarding obligations under leases, see Note 13 of the Notes to the Consolidated Financial Statements in Part IV, Item 15 of this Form 10-K under the subheading “Lease Obligations,” which information is hereby incorporated by reference.
25
3dfx
On December 15, 2000, NVIDIA and one of our indirect subsidiaries entered into an Asset Purchase Agreement, or APA, to purchase certain graphics chip assets from 3dfx. The transaction closed on April 18, 2001. That acquisition, and 3dfx’s October 2002 bankruptcy filing, led to four lawsuits against NVIDIA: two brought by 3dfx’s former landlords, one by 3dfx’s bankruptcy trustee and the fourth by a committee of 3dfx’s equity security holders in the bankruptcy estate. As of the date of the filing of this Annual Report on Form 10-K, the two landlord cases have been settled with payments from the landlords to NVIDIA, and the equity security holders lawsuit was dismissed with prejudice and no appeal was filed. Accordingly, only the bankruptcy trustee suit remains outstanding as more fully explained below.
In March 2003, the Trustee appointed by the Bankruptcy Court to represent 3dfx’s bankruptcy estate served a complaint on NVIDIA asserting claims for, among other things, successor liability and fraudulent transfer and seeking additional payments from us. The Trustee’s fraudulent transfer theory alleged that NVIDIA had failed to pay reasonably equivalent value for 3dfx’s assets, and sought recovery of the difference between the $70 million paid and the alleged fair value, which the Trustee estimated to exceed $50 million. The Trustee’s successor liability theory alleged NVIDIA was effectively 3dfx’s legal successor and therefore was responsible for all of 3dfx’s unpaid liabilities.
On October 13, 2005, the Bankruptcy Court heard the Trustee’s motion for summary adjudication, and on December 23, 2005, denied that motion in all material respects and held that NVIDIA may not dispute that the value of the 3dfx transaction was less than $108 million. The Bankruptcy Court denied the Trustee’s request to find that the value of the 3dfx assets conveyed to NVIDIA was at least $108 million.
In early November 2005, after several months of mediation, NVIDIA and the Official Committee of Unsecured Creditors, or the Creditors’ Committee, agreed to a Plan of Liquidation of 3dfx, which included a conditional settlement of the Trustee’s claims against us. This conditional settlement was subject to a confirmation process through a vote of creditors and the review and approval of the Bankruptcy Court. The conditional settlement called for a payment by NVIDIA of approximately $30.6 million to the 3dfx estate. Under the settlement, $5.6 million related to various administrative expenses and Trustee fees, and $25.0 million related to the satisfaction of debts and liabilities owed to the general unsecured creditors of 3dfx. Accordingly, during the three month period ended October 30, 2005, we recorded $5.6 million as a charge to settlement costs and $25.0 million as additional purchase price for 3dfx. The Trustee advised that he intended to object to the settlement. The conditional settlement never progressed substantially through the confirmation process.
On December 21, 2006, the Bankruptcy Court scheduled a trial for one portion of the Trustee’s case against NVIDIA. On January 2, 2007, NVIDIA terminated the settlement agreement on grounds that the Bankruptcy Court had failed to proceed toward confirmation of the Creditors’ Committee’s plan. A non-jury trial began on March 21, 2007 on valuation issues in the Trustee’s constructive fraudulent transfer claims against NVIDIA. Specifically, the Bankruptcy Court tried four questions: (1) what did 3dfx transfer to NVIDIA in the APA; (2) of what was transferred, what qualifies as “property” subject to the Bankruptcy Court’s avoidance powers under the Uniform Fraudulent Transfer Act and relevant bankruptcy code provisions; (3) what is the fair market value of the “property” identified in answer to question (2); and (4) was the $70 million that NVIDIA paid “reasonably equivalent” to the fair market value of that property. The parties completed post-trial briefing on May 25, 2007.
On April 30, 2008, the Bankruptcy Court issued its Memorandum Decision After Trial, in which it provided a detailed summary of the trial proceedings and the parties’ contentions and evidence and concluded that “the creditors of 3dfx were not injured by the Transaction.” This decision did not entirely dispose of the Trustee’s action, however, as the Trustee’s claims for successor liability and intentional fraudulent conveyance were still pending. On June 19, 2008, NVIDIA filed a motion for summary judgment to convert the Memorandum Decision After Trial to a final judgment. That motion was granted in its entirety and judgment was entered in NVIDIA’s favor on September 11, 2008. The Trustee filed a Notice of Appeal from that judgment on September 22, 2008, and on September 25, 2008, NVIDIA exercised its election to have the appeal heard by the United States District Court.
The District Court’s hearing on the Trustee’s appeal was held on June 10, 2009. On December 20, 2010, the District Court issued an Order affirming the Bankruptcy Court’s entry of summary judgment in NVIDIA’s favor. On January 19, 2011, the Trustee filed a Notice of Appeal to the United States Court of Appeals for the Ninth Circuit.
While the conditional settlement reached in November 2005 never progressed through the confirmation process, the Trustee’s case still remains pending on appeal. Accordingly, we have not reversed the accrual of $30.6 million – $5.6 million as a charge to settlement costs and $25.0 million as additional purchase price for 3dfx – that we recorded during the three months ended October 30, 2005, pending resolution of the appeal of the Trustee’s case.
26
Rambus Inc.
On July 10, 2008, Rambus filed suit against NVIDIA, asserting patent infringement of 17 patents claimed to be owned by Rambus. Rambus seeks damages, enhanced damages and injunctive relief. The lawsuit was filed in the Northern District of California in San Jose, California. On July 11, 2008, NVIDIA filed suit against Rambus in the Middle District of North Carolina asserting numerous claims, including antitrust and other claims. NVIDIA seeks damages, enhanced damages and injunctive relief. Rambus has since dropped two patents from its lawsuit in the Northern District of California. The two cases have been consolidated into a single proceeding in the San Francisco division of the Northern District of California. On April 13, 2009, the Court issued an order staying motion practice and allowing only certain document discovery to proceed. On February 11, 2011, the Court lifted the stay and ordered that discovery on other issues may now proceed. A case management conference is currently scheduled for June 3, 2011.
On November 6, 2008, Rambus filed a complaint alleging a violation of 19 U.S.C. Section 1337 based on a claim of patent infringement of nine Rambus patents against NVIDIA and 14 other respondents with the U.S. International Trade Commission, or ITC. Rambus has subsequently withdrawn four of the nine patents at issue. The complaint sought an exclusion order barring the importation of products that allegedly infringe the now five Rambus patents. The ITC instituted the investigation and a hearing was held October 13-20, 2009. The Administrative Law Judge issued an Initial Determination on January 22, 2010, which found the asserted claims of two patents in one patent family infringed but invalid, and the asserted claims of three patents in a separate patent family, valid, infringed and enforceable. This decision was reviewed by the ITC. The ITC issued a Final Decision on July 26, 2010. In its Final Decision, the ITC found that NVIDIA infringed three related patents and issued a limited exclusion order prohibiting import of certain NVIDIA products. NVIDIA is appealing certain aspects of the ruling that were unfavorable to NVIDIA. Rambus is also appealing certain aspects of the ruling that were unfavorable to Rambus.
NVIDIA also sought reexamination of the patents asserted in the ITC, as well as other patents, in the United States Patent and Trademark Office, or USPTO. Proceedings are underway with respect to all challenged patents. With respect to the claims asserted in the ITC, the USPTO has issued a preliminary ruling invalidating many of the claims. The USPTO has issued Right to Appeal Notices for the three patents found by the administrative law judge to be valid, enforceable and infringed. In the Right to Appeal Notices, the USPTO Examiner has cancelled all asserted claims of one of the patents and allowed the asserted claims on the other two patents. Rambus and NVIDIA are both seeking review of the USPTO Examiner's adverse findings. NVIDIA intends to pursue its offensive and defensive cases vigorously in both actions.
Rambus has also been subject to an investigation in the European Union. NVIDIA was not a party to that investigation, but has recently sought to intervene in the appeal of the investigation. As a result of Rambus’ commitments to resolve that investigation, for a period of five years from the date of the resolution, Rambus must now provide a license to memory controller manufacturers, sellers, and/or companies that integrate memory controllers into other products. The license terms are set forth in a license made available on Rambus’ website, or the Required Rambus License. On August 12, 2010, we entered into the Required Rambus License. Pursuant to the agreement, Rambus charges a royalty of (i) one percent of the net sales price per unit for certain memory controllers and (ii) two percent of the net sales price per unit for certain other memory controllers, provided that the maximum average net sales price per unit for these royalty bearing products shall be deemed not to exceed a maximum of $20. The agreement has a term until December 9, 2014. However, NVIDIA may terminate the agreement on or after August 12, 2011 with thirty 30 days prior written notice to Rambus.
On December 1, 2010, Rambus filed a new lawsuit against NVIDIA and several other companies alleging six claims for patent infringement. This lawsuit is pending in the Northern District of California and seeks damages, enhanced damages and injunctive relief. On the same day, Rambus filed a complaint with the ITC alleging that NVIDIA and several other companies violated 19 U.S.C. Section 1337 based on a claim of patent infringement of three Rambus patents. Rambus seeks exclusion of certain NVIDIA products from importation into the United States. The Northern District of California has stayed the case pending resolution of the ITC investigation. The asserted patents are related to each other, and the three patents in the ITC complaint are also at issue in the lawsuit pending in the Northern District of California. Many of the patents at issue in the new lawsuits are also being challenged in Rambus’ other disputes with NVIDIA. NVIDIA intends to vigorously defend these new lawsuits.
27
Product Defect Litigation and Securities Cases
Product Defect Litigation
In September, October and November 2008, several putative consumer class action lawsuits were filed against us, asserting various claims arising from a weak die/packaging material set in certain versions of our previous generation products used in notebook configurations. Most of the lawsuits were filed in Federal Court in the Northern District of California, but three were filed in state court in California, in Federal Court in New York and in Federal Court in Texas. Those three actions have since been removed or transferred to the United States District Court for the Northern District of California, San Jose Division, where all of the actions now are currently pending. The various lawsuits are titled Nakash v. NVIDIA Corp., Feinstein v. NVIDIA Corp., Inicom Networks, Inc. v. NVIDIA Corp. and Dell, Inc. and Hewlett Packard, Olivos v. NVIDIA Corp., Dell, Inc. and Hewlett Packard, Sielicki v. NVIDIA Corp. and Dell, Inc., Cormier v. NVIDIA Corp., National Business Officers Association, Inc. v. NVIDIA Corp., and West v. NVIDIA Corp. The First Amended Complaint was filed on October 27, 2008, which no longer asserted claims against Dell, Inc. The various complaints assert claims for, among other things, breach of warranty, violations of the Consumer Legal Remedies Act, Business & Professions Code sections 17200 and 17500 and other consumer protection statutes under the laws of various jurisdictions, unjust enrichment and strict liability.
The District Court has entered orders deeming all of the above cases related under the relevant local rules. On December 11, 2008, NVIDIA filed a motion to consolidate all of the aforementioned consumer class action cases. On February 26, 2009, the District Court consolidated the cases, as well as two other cases pending against Hewlett Packard, under the caption “The NVIDIA GPU Litigation” and ordered the plaintiffs to file lead counsel motions by March 2, 2009. On March 2, 2009, several of the parties filed motions for appointment of lead counsel and briefs addressing certain related issues. On April 10, 2009, the District Court appointed Milberg LLP lead counsel. On May 6, 2009, the plaintiffs filed an Amended Consolidated Complaint, alleging claims for violations of California Business and Professions Code Section 17200, Breach of Implied Warranty under California Civil Code Section 1792, Breach of the Implied Warranty of Merchantability under the laws of 27 other states, Breach of Warranty under the Magnuson-Moss Warranty Act, Unjust Enrichment, violations of the New Jersey Consumer Fraud Act, Strict Liability and Negligence, and violation of California’s Consumer Legal Remedies Act.
On August 19, 2009, we filed a motion to dismiss the Amended Consolidated Complaint, and the Court heard arguments on that motion on October 19, 2009. On November 19, 2009, the Court issued an order dismissing with prejudice plaintiffs causes of action for Breach of the Implied Warranty under the laws of 27 other states and unjust enrichment, dismissing with leave to amend plaintiffs’ causes of action for Breach of Implied Warranty under California Civil Code Section 1792 and Breach of Warranty under the Magnuson-Moss Warranty Act, and denying NVIDIA’s motion to dismiss as to the other causes of action. The Court gave plaintiffs until December 14, 2009 to file an amended complaint. On December 14, 2009, plaintiffs filed a Second Amended Consolidated Complaint, asserting claims for violations of California Business and Professions Code Section 17200, Breach of Implied Warranty under California Civil Code Section 1792, Breach of Warranty under the Magnuson-Moss Warranty Act, violations of the New Jersey Consumer Fraud Act, Strict Liability and Negligence, and violation of California’s Consumer Legal Remedies Act. The Second Amended Complaint seeks unspecified damages. On January 19, 2010, we filed a motion to dismiss the Breach of Implied Warranty under California Civil Code Section 1792, Breach of Warranty under the Magnuson-Moss Warranty Act, and California’s Consumer Legal Remedies Act claims in the Second Amended Consolidated Complaint. In addition, on April 1, 2010, Plaintiffs filed a motion to certify a class consisting of all people who purchased computers containing certain of our MCP and GPU products. On May 3, 2010, we filed an opposition to Plaintiffs’ motion for class certification. A hearing on both motions was held on June 14, 2010. On July 16, 2010, the parties filed a stipulation with the District Court advising that, following mediation, they had reached a settlement in principle in The NVIDIA GPU Litigation. The settlement in principle was subject to certain approvals, including final approval by the court. As a result of the settlement in principle, and the other estimated settlement and offsetting insurance reimbursements, NVIDIA recorded a net charge of $12.7 million to sales, general and administrative expense during the second quarter of fiscal year 2011. In addition, a portion of the $181.2 million of additional charges we recorded against cost of revenue related to the weak die/packaging set during the second quarter of fiscal year 2011 relates to estimated additional repair and replacement costs related to the implementation of these settlements. On August 12, 2010, the parties executed a Stipulation and Agreement of Settlement and Release. On September 15, 2010, the Court issued an order granting preliminary approval of the settlement and providing for notice to the potential class members. The Final Approval Hearing was held on December 20, 2010, and on that same day the Court approved the settlement and entered Final Judgment over several objections. In January 2011, several objectors filed Notices of Appeal of the Final Judgment to the United States Court of Appeals for the Ninth Circuit.
On February 28, 2011, a group of purported class members filed a motion with the District Court purporting to seek enforcement of the settlement. The Motion claimed that NVIDIA was not properly complying with its obligations under the settlement in connection with the remedies provided to purchasers of Hewlett-Packard computers included in the settlement. On March 4, 2011, NVIDIA and Class Counsel at Milberg LLP filed oppositions to the Motion. A hearing is scheduled for March 28, 2011.
Securities Cases
In September 2008, three putative securities class actions, or the Actions, were filed in the United States District Court for the Northern District of California arising out of our announcements on July 2, 2008, that we would take a charge against cost of revenue to cover anticipated costs and expenses arising from a weak die/packaging material set in certain versions of our previous generation MCP and GPU products and that we were revising financial guidance for our second quarter of fiscal year 2009. The Actions purport to be brought on behalf of purchasers of NVIDIA stock and assert claims for violations of Sections 10(b) and 20(a) of the Exchange Act. On October 30, 2008, the Actions were consolidated under the caption In re NVIDIA Corporation Securities Litigation, Civil Action No. 08-CV-04260-JW (HRL). Lead Plaintiffs and Lead Plaintiffs’ Counsel were appointed on December 23, 2008. On February 6, 2009, co-Lead Plaintiff filed a Writ of Mandamus with the Ninth Circuit Court of Appeals challenging the designation of co-Lead Plaintiffs’ Counsel. On February 19, 2009, co-Lead Plaintiff filed with the District Court a motion to stay the District Court proceedings pending resolution of the Writ of Mandamus by the Ninth Circuit. On February 24, 2009, Judge Ware granted the stay. On November 5, 2009, the Court of Appeals issued an opinion reversing the District Court’s appointment of one of the lead plaintiffs’ counsel, and remanding the matter for further proceedings. On December 8, 2009, the District Court appointed Milberg LLP and Kahn Swick & Foti, LLC as co-lead counsel. On January 22, 2010, Plaintiffs filed a Consolidated Amended Class Action Complaint for Violations of the Federal Securities Laws, asserting claims for violations of Section 10(b), Rule 10b-5 and Section 20(a) of the Exchange Act. The consolidated complaint sought unspecified compensatory damages. We filed a motion to dismiss the consolidated complaint in March 2010 and a hearing was held on June 24, 2010 before Judge Seeborg. On October 19, 2010, Judge Seeborg granted our motion to dismiss with leave to amend. On December 2, 2010, co-Lead Plaintiffs filed a Second Consolidated Amended Complaint and NVIDIA filed a motion to dismiss on February 14,2011.
28
Intel Corporation
Litigation
On February 17, 2009, Intel filed suit against NVIDIA, seeking declaratory and injunctive relief relating to a license agreement that the parties signed in 2004. The lawsuit was filed in Delaware Chancery Court. Intel sought an order from the Court declaring that the license does not extend to certain NVIDIA chipset products and enjoining NVIDIA from stating that it has license rights for these products. The lawsuit sought no damages from NVIDIA.
On March 23, 2009, NVIDIA filed its answer to Intel’s complaint and also asserted counterclaims for declaratory relief, injunctive relief, breach of contract, and breach of the implied covenant of good faith and fair dealing. NVIDIA’s counterclaims sought an order declaring that NVIDIA has the right to sell certain chipset products with Intel’s processors under the 2004 license agreement, and enjoining Intel from interfering with our license rights. In addition, the counterclaims sought a finding that Intel had materially breached its obligations under a prior license agreement, and requested various remedies for that breach, including termination of Intel’s cross licensing rights and damages. On April 16, 2009, Intel filed its answer to our counterclaims.
As described below, on January 10, 2011, NVIDIA and Intel entered into a patent cross license agreement. Pursuant to this patent cross license agreement, NVIDIA and Intel also agreed to dismiss the Delaware litigation, and each party gave the other a general release for all claims that it might have against the other, known or unknown, based on the actions of either party on or before the date of the settlement. By stipulation of the parties, the Delaware Chancery Court dismissed the lawsuit with prejudice on January 12, 2011.
Patent Cross License Agreement
On January 10, 2011, we entered into a new six-year patent cross licensing agreement, or the License Agreement, with Intel. Under the License Agreement, Intel has granted to NVIDIA and its qualified subsidiaries, and NVIDIA has granted to Intel and Intel’s qualified subsidiaries, a non-exclusive, non-transferable, worldwide license, without the right to sublicense to all patents that are either owned or controlled by the parties at any time that have a first filing date on or before March 31, 2017, to make, have made (subject to certain limitations), use, sell, offer to sell, import and otherwise dispose of certain semiconductor- and electronic-related products anywhere in the world. NVIDIA’s rights to Intel’s patents have certain specified limitations, including but not limited to, NVIDIA was not granted a license to: (1) certain microprocessors, defined in the License Agreement as “Intel Processors” or “Intel Compatible Processors;” (2) certain chipsets that connect to Intel Processors; or (3) certain flash memory products. In connection with the License Agreement, NVIDIA and Intel mutually agreed to settle all outstanding legal disputes. Under the License Agreement, Intel will pay NVIDIA an aggregate amount of $1.5 billion, payable in annual installments, as follows: a $300 million payment on each of January 18, 2011, January 13, 2012 and January 15, 2013 and a $200 million payment on each of January 15, 2014, 2015 and 2016.
29
Our common stock is traded on the NASDAQ Global Select Market under the symbol NVDA. Public trading of our common stock began on January 22, 1999. Prior to that, there was no public market for our common stock. As of March 10, 2011, we had approximately 426 registered stockholders, not including those shares held in street or nominee name. The following table sets forth for the periods indicated the high and low sales price for our common stock as quoted on the NASDAQ Global Select Market:
|
High
|
Low
|
|||||||
|
Fiscal year ending January 29, 2012
|
||||||||
|
First Quarter (through March 10, 2011)
|
$
|
26.17 |
$
|
17.90 | ||||
|
Fiscal year ended January 30, 2011
|
||||||||
|
Fourth Quarter
|
$
|
25.05
|
$
|
11.94
|
||||
|
Third Quarter
|
$
|
12.36
|
$
|
8.65
|
||||
|
Second Quarter
|
$
|
15.88
|
$
|
8.92
|
||||
|
First Quarter
|
$
|
18.34
|
$
|
15.32
|
||||
|
Fiscal year ended January 31, 2010
|
||||||||
|
Fourth Quarter
|
$
|
18.96
|
$
|
11.56
|
||||
|
Third Quarter
|
$
|
16.58
|
$
|
12.58
|
||||
|
Second Quarter
|
$
|
13.04
|
$
|
8.33
|
||||
|
First Quarter
|
$
|
12.08
|
$
|
7.21
|
||||
Dividend Policy
We have never paid and do not expect to pay cash dividends for the foreseeable future.
Issuer Purchases of Equity Securities
Our Board of Directors has authorized us, subject to certain specifications, to repurchase shares of our common stock up to an aggregate maximum amount of $2.7 billion through May 2013. The repurchases will be made from time to time in the open market, in privately negotiated transactions, or in structured stock repurchase programs, and may be made in one or more larger repurchases, in compliance with Rule 10b-18 of the Securities Exchange Act, subject to market conditions, applicable legal requirements, and other factors. The program does not obligate NVIDIA to acquire any particular amount of common stock and the program may be suspended at any time at our discretion. As part of our share repurchase program, we have entered into, and we may continue to enter into, structured share repurchase transactions with financial institutions. These agreements generally require that we make an up-front payment in exchange for the right to receive a fixed number of shares of our common stock upon execution of the agreement, and a potential incremental number of shares of our common stock, within a pre-determined range, at the end of the term of the agreement.
We did not enter into any structured share repurchase transactions or otherwise purchase any shares of our common stock during fiscal year 2011. Through January 30, 2011, we have repurchased an aggregate of 90.9 million shares under our stock repurchase program for a total cost of $1.46 billion. As of January 30, 2011, we are authorized, subject to certain specifications, to repurchase shares of our common stock up to an additional amount of $1.24 billion through May 2013.
Additionally, during fiscal year 2011, we granted approximately 5.8 million stock options and 7.1 million restricted stock units, or RSUs, under the 2007 Equity Incentive Plan. Please refer to Note 3 of the Notes to the Consolidated Financial Statements in Part IV, Item 15 of this Form 10-K for further information regarding stock-based compensation related to our March 2009 stock option purchase and related to equity awards granted under our equity incentive programs.
30
Stock Performance Graphs
The following graph compares the cumulative total stockholder return for our common stock, the S & P 500 Index and the S & P 500 Semiconductors Index for the five years ended January 30, 2011. The graph assumes that $100 was invested on January 29, 2006 in our common stock or on January 29, 2006 in each of the S & P 500 Index and the S & P Semiconductors Index. Total return assumes reinvestment of dividends in each of the indices indicated. We have never paid cash dividends on our common stock. Our results are calculated on fiscal year-end basis and each of the S & P 500 Index and the S & P Semiconductors Index are calculated on month-end basis. Total return is based on historical results and is not intended to indicate future performance.
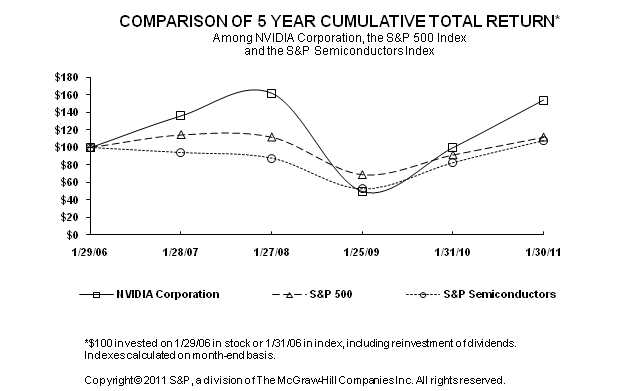
|
1/29/2006
|
1/28/2007
|
1/27/2008
|
1/25/2009
|
1/31/2010
|
1/30/2011
|
|||||||||||||||||||
|
NVIDIA Corporation
|
$
|
100.00
|
$
|
136.09
|
$
|
161.84
|
$
|
50.01
|
$
|
99.83
|
$
|
154.12
|
||||||||||||
|
S & P 500
|
$
|
100.00
|
$
|
114.51
|
$
|
111.87
|
$
|
68.66
|
$
|
91.41
|
$
|
111.69
|
||||||||||||
|
S & P Semiconductors
|
$
|
100.00
|
$
|
94.16
|
$
|
87.75
|
$
|
52.60
|
$
|
82.57
|
$
|
107.76
|
||||||||||||
31
The following graph compares the cumulative total stockholder return for our common stock, the S & P 500 Index and the S & P 500 Semiconductors Index for the period commencing with our initial public offering through the year ended January 30, 2011. The graph assumes that $100 was invested at our initial public offering on January 21, 1999 in our common stock or on December 31, 1998 in each of the S & P 500 Index and the S & P Semiconductors Index. Total return assumes reinvestment of dividends in each of the indices indicated. We have never paid cash dividends on our common stock. Our results are calculated on fiscal year-end basis and each of the S & P 500 Index and the S & P Semiconductors Index are calculated on month-end basis. Total return is based on historical results and is not intended to indicate future performance.
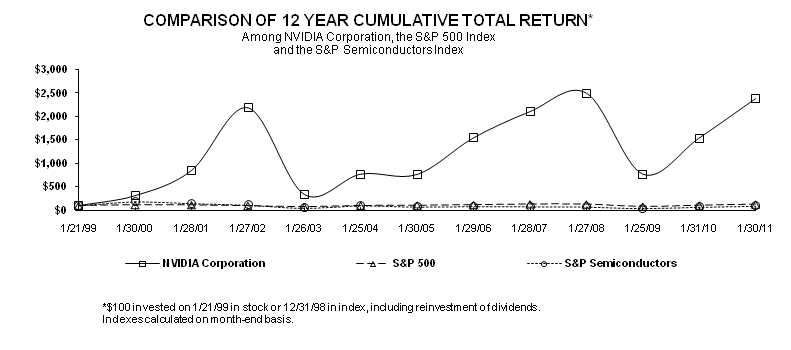
|
1/21/99
|
1/30/00
|
1/28/01
|
1/27/02
|
1/26/03
|
1/25/04
|
1/30/05
|
1/29/06
|
1/28/07
|
1/27/08
|
1/25/09
|
1/31/10
|
1/30/11
|
||||||||||||||||||||||||||||||||||||||||
|
NVIDIA Corporation
|
$ | 100.00 | $ | 311.46 | $ | 846.88 | $ | 2,182.33 | $ | 339.00 | $ | 769.67 | $ | 762.67 | $ | 1,541.67 | $ | 2,098.00 | $ | 2,495.00 | $ | 771.00 | $ | 1,539.00 | $ | 2,376.00 | ||||||||||||||||||||||||||
|
S&P 500
|
$ | 100.00 | $ | 114.96 | $ | 113.93 | $ | 95.53 | $ | 73.54 | $ | 98.97 | $ | 105.13 | $ | 116.05 | $ | 132.89 | $ | 129.82 | $ | 79.67 | $ | 106.07 | $ | 129.61 | ||||||||||||||||||||||||||
|
S&P Semiconductors
|
$ | 100.00 | $ | 180.33 | $ | 145.17 | $ | 112.96 | $ | 50.00 | $ | 99.52 | $ | 74.79 | $ | 86.48 | $ | 81.43 | $ | 75.88 | $ | 45.49 | $ | 71.41 | $ | 93.19 | ||||||||||||||||||||||||||
32
The following selected financial data should be read in conjunction with our financial statements and the notes thereto, and with Item 7, “Management’s Discussion and Analysis of Financial Condition and Results of Operations.” The consolidated statements of operations data for the years ended January 30, 2011, January 31, 2010 and January 25, 2009, and the consolidated balance sheet data as of January 30, 2011 and January 31, 2010 have been derived from and should be read in conjunction with our audited consolidated financial statements and the notes thereto included elsewhere in this Annual Report on Form 10-K. We operate on a 52 or 53-week year, ending on the last Sunday in January. Fiscal years 2011, 2009, 2008 and 2007 were 52-week years, while fiscal year 2010 was a 53-week year.
|
Year Ended
|
||||||||||||||||
|
January 30,
|
January 31,
|
January 25,
|
January 27,
|
January 28,
|
||||||||||||
|
2011
(B,C)
|
2010
(B,D)
|
2009
(B,E)
|
2008
(F)
|
2007
(F,G)
|
||||||||||||
|
(In thousands, except per share data)
|
||||||||||||||||
|
Consolidated Statement of Operations Data:
|
||||||||||||||||
|
Revenue
|
$
|
3,543,309
|
$
|
3,326,445
|
$
|
3,424,859
|
$
|
4,097,860
|
$
|
3,068,771
|
||||||
|
Income (loss) from operations
|
$
|
255,747
|
$
|
(98,945
|
)
|
$
|
(70,700
|
)
|
$
|
836,346
|
$
|
453,452
|
||||
|
Net income (loss)
|
$
|
253,146
|
$
|
(67,987
|
)
|
$
|
(30,041
|
)
|
$
|
797,645
|
$
|
448,834
|
||||
|
Basic net income (loss) per share
|
$
|
0.44
|
$
|
(0.12
|
)
|
$
|
(0.05
|
)
|
$
|
1.45
|
$
|
0.85
|
||||
|
Diluted net income (loss) per share
|
$
|
0.43
|
$
|
(0.12
|
)
|
$
|
(0.05
|
)
|
$
|
1.31
|
$
|
0.76
|
||||
|
Shares used in basic per share computation (A)
|
575,177
|
549,574
|
548,126
|
550,108
|
528,606
|
|||||||||||
|
Shares used in diluted per share computation (A)
|
588,684
|
549,574
|
548,126
|
606,732
|
587,256
|
|||||||||||
|
January 30,
|
January 31,
|
January 25,
|
January 27,
|
January 28,
|
||||||||||||
|
2011
|
2010
|
2009
|
2008
|
2007
|
||||||||||||
|
Consolidated Balance Sheet Data:
|
||||||||||||||||
|
Cash, cash equivalents and marketable securities
|
$
|
2,490,563
|
$
|
1,728,227
|
$
|
1,255,390
|
$
|
1,809,478
|
$
|
1,117,850
|
||||||
|
Total assets
|
$
|
4,495,246
|
$
|
3,585,918
|
$
|
3,350,727
|
$
|
3,747,671
|
$
|
2,675,263
|
||||||
|
Capital lease obligations, less current portion
|
$
|
23,389
|
$
|
24,450
|
$
|
25,634
|
$
|
-
|
$
|
-
|
||||||
|
Total stockholders’ equity
|
$
|
3,181,462
|
$
|
2,665,140
|
$
|
2,394,652
|
$
|
2,617,912
|
$
|
2,006,919
|
||||||
|
Cash dividends declared per common share
|
$
|
-
|
$
|
-
|
$
|
-
|
$
|
-
|
$
|
-
|
||||||
|
(A)
|
Reflects a three-for-two stock-split effective September 10, 2007 and a two-for-one stock-split effective April 6, 2006.
|
|
(B)
|
We recorded a net warranty charge of $193.9 million, $94.0 million and $188.0 million, during fiscal years 2011, 2010 and 2009, respectively, which reduced income from operations to cover anticipated customer warranty, repair, return, replacement and other costs arising from a weak die/packaging material set used in certain versions of our previous generation MCP and GPU products shipped after July 2008 and used in notebook configurations.
|
|
(C)
|
On January 10, 2011, we entered into a new six-year cross licensing agreement with Intel and also mutually agreed to settle all outstanding legal disputes. For accounting purposes, the fair valued benefit prescribed to the settlement portion was $57.0 million, which was recorded within income from operations in fiscal year 2011.
|
|
(D)
|
Fiscal year 2010 includes impact of charge for a tender offer to purchase an aggregate of 28.5 million outstanding stock options for a total cash payment of $78.1 million. As a result of the tender offer the Company incurred a charge of $140.2 million, consisting of the remaining unamortized stock-based compensation expenses associated with the unvested portion of the options tendered in the offer, stock-based compensation expense resulting from amounts paid in excess of the fair value of the underlying options, plus associated payroll taxes and professional fees.
|
|
(E)
|
Fiscal year 2009 includes a $18.9 million for a non-recurring charge resulting from the termination of a development contract related to a new campus construction project we have put on hold and $8.0 million for restructuring charges.
|
|
(F)
|
Fiscal years 2008 and 2007 include a charge of $4.0 million and $13.4 million towards in-process research and development expense related to our purchase of Mental Images Inc. and PortalPlayer Inc., respectively that had not yet reached technological feasibility and have no alternative future use.
|
|
(G)
|
Fiscal year 2007 included a charge of $17.5 million associated with a confidential patent licensing arrangement.
|
33
The following discussion and analysis of our financial condition and results of operations should be read in conjunction with “Item 1A. Risk Factors”, “Item 6. Selected Financial Data”, our Consolidated Financial Statements and related Notes thereto, as well as other cautionary statements and risks described elsewhere in this Annual Report on Form 10-K, before deciding to purchase, hold or sell shares of our common stock.
Overview
Our Company
NVIDIA Corporation invented the graphics processing unit, or GPU, in 1999. Since then, we have strived to set new standards in visual computing with interactive graphics available on devices ranging from tablets and smart phones to notebooks and workstations. Our expertise in programmable GPUs and computer-systems technology has led to breakthroughs in parallel processing which make supercomputing inexpensive and widely accessible. We are strategically investing in three major areas – visual computing, high performance computing and mobile computing. We serve the visual computing market with our consumer GeForce graphics products and professional Quadro graphics products; the high performance computing market with our Tesla computing solutions products; and the mobile computing market with our Tegra system-on-chip products.
We have three primary financial reporting segments – GPU, Professional Solutions Business, or PSB and Consumer Products Business, or CPB. During fiscal years 2010 and 2009, we operated and reported four major product-line operating segments: the GPU business, the PSB business, the media and communications processor, or MCP, business, and the CPB business. However, during the first quarter of fiscal year 2011, we began reporting internally the results of our former MCP segment along with the results of our GPU segment to reflect the way we manage the GPU business. Comparative periods presented reflect this change.
Our GPU business is comprised primarily of our GeForce discrete and chipset products which support desktop and notebook personal computers, or PCs, plus memory products. Our PSB is comprised of our Quadro professional workstation products and other professional graphics products, including our NVIDIA Tesla high-performance computing products. Our CPB is comprised of our Tegra mobile products which support tablets, smartphones, personal media players, or PMPs, internet television, automotive navigation, and other similar devices. CPB also includes license, royalty, other revenue and associated costs related to video game consoles and other digital consumer electronics devices. Original equipment manufacturers, or OEMs, original design manufacturers, or ODMs, add-in-card manufacturers, system builders and consumer electronics companies worldwide utilize our processors as a core component of their entertainment, business and professional solutions.
We were incorporated in California in April 1993 and reincorporated in Delaware in April 1998. Our headquarter facilities are in Santa Clara, California. Our web address is
www.nvidia.com
. The contents of our website are not a part of this Form 10-K.
Recent Developments, Future Objectives and Challenges
GPU Business
During fiscal year 2011, we took the computational capabilities of our GPUs to a new level with the launch of our Fermi architecture. Fermi GPUs are designed to excel at tessellation, the key feature of DirectX 11, and to allow game developers to increase the level of physics realism via our PhysX API. Our flagship product for the desktop, the GeForce GTX 480, was followed by a complete line-up of 400-series GPUs. Later in the year, we refreshed them with our 500-series GPUs, which significantly increased the performance of the products they replaced while fitting into similar power envelopes. We also launched 400M- and 500M-series GPUs for notebooks, along with our Optimus technology, which switches invisibly between discrete GPU and integrated graphics controller depending on the user’s activities. By doing so, NVIDIA Optimus provides notebook users with the battery life of integrated graphics, but with the gaming performance of a discrete graphics processor. PC manufacturers also are expected to launch hundreds of new PCs that use these new GeForce GPUs paired with Intel Corporation’s Sandy Bridge CPUs.
During fiscal year 2011, we also announced our plans to develop a custom central processing unit, or CPU, that will use the ARM instruction set. These CPU cores will be integrated into future generation GPUs for PCs, servers, and supercomputers.
34
Professional Solutions Business
During fiscal year 2011, our Quadro business benefitted from the strength of our Fermi architecture with the launch of the Quadro 2000 midrange GPU and the Quadro 600 entry-level GPU. These professional graphics solutions put the computational and visualization benefits of our Fermi architecture within reach of all engineers, designers and animators, with the Quadro 2000 delivering significantly higher performance across leading CAD applications and the Quadro 600 positioned at a competitive price/performance point. The new Quadro GPUs deliver performance that is up to five times faster for 3D applications and up to eight times faster for computational simulation than our previous Quadro generation products.
Our Tesla supercomputing business continued to make progress with key project wins not only in our core market segments, but also with traction in a number of new focus areas.
Consumer Products Business
During fiscal year 2011, we saw promising signs in our Tegra business, helped by adoption to the Android operating system. Tegra shipment volumes began to ramp up late in the fourth quarter of fiscal year 2011 and we expect the momentum to continue into the first quarter of fiscal year 2012, fueled by the production release of Android-based smartphone and tablet products. During the fiscal year 2011, we had multiple Tegra 2 design wins in both tablets and smartphones. Our customers, including Acer Inc., Dell Inc., LG Electronics Inc. and Motorola Solutions, Inc., announced a number of products incorporating the Tegra 2 mobile processor. We also demonstrated our next-generation mobile processor, the world’s first quad-core mobile processor, at Mobile World Congress.
During fiscal year 2011, we announced that Volkswagen AG and AUDI AG will use our next-generation Tegra starting in 2012. In addition, we announced that BMW Group will use our GPUs for infotainment systems in next-generation cars worldwide. Tesla Motors will also incorporate Tegra processors to power the infotainment, navigation and instrument cluster in its Roadster Model S.
Patent Cross License Agreement
On January 10, 2011, we entered into a new six-year patent cross licensing agreement, or the License Agreement, with Intel. Under the License Agreement, Intel has granted to NVIDIA and its qualified subsidiaries, and NVIDIA has granted to Intel and Intel’s qualified subsidiaries, a non-exclusive, non-transferable, worldwide license, without the right to sublicense to all patents that are either owned or controlled by the parties at any time that have a first filing date on or before March 31, 2017, to make, have made (subject to certain limitations), use, sell, offer to sell, import and otherwise dispose of certain semiconductor- and electronic-related products anywhere in the world. NVIDIA’s rights to Intel’s patents have certain specified limitations, including but not limited to, NVIDIA was not granted a license to: (1) certain microprocessors, defined in the License Agreement as “Intel Processors” or “Intel Compatible Processors;” (2) certain chipsets that connect to Intel Processors; or (3) certain flash memory products. In connection with the License Agreement, NVIDIA and Intel mutually agreed to settle all outstanding legal disputes. Under the License Agreement, Intel will pay NVIDIA an aggregate amount of $1.5 billion, payable in annual installments, as follows: a $300 million payment on each of January 18, 2011, January 13, 2012 and January 15, 2013 and a $200 million payment on each of January 15, 2014, 2015 and 2016.
The License Agreement between NVIDIA and Intel includes multiple elements. As a result, we determined each element of the License Agreement, their fair value and when they should be recognized. The elements of the License Agreement are accounted for as follows:
| 1 . |
Legal settlement
: In connection with the License Agreement, both parties agreed to settle all outstanding legal disputes. The fair value allocated to the settlement of $57.0 million was recorded in the fourth quarter of fiscal year 2011, as a benefit to operating expense.
|
| 2. . |
License to Intel:
We will recognize $1,583.0 million in total, or $66.0 million per quarter, as revenue over the term of the agreement of six years, the period over which Intel will have access to newly filed NVIDIA patents. We will commence recognition of the license revenue in April 2011 when our performance obligation under the agreement begins. Consideration received in advance of the performance period will be classified as deferred revenue.
|
| 3. |
License from Intel
: We recognized $140.0 million as an intangible asset upon execution of the agreement. Amortization of $5.0 million per quarter will be charged to cost of sales over the seven year estimated useful life of the technology beginning in April 2011.
|
Please refer to Note 4 of the Notes to the Consolidated Financial Statements in Part IV, Item 15 of this Form 10-K for further information regarding this cross license and the settlement.
35
Product Defect
Our products are complex and may contain defects or experience failures due to any number of issues in design, fabrication, packaging, materials and/or use within a system. If any of our products or technologies contains a defect, compatibility issue or other error, we may have to invest additional research and development efforts to find and correct the issue. Such efforts could divert our management’s and engineers’ attention from the development of new products and technologies and could increase our operating costs and reduce our gross margin. In addition, an error or defect in new products or releases or related software drivers after commencement of commercial shipments could result in failure to achieve market acceptance or loss of design wins. Also, we may be required to reimburse customers, including for customers’ costs to repair or replace the products in the field, which could cause our revenue to decline. A product recall or a significant number of product returns could be expensive, damage our reputation and could result in the shifting of business to our competitors. Costs associated with correcting defects, errors, bugs or other issues could be significant and could materially harm our financial results.
During the second quarter of fiscal year 2011, we recorded an additional charge to cover the estimated remaining customer warranty, repair, return, replacement and other costs arising from a weak die/packaging material set in certain versions of our previous generation MCP and GPU products used in notebook configurations. The net charge amounted to $193.9 million, of which $181.2 million was charged against cost of revenue. The extra remediation costs are primarily due to additional platforms from late failing systems that we had not previously considered to be at risk. Included in the charge are the estimated costs of implementing a settlement reached during the second quarter of fiscal year 2011 with the plaintiffs of a putative consumer class action lawsuit related to this same matter and the other estimated consumer class action settlement. As a result of this settlement, the other related estimated settlement, and offsetting insurance reimbursements, we recorded a net charge of $12.7 million to sales, general and administrative expense during the second quarter of fiscal year 2011. Together with the $282.0 million net charge we had previously recorded for related estimated costs, this brings the total cumulative net charge to $475.9 million, of which $466.4 million has been charged against cost of revenue and the remainder has been charged to sales, general and administrative expenses.
The previous generation MCP and GPU products that are impacted were included in a number of notebook products that were shipped and sold in significant quantities. Certain notebook configurations of these products are failing in the field at higher than normal rates. Testing suggests a weak material set of die/package combination, system thermal management designs, and customer use patterns are contributing factors for these failures. We have worked with our customers to develop and have made available for download a software driver to cause the system fan to begin operation at the powering up of the system and reduce the thermal stress on these chips. We have also recommended to our customers that they consider changing the thermal management of the products in their notebook system designs. We intend to fully support our customers in their repair and replacement of these impacted products that fail, and their other efforts to mitigate the consequences of these failures. The weak die/packaging material combination is not used in any of our products that are currently in production.
In September, October and November 2008, several putative securities class action lawsuits were filed against us, asserting various claims related to the impacted MCP and GPU products. Please refer to Note 13 of the Notes to the Consolidated Financial Statements in Part IV, Item 15 of this Form 10-K for further information regarding this litigation and the settlement.
Tender Offer
During the first quarter of fiscal year 2010, we announced that our Board of Directors approved a cash tender offer for certain employee stock options. The tender offer applied to outstanding stock options held by employees with an exercise price equal to or greater than $17.50 per share. None of the non-employee members of our Board of Directors or our officers who file reports under Section 16(a) of the Securities Exchange Act of 1934, as amended, including our former Chief Financial Officer, Marvin D. Burkett, were eligible to participate in the Offer. All eligible options with exercise prices less than $28.00 per share, but not less than $17.50 per share, were eligible to receive a cash payment of $3.00 per option in exchange for the cancellation of the eligible option. All eligible options with exercise prices greater than $28.00 per share were eligible to receive a cash payment of $2.00 per option in exchange for the cancellation of the eligible option.
36
A total of 28.5 million options were tendered under the offer for an aggregate cash purchase price of $78.1 million, which was paid in exchange for the cancellation of the eligible options. As a result of the tender offer, we incurred a charge during fiscal year 2010 of $140.2 million consisting of $124.1 million related to the remaining unamortized stock based compensation expense associated with the unvested portion of the options tendered in the offer, $11.6 million related to stock-based compensation expense resulting from amounts paid in excess of the fair value of the underlying options, plus $4.5 million related to associated payroll taxes, professional fees and other costs.
Critical Accounting Policies and Estimates
Management’s discussion and analysis of financial condition and results of operations are based upon our consolidated financial statements, which have been prepared in accordance with U.S. GAAP. The preparation of these financial statements requires us to make estimates and judgments that affect the reported amounts of assets, liabilities, revenue, cost of revenue, expenses and related disclosure of contingencies. On an on-going basis, we evaluate our estimates, including those related to revenue recognition, cash equivalents and marketable securities, accounts receivable, inventories, income taxes, goodwill, stock-based compensation, warranty liabilities, litigation, investigation and settlement costs and other contingencies. We base our estimates on historical experience and on various other assumptions that are believed to be reasonable under the circumstances, the results of which form the basis for making judgments about the carrying values of assets and liabilities.
We believe the following critical accounting policies affect our significant judgments and estimates used in the preparation of our consolidated financial statements. Our management has discussed the development and selection of these critical accounting policies and estimates with the Audit Committee of our Board of Directors, or Board. The Audit Committee has reviewed our disclosures relating to our critical accounting policies and estimates in this Annual Report on Form 10-K.
Revenue Recognition
Product Revenue
We recognize revenue from product sales when persuasive evidence of an arrangement exists, the product has been delivered, the price is fixed or determinable, and collection is reasonably assured. For most sales, we use a binding purchase order and in certain cases we use a contractual agreement as evidence of an arrangement. We consider delivery to occur upon shipment provided title and risk of loss have passed to the customer based on the shipping terms. At the point of sale, we assess whether the arrangement fee is fixed or determinable and whether collection is reasonably assured. If we determine that collection of a fee is not reasonably assured, we defer the fee and recognize revenue at the time collection becomes reasonably assured, which is generally upon receipt of payment.
Our policy on sales to certain distributors, with rights of return, is to defer recognition of revenue and related cost of revenue until the distributors resell the product, as the level of returns cannot be reasonably estimated.
Our customer programs primarily involve rebates, which are designed to serve as sales incentives to resellers of our products in various target markets. We accrue for 100% of the potential rebates and do not apply a breakage factor. We recognize a liability for these rebates at the later of the date at which we record the related revenue or the date at which we offer the rebate. Rebates typically expire six months from the date of the original sale, unless we reasonably believe that the customer intends to claim the rebate. Unclaimed rebates are reversed to revenue.
Our customer programs also include marketing development funds, or MDFs. We account for MDFs as either a reduction of revenue or an operating expense, depending on the nature of the program. MDFs represent monies paid to retailers, system builders, original equipment manufacturers, or OEMs, distributors and add-in card partners that are earmarked for market segment development and expansion and typically are designed to support our partners’ activities while also promoting NVIDIA products. Depending on market conditions, we may take actions to increase amounts offered under customer programs, possibly resulting in an incremental reduction of revenue at the time such programs are offered.
We also record a reduction to revenue by establishing a sales return allowance for estimated product returns at the time revenue is recognized, based primarily on historical return rates. However, if product returns for a particular fiscal period exceed historical return rates we may determine that additional sales return allowances are required to properly reflect our estimated exposure for product returns.
37
License and Development Revenue
For license arrangements that require significant customization of our intellectual property components, we generally recognize this license revenue over the period that services are performed. For all license and service arrangements, we determine progress to completion based on actual direct labor hours incurred to date as a percentage of the estimated total direct labor hours required to complete the project. We periodically evaluate the actual status of each project to ensure that the estimates to complete each contract remain accurate. A provision for estimated losses on contracts is made in the period in which the loss becomes probable and can be reasonably estimated. Costs incurred in advance of revenue recognized are recorded as deferred costs on uncompleted contracts. If the amount billed exceeds the amount of revenue recognized, the excess amount is recorded as deferred revenue. Revenue recognized in any period is dependent on our progress toward completion of projects in progress. Significant management judgment and discretion are used to estimate total direct labor hours. Any changes in or deviations from these estimates could have a material effect on the amount of revenue we recognize in any period.
Royalty revenue is recognized related to the distribution or sale of products that use our technologies under license agreements with third parties. We recognize royalty revenue upon receipt of a confirmation of earned royalties and when collectability is reasonably assured from the applicable licensee.
Accounts Receivable
We maintain an allowance for doubtful accounts receivable for estimated losses resulting from the inability of our customers to make required payments. Management determines this allowance, which consists of an amount identified for specific customer issues as well as an amount based on overall estimated exposure. Our accounts receivable are highly concentrated and make us vulnerable to adverse changes in our customers businesses, and to downturns in the industry and the worldwide economy. Our overall estimated exposure excludes significant amounts that are covered by credit insurance and letters of credit. If the financial condition of our customers, the financial institutions providing letters of credit, or our credit insurance carrier were to deteriorate, resulting in an impairment of their ability to make payments, additional allowances may be required that could adversely affect our operating results. This risk is heightened during periods when economic conditions worsen, such as the when the worldwide economy is experiencing a significant downturn. The financial turmoil that affected the banking system and financial markets and increased the risk that financial institutions mighty consolidate or go out of business resulted in a tightening in the credit markets, a lower than normal level of liquidity in many financial markets, and extreme volatility in fixed income, credit, currency and equity markets. There could be a number of follow-on effects from this type of credit crisis on our business, including inability of customers, including channel partners, to obtain credit to finance purchases of our products and/or customer, insolvencies and failure of financial institutions, which could negatively impact our financial results. Furthermore, there can be no assurance that we will be able to continue to obtain credit insurance in the future.
As of January 30, 2011, our allowance for doubtful accounts receivable was $0.8 million and our gross accounts receivable balance was $386.5 million. Of the $386.5 million, $86.0 million was covered by credit insurance and $4.4 million was covered by letters of credit. If the financial condition of our customers were to deteriorate, resulting in an impairment of their ability to make payments, additional allowances may be required and we may have to record additional reserves or write-offs on certain sales transactions in the future. Factors impacting the allowance include the level of gross receivables, the financial condition of our customers and the extent to which balances are covered by credit insurance or letters of credit. We have incurred cumulative bad debts of $0.5 million over the last three fiscal years. As a result of our low bad debt experience, our allowance for doubtful accounts receivable has ranged between 0.2% and 0.3% during fiscal years 2011 and 2010, respectively. As of January 30, 2011, our allowance for doubtful accounts receivable represented 0.2% of our gross accounts receivable balance.
Inventories
Inventory cost is computed on an adjusted standard basis, which approximates actual cost on an average or first-in, first-out basis. Inventory costs consist primarily of the cost of semiconductors purchased from subcontractors, including wafer fabrication, assembly, testing and packaging, manufacturing support costs, including labor and overhead associated with such purchases, final test yield fallout, inventory provisions and shipping costs. We write down our inventory to the lower of cost or estimated market value. Obsolete or unmarketable inventory is completely written off based upon assumptions about future demand, future product purchase commitments, estimated manufacturing yield levels and market conditions. If actual market conditions are less favorable than those projected by management, or if our future product purchase commitments to our suppliers exceed our forecasted future demand for such products, additional future inventory write-downs may be required that could adversely affect our operating results. Inventory reserves once established are not reversed until the related inventory has been sold or scrapped. If actual market conditions are more favorable than expected and we sell products that we have previously written down, our reported gross margin would be favorably impacted.
38
As of January 30, 2011, our inventory reserve was $152.0 million. As a percentage of our gross inventory balance, our inventory reserve has ranged between 15.0% and 30.6% during fiscal years 2011 and 2010. As of January 30, 2011, our inventory reserve represented 30.6% of our gross inventory balance.
Warranty Liabilities
Cost of revenue includes the estimated cost of product warranties that are calculated at the point of revenue recognition. Under limited circumstances, we may offer an extended limited warranty to customers for certain products. Our products are complex and may contain defects or experience failures due to any number of issues in design, fabrication, packaging, materials and/or use within a system. If any of our products or technologies contains a defect, compatibility issue or other error, we may have to invest additional research and development efforts to find and correct the issue. Such efforts could divert our management’s and engineers’ attention from the development of new products and technologies and could increase our operating costs and reduce our gross margin. In addition, an error or defect in new products or releases or related software drivers after commencement of commercial shipments could result in failure to achieve market acceptance or loss of design wins. Also, we may be required to reimburse customers, including our customers’ costs to repair or replace products in the field. A product recall or a significant number of product returns could be expensive, damage our reputation and could result in the shifting of business to our competitors. Costs associated with correcting defects, errors, bugs or other issues could be significant and could materially harm our financial results.
During fiscal year 2011, we recorded an additional charge to cover the estimated remaining customer warranty, repair, return, replacement and other costs arising from a weak die/packaging material set in certain versions of our previous generation MCP and GPU products used in notebook configurations. The net charge amounted to $193.9 million, of which $181.2 million was charged against cost of revenue. The extra remediation costs are primarily due to additional platforms from late failing systems that we had not previously considered to be at risk. Included in the charge are the estimated costs of implementing a settlement reached during fiscal year 2011 with the plaintiffs of a putative consumer class action lawsuit related to this same matter and another related estimated consumer class action settlement. As a result of this settlement, the other estimated settlement, and offsetting insurance reimbursements, we recorded a net charge of $12.7 million to sales, general and administrative expense during fiscal year 2011. Together with the $282.0 million net charge we had previously recorded for related estimated costs, this brings the total cumulative net charge to $475.9 million, of which $466.4 million has been charged against cost of revenue and the remainder has been charged to sales, general and administrative.
Determining the amount of the warranty charges related to this issue required management to make estimates and judgments based on historical experience, test data and various other assumptions including estimated field failure rates that we believe to be reasonable under the circumstances. The results of these judgments formed the basis for our estimate of the total charge to cover anticipated customer warranty, repair, return and replacement and other associated costs. However, if actual repair, return, replacement and other associated costs and/or actual field failure rates exceed our estimates, we may be required to record additional reserves, which would increase our cost of revenue and materially harm our financial results.
Income Taxes
We recognize federal, state and foreign current tax liabilities or assets based on our estimate of taxes payable or refundable in the current fiscal year by tax jurisdiction. We recognize federal, state and foreign deferred tax assets or liabilities, as appropriate, for our estimate of future tax effects attributable to temporary differences and carryforwards; and we record a valuation allowance to reduce any deferred tax assets by the amount of any tax benefits that, based on available evidence and judgment, are not expected to be realized.
United States income tax has not been provided on earnings of our non-U.S. subsidiaries to the extent that such earnings are considered to be indefinitely reinvested.
Our calculation of current and deferred tax assets and liabilities is based on certain estimates and judgments and involves dealing with uncertainties in the application of complex tax laws. Our estimates of current and deferred tax assets and liabilities may change based, in part, on added certainty or finality to an anticipated outcome, changes in accounting standards or tax laws in the United States, or foreign jurisdictions where we operate, or changes in other facts or circumstances. In addition, we recognize liabilities for potential United States and foreign income tax contingencies based on our estimate of whether, and the extent to which, additional taxes may be due. If we determine that payment of these amounts is unnecessary or if the recorded tax liability is less than our current assessment, we may be required to recognize an income tax benefit or additional income tax expense in our financial statements, accordingly.
39
As of January 30, 2011, we had a valuation allowance of $148.0 million related to state and certain foreign deferred tax assets that management determined are not likely to be realized due, in part, to projections of future taxable income and potential utilization limitations of tax attributes acquired as a result of stock ownership changes. To the extent realization of the deferred tax assets becomes more-likely-than-not, we would recognize such deferred tax asset as an income tax benefit during the period the realization occurred.
Our deferred tax assets do not include the excess tax benefit related to stock-based compensation that are a component of our federal and state net operating loss and research tax credit carryforwards in the amount of $565.2 million as of January 30, 2011. Consistent with prior years, the excess tax benefit reflected in our net operating loss and research tax credit carryforwards will be accounted for as a credit to stockholders’ equity, if and when realized. In determining if and when excess tax benefits have been realized, we have elected to utilize the with-and-without approach with respect to such excess tax benefits. We have also elected to ignore the indirect tax effects of stock-based compensation deductions for financial and accounting reporting purposes, and specifically to recognize the full effect of the research tax credit in income from continuing operations.
We recognize the benefit from a tax position only if it is more-likely-than-not that the position would be sustained upon audit based solely on the technical merits of the tax position. Our policy is to include interest and penalties related to unrecognized tax benefits as a component of income tax expense. Please refer to Note 14 of these Notes to the Consolidated Financial Statements in Part IV, Item 15 of this Form 10-K for additional information.
Goodwill
Our impairment review process compares the fair value of the reporting unit in which the goodwill resides to its carrying value. We determined that our reporting units are equivalent to our operating segments, or components of an operating segment, for the purposes of completing our goodwill impairment test. We utilize a two-step approach to testing goodwill for impairment. The first step tests for possible impairment by applying a fair value-based test. In computing fair value of our reporting units, we use estimates of future revenues, costs and cash flows from such units. The second step, if necessary, measures the amount of such impairment by applying fair value-based tests to individual assets and liabilities. Goodwill is subject to our annual impairment test during the fourth quarter of our fiscal year, or earlier if indicators of potential impairment exist, using a fair value-based approach.
During the fourth quarter of fiscal year 2011, our market capitalization increased over 60% when compared to the same period in fiscal year 2010. We completed our most recent annual impairment test during the fourth quarter of fiscal year 2011 and concluded that there was no impairment as the fair value of our reporting units exceeded their carrying value. This assessment was based upon a discounted cash flow analysis, analysis of market comparables, where appropriate, and analysis of our market capitalization. Determining the number of reporting units and the fair value of a reporting unit requires us to make judgments and involves the use of significant estimates and assumptions. We also make judgments and assumptions in allocating assets and liabilities to each of our reporting units. We base our fair value estimates on assumptions we believe to be reasonable but that are unpredictable and inherently uncertain.
Our estimates of cash flows were based upon, among other things, certain assumptions about expected future operating performance, such as revenue growth rates, operating margins, risk-adjusted discount rates, and future economic and market conditions. Our estimates of discounted cash flows may differ from actual cash flows due to, among other things, economic conditions, changes to our business model or changes in operating performance. Additionally, certain estimates of discounted cash flows involve businesses with limited financial history and developing revenue models, which increases the risk of differences between the projected and actual performance. The long-term financial forecasts that we utilize represent the best estimate that we have at this time and we believe that its underlying assumptions are reasonable. Significant differences between our estimates and actual cash flows could materially affect our future financial results, which could impact our future estimates of the fair value of some or all of our reporting units. Determining the fair value of our reporting units also requires us to use judgment in the selection of appropriate market comparables, if there are any, and the amount of weight to ascribe to fair value measurements that are based on the market approach.
Any significant reductions in the actual amount of cash flows realized by our reporting units, reductions in the value of market comparables, or reductions in our market capitalization could impact future estimates of the fair value of our reporting units. Such events could ultimately result in a charge to our earnings in future periods due to the potential for a write-down of the goodwill associated with some or all of our reporting units.
40
Cash Equivalents and Marketable Securities
Cash equivalents consist of financial instruments which are readily convertible into cash and have original maturities of three months or less at the time of acquisition. Marketable securities consist primarily of highly liquid investments with maturities of greater than three months when purchased. We generally classify our marketable securities at the date of acquisition as available- for- sale. These securities are reported at fair value with the related unrealized gains and losses included in accumulated other comprehensive income (loss), a component of stockholder’s equity, net of tax. Any unrealized losses which are considered to be other-than-temporary impairments are recorded in the other income (expense) section of our consolidated statements of operations. Realized gains (losses) on the sale of marketable securities are determined using the specific-identification method and recorded in the other income (expense) section of our consolidated statements of operations. Please refer to Note 18 of the Notes to the Consolidated Financial Statements in Part IV, Item 15 of this Form 10-K. We measure our cash equivalents and marketable securities at fair value. The fair values of our financial assets and liabilities are determined using quoted market prices of identical assets or quoted market prices of similar assets from active markets. Our Level 1 assets consist of our money market funds. We classify securities within Level 1 assets when the fair value is obtained from real time quotes for transactions in active exchange markets involving identical assets. Our available-for- sale securities are classified as having Level 2 inputs. Our Level 2 assets are valued utilizing a market approach where the market prices of similar assets are provided by a variety of independent industry standard data providers to our investment custodian. Most of our cash equivalents and marketable securities are valued based on Level 2 inputs. As of January 30, 2011, we collected the balance of our investment in the Reserve International Liquidity Fund, Ltd., or International Reserve Fund, that was classified as a Level 3 input due to the inherent subjectivity and the significant judgment involved in its valuation. As such, we do not have any investment classified as Level 3 as of January 30, 2011.
All of our available-for-sale investments are subject to a periodic impairment review. We record a charge to earnings when a decline in fair value is significantly below cost basis and judged to be other-than-temporary, or have other indicators of impairments. If the fair value of an available-for-sale debt instrument is less than its amortized cost basis, an other-than - temporary impairment is triggered in circumstances where (1) we intend to sell the instrument, (2) it is more likely than not that we will be required to sell the instrument before recovery of its amortized cost basis, or (3) a credit loss exists where we do not expect to recover the entire amortized cost basis of the instrument. If we intend to sell or it is more likely than not that we will be required to sell the available-for-sale debt instrument before recovery of its amortized cost basis, we recognize an other-than- temporary impairment in earnings equal to the entire difference between the debt instruments’ amortized cost basis and its fair value. For available-for-sale debt instruments that are considered other-than-temporarily impaired due to the existence of a credit loss, if we do not intend to sell and it is more likely than not that we will be required to sell the instrument before recovery of its remaining amortized cost basis (amortized cost basis less any current-period credit loss), we separate the amount of the impairment into the amount that is credit related and the amount due to all other factors. The credit loss component is recognized in earnings.
Stock-based Compensation
Our stock-based compensation cost for equity awards is measured at grant date, based on the fair value of the awards, and is recognized as expense over the requisite employee service period. We recognize stock-based compensation expense using the straight-line attribution method. We estimate the fair value of employee stock options on the date of grant using a binomial model and we use the closing trading price of our common stock on the date of grant as the fair value of awards of restricted stock units, or RSUs. The determination of fair value of share-based payment awards on the date of grant using an option-pricing model is affected by our stock price as well as assumptions regarding a number of highly complex and subjective variables. These variables include, but are not limited to, the expected stock price volatility over the term of the awards, actual and projected employee stock option exercise behaviors, vesting schedules, death and disability probabilities, expected volatility and risk-free interest. Our management has determined that the use of implied volatility is expected to be more reflective of market conditions and, therefore, can reasonably be expected to be a better indicator of our expected volatility than historical volatility. The risk-free interest rate assumption is based upon observed interest rates appropriate for the term of our employee stock options. The dividend yield assumption is based on the history and expectation of dividend payouts. We began segregating options into groups for employees with relatively homogeneous exercise behavior in order to calculate the best estimate of fair value using the binomial valuation model.
Using the binomial model, we estimated the fair value of the stock options granted under our stock option plans using the following assumptions during the fiscal year ended January 30, 2011:
|
Weighted average expected life of stock options (in years)
|
3.1-6.7
|
|||
|
Risk free interest rate
|
1.5% - 3.3
|
%
|
||
|
Volatility
|
42% - 53
|
%
|
||
|
Dividend yield
|
-
|
Accounting standards also require forfeitures to be estimated at the time of grant and revised, if necessary, in subsequent periods if actual forfeitures differ from those estimates. Forfeitures were estimated based on our historical experience. If factors change and we employ different assumptions in the application of accounting standards in future periods, the compensation expense that we record under these accounting standards may differ significantly from what we have recorded in the current period.
Our stock-based compensation expense for employee stock purchase plan is recognized using an accelerated amortization method. We used the Black-Scholes model to estimate the fair value of shares issued under our employee stock purchase plan during the fiscal year ended January 30, 2011, using the following assumptions:
|
Weighted average expected life of stock options (in years)
|
0.5-2.0
|
|||
|
Risk free interest rate
|
0.2-0.8
|
%
|
||
|
Volatility
|
45%-47
|
%
|
||
|
Dividend yield
|
-
|
Litigation, Investigation and Settlement Costs
From time to time, we are involved in legal actions and/or investigations by regulatory bodies. We are aggressively defending our current litigation matters for which we are responsible. However, there are many uncertainties associated with any litigation or investigations, and we cannot be certain that these actions or other third-party claims against us will be resolved without costly litigation, fines and/or substantial settlement payments. If that occurs, our business, financial condition and results of operations could be materially and adversely affected. If information becomes available that causes us to determine that a loss in any of our pending litigation, investigations or settlements is probable, and we can reasonably estimate the loss associated with such events, we will record the loss in accordance with U.S.GAAP. However, the actual liability in any such litigation or investigations may be materially different from our estimates, which could require us to record additional costs.
41
Results of Operations
The following table sets forth, for the periods indicated, certain items in our consolidated statements of operations expressed as a percentage of revenue.
|
|
Year Ended
|
|||||||
|
January 30, 2011
|
January 31, 2010
|
January 25, 2009
|
||||||
|
Revenue
|
100.0
|
%
|
100.0
|
%
|
100.0
|
%
|
||
|
Cost of revenue
|
60.2
|
64.6
|
65.7
|
|||||
|
Gross profit
|
39.8
|
35.4
|
34.3
|
|||||
|
Operating expenses:
|
||||||||
|
Research and development
|
24.0
|
27.3
|
25.0
|
|||||
|
Sales, general and administrative
|
10.2
|
11.0
|
10.6
|
|||||
|
Restructuring charges and other
|
-
|
-
|
0.8
|
|||||
|
Legal settlement
|
(1.6
|
) |
-
|
-
|
||||
|
Total operating expenses
|
32.6
|
38.3
|
36.4
|
|||||
|
Income (loss) from operations
|
7.2
|
(2.9)
|
(2.1
|
)
|
||||
|
Interest and other income, net
|
0.4
|
0.5
|
0.8
|
|||||
|
Income (loss) before income taxes
|
7.6
|
(2.4)
|
(1.3
|
)
|
||||
|
Income tax expense (benefit)
|
0.5
|
(0.4)
|
(0.4
|
)
|
||||
|
Net income (loss)
|
7.1
|
% |
(2.0)
|
%
|
(0.9)
|
%
|
||
Fiscal Years Ended January 30, 2011, January 31, 2010 and January 25, 2009
Revenue
Fiscal Year 2011 vs. Fiscal Year 2010
Revenue was $3.54 billion for the fiscal year 2011 and $3.33 billion for fiscal year 2010, an increase of 7%. For the first quarter of fiscal year 2012, we expect revenue to grow by six to eight percent from the fourth quarter of fiscal year 2011. A discussion of our revenue results for each of our operating segments is as follows:
GPU Business
. GPU Business revenue decreased by 5% to $2.52 billion for fiscal year 2011 compared to $2.66 billion for fiscal year 2010. The decrease was primarily the result of a decline in sales of MCP products as we continued to phase out our chipset product line. Also sales of mainstream desktop GPU decreased as a result of lower unit shipments
driven by weakness in our end customer markets related to unstable economic conditions and increased competition in the lower-end market segments.
Offsetting these declines were increases in sales of our notebook GPU, high-end desktop GPU and memory products. The growth in sales of notebook GPU products was driven by a continuing shift in the market demand towards notebook PCs from desktop PCs as reported in the December 2010 PC Graphics Report from Mercury Research. The growth in memory sales and high-end desktop GPU products was driven primarily by the launch of our new generation of GPUs with Fermi architecture.
PSB
. PSB revenue increased by 60% to $818.6 million for the fiscal year 2011 as compared to $510.0 million for fiscal year 2010. Both the average selling price, or ASP, and unit shipments of professional workstation products increased due to the recovery of corporate spending following the economic recession that began during fiscal year 2009. In addition, we saw strong growth in our Tesla products from the prior year as our high performance computing line gained traction fueled by the Fermi architecture release.
CPB.
CPB revenue increased by 27% to $197.6 million for fiscal year 2011 as compared to $156.0 million for fiscal year 2010. This increase in CPB revenue was primarily driven by sales growth from ramp up in our Tegra 2 products, offset by decreases in embedded product revenues primarily related to the entertainment markets. Revenue from development arrangements and royalties from game console-related products increased slightly in fiscal year 2011 when compared to fiscal year 2010.
42
Fiscal Year 2010 vs. Fiscal Year 2009
Revenue was $3.33 billion for the fiscal year 2010 and $3.42 billion for fiscal year 2009, a decrease of 3%. A discussion of our revenue results for each of our operating segments is as follows:
GPU Business
. GPU Business revenue increased by 3% to $2.66 billion for fiscal year 2010 compared to $2.59 billion for fiscal year 2009. The increase was primarily driven by sales of our ION products. This was offset by a decrease in sales of our notebook GPUs, driven primarily by a combination of a decline in unit demand and a decline in ASP as a result of increased competition in the marketplace and due to share losses we experienced within the notebook segment, during calendar year 2009 compared to calendar year 2008 as reported in the November PC Graphics 2009 Report from Mercury Research.
PSB
. PSB revenue decreased by 26% to $510.2 million for the fiscal year 2010 as compared to $693.4 million for fiscal year 2009. Both the ASPs and unit shipments of professional workstation products decreased, primarily due to the relatively slow recovery of corporate spending following the economic recession that began during fiscal year 2009.
CPB.
CPB revenue increased by 15% to $156.0 million for fiscal year 2010 as compared to $136.3 million for fiscal year 2009. This increase in CPB revenue was primarily driven by sales growth from our embedded products for the automotive and entertainment markets, and was partially offset by a decrease in revenue from development arrangements and royalties from game console-related products in the comparative periods.
Concentration of Revenue
We generated 83%, 84% and 87% of our total revenue for fiscal years 2011, 2010 and 2009, respectively, from sales to customers outside the United States and other Americas. Revenue by geographic region is allocated to individual countries based on the location to which the products are initially billed even if the foreign contract equipment manufacturers, or CEMs’, add-in board and motherboard manufacturers’ revenue is attributable to end customers in a different location.
Revenue from significant customers, those representing 10% or more of total revenue for the respective dates, is summarized as follows:
|
Year Ended
|
||||||||
|
January 30,
2011
|
January 31,
2010
|
January 25,
2009
|
||||||
|
Revenue:
|
||||||||
|
Customer A
|
12
|
%
|
12
|
%
|
7
|
%
|
||
|
Customer B
|
8
|
%
|
9
|
%
|
8
|
%
|
||
|
Customer C
|
6
|
%
|
7
|
%
|
11
|
%
|
||
Gross Profit and Gross Margin
Gross profit consists of total revenue, net of allowances, less cost of revenue. Cost of revenue consists primarily of the cost of semiconductors purchased from subcontractors, including wafer fabrication, assembly, testing and packaging, manufacturing support costs, including labor and overhead associated with such purchases, final test yield fallout, inventory and warranty provisions and shipping costs. Cost of revenue also includes development costs for license, service arrangements and stock-based compensation related to personnel associated with manufacturing.
Gross margin is the percentage of gross profit to revenue. Our gross margin was 39.8%, 35.4% and 34.3% for fiscal years 2011, 2010 and 2009, respectively. Our gross margin is significantly impacted by the mix of products we sell and can vary in any period depending on that product mix.
Our strategy for improving our gross margin relies upon delivering competitive product offerings that allow us to maintain our market leadership position and expand our addressable markets, lowering our product costs by introducing product architectures that take advantage of smaller process geometries and improving our product mix. We expect gross margin to be in the range of 48.5% to 49.5% during the first quarter of fiscal year 2012.
43
A discussion of our gross margin results for each of our operating segments is as follows:
Fiscal Year 2011 vs. Fiscal Year 2010
Our gross margin increased to 39.8% in fiscal year 2011 from 35.4% for fiscal year 2010. The improvement in gross margin was driven primarily due to increased unit sales, mix and better ASPs of our high-end desktop GPU, notebook GPU and workstation products. Cost efficiencies and pricing decisions also helped margin improve in the current fiscal year. Additionally, fiscal year 2010 included $11.4 million charge related to the Company’s tender offer to purchase certain stock options for personnel related to manufacturing which resulted in an adverse impact on gross margins that did not occur in fiscal year 2011.
Offsetting these favorable impacts, we recorded a net charge to cost of revenue in the amount of $181.2 million in fiscal year 2011 compared to $95.9 million in fiscal year 2010 related to a weak die/packing material set that was used in certain versions of our previous generation chips. Our gross margin was favorably impacted by sales of products that were previously written down and sales of such items improved gross margin by approximately 1.9% and 1.6% in fiscal years 2011 and 2010, respectively. Offsetting these releases are provisions for new inventory reserves. The net effect to gross margin from inventory reserves and sales of items previously written down was a 3.0% unfavorable impact in fiscal year 2011 and a 0.2% favorable impact in fiscal year 2010.
GPU Business
. The gross margin of our GPU Business remained comparable during fiscal year 2011 and fiscal year 2010. While higher inventory reserves due to future demand concerns in the first half of fiscal year 2011 and additional warranty accruals arising from a weak die/packaging material set reduced gross margin for fiscal year 2011 when compared to fiscal year 2010, this was more than offset by higher unit sales, mix and ASPs in the high-end desktop and notebook product lines.
PSB
. The gross margin of our PSB remained flat during fiscal year 2011 as compared to fiscal year 2010. Improvements in gross margin as a result of better ASPs and shipment volumes in our Quadro product line were offset by higher inventory reserves recorded in fiscal year 2011, when compared to fiscal year 2010. Tesla gross margin improved due to better production efficiencies was driven by lower product cost and higher unit sales, while ASPs remained stable.
CPB
. The gross margin of our CPB increased during fiscal year 2011 as compared to fiscal year 2010. This increase was a result of better ASPs and higher unit shipment of our Tegra products as well as slightly better revenue from higher margin products and services, including development arrangements and royalties from game console-related products, in the comparative periods.
Fiscal Year 2010 vs. Fiscal Year 2009
Our gross margin increased to 35.4% in fiscal year 2010 from 34.3% for fiscal year 2009. The improvement in gross margin was driven primarily by improved yields of our 55nm products, transition to 40nm products, as well as other manufacturing cost reductions, and more favorable product mix, particularly with increased sales of higher margin MCP products. Furthermore, during the first quarter of fiscal year 2010 our gross margin benefited from the sell-through of inventory that had previously been written down in the fourth quarter of fiscal year 2009. This did not have a significant impact on our gross margin for the remaining quarters in fiscal year 2010. Offsetting these improvements, we recorded a charge to cost of revenue, net of insurance reimbursement in the amount of $95.9 million in fiscal year 2010 compared to $189.3 million in fiscal year 2009 related to weak die/packing material set that was used in certain versions of our previous generation chips.
GPU Business
. The gross margin of our GPU business increased during fiscal year 2010 as compared to fiscal year 2009. This increase was primarily driven by a shift in MCP product mix toward higher margin Intel-based and AMD-based platform products. We also recorded greater benefits to cost of revenue for insurance reimbursement received and a reduction in the warranty charge arising from a weak die/packing material set in certain versions of our previous generation products as compared to prior year. Additionally, improving yields of our 55nm products, a transition to 40nm products, and other manufacturing cost reductions achieved during fiscal year 2010 contributed to improvements in gross margin. Offsetting these improvements were lower ASPs in our mainstream desktop GPU products as well as in our notebook GPU products that we believe were driven by pricing pressures in the marketplace over the comparable period.
PSB
. The gross margin of our PSB decreased during fiscal year 2010 as compared to fiscal year 2009. This decrease was primarily due to a decline in ASPs caused primarily by pricing pressure resulting from the relatively slow recovery of corporate spending during fiscal year 2010 following the economic recession that began during fiscal year 2009.
CPB
. The gross margin of our CPB decreased during fiscal year 2010 as compared to fiscal year 2009. This decrease was a result of declining revenue from higher margin products and services, including development arrangements and royalties from game console-related products, in the comparative periods.
44
Operating Expenses
|
Year Ended
|
Year Ended
|
||||||||||||||||||||||||||||
|
January
30,
2011
|
January 31,
2010
|
$
Change
|
%
Change
|
January 31,
2010
|
January 25,
2009
|
$
Change
|
%
Change
|
||||||||||||||||||||||
|
(In millions)
|
(In millions)
|
||||||||||||||||||||||||||||
|
Research and development expenses
|
$
|
848.8
|
$
|
908.9
|
$
|
(60.1)
|
(7
|
%
|
)
|
$
|
908.9
|
$
|
855.9
|
$
|
53.0
|
6
|
%
|
||||||||||||
|
Sales, general and administrative expenses
|
361.5
|
367.0
|
(5.5)
|
(1
|
%)
|
367.0
|
362.2
|
4.8
|
1
|
%
|
|||||||||||||||||||
|
Restructuring charges and other
|
-
|
-
|
-
|
-
|
%
|
-
|
26.9
|
(26.9)
|
(100
|
%)
|
|||||||||||||||||||
|
Legal settlement
|
(57.0)
|
-
|
(57.0)
|
(100
|
%
|
)
|
-
|
-
|
-
|
-
|
%
|
||||||||||||||||||
|
Total operating expenses
|
$
|
1,153.3
|
$
|
1,275.9
|
$
|
(122.6)
|
(10
|
%)
|
$
|
1,275.9
|
$
|
1,245.0
|
$
|
30.9
|
2.5
|
%
|
|||||||||||||
|
Research and development as a percentage of net revenue
|
24%
|
27
|
%
|
27
|
%
|
25
|
%
|
||||||||||||||||||||||
|
Sales, general and administrative as a percentage of net revenue
|
10%
|
11
|
%
|
11
|
%
|
11
|
%
|
||||||||||||||||||||||
Research and Development
Fiscal Year 2011 vs. Fiscal Year 2010
Research and development expenses decreased by $60.1 million, or 7%. The majority of the decrease was caused by stock-based compensation charges recorded during fiscal year 2010 of $90.5 million related to a tender offer that closed in March 2009. Depreciation and amortization decreased by $8.9 million due to assets being fully depreciated. These decreases were partially offset by an increase in compensation and benefits of $23.5 million primarily due to growth in headcount and an increase of $7.6 million for development expenses.
Fiscal Year 2010 vs. Fiscal Year 2009
Research and development expenses increased by $53.0 million, or 6%. The majority of the increase was caused by stock-based compensation charges recorded during fiscal year 2010 of $90.5 million related to a tender offer that closed in March 2009, offset by a reduction in ongoing stock-based compensation expense of $36.7 million resulting from the cancellation of stock options pursuant to the tender offer. Compensation and benefits related to research and development increased by $11.9 million due to additional new hires and depreciation and amortization expense increased by $4.2 million due to property and equipment purchases. Additionally, our cost reduction initiatives across several discretionary spending areas resulted in decreased expenses related to computer software and equipment of $7.7 million, travel and entertainment of $5.4 million, employee related expenses of $3.5 million, and development expenses of $2.8 million.
Sales, General and Administrative
Fiscal Year 2011 vs. Fiscal Year 2010
Sales, general and administrative expenses decreased by $5.5 million, or 1%. The majority of the decrease was caused by stock-based compensation charges recorded during fiscal year 2010 of $38.3 million related to a tender offer that closed in March 2009. Professional fees decreased by $10.6 million due to decreased legal service charges. Depreciation and amortization decreased by $4.2 million due to assets being fully depreciated. Offsetting these decreases was an increase in compensation and benefits of $28.1 million primarily attributable to growth in headcount. We had increases across discretionary spending areas such as $5.7 million for marketing, $3.2 million for contract labor, and $2.9 million for travel and entertainment to meet the increasing opportunities of our business as the economy recovers. Our expenses also increased by $15.0 million related to the settlement of the NVIDIA GPU Litigation case described in Note 13 of the Notes to the Consolidated Financial Statements in Part IV, Item 15 of this Form 10-K.
Fiscal Year 2010 vs. Fiscal Year 2009
Sales, general and administrative expenses increased by $4.8 million, or 1%. The majority of the increase was caused by stock-based compensation charges recorded during fiscal year 2010 of $38.3 million related to a tender offer that closed in March 2009, offset by a reduction in ongoing stock-based compensation expense of $19.1 million resulting from the cancellation of stock options pursuant to the tender offer. The increase was also driven by an increase in compensation and benefits by $8.4 million due to additional new hires and professional fees by $11.3 million due to legal service charges. Offsetting these increases, our cost reduction initiatives across several discretionary spending areas resulted in decreased expenses related to advertising and promotions of $9.3 million, employee related expenses of $8.0 million, contract labor of $6.6 million, computer software and equipment of $6.5 million, and marketing of $5.4 million.
Restructuring Charges and Other
During fiscal year 2009, we announced a workforce reduction to allow for continued investment in strategic growth areas. As a result, we eliminated approximately 360 positions worldwide, or about 6.5% of our global workforce. During fiscal year 2009, expenses associated with the workforce reduction, which were comprised primarily of severance and benefits payments to these employees, totaled $8.0 million.
Restructuring and other expenses in fiscal year 2009 also included a non-recurring charge of $18.9 million associated with the termination of a development contract related to a new campus construction project that has been put on hold. There were no restructuring related charges in fiscal years 2011 or 2010.
45
Legal Settlement
On January 10, 2011, we entered into a new six-year cross licensing agreement with Intel and also mutually agreed to settle all outstanding legal disputes. The fair valued benefit prescribed to the legal settlement portion was $57.0 million and was recorded in the fourth quarter of fiscal year 2011.
Interest Income and Interest Expense
Interest income, net of interest expense consists of interest earned on cash, cash equivalents and marketable securities. Interest income decreased to $15.9 million in fiscal year 2011, from $19.8 million in fiscal year 2010 primarily due to the result of lower interest rates on our investments. Interest income decreased to $19.8 million in fiscal year 2010 from $42.5 million in fiscal year 2009 primarily due to lower interest rates in fiscal year 2010 compared to fiscal year 2009 and due to interest expense recorded on a capital lease in 2010.
Other Income (Expense), net
Other income and expense primarily consists of realized gains and losses on the sale of marketable securities and foreign currency translation. Other (expense), net of other income was ($0.5) million, ($3.1) million, and $(14.7) million in fiscal years 2011, 2010, and 2009, respectively. The fluctuation between these years was primarily due to other than temporary impairment of our investment in the money market funds held by the Reserve International Liquidity Fund, Ltd., or International Reserve Fund that resulted in a charge of $5.6 million in fiscal year 2009, which was partially recovered in fiscal year 2011 for a gain of $3.0 million resulting from the final disbursement of this fund. Fiscal year 2009 also included other charges related to other than temporary impairment of $2.5 million related to a decline in the value of publicly traded equity securities and $1.8 million related to debt securities held by us that were issued by companies that had filed for bankruptcy. Please refer to Note 18 of the Notes to the Consolidated Financial Statements in Part IV, Item 15 of this Form 10-K for further discussion.
Income Taxes
We recognized income tax expense (benefit) of $18.0 million, $(14.3) million, and $(12.9) million during fiscal years 2011, 2010 and 2009, respectively. Income tax expense (benefit) as a percentage of income (loss) before taxes, or our annual effective tax rate, was 6.7% in fiscal year 2011, 17.4% in fiscal year 2010, and 30.0% in fiscal year 2009.
Our effective tax rate on income or loss before tax for the fiscal years was lower than the United States federal statutory rate of 35% due to income or loss earned in jurisdictions where the tax rate is lower than the United States federal statutory tax rate of 35%, favorable recognition in these fiscal years of the U.S. federal research tax credit and the expiration of statues of limitations in certain non-U.S. jurisdictions for which we had not previously recognized related tax benefits.
Please refer to Note 14 of these Notes to the Consolidated Financial Statements in Part IV, Item 15 of this Form 10-K for additional information.
Liquidity and Capital Resources
|
January 30, 2011
|
January 31, 2010
|
|||||||
|
(In millions)
|
||||||||
|
Cash and cash equivalents
|
$
|
665.4
|
$
|
447.2
|
||||
|
Marketable securities
|
1,825.2
|
1,281.0
|
||||||
|
Cash, cash equivalents, and marketable securities
|
$
|
2,490.6
|
$
|
1,728.2
|
||||
|
Year Ended
|
||||||||||||
|
January 30,
|
January 31,
|
January 25,
|
||||||||||
|
2011
|
2010
|
2009
|
||||||||||
|
(In millions)
|
||||||||||||
|
Net cash provided by operating activities
|
$
|
675.8
|
$
|
487.8
|
$
|
249.4
|
||||||
|
Net cash used in investing activities
|
$ |
(649.7
|
)
|
$ |
(519.3
|
)
|
$ |
(209.4
|
)
|
|||
|
Net cash (used) provided by financing activities
|
$ |
192.0
|
$ |
61.1
|
$ |
(349.3
|
)
|
|||||
46
As of January 30, 2011, we had $2.49 billion in cash, cash equivalents and marketable securities, an increase of $762.4 million from the end of fiscal year 2010. Our portfolio of cash equivalents and marketable securities is managed by several financial institutions. Our investment policy requires the purchase of top-tier investment grade securities, the diversification of asset types and includes certain limits on our portfolio duration.
Operating activities
Operating activities generated cash of $675.8 million, $487.8 million and $249.4 million during fiscal years 2011, 2010 and 2009, respectively.
The cash provided by operating activities increased in fiscal year 2011 when compared to fiscal year 2010 was primarily due to an increase in our net income and favorable changes in operating assets and liabilities compared to fiscal year 2010. For example, accounts receivable decreased due to improved sales linearity and stronger collections during the year, while accrued and other liabilities increased primarily due to an additional net charge for incremental repair and replacement costs from a weak die/packaging material set. Please refer to Note12 of the Notes to the Consolidated Financial Statements in Part IV, Item 15 of this Form 10-K for further discussion. During fiscal year 2011, non-cash charges to earnings included stock-based compensation of $100.4 million and depreciation and amortization of $186.9 million.
The cash provided by operating activities in fiscal year 2010 increased when compared to fiscal year 2009 was primarily due to changes in operating assets and liabilities, including increases in accounts payable resulting from the timing of payments to vendors and a decrease in inventory resulting from an increase in inventory turnover. Additionally, while we experienced a net loss in fiscal year 2010 of $68.0 million, versus a net loss of $30.0 million in fiscal year 2009, non-cash charges to earnings included stock-based compensation of $242.8 million and depreciation and amortization of $196.7 million.
The cash provided by operating activities decreased in fiscal year 2009 due to a decrease in our net income compared to fiscal year 2008 plus the impact of non-cash charges to earnings and deferred income taxes. During fiscal year 2009, non-cash charges to earnings included stock-based compensation of $162.7 million and depreciation and amortization of $185.0 million. Additionally, operating cash flows for fiscal year 2009 also declined due to changes in operating assets and liabilities, including the timing of payments to vendors and a decrease in inventory turnover. Additionally, we incurred $21.8 million in net cash outflows in fiscal year 2009 towards a confidential patent licensing agreement that we entered into in fiscal year 2007.
Investing activities
Investing activities have consisted primarily of purchases and sales of marketable securities, acquisition of businesses and purchases of property and equipment, which include leasehold improvements for our facilities and intangible assets. Investing activities used cash of $649.7 million, $519.3 million and $209.4 million during fiscal years 2011, 2010 and 2009, respectively.
Investing activities for fiscal year 2011 used cash of $649.7 million towards the purchase of marketable securities, net of proceeds from sales of marketable securities. Additionally, we used $97.9 million towards capital expenditures in fiscal year 2011. Capital expenditures included purchase of new research and development equipment, testing equipment to support our increased production requirements, technology licenses, software, intangible assets and leasehold improvements at our facilities in various international locations.
47
Investing activities for fiscal year 2010 used cash of $441.5 million towards the purchase of marketable securities, net of proceeds from sales of marketable securities. Additionally, we used $77.6 million towards capital expenditures in fiscal year 2010. Capital expenditures included purchase of new research and development equipment, testing equipment to support our increased production requirements, technology licenses, software, intangible assets and leasehold improvements at our facilities in various international locations.
Investing activities for fiscal year 2009 used cash of $27.9 million in connection with our acquisition of Ageia and $407.7 million towards capital expenditures, as we built additional facilities to accommodate our growing employee headcount, new research and development equipment, testing equipment to support our increased production requirements, technology licenses, software, intangible assets and leasehold improvements at our facilities in various international locations. Investing activities for capital expenditures in fiscal year 2009 also included payment of approximately $183.8 million for purchase of a property in Santa Clara, California, that includes approximately 25 acres of land and ten commercial buildings. Our original plans for the purchased property included constructing a new campus on the site. We are currently re-evaluating those plans. This cash outflow is offset by $226.7 million of cash from the net proceeds from sales of marketable securities.
Financing activities
Financing activities provided cash of $192.0 million and $61.1 million during fiscal years 2011 and 2010 respectively, and used cash of $349.3 million during fiscal year 2009.
Net cash provided by financing activities in fiscal year 2011 was primarily due to cash proceeds of $177.3 million from common stock issued under our employee stock plans, and a non-cash tax benefit of $15.3 million for the gross windfall related to employee stock based compensation.
Net cash provided by financing activities in fiscal year 2010 was primarily due to cash proceeds of $138.0 million from common stock issued under our employee stock plans, offset by $78.1 million used for the purchase of outstanding stock options related to a tender offer that closed in March 2009. Please refer to Note14 of the Notes to the Consolidated Financial Statements in Part IV, Item 15 of this Form 10-K for further discussion regarding the cash tender offer.
Net cash used by financing activities in fiscal year 2009 was primarily due to $423.6 million used in our stock repurchase program, offset by cash proceeds of $73.5 million from common stock issued under our employee stock plans.
Liquidity
Our primary source of liquidity is cash generated by our operations. Our investment portfolio consisted of cash and cash equivalents, asset-backed securities, commercial paper, mortgage-backed securities issued by government-sponsored enterprises, money market funds and debt securities of corporations, municipalities and the United States government and its agencies. These investments are denominated in United States dollars. As of January 30, 2011, we did not have any investments in auction-rate preferred securities.
All of the cash equivalents and marketable securities are treated as “available-for-sale”. Investments in both fixed rate and floating rate interest earning instruments carry a degree of interest rate risk. Fixed rate debt securities may have their market value adversely impacted due to a rise in interest rates, while floating rate securities may produce less income than expected if interest rates fall. Due in part to these factors, our future investment income may fall short of expectations due to changes in interest rates or if the decline in fair value of our publicly traded debt or equity investments is judged to be other-than-temporary. We may suffer losses in principal if we are forced to sell securities that decline in market value due to changes in interest rates. However, because any debt securities we hold are classified as “available-for-sale,” no gains or losses are realized in our statement of operations due to changes in interest rates unless such securities are sold prior to maturity or unless declines in market values are determined to be other-than-temporary. These securities are reported at fair value with the related unrealized gains and losses included in accumulated other comprehensive income, a component of stockholders’ equity, net of tax.
48
As of January 30, 2011 and January 31, 2010, we had $2.49 billion and $1.73 billion, respectively, in cash, cash equivalents and marketable securities. Our investment policy requires the purchase of top-tier investment grade securities, the diversification of asset types and includes certain limits on our portfolio duration, as specified in our investment policy guidelines. These guidelines also limit the amount of credit exposure to any one issue, issuer or type of instrument. As of January 30, 2011, we were in compliance with our investment policy. As of January 30, 2011, our investments in government agencies and government sponsored enterprises represented approximately 51% of our total investment portfolio, while the financial sector accounted for approximately 34% of our total investment portfolio. All of our investments are with A/A2 or better rated securities.
We performed an impairment review of our investment portfolio as of January 30, 2011. Based on our quarterly impairment review, we concluded that our investments were appropriately valued and did not record any impairment during fiscal year 2011. During fiscal year 2009, we recorded other than temporary impairment charges of $9.9 million.. These charges included $5.6 million related to an other than temporary impairment of our investment in the money market funds held by the Reserve International Liquidity Fund, Ltd., or International Reserve Fund, $2.5 million related to a decline in the value of publicly traded equity securities, and $1.8 million related to debt securities held by us that were issued by companies that had filed for bankruptcy. In the fourth quarter of fiscal year 2011 we recovered $3.1 million of the other than temporary impairment charge previously recorded. This was recorded as other income in fiscal year 2011. Please refer to Note 18 of the Notes to the Consolidated Financial Statements in Part IV, Item 15 of this Form 10-K for further details.
Net realized gains, excluding any impairment charges, were $1.5 million, $1.8 million and $2.1 million for fiscal year 2011, 2010 and 2009 respectively. As of January 30, 2011, we had a net unrealized gain of $10.5 million, which was comprised of gross unrealized gains of $11.0 million, offset by $0.5 million of gross unrealized losses. As of January 31, 2010, we had a net unrealized gain of $12.6 million, which was comprised of gross unrealized gains of $12.7 million, offset by $0.1 million of gross unrealized losses.
Our accounts receivable are highly concentrated and make us vulnerable to adverse changes in our customers’ businesses, and to downturns in the industry and the worldwide economy. Two customers accounted for approximately 17% of our accounts receivable balance at January 30, 2011. While we strive to limit our exposure to uncollectible accounts receivable using a combination of credit insurance and letters of credit, difficulties in collecting accounts receivable could materially and adversely affect our financial condition and results of operations. These difficulties are heightened during periods when economic conditions worsen. We continue to work directly with more foreign customers and it may be difficult to collect accounts receivable from them. We maintain an allowance for doubtful accounts for estimated losses resulting from the inability of our customers to make required payments. This allowance consists of an amount identified for specific customers and an amount based on overall estimated exposure. If the financial condition of our customers were to deteriorate, resulting in an impairment in their ability to make payments, additional allowances may be required, we may be required to defer revenue recognition on sales to affected customers, and we may be required to pay higher credit insurance premiums, any of which could adversely affect our operating results. In the future, we may have to record additional reserves or write-offs and/or defer revenue on certain sales transactions which could negatively impact our financial results.
Patent Cross License Agreement
On January 10, 2011, we entered into a new six-year patent cross licensing agreement, or the License Agreement, with Intel. Under the License Agreement, Intel has granted to NVIDIA and its qualified subsidiaries, and NVIDIA has granted to Intel and Intel’s qualified subsidiaries, a non-exclusive, non-transferable, worldwide license, without the right to sublicense to all patents that are either owned or controlled by the parties at any time that have a first filing date on or before March 31, 2017, to make, have made (subject to certain limitations), use, sell, offer to sell, import and otherwise dispose of certain semiconductor- and electronic-related products anywhere in the world. NVIDIA’s rights to Intel’s patents have certain specified limitations, including but not limited to, NVIDIA was not granted a license to: (1) certain microprocessors, defined in the License Agreement as “Intel Processors” or “Intel Compatible Processors;” (2) certain chipsets that connect to Intel Processors; or (3) certain flash memory products. In connection with the License Agreement, NVIDIA and Intel mutually agreed to settle all outstanding legal disputes. Under the License Agreement, Intel will pay NVIDIA an aggregate amount of $1.5 billion, payable in annual installments, as follows: a $300 million payment on each of January 18, 2011, January 13, 2012 and January 15, 2013 and a $200 million payment on each of January 15, 2014, 2015 and 2016. Please refer to Note 4 of the Notes to the Consolidated Financial Statements in Part IV, Item 15 of this Form 10-K for further information regarding this cross license and the settlement.
49
Cash Tender Offer
During fiscal year 2010, our Board of Directors approved a cash tender offer for certain employee stock options. The tender offer commenced on February 11, 2009 and was completed during the first quarter of fiscal year 2010. The tender offer applied to outstanding stock options held by employees with an exercise price equal to or greater than $17.50 per share. None of the non-employee members of our Board of Directors or our officers who file reports under Section 16(a) of the Securities Exchange Act of 1934 were eligible to participate in the tender offer. All eligible options with exercise prices equal to or greater than $17.50 per share but less than $28.00 per share were eligible to receive a cash payment of $3.00 per option in exchange for the cancellation of the eligible option. All eligible options with exercise prices equal to or greater than $28.00 per share were eligible to receive a cash payment of $2.00 per option in exchange for the cancellation of the eligible option.
A total of 28.5 million options were tendered under the offer for an aggregate cash purchase price of $78.1 million, which was paid in exchange for the cancellation of the eligible options. As a result of the tender offer, we incurred a charge of $140.2 million consisting of $124.1 million related to the remaining unamortized stock based compensation expense associated with the unvested portion of the options tendered in the offer, $11.6 million related to stock-based compensation expense resulting from amounts paid in excess of the fair value of the underlying options, plus $4.5 million related to associated payroll taxes, professional fees and other costs.
Please refer to Note 2 of the Notes to the Consolidated Financial Statements in Part IV, Item 15 of this Form 10-K for further discussion regarding the cash tender offer.
Stock Repurchase Program
Our Board of Directors has authorized us, subject to certain specifications, to repurchase shares of our common stock up to an aggregate maximum amount of $2.7 billion through May 2013. The repurchases will be made from time to time in the open market, in privately negotiated transactions, or in structured stock repurchase programs, and may be made in one or more larger repurchases, in compliance with Rule 10b-18 of the Securities Exchange Act, subject to market conditions, applicable legal requirements, and other factors. The program does not obligate NVIDIA to acquire any particular amount of common stock and the program may be suspended at any time at our discretion. As part of our share repurchase program, we have entered into, and we may continue to enter into, structured share repurchase transactions with financial institutions. These agreements generally require that we make an up-front payment in exchange for the right to receive a fixed number of shares of our common stock upon execution of the agreement, and a potential incremental number of shares of our common stock, within a pre-determined range, at the end of the term of the agreement.
We did not enter into any structured share repurchase transactions or otherwise purchase any shares of our common stock during fiscal year ended January 30, 2011. Through January 30, 2011, we have repurchased an aggregate of 90.9 million shares under our stock repurchase program for a total cost of $1.46 billion. As of January 30, 2011, we are authorized, subject to certain specifications, to repurchase shares of our common stock up to $1.24 billion through May 2013.
Operating Capital and Capital Expenditure Requirements.
We believe that our existing cash balances and anticipated cash flows from operations will be sufficient to meet our operating, acquisition and capital requirements for at least the next twelve months. However, there is no assurance that we will not need to raise additional equity or debt financing within this time frame. Additional financing may not be available on favorable terms or at all and may be dilutive to our then-current stockholders. We also may require additional capital for other purposes not presently contemplated. If we are unable to obtain sufficient capital, we could be required to curtail capital equipment purchases or research and development expenditures, which could harm our business. Factors that could affect our cash used or generated from operations and, as a result, our need to seek additional borrowings or capital include:
·
decreased demand and market acceptance for our products and/or our customers’ products;
·
inability to successfully develop and produce in volume production our next-generation products;
·
competitive pressures resulting in lower than expected average selling prices; and
·
new product announcements or product introductions by our competitors.
We expect to spend approximately $150.0 million to $200.0 million for capital expenditures during fiscal year 2012, primarily for property development, leasehold improvements, software licenses, emulation equipment, computers and engineering workstations. In addition, we may continue to use cash in connection with the acquisition of new businesses or assets.
50
For additional factors see “Item 1A. Risk Factors - Risks Related to Our Business, Industry and Partners -
Our revenue may fluctuate while our operating expenses are relatively fixed, which makes our results difficult to predict and could cause our results to fall short of expectations.
”
Product Defect
Our products are complex and may contain defects or experience failures due to any number of issues in design, fabrication, packaging, materials and/or use within a system. If any of our products or technologies contains a defect, compatibility issue or other error, we may have to invest additional research and development efforts to find and correct the issue. Such efforts could divert our management’s and engineers’ attention from the development of new products and technologies and could increase our operating costs and reduce our gross margin. In addition, an error or defect in new products or releases or related software drivers after commencement of commercial shipments could result in failure to achieve market acceptance or loss of design wins. Also, we may be required to reimburse customers, including for customers’ costs to repair or replace the products in the field, which could cause our revenue to decline. A product recall or a significant number of product returns could be expensive, damage our reputation and could result in the shifting of business to our competitors. Costs associated with correcting defects, errors, bugs or other issues could be significant and could materially harm our financial results.
During the second quarter of fiscal year 2011, we recorded an additional charge to cover the estimated remaining customer warranty, repair, return, replacement and other costs arising from a weak die/packaging material set in certain versions of our previous generation MCP and GPU products used in notebook configurations. The net charge amounted to $193.9 million, of which $181.2 million was charged against cost of revenue. The extra remediation costs are primarily due to additional platforms from late failing systems that we had not previously considered to be at risk. Included in the charge are the estimated costs of implementing a settlement reached during the second quarter of fiscal year 2011 with the plaintiffs of a putative consumer class action lawsuit related to this same matter and the other estimated consumer class action settlement. As a result of this settlement, the other related estimated settlement, and offsetting insurance reimbursements, we recorded a net charge of $12.7 million to sales, general and administrative expense during the second quarter of fiscal year 2011. Together with the $282.0 million net charge we had previously recorded for related estimated costs, this brings the total cumulative net charge to $475.9 million, of which $466.4 million has been charged against cost of revenue and the remainder has been charged to sales, general and administrative.
The previous generation MCP and GPU products that are impacted were included in a number of notebook products that were shipped and sold in significant quantities. Certain notebook configurations of these products are failing in the field at higher than normal rates. Testing suggests a weak material set of die/package combination, system thermal management designs, and customer use patterns are contributing factors for these failures. We have worked with our customers to develop and have made available for download a software driver to cause the system fan to begin operation at the powering up of the system and reduce the thermal stress on these chips. We have also recommended to our customers that they consider changing the thermal management of the products in their notebook system designs. We intend to fully support our customers in their repair and replacement of these impacted products that fail, and their other efforts to mitigate the consequences of these failures. The weak die/packaging material combination is not used in any of our products that are currently in production.
In September, October and November 2008, several putative securities class action lawsuits were filed against us, asserting various claims related to the impacted MCP and GPU products. Please refer to Note 13 of the Notes to the Consolidated Financial Statements in Part IV, Item 15 of this Form 10-K for further information regarding this litigation and the settlement.
Contractual Obligations
The following table summarizes our contractual obligations as of January 30, 2011:
|
Contractual Obligations
|
Total
|
Within 1 Year
|
2-3 Years
|
4-5 Years
|
After 5 Years
|
All Other
|
||||||||||||||||||
|
(In thousands)
|
||||||||||||||||||||||||
|
Operating leases
|
$
|
177,166
|
$
|
46,329
|
$
|
50,969
|
$
|
34,115
|
$
|
45,753
|
$
|
-
|
||||||||||||
|
Capital lease
|
40,126
|
4,654
|
9,714
|
9,849
|
15,909
|
-
|
||||||||||||||||||
|
Purchase obligations (1)
|
546,360
|
546,360
|
-
|
|||||||||||||||||||||
|
Uncertain tax positions, interest and penalties (2)
|
132,211
|
132,211
|
||||||||||||||||||||||
|
Capital purchase obligations
|
31,736
|
31,736
|
||||||||||||||||||||||
|
Total contractual obligations
|
$
|
927,599
|
$
|
629,079
|
$
|
60,683
|
$
|
43,964
|
$
|
61,662
|
$
|
132,211
|
||||||||||||
|
(1)
|
Represents our inventory purchase commitments as of January 30, 2011.
|
|
(2)
|
Represents unrecognized tax benefits of $132.2 million which consists of $46.4 million recorded in non-current income taxes payable and $74.6 million reflected as a reduction to the related deferred tax assets, and the related interest and penalties on the non-current income tax payable of $11.2 million as of January 30, 2011. We are unable to reasonably estimate the timing of any potential tax liability or interest/penalty payments in individual years due to uncertainties in the underlying income tax positions and the timing of the effective settlement of such tax positions.
|
Off-Balance Sheet Arrangements
As of January 30, 2011, we had no material off-balance sheet arrangements as defined in Regulation S-K 303(a)(4)(ii).
Adoption of New Accounting Pronouncements
Please see Note 1 of the Notes to the Consolidated Financial Statements in Part IV, Item 15 of this Form 10-K for a discussion of adoption of new accounting pronouncements.
Recently Issued Accounting Pronouncements
Please see Note 1 of the Notes to the Consolidated Financial Statements in Part IV, Item 15 of this Form 10-K for a discussion of recently issued accounting pronouncements.
51
Investment and Interest Rate Risk
As of January 30, 2011 and January 31, 2010, we had $2.49 billion and $1.73 billion, respectively, in cash, cash equivalents and marketable securities. We invest in a variety of financial instruments, consisting principally of cash and cash equivalents, asset-backed securities, commercial paper, mortgage-backed securities issued by Government-sponsored enterprises, money market funds and debt securities of corporations, municipalities and the United States government and its agencies. As of January 30, 2011, we did not have any investments in auction-rate preferred securities. Our investments are denominated in United States dollars.
All of the cash equivalents and marketable securities are treated as “available-for-sale.” Investments in both fixed rate and floating rate interest earning instruments carry a degree of interest rate risk. Fixed rate securities may have their market value adversely impacted due to a rise in interest rates, while floating rate securities may produce less income than expected if interest rates fall. Due in part to these factors, our future investment income may fall short of expectations due to changes in interest rates or if the decline in fair value of our publicly traded debt or equity investments is judged to be other-than-temporary. We may suffer losses in principal if we are forced to sell securities that decline in securities market value due to changes in interest rates. However, because any debt securities we hold are classified as “available-for-sale,” no gains or losses are realized in our Consolidated Statements of Operations due to changes in interest rates unless such securities are sold prior to maturity or unless declines in value are determined to be other-than-temporary. These securities are reported at fair value with the related unrealized gains and losses included in accumulated other comprehensive income (loss), a component of stockholders’ equity, net of tax.
As of January 30, 2011, we performed a sensitivity analysis on our floating and fixed rate financial investments. According to our analysis, parallel shifts in the yield curve of both plus or minus 0.5% would result in changes in fair values for these investments of approximately $11.7 million.
The financial turmoil that affected the banking system and financial markets and increased the possibility that financial institutions might consolidate or go out of business resulted in a tightening in the credit markets, a low level of liquidity in many financial markets, and extreme volatility in fixed income, credit, currency and equity markets. There could be a number of follow-on effects from the credit crisis on our business, including insolvency of key suppliers resulting in product delays; inability of customers, including channel partners, to obtain credit to finance purchases of our products and/or customer, including channel partner, insolvencies; and failure of financial institutions, which may negatively impact our treasury operations. Other income and expense could also vary materially from expectations depending on gains or losses realized on the sale or exchange of financial instruments; impairment charges related to debt securities as well as equity and other investments; interest rates; and cash, cash equivalent and marketable securities balances. Volatility in the financial markets and economic uncertainty increases the risk that the actual amounts realized in the future on our financial instruments could differ significantly from the fair values currently assigned to them. As of January 30, 2011, our investments in government agencies and government sponsored enterprises represented approximately 51% of our total investment portfolio, while the financial sector accounted for approximately 34% of our total investment portfolio. Of the financial sector investments, over half are guaranteed by the U.S. government. Substantially all of our investments are with A/A2 or better rated securities. If the fair value of our investments in these sectors was to decline by 2%-5%, the fair values of these investments would decline by approximately $37-$93 million.
Exchange Rate Risk
We consider our direct exposure to foreign exchange rate fluctuations to be minimal. Gains or losses from foreign currency remeasurement are included in “Other income (expense), net” in our Consolidated Financial Statements and to date have not been significant. The impact of foreign currency transaction loss included in determining net income (loss) for fiscal years 2011, 2010 and 2009 was $2.4 million, $0.9 million and $2.0 million, respectively. Currently, sales and arrangements with third-party manufacturers provide for pricing and payment in United States dollars, and, therefore, are not subject to exchange rate fluctuations. Increases in the value of the United States’ dollar relative to other currencies would make our products more expensive, which could negatively impact our ability to compete. Conversely, decreases in the value of the United States’ dollar relative to other currencies could result in our suppliers raising their prices in order to continue doing business with us. Fluctuations in currency exchange rates could harm our business in the future.
We may enter into certain transactions such as forward contracts which are designed to reduce the future potential impact resulting from changes in foreign currency exchange rates. There were no forward exchange contracts outstanding at January 30, 2011.
52
The information required by this Item is set forth in our Consolidated Financial Statements and Notes thereto included in this Annual Report on Form 10-K.
Not applicable.
Controls and Procedures
Disclosure Controls and Procedures
Based on their evaluation as of January 30, 2011, our management, including our Chief Executive Officer and Chief Financial Officer, has concluded that our disclosure controls and procedures (as defined in Rule 13a-15(e) under the Securities Exchange Act of 1934, as amended, or the Exchange Act) were effective to provide reasonable assurance.
Management’s Annual Report on Internal Control Over Financial Reporting
Our management is responsible for establishing and maintaining adequate internal control over financial reporting, as such term is defined in Exchange Act Rule 13a-15(f). Under the supervision and with the participation of our management, including our Chief Executive Officer and Chief Financial Officer, we conducted an evaluation of the effectiveness of our internal control over financial reporting as of January 30, 2011 based on the criteria set forth in
Internal Control - Integrated Framework
issued by the Committee of Sponsoring Organizations of the Treadway Commission. Based on our evaluation under the criteria set forth in
Internal Control — Integrated Framework
, our management concluded that our internal control over financial reporting was effective as of January 30, 2011.
The effectiveness of our internal control over financial reporting as of January 30, 2011 has been audited by PricewaterhouseCoopers LLP, an independent registered public accounting firm, as stated in its report which is included herein.
Changes in Internal Control Over Financial Reporting
There were no changes in our internal control over financial reporting during our last fiscal quarter that have materially affected, or are reasonably likely to materially affect, our internal control over financial reporting.
Inherent Limitations on Effectiveness of Controls
Our management, including our Chief Executive Officer and Chief Financial Officer, does not expect that our disclosure controls and procedures or our internal controls, will prevent all error and all fraud. A control system, no matter how well conceived and operated, can provide only reasonable, not absolute, assurance that the objectives of the control system are met. Further, the design of a control system must reflect the fact that there are resource constraints, and the benefits of controls must be considered relative to their costs. Because of the inherent limitations in all control systems, no evaluation of controls can provide absolute assurance that all control issues and instances of fraud, if any, within NVIDIA have been detected.
None.
53
Identification of Directors
Reference is made to the information regarding directors appearing under the heading “Proposal 1 - Election of Directors” in our 2011 Proxy Statement, which information is hereby incorporated by reference.
Identification of Executive Officers
Reference is made to the information regarding executive officers appearing under the heading “Executive Officers of the Registrant” in Part I of this Annual Report on Form 10-K, which information is hereby incorporated by reference.
Identification of Audit Committee and Financial Expert
Reference is made to the information regarding directors appearing under the heading “Report of the Audit Committee of the Board of Directors” and “Information about the Board of Directors and Corporate Governance” in our 2011 Proxy Statement, which information is hereby incorporated by reference.
Material Changes to Procedures for Recommending Directors
Reference is made to the information regarding directors appearing under the heading “Information about the Board of Directors and Corporate Governance” in our 2011 Proxy Statement, which information is hereby incorporated by reference.
Compliance with Section 16(a) of the Exchange Act
Reference is made to the information appearing under the heading “Section 16(a) Beneficial Ownership Reporting Compliance” in our 2011 Proxy Statement, which information is hereby incorporated by reference.
Code of Conduct
Reference is made to the information appearing under the heading “Information about the Board of Directors and Corporate Governance - Code of Conduct” in our 2011 Proxy Statement, which information is hereby incorporated by reference. The full text of our “Code” and “Financial
Team Code” are published on the Investor Relations portion of our web site, under Corporate Governance, at
www.nvidia.com
. The contents of our website are not a part of this Annual Report on Form 10-K.
The information required by this item is hereby incorporate by reference from the sections entitled “Executive Compensation”, “Compensation Committee Interlocks and Insider Participation”, “Director Compensation” and “Compensation Committee Report” in our 2011 Proxy Statement.
Ownership of NVIDIA Securities
The information required by this item is hereby incorporated by reference from the section entitled “Security Ownership of Certain Beneficial Owners and Management” in our 2011 Proxy Statement.
Equity Compensation Plan Information
Information regarding our equity compensation plans, including both stockholder approved plans and non-stockholder approved plans, will be contained in our 2011 Proxy Statement under the caption ”Equity Compensation Plan Information,” and is incorporated by reference into this Annual Report on Form 10-K.
54
The information required by this item is hereby incorporated by reference from the sections entitled “Transactions with Related Persons”, “Review of Transactions with Related Persons” and “Information about the Board of Directors and Corporate Governance - Independence of the Members of the Board of Directors” in our 2011 Proxy Statement.
The information required by this item is hereby incorporated by reference from the section entitled “Fees Billed by the Independent Registered Public Accounting Firm” in our 2011 Proxy Statement.
55
|
Page
|
|||
|
(a)
|
1.
|
Consolidated Financial Statements
|
|
|
57
|
|||
|
58
|
|||
|
59
|
|||
|
60
|
|||
|
61
|
|||
|
62
|
|||
|
(a)
|
2.
|
Financial Statement Schedule
|
|
|
93
|
|||
|
(a)
|
3.
|
Exhibits
|
|
|
94
|
|||
56
To the
Stockholders and Board of Directors of NVIDIA Corporation:
In our opinion, the consolidated financial statements listed in the index appearing under Item 15(a)(1) present fairly, in all material respects, the financial position of NVIDIA Corporation and its subsidiaries at January 30, 2011 and January 31, 2010, and the results of their operations and their cash flows for each of the three years in the period ended January 30, 2011 in conformity with accounting principles generally accepted in the United States of America. In addition, in our opinion, the financial statement schedule listed in the index appearing under Item 15(a)(2) presents fairly, in all material respects, the information set forth therein when read in conjunction with the related consolidated financial statements. Also in our opinion, the Company maintained, in all material respects, effective internal control over financial reporting as of January 30, 2011, based on criteria established in
Internal Control - Integrated Framework
issued by the Committee of Sponsoring Organizations of the Treadway Commission (COSO). The Company's management is responsible for these financial statements and financial statement schedule, for maintaining effective internal control over financial reporting and for its assessment of the effectiveness of internal control over financial reporting, included in Management's Report on Internal Control over Financial Reporting appearing under Item 9A. Our responsibility is to express opinions on these financial statements, on the financial statement schedule, and on the Company's internal control over financial reporting based on our integrated audits. We conducted our audits in accordance with the standards of the Public Company Accounting Oversight Board (United States). Those standards require that we plan and perform the audits to obtain reasonable assurance about whether the financial statements are free of material misstatement and whether effective internal control over financial reporting was maintained in all material respects. Our audits of the financial statements included examining, on a test basis, evidence supporting the amounts and disclosures in the financial statements, assessing the accounting principles used and significant estimates made by management, and evaluating the overall financial statement presentation. Our audit of internal control over financial reporting included obtaining an understanding of internal control over financial reporting, assessing the risk that a material weakness exists, and testing and evaluating the design and operating effectiveness of internal control based on the assessed risk. Our audits also included performing such other procedures as we considered necessary in the circumstances. We believe that our audits provide a reasonable basis for our opinions.
A company’s internal control over financial reporting is a process designed to provide reasonable assurance regarding the reliability of financial reporting and the preparation of financial statements for external purposes in accordance with generally accepted accounting principles. A company’s internal control over financial reporting includes those policies and procedures that (i) pertain to the maintenance of records that, in reasonable detail, accurately and fairly reflect the transactions and dispositions of the assets of the company; (ii) provide reasonable assurance that transactions are recorded as necessary to permit preparation of financial statements in accordance with generally accepted accounting principles, and that receipts and expenditures of the company are being made only in accordance with authorizations of management and directors of the company; and (iii) provide reasonable assurance regarding prevention or timely detection of unauthorized acquisition, use, or disposition of the company’s assets that could have a material effect on the financial statements.
Because of its inherent limitations, internal control over financial reporting may not prevent or detect misstatements. Also, projections of any evaluation of effectiveness to future periods are subject to the risk that controls may become inadequate because of changes in conditions, or that the degree of compliance with the policies or procedures may deteriorate.
/s/ PricewaterhouseCoopers LLP
San Jose, CA
March 16, 2011
57
|
January 30,
2011
|
January 31,
2010
|
January 25,
2009
|
||||||||
|
Revenue
|
$
|
3,543,309
|
$
|
3,326,445
|
$
|
3,424,859
|
||||
|
Cost of revenue
|
2,134,219
|
2,149,522
|
2,250,590
|
|||||||
|
Gross profit
|
1,409,090
|
1,176,923
|
1,174,269
|
|||||||
|
Operating expenses:
|
||||||||||
|
Research and development
|
848,830
|
908,851
|
855,879
|
|||||||
|
Sales, general and administrative
|
361,513
|
367,017
|
362,222
|
|||||||
|
Restructuring charges and other
|
-
|
-
|
26,868
|
|||||||
|
Legal settlement
|
(57,000
|
)
|
-
|
-
|
||||||
|
Total operating expenses
|
1,153,343
|
1,275,868
|
1,244,969
|
|||||||
|
Income (loss) from operations
|
255,747
|
(98,945
|
)
|
(70,700
|
)
|
|||||
|
Interest income
|
19,057
|
23,115
|
42,859
|
|||||||
|
Interest expense
|
(3,127
|
)
|
(3,320
|
)
|
(406
|
)
|
||||
|
Other income (expense), net
|
(508
|
)
|
(3,144
|
)
|
(14,707
|
)
|
||||
|
Income (loss) before income tax
|
271,169
|
(82,294
|
)
|
(42,954
|
)
|
|||||
|
Income tax expense (benefit)
|
18,023
|
(14,307
|
)
|
(12,913
|
)
|
|||||
|
Net income (loss)
|
$ |
253,146
|
$
|
(67,987
|
)
|
$
|
(30,041
|
)
|
||
|
Basic net income (loss) per share
|
$
|
0.44
|
$
|
(0.12
|
)
|
$
|
(0.05
|
)
|
||
|
Weighted average shares used in basic per share computation
|
575,177
|
549,574
|
548,126
|
|||||||
|
Diluted net income (loss) per share
|
$
|
0.43
|
$
|
(0.12
|
)
|
$
|
(0.05
|
)
|
||
|
Weighted average shares used in diluted per share computation
|
588,684
|
549,574
|
548,126
|
|||||||
See accompanying notes to the consolidated financial statements.
58
|
January 30, 2011
|
January 31, 2010
|
|||||||
|
ASSETS
|
||||||||
|
Current assets :
|
||||||||
|
Cash and cash equivalents
|
$
|
665,361
|
$
|
447,221
|
||||
|
Marketable securities
|
1,825,202
|
1,281,006
|
||||||
|
Accounts receivable, less allowances of $15,839 and $16,330 in 2011 and 2010, respectively
|
348,770
|
374,963
|
||||||
|
Inventories
|
345,525
|
330,674
|
||||||
|
Prepaid expenses and other
|
32,636
|
38,214
|
||||||
|
Deferred income taxes
|
9,456
|
8,752
|
||||||
|
Total current assets
|
3,226,950
|
2,480,830
|
||||||
|
Property and equipment, net
|
568,857
|
571,858
|
||||||
|
Goodwill
|
369,844
|
369,844
|
||||||
|
Intangible assets, net
|
288,745
|
120,458
|
||||||
|
Deposits and other assets
|
40,850
|
42,928
|
||||||
|
Total assets
|
$
|
4,495,246
|
$
|
3,585,918
|
||||
|
LIABILITIES AND STOCKHOLDERS’ EQUITY
|
||||||||
|
Current liabilities:
|
||||||||
|
Accounts payable
|
$
|
286,138
|
$
|
344,527
|
||||
|
Accrued liabilities and other
|
656,544
|
439,851
|
||||||
|
Total current liabilities
|
942,682
|
784,378
|
||||||
|
Other long-term liabilities
|
347,713
|
111,950
|
||||||
|
Capital lease obligations, long term
|
23,389
|
24,450
|
||||||
|
Commitments and contingencies - see Note 13
|
-
|
-
|
||||||
|
Stockholders’ equity:
|
||||||||
|
Preferred stock, $.001 par value; 2,000,000 shares authorized; none issued
|
-
|
-
|
||||||
|
Common stock, $.001 par value; 2,000,000,000 shares authorized; 680,598,737 shares issued
and 588,555,701 outstanding in 2011; and 652,391,708 shares issued
and 561,465,851 outstanding in 2010
|
677
|
653
|
||||||
|
Additional paid-in capital
|
2,500,577
|
2,219,401
|
||||||
|
Treasury stock, at cost (92,043,036 shares in 2011 and 90,925,857 shares in 2010)
|
(1,479,392
|
)
|
(1,463,268
|
)
|
||||
|
Accumulated other comprehensive income
|
10,272
|
12,172
|
||||||
|
Retained earnings
|
2,149,328
|
1,896,182
|
||||||
|
Total stockholders' equity
|
3,181,462
|
2,665,140
|
||||||
|
Total liabilities and stockholders' equity
|
$
|
4,495,246
|
$
|
3,585,918
|
||||
See accompanying notes to the consolidated financial statements.
59
|
Common Stock
Outstanding
Shares Amount
|
Additional Paid-in Capital
|
Treasury Stock
|
Accumulated Other Comprehensive Income(Loss)
|
Retained Earnings
|
Total Stockholders' Equity
|
|||||||||||||||||||||||
|
Balances, January 27, 2008
|
557,102,588
|
$ |
619
|
$ |
1,654,681
|
$ |
(1,039,632
|
)
|
$ |
8,034
|
$ |
1,994,210
|
$ |
2,617,912
|
||||||||||||||
|
Comprehensive Income (Loss):
|
||||||||||||||||||||||||||||
|
Unrealized loss, net of $2054 tax effect
|
-
|
-
|
-
|
-
|
(3,920
|
)
|
-
|
(3,920
|
)
|
|||||||||||||||||||
|
Reclassification adjustment for net realized gains included in net income, net of $135 tax effect
|
-
|
-
|
-
|
-
|
(249
|
)
|
-
|
(249
|
)
|
|||||||||||||||||||
|
Net Loss
|
-
|
-
|
-
|
-
|
(30,041
|
)
|
(30,041
|
)
|
||||||||||||||||||||
|
Total Comprehensive Loss
|
(34,210
|
)
|
||||||||||||||||||||||||||
|
Issuance of common stock from stock plans
|
10,685,101
|
10
|
73,537
|
-
|
-
|
-
|
73,547
|
|||||||||||||||||||||
|
Stock repurchase
|
(29,326,923
|
)
|
-
|
-
|
(423,636
|
)
|
-
|
-
|
(423,636
|
)
|
||||||||||||||||||
|
Tax benefit from stock-based compensation
|
-
|
-
|
(2,946
|
)
|
-
|
-
|
-
|
(2,946
|
)
|
|||||||||||||||||||
|
Stock-based compensation
|
-
|
-
|
163,985
|
-
|
-
|
-
|
163,985
|
|||||||||||||||||||||
|
Balances, January 25, 2009
|
538,460,766
|
629
|
1,889,257
|
(1,463,268
|
)
|
3,865
|
1,964,169
|
2,394,652
|
||||||||||||||||||||
|
Comprehensive Income (Loss):
|
||||||||||||||||||||||||||||
|
Unrealized gain, net of $484 tax effect
|
-
|
-
|
-
|
-
|
9,417
|
-
|
9,417
|
|||||||||||||||||||||
|
Reclassification adjustment for net realized gains included in net income, net of $598 tax effect
|
-
|
-
|
-
|
-
|
(1,110
|
)
|
-
|
(1,110
|
)
|
|||||||||||||||||||
|
Net Loss
|
-
|
-
|
-
|
-
|
-
|
(67,987
|
)
|
(67,987
|
)
|
|||||||||||||||||||
|
Total Comprehensive Loss
|
(59,680
|
)
|
||||||||||||||||||||||||||
|
Issuance of common stock from stock plans
|
23,005,124
|
24
|
138,005
|
-
|
-
|
-
|
138,029
|
|||||||||||||||||||||
|
Stock repurchase
|
(39
|
)
|
- | - | - | - | - | - | ||||||||||||||||||||
|
Tax benefit from stock-based compensation
|
-
|
-
|
29,891
|
-
|
-
|
-
|
29,891
|
|||||||||||||||||||||
|
Stock-based compensation
|
-
|
-
|
104,588
|
-
|
-
|
-
|
104,588
|
|||||||||||||||||||||
|
Tender offer
|
-
|
-
|
(78,075
|
)
|
-
|
-
|
-
|
(78,075
|
)
|
|||||||||||||||||||
|
Charges related to stock option purchase-tender offer
|
-
|
-
|
135,735
|
-
|
-
|
-
|
135,735
|
|||||||||||||||||||||
|
Balances, January 31, 2010
|
561,465,851
|
|
653
|
|
2,219,401
|
|
(1,463,268
|
)
|
|
12,172
|
|
1,896,182
|
|
2,665,140
|
||||||||||||||
|
Comprehensive Income (Loss):
|
||||||||||||||||||||||||||||
|
Unrealized loss, net of $306 tax effect
|
- | - | - | - |
(918
|
)
|
- |
(918
|
)
|
|||||||||||||||||||
|
Reclassification adjustment for net realized gains included in net income, net of $528 tax effect
|
- | - | - | - |
(982
|
)
|
- |
(982
|
)
|
|||||||||||||||||||
|
Net Income
|
- | - | - | - | - |
253,146
|
253,146
|
|||||||||||||||||||||
|
Total Comprehensive Income
|
- | - | - | - | - | - |
251,246
|
|||||||||||||||||||||
|
Issuance of common stock from stock plans
|
28,207,029
|
24
|
193,381
|
- | - | - |
193,405
|
|||||||||||||||||||||
|
Stock repurchase
|
(1,117,179
|
)
|
- | - |
(16,124
|
)
|
- | - |
(16,124
|
)
|
||||||||||||||||||
|
Tax benefit from stock-based compensation
|
-
|
-
|
(14,201
|
)
|
-
|
-
|
-
|
(14,201
|
)
|
|||||||||||||||||||
|
Stock-based compensation
|
-
|
-
|
101,996
|
-
|
-
|
-
|
101,996
|
|||||||||||||||||||||
|
Balances, January 30, 2011
|
588,555,701
|
$
|
677
|
$
|
2,500,577
|
$
|
(1,479,392
|
)
|
$
|
10,272
|
$
|
2,149,328
|
$
|
3,181,462
|
||||||||||||||
See accompanying notes to the consolidated financial statements.
60
|
Year ended
|
||||||||||||
|
January 30
,
2011
|
January 31,
2010
|
January 25,
2009
|
||||||||||
|
Cash flows from operating activities:
|
||||||||||||
|
Net income (loss)
|
$
|
253,146
|
$
|
(67,987
|
)
|
$
|
(30,041
|
)
|
||||
|
Adjustments to reconcile net income (loss) to net cash provided by operating activities:
|
||||||||||||
|
Stock-based compensation expense related to stock option purchase
|
-
|
135,735
|
-
|
|||||||||
|
Stock-based compensation expense
|
100,353
|
107,091
|
162,706
|
|||||||||
|
Depreciation and amortization
|
186,989
|
196,664
|
185,023
|
|||||||||
|
Impairment charge on investments
|
-
|
-
|
9,891
|
|||||||||
|
Deferred income taxes
|
(2,646
|
)
|
(21,147
|
)
|
(23,277
|
)
|
||||||
|
Payments under patent licensing arrangement
|
685
|
(857
|
)
|
(21,797
|
)
|
|||||||
|
Tax benefit from stock based compensation
|
(15,316)
|
(2,034)
|
(871)
|
|||||||||
|
Other
|
887
|
3,927
|
1,059
|
|||||||||
|
Changes in operating assets and liabilities, net of effects of acquisitions:
|
||||||||||||
|
Accounts receivable
|
26,341
|
(56,741
|
)
|
348,873
|
||||||||
|
Inventories
|
(14,128
|
)
|
204,656
|
(177,295
|
)
|
|||||||
|
Prepaid expenses and other current assets
|
8,528
|
1,580
|
21,528
|
|||||||||
|
Deposits and other assets
|
4,331
|
3,857
|
(2,108
|
)
|
||||||||
|
Accounts payable
|
(69,786
|
)
|
119,366
|
(283,207
|
)
|
|||||||
|
Accrued liabilities and other long-term liabilities
|
196,413
|
(136,303
|
)
|
58,876
|
||||||||
|
Net cash provided by operating activities
|
675,797
|
487,807
|
249,360
|
|||||||||
|
Cash flows from investing activities:
|
||||||||||||
|
Purchases of marketable securities
|
(1,719,700
|
)
|
(1,193,948
|
)
|
(999,953
|
)
|
||||||
|
Proceeds from sales and maturities of marketable securities
|
1,170,075
|
752,434
|
1,226,646
|
|||||||||
|
Purchases of property and equipment and intangible assets
|
(97,890
|
)
|
(77,601
|
)
|
(407,670
|
)
|
||||||
|
Acquisition of businesses, net of cash and cash equivalents
|
-
|
-
|
(27,948
|
)
|
||||||||
|
Other
|
(2,163
|
)
|
(218
|
)
|
(442
|
)
|
||||||
|
Net cash used in investing activities
|
(649,678
|
)
|
(519,333
|
)
|
(209,367
|
)
|
||||||
|
Cash flows from financing activities:
|
||||||||||||
|
Payments related to stock option purchase
|
-
|
(78,075
|
)
|
-
|
||||||||
|
Payments related to repurchases of common stock
|
-
|
-
|
(423,636
|
)
|
||||||||
|
Proceeds from issuance of common stock under employee stock plans
|
177,276
|
138,029
|
73,547
|
|||||||||
|
Tax benefit from stock based compensation
|
15,316
|
2,034
|
871
|
|||||||||
|
Other
|
(571)
|
(929)
|
(56)
|
|||||||||
|
Net cash provided by (used in) financing activities
|
192,021
|
61,059
|
(349,274
|
)
|
||||||||
|
Change in cash and cash equivalents
|
218,140
|
29,533
|
(309,281
|
)
|
||||||||
|
Cash and cash equivalents at beginning of period
|
447,221
|
417,688
|
726,969
|
|||||||||
|
Cash and cash equivalents at end of period
|
$
|
665,361
|
$
|
447,221
|
$
|
417,688
|
||||||
|
Supplemental disclosures of cash flow information:
|
||||||||||||
|
Cash paid for income taxes, net
|
$
|
(1,071
|
)
|
$
|
4,217
|
$
|
7,620
|
|||||
|
Cash paid for interest on capital lease obligations
|
$
|
3,127
|
$
|
3,256
|
$
|
-
|
||||||
|
Year Ended
|
||||||||||||
|
January 30,
2011
|
January 31,
2010
|
January 25,
2009
|
||||||||||
|
Non-cash activities:
|
||||||||||||
|
Change in unrealized gains (losses) from marketable securities
|
$
|
(1,899
|
)
|
$ |
8,305
|
$
|
(6,360
|
)
|
||||
|
Assets acquired by assuming related liabilities
|
$
|
252,796
|
$ |
37,830
|
$
|
47,236
|
||||||
|
Acquisition of business - goodwill adjustment
|
$
|
-
|
$ |
-
|
$
|
3,411
|
||||||
See accompanying notes to the consolidated financial statements.
61
NVIDIA CORPORATION AND SUBSIDIARIES
NOTES TO THE CONSOLIDATED FINANCIAL STATEMENTS
Our Company
NVIDIA Corporation invented the graphics processing unit, or GPU, in 1999. Since then, we have strived to set new standards in visual computing with interactive graphics available on devices ranging from tablets and smart phones to notebooks and workstations. Our expertise in programmable GPUs and computer-systems technology has led to breakthroughs in parallel processing which make supercomputing inexpensive and widely accessible. We are strategically investing in three major areas – visual computing, high performance computing and mobile computing. We serve the visual computing market with our consumer GeForce graphics products and professional Quadro graphics products; the high performance computing market with our Tesla computing solutions products; and the mobile computing market with our Tegra system-on-chip products.
We have three financial reporting segments – GPU, Professional Solutions Business, or PSB and Consumer Products Business, or CPB. During fiscal years 2010 and 2009, we operated and reported four major product-line operating segments: the GPU business, the PSB business, the media and communications processor, or MCP, business, and the CPB business. However, during the first quarter of fiscal year 2011, we began reporting internally the results of our former MCP segment along with the results of our GPU segment to reflect the way we manage the GPU business. Comparative periods presented reflect this change.
Our GPU business is comprised primarily of our GeForce discrete and chipset products which support desktop and notebook personal computers, or PCs, plus memory products. Our PSB is comprised of our Quadro professional workstation products and other professional graphics products, including our NVIDIA Tesla high-performance computing products. Our CPB is comprised of our Tegra mobile products which support tablets, smartphones, personal media players, or PMPs, internet television, automotive navigation, and other similar devices. CPB also includes license, royalty, other revenue and associated costs related to video game consoles and other digital consumer electronics devices. Original equipment manufacturers, or OEMs, original design manufacturers, or ODMs, add-in-card manufacturers, system builders and consumer electronics companies worldwide utilize our processors as a core component of their entertainment, business and professional solutions.
We were incorporated in California in April 1993 and reincorporated in Delaware in April 1998. Our headquarter facilities are in Santa Clara, California. Our web address is
www.nvidia.com
. The contents of our website are not a part of this Form 10-K.
All references to “NVIDIA,” “we,” “us,” “our” or the “Company” mean NVIDIA Corporation and its subsidiaries, except where it is made clear that the term means only the parent company.
Fiscal Year
We operate on a 52 or 53-week year, ending on the last Sunday in January. Fiscal year 2011 was a 52-week year while fiscal year 2010 was 53- week year and 2009 was a 52-week year.
Reclassifications
Certain prior fiscal year balances have been reclassified to conform to the current fiscal year presentation.
Principles of Consolidation
Our consolidated financial statements include the accounts of NVIDIA Corporation and its wholly-owned subsidiaries. All material intercompany balances and transactions have been eliminated in consolidation.
Use of Estimates
The preparation of financial statements in conformity with accounting principles generally accepted in the United States of America, or U.S.GAAP, requires management to make estimates and assumptions that affect the reported amounts of assets and liabilities and disclosures of contingent assets and liabilities at the date of the financial statements and the reported amounts of revenue and expenses during the reporting period. Actual results could differ from those estimates. On an on-going basis, we evaluate our estimates, including those related to revenue recognition, cash equivalents and marketable securities, accounts receivable, inventories, income taxes, goodwill, stock-based compensation, warranty liabilities, litigation, investigation and settlement costs and other contingencies. These estimates are based on historical facts and various other assumptions that we believe are reasonable.
62
NVIDIA CORPORATION AND SUBSIDIARIES
NOTES TO THE CONSOLIDATED FINANCIAL STATEMENTS
(Continued)
Revenue Recognition
Product Revenue
We recognize revenue from product sales when persuasive evidence of an arrangement exists, the product has been delivered, the price is fixed or determinable, and collection is reasonably assured. For most sales, we use a binding purchase order and in certain cases we use a contractual agreement as evidence of an arrangement. We consider delivery to occur upon shipment provided title and risk of loss have passed to the customer based on the shipping terms. At the point of sale, we assess whether the arrangement fee is fixed or determinable and whether collection is reasonably assured. If we determine that collection of a fee is not reasonably assured, we defer the fee and recognize revenue at the time collection becomes reasonably assured, which is generally upon receipt of payment.
Our policy on sales to certain distributors, with rights of return, is to defer recognition of revenue and related cost of revenue until the distributors resell the product, as the level of returns cannot be reasonably estimated.
Our customer programs primarily involve rebates, which are designed to serve as sales incentives to resellers of our products in various target markets. We accrue for 100% of the potential rebates and do not apply a breakage factor. We recognize a liability for these rebates at the later of the date at which we record the related revenue or the date at which we offer the rebate. Rebates typically expire six months from the date of the original sale, unless we reasonably believe that the customer intends to claim the rebate. Unclaimed rebates are reversed to revenue.
Our customer programs also include marketing development funds, or MDFs. We account for MDFs as either a reduction of revenue or an operating expense, depending on the nature of the program. MDFs represent monies paid to retailers, system builders, original equipment manufacturers, or OEMs, distributors and add-in card partners that are earmarked for market segment development and expansion and typically are designed to support our partners’ activities while also promoting NVIDIA products. Depending on market conditions, we may take actions to increase amounts offered under customer programs, possibly resulting in an incremental reduction of revenue at the time such programs are offered.
We also record a reduction to revenue by establishing a sales return allowance for estimated product returns at the time revenue is recognized, based primarily on historical return rates. However, if product returns for a particular fiscal period exceed historical return rates we may determine that additional sales return allowances are required to properly reflect our estimated exposure for product returns.
License and Development Revenue
For license arrangements that require significant customization of our intellectual property components, we generally recognize this license revenue over the period that services are performed. For all license and service arrangements, we determine progress to completion based on actual direct labor hours incurred to date as a percentage of the estimated total direct labor hours required to complete the project. We periodically evaluate the actual status of each project to ensure that the estimates to complete each contract remain accurate. A provision for estimated losses on contracts is made in the period in which the loss becomes probable and can be reasonably estimated. Costs incurred in advance of revenue recognized are recorded as deferred costs on uncompleted contracts. If the amount billed exceeds the amount of revenue recognized, the excess amount is recorded as deferred revenue. Revenue recognized in any period is dependent on our progress toward completion of projects in progress. Significant management judgment and discretion are used to estimate total direct labor hours. Any changes in or deviations from these estimates could have a material effect on the amount of revenue we recognize in any period.
Royalty revenue is recognized related to the distribution or sale of products that use our technologies under license agreements with third parties. We recognize royalty revenue upon receipt a confirmation of earned royalties and when collectability is reasonably assured from the applicable licensee.
Advertising Expenses
We expense advertising costs in the period in which they are incurred. Advertising expenses for fiscal years 2011, 2010 and 2009 were $9.5 million, $16.3 million and $28.5 million, respectively.
63
NVIDIA CORPORATION AND SUBSIDIARIES
NOTES TO THE CONSOLIDATED FINANCIAL STATEMENTS
(Continued)
Rent Expense
We recognize rent expense on a straight-line basis over the lease period and accrue for rent expense incurred, but not paid.
Product Warranties
We generally offer limited warranty to end-users that ranges from one to three years for products in order to repair or replace products for any manufacturing defects or hardware component failures. Cost of revenue includes the estimated cost of product warranties that are calculated at the point of revenue recognition. Under limited circumstances, we may offer an extended limited warranty to customers for certain products. We also accrue for known warranty and indemnification issues if a loss is probable and can be reasonably estimated.
Stock-based Compensation
We measure stock-based compensation expense at the grant date of the related equity awards, based on the estimated fair value of the awards, and recognize the expense using the straight-line attribution method over the requisite employee service period. We estimate the fair value of employee stock options on the date of grant using a binomial model and we use the closing trading price of our common stock on the date of grant as the fair value of awards of restricted stock units, or RSUs. We calculate the fair value of our employee stock purchase plan using the Black-Scholes model. Our stock based compensation for employee stock purchase plan is expensed using an accelerated amortization model.
Litigation, Investigation and Settlement Costs
From time to time, we are involved in legal actions and/or investigations by regulatory bodies. We are aggressively defending our current litigation matters for which we are responsible. However, there are many uncertainties associated with any litigation or investigation, and we cannot be certain that these actions or other third-party claims against us will be resolved without costly litigation, fines and/or substantial settlement payments. If that occurs, our business, financial condition and results of operations could be materially and adversely affected. If information becomes available that causes us to determine that a loss in any of our pending litigation, investigations or settlements is probable, and we can reasonably estimate the loss associated with such events, we will record the loss in accordance with U.S.GAAP. However, the actual liability in any such litigation or investigations may be materially different from our estimates, which could require us to record additional costs.
Foreign Currency Translation
We use the United States dollar as our functional currency for all of our subsidiaries. Foreign currency monetary assets and liabilities are remeasured into United States dollars at end-of-period exchange rates. Non-monetary assets and liabilities such as property and equipment, and equity are remeasured at historical exchange rates. Revenue and expenses are remeasured at average exchange rates in effect during each period, except for those expenses related to the previously noted balance sheet amounts, which are remeasured at historical exchange rates. Gains or losses from foreign currency remeasurement are included in “Other income (expense), net” in our Consolidated Financial Statements and to date have not been significant.
The impact of net foreign currency transaction loss included in determining net income (loss) for fiscal years 2011, 2010 and 2009 was $2.4 million, $0.9 million and $2.0 million, respectively.
64
NVIDIA CORPORATION AND SUBSIDIARIES
NOTES TO THE CONSOLIDATED FINANCIAL STATEMENTS
(Continued)
Income Taxes
We recognize federal, state and foreign current tax liabilities or assets based on our estimate of taxes payable or refundable in the current fiscal year by tax jurisdiction. We recognize federal, state and foreign deferred tax assets or liabilities, as appropriate, for our estimate of future tax effects attributable to temporary differences and carryforwards; and we record a valuation allowance to reduce any deferred tax assets by the amount of any tax benefits that, based on available evidence and judgment, are not expected to be realized.
United States income tax has not been provided on earnings of our non-U.S. subsidiaries to the extent that such earnings are considered to be indefinitely reinvested.
Our calculation of current and deferred tax assets and liabilities is based on certain estimates and judgments and involves dealing with uncertainties in the application of complex tax laws. Our estimates of current and deferred tax assets and liabilities may change based, in part, on added certainty or finality to an anticipated outcome, changes in accounting standards or tax laws in the United States, or foreign jurisdictions where we operate, or changes in other facts or circumstances. In addition, we recognize liabilities for potential United States and foreign income tax contingencies based on our estimate of whether, and the extent to which, additional taxes may be due. If we determine that payment of these amounts is unnecessary or if the recorded tax liability is less than our current assessment, we may be required to recognize an income tax benefit or additional income tax expense in our financial statements, accordingly.
As of January 30, 2011, we had a valuation allowance of $148.0 million related to state and certain foreign deferred tax assets that management determined are not likely to be realized due, in part, to projections of future taxable income and potential utilization limitations of tax attributes acquired as a result of stock ownership changes. To the extent realization of the deferred tax assets becomes more-likely-than-not, we would recognize such deferred tax asset as an income tax benefit during the period the realization occurred.
Our deferred tax assets do not include the excess tax benefit related to stock-based compensation that are a component of our federal and state net operating loss and research tax credit carryforwards in the amount of $565.2 million as of January 30, 2011. Consistent with prior years, the excess tax benefit reflected in our net operating loss and research tax credit carryforwards will be accounted for as a credit to stockholders’ equity, if and when realized. In determining if and when excess tax benefits have been realized, we have elected to utilize the with-and-without approach with respect to such excess tax benefits. We have also elected to ignore the indirect tax effects of stock-based compensation deductions for financial and accounting reporting purposes, and specifically to recognize the full effect of the research tax credit in income from continuing operations.
We recognize the benefit from a tax position only if it is more-likely-than-not that the position would be sustained upon audit based solely on the technical merits of the tax position. Our policy is to include interest and penalties related to unrecognized tax benefits as a component of income tax expense. Please refer to Note 14 of these Notes to the Consolidated Financial Statements for additional information.
65
NVIDIA CORPORATION AND SUBSIDIARIES
NOTES TO THE CONSOLIDATED FINANCIAL STATEMENTS
(Continued)
Comprehensive Income (Loss)
Comprehensive income (loss) consists of net income (loss) and other comprehensive income or loss. Other comprehensive income or loss components include unrealized gains or losses on available-for-sale securities, net of tax.
Net Income (Loss) Per Share
Basic net income (loss) per share is computed using the weighted average number of common shares outstanding during the period. Diluted net income (loss) per share is computed using the weighted average number of common and dilutive common equivalent shares outstanding during the period, using the treasury stock method. Under the treasury stock method, the effect of stock options outstanding is not included in the computation of diluted net income (loss) per share for periods when their effect is anti-dilutive.
Cash and Cash Equivalents
We consider all highly liquid investments that are readily convertible into cash and have an original maturity of three months or less at the time of purchase to be cash equivalents. As of January 30, 2011 and January 31, 2010, our cash and cash equivalents were $665.4 million and $447.2 million, respectively, which include $132.6 million and $81.4 million invested in money market funds for fiscal year 2011 and fiscal year 2010, respectively.
Marketable Securities
Marketable securities consist primarily of highly liquid investments with maturities of greater than three months when purchased. We generally classify our marketable securities at the date of acquisition as available-for-sale. These securities are reported at fair value with the related unrealized gains and losses included in accumulated other comprehensive income (loss), a component of stockholders’ equity, net of tax. Any unrealized losses which are considered to be other-than-temporary impairments are recorded in the other income (expense) section of our consolidated statements of operations. Realized gains (losses) on the sale of marketable securities are determined using the specific-identification method and recorded in the other income (expense) section of our consolidated statements of operations.
All of our available-for-sale investments are subject to a periodic impairment review. We record a charge to earnings when a decline in fair value is significantly below cost basis and judged to be other-than-temporary, or have other indicators of impairments. If the fair value of an available-for-sale debt instrument is less than its amortized cost basis, an other-than-temporary impairment is triggered in circumstances where (1) we intend to sell the instrument, (2) it is more likely than not that we will be required to sell the instrument before recovery of its amortized cost basis, or (3) a credit loss exists where we do not expect to recover the entire amortized cost basis of the instrument. If we intend to sell or it is more likely than not that we will be required to sell the available-for-sale debt instrument before recovery of its amortized cost basis, we recognize an other-than-temporary impairment in earnings equal to the entire difference between the debt instruments’ amortized cost basis and its fair value. For available-for-sale debt instruments that are considered other-than-temporarily impaired due to the existence of a credit loss, if we do not intend to sell and it is not more likely than not that we will be required to sell the instrument before recovery of its remaining amortized cost basis (amortized cost basis less any current-period credit loss), we separate the amount of the impairment into the amount that is credit related and the amount due to all other factors. The credit loss component is recognized in earnings while loss related to all other factors is recorded as other comprehensive income (loss).
We performed an impairment review of our investment portfolio as of January 30, 2011. Based on our impairment review and having considered the guidance of the relevant accounting literature, we did not record any other than temporary impairment charges during fiscal year 2011. We concluded that our investments were appropriately valued and that no additional other than temporary impairment charges were necessary on our portfolio of available for sale investments as of January 30, 2011.
66
NVIDIA CORPORATION AND SUBSIDIARIES
NOTES TO THE CONSOLIDATED FINANCIAL STATEMENTS
(Continued)
Fair Value of Financial Instruments
The carrying value of cash, cash equivalents, accounts receivable, accounts payable and accrued liabilities approximate their fair values due to their relatively short maturities as of January 30, 2011 and January 31, 2010. Marketable securities are comprised of available-for-sale securities that are reported at fair value with the related unrealized gains and losses included in accumulated other comprehensive income (loss), a component of stockholders’ equity, net of tax. Fair value of the marketable securities is determined based on quoted market prices.
Concentration of Credit Risk
Financial instruments that potentially subject us to concentrations of credit risk consist primarily of cash equivalents, marketable securities and accounts receivable. Our investment policy requires the purchase of top-tier investment grade securities, the diversification of asset type and includes certain limits on our portfolio duration. All marketable securities are held in our name, managed by several investment managers and held by one major financial institution under a custodial arrangement. Accounts receivable from significant customers, those representing 10% or more of total accounts receivable aggregated approximately 11% of our accounts receivable balance from one customer at January 30, 2011 and approximately 20% of our accounts receivable balance from two customers at January 31, 2010. We perform ongoing credit evaluations of our customers’ financial condition and maintain an allowance for potential credit losses. This allowance consists of an amount identified for specific customers and an amount based on overall estimated exposure. Our overall estimated exposure excludes amounts covered by credit insurance and letters of credit.
Accounts Receivable
We maintain an allowance for doubtful accounts receivable for estimated losses resulting from the inability of our customers to make required payments. We determine this allowance, which consists of an amount identified for specific customer issues as well as an amount based on overall estimated exposure. Factors impacting the allowance include the level of gross receivables, the financial condition of our customers and the extent to which balances are covered by credit insurance or letters of credit.
Inventories
Inventory cost is computed on an adjusted standard basis, which approximates actual cost on an average or first-in, first-out basis. Inventory costs consist primarily of the cost of semiconductors purchased from subcontractors, including wafer fabrication, assembly, testing and packaging, manufacturing support costs, including labor and overhead associated with such purchases, final test yield fallout, inventory provisions and shipping costs. We write down our inventory to the lower of cost or estimated market value. Obsolete or unmarketable inventory is completely written off based upon assumptions about future demand, future product purchase commitments, estimated manufacturing yield levels and market conditions. If actual market conditions are less favorable than those projected by management, or if our future product purchase commitments to our suppliers exceed our forecasted future demand for such products, additional future inventory write-downs may be required that could adversely affect our operating results. Inventory reserves once established are not reversed until the related inventory has been sold or scrapped. If actual market conditions are more favorable than expected and we sell products that we have previously written down, our reported gross margin would be favorably impacted.
Property and Equipment
Property and equipment are stated at cost. Depreciation of property and equipment is computed using the straight-line method based on the estimated useful lives of the assets, generally three to five years. The estimated useful lives of our buildings are up to twenty-five years. Depreciation expense includes the amortization of assets recorded under capital leases. Leasehold improvements and assets recorded under capital leases are amortized over the shorter of the lease term or the estimated useful life of the asset.
Goodwill
Goodwill is subject to our annual impairment test during the fourth quarter of our fiscal year, or earlier if indicators of potential impairment exist, using a fair value-based approach. For the purposes of completing our impairment test, we perform our analysis on a reporting unit basis. We utilize a two-step approach to test goodwill for impairment. The first step tests for possible impairment by applying a fair value-based test. Our impairment review process compares the estimated fair value of the reporting unit in which the goodwill resides to its carrying value. In computing fair value of our reporting units, we use estimates of future revenues, costs and cash flows from such units. The second step, if necessary, measures the amount of such impairment by applying fair value-based tests to individual assets and liabilities.
67
NVIDIA CORPORATION AND SUBSIDIARIES
NOTES TO THE CONSOLIDATED FINANCIAL STATEMENTS
(Continued)
Intangible Assets
Intangible assets primarily represent rights acquired under technology licenses, patents, acquired intellectual property, trademarks and customer relationships. We currently amortize our intangible assets with definitive lives over periods ranging from one to ten years using a method that reflects the pattern in which the economic benefits of the intangible asset are consumed or otherwise used up or, if that pattern cannot be reliably determined, using a straight-line amortization method.
Impairment of Long-Lived Assets
Long-lived assets, such as property and equipment and intangible assets subject to amortization, are reviewed for impairment whenever events or changes in circumstances indicate that the carrying amount of an asset, or asset group may not be recoverable. Recoverability of assets to be held and used is measured by a comparison of the carrying amount of an asset, or asset group to estimated undiscounted future cash flows expected to be generated by the asset, or asset group. If the carrying amount of an asset or asset group exceeds its estimated future cash flows, an impairment charge is recognized for the amount by which the carrying amount of the asset or asset group exceeds the fair value of the asset or asset group. Fair value is determined based on the estimated discounted future cash flows expected to be generated by the asset or asset group. Assets and liabilities to be disposed of would be separately presented in the consolidated balance sheet and the assets would be reported at the lower of the carrying amount or fair value less costs to sell, and would no longer be depreciated.
Accounting for Asset Retirement Obligations
We account for asset retirement obligations associated with the retirement of tangible long-lived assets and the associated asset retirement costs. The accounting guidance applies to legal obligations associated with the retirement of long-lived assets that result from the acquisition, construction, development and/or normal use of the assets and requires that the fair value of a liability for an asset retirement obligation be recognized in the period in which it is incurred if a reasonable estimate of fair value can be made. The fair value of the liability is added to the carrying amount of the associated asset and this additional carrying amount is depreciated over the life of the asset. As of January 30, 2011 and January 31, 2010, our asset retirement obligations to return the leasehold improvements to their original condition upon lease termination at our headquarters facility in Santa Clara, California and certain laboratories at our international locations were $9.7 million and $10.6 million, respectively.
Adoption of New Accounting Pronouncements
Variable Interest Entities
During the first quarter of fiscal year 2011, we adopted new accounting guidance which amends the evaluation criteria to identify the primary beneficiary of a variable interest entity, or VIE, and requires ongoing reassessment of whether an enterprise is the primary beneficiary of the VIE. The new guidance changes the consolidation rules for VIEs, including the consolidation of common structures, such as joint ventures, equity method investments and collaboration arrangements. The guidance is applicable to all new and existing VIEs. The adoption of this new accounting guidance did not have a material impact on our consolidated financial position, results of operations or financial condition.
Improving Disclosures About Fair Value Measurements
During the first quarter of fiscal year 2011, we adopted new accounting guidance which requires additional disclosures about items transferring into and out of levels 1 and 2 in the fair value hierarchy; adding separate disclosures about purchases, sales, issuances, and settlements relative to level 3 measurements; and clarifying, among other things, the existing fair value disclosures about the level of disaggregation. This new guidance is effective for interim and annual reporting periods beginning after December 15, 2009, except for the requirement to provide level 3 activity of purchases, sales, issuances, and settlements on a gross basis, which is effective for fiscal years beginning after December 15, 2010. The adoption of this new accounting guidance impacts only disclosure requirements and did not have an impact on our consolidated financial position, results of operations or financial condition.
Revenue Recognition
In September 2009, the Financial Accounting Standards Board, or FASB, issued new accounting guidance related to the revenue recognition of multiple element arrangements. The new guidance states that if vendor specific objective evidence or third party evidence for deliverables in an arrangement cannot be determined, companies will be required to develop a best estimate of the selling price to separate deliverables and allocate arrangement consideration using the relative selling price method. In addition, the FASB also issued new accounting guidance related to certain revenue arrangements that include software elements. Previously, companies that sold tangible products with “more than incidental” software were required to apply software revenue recognition guidance. This guidance often delayed revenue recognition for the delivery of the tangible product. Under the new guidance, tangible products that have software components that are “essential to the functionality” of the tangible product will be excluded from the software revenue recognition guidance. The new guidance includes factors to help companies determine what is “essential to the functionality.” Software-enabled products will now be subject to other revenue guidance and will follow the guidance for multiple deliverable arrangements issued by the FASB in September 2009 as described above.
We elected to early adopt this accounting guidance at the beginning of the first quarter of fiscal year 2011 on a prospective basis. We did not have a significant change in units of accounting, allocation methodology, or timing of revenue recognition. As a result, the adoption of these accounting standards did not have a material impact on our consolidated financial position, results of operations or financial condition.
Recently Issued Accounting Pronouncements
During the fiscal year ended January 30, 2011, there was no recent issuance of accounting pronouncements as compared to those described in the Annual Report on Form 10-K for the fiscal year ended January 31, 2010, that are of significance, or have potential material significance to us.
68
NVIDIA CORPORATION AND SUBSIDIARIES
NOTES TO THE CONSOLIDATED FINANCIAL STATEMENTS
(Continued)
During the three months ended April 26, 2009, we completed a cash tender offer for certain employee stock options. The tender offer applied to outstanding stock options held by employees with an exercise price equal to or greater than $17.50 per share. None of the non-employee members of our Board of Directors or our officers who file reports under Section 16(a) of the Securities Exchange Act of 1934, as amended, or the Securities Exchange Act, were eligible to participate in the tender offer. All eligible options with exercise prices equal to or greater than $17.50 per share but less than $28.00 per share were eligible to receive a cash payment of $3.00 per option in exchange for the cancellation of the eligible option. All eligible options with exercise prices equal to or greater than $28.00 per share were eligible to receive a cash payment of $2.00 per option in exchange for the cancellation of the eligible option.
Our consolidated statement of operations for fiscal year 2010 includes stock-based compensation charges related to the stock option purchase (in thousands):
|
Cost of revenue
|
$
|
11,412
|
||
|
Research and development
|
90,456
|
|||
|
Sales, general and administrative
|
38,373
|
|||
|
Total
|
$
|
140,241
|
A total of 28.5 million options were tendered under the offer for an aggregate cash purchase price of $78.1 million, which was paid in exchange for the cancellation of the eligible options. As a result of the tender offer, we incurred a charge of $140.2 million consisting of $124.1 million related to the remaining unamortized stock based compensation expense associated with the unvested portion of the options tendered in the offer, $11.6 million related to stock-based compensation expense resulting from amounts paid in excess of the fair value of the underlying options, plus $4.5 million related to associated payroll taxes, professional fees and other costs.
We measure stock-based compensation expense at the grant date of the related equity awards, based on the estimated fair value of the awards, and recognize the expense using the straight-line attribution method over the requisite employee service period adjusted for estimated forfeitures. We estimate the fair value of employee stock options on the date of grant using a binomial model and we use the closing trading price of our common stock on the date of grant as the fair value of awards of restricted stock units, or RSUs. We calculate the fair value of our employee stock purchase plan using the Black-Scholes model. Our stock based compensation for our employee stock purchase plan is expensed using an accelerated amortization model.
In addition to the stock-based compensation expense related to our cash tender offer to purchase certain employee stock options as described in Note 2 – Stock Option Purchase, our consolidated statements of operations include stock-based compensation expense, net of amounts capitalized as inventory, as follows:
|
Year Ended
|
||||||||||||
|
January 30
|
January 31,
|
January 25,
|
||||||||||
|
2011
|
2010
|
2009
|
||||||||||
|
(In thousands)
|
||||||||||||
|
Cost of revenue
|
$
|
8,308
|
$
|
12,050
|
$
|
11,939
|
||||||
|
Research and development
|
57,974
|
61,337
|
98,007
|
|||||||||
|
Sales, general and administrative
|
34,071
|
33,704
|
52,760
|
|||||||||
|
Total
|
$
|
100,353
|
$
|
107,091
|
$
|
162,706
|
||||||
As of January 30, 2011 and January 31, 2010, the aggregate amount of unearned stock-based compensation expense related to our equity awards was $147.1 million and $125.3 million, respectively, adjusted for estimated forfeitures. As of January 30, 2011 and January 31, 2010, we expect to recognize the unearned stock-based compensation expense related to stock options over an estimated weighted average amortization period of 1.7 years and 1.8 years, respectively. As of January 30, 2011, and January 31, 2010 we expect to recognize the unearned stock-based compensation expense related to RSUs over an estimated weighted average amortization period of 2.4 years and 2.3 years.
Stock-based compensation capitalized in inventories resulted in a charge of $0.7 million and $2.5 million in cost of revenue during the fiscal years ended January 30, 2011 and January 31, 2010, respectively.
During fiscal years 2011, 2010 and 2009, we granted approximately 5.8 million, 7.7 million and 17.9 million stock options, respectively, with estimated total grant-date fair values of $34.4 million, $44.2 million and $143.6 million, respectively, and weighted average grant-date fair values of $5.89, $5.74 and $8.03 per option, respectively. During fiscal year 2011, we granted approximately 7.1 million RSUs, with estimated total grant-date fair values of $96.7 million and weighted average grant-date fair value of $13.61. During fiscal year 2010 we granted approximately 7.7 million RSUs, with estimated total grant-date fair values of $94.1 million and weighted average grant-date fair value of $12.26.
Of the estimated total grant-date fair value, we estimated that the stock-based compensation expense related to the equity awards that are not expected to vest for fiscal years 2011, 2010 and 2009 was $23.5 million, $25.7 million and $23.8 million, respectively.
Valuation Assumptions
We utilize a binomial model for calculating the estimated fair value of new stock-based compensation awards granted under our stock option plans. We have determined that the use of implied volatility is expected to be reflective of market conditions and, therefore, can be expected to be a reasonable indicator of our expected volatility. We also segregate options into groups of employees with relatively homogeneous exercise behavior in order to calculate the best estimate of fair value using the binomial valuation model. As such, the expected term assumption used in calculating the estimated fair value of our stock-based compensation awards using the binomial model is based on detailed historical data about employees' exercise behavior, vesting schedules, and death and disability probabilities. Our management believes the resulting binomial calculation provides a reasonable estimate of the fair value of our employee stock options. For our employee stock purchase plan we continue to use the Black-Scholes model.
We estimate forfeitures at the time of grant and revise the estimates of forfeiture, if necessary, in subsequent periods if actual forfeitures differ from those estimates. Forfeitures are estimated based on historical experience.
69
NVIDIA CORPORATION AND SUBSIDIARIES
NOTES TO THE CONSOLIDATED FINANCIAL STATEMENTS
(Continued)
The fair value of stock options granted under our stock option plans and shares issued under our employee stock purchase plan have been estimated at the date of grant with the following assumptions:
|
Year Ended
|
||||||||||||
|
January 30,
2011
|
January 31,
2010
|
January 25,
2009
|
||||||||||
|
Stock Options
|
(Using a binomial model)
|
|||||||||||
|
Weighted average expected life of stock options (in years)
|
3.1-6.7
|
3.7-5.8
|
3.6 - 5.8
|
|||||||||
|
Risk free interest rate
|
1.5%-3.3
|
%
|
1.8%-2.9
|
%
|
1.7% - 3.7
|
%
|
||||||
|
Volatility
|
42%-53
|
%
|
45%-72
|
%
|
52% - 105
|
%
|
||||||
|
Dividend yield
|
—
|
—
|
—
|
|||||||||
|
Year Ended
|
||||||||||||
|
January 30,
2011
|
January 31, 2010
|
January 25,
2009
|
||||||||||
|
Employee Stock Purchase Plan
|
(Using the Black-Scholes model)
|
|||||||||||
|
Weighted average expected life of stock options (in years)
|
0.5-2.0
|
0.5-2.0
|
0.5 - 2.0
|
|||||||||
|
Risk free interest rate
|
0.2%-0.8
|
%
|
0.2 %– 1.0
|
%
|
1.6% - 2.4
|
%
|
||||||
|
Volatility
|
45%-47
|
%
|
53%-73
|
%
|
62% - 68
|
%
|
||||||
|
Dividend yield
|
—
|
—
|
—
|
|||||||||
Equity Incentive Program
We consider equity compensation to be long-term compensation and an integral component of our efforts to attract and retain exceptional executives, senior management and world-class employees. In March 2009, we introduced RSUs as a form of equity compensation to all employees. Currently, we grant stock options and RSUs under our equity incentive plans. We believe that properly structured equity compensation aligns the long-term interests of stockholders and employees by creating a strong, direct link between employee compensation and stock appreciation, as stock options are only valuable to our employees if the value of our common stock increases after the date of grant.
2007 Equity Incentive Plan
At the Annual Meeting of Stockholders held on June 21, 2007, our stockholders approved the NVIDIA Corporation 2007 Equity Incentive Plan, or the 2007 Plan.
The 2007 Plan authorizes the issuance of incentive stock options, nonstatutory stock options, restricted stock, restricted stock unit, stock appreciation rights, performance stock awards, performance cash awards, and other stock-based awards to employees, directors and consultants. Only our employees may receive incentive stock options. The 2007 Plan succeeds our 1998 Equity Incentive Plan, our 1998 Non-Employee Directors’ Stock Option Plan, our 2000 Nonstatutory Equity Incentive Plan, and the PortalPlayer, Inc. 2004 Stock Incentive Plan, or the Prior Plans. All options and stock awards granted under the Prior Plans shall remain subject to the terms of the Prior Plans with respect to which they were originally granted. Up to 101,845,177 shares, which due to the subsequent stock split now totals 152,767,766 shares, of our common stock may be issued pursuant to stock awards granted under the 2007 Plan or the Prior Plans. Currently, we grant stock options and RSUs under our equity incentive plans. As of January 30, 2011, 33,732,068 shares were available for future issuance under the 2007 Plan.
Options granted to new employees that started before the beginning of fiscal year 2010 generally vest ratably quarterly over a three-year period. In addition, options granted prior to the beginning of fiscal year 2010 to existing employees in recognition of performance generally vest as to 25% of the shares two years and three months after the date of grant and as to the remaining 75% of the shares subject to the option in equal quarterly installments over a nine month period. Options granted to new employees and to existing employees in recognition of performance with a vesting commencement date in fiscal year 2010 generally vest as to 33.36% of the shares one year after the date of grant and as to the remaining 66.64% of the shares subject to the option in equal quarterly installments over the remaining period. Options granted under the 2007 Plan generally expire six years from the date of grant.
In general, RSUs are subject to the recipient’s continuing service to NVIDIA. RSUs with a vesting commencement date in fiscal year 2010 vest over three years at the rate of 33.36% on pre-determined dates that are close to the anniversary of the grant date and vest ratably on a semi-annual basis thereafter.
70
NVIDIA CORPORATION AND SUBSIDIARIES
NOTES TO THE CONSOLIDATED FINANCIAL STATEMENTS
(Continued)
Unless terminated sooner, the 2007 Plan is scheduled to terminate on April 23, 2017. Our Board may suspend or terminate the 2007 Plan at any time. No awards may be granted under the 2007 Plan while the 2007 Plan is suspended or after it is terminated. The Board may also amend the 2007 Plan at any time. However, if legal, regulatory or listing requirements require stockholder approval, the amendment will not go into effect until the stockholders have approved the amendment.
PortalPlayer, Inc. 1999 Stock Option Plan
We assumed options issued under the PortalPlayer, Inc. 1999 Stock Option Plan, or the 1999 Plan, when we completed our acquisition of PortalPlayer on January 5, 2007. The 1999 Plan was terminated upon completion of PortalPlayer’s initial public offering of common stock in 2004. No shares of common stock are available for issuance under the 1999 Plan other than to satisfy exercises of stock options granted under the 1999 Plan prior to its termination and any shares that become available for issuance as a result of expiration or cancellation of an option that was issued pursuant to the 1999 Plan. Previously authorized yet unissued shares under the 1999 Plan were cancelled upon completion of PortalPlayer’s initial public offering.
Each option we assumed in connection with our acquisition of PortalPlayer was converted into the right to purchase that number of shares of NVIDIA common stock determined by multiplying the number of shares of PortalPlayer common stock underlying such option by 0.3601 and then rounding down to the nearest whole number of shares. The exercise price per share for each assumed option was similarly adjusted by dividing the exercise price by 0.3601 and then rounding up to the nearest whole cent. Vesting schedules and expiration dates did not change.
Under the 1999 Plan, incentive stock options were granted at a price that was not less than 100% of the fair market value of PortalPlayer’s common stock, as determined by its board of directors, on the date of grant. Non-statutory stock options were granted at a price that was not less than 85% of the fair market value of PortalPlayer’s common stock, as determined by its board of directors, on the date of grant.
Generally, options granted under the 1999 Plan are exercisable for a period of ten years from the date of grant, and shares vest at a rate of 25% on the first anniversary of the grant date of the option, and an additional 1/48th of the shares upon completion of each succeeding full month of continuous employment thereafter.
1998 Employee Stock Purchase Plan
In February 1998, our Board approved the 1998 Employee Stock Purchase Plan, or the Purchase Plan. In June 1999, the Purchase Plan was amended to increase the number of shares reserved for issuance automatically each year at the end of our fiscal year for the next 10 years (commencing at the end of fiscal year 2000 and ending 10 years later in 2009) by an amount equal to 2% of the outstanding shares on each such date, including on an as-if-converted basis preferred stock and convertible notes, and outstanding options and warrants, calculated using the treasury stock method; provided that the maximum number of shares of common stock available for issuance from the Purchase Plan could not exceed 52,000,000 shares which, due to subsequent stock-splits, is now 78,000,0000 shares. The number of shares will no longer be increased annually as we reached the maximum permissible number of shares at the end of fiscal year 2006. There are a total of 78,000,000 shares authorized for issuance. At January 30, 2011, 46,002,673 shares had been issued under the Purchase Plan and 31,997,327 shares were available for future issuance.
The Purchase Plan is intended to qualify as an “employee stock purchase plan” under Section 423 of the Internal Revenue Code. Under the Purchase Plan, the Board has authorized participation by eligible employees, including officers, in periodic offerings following the adoption of the Purchase Plan. Under the Purchase Plan, separate offering periods shall be no longer than 27 months. Under the current offering adopted pursuant to the Purchase Plan, each offering period is 24 months, which is divided into four purchase periods of six months.
Employees are eligible to participate if they are employed by us or an affiliate of us as designated by the Board. Employees who participate in an offering may have up to 10% of their earnings withheld pursuant to the Purchase Plan up to certain limitations and applied on specified dates determined by the Board to the purchase of shares of common stock. The Board may increase this percentage at its discretion, up to 15%. The price of common stock purchased under the Purchase Plan will be equal to the lower of the fair market value of the common stock on the commencement date of each offering period and the purchase date of each offering period at 85% at the fair market value of the common stock on the relevant purchase date. During fiscal years 2011, 2010 and 2009, employees purchased approximately 6.7 million, 5.9 million, and 3.0 million shares, respectively, with weighted-average prices of $6.59, $6.76, and $12.79 per share, respectively, and grant-date fair values of $4.06, $4.60 and $5.90 per share, respectively. Employees may end their participation in the Purchase Plan at any time during the offering period, and participation ends automatically on termination of employment with us and in each case their contributions are refunded.
71
NVIDIA CORPORATION AND SUBSIDIARIES
NOTES TO THE CONSOLIDATED FINANCIAL STATEMENTS
(Continued)
The following summarizes the stock option and RSU transactions under our equity incentive plans:
|
Options Available for Grant
|
Options
Outstanding
|
Weighted Average Exercise Price Per Share
|
Weighted Average Remaining Contractual Life
|
Aggregate Intrinsic Value (1)
|
|||||||||
|
Stock Options:
|
|||||||||||||
|
Balances, January 27, 2008
|
44,044,004
|
90,581,073
|
$
|
13.18
|
|||||||||
|
Authorized
|
-
|
-
|
-
|
||||||||||
|
Granted
|
(17,888,695
|
)
|
17,888,695
|
$
|
8.03
|
||||||||
|
Exercised
|
-
|
(7,670,038
|
)
|
$
|
3.14
|
||||||||
|
Cancelled
|
3,345,450
|
(3,345,450
|
)
|
$
|
7.66
|
||||||||
|
Balances, January 25, 2009
|
29,500,759
|
97,454,280
|
$
|
13.83
|
|||||||||
|
Authorized
|
-
|
-
|
-
|
||||||||||
|
Granted
|
(7,701,396
|
)
|
7,701,396
|
$
|
11.5
|
||||||||
|
Exercised
|
-
|
(17,099,663
|
)
|
$
|
5.74
|
||||||||
|
Cancelled
|
1,175,541
|
(1,175,541
|
)
|
$
|
12.90
|
||||||||
|
Cancellations related to stock options purchase (2)
|
28,532,050
|
(28,532,050
|
)
|
$
|
23.35
|
||||||||
|
Balances, January 31, 2010
|
51,506,954
|
58,348,422
|
$
|
11.30
|
|||||||||
|
Authorized
|
-
|
-
|
-
|
||||||||||
|
Granted
|
(5,818,966
|
)
|
5,818,966
|
$
|
13.79
|
||||||||
|
Exercised
|
-
|
(18,287,483
|
)
|
$
|
8.16
|
||||||||
|
Cancelled
|
1,878,447
|
(1,878,447
|
)
|
$
|
12.56
|
||||||||
|
Balances, January 30, 2011
|
47,566,435
|
44,001,458
|
$
|
12.88
|
2.91
|
$
|
490,941,491
|
||||||
|
Exercisable at January 30, 2011
|
29,016,290
|
$
|
12.85
|
1.71
|
$
|
326,752,839
|
|||||||
|
Vested and Expected to Vest after January 30, 2011
|
41,511,160
|
$
|
12.89
|
2.77
|
$
|
463,094,795
|
|||||||
(1) The aggregate intrinsic value in the table above represents the total pre-tax intrinsic value for in-the-money options at January 30, 2011, based on the $23.76 closing stock price of our common stock on the NASDAQ Global Select Market, which would have been received by the option holders had all in-the-money option holders exercised their options as of that date. The total number of in-the-money options outstanding and exercisable as of January 30, 2011 was 42.7 million shares and 27.8 million shares, respectively.
(2) Please refer to Note 2 of these Notes to the Consolidated Financial Statements for further discussion regarding the cash tender offer for certain employee stock options that our Board of Directors approved in February 2009.
The total intrinsic value of options exercised was $139.1 million, $140.3 million and $84.9 million for fiscal years 2011, 2010 and 2009, respectively. The total fair value of options vested was $60.7 million, $37.0 million and $117.0 million for fiscal years 2011, 2010 and 2009, respectively.
|
|
RSUs
|
Weighted Average Grant-date fair value
|
Weighted Average Remaining Contractual Life
|
||||||
|
Restricted Stock Units:
|
|||||||||
| Balances, January 25, 2009 | - | $ | - | ||||||
| Awarded | 7,672,899 | $ | 12.26 | ||||||
| Vested | (2,400 | ) | $ | 12.40 | |||||
| Forfeited | (181,987 | ) | $ | 11.37 | |||||
|
Balances, January 31, 2010
|
7,488,512 | $ | 12.28 | ||||||
|
Awarded
|
7,104,693 | $ | 13.61 | ||||||
|
Vested
|
(3,215,633 | ) | $ | 11.74 | |||||
|
Forfeited
|
(765,658 | ) | $ | 13.76 | |||||
|
Balances, January 30, 2011
|
10,611,914 | $ | 13.23 | ||||||
|
Expected to Vest after January 30, 2011
|
8,593,484 | $ | 13.24 |
1.96
|
|||||
72
NVIDIA CORPORATION AND SUBSIDIARIES
NOTES TO THE CONSOLIDATED FINANCIAL STATEMENTS
(Continued)
On January 10, 2011, we entered into a new six-year patent cross licensing agreement, or the License Agreement, with Intel. Under the License Agreement, Intel has granted to NVIDIA and its qualified subsidiaries, and NVIDIA has granted to Intel and Intel’s qualified subsidiaries, a non-exclusive, non-transferable, worldwide license, without the right to sublicense to all patents that are either owned or controlled by the parties at any time that have a first filing date on or before March 31, 2017, to make, have made (subject to certain limitations), use, sell, offer to sell, import and otherwise dispose of certain semiconductor- and electronic-related products anywhere in the world. NVIDIA’s rights to Intel’s patents have certain specified limitations, including but not limited to, NVIDIA was not granted a license to: (1) certain microprocessors, defined in the License Agreement as “Intel Processors” or “Intel Compatible Processors;” (2) certain chipsets that connect to Intel Processors; or (3) certain flash memory products. In connection with the License Agreement, NVIDIA and Intel mutually agreed to settle all outstanding legal disputes. Under the License Agreement, Intel will pay NVIDIA an aggregate amount of $1.5 billion, payable in annual installments, as follows: a $300 million payment on each of January 18, 2011, January 13, 2012 and January 15, 2013 and a $200 million payment on each of January 15, 2014, 2015 and 2016.
Accounting for the Agreement
The License Agreement between NVIDIA and Intel includes multiple elements. As a result, we determined each element of the License Agreement, their fair value and when they should be recognized.
We allocated the total consideration, comprising of the cash payments from Intel and the estimated fair value of the license we received from Intel, to the legal settlement and the license to Intel based on the estimated relative fair value of these elements as follows:
|
(in thousands)
|
||||
|
|
||||
|
Legal settlement
|
$
|
57,000
|
||
|
License to Intel
|
1,583,000
|
|||
|
License from Intel
|
(140,000
|
) | ||
|
Total cash consideration
|
$ |
1,500,000
|
||
The elements of the License Agreement are accounted for as follows:
| 1 . |
Legal settlement
: In connection with the License Agreement, both parties agreed to settle all outstanding legal disputes. The fair value allocated to the settlement of $57.0 million was recorded in the fourth quarter of fiscal year 2011, as a benefit to operating expense.
|
| 2. . |
License to Intel:
We will recognize $1,583.0 million in total, or $66.0 million per quarter, as revenue over the term of the agreement of six years, the period over which Intel will have access to newly filed NVIDIA patents. We will commence recognition of the license revenue in April 2011 when our performance obligation under the agreement begins. Consideration received in advance of the performance period will be classified as deferred revenue.
|
| 3. |
License from Intel
: We recognized $140.0 million as an intangible asset upon execution of the agreement. Amortization of $5.0 million per quarter will be charged to cost of sales over the seven year estimated useful life of the technology beginning in April 2011.
|
Fair Value Determination
In determining the estimated fair value of the elements of the License Agreement, we assumed the highest and best use of each element from a market participant perspective. The inputs and assumptions used in our valuation included projected revenue, royalty rates, discount rates, useful lives and income tax rates, among others. The development of a number of these inputs and assumptions in the model required a significant amount of management judgment and is based upon a number of factors, including the selection of industry comparables, royalty rates, market growth rates and other relevant factors. Changes in any number of these assumptions may have had a substantial impact on the estimated fair value of each element. These inputs and assumptions represent management’s best estimate at the time of the transaction.
73
NVIDIA CORPORATION AND SUBSIDIARIES
NOTES TO THE CONSOLIDATED FINANCIAL STATEMENTS
(Continued)
The following is a reconciliation of the numerators and denominators of the basic and diluted net income (loss) per share computations for the periods presented:
|
Year Ended
|
||||||||||||
|
January 30,
2011
|
January 31,
2010
|
January 25,
2009
|
||||||||||
|
(In thousands, except per share data)
|
||||||||||||
|
Numerator:
|
||||||||||||
|
Net income (loss)
|
$
|
253,146
|
$
|
(67,987
|
)
|
$
|
(30,041
|
)
|
||||
|
Denominator:
|
||||||||||||
|
Denominator for basic net income (loss) per share, weighted average shares
|
575,177
|
549,574
|
548,126
|
|||||||||
|
Effect of dilutive securities:
|
||||||||||||
|
Equity Awards outstanding
|
13,507
|
-
|
-
|
|||||||||
|
Denominator for diluted net income (loss) per share, weighted average shares
|
588,684
|
549,574
|
548,126
|
|||||||||
|
Net income (loss) per share:
|
||||||||||||
|
Basic net income (loss) per share
|
$
|
0.44
|
$
|
(0.12
|
)
|
$
|
(0.05
|
)
|
||||
|
Diluted net income (loss) per share
|
$
|
0.43
|
$
|
(0.12
|
)
|
$
|
(0.05
|
)
|
||||
Diluted net income per share for 2011 did not include the effect of anti-dilutive common equivalent shares from 24.6 million outstanding stock options and RSUs, respectively. All of our outstanding stock options were anti-dilutive during fiscal year 2010 and 2009 and excluded from the computation of diluted earnings per share due to the net loss for fiscal years 2010 and 2009.
In September 2008, we announced a workforce reduction to allow for continued investment in strategic growth areas, which was completed in the third quarter of fiscal year 2009. As a result, we eliminated approximately 360 positions worldwide, or about 6.5% of our global workforce. During fiscal year 2009, expenses associated with the workforce reduction, which were comprised primarily of severance and benefits payments to these employees, totaled $8.0 million. The remaining accrual of $0.2 million as of January 25, 2009 relates to severance and benefits payments, which was paid by the third quarter of fiscal year 2010.
Restructuring and other expenses for fiscal year 2009 also included a non-recurring charge of $18.9 million associated with the termination of a development contract related to a new campus construction project that has been put on hold.
During fiscal year 2002, we completed the purchase of certain assets from 3dfx Interactive, Inc., or 3dfx, for an aggregate purchase price of approximately $74.2 million. On December 15, 2000, NVIDIA Corporation and one of our indirect subsidiaries entered into an Asset Purchase Agreement, or the APA, which closed on April 18, 2001, to purchase certain graphics chip assets from 3dfx.
In October 2002, 3dfx filed for Chapter 11 bankruptcy protection in the United States Bankruptcy Court for the Northern District of California. In March 2003, the Trustee appointed by the Bankruptcy Court to represent 3dfx’s bankruptcy estate served his complaint on NVIDIA. The Trustee’s complaint asserted claims for, among other things, successor liability and fraudulent transfer and sought additional payments from us. In early November 2005, NVIDIA and the Official Committee of Unsecured Creditors, or the Creditors’ Committee, agreed to a Plan of Liquidation of 3dfx, which included a conditional settlement of the Trustee’s claims against us. This conditional settlement was subject to a confirmation process through a vote of creditors and the review and approval of the Bankruptcy Court. The conditional settlement called for a payment by NVIDIA of approximately $30.6 million to the 3dfx estate. Under the settlement, $5.6 million related to various administrative expenses and Trustee fees, and $25.0 million related to the satisfaction of debts and liabilities owed to the general unsecured creditors of 3dfx. Accordingly, during the three month period ended October 30, 2005, we recorded $5.6 million as a charge to settlement costs and $25.0 million as additional purchase price for 3dfx. The Trustee advised that he intended to object to the settlement.
The conditional settlement reached in November 2005 never progressed through the confirmation process and the Trustee’s case still remains pending appeal. As such, we have not reversed the accrual of $30.6 million - $5.6 million as a charge to settlement costs and $25.0 million as additional purchase price for 3dfx – that we recorded during the three months ended October 30, 2005, pending resolution of the appeal of the Trustee’s case.
The 3dfx asset purchase price of $95.0 million and $4.2 million of direct transaction costs were allocated based on fair values presented below. The final allocation of the purchase price of the 3dfx assets is contingent upon the outcome of all of the 3dfx litigation. Please refer to Note12 of the Notes to the Consolidated Financial Statements for further discussion regarding this litigation.
|
|
Fair Market Value
|
Straight-Line Amortization Period
|
||||||
|
(In thousands)
|
(Years)
|
|||||||
|
Property and equipment
|
$
|
2,433
|
1-2
|
|||||
|
Trademarks
|
11,310
|
5
|
||||||
|
Goodwill
|
85,418
|
-
|
||||||
|
Total
|
$
|
99,161
|
||||||
74
NVIDIA CORPORATION AND SUBSIDIARIES
NOTES TO THE CONSOLIDATED FINANCIAL STATEMENTS
(Continued)
The carrying amount of goodwill is as follows:
|
January 30,
2011
|
January 31,
2010
|
|||||||
|
(In thousands)
|
||||||||
|
PortalPlayer
|
$
|
104,896
|
$
|
104,896
|
||||
|
3dfx
|
75,326
|
75,326
|
||||||
|
Mental Images
|
59,252
|
59,252
|
||||||
|
MediaQ
|
35,167
|
35,167
|
||||||
|
ULi
|
31,115
|
31,115
|
||||||
|
Hybrid Graphics
|
27,906
|
27,906
|
||||||
|
Ageia
|
19,198
|
19,198
|
||||||
|
Other
|
16,984
|
16,984
|
||||||
|
Total goodwill
|
$
|
369,844
|
$
|
369,844
|
||||
Goodwill is subject to our annual impairment test during the fourth quarter of our fiscal year, or earlier if indicators of potential impairment exist, using a fair value-based approach. We completed our most recent annual impairment test during the fourth quarter of fiscal year 2011 and concluded that there was no impairment. In computing fair value of our reporting units, we use estimates of future revenues, costs and cash flows from such units. This assessment is based upon a discounted cash flow analysis and analysis of our market capitalization. The estimate of cash flow is based upon, among other things, certain assumptions about expected future operating performance such as revenue growth rates and operating margins used to calculate projected future cash flows, risk-adjusted discount rates, future economic and market conditions, and determination of appropriate market comparables.
The amount of goodwill allocated to our graphics processing unit, or GPU, business, the professional solutions business, or PSB, and the consumer products business, or CPB segments as of January 30, 2011 and January 31, 2010 was $133.1 million, $95.1 million and $141.6 million, respectively. Please refer to Note17 of the Notes to the Consolidated Financial Statements for further discussion regarding segments.
The components of our amortizable intangible assets are as follows:
|
January 30, 2011
|
January 31, 2010
|
||||||||||||||||||||||||
|
Gross
Carrying
Amount
|
Accumulated
Amortization
|
Net Carrying
Amount
|
Weighted Average
Useful Life
|
Gross
Carrying
Amount
|
Accumulated
Amortization
|
Net Carrying
Amount
|
Weighted Average Useful Life
|
||||||||||||||||||
|
(In thousands)
|
(In years)
|
(In thousands)
|
(In years)
|
||||||||||||||||||||||
|
Technology licenses
|
$
|
320,477
|
$
|
(62,791
|
)
|
$
|
257,686
|
7.6
|
$
|
135,112
|
$
|
(48,337
|
)
|
$
|
$86,775
|
6.3
|
|||||||||
|
Acquired intellectual property
|
76,264
|
(61,175
|
)
|
15,089
|
3.8
|
75,339
|
(49,838
|
)
|
25,501
|
3.8
|
|||||||||||||||
|
Patents
|
31,278
|
(15,308
|
)
|
15,970
|
5.3
|
19,347
|
(11,165
|
)
|
8,182
|
5.3
|
|||||||||||||||
|
Total intangible assets
|
$
|
428,019
|
$
|
(139,274
|
)
|
$
|
288,745
|
$
|
229,798
|
$
|
(109,340
|
)
|
$
|
120,458
|
|||||||||||
Amortization expense associated with intangible assets for fiscal years 2011, 2010 and 2009 was $30.0 million, $31.9 million and $32.6 million, respectively. Future amortization expense for the net carrying amount of intangible assets at January 30, 2011 is estimated to be $53.8 million in fiscal year 2012, $46.6 million in fiscal year 2013, $42.1 million in fiscal year 2014, $42.0 million in fiscal year 2015, $39.9 million in fiscal year 2016 and $64.3 million in fiscal years subsequent to fiscal year 2016 until fully amortized.
All of the cash equivalents and marketable securities are classified as “available-for-sale” securities. Investments in both fixed rate instruments and floating rate interest earning instruments carry a degree of interest rate risk. Fixed rate debt securities may have their market value adversely impacted due to a rise in interest rates, while floating rate securities may produce less income than expected if interest rates fall. Due in part to these factors, our future investment income may fall short of expectations due to changes in interest rates or if the decline in fair value of our publicly traded debt or equity investments is judged to be other-than-temporary. We may suffer losses in principal if we are forced to sell securities that decline in market value due to changes in interest rates. However, because any debt securities we hold are classified as “available-for-sale,” no gains or losses are realized in our statement of operations due to changes in interest rates unless such securities are sold prior to maturity or unless declines in market values are determined to be other-than-temporary. These securities are reported at fair value with the related unrealized gains and losses included in accumulated other comprehensive income, a component of stockholders’ equity, net of tax.
75
NVIDIA CORPORATION AND SUBSIDIARIES
NOTES TO THE CONSOLIDATED FINANCIAL STATEMENTS
(Continued)
The following is a summary of cash equivalents and marketable securities at January 30, 2011 and January 31, 2010:
|
January 30, 2011
|
||||||||||||||||
|
Amortized
Cost
|
Unrealized
Gain
|
Unrealized
Loss
|
Estimated
Fair Value
|
|||||||||||||
|
(In thousands)
|
||||||||||||||||
|
Debt securities of United States government agencies
|
$
|
531,789
|
$
|
1,034
|
$
|
(226
|
)
|
$
|
532,597
|
|||||||
|
Corporate debt securities
|
925,226
|
3,354
|
(208
|
)
|
928,372
|
|||||||||||
|
Mortgage backed securities issued by United States government-sponsored enterprises
|
140,844
|
4,599
|
(21
|
)
|
145,422
|
|||||||||||
|
Money market funds
|
132,586
|
-
|
-
|
132,586
|
||||||||||||
|
Debt securities issued by United States Treasury
|
435,091
|
1,939
|
(18
|
)
|
437,012
|
|||||||||||
|
Total
|
$
|
2,165,536
|
$
|
10,926
|
$
|
(473
|
)
|
$
|
2,175,989
|
|||||||
|
Classified as:
|
||||||||||||||||
|
Cash equivalents
|
$
|
350,787
|
||||||||||||||
|
Marketable securities
|
1,825,202
|
|||||||||||||||
|
Total
|
$
|
2,175,989
|
||||||||||||||
|
January 31, 2010
|
||||||||||||||||
|
Amortized
Cost
|
Unrealized
Gain
|
Unrealized
Loss
|
Estimated
Fair Value
|
|||||||||||||
|
(In thousands)
|
||||||||||||||||
|
Debt securities of United States government agencies
|
$
|
492,628
|
$
|
3,606
|
$
|
(29
|
)
|
$
|
496,205
|
|||||||
|
Corporate debt securities
|
514,200
|
4,064
|
(44
|
)
|
518,220
|
|||||||||||
|
Mortgage backed securities issued by United States government-sponsored enterprises
|
162,693
|
3,674
|
(13
|
)
|
166,353
|
|||||||||||
|
Money market funds
|
94,340
|
-
|
-
|
94,340
|
||||||||||||
|
Debt securities issued by United States Treasury
|
316,520
|
1,318
|
-
|
317,838
|
||||||||||||
|
Asset-backed securities
|
17
|
-
|
-
|
17
|
||||||||||||
|
Total
|
$
|
1,580,397
|
$
|
12,662
|
$
|
(86
|
)
|
$
|
1,592,973
|
|||||||
|
Classified as:
|
||||||||||||||||
|
Cash equivalents
|
$
|
311,967
|
||||||||||||||
|
Marketable securities
|
1,281,006
|
|||||||||||||||
|
Total
|
$
|
1,592,973
|
||||||||||||||
The following table provides the breakdown of the investments with unrealized losses at January 30, 2011:
|
Less than 12 months
|
12 months or greater
|
Total
|
||||||||||||||||||||||
|
Fair Value
|
Gross
Unrealized
Losses
|
Fair Value
|
Gross
Unrealized
Losses
|
Fair Value
|
Gross
Unrealized
Losses
|
|||||||||||||||||||
|
(In thousands)
|
||||||||||||||||||||||||
|
Corporate debt securities
|
$
|
467,672
|
$
|
(11
|
)
|
$
|
460,700
|
$
|
(197
|
)
|
$
|
928,372
|
$
|
(208
|
)
|
|||||||||
|
Mortgage backed securities issued by United States government-sponsored enterprises
|
8,371
|
-
|
137,051
|
(21
|
)
|
|
145,422
|
(21
|
)
|
|||||||||||||||
|
Debt securities of United States Treasury
|
232,007
|
-
|
205,005
|
(18
|
)
|
437,012
|
(18
|
)
|
||||||||||||||||
|
Debt securities issued by United States government agencies
|
338,096
|
(77
|
)
|
194,501
|
(149
|
)
|
532,597
|
(226
|
)
|
|||||||||||||||
|
Total
|
$
|
1,046,146
|
$
|
(88
|
)
|
$
|
997,257
|
$
|
(385
|
)
|
$
|
2,043,403
|
$
|
(473
|
)
|
|||||||||
We performed an impairment review of our investment portfolio as of January 30, 2011. Factors considered included general market conditions, the duration and extent to which fair value is below cost, and our intent and ability to hold an investment for a sufficient period of time to allow for recovery in value. We also consider specific adverse conditions related to the financial health of and business outlook for an investee, including industry and sector performance, changes in technology, operational and financing cash flow factors, and changes in an investee’s credit rating. Investments that we identify as having an indicator of impairment are subject to further analysis to determine if the investment was other than temporarily impaired. Based on our quarterly impairment review and having considered the guidance in the relevant accounting literature, we did not record any other-than-temporary impairment charges during fiscal year 2011. We concluded that our investments were appropriately valued and that no other than temporary impairment charges were necessary on our portfolio of available for sale investments as of January 30, 2011.
76
NVIDIA CORPORATION AND SUBSIDIARIES
NOTES TO THE CONSOLIDATED FINANCIAL STATEMENTS
(Continued)
As of January 30, 2011, we had 9 investments that were in an unrealized loss position with total unrealized losses amounting to $0.09 million and with a duration of less than one year. The gross unrealized losses related to fixed income securities were due to changes in interest rates. We have determined that the gross unrealized losses on investment securities at January 30, 2011 are temporary in nature. Currently, we have the intent and ability to hold our investments with impairment indicators until maturity.
Net realized gains, excluding any impairment charges, were $1.5 million, $1.8 million and $2.1 million for fiscal year 2011 2010, and 2009 respectively. As of January 30, 2011, we had a net unrealized gain of $10.5 million, which was comprised of gross unrealized gains of $11.0 million, offset by $0.5 million of gross unrealized losses. As of January 31, 2010, we had a net unrealized gain of $12.6 million, which was comprised of gross unrealized gains of $12.7 million, offset by $0.1 million of gross unrealized losses
The amortized cost and estimated fair value of cash equivalents and marketable securities which are primarily debt instruments are classified as available-for-sale at January 30, 2011 and January 31, 2010 and are shown below by contractual maturity.
|
January 30, 2011
|
January 31, 2010
|
|||||||||||||||
|
Amortized
Cost
|
Estimated
Fair Value
|
Amortized
Cost
|
Estimated
Fair Value
|
|||||||||||||
|
(In thousands)
|
||||||||||||||||
|
Less than one year
|
$
|
1,176,046
|
$ |
1,178,733
|
$
|
785,642
|
$
|
788,825
|
||||||||
|
Due in 1 - 5 years
|
899,993
|
904,926
|
729,885
|
738,124
|
||||||||||||
|
Mortgage-backed securities issued by government-sponsored enterprises not due at a single maturity date
|
89,497
|
92,330
|
64,870
|
66,024
|
||||||||||||
|
Total
|
$
|
2,165,536
|
$ |
2,175,989
|
$
|
1,580,397
|
$
|
1,592,973
|
||||||||
Certain balance sheet components are as follows:
|
January 30,
2011
|
January 31,
2010
|
|||||||
|
Inventories:
|
(In thousands)
|
|||||||
|
Raw materials
|
$
|
67,880
|
$
|
76,935
|
||||
|
Work in-process
|
72,698
|
67,502
|
||||||
|
Finished goods
|
204,947
|
186,237
|
||||||
|
Total inventories
|
$
|
345,525
|
$
|
330,674
|
||||
|
January 30,
2011
|
January 31,
2010
|
Estimated
Useful Life
|
|||||||
|
(In thousands)
|
(Years)
|
||||||||
|
Property and Equipment:
|
|||||||||
|
Land
|
$
|
217,372
|
$
|
217,372
|
(A)
|
||||
|
Building
|
29,326
|
29,223
|
3-25
|
||||||
|
Test equipment
|
293,807
|
261,172
|
3
|
||||||
|
Software and licenses
|
306,699
|
232,785
|
3-5
|
||||||
|
Leasehold improvements
|
146,508
|
143,649
|
(B)
|
||||||
|
Computer equipment
|
132,896
|
139,482
|
3
|
||||||
|
Office furniture and equipment
|
36,239
|
34,091
|
5
|
||||||
|
Capital leases
|
26,618
|
26,618
|
(C)
|
||||||
|
Construction in process
|
4,474
|
4,091
|
(D)
|
||||||
|
1,193,939
|
1,088,483
|
||||||||
|
Accumulated depreciation and amortization
|
(625,082
|
)
|
(516,625
|
)
|
|||||
|
Total property and equipment, net
|
$
|
568,857
|
$
|
571,858
|
|||||
(A) Land is a non-depreciable asset.
(B) Leasehold improvements are amortized based on the lesser of either the asset’s estimated useful life or the remaining lease term.
(C) Capital leases are amortized based on the lesser of either the asset’s estimated useful life or the remaining lease term.
(D) Construction in process represents assets that are not in service as of the balance sheet date.
Depreciation expense for fiscal years 2011, 2010 and 2009 was $157.0 million, $164.8 million and $152.4 million, respectively.
77
NVIDIA CORPORATION AND SUBSIDIARIES
NOTES TO THE CONSOLIDATED FINANCIAL STATEMENTS
(Continued)
|
January 30,
2011
|
January 31,
2010
|
|||||||
|
Prepaid Expenses and Other
|
(In thousands)
|
|||||||
|
Prepaid maintenance
|
$
|
12,165
|
$
|
15,153
|
||||
|
Prepaid insurance
|
3,512
|
5,389
|
||||||
|
Prepaid taxes
|
1,364
|
3,574
|
||||||
|
Prepaid rent
|
3,599
|
3,352
|
||||||
|
Other
|
11,996
|
10,746
|
||||||
|
Total prepaid expenses and other
|
$
|
32,636
|
$
|
38,214
|
||||
|
January 30,
2011
|
January 31,
2010
|
|||||||
|
Deposits and Other Assets
|
(In thousands)
|
|||||||
|
Prepaid maintenance, long term
|
$
|
21,239
|
$
|
15,432
|
||||
|
Lease deposits
|
7,003
|
10,611
|
||||||
|
Investment in non-affiliates
|
8,792
|
6,630
|
||||||
|
Other
|
3,816
|
10,255
|
||||||
|
Total deposits and other assets
|
$
|
40,850
|
$
|
42,928
|
||||
|
January 30,
2011
|
January 31,
2010
|
|||||||
|
Accrued Liabilities:
|
(In thousands)
|
|||||||
|
Accrued customer programs (1)
|
$
|
171,163
|
$
|
212,107
|
||||
|
Warranty accrual (2)
|
107,897
|
92,655
|
||||||
|
Accrued payroll and related expenses
|
71,915
|
54,915
|
||||||
|
Accrued legal settlement (3)
|
30,600
|
30,600
|
||||||
|
Deferred rent
|
3,268
|
10,245
|
||||||
|
Deferred revenue
|
245,596
|
9,379
|
||||||
|
Taxes payable, short term
|
4,576
|
1,784
|
||||||
|
Other
|
21,529
|
28,166
|
||||||
|
Total accrued liabilities and other
|
$
|
656,544
|
$
|
439,851
|
||||
(1) Please refer to Note 1 of the Notes to these Consolidated Financial Statements for discussion regarding the nature of accrued customer programs and their accounting treatment related to our revenue recognition policies and estimates.
(2) Please refer to Note 12 of the Notes to these Consolidated Financial Statements for discussion regarding the warranty accrual.
(3) Please refer to Note 13 of the Notes to these Consolidated Financial Statements for discussion regarding the 3dfx litigation.
|
January 30,
2011
|
January 31,
2010
|
|||||||
|
Other Long Term Liabilities:
|
(In thousands)
|
|||||||
|
Deferred income tax liability
|
$
|
46,129
|
$
|
17,739
|
||||
|
Income tax payable
|
57,590
|
53,397
|
||||||
|
Asset retirement obligations
|
9,694
|
10,638
|
||||||
|
Deferred revenue from Intel Cross License Agreement (1)
|
163,000
|
-
|
||||||
|
Other
|
71,300
|
30,176
|
||||||
|
Total other long-term liabilities
|
$
|
347,713
|
$
|
111,950
|
||||
(1) Please refer to Note 4 of the Notes to these Consolidated Financial Statements for discussion regarding our revenue recognition under this agreement.
78
NVIDIA CORPORATION AND SUBSIDIARIES
NOTES TO THE CONSOLIDATED FINANCIAL STATEMENTS
(Continued)
U.S. GAAP, requires that upon issuance of a guarantee, the guarantor must recognize a liability for the fair value of the obligation it assumes under that guarantee. In addition, U.S. GAAP requires disclosures about the guarantees that an entity has issued, including a tabular reconciliation of the changes of the entity’s product warranty liabilities.
Product Defect
Our products are complex and may contain defects or experience failures due to any number of issues in design, fabrication, packaging, materials and/or use within a system. If any of our products or technologies contains a defect, compatibility issue or other error, we may have to invest additional research and development efforts to find and correct the issue. Such efforts could divert our management’s and engineers’ attention from the development of new products and technologies and could increase our operating costs and reduce our gross margin. In addition, an error or defect in new products or releases or related software drivers after commencement of commercial shipments could result in failure to achieve market acceptance or loss of design wins. Also, we may be required to reimburse customers, including for customers’ costs to repair or replace the products in the field, which could cause our revenue to decline. A product recall or a significant number of product returns could be expensive, damage our reputation and could result in the shifting of business to our competitors. Costs associated with correcting defects, errors, bugs or other issues could be significant and could materially harm our financial results.
During the second quarter of fiscal year 2011, we recorded an additional charge to cover the estimated remaining customer warranty, repair, return, replacement and other costs arising from a weak die/packaging material set in certain versions of our previous generation media and communications processor, or MCP, and graphics processing unit, or GPU, products used in notebook configurations. The net charge amounted to $193.9 million, of which $181.2 million was charged against cost of revenue. The extra remediation costs are primarily due to additional platforms from late failing systems that we had not previously considered to be at risk. Included in the charge are the estimated costs of implementing a settlement reached during the second quarter of fiscal year 2011 with the plaintiffs of a putative consumer class action lawsuit related to this same matter and another related estimated consumer class action settlement. As a result of this settlement, the other estimated settlement, and offsetting insurance reimbursements, we recorded a net charge of $12.7 million to sales, general and administrative expense during the second quarter of fiscal year 2011. Together with the $282.0 million net charge we had previously recorded for related estimated costs, this brings the total cumulative net charge to $475.9 million, of which $466.4 million has been charged against cost of revenue and the remainder has been charged to sales, general and administrative.
The previous generation MCP and GPU products that are impacted were included in a number of notebook products that were shipped and sold in significant quantities. Certain notebook configurations of these products are failing in the field at higher than normal rates. Testing suggests a weak material set of die/package combination, system thermal management designs, and customer use patterns are contributing factors for these failures. We have worked with our customers to develop and have made available for download a software driver to cause the system fan to begin operation at the powering up of the system and reduce the thermal stress on these chips. We have also recommended to our customers that they consider changing the thermal management of the products in their notebook system designs. We intend to fully support our customers in their repair and replacement of these impacted products that fail, and their other efforts to mitigate the consequences of these failures. The weak die/packaging material combination is not used in any of our products that are currently in production.
In September, October and November 2008, several putative securities class action lawsuits were filed against us, asserting various claims related to the impacted MCP and GPU products. Please refer to Note 13 of these Notes to the Consolidated Financial Statements for further information regarding this litigation and the settlement.
79
NVIDIA CORPORATION AND SUBSIDIARIES
NOTES TO THE CONSOLIDATED FINANCIAL STATEMENTS
(Continued)
Accrual for estimated product returns and product warranty liabilities
We record a reduction to revenue for estimated product returns at the time revenue is recognized primarily based on historical return rates. Cost of revenue includes the estimated cost of product warranties that are calculated at the point of revenue recognition. Under limited circumstances, we may offer an extended limited warranty to customers for certain products. Additionally, we accrue for known warranty and indemnification issues if a loss is probable and can be reasonably estimated. The estimated product returns and estimated product warranty liabilities for fiscal years 2011, 2010 and 2009 are as follows:
|
January 30,
2011
|
January 31,
2010
|
January 25,
2009
|
||||||||||
|
(In thousands)
|
||||||||||||
|
Balance at beginning of period
|
$
|
92,655
|
$
|
150,631
|
$
|
5,708
|
||||||
|
Additions (1)
|
194,108
|
170,715
|
202,698
|
|||||||||
|
Deductions (2)
|
(178,867
|
)
|
(228,691
|
)
|
(57,775
|
)
|
||||||
|
Balance at end of period
|
$
|
107,896
|
$
|
92,655
|
$
|
150,631
|
||||||
(1) Includes $186.2 million, $164.5 million and $196.0 million for fiscal years 2011, 2010 and 2009, respectively, for incremental repair and replacement costs from a weak die/packaging material set.
(2) Includes $149.8 million, $196.0 million and $37.5 million for fiscal years 2011, 2010 and 2009, respectively, in payments related to the warranty accrual associated with incremental repair and replacement costs from a weak die/packaging material set.
In connection with certain agreements that we have executed in the past, we have at times provided indemnities to cover the indemnified party for matters such as tax, product and employee liabilities. We have also on occasion included intellectual property indemnification provisions in our technology related agreements with third parties. Maximum potential future payments cannot be estimated because many of these agreements do not have a maximum stated liability. As such, we have not recorded any liability in our Consolidated Financial Statements for such indemnifications.
Inventory Purchase Obligations
At January 30, 2011 and January 31, 2010, we had outstanding inventory purchase obligations totaling $546.4 million and $462.0 million, respectively.
Capital Purchase Obligations
At January 30, 2011 and January 31, 2010, we had outstanding capital purchase obligations totaling $31.8 million and $25.2 million, respectively.
Lease Obligations
Our headquarters complex is located in Santa Clara, California and includes eight buildings that are leased properties. The lease agreements for four of the eight leased properties expire in fiscal year 2020 and include four five-year renewals at our option; one leased property expires in fiscal year 2013 with an option to extend for one year; one leased property expires in fiscal year 2012 with an option to extend for three years; one lease property expires in fiscal year 2020 with two five year renewals at our option and the remaining leased building expires in fiscal year 2015 with an option to extend for three years. Future minimum lease payments related to headquarter operating leases total $121.4 million over the remaining terms of the leases, including predetermined rent escalations, and are included in the future minimum lease payment schedule below.
80
NVIDIA CORPORATION AND SUBSIDIARIES
NOTES TO THE CONSOLIDATED FINANCIAL STATEMENTS
(Continued)
In addition to the commitment of our headquarters, we have other domestic and international office facilities under operating leases expiring through fiscal year 2018. Future minimum lease payments under our non-cancelable operating leases as of January 30, 2011, are as follows:
|
Future Minimum Lease Obligations
|
||||
|
(In thousands)
|
||||
|
Year ending January:
|
||||
|
2012
|
$ | 46,329 | ||
|
2013
|
27,898 | |||
|
2014
|
23,071 | |||
|
2015
|
18,949 | |||
|
2016
|
15,166 | |||
|
2017 and thereafter
|
45,753 | |||
|
Total
|
$ | 177,166 | ||
Rent expense for the years ended January 30, 2011, January 31, 2010 and January 25, 2009 was $40.7 million, $46.2 million and $43.0 million, respectively.
Capital lease reflect building and office equipment lease obligations. The building lease relates to our data center in Santa Clara, California. Future minimum lease payments under the building capital lease total $39.5 million over the remaining lease term, including predetermined rent escalations, and are included in the future minimum lease payment schedule below:
|
Future Capital Lease Obligations
|
||||
|
(In thousands)
|
||||
|
Year ending January:
|
||||
|
2012
|
$
|
4,654
|
||
|
2013
|
4,788
|
|||
|
2014
|
4,926
|
|||
|
2015
|
4,852
|
|||
|
2016
|
4,997
|
|||
|
2017 and thereafter
|
15,909
|
|||
|
Total
|
$
|
40,126
|
||
|
Present Value of minimum lease payments
|
$
|
25,063
|
||
|
Current portion
|
$
|
1,674
|
||
|
Long term portion
|
$
|
23,389
|
||
Litigation
3dfx
On December 15, 2000, NVIDIA and one of our indirect subsidiaries entered into an Asset Purchase Agreement, or APA, to purchase certain graphics chip assets from 3dfx. The transaction closed on April 18, 2001. That acquisition, and 3dfx’s October 2002 bankruptcy filing, led to four lawsuits against NVIDIA: two brought by 3dfx’s former landlords, one by 3dfx’s bankruptcy trustee and the fourth by a committee of 3dfx’s equity security holders in the bankruptcy estate. As of the date of the filing of this Annual Report on Form 10-K, the two landlord cases have been settled with payments from the landlords to NVIDIA, and the equity security holders lawsuit was dismissed with prejudice and no appeal was filed. Accordingly, only the bankruptcy trustee suit remains outstanding as more fully explained below.
In March 2003, the Trustee appointed by the Bankruptcy Court to represent 3dfx’s bankruptcy estate served a complaint on NVIDIA asserting claims for, among other things, successor liability and fraudulent transfer and seeking additional payments from us. The Trustee’s fraudulent transfer theory alleged that NVIDIA had failed to pay reasonably equivalent value for 3dfx’s assets, and sought recovery of the difference between the $70 million paid and the alleged fair value, which the Trustee estimated to exceed $50 million. The Trustee’s successor liability theory alleged NVIDIA was effectively 3dfx’s legal successor and therefore was responsible for all of 3dfx’s unpaid liabilities.
On October 13, 2005, the Bankruptcy Court heard the Trustee’s motion for summary adjudication, and on December 23, 2005, denied that motion in all material respects and held that NVIDIA may not dispute that the value of the 3dfx transaction was less than $108 million. The Bankruptcy Court denied the Trustee’s request to find that the value of the 3dfx assets conveyed to NVIDIA was at least $108 million.
81
NVIDIA CORPORATION AND SUBSIDIARIES
NOTES TO THE CONSOLIDATED FINANCIAL STATEMENTS
(Continued)
In early November 2005, after several months of mediation, NVIDIA and the Official Committee of Unsecured Creditors, or the Creditors’ Committee, agreed to a Plan of Liquidation of 3dfx, which included a conditional settlement of the Trustee’s claims against us. This conditional settlement was subject to a confirmation process through a vote of creditors and the review and approval of the Bankruptcy Court. The conditional settlement called for a payment by NVIDIA of approximately $30.6 million to the 3dfx estate. Under the settlement, $5.6 million related to various administrative expenses and Trustee fees, and $25.0 million related to the satisfaction of debts and liabilities owed to the general unsecured creditors of 3dfx. Accordingly, during the three month period ended October 30, 2005, we recorded $5.6 million as a charge to settlement costs and $25.0 million as additional purchase price for 3dfx. The Trustee advised that he intended to object to the settlement. The conditional settlement never progressed substantially through the confirmation process.
On December 21, 2006, the Bankruptcy Court scheduled a trial for one portion of the Trustee’s case against NVIDIA. On January 2, 2007, NVIDIA terminated the settlement agreement on grounds that the Bankruptcy Court had failed to proceed toward confirmation of the Creditors’ Committee’s plan. A non-jury trial began on March 21, 2007 on valuation issues in the Trustee’s constructive fraudulent transfer claims against NVIDIA. Specifically, the Bankruptcy Court tried four questions: (1) what did 3dfx transfer to NVIDIA in the APA; (2) of what was transferred, what qualifies as “property” subject to the Bankruptcy Court’s avoidance powers under the Uniform Fraudulent Transfer Act and relevant bankruptcy code provisions; (3) what is the fair market value of the “property” identified in answer to question (2); and (4) was the $70 million that NVIDIA paid “reasonably equivalent” to the fair market value of that property. The parties completed post-trial briefing on May 25, 2007.
On April 30, 2008, the Bankruptcy Court issued its Memorandum Decision After Trial, in which it provided a detailed summary of the trial proceedings and the parties’ contentions and evidence and concluded that “the creditors of 3dfx were not injured by the Transaction.” This decision did not entirely dispose of the Trustee’s action, however, as the Trustee’s claims for successor liability and intentional fraudulent conveyance were still pending. On June 19, 2008, NVIDIA filed a motion for summary judgment to convert the Memorandum Decision After Trial to a final judgment. That motion was granted in its entirety and judgment was entered in NVIDIA’s favor on September 11, 2008. The Trustee filed a Notice of Appeal from that judgment on September 22, 2008, and on September 25, 2008, NVIDIA exercised its election to have the appeal heard by the United States District Court.
The District Court’s hearing on the Trustee’s appeal was held on June 10, 2009. On December 20, 2010, the District Court issued an Order affirming the Bankruptcy Court’s entry of summary judgment in NVIDIA’s favor. On January 19, 2011, the Trustee filed a Notice of Appeal to the United States Court of Appeals for the Ninth Circuit.
While the conditional settlement reached in November 2005 never progressed through the confirmation process, the Trustee’s case still remains pending on appeal. Accordingly, we have not reversed the accrual of $30.6 million – $5.6 million as a charge to settlement costs and $25.0 million as additional purchase price for 3dfx – that we recorded during the three months ended October 30, 2005, pending resolution of the appeal of the Trustee’s case.
Rambus Inc.
On July 10, 2008, Rambus filed suit against NVIDIA, asserting patent infringement of 17 patents claimed to be owned by Rambus. Rambus seeks damages, enhanced damages and injunctive relief. The lawsuit was filed in the Northern District of California in San Jose, California. On July 11, 2008, NVIDIA filed suit against Rambus in the Middle District of North Carolina asserting numerous claims, including antitrust and other claims. NVIDIA seeks damages, enhanced damages and injunctive relief. Rambus has since dropped two patents from its lawsuit in the Northern District of California. The two cases have been consolidated into a single proceeding in the San Francisco division of the Northern District of California. On April 13, 2009, the Court issued an order staying motion practice and allowing only certain document discovery to proceed. On February 11, 2011, the Court lifted the stay and ordered that discovery on other issues may now proceed. A case management conference is currently scheduled for June 3, 2011.
82
NVIDIA CORPORATION AND SUBSIDIARIES
NOTES TO THE CONSOLIDATED FINANCIAL STATEMENTS
(Continued)
On November 6, 2008, Rambus filed a complaint alleging a violation of 19 U.S.C. Section 1337 based on a claim of patent infringement of nine Rambus patents against NVIDIA and 14 other respondents with the U.S. International Trade Commission, or ITC. Rambus has subsequently withdrawn four of the nine patents at issue. The complaint sought an exclusion order barring the importation of products that allegedly infringe the now five Rambus patents. The ITC instituted the investigation and a hearing was held on October 13-20, 2009. The Administrative Law Judge issued an Initial Determination on January 22, 2010, which found the asserted claims of two patents in one patent family infringed but invalid, and the asserted claims of three patents in a separate patent family, valid, infringed and enforceable. This decision was reviewed by the ITC. The ITC issued a Final Decision on July 26, 2010. In its Final Decision, the ITC found that NVIDIA infringed three related patents and issued a limited exclusion order prohibiting import of certain NVIDIA products. NVIDIA is appealing certain aspects of the ruling that were unfavorable to NVIDIA. Rambus is also appealing certain aspects of the ruling that were unfavorable to Rambus.
NVIDIA also sought reexamination of the patents asserted in the ITC, as well as other patents, in the United States Patent and Trademark Office, or USPTO. Proceedings are underway with respect to all challenged patents. With respect to the claims asserted in the ITC, the USPTO has issued a preliminary ruling invalidating many of the claims. The USPTO has issued "Right to Appeal Notices" for the three patents found by the administrative law judge to be valid, enforceable and infringed. In the Right to Appeal Notices, the USPTO Examiner has cancelled all asserted claims of one of the patents and allowed the asserted claims on the other two patents. Rambus and NVIDIA are both seeking review of the USPTO Examiner's adverse findings. NVIDIA intends to pursue its offensive and defensive cases vigorously in both actions.
Rambus has also been subject to an investigation in the European Union. NVIDIA was not a party to that investigation, but has recently sought to intervene in the appeal of the investigation. As a result of Rambus’ commitments to resolve that investigation, for a period of five years from the date of the resolution, Rambus must now provide a license to memory controller manufacturers, sellers and/or companies that integrate memory controllers into other products. The license terms are set forth in a license made available on Rambus’ website, or the Required Rambus License. On August 12, 2010, we entered into the Required Rambus License. Pursuant to the agreement, Rambus charges a royalty of (i) one percent of the net sales price per unit for certain memory controllers and (ii) two percent of the net sales price per unit for certain other memory controllers, provided that the maximum average net sales price per unit for these royalty bearing products shall be deemed not to exceed a maximum of $20. The agreement has a term until December 9, 2014. However, NVIDIA may terminate the agreement on or after August 12, 2011 with thirty 30 days prior written notice to Rambus.
On December 1, 2010, Rambus filed a new lawsuit against NVIDIA and several other companies alleging six claims for patent infringement. This lawsuit is pending in the Northern District of California and seeks damages, enhanced damages and injunctive relief. On the same day, Rambus filed a complaint with the ITC alleging that NVIDIA and several other companies violated 19 U.S.C. Section 1337 based on a claim of patent infringement of three Rambus patents. Rambus seeks exclusion of certain NVIDIA products from importation into the United States. The Northern District of California has stayed the case pending resolution of the ITC investigation. The asserted patents are related to each other, and the three patents in the ITC complaint are also at issue in the lawsuit pending in the Northern District of California. Many of the patents at issue in the new lawsuits are also being challenged in Rambus’ other disputes with NVIDIA. NVIDIA intends to vigorously defend these new lawsuits.
Product Defect Litigation and Securities Cases
Product Defect Litigation
In September, October and November 2008, several putative consumer class action lawsuits were filed against us, asserting various claims arising from a weak die/packaging material set in certain versions of our previous generation products used in notebook configurations. Most of the lawsuits were filed in Federal Court in the Northern District of California, but three were filed in state court in California, in Federal Court in New York, and in Federal Court in Texas. Those three actions have since been removed or transferred to the United States District Court for the Northern District of California, San Jose Division, where all of the actions now are currently pending. The various lawsuits are titled Nakash v. NVIDIA Corp., Feinstein v. NVIDIA Corp., Inicom Networks, Inc. v. NVIDIA Corp. and Dell, Inc. and Hewlett Packard, Olivos v. NVIDIA Corp., Dell, Inc. and Hewlett Packard, Sielicki v. NVIDIA Corp. and Dell, Inc., Cormier v. NVIDIA Corp., National Business Officers Association, Inc. v. NVIDIA Corp., and West v. NVIDIA Corp. The First Amended Complaint was filed on October 27, 2008, which no longer asserted claims against Dell, Inc. The various complaints assert claims for, among other things, breach of warranty, violations of the Consumer Legal Remedies Act, Business & Professions Code sections 17200 and 17500 and other consumer protection statutes under the laws of various jurisdictions, unjust enrichment, and strict liability.
83
NVIDIA CORPORATION AND SUBSIDIARIES
NOTES TO THE CONSOLIDATED FINANCIAL STATEMENTS
(Continued)
The District Court has entered orders deeming all of the above cases related under the relevant local rules. On December 11, 2008, NVIDIA filed a motion to consolidate all of the aforementioned consumer class action cases. On February 26, 2009, the District Court consolidated the cases, as well as two other cases pending against Hewlett Packard, under the caption “The NVIDIA GPU Litigation” and ordered the plaintiffs to file lead counsel motions by March 2, 2009. On March 2, 2009, several of the parties filed motions for appointment of lead counsel and briefs addressing certain related issues. On April 10, 2009, the District Court appointed Milberg LLP lead counsel. On May 6, 2009, the plaintiffs filed an Amended Consolidated Complaint, alleging claims for violations of California Business and Professions Code Section 17200, Breach of Implied Warranty under California Civil Code Section 1792, Breach of the Implied Warranty of Merchantability under the laws of 27 other states, Breach of Warranty under the Magnuson-Moss Warranty Act, Unjust Enrichment, violations of the New Jersey Consumer Fraud Act, Strict Liability and Negligence, and violation of California’s Consumer Legal Remedies Act.
On August 19, 2009, we filed a motion to dismiss the Amended Consolidated Complaint, and the Court heard arguments on that motion on October 19, 2009. On November 19, 2009, the Court issued an order dismissing with prejudice plaintiffs causes of action for Breach of the Implied Warranty under the laws of 27 other states and unjust enrichment, dismissing with leave to amend plaintiffs’ causes of action for Breach of Implied Warranty under California Civil Code Section 1792 and Breach of Warranty under the Magnuson-Moss Warranty Act, and denying NVIDIA’s motion to dismiss as to the other causes of action. The Court gave plaintiffs until December 14, 2009 to file an amended complaint. On December 14, 2009, plaintiffs filed a Second Amended Consolidated Complaint, asserting claims for violations of California Business and Professions Code Section 17200, Breach of Implied Warranty under California Civil Code Section 1792, Breach of Warranty under the Magnuson-Moss Warranty Act, violations of the New Jersey Consumer Fraud Act, Strict Liability and Negligence, and violation of California’s Consumer Legal Remedies Act. The Second Amended Complaint seeks unspecified damages. On January 19, 2010, we filed a motion to dismiss the Breach of Implied Warranty under California Civil Code Section 1792, Breach of Warranty under the Magnuson-Moss Warranty Act, and California’s Consumer Legal Remedies Act claims in the Second Amended Consolidated Complaint. In addition, on April 1, 2010, Plaintiffs filed a motion to certify a class consisting of all people who purchased computers containing certain of our MCP and GPU products. On May 3, 2010, we filed an opposition to Plaintiffs’ motion for class certification. A hearing on both motions was held on June 14, 2010. On July 16, 2010, the parties filed a stipulation with the District Court advising that, following mediation they had reached a settlement in principle in
The NVIDIA GPU Litigation
. The settlement in principle was subject to certain approvals, including final approval by the court. As a result of the settlement in principle, and the other estimated settlement, and offsetting insurance reimbursements, NVIDIA recorded a net charge of $12.7 million to sales, general and administrative expense during the second quarter of fiscal year 2011. In addition, a portion of the $181.2 million of additional charges we recorded against cost of revenue related to the weak die/packaging set during the second quarter of fiscal year 2011, relates to estimated additional repair and replacement costs related to the implementation of these settlements. On August 12, 2010, the parties executed a Stipulation and Agreement of Settlement and Release. On September 15, 2010, the Court issued an order granting preliminary approval of the settlement and providing for notice to the potential class members. The Final Approval Hearing was held on December 20, 2010, and on that same day the Court approved the settlement and entered Final Judgment over several objections. In January 2011, several objectors filed Notices of Appeal of the Final Judgment to the United States Court of Appeals for the Ninth Circuit.
On February 28, 2011, a group of purported class members filed a motion with the District Court purporting to seek enforcement of the settlement. The Motion claimed that NVIDIA was not properly complying with its obligations under the settlement in connection with the remedies provided to purchasers of Hewlett-Packard computers included in the settlement. On March 4, 2011, NVIDIA and Class Counsel at Milberg LLP filed oppositions to the Motion. A hearing is scheduled for March 28, 2011.
Securities Cases
In September 2008, three putative securities class actions, or the Actions, were filed in the United States District Court for the Northern District of California arising out of our announcements on July 2, 2008, that we would take a charge against cost of revenue to cover anticipated costs and expenses arising from a weak die/packaging material set in certain versions of our previous generation MCP and GPU products and that we were revising financial guidance for our second quarter of fiscal year 2009. The Actions purport to be brought on behalf of purchasers of NVIDIA stock and assert claims for violations of Sections 10(b) and 20(a) of the Exchange Act. On October 30, 2008, the Actions were consolidated under the caption In re NVIDIA Corporation Securities Litigation, Civil Action No. 08-CV-04260-JW (HRL). Lead Plaintiffs and Lead Plaintiffs’ Counsel were appointed on December 23, 2008. On February 6, 2009, co-Lead Plaintiff filed a Writ of Mandamus with the Ninth Circuit Court of Appeals challenging the designation of co-Lead Plaintiffs’ Counsel. On February 19, 2009, co-Lead Plaintiff filed with the District Court, a motion to stay the District Court proceedings pending resolution of the Writ of Mandamus by the Ninth Circuit. On February 24, 2009, Judge Ware granted the stay. On November 5, 2009, the Court of Appeals issued an opinion reversing the District Court’s appointment of one of the lead plaintiffs’ counsel, and remanding the matter for further proceedings. On December 8, 2009, the District Court appointed Milberg LLP and Kahn Swick & Foti, LLC as co-lead counsel. On January 22, 2010, Plaintiffs filed a Consolidated Amended Class Action Complaint for Violations of the Federal Securities Laws, asserting claims for violations of Section 10(b), Rule 10b-5, and Section 20(a) of the Exchange Act. The consolidated complaint sought unspecified compensatory damages. We filed a motion to dismiss the consolidated complaint in March 2010 and a hearing was held on June 24, 2010 before Judge Seeborg. On October 19, 2010, Judge Seeborg granted our motion to dismiss with leave to amend. On December 2, 2010, co-Lead Plaintiffs filed a Second Consolidated Amended Complaint and NVIDIA filed a motion to dimiss on February 14, 2011.
84
NVIDIA CORPORATION AND SUBSIDIARIES
NOTES TO THE CONSOLIDATED FINANCIAL STATEMENTS
(Continued)
Intel Corporation
Litigation
On February 17, 2009, Intel filed suit against NVIDIA, seeking declaratory and injunctive relief relating to a license agreement that the parties signed in 2004. The lawsuit was filed in Delaware Chancery Court. Intel sought an order from the Court declaring that the license does not extend to certain NVIDIA chipset products and enjoining NVIDIA from stating that it has license rights for these products. The lawsuit sought no damages from NVIDIA.
On March 23, 2009, NVIDIA filed its answer to Intel’s complaint and also asserted counterclaims for declaratory relief, injunctive relief, breach of contract and breach of the implied covenant of good faith and fair dealing. NVIDIA’s counterclaims sought an order declaring that NVIDIA has the right to sell certain chipset products with Intel’s processors under the 2004 license agreement, and enjoining Intel from interfering with our license rights. In addition, the counterclaims sought a finding that Intel had materially breached its obligations under a prior license agreement, and requested various remedies for that breach, including termination of Intel’s cross licensing rights and damages. On April 16, 2009, Intel filed its answer to our counterclaims.
As described below, on January 10, 2011, NVIDIA and Intel entered into a patent cross license agreement. Pursuant to this patent cross license agreement, NVIDIA and Intel also agreed to dismiss the Delaware litigation, and each party gave the other a general release for all claims that it might have against the other, known or unknown, based on the actions of either party on or before the date of the settlement. By stipulation of the parties, the Delaware Chancery Court dismissed the lawsuit with prejudice on January 12, 2011.
Patent Cross License Agreement
On January 10, 2011, we entered into a new six-year patent cross licensing agreement, or the License Agreement, with Intel. Under the License Agreement, Intel has granted to NVIDIA and its qualified subsidiaries, and NVIDIA has granted to Intel and Intel’s qualified subsidiaries, a non-exclusive, non-transferable, worldwide license, without the right to sublicense to all patents that are either owned or controlled by the parties at any time that have a first filing date on or before March 31, 2017, to make, have made (subject to certain limitations), use, sell, offer to sell, import and otherwise dispose of certain semiconductor- and electronic-related products anywhere in the world. NVIDIA’s rights to Intel’s patents have certain specified limitations, including but not limited to, NVIDIA was not granted a license to: (1) certain microprocessors, defined in the License Agreement as “Intel Processors” or “Intel Compatible Processors;” (2) certain chipsets that connect to Intel Processors; or (3) certain flash memory products. In connection with the License Agreement, NVIDIA and Intel mutually agreed to settle all outstanding legal disputes. Under the License Agreement, Intel will pay NVIDIA an aggregate amount of $1.5 billion, payable in annual installments, as follows: a $300 million payment on each of January 18, 2011, January 13, 2012 and January 15, 2013 and a $200 million payment on each of January 15, 2014, 2015 and 2016.
Accounting for loss contingencies
While there can be no assurance of favorable outcomes, we believe the claims made by other parties in the above ongoing matters are without merit and we intend to vigorously defend the actions. With the exception of the 3dfx and product defect litigation cases, we have not recorded any accrual for contingent liabilities associated with the legal proceedings described above based on our belief that liabilities, while possible, are not probable. Further, any possible range of loss in these matters cannot be reasonably estimated at this time. We are engaged in other legal actions not described above arising in the ordinary course of its business and, while there can be no assurance of favorable outcomes, we believe that the ultimate outcome of these actions will not have a material adverse effect on our operating results, liquidity or financial position.
85
NVIDIA CORPORATION AND SUBSIDIARIES
NOTES TO THE CONSOLIDATED FINANCIAL STATEMENTS
(Continued)
The income tax expense (benefit) applicable to income before income taxes consists of the following:
|
Year Ended
|
||||||||||||
|
January 30,
2011
|
January 31,
2010
|
January 25,
2009
|
||||||||||
|
(In thousands)
|
||||||||||||
|
Current income taxes:
|
||||||||||||
|
Federal
|
$
|
141
|
$
|
177
|
$
|
(31
|
)
|
|||||
|
State
|
(511)
|
438
|
133
|
|||||||||
|
Foreign
|
6,827
|
6,966
|
8,923
|
|||||||||
|
Total current
|
6,457
|
7,581
|
9,025
|
|||||||||
|
Deferred taxes:
|
||||||||||||
|
Federal
|
(3,063)
|
(22,013
|
)
|
(21,348
|
)
|
|||||||
|
State
|
-
|
-
|
-
|
|||||||||
|
Foreign
|
417
|
866
|
(1,929
|
)
|
||||||||
|
Total deferred
|
(2,646
|
)
|
(21,147
|
)
|
(23,277
|
)
|
||||||
|
Charge in lieu of taxes attributable to employer stock option plans
|
14,212
|
(741)
|
1,339
|
|||||||||
|
Income tax expense (benefit)
|
$
|
18,023
|
$
|
(14,307
|
)
|
$
|
(12,913
|
)
|
||||
Income (loss) before income taxes consists of the following:
|
Year Ended
|
||||||||||||
|
January 30,
2011
|
January 31,
2010
|
January 25,
2009
|
||||||||||
|
(In thousands)
|
||||||||||||
|
Domestic
|
$
|
82,531
|
$
|
(105,793
|
)
|
$
|
(135,149
|
)
|
||||
|
Foreign
|
188,638
|
23,499
|
92,195
|
|||||||||
|
$
|
271,169
|
$
|
(82,294
|
)
|
$
|
(42,954
|
)
|
|||||
The income tax expense (benefit) differs from the amount computed by applying the federal statutory income tax rate of 35% to income (loss) before income taxes as follows:
|
Year Ended
|
||||||||||||
|
January 30,
2011
|
January 31,
2010
|
January 25,
2009
|
||||||||||
|
(In thousands)
|
||||||||||||
|
Tax expense computed at federal statutory rate
|
$
|
94,909
|
$
|
(28,803
|
)
|
$
|
(15,034
|
)
|
||||
|
State income taxes, net of federal tax effect
|
(391)
|
(196)
|
957
|
|||||||||
|
Foreign tax rate differential
|
(49,585)
|
26,902
|
18,875
|
|||||||||
|
Research tax credit
|
(28,729)
|
(22,270
|
)
|
(22,766
|
)
|
|||||||
|
Stock-based compensation
|
1,668
|
10,114
|
5,342
|
|||||||||
|
Other
|
151
|
(54
|
)
|
(287
|
)
|
|||||||
|
Income tax expense (benefit)
|
$
|
18,023
|
$
|
(14,307
|
)
|
$
|
(12,913
|
)
|
||||
86
NVIDIA CORPORATION AND SUBSIDIARIES
NOTES TO THE CONSOLIDATED FINANCIAL STATEMENTS
(Continued)
The tax effect of temporary differences that gives rise to significant portions of the deferred tax assets and liabilities are presented below:
|
January 30,
2011
|
January 31,
2010
|
|||||||
|
(In thousands)
|
||||||||
|
Deferred tax assets:
|
||||||||
|
Net operating loss carryforwards
|
$
|
40,128
|
$
|
33,955
|
||||
|
Accruals and reserves, not currently deductible for tax purposes
|
14,997
|
14,027
|
||||||
|
Property, equipment and intangible assets
|
39,765
|
35,282
|
||||||
|
Research and other tax credit carryforwards
|
255,111
|
193,528
|
||||||
|
Stock-based compensation
|
37,701
|
40,202
|
||||||
|
Gross deferred tax assets
|
387,702
|
316,994
|
||||||
|
Less: valuation allowance
|
(148,016)
|
(113,442
|
)
|
|||||
|
Total deferred tax assets
|
239,686
|
203,552
|
||||||
|
Deferred tax liabilities:
|
||||||||
|
Unremitted earnings of foreign subsidiaries
|
(275,509)
|
(211,778
|
)
|
|||||
|
Net deferred tax asset (liability)
|
$
|
(35,823)
|
$
|
(8,226
|
)
|
|||
We recognized income tax expense (benefit) of $18.0 million, $(14.3) million, and $(12.9) million during fiscal years 2011, 2010 and 2009, respectively. Income tax expense (benefit) as a percentage of income (loss) before taxes, or our annual effective tax rate, was 6.7% in fiscal year 2011, 17.4% in fiscal year 2010 and 30.0% in fiscal year 2009.
Our effective tax rate on income or loss before tax for the fiscal years was lower than the United States federal statutory rate of 35% due to income or loss earned in jurisdictions where the tax rate is lower than the United States federal statutory tax rate of 35%, favorable recognition in these fiscal years of the U.S. federal research tax credit and the expiration of statues of limitations in certain non-U.S. jurisdictions for which we had not previously recognized related tax benefits.
As of January 30, 2011, we had a valuation allowance of $148.0 million related to state and certain foreign deferred tax assets that management determined not likely to be realized due, in part, to projections of future taxable income and potential utilization limitations of tax attributes acquired as a result of stock ownership changes. To the extent realization of the deferred tax assets becomes more-likely-than-not, we would recognize such deferred tax asset as an income tax benefit during the period the realization occurred.
Our deferred tax assets do not include the excess tax benefit related to stock-based compensation that are a component of our federal and state net operating loss and research tax credit carryforwards in the amount of $565.2 million as of January 30, 2011. Consistent with prior years, the excess tax benefit reflected in our net operating loss and research tax credit carryforwards will be accounted for as a credit to stockholders’ equity, if and when realized. In determining if and when excess tax benefits have been realized, we have elected to utilize the with-and-without approach with respect to such excess tax benefits. We have also elected to ignore the indirect tax effects of stock-based compensation deductions for financial and accounting reporting purposes, and specifically to recognize the full effect of the research tax credit in income from continuing operations.
As of January 30, 2011, we had a federal net operating loss carryforward of $1.24 billion, combined state net operating loss carryforwards of $862.8 million, and combined foreign net operating loss carryforwards of $68 million. The federal net operating loss carryforwards will expire beginning in fiscal year 2021 and the state net operating loss carryforwards will begin to expire in fiscal year 2012 in accordance with the rules of each particular state. The foreign net operating loss carryforwards, of which $61.7 million is attributable to Germany, may be carried forward indefinitely, and the remaining amount of $6.3 million relates to other foreign jurisdictions that begin to expire in fiscal year 2012. As of January 30, 2011, we had federal research tax credit carryforwards of $284.1 million that will begin to expire in fiscal year 2018. We have other federal tax credit carryforwards of $1.3 million that will begin to expire in fiscal year 2012. The research tax credit carryforwards attributable to states is in the amount of $269.9 million, of which $260.3 million is attributable to the State of California and may be carried over indefinitely, and $9.6 million is attributable to various other states and will expire beginning in fiscal year 2012 according to the rules of each particular state. We have other state tax credit carryforwards of $4.3 million that will begin to expire in fiscal year 2012 and other foreign tax credit carryforwards of $2.9 million that will begin to expire in fiscal year 2013. Our tax attributes, net operating loss and tax credit carryforwards, remain subject to audit and may be adjusted for changes or modification in tax laws, other authoritative interpretations thereof, or other facts and circumstances. Utilization of federal, state, and foreign net operating losses and tax credit carryforwards may also be subject to limitations due to ownership changes and other limitations provided by the Internal Revenue Code and similar state and foreign tax provisions. If any such limitations apply, the federal, states, or foreign net operating loss and tax credit carryforwards, as applicable, may expire or be denied before utilization.
As of January 30, 2011, United States federal and state income taxes have not been provided on approximately $904.3 million of undistributed earnings of non-United States subsidiaries as such earnings are considered to be indefinitely reinvested. We have not provided the amount of unrecognized deferred tax liabilities for temporary differences related to investments in our foreign subsidiaries as the determination of such amount is not practicable.
The Company has a tax holiday in effect for its business operations in India which will terminate in March 2011. This tax holiday provides for a lower rate of taxation on certain classes of income based on various thresholds of investment and employment in such jurisdiction.For fiscal years 2009 through 2011, the aggregate tax savings of this holiday was approximately $2.8 million with no material per-share impact in these years or approximately $0.9 million per year..
As of January 30, 2011, we had $121.0 million of unrecognized tax benefits, all of which would affect our effective tax rate if recognized. However, included in the unrecognized tax benefits that would affect our effective tax rate if recognized of $121.0 million is $26.6 million and $0.2 million related to state and foreign income tax, respectively, that, if recognized, would be in the form of a carryforward deferred tax asset that would likely attract a full valuation allowance. The $121.0 million of unrecognized tax benefits as of January 30, 2011 consists of $46.4 million recorded in non-current income taxes payable and $74.6 million reflected as a reduction to the related deferred tax assets.
87
NVIDIA CORPORATION AND SUBSIDIARIES
NOTES TO THE CONSOLIDATED FINANCIAL STATEMENTS
(Continued)
A reconciliation of unrecognized tax benefits is as follows:
|
January 30,
2011
|
January 31,
2010
|
January 25,
2009
|
||||||||
|
(In thousands)
|
||||||||||
|
Balance at beginning of period
|
$
|
109,765
|
$
|
95,319
|
$
|
77,791
|
||||
|
Increases in tax positions for prior years
|
-
|
351
|
6,297
|
|||||||
|
Decreases in tax positions for prior years
|
(3,585)
|
(131
|
)
|
(272
|
)
|
|||||
|
Increases in tax positions for current year
|
18,628
|
18,342
|
13,622
|
|||||||
|
Settlements
|
(358)
|
-
|
(181
|
)
|
||||||
|
Lapse in statute of limitations
|
(3,416)
|
(4,116
|
)
|
(1,938
|
)
|
|||||
|
Balance at end of period
|
$
|
121,034
|
$
|
109,765
|
$
|
95,319
|
||||
We classify an unrecognized tax benefit as a current liability, or as a reduction of the amount of a net operating loss carryforward or amount refundable, to the extent that we anticipate payment or receipt of cash for income taxes within one year. Likewise, the amount is classified as a long-term liability if we anticipate payment or receipt of cash for income taxes during a period beyond a year.
Our policy is to include interest and penalties related to unrecognized tax benefits as a component of income tax expense. As of January 30, 2011 and January 31, 2010, and January 25, 2009, we had accrued $11.2 million, $11.2 million, and $11.8 million, respectively, for the payment of interest and penalties related to unrecognized tax benefits, which is not included as a component of our unrecognized tax benefits. As of January 30, 2011, non-current income taxes payable of $57.6 million consists of unrecognized tax benefits of $46.4 million and the related interest and penalties of $11.2 million.
While we believe that we have adequately provided for all tax positions, amounts asserted by tax authorities could be greater or less than our accrued position. Accordingly, our provisions on federal, state and foreign tax-related matters to be recorded in the future may change as revised estimates are made or the underlying matters are settled or otherwise resolved. As of January 30, 2011, we do not believe that our estimates, as otherwise provided for, on such tax positions will significantly increase or decrease within the next twelve months.
We are subject to taxation by a number of taxing authorities both in the United States and throughout the world. As of January 30, 2011, the material tax jurisdictions that are subject to examination include the United States, Hong Kong, Taiwan, China, India, and Germany and include our fiscal years 2004 through 2011. As of January 30, 2011, the material tax jurisdiction for which we are currently under examination include India for fiscal years 2003 through 2007.
Stock Repurchase Program
Our Board of Directors has authorized us, subject to certain specifications, to repurchase shares of our common stock up to an aggregate maximum amount of $2.7 billion through May 2013. The repurchases will be made from time to time in the open market, in privately negotiated transactions, or in structured stock repurchase programs, and may be made in one or more larger repurchases, in compliance with Rule 10b-18 of the Securities Exchange Act, subject to market conditions, applicable legal requirements, and other factors. The program does not obligate NVIDIA to acquire any particular amount of common stock and the program may be suspended at any time at our discretion. As part of our share repurchase program, we have entered into, and we may continue to enter into, structured share repurchase transactions with financial institutions. These agreements generally require that we make an up-front payment in exchange for the right to receive a fixed number of shares of our common stock upon execution of the agreement, and a potential incremental number of shares of our common stock, within a pre-determined range, at the end of the term of the agreement.
We did not enter into any structured share repurchase transactions or otherwise purchase any shares of our common stock during the twelve months ended January 30, 2011. Through January 30, 2011, we have repurchased an aggregate of 90.9 million shares under our stock repurchase program for a total cost of $1.46 billion. As of January 30, 2011, we are authorized, subject to certain specifications, to repurchase shares of our common stock up to $1.24 billion through May 2013.
Apart from our Board authorized stock repurchases, we withhold common stock shares associated with net share settlements to cover tax withholding obligations upon the vesting of restricted stock unit awards under our equity incentive program. During the twelve months ending January 30, 2011, we withheld approximately 1.1 million shares at a total cost of $16.1 million through net share settlements. Please refer to Note 3 of the Notes to the Consolidated Financial Statements for further discussion regarding our equity incentive plans.
Convertible Preferred Stock
As of January 30, 2011 and January 31, 2010, there were no shares of preferred stock outstanding.
Common Stock
At the Annual Meeting of Stockholders held on June 19, 2008, our stockholders approved an increase in our authorized number of shares of common stock to 2,000,000,000. The par value of our common stock remained unchanged at $0.001 per share.
Please refer to Note 2 of these Notes to the Consolidated Financial Statements for further discussion regarding the cash tender offer for certain employee stock options completed in March 2009.
88
NVIDIA CORPORATION AND SUBSIDIARIES
NOTES TO THE CONSOLIDATED FINANCIAL STATEMENTS
(Continued)
We have a 401(k) Retirement Plan, or the 401(k) Plan, covering substantially all of our United States employees. Under the Plan, participating employees may defer up to 100% of their pre-tax earnings, subject to the Internal Revenue Service annual contribution limits. Some of our non-US subsidiaries have defined benefit and defined contributions plans as required by local statutory requirements. Our costs under these plans have not been material.
Our Chief Executive Officer, who is considered to be our chief operating decision maker, or CODM, reviews financial information presented on an operating segment basis for purposes of making operating decisions and assessing financial performance. During the last several fiscal years, we have operated and reported four major product-line operating segments to our CODM: the GPU business, the PSB, the MCP business, and the CPB. However, during the first quarter of fiscal year 2011, we began reporting internally the results of our former MCP segment along with the results of our GPU segment to reflect the way we manage the GPU business. Comparative periods presented reflect this change.
Our GPU business is comprised primarily of our GeForce discrete and chipset products which support desktop and notebook personal computers, or PCs, plus memory products. Our PSB is comprised of our Quadro professional workstation products and other professional graphics products, including our NVIDIA Tesla high-performance computing products. Our CPB is comprised of our Tegra mobile products which support tablets, smartphones, personal media players, or PMPs, internet television, automotive navigation, and other similar devices. CPB also includes license, royalty, other revenue and associated costs related to video game consoles and other digital consumer electronics devices. Original equipment manufacturers, or OEMs, original design manufacturers, or ODMs, add-in-card manufacturers, system builders and consumer electronics companies worldwide utilize our processors as a core component of their entertainment, business and professional solutions.
The “All Other” category includes non-recurring charges and benefits that we do not allocate to our operating segments as these items are not included in the segment operating performance measures evaluated by our CODM. During the year ended January 30, 2011, we entered into a new six-year cross licensing agreement with Intel and also mutually agreed to settle all outstanding legal disputes. For accounting purposes, the fair valued benefit prescribed to the settlement portion was $57.0 million and was considered a non-recurring benefit for the fiscal year 2011. Please refer to Note 4 of the Notes to the Consolidated Financial Statements for further discussion regarding the patent cross license agreement with Intel. Non-recurring charges related to our cash tender offer to purchase certain employee stock options were $140.2 million for the year ended January 31, 2010. Please refer to Note 2 of the Notes to the Consolidated Financial Statements for further discussion regarding the cash tender offer. During the year ended January 25, 2009, we recorded a non- recurring charge of $26.9 million for restructuring and other charges associated with the termination of a development contract related to a new campus construction project we had put on hold. Please refer to Note 6 of the Notes to the Consolidated Financial Statements for further discussion regarding the restructuring and other charges.
Our CODM does not review any information regarding total assets on an operating segment basis. Operating segments do not record intersegment revenue, and, accordingly, there is none to be reported. The accounting policies for segment reporting are the same as for NVIDIA as a whole.
|
GPU
|
PSB
|
CPB
|
All Other
|
Consolidated
|
||||||||||||||||
|
Year Ended January 30, 2011:
|
||||||||||||||||||||
|
Revenue
|
$
|
2,527,144
|
$
|
818,552
|
$
|
197,613
|
$
|
-
|
$
|
3,543,309
|
||||||||||
|
Depreciation and amortization expense
|
$
|
126,536
|
$
|
26,711
|
$
|
33,742
|
$
|
-
|
$
|
186,989
|
||||||||||
|
Operating income (loss)
|
$
|
30,154
|
$
|
321,944
|
$
|
(153,351
|
)
|
$
|
57,000
|
$
|
255,747
|
|||||||||
|
Year Ended January 31, 2010:
|
||||||||||||||||||||
|
Revenue
|
$
|
2,660,176
|
$
|
510,223
|
$
|
156,046
|
$
|
-
|
$
|
3,326,445
|
||||||||||
|
Depreciation and amortization expense
|
$
|
139,298
|
$
|
28,443
|
$
|
28,923
|
$
|
-
|
$
|
196,664
|
||||||||||
|
Operating income (loss)
|
$
|
(13,487
|
)
|
$
|
148,953
|
$
|
(94,170
|
)
|
$
|
(140,241
|
)
|
$
|
(98,945
|
)
|
||||||
|
Year Ended January 25, 2009:
|
||||||||||||||||||||
|
Revenue
|
$
|
2,595,149
|
$
|
693,376
|
$
|
136,334
|
$
|
-
|
$
|
3,424,859
|
||||||||||
|
Depreciation and amortization expense
|
$
|
125,366
|
$
|
29,089
|
$
|
30,568
|
$
|
-
|
$
|
185,023
|
||||||||||
|
Operating income (loss)
|
$
|
(246,212
|
)
|
$
|
254,747
|
$
|
(52,367
|
)
|
$
|
(26,868
|
)
|
$
|
(70,700
|
)
|
||||||
Revenue by geographic region is allocated to individual countries based on the location to which the products are initially billed even if our customers’ revenue is attributable to end customers that are located in a different location. The following tables summarize information pertaining to our revenue from customers based on invoicing address in different geographic regions:
|
Year Ended
|
||||||||||||
|
January 30,
2011
|
January 31,
2010
|
January 25,
2009
|
||||||||||
|
Revenue:
|
(In thousands)
|
|||||||||||
|
China
|
$
|
1,223,199
|
$
|
1,304,196
|
$
|
1,087,739
|
||||||
|
Taiwan
|
936,797
|
883,137
|
974,077
|
|||||||||
|
Other Asia Pacific
|
519,473
|
406,286
|
601,480
|
|||||||||
|
Europe
|
261,421
|
203,760
|
321,117
|
|||||||||
|
United States
|
297,265
|
248,793
|
309,540
|
|||||||||
|
Other Americas
|
305,154
|
280,273
|
130,906
|
|||||||||
|
Total revenue
|
$
|
3,543,309
|
$
|
3,326,445
|
$
|
3,424,859
|
||||||
89
NVIDIA CORPORATION AND SUBSIDIARIES
NOTES TO THE CONSOLIDATED FINANCIAL STATEMENTS
(Continued)
The following table presents summarized information for long-lived assets by geographic region. Long lived assets consist of property and equipment and deposits and other assets and exclude goodwill and intangible assets.
|
January 30,
2011
|
January 31,
2010
|
|||||||
|
Long-lived assets:
|
(In thousands)
|
|||||||
|
United States
|
$
|
529,797
|
$
|
468,568
|
||||
|
Taiwan
|
56,202
|
69,051
|
||||||
|
China
|
32,500
|
39,124
|
||||||
|
India
|
31,454
|
32,070
|
||||||
|
Europe
|
4,541
|
5,603
|
||||||
|
Other Asia Pacific
|
787
|
370
|
||||||
|
Total long-lived assets
|
$
|
655,281
|
$
|
614,786
|
||||
Revenue from significant customers, those representing 10% or more of total revenue for the respective dates, is summarized as follows:
|
Year Ended
|
||||||||
|
January 30,
2011
|
January 31,
2010
|
January 25,
2009
|
||||||
|
Revenue:
|
||||||||
|
Customer A
|
12
|
%
|
12
|
%
|
7
|
%
|
||
|
Customer B
|
8
|
%
|
9
|
%
|
8
|
%
|
||
|
Customer C
|
6
|
%
|
7
|
%
|
11
|
%
|
||
Accounts receivable from significant customers, those representing 10% or more of total accounts receivable for the respective periods, is summarized as follows:
|
January 30,
2011
|
January 31,
2010
|
|||||
|
Accounts Receivable:
|
||||||
|
Customer A
|
11
|
%
|
10
|
%
|
||
|
Customer B
|
6
|
%
|
10
|
%
|
||
We measure our cash equivalents and marketable securities at fair value. The fair values of our financial assets and liabilities are determined using quoted market prices of identical assets or quoted market prices of similar assets from active markets. Our Level 1 assets consist of our money market funds. We classify securities within Level 1 assets when the fair value is obtained from real time quotes for transactions in active exchange markets involving identical assets. Our available-for- sale securities are classified as having Level 2 inputs. Our Level 2 assets are valued utilizing a market approach where the market prices of similar assets are provided by a variety of independent industry standard data providers to our investment custodian. There were no significant transfers between Levels 1 and 2 assets for the year ended January 30, 2011. Level 3 assets are based on unobservable inputs to the valuation methodology and include our own data about assumptions market participants would use in pricing the asset or liability based on the best information available under the circumstances.
90
NVIDIA CORPORATION AND SUBSIDIARIES
NOTES TO THE CONSOLIDATED FINANCIAL STATEMENTS
(Continued)
Financial assets and liabilities measured at fair value are summarized below:
|
Fair value measurement at reporting date using
|
|||||||||
|
Quoted Prices in Active Markets for Identical Assets
|
Significant Other Observable Inputs
|
||||||||
|
January 30, 2011
|
(Level 1)
|
(Level 2)
|
|||||||
|
Debt securities issued by U.S. Government agencies (1)
|
$
|
532,597
|
$
|
- |
$
|
532,597
|
|||
|
Corporate debt securities (2)
|
928,372
|
- |
928,372
|
||||||
|
Mortgage-backed securities issued by Government-sponsored entities (3)
|
145,422
|
- |
145,422
|
||||||
|
Money market funds (4)
|
132,586
|
132,586
|
- | ||||||
|
Debt securities issued by United States Treasury (5)
|
437,012
|
- |
437,012
|
||||||
|
Total assets
|
$
|
2,175,989
|
$
|
132,586
|
$
|
2,043,403
|
|||
(1) Includes $70.9 million in Cash Equivalents and $461.7 million in Marketable Securities on the Consolidated Balance Sheet.
(2) Includes $107.1 million in Cash Equivalents and $821.3 million in Marketable Securities on the Consolidated Balance Sheet.
(3) Included in Marketable Securities on the Consolidated Balance Sheet.
(4) Included in Cash Equivalents on the Consolidated Balance Sheet.
(5) Includes $40.2 million in Cash Equivalents and $396.8 million in Marketable Securities on the Consolidated Balance Sheet.
During fiscal year 2011, we recovered $3.1 million of the other than temporary impairment charge previously recorded, for the International Reserve Fund. The money market investment in the International Reserve Fund, was valued at $13.0 million as of January 31, 2010, after a $5.6 million other than temporary impairment charge that we recorded during fiscal year 2009. We had previously, assessed the fair value of the money market funds by considering the underlying securities held by the International Reserve Fund. Due to the inherent subjectivity and the significant judgment involved in the valuation of our holdings of the International Reserve Fund, we have previously, classified these securities under the Level 3 fair value hierarchy. As a result of the final payout of our invested portion, we received $16.1 million in the fourth quarter of fiscal year 2011. Consequently, we have no securities classified under Level 3.
Reconciliation of financial assets measured at fair value on a recurring basis using significant unobservable inputs, or Level 3 inputs (in thousands):
|
Balance, beginning of period, January 31, 2010
|
$
|
12,959
|
||
|
Transfer into Level 3
|
-
|
|||
|
Other than temporary impairment
|
-
|
|||
|
Redemption of funds
|
16,075
|
|||
|
Gain recorded in other income
|
(3,116
|
)
|
||
|
Balance, end of period, January 30, 2011
|
$
|
-
|
91
NVIDIA CORPORATION AND SUBSIDIARIES
NOTES TO THE CONSOLIDATED FINANCIAL STATEMENTS
(Continued)
The following table sets forth our unaudited consolidated financial results, for the last eight fiscal quarters:
|
Fiscal Year 2011
Quarters Ended
|
||||||||||||||||
|
January 30,
2011 (A)
|
October 31,
2010
|
August 1,
2010 (B, C, D)
|
May 2,
2010
|
|||||||||||||
|
(In thousands, except per share data)
|
||||||||||||||||
|
Statement of Operations Data:
|
||||||||||||||||
|
Revenue
|
$
|
886,376
|
$
|
843,912
|
$
|
811,208
|
$
|
1,001,813
|
||||||||
|
Cost of revenue
|
$
|
460,017
|
$
|
451,850
|
$
|
676,916
|
$
|
545,436
|
||||||||
|
Gross profit
|
$
|
426,359
|
$
|
392,062
|
$
|
134,292
|
$
|
456,377
|
||||||||
|
Net income (loss)
|
$
|
171,651
|
$
|
84,862
|
$
|
(140,961
|
)
|
$
|
137,594
|
|||||||
|
Basic net income (loss) per share
|
$
|
0.29
|
$
|
0.15
|
$
|
(0.25
|
)
|
$
|
0.24
|
|||||||
|
Diluted net income (loss) per share
|
$
|
0.29
|
$
|
0.15
|
$
|
(0.25
|
)
|
$
|
0.23
|
|||||||
|
Fiscal Year 2010
Quarters Ended
|
||||||||||||||||
|
January 31,
2010
|
October 25,
2009
(E)
|
July 26, 2009
(F, G)
|
April 26, 2009
(H)
|
|||||||||||||
|
(In thousands, except per share data)
|
||||||||||||||||
|
Statement of Operations Data:
|
||||||||||||||||
|
Revenue
|
$
|
982,488
|
$
|
903,206
|
$
|
776,520
|
$
|
664,231
|
||||||||
|
Cost of revenue
|
$
|
543,767
|
$
|
511,423
|
$
|
619,797
|
$
|
474,535
|
||||||||
|
Gross profit
|
$
|
438,721
|
$
|
391,783
|
$
|
156,723
|
$
|
189,696
|
||||||||
|
Net income (loss)
|
$
|
131,076
|
$
|
107,577
|
$
|
(105,302
|
)
|
$
|
(201,338)
|
|||||||
|
Basic net income (loss) per share
|
$
|
0.24
|
$
|
0.20
|
$
|
(0.19
|
)
|
$
|
(0.37)
|
|||||||
|
Diluted net income (loss) per share
|
$
|
0.23
|
$
|
0.19
|
$
|
(0.19
|
)
|
$
|
(0.37)
|
|||||||
|
(A)
|
Included $57.0 million benefit, as a result of the Company and Intel entering into a new six-year cross licensing agreement. Both parties also agreed to settle all outstanding legal disputes. Please refer to Note 13 of these Notes to Consolidated Financial Statements for details.
|
|
(B)
|
Included $13.4 million benefit from an insurance provider as reimbursement for some claims against us towards the cost arising from a weak die/packaging material set. Portions of the reimbursement are allocated to cost of revenue ($11.1 million) and legal expense ($2.3 million).
|
|
(C)
|
Included $192.3 million warranty charge against cost of revenue arising from a weak die/packaging material set.
|
|
(D)
|
Included $15.0 million charge related to a class action lawsuit settlement. Please refer to Note 13 of these Notes to Consolidated Financial Statements for details.
|
|
(E)
|
Included $25.1 million benefit from an insurance provider as reimbursement for some claims against us towards the cost arising from a weak die/packaging material set. Portions of the reimbursement are allocated to cost of revenue ($24.1 million) and legal expense ($1.0 million).
|
|
(F)
|
Included $164.5 million warranty charge against cost of revenue arising from a weak die/packaging material set.
|
|
(G)
|
Included $45.4 million benefit from an insurance provider as reimbursement for some claims against us towards the cost arising from a weak die/packaging material set. Portions of the reimbursement are allocated to cost of revenue ($44.5 million) and legal expense ($0.9 million).
|
|
(H)
|
Included non-recurring charges of $140.2 million for the stock option purchase completed in March 2009 related to personnel associated with cost of revenue, research and development and sales, general and administrative of $11.4 million, $90.5 million, and $38.3 million, respectively.
|
92
|
Description
|
Balance at
Beginning
of Period
|
Additions
|
Deductions
|
Balance at
End of Period
|
||||||||||||
|
(In thousands)
|
||||||||||||||||
|
Year ended January 30, 2011
|
||||||||||||||||
|
Allowance for doubtful accounts
|
$
|
961
|
$
|
875
|
(1)
|
$
|
(1,047
|
) (4)
|
$
|
789
|
||||||
|
Sales return allowance
|
$
|
15,369
|
$
|
26,517
|
(2)
|
$
|
(26,837
|
) (5)
|
$
|
15,049
|
||||||
|
Deferred tax valuation allowance
|
$
|
113,442
|
$
|
34,574
|
(3)
|
$
|
-
|
$
|
148,016
|
|||||||
|
Year ended January 31, 2010
|
||||||||||||||||
|
Allowance for doubtful accounts
|
$
|
1,062
|
$
|
550
|
(1)
|
$
|
(651
|
) (4)
|
$
|
961
|
||||||
|
Sales return allowance
|
$
|
17,336
|
$
|
24,790
|
(2)
|
$
|
(26,757
|
) (5)
|
$
|
15,369
|
||||||
|
Deferred tax valuation allowance
|
$
|
92,541
|
$
|
20,901
|
(3)
|
$
|
-
|
$
|
113,442
|
|||||||
|
Year ended January 25, 2009
|
||||||||||||||||
|
Allowance for doubtful accounts
|
$
|
968
|
$
|
608
|
(1)
|
$
|
(514
|
) (4)
|
$
|
1,062
|
||||||
|
Sales return allowance
|
$
|
18,724
|
$
|
27,859
|
(2)
|
$
|
(29,247
|
) (5)
|
$
|
17,336
|
||||||
|
Deferred tax valuation allowance
|
$
|
82,522
|
$
|
10,019
|
(3)
|
$
|
-
|
$
|
92,541
|
|||||||
(1) Allowances for doubtful accounts are charged to expenses.
(2) Represents allowance for sales returns estimated at the time revenue is recognized primarily based on historical return rates and is charged as a reduction to revenue.
(3) Represents change in valuation allowance primarily related to state deferred tax assets that management has determined not likely to be realized due, in part, to projections of future state taxable income.
(4) Represents uncollectible accounts written off against the allowance for doubtful accounts.
(5) Represents allowance for sales returns written off.
93
|
Incorporated by Reference
|
||||||||||||||||||||||||||||||||||||||||||||||||||||||
|
Exhibit No.
|
Exhibit Description
|
Schedule/Form
|
File Number
|
Exhibit
|
Filing
Date
|
|||||||||||||||||||||||||||||||||||||||||||||||||
|
2.1
|
Agreement and Plan of Merger by and among NVIDIA Corporation, Partridge Acquisition, Inc. and PortalPlayer, Inc. dated 11/6/06
|
8-K
|
0-23985
|
2.1
|
11/9/2006
|
|||||||||||||||||||||||||||||||||||||||||||||||||
|
3.1
|
Amended and Restated Certificate of Incorporation
|
S-8
|
333-74905
|
4.1
|
3/23/1999
|
|||||||||||||||||||||||||||||||||||||||||||||||||
|
3.2
|
Certificate of Amendment of Amended and Restated Certificate of Incorporation
|
10-Q
|
0-23985
|
3.1
|
8/21/2008
|
|||||||||||||||||||||||||||||||||||||||||||||||||
|
3.3
|
Bylaws of NVIDIA Corporation, Amended and Restated as of February 12, 2009
|
8-K
|
0-23985
|
3.1
|
2/19/2009
|
|||||||||||||||||||||||||||||||||||||||||||||||||
|
4.1
|
Reference is made to Exhibits 3.1, 3.2 and 3.3
|
|||||||||||||||||||||||||||||||||||||||||||||||||||||
|
4.2
|
Specimen Stock Certificate
|
S-1/A
|
333-47495
|
4.2
|
4/24/1998
|
|||||||||||||||||||||||||||||||||||||||||||||||||
|
10.1
|
Form of Indemnity Agreement between NVIDIA Corporation and each of its directors and officers
|
8-K
|
0-23985
|
10.1
|
3/7/2006
|
|||||||||||||||||||||||||||||||||||||||||||||||||
|
10.2+
|
1998 Equity Incentive Plan, as amended
|
8-K
|
0-23985
|
10.2
|
3/13/2006
|
|||||||||||||||||||||||||||||||||||||||||||||||||
|
10.3+
|
1998 Equity Incentive Plan ISO, as amended
|
10-Q
|
0-23985
|
10.5
|
11/22/2004
|
|||||||||||||||||||||||||||||||||||||||||||||||||
|
10.4+
|
1998 Equity Incentive Plan NSO, as amended
|
10-Q
|
0-23985
|
10.6
|
11/22/2004
|
|||||||||||||||||||||||||||||||||||||||||||||||||
|
10.5+
|
Certificate of Stock Option Grant
|
10-Q
|
0-23985
|
10.7
|
11/22/2004
|
|||||||||||||||||||||||||||||||||||||||||||||||||
|
10.6+
|
1998 Non-Employee Directors’ Stock Option Plan, as amended
|
8-K
|
0-23985
|
10.1
|
4/3/2006
|
|||||||||||||||||||||||||||||||||||||||||||||||||
|
10.7+
|
1998 Non-Employee Directors’ Stock Option Plan (Annual Grant - Board Service), as amended
|
10-Q
|
0-23985
|
10.1
|
11/22/2004
|
|||||||||||||||||||||||||||||||||||||||||||||||||
|
10.8+
|
1998 Non-Employee Directors’ Stock Option Plan (Committee Grant - Committee Service), as amended
|
10-Q
|
0-23985
|
10.2
|
11/22/2004
|
|||||||||||||||||||||||||||||||||||||||||||||||||
|
10.9+
|
1998 Non-Employee Directors’ Stock Option Plan (Initial Grant)
|
10-Q
|
0-23985
|
10.3
|
11/22/2004
|
|||||||||||||||||||||||||||||||||||||||||||||||||
|
10.10+
|
1998 Employee Stock Purchase Plan, as amended and restated
|
10-Q
|
0-23985
|
10.2
|
5/22/2008
|
|||||||||||||||||||||||||||||||||||||||||||||||||
|
10.11+
|
2000 Nonstatutory Equity Incentive Plan, as amended
|
SC TO-1
|
005-56649
|
99(d)(1)(A)
|
11/29/2006
|
|||||||||||||||||||||||||||||||||||||||||||||||||
|
10.12+
|
2000 Nonstatutory Equity Incentive Plan NSO
|
SC TO-1
|
005-56649
|
99.1(d)(1)(B)
|
11/29/2006
|
|||||||||||||||||||||||||||||||||||||||||||||||||
|
10.13+
|
PortalPlayer, Inc. 1999 Stock Option Plan and Form of Agreements thereunder
|
S-8
|
333-140021
|
99.1
|
1/16/2007
|
|||||||||||||||||||||||||||||||||||||||||||||||||
|
10.14+
|
PortalPlayer, Inc. Amended and Restated 2004 Stock Incentive Plan
|
S-8
|
333-140021
|
99.2
|
1/16/2007
|
|||||||||||||||||||||||||||||||||||||||||||||||||
|
10.15+
|
2007 Equity Incentive Plan
|
10-Q
|
0-23985
|
10.15
|
12/7/2010
|
|||||||||||||||||||||||||||||||||||||||||||||||||
|
10.16+
|
2007 Equity Incentive Plan - Non Statutory Stock Option (Annual Grant - Board Service)
|
10-Q
|
0-23985
|
10.2
|
8/22/2007
|
|||||||||||||||||||||||||||||||||||||||||||||||||
|
10.17+
|
2007 Equity Incentive Plan - Non Statutory Stock Option (Annual Grant - Committee Service)
|
10-Q
|
0-23985
|
10.3
|
8/22/2007
|
|||||||||||||||||||||||||||||||||||||||||||||||||
|
10.18+
|
2007 Equity Incentive Plan - Non Statutory Stock Option (Initial Grant – Board Service)
|
10-Q
|
0-23985 | 10.4 |
8/22/2007
|
|||||||||||||||||||||||||||||||||||||||||||||||||
|
10.19+
|
2007 Equity Incentive Plan – Non-Statutory Stock Option (Annual Grant - Board Service)
|
10-Q
|
0-23985 | 10.1 |
|
8/20/2009
|
||||||||||||||||||||||||||||||||||||||||||||||||
|
10.20+
|
2007 Equity Incentive Plan - Non Statutory Stock Option
|
8-K
|
0-23985 | 10.20 |
|
9/13/2010
|
||||||||||||||||||||||||||||||||||||||||||||||||
|
10.21+
|
2007 Equity Incentive Plan - Incentive Stock Option
|
8-K
|
0-23985 | 10.21 |
|
9/13/2010
|
||||||||||||||||||||||||||||||||||||||||||||||||
|
10.22+
|
2007 Equity Incentive Plan – Restricted Stock Unit Grant Notice and Restricted Stock Unit Purchase Agreement
|
10-Q
|
0-23985 | 10.22 |
|
12/07/2010
|
||||||||||||||||||||||||||||||||||||||||||||||||
|
10.23+
|
Fiscal Year 2011 Variable Compensation Plan
|
8-K
|
0-23985 | 10.1 |
5/5/2010
|
|||||||||||||||||||||||||||||||||||||||||||||||||
|
10.24+
|
Fiscal Year 2010 Variable Compensation Plan
|
8-K
|
0-23985 | 10.1 |
4/8/2009
|
|||||||||||||||||||||||||||||||||||||||||||||||||
|
10.25+
|
David L. White Offer Letter, dated January 28, 2009
|
8-K
|
0-23985 | 10.1 |
2/27/2009
|
|||||||||||||||||||||||||||||||||||||||||||||||||
|
10.26
|
Lease dated April 4, 2000 between NVIDIA Corporation and Sobrato Interests III for Building A
|
S-3/A
|
333-33560 | 10.1 |
4/20/2000
|
|||||||||||||||||||||||||||||||||||||||||||||||||
|
10.27
|
Lease dated April 4, 2000 between NVIDIA Corporation and Sobrato Interests III for Building B
|
S-3/A
|
333-33560 | 10.2 |
4/20/2000
|
|||||||||||||||||||||||||||||||||||||||||||||||||
|
10.28
|
Lease dated April 4, 2000 between NVIDIA Corporation and Sobrato Interests III for Building C
|
S-3/A
|
333-33560 | 10.3 |
4/20/2000
|
|||||||||||||||||||||||||||||||||||||||||||||||||
|
10.29
|
Lease dated April 4, 2000 between NVIDIA Corporation and Sobrato Interests III for Building D
|
S-3/A
|
333-33560 | 10.4 |
4/20/2000
|
|||||||||||||||||||||||||||||||||||||||||||||||||
|
10.31+
|
Fiscal Year 2011 Variable Compensation Plan (as amended September 7, 2010)
|
10-Q
|
0-23985 | 10.31 |
|
12/7/2010
|
||||||||||||||||||||||||||||||||||||||||||||||||
|
10.32
|
Memory Controller Patent License Agreement Between Rambus Inc. and NVIDIA Corporation, dated August 12, 2010
|
10-Q
|
0-23985 | 10.32 |
|
12/7/2010
|
||||||||||||||||||||||||||||||||||||||||||||||||
|
10.33
|
Second Amendment to Lease, dated August 18, 2010 between NVIDIA Corporation and Sobrato Interests III for Building A
|
10-Q
|
0-23985 | 10.33 |
|
12/7/2010
|
||||||||||||||||||||||||||||||||||||||||||||||||
|
10.34
|
Third Amendment to Lease, dated August 18, 2010, between NVIDIA Corporation and Sobrato Interests III for Building B
|
10-Q
|
0-23985 | 10.34 |
|
12/7/2010
|
||||||||||||||||||||||||||||||||||||||||||||||||
|
10.35
|
Third Amendment to Lease, dated August 18, 2010, between NVIDIA Corporation and Sobrato Interests III for Building C
|
10-Q
|
0-23985 | 10.35 |
|
12/7/2010
|
||||||||||||||||||||||||||||||||||||||||||||||||
|
10.36
|
Second Amendment to Lease, dated August 18, 2010, between NVIDIA Corporation and Sobrato Interests III for Building D
|
10-Q
|
0-23985 | 10.36 |
|
12/7/2010
|
||||||||||||||||||||||||||||||||||||||||||||||||
|
10.37
10.38
|
Patent Cross License Agreement dated as of January 10, 2011, between NVIDIA Corporation and Intel Corporation
Tranisition and Consulting Agreement, dated March 15, 2011, between David L.White and NVIDIA Corporation
|
8-K
8-K
|
0-23985
0-23985
|
10.1
10.1
|
01/10/2011
03/15/2011
|
|||||||||||||||||||||||||||||||||||||||||||||||||
|
21.1*
|
List of Registrant’s Subsidiaries
|
|||||||||||||||||||||||||||||||||||||||||||||||||||||
|
23.1*
|
Consent of PricewaterhouseCoopers LLP
|
|||||||||||||||||||||||||||||||||||||||||||||||||||||
|
24.1*
|
Power of Attorney (included in signature page)
|
|||||||||||||||||||||||||||||||||||||||||||||||||||||
|
31.1*
|
Certification of Chief Executive Officer as required by Rule 13a-14(a) of the Securities Exchange Act of 1934
|
|||||||||||||||||||||||||||||||||||||||||||||||||||||
|
31.2*
|
Certification of Chief Financial Officer as required by Rule 13a-14(a) of the Securities Exchange Act of 1934
|
|||||||||||||||||||||||||||||||||||||||||||||||||||||
|
32.1#*
|
Certification of Chief Executive Officer as required by Rule 13a-14(b) of the Securities Exchange Act of 1934
|
|||||||||||||||||||||||||||||||||||||||||||||||||||||
|
32.2#*
|
Certification of Chief Financial Officer as required by Rule 13a-14(b) of the Securities Exchange Act of 1934
|
|||||||||||||||||||||||||||||||||||||||||||||||||||||
|
101.INS*
±
|
XBRL Instance Document
|
|||||||||||||||||||||||||||||||||||||||||||||||||||||
|
101.SCH*
±
|
XBRL Taxonomy Extension Schema Document
|
|||||||||||||||||||||||||||||||||||||||||||||||||||||
|
101.CAL*
±
|
XBRL Taxonomy Extension Calculation Linkbase Document
|
|||||||||||||||||||||||||||||||||||||||||||||||||||||
|
101.DEF*
±
|
XBRL Taxonomy Extension Definition Linkbase Document
|
|||||||||||||||||||||||||||||||||||||||||||||||||||||
|
101.LAB*
±
|
XBRL Taxonomy Extension Labels Linkbase Document
|
|||||||||||||||||||||||||||||||||||||||||||||||||||||
|
101.PRE*
±
|
XBRL Taxonomy Extension Presentation Linkbase Document
|
|||||||||||||||||||||||||||||||||||||||||||||||||||||
* Filed Herewith
+ Management contract or compensatory plan or arrangement.
# In accordance with Item 601(b)(32)(ii) of Regulation S-K and SEC Release Nos. 33-8238 and 34-47986, Final Rule: Management’s Reports on Internal Control Over Financial Reporting and Certification of Disclosure in Exchange Act Periodic Reports, the certifications furnished in Exhibits 32.1 and 32.2 hereto are deemed to accompany this Quarterly Report on Form 10-Q and will not be deemed “filed” for purpose of Section 18 of the Exchange Act. Such certifications will not be deemed to be incorporated by reference into any filing under the Securities Act or the Exchange Act, except to the extent that the registrant specifically incorporates it by reference.
±
Pursuant to applicable securities laws and regulations, the Company is deemed to have complied with the reporting obligation relating to the submission of interactive data files in such exhibits and is not subject to liability under any anti-fraud provisions of the federal securities laws as long as the Company has made a good faith attempt to comply with the submission requirements and promptly amends the interactive data files after becoming aware that the interactive data files fails to comply with the submission requirements. These interactive data files are deemed not filed or part of a registration statement or prospectus for purposes of sections 11 or 12 of the Securities Act, are deemed not filed for purposes of section 18 of the Exchange Act and otherwise are not subject to liability under these sections.
Copies of above exhibits not contained herein are available to any stockholder upon written request to:
Investor Relations: NVIDIA Corporation, 2701 San Tomas Expressway, Santa Clara, CA 95050.
94
Pursuant to the requirements of Section 13 or 15(d) of the Securities Exchange Act of 1934, the Registrant has duly caused this report to be signed on its behalf by the undersigned, thereunto duly authorized, on March 16, 2011.
|
NVIDIA Corporation
|
|
|
By:
|
/s/ Jen-Hsun Huang
|
|
Jen-Hsun Huang
|
|
|
President and Chief Executive Officer
|
|
POWER OF ATTORNEY
KNOW ALL PERSONS BY THESE PRESENTS, that each person whose signature appears below constitutes and appoints Jen-Hsun Huang and David L. White, and each or any one of them, his true and lawful attorney-in-fact and agent, with full power of substitution and resubstitution, for him and in his name, place and stead, in any and all capacities, to sign any and all amendments (including posting effective amendments) to this report, and to file the same, with all exhibits thereto, and other documents in connection therewith, with the Securities and Exchange Commission, granting unto said attorneys-in-facts and agents, and each of them, full power and authority to do and perform each and every act and thing requisite and necessary to be done in connection therewith, as fully to all intents and purposes as he might or could do in person, hereby ratifying and confirming all that said attorneys-in-fact and agents, or any of them, or their or his substitutes or substitutes, may lawfully do or cause to be done by virtue hereof.
Pursuant to the requirements of the Securities Exchange Act of 1934, this report has been signed below by the following persons on behalf of the registrant and in the capacities and on the dates indicated.
|
Signature
|
Title
|
Date
|
|
/s/ JEN-HSUN HUANG
|
President, Chief Executive Officer and Director
(Principal Executive Officer)
|
March 16, 2011
|
|
Jen-Hsun Huang
|
||
|
/s/ DAVID L. WHITE
|
Executive Vice President and Chief Financial Officer
(Principal Financial and Accounting Officer)
|
March 16, 2011
|
|
David L. White
|
||
|
/s/ TENCH COXE
|
Director
|
March 16, 2011
|
|
Tench Coxe
|
||
|
/s/ MARK STEVENS
|
Director
|
March 16, 2011
|
|
Mark Stevens
|
||
|
/s/ JAMES C. GAITHER
|
Director
|
March 16, 2011
|
|
James C. Gaither
|
||
|
/s/ HARVEY C. JONES
|
Director
|
March 16, 2011
|
|
Harvey C. Jones
|
||
|
/s/ MARK L. PERRY
|
Director
|
March 16, 2011
|
|
Mark L. Perry
|
||
|
/s/ WILLIAM J. MILLER
|
Director
|
March 16, 2011
|
|
William J. Miller
|
||
|
/s/ A. BROOKE SEAWELL
|
Director
|
March 16, 2011
|
A. Brooke Seawell
95
EXHIBIT INDEX
|
Incorporated by Reference
|
||||||||||||||||||||||||||||||||||||||||||||||||||||||
|
Exhibit No.
|
Exhibit Description
|
Schedule/Form
|
File Number
|
Exhibit
|
Filing
Date
|
|||||||||||||||||||||||||||||||||||||||||||||||||
|
2.1
|
Agreement and Plan of Merger by and among NVIDIA Corporation, Partridge Acquisition, Inc. and PortalPlayer, Inc. dated 11/6/06
|
8-K
|
0-23985
|
2.1
|
11/9/2006
|
|||||||||||||||||||||||||||||||||||||||||||||||||
|
3.1
|
Amended and Restated Certificate of Incorporation
|
S-8
|
333-74905
|
4.1
|
3/23/1999
|
|||||||||||||||||||||||||||||||||||||||||||||||||
|
3.2
|
Certificate of Amendment of Amended and Restated Certificate of Incorporation
|
10-Q
|
0-23985
|
3.1
|
8/21/2008
|
|||||||||||||||||||||||||||||||||||||||||||||||||
|
3.3
|
Bylaws of NVIDIA Corporation, Amended and Restated as of February 12, 2009
|
8-K
|
0-23985
|
3.1
|
2/19/2009
|
|||||||||||||||||||||||||||||||||||||||||||||||||
|
4.1
|
Reference is made to Exhibits 3.1, 3.2 and 3.3
|
|||||||||||||||||||||||||||||||||||||||||||||||||||||
|
4.2
|
Specimen Stock Certificate
|
S-1/A
|
333-47495
|
4.2
|
4/24/1998
|
|||||||||||||||||||||||||||||||||||||||||||||||||
|
10.1
|
Form of Indemnity Agreement between NVIDIA Corporation and each of its directors and officers
|
8-K
|
0-23985
|
10.1
|
3/7/2006
|
|||||||||||||||||||||||||||||||||||||||||||||||||
|
10.2+
|
1998 Equity Incentive Plan, as amended
|
8-K
|
0-23985
|
10.2
|
3/13/2006
|
|||||||||||||||||||||||||||||||||||||||||||||||||
|
10.3+
|
1998 Equity Incentive Plan ISO, as amended
|
10-Q
|
0-23985
|
10.5
|
11/22/2004
|
|||||||||||||||||||||||||||||||||||||||||||||||||
|
10.4+
|
1998 Equity Incentive Plan NSO, as amended
|
10-Q
|
0-23985
|
10.6
|
11/22/2004
|
|||||||||||||||||||||||||||||||||||||||||||||||||
|
10.5+
|
Certificate of Stock Option Grant
|
10-Q
|
0-23985
|
10.7
|
11/22/2004
|
|||||||||||||||||||||||||||||||||||||||||||||||||
|
10.6+
|
1998 Non-Employee Directors’ Stock Option Plan, as amended
|
8-K
|
0-23985
|
10.1
|
4/3/2006
|
|||||||||||||||||||||||||||||||||||||||||||||||||
|
10.7+
|
1998 Non-Employee Directors’ Stock Option Plan (Annual Grant - Board Service), as amended
|
10-Q
|
0-23985
|
10.1
|
11/22/2004
|
|||||||||||||||||||||||||||||||||||||||||||||||||
|
10.8+
|
1998 Non-Employee Directors’ Stock Option Plan (Committee Grant - Committee Service), as amended
|
10-Q
|
0-23985
|
10.2
|
11/22/2004
|
|||||||||||||||||||||||||||||||||||||||||||||||||
|
10.9+
|
1998 Non-Employee Directors’ Stock Option Plan (Initial Grant)
|
10-Q
|
0-23985
|
10.3
|
11/22/2004
|
|||||||||||||||||||||||||||||||||||||||||||||||||
|
10.10+
|
1998 Employee Stock Purchase Plan, as amended and restated
|
10-Q
|
0-23985
|
10.2
|
5/22/2008
|
|||||||||||||||||||||||||||||||||||||||||||||||||
|
10.11+
|
2000 Nonstatutory Equity Incentive Plan, as amended
|
SC TO-1
|
005-56649
|
99(d)(1)(A)
|
11/29/2006
|
|||||||||||||||||||||||||||||||||||||||||||||||||
|
10.12+
|
2000 Nonstatutory Equity Incentive Plan NSO
|
SC TO-1
|
005-56649
|
99.1(d)(1)(B)
|
11/29/2006
|
|||||||||||||||||||||||||||||||||||||||||||||||||
|
10.13+
|
PortalPlayer, Inc. 1999 Stock Option Plan and Form of Agreements thereunder
|
S-8
|
333-140021
|
99.1
|
1/16/2007
|
|||||||||||||||||||||||||||||||||||||||||||||||||
|
10.14+
|
PortalPlayer, Inc. Amended and Restated 2004 Stock Incentive Plan
|
S-8
|
333-140021
|
99.2
|
1/16/2007
|
|||||||||||||||||||||||||||||||||||||||||||||||||
|
10.15+
|
2007 Equity Incentive Plan
|
10-Q
|
0-23985
|
10.15
|
12/7/2010
|
|||||||||||||||||||||||||||||||||||||||||||||||||
|
10.16+
|
2007 Equity Incentive Plan - Non Statutory Stock Option (Annual Grant - Board Service)
|
10-Q
|
0-23985
|
10.2
|
8/22/2007
|
|||||||||||||||||||||||||||||||||||||||||||||||||
|
10.17+
|
2007 Equity Incentive Plan - Non Statutory Stock Option (Annual Grant - Committee Service)
|
10-Q
|
0-23985
|
10.3
|
8/22/2007
|
|||||||||||||||||||||||||||||||||||||||||||||||||
|
10.18+
|
2007 Equity Incentive Plan - Non Statutory Stock Option (Initial Grant – Board Service)
|
10-Q
|
0-23985 | 10.4 |
8/22/2007
|
|||||||||||||||||||||||||||||||||||||||||||||||||
|
10.19+
|
2007 Equity Incentive Plan – Non-Statutory Stock Option (Annual Grant - Board Service)
|
10-Q
|
0-23985 | 10.1 |
|
8/20/2009
|
||||||||||||||||||||||||||||||||||||||||||||||||
|
10.20+
|
2007 Equity Incentive Plan - Non Statutory Stock Option
|
8-K
|
0-23985 | 10.20 |
|
9/13/2010
|
||||||||||||||||||||||||||||||||||||||||||||||||
|
10.21+
|
2007 Equity Incentive Plan - Incentive Stock Option
|
8-K
|
0-23985 | 10.21 |
|
9/13/2010
|
||||||||||||||||||||||||||||||||||||||||||||||||
|
10.22+
|
2007 Equity Incentive Plan – Restricted Stock Unit Grant Notice and Restricted Stock Unit Purchase Agreement
|
10-Q
|
0-23985 | 10.22 |
|
12/07/2010
|
||||||||||||||||||||||||||||||||||||||||||||||||
|
10.23+
|
Fiscal Year 2011 Variable Compensation Plan
|
8-K
|
0-23985 | 10.1 |
5/5/2010
|
|||||||||||||||||||||||||||||||||||||||||||||||||
|
10.24+
|
Fiscal Year 2010 Variable Compensation Plan
|
8-K
|
0-23985 | 10.1 |
4/8/2009
|
|||||||||||||||||||||||||||||||||||||||||||||||||
|
10.25+
|
David L. White Offer Letter, dated January 28, 2009
|
8-K
|
0-23985 | 10.1 |
2/27/2009
|
|||||||||||||||||||||||||||||||||||||||||||||||||
|
10.26
|
Lease dated April 4, 2000 between NVIDIA Corporation and Sobrato Interests III for Building A
|
S-3/A
|
333-33560 | 10.1 |
4/20/2000
|
|||||||||||||||||||||||||||||||||||||||||||||||||
|
10.27
|
Lease dated April 4, 2000 between NVIDIA Corporation and Sobrato Interests III for Building B
|
S-3/A
|
333-33560 | 10.2 |
4/20/2000
|
|||||||||||||||||||||||||||||||||||||||||||||||||
|
10.28
|
Lease dated April 4, 2000 between NVIDIA Corporation and Sobrato Interests III for Building C
|
S-3/A
|
333-33560 | 10.3 |
4/20/2000
|
|||||||||||||||||||||||||||||||||||||||||||||||||
|
10.29
|
Lease dated April 4, 2000 between NVIDIA Corporation and Sobrato Interests III for Building D
|
S-3/A
|
333-33560 | 10.4 |
4/20/2000
|
|||||||||||||||||||||||||||||||||||||||||||||||||
|
10.31+
|
Fiscal Year 2011 Variable Compensation Plan (as amended September 7, 2010)
|
10-Q
|
0-23985 | 10.31 |
|
12/7/2010
|
||||||||||||||||||||||||||||||||||||||||||||||||
|
10.32
|
Memory Controller Patent License Agreement Between Rambus Inc. and NVIDIA Corporation, dated August 12, 2010
|
10-Q
|
0-23985 | 10.32 |
|
12/7/2010
|
||||||||||||||||||||||||||||||||||||||||||||||||
|
10.33
|
Second Amendment to Lease, dated August 18, 2010 between NVIDIA Corporation and Sobrato Interests III for Building A
|
10-Q
|
0-23985 | 10.33 |
|
12/7/2010
|
||||||||||||||||||||||||||||||||||||||||||||||||
|
10.34
|
Third Amendment to Lease, dated August 18, 2010, between NVIDIA Corporation and Sobrato Interests III for Building B
|
10-Q
|
0-23985 | 10.34 |
|
12/7/2010
|
||||||||||||||||||||||||||||||||||||||||||||||||
|
10.35
|
Third Amendment to Lease, dated August 18, 2010, between NVIDIA Corporation and Sobrato Interests III for Building C
|
10-Q
|
0-23985 | 10.35 |
|
12/7/2010
|
||||||||||||||||||||||||||||||||||||||||||||||||
|
10.36
|
Second Amendment to Lease, dated August 18, 2010, between NVIDIA Corporation and Sobrato Interests III for Building D
|
10-Q
|
0-23985 | 10.36 |
|
12/7/2010
|
||||||||||||||||||||||||||||||||||||||||||||||||
|
10.37
10.38
|
Patent Cross License Agreement dated as of January 10, 2011, between NVIDIA Corporation and Intel Corporation
Tranisition and Consulting Agreement, dated March 15, 2011, between David L.White and NVIDIA Corporation
|
8-K
8-K
|
0-23985
0-23985
|
10.1
10.1
|
01/10/2011
03/15/2011
|
|||||||||||||||||||||||||||||||||||||||||||||||||
|
21.1*
|
List of Registrant’s Subsidiaries
|
|||||||||||||||||||||||||||||||||||||||||||||||||||||
|
23.1*
|
Consent of PricewaterhouseCoopers LLP
|
|||||||||||||||||||||||||||||||||||||||||||||||||||||
|
24.1*
|
Power of Attorney (included in signature page)
|
|||||||||||||||||||||||||||||||||||||||||||||||||||||
|
31.1*
|
Certification of Chief Executive Officer as required by Rule 13a-14(a) of the Securities Exchange Act of 1934
|
|||||||||||||||||||||||||||||||||||||||||||||||||||||
|
31.2*
|
Certification of Chief Financial Officer as required by Rule 13a-14(a) of the Securities Exchange Act of 1934
|
|||||||||||||||||||||||||||||||||||||||||||||||||||||
|
32.1#*
|
Certification of Chief Executive Officer as required by Rule 13a-14(b) of the Securities Exchange Act of 1934
|
|||||||||||||||||||||||||||||||||||||||||||||||||||||
|
32.2#*
|
Certification of Chief Financial Officer as required by Rule 13a-14(b) of the Securities Exchange Act of 1934
|
|||||||||||||||||||||||||||||||||||||||||||||||||||||
|
101.INS*
±
|
XBRL Instance Document
|
|||||||||||||||||||||||||||||||||||||||||||||||||||||
|
101.SCH*
±
|
XBRL Taxonomy Extension Schema Document
|
|||||||||||||||||||||||||||||||||||||||||||||||||||||
|
101.CAL*
±
|
XBRL Taxonomy Extension Calculation Linkbase Document
|
|||||||||||||||||||||||||||||||||||||||||||||||||||||
|
101.DEF*
±
|
XBRL Taxonomy Extension Definition Linkbase Document
|
|||||||||||||||||||||||||||||||||||||||||||||||||||||
|
101.LAB*
±
|
XBRL Taxonomy Extension Labels Linkbase Document
|
|||||||||||||||||||||||||||||||||||||||||||||||||||||
|
101.PRE*
±
|
XBRL Taxonomy Extension Presentation Linkbase Document
|
|||||||||||||||||||||||||||||||||||||||||||||||||||||
* Filed Herewith
+ Management contract or compensatory plan or arrangement.
# In accordance with Item 601(b)(32)(ii) of Regulation S-K and SEC Release Nos. 33-8238 and 34-47986, Final Rule: Management’s Reports on Internal Control Over Financial Reporting and Certification of Disclosure in Exchange Act Periodic Reports, the certifications furnished in Exhibits 32.1 and 32.2 hereto are deemed to accompany this Quarterly Report on Form 10-Q and will not be deemed “filed” for purpose of Section 18 of the Exchange Act. Such certifications will not be deemed to be incorporated by reference into any filing under the Securities Act or the Exchange Act, except to the extent that the registrant specifically incorporates it by reference.
±
Pursuant to applicable securities laws and regulations, the Company is deemed to have complied with the reporting obligation relating to the submission of interactive data files in such exhibits and is not subject to liability under any anti-fraud provisions of the federal securities laws as long as the Company has made a good faith attempt to comply with the submission requirements and promptly amends the interactive data files after becoming aware that the interactive data files fails to comply with the submission requirements. These interactive data files are deemed not filed or part of a registration statement or prospectus for purposes of sections 11 or 12 of the Securities Act, are deemed not filed for purposes of section 18 of the Exchange Act and otherwise are not subject to liability under these sections.
Copies of above exhibits not contained herein are available to any stockholder upon written request to:
Investor Relations: NVIDIA Corporation, 2701 San Tomas Expressway, Santa Clara, CA 95050.
96
TABLE OF CONTENTS
Part IItem 1. BusinessItem 1A. Risk FactorsItem 1B. Unresolved Staff CommentsItem 2. PropertiesItem 3. Legal ProceedingsItem 4. Removed and ReservedPart IIItem 5. Market For Registrant S Common Equity, Related Stockholder Matters and Issuer Purchases Of Equity SecuritiesItem 6. Selected Financial DataItem 7. Management S Discussion and Analysis Of Financial Condition and Results Of OperationsItem 7A. Quantitative and Qualitative Disclosures About Market RiskItem 8. Financial Statements and Supplementary DataItem 9. Changes in and Disagreements with Accountants on Accounting and Financial DisclosureItem 9A. Controls and ProceduresItem 9B. Other InformationPart IIIItem 10. Directors, Executive Officers and Corporate GovernanceItem 11. Executive CompensationItem 12. Security Ownership Of Certain Beneficial Owners and Management and Related Stockholder MattersItem 13. Certain Relationships and Related Transactions, and Director IndependenceItem 14. Principal Accounting Fees and ServicesPart IVItem 15. Exhibits, Financial Statement ScheduleNote 1 - Organization and Summary Of Significant Accounting PoliciesNote 2 Stock Option PurchaseNote 3 - Stock-based CompensationNote 4- Patent Cross License AgreementNote 5 Net Income (loss) Per ShareNote 6 Restructuring Charges and OtherNote 7 - 3dfxNote 8 - GoodwillNote 9 - Amortizable Intangible AssetsNote 10 - Marketable SecuritiesNote 11 - Balance Sheet ComponentsNote 12 - GuaranteesNote 13 - Financial Arrangements, Commitments and ContingenciesNote 14 - Income TaxesNote 15 - Stockholders EquityNote 16 - Employee Retirement PlansNote 17 - Segment InformationNote 18 Fair Value Of Cash Equivalents and Marketable SecuritiesNote 19 - Quarterly Summary (unaudited)