NVIDIA CORP
10-Ks and 10-Qs
|
|
|
|
|
|
|
|
|
|
|
|
|
|
|
|
|
|
|
|
|
|
|
|
|
|
|
|
|
|
|
|
|
|
|
|
|
|
|
|
|
|
|
|
|
|
|
|
|
|
|
|
|
|
|
|
UNITED STATES
SECURITIES AND EXCHANGE COMMISSION
Washington, D.C. 20549
____________________________________________________________________________________________
FORM 10-K
|
[x]
|
ANNUAL REPORT PURSUANT TO SECTION 13 OR 15(d) OF THE SECURITIES EXCHANGE ACT OF 1934
|
|
For the fiscal year ended January 26, 2014
|
|
OR
|
[_]
|
TRANSITION REPORT PURSUANT TO SECTION 13 OR 15(d) OF THE SECURITIES EXCHANGE ACT OF 1934
|
Commission file number: 0-23985

NVIDIA CORPORATION
(Exact name of registrant as specified in its charter)
|
Delaware
|
94-3177549
|
|
(State or other jurisdiction of
|
(I.R.S. Employer
|
|
Incorporation or Organization)
|
Identification No.)
|
2701 San Tomas Expressway
Santa Clara, California 95050
(408) 486-2000
(Address, including zip code, and telephone number, including area code, of principal executive offices)
Securities registered pursuant to Section 12(b) of the Act:
|
Title of each class
|
Name of each exchange on which registered
|
|
Common Stock, $0.001 par value per share
|
The NASDAQ Global Select Market
|
Securities registered pursuant to Section 12(g) of the Act:
None
Indicate by check mark if the registrant is a well-known seasoned issuer, as defined in Rule 405 of the Securities Act. Yes
ý
No
o
Indicate by check mark if the registrant is not required to file reports pursuant to Section 13 or Section 15(d) of the Act. Yes
o
No
ý
Indicate by check mark whether the registrant (1) has filed all reports required to be filed by Section 13 or 15(d) of the Securities Exchange Act of 1934 during the preceding 12 months (or for such shorter period that the registrant was required to file such reports), and (2) has been subject to such filing requirements for the past 90 days. Yes
ý
No
o
Indicate by check mark whether the registrant has submitted electronically and posted on its corporate Web site, if any, every Interactive Data File required to be submitted and posted pursuant to Rule 405 of Regulation S-T (§232.405 of this chapter) during the preceding 12 months (or for such shorter period that the registrant was required to submit and post such files). Yes
ý
No
o
Indicate by check mark if disclosure of delinquent filers pursuant to Item 405 of Regulation S-K (§ 229.405 of this chapter) is not contained herein, and will not be contained, to the best of registrant’s knowledge, in definitive proxy or information statements incorporated by reference in Part III of this Form 10-K or any amendment to this Form 10-K.
o
Indicate by check mark whether the registrant is a large accelerated filer, an accelerated filer, a non-accelerated filer, or a smaller reporting company. See definitions of “large accelerated filer,” “accelerated filer” and “smaller reporting company” in Rule 12b-2 of the Exchange Act. (Check one)
|
Large accelerated filer
x
|
Accelerated filer
o
|
|
Non-accelerated filer
o
(Do not check if a smaller reporting company)
|
Smaller reporting company
o
|
Indicate by check mark whether the registrant is a shell company (as defined in Rule 12b-2 of the Act). Yes
o
No
ý
The aggregate market value of the voting stock held by non-affiliates of the registrant as of July 26, 2013 was approximately $7.82 billion (based on the closing sales price of the registrant's common stock as reported by the NASDAQ Global Select Market on July 26, 2013). This calculation excludes approximately 27,595,765 shares held by directors and executive officers of the registrant. This calculation does not exclude shares held by such organizations whose ownership exceeds 5% of the registrant's outstanding common stock that have represented to the registrant that they are registered investment advisers or investment companies registered under section 8 of the Investment Company Act of 1940.
The number of shares of common stock outstanding as of
March 7, 2014
was 554,241,412.
DOCUMENTS INCORPORATED BY REFERENCE
Portions of the registrant's Proxy Statement for its 2014 Annual Meeting of Stockholders to be filed with the Securities and Exchange Commission pursuant to Regulation 14A not later than 120 days after the end of the fiscal year covered by this Annual Report on Form 10-K are incorporated by reference into Part III, Items 10-14 of this Annual Report on Form 10-K.
NVIDIA CORPORATION
TABLE OF CONTENTS
|
|
|
Page
|
|
|
|
|
|
|
|
|
|
|
|
|
|
|
|
|
|
|
|
|
|
|
|
|
|
|
||
|
|
|
|
|
|
|
|
|
|
|
|
|
|
|
|
|
|
|
|
|
|
|
|
|
|
|
|
|
|
|
|
|
|
|
|
|
|
|
|
|
|
|
|
|
|
|
|
|
|
|
|
|
|
|
|
|
|
|
|
|
|
|
|
|
|
|
|
|
|
|
|
2
Forward-Looking Statements
This Annual Report on Form 10-K contains forward-looking statements within the meaning of Section 27A of the Securities Act of 1933, as amended, and Section 21E of the Securities Exchange Act of 1934, as amended, which are subject to the “safe harbor” created by those sections. Forward-looking statements are based on our management's beliefs and assumptions and on information currently available to our management. In some cases, you can identify forward-looking statements by terms such as “may,” “will,” “should,” “could,” “goal,” “would,” “expect,” “plan,” “anticipate,” “believe,” “estimate,” “project,” “predict,” “potential” and similar expressions intended to identify forward-looking statements. These statements involve known and unknown risks, uncertainties and other factors, which may cause our actual results, performance, time frames or achievements to be materially different from any future results, performance, time frames or achievements expressed or implied by the forward-looking statements. We discuss many of these risks, uncertainties and other factors in this Annual Report on Form 10-K in greater detail under the heading “Risk Factors.” Given these risks, uncertainties and other factors, you should not place undue reliance on these forward-looking statements. Also, these forward-looking statements represent our estimates and assumptions only as of the date of this filing. You should read this Annual Report on Form 10-K completely and with the understanding that our actual future results may be materially different from what we expect. We hereby qualify our forward-looking statements by these cautionary statements. Except as required by law, we assume no obligation to update these forward-looking statements publicly, or to update the reasons actual results could differ materially from those anticipated in these forward-looking statements, even if new information becomes available in the future.
All references to “NVIDIA,” “we,” “us,” “our” or the “Company” mean NVIDIA Corporation and its subsidiaries, except where it is made clear that the term means only the parent company.
© 2014 NVIDIA Corporation. All rights reserved. NVIDIA, the NVIDIA logo, GeForce, NVIDIA Fermi, ICERA, Kepler, Quadro, Tesla, Tegra, NVIDIA GRID are trademarks and/or registered trademarks of NVIDIA Corporation in the U.S. and other countries.
3
Our Company
NVIDIA is a visual computing company. In a world increasingly filled with visual displays, our graphics technologies let our customers interact with the world of digital ideas, information and entertainment with an efficiency that no other communication medium can match.
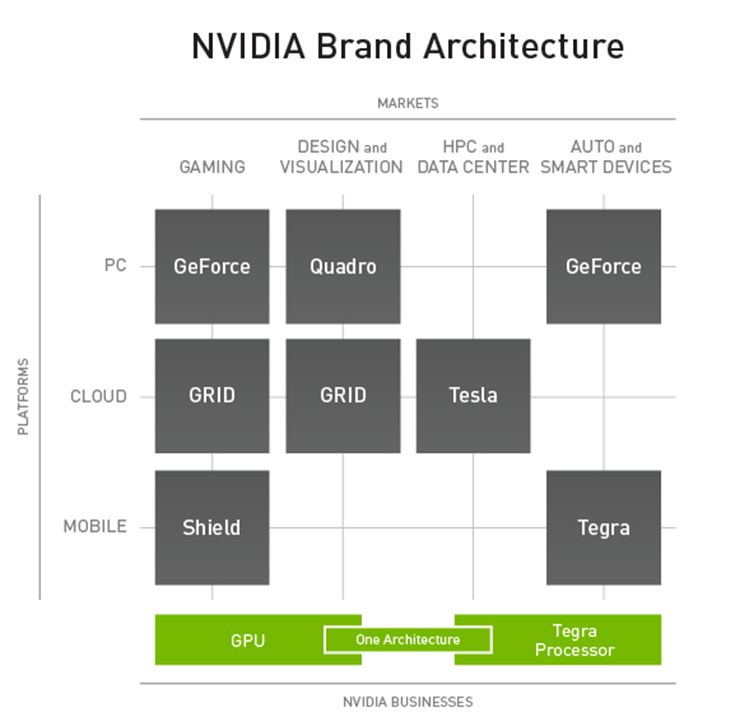
Our strategy is to be the world leader in visual computing. We target applications in each of the major computing platforms - PC, cloud, mobile - where we can create value. Our target markets are gaming, design and visualization, high performance computing, or HPC, and data center, and automotive and smart devices. We deploy business models we believe are best suited for each application, whether IP, chips, systems, or NVIDIA-branded devices and services.
We have long been known for bringing video games to life with our PC graphics chips. With our invention of the GPU, we introduced the world to the power of programmable shading, which defines modern computer graphics. Today, we reach well beyond PC graphics and games. Our energy-efficient processors are at the heart of products ranging from smartphones to automobiles to supercomputers. We believe in leveraging our processors and visual computing expertise to create differentiated products.
PC gamers choose our GPUs to enjoy immersive fantasy worlds. Our Tegra system-on-a-chip, or SOC, processors power smartphones, tablets and automobile infotainment systems. Professional designers use our GPUs to create visual effects in movies and design everything from audio headsets to commercial aircraft. Supercomputers take advantage of the massively parallel processing capabilities of our GPUs to accelerate a wide range of important applications, from simulations of viruses to weather forecasting and global oil exploration.
NVIDIA's research and development in visual computing has yielded approximately 7,000 patent assets, including inventions essential to modern computing.
Our businesses are based on two technologies with a consistent underlying graphics architecture: the GPU and the Tegra processor.
GPUs, each with billions of transistors, are the engines of visual computing and among the world's most complex processors. We have GPU product brands aimed at specific users and applications: GeForce for gamers; Quadro for designers; Tesla for researchers; and GRID for cloud-based graphics.
|
•
|
In gaming, GPUs enhance the gaming experience on PCs by improving the visual quality of graphics, increasing the frame rate for smoother gameplay and improving realism by replicating the behavior of light and physical objects.
|
|
•
|
For designers, GPUs improve productivity and introduce new capabilities. For example, an architect designing a new building in a CAD package can interact with the model in real time, the model can be more detailed, and photo realistic renderings can be generated for the client.
|
|
•
|
Researchers can use GPUs to run their simulations faster while consuming less power, increasing the accuracy of weather forecasts, or pricing financial derivatives more quickly.
|
|
•
|
GRID uses GPUs to deliver graphics performance remotely, from the cloud. Uses include gaming, professional applications provided as a service (SaaS) and improving Citrix and VMware installations.
|
The Tegra processor is a SOC integrating an entire computer on a single chip. Tegra processors incorporate GPUs and multi-core CPUs together with audio, video and input/output capabilities. They can also be integrated with baseband processors to add voice and data communication. Our Tegra SOC conserves power while delivering state-of-the-art graphics and multimedia processing.
Tegra runs devices like smartphones, tablets and PCs; it can also be embedded into smart devices, such as televisions, monitors, set-top boxes, gaming devices and cars. SHIELD, our Android gaming device based on Tegra, contains proprietary NVIDIA-developed software and system technologies and leverages our deep partnerships with game developers.
4
Headquartered in Santa Clara, California, we were incorporated in California in April 1993 and reincorporated in Delaware in April 1998.
Our Businesses
Our two reporting segments - GPU and Tegra Processor - leverage a single, unified architecture.
On this foundation, we build technologies for each of the major computing platforms - PC, cloud, mobile. We create differentiated brands to target large markets - Gaming, Design and Visualization, HPC and Data Center, and Automotive and Smart Devices - where visual computing is challenging.
Businesses
NVIDIA Brands and
Product Lines
GPU
|
•
|
GeForce
for consumer desktop and notebook PCs
|
|
•
|
Quadro
for professionals working in computer-aided design, video editing, special effects and other applications
|
|
•
|
Tesla
for supercomputing and big data applications
|
|
•
|
GRID
to provide the power of NVIDIA graphics through the cloud
|
Tegra Processor
|
•
|
Tegra
processors for smartphones, tablets, gaming devices, other computer devices such as Windows RT-based devices, set-top boxes, chromebooks, clamshells, and others
|
|
•
|
Icera
baseband processors and radio frequency (RF) transceivers for mobile connectivity
|
|
•
|
Tegra NOTE
, a complete tablet platform based on Tegra 4
|
|
•
|
Tegra VCM
,
a
Tegra-based vehicle computing module that integrates an entire automotive computer into a single component
|
|
•
|
SHIELD
, an Android gaming device optimized to help users enjoy digital content in the cloud
|
In addition, we have also announced an IP licensing initiative designed to bring our GPU technology to new markets.
5
Our Markets
We are focused on markets in which visual computing is important, such as gaming, design and visualization, HPC and data center, and automotive and smart devices.
Gaming
We focus on open platforms - PCs, mobile devices and the cloud. We build processors to deliver the best graphics for a great gaming experience, sophisticated 3D software and algorithms that are incorporated into games, and technology that enables games to be played remotely from the cloud.
Our products for the gaming market include: GeForce GTX GPUs for PC gaming; Tegra processors for mobile devices; the GRID visual computing appliance, which streams games from the cloud to connected devices; and SHIELD. These products can be enjoyed independently or in conjunction with each other to connect the gaming experience across platforms. For example, gamers can use SHIELD to play Android games or stream games from a PC with a GeForce processor; or they can stream games from a GRID gaming server to their PC or TV.
Design and Visualization
Our strategy is to serve as our customers' most trusted graphics partner, working closely with independent software vendors to optimize their offerings for NVIDIA GPUs. Our visual computing solutions enhance productivity for critical parts of the workflow of major industries, ranging from automotive, to film and television broadcast.
Visual computing is vital to productivity in many environments:
|
•
|
Design and Manufacturing
- including computer-aided design, architectural design, consumer-products manufacturing, medical instrumentation, and science and aerospace
|
|
•
|
Media and Entertainment
- including professional video editing and movie post production, special effects for movies and television, advertising, and virtual sets for broadcast
|
|
•
|
Virtual Desktop Infrastructure (VDI)
- many enterprises choose to virtualize their IT infrastructure using software from companies such as Citrix and VMware; for these environments, NVIDIA GRID hardware and software can significantly improve the end-user experience
|
NVIDIA brands for this market include Quadro GPUs for workstations and GRID for enterprise VDI.
NVIDIA Quadro GPUs enhance the productivity of designers by improving performance and adding functionality, such as photorealistic rendering for computer-aided design workstations. Other applications include professional video editing, generating special effects in movies and creating virtual sets for broadcast.
GRID makes it possible to run graphics-intensive applications remotely on a server in the datacenter, instead of locally on a PC or workstation. Applications include accelerating virtual desktop infrastructures and delivering graphics-intensive applications from the cloud.
HPC and Data Center
Our strategy for the HPC and data center market is to serve demand for big data analytics, including aerospace simulation, molecular dynamics, bio-science simulations of viruses, oil and gas exploration.
NVIDIA Tesla applies the parallel-processing capability of GPUs to general-purpose computing problems, greatly increasing performance and power efficiency over CPU-only solutions. Tesla-based servers and supercomputers increase the speed of applications used in bio-science research, mechanical and fluid simulations, energy exploration, computational finance and in big data analytics.
6
Automotive and Smart Devices
The foundation of our mobile computing strategy is the Tegra processor, which harnesses our expertise in computer chip, software and system design, while leveraging our world-leading expertise in visual computing.
The mobile market is more than smartphones. The combination of Tegra and our significant computing software assets enables us to address the many new markets for connected smart devices. For example, millions of cars are sold each year, and all, we believe, will eventually include multiple smart devices similar to Tegra-based computers that augment our driving experience. They will ensure our safety and the safety of those around us, search and navigate to destinations through heads-up displays, and enhance our comfort and enjoyment. Cars will be connected to our mobile devices. They may someday drive themselves out of parking garages to meet their owners, with the seat and temperature already set to their liking. These features could be enabled by sophisticated navigation and infotainment systems, as well as next-generation safety and driver-assistance systems.
Increasingly, devices are becoming smarter and more connected. There will be smart TVs that respond to voice and gesture commands, smart monitors powered by Android making a PC optional, and watches and jewelry that recognize voice commands and make calls. Our mobile vision is to put Tegra into every device where visual computing is valued.
Our Strategies
Extend Technology Leadership in Visual Computing.
We believe that visual computing is fundamental to the continued expansion of computing and essential to new computing experiences that define the future of computing. We apply our expertise in these areas to enhance the user experience for consumer entertainment and professional visualization applications. We focus our significant R&D depth and scale to extend our visual computing leadership.
Enable and Deliver the World's Best Gaming Experiences
.
By focusing on open platforms and end-to-end experiences, we aim to bring the highest fidelity and quality to any gaming device. We have a broad portfolio of products and technologies optimized for gamers - GPUs and software, mobile SOCs, value-added solutions such as GeForce Experience and TegraZone, differentiated devices like SHIELD, and technologies and appliances for high-quality streaming in GRID.
Revolutionize Computing with the Parallel Processing Capability of the GPU.
NVIDIA CUDA is a general purpose parallel computing platform that leverages the thousands of massively parallel processors inside an NVIDIA GPU to solve many complex computational problems in a fraction of the time required by a CPU and at a fraction of the power consumption. We work with developers worldwide who write programs for the CUDA platform using various high-level programming languages. Developers are able to accelerate applications in areas ranging from molecular dynamics to image processing, derivatives modeling for financial risk analysis and big data analytics.
Extend our Visual Computing Leadership into Mobile and Cloud Computing Platforms.
Mobile, cloud and SaaS are driving changes in the computer industry. We believe visual computing will be a key component in this new computing paradigm. We want to enable interactive graphics applications like games, movie and photo editors, and design software to be accessed from any computer and from anywhere.
We also believe that the user experience in VDIs, such as those enabled by Citrix and VMware, should be indistinguishable from traditional, non-virtual, environments.
Leverage our Processors and Visual Computing Expertise to Create Differentiated Devices.
We leverage our significant R&D depth and scale to create differentiated products, including SHIELD. SHIELD is intended to attract modern gamers who want to play on open platforms. We believe SHIELD also enhances the strategic position of Tegra, for example, by attracting more games to TegraZone, which will in turn make every Tegra-powered device more enjoyable.
Use Our Intellectual Property and Resources to Enter into License and Development Contracts.
We believe our intellectual property portfolio is a valuable asset than can be monetized by licensing our technology to customers that desire to build such capabilities directly into their own products. Such license and development arrangements may further enhance the reach of our graphics and mobile technology.
7
Sales and Marketing
Our worldwide sales and marketing strategy is key to our objective to become the leading supplier of high-performance and efficient GPUs and mobile SOC products. Our sales and marketing teams work closely with each industry's respective original equipment manufacturers, or OEMs, original design manufacturers, or ODMs, system builders, motherboard manufacturers, add-in board manufacturers, or AIBs, and industry trendsetters, collectively referred to as our Channel, to define product features, performance, price and timing of new products. Members of our sales team have a high level of technical expertise and product and industry knowledge to support the competitive and complex design win process. We also employ a highly skilled team of application engineers to assist our Channel in designing, testing and qualifying system designs that incorporate our products. We believe that the depth and quality of our design support are keys to improving our Channel's time-to-market, maintaining a high level of customer satisfaction within our Channel and fostering relationships that encourage customers to use the next generation of our products.
In the markets we serve that purchase our GPUs, the sales process involves achieving key design wins with leading OEMs and major system builders and supporting the product design into high volume production with key ODMs, motherboard manufacturers and AIBs. These design wins in turn influence the retail and system builder channel that is serviced by AIB and motherboard manufacturers. Our distribution strategy is to work with a number of leading independent contract equipment manufacturers, or CEMs, ODMs, motherboard manufacturers, AIBs and distributors, each of which have relationships with a broad range of major OEMs and/or strong brand name recognition in the retail channel. Currently, we sell a significant portion of our processors directly to distributors, CEMs, ODMs, motherboard manufacturers and AIBs, which then sell boards and systems with our products to leading OEMs, retail outlets and a large number of system builders. In the Tegra Processor segment that we serve, the sales process primarily involves achieving key design wins directly with the leading mobile OEMs and supporting the product design into high-volume production.
As a result of our Channel strategy, a small number of our customers represent the majority of our revenue. However, their end customers consist of a large number of OEMs and system builders throughout the world. Sales to our largest customer accounted for
11%
of our total revenue for
fiscal year 2014
.
To encourage software title developers and publishers to develop games optimized for platforms utilizing our products and enterprise applications optimized for our GPUs, we seek to establish and maintain strong relationships in the software development community. Engineering and marketing personnel interact with and visit key software developers to promote and discuss our products, as well as to ascertain product requirements and solve technical problems. Our developer program makes certain that our products are available to developers prior to volume availability in order to encourage the development of software applications and game titles that are optimized for our products.
Backlog
Our sales are primarily made pursuant to standard purchase orders. The quantity of products purchased by our customers as well as our shipment schedules are subject to revisions that reflect changes in both the customers' requirements and in manufacturing availability. The semiconductor industry is characterized by short lead time orders and quick delivery schedules. In light of industry practice and experience, we believe that only a small portion of our backlog is non-cancelable and that the dollar amount associated with the non-cancelable portion is not significant.
Seasonality
Our GPU and Tegra processor products serve many markets from consumer PC gaming to enterprise workstations to government and service provider cloud datacenters; however, a majority of our revenue is consumer focused. Our consumer products have typically seen stronger revenue in the second half of our fiscal year. However, there can be no assurance that this trend will continue.
8
Manufacturing
We do not directly manufacture semiconductor wafers used for our products. Instead, we utilize what is known as a fabless manufacturing strategy for all of our product-line operating segments whereby we employ world-class suppliers for all phases of the manufacturing process, including wafer fabrication, assembly, testing and packaging. This strategy uses the expertise of industry-leading suppliers that are certified by the International Organization for Standardization in such areas as fabrication, assembly, quality control and assurance, reliability and testing. In addition, this strategy allows us to avoid many of the significant costs and risks associated with owning and operating manufacturing operations. Our suppliers are also responsible for procurement of most of the raw materials used in the production of our products. As a result, we can focus our resources on product design, additional quality assurance, marketing and customer support.
We utilize industry-leading suppliers, such as Taiwan Semiconductor Manufacturing Company Limited, to produce our semiconductor wafers. We then utilize independent subcontractors, such as Advanced Semiconductor Engineering, Inc., JSI Logistics Ltd., King Yuan Electronics Co., Ltd. and Siliconware Precision Industries Company Ltd. to perform assembly, testing and packaging of most of our products. We purchase substrates from IbidenCo., Ltd., Nanya Technology Corporation, and Unimicron Technology Corporation.
We typically receive semiconductor products from our subcontractors, perform incoming quality assurance and then ship the semiconductors to CEMs, distributors, motherboard and AIB customers from our third-party warehouse in Hong Kong. Generally, these manufacturers assemble and test the boards based on our design kit and test specifications, and then ship our products to retailers, system builders or OEMs as motherboard and add-in board solutions.
Inventory and Working Capital
We focus considerable attention on managing our inventories and other working-capital-related items. We manage inventories by communicating with our customers and then using our industry experience to forecast demand on a product-by-product basis. We then place manufacturing orders for our products that are based on forecasted demand. The quantity of products actually purchased by our customers as well as shipment schedules are subject to revisions that reflect changes in both the customers' requirements and in manufacturing availability. We generally maintain substantial inventories of our products because the semiconductor industry is characterized by short lead time orders and quick delivery schedules. A substantial amount of our inventories are maintained as semi-finished products that can be leveraged across a wide range of our processors to balance our customer demands.
Our existing cash and marketable securities balances increased by
25.3%
to $4.67 billion at the end of
fiscal year 2014
compared with the end of
fiscal year 2013
, primarily due to our issuance of $1.5 billion in Convertible Senior Notes in December 2013. We believe that these balances and our anticipated cash flows from operations will be sufficient to meet our operating, acquisition, capital purchases and our intended capital return to shareholders needs for at least the next twelve months.
Research and Development
We believe that the continued introduction of new and enhanced products designed to deliver leading visual computing technology including 3D graphics, HD video, audio, ultra-low power consumption and SOC architectures is essential to our future success. Our research and development strategy is to focus on concurrently developing multiple generations of GPUs and Tegra Processors, including GPUs for high-performance computing, and Tegra SOCs for SHIELD and other mobile products using independent design teams. Our research and development efforts are performed within specialized groups consisting of software engineering, hardware engineering, very large scale integration design engineering, process engineering, architecture and algorithms. These groups act as a pipeline designed to allow the efficient simultaneous development of multiple generations of products.
A critical component of our product development effort is our partnerships with leaders in the computer-aided design industry. We invest significant resources in the development of relationships with industry leaders, often assisting these companies in the product definition of their new products. We believe that forming these relationships and utilizing next-generation development tools to design, simulate and verify our products will help us remain at the forefront of the 3D graphics market and develop products that utilize leading-edge technology on a rapid basis. We believe this approach assists us in meeting the new design schedules of PC OEMs and other manufacturers. We believe in leveraging our significant R&D depth and scale to create differentiated products.
As of
January 26, 2014
, we had
6,384
full-time employees engaged in research and development. During fiscal years
2014
, 2013 and 2012, we incurred research and development expense of $
1,335.8 million
,
$1,147.3 million
and $
1,002.6 million
, respectively.
9
Competition
The market for our products is intensely competitive and is characterized by rapid technological change, evolving industry standards and declining average selling prices. We believe that the principal competitive factors in this market are performance, breadth of product offerings, access to customers and distribution channels, software support, conformity to industry standard Application Programming Interfaces, manufacturing capabilities, processor pricing and total system costs. We believe that our ability to remain competitive will depend on how well we are able to anticipate the features and functions that customers will demand and whether we are able to deliver consistent volumes of our products at acceptable levels of quality and at competitive prices. We expect competition to increase from both existing competitors and new market entrants with products that may be less costly than ours, or may provide better performance or additional features not provided by our products. In addition, it is possible that new competitors or alliances among competitors could emerge and acquire significant market share
.
A significant source of competition comes from companies that provide or intend to provide GPUs and mobile SOC products. Some of our competitors may have greater marketing, financial, distribution and manufacturing resources than we do and may be more able to adapt to customer or technological changes.
Our current competitors include:
|
•
|
suppliers of discrete and integrated GPUs, including supercomputers and chipsets that incorporate 3D graphics functionality as part of their existing solutions, such as Advanced Micro Devices, or AMD, and Intel Corporation;
|
|
•
|
suppliers of SOC products that support tablets, smartphones, and PCs as well as products that are embedded into smart devices such as televisions, monitors, set-top boxes, gaming devices and automobiles, such as AMD, ARM Holdings plc, or ARM, Broadcom Corporation, Freescale Semiconductor Inc., HiSilicon Technologies Co., Ltd., Imagination Technologies Ltd., Intel, Marvell Technology Group Ltd., Mediatek, Qualcomm Incorporated, Renesas Technology Corp., Samsung Electronics Co. Ltd., ST Microelectronics, and Texas Instruments Incorporated;
|
|
•
|
licensors of graphics technologies, such as ARM and Imagination Technologies Group plc.; and
|
|
•
|
suppliers of cellular basebands, such as Broadcom Corporation, HiSilicon Technologies Co., Ltd., Intel, Marvell Technology Group Ltd., Mediatek, Qualcomm Incorporated, Samsung Electronics Co. Ltd., and Spreadtrum Communications Co., Ltd.
|
If and to the extent we offer products in new markets, we may face competition from existing competitors as well as from companies with which we currently do not compete. We expect substantial competition from both Intel's and AMD's, strategy of selling platform solutions, including integrating a CPU and a GPU on the same chip or same package, as evidenced by Intel's CPUs with integrated graphics and AMD's accelerated processing unit, or APU, products. As AMD and Intel continue to pursue platform solutions and integrated CPUs, we may not be able to successfully compete and our business could be negatively impacted.
Patents and Proprietary Rights
We rely primarily on a combination of patents, trademarks, trade secrets, employee and third-party nondisclosure agreements and licensing arrangements to protect our intellectual property in the United States and internationally. Our currently issued patents have expiration dates from April 2014 to September 2033. We have numerous patents issued, allowed and pending in the United States and in foreign jurisdictions. Our patents and pending patent applications primarily relate to our products and the technology used in connection with our products. We also rely on international treaties, organizations and foreign laws to protect our intellectual property. The laws of certain foreign countries in which our products are or may be manufactured or sold, including various countries in Asia, may not protect our products or intellectual property rights to the same extent as the laws of the United States. This decreased protection makes the possibility of piracy of our technology and products more likely. We continuously assess whether and where to seek formal protection for particular innovations and technologies based on such factors as:
|
•
|
the location in which our products are manufactured;
|
|
•
|
our strategic technology or product directions in different countries;
|
|
•
|
the degree to which intellectual property laws exist and are meaningfully enforced in different jurisdictions; and
|
|
•
|
the commercial significance of our operations and our competitors' operations in particular countries and regions.
|
10
We have also licensed technology from third parties for incorporation in some of our products and for defensive reasons, and expect to continue to enter into such license agreements.
Employees
As of
January 26, 2014
, we had
8,808
employees,
6,384
of whom were engaged in research and development and
2,424
of whom were engaged in sales, marketing, operations and administrative positions.
Environmental Regulatory Compliance
To date, we have not incurred significant expenses related to environmental regulatory compliance matters. For additional detail see “Item 1A. Risk Factors - Risks Related to Regulatory, Legal, Our Common Stock and Other Matters -
Our failure to comply with any applicable environmental regulations could result in a range of consequences, including fines, suspension of production, excess inventory, sales limitations, and criminal and civil liabilities
.”
Financial Information by Reporting Segment and Geographic Data
The information included in
Note 16
of the Notes to the Consolidated Financial Statements in Part IV, Item 15 of this Annual Report on Form 10-K, including financial information by reporting segment and revenue and long-lived assets by geographic region, is hereby incorporated by reference. For additional detail regarding the risks attendant to our foreign operations see “Item 1A. Risk Factors - Risks Related to Our Business, Industry and Partners -
We are subject to risks associated with international operations which may harm our business.
”
Executive Officers of the Registrant
The following sets forth certain information regarding our executive officers, their ages and their positions as of
March 7, 2014
:
|
Name
|
Age
|
Position
|
||
|
Jen-Hsun Huang
|
51
|
President, Chief Executive Officer and Director
|
||
|
Colette M. Kress
|
46
|
Executive Vice President and Chief Financial Officer
|
||
|
Ajay K. Puri
|
59
|
Executive Vice President, Worldwide Sales
|
||
|
David M. Shannon
|
58
|
Executive Vice President, Chief Administrative Officer and Secretary
|
||
|
Debora Shoquist
|
59
|
Executive Vice President, Operations
|
||
Jen-Hsun Huang
co-founded NVIDIA in April 1993 and has served as its President, Chief Executive Officer and a member of the Board of Directors since its inception. From 1985 to 1993, Mr. Huang was employed at LSI Logic Corporation, a computer chip manufacturer, where he held a variety of positions, most recently as Director of Coreware, the business unit responsible for LSI's “system-on-chip” strategy. From 1983 to 1985, Mr. Huang was a microprocessor designer for Advanced Micro Devices, Inc., a semiconductor company. Mr. Huang holds a B.S.E.E. degree from Oregon State University and an M.S.E.E. degree from Stanford University.
Colette M. Kress
joined NVIDIA in September 2013 as Executive Vice President and Chief Financial Officer. Prior to NVIDIA, Ms. Kress most recently served as Senior Vice President and Chief Financial Officer of the Business Technology and Operations Finance organization at Cisco Systems, Inc., a networking equipment company, since 2010. At Cisco, Ms. Kress was responsible for financial strategy, planning, reporting and business development for all business segments, engineering and operations. From 1997 to 2010 Ms. Kress held a variety of positions at Microsoft Corporation, a software company, including, beginning in 2006, Chief Financial Officer of the Server and Tools division, where Ms. Kress was responsible for financial strategy, planning, reporting and business development for the division. Prior to joining Microsoft, Ms. Kress spent eight years at Texas Instruments Incorporated, a semiconductor company, where she held a variety of finance positions. Ms. Kress holds a B.S. degree in Finance from University of Arizona and an M.B.A. degree from Southern Methodist University.
11
Ajay K. Puri
joined NVIDIA in December 2005 as Senior Vice President, Worldwide Sales and became Executive Vice President, Worldwide Sales in January 2009. Prior to NVIDIA, he held positions in sales, marketing, and general management over a 22-year career at Sun Microsystems, Inc., a computing systems company. Mr. Puri previously held marketing, management consulting, and product development positions at Hewlett-Packard Company, an information technology company, Booz Allen Hamilton Inc., a management and technology consulting company, and Texas Instruments. Mr. Puri holds a B.S.E.E. degree from the University of Minnesota, an M.S.E.E. degree from the California Institute of Technology and an M.B.A. degree from Harvard Business School.
David M. Shannon
serves as Executive Vice President, Chief Administrative Officer and Secretary of NVIDIA. In this role, he is responsible for NVIDIA’s legal and human resources functions, as well as intellectual property licensing. Mr. Shannon joined NVIDIA in August 2002 as Vice President and General Counsel. Mr. Shannon became Secretary of NVIDIA in April 2005, a Senior Vice President in December 2005 and an Executive Vice President in January 2009. In January 2013, Mr. Shannon also became the head of Human Resources. Mr. Shannon was promoted to the role of Chief Administrative Officer in January 2014. From 1993 to 2002, Mr. Shannon held various counsel positions at Intel, most recently the position of Vice President and Assistant General Counsel. Mr. Shannon also practiced for eight years in the law firm of Gibson Dunn and Crutcher, focusing on complex commercial and high-technology related litigation. Mr. Shannon holds B.A. and J.D. degrees from Pepperdine University.
Debora Shoquist
joined NVIDIA in September 2007 as Senior Vice President of Operations and became Executive Vice President of Operations in January 2009. From 2004 to 2007, Ms. Shoquist served as Executive Vice President of Operations at JDS Uniphase Corporation, a provider of communications test and measurement solutions and optical products for the telecommunications industry. From 2002 to 2004, Ms. Shoquist served as Senior Vice President and General Manager of the Electro-Optics business at Coherent, Inc., a manufacturer of commercial and scientific laser equipment. Ms. Shoquist’s experience includes her role at Quantum Corporation, a data protection company, as the President of the Personal Computer Hard Disk Drive Division. Ms. Shoquist’s experience also includes senior roles at Hewlett-Packard. Ms. Shoquist holds a B.S. degree in Electrical Engineering from Kansas State University and a B.S. degree in Biology from Santa Clara University.
Available Information
Our annual reports on Form 10-K, quarterly reports on Form 10-Q, current reports on Form 8-K and, if applicable, amendments to those reports filed or furnished pursuant to Section 13(a) of the Securities Exchange Act of 1934, as amended, are available free of charge on or through our web site,
http://www.nvidia.com
, as soon as reasonably practicable after we electronically file such material with, or furnish it to, the Securities and Exchange Commission, or the SEC. Our web site and the information on it or connected to it are not a part of this Annual Report on Form 10-K.
12
In evaluating NVIDIA and our business, the following factors should be considered in addition to the other information in this Annual Report on Form 10-K. Before you buy our common stock, you should know that making such an investment involves some risks including, but not limited to, the risks described below. Additionally, any one of the following risks could seriously harm our business, financial condition and results of operations, which could cause our stock price to decline. Additional risks and uncertainties not presently known to us or that we currently deem immaterial may also impair our business operations.
Risks Related to Our Business, Industry and Partners
If we are unable to compete in the markets for our products, our financial results will be adversely impacted
.
The market for our products is extremely competitive, and we expect competition to intensify as current competitors expand their product offerings, industry standards continue to evolve and others realize the market potential of mobile and consumer products and services.
We expect competition to increase from both existing competitors and new market entrants with products that may be less costly than ours, or may provide better performance or additional features not provided by our products. In addition, it is possible that new competitors or alliances among competitors could emerge and acquire significant market share. Furthermore, competitors with greater financial resources may be able to offer lower prices than us, or they may offer additional products, services or other incentives that we may not be able to match. In addition, many of our competitors operate and maintain their own fabrication facilities and have longer operating histories, greater name recognition, larger customer bases, and greater sales, marketing and distribution resources than we do. In order to effectively compete we may have to invest more resources in research and development than anticipated, which could increase our operating expenses and negatively impact our operating results. If we are required to invest significantly greater resources than anticipated in research and development efforts without a corresponding increase in revenue, our operating results could decline. In order to remain competitive and meet the demands of the markets we serve, we expect to devote a substantial portion of our resources to research and development. Our ability to compete will depend on, among other factors, our ability to:
|
•
|
continue to keep pace with technological developments;
|
|
•
|
develop and introduce new products, services, technologies and enhancements on a timely basis;
|
|
•
|
transition our semiconductor products to increasingly smaller line width geometries;
|
|
•
|
obtain sufficient foundry capacity and packaging materials; and
|
|
•
|
succeed in significant foreign markets, such as China and India.
|
If we are unable to compete in our current or new markets, demand for our products could decrease which could cause our revenue to decline and our financial results to suffer. If and to the extent we offer products in new markets, we may face competition from existing competitors as well as from companies with which we currently do not compete. We expect substantial competition from both Intel and AMD's, strategy of selling platform solutions, including integrating a CPU and a GPU on the same chip or same package, as evidenced by Intel's CPUs with integrated graphics and AMD's APU product. As AMD and Intel continue to pursue platform solutions and integrated CPUs, we may not be able to successfully compete and our business could be negatively impacted. Despite the use of these integrated CPUs, personal computer, or PC, builders and consumers have continued to embrace discrete GPUs to provide higher performance. If integrated CPUs offer a more compelling value proposition in the future, PC builders and consumers may move away from the use of discrete GPUs, which could adversely affect our business and cause our financial results to decline.
We are implementing a business strategy to license our GPU cores and visual computing patent portfolio to device manufacturers. Although we have engaged in licensing in the past, we are now engaging a broader market with new and existing competitors who may be able to adapt more quickly to customer requirements and emerging technologies. We cannot be assured of the extent of the demand for licenses to our GPU cores or other elements of our visual computing patent portfolio, or that we will be able to compete successfully against current or new competitors who may have stronger positions in these new markets.
13
Our business results could be adversely affected if the identification and development of new products is delayed or unsuccessful.
In order to maintain or improve our financial results, we will need to continue to identify and develop new products and enhancements to our existing products in a timely and cost-effective manner. The process of developing new products and services and enhancing existing products and services is highly complex, costly and uncertain, and any failure by us to anticipate customers' changing needs and emerging technology trends could adversely affect our business. We must make multi-year investments and commit significant resources before knowing whether our predictions will accurately reflect customer demand for our new products and technologies. It is possible that our development efforts will not be successful and that our new technologies will not result in meaningful revenues. Even if we introduce new and enhanced products to the market, we may not be able to achieve consumer and/or market acceptance of them in a timely manner.
Our ability to successfully develop and deliver new products will depend on various factors, including our ability to:
|
•
|
effectively identify and capitalize upon opportunities in new markets;
|
|
•
|
timely complete and introduce new products and technologies;
|
|
•
|
transition our semiconductor products to increasingly smaller line width geometries; and
|
|
•
|
obtain sufficient foundry capacity and packaging materials.
|
We occasionally have experienced delays in completing the development and introduction of new products and product enhancements, and we could experience delays in the future. In addition, in the past, we have faced challenges in managing product transitions from older to newer products resulting in obsolete inventory. Our failure to successfully develop and introduce new products and technologies or identify new uses for existing or future products could result in rapidly declining average selling prices, reduced demand for our products or loss of market share, any of which could harm our competitive position and cause our revenue, gross margin and overall financial results to suffer.
If we are unable to achieve consumer and market acceptance and design wins for our products and technologies, our results of operations and competitive position will be harmed.
The success of our business depends to a significant extent on our ability to achieve consumer and market acceptance of our new products and enhancements to our existing products and identify and enter new markets, such as cloud-based computing appliances, servers, automotive technology, smartphones, tablets, video game consoles, and other similar consumer electronic devices. The markets for our products and technologies are characterized by unpredictable and sometimes rapid shifts in the popularity of products, often caused by the publication of competitive industry benchmark results, changes in pricing of dynamic random-access memory devices and other changes in the total system cost of add-in boards, or AIBs, as well as by severe price competition and by frequent new technology and product introductions. Broad consumer and market acceptance is difficult to achieve and such consumer and market acceptance, if achieved, is difficult to sustain due to intense competition and frequent new technology and product introductions. Our success in achieving consumer and market acceptance will depend in part on our ability to cultivate new industry relationships and improve the functionality of our products as the number of internet-connected devices increases. If we do not successfully achieve or maintain consumer and market acceptance for our products and enhancements or identify and enter new markets, our ability to compete and maintain or increase revenues will suffer.
We believe achieving design wins, which entails having our existing and future products chosen for hardware components or subassemblies designed by original equipment manufacturers, or OEMs, original design manufacturers, or ODMs, and AIB and motherboard manufacturers, is an integral part of our future success. Our OEM, ODM, and AIB and motherboard manufacturers' customers typically introduce new system configurations as often as twice per year, typically based on spring and fall design cycles or in connection with trade shows. Accordingly, when our customers are making their design decisions, our existing products must have competitive performance levels or we must timely introduce new products in order to be included in our customers' new system configurations. This requires that we:
|
•
|
anticipate the features and functionality that customers and consumers will demand;
|
|
•
|
incorporate those features and functionalities into products that meet the exacting design requirements of our customers;
|
14
|
•
|
price our products competitively; and
|
|
•
|
introduce products to the market within our customers' limited design cycles.
|
If OEMs, ODMs, and AIB and motherboard manufacturers do not include our products in their systems, they will typically not use our products in their systems until at least the next design configuration.
Our ability to achieve design wins also depends in part on our ability to identify and be compliant with evolving industry standards. Unanticipated changes in industry standards could render our products incompatible with products developed by major hardware manufacturers and software developers. If our products are not in compliance with prevailing industry standards, we may not be designed into our customers' product designs. However, to be compliant with changes to industry standards, we may have to invest significant time and resources to redesign our products which could negatively impact our gross margin or operating results. If we are unable to achieve new design wins for existing or new customers, we may lose market share and our operating results would be negatively impacted.
We depend on foundries to manufacture our products and these third parties may not be able to obtain or successfully implement high quality, leading-edge process technologies or otherwise satisfy our manufacturing requirements, which would harm our business
.
We do not manufacture the silicon wafers used for our products and do not own or operate a wafer fabrication facility. Instead, we are dependent on industry-leading foundries, such as Taiwan Semiconductor Manufacturing Company Limited, or TSMC, to manufacture our semiconductor wafers using their fabrication equipment and techniques. A substantial portion of our wafers are supplied by TSMC. The foundries, which have limited capacity, also manufacture products for other semiconductor companies, including some of our competitors. Because we do not have long-term commitment contracts with any of these foundries, they do not have an obligation to provide us with any set pricing or minimum quantity of product at any time except as may be provided in a specific purchase order. Most of our products are only manufactured by one foundry at a time. In times of high demand, the foundries could choose to prioritize their capacity for other companies, reduce or eliminate deliveries to us, or increase the prices that they charge us. If we are unable to meet customer demand due to reduced or eliminated deliveries or have to increase the prices of our products, we could lose sales to customers, which would negatively impact our revenue and our reputation.
Furthermore, our third-party foundries may not be able to develop, obtain or successfully implement high quality, leading-edge process technologies, including transitions to smaller geometry process technologies, needed to manufacture our products profitably or on a timely basis. If our third-party foundries experience manufacturing inefficiencies, we may fail to achieve acceptable yields or experience product delivery delays. For example, due to capacity constraints at TSMC of our 28 nanometer Kepler GPUs in the first quarter of fiscal year 2013, we were unable to fulfill customer demand for our high-end desktop GPU products, and as our sales mix shifted to our mainstream desktop GPU products, revenue and gross margins for the first quarter of fiscal year 2013 were negatively impacted compared to the prior quarter.
Because the lead-time needed to establish strategic relationships with new manufacturing partners and achieve initial production could be over a year, we do not have a readily available alternative source of supply for our products. In addition, the time and effort to qualify a new foundry would result in additional expense and diversion of resources, and could result in lost sales, any of which would negatively impact our financial results. We believe that long-term market acceptance for our products will depend on reliable relationships with the third-party manufacturers we use to ensure adequate product supply and competitive pricing to respond to customer demand.
Failure to achieve expected manufacturing yields for our products could negatively impact our financial results and damage our reputation.
Manufacturing yields for our products are a function of product design, which is developed largely by us, and process technology, which typically is proprietary to the manufacturer. Low yields may result from either product design or process technology failure. We do not know a yield problem exists until our design is manufactured. When a yield issue is identified, the product is analyzed and tested to determine the cause. As a result, yield problems may not be identified until well into the production process. Resolution of yield problems requires cooperation by, and communication between, us and the manufacturer. Because of our potentially limited access to wafer foundry capacity, decreases in manufacturing yields could result in an increase in our costs and force us to allocate our available product supply among our customers. Lower than expected yields could potentially harm customer relationships, our reputation and our financial results.
15
A decline in demand in certain end-user markets could decrease the demand for our products and harm our results of operations.
Our customer base includes companies in a wide range of end-user markets, but we generate a significant amount of revenue from sales to consumers of communications- and PC-related products. Within these end-user markets, a large portion of our revenue is generated from sales to consumers in the smartphone, tablet and PC markets, including professional workstations. Decline in one or several of these end-user markets could harm demand for our products and our results of operations and financial condition. These declines could be large and sudden. Because smartphone, tablet and PC manufacturers often build inventories during periods of anticipated growth, they may be left with excess inventories if growth slows or if they incorrectly forecast product transitions. In these cases, these manufacturers may abruptly suspend substantially all purchases of additional inventory from suppliers like us until their excess inventory has been absorbed, which would have a negative impact on our financial results.
We sell our products to a limited number of customers and our business could suffer if we lose any of these customers.
We receive a significant amount of our revenue from a limited number of customers. Revenue from significant customers, those representing 10% or more of total revenue, was approximately 21% of our total revenue from two customers in fiscal year 2014 and approximately 13% and 11% of our total revenue from one customer in fiscal years 2013 and 2012, respectively.
Approximately
23%
of our accounts receivable balance was from one customer as of January 26, 2014, and approximately 40% of our accounts receivable balance was from three customers as of January 27, 2013. We maintain an allowance for doubtful accounts for estimated losses resulting from the inability of our customers to make required payments and obtain credit insurance over the purchasing credit extended to certain customers. In the future, we may have to record additional reserves or write-offs and/or defer revenue on certain sales transactions which could negatively impact our financial results and as a result of the tightening of the credit markets, we may not be able to acquire credit insurance on the credit we extend to these customers or in amounts that we deem sufficient.
Revenue from our largest customer has fluctuated significantly from period to period primarily due to the timing and number of design wins with each customer, as well as the continued diversification of our customer base as we expand into new markets, and will likely continue to fluctuate dramatically in the future. Our operating results in the foreseeable future will continue to depend on sales to a relatively small number of customers, as well as the ability of these customers to sell products that incorporate our products. In the future, these customers may decide not to purchase our products at all, purchase fewer products than they did in the past, or alter their purchasing patterns in some other way, particularly because:
|
•
|
substantially all of our sales are made on a purchase order basis, which permits our customers to cancel, change or delay product purchase commitments with little or no notice to us and without penalty;
|
|
•
|
our customers may develop their own solutions;
|
|
•
|
our customers may purchase products from our competitors; or
|
|
•
|
our customers may discontinue sales or lose market share in the markets for which they purchase our products.
|
The loss of any of our large customers or a significant reduction in sales we make to them would likely harm our financial condition and results of operations and any difficulties in collecting accounts receivable could harm our operating results and financial condition.
16
If we fail to appropriately scale our operations in response to changes in demand for our existing products or to the demand for new products requested by our customers, our business and profitability could be harmed.
To achieve our business objectives, it may be necessary from time to time for us to expand or contract our operations. In the future, we may not be able to scale our workforce and operations in a sufficiently timely manner to respond effectively to changes in demand for our existing products or to the demand for new products requested by our customers. In that event, we may be unable to meet competitive challenges or exploit potential market opportunities, and our current or future business could be materially and adversely affected. Conversely, if we expand our operations and workforce too rapidly in anticipation of increased demand for our products, and such demand does not materialize at the pace at which we expected, the rate of increase in our costs and operating expenses may exceed the rate of increase in our revenue, which would adversely affect our results of operations. In addition, if such demand does not materialize at the pace which we expect, we may be required to scale down our business through expense and headcount reductions as well as facility consolidations or closures that could result in restructuring charges that would materially and adversely affect our results of operations. Because many of our expenses are fixed in the short-term or are incurred in advance of anticipated sales, we may not be able to decrease our expenses in a timely manner to offset any decrease in customer demand. If customer demand does not increase as anticipated, our profitability could be adversely affected due to our higher expense levels.
Our past growth has placed, and any future long-term growth is expected to continue to place, a significant strain on our management personnel, systems and resources. To implement our current business and product plans, we will need to continue to expand, train, manage and motivate our workforce. All of these endeavors require substantial management effort. If we are unable to effectively manage our expanding operations, we may be unable to scale our business quickly enough to meet competitive challenges or exploit potential market opportunities, or conversely, we may scale our business too quickly and the rate of increase in our costs and expenses may exceed the rate of increase in our revenue, either of which would harm our results of operations.
Our revenue may fluctuate while a majority of our operating expenses are a factor of multi-year investments ahead of when revenue is received, which makes our results difficult to predict and could cause our results to fall short of expectations.
Our operating expenses are primarily related to multi-year research and development investments ahead of the revenue received from the products which are produced. Our research and development expenses totaled
$1.34 billion
,
$1.15 billion
, and
$1.00 billion
in fiscal years 2014, 2013 and 2012, respectively.
Any one or more of the risks discussed in this Annual Report on Form 10-K or other factors could prevent us from achieving our expected future revenue or net income. Accordingly, we believe that period-to-period comparisons of our results of operations should not be relied upon as an indication of future performance. Similarly, the results of any quarterly or full fiscal year period are not necessarily indicative of results to be expected for a subsequent quarter or a full fiscal year. As a result, it is possible that in some quarters our operating results could be below the expectations of securities analysts or investors, which could cause the trading price of our common stock to decline. We believe that our quarterly and annual results of operations may continue to be affected by a variety of factors that could harm our revenue, gross profit and results of operations.
Because our gross margin for any period depends on a number of factors, our failure to forecast changes in any of these factors could adversely affect our gross margin.
We are focused on improving our gross margin. Our gross margin for any period depends on a number of factors, including:
|
•
|
the mix of our products sold;
|
|
•
|
average selling prices;
|
|
•
|
introduction of new products;
|
|
•
|
product transitions;
|
|
•
|
sales discounts;
|
|
•
|
unexpected pricing actions by our competitors;
|
17
|
•
|
the cost of product components; and
|
|
•
|
the yield of wafers produced by the foundries that manufacture our products.
|
If we do not correctly forecast the impact of any of the relevant factors on our business, there may not be any actions we can take or we may not be able to take any possible actions in time to counteract any negative impact on our gross margin. In addition, if we are unable to meet our gross margin target for any period or the target set by analysts, the trading price of our common stock may decline.
Our failure to estimate customer demand properly could adversely affect our financial results.
We manufacture our products based on forecasts of customer demand in order to have shorter shipment lead times and quicker delivery schedules for our customers. As a result, we may build inventories for anticipated periods of growth which do not occur or may build inventory anticipating demand for a product that does not materialize. In forecasting demand, we make multiple assumptions any of which may prove to be incorrect. Situations that may result in excess or obsolete inventory include:
|
•
|
changes in business and economic conditions, including downturns in the semiconductor industry and/or overall economy;
|
|
•
|
changes in consumer confidence caused by changes in market conditions, including changes in the credit market, expectations for inflation, and energy prices;
|
|
•
|
if there were a sudden and significant decrease in demand for our products;
|
|
•
|
if there were a higher incidence of inventory obsolescence because of rapidly changing technology and customer requirements;
|
|
•
|
if we fail to estimate customer demand properly for our older products as our newer products are introduced; or
|
|
•
|
if our competition were to take unexpected competitive pricing actions.
|
Any inability to sell products to which we have devoted resources could harm our business. In addition, cancellation or deferral of customer purchase orders could result in our holding excess inventory, which could adversely affect our gross margin and restrict our ability to fund operations. Additionally, because we often sell a substantial portion of our products in the last month of each quarter, we may not be able to reduce our inventory purchase commitments in a timely manner in response to customer cancellations or deferrals. We could be subject to excess or obsolete inventories and be required to take corresponding inventory write-downs and/or a reduction in average selling prices if growth slows or does not materialize, or if we incorrectly forecast product demand, which could negatively impact our financial results.
Conversely, if we underestimate our customers' demand for our products, our third-party manufacturing partners may not have adequate lead-time or capacity to increase production for us meaning that we may not be able to obtain sufficient inventory to fill our customers' orders on a timely basis. Even if we are able to increase production levels to meet customer demand, we may not be able to do so in a cost effective or timely manner. Inability to fulfill our customers' orders on a timely basis, or at all, could damage our customer relationships, result in lost revenue, cause a loss in market share, impact our customer relationships or damage our reputation, any of which could adversely impact our business.
18
We may not be able to realize the potential financial or strategic benefits of business acquisitions or strategic investments and we may not be able to successfully integrate acquisition targets, which could hurt our ability to grow our business, develop new products or sell our products.
We have acquired and invested in other businesses that offered products, services and technologies that we believe will help expand or enhance our existing products and business.
We may enter into future acquisitions of, or investments in, businesses, in order to complement or expand our current businesses or enter into a new business market. Negotiations associated with an acquisition or strategic investment could divert management's attention and other company resources. Any of the following risks associated with past or future acquisitions or investments could impair our ability to grow our business, develop new products or sell our products, and ultimately could have a negative impact on our growth or our financial results:
|
•
|
difficulty in combining the technology, products, operations or workforce of the acquired business with our business;
|
|
•
|
difficulty in operating in a new or multiple new locations;
|
|
•
|
disruption of our ongoing businesses or the ongoing business of the company we invest in or acquire;
|
|
•
|
difficulty in realizing the potential financial or strategic benefits of the transaction;
|
|
•
|
difficulty in maintaining uniform standards, controls, procedures and policies;
|
|
•
|
difficulty integrating the target's accounting, management information, human resources and other administrative systems;
|
|
•
|
diversion of capital and other resources;
|
|
•
|
assumption of liabilities;
|
|
•
|
incurring acquisition-related costs or amortization costs for acquired intangible assets that could impact our operating results;
|
|
•
|
incurring impairment charges related to goodwill and other purchased intangible assets acquired in connection with acquisitions or investments;
|
|
•
|
diversion of resources and unanticipated expenses resulting from litigation arising from potential or actual business acquisitions or investments;
|
|
•
|
potential failure of the due diligence processes to identify significant issues with product quality, architecture and development, or legal and financial contingencies, among other things;
|
|
•
|
difficulties in entering into new markets in which we have limited or no experience and where competitors in such markets have stronger positions;
|
|
•
|
potential inability to obtain, or obtain in a timely manner, approvals from governmental authorities, which could delay or prevent such acquisitions or investments; and
|
|
•
|
impairment of relationships with employees, vendors and customers, or the loss of any of our key employees, vendors or customers or our target's key employees, vendors or customers, as a result of our acquisition or investment.
|
19
We may be required to record a charge to earnings if our goodwill or amortizable intangible assets become impaired, which could negatively impact our operating results.
Under generally accepted accounting principles in the United States, or U.S. GAAP, we review our amortizable intangible assets and goodwill for impairment when events or changes in circumstances indicate the carrying value may not be recoverable. Goodwill is tested for impairment at least annually. The carrying value of our goodwill or amortizable assets from acquisitions may not be recoverable due to factors such as a decline in stock price and market capitalization, reduced estimates of future cash flows and slower growth rates in our industry or in any of our reporting units. Estimates of future cash flows are based on an updated long-term financial outlook of our operations. However, actual performance in the near-term or long-term could be materially different from these forecasts, which could impact future estimates. For example, in the most recent impairment test of our Tegra Processor reporting unit, the fair value of the reporting unit only exceeded its carrying value by 17%. If the future operating results of the Tegra Processor reporting unit are significantly lower than our estimates, the goodwill assigned to Tegra Processor could be impaired, which would negatively impact our results of operations.
System security risks, data protection breaches, cyber-attacks and systems integration issues could disrupt our internal operations, and any such disruption could reduce our expected revenue, increase our expenses, damage our reputation and adversely affect our stock price
.
Experienced computer programmers and hackers may be able to penetrate our security controls and misappropriate or compromise our confidential information or that of third parties, create system disruptions or cause shutdowns. Computer programmers and hackers also may be able to develop and deploy viruses, worms and other malicious software programs that attack our products or otherwise exploit any security vulnerabilities of our products. The costs to us to eliminate or alleviate malicious software programs and security vulnerabilities could be significant, and our efforts to address these problems may not be successful and could result in interruptions, delays, cessation of service and loss of existing or potential customers that may impede our sales, manufacturing, distribution or other critical functions.
We manage and store various proprietary information and sensitive or confidential data relating to our business and third party business. Breaches of our security measures or the accidental loss, inadvertent disclosure or unapproved dissemination of proprietary information or sensitive or confidential data about us or our partners or customers, including the potential loss or disclosure of such information or data as a result of fraud, trickery or other forms of deception, could expose us, our partners and customers or the individuals affected to a risk of loss or misuse of this information, result in litigation and potential liability for us, damage our brand and reputation or otherwise harm our business. In addition, the cost and operational consequences of implementing further data protection measures could be significant. For example, in July 2012, unauthorized third parties gained access to certain user information on our online forums. We have strengthened security in an effort to minimize future attacks. However, hackers may continue to target our security controls in the future, and we cannot guarantee that our security measures will be able to prevent future breaches of our website and/or attacks on our products.
Portions of our IT infrastructure also may experience interruptions of service or produce errors in connection with systemic failures, systems integration or migration work that takes place from time to time. We may not be successful in implementing new systems and transitioning data, which could cause business disruptions and be more expensive, time consuming, disruptive and resource-intensive. Such disruptions could adversely impact our ability to fulfill orders and interrupt other processes. Delayed sales, lower margins or lost customers resulting from these disruptions could adversely affect our financial results, stock price and reputation.
We may not be able to attract and retain qualified employees which could negatively impact our business.
Our future success and ability to compete are substantially dependent on our ability to identify, hire, train and retain highly qualified key personnel. The market for key employees in the technology industry can be competitive. None of our key employees is bound by an employment agreement, meaning our relationships with all of our key employees are at will. The loss of the services of any of our key employees could delay our product development efforts, harm our ability to sell our products or otherwise negatively impact our business.
20
We are dependent on third parties for assembly, testing and packaging of our products, which reduces our control over our product delivery schedule, product quantity or product quality.
Our products are assembled, tested and packaged by independent subcontractors, such as Advanced Semiconductor Engineering, Inc., ChipPAC, JSI Logistics, Ltd., King Yuan Electronics Co. and Siliconware Precision Industries Co. Ltd. As a result, we do not directly control our product delivery schedules, product quantity, or product quality. All of these subcontractors assemble, test and package products for other companies, including some of our competitors. Because we do not have long-term agreements with our subcontractors, when demand for subcontractors to assemble, test or package products is high, our subcontractors may decide to prioritize the orders of other customers over our orders. Because the time required to qualify a different subcontractor to assemble, test or package our products can be lengthy, if we have to find a replacement subcontractor we could experience significant delays in shipments of our products, product shortages, a decrease in the quality of our products, or an increase in product cost. Any product shortages or quality assurance problems could increase the costs of manufacture, assembly or testing of our products, which could cause our gross margin to decline.
We rely on third-party vendors to supply software development tools to us for the development of our new products and we may be unable to obtain the tools necessary to develop or enhance new or existing products.
We rely on third-party software development tools to assist us in the design, simulation and verification of new products or product enhancements. To bring new products or product enhancements to market in a timely manner, or at all, we need software development tools that are sophisticated enough or technologically advanced enough to complete our design, simulations and verifications. In the past, we have experienced delays in the introduction of products as a result of the inability of then available software development tools to fully simulate the complex features and functionalities of our products. In the future, the design requirements necessary to meet consumer demands for more features and greater functionality from our products may exceed the capabilities of available software development tools. Unavailability of software development tools may result in our missing design cycles or losing design wins, either of which could result in a loss of market share or negatively impact our operating results.
Because of the importance of software development tools to the development and enhancement of our products, a critical component of our product development efforts is our partnerships with leaders in the computer-aided design industry, including Cadence Design Systems, Inc. and Synopsys, Inc. We have invested significant resources to develop relationships with these industry leaders and have often assisted them in the development of their new products. We believe that forming these relationships and utilizing next-generation development tools to design, simulate and verify our products will help us remain at the forefront of the 3D graphics, communications and networking segments and develop products that utilize leading-edge technology on a rapid basis. If these relationships are not successful, we may be unable to develop new products or product enhancements in a timely manner, which could result in a loss of market share, a decrease in revenue or a negative impact on our operating results.
If our products contain significant defects, our financial results could be negatively impacted, our reputation could be damaged and we could lose market share.
Our products are complex and may contain defects or experience failures due to any number of issues in design, fabrication, packaging, materials and/or use within a system. If any of our products or technologies contains a defect, compatibility issue or other error, we may have to invest additional research and development efforts to find and correct the issue. Such efforts could divert our engineers' attention from the development of new products and technologies and could increase our operating costs and reduce our gross margin. In addition, an error or defect in new products or releases or related software drivers after commencement of commercial shipments could result in failure to achieve market acceptance or loss of design wins. Also, we may be required to reimburse customers, including our customers' costs to repair or replace products in the field. A product recall or a significant number of product returns could be expensive, could damage our reputation, could result in the shifting of business to our competitors and could result in litigation against us. Costs associated with correcting defects, errors, bugs or other issues could be significant and could materially harm our financial results.
21
Our business is cyclical in nature and has experienced severe downturns that have harmed, and may in the future harm, our business and financial results.
Our business is directly affected by market conditions in the highly cyclical semiconductor industry. The semiconductor industry has been adversely affected by many factors, including the global downturn that started in the second half of 2008, ongoing efforts by our customers to reduce their spending, diminished product demand, increased inventory levels, lower average selling prices, uncertainty regarding long-term growth rates and underlying financial health and increased competition. These factors could, among other things, limit our ability to maintain or increase our sales or recognize revenue and in turn adversely affect our business, operating results and financial condition. If our actions to reduce our operating expenses to sufficiently offset these factors when they occur are unsuccessful, our operating results will suffer.
We are subject to risks associated with international operations which may harm our business.
We conduct our business worldwide and we have offices in various countries outside of the United States. Our semiconductor wafers are manufactured, assembled, tested and packaged by third parties located outside of the United States and other Americas. We generated
75%
, 74% and 78% of our revenue for fiscal years 2014, 2013 and 2012, respectively, from sales to customers outside the United States and other Americas. The manufacture, assembly, test and packaging of our products outside of the United States, operation of offices outside of the United States, and sales to customers internationally subjects us to a number of risks, including:
|
•
|
international economic and political conditions, such as political tensions between countries in which we do business;
|
|
•
|
unexpected changes in, or impositions of, legislative or regulatory requirements;
|
|
•
|
complying with a variety of foreign laws;
|
|
•
|
differing legal standards with respect to protection of intellectual property and employment practices;
|
|
•
|
local business and cultural factors that differ from our normal standards and practices, including business practices that we are prohibited from engaging in by the Foreign Corrupt Practices Act and other anticorruption laws and regulations;
|
|
•
|
inadequate local infrastructure that could result in business disruptions;
|
|
•
|
exporting or importing issues related to export or import restrictions, tariffs, quotas and other trade barriers and restrictions;
|
|
•
|
financial risks such as longer payment cycles, difficulty in collecting accounts receivable and fluctuations in currency exchange rates;
|
|
•
|
imposition of additional taxes and penalties;
|
|
•
|
increased costs due to imposition of climate change regulations, such as carbon taxes, fuel or energy taxes, and pollution limits; and
|
|
•
|
other factors beyond our control such as terrorism, cyber attack, civil unrest, war and diseases.
|
If sales to any of our customers outside of the United States and other Americas are delayed or cancelled because of any of the above factors, our revenue may be negatively impacted.
Our international operations are subject to many of the above listed risks. Difficulties with our international operations, including finding appropriate staffing and office space, may divert management's attention and other resources, any of which could negatively impact our operating results.
22
Legal and regulatory requirements differ among jurisdictions worldwide. Violations of these laws and regulations could result in fines; criminal sanctions against us, our officers, or our employees; prohibitions on the conduct of our business; and damage to our reputation. Although we have policies, controls, and procedures designed to ensure compliance with foreign laws, many of these laws and regulations are ambiguous and are often interpreted and enforced in unpredictable ways.
The economic conditions in our primary overseas markets, particularly in Asia, may negatively impact the demand for our products abroad. All of our international sales to date have been denominated in United States dollars. Accordingly, an increase in the value of the United States dollar relative to foreign currencies could make our products less competitive in international markets or require us to assume the risk of denominating certain sales in foreign currencies. We anticipate that these factors will impact our business to a greater degree as we further expand our international business activities.
Business disruptions could seriously harm our future revenue and financial condition and increase our costs and expenses.
Our worldwide operations could be disrupted by earthquakes, telecommunications failures, power or water shortages, tsunamis, floods, hurricanes, typhoons, fires, extreme weather conditions, medical epidemics or pandemics and other natural or man-made disasters, catastrophic events or climate change. The occurrence of any of these business disruptions could result in significant losses, seriously harm our revenue and financial condition, adversely affect our competitive position, increase our costs and expenses, and require substantial expenditures and recovery time in order to fully resume operations. Our corporate headquarters, and a portion of our research and development activities, are located in California, and other critical business operations and some of our suppliers are located in Asia, near major earthquake faults known for seismic activity. In addition, a majority of our principal IT data centers are located in California, making our operations vulnerable to natural disasters or other business disruptions occurring in this geographical area. The manufacture of product components, the final assembly of our products and other critical operations are concentrated in certain geographic locations, including Taiwan, China and Korea. Our operations could be adversely affected if manufacturing, logistics or other operations in these locations are disrupted for any reason, including natural disasters, high heat events or water shortages, information technology system failures, military actions or economic, business, labor, environmental, public health, regulatory or political issues. The ultimate impact on us, our significant suppliers and our general infrastructure of being located near major earthquake faults and being consolidated in certain geographical areas is unknown. However, in the event of a major earthquake or other natural disaster or catastrophic event, our revenue, profitability and financial condition could suffer.
Our investment portfolio may become impaired by deterioration of the capital markets.
Our cash equivalent and marketable securities portfolio as of January 26, 2014 consisted of cash and cash equivalents, commercial paper, mortgage-backed securities issued by government-sponsored enterprises, asset-backed securities, money market funds and debt securities of corporations, municipalities and the United States government and its agencies. We follow an established investment policy and set of guidelines, designed to preserve principal, minimize risk, and monitor and help mitigate our exposure to interest rate and credit risk. The policy sets forth credit quality standards and limits our exposure to any one issuer, as well as our maximum exposure to various asset classes, and a variety of financial instruments, consisting principally of cash and cash equivalents, commercial paper, mortgage-backed securities issued by government-sponsored enterprises, asset-backed securities, money market funds and debt securities of corporations, municipalities and the United States government and its agencies.
Should financial market conditions worsen in the future, investments in some financial instruments may pose risks arising from market liquidity and credit concerns. In addition, any deterioration of the capital markets could cause our other income and expense to vary from expectations. As of January 26, 2014, we had no material impairment charges associated with our short-term investment portfolio, and although we believe our current investment portfolio has very little risk of material impairment, we cannot predict future market conditions or market liquidity, or credit availability, and can provide no assurance that our investment portfolio will remain materially unimpaired.
Risks Related to Regulatory, Legal, Our Common Stock and Other Matters
Our common stock price has at times experienced substantial price volatility and, as a result, investors may suffer losses
.
Our stock has at times experienced substantial price volatility as a result of variations between our actual and anticipated financial results, announcements by us and our competitors, or uncertainty about current global economic conditions. The stock market as a whole also has experienced extreme price and volume fluctuations that have affected the market price of many technology companies in ways that may have been unrelated to these companies' operating performance.
23
In the past, securities class action litigation has often been brought against a company following periods of volatility in the market price of its securities. Due to changes in the volatility of our stock price, we have been in the past and may be in the future the target of securities litigation. Such lawsuits generally result in the diversion of management's time and attention away from business operations, which could harm our business. In addition, the costs of defense and any damages resulting from litigation, a ruling against us, or a settlement of the litigation could adversely affect our cash flow and financial results.
We are subject to litigation which, if determined adversely to us, could harm our business.
We are engaged in litigation with parties related to our acquisition of 3dfx in 2001. In addition, in September, October and November 2008, several putative securities class action lawsuits were filed against us for alleged defects in our previous generation MCP and GPU products. Please refer to
Note 12
of the Notes to the Consolidated Financial Statements in Part IV, Item 15 of this Annual Report on Form 10-K for further details on these lawsuits.
There can be no assurance that any litigation to which we are a party will be resolved in our favor. Any claim that is successfully decided against us may cause us to pay substantial damages, including punitive damages, and other related fees or prevent us from selling or importing certain of our products. Regardless of whether lawsuits are resolved in our favor or if we are the plaintiff or the defendant in the litigation, any lawsuits to which we are a party will likely be expensive and time consuming to defend or resolve. Such lawsuits could result in the diversion of management's time and attention away from business operations, which could harm our business. Such lawsuits could also harm our relationships with existing customers and result in the diversion of management's time and attention away from business operations, which could harm our business. Costs of defense and any damages resulting from litigation, a ruling against us, or a settlement of the litigation could adversely affect our cash flow and financial results.
Actions to adequately protect our intellectual property rights, such as litigation to defend against alleged infringement of intellectual property rights or to enforce our intellectual property rights, could result in substantial costs to us and our ability to compete could be harmed if we fail to take such actions or are unsuccessful in doing so.
We rely primarily on a combination of patents, trademarks, trade secrets, employee and third-party nondisclosure agreements, and licensing arrangements to protect our intellectual property in the United States and internationally. We have numerous patents issued, allowed and pending in the United States and in foreign jurisdictions. Our patents and pending patent applications primarily relate to our products and the technology used in connection with our products. We also rely on international treaties, organizations and foreign laws to protect our intellectual property. The laws of certain foreign countries in which our products are or may be manufactured or sold, including various countries in Asia, may not protect our products or intellectual property rights to the same extent as the laws of the United States. This makes the possibility of piracy of our technology and products more likely. We continuously assess whether and where to seek formal protection for particular innovations and technologies based on such factors as:
|
•
|
the commercial significance of our operations and our competitors' operations in particular countries and regions;
|
|
•
|
the location in which our products are manufactured;
|
|
•
|
our strategic technology or product directions in different countries; and
|
|
•
|
the degree to which intellectual property laws exist and are meaningfully enforced in different jurisdictions.
|
Our pending patent applications and any future applications may not be approved. In addition, any issued patents may not provide us with competitive advantages or may be challenged, invalidated, infringed, circumvented or misappropriated by third parties. We expect that as the number of issued hardware and software patents increases and as competition intensifies, the volume of intellectual property infringement claims and lawsuits may increase. We may in the future become involved in lawsuits or other legal proceedings alleging patent infringement or other intellectual property rights violations by us or parties that we have agreed to indemnify for certain claims of infringement. Third parties may also claim that our employees have misappropriated or divulged their former employers’ trade secrets or confidential information.
An unfavorable ruling in any such intellectual property related litigation could include significant damages, invalidation of a patent or family of patents, indemnification of customers, payment of lost profits, or, when it has been sought, injunctive relief.
24
In addition, in the future, we may need to commence litigation or other legal proceedings in order to:
|
•
|
assert claims of infringement of our intellectual property;
|
|
•
|
enforce our patents;
|
|
•
|
protect our trade secrets or know-how; or
|
|
•
|
determine the enforceability, scope and validity of the propriety rights of others.
|
If we have to initiate litigation in order to protect our intellectual property, our operating expenses may increase which could negatively impact our operating results. Our failure to effectively protect our intellectual property could harm our business.
If infringement claims are made against us or our products are found to infringe a third parties' patent or intellectual property, we or one of our indemnitees may have to seek a license to the third parties' patent or other intellectual property rights. However, we may not be able to obtain licenses at all or on terms acceptable to us particularly from our competitors. If we or one of our indemnitees is unable to obtain a license from a third party for technology that we use or that is used in one of our products, we could be subject to substantial liabilities or have to suspend or discontinue the manufacture and sale of one or more of our products. We may also have to make royalty or other payments, or cross license our technology. If these arrangements are not concluded on commercially reasonable terms, our business could be negatively impacted. Furthermore, the indemnification of a customer or other indemnitee may increase our operating expenses which could negatively impact our operating results.
Changes in United States tax legislation regarding our foreign earnings could adversely impact our business.
Currently, a majority of our revenue is generated from customers located outside the United States, and a significant portion of our assets, including employees, are located outside the United States. United States income taxes and foreign withholding taxes have not been provided on undistributed earnings for certain non-United States subsidiaries, because such earnings are intended to be indefinitely reinvested in the operations of those subsidiaries. Throughout the period of President Obama's administration, the White House has proposed various international tax measures, some of which, if enacted into law, would substantially reduce our ability to defer United States taxes on such indefinitely reinvested non-United States earnings, eliminate certain tax deductions until foreign earnings are repatriated to the United States and/or otherwise cause the total tax cost of U.S. multinational corporations to increase. If these or similar proposals are constituted into legislation in the current or future year(s), they could have a negative impact on our financial position and results of operations.
Our operating results may be adversely affected if we are subject to unexpected tax liabilities.
We are subject to taxation by a number of taxing authorities both in the United States and throughout the world. Tax rates vary among the jurisdictions in which we operate. Significant judgment is required in determining our provision for our income taxes as there are many transactions and calculations where the ultimate tax determination is uncertain. Although we believe our tax estimates are reasonable, any of the below could cause our effective tax rate to be materially different than that which is reflected in historical income tax provisions and accruals:
|
•
|
the jurisdictions in which profits are determined to be earned and taxed;
|
|
•
|
adjustments to estimated taxes upon finalization of various tax returns;
|
|
•
|
changes in available tax credits;
|
|
•
|
changes in stock-based compensation expense;
|
|
•
|
changes in tax laws, the interpretation of tax laws either in the United States or abroad or the issuance of new interpretative accounting guidance related to transactions and calculations where the tax treatment was previously uncertain; and
|
|
•
|
the resolution of issues arising from tax audits with various tax authorities.
|
25
Should additional taxes be assessed as a result of any of the above, our operating results could be adversely affected. In addition, our future effective tax rate could be adversely affected by changes in the mix of earnings in countries with differing statutory tax rates, changes in tax laws or changes in the interpretation of tax laws.
We are subject to the risks of owning real property.
During fiscal year 2009, we purchased real property in Santa Clara, California that includes
approximately 36 acres of land and twelve commercial buildings
and eventually expect to break ground on a new building for a corporate headquarters campus in Santa Clara. We also own real property in India. We have limited experience in the ownership and management of real property and are subject to the risks of owning real property, including:
|
•
|
the possibility of environmental contamination and the costs associated with mitigating any environmental problems;
|
|
•
|
adverse changes in the value of these properties, due to interest rate changes, changes in the market in which the property is located, or other factors;
|
|
•
|
the risk of loss if we decide to sell and are not able to recover all capitalized costs;
|
|
•
|
increased cash commitments for the planned construction of our Santa Clara campus;
|
|
•
|
the possible need for structural improvements in order to comply with zoning, seismic and other legal or regulatory requirements;
|
|
•
|
increased operating expenses for the buildings or the property or both;
|
|
•
|
possible disputes with third parties, such as neighboring owners or others, related to the buildings or the property or both; and
|
|
•
|
the risk of financial loss in excess of amounts covered by insurance, or uninsured risks, such as the loss caused by damage to the buildings as a result of earthquakes, floods and or other natural disasters.
|
Expensing employee equity compensation adversely affects our operating results and could also adversely affect our competitive position.
Since inception, we have used equity through our equity incentive plans and our employee stock purchase program as a fundamental component of our compensation packages. We believe that these programs directly motivate our employees and, through the use of vesting, encourage our employees to remain with us.
We record compensation expense for stock options, restricted stock units and our employee stock purchase plan using the fair value of those awards in accordance with U.S. GAAP. Stock-based compensation expense was
$136.3 million
, $136.7 million and $136.4 million for fiscal years 2014, 2013 and 2012, respectively, related to on-going vesting of equity awards, which negatively impacted our operating results.
To the extent that expensing employee equity compensation makes it more expensive to grant stock options and restricted stock units or to continue to have an employee stock purchase program, we may decide to incur increased cash compensation costs. In addition, actions that we may take to reduce stock-based compensation expense that may be more severe than any actions our competitors may implement and may make it difficult to attract retain and motivate employees, which could adversely affect our competitive position as well as our business and operating results.
26
We have a substantial amount of indebtedness which could adversely affect our financial position and prevent us from implementing our strategy or fulfilling our contractual obligations
.
In December 2013, we issued $1.5 billion of 1.00% Convertible Senior Notes due 2018, or 1.00% Notes. Our substantial indebtedness may:
|
•
|
limit our ability to use our cash flow or borrow additional funds for working capital, capital expenditures, acquisitions and general corporate and other purposes;
|
|
•
|
make it difficult for us to satisfy our financial obligations;
|
|
•
|
place us at a competitive disadvantage compared to our less leveraged competitors; and
|
|
•
|
increase our vulnerability to the impact of adverse economic and industry conditions.
|
The exercise of warrants issued to Goldman, Sachs & Co., or Goldman, concurrently with our 1.00% Notes would, and the conversion of our 1.00% Notes could, dilute the ownership interest of our existing stockholders
.
The warrants issued concurrently with our 1.00% Notes shall be deemed to be automatically exercised on certain dates between March 2019 and June 2019, unless Goldman notifies us otherwise. Any issuance by us of additional shares to Goldman upon exercise of the warrants will dilute the ownership interests of our existing stockholders. Moreover, the conversion of our 1.00% Notes may dilute the ownership interests of our existing stockholders and could have a dilutive effect on our earnings per share to the extent that the price of our common stock exceeds the conversion price of the 1.00% Notes. Any sales in the public market by Goldman of our common stock upon exercise of the warrants or sales in the public market of our common stock issuable upon conversion of the 1.00% Notes could adversely affect prevailing market prices of our common stock.
Our failure to comply with any applicable environmental regulations could result in a range of consequences, including fines, suspension of production, excess inventory, sales limitations, and criminal and civil liabilities.
We are subject to various state, federal and international laws and regulations governing the environment, including restricting the presence of certain substances in electronic products and making producers of those products financially responsible for the collection, treatment, recycling and disposal of those products. Although our management systems are designed to maintain compliance, we cannot assure you that we have been or will be at all times in complete compliance with such laws and regulations. If we violate or fail to comply with any of them, a range of consequences could result, including fines, import/export restrictions, sales limitations, criminal and civil liabilities or other sanctions. We could also be held liable for any and all consequences arising out of exposure to hazardous materials used, stored, released, disposed of by us or located at, under or emanating from our facilities or other environmental or natural resource damage.
Environmental laws are complex, change frequently and have tended to become more stringent over time. For example, the European Union and China are two among a growing number of jurisdictions that have enacted in recent years restrictions on the use of lead, among other chemicals, in electronic products. These regulations affect semiconductor packaging. There is a risk that the cost, quality and manufacturing yields of lead-free products may be less favorable compared to lead-based products or that the transition to lead-free products may produce sudden changes in demand, which may result in excess inventory.
27
There is also a movement to improve the transparency and accountability concerning the supply of minerals coming from the areas of conflict. Recent U.S. legislation includes SEC disclosure requirements regarding the use of “conflict” minerals mined from the Democratic Republic of Congo and adjoining countries, for which the first report is due on May 31, 2014 for the 2013 calendar year. The implementation of these requirements could affect the sourcing and availability of minerals used in the manufacture of semiconductor devices. As a result, there may only be a limited pool of suppliers who provide conflict-free metals, and we cannot assure you that we will be able to obtain products in sufficient quantities or at competitive prices. Furthermore, we may incur additional costs associated with complying with these disclosure requirements, including costs related to determining the source of any “conflict” minerals in our products. Also, because our supply chain is complex, we may be unable to sufficiently verify the origins for all metals used in our products, resulting in reputational challenges with our customers and stockholders. Some customers may require that all of our products are certified to be conflict-free; if we cannot satisfy these customers, they may choose a competitor's products. Although we expect to be able to file the required report on time, we are dependent upon the information provided by our many suppliers. To the extent that the information we receive from our suppliers is inaccurate or inadequate or our processes in obtaining such information do not fulfill the SEC’s diligence requirements, we could also face SEC enforcement risks.
Future environmental legal requirements may become more stringent or costly and our compliance costs and potential liabilities arising from past and future releases of, or exposure to, hazardous substances may harm our business and our reputation.
While we believe that we have adequate internal control over financial reporting, if we or our independent registered public accounting firm determines that we do not, our reputation may be adversely affected and our stock price may decline.
Section 404 of the Sarbanes-Oxley Act of 2002, or Section 404, requires our management to report on, and our independent registered public accounting firm to audit, the effectiveness of our internal control structure and procedures for financial reporting. We have an ongoing program to perform the system and process evaluation and testing necessary to comply with these requirements. However, the manner in which companies and their independent public accounting firms apply these requirements and test companies' internal controls remains subject to some judgment. To date, we have incurred, and we expect to continue to incur, increased expense and to devote additional management resources to Section 404 compliance. Despite our efforts, if we identify a material weakness in our internal controls, there can be no assurance that we will be able to remediate that material weakness in a timely manner, or that we will be able to maintain all of the controls necessary to determine that our internal control over financial reporting is effective. In the event that our chief executive officer, our chief financial officer or our independent registered public accounting firm determine that our internal control over financial reporting is not effective as defined under Section 404, investor perceptions of us may be adversely affected and could cause a decline in the market price of our stock.
Changes in financial accounting standards or interpretations of existing standards could affect our reported results of operations.
We prepare our consolidated financial statements in conformity with U.S. GAAP. These principles are constantly subject to review and interpretation by the SEC and various bodies formed to interpret and create appropriate accounting principles. A change in these principles, or the interpretation of them, can have a significant effect on our reported results and may even retroactively affect previously reported transactions. Additionally, changes in existing accounting rules, such as the possible upcoming changes to revenue recognition and lease accounting standards, or changes in practices, such as changes to auditing standards promulgated by the Public Company Accounting Oversight Board, could have a significant adverse effect on our results of operations or the manner in which we conduct our business.
Delaware law and provisions in our certificate of incorporation, our bylaws and our agreement with Microsoft Corporation could delay or prevent a change in control.
Our status as a Delaware corporation and the anti-takeover provisions of the Delaware General Corporation Law may discourage, delay, or prevent a change in control by prohibiting us from engaging in a business combination with an interested stockholder for a period of three years after the person becomes an interested stockholder, even if a change of control would be beneficial to our existing stockholders. In addition, our certificate of incorporation and bylaws contain provisions that could make it more difficult for a third party to acquire a majority of our outstanding voting stock. These provisions include the following:
|
•
|
the ability of our Board of Directors to create and issue preferred stock without prior stockholder approval;
|
|
•
|
the prohibition of stockholder action by written consent;
|
28
|
•
|
a classified Board of Directors, which will become fully declassified from and after our 2014 Annual Meeting of Stockholders;
|
|
•
|
advance notice requirements for director nominations and stockholder proposals;
|
|
•
|
the ability of our Board of Directors to increase or decrease the number of directors without stockholder approval;
|
|
•
|
a super-majority voting requirement to amend some provisions in our certificate of incorporation and bylaws;
|
|
•
|
the elimination of the ability of our stockholders to call special meetings of stockholders; and
|
|
•
|
the ability of our Board of Directors to make, amend or repeal our bylaws.
|
On March 5, 2000, we entered into an agreement with Microsoft in which we agreed to develop and sell graphics chips and to license certain technology to Microsoft and its licensees for use in the Xbox. Under the agreement, if an individual or corporation makes an offer to purchase shares equal to or greater than 30% of the outstanding shares of our common stock, Microsoft may have first and last rights of refusal to purchase the stock. The Microsoft provision and the other factors listed above could also delay or prevent a change in control of NVIDIA. These provisions could also discourage proxy contests and make it more difficult for stockholders to elect directors of their choosing and to cause us to take other corporate actions they desire.
Not applicable.
Our headquarters complex is located in Santa Clara, California. Our corporate campus is comprised of leased facilities with eight commercial buildings totaling 887,993 square feet. In addition, we also lease data center space in Santa Clara.
Outside of Santa Clara, we lease space in Austin, Texas and a number of regional facilities in other U.S. locations, which are used as research and development centers and/or sales and administrative offices. Outside of the United States, we own a building in Hyderabad, India, which is being used primarily as a research and development center. We also lease space in various international locations as research and development centers and/or sales and administrative offices primarily in Asia Pacific regions and Europe.
We own real property in Santa Clara, California that includes
approximately 36 acres of land and twelve commercial buildings
.
We expect to eventually build a new building for a corporate headquarters campus on this property. However, we recently leased and occupied an office building within the boundaries of our main Santa Clara campus that has balanced the workspace needs for our Santa Clara staff. As such, we now have the opportunity to delay the start of the new campus building and refine our design to further optimize for functionality and cost.
We believe that we currently have sufficient facilities to conduct our operations for the next twelve months. For additional information regarding obligations under leases, see
Note 12
of the Notes to the Consolidated Financial Statements in Part IV, Item 15 of this Annual Report on Form 10-K under the subheading “Lease Obligations,” which information is hereby incorporated by reference.
29
3dfx
On December 15, 2000, NVIDIA and one of our indirect subsidiaries entered into an Asset Purchase Agreement, to purchase certain graphics chip assets from 3dfx. The transaction closed on April 18, 2001. That acquisition, and 3dfx's October 2002 bankruptcy filing, led to four lawsuits against NVIDIA: two brought by 3dfx's former landlords, one by 3dfx's bankruptcy trustee and the fourth by a committee of 3dfx's equity security holders in the bankruptcy estate. The two landlord cases have been settled with payments from the landlords to NVIDIA, and the equity security holders' lawsuit was dismissed with prejudice and no appeal was filed. Accordingly, only the bankruptcy trustee suit remains outstanding.
Please refer to
Note 12
of the Notes to the Consolidated Financial Statements in Part IV, Item 15 of this
Annual Report on
Form 10-K for further discussion regarding this litigation.
Securities Cases
In September 2008, three putative securities class actions, were filed in the United States District Court for the Northern District of California arising out of our announcements on July 2, 2008, that we would take a charge against cost of revenue to cover anticipated costs and expenses arising from a weak die/packaging material set in certain versions of our previous generation MCP and GPU products and that we were revising financial guidance for our second quarter of fiscal year 2009.
Please refer to
Note 12
of the Notes to the Consolidated Financial Statements in Part IV, Item 15 of this
Annual Report on
Form 10-K for further discussion regarding this litigation.
Accounting for Loss Contingencies
While there can be no assurance of favorable outcomes, we believe the claims made by other parties in the above ongoing matters are without merit and we intend to vigorously defend the actions. With the exception of the 3dfx case, we have not recorded any accrual for contingent liabilities associated with the legal proceedings described above based on our belief that liabilities, while possible, are not probable. Further, any possible range of loss in these matters cannot be reasonably estimated at this time. We are engaged in other legal actions not described above arising in the ordinary course of its business and, while there can be no assurance of favorable outcomes, we believe that the ultimate outcome of these actions will not have a material adverse effect on our operating results, liquidity or financial position.
Not Applicable.
30
Our common stock is traded on the NASDAQ Global Select Market under the symbol NVDA. Public trading of our common stock began on January 22, 1999. Prior to that, there was no public market for our common stock. As of March 7, 2014, we had approximately 381 registered stockholders, not including those shares held in street or nominee name. The following table sets forth for the periods indicated the high and low sales price for our common stock as quoted on the NASDAQ Global Select Market:
|
|
High
|
Low
|
|||||
|
Fiscal year ending January 25, 2015
|
|
|
|||||
|
First Quarter (through March 7, 2014)
|
$
|
19.05
|
|
$
|
15.32
|
|
|
|
Fiscal year ended January 26, 2014
|
|||||||
|
Fourth Quarter
|
$
|
16.44
|
|
$
|
14.52
|
|
|
|
Third Quarter
|
$
|
16.10
|
|
$
|
13.11
|
|
|
|
Second Quarter
|
$
|
15.48
|
|
$
|
13.37
|
|
|
|
First Quarter
|
$
|
13.50
|
|
$
|
12.04
|
|
|
|
Fiscal year ended January 27, 2013
|
|
|
|||||
|
Fourth Quarter
|
$
|
13.19
|
|
$
|
11.15
|
|
|
|
Third Quarter
|
$
|
15.22
|
|
$
|
11.83
|
|
|
|
Second Quarter
|
$
|
13.90
|
|
$
|
11.63
|
|
|
|
First Quarter
|
$
|
16.90
|
|
$
|
12.75
|
|
|
Dividend Policy
Prior to fiscal year 2013, we had never declared or paid any dividend on shares of our common stock. On November 8, 2012, we announced the initiation of a quarterly cash dividend program. This initial quarterly dividend of $0.075 per share was equivalent to $0.30 per share on an annual basis. On November 7, 2013, we increased our quarterly cash dividend by 13% to $0.085 per share which was equivalent to $0.34 per share on an annual basis. A subsequent cash dividend of $0.085 per share was declared on February 12, 2014, payable on March 20, 2014 to all common stockholders of record at the close of business on February 27, 2014.
In fiscal year 2014 and fiscal year 2013, we paid
$181.3 million
and
$46.9 million
, respectively, in cash dividends to our common stockholders.
Our cash dividend program and the payment of future cash dividends under that program are subject to continued capital availability and our Board of Directors' continuing determination that the dividend program and the declaration of dividends thereunder are in the best interests of our stockholders and are in compliance with all laws and agreements of NVIDIA applicable to the declaration and payment of cash dividends.
In fiscal year 2014, based upon our earnings and profits, 85% of our dividend payments were considered qualified dividends and 15% of our dividend payments were considered to be a return of capital for U.S. federal income tax purposes. We expect that a portion of our dividend payments in fiscal year 2015 may also be considered a return of capital for U.S. federal income tax purposes.
Issuer Purchases of Equity Securities
Beginning August 2004, our Board of Directors authorized us, subject to certain specifications, to repurchase shares of our common stock. Most recently, in November 2013, the Board extended the previously authorized repurchase program through January 2016 and authorized an additional $1.0 billion for an aggregate of $3.7 billion under the repurchase program. Through January 26, 2014, we have repurchased an aggregate of 161.2 million shares under our stock repurchase program for a total cost of $2.45 billion. As of January 26, 2014, we are authorized, subject to certain specifications, to repurchase shares of our common stock up to $1.25 billion through January 2016.
In November 2013, we announced the intention to return $1.0 billion to shareholders in fiscal year 2015 in the form of share repurchases and cash dividends.
31
The repurchases will be made from time to time in the open market, in privately negotiated transactions, or in structured stock repurchase programs, and may be made in one or more larger repurchases, in compliance with Rule 10b-18 of the Securities Exchange Act of 1934, as amended, or the Exchange Act, subject to market conditions, applicable legal requirements, and other factors. The program does not obligate NVIDIA to acquire any particular amount of common stock and the program may be suspended at any time at our discretion. As part of our share repurchase program, we have entered into, and we may continue to enter into, structured share repurchase transactions with financial institutions. These agreements generally require that we make an up-front payment in exchange for the right to receive a fixed number of shares of our common stock upon execution of the agreement, and a potential incremental number of shares of our common stock, within a pre-determined range, at the end of the term of the agreement.
The following table presents details of our share repurchase transactions during the three months ended January 26, 2014 (in millions, except per share amounts):
|
Period
|
Total Number of Shares Purchased
|
Average Price Paid per Share
|
Total Number of Shares Purchased as Part of Publicly Announced Plans or Programs
|
Approximate Dollar Value of Shares that May Yet Be Purchased Under the Plans or Programs
|
||||
|
October 28, 2013 - November 24, 2013
|
1.5
|
$15.86
|
1.5
|
$1,262.7
|
||||
|
November 25, 2013 - December 22, 2013
|
0.9
|
$15.51
|
0.9
|
$1,248.4
|
||||
|
December 23, 2013 - January 26, 2014
|
—
|
—
|
—
|
$1,248.4
|
||||
|
Total
|
2.4
|
$15.72
|
2.4
|
|||||
As part of the repurchase program, during February 2014, we entered into an accelerated share repurchase agreement, or ASR, with an investment bank, under which we prepaid $500.0 million to purchase shares of our common stock. In February 2014, the investment bank delivered 20.6 million shares to us. We expect to receive additional shares at the time of settlement of the ASR in the second quarter of fiscal year 2015. The price we will ultimately pay per share will be no more than the volume-weighted average price of our common stock over the period of the ASR.
In addition to our share repurchase program, we withhold common stock shares associated with net share settlements to cover tax withholding obligations upon the vesting of restricted stock unit, or RSU, awards under our equity incentive program. During fiscal year 2014, we withheld approximately 1.9 million shares at a total cost of $27.3 million through net share settlements. Please refer to Note 2 of the Notes to the Consolidated Financial Statements in Part IV, Item 15 of this Form 10-K for further discussion regarding our equity incentive plans.
32
Stock Performance Graphs
The following graph compares the cumulative total stockholder return for our common stock, the S&P 500 Index and the S&P Semiconductors Index for the five years ended
January 26, 2014
. The graph assumes that $100 was invested on January 25, 2009 in our common stock or on January 31, 2009 in each of the S&P 500 Index and the S & P Semiconductors Index. Total return assumes reinvestment of dividends in each of the indices indicated. Our results are calculated on a fiscal year-end basis and each of the S&P 500 Index and the S&P Semiconductors Index are calculated on a month-end basis. Total return is based on historical results and is not intended to indicate future performance.
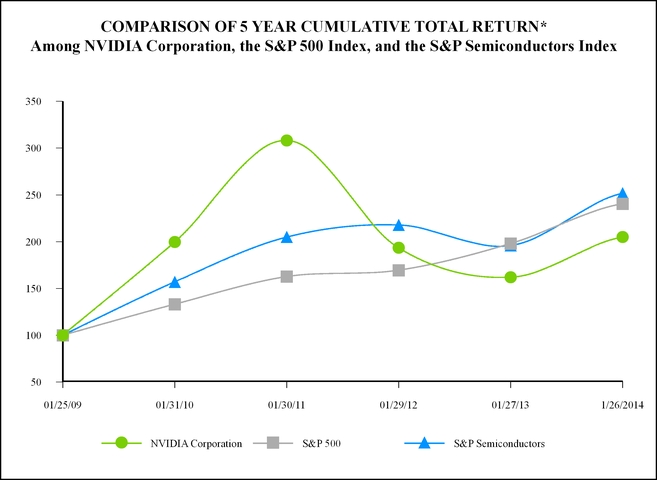
*$100 invested on 1/25/09 in stock or 1/31/09 in index, including reinvestment of dividends. Indexes calculated on month-end basis.
Copyright© 2014 S&P, a division of The McGraw-Hill Companies Inc. All rights reserved.
|
|
1/25/2009
|
1/31/2010
|
1/30/2011
|
1/29/2012
|
1/27/2013
|
1/26/2014
|
||||||||||||||||||
|
NVIDIA Corporation
|
$
|
100.00
|
|
$
|
199.61
|
|
$
|
308.17
|
|
$
|
193.39
|
|
$
|
162.01
|
|
$
|
204.89
|
|
||||||
|
S&P 500
|
$
|
100.00
|
|
$
|
133.14
|
|
$
|
162.67
|
|
$
|
169.54
|
|
$
|
197.98
|
|
$
|
240.58
|
|
||||||
|
S&P Semiconductors
|
$
|
100.00
|
|
$
|
156.98
|
|
$
|
204.86
|
|
$
|
217.83
|
|
$
|
195.89
|
|
$
|
251.73
|
|
||||||
33
The following graph compares the cumulative total stockholder return for our common stock, the S&P 500 Index and the S&P Semiconductors Index for the ten years ended
January 26, 2014
. The graph assumes that $100 was invested on January 25, 2004 in our common stock or on January 31, 2004 in each of the S&P 500 Index and the S&P Semiconductors Index. Total return assumes reinvestment of dividends in each of the indices indicated. Our results are calculated on a fiscal year-end basis and each of the S&P 500 Index and the S&P Semiconductors Index are calculated on a month-end basis. Total return is based on historical results and is not intended to indicate future performance.
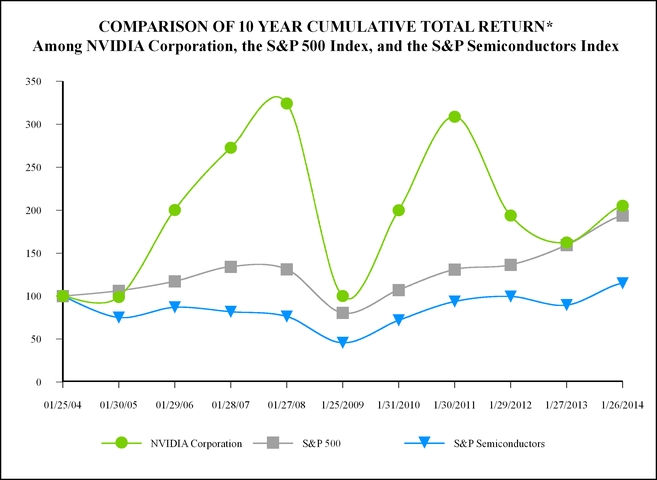
*$100 invested on 1/25/04 in stock or 1/31/04 index, including reinvestment of dividends. Indexes calculated on month-end basis.
Copyright© 2014 S&P, a division of The McGraw-Hill Companies Inc. All rights reserved.
|
|
1/25/2004
|
|
1/30/2005
|
|
1/29/2006
|
|
1/28/2007
|
|
1/27/2008
|
|
1/25/2009
|
|
1/31/2010
|
|
1/30/2011
|
|
1/29/2012
|
|
1/27/2013
|
|
1/26/2014
|
|
|||||||||||||||||||||
|
NVIDIA Corporation
|
$
|
100.00
|
|
$
|
99.09
|
|
$
|
200.30
|
|
$
|
272.59
|
|
$
|
324.17
|
|
$
|
100.17
|
|
$
|
199.96
|
|
$
|
308.71
|
|
$
|
193.72
|
|
$
|
162.29
|
|
$
|
205.25
|
|
||||||||||
|
S&P 500
|
$
|
100.00
|
|
$
|
106.23
|
|
$
|
117.26
|
|
$
|
134.28
|
|
$
|
131.17
|
|
$
|
80.50
|
|
$
|
107.18
|
|
$
|
130.96
|
|
$
|
136.48
|
|
$
|
159.38
|
|
$
|
193.68
|
|
||||||||||
|
S&P Semiconductors
|
$
|
100.00
|
|
$
|
75.16
|
|
$
|
86.90
|
|
$
|
81.82
|
|
$
|
76.25
|
|
$
|
45.71
|
|
$
|
71.75
|
|
$
|
93.64
|
|
$
|
99.56
|
|
$
|
89.54
|
|
$
|
115.06
|
|
||||||||||
34
The following selected financial data should be read in conjunction with our financial statements and the notes thereto, and with Item 7, “Management’s Discussion and Analysis of Financial Condition and Results of Operations.” The consolidated statements of operations data for the fiscal years ended
January 26, 2014
,
January 27, 2013
and
January 29, 2012
and the consolidated balance sheet data as of
January 26, 2014
and
January 27, 2013
have been derived from and should be read in conjunction with our audited consolidated financial statements and the notes thereto included in Part IV, Item 15 in this Annual Report on Form 10-K. We operate on a 52- or 53-week year, ending on the last Sunday in January. Fiscal years 2014, 2013, 2012 and 2011 were 52-week years, while fiscal year 2010 was a 53-week year.
|
|
Year Ended
|
||||||||||||||||||
|
January 26,
2014
|
January 27,
2013
|
January 29,
2012
|
January 30,
2011 (A,B)
|
January 31,
2010 (A,C)
|
|||||||||||||||
|
|
(In thousands, except per share data)
|
||||||||||||||||||
|
Consolidated Statement of Operations Data:
|
|
|
|
|
|
||||||||||||||
|
Revenue
|
$
|
4,130,162
|
|
$
|
4,280,159
|
|
$
|
3,997,930
|
|
$
|
3,543,309
|
|
$
|
3,326,445
|
|
||||
|
Income (loss) from operations
|
$
|
496,227
|
|
$
|
648,239
|
|
$
|
648,299
|
|
$
|
255,747
|
|
$
|
(98,945
|
)
|
||||
|
Net income (loss)
|
$
|
439,990
|
|
$
|
562,536
|
|
$
|
581,090
|
|
$
|
253,146
|
|
$
|
(67,987
|
)
|
||||
|
Basic net income (loss) per share
|
$
|
0.75
|
|
$
|
0.91
|
|
$
|
0.96
|
|
$
|
0.44
|
|
$
|
(0.12
|
)
|
||||
|
Diluted net income (loss) per share
|
$
|
0.74
|
|
$
|
0.90
|
|
$
|
0.94
|
|
$
|
0.43
|
|
$
|
(0.12
|
)
|
||||
|
Shares used in basic per share computation
|
587,893
|
|
619,324
|
|
603,646
|
|
575,177
|
|
549,574
|
|
|||||||||
|
Shares used in diluted per share computation
|
594,517
|
|
624,957
|
|
616,371
|
|
588,684
|
|
549,574
|
|
|||||||||
|
Year Ended
|
|||||||||||||||||||
|
January 26,
2014 (D,E)
|
January 27,
2013 (D)
|
January 29,
2012 (F)
|
January 30,
2011
|
January 31,
2010
|
|||||||||||||||
|
(In thousands, except per share data)
|
|||||||||||||||||||
|
Consolidated Balance Sheet Data:
|
|
|
|
|
|
||||||||||||||
|
Cash, cash equivalents and marketable securities
|
$
|
4,671,810
|
|
$
|
3,727,883
|
|
$
|
3,129,576
|
|
$
|
2,490,563
|
|
$
|
1,728,227
|
|
||||
|
Total assets
|
$
|
7,250,894
|
|
$
|
6,412,245
|
|
$
|
5,552,928
|
|
$
|
4,495,246
|
|
$
|
3,585,918
|
|
||||
|
Long-term debt
|
$
|
1,356,375
|
|
$
|
—
|
|
$
|
—
|
|
$
|
—
|
|
$
|
—
|
|
||||
|
Capital lease obligations, less current portion
|
$
|
17,500
|
|
$
|
18,998
|
|
$
|
21,439
|
|
$
|
23,389
|
|
$
|
24,450
|
|
||||
|
Total stockholders’ equity
|
$
|
4,456,398
|
|
$
|
4,827,703
|
|
$
|
4,145,724
|
|
$
|
3,181,462
|
|
$
|
2,665,140
|
|
||||
|
Cash dividends declared and paid per common share
|
$
|
0.310
|
|
$
|
0.075
|
|
$
|
—
|
|
$
|
—
|
|
$
|
—
|
|
||||
|
(A)
|
We recorded a net warranty charge of $193.9 million and $94.0 million during fiscal years 2011 and 2010, respectively, towards the repair and replacement of products arising from a weak die/packaging material set used in certain versions of our previous generation MCP and GPU products.
|
|
(B)
|
In fiscal year 2011, we entered into a six-year cross licensing agreement with Intel and also mutually agreed to settle all outstanding legal disputes. We valued the settlement portion at $57.0 million, which was recorded within income from operations in fiscal year 2011.
|
|
(C)
|
Fiscal year 2010 includes impact of charge for a tender offer to purchase an aggregate of 28.5 million outstanding stock options for a total cash payment of $78.1 million. As a result of the tender offer, we incurred a charge of $140.2 million, consisting of the remaining unamortized stock-based compensation expenses associated with the unvested portion of the options tendered in the offer, stock-based compensation expense resulting from amounts paid in excess of the fair value of the underlying options, plus associated payroll taxes and professional fees.
|
35
|
(D)
|
On November 8, 2012, we initiated a quarterly dividend payment of 7.5 cents per share, or 30 cents on an annual basis. On November 7, 2013, we increased the quarterly cash dividend to 8.5 cents per share, or 34 cents on an annual basis.
|
|
(E)
|
On December 2, 2013, we issued
$1.5 billion
aggregate principal amount of
1.00%
Convertible Senior Notes due 2018.
|
|
(F)
|
On June 10, 2011, we completed the acquisition of Icera, Inc. for total cash consideration of $352.2 million, and recorded goodwill of $271.2 million.
|
The following discussion and analysis of our financial condition and results of operations should be read in conjunction with “Item 1A. Risk Factors”, “Item 6. Selected Financial Data”, our Consolidated Financial Statements and related Notes thereto, as well as other cautionary statements and risks described elsewhere in this Annual Report on Form 10-K, before deciding to purchase, hold or sell shares of our common stock.
Overview
Our Company
NVIDIA is a visual computing company. In a world increasingly filled with visual displays, our graphics technologies let our customers interact with the world of digital ideas, information and entertainment with an efficiency that no other communication medium can match.
Our strategy is to be the world leader in visual computing. We target applications in each of the major computing platforms - PC, cloud, mobile - where we can create value. Our target markets are gaming, design and visualization, high performance computing, or HPC, and data center, and automotive and smart devices. We deploy business models we believe are best suited for each application, whether IP, chips, systems, or NVIDIA-branded devices and services.
We have long been known for bringing video games to life with our PC graphics chips. With our invention of the GPU, we introduced the world to the power of programmable shading, which defines modern computer graphics. Today, we reach well beyond PC graphics and games. Our energy-efficient processors are at the heart of products ranging from smartphones to automobiles to supercomputers. We believe in leveraging our processors and visual computing expertise to create differentiated products.
PC gamers choose our GPUs to enjoy immersive fantasy worlds. Our Tegra system-on-a-chip, or SOC, processors power smartphones, tablets and automobile infotainment systems. Professional designers use our GPUs to create visual effects in movies and design everything from audio headsets to commercial aircraft. Supercomputers take advantage of the massively parallel processing capabilities of our GPUs to accelerate a wide range of important applications, from simulations of viruses to weather forecasting and global oil exploration.
NVIDIA's research and development in visual computing has yielded approximately 7,000 patent assets, including inventions essential to modern computing.
Our businesses are based on two technologies with a consistent underlying graphics architecture: the GPU and the Tegra processor.
GPUs, each with billions of transistors, are the engines of visual computing and among the world's most complex processors. We have GPU product brands aimed at specific users and applications: GeForce for gamers; Quadro for designers; Tesla for researchers; and GRID for cloud-based graphics.
|
•
|
In gaming, GPUs enhance the gaming experience on PCs by improving the visual quality of graphics, increasing the frame rate for smoother gameplay and improving realism by replicating the behavior of light and physical objects.
|
36
|
•
|
For designers, GPUs improve productivity and introduce new capabilities. For example, an architect designing a new building in a CAD package can interact with the model in real time, the model can be more detailed, and photo realistic renderings can be generated for the client.
|
|
•
|
Researchers can use GPUs to run their simulations faster while consuming less power, increasing the accuracy of weather forecasts, or pricing financial derivatives more quickly.
|
|
•
|
GRID uses GPUs to deliver graphics performance remotely, from the cloud. Uses include gaming, professional applications provided as a service (SaaS) and improving Citrix and VMware installations.
|
The Tegra processor is a SOC integrating an entire computer on a single chip. Tegra processors incorporate GPUs and multi-core CPUs together with audio, video and input/output capabilities. They can also be integrated with baseband processors to add voice and data communication. Our Tegra SOC conserves power while delivering state-of-the-art graphics and multimedia processing.
Tegra runs devices like smartphones, tablets and PCs; it can also be embedded into smart devices, such as televisions, monitors, set-top boxes, gaming devices and cars. SHIELD, our Android gaming device based on Tegra, contains proprietary NVIDIA-developed software and system technologies and leverages our deep partnerships with game developers.
Headquartered in Santa Clara, California, we were incorporated in California in April 1993 and reincorporated in Delaware in April 1998.
Our Businesses
We have two reporting segments - GPU and Tegra Processor - that leverage a single, unified architecture. Our GPU business leverages our GPU technology across multiple end markets. It comprises four primary product lines: GeForce for desktop and notebook PCs; Quadro for professional workstations; Tesla for high-performance servers and workstations; and NVIDIA GRID for server graphics solutions. It also includes other related products, licenses and revenue supporting the GPU business, such as memory products. Our Tegra Processor business comprises product lines primarily based on our Tegra SOC and modem processor technologies including Tegra for smartphones and tablets, including for Windows RT-based devices; automotive computers, including infotainment and navigation systems; and gaming devices such as SHIELD. It also includes other related products, licenses and revenue supporting the Tegra Processor business - such as Icera baseband processors and RF transceivers, embedded products, and license and other revenue associated with game consoles.
In addition to the two reporting segments discussed above, the “All Other” category primarily includes licensing revenue from our patent cross licensing agreement with Intel, which we expect to recognize through March 2017.
Recent Developments, Future Objectives and Challenges
GPU Business
During fiscal year 2014, we announced and shipped our new family of high-end Kepler-based gaming GPUs - GeForce GTX Titan, GeForce GTX 780, GeForce GTX 780 Ti, GeForce GTX 770 and GeForce GTX 760, and introduced G-SYNC technology that enables synchronization between the GPU and the display to help eliminate on-screen lag.
In addition, we extended our Kepler technology further into the workstation market by shipping four new professional graphics products under our Quadro K Series, including our most powerful workstation graphics card - the Quadro K6000. Furthermore, we launched Tesla K40, an accelerator for supercomputing and enterprise data analytics, and partnered with IBM to build supercomputers for the high performance computing community.
For the cloud computing platform, we launched GRID VCA - the industry's first visual computing appliance that enables businesses to deploy cloud-based, GPU-accelerated applications through any Windows, Linux or Mac client on their network. We also announced that VMware Horizon View supports NVIDIA GRID technology and that Citrix’s XenDesktop 7 has fully integrated our GRID vGPU technology to share GPUs across virtual machines. Finally, we announced an IP licensing initiative designed to bring our GPU technology to new markets and generate revenue from markets previously inaccessible to us.
37
Tegra Processor Business
During fiscal year 2014, we announced our first fully integrated 4G LTE mobile processor - Tegra 4i, and extended our reach in the mobile devices market with the first shipments of Tegra 4 devices - including Xiaomi's Mi3 smartphone in China and Tegra Note, a complete tablet platform. We also launched our next generation mobile system-on-a-chip, Tegra K1, extending the Kepler architecture across the Company’s entire line of processors, displayed Denver, our custom 64-bit ARM core inside Tegra K1, and showed Android running on 64-bit ARM.
In addition, we announced that Audi introduced a new Tegra-powered infotainment system, smart display and digital cockpit and that Audi would use Tegra K1 to power its future piloted-driving initiatives. Finally, we started shipping SHIELD, an open-platform gaming and entertainment portable that enables gamers to play Android games or stream games from a PC with a GeForce processor.
Convertible Notes
On December 2, 2013, we issued $1.5 billion of 1.00% Convertible Senior Notes, or the Notes, due in 2018 and concurrently entered into separate note hedge and warrant transactions and used $14.3 million to repurchase shares of our common stock from purchasers of the Notes in privately negotiated transactions. In addition to using the net proceeds to fund the transaction costs, note hedge and warrant transactions, we further intend to use the proceeds to repurchase of shares of our common stock and pay cash dividends pursuant to our recently announced fiscal year 2015 capital return program, and for general corporate purposes.
Please refer to Note 11 of the Notes to the Consolidated Financial Statements in Part IV, Item 15 of this Annual Report on Form 10-K for further discussion.
Capital Return to Shareholders
During fiscal year 2014, we repurchased shares worth
$887.3 million
, paid a total of
$181.3 million
in dividends and increased our quarterly cash dividend by 13% to $0.085 per share. We
have announced our intention to return $1.0 billion to shareholders in fiscal year 2015 in the form of share repurchases and dividends. As part of our capital return program, during February 2014 we entered into an accelerated share repurchase agreement to purchase $500.0 million in shares of our common stock.
Please refer to
Note 14
of the Notes to the Consolidated Financial Statements in Part IV, Item 15 of this Annual Report on Form 10-K for further discussion.
Critical Accounting Policies and Estimates
Management’s discussion and analysis of financial condition and results of operations are based upon our consolidated financial statements, which have been prepared in accordance with U.S. GAAP. The preparation of these financial statements requires us to make estimates and judgments that affect the reported amounts of assets, liabilities, revenue, cost of revenue, expenses and related disclosure of contingencies. On an on-going basis, we evaluate our estimates, including those related to revenue recognition, cash equivalents and marketable securities, accounts receivable, inventories, income taxes, goodwill, stock-based compensation, warranty liabilities, litigation, investigation and settlement costs and other contingencies. We base our estimates on historical experience and on various other assumptions that are believed to be reasonable under the circumstances, the results of which form the basis for making judgments about the carrying values of assets and liabilities.
We believe the following critical accounting policies affect our significant judgments and estimates used in the preparation of our consolidated financial statements. Our management has discussed the development and selection of these critical accounting policies and estimates with the Audit Committee of our Board of Directors. The Audit Committee has reviewed our disclosures relating to our critical accounting policies and estimates in this Annual Report on Form 10-K.
38
Revenue Recognition
Product Revenue
We recognize revenue from product sales when persuasive evidence of an arrangement exists, the product has been delivered, the price is fixed or determinable and collection of the related receivable is reasonably assured. For most sales, we use a binding purchase order and in certain cases we use a contractual agreement as evidence of an arrangement. We consider delivery to occur upon shipment provided title and risk of loss have passed to the customer. At the point of sale, we assess whether the arrangement fee is fixed or determinable and whether collection is reasonably assured. If we determine that collection of a fee is not reasonably assured, we defer the fee and recognize revenue at the time collection becomes reasonably assured, which is generally upon receipt of payment.
Our policy on sales to certain distributors with rights of return is to defer recognition of revenue and related cost of revenue until the distributors resell the product, as the level of returns cannot be reasonably estimated.
Our customer programs primarily involve rebates, which are designed to serve as sales incentives to resellers of our products in various target markets. We account for rebates as a reduction of revenue and accrue for 100% of the potential rebates and do not apply a breakage factor. While we have a long history of rebate arrangements with OEMs, we believe we are unable to apply our historical experience to reliably estimate the amount of rebates that will eventually be claimed by individual OEMs. The OEMs are not our direct customers and the quantity and mix of demand they place on CEM/ODMs may shift as we introduce new generations and iterations of products and as we experience changes in new competitor offerings. In addition, we typically find that approximately 95% of the rebates we accrue each year are eventually claimed, which is substantially close to 100%, and that this percentage varies by program and by customer. We recognize a liability for these rebates at the later of the date at which we record the related revenue or the date at which we offer the rebate. Rebates typically expire six months from the date of the original sale, unless we reasonably believe that the customer intends to claim the rebate. Unclaimed rebates are reversed to revenue, the amount of which typically represents approximately 0.5% of total revenue.
Our customer programs also include marketing development funds, or MDFs. MDFs represent monies paid to retailers, system builders, original equipment manufacturers, or OEMs, distributors and add-in card partners that are earmarked for market segment development and expansion and typically are designed to support our partners’ activities while also promoting NVIDIA products. Depending on market conditions, we may take actions to increase amounts offered under customer programs, possibly resulting in an incremental reduction of revenue at the time such programs are offered. We account for MDFs as a reduction of revenue and apply a breakage factor to certain types of MDF program accruals for which we believe we can make a reasonable and reliable estimate of the amount that will ultimately be unclaimed. MDF amounts that have been previously recorded against revenue and subsequently expired unclaimed are reversed to revenue. Such amounts have not been significant.
We also record a reduction to revenue by establishing a sales return allowance for estimated product returns at the time revenue is recognized, based primarily on historical return rates. However, if product returns for a particular fiscal period exceed historical return rates we may determine that additional sales return allowances are required to properly reflect our estimated exposure for product returns.
License and Development Revenue
For license arrangements that require significant customization of our intellectual property components, we generally recognize the related revenue over the period that services are performed. For most license and service arrangements, we determine progress to completion based on actual direct labor hours incurred to date as a percentage of the estimated total direct labor hours required to complete the project. We periodically evaluate the actual status of each project to ensure that the estimates to complete each contract remain accurate. A provision for estimated losses on contracts is made in the period in which the loss becomes probable and can be reasonably estimated. Costs incurred in advance of revenue recognized are recorded as deferred costs on uncompleted contracts. If the amount billed exceeds the amount of revenue recognized, the excess amount is recorded as deferred revenue. Revenue recognized in any period is dependent on our progress toward completion of projects in progress. Significant management judgment and discretion are used to estimate total direct labor hours. Any changes in or deviations from these estimates could have a material effect on the amount of revenue we recognize in any period.
For license arrangements that do not require significant customization but where we are obligated to provide further deliverables over the term of the license agreement, we record revenue over the life of the license term, with consideration received in advance of the performance period classified as deferred revenue
.
39
Royalty revenue is recognized related to the distribution or sale of products that use our technologies under license agreements with third parties. We recognize royalty revenue upon receipt of a confirmation of earned royalties and when collectability is reasonably assured from the applicable licensee.
Accounts Receivable
We maintain an allowance for doubtful accounts receivable for estimated losses resulting from the inability of our customers to make required payments. Management determines this allowance, which consists of an amount identified for specific customer issues as well as an amount based on overall estimated exposure. Our accounts receivable are highly concentrated and make us vulnerable to adverse changes in our customers businesses, and to downturns in the industry and the worldwide economy. Our overall estimated exposure excludes significant amounts that are covered by credit insurance and letters of credit. If the financial condition of our customers, the financial institutions providing letters of credit, or our credit insurance carrier were to deteriorate, resulting in an impairment of their ability to make payments, additional allowances may be required that could adversely affect our operating results. Furthermore, there can be no assurance that we will be able to continue to obtain credit insurance in the future.
As of
January 26, 2014
, our allowance for doubtful accounts receivable was $0.8 million and our gross accounts receivable balance was $443.5 million. Of the $443.5 million, $84.1 million was covered by credit insurance and $23.1 million was covered by letters of credit. If the financial condition of our customers were to deteriorate, resulting in an impairment of their ability to make payments, additional allowances may be required and we may have to record additional reserves or write-offs on certain sales transactions in the future. Factors impacting the allowance include the level of gross receivables, the financial condition of our customers and the extent to which balances are covered by credit insurance or letters of credit. The amount of our cumulative bad debt charges over the last three fiscal years has not been significant. As a result of our low bad debt experience, our allowance for doubtful accounts receivable has ranged between 0.1% and 0.4% during fiscal years 2014 and 2013. As of
January 26, 2014
, our allowance for doubtful accounts receivable represented 0.2% of our gross accounts receivable balance.
Inventories
Inventory cost is computed on an adjusted standard basis, which approximates actual cost on an average or first-in, first-out basis. Inventory costs consist primarily of the cost of semiconductors purchased from subcontractors, including wafer fabrication, assembly, testing and packaging, manufacturing support costs, including labor and overhead associated with such purchases, final test yield fallout, and shipping costs, as well as the cost of purchased memory products and other component parts. We charge cost of sales for inventory provisions to write down our inventory to the lower of cost or estimated market value or to completely write off obsolete or excess inventory. Most of our inventory provisions relate to the write-off of excess quantities of products, based on our inventory levels and future product purchase commitments compared to assumptions about future demand and market conditions. Once inventory has been written-off or written-down, it creates a new cost basis for the inventory that is not subsequently written-up.
Situations that may result in excess or obsolete inventory include changes in business and economic conditions, changes in consumer confidence caused by changes in market conditions, sudden and significant decreases in demand for our products, inventory obsolescence because of rapidly changing technology and customer requirements, failure to estimate customer demand properly for older products as newer products are introduced, or unexpected competitive pricing actions by our competition. In addition, cancellation or deferral of customer purchase orders could result in our holding excess inventory. Also, because we often sell a substantial portion of our products in the last month of each quarter, we may not be able to reduce our inventory purchase commitments in a timely manner in response to customer cancellations or deferrals.
Charges to cost of sales for inventory provisions totaled $50.1 million, $89.9 million and $53.0 million, unfavorably impacting our gross margin by 1.2%, 2.1% and 1.3%, in fiscal years 2014, 2013 and 2012, respectively. Sales of inventory that was previously written-off or written-down totaled $43.4 million, $53.7 million and $71.1 million, favorably impacting our gross margin by 1.1%, 1.3% and 1.8% in fiscal years 2014, 2013 and 2012, respectively. As a result, the overall net effect on our gross margin from charges to cost of sales for inventory provisions and sales of items previously written-off or written-down was a 0.1% unfavorable impact in fiscal year 2014, a 0.8% unfavorable impact in fiscal year 2013 and a 0.5% favorable impact in fiscal year 2012.
40
During fiscal years 2014, 2013 and 2012, the charges we took to cost of sales for inventory provisions were primarily related to the write-off of excess quantities of certain older generations of GPU and Tegra Processor products whose inventory levels were higher than our updated forecasts of future demand for those products. As a fabless semiconductor company, we must make commitments to purchase inventory based on forecasts of future customer demand. In doing so, we must account for our third-party manufacturers' lead times and constraints. We also adjust to other market factors, such as product offerings and pricing actions by our competitors, new product transitions, and macroeconomic conditions - all of which may impact demand for our products.
Please refer to the Gross Profit and Gross Margin discussion below in this Management's Discussion and Analysis for further discussion.
Warranty Liabilities
Cost of revenue includes the estimated cost of product warranties that are calculated at the point of revenue recognition. Under limited circumstances, we may offer an extended limited warranty to customers for certain products. Our products are complex and may contain defects or experience failures due to any number of issues in design, fabrication, packaging, materials and/or use within a system. If any of our products or technologies contains a defect, compatibility issue or other error, we may have to invest additional research and development efforts to find and correct the issue. In addition, an error or defect in new products or releases or related software drivers after commencement of commercial shipments could result in failure to achieve market acceptance or loss of design wins. Also, we may be required to reimburse customers, including our customers’ costs to repair or replace products in the field.
Income Taxes
We recognize federal, state and foreign current tax liabilities or assets based on our estimate of taxes payable or refundable in the current fiscal year by tax jurisdiction. We recognize federal, state and foreign deferred tax assets or liabilities, as appropriate, for our estimate of future tax effects attributable to temporary differences and carryforwards; and we record a valuation allowance to reduce any deferred tax assets by the amount of any tax benefits that, based on available evidence and judgment, are not expected to be realized.
United States income tax has not been provided on a portion of earnings of our non-U.S. subsidiaries to the extent that such earnings are considered to be indefinitely reinvested.
Our calculation of current and deferred tax assets and liabilities is based on certain estimates and judgments and involves dealing with uncertainties in the application of complex tax laws. Our estimates of current and deferred tax assets and liabilities may change based, in part, on added certainty or finality to an anticipated outcome, changes in accounting standards or tax laws in the United States, or foreign jurisdictions where we operate, or changes in other facts or circumstances. In addition, we recognize liabilities for potential United States and foreign income tax contingencies based on our estimate of whether, and the extent to which, additional taxes may be due. If we determine that payment of these amounts is unnecessary or if the recorded tax liability is less than our current assessment, we may be required to recognize an income tax benefit or additional income tax expense in our financial statements, accordingly.
As of January 26, 2014, we had a valuation allowance of $244.5 million related to state and certain foreign deferred tax assets that management determined are not likely to be realized due, in part, to projections of future taxable income and potential utilization limitations of tax attributes acquired as a result of stock ownership changes. To the extent realization of the deferred tax assets becomes more-likely-than-not, we would recognize such deferred tax asset as an income tax benefit during the period.
Our deferred tax assets do not include the excess tax benefit related to stock-based compensation that are a component of our federal and state net operating loss and research tax credit carryforwards in the amount of $427.9 million as of January 26, 2014. Consistent with prior years, the excess tax benefit reflected in our net operating loss and research tax credit carryforwards will be accounted for as a credit to stockholders' equity, if and when realized. In determining if and when excess tax benefits have been realized, we have elected to utilize the with-and-without approach with respect to such excess tax benefits. We have also elected to ignore the indirect tax effects of stock-based compensation deductions for financial and accounting reporting purposes, and specifically to recognize the full effect of the research tax credit in income from operations.
We recognize the benefit from a tax position only if it is more-likely-than-not that the position would be sustained upon audit based solely on the technical merits of the tax position. Our policy is to include interest and penalties related to unrecognized tax benefits as a component of income tax expense. Please refer to
Note 13
of the Notes to the Consolidated Financial Statements in Part IV, Item 15 of this Annual Report on Form 10-K for additional information.
41
Goodwill
Goodwill is subject to our annual impairment test during the fourth quarter of our fiscal year, or earlier if indicators of potential impairment exist, using either a qualitative or a quantitative assessment. Our impairment review process compares the fair value of the reporting unit in which the goodwill resides to its carrying value. We have identified three reporting units, GPU, Professional Solutions and Tegra Processor, for the purposes of completing our goodwill analysis. Goodwill assigned to these reporting units as of January 26, 2014 was $135.3 million, $95.1 million and
$412.8 million
, respectively. Determining the number of reporting units and the fair value of a reporting unit requires us to make judgments and involves the use of significant estimates and assumptions. We also make judgments and assumptions in allocating assets and liabilities to each of our reporting units. We base our fair value estimates on assumptions we believe to be reasonable but that are unpredictable and inherently uncertain.
Both a qualitative and quantitative approach are applicable accounting standards for the assessment of goodwill impairment. With the qualitative approach to testing goodwill for impairment, we perform an analysis evaluating factors including, but not limited to, macro-economic conditions, market and industry conditions, the competitive environment, the operational stability and overall financial performance of the reporting units, including cost factors and actual revenue results. For reporting units in which the qualitative assessment concludes it is more likely than not that the fair value is more than its carrying value, no further goodwill impairment testing is required.
For those reporting units where a significant change or event has occurred, where potential impairment indicators exist, or for which we have not performed a quantitative assessment recently, we utilize a two-step quantitative assessment to testing goodwill for impairment. The first step tests for possible impairment by applying a fair value-based test. The second step, if necessary, measures the amount of such impairment by applying fair value-based tests to individual assets and liabilities. We estimated the fair value of reporting units by weighing the results from the income approach and the market approach. These valuation approaches consider a number of factors that include, but are not limited to, prospective financial information, growth rates, terminal or residual values, discount rates and comparable multiples from publicly traded companies in our industry and require us to make certain assumptions and estimates regarding industry economic factors and the future profitability of our business.
When performing an income approach valuation, we incorporate the use of projected financial information and a discount rate that are developed using market participant based assumptions to our discounted cash flow model. Our estimates of discounted cash flow were based upon, among other things, certain assumptions about our expected future operating performance, such as revenue growth rates, operating margins, risk-adjusted discount rates, and future economic and market conditions. Our estimates may differ from actual cash flow due to, among other things, economic conditions, changes to our business model or changes in operating performance. Additionally, certain estimates of discounted cash flow involve businesses with limited financial history and developing revenue models, which increases the risk of differences between the projected and actual performance. The long-term financial forecasts that we utilize represent the best estimate that we have at this time and we believe that its underlying assumptions are reasonable. Significant differences between our estimates and actual cash flow could materially affect our future financial results, which could impact our future estimates of the fair value of our reporting unit.
During the fourth quarter of fiscal year 2014, we utilized a quantitative assessment to test goodwill impairment for all three reporting units and concluded that there was no impairment, as the fair value of our GPU and Professional Solutions reporting units significantly exceeded their carrying values and the fair value of our Tegra Processor reporting unit exceeded its carrying value by 17%. As such, even if we applied a hypothetical 10% decrease to the fair value of each reporting unit, it still would not have resulted in the fair value of our reporting units being less than their carrying values. As an overall test of the reasonableness of estimated fair values of reporting units, we reconciled the combined fair value estimates of our reporting units to our market capitalization as of the valuation date of October 27, 2013. The reconciliation confirmed that the fair values were relatively representative of the market views when applying a reasonable control premium to the market capitalization. However, any significant reductions in the actual amount of future cash flows realized by our reporting units, reductions in the value of market comparables, or reductions in our market capitalization could impact future estimates of the fair values of our reporting units. Such events could ultimately result in a charge to our earnings in future periods due to the potential for a write-down of the goodwill associated with our reporting units.
42
In particular, the fair value of our Tegra reporting unit exceeded its carrying value by approximately 17%. The fair value of this reporting unit was assessed using a combination of income and market approaches. The underlying assumptions we used in assessing the fair value of the Tegra reporting unit include, but are not limited to, assumptions around future revenue growth rates, gross margins, operating expense investment levels, overall market growth rates, our market share of the overall market, and the appropriate discount rates to apply to future cash flows. If the actual future results of the Tegra reporting unit do not achieve the levels we estimated in assessing its fair value, the fair value of the Tegra reporting unit could decline. A future decline in the fair value of the Tegra reporting unit could result a charge to our earnings as a result of a write-down of the value of the goodwill associated with that reporting unit.
Our next annual evaluation of the goodwill by reporting unit will be performed during the fourth quarter of fiscal year 2015, or earlier if indicators of potential impairment exist. Such indicators include, but are not limited to, challenging economic conditions, such as a decline in our operating results, an unfavorable industry or macroeconomic environment, a substantial decline in our stock price, or any other adverse change in market conditions. Such conditions could have the effect of changing one of the critical assumptions or estimates we use to calculate the fair value of our reporting units, which could result in a decrease in fair value and require us to record goodwill impairment charges.
Cash Equivalents and Marketable Securities
Cash equivalents consist of financial instruments which are readily convertible into cash and have original maturities of three months or less at the time of acquisition. Marketable securities consist primarily of highly liquid investments with maturities of greater than three months when purchased. We generally classify our marketable securities at the date of acquisition as available- for- sale. These securities are reported at fair value with the related unrealized gains and losses included in accumulated other comprehensive income (loss), a component of stockholder’s equity, net of tax. Any unrealized losses which are considered to be other-than-temporary impairments are recorded in the other income (expense) section of our consolidated statements of operations. Realized gains (losses) on the sale of marketable securities are determined using the specific-identification method and recorded in the other income (expense) section of our consolidated statements of operations. Please refer to
Note 7
of the Notes to the Consolidated Financial Statements in Part IV, Item 15 of this Annual Report on Form 10-K. We measure our cash equivalents and marketable securities at fair value. The fair values of our financial assets and liabilities are determined using quoted market prices of identical assets or quoted market prices of similar assets from active markets. Our Level 1 assets consist of our money market funds. We classify securities within Level 1 assets when the fair value is obtained from real time quotes for transactions in active exchange markets involving identical assets. Our available-for- sale securities are classified as having Level 2 inputs. Our Level 2 assets are valued utilizing a market approach where the market prices of similar assets are provided by a variety of independent industry standard data providers to our investment custodian. Most of our cash equivalents and marketable securities are valued based on Level 2 inputs. We do not have any investments classified as Level 3 as of
January 26, 2014
.
All of our available-for-sale investments are subject to a periodic impairment review. We record a charge to earnings when a decline in fair value is significantly below cost basis and judged to be other-than-temporary, or have other indicators of impairments. If the fair value of an available-for-sale debt instrument is less than its amortized cost basis, an other-than - temporary impairment is triggered in circumstances where (1) we intend to sell the instrument, (2) it is more likely than not that we will be required to sell the instrument before recovery of its amortized cost basis, or (3) a credit loss exists where we do not expect to recover the entire amortized cost basis of the instrument. If we intend to sell or it is more likely than not that we will be required to sell the available-for-sale debt instrument before recovery of its amortized cost basis, we recognize an other-than- temporary impairment in earnings equal to the entire difference between the debt instruments’ amortized cost basis and its fair value. For available-for-sale debt instruments that are considered other-than-temporarily impaired due to the existence of a credit loss, if we do not intend to sell and it is more likely than not that we will be required to sell the instrument before recovery of its remaining amortized cost basis (amortized cost basis less any current-period credit loss), we separate the amount of the impairment into the amount that is credit related and the amount due to all other factors. The credit loss component is recognized in earnings.
Stock-based Compensation
We measure stock-based compensation expense based on the estimated fair value of equity awards at the grant date, and recognize the expense using a straight-line attribution method over the requisite employee service period. We estimate the fair value of employee stock options on the date of grant using a binomial model. We use the closing trading price of our common stock on the date of grant, minus a dividend yield discount, as the fair value of awards of restricted stock units, or RSUs. The fair value of our employee stock purchase plan is calculated using the Black-Scholes model. Our stock-based compensation for employee stock purchase plan is expensed using an accelerated amortization model.
43
We determine the fair value of stock option awards on the date of grant using an option-pricing model that is affected by our stock price as well as assumptions regarding a number of highly complex and subjective variables. These variables include, but are not limited to, weighted average expected term, risk-free interest rate, expected stock price volatility, dividend yield, actual and projected employee stock option exercise behaviors, vesting schedules and death and disability probabilities We also segregate options into groups of employees with relatively homogeneous exercise behavior in order to calculate the best estimate of fair value using the binomial valuation model.
The expected life of employee stock options is a derived output of our valuation model and is impacted by the underlying assumptions of our company. The risk-free interest rate assumption is based upon observed interest rates on Treasury bills appropriate for the term of our employee stock options. Our management has determined that the use of implied volatility is expected to be more reflective of market conditions and, therefore, can reasonably be expected to be a better indicator of our expected volatility than historical volatility. Dividend yield is based on history and expectation of dividend payouts.
Our RSU awards are not eligible for cash dividends prior to vesting; therefore, the fair value of RSUs is discounted by the dividend yield. Additionally, for employee stock option and RSU awards, we estimate forfeitures annually and revise the estimates of forfeiture in subsequent periods if actual forfeitures differ from those estimates. Forfeitures are estimated based on historical experience. If factors change and we employ different assumptions in the application of accounting standards in future periods, the compensation expense that we record under these accounting standards may differ significantly from what we have recorded in the current period.
Using the binomial model, we estimated the fair value of the stock options granted under our stock option plans using the following assumptions during fiscal year
2014
:
|
Weighted average expected life (in years)
|
2.4-3.5
|
|
Risk-free interest rate
|
1.8%-3.0%
|
|
Volatility
|
28%-37%
|
|
Dividend yield
|
1.9%-2.4%
|
We used the Black-Scholes model to estimate the fair value of shares issued under our ESPP during fiscal year
2014
, using the following assumptions:
|
Weighted average expected life (in years)
|
0.5-2.0
|
|
Risk-free interest rate
|
0.1%-0.4%
|
|
Volatility
|
32%-37%
|
|
Dividend yield
|
2.0%-2.4%
|
Litigation, Investigation and Settlement Costs
From time to time, we are involved in legal actions and/or investigations by regulatory bodies. We are aggressively defending our current litigation matters. However, there are many uncertainties associated with any litigation or investigations, and we cannot be certain that these actions or other third-party claims against us will be resolved without costly litigation, fines and/or substantial settlement payments. If that occurs, our business, financial condition and results of operations could be materially and adversely affected. If information becomes available that causes us to determine that a loss in any of our pending litigation, investigations or settlements is probable, and we can reasonably estimate the loss associated with such events, we will record the loss in accordance with U.S. GAAP. However, the actual liability in any such litigation or investigation may be materially different from our estimates, which could require us to record additional costs.
44
Results of Operations
The following table sets forth, for the periods indicated, certain items in our consolidated statements of operations expressed as a percentage of revenue.
|
|
Year Ended
|
|||||||
|
|
January 26, 2014
|
January 27, 2013
|
January 29, 2012
|
|||||
|
Revenue
|
100.0
|
%
|
100.0
|
%
|
100.0
|
%
|
||
|
Cost of revenue
|
45.1
|
|
48.0
|
|
48.6
|
|
||
|
Gross profit
|
54.9
|
|
52.0
|
|
51.4
|
|
||
|
Operating expenses:
|
|
|
|
|||||
|
Research and development
|
32.3
|
|
26.8
|
|
25.1
|
|
||
|
Sales, general and administrative
|
10.5
|
|
10.1
|
|
10.1
|
|
||
|
Total operating expenses
|
42.8
|
|
36.9
|
|
35.2
|
|
||
|
Income from operations
|
12.1
|
|
15.1
|
|
16.2
|
|
||
|
Interest income
|
0.4
|
|
0.5
|
|
0.5
|
|
||
|
Interest expense
|
(0.3
|
)
|
(0.1
|
)
|
(0.1
|
)
|
||
|
Other income (expense), net
|
0.2
|
|
(0.1
|
)
|
—
|
|
||
|
Income before income taxes
|
12.4
|
|
15.4
|
|
16.6
|
|
||
|
Income tax expense
|
1.7
|
|
2.3
|
|
2.1
|
|
||
|
Net income
|
10.7
|
%
|
13.1
|
%
|
14.5
|
%
|
||
Fiscal Years Ended January 26, 2014, January 27, 2013, and January 29, 2012
Revenue
Fiscal Year 2014 vs. Fiscal Year 2013
Revenue was
$4.13 billion
for
fiscal year 2014
and
$4.28 billion
for
fiscal year 2013
, a decrease of
4%
. A discussion of our revenue results for each of our reporting segments and the other category is as follows:
GPU Business.
GPU business revenue for
fiscal year 2014
increased by
7%
to
$3.47 billion
when compared to
$3.25 billion
for
fiscal year 2013
. This growth was largely attributable to strength in our high-end GeForce GTX GPUs which grew 18% driven by gaming market segment demand. The GPU business also benefited from a 37% increase in Tesla high-performance computing revenue and a 10% increase in Quadro workstation revenue in fiscal year 2014. Offsetting these growth areas were declines in the overall market for desktop PCs and notebooks, which contributed to lower unit volumes of our mainstream GeForce GPUs.
Tegra Processor Business.
Tegra Processor business revenue decreased by
48%
to
$398.0 million
for
fiscal year 2014
as compared to
$764.4 million
for
fiscal year 2013
. This decrease was primarily due to lower sales of our previous generation Tegra 3-based products for smartphones and tablet devices. Additionally, sales of our embedded products for entertainment devices and revenue from license fees related to game consoles also decreased during fiscal year 2014. These decreases were partially offset by the sales of Tegra 4-based products for smartphones and tablet devices as well as infotainment systems for automobiles.
All Other.
License revenue from the patent cross licensing arrangement we entered into with Intel in January 2011 was flat at $264.0 million between fiscal years 2014 and 2013.
45
Fiscal Year 2013 vs. Fiscal Year 2012
Revenue was $4.28 billion for fiscal year 2013 and $4.00 billion for fiscal year 2012, an increase of 7%. A discussion of our revenue results for each of our reporting segments and the other category is as follows:
GPU Business.
GPU business revenue of $3.25 billion for fiscal year 2013 increased by 2% compared to $3.19 billion for fiscal year 2012. This growth was largely attributable to the introduction of GPUs based on our Kepler architecture in fiscal year 2013. GeForce notebook revenues increased on the strength of Kepler-based design wins on the Ivy Bridge platform. Strong demand for Kepler-based GeForce desktop GPU products also contributed to the increase in GPU business revenues. The GPU business also benefited from a greater than 36% increase in Tesla revenue in fiscal year 2013. Offsetting these increases were a decrease in Quadro revenue, which we believe was due primarily to general weakness in Western Europe, and a continued decline in sales of our MCP products as we continued to phase out our chipset product line.
Tegra Processor Busines
s. Tegra Processor business revenue increased by 29% to $764.4 million for fiscal year 2013 as compared to $591.2 million for fiscal year 2012. This increase was primarily due to higher sales of our Tegra 3-based smartphones and tablet devices as we transitioned from the previous generation Tegra 2-based products and introduced our Tegra-3 based processors in Windows RT-based tablet devices. Additionally, revenues for our embedded products for entertainment and automotive devices also increased during fiscal year 2013. Offsetting these increases was a decrease in revenue from license fees and other revenue related to game consoles.
All Other
. The increase in revenue is also due to revenue from the patent cross licensing arrangement we entered into with Intel in January 2011. We recognized $264.0 million in related licensing revenue during the entire twelve months of fiscal year 2013, while fiscal year 2012 only included $220.0 million in related revenue - reflecting only ten months of the corresponding revenue.
Concentration of Revenue
We generated
75%
, 74% and 78% of our total revenue for fiscal years
2014
, 2013 and 2012, respectively, from sales to customers outside the United States and other Americas. Revenue by geographic region is allocated to individual countries based on the location to which the products are initially billed even if the foreign contract equipment manufacturers, add-in board and motherboard manufacturers’ revenue is attributable to end customers in a different location.
Revenue from significant customers, those representing 10% or more of total revenue for the respective dates, is summarized as follows:
|
|
Year Ended
|
|||||||
|
|
January 26,
2014 |
January 27,
2013
|
January 29,
2012
|
|||||
|
Revenue:
|
|
|
|
|||||
|
Customer A
|
11
|
%
|
13
|
%
|
11
|
%
|
||
|
Customer B
|
10
|
%
|
9
|
%
|
7
|
%
|
||
Gross Profit and Gross Margin
Gross profit consists of total revenue, net of allowances, less cost of revenue. Cost of revenue consists primarily of the cost of semiconductors purchased from subcontractors, including wafer fabrication, assembly, testing and packaging, manufacturing support costs, including labor and overhead associated with such purchases, final test yield fallout, inventory and warranty provisions and shipping costs. Cost of revenue also includes development costs for license, service arrangements and stock-based compensation related to personnel associated with manufacturing.
Gross margin is the percentage of gross profit to revenue. Our gross margin was 54.9%, 52.0% and 51.4% for fiscal years 2014, 2013 and 2012, respectively. Our gross margin is significantly impacted by the mix of products we sell and can vary in any period depending on that product mix.
46
A discussion of our gross margin results for each of our reporting segments is as follows:
Fiscal Year 2014 vs. Fiscal Year 2013
Our gross margin increased to
54.9%
in
fiscal year 2014
from
52.0%
in
fiscal year 2013
. The improvement in gross margin was driven primarily by a combination of increased unit sales and a richer product mix of our high-end GeForce GTX GPU, Tesla high performance computing, and Quadro professional workstation products. The lower sales unit volumes of our lower margin mainstream GPUs and Tegra processors also contributed to the gross margin increase. Gross margin also improved due to the favorable impact of lower net inventory provisions in fiscal year 2014 compared to fiscal year 2013.
Charges to cost of sales for inventory provisions totaled $50.1 million and $89.9 million for fiscal years 2014 and 2013, unfavorably impacting our gross margin by 1.2% and 2.1%, respectively. Sales of inventory that was previously written-off or written-down totaled $43.4 million and $53.7 million for fiscal years 2014 and 2013, favorably impacting our gross margin by 1.1% and 1.3%, respectively. As a result, the overall net effect on our gross margin from inventory provisions and sales of items previously written down was an unfavorable impact of 0.1% and 0.8% in fiscal years 2014 and 2013, respectively.
GPU Business
. The gross margin of our GPU business increased during fiscal year 2014 when compared to fiscal year 2013. This was primarily due to a combination of increased unit sales and a richer product mix of our high-end GeForce GTX GPU, Tesla high performance computing, and Quadro professional workstation products. Lower inventory provisions for excess inventory in fiscal year 2014 also contributed to the increase in gross margin.
Tegra Processor Business.
The gross margin of our Tegra Processor business decreased during fiscal year 2014 when compared to fiscal year 2013. This decrease was driven primarily by a combination of an overall decline in margins of our Tegra products and a less rich mix between tablet products, which have had higher gross margins, and smartphone and automotive module products, which have had comparably lower gross margins.
Fiscal Year 2013 vs. Fiscal Year 2012
Our gross margin increased to 52.0% in fiscal year 2013 from 51.4% in fiscal year 2012. The improvement in gross margin was driven primarily by increased unit sales and a richer product mix of our high-end GeForce desktop products, plus Tesla and Quadro products. The addition of a full year of revenue from the patent cross licensing arrangement with Intel compared to ten months of such corresponding revenue in fiscal year 2012 also contributed to the improvement in gross margin. Offsetting these were the unfavorable impact of higher net provisions for inventory in fiscal year 2013 when compared to fiscal year 2012.
Charges to cost of sales for inventory provisions totaled $89.9 million and $53.0 million for fiscal years 2013 and 2012, unfavorably impacting our gross margin by 2.1% and 1.3%, respectively. Sales of inventory that was previously written-off or written down totaled $53.7 million and $71.1 million for fiscal years 2013 and 2012, favorably impacting our gross margin by 1.3% and 1.8%, respectively. As a result, the overall net effect on our gross margin from inventory provisions and sales of items previously written down was a 0.8% unfavorable impact in fiscal year 2013 and a 0.5% favorable impact in fiscal year 2012.
GPU Business
. The gross margin of our GPU business increased during fiscal year 2013 when compared to fiscal year 2012. This was primarily due to a richer product mix of our Kepler-based high-end 28 nanometer GeForce desktop products and our Quadro products. Memory margins strengthened on improved market pricing. These favorable contributors to gross margin were primarily offset by higher net inventory provisions in fiscal year 2013 compared to fiscal year 2012.
Tegra Processor Business.
The gross margin of our Tegra Processor business decreased slightly during fiscal year 2013 as compared to fiscal year 2012. This decrease was the result of a change in product mix driven by a lower mix of revenue from areas such as license fees and other revenues related to game consoles, which typically have higher gross margins than our Tegra products, offset by a higher mix of revenue from sales of our Tegra products, which grew substantially during the year.
47
Operating Expenses
|
|
Year Ended
|
Year Ended
|
|||||||||||||||||||||||||||
|
|
January 26,
2014 |
January 27,
2013 |
$
Change
|
%
Change
|
January 27,
2013 |
January 29,
2012 |
$
Change
|
%
Change
|
|||||||||||||||||||||
|
|
(In millions)
|
(In millions)
|
|||||||||||||||||||||||||||
|
Research and development expenses
|
$
|
1,335.8
|
|
$
|
1,147.3
|
|
$
|
188.5
|
|
16.4
|
%
|
$
|
1,147.3
|
|
$
|
1,002.6
|
|
$
|
144.7
|
|
14.4
|
%
|
|||||||
|
Sales, general and administrative expenses
|
435.7
|
|
430.8
|
|
4.9
|
|
1.1
|
%
|
430.8
|
|
405.6
|
|
25.2
|
|
6.2
|
%
|
|||||||||||||
|
Total operating expenses
|
$
|
1,771.5
|
|
$
|
1,578.1
|
|
$
|
193.4
|
|
12.3
|
%
|
$
|
1,578.1
|
|
$
|
1,408.2
|
|
$
|
169.9
|
|
12.1
|
%
|
|||||||
|
Research and development as a percentage of net revenue
|
32.3
|
%
|
26.8
|
%
|
|
|
26.8
|
%
|
25.1
|
%
|
|
|
|||||||||||||||||
|
Sales, general and administrative as a percentage of net revenue
|
10.5
|
%
|
10.1
|
%
|
|
|
10.1
|
%
|
10.1
|
%
|
|
|
|||||||||||||||||
Research and Development
Fiscal Year 2014 vs. Fiscal Year 2013
Research and development expenses increased by
$188.5 million
, or
16%
, year over year. This increase was primarily due to a $101.9 million increase in compensation and benefits expense due to increased hiring of engineering talent. The growth in engineering employees also drove an increase in facilities and IT support expense of $34.6 million, purchases of computer and software supplies of $14.1 million and depreciation and amortization of $11.0 million. In addition, engineering development expenses increased by $23.2 million, primarily related to the ramp up of our next generation Tegra products.
Fiscal Year 2013 vs. Fiscal Year 2012
Research and development expenses increased by $144.7 million, or 14%, year over year. This increase was primarily due to a $99.4 million increase in compensation and benefits expense as we continue to hire engineering talent to invest in our business. Depreciation and amortization increased by $9.8 million, driven primarily by amortization of intangible assets associated with our acquisition of Icera in fiscal year 2012, as well as purchases of additional hardware and licenses during the year. Engineering development expenses increased by $6.8 million related to the ramp of our next-generation GPU architecture, Kepler, designed for 28nm technology and our next generation Tegra processor architecture, Tegra 4.
Sales, General and Administrative
Fiscal Year 2014 vs. Fiscal Year 2013
Sales, general and administrative expenses increased by $
4.9 million
, or
1%
, year over year. This increase was primarily due to a $37.9 million increase in compensation and benefits expense due to increased hiring. Offsetting this increase were the absence of both a $20.1 million charge for a charitable contribution and a charge of $3.1 million for a class action settlement that we recorded in the prior fiscal year.
Fiscal Year 2013 vs. Fiscal Year 2012
Sales, general and administrative expenses increased by $25.2 million, or 6%, year over year. This increase was primarily due to a $21.6 million increase in compensation and benefits expense as we continue to invest in our business. Also contributing to the increase was a $20.1 million expense for the net present value of a charitable contribution that we recorded in the second quarter of fiscal year 2013. Offsetting these increases were decreases in outside professional fees of $10.4 million due to an overall decrease in professional services costs during fiscal year 2013 compared with fiscal year 2012 due to a general decline in litigation-related costs and the absence of services associated with acquisition activity in fiscal year 2013.
48
Interest Income and Interest Expense
Interest income consists of interest earned on cash, cash equivalents and marketable securities. Interest expense is primarily comprised of coupon interest and debt discount amortization related to the convertible notes issued in the fourth quarter of fiscal year 2014.
Interest income was
$17.1 million
,
$19.9 million
and
$19.1 million
in fiscal years 2014, 2013 and 2012, respectively. The decrease in fiscal year 2014 from the prior year was primarily due to the result of lower average cash balances as we liquidated a portion of our investment portfolio to fund an accelerated share repurchase transaction during the second quarter of fiscal year 2014.
Interest expense was
$10.4 million
,
$3.3 million
, and
$3.1 million
in fiscal years 2014, 2013 and 2012, respectively. The increase from prior year is attributable to $2.5 million for coupon interest and $4.6 million for debt discount amortization related to the convertible notes. We expect to incur annual coupon interest expense of $15.0 million, and annual debt discount amortization of $28.0 million, for fiscal year 2015.
Other Income and Expense
Other income and expense primarily consists of realized gains and losses from the sale of marketable securities, sale of investment in non-affiliated companies, and the impact of changes in foreign currency rates. Net other income (expense) was $
7.4 million
, $
(2.8) million
and $
(1.0) million
in fiscal years
2014
,
2013
and
2012
, respectively. The increase in other income for fiscal year 2014 was primarily due to an increase in gains from foreign currency remeasurements and a gain of $3.1 million from sale of a non-affiliated investment.
Income Taxes
We recognized income tax expense of $
70.3 million
, $
99.5 million
and $
82.3 million
during fiscal years
2014
,
2013
and
2012
, respectively. Income tax expense as a percentage of income before taxes, or our annual effective tax rate, was
13.8%
,
15.0%
, and
12.4%
in fiscal years
2014
,
2013
and
2012
, respectively.
Our effective tax rate on income or loss before tax for the fiscal years was lower than the United States federal statutory rate of
35%
due to income or loss earned in jurisdictions, including British Virgin Islands, Hong Kong, China, Taiwan and United Kingdom, where the tax rate is lower than the United States federal statutory tax rate of
35%
, favorable recognition in these fiscal years of the U.S. federal R&D tax credit and release of tax reserves as a result of the expiration of statutes of limitations in certain non-U.S. jurisdictions for which we had not previously recognized related tax benefits.
Please refer to
Note 13
of the Notes to the Consolidated Financial Statements in Part IV, Item 15 of this Annual Report on Form 10-K for additional information.
Liquidity and Capital Resources
|
|
January 26, 2014
|
January 27, 2013
|
|||||
|
|
(In millions)
|
||||||
|
Cash and cash equivalents
|
$
|
1,151.6
|
|
$
|
732.8
|
|
|
|
Marketable securities
|
3,520.2
|
|
2,995.1
|
|
|||
|
Cash, cash equivalents, and marketable securities
|
$
|
4,671.8
|
|
$
|
3,727.9
|
|
|
|
|
Year Ended
|
||||||||||
|
January 26,
2014 |
January 27,
2013 |
January 29,
2012 |
|||||||||
|
|
(In millions)
|
||||||||||
|
Net cash provided by operating activities
|
$
|
835.1
|
|
$
|
824.2
|
|
$
|
909.2
|
|
||
|
Net cash used in investing activities
|
$
|
(805.9
|
)
|
$
|
(744.0
|
)
|
$
|
(1,143.4
|
)
|
||
|
Net cash (used in) provided by financing activities
|
$
|
389.6
|
|
$
|
(15.3
|
)
|
$
|
236.7
|
|
||
49
As of
January 26, 2014
, we had
$4.67 billion
in cash, cash equivalents and marketable securities, an increase of
$943.9 million
from the end of fiscal year
2013
. Our portfolio of cash equivalents and marketable securities is managed on our behalf by several financial institutions which are required to follow our investment policy, which requires the purchase of high grade investment securities, the diversification of asset types and includes certain limits on our portfolio duration.
Operating activities
Operating activities consist primarily of net income or loss for the fiscal period, offset by the impact of non-cash expenses such as stock-based compensation and depreciation and amortization expense, and changes in operating assets and liabilities such as accounts receivable and inventories.
Cash provided by operating activities increased slightly in fiscal year 2014 compared to fiscal year 2013 primarily due to favorable changes in operating assets offset by a decrease in net income. The favorable change in operating assets was driven mainly by a combination of a decrease in accounts receivable, resulting from strong collections and linear monthly shipments in the fourth quarter of fiscal year 2014, and a decrease in inventories.
Cash provided by operating activities decreased in fiscal year 2013 compared to fiscal year 2012 primarily due to a decrease in net income and unfavorable changes in operating assets compared to fiscal year 2012. For example, accounts receivable increased primarily due to higher sales in the fourth quarter of fiscal year 2013 compared to the fourth quarter of fiscal year 2012 and inventory increased as a result of the production ramp of Kepler-based GPU products.
Investing activities
Investing activities consist primarily of purchases, sales and maturities of marketable securities, acquisitions of businesses and purchases of property and equipment, including leasehold improvements for our facilities and intangible assets.
Cash used in investing activities for fiscal year 2014 increased from fiscal year 2013 driven primarily by capital expenditures in fiscal year 2014 for new technology licenses and leasehold improvements at our facilities in various locations.
Cash used in investing activities for fiscal year 2013 decreased from fiscal year 2012 due primarily to the acquisition of Icera in fiscal year 2012. We used $183.3 million towards capital expenditures in fiscal year 2013 mainly for the purchase of new research and development equipment, testing equipment to support our increased production requirements, technology licenses, software, intangible assets and leasehold improvements at our facilities in various locations.
Financing activities
Financing activities consist primarily of borrowing activities, such as convertible debt issuances or capital leases, and equity-related activities such as stock repurchases and dividend payments.
Cash provided by financing activities increased in fiscal year 2014 due primarily to the net proceeds of $1.48 billion we received from the convertible note offering that was completed during the fourth quarter of fiscal year 2014 as well as cash proceeds of
$70.2 million
from common stock issued under our employee stock plans. Concurrent with the convertible note offering, we used net proceeds of $108 million to fund the related note hedge and warrant transactions. During fiscal year 2014, we also used $887.3 million to repurchase shares of our common stock and paid $181.3 million of cash dividends to shareholders.
Cash used in financing activities in fiscal year 2013 was due primarily to our repurchase of $100.0 million of shares of our common stock and our first quarterly cash dividend payment of $46.9 million. These uses of cash were offset by cash proceeds of $64.9 million from common stock issued under our employee stock plans and a non-cash tax benefit of $68.7 million related to employee stock-based compensation.
Liquidity
Our primary source of liquidity is cash generated by our operations. Our investment portfolio consisted of cash and cash equivalents, commercial paper, mortgage-backed securities issued by government-sponsored enterprises, money market funds and debt securities of corporations, municipalities and the United States government and its agencies. These investments are denominated in United States dollars. As of
January 26, 2014
, we did not have any investments in auction-rate preferred securities.
50
All of the cash equivalents and marketable securities are treated as “available-for-sale”. Investments in both fixed and floating rate interest earning instruments carry a degree of interest rate risk. Fixed rate debt securities may have their market value adversely impacted due to a rise in interest rates, while floating rate securities may produce less income than expected if interest rates fall. Due in part to these factors, our future investment income may fall short of expectations due to changes in interest rates or if the decline in fair value of our publicly traded debt or equity investments is judged to be other-than-temporary. We may suffer losses in principal if we are forced to sell securities that decline in market value due to changes in interest rates. However, because any debt securities we hold are classified as “available-for-sale,” no gains or losses are realized in our statement of income due to changes in interest rates unless such securities are sold prior to maturity or unless declines in market values are determined to be other-than-temporary. These securities are reported at fair value with the related unrealized gains and losses included in accumulated other comprehensive income, a component of stockholders’ equity, net of tax.
As of
January 26, 2014
and
January 27, 2013
, we had $
4.67 billion
and $
3.73 billion
, respectively, in cash, cash equivalents and marketable securities. Our investment policy requires the purchase of high grade investment securities, the diversification of asset types and includes certain limits on our portfolio duration, as specified in our investment policy guidelines. These guidelines also limit the amount of credit exposure to any one issue, issuer or type of instrument. As of
January 26, 2014
, we were in compliance with our investment policy. As of
January 26, 2014
, our investments in U.S. government agencies and U.S. government sponsored enterprises represented approximately
42%
of our total investment portfolio, while the financial sector accounted for approximately
27%
of our total investment portfolio. Substantially all of our investments are with A/A3 or better rated securities.
We performed an impairment review of our investment portfolio as of
January 26, 2014
. Based on our quarterly impairment review, we concluded that our investments were appropriately valued and did not record any impairment during fiscal year
2014
.
Net realized gains were $
2.4 million
, $
0.5 million
and $
0.4 million
for fiscal years
2014
,
2013
and
2012
, respectively. As of
January 26, 2014
, we had a net unrealized gain of $
4.8 million
, which was comprised of gross unrealized gains of $
7.2 million
, offset by $
2.4 million
of gross unrealized losses. As of
January 27, 2013
, we had a net unrealized gain of $
10.9 million
, which was comprised of gross unrealized gains of
$11.7 million
, offset by $
0.8 million
of gross unrealized losses.
Our accounts receivable are highly concentrated.
One
customer accounted for approximately
23%
of our accounts receivable balance at
January 26, 2014
. We maintain an allowance for doubtful accounts for estimated losses resulting from the inability of our customers to make required payments. This allowance consists of an amount identified for specific customers and an amount based on overall estimated exposure. As of
January 26, 2014
, our allowance for doubtful accounts receivable was 0.2% of our gross accounts receivable balance.
Our cash balances are held in numerous locations throughout the world, including substantial amounts held outside of the United States. As of January 26, 2014, we had cash, cash equivalents and marketable securities of $2.06 billion held within the United States and $2.61 billion held outside of the United States. Most of the amounts held outside the United States may be repatriated to the United States but, under current law, would be subject to U.S. federal income taxes, less applicable foreign tax credits. Further, repatriation of some foreign balances may be restricted by local laws. As of January 26, 2014, we have not provided for U.S. federal and state income taxes on approximately $1.96 billion of undistributed earnings of non-United States subsidiaries, as such earnings are considered indefinitely reinvested outside the United States. Although we have no current need to do so, if we repatriate foreign earnings for cash requirements in the United States, we would incur U.S. federal and state income tax, less applicable foreign tax credits, and reduced by the current amount of our U.S. federal and state net operating loss and tax credit carryforwards. Further, in addition to the $2.06 billion of cash, cash equivalents and marketable securities held within the United States and available to fund our U.S. operations and any other U.S. cash needs, we have access to external sources of financing if cash is needed in the United States other than by repatriation of foreign earnings where U.S. income tax may otherwise be due. Accordingly, we do not reasonably expect any material effect on our business, as a whole, or to our financial flexibility with respect to our current cash balances held outside of the United States.
Convertible Notes
On December 2, 2013, we issued $1.5 billion of 1.00% Convertible Senior Notes, or the Notes, due in 2018 and concurrently entered into separate note hedge and warrant transactions and used $14.3 million to repurchase shares of our common stock from purchasers of the Notes in privately negotiated transactions. In addition to using the net proceeds to fund the transaction costs, note hedge and warrant transactions, we further intend to use the proceeds to repurchase of shares of our common stock and pay cash dividends pursuant to our recently announced fiscal year 2015 capital return program, and for general corporate purposes.
51
The Notes are unsecured, unsubordinated obligations of the Company, which pay interest in cash semi-annually at a rate of 1.00% per annum. The Notes will mature on December 1, 2018 unless earlier repurchased or converted in accordance with their terms prior to such date. As of January 26, 2014, none of the conditions allowing holders of the Notes to convert had been met and the Notes are therefore classified as a long-term liability on our consolidated balance sheets. Please refer to Note 11 of the Notes to the Consolidated Financial Statements in Part IV, Item 15 of this Annual Report on Form 10-K for further discussion.
Stock Repurchase Program
Our Board of Directors has authorized us to repurchase up to $3.7 billion of our common stock through January 2016. As of January 26, 2014, we had repurchased $2.45 billion of that amount, leaving up to $1.25 billion available under this authorization through January 2016. We have announced our intention to return $1.0 billion to shareholders in fiscal year 2015 in the form of share repurchases and dividends. As part of our capital return program, during February 2014 we entered into an accelerated share repurchase agreement to purchase $500.0 million in shares of our common stock. Please refer to
Note 14
of the Notes to the Consolidated Financial Statements in Part IV, Item 15 of this Annual Report on Form 10-K for further discussion regarding our stock repurchase program.
Cash Dividend Program
Prior to fiscal year 2013, we had never declared or paid any dividend on shares of our common stock. On November 8, 2012, we announced the initiation of a quarterly cash dividend program. This initial quarterly dividend of $0.075 per share was equivalent to $0.30 per share on an annual basis. On November 7, 2013, we increased our quarterly cash dividend by 13% to $0.085 per share which was equivalent to $0.34 per share on an annual basis. A subsequent cash dividend of $0.085 per share was declared on February 12, 2014, payable on March 20, 2014 to all common stockholders of record at the close of business on February 27, 2014.
In fiscal year 2014 and fiscal year 2013, we paid
$181.3 million
and
$46.9 million
, respectively, in dividends to our common stockholders.
Our cash dividend program and the payment of future cash dividends under that program are subject to continued capital availability and our Board of Directors' continuing determination that the dividend program and the declaration of dividends thereunder are in the best interests of our stockholders and are in compliance with all laws and agreements of NVIDIA applicable to the declaration and payment of cash dividends.
Operating Capital and Capital Expenditure Requirements
We believe that our existing cash balances and anticipated cash flows from operations will be sufficient to meet our operating, acquisition, stock repurchase, cash dividend and capital requirements for at least the next twelve months. However, there is no assurance that we will not need to raise additional equity or debt financing within this time frame. Additional financing may not be available on favorable terms or at all and may be dilutive to our then-current stockholders. We also may require additional capital for other purposes not presently contemplated. If we are unable to obtain sufficient capital, we could be required to curtail capital equipment purchases or research and development expenditures, which could harm our business. Factors that could affect our cash used or generated from operations and, as a result, our need to seek additional borrowings or capital include:
|
•
|
decreased demand and market acceptance for our products and/or our customers’ products;
|
|
•
|
inability to successfully develop and produce in volume production our next-generation products;
|
|
•
|
competitive pressures resulting in lower than expected average selling prices; and
|
|
•
|
new product announcements or product introductions by our competitors.
|
We expect to spend approximately $
150.0 million
to $
175.0 million
for capital expenditures during fiscal year 2015, primarily for leasehold improvements, emulation equipment, computers and engineering workstations.
For additional factors see “Item 1A. Risk Factors - Risks Related to Our Business, Industry and Partners -
Our revenue may fluctuate while a majority of our operating expenses are a factor of multi-year investments ahead of when revenue is received, which makes our results difficult to predict and could cause our results to fall short of expectations.
”
52
Contractual Obligations
The following table summarizes our contractual obligations as of
January 26, 2014
:
|
Payment Due By Period
|
|||||||||||||||||||||||
|
Contractual Obligations
|
Total
|
Less than 1 Year
|
1-3 Years
|
4-5 Years
|
More than 5 Years
|
All Other
|
|||||||||||||||||
|
|
(In thousands)
|
||||||||||||||||||||||
|
1.00% Convertible Senior Notes due 2018 (1)
|
$
|
1,575,000
|
|
$
|
15,000
|
|
$
|
30,000
|
|
$
|
1,530,000
|
|
$
|
—
|
|
$
|
—
|
|
|||||
|
Operating leases (2)
|
291,848
|
|
74,007
|
|
131,684
|
|
51,464
|
|
34,693
|
|
—
|
|
|||||||||||
|
Capital lease
|
27,324
|
|
5,168
|
|
10,756
|
|
11,374
|
|
26
|
|
—
|
|
|||||||||||
|
Inventory purchase obligations
|
397,704
|
|
397,704
|
|
—
|
|
—
|
|
—
|
|
—
|
|
|||||||||||
|
Uncertain tax positions, interest and penalties (3)
|
119,977
|
|
—
|
|
—
|
|
—
|
|
—
|
|
119,977
|
|
|||||||||||
|
Capital purchase obligations
|
41,293
|
|
41,293
|
|
—
|
|
—
|
|
—
|
|
—
|
|
|||||||||||
|
Retention program (4)
|
18,090
|
|
14,468
|
|
3,622
|
|
—
|
|
|||||||||||||||
|
Total contractual obligations
|
$
|
2,471,236
|
|
$
|
547,640
|
|
$
|
176,062
|
|
$
|
1,592,838
|
|
$
|
34,719
|
|
$
|
119,977
|
|
|||||
|
(1)
|
Represents the aggregate principal amount of
$1,500.0 million
and anticipated interest payments of
$75.0 million
of the Notes. See
Note 11
of the Notes to the Consolidated Financial Statements in Part IV, Item 15 of this Annual Report on Form 10-K.
|
|
(2)
|
The Company includes most of its facilities leases as well as non-cancelable obligations under certain software licensing arrangements in the operating lease category.
|
|
(3)
|
Represents unrecognized tax benefits of $120.0 million which consists of $107.1 million plus the related interest and penalties of $12.9 million recorded in non-current income tax payable as of January 26, 2014. We are unable to reasonably estimate the timing of any potential tax liability or interest/penalty payments in individual years due to uncertainties in the underlying income tax positions and the timing of the effective settlement of such tax positions.
|
|
(4)
|
Represents the remaining portion of a retention program totaling approximately $61.5 million that we initiated in fiscal year 2012 in connection with our acquisition of Icera. As of
January 26, 2014
, we have made payments of $43.4 million in connection with this program. The remaining payments will be paid out over the next two years.
|
Off-Balance Sheet Arrangements
During fiscal years
2014
,
2013
and
2012
, we had no material off-balance sheet arrangements as defined in Regulation S-K 303(a)(4)(ii).
Adoption of New and Recently Issued Accounting Pronouncements
Please see
Note 1
of the Notes to the Consolidated Financial Statements in Part IV, Item 15 of this Annual Report on Form 10-K for a discussion of adoption of new and recently issued accounting pronouncements.
Investment and Interest Rate Risk
As of
January 26, 2014
and
January 27, 2013
, we had
$4.67 billion
and
$3.73 billion
, respectively, in cash, cash equivalents and marketable securities. We invest in a variety of financial instruments, consisting principally of cash and cash equivalents, asset-backed securities, commercial paper, mortgage-backed securities issued by Government-sponsored enterprises, money market funds and debt securities of corporations, municipalities and the United States government and its agencies. As of
January 26, 2014
, we did not have any investments in auction-rate preferred securities. Our investments are denominated in United States dollars.
53
All of the cash equivalents and marketable securities are treated as “available-for-sale.” Investments in both fixed and floating rate interest earning instruments carry a degree of interest rate risk. Fixed rate securities may have their market value adversely impacted due to a rise in interest rates, while floating rate securities may produce less income than expected if interest rates fall. Due in part to these factors, our future investment income may fall short of expectations due to changes in interest rates or if the decline in fair value of our publicly traded debt or equity investments is judged to be other-than-temporary. We may suffer losses in principal if we are forced to sell securities that decline in securities market value due to changes in interest rates. However, because any debt securities we hold are classified as “available-for-sale,” no gains or losses are realized in our Consolidated Statements of Income due to changes in interest rates unless such securities are sold prior to maturity or unless declines in value are determined to be other-than-temporary. These securities are reported at fair value with the related unrealized gains and losses included in accumulated other comprehensive income (loss), a component of stockholders’ equity, net of tax.
As of
January 26, 2014
, we performed a sensitivity analysis on our floating and fixed rate financial investments. According to our analysis, parallel shifts in the yield curve of both plus or minus 0.5% would result in changes in fair values for these investments of approximately
$21.5 million
.
Other income and expense could also vary materially from expectations depending on gains or losses realized on the sale or exchange of financial instruments; impairment charges related to debt securities as well as equity and other investments; interest rates; and cash, cash equivalent and marketable securities balances. Volatility in the financial markets and economic uncertainty increases the risk that the actual amounts realized in the future on our financial instruments could differ significantly from the fair values currently assigned to them. As of
January 26, 2014
, our investments in government agencies and government sponsored enterprises represented approximately
42%
of our total investment portfolio, while the financial sector accounted for approximately
27%
of our total investment portfolio. Substantially all of our investments are with A/A3 or better rated securities. If the fair value of our investments in these sectors was to decline by 2%-5%, the fair values of these investments would decline by approximately
$56
-
$140 million
.
Exchange Rate Risk
We consider our direct exposure to foreign exchange rate fluctuations to be minimal. Gains or losses from foreign currency remeasurement are included in “Other expense, net” in our Consolidated Financial Statements and to date have not been significant. The impact of foreign currency transaction gain (loss) included in determining net income for fiscal years
2014
,
2013
and
2012
was
$4.7 million
,
$(1.5)
million and
$1.6
million, respectively. Currently, sales and arrangements with third-party manufacturers provide for pricing and payment in United States dollars, and, therefore, are not subject to exchange rate fluctuations. Increases in the value of the United States’ dollar relative to other currencies would make our products more expensive, which could negatively impact our ability to compete. Conversely, decreases in the value of the United States’ dollar relative to other currencies could result in our suppliers raising their prices in order to continue doing business with us. Fluctuations in currency exchange rates could harm our business in the future.
We may enter into certain transactions such as forward contracts which are designed to reduce the future potential impact resulting from changes in foreign currency exchange rates. There were no forward exchange contracts outstanding at
January 26, 2014
.
The information required by this Item is set forth in our Consolidated Financial Statements and Notes thereto included in this Annual Report on Form 10-K.
None.
54
Controls and Procedures
Disclosure Controls and Procedures
Based on their evaluation as of
January 26, 2014
, our management, including our Chief Executive Officer and Chief Financial Officer, has concluded that our disclosure controls and procedures (as defined in Rule 13a-15(e) under the Securities Exchange Act of 1934, as amended, or the Exchange Act) were effective to provide reasonable assurance.
Management’s Annual Report on Internal Control Over Financial Reporting
Our management is responsible for establishing and maintaining adequate internal control over financial reporting, as such term is defined in Exchange Act Rule 13a-15(f). Under the supervision and with the participation of our management, including our Chief Executive Officer and Chief Financial Officer, we conducted an evaluation of the effectiveness of our internal control over financial reporting as of
January 26, 2014
based on the criteria set forth in
Internal Control - Integrated Framework (1992)
issued by the Committee of Sponsoring Organizations of the Treadway Commission. Based on our evaluation under the criteria set forth in
Internal Control — Integrated Framework
, our management concluded that our internal control over financial reporting was effective as of
January 26, 2014
.
The effectiveness of our internal control over financial reporting as of
January 26, 2014
has been audited by PricewaterhouseCoopers LLP, an independent registered public accounting firm, as stated in its report which is included herein.
Changes in Internal Control Over Financial Reporting
There were no changes in our internal control over financial reporting during our last fiscal quarter that have materially affected, or are reasonably likely to materially affect, our internal control over financial reporting.
Inherent Limitations on Effectiveness of Controls
Our management, including our Chief Executive Officer and Chief Financial Officer, does not expect that our disclosure controls and procedures or our internal controls, will prevent all error and all fraud. A control system, no matter how well conceived and operated, can provide only reasonable, not absolute, assurance that the objectives of the control system are met. Further, the design of a control system must reflect the fact that there are resource constraints, and the benefits of controls must be considered relative to their costs. Because of the inherent limitations in all control systems, no evaluation of controls can provide absolute assurance that all control issues and instances of fraud, if any, within NVIDIA have been detected.
None.
55
Certain information required by Part III is omitted from this report because we will file with the SEC a definitive proxy statement pursuant to Regulation 14A, or the
2014
Proxy Statement, not later than 120 days after the fiscal year ended
January 26, 2014
, and certain information included therein is incorporated herein by reference.
Identification of Directors
Reference is made to the information regarding directors appearing under the heading “Proposal 1 - Election of Directors” in our
2014
Proxy Statement, which information is hereby incorporated by reference.
Identification of Executive Officers
Reference is made to the information regarding executive officers appearing under the heading “Executive Officers of the Registrant” in Part I of this Annual Report on Form 10-K, which information is hereby incorporated by reference.
Identification of Audit Committee and Financial Experts
Reference is made to the information regarding directors appearing under the heading “Report of the Audit Committee of the Board of Directors” and “Information about the Board of Directors and Corporate Governance” in our
2014
Proxy Statement, which information is hereby incorporated by reference.
Material Changes to Procedures for Recommending Directors
Reference is made to the information regarding directors appearing under the heading “Information about the Board of Directors and Corporate Governance” in our
2014
Proxy Statement, which information is hereby incorporated by reference.
Compliance with Section 16(a) of the Exchange Act
Reference is made to the information appearing under the heading “Section 16(a) Beneficial Ownership Reporting Compliance” in our
2014
Proxy Statement, which information is hereby incorporated by reference.
Code of Conduct
Reference is made to the information appearing under the heading “Information about the Board of Directors and Corporate Governance - Code of Conduct” in our
2014
Proxy Statement, which information is hereby incorporated by reference. The full text of our “Code” and “Financial Team Code” are published on the Investor Relations portion of our web site, under Corporate Governance, at
www.nvidia.com
. The contents of our website are not a part of this Annual Report on Form 10-K.
The information required by this item is hereby incorporated by reference from the sections entitled “Executive Compensation”, “Compensation Committee Interlocks and Insider Participation”, “Director Compensation” and “Compensation Committee Report” in our
2014
Proxy Statement.
Ownership of NVIDIA Securities
The information required by this item is hereby incorporated by reference from the section entitled “Security Ownership of Certain Beneficial Owners and Management” in our
2014
Proxy Statement.
56
Equity Compensation Plan Information
Information regarding our equity compensation plans, including both stockholder approved plans and non-stockholder approved plans, will be contained in our
2014
Proxy Statement under the caption ”Equity Compensation Plan Information,” and is hereby incorporated by reference.
The information required by this item is hereby incorporated by reference from the sections entitled “Review of Transactions with Related Persons” and “Information about the Board of Directors and Corporate Governance - Independence of the Members of the Board of Directors” in our
2014
Proxy Statement.
The information required by this item is hereby incorporated by reference from the section entitled “Fees Billed by the Independent Registered Public Accounting Firm” in our
2014
Proxy Statement.
57
|
|
|
Page
|
||
|
(a)
|
1.
|
Consolidated Financial Statements
|
|
|
|
|
||||
|
|
||||
|
|
||||
|
|
||||
|
|
||||
|
|
||||
|
2.
|
Financial Statement Schedule
|
|
||
|
|
||||
|
3.
|
Exhibits
|
|
||
|
|
||||
58
REPORT OF INDEPENDENT REGISTERED PUBLIC ACCOUNTING FIRM
To the
Stockholders and Board of Directors of NVIDIA Corporation:
In our opinion, the accompanying consolidated financial statements listed in the index appearing under Item 15(a)1. present fairly, in all material respects, the financial position of NVIDIA Corporation and its subsidiaries at
January 26, 2014
and
January 27, 2013
, and the results of their operations and their cash flows for each of the three years in the period ended
January 26, 2014
in conformity with accounting principles generally accepted in the United States of America. In addition, in our opinion, the financial statement schedule listed in the index appearing under Item 15(a)2. presents fairly, in all material respects, the information set forth therein when read in conjunction with the related consolidated financial statements. Also in our opinion, the Company maintained, in all material respects, effective internal control over financial reporting as of
January 26, 2014
, based on criteria established in
Internal Control - Integrated Framework (1992)
issued by the Committee of Sponsoring Organizations of the Treadway Commission (COSO). The Company's management is responsible for these financial statements and financial statement schedule, for maintaining effective internal control over financial reporting and for its assessment of the effectiveness of internal control over financial reporting, included in Management's Annual Report on Internal Control over Financial Reporting appearing under Item 9A. Our responsibility is to express opinions on these financial statements, on the financial statement schedule, and on the Company's internal control over financial reporting based on our integrated audits. We conducted our audits in accordance with the standards of the Public Company Accounting Oversight Board (United States). Those standards require that we plan and perform the audits to obtain reasonable assurance about whether the financial statements are free of material misstatement and whether effective internal control over financial reporting was maintained in all material respects. Our audits of the financial statements included examining, on a test basis, evidence supporting the amounts and disclosures in the financial statements, assessing the accounting principles used and significant estimates made by management, and evaluating the overall financial statement presentation. Our audit of internal control over financial reporting included obtaining an understanding of internal control over financial reporting, assessing the risk that a material weakness exists, and testing and evaluating the design and operating effectiveness of internal control based on the assessed risk. Our audits also included performing such other procedures as we considered necessary in the circumstances. We believe that our audits provide a reasonable basis for our opinions.
A company’s internal control over financial reporting is a process designed to provide reasonable assurance regarding the reliability of financial reporting and the preparation of financial statements for external purposes in accordance with generally accepted accounting principles. A company’s internal control over financial reporting includes those policies and procedures that (i) pertain to the maintenance of records that, in reasonable detail, accurately and fairly reflect the transactions and dispositions of the assets of the company; (ii) provide reasonable assurance that transactions are recorded as necessary to permit preparation of financial statements in accordance with generally accepted accounting principles, and that receipts and expenditures of the company are being made only in accordance with authorizations of management and directors of the company; and (iii) provide reasonable assurance regarding prevention or timely detection of unauthorized acquisition, use, or disposition of the company’s assets that could have a material effect on the financial statements.
Because of its inherent limitations, internal control over financial reporting may not prevent or detect misstatements. Also, projections of any evaluation of effectiveness to future periods are subject to the risk that controls may become inadequate because of changes in conditions, or that the degree of compliance with the policies or procedures may deteriorate.
/s/ PricewaterhouseCoopers LLP
San Jose, CA
March 12, 2014
59
NVIDIA CORPORATION AND SUBSIDIARIES
(In thousands, except per share data)
|
Year Ended
|
|||||||||||
|
January 26,
2014 |
January 27,
2013 |
January 29,
2012 |
|||||||||
|
Revenue
|
$
|
4,130,162
|
|
$
|
4,280,159
|
|
$
|
3,997,930
|
|
||
|
Cost of revenue
|
1,862,399
|
|
2,053,816
|
|
1,941,413
|
|
|||||
|
Gross profit
|
2,267,763
|
|
2,226,343
|
|
2,056,517
|
|
|||||
|
Operating expenses:
|
|
|
|
||||||||
|
Research and development
|
1,335,834
|
|
1,147,282
|
|
1,002,605
|
|
|||||
|
Sales, general and administrative
|
435,702
|
|
430,822
|
|
405,613
|
|
|||||
|
Total operating expenses
|
1,771,536
|
|
1,578,104
|
|
1,408,218
|
|
|||||
|
Income from operations
|
496,227
|
|
648,239
|
|
648,299
|
|
|||||
|
Interest income
|
17,119
|
|
19,908
|
|
19,149
|
|
|||||
|
Interest expense
|
(10,443
|
)
|
(3,294
|
)
|
(3,089
|
)
|
|||||
|
Other income (expense), net
|
7,351
|
|
(2,814
|
)
|
(963
|
)
|
|||||
|
Income before income tax
|
510,254
|
|
662,039
|
|
663,396
|
|
|||||
|
Income tax expense
|
70,264
|
|
99,503
|
|
82,306
|
|
|||||
|
Net income
|
$
|
439,990
|
|
$
|
562,536
|
|
$
|
581,090
|
|
||
|
Net income per share:
|
|||||||||||
|
Basic
|
$
|
0.75
|
|
$
|
0.91
|
|
$
|
0.96
|
|
||
|
Diluted
|
$
|
0.74
|
|
$
|
0.90
|
|
$
|
0.94
|
|
||
|
Weighted average shares used in per share computation:
|
|||||||||||
|
Basic
|
587,893
|
|
619,324
|
|
603,646
|
|
|||||
|
Diluted
|
594,517
|
|
624,957
|
|
616,371
|
|
|||||
|
Cash dividends declared and paid per common share
|
$0.310
|
$0.075
|
$
|
—
|
|
||||||
See accompanying notes to the consolidated financial statements.
60
NVIDIA CORPORATION AND SUBSIDIARIES
CONSOLIDATED STATEMENTS OF COMPREHENSIVE INCOME
(In thousands)
|
Year Ended
|
||||||||||||
|
January 26, 2014
|
January 27, 2013
|
January 29, 2012
|
||||||||||
|
Net income
|
$
|
439,990
|
|
$
|
562,536
|
|
$
|
581,090
|
|
|||
|
Other comprehensive income (loss), net of tax:
|
||||||||||||
|
Net change in unrealized gains (losses) on available-for-sale securities, net of tax effect of $(134), $126, and $937 in 2014, 2013 and 2012, respectively
|
(3,555
|
)
|
(303
|
)
|
755
|
|
||||||
|
Reclassification adjustments for net realized gains on available-for-sale securities included in net income, net of tax effect of $834, $178, and $222 in 2014, 2013 and 2012, respectively
|
(1,549
|
)
|
(330
|
)
|
(413
|
)
|
||||||
|
Other comprehensive income (loss)
|
$
|
(5,104
|
)
|
$
|
(633
|
)
|
$
|
342
|
|
|||
|
Total comprehensive income
|
$
|
434,886
|
|
$
|
561,903
|
|
$
|
581,432
|
|
|||
See accompanying notes to the consolidated financial statements.
61
NVIDIA CORPORATION AND SUBSIDIARIES
(In thousands, except share and per share data)
|
|
January 26, 2014
|
January 27, 2013
|
|||||
|
ASSETS
|
|
|
|||||
|
Current assets:
|
|
|
|||||
|
Cash and cash equivalents
|
$
|
1,151,587
|
|
$
|
732,786
|
|
|
|
Marketable securities
|
3,520,223
|
|
2,995,097
|
|
|||
|
Accounts receivable, less allowances of $14,959 in 2014 and $16,595 in 2013
|
426,357
|
|
454,252
|
|
|||
|
Inventories
|
387,765
|
|
412,467
|
|
|||
|
Prepaid expenses and other
|
70,285
|
|
76,920
|
|
|||
|
Deferred income taxes
|
68,494
|
|
103,736
|
|
|||
|
Total current assets
|
5,624,711
|
|
4,775,258
|
|
|||
|
Property and equipment, net
|
582,740
|
|
576,144
|
|
|||
|
Goodwill
|
643,179
|
|
641,030
|
|
|||
|
Intangible assets, net
|
296,012
|
|
312,332
|
|
|||
|
Other assets
|
104,252
|
|
107,481
|
|
|||
|
Total assets
|
$
|
7,250,894
|
|
$
|
6,412,245
|
|
|
|
LIABILITIES AND STOCKHOLDERS’ EQUITY
|
|
|
|||||
|
Current liabilities:
|
|
|
|||||
|
Accounts payable
|
$
|
324,391
|
|
$
|
356,428
|
|
|
|
Accrued liabilities and other
|
621,105
|
|
619,795
|
|
|||
|
Total current liabilities
|
945,496
|
|
976,223
|
|
|||
|
Long-term debt
|
1,356,375
|
|
—
|
|
|||
|
Other long-term liabilities
|
475,125
|
|
589,321
|
|
|||
|
Capital lease obligations, long-term
|
17,500
|
|
18,998
|
|
|||
|
Commitments and contingencies - see Note 12
|
—
|
|
—
|
|
|||
|
Stockholders’ equity:
|
|
|
|||||
|
Preferred stock, $.001 par value; 2,000,000 shares authorized; none issued
|
—
|
|
—
|
|
|||
|
Common stock, $.001 par value; 2,000,000,000 shares authorized; 735,242,458 shares issued and 567,996,734 outstanding in 2014; 720,153,197 shares issued and 616,756,134 outstanding in 2013
|
732
|
|
720
|
|
|||
|
Additional paid-in capital
|
3,483,342
|
|
3,193,623
|
|
|||
|
Treasury stock, at cost (167,245,724 shares in 2014 and 103,397,063 shares in 2013)
|
(2,537,295
|
)
|
(1,622,709
|
)
|
|||
|
Accumulated other comprehensive income
|
4,877
|
|
9,981
|
|
|||
|
Retained earnings
|
3,504,742
|
|
3,246,088
|
|
|||
|
Total stockholders' equity
|
4,456,398
|
|
4,827,703
|
|
|||
|
Total liabilities and stockholders' equity
|
$
|
7,250,894
|
|
$
|
6,412,245
|
|
|
See accompanying notes to the consolidated financial statements.
62
NVIDIA CORPORATION AND SUBSIDIARIES
CONSOLIDATED STATEMENTS OF STOCKHOLDERS’ EQUITY
(In thousands, except share data)
|
Common Stock
Outstanding
|
Additional
|
Treasury
|
Accumulated Other Comprehensive
|
Retained
|
Total Stockholders'
|
|||||||||||||||||||||
|
|
Shares
|
Amount
|
Paid-in Capital
|
Stock
|
Income
|
Earnings
|
Equity
|
|||||||||||||||||||
|
Balances, January 30, 2011
|
588,555,701
|
|
|
$
|
677
|
|
|
$
|
2,500,577
|
|
|
$
|
(1,479,392
|
)
|
|
$
|
10,272
|
|
|
$
|
2,149,328
|
|
$
|
3,181,462
|
|
|
|
Other comprehensive income
|
—
|
|
|
—
|
|
|
—
|
|
|
—
|
|
|
342
|
|
|
—
|
|
342
|
|
|||||||
|
Net income
|
—
|
|
|
—
|
|
|
—
|
|
|
—
|
|
|
|
|
|
581,090
|
|
581,090
|
|
|||||||
|
Issuance of common stock from stock plans
|
24,753,362
|
|
|
23
|
|
|
213,346
|
|
|
—
|
|
|
—
|
|
|
—
|
|
213,369
|
|
|||||||
|
Tax withholding related to vesting of restricted stock units
|
(1,117,651
|
)
|
|
—
|
|
|
—
|
|
|
(17,512
|
)
|
|
—
|
|
|
—
|
|
(17,512
|
)
|
|||||||
|
Tax benefit from stock-based compensation
|
—
|
|
|
—
|
|
|
50,475
|
|
|
—
|
|
|
—
|
|
|
—
|
|
50,475
|
|
|||||||
|
Stock-based compensation
|
—
|
|
|
—
|
|
|
136,498
|
|
|
—
|
|
|
—
|
|
|
—
|
|
136,498
|
|
|||||||
|
Balances, January 29, 2012
|
612,191,412
|
|
|
700
|
|
|
2,900,896
|
|
|
(1,496,904
|
)
|
|
10,614
|
|
|
2,730,418
|
|
4,145,724
|
|
|||||||
|
Other comprehensive loss
|
—
|
|
|
—
|
|
|
—
|
|
|
—
|
|
|
(633
|
)
|
|
—
|
|
(633
|
)
|
|||||||
|
Net income
|
—
|
|
|
—
|
|
|
—
|
|
|
—
|
|
|
|
|
|
562,536
|
|
562,536
|
|
|||||||
|
Issuance of common stock from stock plans
|
14,800,959
|
|
|
20
|
|
|
90,721
|
|
|
—
|
|
|
—
|
|
|
—
|
|
90,741
|
|
|||||||
|
Tax withholding related to vesting of restricted stock units
|
(1,836,097
|
)
|
|
—
|
|
|
—
|
|
|
(25,805
|
)
|
|
—
|
|
|
—
|
|
(25,805
|
)
|
|||||||
|
Stock repurchase
|
(8,400,140
|
)
|
|
—
|
|
|
—
|
|
|
(100,000
|
)
|
|
—
|
|
|
—
|
|
(100,000
|
)
|
|||||||
|
Cash dividends declared and paid ($0.075 per common share)
|
—
|
|
|
—
|
|
|
—
|
|
|
—
|
|
|
—
|
|
|
(46,866
|
)
|
(46,866
|
)
|
|||||||
|
Tax benefit from stock-based compensation
|
—
|
|
|
—
|
|
|
64,905
|
|
|
—
|
|
|
—
|
|
|
—
|
|
64,905
|
|
|||||||
|
Stock-based compensation
|
—
|
|
|
—
|
|
|
137,101
|
|
|
—
|
|
|
—
|
|
|
—
|
|
137,101
|
|
|||||||
|
Balances, January 27, 2013
|
616,756,134
|
|
|
720
|
|
|
3,193,623
|
|
|
(1,622,709
|
)
|
|
9,981
|
|
|
3,246,088
|
|
4,827,703
|
|
|||||||
|
Other comprehensive loss
|
—
|
|
|
—
|
|
|
—
|
|
|
—
|
|
|
(5,104
|
)
|
|
—
|
|
(5,104
|
)
|
|||||||
|
Net income
|
—
|
|
|
—
|
|
|
—
|
|
|
—
|
|
|
—
|
|
|
439,990
|
|
439,990
|
|
|||||||
|
Issuance of common stock from stock plans
|
15,088,872
|
|
|
12
|
|
|
97,442
|
|
|
—
|
|
|
—
|
|
|
—
|
|
97,454
|
|
|||||||
|
Tax withholding related to vesting of restricted stock units
|
(1,944,391
|
)
|
|
—
|
|
|
—
|
|
|
(27,282
|
)
|
|
—
|
|
|
—
|
|
(27,282
|
)
|
|||||||
|
Stock repurchase
|
(61,903,881
|
)
|
|
—
|
|
|
—
|
|
|
(887,304
|
)
|
|
|
|
|
—
|
|
(887,304
|
)
|
|||||||
|
Discount on convertible notes
|
—
|
|
—
|
|
125,725
|
|
—
|
|
—
|
|
—
|
|
125,725
|
|
||||||||||||
|
Purchase of convertible note hedges
|
—
|
|
—
|
|
(167,100
|
)
|
—
|
|
—
|
|
—
|
|
(167,100
|
)
|
||||||||||||
|
Proceeds from the sale of common stock warrants
|
—
|
|
—
|
|
59,100
|
|
—
|
|
—
|
|
—
|
|
59,100
|
|
||||||||||||
|
Deferred tax asset associated with convertible notes
|
—
|
|
—
|
|
14,481
|
|
—
|
|
—
|
|
—
|
|
14,481
|
|
||||||||||||
|
Cash dividends declared and paid ($0.310 per common share)
|
—
|
|
|
—
|
|
|
—
|
|
|
—
|
|
|
—
|
|
|
(181,336
|
)
|
(181,336
|
)
|
|||||||
|
Tax benefit from stock-based compensation
|
—
|
|
|
—
|
|
|
23,827
|
|
|
—
|
|
|
—
|
|
|
—
|
|
23,827
|
|
|||||||
|
Stock-based compensation
|
—
|
|
|
—
|
|
|
136,244
|
|
|
—
|
|
|
—
|
|
|
—
|
|
136,244
|
|
|||||||
|
Balances, January 26, 2014
|
567,996,734
|
|
|
$
|
732
|
|
|
$
|
3,483,342
|
|
|
$
|
(2,537,295
|
)
|
|
$
|
4,877
|
|
|
$
|
3,504,742
|
|
$
|
4,456,398
|
|
|
See accompanying notes to the consolidated financial statements.
63
NVIDIA CORPORATION AND SUBSIDIARIES
(In thousands)
|
Year Ended
|
|||||||||||
|
|
January 26, 2014
|
January 27, 2013
|
January 29, 2012
|
||||||||
|
Cash flows from operating activities:
|
|
|
|||||||||
|
Net income
|
$
|
439,990
|
|
$
|
562,536
|
|
$
|
581,090
|
|
||
|
Adjustments to reconcile net income to net cash provided by operating activities:
|
|
|
|||||||||
|
Stock-based compensation expense
|
136,295
|
|
136,662
|
|
136,354
|
|
|||||
|
Depreciation and amortization
|
239,148
|
|
226,235
|
|
204,205
|
|
|||||
|
Amortization of debt discount
|
4,600
|
|
—
|
|
—
|
|
|||||
|
Gain on sale of long-lived assets and investments
|
(10,471
|
)
|
—
|
|
—
|
|
|||||
|
Deferred income taxes
|
15,430
|
|
31,860
|
|
19,056
|
|
|||||
|
Tax benefit from stock-based compensation
|
(25,801
|
)
|
(68,710
|
)
|
(52,793
|
)
|
|||||
|
Other
|
23,718
|
|
47,911
|
|
19,095
|
|
|||||
|
Changes in operating assets and liabilities, net of effects of acquisitions:
|
|
|
|||||||||
|
Accounts receivable
|
28,852
|
|
(118,940
|
)
|
26,236
|
|
|||||
|
Inventories
|
24,651
|
|
(78,949
|
)
|
18,884
|
|
|||||
|
Prepaid expenses and other current assets
|
6,729
|
|
(20,290
|
)
|
(14,803
|
)
|
|||||
|
Deposits and other assets
|
4,823
|
|
8,567
|
|
(70,694
|
)
|
|||||
|
Accounts payable
|
(20,382
|
)
|
10,885
|
|
35,708
|
|
|||||
|
Accrued liabilities and other long-term liabilities
|
(32,436
|
)
|
86,405
|
|
6,818
|
|
|||||
|
Net cash provided by operating activities
|
835,146
|
|
824,172
|
|
909,156
|
|
|||||
|
Cash flows from investing activities:
|
|
|
|||||||||
|
Purchases of marketable securities
|
(3,065,404
|
)
|
(2,378,445
|
)
|
(1,964,898
|
)
|
|||||
|
Proceeds from sales of marketable securities
|
1,926,817
|
|
854,993
|
|
656,171
|
|
|||||
|
Proceeds from maturities of marketable securities
|
585,150
|
|
962,417
|
|
654,572
|
|
|||||
|
Purchases of property and equipment and intangible assets
|
(255,186
|
)
|
(183,309
|
)
|
(138,735
|
)
|
|||||
|
Proceeds from sale of long-lived assets and investments
|
24,781
|
|
—
|
|
—
|
|
|||||
|
Acquisition of businesses, net of cash and cash equivalents
|
(17,145
|
)
|
—
|
|
(348,884
|
)
|
|||||
|
Other
|
(4,950
|
)
|
352
|
|
(1,590
|
)
|
|||||
|
Net cash used in investing activities
|
(805,937
|
)
|
(743,992
|
)
|
(1,143,364
|
)
|
|||||
|
Cash flows from financing activities:
|
|
|
|||||||||
|
Proceeds from issuance of convertible notes, net
|
1,477,500
|
|
—
|
|
—
|
|
|||||
|
Purchase of convertible note hedges
|
(167,100
|
)
|
—
|
|
—
|
|
|||||
|
Proceeds from the sale of common stock warrants
|
59,100
|
|
—
|
|
—
|
|
|||||
|
Proceeds from issuance of common stock under employee stock plans
|
70,170
|
|
64,935
|
|
195,857
|
|
|||||
|
Payments related to repurchases of common stock
|
(887,304
|
)
|
(100,000
|
)
|
—
|
|
|||||
|
Dividends paid
|
(181,336
|
)
|
(46,866
|
)
|
—
|
|
|||||
|
Tax benefit from stock-based compensation
|
25,801
|
|
68,710
|
|
52,793
|
|
|||||
|
Payments under capital lease obligations
|
(2,239
|
)
|
(2,049
|
)
|
(1,608
|
)
|
|||||
|
Other
|
(5,000
|
)
|
—
|
|
(10,319
|
)
|
|||||
|
Net cash (used in) provided by financing activities
|
389,592
|
|
(15,270
|
)
|
236,723
|
|
|||||
|
Change in cash and cash equivalents
|
418,801
|
|
64,910
|
|
2,515
|
|
|||||
|
Cash and cash equivalents at beginning of period
|
732,786
|
|
667,876
|
|
665,361
|
|
|||||
|
Cash and cash equivalents at end of period
|
$
|
1,151,587
|
|
$
|
732,786
|
|
$
|
667,876
|
|
||
64
|
|
Year Ended
|
||||||||||
|
|
January 26, 2014
|
January 27, 2013
|
January 29, 2012
|
||||||||
|
Supplemental disclosures of cash flow information:
|
|||||||||||
|
Cash (received) paid for income taxes, net
|
$
|
14,615
|
|
$
|
(38,608
|
)
|
$
|
58,328
|
|
||
|
Cash paid for interest on capital lease obligations
|
$
|
2,518
|
|
$
|
2,772
|
|
$
|
3,008
|
|
||
|
Non-cash investing and financing activities:
|
|
|
|||||||||
|
Change in unrealized gains (losses) from marketable securities
|
$
|
(5,104
|
)
|
$
|
(633
|
)
|
$
|
342
|
|
||
|
Assets acquired by assuming related liabilities
|
$
|
3,327
|
|
$
|
45,195
|
|
$
|
15,913
|
|
||
See accompanying notes to the consolidated financial statements.
65
NVIDIA CORPORATION AND SUBSIDIARIES
NOTES TO THE CONSOLIDATED FINANCIAL STATEMENTS
Note 1
- Organization and Summary of Significant Accounting Policies
Our Company
NVIDIA is a visual computing company. In a world increasingly filled with visual displays, our graphics technologies let our customers interact with the world of digital ideas, information and entertainment with an efficiency that no other communication medium can match.
NVIDIA's research and development in visual computing has yielded approximately 7,000 patent assets, including inventions essential to modern computing.
Our businesses are based on two technologies with a consistent underlying graphics architecture: the GPU and the Tegra processor.
GPUs, each with billions of transistors, are the engines of visual computing and among the world's most complex processors. We have GPU product brands aimed at specific users and applications: GeForce for gamers; Quadro for designers; Tesla for researchers; and GRID for cloud-based graphics.
The Tegra processor is a SOC integrating an entire computer on a single chip. Tegra processors incorporate GPUs and multi-core CPUs together with audio, video and input/output capabilities. They can also be integrated with baseband processors to add voice and data communication. Our Tegra SOC conserves power while delivering state-of-the-art graphics and multimedia processing.
Headquartered in Santa Clara, California, we were incorporated in California in April 1993 and reincorporated in Delaware in April 1998.
All references to “NVIDIA,” “we,” “us,” “our” or the “Company” mean NVIDIA Corporation and its subsidiaries, except where it is made clear that the term means only the parent company.
Fiscal Year
We operate on a 52- or a 53-week year, ending on the last Sunday in January. Fiscal years
2014
,
2013
and
2012
were 52-week years.
Reclassifications
Certain prior fiscal year balances have been reclassified to conform to the current fiscal year presentation.
Principles of Consolidation
Our consolidated financial statements include the accounts of NVIDIA Corporation and its wholly-owned subsidiaries. All material intercompany balances and transactions have been eliminated in consolidation.
Use of Estimates
The preparation of financial statements in conformity with accounting principles generally accepted in the United States, or U.S.GAAP, requires management to make estimates and assumptions that affect the reported amounts of assets and liabilities and disclosures of contingent assets and liabilities at the date of the financial statements and the reported amounts of revenue and expenses during the reporting period. Actual results could differ from those estimates. On an on-going basis, we evaluate our estimates, including those related to revenue recognition, cash equivalents and marketable securities, accounts receivable, inventories, income taxes, goodwill, stock-based compensation, warranty liabilities, litigation, investigation and settlement costs and other contingencies. These estimates are based on historical facts and various other assumptions that we believe are reasonable.
66
NVIDIA CORPORATION AND SUBSIDIARIES
NOTES TO THE CONSOLIDATED FINANCIAL STATEMENTS
(Continued)
Revenue Recognition
Product Revenue
We recognize revenue from product sales when persuasive evidence of an arrangement exists, the product has been delivered, the price is fixed or determinable and collection of the related receivable is reasonably assured. For most sales, we use a binding purchase order and in certain cases we use a contractual agreement as evidence of an arrangement. We consider delivery to occur upon shipment provided title and risk of loss have passed to the customer. At the point of sale, we assess whether the arrangement fee is fixed or determinable and whether collection is reasonably assured. If we determine that collection of a fee is not reasonably assured, we defer the fee and recognize revenue at the time collection becomes reasonably assured, which is generally upon receipt of payment.
Our policy on sales to certain distributors with rights of return is to defer recognition of revenue and related cost of revenue until the distributors resell the product, as the level of returns cannot be reasonably estimated.
Our customer programs primarily involve rebates, which are designed to serve as sales incentives to resellers of our products in various target markets. We account for rebates as a reduction of revenue and accrue for 100% of the potential rebates and do not apply a breakage factor. While we have a long history of rebate arrangements with OEMs, we believe we are unable to apply our historical experience to reliably estimate the amount of rebates that will eventually be claimed by individual OEMs. The OEMs are not our direct customers and the quantity and mix of demand they place on CEM/ODMs may shift as we introduce new generations and iterations of products and as we experience changes in new competitor offerings. In addition, we typically find that approximately 95% of the rebates we accrue each year are eventually claimed, which is substantially close to 100%, and that this percentage varies by program and by customer. We recognize a liability for these rebates at the later of the date at which we record the related revenue or the date at which we offer the rebate. Rebates typically expire six months from the date of the original sale, unless we reasonably believe that the customer intends to claim the rebate. Unclaimed rebates are reversed to revenue, the amount of which typically represents approximately 0.5% of total revenue.
Our customer programs also include marketing development funds, or MDFs. MDFs represent monies paid to retailers, system builders, original equipment manufacturers, or OEMs, distributors and add-in card partners that are earmarked for market segment development and expansion and typically are designed to support our partners’ activities while also promoting NVIDIA products. Depending on market conditions, we may take actions to increase amounts offered under customer programs, possibly resulting in an incremental reduction of revenue at the time such programs are offered. We account for MDFs as a reduction of revenue and apply a breakage factor to certain types of MDF program accruals for which we believe we can make a reasonable and reliable estimate of the amount that will ultimately be unclaimed. MDF amounts that have been previously recorded against revenue and subsequently expired unclaimed are reversed to revenue. Such amounts have not been significant.
We also record a reduction to revenue by establishing a sales return allowance for estimated product returns at the time revenue is recognized, based primarily on historical return rates. However, if product returns for a particular fiscal period exceed historical return rates we may determine that additional sales return allowances are required to properly reflect our estimated exposure for product returns.
License and Development Revenue
For license arrangements that require significant customization of our intellectual property components, we generally recognize the related revenue over the period that services are performed. For most license and service arrangements, we determine progress to completion based on actual direct labor hours incurred to date as a percentage of the estimated total direct labor hours required to complete the project. We periodically evaluate the actual status of each project to ensure that the estimates to complete each contract remain accurate. A provision for estimated losses on contracts is made in the period in which the loss becomes probable and can be reasonably estimated. Costs incurred in advance of revenue recognized are recorded as deferred costs on uncompleted contracts. If the amount billed exceeds the amount of revenue recognized, the excess amount is recorded as deferred revenue. Revenue recognized in any period is dependent on our progress toward completion of projects in progress. Significant management judgment and discretion are used to estimate total direct labor hours. Any changes in or deviations from these estimates could have a material effect on the amount of revenue we recognize in any period.
For license arrangements that do not require significant customization but where we are obligated to provide further deliverables over the term of the license agreement, we record revenue over the life of the license term, with consideration received in advance of the performance period classified as deferred revenue
.
67
NVIDIA CORPORATION AND SUBSIDIARIES
NOTES TO THE CONSOLIDATED FINANCIAL STATEMENTS
(Continued)
Royalty revenue is recognized related to the distribution or sale of products that use our technologies under license agreements with third parties. We recognize royalty revenue upon receipt of a confirmation of earned royalties and when collectability is reasonably assured from the applicable licensee.
Advertising Expenses
We expense advertising costs in the period in which they are incurred. Advertising expenses for fiscal years
2014
,
2013
and
2012
were $
13.1 million
,
$9.2 million
and
$8.4 million
, respectively.
Rent Expense
We recognize rent expense on a straight-line basis over the lease period and accrue for rent expense incurred, but not paid.
Product Warranties
We generally offer limited warranty to end-users that ranges from one to three years for products in order to repair or replace products for any manufacturing defects or hardware component failures. Cost of revenue includes the estimated cost of product warranties that are calculated at the point of revenue recognition. Under limited circumstances, we may offer an extended limited warranty to customers for certain products. We also accrue for known warranty and indemnification issues if a loss is probable and can be reasonably estimated.
Stock-based Compensation
We measure stock-based compensation expense based on the estimated fair value of equity awards at the grant date, and recognize the expense using a straight-line attribution method over the requisite employee service period. We estimate the fair value of employee stock options on the date of grant using a binomial model. We use the closing trading price of our common stock on the date of grant, minus a dividend yield discount, as the fair value of awards of restricted stock units. The fair value of our employee stock purchase plan is calculated using the Black-Scholes model. Our stock-based compensation for employee stock purchase plan is expensed using an accelerated amortization model.
Litigation, Investigation and Settlement Costs
From time to time, we are involved in legal actions and/or investigations by regulatory bodies. We are aggressively defending our current litigation matters. However, there are many uncertainties associated with any litigation or investigation, and we cannot be certain that these actions or other third-party claims against us will be resolved without litigation, fines and/or substantial settlement payments. If that occurs, our business, financial condition and results of operations could be materially and adversely affected. If information becomes available that causes us to determine that a loss in any of our pending litigation, investigations or settlements is probable, and we can reasonably estimate the loss associated with such events, we will record the loss in accordance with U.S. GAAP. However, the actual liability in any such litigation or investigation may be materially different from our estimates, which could require us to record additional costs.
Foreign Currency Remeasurement
We use the United States dollar as our functional currency for all of our subsidiaries. Foreign currency monetary assets and liabilities are remeasured into United States dollars at end-of-period exchange rates. Non-monetary assets and liabilities such as property and equipment, and equity are remeasured at historical exchange rates. Revenue and expenses are remeasured at average exchange rates in effect during each period, except for those expenses related to the previously noted balance sheet amounts, which are remeasured at historical exchange rates. Gains or losses from foreign currency re-measurement are included in “Other income (expense), net” in our Consolidated Statements of Income and to date have not been significant.
The impact of gain or loss from foreign currency remeasurement included in determining other income (expense), net for fiscal years
2014
,
2013
and
2012
was $
4.7 million
, $
(1.5) million
and $
1.6 million
, respectively.
68
NVIDIA CORPORATION AND SUBSIDIARIES
NOTES TO THE CONSOLIDATED FINANCIAL STATEMENTS
(Continued)
Income Taxes
We recognize federal, state and foreign current tax liabilities or assets based on our estimate of taxes payable or refundable in the current fiscal year by tax jurisdiction. We recognize federal, state and foreign deferred tax assets or liabilities, as appropriate, for our estimate of future tax effects attributable to temporary differences and carryforwards; and we record a valuation allowance to reduce any deferred tax assets by the amount of any tax benefits that, based on available evidence and judgment, are not expected to be realized.
United States income tax has not been provided on a portion of earnings of our non-U.S. subsidiaries to the extent that such earnings are considered to be indefinitely reinvested.
Our calculation of current and deferred tax assets and liabilities is based on certain estimates and judgments and involves dealing with uncertainties in the application of complex tax laws. Our estimates of current and deferred tax assets and liabilities may change based, in part, on added certainty or finality to an anticipated outcome, changes in accounting standards or tax laws in the United States, or foreign jurisdictions where we operate, or changes in other facts or circumstances. In addition, we recognize liabilities for potential United States and foreign income tax contingencies based on our estimate of whether, and the extent to which, additional taxes may be due. If we determine that payment of these amounts is unnecessary or if the recorded tax liability is less than our current assessment, we may be required to recognize an income tax benefit or additional income tax expense in our financial statements, accordingly.
As of January 26, 2014, we had a valuation allowance of
$244.5 million
related to state and certain foreign deferred tax assets that management determined are not likely to be realized due, in part, to projections of future taxable income and potential utilization limitations of tax attributes acquired as a result of stock ownership changes. To the extent realization of the deferred tax assets becomes more-likely-than-not, we would recognize such deferred tax asset as an income tax benefit during the period.
Our deferred tax assets do not include the excess tax benefit related to stock-based compensation that are a component of our federal and state net operating loss and research tax credit carryforwards in the amount of
$427.9 million
as of January 26, 2014. Consistent with prior years, the excess tax benefit reflected in our net operating loss and research tax credit carryforwards will be accounted for as a credit to stockholders' equity, if and when realized. In determining if and when excess tax benefits have been realized, we have elected to utilize the with-and-without approach with respect to such excess tax benefits. We have also elected to ignore the indirect tax effects of stock-based compensation deductions for financial and accounting reporting purposes, and specifically to recognize the full effect of the research tax credit in income from operations.
We recognize the benefit from a tax position only if it is more-likely-than-not that the position would be sustained upon audit based solely on the technical merits of the tax position. Our policy is to include interest and penalties related to unrecognized tax benefits as a component of income tax expense. Please refer to
Note 13
of these Notes to the Consolidated Financial Statements for additional information.
Comprehensive Income
Comprehensive income consists of net income and other comprehensive income (loss). Other comprehensive income (loss) components include unrealized gains (losses) on available-for-sale securities, net of tax.
Net Income Per Share
Basic net income per share is computed using the weighted average number of common shares outstanding during the period. Diluted net income per share is computed using the weighted average number of common and potentially dilutive shares outstanding during the period, using the treasury stock method. Under the treasury stock method, the effect of stock options outstanding is not included in the computation of diluted net income per share for periods when their effect is anti-dilutive. Additionally, we issued convertible notes with a net settlement feature that requires us, upon conversion, to settle the principal amount of debt for cash and the conversion premium for cash or shares of our common stock. Our convertible notes, note hedges, and related warrants contain various conversion features, which are further described in
Note 11
of these Notes to the Consolidated Financial Statements. The potentially dilutive shares resulting from the convertible notes and warrants under the treasury stock method will be included in the calculation of diluted income per share when their inclusion is dilutive. However, unless actually exercised, the note hedges will not be included in the calculation of diluted net income per share, as their pre-exercised effect would be anti-dilutive under the treasury stock method.
69
NVIDIA CORPORATION AND SUBSIDIARIES
NOTES TO THE CONSOLIDATED FINANCIAL STATEMENTS
(Continued)
Cash and Cash Equivalents
We consider all highly liquid investments that are readily convertible into cash and have an original maturity of three months or less at the time of purchase to be cash equivalents. As of
January 26, 2014
and
January 27, 2013
, our cash and cash equivalents were
$1,151.6 million
and
$732.8 million
, respectively, which include $
307.9 million
and
$195.8 million
invested in money market funds for
fiscal year 2014
and
fiscal year 2013
, respectively.
Marketable Securities
Marketable securities consist primarily of highly liquid investments with maturities of greater than three months when purchased. We generally classify our marketable securities at the date of acquisition as available-for-sale. These securities are reported at fair value with the related unrealized gains and losses included in accumulated other comprehensive income, a component of stockholders’ equity, net of tax. Any unrealized losses which are considered to be other-than-temporary impairments are recorded in the other income and expense section of our consolidated statements of income. Realized gains and losses on the sale of marketable securities are determined using the specific-identification method and recorded in the other income and expense section of our consolidated statements of income.
All of our available-for-sale investments are subject to a periodic impairment review. We record a charge to earnings when a decline in fair value is significantly below cost basis and judged to be other-than-temporary, or have other indicators of impairments. If the fair value of an available-for-sale debt instrument is less than its amortized cost basis, an other-than-temporary impairment is triggered in circumstances where (1) we intend to sell the instrument, (2) it is more likely than not that we will be required to sell the instrument before recovery of its amortized cost basis, or (3) a credit loss exists where we do not expect to recover the entire amortized cost basis of the instrument. If we intend to sell or it is more likely than not that we will be required to sell the available-for-sale debt instrument before recovery of its amortized cost basis, we recognize an other-than-temporary impairment in earnings equal to the entire difference between the debt instruments’ amortized cost basis and its fair value. For available-for-sale debt instruments that are considered other-than-temporarily impaired due to the existence of a credit loss, if we do not intend to sell and it is not more likely than not that we will be required to sell the instrument before recovery of its remaining amortized cost basis (amortized cost basis less any current-period credit loss), we separate the amount of the impairment into the amount that is credit related and the amount due to all other factors. The credit loss component is recognized in earnings while loss related to all other factors is recorded as other comprehensive income.
We performed an impairment review of our investment portfolio as of
January 26, 2014
. Based on our impairment review and having considered the guidance of the relevant accounting literature, we did not record any other than temporary impairment charges during
fiscal year 2014
. We concluded that our investments were appropriately valued and that no other than temporary impairment charges were necessary on our portfolio of available for sale investments as of
January 26, 2014
.
Fair Value of Financial Instruments
The carrying value of cash equivalents, accounts receivable, accounts payable and accrued liabilities approximate their fair values due to their relatively short maturities as of
January 26, 2014
and
January 27, 2013
. Marketable securities are comprised of available-for-sale securities that are reported at fair value with the related unrealized gains and losses included in accumulated other comprehensive income, a component of stockholders’ equity, net of tax. Fair value of the marketable securities is determined based on quoted market prices.
Concentration of Credit Risk
Financial instruments that potentially subject us to concentrations of credit risk consist primarily of cash equivalents, marketable securities, accounts receivable and the note hedge. Our investment policy requires the purchase of high grade investment securities, the diversification of asset type and includes certain limits on our portfolio duration. All marketable securities are held in our name, managed by several investment managers and held by one major financial institution under a custodial arrangement. Accounts receivable from significant customers, those representing 10% or more of total accounts receivable aggregated approximately
23%
of our accounts receivable balance from
one
customer at
January 26, 2014
and approximately
40%
of our accounts receivable balance from
three
customers at
January 27, 2013
. We perform ongoing credit evaluations of our customers’ financial condition and maintain an allowance for potential credit losses. This allowance consists of an amount identified for specific customers and an amount based on overall estimated exposure. Our overall estimated exposure excludes amounts covered by credit insurance and letters of credit.
70
NVIDIA CORPORATION AND SUBSIDIARIES
NOTES TO THE CONSOLIDATED FINANCIAL STATEMENTS
(Continued)
Accounts Receivable
We maintain an allowance for doubtful accounts receivable for estimated losses resulting from the inability of our customers to make required payments. We determine this allowance, which consists of an amount identified for specific customer issues as well as an amount based on overall estimated exposure. Factors impacting the allowance include the level of gross receivables, the financial condition of our customers and the extent to which balances are covered by credit insurance or letters of credit.
Inventories
Inventory cost is computed on an adjusted standard basis, which approximates actual cost on an average or first-in, first-out basis. Inventory costs consist primarily of the cost of semiconductors purchased from subcontractors, including wafer fabrication, assembly, testing and packaging, manufacturing support costs, including labor and overhead associated with such purchases, final test yield fallout, and shipping costs, as well as the cost of purchased memory products and other component parts. We charge cost of sales for inventory provisions to write down our inventory to the lower of cost or estimated market value or to completely write off obsolete or excess inventory. Most of our inventory provisions relate to the write-off of excess quantities of products, based on our inventory levels and future product purchase commitments compared to assumptions about future demand and market conditions. Once inventory has been written-off or written-down, it creates a new cost basis for the inventory that is not subsequently written-up.
Property and Equipment
Property and equipment are stated at cost. Depreciation of property and equipment is computed using the straight-line method based on the estimated useful lives of the assets, generally three to five years. The estimated useful lives of our buildings are up to twenty five years. Depreciation expense includes the amortization of assets recorded under capital leases. Leasehold improvements and assets recorded under capital leases are amortized over the shorter of the expected lease term or the estimated useful life of the asset.
Goodwill
Goodwill is subject to our annual impairment test during the fourth quarter of our fiscal year, or earlier if indicators of potential impairment exist. For the purposes of completing our impairment test, we perform either a qualitative or a quantitative analysis on a reporting unit basis.
For those reporting units where a significant change or event has occurred, where potential impairment indicators exist, or for which we have not performed a quantitative assessment recently, we utilize a two-step quantitative assessment to testing goodwill for impairment. The first step tests for possible impairment by applying a fair value-based test by weighing the results from the income approach and the market approach. The second step, if necessary, measures the amount of such impairment by applying fair value-based tests to individual assets and liabilities. Please refer to
Note 5
of these Notes to the Consolidated Financial Statements for additional information.
Intangible Assets
Intangible assets primarily represent rights acquired under technology licenses, patents, acquired intellectual property, trademarks and customer relationships and are subject to an annual impairment test. We currently amortize our intangible assets with definitive lives over periods ranging from one to ten years using a method that reflects the pattern in which the economic benefits of the intangible asset are consumed or otherwise used up or, if that pattern cannot be reliably determined, using a straight-line amortization method.
71
NVIDIA CORPORATION AND SUBSIDIARIES
NOTES TO THE CONSOLIDATED FINANCIAL STATEMENTS
(Continued)
Impairment of Long-Lived Assets
Long-lived assets, such as property and equipment and intangible assets subject to amortization are reviewed for impairment whenever events or changes in circumstances indicate that the carrying amount of an asset, or asset group may not be recoverable. Recoverability of assets to be held and used is measured by a comparison of the carrying amount of an asset, or asset group to estimated undiscounted future cash flows expected to be generated by the asset, or asset group. If the carrying amount of an asset or asset group exceeds its estimated future cash flows, an impairment charge is recognized for the amount by which the carrying amount of the asset or asset group exceeds the estimated fair value of the asset or asset group. Fair value is determined based on the estimated discounted future cash flows expected to be generated by the asset or asset group. Assets and liabilities to be disposed of would be separately presented in the consolidated balance sheet and the assets would be reported at the lower of the carrying amount or fair value less costs to sell, and would no longer be depreciated.
Accounting for Asset Retirement Obligations
We account for asset retirement obligations associated with the retirement of tangible long-lived assets and the associated asset retirement costs. The accounting guidance applies to legal obligations associated with the retirement of long-lived assets that result from the acquisition, construction, development and/or normal use of the assets and requires that the fair value of a liability for an asset retirement obligation be recognized in the period in which it is incurred if a reasonable estimate of fair value can be made. The fair value of the liability is added to the carrying amount of the associated asset and this additional carrying amount is depreciated over the life of the asset. As of
January 26, 2014
and
January 27, 2013
, our asset retirement obligations to return the leasehold improvements at our headquarters facility in Santa Clara, California and certain laboratories at our Austin facility and international locations to their original condition upon lease termination were
$11.1 million
and
$10.6 million
, respectively.
Adoption of New and Recently Issued Accounting Pronouncements
In July 2013, the Financial Accounting Standards Board, or FASB, issued guidance regarding the presentation of unrecognized tax benefits when a net operating loss carryforward, similar tax loss, or tax credit carryforward exists. The new guidance requires that an unrecognized tax benefit, or a portion of an unrecognized tax benefit, be presented in the financial statements as a reduction to a deferred tax asset for a net operating loss carryforward, a similar tax loss, or a tax credit carryforward when settlement in this manner is available under the tax law. This guidance is effective on a prospective basis for financial statements issued for fiscal years, and interim periods within those fiscal years, beginning after December 15, 2013. Retrospective and early adoption is permitted. We expect to adopt this guidance in our interim and annual periods beginning January 27, 2014. We do not believe the adoption of this guidance will have a material impact on our consolidated financial statements.
In February 2013, the FASB issued updated guidance requiring entities to report the effect of significant reclassifications to accumulated other comprehensive income on the respective line items in net income. These reclassifications are reported only if U.S. GAAP requires the entire amount to be reclassified to net income. For other amounts that are not required under U.S. GAAP to be reclassified in their entirety from accumulated other comprehensive income to net income in the same reporting period, an entity is required to cross-reference other disclosures required under U.S. GAAP that provide additional detail about those amounts. We adopted this guidance in our interim period ended April 28, 2013. The adoption of this guidance did not impact our financial statements, as the guidance is related to disclosure only, and we have not had significant reclassifications out of accumulated other comprehensive income.
Note 2
- Stock-Based Compensation
We measure stock-based compensation expense based on the estimated fair value of equity awards at the grant date, and recognize the expense using a straight-line attribution method over the requisite employee service period. We estimate the fair value of employee stock options on the date of grant using a binomial model and we use the closing trading price of our common stock on the date of grant, minus a dividend yield discount, as the fair value of awards of RSUs. We estimate the fair value of shares to be issued our employee stock purchase plan using the Black-Scholes at the commencement of an offering period in March and September each year. Our stock-based compensation for employee stock purchase plan is expensed using an accelerated amortization model.
72
NVIDIA CORPORATION AND SUBSIDIARIES
NOTES TO THE CONSOLIDATED FINANCIAL STATEMENTS
(Continued)
Our consolidated statements of income include stock-based compensation expense, net of amounts capitalized as inventory, as follows:
|
|
Year Ended
|
||||||||||
|
January 26,
2014 |
January 27,
2013 |
January 29,
2012 |
|||||||||
|
|
(In thousands)
|
||||||||||
|
Cost of revenue
|
$
|
10,688
|
|
$
|
10,490
|
|
$
|
11,322
|
|
||
|
Research and development
|
82,940
|
|
82,157
|
|
80,502
|
|
|||||
|
Sales, general and administrative
|
42,667
|
|
44,015
|
|
44,530
|
|
|||||
|
Total
|
$
|
136,295
|
|
$
|
136,662
|
|
$
|
136,354
|
|
||
As of
January 26, 2014
and
January 27, 2013
, the aggregate amount of unearned stock-based compensation expense related to our equity awards was
$241.3 million
and
$208.7 million
, respectively, adjusted for estimated forfeitures. As of
January 26, 2014
and
January 27, 2013
, we expect to recognize the unearned stock-based compensation expense related to stock options over an estimated weighted average amortization period of 2.5 years and 2.7 years, respectively. As of both
January 26, 2014
and
January 27, 2013
, we expect to recognize the unearned stock-based compensation expense related to RSUs over an estimated weighted average amortization period of 2.7 years.
Stock-based compensation capitalized in inventories resulted in a net charge of
$0.1 million
,
$0.4 million
and
$0.1 million
in cost of revenue during the fiscal years ended
January 26, 2014
,
January 27, 2013
and
January 29, 2012
, respectively.
During fiscal years
2014
,
2013
and
2012
, we granted approximately
6.1 million
,
7.1 million
and
6.4 million
stock options, respectively, with estimated total grant-date fair values of
$21.3 million
,
$38.3 million
and
$52.4 million
, respectively, and weighted average grant-date fair values of
$3.47
,
$5.38
and
$8.16
per option, respectively. During fiscal years
2014
,
2013
and
2012
, we granted approximately
10.8 million
,
8.1 million
and
7.3 million
RSUs, respectively, with estimated total grant-date fair values of
$144.8 million
,
$112.8 million
and
$119.7 million
, respectively, and weighted average grant-date fair values of
$13.46
,
$13.86
and
$16.31
per RSU, respectively.
Of the estimated total grant-date fair value, we estimated that the stock-based compensation expense related to the equity awards that are not expected to vest for fiscal years
2014
,
2013
and
2012
was
$29.7 million
,
$27.1 million
and
$30.8 million
, respectively.
Valuation Assumptions
We determine the fair value of stock option awards on the date of grant using an option-pricing model that is affected by our stock price as well as assumptions regarding a number of highly complex and subjective variables. These variables include, but are not limited to, weighted average expected term, risk-free interest rate, expected stock price volatility, dividend yield, actual and projected employee stock option exercise behaviors, vesting schedules and death and disability probabilities. We segregate options into groups of employees with relatively homogeneous exercise behavior in order to calculate the best estimate of fair value using the binomial valuation model.
The expected life of employee stock options is a derived output of our valuation model and is impacted by the underlying assumptions of our company. The risk-free interest rate assumption is based upon observed interest rates on Treasury bills appropriate for the term of our employee stock options. Our management has determined that the use of implied volatility is expected to be more reflective of market conditions and, therefore, can reasonably be expected to be a better indicator of our expected volatility than historical volatility. Dividend yield is based on history and expectation of dividend payouts. Our RSU awards are not eligible for cash dividends prior to vesting; therefore, the fair value of RSUs is discounted by the dividend yield.
For awards granted on or subsequent to November 8, 2012, we use a dividend yield at grant date based on the per share dividends declared during the most recent quarter. Additionally, for employee stock option and RSU awards, we estimate forfeitures annually and revise the estimates of forfeiture in subsequent periods if actual forfeitures differ from those estimates. Forfeitures are estimated based on historical experience.
73
NVIDIA CORPORATION AND SUBSIDIARIES
NOTES TO THE CONSOLIDATED FINANCIAL STATEMENTS
(Continued)
The fair value of stock options granted under our stock option plans and shares issued under our employee stock purchase plan have been estimated with the following assumptions:
|
|
Year Ended
|
|||||
|
|
January 26,
2014 |
January 27,
2013 |
January 29,
2012 |
|||
|
Stock Options
|
(Using a binomial model)
|
|||||
|
Weighted average expected life (in years)
|
2.4-3.5
|
3.1-4.9
|
3.0-5.4
|
|
||
|
Risk-free interest rate
|
1.8%-3.0%
|
1.5%-2.3%
|
1.9%-3.8%
|
|
||
|
Volatility
|
28%-37%
|
39%-49%
|
46%-65%
|
|
||
|
Dividend yield
|
1.9%-2.4%
|
2.4%
|
—
|
|
||
|
|
Year Ended
|
||||||
|
|
January 26,
2014 |
January 27,
2013 |
January 29,
2012 |
||||
|
Employee Stock Purchase Plan
|
(Using the Black-Scholes model)
|
||||||
|
Weighted average expected life (in years)
|
0.5-2.0
|
0.5-2.0
|
|
0.5-2.0
|
|
||
|
Risk-free interest rate
|
0.1%-0.4%
|
0.1%-0.3%
|
|
0.1%-0.7%
|
|
||
|
Volatility
|
32%-37%
|
44%-47%
|
|
57%-61%
|
|
||
|
Dividend yield
|
2.0%-2.4%
|
—
|
|
—
|
|
||
Equity Incentive Program
We grant stock options, RSUs, and stock purchase rights under the following equity incentive plans.
Amended and Restated 2007 Equity Incentive Plan
At the Annual Meeting of Stockholders held on June 21, 2007, our stockholders approved the NVIDIA Corporation 2007 Equity Incentive Plan, or the 2007 Plan. At the Annual Meeting of Stockholders held on May 17, 2012, our stockholders approved an amendment and restatement of the 2007 Plan. At the Annual Meeting of Stockholders held on May 15, 2013, our stockholders re-approved the 2012 amendment and restatement of the 2007 Plan, or the Restated 2007 Plan.
The Restated 2007 Plan authorizes the issuance of incentive stock options, nonstatutory stock options, restricted stock, restricted stock unit, stock appreciation rights, performance stock awards, performance cash awards, and other stock-based awards to employees, directors and consultants. Only our employees may receive incentive stock options. With the amendment and restatement of the 2007 Plan, which increased the number of shares of common stock authorized for issuance under the 2007 Plan by
25,000,000
shares, up to
177,767,766
shares of our common stock may be issued pursuant to stock awards granted under the Restated 2007 Plan . Currently, we grant stock options and RSUs under our equity incentive plans. As of January 26, 2014, there were
24,722,435
shares available for future issuance under the Restated 2007 Plan.
Stock options granted to employees, subject to certain exceptions, vest over a four year period, subject to continued service, with
25% vesting on the anniversary of the hire date in the case of new hires or the anniversary of the date of grant in the case of grants to existing employees and 6.25% vesting at the end of each quarterly period thereafter
. Options granted under the 2007 Plan generally expire
ten
years from the date of grant.
With respect to RSUs, subject to certain exceptions, RSUs granted to employees vest over a four year period, subject to continued service, with
25% vesting on a pre-determined date that is close to the anniversary of the date of grant and 12.5% vesting semi-annually thereafter until fully vested
.
74
NVIDIA CORPORATION AND SUBSIDIARIES
NOTES TO THE CONSOLIDATED FINANCIAL STATEMENTS
(Continued)
Unless terminated sooner, the Restated 2007 Plan is scheduled to terminate on March 21, 2022. Our Board may suspend or terminate the Restated 2007 Plan at any time. No awards may be granted under the Restated 2007 Plan while the Restated 2007 Plan is suspended or after it is terminated. The Board may also amend the Restated 2007 Plan at any time. However, if legal, regulatory or listing requirements require stockholder approval, the amendment will not go into effect until the stockholders have approved the amendment.
PortalPlayer, Inc. 1999 Stock Option Plan
We assumed options issued under the PortalPlayer, Inc. 1999 Stock Option Plan, or the 1999 Plan, when we completed our acquisition of PortalPlayer on January 5, 2007. Options to purchase
920
shares of NVIDIA common stock remain outstanding under the 1999 Plan. We do not intend to grant future stock awards under the 1999 Plan.
1998 and 2012 Employee Stock Purchase Plans
In February 1998, our Board approved the 1998 Employee Stock Purchase Plan, or the 1998 Plan. At the Annual Meeting of Stockholders held on May 17, 2012, our stockholders approved the 2012 Employee Stock Purchase Plan, or the 2012 Plan, the successor to the 1998 Plan, and collectively with the 1998 Plan, the ESPP Plans.
Prior to the effective date of the 2012 Plan, we had authorized a total of
78,000,000
shares for issuance under the 1998 Plan,
54,567,667
shares of which had been issued,
15,000,000
shares of which were reserved for issuance pursuant to outstanding purchase rights and
8,432,333
shares of which were available for future issuance. Upon its approval by our stockholders, the maximum aggregate number of shares that could be issued under the 2012 Plan would not exceed
55,432,333
shares.
Effective upon the August 31, 2012 purchase date pursuant to the 1998 Plan, of the 15,000,000 shares which had been reserved for issuance pursuant to outstanding purchase rights,
2,687,698
shares were issued pursuant to outstanding purchase rights,
183,000
shares were available but reserved for future issuance, and the remaining
12,129,302
shares were moved into the share reserve of the 2012 Plan. Effective upon the February 28, 2013 purchase date pursuant to the 1998 Plan,
8,819
shares were issued pursuant to outstanding purchase rights, and the remaining
174,181
shares were moved into the share reserve of the 2012 Plan. At January 26, 2014, under the 2012 Plan, we had issued
6,115,403
shares and reserved
46,620,413
shares for future issuance.
Each of the ESPP Plans is intended to qualify as an “employee stock purchase plan” under Section 423 of the Internal Revenue Code. Under the current offerings adopted pursuant to the ESPP Plans, each offering period is
24
months, which is divided into four purchase periods of six months.
Employees are eligible to participate if they are employed by us or an affiliate of us as designated by the Board. Employees who participate in an offering may have up to
10%
of their earnings withheld pursuant to the ESPP Plans up to certain limitations and applied on specified dates determined by the Board to the purchase of shares of common stock. The Board may increase this percentage at its discretion, up to
15%
. The price of common stock purchased under the ESPP Plans will be equal to 85% of the lower of the fair market value of the common stock on the commencement date of each offering period and the purchase date of each offering period. During fiscal years
2014
,
2013
and
2012
, employees purchased approximately
6.1 million
,
5.5 million
, and
5.8 million
shares, respectively, under the ESPP Plans with weighted-average prices of
$10.79
,
$10.83
, and
$8.18
per share, respectively, and weighted average grant-date fair values of
$5.60
,
$5.16
and
$5.47
per share, respectively. Employees may end their participation in the ESPP Plans at any time during the offering period, and participation ends automatically on termination of employment with us and in each case their contributions are refunded.
75
NVIDIA CORPORATION AND SUBSIDIARIES
NOTES TO THE CONSOLIDATED FINANCIAL STATEMENTS
(Continued)
The following is a summary of our equity award transactions under our equity incentive plans:
|
Options Outstanding
|
Restricted Stock Units Outstanding
|
||||||||||||||||||||||
|
|
Total Stock
Awards
Available for
Grant
|
Number
of
Shares
|
Weighted
Average
Exercise Price
Per Share
|
Weighted
Average
Remaining
Contractual
Life
|
Aggregate
Intrinsic
Value (1)
|
Number of
Shares
|
Weighted
Average
Grant-Date
Fair Value
|
||||||||||||||||
|
Balances, January 30, 2011
|
33,736,488
|
|
44,001,458
|
|
$
|
12.88
|
|
|
|
10,611,914
|
|
$
|
13.23
|
|
|||||||||
|
Authorized
|
—
|
|
—
|
|
—
|
|
|
|
—
|
|
—
|
|
|||||||||||
|
Granted
|
(13,767,554
|
)
|
6,430,778
|
|
$
|
16.18
|
|
|
|
7,336,776
|
|
$
|
16.31
|
|
|||||||||
|
Exercised
|
—
|
|
(15,515,053
|
)
|
$
|
10.70
|
|
|
|
—
|
|
—
|
|
||||||||||
|
Vested restricted stock
|
—
|
|
—
|
|
—
|
|
(3,442,076
|
)
|
$
|
12.02
|
|
||||||||||||
|
Canceled and forfeited
|
2,457,018
|
|
(1,588,207
|
)
|
$
|
14.78
|
|
|
|
(868,811
|
)
|
$
|
14.72
|
|
|||||||||
|
Balances, January 29, 2012
|
22,425,952
|
|
33,328,976
|
|
$
|
14.44
|
|
|
|
13,637,803
|
|
$
|
15.10
|
|
|||||||||
|
Authorized (2)
|
25,000,000
|
|
—
|
|
—
|
|
|
|
—
|
|
—
|
|
|||||||||||
|
Granted
|
(15,254,977
|
)
|
7,119,319
|
|
$
|
13.88
|
|
|
|
8,135,658
|
|
$
|
13.86
|
|
|||||||||
|
Exercised
|
—
|
|
(3,646,680
|
)
|
$
|
8.66
|
|
|
|
—
|
|
—
|
|
||||||||||
|
Vested restricted stock
|
—
|
|
—
|
|
—
|
|
(5,691,623
|
)
|
$
|
15.02
|
|
||||||||||||
|
Canceled and forfeited
|
4,728,901
|
|
(3,806,290
|
)
|
$
|
17.04
|
|
|
|
(922,611
|
)
|
$
|
15.14
|
|
|||||||||
|
Balances, January 27, 2013
|
36,899,876
|
|
32,995,325
|
|
$
|
14.66
|
|
|
|
15,159,227
|
|
$
|
14.46
|
|
|||||||||
|
Authorized
|
—
|
|
—
|
|
|
|
|
|
—
|
|
—
|
|
|||||||||||
|
Granted
|
(16,905,398
|
)
|
6,148,672
|
|
$
|
14.30
|
|
|
|
10,756,726
|
|
$
|
13.46
|
|
|||||||||
|
Exercised
|
—
|
|
(3,058,530
|
)
|
$
|
10.26
|
|
|
|
—
|
|
—
|
|
||||||||||
|
Vested restricted stock
|
—
|
|
—
|
|
—
|
|
(5,906,509
|
)
|
$
|
14.79
|
|
||||||||||||
|
Canceled and forfeited
|
4,738,712
|
|
(3,581,556
|
)
|
$
|
21.85
|
|
|
(1,157,156
|
)
|
$
|
13.86
|
|
||||||||||
|
Balances, January 26, 2014
|
24,733,190
|
|
32,503,911
|
|
$
|
14.22
|
|
5.5
|
|
$
|
67,868,413
|
|
18,852,288
|
|
$
|
13.82
|
|
||||||
|
Exercisable at January 26, 2014
|
19,866,375
|
|
$
|
14.09
|
|
3.7
|
|
$
|
49,516,264
|
|
|||||||||||||
|
Vested and expected to vest after January 26, 2014
|
30,498,779
|
|
$
|
14.21
|
|
5.3
|
|
$
|
64,921,492
|
|
15,258,123
|
|
$
|
13.82
|
|
||||||||
(1) The aggregate intrinsic value in the table above represents the total pre-tax intrinsic value for in-the-money options at
January 26, 2014
, based on the
$15.56
closing stock price of our common stock on the NASDAQ Global Select Market on January 24, 2014, the last trading day of
fiscal year 2014
, which would have been received by the option holders had all in-the-money option holders exercised their options as of that date. The total number of in-the-money options outstanding and exercisable as of
January 26, 2014
was
39.9 million
shares and
12.3 million
shares, respectively.
(2) Represents the shares that were approved at our 2012 Annual Meeting of Stockholders and re-approved at our 2013 Annual Meeting of Stockholders.
The total intrinsic value of options exercised was
$14.4 million
,
$21.1 million
and
$105.3 million
for fiscal years
2014
,
2013
and
2012
, respectively. Upon exercise of an option, we issue new shares of stock. The total fair value of options vested was
$34.6 million
,
$40.3 million
and
$49.5 million
for fiscal years
2014
,
2013
and
2012
, respectively.
76
NVIDIA CORPORATION AND SUBSIDIARIES
NOTES TO THE CONSOLIDATED FINANCIAL STATEMENTS
(Continued)
The following is a reconciliation of the numerators and denominators of the basic and diluted net income per share computations for the periods presented:
|
|
Year Ended
|
||||||||||
|
|
January 26,
2014 |
January 27,
2013 |
January 29,
2012 |
||||||||
|
|
(In thousands, except per share data)
|
||||||||||
|
Numerator:
|
|
|
|
||||||||
|
Net income
|
$
|
439,990
|
|
$
|
562,536
|
|
$
|
581,090
|
|
||
|
Denominator:
|
|
|
|
||||||||
|
Denominator for basic net income per share, weighted average shares
|
587,893
|
|
619,324
|
|
603,646
|
|
|||||
|
Effect of dilutive securities:
|
|
|
|
||||||||
|
Stock awards outstanding
|
6,624
|
|
5,633
|
|
12,725
|
|
|||||
|
Denominator for diluted net income per share, weighted average shares
|
594,517
|
|
624,957
|
|
616,371
|
|
|||||
|
Net income per share:
|
|
|
|
||||||||
|
Basic net income per share
|
$
|
0.75
|
|
$
|
0.91
|
|
$
|
0.96
|
|
||
|
Diluted net income per share
|
$
|
0.74
|
|
$
|
0.90
|
|
$
|
0.94
|
|
||
|
Potentially dilutive securities excluded from income per diluted share because their effect would have been anti-dilutive
|
25,630
|
|
26,784
|
|
22,617
|
|
|||||
The denominator for diluted net income per share for fiscal year 2014 does not include any effect from the Notes. In accordance with ASC 260,
Earnings per Share,
commencing after the fiscal quarter ending on April 27, 2014, the Notes will not impact the denominator for diluted net income per share unless the average price of our common stock, as calculated under the terms of the Notes, exceeds the conversion price of
$20.16
per share. Likewise, the denominator for diluted net income per share will not include any effect from the warrants unless the average price of our common stock, as calculated under the terms of the warrants, exceeds
$27.14
per share.
The denominator for diluted net income per share for fiscal year 2014 also does not include any effect from the note hedges. In future periods, the denominator for diluted net income per share will exclude any effect of the note hedges, as their effect would be anti-dilutive. In the event an actual conversion of any or all of the Notes occurs, the shares that would be delivered to the Company under the note hedges are designed to neutralize the dilutive effect of the shares that the Company would issue under the Notes. Please refer to
Note 11
of these Notes to the Consolidated Financial Statements for discussion regarding the Notes.
77
NVIDIA CORPORATION AND SUBSIDIARIES
NOTES TO THE CONSOLIDATED FINANCIAL STATEMENTS
(Continued)
During fiscal year 2002, we completed the purchase of certain assets from 3dfx Interactive, Inc., or 3dfx, for an aggregate purchase price of approximately
$74.2 million
. On December 15, 2000, NVIDIA Corporation and one of our indirect subsidiaries entered into an Asset Purchase Agreement, or the APA, which closed on April 18, 2001, to purchase certain graphics chip assets from 3dfx.
In October 2002, 3dfx filed for Chapter 11 bankruptcy protection in the United States Bankruptcy Court for the Northern District of California. In March 2003, the Trustee appointed by the Bankruptcy Court to represent 3dfx’s bankruptcy estate served his complaint on NVIDIA. The Trustee’s complaint asserted claims for, among other things, successor liability and fraudulent transfer and sought additional payments from us. In early November 2005, NVIDIA and the Official Committee of Unsecured Creditors, or the Creditors’ Committee, agreed to a Plan of Liquidation of 3dfx, which included a conditional settlement of the Trustee’s claims against us. This conditional settlement was subject to a confirmation process through a vote of creditors and the review and approval of the Bankruptcy Court. The conditional settlement called for a payment by NVIDIA of approximately
$30.6 million
to the 3dfx estate. Under the settlement,
$5.6 million
related to various administrative expenses and Trustee fees, and
$25.0 million
related to the satisfaction of debts and liabilities owed to the general unsecured creditors of 3dfx. Accordingly, during the three month period ended October 30, 2005, we recorded
$5.6 million
as a charge to settlement costs and
$25.0 million
as additional purchase price for 3dfx. The Trustee advised that he intended to object to the settlement.
The conditional settlement reached in November 2005 never progressed through the confirmation process and the Trustee’s case still remains pending appeal. As such, we have not reversed the accrual of
$30.6 million
-
$5.6 million
as a charge to settlement costs and
$25.0 million
as additional purchase price for 3dfx that we recorded during the three months ended October 30, 2005, pending resolution of the appeal of the Trustee’s case.
The 3dfx asset purchase price of
$95.0 million
and
$4.2 million
of direct transaction costs were allocated based on fair values presented below. The final allocation of the purchase price of the 3dfx assets is contingent upon the outcome of all of the 3dfx litigation. Please refer to
Note 12
of these Notes to the Consolidated Financial Statements for further discussion regarding this litigation.
|
|
Fair Market Value
|
Straight-Line
Amortization Period
|
|||
|
|
(In thousands)
|
(In years)
|
|||
|
Property and equipment
|
$
|
2,433
|
|
1-2
|
|
|
Trademarks
|
11,310
|
|
5
|
||
|
Goodwill
|
85,418
|
|
—
|
||
|
Total
|
$
|
99,161
|
|
|
|
78
NVIDIA CORPORATION AND SUBSIDIARIES
NOTES TO THE CONSOLIDATED FINANCIAL STATEMENTS
(Continued)
Note 5
- Goodwill
The carrying amount of goodwill is as follows:
|
|
January 26,
2014 |
January 27,
2013 |
|||||
|
|
(In thousands)
|
||||||
|
Icera
|
$
|
271,186
|
|
$
|
271,186
|
|
|
|
PortalPlayer
|
104,896
|
|
104,896
|
|
|||
|
3dfx
|
75,326
|
|
75,326
|
|
|||
|
Mental Images
|
59,252
|
|
59,252
|
|
|||
|
MediaQ
|
35,167
|
|
35,167
|
|
|||
|
ULi
|
31,115
|
|
31,115
|
|
|||
|
Hybrid Graphics
|
27,906
|
|
27,906
|
|
|||
|
Ageia
|
19,198
|
|
19,198
|
|
|||
|
Portland Group Inc.
|
2,149
|
|
—
|
|
|||
|
Other
|
16,984
|
|
16,984
|
|
|||
|
Total goodwill
|
$
|
643,179
|
|
$
|
641,030
|
|
|
The amount of goodwill allocated to our GPU and Tegra Processor segments as of
January 26, 2014
was
$230.4 million
and
$412.8 million
, respectively, and as of
January 27, 2013
was
$228.2 million
and
$412.8 million
, respectively. Please refer to
Note 16
of these Notes to the Consolidated Financial Statements for further discussion regarding segments.
We allocate goodwill to our reporting units and perform our annual impairment test during the fourth quarter of our fiscal year, or earlier if indicators of potential impairment exist. For the purposes of completing our impairment test, we perform either a qualitative or a quantitative analysis on a reporting unit basis. We utilized a quantitative analysis to complete our most recent annual impairment test during the fourth quarter of fiscal year
2014
and concluded that there was no impairment, as the fair value of our reporting units exceeded their carrying values.
In a qualitative analysis, we evaluate factors including, but not limited to, macro-economic conditions, market and industry conditions, the competitive environment, the operational stability and the overall financial performance of the reporting units, including cost factors and actual revenue results. For reporting units in which the qualitative assessment concludes it is more likely than not that the fair value is more than its carrying value, no further goodwill impairment testing is required.
For those reporting units where a significant change or event has occurred, where potential impairment indicators exist, or for which we have not performed a quantitative assessment recently, we utilize a two-step quantitative assessment to testing goodwill for impairment. The first step tests for possible impairment by applying a fair value-based test by weighing the results from the income approach and the market approach. These valuation approaches consider a number of factors that include, but are not limited to, prospective financial information, growth rates, terminal or residual values, discount rates and comparable multiples from publicly traded companies in our industry and require us to make certain assumptions and estimates regarding industry economic factors and the future profitability of our business.
When performing an income approach valuation, we incorporate the use of projected financial information and a discount rate that are developed using market participant based assumptions to our discounted cash flow model. Our estimates of discounted cash flow were based upon, among other things, certain assumptions about our expected future operating performance, such as revenue growth rates, operating margins, risk-adjusted discount rates, and future economic and market conditions. The market method of determining the fair value of our reporting units requires us to use judgment in the selection of appropriate market comparables.
79
NVIDIA CORPORATION AND SUBSIDIARIES
NOTES TO THE CONSOLIDATED FINANCIAL STATEMENTS
(Continued)
The components of our amortizable intangible assets are as follows:
|
|
January 26, 2014
|
January 27, 2013
|
|||||||||||||||||||||||||
|
|
Gross
Carrying
Amount
|
Accumulated
Amortization
|
Net
Carrying
Amount
|
Weighted Average
Useful Life
|
Gross
Carrying
Amount
|
Accumulated
Amortization
|
Net
Carrying
Amount
|
Weighted Average Useful Life
|
|||||||||||||||||||
|
|
(In thousands)
|
(In years)
|
(In thousands)
|
(In years)
|
|||||||||||||||||||||||
|
Acquisition-related intangible assets
|
$
|
189,239
|
|
$
|
(114,104
|
)
|
$
|
75,135
|
|
6.5
|
$
|
172,039
|
|
$
|
(96,389
|
)
|
$
|
75,650
|
|
6.9
|
|||||||
|
Patents and licensed technology
|
446,196
|
|
(225,319
|
)
|
220,877
|
|
7.2
|
407,002
|
|
(170,320
|
)
|
236,682
|
|
7.0
|
|||||||||||||
|
Total intangible assets
|
$
|
635,435
|
|
$
|
(339,423
|
)
|
$
|
296,012
|
|
|
$
|
579,041
|
|
$
|
(266,709
|
)
|
$
|
312,332
|
|
|
|||||||
Amortization expense associated with intangible assets for fiscal years
2014
,
2013
and
2012
was
$72.7 million
,
$68.4 million
and
$59.0 million
, respectively. Amortization expense increased compared to the prior year primarily due to the addition of licensed technology, patent portfolios and the acquisition of certain assets from a business combination during fiscal year 2014. Future amortization expense for the net carrying amount of intangible assets at
January 26, 2014
is estimated to be
$79.4 million
in fiscal year
2015
,
$72.7 million
in fiscal year
2016
,
$59.4 million
in fiscal year
2017
,
$48.1 million
in fiscal year
2018
,
$19.9 million
in fiscal year
2019
and
$16.5 million
in fiscal years subsequent to fiscal year
2019
until fully amortized.
Note 7
- Marketable Securities
All of the cash equivalents and marketable securities are classified as “available-for-sale” securities. Investments in both fixed and floating rate interest earning instruments carry a degree of interest rate risk. Fixed rate debt securities may have their market value adversely impacted due to a rise in interest rates, while floating rate securities may produce less income than expected if interest rates fall. Due in part to these factors, our future investment income may fall short of expectations due to changes in interest rates or if the decline in fair value of our publicly traded debt or equity investments is judged to be other-than-temporary. We may suffer losses in principal if we are forced to sell securities that decline in market value due to changes in interest rates. However, because any debt securities we hold are classified as “available-for-sale,” no gains or losses are realized in our consolidated statement of income due to changes in interest rates unless such securities are sold prior to maturity or unless declines in market values are determined to be other-than-temporary. These securities are reported at fair value with the related unrealized gains and losses included in accumulated other comprehensive income, a component of stockholders’ equity, net of tax.
80
NVIDIA CORPORATION AND SUBSIDIARIES
NOTES TO THE CONSOLIDATED FINANCIAL STATEMENTS
(Continued)
The following is a summary of cash equivalents and marketable securities at
January 26, 2014
and
January 27, 2013
:
|
|
January 26, 2014
|
||||||||||||||
|
|
Amortized
Cost
|
Unrealized
Gain
|
Unrealized
Loss
|
Estimated
Fair Value
|
|||||||||||
|
|
(In thousands)
|
||||||||||||||
|
Debt securities of United States government agencies
|
$
|
1,012,740
|
|
$
|
848
|
|
$
|
(261
|
)
|
$
|
1,013,327
|
|
|||
|
Corporate debt securities
|
1,827,788
|
|
1,857
|
|
(1,065
|
)
|
1,828,580
|
|
|||||||
|
Mortgage backed securities issued by United States government-sponsored enterprises
|
185,594
|
|
3,837
|
|
(725
|
)
|
188,706
|
|
|||||||
|
Money market funds
|
307,865
|
|
—
|
|
—
|
|
307,865
|
|
|||||||
|
Debt securities issued by United States Treasury
|
495,889
|
|
621
|
|
(57
|
)
|
496,453
|
|
|||||||
|
Asset-backed securities
|
258,017
|
|
15
|
|
(315
|
)
|
257,717
|
|
|||||||
|
Total
|
$
|
4,087,893
|
|
$
|
7,178
|
|
$
|
(2,423
|
)
|
$
|
4,092,648
|
|
|||
|
Classified as:
|
|
|
|
|
|||||||||||
|
Cash equivalents
|
|
|
|
$
|
572,425
|
|
|||||||||
|
Marketable securities
|
|
|
|
3,520,223
|
|
||||||||||
|
Total
|
|
|
|
$
|
4,092,648
|
|
|||||||||
|
|
January 27, 2013
|
||||||||||||||
|
|
Amortized
Cost
|
Unrealized
Gain
|
Unrealized
Loss
|
Estimated
Fair Value
|
|||||||||||
|
|
(In thousands)
|
||||||||||||||
|
Debt securities of United States government agencies
|
$
|
867,087
|
|
$
|
1,199
|
|
$
|
(139
|
)
|
$
|
868,147
|
|
|||
|
Corporate debt securities
|
1,255,297
|
|
3,175
|
|
(542
|
)
|
1,257,930
|
|
|||||||
|
Mortgage backed securities issued by United States government-sponsored enterprises
|
183,034
|
|
6,194
|
|
(57
|
)
|
189,171
|
|
|||||||
|
Money market funds
|
195,790
|
|
—
|
|
—
|
|
195,790
|
|
|||||||
|
Debt securities issued by United States Treasury
|
785,228
|
|
1,102
|
|
(105
|
)
|
786,225
|
|
|||||||
|
Total
|
$
|
3,286,436
|
|
$
|
11,670
|
|
$
|
(843
|
)
|
$
|
3,297,263
|
|
|||
|
Classified as:
|
|
|
|
|
|||||||||||
|
Cash equivalents
|
|
|
|
$
|
302,166
|
|
|||||||||
|
Marketable securities
|
|
|
|
2,995,097
|
|
||||||||||
|
Total
|
|
|
|
$
|
3,297,263
|
|
|||||||||
81
NVIDIA CORPORATION AND SUBSIDIARIES
NOTES TO THE CONSOLIDATED FINANCIAL STATEMENTS
(Continued)
The following table provides the breakdown of the investments with unrealized losses at
January 26, 2014
:
|
|
Less than 12 months
|
12 months or greater
|
Total
|
||||||||||||||||||||
|
|
Fair Value
|
Gross
Unrealized
Losses
|
Fair Value
|
Gross
Unrealized
Losses
|
Fair Value
|
Gross
Unrealized
Losses
|
|||||||||||||||||
|
|
(In thousands)
|
||||||||||||||||||||||
|
Corporate debt securities
|
$
|
789,095
|
|
$
|
(87
|
)
|
$
|
1,039,485
|
|
$
|
(978
|
)
|
$
|
1,828,580
|
|
$
|
(1,065
|
)
|
|||||
|
Mortgage backed securities issued by United States government-sponsored enterprises
|
999
|
|
—
|
|
187,707
|
|
(725
|
)
|
188,706
|
|
(725
|
)
|
|||||||||||
|
Debt securities of United States Treasury
|
88,984
|
|
(9
|
)
|
407,469
|
|
(48
|
)
|
496,453
|
|
(57
|
)
|
|||||||||||
|
Debt securities issued by United States government agencies
|
576,920
|
|
(100
|
)
|
436,407
|
|
(161
|
)
|
1,013,327
|
|
(261
|
)
|
|||||||||||
|
Asset-backed securities
|
119,889
|
|
(119
|
)
|
137,828
|
|
(196
|
)
|
257,717
|
|
(315
|
)
|
|||||||||||
|
Total
|
$
|
1,575,887
|
|
$
|
(315
|
)
|
$
|
2,208,896
|
|
$
|
(2,108
|
)
|
$
|
3,784,783
|
|
$
|
(2,423
|
)
|
|||||
We performed an impairment review of our investment portfolio as of
January 26, 2014
. Factors considered included general market conditions, the duration and extent to which fair value is below cost, and our intent and ability to hold an investment for a sufficient period of time to allow for recovery in value. We also consider specific adverse conditions related to the financial health of and business outlook for an investee, including industry and sector performance, changes in technology, operational and financing cash flow factors, and changes in an investee’s credit rating. Investments that we identify as having an indicator of impairment are subject to further analysis to determine if the investment was other than temporarily impaired. Based on our quarterly impairment review and having considered the guidance in the relevant accounting literature, we did not record any other-than-temporary impairment charges during
fiscal year 2014
. We concluded that our investments were appropriately valued and that no other than temporary impairment charges were necessary on our portfolio of available for sale investments as of
January 26, 2014
.
As of
January 26, 2014
, we had
eight
investments that were in an unrealized loss position with total unrealized losses amounting to
$0.3 million
and with a duration of less than one year. The gross unrealized losses related to fixed income securities were due to changes in interest rates. We have determined that the gross unrealized losses on investment securities at
January 26, 2014
are temporary in nature. Currently, we have the intent and ability to hold our investments with impairment indicators until maturity.
Net realized gains were
$2.4 million
,
$0.5 million
and
$0.4 million
for fiscal years
2014
,
2013
, and
2012
, respectively. As of
January 26, 2014
, we had a net unrealized gain of
$4.8 million
, which was comprised of gross unrealized gains of
$7.2 million
, offset by
$2.4 million
of gross unrealized losses. As of
January 27, 2013
, we had a net unrealized gain of
$10.9 million
, which was comprised of gross unrealized gains of
$11.7 million
, offset by
$0.8 million
of gross unrealized losses.
The amortized cost and estimated fair value of cash equivalents and marketable securities which are primarily debt instruments are classified as available-for-sale at
January 26, 2014
and
January 27, 2013
and are shown below by contractual maturity.
|
|
January 26, 2014
|
January 27, 2013
|
|||||||||||||
|
|
Amortized
Cost
|
Estimated
Fair Value
|
Amortized
Cost
|
Estimated
Fair Value
|
|||||||||||
|
|
(In thousands)
|
||||||||||||||
|
Less than one year
|
$
|
1,883,132
|
|
$
|
1,883,753
|
|
$
|
1,397,350
|
|
$
|
1,399,304
|
|
|||
|
Due in 1 - 5 years
|
2,114,289
|
|
2,117,387
|
|
1,777,785
|
|
1,783,103
|
|
|||||||
|
Mortgage-backed securities issued by government-sponsored enterprises not due at a single maturity date
|
90,472
|
|
91,508
|
|
111,301
|
|
114,856
|
|
|||||||
|
Total
|
$
|
4,087,893
|
|
$
|
4,092,648
|
|
$
|
3,286,436
|
|
$
|
3,297,263
|
|
|||
82
NVIDIA CORPORATION AND SUBSIDIARIES
NOTES TO THE CONSOLIDATED FINANCIAL STATEMENTS
(Continued)
We measure our cash equivalents and marketable securities at fair value. The fair values of our financial assets and liabilities are determined using quoted market prices of identical assets or quoted market prices of similar assets from active markets. Our Level 1 assets consist of our money market funds. We classify securities within Level 1 assets when the fair value is obtained from real time quotes for transactions in active exchange markets involving identical assets. Our available-for- sale securities are classified as having Level 2 inputs. Our Level 2 assets are valued utilizing a market approach where the market prices of similar assets are provided by a variety of independent industry standard data providers to our investment custodian. There were no significant transfers between Levels 1 and 2 assets for the year ended
January 26, 2014
. Level 3 assets are based on unobservable inputs to the valuation methodology and include our own data about assumptions market participants would use in pricing the asset or liability based on the best information available under the circumstances.
Financial assets and liabilities measured at fair value are summarized below:
|
|
|
Fair Value Measurement at Reporting Date Using
|
|||||||||
|
|
|
Quoted Prices in Active Markets for Identical Assets
|
Significant Other Observable Inputs
|
||||||||
|
|
January 26, 2014
|
(Level 1)
|
(Level 2)
|
||||||||
|
(In thousands)
|
|||||||||||
|
Debt securities of United States government agencies (1)
|
$
|
1,013,327
|
|
$
|
—
|
|
$
|
1,013,327
|
|
||
|
Corporate debt securities (2)
|
1,828,580
|
|
—
|
|
1,828,580
|
|
|||||
|
Mortgage backed securities issued by United States government-sponsored enterprises (3)
|
188,706
|
|
—
|
|
188,706
|
|
|||||
|
Money market funds (4)
|
307,865
|
|
307,865
|
|
—
|
|
|||||
|
Debt securities issued by United States Treasury (3)
|
496,453
|
|
—
|
|
496,453
|
|
|||||
|
Asset-backed securities (3)
|
257,717
|
|
—
|
|
257,717
|
|
|||||
|
Total assets
|
$
|
4,092,648
|
|
$
|
307,865
|
|
$
|
3,784,783
|
|
||
|
(1)
|
Includes
$30.0 million
in Cash Equivalents and
$983.3 million
in Marketable Securities on the Consolidated Balance Sheet.
|
|
(2)
|
Includes $
234.6 million
in Cash Equivalents and $
1,594.0 million
in Marketable Securities on the Consolidated Balance Sheet.
|
|
(3)
|
Included in Marketable Securities on the Consolidated Balance Sheet.
|
|
(4)
|
Included in Cash Equivalents on the Consolidated Balance Sheet.
|
83
NVIDIA CORPORATION AND SUBSIDIARIES
NOTES TO THE CONSOLIDATED FINANCIAL STATEMENTS
(Continued)
Certain balance sheet components are as follows:
|
|
January 26,
2014 |
January 27,
2013 |
|||||
|
Inventories:
|
(In thousands)
|
||||||
|
Raw materials
|
$
|
126,896
|
|
$
|
157,989
|
|
|
|
Work in-process
|
94,844
|
|
67,352
|
|
|||
|
Finished goods
|
166,025
|
|
187,126
|
|
|||
|
Total inventories
|
$
|
387,765
|
|
$
|
412,467
|
|
|
|
|
January 26,
2014 |
January 27,
2013 |
Estimated
Useful Life
|
||||||
|
|
(In thousands)
|
(In years)
|
|||||||
|
Property and Equipment:
|
|
|
|
||||||
|
Land
|
$
|
218,496
|
|
$
|
218,496
|
|
(A)
|
||
|
Building
|
19,268
|
|
30,869
|
|
5-25
|
||||
|
Test equipment
|
412,862
|
|
349,530
|
|
3-5
|
||||
|
Software and licenses
|
120,435
|
|
245,734
|
|
3-5
|
||||
|
Leasehold improvements
|
178,884
|
|
159,413
|
|
(B)
|
||||
|
Computer equipment
|
204,344
|
|
174,712
|
|
3
|
||||
|
Office furniture and equipment
|
58,874
|
|
58,712
|
|
5
|
||||
|
Capital leases
|
28,481
|
|
27,231
|
|
(B)
|
||||
|
Construction in process
|
41,176
|
|
24,085
|
|
(C)
|
||||
|
Total property and equipment, gross
|
1,282,820
|
|
1,288,782
|
|
|
||||
|
Accumulated depreciation and amortization
|
(700,080
|
)
|
(712,638
|
)
|
|
||||
|
Total property and equipment, net
|
$
|
582,740
|
|
$
|
576,144
|
|
|
||
(A) Land is a non-depreciable asset.
(B) Leasehold improvements and capital leases are amortized based on the lesser of either the asset’s estimated useful life or the remaining expected lease term.
(C) Construction in process represents assets that are not in service as of the balance sheet date.
Depreciation expense for fiscal years
2014
,
2013
and
2012
was
$164.0 million
,
$157.6 million
and
$145.2 million
, respectively.
|
|
January 26,
2014 |
January 27,
2013 |
|||||
|
Accrued Liabilities:
|
(In thousands)
|
||||||
|
Deferred revenue
|
$
|
273,108
|
|
$
|
273,605
|
|
|
|
Accrued customer programs (1)
|
157,840
|
|
163,406
|
|
|||
|
Customer advances
|
9,297
|
|
9,090
|
|
|||
|
Warranty accrual (2)
|
7,571
|
|
14,874
|
|
|||
|
Accrued payroll and related expenses
|
109,721
|
|
98,977
|
|
|||
|
Accrued legal settlement (3)
|
30,600
|
|
30,600
|
|
|||
|
Taxes payable, short- term
|
2,378
|
|
3,173
|
|
|||
|
Other
|
30,590
|
|
26,070
|
|
|||
|
Total accrued liabilities and other
|
$
|
621,105
|
|
$
|
619,795
|
|
|
84
NVIDIA CORPORATION AND SUBSIDIARIES
NOTES TO THE CONSOLIDATED FINANCIAL STATEMENTS
(Continued)
(1) Please refer to
Note 1
of these Notes to the Consolidated Financial Statements for discussion regarding the nature of accrued customer programs and their accounting treatment related to our revenue recognition policies and estimates.
(2) Please refer to
Note 10
of these Notes to the Consolidated Financial Statements for discussion regarding the warranty accrual.
(3) Please refer to
Note 12
of these Notes to the Consolidated Financial Statements for discussion regarding the 3dfx litigation.
|
|
January 26,
2014 |
January 27,
2013 |
|||||
|
Other Long Term Liabilities:
|
(In thousands)
|
||||||
|
Deferred income tax liability
|
$
|
157,953
|
|
$
|
192,950
|
|
|
|
Income tax payable
|
119,977
|
|
115,267
|
|
|||
|
Asset retirement obligations
|
11,056
|
|
10,165
|
|
|||
|
Deferred revenue
|
172,199
|
|
236,152
|
|
|||
|
Other
|
13,940
|
|
34,787
|
|
|||
|
Total other long-term liabilities
|
$
|
475,125
|
|
$
|
589,321
|
|
|
Note 10
- Guarantees
U.S. GAAP requires that upon issuance of a guarantee, the guarantor must recognize a liability for the fair value of the obligation it assumes under that guarantee. In addition, U.S. GAAP requires disclosures about the guarantees that an entity has issued, including a tabular reconciliation of the changes of the entity’s product warranty liabilities.
Accrual for estimated product returns and product warranty liabilities
We record a reduction to revenue for estimated product returns at the time revenue is recognized primarily based on historical return rates. Cost of revenue includes the estimated cost of product warranties that are calculated at the point of revenue recognition. Under limited circumstances, we may offer an extended limited warranty to customers for certain products. Additionally, we accrue for known warranty and indemnification issues if a loss is probable and can be reasonably estimated. During periods prior to fiscal year 2012, we recorded a cumulative net charge of
$475.9 million
, most of which was charged against cost of revenue, to cover customer warranty, repair, return, replacement and other costs arising from a weak die/packaging material set in certain versions of our previous generation MCP and GPU products used in notebook configurations. During fiscal year 2014, we released the remaining
$7.8 million
unclaimed balance of that warranty accrual.
The estimated product returns and estimated product warranty liabilities for fiscal years
2014
,
2013
and
2012
are as follows:
|
|
January 26,
2014 |
January 27,
2013 |
January 29,
2012 |
||||||||
|
|
(In thousands)
|
||||||||||
|
Balance at beginning of period (1)
|
$
|
14,874
|
|
$
|
18,406
|
|
$
|
107,896
|
|
||
|
Additions
|
6,786
|
|
5,738
|
|
7,329
|
|
|||||
|
Deductions (2)
|
(14,089
|
)
|
(9,270
|
)
|
(96,819
|
)
|
|||||
|
Balance at end of period
|
$
|
7,571
|
|
$
|
14,874
|
|
$
|
18,406
|
|
||
(1) Includes a balance of
$9.6 million
,
$13.2 million
and
$103.7 million
for fiscal years 2014, 2013 and
2012
, respectively, for the remaining amount of the warranty accrual associated with incremental repair and replacement costs from a weak die/packaging material set, which we recorded prior to fiscal year 2012.
(2) Includes $
1.8 million
, $
3.0 million
and $
73.3 million
for fiscal years
2014
,
2013
and
2012
, respectively, in payments related to weak die/packaging set warranty accrual recorded prior to fiscal year 2012, and $7.8 million related to the release of the final unclaimed portion of that accrual during fiscal year 2014.
85
NVIDIA CORPORATION AND SUBSIDIARIES
NOTES TO THE CONSOLIDATED FINANCIAL STATEMENTS
(Continued)
In connection with certain agreements that we have executed in the past, we have at times provided indemnities to cover the indemnified party for matters such as tax, product and employee liabilities. We have also on occasion included intellectual property indemnification provisions in our technology related agreements with third parties. Maximum potential future payments cannot be estimated because many of these agreements do not have a maximum stated liability. As such, we have not recorded any liability in our Consolidated Financial Statements for such indemnifications.
Note 11
- Long-Term Debt
1.00 % Convertible Senior Notes Due 2018
On December 2, 2013, we issued
$1.5 billion
of
1.00%
convertible senior notes due 2018, or the Notes. The Notes are unsecured, unsubordinated obligations of the Company, which pay interest in cash semi-annually at a rate of 1.00% per annum. The Notes will mature on December 1, 2018 unless earlier repurchased or converted in accordance with their terms prior to such date. The Notes may be converted, under the conditions specified below, based on an initial conversion rate of approximately
49.60
shares of common stock per $1,000 principal amount of Notes (equivalent to an initial conversion price of approximately
$20.16
per share of common stock), subject to adjustment as described in the indenture governing the Notes.
Holders may convert their notes at their option at any time prior to August 1, 2018 only under the following circumstances:
(1) during any fiscal quarter commencing after the fiscal quarter ending on April 27, 2014 (and only during such fiscal quarter), if the last reported sale price of the common stock for at least 20 trading days (whether or not consecutive) during a period of 30 consecutive trading days ending on the last trading day of the immediately preceding fiscal quarter is greater than or equal to 130% of the conversion price on each applicable trading day; (2) during the five business day period after any five consecutive trading day period (the measurement period) in which the trading price per $1,000 principal amount of notes for each trading day of the measurement period was less than 98% of the product of the last reported sale price of our common stock and the conversion rate on each such trading day; or (3) upon the occurrence of specified corporate events. On or after August 1, 2018 to the close of business on the second scheduled trading day immediately preceding the maturity date, holders may convert all or any portion of their notes regardless of the foregoing conditions. Upon conversion, we will pay cash up to the aggregate principal amount of the notes to be converted and pay or deliver, as the case may be, cash, shares of our common stock or a combination of cash and shares of our common stock, at our election, in respect of the remainder, if any, of our conversion obligation in excess of the aggregate principal amount of the notes being converted.
As of January 26, 2014, none of the conditions allowing holders of the Notes to convert had been met. The determination of whether or not the Notes are convertible must be performed quarterly. If the Notes become convertible at the option of the holder, the difference between the principal amount and the carrying value of the Notes would be reflected as convertible debt in the mezzanine equity section on our Consolidated Balance Sheets.
In accordance with ASC 470-20
Debt with Conversion and Other Options
, all cash-settled convertible debt should be separated into debt and equity components at issuance and be assigned a fair value. The value assigned to the debt component is the estimated fair value, as of the issuance date, of a similar debt without the conversion feature. The difference between the net cash proceeds and this estimated fair value, represents the value assigned to the equity component and is recorded as a debt discount. The debt discount is amortized using the effective interest method from the origination date through its stated contractual maturity date.
The initial debt component of the Notes was valued at
$1,351.8 million
based on the contractual cash flows discounted at an appropriate market rate for a non-convertible debt at the date of issuance, which was determined to be
3.15%
. The carrying value of the permanent equity component reported in additional paid-in-capital was valued at
$125.7 million
and recorded as a debt discount. This amount, together with the
$22.5 million
purchaser's discount to the par value of the Notes represents the total unamortized debt discount of
$148.2 million
we recorded at the time of issuance of the Notes. The aggregate debt discount is amortized as interest expense over the contractual term of the Notes using the effective interest method using an interest rate of
3.15%
.
86
NVIDIA CORPORATION AND SUBSIDIARIES
NOTES TO THE CONSOLIDATED FINANCIAL STATEMENTS
(Continued)
The following table presents the carrying amounts of the liability and equity components:
|
January 26,
2014
|
||||
|
(In thousands)
|
||||
|
Amount of the equity component
|
$
|
125,725
|
|
|
|
1.00% convertible senior notes due 2018
|
$
|
1,500,000
|
|
|
|
Unamortized debt discount (1)
|
(143,625
|
)
|
||
|
Net carrying amount
|
$
|
1,356,375
|
|
|
(1) As of January 26, 2014, the remaining period over which the unamortized debt discount will be amortized is 4.83 years.
The following table presents the interest expense for the contractual interest and the accretion of debt discount:
|
Year Ended
|
||||
|
January 26,
2014
|
||||
|
(In thousands)
|
||||
|
Contractual coupon interest expense
|
$
|
2,500
|
|
|
|
Amortization of debt discount
|
4,600
|
|
||
|
Amortization of debt issuance costs
|
34
|
|
||
|
Total interest expense related to Notes
|
$
|
7,134
|
|
|
As of January 26, 2014, the fair value of the Notes was approximately
$1,528.4 million
. The 2018 Notes are classified within Level 2 as they are not actively traded in markets.
Note Hedges and Warrants
The net proceeds from the Notes were approximately
$1,477.5 million
after payment of the initials purchaser's discount. Concurrently with the offering of the Notes, we entered into a convertible note hedge transaction, or the Note Hedges, with a strike price equal to the initial conversion price of the Notes, or approximately
$20.16
per share. The Note Hedges allow us to receive shares of our common stock and/or cash related to the excess conversion value that we would pay to the holders of the Notes upon conversion. We paid
$167.1 million
for the Note Hedges.
In addition, concurrent with the offering of the Notes and the purchase of the Note Hedges, we entered into a separate warrant transaction, or the Warrants, with a strike price to the holders of the Warrants of approximately
$27.14
per share. The Warrants are net share settled and cover, subject to customary antidilution adjustments, approximately
74.4 million
shares of our common stock. We received
$59.1 million
for the Warrants transaction.
The
$108.0 million
net cost of the Note Hedges offset by the proceeds from the Warrants is included as a net reduction to additional paid-in capital in the stockholders’ equity section of our consolidated balance sheets, in accordance with the guidance in ASC 815-40
Derivatives and Hedging-Contracts in Entity's Own Equity.
87
NVIDIA CORPORATION AND SUBSIDIARIES
NOTES TO THE CONSOLIDATED FINANCIAL STATEMENTS
(Continued)
Note 12
- Commitments and Contingencies
Inventory Purchase Obligations
At
January 26, 2014
and
January 27, 2013
, we had outstanding inventory purchase obligations totaling
$397.7 million
and
$470.3 million
, respectively.
Capital Purchase Obligations
At
January 26, 2014
and
January 27, 2013
, we had outstanding capital purchase obligations totaling
$41.3 million
and
$44.8 million
, respectively.
Lease Obligations
Our headquarters complex is located in Santa Clara, California and includes eight buildings that are leased properties. The lease agreements for three of the eight leased properties expire in fiscal year 2020 and include two five-year renewals at our option; one leased building expires in fiscal year 2019 that also has two five-year renewal options; one lease property expires in fiscal year 2018; one lease property expires in fiscal year 2017 with a five-year renewal at our option; and two leased buildings expire in fiscal year 2015, one with a seven-year renewal at our option. Future minimum lease payments related to headquarters operating leases total
$81.0 million
over the remaining terms of the leases, including predetermined rent escalations, and are included in the future minimum lease payment schedule below.
In addition to the commitment of our headquarters, we have other domestic and international office facilities under operating leases expiring through fiscal year 2025. We also include non-cancelable obligations under certain software licensing arrangements as operating leases.
Future minimum lease payments under our non-cancelable operating leases as of
January 26, 2014
, are as follows:
|
|
Future Minimum Lease Obligations
|
||
|
|
(In thousands)
|
||
|
Fiscal Year:
|
|
||
|
2015
|
$
|
74,007
|
|
|
2016
|
70,800
|
|
|
|
2017
|
60,884
|
|
|
|
2018
|
29,262
|
|
|
|
2019
|
22,202
|
|
|
|
2020 and thereafter
|
34,693
|
|
|
|
Total
|
$
|
291,848
|
|
Rent expense for the years ended
January 26, 2014
,
January 27, 2013
and
January 29, 2012
was
$43.8 million
,
$38.4 million
and
$37.9 million
, respectively.
88
NVIDIA CORPORATION AND SUBSIDIARIES
NOTES TO THE CONSOLIDATED FINANCIAL STATEMENTS
(Continued)
Capital lease obligations include building and office equipment lease obligations. The building lease relates to our data center in Santa Clara, California. Future minimum lease payments under the building capital lease total
$25.8 million
over the remaining lease term, including predetermined rent escalations, and are included in the future minimum lease payment schedule below:
|
|
Future Capital Lease Obligations
|
||
|
|
(In thousands)
|
||
|
Fiscal Year:
|
|
|
|
|
2015
|
$
|
5,168
|
|
|
2016
|
5,303
|
|
|
|
2017
|
5,453
|
|
|
|
2018
|
5,607
|
|
|
|
2019
|
5,767
|
|
|
|
2020 and thereafter
|
26
|
|
|
|
Total
|
$
|
27,324
|
|
|
Present value of minimum lease payments
|
$
|
20,417
|
|
|
|
|
||
|
Current portion
|
$
|
2,917
|
|
|
Long-term portion
|
$
|
17,500
|
|
Litigation
3dfx
On December 15, 2000, NVIDIA and one of our indirect subsidiaries entered into an Asset Purchase Agreement, or APA, to purchase certain graphics chip assets from 3dfx. The transaction closed on April 18, 2001. That acquisition, and 3dfx's October 2002 bankruptcy filing, led to four lawsuits against NVIDIA: two brought by 3dfx's former landlords, one by 3dfx's bankruptcy trustee and the fourth by a committee of 3dfx's equity security holders in the bankruptcy estate. The two landlord cases have been settled with payments from the landlords to NVIDIA, and the equity security holders' lawsuit was dismissed with prejudice and no appeal was filed. Accordingly, only the bankruptcy trustee suit remains outstanding as more fully explained below.
In March 2003, the Trustee appointed by the Bankruptcy Court to represent 3dfx's bankruptcy estate served a complaint on NVIDIA asserting claims for, among other things, successor liability and fraudulent transfer and seeking additional payments from us. The Trustee's fraudulent transfer theory alleged that NVIDIA had failed to pay reasonably equivalent value for 3dfx's assets, and sought recovery of the difference between the
$70.0 million
paid and the alleged fair value, which difference the Trustee estimated to exceed
$50.0 million
. The Trustee's successor liability theory alleged NVIDIA was effectively 3dfx's legal successor and therefore was responsible for all of 3dfx's unpaid liabilities.
On October 13, 2005, the Bankruptcy Court heard the Trustee's motion for summary adjudication, and on December 23, 2005, denied that motion in all material respects and held that NVIDIA may not dispute that the value of the 3dfx transaction was less than
$108.0 million
. The Bankruptcy Court denied the Trustee's request to find that the value of the 3dfx assets conveyed to NVIDIA was at least $108.0 million.
In early November 2005, after several months of mediation, NVIDIA and the Official Committee of Unsecured Creditors, or the Creditors' Committee, agreed to a Plan of Liquidation of 3dfx, which included a conditional settlement of the Trustee's claims against us. This conditional settlement was subject to a confirmation process through a vote of creditors and the review and approval of the Bankruptcy Court. The conditional settlement called for a payment by NVIDIA of approximately
$30.6 million
to the 3dfx estate. Under the settlement,
$5.6 million
related to various administrative expenses and Trustee fees, and
$25.0 million
related to the satisfaction of debts and liabilities owed to the general unsecured creditors of 3dfx. Accordingly, during the three month period ended October 30, 2005, we recorded $5.6 million as a charge to settlement costs and $25.0 million as additional purchase price for 3dfx. The Trustee advised that he intended to object to the settlement. The conditional settlement never progressed substantially through the confirmation process.
89
NVIDIA CORPORATION AND SUBSIDIARIES
NOTES TO THE CONSOLIDATED FINANCIAL STATEMENTS
(Continued)
On December 21, 2006, the Bankruptcy Court scheduled a trial for one portion of the Trustee's case against NVIDIA. On January 2, 2007, NVIDIA terminated the settlement agreement on grounds that the Bankruptcy Court had failed to proceed toward confirmation of the Creditors' Committee's plan. A non-jury trial began on March 21, 2007 on valuation issues in the Trustee's constructive fraudulent transfer claims against NVIDIA. Specifically, the Bankruptcy Court tried four questions: (1) what did 3dfx transfer to NVIDIA in the APA; (2) of what was transferred, what qualifies as “property” subject to the Bankruptcy Court's avoidance powers under the Uniform Fraudulent Transfer Act and relevant bankruptcy code provisions; (3) what is the fair market value of the “property” identified in answer to question (2); and (4) was the $70.0 million that NVIDIA paid “reasonably equivalent” to the fair market value of that property. The parties completed post-trial briefing on May 25, 2007.
On April 30, 2008, the Bankruptcy Court issued its Memorandum Decision After Trial, in which it provided a detailed summary of the trial proceedings and the parties' contentions and evidence and concluded that “the creditors of 3dfx were not injured by the Transaction.” This decision did not entirely dispose of the Trustee's action, however, as the Trustee's claims for successor liability and intentional fraudulent conveyance were still pending. On June 19, 2008, NVIDIA filed a motion for summary judgment to convert the Memorandum Decision After Trial to a final judgment. That motion was granted in its entirety and judgment was entered in NVIDIA's favor on September 11, 2008. The Trustee filed a Notice of Appeal from that judgment on September 22, 2008, and on September 25, 2008, NVIDIA exercised its election to have the appeal heard by the United States District Court.
The District Court's hearing on the Trustee's appeal was held on June 10, 2009. On December 20, 2010, the District Court issued an Order affirming the Bankruptcy Court's entry of summary judgment in NVIDIA's favor. On January 19, 2011, the Trustee filed a Notice of Appeal to the United States Court of Appeals for the Ninth Circuit. The appeal is currently pending.
While the conditional settlement reached in November 2005 never progressed through the confirmation process, the Trustee's case still remains pending on appeal. Accordingly, we have not reversed the accrual of $30.6 million - $5.6 million as a charge to settlement costs and $25.0 million as additional purchase price for 3dfx - that we recorded during the three months ended October 30, 2005, pending resolution of the appeal of the Trustee's case.
Securities Cases
In September 2008, three putative securities class actions, or the Actions, were filed in the United States District Court for the Northern District of California arising out of our announcements on July 2, 2008, that we would take a charge against cost of revenue to cover anticipated costs and expenses arising from a weak die/packaging material set in certain versions of our previous generation MCP and GPU products and that we were revising financial guidance for our second quarter of fiscal year 2009. The Actions purport to be brought on behalf of purchasers of NVIDIA stock and assert claims for violations of Sections 10(b) and 20(a) of the Securities Exchange Act of 1934, as amended, or the Securities Exchange Act. On October 30, 2008, the Actions were consolidated under the caption In re NVIDIA Corporation Securities Litigation, Civil Action No. 08-CV-04260-JW (HRL). Lead Plaintiffs and Lead Plaintiffs' Counsel were appointed on December 23, 2008. On February 6, 2009, co-Lead Plaintiff filed a Writ of Mandamus with the Ninth Circuit Court of Appeals challenging the designation of co-Lead Plaintiffs' Counsel. On February 19, 2009, co-Lead Plaintiff filed with the District Court, a motion to stay the District Court proceedings pending resolution of the Writ of Mandamus by the Ninth Circuit. On February 24, 2009, Judge Ware granted the stay. On November 5, 2009, the Court of Appeals issued an opinion reversing the District Court's appointment of one of the lead plaintiffs' counsel, and remanding the matter for further proceedings. On December 8, 2009, the District Court appointed Milberg LLP and Kahn Swick & Foti, LLC as co-lead counsel.
On January 22, 2010, Plaintiffs filed a Consolidated Amended Class Action Complaint for Violations of the Federal Securities Laws, asserting claims for violations of Section 10(b), Rule 10b-5, and Section 20(a) of the Securities Exchange Act. The consolidated complaint sought unspecified compensatory damages. We filed a motion to dismiss the consolidated complaint in March 2010 and a hearing was held on June 24, 2010 before Judge Seeborg. On October 19, 2010, Judge Seeborg granted our motion to dismiss with leave to amend. On December 2, 2010, co-Lead Plaintiffs filed a Second Consolidated Amended Complaint. We moved to dismiss the Second Consolidated Amended Complaint on February 14, 2011. Following oral argument, on October 12, 2011, Judge Seeborg granted our motion to dismiss without leave to amend, and on November 8, 2011, Plaintiffs filed a Notice of Appeal to the Ninth Circuit. The appeal was heard on January 14, 2014 and is currently under submission.
90
NVIDIA CORPORATION AND SUBSIDIARIES
NOTES TO THE CONSOLIDATED FINANCIAL STATEMENTS
(Continued)
Accounting for Loss Contingencies
While there can be no assurance of favorable outcomes, we believe the claims made by other parties in the above ongoing matters are without merit and we intend to vigorously defend the actions. With the exception of the 3dfx case, we have not recorded any accrual for contingent liabilities associated with the legal proceedings described above based on our belief that liabilities, while possible, are not probable. Further, any possible range of loss in these matters cannot be reasonably estimated at this time. We are engaged in other legal actions not described above arising in the ordinary course of its business and, while there can be no assurance of favorable outcomes, we believe that the ultimate outcome of these actions will not have a material adverse effect on our operating results, liquidity or financial position.
Note 13
- Income Taxes
The income tax expense applicable to income before income taxes consists of the following:
|
|
Year Ended
|
||||||||||
|
|
January 26,
2014 |
January 27,
2013 |
January 29,
2012 |
||||||||
|
|
(In thousands)
|
||||||||||
|
Current income taxes:
|
|
|
|
||||||||
|
Federal
|
$
|
7,896
|
|
$
|
7,506
|
|
$
|
7,099
|
|
||
|
State
|
1,234
|
|
1,016
|
|
789
|
|
|||||
|
Foreign
|
18,513
|
|
16,766
|
|
7,630
|
|
|||||
|
Total current
|
27,643
|
|
25,288
|
|
15,518
|
|
|||||
|
Deferred taxes:
|
|
|
|
||||||||
|
Federal
|
17,070
|
|
28,143
|
|
25,111
|
|
|||||
|
State
|
—
|
|
—
|
|
—
|
|
|||||
|
Foreign
|
(1,640
|
)
|
3,717
|
|
(6,055
|
)
|
|||||
|
Total deferred
|
15,430
|
|
31,860
|
|
19,056
|
|
|||||
|
Charge in lieu of taxes attributable to employer stock option plans
|
27,191
|
|
42,355
|
|
47,732
|
|
|||||
|
Income tax expense
|
$
|
70,264
|
|
$
|
99,503
|
|
$
|
82,306
|
|
||
Income before income taxes consists of the following:
|
|
Year Ended
|
||||||||||
|
|
January 26,
2014 |
January 27,
2013 |
January 29,
2012 |
||||||||
|
|
(In thousands)
|
||||||||||
|
Domestic
|
$
|
79,136
|
|
$
|
99,422
|
|
$
|
120,768
|
|
||
|
Foreign
|
431,118
|
|
562,617
|
|
542,628
|
|
|||||
|
Income before income tax
|
$
|
510,254
|
|
$
|
662,039
|
|
$
|
663,396
|
|
||
91
NVIDIA CORPORATION AND SUBSIDIARIES
NOTES TO THE CONSOLIDATED FINANCIAL STATEMENTS
(Continued)
The income tax expense (benefit) differs from the amount computed by applying the federal statutory income tax rate of
35%
to income (loss) before income taxes as follows:
|
|
Year Ended
|
||||||||||
|
|
January 26,
2014 |
January 27,
2013 |
January 29,
2012 |
||||||||
|
|
(In thousands)
|
||||||||||
|
Tax expense computed at federal statutory rate
|
$
|
178,589
|
|
$
|
231,714
|
|
$
|
232,189
|
|
||
|
State income taxes, net of federal tax effect
|
1,608
|
|
1,048
|
|
2,302
|
|
|||||
|
Foreign tax rate differential
|
(93,831
|
)
|
(123,626
|
)
|
(142,071
|
)
|
|||||
|
U.S. federal R&D tax credit
|
(30,155
|
)
|
(29,294
|
)
|
(24,270
|
)
|
|||||
|
Stock-based compensation
|
8,900
|
|
11,876
|
|
10,983
|
|
|||||
|
Tax expense related to intercompany transaction
|
9,785
|
|
9,785
|
|
1,533
|
|
|||||
|
Other
|
(4,632
|
)
|
(2,000
|
)
|
1,640
|
|
|||||
|
Income tax expense
|
$
|
70,264
|
|
$
|
99,503
|
|
$
|
82,306
|
|
||
The tax effect of temporary differences that gives rise to significant portions of the deferred tax assets and liabilities are presented below:
|
|
January 26,
2014 |
January 27,
2013 |
|||||
|
|
(In thousands)
|
||||||
|
Deferred tax assets:
|
|
||||||
|
Net operating loss carryforwards
|
$
|
81,629
|
|
$
|
84,156
|
|
|
|
Accruals and reserves, not currently deductible for tax purposes
|
131,932
|
|
121,644
|
|
|||
|
Property, equipment and intangible assets
|
48,358
|
|
54,636
|
|
|||
|
Research and other tax credit carryforwards
|
306,975
|
|
271,933
|
|
|||
|
Stock-based compensation
|
33,135
|
|
34,187
|
|
|||
|
Convertible debt
|
14,885
|
|
—
|
|
|||
|
Gross deferred tax assets
|
616,914
|
|
566,556
|
|
|||
|
Less: valuation allowance
|
(244,487
|
)
|
(224,774
|
)
|
|||
|
Total deferred tax assets
|
$
|
372,427
|
|
$
|
341,782
|
|
|
|
Deferred tax liabilities:
|
|
|
|||||
|
Acquired intangibles
|
$
|
(33,244
|
)
|
$
|
(43,878
|
)
|
|
|
Unremitted earnings of foreign subsidiaries
|
(425,401
|
)
|
(383,591
|
)
|
|||
|
Gross deferred tax liabilities
|
$
|
(458,645
|
)
|
$
|
(427,469
|
)
|
|
|
Net deferred tax liability
|
$
|
(86,218
|
)
|
$
|
(85,687
|
)
|
|
We recognized income tax expense of
$70.3 million
,
$99.5 million
, and
$82.3 million
during fiscal years 2014, 2013 and 2012, respectively. Income tax expense as a percentage of income before taxes, or our annual effective tax rate, was
13.8%
in fiscal year 2014,
15.0%
in fiscal year 2013 and
12.4%
in fiscal year 2012.
Our effective tax rate on income or loss before tax for the fiscal years was lower than the United States federal statutory rate of 35% due to income or loss earned in jurisdictions, including British Virgin Islands, Hong Kong, China, Taiwan and United Kingdom, where the tax rate is lower than the United States federal statutory tax rate of 35%, favorable recognition in these fiscal years of the U.S. federal R&D tax credit and release of tax reserves as a result of the expiration of statutes of limitations in certain non-U.S. jurisdictions for which we had not previously recognized related tax benefits. As of January 26, 2014 and January 27, 2013 we had a valuation allowance of
$244.5 million
and
$224.8 million
, respectively, related to state and certain foreign deferred tax assets that management determined not likely to be realized due, in part, to projections of future taxable income. To the extent realization of the deferred tax assets becomes more-likely-than-not, we would recognize such deferred tax asset as an income tax benefit during the period.
92
NVIDIA CORPORATION AND SUBSIDIARIES
NOTES TO THE CONSOLIDATED FINANCIAL STATEMENTS
(Continued)
Our deferred tax assets do not include the excess tax benefit related to stock-based compensation that are a component of our federal and state net operating loss and research tax credit carryforwards in the amount of
$427.9 million
as of January 26, 2014. Consistent with prior years, the excess tax benefit reflected in our net operating loss and research tax credit carryforwards will be accounted for as a credit to stockholders' equity, if and when realized. In determining if and when excess tax benefits have been realized, we have elected to utilize the with-and-without approach with respect to such excess tax benefits. We have also elected to ignore the indirect tax effects of stock-based compensation deductions for financial and accounting reporting purposes, and specifically to recognize the full effect of the research tax credit in income from operations.
As of January 26, 2014, we had a federal net operating loss carryforward of
$601.8 million
, combined state net operating loss carryforwards of
$716.0 million
, and combined foreign net operating loss carryforwards of $366.9 million. The federal net operating loss carryforwards will expire beginning in fiscal year 2022 and the state net operating loss carryforwards will begin to expire in fiscal year 2015 in accordance with the rules of each particular state. The total foreign net operating loss carryforwards of
$366.9 million
, include
$91.4 million
attributable to Germany,
$250.4 million
attributable to UK, both of which may be carried forward indefinitely,
$21.0 million
attributable to Canada and the remainder to other foreign jurisdictions that begin to expire in fiscal year 2015. As of January 26, 2014, we had federal research tax credit carryforwards of
$387.7 million
that will begin to expire in fiscal year 2018. We have other federal tax credit carryforwards of
$1.5 million
that will begin to expire in fiscal year 2015. The research tax credit carryforwards attributable to states is in the amount of
$369.2 million
, of which
$358.2 million
is attributable to the State of California and may be carried over indefinitely, and
$11.0 million
is attributable to various other states and will expire beginning in fiscal year 2015 according to the rules of each particular state. We have other state tax credit carryforwards of
$3.0 million
that will expire in fiscal year 2026 and other foreign tax credit carryforwards of
$15.7 million
, of which
$4.7 million
may be refunded in fiscal year 2016,
$4.8 million
may be refunded in fiscal year 2017 and
$6.2 million
may be refunded in fiscal year 2018 if not utilized. Our tax attributes, net operating loss and tax credit carryforwards, remain subject to audit and may be adjusted for changes or modification in tax laws, other authoritative interpretations thereof, or other facts and circumstances. Utilization of federal, state, and foreign net operating losses and tax credit carryforwards may also be subject to limitations due to ownership changes and other limitations provided by the Internal Revenue Code and similar state and foreign tax provisions. If any such limitations apply, the federal, states, or foreign net operating loss and tax credit carryforwards, as applicable, may expire or be denied before utilization.
As of January 26, 2014, U.S. federal and state income taxes have not been provided on approximately
$1.96 billion
of undistributed earnings of non-United States subsidiaries as such earnings are considered to be indefinitely reinvested. We have not provided the amount of unrecognized deferred tax liabilities for temporary differences related to investments in our foreign subsidiaries as the determination of such amount is not practicable.
As of January 26, 2014, we had
$237.7 million
of gross unrecognized tax benefits, of which
$215.4 million
would affect our effective tax rate if recognized. However, included in the unrecognized tax benefits that would affect our effective tax rate if recognized of $215.4 million is
$40.3 million
and
$0.2 million
related to state and foreign income tax, respectively, that, if recognized, would be in the form of a carryforward deferred tax asset that would likely attract a full valuation allowance. The $215.4 million of unrecognized tax benefits as of January 26, 2014 consisted of $107.1 million recorded in non-current income taxes payable and
$108.3 million
reflected as a reduction to the related deferred tax assets.
A reconciliation of gross unrecognized tax benefits is as follows:
|
|
January 26,
2014 |
January 27,
2013 |
January 29,
2012 |
||||||||
|
|
(In thousands)
|
||||||||||
|
Balance at beginning of period
|
$
|
220,543
|
|
$
|
138,262
|
|
$
|
121,034
|
|
||
|
Increases in tax positions for prior years
|
—
|
|
18,800
|
|
385
|
|
|||||
|
Decreases in tax positions for prior years
|
(714
|
)
|
(304
|
)
|
(293
|
)
|
|||||
|
Increases in tax positions for current year
|
22,787
|
|
67,764
|
|
22,181
|
|
|||||
|
Settlements
|
—
|
|
—
|
|
—
|
|
|||||
|
Lapse in statute of limitations
|
(4,878
|
)
|
(3,979
|
)
|
(5,045
|
)
|
|||||
|
Balance at end of period
|
$
|
237,738
|
|
$
|
220,543
|
|
$
|
138,262
|
|
||
93
NVIDIA CORPORATION AND SUBSIDIARIES
NOTES TO THE CONSOLIDATED FINANCIAL STATEMENTS
(Continued)
We classify an unrecognized tax benefit as a current liability, or as a reduction of the amount of a net operating loss carry-forward or amount refundable, to the extent that we anticipate payment or receipt of cash for income taxes within one year. Likewise, the amount is classified as a long-term liability if we anticipate payment or receipt of cash for income taxes during a period beyond a year.
Our policy is to include interest and penalties related to unrecognized tax benefits as a component of income tax expense. As of January 26, 2014, January 27, 2013, and January 29, 2012, we had accrued
$12.9 million
,
$11.3 million
, and
$9.5 million
, respectively, for the payment of interest and penalties related to unrecognized tax benefits, which is not included as a component of our unrecognized tax benefits. As of January 26, 2014, non-current income taxes payable of
$120.0 million
consisted of unrecognized tax benefits of
$107.1 million
, reduced by the associated federal deduction for state taxes, and the related interest and penalties of $12.9 million.
While we believe that we have adequately provided for all tax positions, amounts asserted by tax authorities could be greater or less than our accrued position. Accordingly, our provisions on federal, state and foreign tax-related matters to be recorded in the future may change as revised estimates are made or the underlying matters are settled or otherwise resolved. As of January 26, 2014, we do not believe that our estimates, as otherwise provided for, on such tax positions will significantly increase or decrease within the next twelve months.
We are subject to taxation by a number of taxing authorities both in the United States and throughout the world. As of January 26, 2014, the material tax jurisdictions that may be subject to examination include the United States, Taiwan, Canada, China, Germany, Hong Kong, France, Japan, and India for fiscal years 2003 through 2013. As of January 26, 2014, the material tax jurisdictions for which we are currently under examination include India and Germany for fiscal years 2003 through 2012.
Note 14
- Stockholders’ Equity
Stock Repurchase Program
Beginning August 2004, our Board of Directors authorized us, subject to certain specifications, to repurchase shares of our common stock. Most recently, in November 2013, the Board extended the previously authorized repurchase program through January 2016 and authorized an additional
$1.0 billion
for an aggregate of
$3.7 billion
under the repurchase program. Through January 26, 2014, we have repurchased an aggregate of
161.2 million
shares under our stock repurchase program for a total cost of
$2.45 billion
. As of January 26, 2014, we are authorized, subject to certain specifications, to repurchase shares of our common stock up to
$1.25 billion
through January 2016.
In November 2013, we announced the intention to return
$1.0 billion
to shareholders in fiscal year 2015 in the form of share repurchases and cash dividends. During February 2014, as part of our stock repurchase program, we entered into an accelerated share repurchase agreement, or ASR, with an investment bank, under which we prepaid
$500.0 million
to purchase shares of our common stock and received
20.6 million
shares. Upon final settlement of the ASR, we may either (1) receive additional shares of our common stock, or (2) be required to deliver shares of our common stock or elect to make a cash payment to the investment bank, based on the terms and conditions under the ASR. The shares we receive results in a reduction, on the delivery date, of the outstanding shares used to calculate the weighted-average common shares outstanding for basic and diluted earnings per share.
The repurchases will be made from time to time in the open market, in privately negotiated transactions, or in structured stock repurchase programs, and may be made in one or more larger repurchases, in compliance with Rule 10b-18 of the Exchange Act, subject to market conditions, applicable legal requirements, and other factors. The program does not obligate NVIDIA to acquire any particular amount of common stock and the program may be suspended at any time at our discretion. As part of our share repurchase program, we have entered into, and we may continue to enter into, structured share repurchase transactions with financial institutions. These agreements generally require that we make an up-front payment in exchange for the right to receive a fixed number of shares of our common stock upon execution of the agreement, and a potential incremental number of shares of our common stock, within a pre-determined range, at the end of the term of the agreement.
In addition to our Board authorized stock repurchases, we withhold common stock shares associated with net share settlements to cover tax withholding obligations upon the vesting of restricted stock unit, or RSU, awards under our equity incentive program. During fiscal year 2014, we withheld approximately
1.9 million
shares at a total cost of
27.3 million
through net share settlements. Please refer to
Note 2
of these Notes to the Consolidated Financial Statements for further information regarding stock-based compensation related to equity awards granted under our equity incentive programs.
94
NVIDIA CORPORATION AND SUBSIDIARIES
NOTES TO THE CONSOLIDATED FINANCIAL STATEMENTS
(Continued)
Convertible Preferred Stock
As of
January 26, 2014
and
January 27, 2013
, there were no shares of preferred stock outstanding.
We have a 401(k) Retirement Plan covering substantially all of our United States employees. Under the plan, participating employees may defer up to
100%
of their pre-tax earnings, subject to the Internal Revenue Service annual contribution limits. Effective January 2013, we began matching a portion of the employee contributions. Our contribution expense in fiscal year 2014 was
$5.1 million
and it was not material in fiscal year 2013. Some of our non-U.S. subsidiaries have defined benefit and defined contribution plans as required by local statutory requirements. Our costs under these plans have not been material.
Note 16
- Segment Information
Our Chief Executive Officer, who is considered to be our chief operating decision maker, or CODM, reviews financial information presented on an operating segment basis for purposes of making operating decisions and assessing financial performance. Our operating segments are equivalent to our reportable segments. We report our business in two primary reporting segments - the GPU business and the Tegra Processor business.
Our GPU business leverages our GPU technology across multiple end markets. It comprises four primary product lines: GeForce for consumer desktop and notebook PCs; Quadro for professional workstations; Tesla for high-performance computing; and NVIDIA GRID to provide the power of NVIDIA graphics through the cloud. It also includes other related products, licenses and revenue supporting the GPU business, such as memory products.
Our Tegra Processor business comprises primarily product lines based on our Tegra SOC and modem processor technologies, including Tegra for tablets, smartphones and gaming devices; Icera baseband processors and RF transceivers; automotive computers, including infotainment and navigation systems; and gaming devices, such as SHIELD. It also includes embedded products and license and other revenue associated with game consoles.
During the fourth quarter of fiscal year 2014, our CODM completed a refinement of the methodology utilized to assign expenses to the GPU and Tegra Processor businesses to align to the Company’s product architecture and roadmap. With the announcement of our Tegra K1 processor, we now have a single unifying architecture for our GPU and Tegra Processors. This architecture unification prompted a methodology change that leverages our visual computing expertise by charging the operating expenses of certain core engineering functions to the GPU business, while charging the Tegra Processor business for the incremental cost of the teams working directly for that business. In instances where the operating expenses of certain functions benefit both reporting segments, our CODM assigns 100% of those expenses to the reporting segment that benefits the most. The revenue and cost of revenue of the reporting segments was not affected, and comparative periods presented below reflect the impact of this change.
The “All Other” category presented below represents the revenue and expenses that our CODM does not assign to either the GPU business or the Tegra Processor business for purposes of making operating decisions or assessing financial performance. The revenue includes primarily patent licensing revenue and the expenses include corporate infrastructure and support costs, stock-based compensation costs, amortization of acquisition-related intangible assets, other acquisition-related costs, and other non-recurring charges and benefits that our CODM deems to be enterprise in nature.
95
NVIDIA CORPORATION AND SUBSIDIARIES
NOTES TO THE CONSOLIDATED FINANCIAL STATEMENTS
(Continued)
Our CODM does not review any information regarding total assets on a reporting segment basis. Reporting segments do not record intersegment revenue, and, accordingly, there is none to be reported. The accounting policies for segment reporting are the same as for NVIDIA as a whole. The table below presents details of our reportable segments and the “All Other” category.
|
|
GPU
|
Tegra Processor
|
All Other
|
Consolidated
|
|||||||||||
|
(In thousands)
|
|||||||||||||||
|
Year Ended January 26, 2014:
|
|
|
|
|
|||||||||||
|
Revenue
|
$
|
3,468,144
|
|
$
|
398,018
|
|
$
|
264,000
|
|
$
|
4,130,162
|
|
|||
|
Depreciation and amortization expense
|
$
|
146,571
|
|
$
|
49,839
|
|
$
|
42,738
|
|
$
|
239,148
|
|
|||
|
Operating income (loss)
|
$
|
834,763
|
|
$
|
(268,068
|
)
|
$
|
(70,468
|
)
|
$
|
496,227
|
|
|||
|
Year Ended January 27, 2013:
|
|
|
|
|
|||||||||||
|
Revenue
|
$
|
3,251,712
|
|
$
|
764,447
|
|
$
|
264,000
|
|
$
|
4,280,159
|
|
|||
|
Depreciation and amortization expense
|
$
|
143,262
|
|
$
|
40,793
|
|
$
|
42,180
|
|
$
|
226,235
|
|
|||
|
Operating income (loss)
|
$
|
694,338
|
|
$
|
40,508
|
|
$
|
(86,607
|
)
|
$
|
648,239
|
|
|||
|
Year Ended January 29, 2012:
|
|
|
|
|
|||||||||||
|
Revenue
|
$
|
3,186,764
|
|
$
|
591,166
|
|
$
|
220,000
|
|
$
|
3,997,930
|
|
|||
|
Depreciation and amortization expense
|
$
|
129,307
|
|
$
|
35,431
|
|
$
|
39,467
|
|
$
|
204,205
|
|
|||
|
Operating income (loss)
|
$
|
721,957
|
|
$
|
43,736
|
|
$
|
(117,394
|
)
|
$
|
648,299
|
|
|||
|
Year Ended
|
||||||||||||
|
January 26,
2014 |
January 27,
2013 |
January 29,
2012 |
||||||||||
|
(In thousands)
|
||||||||||||
|
Reconciling items included in "All Other" category :
|
||||||||||||
|
Revenue not allocated to reporting segments
|
$
|
264,000
|
|
$
|
264,000
|
|
$
|
220,000
|
|
|||
|
Unallocated corporate operating expenses and other expenses
|
(166,483
|
)
|
(157,680
|
)
|
(156,268
|
)
|
||||||
|
Stock-based compensation
|
(136,295
|
)
|
(136,662
|
)
|
(136,354
|
)
|
||||||
|
Acquisition-related costs, net
|
(31,652
|
)
|
(36,138
|
)
|
(37,472
|
)
|
||||||
|
Other non-recurring expenses and benefits
|
(38
|
)
|
(20,127
|
)
|
(7,300
|
)
|
||||||
|
Total
|
$
|
(70,468
|
)
|
$
|
(86,607
|
)
|
$
|
(117,394
|
)
|
|||
96
NVIDIA CORPORATION AND SUBSIDIARIES
NOTES TO THE CONSOLIDATED FINANCIAL STATEMENTS
(Continued)
Revenue by geographic region is allocated to individual countries based on the location to which the products are initially billed even if our customers’ revenue is attributable to end customers that are located in a different location. The following tables summarize information pertaining to our revenue from customers based on invoicing address in different geographic regions:
|
|
Year Ended
|
||||||||||
|
|
January 26,
2014 |
January 27,
2013 |
January 29,
2012 |
||||||||
|
Revenue:
|
(In thousands)
|
||||||||||
|
China
|
$
|
793,790
|
|
$
|
780,493
|
|
$
|
941,811
|
|
||
|
Taiwan
|
1,321,503
|
|
1,356,838
|
|
1,137,175
|
|
|||||
|
Other Asia Pacific
|
675,339
|
|
783,573
|
|
730,975
|
|
|||||
|
Europe
|
295,160
|
|
263,488
|
|
296,591
|
|
|||||
|
United States
|
726,830
|
|
799,430
|
|
596,264
|
|
|||||
|
Other Americas
|
317,540
|
|
296,337
|
|
295,114
|
|
|||||
|
Total revenue
|
$
|
4,130,162
|
|
$
|
4,280,159
|
|
$
|
3,997,930
|
|
||
The following table presents summarized information for long-lived assets by geographic region. Long-lived assets consist of property and equipment and deposits and other assets, and exclude goodwill and intangible assets.
|
|
January 26,
2014 |
January 27,
2013 |
|||||
|
Long-lived assets:
|
(In thousands)
|
||||||
|
United States
|
$
|
522,461
|
|
$
|
542,669
|
|
|
|
Taiwan
|
51,993
|
|
45,868
|
|
|||
|
China
|
29,313
|
|
34,644
|
|
|||
|
India
|
31,456
|
|
31,312
|
|
|||
|
Europe
|
50,677
|
|
28,190
|
|
|||
|
Other Asia Pacific
|
1,092
|
|
941
|
|
|||
|
Total long-lived assets
|
$
|
686,992
|
|
$
|
683,624
|
|
|
Revenue from significant customers, those representing 10% or more of total revenue for the respective dates, is summarized as follows:
|
|
Year Ended
|
|||||||
|
|
January 26,
2014 |
January 27,
2013 |
January 29,
2012 |
|||||
|
Revenue:
|
|
|
|
|||||
|
Customer A
|
11
|
%
|
13
|
%
|
11
|
%
|
||
|
Customer B
|
10
|
%
|
9
|
%
|
7
|
%
|
||
Revenue from customer A was attributable to both the GPU and Tegra Processor businesses, while revenue from customer B was attributable to the GPU business.
97
NVIDIA CORPORATION AND SUBSIDIARIES
NOTES TO THE CONSOLIDATED FINANCIAL STATEMENTS
(Continued)
Accounts receivable from significant customers, those representing 10% or more of total accounts receivable for the respective periods, is summarized as follows:
|
|
January 26,
2014 |
January 27,
2013 |
|||
|
Accounts Receivable:
|
|
|
|||
|
Customer A
|
23
|
%
|
20
|
%
|
|
|
Customer B
|
5
|
%
|
10
|
%
|
|
|
Customer C
|
9
|
%
|
10
|
%
|
|
The following table sets forth our unaudited consolidated financial results, for the last eight fiscal quarters:
|
|
Fiscal Year 2014
Quarters Ended
|
||||||||||||||
|
|
January 26,
2014 |
October 27,
2013 |
July 28,
2013
|
April 28,
2013 |
|||||||||||
|
|
(In thousands, except per share data)
|
||||||||||||||
|
Statement of Income Data:
|
|
|
|
|
|||||||||||
|
Revenue
|
$
|
1,144,218
|
|
$
|
1,053,967
|
|
$
|
977,238
|
|
$
|
954,739
|
|
|||
|
Cost of revenue
|
$
|
524,976
|
|
$
|
469,552
|
|
$
|
431,700
|
|
$
|
436,171
|
|
|||
|
Gross profit
|
$
|
619,242
|
|
$
|
584,415
|
|
$
|
545,538
|
|
$
|
518,568
|
|
|||
|
Net income
|
$
|
146,917
|
|
$
|
118,734
|
|
$
|
96,448
|
|
$
|
77,891
|
|
|||
|
Basic net income per share
|
$
|
0.26
|
|
$
|
0.20
|
|
$
|
0.16
|
|
$
|
0.13
|
|
|||
|
Diluted net income per share
|
$
|
0.25
|
|
$
|
0.20
|
|
$
|
0.16
|
|
$
|
0.13
|
|
|||
|
|
Fiscal Year 2013
Quarters Ended
|
||||||||||||||
|
|
January 27,
2013 |
October 28,
2012 |
July 29,
2012 (A)
|
April 29,
2012 |
|||||||||||
|
|
(In thousands, except per share data)
|
||||||||||||||
|
Statement of Income Data:
|
|
|
|
|
|||||||||||
|
Revenue
|
$
|
1,106,902
|
|
$
|
1,204,110
|
|
$
|
1,044,270
|
|
$
|
924,877
|
|
|||
|
Cost of revenue
|
$
|
521,300
|
|
$
|
567,452
|
|
$
|
503,551
|
|
$
|
461,513
|
|
|||
|
Gross profit
|
$
|
585,602
|
|
$
|
636,658
|
|
$
|
540,719
|
|
$
|
463,364
|
|
|||
|
Net income
|
$
|
173,973
|
|
$
|
209,080
|
|
$
|
119,046
|
|
$
|
60,437
|
|
|||
|
Basic net income per share
|
$
|
0.28
|
|
$
|
0.34
|
|
$
|
0.19
|
|
$
|
0.10
|
|
|||
|
Diluted net income per share
|
$
|
0.28
|
|
$
|
0.33
|
|
$
|
0.19
|
|
$
|
0.10
|
|
|||
|
(A)
|
Includes net present value of a
$25 million
charitable contribution pledged in fiscal year 2013 to Stanford Hospital and Clinic, payable over a
ten
year period.
|
98
NVIDIA CORPORATION AND SUBSIDIARIES
NOTES TO THE CONSOLIDATED FINANCIAL STATEMENTS
(Continued)
During February 2014, as part of our stock repurchase program, we entered into an accelerated share repurchase agreement, or ASR, with an investment bank, under which we prepaid
$500.0 million
to purchase shares of our common stock and received
20.6 million
shares. Upon final settlement of the ASR, we may either (1) receive additional shares of our common stock, or (2) be required to deliver shares of our common stock or elect to make a cash payment to the investment bank, based on the terms and conditions under the ASR. The shares we receive results in a reduction, on the delivery date, of the outstanding shares used to calculate the weighted-average common shares outstanding for basic and diluted earnings per share.
99
NVIDIA CORPORATION AND SUBSIDIARIES
SCHEDULE II – VALUATION AND QUALIFYING ACCOUNTS
|
Description
|
Balance at
Beginning
of Period
|
Additions
|
|
Deductions
|
|
Balance at
End of Period
|
|||||||||
|
|
(In thousands)
|
||||||||||||||
|
Year ended January 26, 2014
|
|
|
|
|
|
|
|||||||||
|
Allowance for doubtful accounts
|
$
|
1,804
|
|
$
|
319
|
|
(1)
|
$
|
(1,275
|
)
|
(1)
|
$
|
848
|
|
|
|
Sales return allowance
|
$
|
14,790
|
|
$
|
20,703
|
|
(2)
|
$
|
(21,382
|
)
|
(4)
|
$
|
14,111
|
|
|
|
Deferred tax valuation allowance
|
$
|
224,774
|
|
$
|
19,713
|
|
(3)
|
$
|
—
|
|
|
$
|
244,487
|
|
|
|
Year ended January 27, 2013
|
|
|
|
|
|
|
|||||||||
|
Allowance for doubtful accounts
|
$
|
973
|
|
$
|
1,216
|
|
(1)
|
$
|
(385
|
)
|
(1)
|
$
|
1,804
|
|
|
|
Sales return allowance
|
$
|
13,881
|
|
$
|
17,627
|
|
(2)
|
$
|
(16,718
|
)
|
(4)
|
$
|
14,790
|
|
|
|
Deferred tax valuation allowance
|
$
|
212,285
|
|
$
|
12,489
|
|
(3)
|
$
|
—
|
|
|
$
|
224,774
|
|
|
|
Year ended January 29, 2012
|
|
|
|
|
|
|
|||||||||
|
Allowance for doubtful accounts
|
$
|
789
|
|
$
|
449
|
|
(1)
|
$
|
(265
|
)
|
(1)
|
$
|
973
|
|
|
|
Sales return allowance
|
$
|
15,049
|
|
$
|
25,331
|
|
(2)
|
$
|
(26,499
|
)
|
(4)
|
$
|
13,881
|
|
|
|
Deferred tax valuation allowance
|
$
|
148,016
|
|
$
|
64,269
|
|
(3)
|
$
|
—
|
|
|
$
|
212,285
|
|
|
(1) Additions represent allowance for doubtful accounts charged to expense and deductions represent amounts recorded as reduction to expense upon reassessment of allowance for doubtful accounts at period end.
(2) Represents allowance for sales returns estimated at the time revenue is recognized primarily based on historical return rates and is charged as a reduction to revenue.
(3) Represents change in valuation allowance primarily related to state and certain foreign deferred tax assets that management has determined not likely to be realized due, in part, to projections of future taxable income of the respective jurisdictions.
(4) Represents allowance for sales returns written off.
100
EXHIBIT INDEX
|
Incorporated by Reference
|
|||||||||||
|
Exhibit No.
|
Exhibit Description
|
Schedule/Form
|
File Number
|
Exhibit
|
Filing Date
|
||||||
|
2.1
|
Agreement and Plan of Merger by and among NVIDIA Corporation, Partridge Acquisition, Inc. and PortalPlayer, Inc. dated 11/6/06
|
8-K
|
0-23985
|
2.1
|
11/9/2006
|
||||||
|
3.1
|
Amended and Restated Certificate of Incorporation
|
S-8
|
333-74905
|
4.1
|
3/23/1999
|
||||||
|
3.2
|
Certificate of Amendment of Amended and Restated Certificate of Incorporation
|
10-Q
|
0-23985
|
3.1
|
8/21/2008
|
||||||
|
3.3
|
Certificate of Amendment of Amended and Restated Certificate of Incorporation
|
8-K
|
0-23985
|
3.1
|
5/24/2011
|
||||||
|
3.4
|
Bylaws of NVIDIA Corporation, Amended and Restated as of November 11, 2013
|
8-K
|
0-23985
|
3.1
|
11/14/2013
|
||||||
|
4.1
|
Reference is made to Exhibits 3.1, 3.2, 3.3 and 3.4
|
|
|
|
|
||||||
|
4.2
|
Specimen Stock Certificate
|
S-1/A
|
333-47495
|
4.2
|
4/24/1998
|
||||||
|
4.3
|
Indenture (including the form of Notes) dated December 2, 2013 between NVIDIA Corporation and Wells Fargo Bank, National Association
|
8-K
|
0-23985
|
4.1
|
12/2/2013
|
||||||
|
4.4
|
Form of 1.00% Convertible Senior Note due 2018 (included in Exhibit 4.3)
|
8-K
|
0-23985
|
4.2
|
12/2/2013
|
||||||
|
10.1
|
Form of Indemnity Agreement between NVIDIA Corporation and each of its directors and officers
|
8-K
|
0-23985
|
10.1
|
3/7/2006
|
||||||
|
10.2+
|
1998 Equity Incentive Plan, as amended
|
8-K
|
0-23985
|
10.2
|
3/13/2006
|
||||||
|
10.3+
|
1998 Equity Incentive Plan ISO, as amended
|
10-Q
|
0-23985
|
10.5
|
11/22/2004
|
||||||
|
10.4+
|
1998 Equity Incentive Plan NSO, as amended
|
10-Q
|
0-23985
|
10.6
|
11/22/2004
|
||||||
|
10.5+
|
Certificate of Stock Option Grant
|
10-Q
|
0-23985
|
10.7
|
11/22/2004
|
||||||
|
10.6+
|
1998 Employee Stock Purchase Plan, as amended and restated
|
10-Q
|
0-23985
|
10.2
|
5/22/2008
|
||||||
|
10.7+
|
2000 Nonstatutory Equity Incentive Plan, as amended
|
SC TO-1
|
005-56649
|
99(d)(1)(A)
|
11/29/2006
|
||||||
|
10.8+
|
2000 Nonstatutory Equity Incentive Plan NSO
|
SC TO-1
|
005-56649
|
99.1(d)(1)(B)
|
11/29/2006
|
||||||
|
10.9+
|
PortalPlayer, Inc. 1999 Stock Option Plan and Form of Agreements thereunder
|
S-8
|
333-140021
|
99.1
|
1/16/2007
|
||||||
|
10.10+
|
PortalPlayer, Inc. Amended and Restated 2004 Stock Incentive Plan
|
S-8
|
333-140021
|
99.2
|
1/16/2007
|
||||||
|
10.11+
|
Amended and Restated 2007 Equity Incentive Plan
|
DEF 14A
|
0-23985
|
Appendix A
|
4/3/2013
|
||||||
|
10.12+
|
2007 Equity Incentive Plan - Non Statutory Stock Option (Annual Grant - Board Service (2007))
|
10-Q
|
0-23985
|
10.2
|
8/22/2007
|
||||||
|
10.13+
|
2007 Equity Incentive Plan - Non Statutory Stock Option (Annual Grant - Committee Service (2007))
|
10-Q
|
0-23985
|
10.3
|
8/22/2007
|
||||||
|
10.14+
|
2007 Equity Incentive Plan - Non Statutory Stock Option (Initial Grant - Board Service (2007))
|
10-Q
|
0-23985
|
10.4
|
8/22/2007
|
||||||
|
10.15+
|
2007 Equity Incentive Plan - Non-Statutory Stock Option (Annual Grant - Board Service (2009))
|
10-Q
|
0-23985
|
10.1
|
8/20/2009
|
||||||
|
10.16+
|
2007 Equity Incentive Plan - Non-Statutory Stock Option (Annual Grant - Board Service (2011))
|
10-Q
|
0-23985
|
10.41
|
5/27/2011
|
||||||
101
|
10.17+
|
2007 Equity Incentive Plan - Non-Statutory Stock Option (Initial Grant - Board Service (2011))
|
8-K
|
0-23985
|
10.1
|
12/14/2011
|
||||||
|
10.18+
|
Amended and Restated 2007 Equity Incentive Plan - Non-Employee Director Stock Option Grant (2012 Annual Board Retainer)
|
10-Q
|
0-23985
|
10.4
|
5/23/2012
|
||||||
|
10.19+
|
2007 Equity Incentive Plan - Non Statutory Stock Option
|
8-K
|
0-23985
|
10.2
|
9/13/2010
|
||||||
|
10.20+
|
2007 Equity Incentive Plan - Incentive Stock Option
|
8-K
|
0-23985
|
10.21
|
9/13/2010
|
||||||
|
10.21+
|
Amended and Restated 2007 Equity Incentive Plan - Non Statutory Stock Option
|
10-Q
|
0-23985
|
10.1
|
8/22/2012
|
||||||
|
10.22+
|
Amended and Restated 2007 Equity Incentive Plan - Incentive Stock Option
|
10-Q
|
0-23985
|
10.2
|
8/22/2012
|
||||||
|
10.23+
|
2007 Equity Incentive Plan - Restricted Stock Unit Grant Notice and Restricted Stock Unit Purchase Agreement
|
10-Q
|
0-23985
|
10.22
|
12/7/2010
|
||||||
|
10.24+
|
Amended and Restated 2007 Equity Incentive Plan - Restricted Stock Unit Grant Notice and Restricted Stock Unit Purchase Agreement
|
10-Q
|
0-23985
|
10.3
|
8/22/2012
|
||||||
|
10.25+
|
Amended and Restated 2007 Equity Incentive Plan - Non-Employee Director Restricted Stock Unit (without deferral option)
|
10-Q
|
0-23985
|
10.2
|
5/23/2012
|
||||||
|
10.26+
|
Amended and Restated 2007 Equity Incentive Plan - Non-Employee Director Restricted Stock Unit (with deferral option)
|
10-Q
|
0-23985
|
10.3
|
5/23/2012
|
||||||
|
10.27+
|
Amended and Restated 2007 Equity Incentive Plan - Non Statutory Stock Option (Initial Grant - Board Service)
|
8-K
|
0-23985
|
10.1
|
7/23/2013
|
||||||
|
10.28+
|
2012 Employee Stock Purchase Plan
|
10-Q
|
0-23985
|
10.6
|
5/23/2012
|
||||||
|
10.29+
|
Fiscal Year 2014 Variable Compensation Plan
|
8-K
|
0-23985
|
10.1
|
4/2/2013
|
||||||
|
10.30+
|
Fiscal Year 2013 Variable Compensation Plan
|
8-K
|
0-23985
|
10.1
|
3/28/2012
|
||||||
|
10.31+
|
Offer Letter between NVIDIA Corporation and Colette Kress, dated September 13, 2013
|
8-K
|
0-23985
|
10.1
|
9/16/2013
|
||||||
|
10.32
|
Lease dated April 4, 2000 between NVIDIA Corporation and Sobrato Interests III for Building A
|
S-3/A
|
333-33560
|
10.1
|
4/20/2000
|
||||||
|
10.33
|
Lease dated April 4, 2000 between NVIDIA Corporation and Sobrato Interests III for Building B
|
S-3/A
|
333-33560
|
10.2
|
4/20/2000
|
||||||
|
10.34
|
Lease dated April 4, 2000 between NVIDIA Corporation and Sobrato Interests III for Building C
|
S-3/A
|
333-33560
|
10.3
|
4/20/2000
|
||||||
|
10.35
|
Lease dated April 4, 2000 between NVIDIA Corporation and Sobrato Interests III for Building D
|
S-3/A
|
333-33560
|
10.4
|
4/20/2000
|
||||||
|
10.36
|
Memory Controller Patent License Agreement Between Rambus Inc. and NVIDIA Corporation, dated August 12, 2010
|
10-Q
|
0-23985
|
10.32
|
12/7/2010
|
||||||
|
10.37
|
Second Amendment to Lease, dated August 18, 2010 between NVIDIA Corporation and Sobrato Interests III for Building A
|
10-Q
|
0-23985
|
10.33
|
12/7/2010
|
||||||
|
10.38
|
Third Amendment to Lease, dated August 18, 2010, between NVIDIA Corporation and Sobrato Interests III for Building B
|
10-Q
|
0-23985
|
10.34
|
12/7/2010
|
||||||
|
10.39
|
Third Amendment to Lease, dated August 18, 2010, between NVIDIA Corporation and Sobrato Interests III for Building C
|
10-Q
|
0-23985
|
10.35
|
12/7/2010
|
||||||
102
|
10.40
|
Second Amendment to Lease, dated August 18, 2010, between NVIDIA Corporation and Sobrato Interests III for Building D
|
10-Q
|
0-23985
|
10.36
|
12/7/2010
|
||||||
|
10.41
|
Patent Cross License Agreement dated as of January 10, 2011, between NVIDIA Corporation and Intel Corporation
|
8-K
|
0-23985
|
10.1
|
1/10/2011
|
||||||
|
10.42
|
Master Confirmation and Supplemental Confirmation between NVIDIA Corporation and Goldman, Sachs & Co., dated May 14, 2013
|
10-Q
|
0-23985
|
10.3
|
5/22/2013
|
||||||
|
10.43
|
Base Convertible Note Hedge Transaction Confirmation
|
8-K
|
0-23985
|
99.1
|
12/2/2013
|
||||||
|
10.44
|
Base Warrant Transaction Confirmation
|
8-K
|
0-23985
|
99.2
|
12/2/2013
|
||||||
|
10.45
|
Additional Convertible Note Hedge Transaction Confirmation
|
8-K
|
0-23985
|
99.3
|
12/2/2013
|
||||||
|
10.46
|
Additional Warrant Transaction Confirmation
|
8-K
|
0-23985
|
99.4
|
12/2/2013
|
||||||
|
21.1*
|
List of Registrant's Subsidiaries
|
||||||||||
|
23.1*
|
Consent of PricewaterhouseCoopers LLP
|
||||||||||
|
24.1*
|
Power of Attorney (included in signature page)
|
||||||||||
|
31.1*
|
Certification of Chief Executive Officer as required by Rule 13a-14(a) of the Securities Exchange Act of 1934
|
||||||||||
|
31.2*
|
Certification of Chief Financial Officer as required by Rule 13a-14(a) of the Securities Exchange Act of 1934
|
||||||||||
|
32.1#*
|
Certification of Chief Executive Officer as required by Rule 13a-14(b) of the Securities Exchange Act of 1934
|
||||||||||
|
32.2#*
|
Certification of Chief Financial Officer as required by Rule 13a-14(b) of the Securities Exchange Act of 1934
|
||||||||||
|
101.INS*
|
XBRL Instance Document
|
||||||||||
|
101.SCH*
|
XBRL Taxonomy Extension Schema Document
|
||||||||||
|
101.CAL*
|
XBRL Taxonomy Extension Calculation Linkbase Document
|
||||||||||
|
101.DEF*
|
XBRL Taxonomy Extension Definition Linkbase Document
|
||||||||||
|
101.LAB*
|
XBRL Taxonomy Extension Labels Linkbase Document
|
||||||||||
|
101.PRE*
|
XBRL Taxonomy Extension Presentation Linkbase Document
|
||||||||||
* Filed herewith.
+ Management contract or compensatory plan or arrangement.
# In accordance with Item 601(b)(32)(ii) of Regulation S-K and SEC Release Nos. 33-8238 and 34-47986, Final Rule: Management's Reports on Internal Control Over Financial Reporting and Certification of Disclosure in Exchange Act Periodic Reports, the certifications furnished in Exhibits 32.1 and 32.2 hereto are deemed to accompany this Annual Report on Form 10-K and will not be deemed “filed” for purpose of Section 18 of the Exchange Act. Such certifications will not be deemed to be incorporated by reference into any filing under the Securities Act or the Exchange Act, except to the extent that the registrant specifically incorporates it by reference.
Copies of above exhibits not contained herein are available to any stockholder upon written request to:
Investor Relations: NVIDIA Corporation, 2701 San Tomas Expressway, Santa Clara, CA 95050
103
SIGNATURES
Pursuant to the requirements of Section 13 or 15(d) of the Securities Exchange Act of 1934, the Registrant has duly caused this report to be signed on its behalf by the undersigned, thereunto duly authorized, on
March 12, 2014
.
|
NVIDIA Corporation
|
|
|
By:
|
/s/ Jen-Hsun Huang
|
|
|
Jen-Hsun Huang
|
|
|
President and Chief Executive Officer
|
POWER OF ATTORNEY
KNOW ALL PERSONS BY THESE PRESENTS, that each person whose signature appears below constitutes and appoints Jen-Hsun Huang and Colette M. Kress, and each or any one of them, his true and lawful attorney-in-fact and agent, with full power of substitution and resubstitution, for him and in his name, place and stead, in any and all capacities, to sign any and all amendments (including posting effective amendments) to this report, and to file the same, with all exhibits thereto, and other documents in connection therewith, with the Securities and Exchange Commission, granting unto said attorneys-in-facts and agents, and each of them, full power and authority to do and perform each and every act and thing requisite and necessary to be done in connection therewith, as fully to all intents and purposes as he might or could do in person, hereby ratifying and confirming all that said attorneys-in-fact and agents, or any of them, or their or his substitutes or substitutes, may lawfully do or cause to be done by virtue hereof.
Pursuant to the requirements of the Securities Exchange Act of 1934, this report has been signed below by the following persons on behalf of the registrant and in the capacities and on the dates indicated.
104
|
Signature
|
Title
|
Date
|
|
/s/ JEN-HSUN HUANG
|
President, Chief Executive Officer and Director
(Principal Executive Officer)
|
March 12, 2014
|
|
Jen-Hsun Huang
|
|
|
|
/s/ COLETTE M. KRESS
|
Executive Vice President and Chief Financial Officer
(Principal Financial Officer)
|
March 12, 2014
|
|
Colette M. Kress
|
|
|
|
/s/ MICHAEL J. BYRON
|
Vice President of Finance and Chief Accounting Officer
(Principal Accounting Officer)
|
March 12, 2014
|
|
Michael J. Byron
|
||
|
/s/ TENCH COXE
|
Director
|
March 12, 2014
|
|
Tench Coxe
|
|
|
|
/s/ MARK STEVENS
|
Director
|
March 12, 2014
|
|
Mark Stevens
|
|
|
|
/s/ JAMES C. GAITHER
|
Director
|
March 12, 2014
|
|
James C. Gaither
|
|
|
|
/s/ HARVEY C. JONES
|
Director
|
March 12, 2014
|
|
Harvey C. Jones
|
|
|
|
/s/ MARK L. PERRY
|
Director
|
March 12, 2014
|
|
Mark L. Perry
|
|
|
|
/s/ WILLIAM J. MILLER
|
Director
|
March 12, 2014
|
|
William J. Miller
|
|
|
|
/s/ A. BROOKE SEAWELL
|
Director
|
March 12, 2014
|
|
A. Brooke Seawell
|
||
|
/s/ ROBERT BURGESS
|
Director
|
March 12, 2014
|
|
Robert Burgess
|
||
|
/s/ DAWN HUDSON
|
Director
|
March 12, 2014
|
|
Dawn Hudson
|
||
105
EXHIBIT INDEX
|
Incorporated by Reference
|
|||||||||||
|
Exhibit No.
|
Exhibit Description
|
Schedule/Form
|
File Number
|
Exhibit
|
Filing Date
|
||||||
|
2.1
|
Agreement and Plan of Merger by and among NVIDIA Corporation, Partridge Acquisition, Inc. and PortalPlayer, Inc. dated 11/6/06
|
8-K
|
0-23985
|
2.1
|
11/9/2006
|
||||||
|
3.1
|
Amended and Restated Certificate of Incorporation
|
S-8
|
333-74905
|
4.1
|
3/23/1999
|
||||||
|
3.2
|
Certificate of Amendment of Amended and Restated Certificate of Incorporation
|
10-Q
|
0-23985
|
3.1
|
8/21/2008
|
||||||
|
3.3
|
Certificate of Amendment of Amended and Restated Certificate of Incorporation
|
8-K
|
0-23985
|
3.1
|
5/24/2011
|
||||||
|
3.4
|
Bylaws of NVIDIA Corporation, Amended and Restated as of November 11, 2013
|
8-K
|
0-23985
|
3.1
|
11/14/2013
|
||||||
|
4.1
|
Reference is made to Exhibits 3.1, 3.2, 3.3 and 3.4
|
|
|
|
|
||||||
|
4.2
|
Specimen Stock Certificate
|
S-1/A
|
333-47495
|
4.2
|
4/24/1998
|
||||||
|
4.3
|
Indenture (including the form of Notes) dated December 2, 2013 between NVIDIA Corporation and Wells Fargo Bank, National Association
|
8-K
|
0-23985
|
4.1
|
12/2/2013
|
||||||
|
4.4
|
Form of 1.00% Convertible Senior Note due 2018 (included in Exhibit 4.3)
|
8-K
|
0-23985
|
4.2
|
12/2/2013
|
||||||
|
10.1
|
Form of Indemnity Agreement between NVIDIA Corporation and each of its directors and officers
|
8-K
|
0-23985
|
10.1
|
3/7/2006
|
||||||
|
10.2+
|
1998 Equity Incentive Plan, as amended
|
8-K
|
0-23985
|
10.2
|
3/13/2006
|
||||||
|
10.3+
|
1998 Equity Incentive Plan ISO, as amended
|
10-Q
|
0-23985
|
10.5
|
11/22/2004
|
||||||
|
10.4+
|
1998 Equity Incentive Plan NSO, as amended
|
10-Q
|
0-23985
|
10.6
|
11/22/2004
|
||||||
|
10.5+
|
Certificate of Stock Option Grant
|
10-Q
|
0-23985
|
10.7
|
11/22/2004
|
||||||
|
10.6+
|
1998 Employee Stock Purchase Plan, as amended and restated
|
10-Q
|
0-23985
|
10.2
|
5/22/2008
|
||||||
|
10.7+
|
2000 Nonstatutory Equity Incentive Plan, as amended
|
SC TO-1
|
005-56649
|
99(d)(1)(A)
|
11/29/2006
|
||||||
|
10.8+
|
2000 Nonstatutory Equity Incentive Plan NSO
|
SC TO-1
|
005-56649
|
99.1(d)(1)(B)
|
11/29/2006
|
||||||
|
10.9+
|
PortalPlayer, Inc. 1999 Stock Option Plan and Form of Agreements thereunder
|
S-8
|
333-140021
|
99.1
|
1/16/2007
|
||||||
|
10.10+
|
PortalPlayer, Inc. Amended and Restated 2004 Stock Incentive Plan
|
S-8
|
333-140021
|
99.2
|
1/16/2007
|
||||||
|
10.11+
|
Amended and Restated 2007 Equity Incentive Plan
|
DEF 14A
|
0-23985
|
Appendix A
|
4/3/2013
|
||||||
|
10.12+
|
2007 Equity Incentive Plan - Non Statutory Stock Option (Annual Grant - Board Service (2007))
|
10-Q
|
0-23985
|
10.2
|
8/22/2007
|
||||||
|
10.13+
|
2007 Equity Incentive Plan - Non Statutory Stock Option (Annual Grant - Committee Service (2007))
|
10-Q
|
0-23985
|
10.3
|
8/22/2007
|
||||||
|
10.14+
|
2007 Equity Incentive Plan - Non Statutory Stock Option (Initial Grant - Board Service (2007))
|
10-Q
|
0-23985
|
10.4
|
8/22/2007
|
||||||
|
10.15+
|
2007 Equity Incentive Plan - Non-Statutory Stock Option (Annual Grant - Board Service (2009))
|
10-Q
|
0-23985
|
10.1
|
8/20/2009
|
||||||
106
|
10.16+
|
2007 Equity Incentive Plan - Non-Statutory Stock Option (Annual Grant - Board Service (2011))
|
10-Q
|
0-23985
|
10.41
|
5/27/2011
|
||||||
|
10.17+
|
2007 Equity Incentive Plan - Non-Statutory Stock Option (Initial Grant - Board Service (2011))
|
8-K
|
0-23985
|
10.1
|
12/14/2011
|
||||||
|
10.18+
|
Amended and Restated 2007 Equity Incentive Plan - Non-Employee Director Stock Option Grant (2012 Annual Board Retainer)
|
10-Q
|
0-23985
|
10.4
|
5/23/2012
|
||||||
|
10.19+
|
2007 Equity Incentive Plan - Non Statutory Stock Option
|
8-K
|
0-23985
|
10.2
|
9/13/2010
|
||||||
|
10.20+
|
2007 Equity Incentive Plan - Incentive Stock Option
|
8-K
|
0-23985
|
10.21
|
9/13/2010
|
||||||
|
10.21+
|
Amended and Restated 2007 Equity Incentive Plan - Non Statutory Stock Option
|
10-Q
|
0-23985
|
10.1
|
8/22/2012
|
||||||
|
10.22+
|
Amended and Restated 2007 Equity Incentive Plan - Incentive Stock Option
|
10-Q
|
0-23985
|
10.2
|
8/22/2012
|
||||||
|
10.23+
|
2007 Equity Incentive Plan - Restricted Stock Unit Grant Notice and Restricted Stock Unit Purchase Agreement
|
10-Q
|
0-23985
|
10.22
|
12/7/2010
|
||||||
|
10.24+
|
Amended and Restated 2007 Equity Incentive Plan - Restricted Stock Unit Grant Notice and Restricted Stock Unit Purchase Agreement
|
10-Q
|
0-23985
|
10.3
|
8/22/2012
|
||||||
|
10.25+
|
Amended and Restated 2007 Equity Incentive Plan - Non-Employee Director Restricted Stock Unit (without deferral option)
|
10-Q
|
0-23985
|
10.2
|
5/23/2012
|
||||||
|
10.26+
|
Amended and Restated 2007 Equity Incentive Plan - Non-Employee Director Restricted Stock Unit (with deferral option)
|
10-Q
|
0-23985
|
10.3
|
5/23/2012
|
||||||
|
10.27+
|
Amended and Restated 2007 Equity Incentive Plan - Non Statutory Stock Option (Initial Grant - Board Service)
|
8-K
|
0-23985
|
10.1
|
7/23/2013
|
||||||
|
10.28+
|
2012 Employee Stock Purchase Plan
|
10-Q
|
0-23985
|
10.6
|
5/23/2012
|
||||||
|
10.29+
|
Fiscal Year 2014 Variable Compensation Plan
|
8-K
|
0-23985
|
10.1
|
4/2/2013
|
||||||
|
10.30+
|
Fiscal Year 2013 Variable Compensation Plan
|
8-K
|
0-23985
|
10.1
|
3/28/2012
|
||||||
|
10.31+
|
Offer Letter between NVIDIA Corporation and Colette Kress, dated September 13, 2013
|
8-K
|
0-23985
|
10.1
|
9/16/2013
|
||||||
|
10.32
|
Lease dated April 4, 2000 between NVIDIA Corporation and Sobrato Interests III for Building A
|
S-3/A
|
333-33560
|
10.1
|
4/20/2000
|
||||||
|
10.33
|
Lease dated April 4, 2000 between NVIDIA Corporation and Sobrato Interests III for Building B
|
S-3/A
|
333-33560
|
10.2
|
4/20/2000
|
||||||
|
10.34
|
Lease dated April 4, 2000 between NVIDIA Corporation and Sobrato Interests III for Building C
|
S-3/A
|
333-33560
|
10.3
|
4/20/2000
|
||||||
|
10.35
|
Lease dated April 4, 2000 between NVIDIA Corporation and Sobrato Interests III for Building D
|
S-3/A
|
333-33560
|
10.4
|
4/20/2000
|
||||||
|
10.36
|
Memory Controller Patent License Agreement Between Rambus Inc. and NVIDIA Corporation, dated August 12, 2010
|
10-Q
|
0-23985
|
10.32
|
12/7/2010
|
||||||
|
10.37
|
Second Amendment to Lease, dated August 18, 2010 between NVIDIA Corporation and Sobrato Interests III for Building A
|
10-Q
|
0-23985
|
10.33
|
12/7/2010
|
||||||
|
10.38
|
Third Amendment to Lease, dated August 18, 2010, between NVIDIA Corporation and Sobrato Interests III for Building B
|
10-Q
|
0-23985
|
10.34
|
12/7/2010
|
||||||
107
|
10.39
|
Third Amendment to Lease, dated August 18, 2010, between NVIDIA Corporation and Sobrato Interests III for Building C
|
10-Q
|
0-23985
|
10.35
|
12/7/2010
|
||||||
|
10.40
|
Second Amendment to Lease, dated August 18, 2010, between NVIDIA Corporation and Sobrato Interests III for Building D
|
10-Q
|
0-23985
|
10.36
|
12/7/2010
|
||||||
|
10.41
|
Patent Cross License Agreement dated as of January 10, 2011, between NVIDIA Corporation and Intel Corporation
|
8-K
|
0-23985
|
10.1
|
1/10/2011
|
||||||
|
10.42
|
Master Confirmation and Supplemental Confirmation between NVIDIA Corporation and Goldman, Sachs & Co., dated May 14, 2013
|
10-Q
|
0-23985
|
10.3
|
5/22/2013
|
||||||
|
10.43
|
Base Convertible Note Hedge Transaction Confirmation
|
8-K
|
0-23985
|
99.1
|
12/2/2013
|
||||||
|
10.44
|
Base Warrant Transaction Confirmation
|
8-K
|
0-23985
|
99.2
|
12/2/2013
|
||||||
|
10.45
|
Additional Convertible Note Hedge Transaction Confirmation
|
8-K
|
0-23985
|
99.3
|
12/2/2013
|
||||||
|
10.46
|
Additional Warrant Transaction Confirmation
|
8-K
|
0-23985
|
99.4
|
12/2/2013
|
||||||
|
21.1*
|
List of Registrant's Subsidiaries
|
||||||||||
|
23.1*
|
Consent of PricewaterhouseCoopers LLP
|
||||||||||
|
24.1*
|
Power of Attorney (included in signature page)
|
||||||||||
|
31.1*
|
Certification of Chief Executive Officer as required by Rule 13a-14(a) of the Securities Exchange Act of 1934
|
||||||||||
|
31.2*
|
Certification of Chief Financial Officer as required by Rule 13a-14(a) of the Securities Exchange Act of 1934
|
||||||||||
|
32.1#*
|
Certification of Chief Executive Officer as required by Rule 13a-14(b) of the Securities Exchange Act of 1934
|
||||||||||
|
32.2#*
|
Certification of Chief Financial Officer as required by Rule 13a-14(b) of the Securities Exchange Act of 1934
|
||||||||||
|
101.INS*
|
XBRL Instance Document
|
||||||||||
|
101.SCH*
|
XBRL Taxonomy Extension Schema Document
|
||||||||||
|
101.CAL*
|
XBRL Taxonomy Extension Calculation Linkbase Document
|
||||||||||
|
101.DEF*
|
XBRL Taxonomy Extension Definition Linkbase Document
|
||||||||||
|
101.LAB*
|
XBRL Taxonomy Extension Labels Linkbase Document
|
||||||||||
|
101.PRE*
|
XBRL Taxonomy Extension Presentation Linkbase Document
|
||||||||||
* Filed herewith.
+ Management contract or compensatory plan or arrangement.
# In accordance with Item 601(b)(32)(ii) of Regulation S-K and SEC Release Nos. 33-8238 and 34-47986, Final Rule: Management's Reports on Internal Control Over Financial Reporting and Certification of Disclosure in Exchange Act Periodic Reports, the certifications furnished in Exhibits 32.1 and 32.2 hereto are deemed to accompany this Annual Report on Form 10-K and will not be deemed “filed” for purpose of Section 18 of the Exchange Act. Such certifications will not be deemed to be incorporated by reference into any filing under the Securities Act or the Exchange Act, except to the extent that the registrant specifically incorporates it by reference.
Copies of above exhibits not contained herein are available to any stockholder upon written request to:
Investor Relations: NVIDIA Corporation, 2701 San Tomas Expressway, Santa Clara, CA 95050
108
TABLE OF CONTENTS
Part IItem 1. BusinessItem 1A. Risk FactorsItem 1B. Unresolved Staff CommentsItem 2. PropertiesItem 3. Legal ProceedingsItem 4. Mine Safety DisclosuresPart IIItem 5. Market For Registrant S Common Equity, Related Stockholder Matters and Issuer Purchases Of Equity SecuritiesItem 6. Selected Financial DataItem 7. Management S Discussion and Analysis Of Financial Condition and Results Of OperationsItem 7A. Quantitative and Qualitative Disclosures About Market RiskItem 8. Financial Statements and Supplementary DataItem 9. Changes in and Disagreements with Accountants on Accounting and Financial DisclosureItem 9A. Controls and ProceduresItem 9B. Other InformationPart IIIItem 10. Directors, Executive Officers and Corporate GovernanceItem 11. Executive CompensationItem 12. Security Ownership Of Certain Beneficial Owners and Management and Related Stockholder MattersItem 13. Certain Relationships and Related Transactions, and Director IndependenceItem 14. Principal Accounting Fees and ServicesPart IVItem 15. Exhibits, Financial Statement ScheduleNote 1 - Organization and Summary Of Significant Accounting PoliciesNote 2 - Stock-based CompensationNote 3 - Net Income Per ShareNote 4 - 3dfxNote 5 - GoodwillNote 6 - Amortizable Intangible AssetsNote 7 - Marketable SecuritiesNote 8 - Fair Value Of Cash Equivalents and Marketable SecuritiesNote 9 - Balance Sheet ComponentsNote 10 - GuaranteesNote 11 - Long-term DebtNote 12 - Commitments and ContingenciesNote 13 - Income TaxesNote 14 - Stockholders EquityNote 15 - Employee Retirement PlansNote 16 - Segment InformationNote 17 - Quarterly Summary (unaudited)Note 18 - Subsequent Event