NVIDIA CORP
10-Ks and 10-Qs
|
|
|
|
|
|
|
|
|
|
|
|
|
|
|
|
|
|
|
|
|
|
|
|
|
|
|
|
|
|
|
|
|
|
|
|
|
|
|
|
|
|
|
|
|
|
|
|
|
|
|
|
|
|
|
|
UNITED STATES
SECURITIES AND EXCHANGE COMMISSION
Washington, D.C. 20549
____________________________________________________________________________________________
FORM 10-K
|
[x]
|
ANNUAL REPORT PURSUANT TO SECTION 13 OR 15(d) OF THE SECURITIES EXCHANGE ACT OF 1934
|
|
For the fiscal year ended January 31, 2016
|
|
OR
|
[_]
|
TRANSITION REPORT PURSUANT TO SECTION 13 OR 15(d) OF THE SECURITIES EXCHANGE ACT OF 1934
|
Commission file number: 0-23985

NVIDIA CORPORATION
(Exact name of registrant as specified in its charter)
|
Delaware
|
94-3177549
|
|
(State or other jurisdiction of
|
(I.R.S. Employer
|
|
Incorporation or Organization)
|
Identification No.)
|
2701 San Tomas Expressway
Santa Clara, California 95050
(408) 486-2000
(Address, including zip code, and telephone number, including area code, of principal executive offices)
Securities registered pursuant to Section 12(b) of the Act:
|
Title of each class
|
Name of each exchange on which registered
|
|
Common Stock, $0.001 par value per share
|
The NASDAQ Global Select Market
|
Securities registered pursuant to Section 12(g) of the Act:
None
Indicate by check mark if the registrant is a well-known seasoned issuer, as defined in Rule 405 of the Securities Act. Yes
ý
No
o
Indicate by check mark if the registrant is not required to file reports pursuant to Section 13 or Section 15(d) of the Act. Yes
o
No
ý
Indicate by check mark whether the registrant (1) has filed all reports required to be filed by Section 13 or 15(d) of the Securities Exchange Act of 1934 during the preceding 12 months (or for such shorter period that the registrant was required to file such reports), and (2) has been subject to such filing requirements for the past 90 days. Yes
ý
No
o
Indicate by check mark whether the registrant has submitted electronically and posted on its corporate Web site, if any, every Interactive Data File required to be submitted and posted pursuant to Rule 405 of Regulation S-T (§232.405 of this chapter) during the preceding 12 months (or for such shorter period that the registrant was required to submit and post such files). Yes
ý
No
o
Indicate by check mark if disclosure of delinquent filers pursuant to Item 405 of Regulation S-K (§ 229.405 of this chapter) is not contained herein, and will not be contained, to the best of registrant’s knowledge, in definitive proxy or information statements incorporated by reference in Part III of this Form 10-K or any amendment to this Form 10-K.
ý
Indicate by check mark whether the registrant is a large accelerated filer, an accelerated filer, a non-accelerated filer, or a smaller reporting company. See definitions of “large accelerated filer,” “accelerated filer” and “smaller reporting company” in Rule 12b-2 of the Exchange Act. (Check one)
|
Large accelerated filer
x
|
Accelerated filer
o
|
|
Non-accelerated filer
o
(Do not check if a smaller reporting company)
|
Smaller reporting company
o
|
Indicate by check mark whether the registrant is a shell company (as defined in Rule 12b-2 of the Act). Yes
o
No
ý
The aggregate market value of the voting stock held by non-affiliates of the registrant as of July 24, 2015 was approximately $9.92 billion (based on the closing sales price of the registrant's common stock as reported by the NASDAQ Global Select Market on July 24, 2015). This calculation excludes
28 million
shares held by directors and executive officers of the registrant. This calculation does not exclude shares held by such organizations whose ownership exceeds 5% of the registrant's outstanding common stock that have represented to the registrant that they are registered investment advisers or investment companies registered under section 8 of the Investment Company Act of 1940.
The number of shares of common stock outstanding as of
March 11, 2016
was
542 million
.
DOCUMENTS INCORPORATED BY REFERENCE
Portions of the registrant's Proxy Statement for its 2016 Annual Meeting of Shareholders to be filed with the Securities and Exchange Commission pursuant to Regulation 14A not later than 120 days after the end of the fiscal year covered by this Annual Report on Form 10-K are incorporated by reference into Part III, Items 10-14 of this Annual Report on Form 10-K.
NVIDIA CORPORATION
TABLE OF CONTENTS
|
|
|
Page
|
|
|
|
|
|
|
|
|
|
|
|
|
|
|
|
|
|
|
|
|
|
|
|
|
|
|
||
|
|
|
|
|
|
|
|
|
|
|
|
|
|
|
|
|
|
|
|
|
|
|
|
|
|
|
|
|
|
|
|
|
|
|
|
|
|
|
|
|
|
|
|
|
|
|
|
|
|
|
|
|
|
|
|
|
|
|
|
|
|
|
|
|
|
|
|
|
|
|
|
2
WHERE YOU CAN FIND MORE INFORMATION
Investors and others should note that we announce material financial information to our investors using our investor relations website, press releases, SEC filings and public conference calls and webcasts. We also use the following social media channels as a means of disclosing information about the company, our products, our planned financial and other announcements and attendance at upcoming investor and industry conferences, and other matters and for complying with our disclosure obligations under Regulation FD:
NVIDIA Twitter Account (https://twitter.com/NVIDIA)
NVIDIA Company Blog (http://blogs.nvidia.com/)
NVIDIA Facebook Page (https://www.facebook.com/NVIDIA)
NVIDIA LinkedIn Page (http://www.linkedin.com/company/nvidia?trk=hb_tab_compy_id_3608)
In addition, investors and others can use the Pulse news reader to subscribe to the NVIDIA Daily News feed and can view NVIDIA videos on YouTube.
The information we post through these social media channels may be deemed material. Accordingly, investors should monitor these accounts and the blog, in addition to following our press releases, SEC filings and public conference calls and webcasts. This list may be updated from time to time. The information we post through these channels is not a part of this annual report on Form 10-K. These channels may be updated from time to time on NVIDIA's investor relations website.
Forward-Looking Statements
This Annual Report on Form 10-K contains forward-looking statements within the meaning of Section 27A of the Securities Act of 1933, as amended, and Section 21E of the Securities Exchange Act of 1934, as amended, which are subject to the “safe harbor” created by those sections. Forward-looking statements are based on our management's beliefs and assumptions and on information currently available to our management. In some cases, you can identify forward-looking statements by terms such as “may,” “will,” “should,” “could,” “goal,” “would,” “expect,” “plan,” “anticipate,” “believe,” “estimate,” “project,” “predict,” “potential” and similar expressions intended to identify forward-looking statements. These statements involve known and unknown risks, uncertainties and other factors, which may cause our actual results, performance, time frames or achievements to be materially different from any future results, performance, time frames or achievements expressed or implied by the forward-looking statements. We discuss many of these risks, uncertainties and other factors in this Annual Report on Form 10-K in greater detail under the heading “Risk Factors.” Given these risks, uncertainties and other factors, you should not place undue reliance on these forward-looking statements. Also, these forward-looking statements represent our estimates and assumptions only as of the date of this filing. You should read this Annual Report on Form 10-K completely and with the understanding that our actual future results may be materially different from what we expect. We hereby qualify our forward-looking statements by these cautionary statements. Except as required by law, we assume no obligation to update these forward-looking statements publicly, or to update the reasons actual results could differ materially from those anticipated in these forward-looking statements, even if new information becomes available in the future.
All references to “NVIDIA,” “we,” “us,” “our” or the “Company” mean NVIDIA Corporation and its subsidiaries, except where it is made clear that the term means only the parent company.
© 2016 NVIDIA Corporation. All rights reserved. NVIDIA, the NVIDIA logo, GeForce, Quadro, Tegra, Tesla, CUDA, GeForce Experience, ICERA, Iray, Maxwell, NVIDIA DesignWorks, NVIDIA DIGITS, NVIDIA DRIVE, NVIDIA GameWorks, NVIDIA GeForce NOW, NVIDIA GRID, NVIDIA SHIELD and Pascal are trademarks and/or registered trademarks of NVIDIA Corporation in the United States and other countries. Other company and product names may be trademarks of the respective companies with which they are associated.
3
Our Company
NVIDIA is the world leader in visual computing. It enables us to open up new avenues of exploration, facilitate creativity and discovery, and power breakthroughs in new areas like artificial intelligence, virtual reality and autonomous cars.
Beginning as a PC graphics chip company, NVIDIA has transformed into a specialized platform company that targets four large markets - Gaming, Professional Visualization, Datacenter and Automotive - where visual computing is essential and valued. We are focused on delivering value through PC, mobile and cloud architectures. Our vertical integration enables us to bring together hardware, system software, programmable algorithms, systems and services to create unique value for the markets we serve.
Innovation is at our core. We have invested $12 billion in research and development since our inception, yielding some 7,300 patent assets, including inventions essential to modern computing. The GPU introduced the world to the power of programmable graphics. Our invention of CUDA has enabled the GPU’s parallel processing capabilities to be harnessed to accelerate general purpose computing. And our invention of the virtualized GPU has put the power of parallel processing into the cloud, accessible from virtually any connected device, anywhere.
Gamers choose NVIDIA GPUs to enjoy immersive fantasy worlds, which will increasingly be experienced in virtual reality. Professional designers use them to create visual effects in movies and design products ranging from soft drink bottles to commercial aircraft. Researchers use them to accelerate a wide range of important applications, from simulations of viruses to the revolution in deep learning, which has broad applications ranging from analyzing scientific data to facilitating everyday tasks.
Our GPU product brands are aimed at specialized markets including GeForce for gamers; Quadro for designers; Tesla for researchers and analysts focused on artificial intelligence, deep learning and big-data; and GRID for cloud-based visual computing users. We also integrate our GPUs into powerful mobile system-on-a-chip (SOC) processors, which drive supercomputing capabilities for tablets and online gaming and entertainment devices, as well as autonomous robots, drones and cars. Our Tegra brand integrates an entire computer onto a single chip, incorporating GPUs and multi-core CPUs with audio, video and input/output capabilities.
Headquartered in Santa Clara, California, NVIDIA was incorporated in California in April 1993 and reincorporated in Delaware in April 1998.
Our Businesses
Our two reportable segments - GPU and Tegra Processor - are based on a single underlying architecture. From our proprietary processors, we have created platforms that address four large markets where our visual computing expertise is critical: Gaming, Professional Visualization, Datacenter, and Automotive.
|
Businesses
|
NVIDIA Visual Computing Platforms and Brands
|
||
|
GPU
|
∙
|
GeForce
for PC gaming
|
|
|
∙
|
Quadro
for design professionals working in computer-aided design, video editing, special effects and other creative applications
|
||
|
∙
|
Tesla
for deep learning and accelerated computing, leveraging the parallel computing capabilities of GPUs for general purpose computing
|
||
|
∙
|
GRID
to provide the power of NVIDIA graphics through the cloud and datacenters
|
||
|
Tegra Processor
|
∙
|
Tegra
processors are primarily designed to enable our branded platforms - DRIVE and SHIELD. Tegra is also sold to OEMs for devices where graphics and overall performance is of great importance
|
|
|
∙
|
DRIVE
automotive computers that provide supercomputing capabilities to make driving safer and more enjoyable
|
||
|
∙
|
SHIELD
includes a family of devices designed to harness the power of mobile-cloud to revolutionize gaming
|
||
4
Our Markets
We specialize in markets in which visual computing and accelerated computing platforms are important. These platforms incorporate hardware, systems software, programmable algorithms, systems and services to deliver value that is unique in the marketplace.
Gaming
Computer gaming is one of the largest entertainment industries. Helping to propel it are the launch of new gaming titles, the rise of eSports - competitive online gaming - and the new realm of virtual reality.
Our GPUs enhance the gaming experience by improving the visual quality of graphics, increasing the frame rate for smoother gameplay and improving realism by replicating the behavior of light and physical objects. These can be enjoyed independently or together to extend the gaming experience across platforms.
Our gaming platforms utilize sophisticated 3D software and algorithms - including our GameWorks investment in real-time graphics and simulation. These enable us to deliver realism and immersion, even when playing games remotely from the cloud. We further enhance gaming with GeForce Experience, our gaming application that optimizes the PC user’s settings for each title and enables players to record and share their victories. It has been downloaded by more than 70 million users.
Our products for the gaming market include GeForce GTX GPUs for PC gaming, the SHIELD family of tablet and portable devices for mobile gaming, GRID for cloud-based streaming on gaming devices, and development services for gaming platforms.
Professional Visualization
We serve the Professional Visualization market by working closely with independent software vendors to optimize their offerings for NVIDIA GPUs. Our visual computing solutions enhance productivity for critical parts of the workflow for such major industries as automotive, media and entertainment, oil and gas, and medical imaging - where our GPUs improve productivity and introduce new capabilities.
For designers who build the products we use every day, it is critical that what they see digitally mirrors reality. This requires simulating the physical behavior of light and materials, or physically-based rendering, an emerging trend in professional design. Our Iray and DesignWorks software delivers this to designers. They enable an architect designing a building with a computer-aided design package to interact with the model in real time, view the model in greater detail, and generate photorealistic renderings for the client. And they enable an automotive designer to create a highly realistic 3D image of a car, which can be viewed from all angles, reducing reliance on creating costly, time-consuming full-scale clay models.
Just as virtual reality is becoming more important in gaming, there is a growing number of enterprise applications - within medicine, architecture, product design and retailing - that we are helping to enable for virtual experiences. Virtual car showrooms, surgical training, and bringing historical scenes to life are early examples of this technology deployed.
Visual computing is vital to productivity in many environments, including:
|
•
|
Design and Manufacturing
- including computer-aided design, architectural design, consumer-products manufacturing, medical instrumentation and aerospace
|
|
•
|
Digital Content Creation
- including professional video editing and post production, special effects for films and broadcast-television graphics
|
|
•
|
Enterprise Graphics Virtualization
- including enterprises that virtualize their IT infrastructure using software from companies such as VMware, Inc. and Citrix Systems, Inc., which are significantly improved by NVIDIA GRID hardware and software
|
Our brand for this market is Quadro for workstations. Quadro GPUs enhance the productivity of designers by improving performance and adding functionality, such as photorealistic rendering, high color fidelity and advanced scalable display capabilities.
5
Datacenter
The NVIDIA Tesla accelerated computing platform greatly increases the performance and power efficiency of high-performance computers and datacenter systems by applying the parallel-processing of GPUs and enabling software to solve general-purpose computing problems. Tesla-based servers and supercomputers increase the speed of applications used in such fields as aerospace, bio-science research, mechanical and fluid simulations, energy exploration, deep learning, computational finance and data analytics.
Accelerated computing is recognized as the path forward for high performance computing amid the slowing of Moore’s Law - which postulates the doubling of transistors every 18-24 months. The proportion of supercomputers utilizing accelerators has grown sharply over the past five years, now accounting for one-fifth of the systems on the Top 500 list and one-third of the list’s total floating-point operations per second. Tesla GPU accelerators power the fastest supercomputers in the United States, Japan and Europe. They will also drive the U.S. Energy Department’s next generation of supercomputers at Oak Ridge and Lawrence Livermore National Laboratories.
Tesla has had a significant impact on scientific discovery, including improving heart surgery, HIV research and mapping human genome folds. Tesla GPUs and our cuDNN software have been broadly adopted for deep learning, a new computing method for enabling artificial intelligence. Deep learning enables computers to learn for themselves and perform tasks, like recognizing images, text and speech - in some cases better than humans. Leading web-services companies are using GPUs to improve consumer cloud services. The use of deep learning is growing rapidly in many industries, automating such tasks as reading medical imaging, surveying coral on the sea bottom and robotically thinning lettuce harvests to maximize crop yields.
We also serve the Datacenter market with GRID for virtualized graphics. GRID makes it possible to run graphics-intensive applications remotely on a server in the datacenter, instead of locally on a PC or workstation. Applications include accelerating virtual desktop infrastructures and delivering graphics-intensive applications from the cloud.
Automotive
The automotive technology market has grown tremendously as the car itself is becoming a powerful computer. Cars will feature a multitude of devices, driven by sophisticated software algorithms. These devices will be designed to ensure our safety and the safety of those around us, enhance our comfort and enjoyment, and search and navigate. They will use the tools of deep learning to sense their environment, ultimately driving themselves.
Our products are in more than 10 million cars on the road today, powering infotainment, navigation and virtual cockpit systems from a broad range of automakers.
To enable autonomous driving, NVIDIA delivers an end-to-end solution - consisting of NVIDIA DIGITS and DRIVE PX - for both training a deep neural network, as well as deploying the output of that network in a car. DIGITS is a tool for developing, training and visualizing deep neural networks that can run on any NVIDIA GPU-based system. The trained neural net model runs within the car on NVIDIA DRIVE PX 2, an artificial intelligence platform that can utilize many configurations offering processing power greater than 150 Macbook Pro notebooks.
Beyond Automotive, we see the opportunity for Tegra in other embedded areas where visual computing is valued. Examples include robots that respond to voice and gesture commands, drones that process enormous amounts of visual-based data and smart monitors powered by Android that make a PC optional.
Business Strategies
NVIDIA’s key strategies that shape our overall business approach include:
Extending our technology leadership in visual computing.
We believe that visual computing is fundamental to the continued expansion and evolution of computing. We apply our research and development resources to extending our leadership in visual computing, enabling us to enhance the user experience for consumer entertainment and professional visualization applications.
6
Extending our visual computing leadership into mobile and cloud-computing platforms.
We believe that visual computing will remain a key component in the computing paradigm circumscribed by mobile, cloud and software as a service. We enable interactive graphics applications - such as games, movie and photo editing and design software - to be accessed by any device, anywhere. We believe that the user experience in virtual desktop infrastructures should be indistinguishable from physical environments and, accordingly, leverage our research and development resources to create differentiated devices and products that deliver this capability.
Revolutionizing computing with the GPU’s parallel processing capability.
We believe that the massively parallel processing capabilities of NVIDIA GPUs can solve complex computational problems in significantly less time and with less power consumption than a CPU. We work with developers worldwide who write programs for the CUDA platform using various high-level programming languages. Developers are able to accelerate applications in areas ranging from molecular dynamics to image processing, derivatives modeling for financial risk analysis and big-data analytics.
Protecting our intellectual property, and using it to enter into license and development contracts.
We believe our intellectual property portfolio is a valuable asset that can be monetized by licensing our technology to customers and partners that desire to build such capabilities directly into their own products. Such license and development arrangements can further enhance the reach of our graphics and mobile technology.
Enabling visual computing platforms in key focus areas.
We believe that we are well-positioned to use our expertise in visual and parallel computing to make contributions in four key markets where our visual computing expertise is valued:
-
Gaming
:
Our strategy is to use advanced graphics technologies to create a range of gaming platforms, stretching across PCs, mobile devices and the cloud.
-
Professional Visualization
: Our strategy is to serve as our customers' most trusted graphics partner, working closely with independent software vendors to optimize their offerings for NVIDIA GPUs.
-
Datacenter
:
Our strategy is to serve growing demand for deep learning, big-data analytics and scientific computing.
-
Automotive
: Our strategy is to utilize Tegra’s visual computing capabilities to augment the driving experience, as well as leverage our significant supercomputing capabilities to accelerate autonomous driving.
Sales and Marketing
Our worldwide sales and marketing strategy is key to achieving our objective of providing markets with our high-performance and efficient GPUs and mobile SOC products. Our sales and marketing teams, located across our global markets, work closely with each industry's respective original equipment manufacturers, or OEMs, original device manufacturers, or ODMs, system builders, motherboard manufacturers, add-in board manufacturers, or AIBs, retailers/distributors and industry trendsetters, collectively referred to as our Channel, to define product features, performance, price and timing of new products. Members of our sales team have a high level of technical expertise and product and industry knowledge to support the competitive and complex design win process. We also employ a highly skilled team of application engineers to assist our Channel in designing, testing and qualifying system designs that incorporate our products. We believe that the depth and quality of our design support are keys to improving our Channel's time-to-market, maintaining a high level of customer satisfaction within our Channel and fostering relationships that encourage our customers and partners to use the next generation of our products.
As a result of our Channel strategy, a small number of our customers represent the majority of our revenue. Sales to ASUSTeK Computer Inc., accounted for
11%
of our total revenue for fiscal year 2016.
To encourage software title developers and publishers to develop games optimized for platforms utilizing our products and enterprise applications optimized for our GPUs, we seek to establish and maintain strong relationships in the software development community. Engineering and marketing personnel interact with and visit key software developers to promote and discuss our products, as well as to ascertain product requirements and solve technical problems. Our developer program makes certain that our products are available to developers prior to volume availability in order to encourage the development of software applications and game titles that are optimized for our products.
As NVIDIA’s business has evolved from gaming to broader areas and from chips to platforms, so, too, have our avenues to market. SHIELD products, such as our gaming tablet and Android TV device, are sold through e-tail channels and through some of the world’s largest retailers.
7
Backlog
Our sales are primarily made pursuant to standard purchase orders. The quantity of products purchased by our customers as well as our shipment schedules are subject to revisions that reflect changes in both the customers' requirements and in manufacturing availability. The semiconductor industry is characterized by short lead time orders and quick delivery schedules. In light of industry practice and experience, we believe that only a small portion of our backlog is non-cancelable and that the dollar amount associated with the non-cancelable portion is not significant.
Seasonality
Our GPU and Tegra processor products serve many markets from consumer PC gaming to enterprise workstations to government and service provider cloud datacenters; however, a majority of our revenue is consumer focused. Our consumer products have typically seen stronger revenue in the second half of our fiscal year. However, there can be no assurance that this trend will continue.
Manufacturing
We do not directly manufacture semiconductor wafers used for our products. Instead, we utilize what is known as a fabless manufacturing strategy for all of our product-line operating segments whereby we employ world-class suppliers for all phases of the manufacturing process, including wafer fabrication, assembly, testing and packaging. This strategy uses the expertise of industry-leading suppliers that are certified by the International Organization for Standardization in such areas as fabrication, assembly, quality control and assurance, reliability and testing. In addition, this strategy allows us to avoid many of the significant costs and risks associated with owning and operating manufacturing operations. While we directly procure certain raw materials used in the production of our products, such as substrates and a variety of components, our suppliers are responsible for procurement of the majority of the raw materials used in the production of our products. As a result, we can focus our resources on product design, additional quality assurance, marketing and customer support.
We utilize industry-leading suppliers, such as Taiwan Semiconductor Manufacturing Company Limited and Samsung Electronics Co. Ltd, to produce our semiconductor wafers. We then utilize independent subcontractors, such as Advanced Semiconductor Engineering, Inc., BYD Auto Co. Ltd., Hon Hai Precision Industry Co., Ltd., JSI Logistics Ltd., King Yuan Electronics Co., Ltd. and Siliconware Precision Industries Company Ltd. to perform assembly, testing and packaging of most of our products and platforms. We purchase substrates from IbidenCo., Ltd., Nanya Technology Corporation, and Unimicron Technology Corporation.
We typically receive semiconductor products from our subcontractors, perform incoming quality assurance and then ship the semiconductors to contract equipment manufacturers, or CEMs, distributors, motherboard and AIB customers from our third-party warehouse in Hong Kong. Generally, these manufacturers assemble and test the boards based on our design kit and test specifications, and then ship our products to retailers, system builders or OEMs as motherboard and add-in board solutions.
Working Capital
We focus considerable attention on managing our inventories and other working-capital-related items. We manage inventories by communicating with our customers and partners and then using our industry experience to forecast demand on a product-by-product basis. We then place manufacturing orders for our products that are based on forecasted demand. The quantity of products actually purchased by our customers as well as shipment schedules are subject to revisions that reflect changes in both the customers' requirements and in manufacturing availability. We generally maintain substantial inventories of our products because the semiconductor industry is characterized by short lead time orders and quick delivery schedules. A substantial amount of our inventories are maintained as semi-finished products that can be leveraged across a wide range of our processors to balance our customer demands.
Our existing cash and marketable securities balances increased by
9%
to
$5.04 billion
at the end of fiscal year 2016 compared with the end of fiscal year 2015. We believe that these balances and our anticipated cash flows from operations will be sufficient to meet our operating, acquisition, capital expenditure and intended capital return to shareholders needs for at least the next twelve months.
8
Research and Development
We believe that the continued introduction of new and enhanced products designed to deliver leading visual computing technology is essential to our future success. Our research and development strategy is to focus on concurrently developing multiple generations of GPUs and Tegra Processors, including GPUs for high-performance computing, and Tegra SOCs for SHIELD and other mobile products using independent design teams. Our research and development efforts include software engineering, hardware engineering, very large scale integration design engineering, process engineering, architecture and algorithms.
A critical component of our product development effort is our partnerships with industry leaders. We invest significant resources in the development of relationships with industry leaders, often assisting these companies in the product definition of their new products. We believe that forming these relationships and utilizing next-generation development tools to design, simulate and verify our products will help us remain at the forefront of visual computing and develop products that utilize leading-edge technology on a rapid basis. We believe in leveraging our significant research and development depth and scale to create differentiated products.
As of
January 31, 2016
, we had
6,566
full-time employees engaged in research and development. During fiscal years
2016
, 2015 and 2014, we incurred research and development expense of
$1.33 billion
,
$1.36 billion
and $
1.34 billion
, respectively.
Competition
The market for our products is intensely competitive and is characterized by rapid technological change, evolving industry standards and declining average selling prices. We believe that the principal competitive factors in this market are performance, breadth of product offerings, access to customers and partners and distribution channels, software support, conformity to industry standard Application Programming Interfaces, manufacturing capabilities, processor pricing and total system costs. We believe that our ability to remain competitive will depend on how well we are able to anticipate the features and functions that customers and partners will demand and whether we are able to deliver consistent volumes of our products at acceptable levels of quality and at competitive prices. We expect competition to increase from both existing competitors and new market entrants with products that may be less costly than ours, or may provide better performance or additional features not provided by our products. In addition, it is possible that new competitors or alliances among competitors could emerge and acquire significant market share.
A significant source of competition comes from companies that provide or intend to provide GPUs and mobile SOC products. Some of our competitors may have greater marketing, financial, distribution and manufacturing resources than we do and may be more able to adapt to customer or technological changes.
Our current competitors include:
|
•
|
suppliers of discrete and integrated GPUs, including supercomputers and chipsets that incorporate 3D graphics functionality as part of their existing solutions, such as Advanced Micro Devices, or AMD, and Intel Corporation, or Intel;
|
|
•
|
suppliers of SOC products that are embedded into automobiles and smart devices such as televisions, monitors, set-top boxes, gaming devices and automobiles, such as Ambarella, Inc., AMD, Apple, Inc., Avago Technologies Ltd., Intel, Marvell Technology Group Ltd., Mediatek, Mobileye N.V., Qualcomm Incorporated, Renesas Electronics Corporation, Samsung, ST Microelectronics, and Texas Instruments Incorporated; and
|
|
•
|
licensors of graphics technologies, such as ARM Holdings plc, or ARM, and Imagination Technologies Group plc.
|
9
Patents and Proprietary Rights
We rely primarily on a combination of patents, trademarks, trade secrets, employee and third-party nondisclosure agreements and licensing arrangements to protect our intellectual property in the United States and internationally. Our currently issued patents have expiration dates from April 2016 to December 2034. We have numerous patents issued, allowed and pending in the United States and in foreign jurisdictions. Our patents and pending patent applications primarily relate to our products and the technology used in connection with our products. We also rely on international treaties, organizations and foreign laws to protect our intellectual property. The laws of certain foreign countries in which our products are or may be manufactured or sold, including various countries in Asia, may not protect our products or intellectual property rights to the same extent as the laws of the United States. This decreased protection makes the possibility of piracy of our technology and products more likely. We continuously assess whether and where to seek formal protection for particular innovations and technologies based on such factors as:
•
the location in which our products are manufactured;
•
our strategic technology or product directions in different countries;
•
the degree to which intellectual property laws exist and are meaningfully enforced in different jurisdictions; and
•
the commercial significance of our operations and our competitors' operations in particular countries and regions.
We have also licensed technology from third parties for incorporation in some of our products and for defensive reasons, and expect to continue to enter into such license agreements.
Employees
As of
January 31, 2016
, we had
9,227
employees,
6,566
of whom were engaged in research and development and
2,661
of whom were engaged in sales, marketing, operations and administrative positions.
Environmental Regulatory Compliance
To date, we have not incurred significant expenses related to environmental regulatory compliance matters.
Financial Information by Reporting Segment and Geographic Data
The information included in
Note 16
of the Notes to the Consolidated Financial Statements in Part IV, Item 15 of this Annual Report on Form 10-K, including financial information by reportable segment and revenue and long-lived assets by geographic region, is hereby incorporated by reference. For additional detail regarding the risks attendant to our foreign operations see “Item 1A. Risk Factors - Risks Related to Our Business, Industry and Partners -
We are subject to risks and uncertainties associated with international operations which may harm our business.
”
Executive Officers of the Registrant
The following sets forth certain information regarding our executive officers, their ages and positions as of
March 11, 2016
:
|
Name
|
Age
|
Position
|
||
|
Jen-Hsun Huang
|
53
|
President, Chief Executive Officer and Director
|
||
|
Colette M. Kress
|
48
|
Executive Vice President and Chief Financial Officer
|
||
|
Ajay K. Puri
|
61
|
Executive Vice President, Worldwide Field Operations
|
||
|
David M. Shannon
|
60
|
Executive Vice President, Chief Administrative Officer and Secretary
|
||
|
Debora Shoquist
|
61
|
Executive Vice President, Operations
|
||
Jen-Hsun Huang
co-founded NVIDIA in April 1993 and has served as its President, Chief Executive Officer and a member of the Board of Directors since its inception. From 1985 to 1993, Mr. Huang was employed at LSI Logic Corporation, a computer chip manufacturer, where he held a variety of positions including as Director of Coreware, the business unit responsible for LSI's “system-on-chip”. From 1983 to 1985, Mr. Huang was a microprocessor designer for Advanced Micro Devices, Inc., a semiconductor company. Mr. Huang holds a B.S.E.E. degree from Oregon State University and an M.S.E.E. degree from Stanford University.
10
Colette M. Kress
joined NVIDIA in September 2013 as Executive Vice President and Chief Financial Officer. Prior to NVIDIA, Ms. Kress most recently served as Senior Vice President and Chief Financial Officer of the Business Technology and Operations Finance organization at Cisco Systems, Inc., a networking equipment company, since 2010. At Cisco, Ms. Kress was responsible for financial strategy, planning, reporting and business development for all business segments, engineering and operations. From 1997 to 2010 Ms. Kress held a variety of positions at Microsoft Corporation, a software company, including, beginning in 2006, Chief Financial Officer of the Server and Tools division, where Ms. Kress was responsible for financial strategy, planning, reporting and business development for the division. Prior to joining Microsoft, Ms. Kress spent eight years at Texas Instruments Incorporated, a semiconductor company, where she held a variety of finance positions. Ms. Kress holds a B.S. degree in Finance from University of Arizona and an M.B.A. degree from Southern Methodist University.
Ajay K. Puri
joined NVIDIA in December 2005 as Senior Vice President, Worldwide Sales and became Executive Vice President, Worldwide Sales (subsequently renamed to Worldwide Field Operations) in January 2009. Prior to NVIDIA, he held positions in sales, marketing, and general management over a 22-year career at Sun Microsystems, Inc., a computing systems company. Mr. Puri previously held marketing, management consulting, and product development positions at Hewlett-Packard Company, an information technology company, Booz Allen Hamilton Inc., a management and technology consulting company, and Texas Instruments. Mr. Puri holds a B.S.E.E. degree from the University of Minnesota, an M.S.E.E. degree from the California Institute of Technology and an M.B.A. degree from Harvard Business School.
David M. Shannon
serves as Executive Vice President, Chief Administrative Officer and Secretary of NVIDIA. In this role, he is responsible for NVIDIA’s legal and human resources functions, as well as intellectual property licensing. Mr. Shannon joined NVIDIA in August 2002 as Vice President and General Counsel. Mr. Shannon became Secretary of NVIDIA in April 2005, a Senior Vice President in December 2005 and an Executive Vice President in January 2009. In January 2013, Mr. Shannon also became the head of Human Resources. Mr. Shannon was promoted to the role of Chief Administrative Officer in January 2014. From 1993 to 2002, Mr. Shannon held various counsel positions at Intel, most recently the position of Vice President and Assistant General Counsel. Mr. Shannon also practiced for eight years in the law firm of Gibson Dunn and Crutcher, focusing on complex commercial and high-technology related litigation. Mr. Shannon holds B.A. and J.D. degrees from Pepperdine University.
Debora Shoquist
joined NVIDIA in 2007 as Senior Vice President of Operations and in 2009 became Executive Vice President of Operations. Her role has since expanded with responsibility added for Facilities in 2013, and for Information Technology in 2015. Prior to NVIDIA, Ms. Shoquist served from 2004 to 2007 as Executive Vice President of Operations at JDS Uniphase Corp., a provider of communications test and measurement solutions and optical products for the telecommunications industry. She served from 2002 to 2004 as Senior Vice President and General Manager of the Electro-Optics business at Coherent, Inc., a manufacturer of commercial and scientific laser equipment. Previously, she worked at Quantum Corp., a data protection company, as President of the Personal Computer Hard Disk Drive Division, and at Hewlett-Packard Corp. Ms. Shoquist holds a B.S. degree in Electrical Engineering from Kansas State University and a B.S. degree in Biology from Santa Clara University.
Available Information
Our annual reports on Form 10-K, quarterly reports on Form 10-Q, current reports on Form 8-K and, if applicable, amendments to those reports filed or furnished pursuant to Section 13(a) of the Securities Exchange Act of 1934, as amended, are available free of charge on or through our web site,
http://www.nvidia.com
, as soon as reasonably practicable after we electronically file such material with, or furnish it to, the Securities and Exchange Commission, or the SEC. Our web site and the information on it or connected to it are not a part of this Annual Report on Form 10-K.
11
In evaluating NVIDIA and our business, the following factors should be considered in addition to the other information in this Annual Report on Form 10-K. Before you buy our common stock, you should know that making such an investment involves risks including, but not limited to, the risks described below. Any one of the following risks could harm our business, financial condition and results of operations, which could cause our stock price to decline. Additional risks, trends and uncertainties not presently known to us or that we currently deem immaterial may also harm our business.
Risks Related to Our Business, Industry and Partners
If we are unable to successfully compete in our target markets, our revenue and financial results will be adversely impacted
.
NVIDIA-branded products and services are visual computing platforms that address four large markets: Gaming, Professional Visualization, Datacenter, and Automotive. Our products, services and technologies are designed to meet the evolving needs of these markets; however, these markets remain extremely competitive, and we expect competition to intensify as current competitors expand their product and/or service offerings, industry standards continue to evolve and new competitors enter these markets. Our success depends to a significant extent on our ability to identify and develop new products, services and technologies, and enhancements to our existing products, services and technologies, in a timely and cost-effective manner and to achieve consumer and market acceptance of them.
If we are unable to successfully compete in our target markets, including in significant international markets such as China, demand for our products, services and technologies could decrease which would cause our revenue to decline and our financial results to suffer. In addition, if we fail to anticipate the changing needs of our target markets and emerging technology trends, our business will be harmed.
Our competitors’ products, services and technologies may be less costly, or may offer superior functionality or different features than ours. In addition, many of our competitors operate and maintain their own fabrication facilities and have longer operating histories, greater name recognition, larger customer bases, and greater financial, sales, marketing and distribution resources than we do. These competitors may be able to more effectively identify and capitalize upon opportunities in new markets and end user customer trends, quickly transition their semiconductor products to increasingly smaller line width geometries and obtain sufficient foundry capacity and packaging materials, which could harm our business.
If we fail to successfully execute our transitions to new business models and markets, our results of operations could suffer.
In connection with our diversification into new business models, we have transformed into a specialized platform company, targeting markets where visual computing is essential and valued. Our business strategy is dependent on creating products and services that anticipate customer requirements and emerging industry trends. We cannot assure you that our new strategic direction will result in innovative products and technologies that provide value to our customers and partners. We also devote significant resources to the development of technologies and business offerings in markets where our operating history is less extensive, such as the automotive market. These new offerings and markets may require a considerable investment of technical, financial, compliance, sales and marketing resources. If demand for products and services from these growth markets is below our expectations or if we are not able to improve the cost or operational efficiencies of these new business models, we may not realize benefits from our strategy. Alternatively, we may not be able to effectively implement our strategy, or adapt that strategy as market conditions evolve, in a timely manner to exploit potential market opportunities or meet competitive challenges. If we are unable to successfully establish new offerings in light of the competitive environment, our results of operations could suffer.
If we do not replace our Intel licensing revenues, our financial results may be adversely affected.
In January 2011, we entered into a patent cross licensing agreement under which Intel agreed to pay us an aggregate of $1.50 billion over six years. The final $200 million payment under this agreement was received in January 2016. We will be recognizing revenue under this agreement through the first quarter of fiscal year 2018. If we do not enter into new licensing agreements or if the Intel agreement is not offset by other growth in income our financial results may be adversely affected.
12
If our products fail to achieve expected manufacturing yields, our financial results could be adversely impacted and our reputation with our customers and partners may be harmed.
Manufacturing yields for our products are a function of product design, which is developed largely by us, and process technology, which typically is proprietary to the foundry. Low yields may result from either product design or process technology failure. We do not know whether a yield problem will exist until our design is actually manufactured by the foundry. As a result, yield problems may not be identified until well into the manufacturing process and require us and the foundry to cooperate to resolve the problem. Because of our potentially limited access to wafer foundry capacity, any decrease in manufacturing yields could result in higher manufacturing costs and require us to allocate our available product supply among our customers and partners. Lower than expected yields could harm customer or partner relationships, our reputation and our financial results.
If our products contain significant defects, we could incur significant expenses to remediate such defects, our reputation could be damaged and we could lose market share.
Our products are complex and may contain defects or experience failures or unsatisfactory performance due to any number of issues in design, fabrication, packaging, materials and/or use within a system. Our products are used by a variety of industries, including the automotive industry. Failure of our products to perform to specifications, or other product defects, could lead to substantial damage to the products we sell directly to customers, the end product in which our device has been integrated by OEMs, ODMs, AIBs and Tier 1 automotive suppliers, and to the user of such end product. Any such defect may cause us to incur significant warranty, support and repair or replacement costs, cause us to lose market share, and divert the attention of our engineering personnel from our product development efforts to find and correct the issue. In addition, an error or defect in new products or releases or related software drivers after commencement of commercial shipments could result in failure to achieve market acceptance or loss of design wins and harm our relationships with customers and partners and consumers’ perceptions of our brand. Also, we may be required to reimburse our customers, partners or consumers, including costs to repair or replace products in the field. A product recall, particularly an automotive recall, or a significant number of product returns could be expensive, damage our reputation, result in the shifting of business to our competitors and result in litigation against us such as product liability suits. If a product liability claim is brought against us, the cost of defending the claim could be significant and would divert the efforts of our technical and management personnel, and harm our business. Further, our business liability insurance may be inadequate or future coverage may be unavailable on acceptable terms, which could adversely impact our financial results.
System security and data protection breaches, as well as cyber-attacks, could disrupt our operations, reduce our expected revenue and increase our expenses, which could adversely affect our stock price and damage our reputation.
Security breaches, computer malware and cyber-attacks have become more prevalent and sophisticated in recent years. These attacks have occurred on our systems in the past and may occur in the future. Experienced computer programmers, hackers and employees may be able to penetrate our security controls and misappropriate or compromise our confidential information, or that of our employees or third parties. These attacks may create system disruptions or cause shutdowns. These hackers may also develop and deploy viruses, worms and other malicious software programs that attack or otherwise exploit security vulnerabilities in our products, including consumer and automotive products, where we utilize over-the-air updates to improve functionality over time. For portions of our IT infrastructure, including business management and communication software products, we rely on products and services provided by third parties. These providers may also experience breaches and attacks to their products which may impact our systems. Data security breaches may also result from non-technical means, such as actions by an employee with access to our systems.
Actual or perceived breaches of our security measures or the accidental loss, inadvertent disclosure or unapproved dissemination of proprietary information or sensitive or confidential data about us, our partners, our customers or third parties could expose the parties affected to a risk of loss or misuse of this information, resulting in litigation and potential liability, damage to our brand and reputation or other harm to our business. Our efforts to prevent and overcome these challenges could increase our expenses and may not be successful. We may experience interruptions, delays, cessation of service and loss of existing or potential customers. Such disruptions could adversely impact our ability to fulfill orders and interrupt other critical functions. Delayed sales, lower margins or lost customers as a result of these disruptions could adversely affect our financial results, stock price and reputation.
13
We depend on third parties and their technology to manufacture, assemble, test and/or package our products, which reduces our control over product quantity and quality, development, enhancement and product delivery schedule and could harm our business
.
We do not manufacture the silicon wafers used for our GPUs and Tegra processors and do not own or operate a wafer fabrication facility. Instead, we are dependent on industry-leading foundries, such as Taiwan Semiconductor Manufacturing Company Limited and Samsung Electronics Co. Ltd., to manufacture our semiconductor wafers using their fabrication equipment and techniques. Similarly, we do not assemble, test or package our products, but instead rely on independent subcontractors, such as Advanced Semiconductor Engineering, Inc., BYD Auto Co., Ltd., Hon Hai Precision Industry Co., Ltd., JSI Logistics, Ltd., King Yuan Electronics Co. and Siliconware Precision Industries Co. Ltd. We do not have long-term commitment contracts with these foundries or subcontractors. As a result, we face several significant risks which could have an adverse effect on our ability to meet customer demand and/or negatively impact our business operations, gross margin, revenue and/or financial results, including:
|
•
|
a lack of guaranteed supply of wafers and other components and potential higher wafer and component prices due to supply constraints;
|
|
•
|
a failure by our foundries to procure raw materials or to provide or allocate adequate manufacturing or test capacity for our products;
|
|
•
|
a failure to develop, obtain or successfully implement high quality, leading-edge process technologies, including transitions to smaller geometry process technologies, needed to manufacture our products profitably or on a timely basis;
|
|
•
|
loss of a supplier and additional expense and/or production delays as a result of qualifying a new foundry or subcontractor and commencing volume production or testing in the event of a loss of or a decision to add or change a supplier;
|
|
•
|
a lack of direct control over delivery schedules or product quantity and quality; and
|
|
•
|
delays in product shipments, shortages, a decrease in product quality and/or higher expenses in the event our subcontractors or foundries prioritize our competitors’ orders over our orders or otherwise.
|
We also rely on third-party software development tools to assist us in the design, simulation and verification of new products or product enhancements, and to bring such new products and enhancements to market in a timely manner. In the past, we have experienced delays in the introduction of products and enhancements as a result of the inability of then available software development tools to fully simulate the complex features and functionalities of our products. The design requirements necessary to meet consumer demands for more features and greater functionality from our products may exceed the capabilities of available software development tools. If we miss design cycles or lose design wins due to the unavailability of such software development tools, we could lose market share and our revenues could decline.
If we fail to achieve design wins for our products, our business will be harmed.
For our products that we do not sell directly to consumers, achieving design wins is an important success factor. Our OEM, ODM, and AIB and motherboard manufacturers' customers typically introduce new system configurations as often as twice per year, typically based on spring and fall design cycles or in connection with trade shows. If OEMs, ODMs, and AIB and motherboard manufacturers do not include our products in their systems, they will typically not use our products in their systems until at least the next design configuration. In order to achieve design wins, we must:
•
anticipate the features and functionality that customers and consumers will demand;
|
•
|
incorporate those features and functionalities into products that meet the exacting design requirements of our customers; and
|
•
price our products competitively.
Unanticipated changes in industry standards could render our products incompatible with products developed by major hardware manufacturers and software developers. Further, if our products are not in compliance with prevailing industry standards, our customers may not incorporate our products into their design strategies.
14
Business disruptions could harm our business, lead to a decline in revenues and increase our costs.
Our worldwide operations could be disrupted by earthquakes, telecommunications failures, power or water shortages, tsunamis, floods, hurricanes, typhoons, fires, extreme weather conditions, medical epidemics or pandemics and other natural or man-made disasters, catastrophic events or climate change. The occurrence of any of these disruptions could harm our business and result in significant losses, a decline in revenue and an increase in our costs and expenses. Any of these business disruptions could require substantial expenditures and recovery time in order to fully resume operations. Our corporate headquarters, and a portion of our research and development activities, are located in California, and other critical business operations and some of our suppliers are located in Asia, near major earthquake faults known for seismic activity. In addition, a majority of our principal IT datacenters are located in California, making our operations vulnerable to natural disasters or other business disruptions occurring in this geographical area. The manufacture of product components, the final assembly of our products and other critical operations are concentrated in certain geographic locations, including Taiwan, China and Korea. Our operations could be harmed if manufacturing, logistics or other operations in these locations are disrupted for any reason, including natural disasters, high heat events or water shortages, information technology system failures, military actions or economic, business, labor, environmental, public health, regulatory or political issues. The ultimate impact on us, our third-party foundries and other suppliers and our general infrastructure of being located near major earthquake faults and being consolidated in certain geographical areas is unknown. In the event of a major earthquake or other disaster or catastrophic event, our revenue could decline and our business may be harmed.
We receive a significant amount of our revenue from a limited number of customers and our revenue could decline if we lose any of these customers.
We receive a significant amount of our revenue from a limited number of customers. Revenue from significant customers, those representing 10% or more of total revenue, was
11%
of our total revenue from
one
customer in both fiscal year 2016 and 2015 and 21% of our total revenue from two customers in fiscal year 2014. Our operating results in the foreseeable future will continue to depend on sales to a relatively small number of customers, as well as the ability of these customers to sell products that incorporate our GPUs and Tegra processors. In the future, these customers may decide not to purchase our products at all, to purchase fewer products than they did in the past, or to alter their purchasing patterns in some other way, particularly because:
|
•
|
most of our sales are made on a purchase order basis, which permits our customers to cancel, change or delay product purchase commitments with little or no notice to us and without penalty;
|
|
•
|
our customers may develop their own solutions;
|
|
•
|
our customers may purchase products from our competitors; or
|
|
•
|
our customers may discontinue sales or lose market share in the markets for which they purchase our products.
|
The loss of any of our large customers or a significant reduction in purchases by them would likely harm our financial condition and results of operations, and any difficulties in collecting accounts receivable could harm our operating results and financial condition.
We maintain an allowance for doubtful accounts for estimated losses resulting from the inability of certain of our customers to make required payments and obtain credit insurance over the purchasing credit extended to these customers. In the future, we may have to record additional provisions or write-offs and/or defer revenue on certain sales transactions, which could negatively impact our financial results, and we may not be able to acquire credit insurance on the credit we extend to these customers or in amounts that we deem sufficient.
Our gross margin depends on a number of factors and changes in any of these factors could adversely affect our gross margin.
Our gross margin for any period depends on a number of factors, including the mix of our products sold, average selling prices, introduction of new products and services, process node transitions, product transitions, sales discounts, pricing actions by our competitors, the cost of product components and the yield of wafers produced by the foundries that manufacture our products. We are focused on improving our gross margin and if we are not able to control or estimate the impact of the above factors or other factors we do not foresee, our gross margins may be negatively impacted. In addition, gross margins for our Tegra processors are lower than our overall corporate gross margins. If Tegra processors comprise a higher percentage of our future revenue, or if we continue to enter into new business areas with comparatively lower margins, our overall gross margins may decline.
15
If we fail to estimate customer demand properly, our financial results could be harmed.
We manufacture our GPUs and Tegra processors based on estimates of customer demand. In order to have shorter shipment lead times and quicker delivery schedules for our customers, we may build inventories for anticipated periods of growth which do not occur, or may build inventory anticipating demand for a product that does not materialize. In estimating demand, we make multiple assumptions, any of which may prove to be incorrect. Situations that may result in excess or obsolete inventory include:
•
changes in business and economic conditions, including downturns in our target markets and/or overall economy;
•
changes in consumer confidence caused by changes in market conditions, including changes in the credit market;
•
a sudden and significant decrease in demand for our products;
•
a higher incidence of inventory obsolescence because of rapidly changing technology or customer requirements;
•
our introduction of new products resulting in lower demand for older products;
•
less demand than expected for newly-introduced products; or
•
increased competition, including competitive pricing actions.
In addition, the cancellation or deferral of customer purchase orders could result in our holding excess inventory, which could adversely affect our gross margins. In addition, because we often sell a substantial portion of our products in the last month of each quarter, we may not be able to reduce our inventory purchase commitments in a timely manner in response to customer cancellations or deferrals. We could be required to write-down our inventory to the lower of cost or market or write-off excess inventory, and we could experience a reduction in average selling prices if we incorrectly forecast product demand, any of which could harm our financial results.
Conversely, if we underestimate our customers' demand for our products, our foundry partners may not have adequate lead-time or capacity to increase production and we may not be able to obtain sufficient inventory to fill customers' orders on a timely basis. Even if we are able to increase production levels to meet customer demand, we may not be able to do so in a cost-effective or timely manner. If we fail to fulfill our customers' orders on a timely basis, or at all, our customer relationships could be damaged, we could lose revenue and market share and our reputation could be damaged.
We are subject to risks and uncertainties associated with international operations which may harm our business.
We conduct our business worldwide and we have offices in various countries outside of the United States. Our semiconductor wafers are manufactured, assembled, tested and packaged by third parties located outside of the United States and Other Americas. We also generate a significant portion of our revenue from sales to customers outside the United States and Other Americas. Revenue from sales to customers outside of the United States and Other Americas accounted for
79%
of total revenue for fiscal year 2016 and 75% of total revenue for both fiscal year 2015 and 2014. The global nature of our business subjects us to a number of risks and uncertainties, including:
|
•
|
international economic and political conditions, such as political tensions between countries in which we do business;
|
|
•
|
unexpected changes in, or impositions of, legislative or regulatory requirements;
|
|
•
|
differing legal standards with respect to protection of intellectual property and employment practices;
|
|
•
|
local business and cultural factors that differ from our normal standards and practices, including business practices that we are prohibited from engaging in by the Foreign Corrupt Practices Act and other anticorruption laws and regulations;
|
|
•
|
exporting or importing issues related to export or import restrictions, tariffs, quotas and other trade barriers and restrictions;
|
|
•
|
financial risks such as longer payment cycles, difficulty in collecting accounts receivable and foreign exchange rate fluctuations; and
|
|
•
|
increased costs due to imposition of climate change regulations, such as carbon taxes, fuel or energy taxes, and pollution limits.
|
If sales to any of our customers outside of the United States and Other Americas are delayed or cancelled because of any of the above factors, our revenue may be negatively impacted.
16
We may not be able to realize the potential financial or strategic benefits of business acquisitions or strategic investments and we may not be able to successfully integrate acquisition targets, which could hurt our ability to grow our business, develop new products or sell our products.
We have in the past acquired and invested in, and intend to continue to acquire and invest in, other businesses that offer products, services and technologies that we believe will help expand or enhance our existing products and business. Any of the following risks associated with past or future acquisitions or investments could impair our ability to grow our business, develop new products or sell our products, and ultimately could have a negative impact on our growth or our financial results:
|
•
|
difficulty in combining the technology, products, operations or workforce of the acquired business with our business;
|
|
•
|
diversion of capital and other resources, including management's attention;
|
|
•
|
assumption of liabilities;
|
|
•
|
incurring amortization expenses, impairment charges to goodwill or write-downs of acquired assets;
|
|
•
|
potential failure of our due diligence processes to identify significant issues with product quality, architecture and development, or legal and financial contingencies, among other things; and
|
|
•
|
impairment of relationships with, or loss of our or our target’s, employees, vendors and customers, as a result of our acquisition or investment.
|
Risks Related to Regulatory, Legal, Our Common Stock and Other Matters
Actions to adequately protect our intellectual property rights could result in substantial costs to us and our ability to compete could be harmed if we are unsuccessful in doing so or if we are prohibited from making or selling our products.
We have in the past, currently are, and may in the future become involved in lawsuits or other legal proceedings alleging patent infringement or other intellectual property rights violations by us, our employees or parties that we have agreed to indemnify for certain claims of infringement. An unfavorable ruling in any such intellectual property related litigation could include significant damages, invalidation of a patent or family of patents, indemnification of customers, payment of lost profits, or, when it has been sought, injunctive relief.
We may commence litigation or other legal proceedings in order to protect our intellectual property rights. Such proceedings may increase our operating expenses, which could negatively impact our operating results. Further, we could be subject to countersuits as a result of our initiation of litigation. If infringement claims are made against us or our products are found to infringe a third party’s patent or intellectual property, we or one of our indemnitees may have to seek a license to the third party’s patent or other intellectual property rights. However, we may not be able to obtain licenses at all or on terms acceptable to us particularly from our competitors. If we or one of our indemnitees is unable to obtain a license from a third party for technology that we use or that is used in one of our products, we could be subject to substantial liabilities or have to suspend or discontinue the manufacture and sale of one or more of our products. We may also have to make royalty or other payments, or cross license our technology. If these arrangements are not concluded on commercially reasonable terms, our business could be negatively impacted. Furthermore, the indemnification of a customer or other indemnitee may increase our operating expenses which could negatively impact our operating results.
We rely primarily on a combination of patents, trademarks, trade secrets, employee and third-party nondisclosure agreements, licensing arrangements, and the laws of the countries in which we operate to protect our intellectual property in the United States and internationally. The laws of certain foreign countries may not protect our products or intellectual property rights to the same extent as the laws of the United States. This makes the possibility of piracy of our technology and products more likely. We continuously assess whether and where to seek formal protection for existing and new innovations and technologies, but cannot be certain whether our applications for such protections will be approved, and, if approved, whether we will be able to enforce such protections.
17
Our operating results have in the past fluctuated and may in the future fluctuate, and if our operating results are below the expectations of securities analysts or investors, our stock price could decline.
Our operating results have in the past fluctuated and may in the future continue to fluctuate due to numerous factors. For example, our operating expenses represent a significant portion of total revenue and are largely independent of revenue in any particular period. In particular, our research and development expenses reflect multi-year commitments to the development of new products and enhancements that will not result in revenue, if any, until future periods. Therefore, investors should not rely on quarterly comparisons of our results of operations as an indication of our future performance.
Factors that could affect our results of operations in the future include:
|
•
|
demand and market acceptance for our products and services and/or our customers’ products;
|
|
•
|
the successful development and volume production of our next-generation products;
|
|
•
|
our inability to adjust spending to offset revenue shortfalls due to the multi-year development cycle for some of our products and services;
|
|
•
|
new product and service announcements or product and service introductions by our competitors;
|
|
•
|
our introduction of new products in accordance with OEMs’ design requirements and design cycles;
|
|
•
|
changes in the timing of product orders due to unexpected delays in the introduction of our customers’ products;
|
|
•
|
the level of growth or decline of the PC industry in general;
|
|
•
|
seasonal fluctuations associated with the PC and consumer products market;
|
|
•
|
contraction in automotive and consumer end-market demand due to adverse regional or worldwide economic conditions;
|
|
•
|
slower than expected growth of demand for new technologies;
|
|
•
|
fluctuations in the availability of manufacturing capacity or manufacturing yields;
|
|
•
|
our ability to reduce the manufacturing costs of our products;
|
|
•
|
competitive pressures resulting in lower than expected average selling prices;
|
|
•
|
product rates of return in excess of that forecasted or expected due to quality issues;
|
|
•
|
rescheduling or cancellation of customer orders;
|
|
•
|
the loss of a significant customer;
|
|
•
|
substantial disruption in the operations of our foundries or other third-party subcontractors, as a result of a natural disaster, equipment failure, terrorism or other causes;
|
|
•
|
supply constraints for and changes in the cost of the other components incorporated into our customers’ products, including memory devices;
|
|
•
|
costs associated with the repair and replacement of defective products;
|
|
•
|
unexpected inventory write-downs or write-offs;
|
|
•
|
legal and other costs related to defending intellectual property and other types of lawsuits;
|
|
•
|
availability of software and technology licenses at commercially reasonable terms for the continued sale or development of new products;
|
|
•
|
customer bad debt write-offs;
|
|
•
|
changes in our effective tax rate as a result of changes in the mix of earnings in countries with differing statutory tax rates, applicable tax laws or interpretations of tax laws;
|
|
•
|
any unanticipated costs associated with environmental liabilities;
|
|
•
|
unexpected costs related to our ownership of real property;
|
|
•
|
costs to comply with new government regulations and regulatory enforcement actions;
|
|
•
|
costs to maintain effective internal control over financial reporting;
|
|
•
|
changes in financial accounting standards or interpretations of existing standards; and
|
|
•
|
general macroeconomic events and factors affecting the overall semiconductor industry and our target markets.
|
Any one or more of the factors discussed above could prevent us from achieving our expected future financial results. Any such failure to meet our expectations or the expectations of our investors or security analysts could cause our stock price to decline or experience substantial price volatility and, as a result, investors may suffer losses.
In the past, securities class action litigation has often been brought against a company following periods of volatility in the market price of its securities. We have been in the past, and may be in the future, the target of securities litigation. Such lawsuits generally result in the diversion of management's time and attention away from business operations, which could harm our business. In addition, the costs of defense and any damages resulting from litigation, a ruling against us, or a settlement of the litigation could adversely affect our cash flow and financial results.
18
Privacy concerns relating to our products and services could damage our reputation and deter current and potential users from using our products and services.
Our products and services may provide us with access to sensitive, confidential or personal data or information that is subject to privacy and security laws and regulations. Concerns about our practices with regard to the collection, use, retention, security or disclosure of personal information or other privacy-related matters, even if unfounded, could damage our reputation and adversely affect our operating results.
Worldwide regulatory authorities are considering various legislative proposals concerning data protection. In addition, the interpretation and application of consumer and data protection laws in the United States, Europe and elsewhere are often uncertain and fluid, and may be interpreted and applied in a manner that is inconsistent with our data practices. If so, we may be ordered to change our data practices and/or be fined. Complying with these changing laws could cause us to incur substantial costs, which could have an adverse effect on our business and results of operations.
We are subject to risks associated with development and construction of our headquarters building under an operating lease financing arrangement.
In fiscal year 2016, we began to construct a new headquarters building in Santa Clara, California, which is currently targeted for completion in the fourth quarter of fiscal year 2018. We may encounter unanticipated occurrences or conditions during construction that may increase the expense of the project. We may also encounter unanticipated delays in the construction of the new building and final city approval for occupancy may be delayed. We are financing this construction under an operating lease arrangement described below. Delays and cost overruns during construction could result in a default under the operating lease financing arrangement which could result in liabilities and expenses and could harm our business, prospects, financial condition and results of operations.
Additionally, any such difficulties could result in our default under the operative agreements entered into with a syndicate of banks that are participants to the operating lease financing arrangement to finance development and construction of our headquarters. We have pledged our assets that relate to the new headquarters building in order to secure our obligations under the operating lease financing arrangement. We will need to maintain compliance with the requirements governing such agreements, including compliance with financial and other covenants, certain of which may be subject to events outside of our control. If we fail to comply with the covenants, we may be unable to obtain or utilize all or a portion of the financing contemplated by the operating lease financing arrangement. Further, noncompliance with such covenants or other event of default could lead to a termination of our lease of the property, and the lenders could have the right to, among other things, foreclose on the collateral for our obligations under the operating lease financing arrangement. A loss of financing for the new headquarters building or foreclosure on the collateral could adversely affect our liquidity and business.
We have a substantial amount of indebtedness which could adversely affect our financial position and prevent us from implementing our strategy or fulfilling our contractual obligations
.
In December 2013, we issued $1.5 billion of 1.00% Convertible Senior Notes due 2018, or 1.00% Notes. Our substantial indebtedness may:
|
•
|
limit our ability to use our cash flow or borrow additional funds for working capital, capital expenditures, acquisitions and general corporate and other purposes;
|
|
•
|
make it difficult for us to satisfy our financial obligations;
|
|
•
|
place us at a competitive disadvantage compared to our less leveraged competitors; and
|
|
•
|
increase our vulnerability to the impact of adverse economic and industry conditions.
|
Additionally, our obligation to make payments related to the 1.00% Notes when converted or due could impact our cash balance and limit our ability to use our cash for our capital return program and our other liquidity needs, including working capital, capital expenditures, acquisitions, investments and other general corporate purposes.
The exercise of warrants associated with our 1.00% Notes would dilute the ownership interest of our existing shareholders.
The warrants issued concurrently with our 1.00% Notes will be deemed to be automatically exercised on certain dates between March 2019 and June 2019, unless the warrant holder notifies us otherwise. Any issuance by us of shares upon exercise of the warrants will dilute the ownership interest of our existing shareholders. Any sales in the public market by the warrant holder of our common stock upon exercise of the warrants could adversely affect prevailing market prices of our common stock.
19
Delaware law and provisions in our certificate of incorporation, our bylaws and our agreement with Microsoft Corporation could delay or prevent a change in control.
Our status as a Delaware corporation and the anti-takeover provisions of the Delaware General Corporation Law may discourage, delay, or prevent a change in control by prohibiting us from engaging in a business combination with an interested shareholder for a period of three years after the person becomes an interested shareholder, even if a change of control would be beneficial to our existing shareholders. In addition, our certificate of incorporation and bylaws contain provisions that could make it more difficult for a third party to acquire a majority of our outstanding voting stock. These provisions include the following:
•
the ability of our Board of Directors to create and issue preferred stock without prior shareholder approval;
•
the prohibition of shareholder action by written consent;
•
advance notice requirements for director nominations and shareholder proposals;
•
the ability of our Board of Directors to increase or decrease the number of directors without shareholder approval;
•
a super-majority voting requirement to amend some provisions in our certificate of incorporation and bylaws;
•
the inability of our shareholders to call special meetings of shareholders; and
•
the ability of our Board of Directors to make, amend or repeal our bylaws.
On March 5, 2000, we entered into an agreement with Microsoft in which we agreed to develop and sell graphics chips and to license certain technology to Microsoft and its licensees for use in the Xbox. Under the agreement, if an individual or corporation makes an offer to purchase shares equal to or greater than 30% of the outstanding shares of our common stock, Microsoft may have first and last rights of refusal to purchase the stock. The Microsoft provision and the other factors listed above could also delay or prevent a change in control of NVIDIA. These provisions could also discourage proxy contests and make it more difficult for shareholders to elect directors of their choosing and to cause us to take other corporate actions they desire.
Not applicable.
Our headquarters complex is located in Santa Clara, California. It includes eight leased commercial buildings totaling
896,565
square feet and real property that we own, which consists of six commercial buildings on
36
acres of land. During fiscal year 2016, we began to construct a new headquarters building in Santa Clara, California, which is currently targeted for completion in the fourth quarter of fiscal year 2018. In addition, we also lease datacenter space in Santa Clara.
Outside of Santa Clara, we lease space in Austin, Texas and a number of regional facilities in other U.S. locations, which are used as research and development centers and/or sales and administrative offices. Outside of the United States, we own a building in Hyderabad, India, which is being used primarily as a research and development center. We also lease facilities in various international locations as research and development centers and/or sales and administrative offices. These leased facilities are located primarily in Asia and Europe.
We believe that we currently have sufficient facilities to conduct our operations for the next twelve months. For additional information regarding obligations under leases, see
Note 12
of the Notes to the Consolidated Financial Statements in Part IV, Item 15 of this Annual Report on Form 10-K under the subheading “Lease Obligations,” which information is hereby incorporated by reference.
Please see Note 12 of the Notes to the Consolidated Financial Statements in Part IV, Item 15 of this Annual Report on Form 10-K for a discussion of our legal proceedings.
Not Applicable.
20
Our common stock is traded on the NASDAQ Global Select Market under the symbol NVDA. Public trading of our common stock began on January 22, 1999. Prior to that, there was no public market for our common stock. As of March 11, 2016, we had approximately 342 registered shareholders, not including those shares held in street or nominee name. The following table sets forth for the periods indicated the high and low sales price for our common stock as quoted on the NASDAQ Global Select Market:
|
High
|
Low
|
||||||
|
Fiscal year ending January 29, 2017
|
|
|
|||||
|
First Quarter (through March 11, 2016)
|
$
|
33.06
|
|
$
|
24.75
|
|
|
|
Fiscal year ended January 31, 2016
|
|||||||
|
Fourth Quarter
|
$
|
33.94
|
|
$
|
26.45
|
|
|
|
Third Quarter
|
$
|
28.78
|
|
$
|
19.09
|
|
|
|
Second Quarter
|
$
|
22.88
|
|
$
|
19.16
|
|
|
|
First Quarter
|
$
|
23.61
|
|
$
|
18.94
|
|
|
|
Fiscal year ended January 26, 2015
|
|||||||
|
Fourth Quarter
|
$
|
21.25
|
|
$
|
18.27
|
|
|
|
Third Quarter
|
$
|
20.15
|
|
$
|
16.77
|
|
|
|
Second Quarter
|
$
|
19.73
|
|
$
|
17.71
|
|
|
|
First Quarter
|
$
|
19.46
|
|
$
|
15.32
|
|
|
Dividend Policy
On May 7, 2015, we increased our quarterly cash dividend from $0.085 per share to $0.0975 per share, or $0.39 on an annual basis. On November 5, 2015, we again increased our quarterly cash dividend to $0.115 per share, or $0.46 on an annual basis. In fiscal years 2016 and 2015, we paid
$213 million
and
$186 million
, respectively, in cash dividends to our common shareholders.
Our cash dividend program and the payment of future cash dividends under the program are subject to continued capital availability and our Board of Directors' continuing determination that the dividend program and the declaration of dividends thereunder are in the best interests of our shareholders and are in compliance with all laws and agreements of NVIDIA applicable to the declaration and payment of cash dividends. In fiscal year 2016, based upon our earnings and profits, 100% of our dividend payments were considered to be a return of capital for U.S. federal income tax purposes. It is possible that a portion of our dividend payments in future fiscal years may be considered a return of capital for U.S. federal income tax purposes.
Issuer Purchases of Equity Securities
Beginning August 2004, our Board of Directors authorized us, subject to certain specifications, to repurchase shares of our common stock. In May 2015, the Board extended the previously authorized repurchase program through December 2018 and authorized an additional $1.62 billion under the repurchase program.
Through January 31, 2016, we have repurchased an aggregate of 231 million shares under our share repurchase program for a total cost of $3.85 billion. As of January 31, 2016, we are authorized, subject to certain specifications, to repurchase additional shares of our common stock up to $1.47 billion through December 2018. We intend to return approximately $1.00 billion to shareholders in fiscal year 2017 in the form of share repurchases and cash dividends.
21
The repurchases will be made from time to time in the open market, in privately negotiated transactions, or in structured share repurchase programs, and may be made in one or more larger repurchases, in compliance with Rule 10b-18 of the Securities Exchange Act of 1934, as amended, or the Exchange Act, subject to market conditions, applicable legal requirements, and other factors. The program does not obligate NVIDIA to acquire any particular amount of common stock and the program may be suspended at any time at our discretion. As part of our share repurchase program, we have entered into, and we may continue to enter into, structured share repurchase transactions with financial institutions. These agreements generally require that we make an up-front payment in exchange for the right to receive a fixed number of shares of our common stock upon execution of the agreement, and a potential incremental number of shares of our common stock, within a pre-determined range, at the end of the term of the agreement.
The following table presents details of our share repurchase transactions during the three fiscal months ended January 31, 2016 (in millions, except shares and per share amounts):
|
Period
|
Total Number of Shares Purchased
|
Average Price Paid per Share (1)
|
Total Number of Shares Purchased as Part of Publicly Announced Plans or Programs
|
Approximate Dollar Value of Shares that May Yet Be Purchased Under the Plans or Programs
|
||||||||
|
October 26, 2015 - November 22, 2015
|
3,047,106
|
$
|
44.30
|
|
3,047,106
|
$
|
1,465
|
|
||||
|
November 23, 2015 - December 27, 2015
|
—
|
$
|
—
|
|
—
|
$
|
1,465
|
|
||||
|
December 28, 2015 - January 31, 2016
|
1,205,682
|
$
|
—
|
|
1,205,682
|
$
|
1,465
|
|
||||
|
Total
|
4,252,788
|
$
|
31.74
|
|
4,252,788
|
|||||||
|
(1)
|
In November 2015, we entered into an accelerated share repurchase agreement, or ASR, with an investment bank, under which we made an upfront payment of $135 million to purchase shares of our common stock. We received an initial delivery of 3,047,106 shares in November 2015 at an average price per share of $44.30, which is based solely on the result of dividing the $135 million we had paid towards the ASR by such 3,047,106 shares. In January 2016, at the time of settlement of the ASR, we received an additional 1,205,682 shares without any further cash payment. The total number of shares repurchased under this ASR was 4,252,788 shares, and thus the average price we ultimately paid per share under the ASR was $31.74. Please refer to
Note 14
of the Notes to the Consolidated Financial Statements in Part IV, Item 15 of this Annual Report on Form 10-K for further discussion regarding the accelerated share repurchase program.
|
In addition to our share repurchase program, we withhold common stock shares associated with net share settlements to cover tax withholding obligations upon the vesting of awards of restricted stock units, or RSUs, and performance stock units that are based on our corporate financial performance targets, or PSUs, under our equity incentive program. During fiscal year 2016, we withheld approximately 3 million shares at a total cost of
$66 million
through net share settlements. Please refer to Note 2 of the Notes to the Consolidated Financial Statements in Part IV, Item 15 of this Annual Report on Form 10-K for further discussion regarding our equity incentive plans.
22
Stock Performance Graphs
The following graph compares the cumulative total shareholder return for our common stock, the S&P 500 Index and the S&P Semiconductors Index for the five years ended
January 31, 2016
. The graph assumes that $100 was invested on January 30, 2011 in our common stock and in each of the S&P 500 Index and the S&P Semiconductors Index. Total return assumes reinvestment of dividends in each of the indices indicated. Total return is based on historical results and is not intended to indicate future performance.
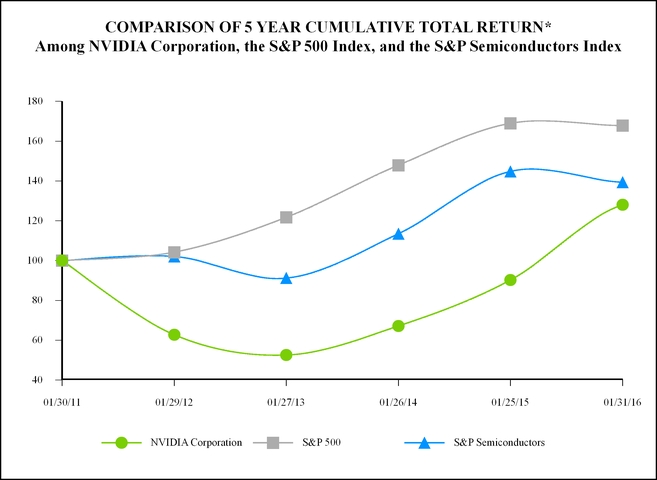
*$100 invested on 1/30/11 in stock and in indices, including reinvestment of dividends.
The S&P 500 index and S&P Semiconductor Select Industry index are proprietary to and are calculated, distributed and marketed by S&P Opco, LLC (a subsidiary of S&P Dow Jones Indices LLC), its affiliates and/or its licensors and has been licensed for use. S&P® and S&P 500®, among other famous marks, are registered trademarks of Standard & Poor’s Financial Services LLC, and Dow Jones® is a registered trademark of Dow Jones Trademark Holdings LLC. © 2016 S&P Dow Jones Indices LLC, its affiliates and/or its licensors. All rights reserved.
|
|
1/30/2011
|
1/29/2012
|
1/27/2013
|
1/26/2014
|
1/25/2015
|
1/31/2016
|
||||||||||||||||||
|
NVIDIA Corporation
|
$
|
100.00
|
|
$
|
62.75
|
|
$
|
52.55
|
|
$
|
67.11
|
|
$
|
90.21
|
|
$
|
127.99
|
|
||||||
|
S&P 500
|
$
|
100.00
|
|
$
|
104.22
|
|
$
|
121.71
|
|
$
|
147.89
|
|
$
|
168.93
|
|
$
|
167.81
|
|
||||||
|
S&P Semiconductors
|
$
|
100.00
|
|
$
|
102.04
|
|
$
|
91.20
|
|
$
|
113.44
|
|
$
|
144.77
|
|
$
|
139.35
|
|
||||||
23
The following graph compares the cumulative total shareholder return for our common stock, the S&P 500 Index and the S&P Semiconductors Index for the ten years ended
January 31, 2016
. The graph assumes that $100 was invested on January 29, 2006 in our common stock and in each of the S&P 500 Index and the S&P Semiconductors Index. Total return assumes reinvestment of dividends in each of the indices indicated. Total return is based on historical results and is not intended to indicate future performance.

*$100 invested on 1/29/06 in stock or in indices, including reinvestment of dividends.
The S&P 500 index and S&P Semiconductor Select Industry index are proprietary to and are calculated, distributed and marketed by S&P Opco, LLC (a subsidiary of S&P Dow Jones Indices LLC), its affiliates and/or its licensors and has been licensed for use. S&P® and S&P 500®, among other famous marks, are registered trademarks of Standard & Poor’s Financial Services LLC, and Dow Jones® is a registered trademark of Dow Jones Trademark Holdings LLC. © 2016 S&P Dow Jones Indices LLC, its affiliates and/or its licensors. All rights reserved.
|
|
1/29/2006
|
|
1/28/2007
|
|
1/27/2008
|
|
1/25/2009
|
|
1/31/2010
|
|
1/30/2011
|
|
1/29/2012
|
|
1/27/2013
|
|
1/26/2014
|
|
1/25/2015
|
|
1/31/2016
|
|
|||||||||||||||||||||
|
NVIDIA Corporation
|
$
|
100.00
|
|
$
|
136.09
|
|
$
|
161.84
|
|
$
|
50.01
|
|
$
|
99.83
|
|
$
|
154.12
|
|
$
|
96.71
|
|
$
|
80.98
|
|
$
|
103.43
|
|
$
|
139.04
|
|
$
|
197.25
|
|
||||||||||
|
S&P 500
|
$
|
100.00
|
|
$
|
114.51
|
|
$
|
111.87
|
|
$
|
68.65
|
|
$
|
91.41
|
|
$
|
111.68
|
|
$
|
116.39
|
|
$
|
135.92
|
|
$
|
165.17
|
|
$
|
188.66
|
|
$
|
187.41
|
|
||||||||||
|
S&P Semiconductors
|
$
|
100.00
|
|
$
|
93.20
|
|
$
|
87.12
|
|
$
|
48.31
|
|
$
|
72.37
|
|
$
|
92.93
|
|
$
|
94.82
|
|
$
|
84.75
|
|
$
|
105.42
|
|
$
|
134.53
|
|
$
|
129.50
|
|
||||||||||
24
The following selected financial data should be read in conjunction with our financial statements and the notes thereto, and with Item 7, “Management’s Discussion and Analysis of Financial Condition and Results of Operations.” The Consolidated Statements of Operations data for the fiscal years ended
January 31, 2016
,
January 25, 2015
and
January 26, 2014
and the Consolidated Balance Sheets data as of
January 31, 2016
and
January 25, 2015
have been derived from and should be read in conjunction with our audited consolidated financial statements and the notes thereto included in Part IV, Item 15 in this Annual Report on Form 10-K. We operate on a 52- or a 53-week year, ending on the last Sunday in January. Fiscal year 2016 was a 53-week year, and fiscal years 2015 and 2014 were 52-week years.
|
|
Year Ended
|
||||||||||||||||||
|
January 31,
2016 (A)
|
January 25,
2015
|
January 26,
2014
|
January 27,
2013
|
January 29,
2012
|
|||||||||||||||
|
|
(In millions, except per share data)
|
||||||||||||||||||
|
Consolidated Statement of Operations Data:
|
|
|
|
|
|
||||||||||||||
|
Revenue
|
$
|
5,010
|
|
$
|
4,682
|
|
$
|
4,130
|
|
$
|
4,280
|
|
$
|
3,998
|
|
||||
|
Income from operations
|
$
|
747
|
|
$
|
759
|
|
$
|
496
|
|
$
|
648
|
|
$
|
648
|
|
||||
|
Net income
|
$
|
614
|
|
$
|
631
|
|
$
|
440
|
|
$
|
563
|
|
$
|
581
|
|
||||
|
Net income per share:
|
|||||||||||||||||||
|
Basic
|
$
|
1.13
|
|
$
|
1.14
|
|
$
|
0.75
|
|
$
|
0.91
|
|
$
|
0.96
|
|
||||
|
Diluted
|
$
|
1.08
|
|
$
|
1.12
|
|
$
|
0.74
|
|
$
|
0.90
|
|
$
|
0.94
|
|
||||
|
Weighted average shares used in per share computation:
|
|||||||||||||||||||
|
Basic
|
543
|
|
552
|
|
588
|
|
619
|
|
604
|
|
|||||||||
|
Diluted
|
569
|
|
563
|
|
595
|
|
625
|
|
616
|
|
|||||||||
|
Year Ended
|
|||||||||||||||||||
|
January 31,
2016 (B, C)
|
January 25,
2015 (B)
|
January 26,
2014 (B,C)
|
January 27,
2013 (B)
|
January 29,
2012 (D)
|
|||||||||||||||
|
(In millions, except per share data)
|
|||||||||||||||||||
|
Consolidated Balance Sheet Data:
|
|
|
|
|
|
||||||||||||||
|
Cash, cash equivalents and marketable securities
|
$
|
5,037
|
|
$
|
4,623
|
|
$
|
4,672
|
|
$
|
3,728
|
|
$
|
3,130
|
|
||||
|
Total assets
|
$
|
7,370
|
|
$
|
7,201
|
|
$
|
7,251
|
|
$
|
6,412
|
|
$
|
5,553
|
|
||||
|
Convertible short-term debt
|
$
|
1,413
|
|
$
|
—
|
|
$
|
—
|
|
$
|
—
|
|
$
|
—
|
|
||||
|
Convertible long-term debt
|
$
|
—
|
|
$
|
1,384
|
|
$
|
1,356
|
|
$
|
—
|
|
$
|
—
|
|
||||
|
Capital lease obligations, less current portion
|
$
|
10
|
|
$
|
14
|
|
$
|
18
|
|
$
|
19
|
|
$
|
21
|
|
||||
|
Convertible debt conversion obligation
|
$
|
87
|
|
$
|
—
|
|
$
|
—
|
|
$
|
—
|
|
$
|
—
|
|
||||
|
Total shareholders’ equity
|
$
|
4,469
|
|
$
|
4,418
|
|
$
|
4,456
|
|
$
|
4,828
|
|
$
|
4,146
|
|
||||
|
Cash dividends declared and paid per common share
|
$
|
0.3950
|
|
$
|
0.3400
|
|
$
|
0.3100
|
|
$
|
0.0750
|
|
$
|
—
|
|
||||
|
(A)
|
In May 2015, we announced our intention to wind down or sell our Icera modem operations. We were unable to identify a viable buyer with genuine interest and, as a result, we began the wind-down of Icera modem operations in the second quarter of fiscal year 2016. Our income from operations for fiscal year 2016 included $131 million of restructuring and other charges, and our net income for fiscal year 2016 included $86 million of restructuring and other charges, net of tax.
|
|
(B)
|
On November 8, 2012, we initiated a quarterly dividend payment of $0.075 per share, or $0.30 per share on an annual basis. On November 7, 2013, we increased the quarterly cash dividend to $0.085 per share, or $0.34 per share on an annual basis. On May 7, 2015, we increased the quarterly cash dividend to $0.0975 per share, or $0.39 per share on an annual basis. On November 5, 2015, we increased the quarterly cash dividend to $0.115 per share, or $0.46 per share on an annual basis.
|
25
|
(C)
|
On December 2, 2013, we issued
1.00%
Convertible Senior Notes due 2018 in the aggregate principal amount of
$1.50 billion
. As of January 31, 2016, the Notes became convertible at the holders’ option beginning February 1, 2016 and ending May 1, 2016. As such, $1.41 billion of the carrying value of the Notes was reclassified from long-term debt to short-term debt and $87 million was reclassified from shareholders’ equity to convertible debt conversion obligation in our Consolidated Balance Sheet as of January 31, 2016.
|
|
(D)
|
On June 10, 2011, we completed the acquisition of Icera, Inc. for total cash consideration of $352 million, and recorded goodwill of $271 million. On May 5, 2015, we announced our intent to wind down our Icera modem operations. Please refer to Note 17 of the Notes to the Consolidated Financial Statements in Part IV, Item 15 of this Annual Report on Form 10-K for further discussion.
|
The following discussion and analysis of our financial condition and results of operations should be read in conjunction with “Item 1A. Risk Factors”, “Item 6. Selected Financial Data”, our Consolidated Financial Statements and related Notes thereto, as well as other cautionary statements and risks described elsewhere in this Annual Report on Form 10-K, before deciding to purchase, hold or sell shares of our common stock.
Overview
Our Company and Our Businesses
NVIDIA is the world leader in visual computing. NVIDIA has transformed into a specialized platform company that targets four large markets - Gaming, Professional Visualization, Datacenter and Automotive - where visual computing is essential and valued.
Our two reportable segments - GPU and Tegra Processor - are based on a single underlying graphics architecture. From our proprietary processors, we have created platforms that address the four large markets where our visual computing expertise is critically important. We are focused on delivering value through PC, mobile and cloud architectures. Our vertical integration enables us to bring together hardware, system software, programmable algorithms, systems and services to create unique value for the markets we serve.
Our GPU product brands are aimed at specialized markets including GeForce for gamers; Quadro for designers; Tesla for researchers and analysts focused on artificial intelligence, deep learning and big-data; and GRID for cloud-based visual computing users. We also integrate our GPUs into powerful mobile system-on-a-chip (SOC) processors, which drive supercomputing capabilities for tablets and online gaming and entertainment devices, as well as autonomous robots, drones and cars. Our Tegra brand integrates an entire computer onto a single chip, incorporating GPUs and multi-core CPUs with audio, video and input/output capabilities.
Headquartered in Santa Clara, California, NVIDIA was incorporated in California in April 1993 and reincorporated in Delaware in April 1998.
26
Recent Developments, Future Objectives and Challenges
Fiscal Year 2016 Summary
|
|
Year Ended
|
||||||||
|
|
January 31,
2016 |
January 25,
2015
|
Change
|
||||||
|
(In millions, except per share data)
|
|||||||||
|
Revenue
|
$
|
5,010
|
|
$
|
4,682
|
|
up 7%
|
||
|
Gross margin
|
56.1
|
%
|
55.5
|
%
|
up 60 bps
|
||||
|
Operating expenses
|
$
|
2,064
|
|
$
|
1,840
|
|
up 12%
|
||
|
Income from operations
|
$
|
747
|
|
$
|
759
|
|
down 2%
|
||
|
Net income
|
$
|
614
|
|
$
|
631
|
|
down 3%
|
||
|
Net income per diluted share
|
$
|
1.08
|
|
$
|
1.12
|
|
down 4%
|
||
Revenue grew 7% in fiscal year 2016 to a record $5.01 billion. GPU revenue was $4.19 billion, up 9% from the previous year, reflecting growth in GeForce GPUs for gaming and Tesla products for datacenter. Tegra Processor revenue was $559 million, down 3% from the previous year, reflecting a decline in Tegra products for OEMs, partially offset by an increase in Tegra products for automotive and development services. License revenue from our patent license agreement with Intel remained flat at $264 million for fiscal year 2016.
Gross margin for fiscal year 2016 was a record 56.1%, up 60 basis points from the previous year, led by the strength in GPU business revenue partially offset by lower Tegra Processor business gross margins.
Operating expenses for fiscal year 2016 were $2.06 billion, up from $1.84 billion in the previous year. Income from operations for fiscal year 2016 was $747 million, down from $759 million in the previous year. However, these amounts for fiscal year 2016 included $131 million in restructuring and other charges for the wind-down of our Icera modem operations and $70 million in legal fees associated with our litigation against Samsung and Qualcomm.
Net income for fiscal year 2016 was $614 million and net income per diluted share was $1.08, down from $631 million and $1.12, respectively, in the previous year. These decreases were driven by our legal fees and our restructuring and other charges, partially offset by revenue and gross margin growth.
We returned $800 million to shareholders in fiscal year 2016 through share repurchases and quarterly cash dividends, and we intend to return approximately $1.00 billion to shareholders in fiscal year 2017.
Cash, cash equivalents and marketable securities were $5.04 billion as of January 31, 2016, up from $4.62 billion as of January 25, 2015, and cash flow from operating activities was $1.18 billion for fiscal year 2016, up from $906 million in the previous year.
27
GPU Business
During fiscal year 2016, we released many new products, including the GeForce GTX TITAN X, GeForce GTX 980 Ti, GeForce GTX 980 for notebook, and the GeForce GTX 950. These GPUs deliver better performance and power efficiency than their predecessors and helped double the number of users of our GeForce Experience PC gaming platform from a year earlier. Additionally, we released NVIDIA GameWorks VR, a software development kit that creates more immersive gameplay on virtual reality-ready desktops and notebooks and enables professional designers to bring virtual reality to applications. We also announced the GeForce GTX VR Ready program to help users discover systems that will provide optimized virtual reality experiences.
We introduced the Quadro M6000, a powerful professional GPU, and the Quadro Visual Computing Appliance, which contains eight M6000 GPUs. We also rolled out NVIDIA Iray plugins for Autodesk Maya and Autodesk 3ds Max, which enable users to create designs incorporating real-world lights and materials faster and easier than before, and enabled professional designers to bring virtual reality to applications, with the launch of NVIDIA DesignWorks VR.
We announced our next-generation Pascal GPU architecture. This architecture is expected to accelerate deep learning applications faster than our current-generation Maxwell processors. In addition, we unveiled our next generation virtualized graphics platform - NVIDIA GRID 2.0, which delivers graphics-intensive applications to connected devices. We also shipped cuDNN 3.0, which improves performance of deep learning training on GPUs.
Further, we announced that the Swiss Federal Office of Meteorology and Climatology was the first major national weather service to use a GPU-accelerated supercomputer to improve daily forecasts. We introduced an end-to-end hyperscale datacenter deep learning platform - consisting of two accelerators, the NVIDIA Tesla M40 and NVIDIA Tesla M4 - that lets web-services companies accelerate deep learning workloads. In addition, we announced that leading web-services companies were increasingly adopting our accelerated service platform to power the machine learning and high performance computing applications.
Tegra Processor Business
For the automotive market, we are partnering with several companies to use our NVIDIA DRIVE PX platform - a car computer that utilizes deep learning to enable self-driving capabilities - in their autonomous driving efforts. We launched NVIDIA DRIVE™ PX 2, a powerful engine for in-vehicle artificial intelligence and announced that Volvo will use DRIVE PX 2 in their autonomous-car pilot program next year. We were featured in new production vehicles and concept cars with NVIDIA-powered digital cockpits, including Mercedes-Benz, Audi, Porsche, Bentley and Honda, at the International Auto Show in Frankfurt, Germany, and also furthered our relationship with Tesla Motors, which introduced the Model X equipped with an NVIDIA-powered infotainment system and digital instrument cluster.
During fiscal year 2016, we launched the NVIDIA SHIELD Android TV device and GeForce NOW, which allows players to stream video games from the cloud to their SHIELD devices.
28
Critical Accounting Policies and Estimates
Management’s discussion and analysis of financial condition and results of operations are based upon our consolidated financial statements, which have been prepared in accordance with accounting principles generally accepted in the United States, or U.S. GAAP. The preparation of these financial statements requires us to make estimates and judgments that affect the reported amounts of assets, liabilities, revenue, cost of revenue, expenses and related disclosure of contingencies. On an on-going basis, we evaluate our estimates, including those related to revenue recognition, inventories, income taxes, goodwill, cash equivalents and marketable securities, stock-based compensation, and litigation, investigation and settlement costs and other contingencies. We base our estimates on historical experience and on various other assumptions that are believed to be reasonable under the circumstances, the results of which form the basis for making judgments about the carrying values of assets and liabilities.
We believe the following critical accounting policies affect our significant judgments and estimates used in the preparation of our consolidated financial statements. Our management has discussed the development and selection of these critical accounting policies and estimates with the Audit Committee of our Board of Directors. The Audit Committee has reviewed our disclosures relating to our critical accounting policies and estimates in this Annual Report on Form 10-K.
Revenue Recognition
Product Revenue
We recognize revenue from product sales when persuasive evidence of an arrangement exists, the product has been delivered, the price is fixed or determinable and collection of the related receivable is reasonably assured.
For sales to certain distributors with rights of return for which the level of returns cannot be reasonably estimated, our policy is to defer recognition of revenue and related cost of revenue until the distributors resell the product and, in some cases, when customer return rights lapse.
Our customer programs primarily involve rebates, which are designed to serve as sales incentives to resellers of our products in various target markets. We account for rebates as a reduction of revenue and accrue for 100% of the potential rebates and do not apply a breakage factor. While we have a long history of rebate arrangements with OEMs, we believe we are unable to apply our historical experience to reliably estimate the amount of rebates that will eventually be claimed by individual OEMs. In such cases, the OEMs may not be our direct customers and therefore the quantity and mix of demand they place on their CEMs/ODMs may shift as we introduce new generations and iterations of products and as we experience changes in new competitor offerings. In addition, we typically find that approximately 95% of the rebates we accrue each year are eventually claimed, which is substantially close to 100%, and that this percentage varies by program and by customer. We recognize a liability for these rebates at the later of the date at which we record the related revenue or the date at which we offer the rebate. Rebates typically expire six months from the date of the original sale, unless we reasonably believe that the customer intends to claim the rebate. Unclaimed rebates are reversed to revenue, the amount of which typically represents less than 0.5% of total revenue.
Our customer programs also include marketing development funds, or MDFs. MDFs represent monies paid to retailers, system builders, OEMs, distributors, add-in card partners and other channel partners that are earmarked for market segment development and expansion and typically are designed to support our partners’ activities while also promoting NVIDIA products. Depending on market conditions, we may take actions to increase amounts offered under customer programs, possibly resulting in an incremental reduction of revenue at the time such programs are offered. We account for MDFs as a reduction of revenue and apply a breakage factor to certain types of MDF program accruals for which we believe we can make a reasonable and reliable estimate of the amount that will ultimately be unclaimed.
We also record a reduction to revenue by establishing a sales return allowance for estimated product returns at the time revenue is recognized, based primarily on historical return rates. However, if product returns for a particular fiscal period exceed historical return rates we may determine that additional sales return allowances are required to properly reflect our estimated exposure for product returns.
29
License and Development Revenue
For license arrangements that require significant customization of our intellectual property components, we generally recognize the related revenue over the period that services are performed. For most license and service arrangements, we determine progress to completion based on actual cost incurred to date as a percentage of the estimated total cost required to complete the project. We periodically evaluate the actual status of each project to ensure that the estimates to complete each contract remain accurate. Revenue recognized in any period is dependent on our progress toward completion of projects in progress. Significant management judgment and discretion are used to estimate total cost. Any changes in or deviations from these estimates could have a material effect on the amount of revenue we recognize in any period.
For license arrangements that do not require significant customization but where we are obligated to provide further deliverables over the term of the license agreement, we record revenue over the life of the license term, with consideration received in advance of the performance period classified as deferred revenue.
Please refer to Note 1 of the Notes to the Consolidated Financial Statements in Part IV, Item 15 of this Annual Report on Form 10-K for additional information.
Inventories
Inventory cost is computed on an adjusted standard basis, which approximates actual cost on an average or first-in, first-out basis. We charge cost of sales for inventory provisions to write down our inventory to the lower of cost or estimated market value or to completely write off obsolete or excess inventory. Most of our inventory provisions relate to the write-off of excess quantities of products, based on our inventory levels and future product purchase commitments compared to assumptions about future demand and market conditions.
Situations that may result in excess or obsolete inventory include changes in business and economic conditions, changes in consumer confidence caused by changes in market conditions, sudden and significant decreases in demand for our products, inventory obsolescence because of rapidly changing technology and customer requirements, failure to estimate customer demand properly for older products as newer products are introduced, or unexpected competitive pricing actions by our competition. In addition, cancellation or deferral of customer purchase orders could result in our holding excess inventory. Also, because we often sell a substantial portion of our products in the last month of each quarter, we may not be able to reduce our inventory purchase commitments in a timely manner in response to customer cancellations or deferrals.
The overall net effect on our gross margin from inventory provisions and sales of items previously written down was an unfavorable impact of 1.6%, 0.6% and 0.1% in fiscal years 2016, 2015 and 2014, respectively. The charges we took to cost of sales for inventory provisions during these fiscal years were primarily related to the write-off of excess quantities of products whose inventory levels were higher than our updated forecasts of future demand for those products. As a fabless semiconductor company, we must make commitments to purchase inventory based on forecasts of future customer demand. In doing so, we must account for our third-party manufacturers' lead times and constraints. We also adjust to other market factors, such as product offerings and pricing actions by our competitors, new product transitions, and macroeconomic conditions - all of which may impact demand for our products.
Please refer to the Gross Profit and Gross Margin discussion below in this Management's Discussion and Analysis for further discussion.
30
Income Taxes
We recognize federal, state and foreign current tax liabilities or assets based on our estimate of taxes payable or refundable in the current fiscal year by tax jurisdiction. We recognize federal, state and foreign deferred tax assets or liabilities, as appropriate, for our estimate of future tax effects attributable to temporary differences and carryforwards; and we record a valuation allowance to reduce any deferred tax assets by the amount of any tax benefits that, based on available evidence and judgment, are not expected to be realized.
United States income tax has not been provided on a portion of earnings of our non-U.S. subsidiaries to the extent that such earnings are considered to be indefinitely reinvested.
Our calculation of deferred tax assets and liabilities is based on certain estimates and judgments and involves dealing with uncertainties in the application of complex tax laws. Our estimates of deferred tax assets and liabilities may change based, in part, on added certainty or finality to an anticipated outcome, changes in accounting standards or tax laws in the United States, or foreign jurisdictions where we operate, or changes in other facts or circumstances. In addition, we recognize liabilities for potential United States and foreign income tax contingencies based on our estimate of whether, and the extent to which, additional taxes may be due. If we determine that payment of these amounts is unnecessary or if the recorded tax liability is less than our current assessment, we may be required to recognize an income tax benefit or additional income tax expense in our financial statements accordingly.
As of January 31, 2016, we had a valuation allowance of $272 million related to state and certain foreign deferred tax assets that management determined are not likely to be realized due, in part, to projections of future taxable income and potential utilization limitations of tax attributes acquired as a result of stock ownership changes. To the extent realization of the deferred tax assets becomes more-likely-than-not, we would recognize such deferred tax asset as an income tax benefit during the period.
Goodwill
Goodwill is subject to our annual impairment test during the fourth quarter of our fiscal year, or earlier if indicators of potential impairment exist, using either a qualitative or a quantitative assessment. Our impairment review process compares the fair value of the reporting unit in which the goodwill resides to its carrying value. We have identified two reporting units, GPU and Tegra Processor, for the purposes of completing our goodwill analysis. Goodwill assigned to these reporting units as of January 31, 2016 was
$210 million
and
$408 million
, respectively. Determining the number of reporting units and the fair value of a reporting unit requires us to make judgments and involves the use of significant estimates and assumptions. We also make judgments and assumptions in allocating assets and liabilities to each of our reporting units. We base our fair value estimates on assumptions we believe to be reasonable but that are unpredictable and inherently uncertain.
During the fourth quarter of fiscal year 2016, we elected to use the quantitative assessment to test goodwill for impairment for each reporting unit. In applying the fair value based test of each reporting unit, the results from the income approach and the market approach were equally weighted. These valuation approaches consider a number of factors that include, but are not limited to, prospective financial information, growth rates, terminal or residual values, discount rates and comparable multiples from publicly traded companies in our industry and require us to make certain assumptions and estimates regarding industry economic factors and the future profitability of our business.
When performing an income approach valuation, we incorporate the use of projected financial information and a discount rate that are developed using market participant based assumptions to our discounted cash flow model. Our estimates of discounted cash flow were based upon, among other things, certain assumptions about our expected future operating performance, such as revenue growth rates, operating margins, risk-adjusted discount rates, and future economic and market conditions. Our estimates may differ from actual cash flow due to, among other things, economic conditions, changes to our business model or changes in operating performance. Additionally, certain estimates of discounted cash flow involve businesses with limited financial history and developing revenue models, which increases the risk of differences between the projected and actual performance. The long-term financial forecasts that we utilize represent the best estimate that we have at this time and we believe that its underlying assumptions are reasonable. Significant differences between our estimates and actual cash flow could materially affect our future financial results, which could impact our future estimates of the fair value of our reporting units.
31
During the fourth quarter of fiscal year 2016, we concluded that there was no impairment of our goodwill. The fair values of our GPU and Tegra Processor reporting units significantly exceeded their respective carrying values. As such, even the application of a hypothetical 10% decrease to the fair value of each reporting unit would not have resulted in the fair value of either reporting unit being less than its carrying value. As an overall test of the reasonableness of estimated fair values of our reporting units, we reconciled the combined fair value estimates of our reporting units to our market capitalization as of the valuation date. The reconciliation confirmed that the fair values were relatively representative of the market views when applying a reasonable control premium to the market capitalization. However, any significant reductions in the actual amount of future cash flows realized by our reporting units, reductions in the value of market comparables, or reductions in our market capitalization could impact future estimates of the fair values of our reporting units. Such events could ultimately result in a charge to our earnings in future periods due to the potential for a write-down of the goodwill associated with our reporting units.
Our next annual evaluation of the goodwill by reporting unit will be performed during the fourth quarter of fiscal year 2017, or earlier if indicators of potential impairment exist. Such indicators include, but are not limited to, challenging economic conditions, such as a decline in our operating results, an unfavorable industry or macroeconomic environment, a substantial decline in our stock price, or any other adverse change in market conditions. Such conditions could have the effect of changing one of the critical assumptions or estimates we use to calculate the fair value of our reporting units, which could result in a decrease in fair value and require us to record goodwill impairment charges.
Cash Equivalents and Marketable Securities
Cash equivalents consist of financial instruments which are readily convertible into cash and have original maturities of three months or less at the time of acquisition. Marketable securities consist primarily of highly liquid investments with maturities of greater than three months when purchased.
We measure our cash equivalents and marketable securities at fair value. The fair values of our financial assets and liabilities are determined using quoted market prices of identical assets or quoted market prices of similar assets from active markets. Our Level 1 assets consist of our money market funds. We classify securities within Level 1 assets when the fair value is obtained from real time quotes for transactions in active exchange markets involving identical assets. Our available-for-sale securities are classified as having Level 2 inputs. Our Level 2 assets are valued utilizing a market approach where the market prices of similar assets are provided by a variety of independent industry standard data providers to our investment custodian. Most of our cash equivalents and marketable securities are valued based on Level 2 inputs. We did not have any investments classified as Level 3 as of
January 31, 2016
.
All of our available-for-sale investments are subject to a periodic impairment review. We record a charge to earnings when a decline in fair value is significantly below cost basis and judged to be other-than-temporary, or have other indicators of impairments.
If the fair value of an available-for-sale debt instrument is less than its amortized cost basis, an other-than-temporary impairment is triggered in circumstances where (1) we intend to sell the instrument, (2) it is more likely than not that we will be required to sell the instrument before recovery of its amortized cost basis, or (3) a credit loss exists where we do not expect to recover the entire amortized cost basis of the instrument. In these situations, we recognize an other-than-temporary impairment in earnings equal to the entire difference between the debt instruments’ amortized cost basis and its fair value. For available-for-sale debt instruments that are considered other-than-temporarily impaired due to the existence of a credit loss, if we do not intend to sell and it is more likely than not that we will not be required to sell the instrument before recovery of its remaining amortized cost basis (amortized cost basis less any current-period credit loss), we separate the amount of the impairment into the amount that is credit related and the amount due to all other factors. The credit loss component is recognized in earnings.
We performed an impairment review of our investment portfolio as of January 31, 2016. We concluded that our investments were appropriately valued and that no other than temporary impairment charges were necessary on our portfolio of available-for-sale investments as of January 31, 2016.
32
Stock-based Compensation
Our stock-based compensation expense is associated with stock options, restricted stock units, or RSUs, performance stock units that are based on our corporate financial performance targets, or PSUs, performance stock units that are based on market conditions, or market-based PSUs, and our employee stock purchase plan, or ESPP.
Beginning in fiscal year 2015, we shifted away from granting stock options and toward granting RSUs, PSUs and market-based PSUs to reflect changing market trends for equity incentives at our peer companies. The number of PSUs that will ultimately vest is contingent on the Company’s level of achievement compared with the corporate financial performance target established by our Compensation Committee in the beginning of each fiscal year. The number of shares of our stock to be received at vesting ranges from 0% to 200% of the target amount.
We use the closing trading price of our common stock on the date of grant, minus a dividend yield discount, as the fair value of awards of RSUs and PSUs, and we use a Monte Carlo simulation on the date of grant to estimate the fair value of market-based PSUs. We use a Black-Scholes valuation at the commencement of an offering period in March and September of each year to estimate the fair value of the shares to be issued under our ESPP.
Stock-based compensation expense for RSUs and market-based PSUs is recognized using a straight-line attribution method over the requisite employee service period, while compensation expense for PSUs and ESPP is recognized using an accelerated amortization model.
Our RSU, PSU and market-based PSU awards are not eligible for cash dividends prior to vesting; therefore, the fair value of RSUs, PSUs and market-based PSUs is discounted by the dividend yield. Additionally, we estimate forfeitures annually based on historical experience and revise the estimates of forfeiture in subsequent periods if actual forfeitures differ from those estimates. If factors change, the compensation expense that we record under these accounting standards may differ significantly from what we have recorded in the current period.
Litigation, Investigation and Settlement Costs
From time to time, we are involved in legal actions and/or investigations by regulatory bodies. We are aggressively defending our current litigation matters. However, there are many uncertainties associated with any litigation or investigations, and we cannot be certain that these actions or other third-party claims against us will be resolved without costly litigation, fines and/or substantial settlement payments. If that occurs, our business, financial condition and results of operations could be materially and adversely affected. If information becomes available that causes us to determine that a loss in any of our pending litigation, investigations or settlements is probable, and we can reasonably estimate the loss associated with such events, we will record the loss in accordance with U.S. GAAP. However, the actual liability in any such litigation or investigation may be materially different from our estimates, which could require us to record additional costs.
33
Results of Operations
The following table sets forth, for the periods indicated, certain items in our Consolidated Statements of Operations expressed as a percentage of revenue.
|
|
Year Ended
|
|||||||
|
|
January 31, 2016
|
January 25, 2015
|
January 26, 2014
|
|||||
|
Revenue
|
100.0
|
%
|
100.0
|
%
|
100.0
|
%
|
||
|
Cost of revenue
|
43.9
|
|
44.5
|
|
45.1
|
|
||
|
Gross profit
|
56.1
|
|
55.5
|
|
54.9
|
|
||
|
Operating expenses:
|
|
|
|
|||||
|
Research and development
|
26.6
|
|
29.0
|
|
32.3
|
|
||
|
Sales, general and administrative
|
12.0
|
|
10.3
|
|
10.5
|
|
||
|
Restructuring and other charges
|
2.6
|
|
—
|
|
—
|
|
||
|
Total operating expenses
|
41.2
|
|
39.3
|
|
42.8
|
|
||
|
Income from operations
|
14.9
|
|
16.2
|
|
12.1
|
|
||
|
Interest income
|
0.8
|
|
0.6
|
|
0.4
|
|
||
|
Interest expense
|
(0.9
|
)
|
(1.0
|
)
|
(0.3
|
)
|
||
|
Other income, net
|
0.1
|
|
0.3
|
|
0.2
|
|
||
|
Income before income taxes
|
14.9
|
|
16.1
|
|
12.4
|
|
||
|
Income tax expense
|
2.6
|
|
2.6
|
|
1.7
|
|
||
|
Net income
|
12.3
|
%
|
13.5
|
%
|
10.7
|
%
|
||
Revenue
NVIDIA’s products and services are built for three computing platforms - PC, Datacenter/Cloud, and Mobile. For each of fiscal year 2016, 2015 and 2014, approximately 75% of our revenue stemmed from products and services associated with the PC computing platform, of which GPUs for the gaming and professional visualization markets comprised approximately 85%, 80% and 70%, respectively, while PC OEM represented approximately 15%, 20% and 30%, respectively.
Revenue by Reportable Segments
|
Year Ended
|
Year Ended
|
||||||||||||||||||||||||||||
|
January 31,
2016 |
|
January 25,
2015 |
$
Change
|
%
Change
|
January 25,
2015 |
January 26,
2014 |
$
Change
|
%
Change
|
|||||||||||||||||||||
|
(In millions)
|
(In millions)
|
||||||||||||||||||||||||||||
|
GPU
|
$
|
4,187
|
|
$
|
3,839
|
|
$
|
348
|
|
9
|
%
|
$
|
3,839
|
|
$
|
3,468
|
|
$
|
371
|
|
11
|
%
|
|||||||
|
Tegra Processor
|
559
|
|
579
|
|
(20
|
)
|
(3
|
)%
|
579
|
|
398
|
|
181
|
|
45
|
%
|
|||||||||||||
|
All Other
|
264
|
|
264
|
|
—
|
|
—
|
%
|
264
|
|
264
|
|
—
|
|
—
|
%
|
|||||||||||||
|
Total
|
$
|
5,010
|
|
$
|
4,682
|
|
$
|
328
|
|
7
|
%
|
$
|
4,682
|
|
$
|
4,130
|
|
$
|
552
|
|
13
|
%
|
|||||||
GPU Business.
GPU business revenue increased by
9%
in fiscal year 2016 compared to fiscal year 2015. This increase was due primarily to increased revenue from sales of high-end GeForce GPU products for gaming, which increased over 30% reflecting a combination of continued strength in PC gaming and increased sales of our Maxwell-based GPU products. Revenue from Tesla GPUs for Datacenter increased, driven by strong demand from cloud service providers. Revenue from Quadro GPUs for professional visualization declined due to weakness in the overall workstation market. Revenue from GeForce GPU products for mainstream PC OEMs declined compared to last year.
34
GPU business revenue increased by
11%
in fiscal year 2015 compared to fiscal year 2014. This increase was due primarily to higher revenue from GeForce GPU products and associated memory for gaming, which increased over 30% reflecting a combination of continued strength in PC gaming and increased sales of our Maxwell-based GPU products. Revenue from Tesla for Datacenter computing increased due to large project wins with cloud service providers and revenue from our NVIDIA GRID virtualization products also increased as this platform gained momentum. Revenue from GeForce GPU products for mainstream PC OEMs declined compared to fiscal year 2014.
Tegra Processor Business.
Tegra Processor business revenue decreased by
3%
in
fiscal year 2016
compared to
fiscal year 2015
. This decrease was driven by a decline in sales of Tegra products for OEM smartphones and tablets of almost 90%, partially offset by an increase in sales of Tegra products serving automotive systems of almost 75%. Revenue also grew from development services and sales of SHIELD devices.
Tegra Processor business revenue increased by 45% in fiscal year 2015 compared to fiscal year 2014. This increase was driven by higher sales of Tegra products serving automotive infotainment systems, OEM smartphones and tablet devices, and the onset of SHIELD tablet sales in fiscal year 2015.
All Other.
License revenue from the patent cross licensing arrangement we entered into with Intel in January 2011 was flat at
$264 million
for fiscal years 2016, 2015, and 2014. The final payment under this arrangement was received in January 2016, and will be recognized as revenue into the first quarter of fiscal year 2018.
Concentration of Revenue
Revenue from sales to customers outside of the United States and Other Americas accounted for
79%
of total revenue for fiscal year 2016, and
75%
of total revenue for both fiscal year 2015 and 2014. Revenue by geographic region is allocated to individual countries based on the location to which the products are initially billed even if the revenue is attributable to end customers in a different location.
Revenue from significant customers, those representing 10% or more of total revenue for the respective dates, is summarized as follows:
|
|
Year Ended
|
|||||||
|
|
January 31,
2016 |
January 25,
2015
|
January 26,
2014
|
|||||
|
Revenue:
|
|
|
|
|||||
|
Customer A
|
11
|
%
|
11
|
%
|
11
|
%
|
||
|
Customer B
|
9
|
%
|
9
|
%
|
10
|
%
|
||
35
Gross Profit and Gross Margin
Gross profit consists of total revenue, net of allowances, less cost of revenue. Cost of revenue consists primarily of the cost of semiconductors purchased from subcontractors, including wafer fabrication, assembly, testing and packaging, board and device costs, manufacturing support costs, including labor and overhead associated with such purchases, final test yield fallout, inventory and warranty provisions and shipping costs. Cost of revenue also includes development costs for license and service arrangements and stock-based compensation related to personnel associated with manufacturing. Gross margin is the percentage of gross profit to revenue.
Our overall gross margin was
56.1%
,
55.5%
and
54.9%
for fiscal years
2016
,
2015
and
2014
, respectively. The increase over these fiscal years was driven primarily by a richer product mix in our GPU business, partially offset by lower Tegra business margins.
Charges to cost of sales for inventory provisions totaled $112 million, $59 million and $50 million for fiscal years 2016, 2015 and 2014, unfavorably impacting our gross margin by 2.2%, 1.3% and 1.2%, respectively. Sales of inventory that was previously written-off or written-down totaled $32 million for both fiscal year 2016 and 2015 and $43 million for fiscal year 2014, favorably impacting our gross margin by 0.6%, 0.7% and 1.1%, respectively. As a result, the overall net effect on our gross margin from inventory provisions and sales of items previously written down was an unfavorable impact of 1.6%, 0.6% and 0.1% in fiscal years 2016, 2015 and 2014, respectively.
A discussion of our gross margin results for each of our reportable segments is as follows:
GPU Business
. The gross margin of our GPU business increased during fiscal year 2016 when compared to fiscal year 2015 primarily due to a richer product mix resulting from stronger sales of our GeForce GPU products for gaming and lower sales of GeForce GPU products for mainstream PC OEMs. The gross margin of our GPU business increased during fiscal year 2015 when compared to fiscal year 2014 due to richer product mix resulting from strong sales of high-end GeForce GTX GPU products based on our Maxwell architecture and the volume increase in our Tesla accelerated computing products.
Tegra Processor Business.
The gross margin of our Tegra Processor business decreased during fiscal year 2016 when compared to fiscal year 2015 due to inventory provisions, the warranty charge associated with the SHIELD 8-inch tablet product recall, and a less rich product mix resulting from higher automotive and SHIELD product sales and lower sales of OEM smartphone and tablet products. The inventory provisions related primarily to older generation Tegra products, as well as inventory purchase commitments in excess of estimated demand and excess component inventories for SHIELD products. The gross margin of our Tegra Processor business decreased during fiscal year 2015 when compared to fiscal year 2014. These decreases were driven primarily by a combination of an overall decline in margins of our Tegra products and a less rich mix between tablet products, which have had higher gross margins, and smartphone and automotive module products, which have had comparably lower gross margins.
36
Operating Expenses
|
|
Year Ended
|
Year Ended
|
|||||||||||||||||||||||||||
|
|
January 31,
2016 |
|
January 25,
2015 |
$
Change
|
%
Change
|
January 25,
2015
|
January 26,
2014 |
$
Change
|
%
Change
|
||||||||||||||||||||
|
|
(In millions)
|
(In millions)
|
|||||||||||||||||||||||||||
|
Research and development expenses
|
$
|
1,331
|
|
$
|
1,360
|
|
$
|
(29
|
)
|
(2
|
)%
|
$
|
1,360
|
|
$
|
1,336
|
|
$
|
24
|
|
2
|
%
|
|||||||
|
Sales, general and administrative expenses
|
602
|
|
480
|
|
122
|
|
25
|
%
|
480
|
|
436
|
|
44
|
|
10
|
%
|
|||||||||||||
|
Restructuring and other charges
|
131
|
|
—
|
|
131
|
|
100
|
%
|
—
|
|
—
|
|
—
|
|
—
|
%
|
|||||||||||||
|
Total operating expenses
|
$
|
2,064
|
|
$
|
1,840
|
|
$
|
224
|
|
12
|
%
|
$
|
1,840
|
|
$
|
1,772
|
|
$
|
68
|
|
4
|
%
|
|||||||
|
Research and development as a percentage of net revenue
|
26.6
|
%
|
29.0
|
%
|
|
|
29.0
|
%
|
32.3
|
%
|
|
|
|||||||||||||||||
|
Sales, general and administrative as a percentage of net revenue
|
12.0
|
%
|
10.3
|
%
|
|
|
10.3
|
%
|
10.5
|
%
|
|
|
|||||||||||||||||
|
Restructuring and other charges as a percentage of net revenue
|
2.6
|
%
|
—
|
%
|
|
|
—
|
%
|
—
|
%
|
|
|
|||||||||||||||||
Research and Development
Research and development expenses decreased by 2% in fiscal year 2016 compared to fiscal year 2015. This decrease was primarily driven by the wind-down of Icera modem operations and other organization efficiencies, partially offset by increases in employee compensation and related costs, including stock-based compensation expense.
Research and development expenses remained relatively flat during fiscal year 2015 compared to fiscal year 2014. Compensation and benefits increased by $57 million resulting from employee additions, employee compensation increases and related costs, including stock-based compensation expense. Offsetting this increase was a $39 million decrease in engineering development expenses.
Sales, General and Administrative
Sales, general and administrative expenses increased by
25%
in fiscal year 2016 compared to fiscal year 2015. Outside professional fees increased, primarily due to $70 million of legal fees associated with our litigation against Samsung and Qualcomm. Compensation and benefits increased by $39 million resulting from employee additions, employee compensation increases and related costs, including stock-based compensation expense. Advertising and promotions increased by $9 million resulting from higher print and digital advertising.
Sales, general and administrative expenses increased by
10%
in fiscal year 2015 compared to fiscal year 2014. Compensation and benefits increased by $54 million resulting from employee additions, employee compensation increases and related costs, including stock-based compensation expense. Facilities costs increased by $10 million as we expanded our offices internationally and leased an office building within the boundaries of our main Santa Clara campus. Offsetting these increases were a decrease in outside professional fees of $9 million as well as more favorable international taxes and government subsidies.
37
Restructuring and Other Charges
In May 2015, we announced our intent to wind down our Icera modem operations and that we were open to a sale of the technology or operations. We pursued the sale of Icera’s technology and operations but were unable to identify a viable buyer with genuine interest. As a result, we began the wind-down of Icera modem operations in the second quarter of fiscal year 2016. The wind-down of Icera modem operations allows for continued investment in strategic growth areas, including our growth initiatives of deep learning, self-driving cars, and gaming.
Our operating expenses for fiscal year 2016 included
$131 million
of restructuring and other charges, as follows:
|
Year Ended
|
||||
|
January 31,
|
||||
|
2016
|
||||
|
(In millions)
|
||||
|
Employee severance and related costs
|
$
|
82
|
|
|
|
Tax subsidy impairment
|
17
|
|
||
|
Fixed assets impairment
|
18
|
|
||
|
Facilities and related costs
|
9
|
|
||
|
Other exit costs
|
5
|
|
||
|
Restructuring and other charges
|
$
|
131
|
|
|
We expect to incur additional restructuring charges to operating expense of approximately $1 million to $2 million per quarter for each of the first two quarters of fiscal year 2017, after which we expect the restructuring to be substantially complete. Please refer to Note 17 of the Notes to the Consolidated Financial Statements in Part IV, Item 15 of this Annual Report on Form 10-K for further discussion.
Interest Income and Interest Expense
Interest income consists of interest earned on cash, cash equivalents and marketable securities. Interest expense is primarily comprised of coupon interest and debt discount amortization related to the convertible notes issued in the fourth quarter of fiscal year 2014.
Interest income was
$39 million
,
$28 million
and
$17 million
in fiscal years
2016
,
2015
and
2014
, respectively. The increase in fiscal year 2016 compared to fiscal year 2015 was primarily due to higher average cash balances invested in interest bearing securities, as well as higher purchased yields. The increase in fiscal year 2015 compared to fiscal year 2014 was primarily due to higher average cash balances as we invested the proceeds from the convertible notes we issued in the fourth quarter of fiscal year 2014 in interest bearing securities.
Interest expense was
$47 million
,
$46 million
and
$10 million
in fiscal years
2016
,
2015
and
2014
, respectively. The increases in fiscal years 2016 and 2015 compared to fiscal years 2015 and 2014, respectively, were primarily due to coupon interest and debt discount amortization related to the convertible notes we issued in the fourth quarter of fiscal 2014.
Other Income and Expense
Other income and expense primarily consists of realized gains and losses from the sale of marketable securities, sales or impairments of investments in non-affiliated companies, and the impact of changes in foreign currency rates.
Net other income was $
4 million
, $
14 million
and $
7 million
in fiscal years
2016
,
2015
and
2014
, respectively. The decrease for fiscal year 2016 compared to fiscal year 2015 was primarily due to less gain recognized from sales of non-affiliated investments and more losses from foreign currency remeasurement. The increase for fiscal year 2015 compared to fiscal year 2014 was primarily due to a gain from the sale of a non-affiliated investment, partially offset by the recognition of an impairment loss of a non-affiliated investment and losses from foreign currency remeasurement.
38
Income Taxes
We recognized income tax expense of $129 million, $124 million and $70 million during fiscal years 2016, 2015 and 2014, respectively. Our annual effective tax rate, was 17.3%, 16.5%, and 13.8% in fiscal years 2016, 2015 and 2014, respectively. The difference in the effective tax rates amongst the three years was primarily due to an increase in the amount of earnings subject to United States tax in fiscal years 2016 and 2015, partially offset by a net income tax benefit related to the Icera modem restructuring in fiscal year 2016, and a higher percentage of research tax credit benefit in fiscal year 2014.
Our effective tax rate for each of the fiscal years was lower than the United States federal statutory rate of 35% primarily due to income earned in jurisdictions, including British Virgin Islands, Hong Kong, China, Taiwan and United Kingdom, where the tax rate is lower than the United States federal statutory tax rate of 35%, favorable recognition in these fiscal years of the U.S. federal research tax credit and favorable discrete events primarily attributable to the tax benefit recognized upon the expiration of the applicable statutes of limitations.
Please refer to
Note 13
of the Notes to the Consolidated Financial Statements in Part IV, Item 15 of this Annual Report on Form 10-K for additional information.
Liquidity and Capital Resources
|
|
January 31, 2016
|
January 25, 2015
|
|||||
|
|
(In millions)
|
||||||
|
Cash and cash equivalents
|
$
|
596
|
|
$
|
497
|
|
|
|
Marketable securities
|
4,441
|
|
4,126
|
|
|||
|
Cash, cash equivalents, and marketable securities
|
$
|
5,037
|
|
$
|
4,623
|
|
|
|
|
Year Ended
|
||||||||||
|
January 31,
2016 |
January 25,
2015 |
January 26,
2014 |
|||||||||
|
|
(In millions)
|
||||||||||
|
Net cash provided by operating activities
|
$
|
1,175
|
|
$
|
906
|
|
$
|
835
|
|
||
|
Net cash (used in) investing activities
|
$
|
(400
|
)
|
$
|
(727
|
)
|
$
|
(806
|
)
|
||
|
Net cash (used in) provided by financing activities
|
$
|
(676
|
)
|
$
|
(834
|
)
|
$
|
390
|
|
||
As of
January 31, 2016
, we had
$5.04 billion
in cash, cash equivalents and marketable securities, an increase of
$414 million
from the end of fiscal year
2015
. Our portfolio of cash equivalents and marketable securities is managed on our behalf by several financial institutions which are required to follow our investment policy, which requires the purchase of high grade investment securities, the diversification of asset types and includes certain limits on our portfolio duration.
Cash provided by operating activities increased in fiscal year 2016 compared to fiscal year 2015 primarily due to changes in working capital and higher non-cash expenses such as stock-based compensation and restructuring and other charges in fiscal 2016, partially offset by a decline in net income. Cash provided by operating activities increased in fiscal year 2015 compared to fiscal year 2014 primarily due to higher net income from revenue growth and contained operating expenses, partially offset by an increase in inventories resulting from the introduction of newly launched Maxwell-based GPUs and certain Tegra SOCs and SHIELD devices, and an increase in accounts receivable.
Cash used in investing activities decreased in fiscal year 2016 compared to fiscal year 2015 primarily due to higher proceeds from sales and maturities of marketable securities and lower purchases of property and equipment and intangible assets. Cash used in investing activities for fiscal year 2015 decreased from fiscal year 2014 primarily due to lower purchases of property and equipment and intangible assets.
Cash used in financing activities decreased in fiscal year 2016 compared to fiscal year 2015, primarily due to lower share repurchases, partially offset by higher dividends. Cash was provided by financing activities in fiscal year 2014, primarily due to net proceeds of $1.48 billion from the convertible note offering we completed, partially offset by net proceeds of $108 million from the related note hedge and warrant transactions.
39
Liquidity
Our primary source of liquidity is cash generated by our operations. Our investment portfolio consists principally of cash and cash equivalents, debt securities of corporations and United States government and its agencies, asset-backed securities, mortgage-backed securities issued by government-sponsored enterprises, money market funds and foreign government bonds. These investments are denominated in United States dollars. As of
January 31, 2016
, we did not have any investments in auction-rate preferred securities.
Please refer to Note 6 of the Notes to the Consolidated Financial Statements in Part IV, Item 15 of this Annual Report on Form 10-K for additional information.
As of
January 31, 2016
and
January 25, 2015
, we had $
5.04 billion
and $
4.62 billion
, respectively, in cash, cash equivalents and marketable securities. Our investment policy requires the purchase of high grade investment securities and the diversification of asset types and includes certain limits on our portfolio duration, as specified in our investment policy guidelines. These guidelines also limit the amount of credit exposure to any one issue, issuer or type of instrument. As of
January 31, 2016
, we were in compliance with our investment policy. As of
January 31, 2016
, our investments in U.S. government agencies and U.S. government sponsored enterprises represented
47%
of our total investment portfolio, while the financial sector accounted for
23%
of our total investment portfolio. All of our investments are with A/A3 or better rated securities.
We performed an impairment review of our investment portfolio as of
January 31, 2016
. Based on our quarterly impairment review, we concluded that our investments were appropriately valued and did not record any impairment during fiscal year
2016
.
Net realized gains were $
2 million
for both fiscal year
2016
and
2014
and were not significant for fiscal year 2015. As of
January 31, 2016
, the amount of our net unrealized gain was not significant. As of
January 25, 2015
, we had a net unrealized gain of $
8 million
, which was comprised of gross unrealized gains of
$11 million
, offset by $
3 million
of gross unrealized losses.
Our accounts receivable are highly concentrated.
One
customer accounted for
21%
of our accounts receivable balance as of
January 31, 2016
. We maintain an allowance for doubtful accounts for estimated losses resulting from the inability of our customers to make required payments. This allowance consists of an amount identified for specific customers and an amount based on overall estimated exposure.
Our cash balances are held in numerous locations throughout the world, including substantial amounts held outside of the United States. As of January 31, 2016, we had cash, cash equivalents and marketable securities of $1.3 billion held within the United States and $3.7 billion held outside of the United States. Most of the amounts held outside the United States may be repatriated to the United States but, under current law, would be subject to U.S. federal income taxes, less applicable foreign tax credits. Further, repatriation of some foreign balances may be restricted by local laws. As of January 31, 2016, we have not provided for U.S. federal and state income taxes on approximately $2.5 billion of undistributed earnings of non-United States subsidiaries, as such earnings are considered indefinitely reinvested outside the United States. Although we have no current need to do so, if we repatriate foreign earnings for cash requirements in the United States, we would incur U.S. federal and state income tax, less applicable foreign tax credits, and reduced by the current amount of our U.S. federal and state net operating loss and tax credit carryforwards. Further, in addition to the $1.3 billion of cash, cash equivalents and marketable securities held within the United States and available to fund our U.S. operations and any other U.S. cash needs, we have access to external sources of financing if cash is needed in the United States other than by repatriation of foreign earnings where U.S. income tax may otherwise be due. Accordingly, we do not reasonably expect any material effect on our business, as a whole, or to our financial flexibility with respect to our current cash balances held outside of the United States.
Dividend payments and any share repurchases must be made from cash held in the United States. For fiscal year 2016, we made total cash dividend payments of
$213 million
and repurchased
$587 million
of our common stock, utilizing a significant amount of our U.S. cash balance previously taxed as of
January 31, 2016
.
40
Convertible Notes
On December 2, 2013, we issued $1.50 billion of 1.00% Convertible Senior Notes, or the Notes, due in 2018 and concurrently entered into separate note hedge and warrant transactions. The Notes will mature on December 1, 2018 unless earlier repurchased or converted in accordance with their terms prior to such date. As of January 31, 2016, the conversion threshold had been met and the Notes became convertible at the holders’ option beginning on February 1, 2016 and ending May 1, 2016. As such, the
$1.41 billion
carrying value of the Notes was classified as a current liability and the
$87 million
difference between the principal amount and the carrying value of the Notes was reclassified from shareholders’ equity to convertible debt in the mezzanine equity section of our Consolidated Balance Sheet as of January 31, 2016, and will remain there for as long as the Notes are convertible. The determination of whether or not the Notes are convertible must continue to be performed on a quarterly basis. Consequently, the Notes may be reclassified as long-term debt if the conversion threshold is not met in future quarters. Please refer to Note 11 of the Notes to the Consolidated Financial Statements in Part IV, Item 15 of this Annual Report on Form 10-K for further discussion.
Capital Return to Shareholders
During fiscal year 2016, we repurchased a total of 25 million shares for $587 million and paid $213 million in cash dividends to our shareholders, equivalent to $0.085 per share for the three months ended April 26, 2015, $0.0975 per share for the six months ended October 25, 2015, and $0.115 per share for the three months ended January 31, 2016. As a result, we returned $800 million to shareholders during fiscal year 2016 in the form of share repurchases and dividend payments.
For fiscal 2017, we intend to return approximately $1.0 billion to shareholders through ongoing quarterly cash dividends and share repurchases.
Our cash dividend program and the payment of future cash dividends under that program are subject to continued capital availability and our Board's continuing determination that the dividend program and the declaration of dividends thereunder are in the best interests of our shareholders and are in compliance with all laws and agreements of NVIDIA applicable to the declaration and payment of cash dividends. Please refer to Note 14 of the Notes to the Consolidated Financial Statements in Part IV, Item 15 of this Annual Report on Form 10-K for further discussion.
Operating Capital and Capital Expenditure Requirements
We believe that our existing cash balances and anticipated cash flows from operations will be sufficient to meet our operating, acquisition, share repurchase, cash dividend and capital requirements for at least the next twelve months. However, there is no assurance that we will not need to raise additional equity or debt financing within this time frame. Additional financing may not be available on favorable terms or at all and may be dilutive to our then-current shareholders. We also may require additional capital for other purposes not presently contemplated. If we are unable to obtain sufficient capital, we could be required to curtail capital equipment purchases or research and development expenditures, which could harm our business. Factors that could affect our cash used or generated from operations and, as a result, our need to seek additional borrowings or capital include:
|
•
|
decreased demand and market acceptance for our products and/or our customers’ products;
|
|
•
|
inability to successfully develop and produce in volume production our next-generation products;
|
|
•
|
competitive pressures resulting in lower than expected average selling prices; and
|
|
•
|
new product announcements or product introductions by our competitors.
|
We expect to spend approximately
$100 million
to
$150 million
for capital expenditures during fiscal year 2017, primarily for facilities, emulation equipment, computers and engineering workstations.
41
Contractual Obligations
The following table summarizes our contractual obligations as of
January 31, 2016
:
|
Payment Due By Period
|
|||||||||||||||||||||||
|
Contractual Obligations
|
Total
|
Less than
1 Year
|
1-3 Years
|
4-5 Years
|
More than
5 Years
|
All Other
|
|||||||||||||||||
|
|
(In millions)
|
||||||||||||||||||||||
|
1.00% Convertible Senior Notes due 2018 (1)
|
$
|
1,545
|
|
$
|
1,515
|
|
$
|
30
|
|
$
|
—
|
|
$
|
—
|
|
$
|
—
|
|
|||||
|
Inventory purchase obligations
|
391
|
|
391
|
|
—
|
|
—
|
|
—
|
|
—
|
|
|||||||||||
|
Operating leases (2) (3)
|
265
|
|
75
|
|
123
|
|
46
|
|
21
|
|
—
|
|
|||||||||||
|
Uncertain tax positions, interest and penalties (4)
|
78
|
|
—
|
|
—
|
|
—
|
|
—
|
|
78
|
|
|||||||||||
|
Capital purchase obligations
|
36
|
|
36
|
|
—
|
|
—
|
|
—
|
|
—
|
|
|||||||||||
|
Capital lease
|
17
|
|
5
|
|
12
|
|
—
|
|
—
|
|
—
|
|
|||||||||||
|
Restructuring related obligation (5)
|
23
|
|
23
|
|
—
|
|
—
|
|
—
|
|
—
|
|
|||||||||||
|
Total contractual obligations
|
$
|
2,355
|
|
$
|
2,045
|
|
$
|
165
|
|
$
|
46
|
|
$
|
21
|
|
$
|
78
|
|
|||||
|
(1)
|
Represents the aggregate principal amount of
$1.50 billion
and anticipated interest payments of
$45 million
of the Notes. See
Note 11
of the Notes to the Consolidated Financial Statements in Part IV, Item 15 of this Annual Report on Form 10-K.
|
|
(2)
|
Includes facilities leases as well as non-cancelable obligations under certain software licensing arrangements in the operating lease category.
|
|
(3)
|
Excludes operating lease payments that we expect to make under an operating lease financing arrangement following construction of a new headquarters building in Santa Clara, California, which is currently targeted for completion in the fourth quarter of fiscal year 2018. The amount of the operating lease payments will be determined after the completion of construction. See the section below titled “Off-Balance Sheet Arrangements” for additional information.
|
|
(4)
|
Represents unrecognized tax benefits of
$78 million
which consists of
$67 million
plus the related interest and penalties of
$11 million
recorded in non-current income tax payable as of January 31, 2016. We are unable to reasonably estimate the timing of any potential tax liability or interest/penalty payments in individual years due to uncertainties in the underlying income tax positions and the timing of the effective settlement of such tax positions.
|
|
(5)
|
Our operating expenses for the fiscal year 2016 included $131 million of restructuring and other charges related to the wind-down of our Icera modem operations. The $23 million represents the remaining balance of the restructuring liability as of January 31, 2016.
|
Off-Balance Sheet Arrangements
During fiscal year 2016, we began to construct a new headquarters building in Santa Clara, California, which is currently targeted for completion in the fourth quarter of fiscal year 2018. We are financing this construction under an off-balance sheet, build-to-suit operating lease arrangement. The banks have committed to fund up to $380 million of costs relating to construction. Once construction is complete, the lease balance will remain static at the completed cost for the remaining duration of the lease term. During construction, accrued interest will be capitalized into the lease balance. Following construction, we will pay rent in the form of interest. The lease has an initial 7.5 year term expiring on December 19, 2022, consisting of an approximately 2.5 year construction period followed by a 5 year lease term. We have the option to renew this lease for up to three additional 5 year periods, subject to approval by the banks. During the term of the lease, we may elect to purchase the headquarters building for the amount of the banks’ investment in the building and any accrued but unpaid rent. At the end of the lease term, we may elect to buy the building for the outstanding balance on the maturity date or arrange for the cash sale of the building to an unaffiliated third party. The aggregate guarantee made by us under the lease is no more than 87.5% of the costs incurred in connection with the construction of the building. Please refer to Note 12
of the Notes to the Consolidated Financial Statements in Part IV, Item 15 of this Annual Report on Form 10-K for further discussion regarding our operating lease financing arrangement.
During fiscal years
2015
and
2014
, we had no material off-balance sheet arrangements as defined in Regulation S-K 303(a)(4)(ii).
42
Adoption of New and Recently Issued Accounting Pronouncements
Please see
Note 1
of the Notes to the Consolidated Financial Statements in Part IV, Item 15 of this Annual Report on Form 10-K for a discussion of adoption of new and recently issued accounting pronouncements.
Investment and Interest Rate Risk
As of
January 31, 2016
and
January 25, 2015
, we had
$5.04 billion
and
$4.62 billion
, respectively, in cash, cash equivalents and marketable securities. As of
January 31, 2016
, we did not have any investments in auction-rate preferred securities.
As of
January 31, 2016
, we performed a sensitivity analysis on our floating and fixed rate financial investments. According to our analysis, parallel shifts in the yield curve of both plus or minus 0.5% would result in changes in fair values for these investments of
$28 million
.
Investments in both fixed and floating rate interest earning instruments carry a degree of interest rate risk. Fixed rate debt securities may have their market value adversely impacted due to a rise in interest rates, while floating rate securities may produce less income than expected if interest rates fall. Due in part to these factors, our future investment income may fall short of expectations due to changes in interest rates or if the decline in fair value of our publicly traded debt or equity investments is judged to be other-than-temporary. We may suffer losses in principal if we are forced to sell securities that decline in market value due to changes in interest rates. However, because any debt securities we hold are classified as “available-for-sale,” no gains or losses are realized in our Consolidated Statements of Income due to changes in interest rates unless such securities are sold prior to maturity or unless declines in market values are determined to be other-than-temporary.
Other income and expense could also vary materially from expectations depending on gains or losses realized on the sale or exchange of financial instruments; impairment charges related to debt securities as well as equity and other investments; interest rates; and cash, cash equivalent and marketable securities balances. Volatility in the financial markets and economic uncertainty increases the risk that the actual amounts realized in the future on our financial instruments could differ significantly from the fair values currently assigned to them. As of
January 31, 2016
, our investments in government agencies and government sponsored enterprises represented
47%
of our total investment portfolio, while the financial sector accounted for
23%
of our total investment portfolio. Substantially all of our investments are with A/A3 or better rated securities. If the fair value of our investments in these sectors was to decline by 2% - 5%, the fair values of these investments could decline by approximately
$66 million
-
$164 million
.
On December 2, 2013, we issued
$1.50 billion
of 1.00 % Convertible Senior Notes due 2018, or the Notes. Please refer to Note 11 of the Notes to the Consolidated Financial Statements in Part IV, Item 15 of this Annual Report on Form 10-K for additional information. We carry the Notes at face value less unamortized discount on our Consolidated Balance Sheets. Since the Notes bear interest at a fixed rate, we have no financial statement risk associated with changes in interest rates. However, the fair value of the Notes changes primarily when the market price of our stock fluctuates.
During fiscal year 2016, we began to construct a new headquarters building in Santa Clara, California, which is currently targeted for completion in the fourth quarter of fiscal year 2018. We are financing this construction under an off-balance sheet, build-to-suit operating lease financing arrangement. Following construction, we will pay rent in the form of interest that is based on a variable interest rate and is, therefore, affected by changes in market interest rates. In order to mitigate the interest rate risk on the operating lease financing arrangement, in August 2015, we entered into an interest rate swap for a portion of the operating lease financing arrangement, which entitles us to pay amounts based on a fixed interest rate in exchange for receipt of amounts based on variable interest rates. Please refer to Notes 9 and 12 of the Notes to the Consolidated Financial Statements in Part IV, Item 15 of this Annual Report on Form 10-K for additional information. If the syndicate of banks that are participants to the operating lease financing arrangement were to fail to fund loans for any reason, we would remain liable for payments due under the swap unless we were to settle the swap. If we were to settle the swap at a time when interest rates have fallen (relative to the swap’s inception), the price to settle the swap could be significant.
43
Exchange Rate Risk
We consider our direct exposure to foreign exchange rate fluctuations to be minimal. Gains or losses from foreign currency remeasurement are included in “Other income, net” in our Consolidated Financial Statements and to date have not been significant. The impact of foreign currency transaction gain (loss) included in determining net income was not significant for both fiscal year 2016 and 2015, and was a gain of
$5
million for fiscal year 2014.
Sales and arrangements with third-party manufacturers provide for pricing and payment in United States dollars, and, therefore, are not subject to exchange rate fluctuations. Increases in the value of the United States’ dollar relative to other currencies would make our products more expensive, which could negatively impact our ability to compete. Conversely, decreases in the value of the United States’ dollar relative to other currencies could result in our suppliers raising their prices in order to continue doing business with us. Additionally, we have international operations and incur expenditures in currencies other than U.S. dollars. Our operating expenses benefit from a stronger dollar and are adversely affected by a weaker dollar.
We may enter into certain transactions such as forward contracts which are designed to reduce the future potential impact resulting from changes in foreign currency exchange rates. There were no forward exchange contracts outstanding as of
January 31, 2016
.
The information required by this Item is set forth in our Consolidated Financial Statements and Notes thereto included in this Annual Report on Form 10-K.
None.
44
Controls and Procedures
Disclosure Controls and Procedures
Based on their evaluation as of
January 31, 2016
, our management, including our Chief Executive Officer and Chief Financial Officer, has concluded that our disclosure controls and procedures (as defined in Rule 13a-15(e) under the Securities Exchange Act of 1934, as amended, or the Exchange Act) were effective to provide reasonable assurance.
Management’s Annual Report on Internal Control Over Financial Reporting
Our management is responsible for establishing and maintaining adequate internal control over financial reporting, as such term is defined in Exchange Act Rule 13a-15(f). Under the supervision and with the participation of our management, including our Chief Executive Officer and Chief Financial Officer, we conducted an evaluation of the effectiveness of our internal control over financial reporting as of
January 31, 2016
based on the criteria set forth in
Internal Control - Integrated Framework (2013)
issued by the Committee of Sponsoring Organizations of the Treadway Commission. Based on our evaluation under the criteria set forth in
Internal Control — Integrated Framework
, our management concluded that our internal control over financial reporting was effective as of
January 31, 2016
.
The effectiveness of our internal control over financial reporting as of
January 31, 2016
has been audited by PricewaterhouseCoopers LLP, an independent registered public accounting firm, as stated in its report which is included herein.
Changes in Internal Control Over Financial Reporting
There were no changes in our internal control over financial reporting during our last fiscal quarter that have materially affected, or are reasonably likely to materially affect, our internal control over financial reporting.
Inherent Limitations on Effectiveness of Controls
Our management, including our Chief Executive Officer and Chief Financial Officer, does not expect that our disclosure controls and procedures or our internal controls, will prevent all error and all fraud. A control system, no matter how well conceived and operated, can provide only reasonable, not absolute, assurance that the objectives of the control system are met. Further, the design of a control system must reflect the fact that there are resource constraints, and the benefits of controls must be considered relative to their costs. Because of the inherent limitations in all control systems, no evaluation of controls can provide absolute assurance that all control issues and instances of fraud, if any, within NVIDIA have been detected.
None.
45
Certain information required by Part III is omitted from this report because we will file with the SEC a definitive proxy statement pursuant to Regulation 14A, or the
2016
Proxy Statement, no later than 120 days after the fiscal year ended
January 31, 2016
, and certain information included therein is incorporated herein by reference.
Identification of Directors
Reference is made to the information regarding directors appearing under the heading “Proposal 1 - Election of Directors” in our
2016
Proxy Statement, which information is hereby incorporated by reference.
Identification of Executive Officers
Reference is made to the information regarding executive officers appearing under the heading “Executive Officers of the Registrant” in Part I of this Annual Report on Form 10-K, which information is hereby incorporated by reference.
Identification of Audit Committee and Financial Experts
Reference is made to the information regarding directors appearing under the heading “Report of the Audit Committee of the Board of Directors” and “Information About the Board of Directors and Corporate Governance” in our
2016
Proxy Statement, which information is hereby incorporated by reference.
Material Changes to Procedures for Recommending Directors
Reference is made to the information regarding directors appearing under the heading “Information About the Board of Directors and Corporate Governance” in our
2016
Proxy Statement, which information is hereby incorporated by reference.
Compliance with Section 16(a) of the Exchange Act
Reference is made to the information appearing under the heading “Section 16(a) Beneficial Ownership Reporting Compliance” in our
2016
Proxy Statement, which information is hereby incorporated by reference.
Code of Conduct
Reference is made to the information appearing under the heading “Information About the Board of Directors and Corporate Governance - Code of Conduct” in our
2016
Proxy Statement, which information is hereby incorporated by reference. The full text of our “Code” and “Financial Team Code” are published on the Investor Relations portion of our website, under Corporate Governance, at
www.nvidia.com
. The contents of our website are not a part of this Annual Report on Form 10-K.
The information required by this item is hereby incorporated by reference from the sections titled “Executive Compensation”, “Compensation Committee Interlocks and Insider Participation”, “Director Compensation” and “Compensation Committee Report” in our
2016
Proxy Statement.
46
Ownership of NVIDIA Securities
The information required by this item is hereby incorporated by reference from the section titled “Security Ownership of Certain Beneficial Owners and Management” in our
2016
Proxy Statement.
Equity Compensation Plan Information
Information regarding our equity compensation plans, including both shareholder approved plans and non-shareholder approved plans, will be contained in our
2016
Proxy Statement under the caption "Equity Compensation Plan Information," and is hereby incorporated by reference.
The information required by this item is hereby incorporated by reference from the sections titled “Review of Transactions with Related Persons” and “Information About the Board of Directors and Corporate Governance - Independence of the Members of the Board of Directors” in our
2016
Proxy Statement.
The information required by this item is hereby incorporated by reference from the section titled “Fees Billed by the Independent Registered Public Accounting Firm” in our
2016
Proxy Statement.
47
|
|
|
Page
|
||
|
(a)
|
1.
|
Consolidated Financial Statements
|
|
|
|
|
||||
|
|
||||
|
|
||||
|
|
||||
|
|
||||
|
|
||||
|
2.
|
Financial Statement Schedule
|
|
||
|
|
||||
|
3.
|
Exhibits
|
|
||
|
|
||||
48
REPORT OF INDEPENDENT REGISTERED PUBLIC ACCOUNTING FIRM
To the Stockholders and Board of Directors of NVIDIA Corporation:
In our opinion, the consolidated financial statements listed in the index appearing under Item 15(a)(1) present fairly, in all material respects, the financial position of NVIDIA Corporation and its subsidiaries at January 31, 2016 and January 25, 2015, and the results of their operations and their cash flows for each of the three years in the period ended January 31, 2016 in conformity with accounting principles generally accepted in the United States of America. In addition, in our opinion, the financial statement schedule listed in the index
appearing under item 15(a)(2) presents fairly, in all material respects, the information set forth therein when read in conjunction with the related consolidated financial statements. Also in our opinion, the Company maintained, in all material respects, effective internal control over financial reporting as of January 31, 2016, based on criteria established in
Internal Control - Integrated Framework
(2013) issued by the Committee of Sponsoring Organizations of the Treadway Commission (COSO). The Company's management is responsible for these financial statements and financial statement schedule, for maintaining effective internal control over financial reporting and for its assessment of the effectiveness of internal control over financial reporting, included in Management's Report on Internal Control over Financial Reporting appearing under Item 9A. Our responsibility is to express opinions on these financial statements, on the financial statement schedule, and on the Company's internal control over financial reporting based on our integrated audits. We conducted our audits in accordance with the standards of the Public Company Accounting Oversight Board (United States). Those standards require that we plan and perform the audits to obtain reasonable assurance about whether the financial statements are free of material misstatement and whether effective internal control over financial reporting was maintained in all material respects. Our audits of the financial statements included examining, on a test basis, evidence supporting the amounts and disclosures in the financial statements, assessing the accounting principles used and significant estimates made by management, and evaluating the overall financial statement presentation. Our audit of internal control over financial reporting included obtaining an understanding of internal control over financial reporting, assessing the risk that a material weakness exists, and testing and evaluating the design and operating effectiveness of internal control based on the assessed risk. Our audits also included performing such other procedures as we considered necessary in the circumstances. We believe that our audits provide a reasonable basis for our opinions.
As discussed in Note 1 to the consolidated financial statements, the Company changed the manner in which it classifies deferred tax assets and liabilities on the consolidated balance sheet in fiscal year 2016.
A company’s internal control over financial reporting is a process designed to provide reasonable assurance regarding the reliability of financial reporting and the preparation of financial statements for external purposes in accordance with generally accepted accounting principles. A company’s internal control over financial reporting includes those policies and procedures that (i) pertain to the maintenance of records that, in reasonable detail, accurately and fairly reflect the transactions and dispositions of the assets of the company; (ii) provide reasonable assurance that transactions are recorded as necessary to permit preparation of financial statements in accordance with generally accepted accounting principles, and that receipts and expenditures of the company are being made only in accordance with authorizations of management and directors of the company; and (iii) provide reasonable assurance regarding prevention or timely detection of unauthorized acquisition, use, or disposition of the company’s assets that could have a material effect on the financial statements.
Because of its inherent limitations, internal control over financial reporting may not prevent or detect misstatements. Also, projections of any evaluation of effectiveness to future periods are subject to the risk that controls may become inadequate because of changes in conditions, or that the degree of compliance with the policies or procedures may deteriorate.
/s/ PricewaterhouseCoopers LLP
San Jose, California
March 16, 2016
49
NVIDIA CORPORATION AND SUBSIDIARIES
(In millions, except per share data)
|
Year Ended
|
|||||||||||
|
January 31,
2016 |
January 25,
2015 |
January 26,
2014 |
|||||||||
|
Revenue
|
$
|
5,010
|
|
$
|
4,682
|
|
$
|
4,130
|
|
||
|
Cost of revenue
|
2,199
|
|
2,083
|
|
1,862
|
|
|||||
|
Gross profit
|
2,811
|
|
2,599
|
|
2,268
|
|
|||||
|
Operating expenses:
|
|
|
|
||||||||
|
Research and development
|
1,331
|
|
1,360
|
|
1,336
|
|
|||||
|
Sales, general and administrative
|
602
|
|
480
|
|
436
|
|
|||||
|
Restructuring and other charges
|
131
|
|
—
|
|
—
|
|
|||||
|
Total operating expenses
|
2,064
|
|
1,840
|
|
1,772
|
|
|||||
|
Income from operations
|
747
|
|
759
|
|
496
|
|
|||||
|
Interest income
|
39
|
|
28
|
|
17
|
|
|||||
|
Interest expense
|
(47
|
)
|
(46
|
)
|
(10
|
)
|
|||||
|
Other income, net
|
4
|
|
14
|
|
7
|
|
|||||
|
Income before income tax expense
|
743
|
|
755
|
|
510
|
|
|||||
|
Income tax expense
|
129
|
|
124
|
|
70
|
|
|||||
|
Net income
|
$
|
614
|
|
$
|
631
|
|
$
|
440
|
|
||
|
Net income per share:
|
|||||||||||
|
Basic
|
$
|
1.13
|
|
$
|
1.14
|
|
$
|
0.75
|
|
||
|
Diluted
|
$
|
1.08
|
|
$
|
1.12
|
|
$
|
0.74
|
|
||
|
Weighted average shares used in per share computation:
|
|||||||||||
|
Basic
|
543
|
|
552
|
|
588
|
|
|||||
|
Diluted
|
569
|
|
563
|
|
595
|
|
|||||
|
Cash dividends declared and paid per common share
|
$
|
0.3950
|
|
$
|
0.3400
|
|
$
|
0.3100
|
|
||
See accompanying notes to the consolidated financial statements.
50
NVIDIA CORPORATION AND SUBSIDIARIES
CONSOLIDATED STATEMENTS OF COMPREHENSIVE INCOME
(In millions)
|
Year Ended
|
||||||||||||
|
January 31, 2016
|
January 25, 2015
|
January 26, 2014
|
||||||||||
|
Net income
|
$
|
614
|
|
$
|
631
|
|
$
|
440
|
|
|||
|
Other comprehensive income (loss), net of tax:
|
||||||||||||
|
Net change in unrealized gains (losses) on available-for-sale securities
|
(6
|
)
|
3
|
|
(4
|
)
|
||||||
|
Net change in fair value of interest rate swap
|
(4
|
)
|
—
|
|
—
|
|
||||||
|
Reclassification adjustments for net realized gains on available-for-sale securities included in net income
|
(2
|
)
|
—
|
|
(1
|
)
|
||||||
|
Other comprehensive income (loss)
|
(12
|
)
|
3
|
|
(5
|
)
|
||||||
|
Total comprehensive income
|
$
|
602
|
|
$
|
634
|
|
$
|
435
|
|
|||
See accompanying notes to the consolidated financial statements.
51
NVIDIA CORPORATION AND SUBSIDIARIES
(In millions, except per share data)
|
|
January 31, 2016
|
January 25, 2015
|
|||||
|
ASSETS
|
|
|
|||||
|
Current assets:
|
|
|
|||||
|
Cash and cash equivalents
|
$
|
596
|
|
$
|
497
|
|
|
|
Marketable securities
|
4,441
|
|
4,126
|
|
|||
|
Accounts receivable, less allowances of $11 as of January 31, 2016 and $17 as of January 25, 2015
|
505
|
|
474
|
|
|||
|
Inventories
|
418
|
|
483
|
|
|||
|
Prepaid expenses and other current assets
|
93
|
|
70
|
|
|||
|
Deferred income taxes
|
—
|
|
63
|
|
|||
|
Total current assets
|
6,053
|
|
5,713
|
|
|||
|
Property and equipment, net
|
466
|
|
557
|
|
|||
|
Goodwill
|
618
|
|
618
|
|
|||
|
Intangible assets, net
|
166
|
|
222
|
|
|||
|
Other assets
|
67
|
|
91
|
|
|||
|
Total assets
|
$
|
7,370
|
|
$
|
7,201
|
|
|
|
LIABILITIES, CONVERTIBLE DEBT CONVERSION OBLIGATION AND SHAREHOLDERS' EQUITY
|
|||||||
|
Current liabilities:
|
|
|
|||||
|
Accounts payable
|
$
|
296
|
|
$
|
293
|
|
|
|
Accrued and other current liabilities
|
642
|
|
603
|
|
|||
|
Convertible short-term debt
|
1,413
|
|
—
|
|
|||
|
Total current liabilities
|
2,351
|
|
896
|
|
|||
|
Convertible long-term debt
|
—
|
|
1,384
|
|
|||
|
Other long-term liabilities
|
453
|
|
489
|
|
|||
|
Capital lease obligations, long-term
|
10
|
|
14
|
|
|||
|
Total liabilities
|
2,814
|
|
2,783
|
|
|||
|
Commitments and contingencies - see Note 12
|
|
|
|
|
|||
|
Convertible debt conversion obligation
|
87
|
|
—
|
|
|||
|
Shareholders’ equity:
|
|
|
|||||
|
Preferred stock, $.001 par value; 2 shares authorized; none issued
|
—
|
|
—
|
|
|||
|
Common stock, $.001 par value; 2,000 shares authorized; 780 shares issued and 539 outstanding as of January 31, 2016; 759 shares issued and 545 outstanding as of January 25, 2015
|
1
|
|
1
|
|
|||
|
Additional paid-in capital
|
4,170
|
|
3,855
|
|
|||
|
Treasury stock, at cost (242 shares in 2016 and 214 shares in 2015)
|
(4,048
|
)
|
(3,395
|
)
|
|||
|
Accumulated other comprehensive income (loss)
|
(4
|
)
|
8
|
|
|||
|
Retained earnings
|
4,350
|
|
3,949
|
|
|||
|
Total shareholders' equity
|
4,469
|
|
4,418
|
|
|||
|
Total liabilities, convertible debt conversion obligation and shareholders' equity
|
$
|
7,370
|
|
$
|
7,201
|
|
|
See accompanying notes to the consolidated financial statements.
52
NVIDIA CORPORATION AND SUBSIDIARIES
CONSOLIDATED STATEMENTS OF SHAREHOLDERS’ EQUITY
(In millions)
|
Common Stock
Outstanding
|
Additional
|
Treasury
|
Accumulated Other Comprehensive
|
Retained
|
Total Shareholders'
|
|||||||||||||||||||||
|
|
Shares
|
Amount
|
Paid-in Capital
|
Stock
|
Income (Loss)
|
Earnings
|
Equity
|
|||||||||||||||||||
|
Balances, January 27, 2013
|
617
|
|
$
|
1
|
|
$
|
3,194
|
|
$
|
(1,623
|
)
|
$
|
10
|
|
$
|
3,245
|
|
$
|
4,827
|
|
||||||
|
Other comprehensive loss
|
—
|
|
—
|
|
—
|
|
—
|
|
(5
|
)
|
—
|
|
(5
|
)
|
||||||||||||
|
Net income
|
—
|
|
—
|
|
—
|
|
—
|
|
—
|
|
440
|
|
440
|
|
||||||||||||
|
Issuance of common stock from stock plans
|
15
|
|
—
|
|
97
|
|
—
|
|
—
|
|
—
|
|
97
|
|
||||||||||||
|
Tax withholding related to vesting of restricted stock units
|
(2
|
)
|
—
|
|
—
|
|
(28
|
)
|
—
|
|
—
|
|
(28
|
)
|
||||||||||||
|
Share repurchase
|
(62
|
)
|
—
|
|
—
|
|
(887
|
)
|
—
|
|
(887
|
)
|
||||||||||||||
|
Discount on convertible notes
|
—
|
|
—
|
|
126
|
|
—
|
|
—
|
|
—
|
|
126
|
|
||||||||||||
|
Purchase of convertible note hedges
|
—
|
|
—
|
|
(167
|
)
|
—
|
|
—
|
|
—
|
|
(167
|
)
|
||||||||||||
|
Proceeds from the sale of common stock warrants
|
—
|
|
—
|
|
59
|
|
—
|
|
—
|
|
—
|
|
59
|
|
||||||||||||
|
Deferred tax asset associated with convertible notes
|
—
|
|
—
|
|
14
|
|
—
|
|
—
|
|
—
|
|
14
|
|
||||||||||||
|
Cash dividends declared and paid ($0.310 per common share)
|
—
|
|
—
|
|
—
|
|
—
|
|
—
|
|
(181
|
)
|
(181
|
)
|
||||||||||||
|
Tax benefit from stock-based compensation
|
—
|
|
—
|
|
24
|
|
—
|
|
—
|
|
—
|
|
24
|
|
||||||||||||
|
Stock-based compensation
|
—
|
|
—
|
|
136
|
|
—
|
|
—
|
|
—
|
|
136
|
|
||||||||||||
|
Balances, January 26, 2014
|
568
|
|
1
|
|
3,483
|
|
(2,538
|
)
|
5
|
|
3,504
|
|
4,455
|
|
||||||||||||
|
Other comprehensive income
|
—
|
|
—
|
|
—
|
|
—
|
|
3
|
|
—
|
|
3
|
|
||||||||||||
|
Net income
|
—
|
|
—
|
|
—
|
|
—
|
|
—
|
|
631
|
|
631
|
|
||||||||||||
|
Issuance of common stock from stock plans
|
24
|
|
—
|
|
197
|
|
—
|
|
—
|
|
—
|
|
197
|
|
||||||||||||
|
Tax withholding related to vesting of restricted stock units
|
(3
|
)
|
—
|
|
—
|
|
(43
|
)
|
—
|
|
—
|
|
(43
|
)
|
||||||||||||
|
Share repurchase
|
(44
|
)
|
—
|
|
—
|
|
(814
|
)
|
—
|
|
—
|
|
(814
|
)
|
||||||||||||
|
Cash dividends declared and paid ($0.340 per common share)
|
—
|
|
—
|
|
—
|
|
—
|
|
—
|
|
(186
|
)
|
(186
|
)
|
||||||||||||
|
Tax benefit from stock-based compensation
|
—
|
|
—
|
|
17
|
|
—
|
|
—
|
|
—
|
|
17
|
|
||||||||||||
|
Stock-based compensation
|
—
|
|
—
|
|
158
|
|
—
|
|
—
|
|
—
|
|
158
|
|
||||||||||||
|
Balances, January 25, 2015
|
545
|
|
1
|
|
3,855
|
|
(3,395
|
)
|
8
|
|
3,949
|
|
4,418
|
|
||||||||||||
|
Other comprehensive loss
|
—
|
|
—
|
|
—
|
|
—
|
|
(12
|
)
|
—
|
|
(12
|
)
|
||||||||||||
|
Net income
|
—
|
|
—
|
|
—
|
|
—
|
|
—
|
|
614
|
|
614
|
|
||||||||||||
|
Issuance of common stock from stock plans
|
22
|
|
—
|
|
186
|
|
—
|
|
—
|
|
—
|
|
186
|
|
||||||||||||
|
Tax withholding related to vesting of restricted stock units
|
(3
|
)
|
—
|
|
—
|
|
(66
|
)
|
—
|
|
—
|
|
(66
|
)
|
||||||||||||
|
Share repurchase
|
(25
|
)
|
—
|
|
—
|
|
(587
|
)
|
—
|
|
—
|
|
(587
|
)
|
||||||||||||
|
Cash dividends declared and paid ($0.395 per common share)
|
—
|
|
—
|
|
—
|
|
—
|
|
—
|
|
(213
|
)
|
(213
|
)
|
||||||||||||
|
Tax benefit from stock-based compensation
|
—
|
|
—
|
|
10
|
|
—
|
|
—
|
|
—
|
|
10
|
|
||||||||||||
|
Stock-based compensation
|
—
|
|
—
|
|
206
|
|
—
|
|
—
|
|
—
|
|
206
|
|
||||||||||||
|
Reclassification of convertible debt conversion obligation
|
—
|
|
—
|
|
(87
|
)
|
—
|
|
—
|
|
—
|
|
(87
|
)
|
||||||||||||
|
Balances, January 31, 2016
|
539
|
|
$
|
1
|
|
$
|
4,170
|
|
$
|
(4,048
|
)
|
$
|
(4
|
)
|
$
|
4,350
|
|
$
|
4,469
|
|
||||||
See accompanying notes to the consolidated financial statements.
53
NVIDIA CORPORATION AND SUBSIDIARIES
(In millions)
|
Year Ended
|
|||||||||||
|
|
January 31, 2016
|
January 25, 2015
|
January 26, 2014
|
||||||||
|
Cash flows from operating activities:
|
|
|
|||||||||
|
Net income
|
$
|
614
|
|
$
|
631
|
|
$
|
440
|
|
||
|
Adjustments to reconcile net income to net cash provided by operating activities:
|
|
|
|||||||||
|
Depreciation and amortization
|
197
|
|
220
|
|
239
|
|
|||||
|
Stock-based compensation expense
|
204
|
|
158
|
|
136
|
|
|||||
|
Restructuring and other charges
|
45
|
|
—
|
|
—
|
|
|||||
|
Amortization of debt discount
|
29
|
|
28
|
|
5
|
|
|||||
|
Net gain on sale and disposal of long-lived assets and investments
|
(6
|
)
|
(17
|
)
|
(8
|
)
|
|||||
|
Deferred income taxes
|
134
|
|
83
|
|
15
|
|
|||||
|
Tax benefit from stock-based compensation
|
(10
|
)
|
(18
|
)
|
(26
|
)
|
|||||
|
Other
|
19
|
|
24
|
|
21
|
|
|||||
|
Changes in operating assets and liabilities, net of effects of acquisitions:
|
|
|
|||||||||
|
Accounts receivable
|
(32
|
)
|
(49
|
)
|
29
|
|
|||||
|
Inventories
|
66
|
|
(95
|
)
|
25
|
|
|||||
|
Prepaid expenses and other assets
|
(16
|
)
|
4
|
|
12
|
|
|||||
|
Accounts payable
|
(11
|
)
|
(27
|
)
|
(20
|
)
|
|||||
|
Accrued and other current liabilities
|
39
|
|
5
|
|
5
|
|
|||||
|
Other long-term liabilities
|
(97
|
)
|
(41
|
)
|
(38
|
)
|
|||||
|
Net cash provided by operating activities
|
1,175
|
|
906
|
|
835
|
|
|||||
|
Cash flows from investing activities:
|
|
|
|||||||||
|
Purchases of marketable securities
|
(3,477
|
)
|
(2,862
|
)
|
(3,066
|
)
|
|||||
|
Proceeds from sales of marketable securities
|
2,102
|
|
1,372
|
|
1,927
|
|
|||||
|
Proceeds from maturities of marketable securities
|
1,036
|
|
865
|
|
585
|
|
|||||
|
Purchases of property and equipment and intangible assets
|
(86
|
)
|
(122
|
)
|
(255
|
)
|
|||||
|
Proceeds from sale of long-lived assets and investments
|
7
|
|
21
|
|
25
|
|
|||||
|
Acquisition of businesses, net of cash and cash equivalents
|
—
|
|
—
|
|
(17
|
)
|
|||||
|
Reimbursement of headquarters building development costs from banks
|
24
|
|
—
|
|
—
|
|
|||||
|
Other
|
(6
|
)
|
(1
|
)
|
(5
|
)
|
|||||
|
Net cash used in investing activities
|
(400
|
)
|
(727
|
)
|
(806
|
)
|
|||||
|
Cash flows from financing activities:
|
|
|
|||||||||
|
Proceeds from issuance of convertible notes, net
|
—
|
|
—
|
|
1,478
|
|
|||||
|
Purchase of convertible note hedges
|
—
|
|
—
|
|
(167
|
)
|
|||||
|
Proceeds from the sale of common stock warrants
|
—
|
|
—
|
|
59
|
|
|||||
|
Proceeds from issuance of common stock under employee stock plans
|
120
|
|
154
|
|
69
|
|
|||||
|
Payments related to repurchases of common stock
|
(587
|
)
|
(814
|
)
|
(887
|
)
|
|||||
|
Dividends paid
|
(213
|
)
|
(186
|
)
|
(181
|
)
|
|||||
|
Tax benefit from stock-based compensation
|
10
|
|
18
|
|
26
|
|
|||||
|
Payments under capital lease obligations
|
(3
|
)
|
(3
|
)
|
(2
|
)
|
|||||
|
Other
|
(3
|
)
|
(3
|
)
|
(5
|
)
|
|||||
|
Net cash (used in) provided by financing activities
|
(676
|
)
|
(834
|
)
|
390
|
|
|||||
|
Change in cash and cash equivalents
|
99
|
|
(655
|
)
|
419
|
|
|||||
|
Cash and cash equivalents at beginning of period
|
497
|
|
1,152
|
|
733
|
|
|||||
|
Cash and cash equivalents at end of period
|
$
|
596
|
|
$
|
497
|
|
$
|
1,152
|
|
||
54
|
|
Year Ended
|
||||||||||
|
|
January 31, 2016
|
January 25, 2015
|
January 26, 2014
|
||||||||
|
Supplemental disclosures of cash flow information:
|
|||||||||||
|
Cash paid for income taxes, net
|
$
|
14
|
|
$
|
14
|
|
$
|
15
|
|
||
|
Cash paid for interest
|
$
|
17
|
|
$
|
17
|
|
$
|
3
|
|
||
|
Non-cash investing and financing activities:
|
|
|
|||||||||
|
Assets acquired by assuming related liabilities
|
$
|
19
|
|
$
|
10
|
|
$
|
3
|
|
||
|
Goodwill adjustment related to previously acquired business
|
$
|
—
|
|
$
|
(25
|
)
|
$
|
—
|
|
||
See accompanying notes to the consolidated financial statements.
55
NVIDIA CORPORATION AND SUBSIDIARIES
NOTES TO THE CONSOLIDATED FINANCIAL STATEMENTS
Note 1
- Organization and Summary of Significant Accounting Policies
Our Company
NVIDIA is dedicated to advancing visual computing. NVIDIA has transformed into a specialized platform company that targets four large markets - Gaming, Professional Visualization, Datacenter and Automotive - where visual computing is essential and valued.
Our two reportable segments - GPU and Tegra Processor - are based on a single underlying graphics architecture. From our proprietary processors, we have created platforms that address the four large markets where our visual computing expertise is critically important. We are focused on delivering value through PC, mobile and cloud architectures. Our vertical integration enables us to bring together hardware, system software, programmable algorithms, systems and services to create unique value for the markets we serve.
Our GPU product brands are aimed at specialized markets including GeForce for gamers; Quadro for designers; Tesla for researchers and analysts focused on artificial intelligence, deep learning and big-data; and GRID for cloud-based visual computing users. We also integrate our GPUs into powerful mobile system-on-a-chip (SOC) processors, which drive supercomputing capabilities for tablets and online gaming and entertainment devices, as well as autonomous robots, drones and cars. Our Tegra brand integrates an entire computer onto a single chip, incorporating GPUs and multi-core CPUs with audio, video and input/output capabilities.
Headquartered in Santa Clara, California, NVIDIA was incorporated in California in April 1993 and reincorporated in Delaware in April 1998.
All references to “NVIDIA,” “we,” “us,” “our” or the “Company” mean NVIDIA Corporation and its subsidiaries, except where it is made clear that the term means only the parent company.
Fiscal Year
We operate on a 52- or a 53-week year, ending on the last Sunday in January. Fiscal year
2016
was a 53-week year with the extra week in the fiscal fourth quarter and fiscal years
2015
and
2014
were 52-week years.
Principles of Consolidation
Our consolidated financial statements include the accounts of NVIDIA Corporation and its wholly-owned subsidiaries. All intercompany balances and transactions have been eliminated in consolidation.
Use of Estimates
The preparation of financial statements in conformity with accounting principles generally accepted in the United States, or U.S. GAAP, requires management to make estimates and assumptions that affect the reported amounts of assets and liabilities and disclosures of contingent assets and liabilities at the date of the financial statements and the reported amounts of revenue and expenses during the reporting period. Actual results could differ from those estimates. On an on-going basis, we evaluate our estimates, including those related to revenue recognition, cash equivalents and marketable securities, accounts receivable, inventories, income taxes, goodwill, stock-based compensation, litigation, investigation and settlement costs, restructuring and other charges, and other contingencies. These estimates are based on historical facts and various other assumptions that we believe are reasonable.
56
NVIDIA CORPORATION AND SUBSIDIARIES
NOTES TO THE CONSOLIDATED FINANCIAL STATEMENTS
(Continued)
Revenue Recognition
Product Revenue
We recognize revenue from product sales when persuasive evidence of an arrangement exists, the product has been delivered, the price is fixed or determinable and collection of the related receivable is reasonably assured. For most sales, we use a binding purchase order and in certain cases we use a contractual agreement as evidence of an arrangement. We consider delivery to occur upon shipment provided title and risk of loss have passed to the customer. At the point of sale, we assess whether the arrangement fee is fixed or determinable and whether collection is reasonably assured. If we determine that collection of a fee is not reasonably assured, we defer the fee and recognize revenue at the time collection becomes reasonably assured, which is generally upon receipt of payment.
For sales to certain distributors with rights of return for which the level of returns cannot be reasonably estimated, our policy is to defer recognition of revenue and related cost of revenue until the distributors resell the product and, in some cases, when customer return rights lapse.
Our customer programs primarily involve rebates, which are designed to serve as sales incentives to resellers of our products in various target markets. We account for rebates as a reduction of revenue and recognize a liability for these rebates at the later of the date at which we record the related revenue or the date at which we offer the rebate. Unclaimed rebates are reversed to revenue.
Our customer programs also include marketing development funds, or MDFs. MDFs represent monies paid to retailers, system builders, original equipment manufacturers, or OEMs, distributors, add-in card partners and other channel partners that are earmarked for market segment development and expansion and typically are designed to support our partners’ activities while also promoting NVIDIA products. We account for MDFs as a reduction of revenue and apply a breakage factor to certain types of MDF programs.
We also record a reduction to revenue by establishing a sales return allowance for estimated product returns at the time revenue is recognized, based primarily on historical return rates. However, if product returns for a particular fiscal period exceed historical return rates we may determine that additional sales return allowances are required to properly reflect our estimated exposure for product returns.
License and Development Revenue
For license arrangements that require significant customization of our intellectual property components, we generally recognize the related revenue over the period that services are performed. For most license and service arrangements, we determine progress to completion based on actual cost incurred to date as a percentage of the estimated total cost required to complete the project. A provision for estimated losses on contracts is made in the period in which the loss becomes probable and can be reasonably estimated. Costs incurred in advance of revenue recognized are recorded as deferred costs on uncompleted contracts. If the amount billed exceeds the amount of revenue recognized, the excess amount is recorded as deferred revenue.
For license arrangements that do not require significant customization but where we are obligated to provide further deliverables over the term of the license agreement, we record revenue over the life of the license term, with consideration received in advance of the performance period classified as deferred revenue.
Royalty revenue is recognized related to the distribution or sale of products that use our technologies under license agreements with third parties. We recognize royalty revenue upon receipt of a confirmation of earned royalties and when collectability is reasonably assured from the applicable licensee.
57
NVIDIA CORPORATION AND SUBSIDIARIES
NOTES TO THE CONSOLIDATED FINANCIAL STATEMENTS
(Continued)
Restructuring and Other Charges
Our restructuring and other charges include employee severance and related costs, the write-down of assets, and other exit costs. The severance and related costs include one-time termination benefits as well as certain statutory termination benefits or employee terminations under ongoing benefit arrangements. One-time termination benefits are recognized as a liability at estimated fair value when the approved plan of termination has been communicated to employees, unless employees must provide future service, in which case the benefits are recognized ratably over the future service period. Ongoing termination benefits arrangements are recognized as a liability at estimated fair value when the amount of such benefits becomes estimable and payment is probable. Any contract termination costs are recognized at estimated fair value when we terminate the contract in accordance with the contract terms. Other associated costs are recognized in the period the liability is incurred.
Advertising Expenses
We expense advertising costs in the period in which they are incurred. Advertising expenses for fiscal years
2016
,
2015
and
2014
were $
17 million
,
$15 million
and
$13 million
, respectively.
Rent Expense
We recognize rent expense on a straight-line basis over the lease period and accrue for rent expense incurred, but not paid.
Product Warranties
We generally offer limited warranty to end-users that ranges from one to three years for products in order to repair or replace products for any manufacturing defects or hardware component failures. Cost of revenue includes the estimated cost of product warranties that are calculated at the point of revenue recognition. Under limited circumstances, we may offer an extended limited warranty to customers for certain products. We also accrue for known warranty and indemnification issues if a loss is probable and can be reasonably estimated.
Stock-based Compensation
We estimate the fair value of employee stock options on the date of grant using a binomial model and recognize the expense using a straight-line attribution method over the requisite employee service period. We use the closing trading price of our common stock on the date of grant, minus a dividend yield discount, as the fair value of awards of restricted stock units, or RSUs, and performance stock units that are based on our corporate financial performance targets, or PSUs, and we use a Monte Carlo simulation on the date of grant to estimate the fair value of performance stock units that are based on market conditions, or market-based PSUs. The compensation expense for stock options, RSUs and market-based PSUs is recognized using a straight-line attribution method over the requisite employee service period while compensation expense for PSUs is recognized using an accelerated amortization model. We estimate the fair value of shares to be issued under our employee stock purchase plan, or ESPP, using the Black-Scholes model at the commencement of an offering period in March and September of each year. Stock-based compensation for our ESPP is expensed using an accelerated amortization model.
Litigation, Investigation and Settlement Costs
From time to time, we are involved in legal actions and/or investigations by regulatory bodies. We are aggressively defending our current litigation matters. However, there are many uncertainties associated with any litigation or investigation, and we cannot be certain that these actions or other third-party claims against us will be resolved without litigation, fines and/or substantial settlement payments. If that occurs, our business, financial condition and results of operations could be materially and adversely affected. If information becomes available that causes us to determine that a loss in any of our pending litigation, investigations or settlements is probable, and we can reasonably estimate the loss associated with such events, we will record the loss in accordance with U.S. GAAP. However, the actual liability in any such litigation or investigation may be materially different from our estimates, which could require us to record additional costs.
58
NVIDIA CORPORATION AND SUBSIDIARIES
NOTES TO THE CONSOLIDATED FINANCIAL STATEMENTS
(Continued)
Foreign Currency Remeasurement
We use the United States dollar as our functional currency for all of our subsidiaries. Foreign currency monetary assets and liabilities are remeasured into United States dollars at end-of-period exchange rates. Non-monetary assets and liabilities such as property and equipment, and equity are remeasured at historical exchange rates. Revenue and expenses are remeasured at average exchange rates in effect during each period, except for those expenses related to the previously noted balance sheet amounts, which are remeasured at historical exchange rates. Gains or losses from foreign currency remeasurement are included in “Other income, net” in our Consolidated Statements of Income and to date have not been significant.
The impact of gain or loss from foreign currency remeasurement included in determining other income, net was not significant for both fiscal year 2016 and 2015, and was a gain of $
5 million
for fiscal year 2014.
Income Taxes
We recognize federal, state and foreign current tax liabilities or assets based on our estimate of taxes payable or refundable in the current fiscal year by tax jurisdiction. We recognize federal, state and foreign deferred tax assets or liabilities, as appropriate, for our estimate of future tax effects attributable to temporary differences and carryforwards; and we record a valuation allowance to reduce any deferred tax assets by the amount of any tax benefits that, based on available evidence and judgment, are not expected to be realized.
United States income tax has not been provided on a portion of earnings of our non-U.S. subsidiaries to the extent that such earnings are considered to be indefinitely reinvested.
Our calculation of deferred tax assets and liabilities is based on certain estimates and judgments and involves dealing with uncertainties in the application of complex tax laws. Our estimates of deferred tax assets and liabilities may change based, in part, on added certainty or finality to an anticipated outcome, changes in accounting standards or tax laws in the United States, or foreign jurisdictions where we operate, or changes in other facts or circumstances. In addition, we recognize liabilities for potential United States and foreign income tax contingencies based on our estimate of whether, and the extent to which, additional taxes may be due. If we determine that payment of these amounts is unnecessary or if the recorded tax liability is less than our current assessment, we may be required to recognize an income tax benefit or additional income tax expense in our financial statements accordingly.
As of January 31, 2016, we had a valuation allowance of
$272 million
related to state and certain foreign deferred tax assets that management determined are not likely to be realized due, in part, to projections of future taxable income and potential utilization limitations of tax attributes acquired as a result of stock ownership changes. To the extent realization of the deferred tax assets becomes more-likely-than-not, we would recognize such deferred tax asset as an income tax benefit during the period.
We recognize excess tax benefit related to stock-based compensation as a credit to shareholders' equity if and when realized. In determining if and when excess tax benefits have been realized, we have elected to utilize the with-and-without approach with respect to such excess tax benefits. We have also elected to ignore the indirect tax effects of stock-based compensation deductions for financial and accounting reporting purposes, and specifically to recognize the full effect of the research tax credit in income from operations.
We recognize the benefit from a tax position only if it is more-likely-than-not that the position would be sustained upon audit based solely on the technical merits of the tax position. Our policy is to include interest and penalties related to unrecognized tax benefits as a component of income tax expense. Please refer to
Note 13
of these Notes to the Consolidated Financial Statements for additional information.
Comprehensive Income
Comprehensive income consists of net income and other comprehensive income (loss). Other comprehensive income (loss) components include unrealized gains (losses) on available-for-sale securities and the net change in fair value of our interest rate swap, net of tax.
59
NVIDIA CORPORATION AND SUBSIDIARIES
NOTES TO THE CONSOLIDATED FINANCIAL STATEMENTS
(Continued)
Net Income Per Share
Basic net income per share is computed using the weighted average number of common shares outstanding during the period. Diluted net income per share is computed using the weighted average number of common and potentially dilutive shares outstanding during the period, using the treasury stock method. Under the treasury stock method, the effect of stock options outstanding is not included in the computation of diluted net income per share for periods when their effect is anti-dilutive. Additionally, we issued convertible notes with a net settlement feature that requires us, upon conversion, to settle the principal amount of debt for cash and the conversion premium for cash or shares of our common stock. Our convertible notes, note hedges, and related warrants contain various conversion features, which are further described in
Note 11
of these Notes to the Consolidated Financial Statements. The potentially dilutive shares resulting from the convertible notes and warrants under the treasury stock method will be included in the calculation of diluted income per share when their inclusion is dilutive. However, unless actually exercised, the note hedges will not be included in the calculation of diluted net income per share, as their pre-exercised effect would be anti-dilutive under the treasury stock method.
Cash and Cash Equivalents
We consider all highly liquid investments that are readily convertible into cash and have an original maturity of three months or less at the time of purchase to be cash equivalents. As of
January 31, 2016
and
January 25, 2015
, our cash and cash equivalents were
$596 million
and
$497 million
, respectively, including $
43 million
and
$132 million
, respectively, invested in money market funds.
Marketable Securities
Marketable securities consist primarily of highly liquid investments with maturities of greater than three months when purchased. We generally classify our marketable securities at the date of acquisition as available-for-sale. These securities are reported at fair value with the related unrealized gains and losses included in accumulated other comprehensive income (loss), a component of shareholders’ equity, net of tax. The fair value of interest-bearing securities includes accrued interest. Any unrealized losses which are considered to be other-than-temporary impairments are recorded in the other income and expense section of our Consolidated Statements of Income. Realized gains and losses on the sale of marketable securities are determined using the specific-identification method and recorded in the other income and expense section of our Consolidated Statements of Income.
All of our available-for-sale investments are subject to a periodic impairment review. We record a charge to earnings when a decline in fair value is significantly below cost basis and judged to be other-than-temporary, or have other indicators of impairments. If the fair value of an available-for-sale debt instrument is less than its amortized cost basis, an other-than-temporary impairment is triggered in circumstances where (1) we intend to sell the instrument, (2) it is more likely than not that we will be required to sell the instrument before recovery of its amortized cost basis, or (3) a credit loss exists where we do not expect to recover the entire amortized cost basis of the instrument. In these situations, we recognize an other-than-temporary impairment in earnings equal to the entire difference between the debt instruments’ amortized cost basis and its fair value. For available-for-sale debt instruments that are considered other-than-temporarily impaired due to the existence of a credit loss, if we do not intend to sell and it is not more likely than not that we will not be required to sell the instrument before recovery of its remaining amortized cost basis (amortized cost basis less any current-period credit loss), we separate the amount of the impairment into the amount that is credit related and the amount due to all other factors. The credit loss component is recognized in earnings while loss related to all other factors is recorded in accumulated other comprehensive income (loss).
60
NVIDIA CORPORATION AND SUBSIDIARIES
NOTES TO THE CONSOLIDATED FINANCIAL STATEMENTS
(Continued)
Fair Value of Financial Instruments
The carrying value of cash equivalents, accounts receivable, accounts payable and accrued liabilities approximate their fair values due to their relatively short maturities as of
January 31, 2016
and
January 25, 2015
. Marketable securities are comprised of available-for-sale securities that are reported at fair value with the related unrealized gains (losses) included in accumulated other comprehensive income (loss), a component of shareholders’ equity, net of tax. Fair value of the marketable securities is determined based on quoted market prices. Derivative instruments are recognized as either assets or liabilities and are measured at fair value. The accounting for changes in the fair value of a derivative depends on the intended use of the derivative and the resulting designation. For derivative instruments designated as fair value hedges, the gains (losses) are recognized in earnings in the periods of change together with the offsetting losses (gains) on the hedged items attributed to the risk being hedged. For derivative instruments designated as cash-flow hedges, the effective portion of the gains (losses) on the derivatives is initially reported as a component of other comprehensive income (loss) and is subsequently recognized in earnings when the hedged exposure is recognized in earnings.
Concentration of Credit Risk
Financial instruments that potentially subject us to concentrations of credit risk consist primarily of cash equivalents, marketable securities, accounts receivable, note hedge and interest rate swap. Our investment policy requires the purchase of high grade investment securities, the diversification of asset type and includes certain limits on our portfolio duration. All marketable securities are held in our name, managed by several investment managers and held by one major financial institution under a custodial arrangement. Accounts receivable from significant customers, those representing
10%
or more of total accounts receivable, aggregated approximately
21%
of our accounts receivable balance from
one
customer as of
January 31, 2016
and
30%
of our account receivable balance from
two
customers as of
January 25, 2015
. We perform ongoing credit evaluations of our customers’ financial condition and maintain an allowance for potential credit losses. This allowance consists of an amount identified for specific customers and an amount based on overall estimated exposure. Our overall estimated exposure excludes amounts covered by credit insurance and letters of credit.
Accounts Receivable
We maintain an allowance for doubtful accounts receivable for estimated losses resulting from the inability of our customers to make required payments. We determine this allowance, which consists of an amount identified for specific customer issues as well as an amount based on overall estimated exposure. Factors impacting the allowance include the level of gross receivables, the financial condition of our customers and the extent to which balances are covered by credit insurance or letters of credit.
Inventories
Inventory cost is computed on an adjusted standard basis, which approximates actual cost on an average or first-in, first-out basis. Inventory costs consist primarily of the cost of semiconductors purchased from subcontractors, including wafer fabrication, assembly, testing and packaging, manufacturing support costs, including labor and overhead associated with such purchases, final test yield fallout, and shipping costs, as well as the cost of purchased memory products and other component parts. We charge cost of sales for inventory provisions to write down our inventory to the lower of cost or estimated market value or to completely write off obsolete or excess inventory. Most of our inventory provisions relate to the write-off of excess quantities of products, based on our inventory levels and future product purchase commitments compared to assumptions about future demand and market conditions. Once inventory has been written-off or written-down, it creates a new cost basis for the inventory that is not subsequently written-up.
Property and Equipment
Property and equipment are stated at cost. Depreciation of property and equipment is computed using the straight-line method based on the estimated useful lives of the assets, generally three to five years. Once an asset is identified for retirement or disposition, the related cost and accumulated depreciation or amortization are removed, and a gain or loss is recorded. The estimated useful lives of our buildings are up to twenty five years. Depreciation expense includes the amortization of assets recorded under capital leases. Leasehold improvements and assets recorded under capital leases are amortized over the shorter of the expected lease term or the estimated useful life of the asset.
61
NVIDIA CORPORATION AND SUBSIDIARIES
NOTES TO THE CONSOLIDATED FINANCIAL STATEMENTS
(Continued)
Goodwill
Goodwill is subject to our annual impairment test during the fourth quarter of our fiscal year, or earlier if indicators of potential impairment exist. For the purposes of completing our impairment test, we perform either a qualitative or a quantitative analysis on a reporting unit basis.
For those reporting units where a significant change or event has occurred, where potential impairment indicators exist, or for which we have not performed a quantitative assessment recently, we utilize a two-step quantitative assessment to testing goodwill for impairment. The first step tests for possible impairment by applying a fair value-based test by weighing the results from the income approach and the market approach. The second step, if necessary, measures the amount of such impairment by applying fair value-based tests to individual assets and liabilities. Please refer to
Note 4
of these Notes to the Consolidated Financial Statements for additional information.
Intangible Assets
Intangible assets primarily represent rights acquired under technology licenses, patents, acquired intellectual property, trademarks and customer relationships and are subject to an annual impairment test. We currently amortize our intangible assets with definitive lives over periods ranging from one to ten years using a method that reflects the pattern in which the economic benefits of the intangible asset are consumed or otherwise used up or, if that pattern cannot be reliably determined, using a straight-line amortization method.
Impairment of Long-Lived Assets
Long-lived assets, such as property and equipment and intangible assets subject to amortization are reviewed for impairment whenever events or changes in circumstances indicate that the carrying amount of an asset, or asset group may not be recoverable. Recoverability of assets to be held and used is measured by a comparison of the carrying amount of an asset, or asset group to estimated undiscounted future cash flows expected to be generated by the asset, or asset group. If the carrying amount of an asset or asset group exceeds its estimated future cash flows, an impairment charge is recognized for the amount by which the carrying amount of the asset or asset group exceeds the estimated fair value of the asset or asset group. Fair value is determined based on the estimated discounted future cash flows expected to be generated by the asset or asset group. Assets and liabilities to be disposed of would be separately presented in the Consolidated Balance Sheet and the assets would be reported at the lower of the carrying amount or fair value less costs to sell, and would no longer be depreciated.
Accounting for Asset Retirement Obligations
We account for asset retirement obligations associated with the retirement of tangible long-lived assets and the associated asset retirement costs. As of
January 31, 2016
and
January 25, 2015
, our asset retirement obligations to return the leasehold improvements at our headquarters facility and certain laboratories at our domestic and international facilities to their original condition upon lease termination were
$2 million
and
$7 million
, respectively.
Adoption of New and Recently Issued Accounting Pronouncements
In February 2016, the Financial Accounting Standards Board, or FASB, issued an accounting standards update regarding the accounting for leases. The objective of the update is to increase transparency and comparability among organizations by recognizing lease assets and liabilities on the balance sheet for leases with a lease term of more than 12 months. In addition, the update will require additional disclosures regarding key information about leasing arrangements. Under existing guidance, operating leases are not recorded as lease assets and lease liabilities on the balance sheet. The update will be effective for us beginning in our first quarter of fiscal year 2020, with early adoption permitted. We are currently evaluating the impact of the adoption of this accounting guidance on our consolidated financial statements, however, we expect the adoption of this accounting guidance to result in an increase in lease assets and a corresponding increase in lease liabilities on our Consolidated Balance Sheets.
62
NVIDIA CORPORATION AND SUBSIDIARIES
NOTES TO THE CONSOLIDATED FINANCIAL STATEMENTS
(Continued)
In November 2015, the FASB issued an accounting standards update to simplify the presentation of deferred income taxes. The new guidance requires that all deferred tax assets and liabilities, along with any related valuation allowance, be classified as noncurrent on the balance sheet. The update is effective for fiscal years beginning after December 15, 2016, including interim periods within that reporting period. Early adoption is permitted and may be applied either prospectively or retrospectively. We adopted this update in the fourth quarter of fiscal year 2016 on a prospective basis. Prior reporting periods were not retrospectively adjusted. The adoption of this guidance had no impact on our Consolidated Statements of Income.
In July 2015, the FASB issued an accounting standards update for the subsequent measurement of inventory. The amended guidance requires entities to measure inventory at the lower of cost or net realizable value. Net realizable value is the estimated selling price in the ordinary course of business, less reasonably predictable costs of completion, disposal and transportation. The requirement would replace the current lower of cost or market evaluation. The update is effective for us beginning in our first quarter of fiscal year 2018, with early adoption permitted to be applied prospectively. The adoption of this accounting guidance is not currently expected to have a material impact on our consolidated financial statements.
In April 2015, the FASB issued an accounting standards update that requires an entity to present debt issuance costs on the balance sheet as a direct deduction from the related debt liability as opposed to an asset. Amortization of the costs will continue to be reported as interest expense. The update is effective for annual reporting periods (including interim reporting periods within those periods) beginning after December 15, 2015. Early adoption is permitted for financial statements that have not been previously issued, and the new guidance would be applied retrospectively to all prior periods presented. The update will be effective for us beginning in our first quarter of fiscal year 2017. The adoption of this accounting guidance is not currently expected to have a material impact on our consolidated financial statements.
In April 2015, the FASB issued an accounting standards update that provides clarification on whether a cloud computing arrangement includes a software license. If a software license is included, the customer should account for the license consistent with its accounting for other software licenses. If a software license is not included, the arrangement should be accounted for as a service contract. The update is effective for reporting periods beginning after December 15, 2015, with early adoption permitted. Companies can elect to adopt the standard update prospectively or retrospectively to arrangements entered into, or materially modified, after the effective date. The update will be effective for us beginning in our first quarter of fiscal year 2017. We expect the adoption of this accounting guidance to result in an increase in software license assets and related depreciation expense, and a corresponding decrease in prepaid service contract assets and related service contract expense in our consolidated financial statements.
In May 2014, the FASB issued an accounting standards update that creates a single source of revenue guidance under U.S. GAAP for all companies, in all industries, effective for annual reporting periods beginning after December 15, 2016, including interim periods within that reporting period. On July 9, 2015, the FASB voted to defer the effective date by one year, such that the new standard will be effective for us beginning in our first quarter of fiscal year 2019. The FASB will also permit entities to adopt the standard one year earlier if they choose (i.e., the original effective date). We will adopt this guidance either by using a full retrospective approach for all periods presented in the period of adoption or a modified retrospective approach. We are currently evaluating the impact of this accounting guidance on our consolidated financial statements and have not yet determined which transition method we will apply.
63
NVIDIA CORPORATION AND SUBSIDIARIES
NOTES TO THE CONSOLIDATED FINANCIAL STATEMENTS
(Continued)
Note 2
- Stock-Based Compensation
Our stock-based compensation expense is associated with stock options, restricted stock units, or RSUs, performance stock units that are based on our corporate financial performance targets, or PSUs, performance stock units that are based on market conditions, or market-based PSUs, and our employee stock purchase plan, or ESPP.
Our consolidated statements of income include stock-based compensation expense, net of amounts capitalized as inventory, as follows:
|
|
Year Ended
|
||||||||||
|
January 31,
2016 |
January 25,
2015 |
January 26,
2014 |
|||||||||
|
|
(In millions)
|
||||||||||
|
Cost of revenue
|
$
|
15
|
|
$
|
12
|
|
$
|
11
|
|
||
|
Research and development
|
115
|
|
88
|
|
83
|
|
|||||
|
Sales, general and administrative
|
74
|
|
58
|
|
42
|
|
|||||
|
Total
|
$
|
204
|
|
$
|
158
|
|
$
|
136
|
|
||
Stock-based compensation capitalized in inventories was not significant during fiscal years 2016, 2015 and 2014.
The following is a summary of equity awards granted under our equity incentive plans:
|
Year Ended
|
|||||||||||
|
January 31,
|
|
January 25,
|
January 26,
|
||||||||
|
2016
|
|
2015
|
2014
|
||||||||
|
(In millions, except per share data)
|
|||||||||||
|
Stock Options
|
|||||||||||
|
Awards granted
|
—
|
|
|
—
|
|
|
6
|
|
|||
|
Estimated total grant-date fair value
|
$
|
—
|
|
$
|
—
|
|
$
|
21
|
|
||
|
Weighted average grant-date fair value (per share)
|
$
|
—
|
|
$
|
—
|
|
$
|
3.47
|
|
||
|
RSUs, PSUs and Market-based PSUs
|
|||||||||||
|
Awards granted
|
13
|
|
13
|
|
11
|
|
|||||
|
Estimated total grant-date fair value
|
$
|
296
|
|
$
|
228
|
|
$
|
145
|
|
||
|
Weighted average grant-date fair value (per share)
|
$
|
22.01
|
|
$
|
17.68
|
|
$
|
13.46
|
|
||
|
ESPP
|
|||||||||||
|
Shares purchased
|
6
|
|
7
|
|
6
|
|
|||||
|
Weighted average price (per share)
|
$
|
13.67
|
|
$
|
10.99
|
|
$
|
10.79
|
|
||
|
Weighted average grant-date fair value (per share)
|
$
|
4.53
|
|
$
|
4.99
|
|
$
|
5.60
|
|
||
Beginning fiscal year 2015, we shifted away from granting stock options and toward granting RSUs, PSUs and market-based PSUs to reflect changing market trends for equity incentives at our peer companies. The number of PSUs that will ultimately vest is contingent on the Company’s level of achievement versus the corporate financial performance target established by our Compensation Committee in the beginning of each fiscal year.
Of the total fair value of equity awards, we estimated that the stock-based compensation expense related to the equity awards that are not expected to vest for fiscal years
2016
,
2015
and
2014
was
$46 million
,
$37 million
and
$30 million
, respectively.
64
NVIDIA CORPORATION AND SUBSIDIARIES
NOTES TO THE CONSOLIDATED FINANCIAL STATEMENTS
(Continued)
|
January 31,
|
January 25,
|
||||||
|
2016
|
2015
|
||||||
|
(In millions)
|
|||||||
|
Unearned stock-based compensation expense
|
$
|
381
|
|
$
|
291
|
|
|
|
Estimated weighted average remaining amortization period
|
(In years)
|
||||||
|
Stock Options
|
1.1
|
|
1.8
|
|
|||
|
RSUs, PSUs and Market-based PSUs
|
2.7
|
|
2.8
|
|
|||
|
ESPP
|
0.7
|
|
0.5
|
|
|||
The fair value of stock options granted under our stock option plans and shares issued under our ESPP have been estimated with the following assumptions:
|
|
Year Ended
|
||||||
|
|
January 31,
2016 |
January 25,
2015 |
January 26,
2014 |
||||
|
(Using a binomial model)
|
|||||||
|
Stock Options
|
|||||||
|
Weighted average expected life (in years)
|
—
|
|
—
|
|
2.4-3.5
|
||
|
Risk-free interest rate
|
—
|
|
—
|
|
1.8%-3.0%
|
||
|
Volatility
|
—
|
|
—
|
|
28%-37%
|
||
|
Dividend yield
|
—
|
|
—
|
|
1.9%-2.4%
|
||
|
|
Year Ended
|
||||
|
|
January 31,
2016 |
January 25,
2015 |
January 26,
2014 |
||
|
(Using the Black-Scholes model)
|
|||||
|
ESPP
|
|||||
|
Weighted average expected life (in years)
|
0.5-2.0
|
0.5-2.0
|
0.5-2.0
|
||
|
Risk-free interest rate
|
0.1%-0.7%
|
0.1%-0.5%
|
0.1%-0.4%
|
||
|
Volatility
|
24%-34%
|
23%-31%
|
32%-37%
|
||
|
Dividend yield
|
1.5%-1.8%
|
1.7%-1.9%
|
2.0%-2.4%
|
||
The expected life of employee stock options is a derived output of our valuation model and is impacted by the underlying assumptions of our company. For ESPP shares, the expected term represents the average term from the first day of the offering period to the purchase date. The risk-free interest rate assumption used to value stock options and ESPP is based upon observed interest rates on Treasury bills appropriate for the expected term of the award. Our expected stock price volatility assumption for ESPP is estimated using historical volatility. For awards granted subsequent to November 7, 2012, we use the dividend yield at grant date. Our RSU, PSU and market-based PSU awards are not eligible for cash dividends prior to vesting; therefore, the fair values of RSUs, PSUs and market-based PSUs are discounted for the dividend yield.
Additionally, for employee stock option, RSU, PSU and market-based PSU awards, we estimate forfeitures annually and revise the estimates of forfeiture in subsequent periods if actual forfeitures differ from those estimates. Forfeitures are estimated based on historical experience.
65
NVIDIA CORPORATION AND SUBSIDIARIES
NOTES TO THE CONSOLIDATED FINANCIAL STATEMENTS
(Continued)
Equity Incentive Program
We grant stock options, RSUs, PSUs, market-based PSUs and stock purchase rights under the following equity incentive plans.
Amended and Restated 2007 Equity Incentive Plan
In 2007, our shareholders approved the NVIDIA Corporation 2007 Equity Incentive Plan, which was subsequently amended and restated in 2012, 2013 and 2014, or the 2007 Plan.
The 2007 Plan authorizes the issuance of incentive stock options, non-statutory stock options, restricted stock, restricted stock unit, stock appreciation rights, performance stock awards, performance cash awards, and other stock-based awards to employees, directors and consultants. Only our employees may receive incentive stock options. Up to
187,767,766
shares of our common stock may be issued pursuant to stock awards granted under the 2007 Plan. Currently, we grant RSUs, PSUs and market-based PSUs under the 2007 Plan, under which, as of January 31, 2016, there were
13,538,400
shares available for future issuance.
Stock options previously granted to employees, subject to certain exceptions, vest over a four year period, subject to continued service, with
25%
vesting on the anniversary of the hire date in the case of new hires or the anniversary of the date of grant in the case of grants to existing employees and
6.25%
vesting at the end of each quarterly period thereafter. Stock options previously granted under the 2007 Plan generally expire ten years from the date of grant.
Subject to certain exceptions, RSUs granted to employees vest over a four year period, subject to continued service, with
25%
vesting on a pre-determined date that is close to the anniversary of the date of grant and
12.5%
vesting semi-annually thereafter until fully vested.
PSUs vest on a similar schedule as our RSUs. Market-based PSUs vest
100%
on approximately the three-year anniversary of the date of grant. However, the number of shares subject to both PSUs and market-based PSUs that are eligible to vest is generally determined by the Compensation Committee based on achievement of pre-determined criteria.
Unless terminated sooner, the 2007 Plan is scheduled to terminate on March 21, 2022. Our Board may suspend or terminate the 2007 Plan at any time. No awards may be granted under the 2007 Plan while the 2007 Plan is suspended or after it is terminated. The Board may also amend the 2007 Plan at any time. However, if legal, regulatory or listing requirements require shareholder approval, the amendment will not go into effect until the shareholders have approved the amendment.
2012 Employee Stock Purchase Plan
In 2012, our shareholders approved the 2012 Employee Stock Purchase Plan, which was subsequently amended and restated in 2014, or the 2012 Plan, as the successor to the 1998 Employee Stock Purchase Plan.
Up to
65,235,816
shares of our common stock may be issued pursuant to purchases under the 2012 Plan. As of January 31, 2016, we had issued
18,459,901
shares and reserved
46,775,915
shares for future issuance under the 2012 Plan.
The 2012 Plan is intended to qualify as an “employee stock purchase plan” under Section 423 of the Internal Revenue Code. Under the current offerings adopted pursuant to the 2012 Plan, each offering period is
24 months
, which is divided into four purchase periods of
six months
.
Employees are eligible to participate if they are employed by us or an affiliate of us as designated by the Board. Employees who participate in an offering may have up to
10%
of their earnings withheld up to certain limitations and applied on specified dates determined by the Board to the purchase of shares of common stock. The Board may increase this percentage at its discretion, up to
15%
. The price of common stock purchased under our ESPP will be equal to
85%
of the lower of the fair market value of the common stock on the commencement date of each offering period and the purchase date of each offering period. Employees may end their participation in the ESPP at any time during the offering period, and participation ends automatically on termination of employment with us. In each case, the employee’s contributions are refunded.
66
NVIDIA CORPORATION AND SUBSIDIARIES
NOTES TO THE CONSOLIDATED FINANCIAL STATEMENTS
(Continued)
The following is a summary of our equity award transactions under our equity incentive plans:
|
RSUs, PSUs and Market-based PSUs Outstanding
|
Options Outstanding
|
||||||||||||||||||
|
|
Number of
Shares |
Weighted
Average Grant-Date Fair Value |
Number
of
Shares
|
Weighted
Average
Exercise Price
Per Share
|
Weighted
Average
Remaining
Contractual
Life
|
Aggregate
Intrinsic
Value (3)
|
|||||||||||||
|
(In millions, except years and per share data)
|
|||||||||||||||||||
|
Balances, January 25, 2015
|
23
|
|
$
|
15.94
|
|
21
|
|
$
|
14.61
|
|
|
|
|||||||
|
Granted (1)(2)
|
13
|
|
$
|
22.01
|
|
—
|
|
$
|
—
|
|
|
|
|||||||
|
Exercised
|
—
|
|
—
|
|
(7
|
)
|
$
|
14.60
|
|
|
|
||||||||
|
Vested restricted stock
|
(8
|
)
|
$
|
15.56
|
|
—
|
|
—
|
|
||||||||||
|
Canceled and forfeited
|
(2
|
)
|
$
|
16.63
|
|
(1
|
)
|
$
|
17.28
|
|
|
||||||||
|
Balances, January 31, 2016
|
26
|
|
$
|
19.12
|
|
13
|
|
$
|
14.49
|
|
5.9
|
$
|
197
|
|
|||||
|
Exercisable as of January 31, 2016
|
11
|
|
$
|
14.51
|
|
5.6
|
$
|
159
|
|
||||||||||
|
Vested and expected to vest after January 31, 2016
|
22
|
|
$
|
19.14
|
|
13
|
|
$
|
14.50
|
|
5.8
|
$
|
191
|
|
|||||
|
(1)
|
Includes the total number of PSUs that became eligible to vest based on the corporate financial performance level achieved for fiscal year 2016.
|
|
(2)
|
Includes the market-based PSUs that become eligible to vest if the maximum target for total shareholder return, or TSR, over the 3-year measurement period is achieved. Depending on the ranking of our TSR compared to the respective TSRs of the companies comprising the Standard & Poor’s 500 Index during a 3-year measurement period, the market-based PSUs that become eligible to vest could range from
0
to
0.4 million
shares. We granted market-based PSUs during the first quarter of fiscal year 2016 to our CEO and senior management as approved by our Compensation Committee.
|
|
(3)
|
The aggregate intrinsic value in the table above represents the total pre-tax intrinsic value for in-the-money options at
January 31, 2016
, based on the
$29.29
closing price of our common stock on January 29, 2016.
|
As of
January 31, 2016
and
January 25, 2015
, there were
14 million
and
25 million
shares, respectively, of common stock reserved for future issuance under our equity incentive plans.
The total intrinsic value of options exercised was
$75 million
,
$62 million
and
$14 million
for fiscal years
2016
,
2015
and
2014
, respectively. Upon exercise of an option, we issue new shares of stock. The total fair value of options vested was
$17 million
,
$33 million
and
$35 million
for fiscal years
2016
,
2015
and
2014
, respectively.
67
NVIDIA CORPORATION AND SUBSIDIARIES
NOTES TO THE CONSOLIDATED FINANCIAL STATEMENTS
(Continued)
The following is a reconciliation of the numerators and denominators of the basic and diluted net income per share computations for the periods presented:
|
|
Year Ended
|
||||||||||
|
|
January 31,
2016 |
January 25,
2015 |
January 26,
2014 |
||||||||
|
|
(In millions, except per share data)
|
||||||||||
|
Numerator:
|
|
|
|
||||||||
|
Net income
|
$
|
614
|
|
$
|
631
|
|
$
|
440
|
|
||
|
Denominator:
|
|
|
|
||||||||
|
Denominator for basic net income per share, weighted average shares
|
543
|
|
552
|
|
588
|
|
|||||
|
Effect of dilutive securities:
|
|
|
|
||||||||
|
Equity awards outstanding
|
13
|
|
11
|
|
7
|
|
|||||
|
Assumed conversion of 1% Convertible Senior Notes Due 2018
|
13
|
|
—
|
|
—
|
|
|||||
|
Denominator for diluted net income per share, weighted average shares
|
569
|
|
563
|
|
595
|
|
|||||
|
Net income per share:
|
|
|
|
||||||||
|
Basic
|
$
|
1.13
|
|
$
|
1.14
|
|
$
|
0.75
|
|
||
|
Diluted
|
$
|
1.08
|
|
$
|
1.12
|
|
$
|
0.74
|
|
||
|
Potentially dilutive securities excluded from income per diluted share because their effect would have been anti-dilutive
|
10
|
|
12
|
|
26
|
|
|||||
The
1.00%
Convertible Senior Notes, or the Notes, are included in the calculation of diluted net income per share if their inclusion is dilutive. The Notes will generally have a dilutive impact on net income per share if our average stock price for the reporting period exceeds the adjusted conversion price of
$20.1204
per share. For the fiscal year ended January 31, 2016, our average stock price exceeded the conversion price, causing the Notes to have a dilutive impact for this period.
The denominator for diluted net income per share does not include any effect from the convertible note hedge transaction, or the Note Hedges, that we entered into concurrently with the issuance of the Notes, as its effect would be anti-dilutive. In the event an actual conversion of any or all of the Notes occurs, the shares that would be delivered to us under the Note Hedges are designed to neutralize the dilutive effect of the shares that we would issue under the Notes.
The denominator for diluted net income per share will not include any effect from the warrants, which we entered into concurrently with the issuance of the Notes, unless our average stock price for the reporting period exceeds the adjusted strike price of
$27.0851
per share.
Please refer to Note 11 of these Notes to the Consolidated Financial Statements for additional discussion regarding the Notes.
68
NVIDIA CORPORATION AND SUBSIDIARIES
NOTES TO THE CONSOLIDATED FINANCIAL STATEMENTS
(Continued)
Note 4
- Goodwill
The carrying amount of goodwill is as follows:
|
|
January 31,
2016 |
January 25,
2015 |
|||||
|
|
(In millions)
|
||||||
|
Icera
|
$
|
271
|
|
$
|
271
|
|
|
|
PortalPlayer
|
105
|
|
105
|
|
|||
|
3dfx
|
50
|
|
50
|
|
|||
|
Mental Images
|
59
|
|
59
|
|
|||
|
MediaQ
|
35
|
|
35
|
|
|||
|
ULi
|
31
|
|
31
|
|
|||
|
Hybrid Graphics
|
28
|
|
28
|
|
|||
|
Ageia
|
19
|
|
19
|
|
|||
|
Portland Group Inc.
|
2
|
|
2
|
|
|||
|
Other
|
18
|
|
18
|
|
|||
|
Total goodwill
|
$
|
618
|
|
$
|
618
|
|
|
The amount of goodwill allocated to our GPU and Tegra Processor segments was
$210 million
and
$408 million
, respectively, as of both
January 31, 2016
and
January 25, 2015
. Please refer to
Note 16
of these Notes to the Consolidated Financial Statements for further discussion regarding segments.
We utilized a two-step quantitative analysis to complete our annual impairment test during the fourth quarter of fiscal year 2016 and concluded that there was no impairment, as the fair value of our reporting units exceeded their carrying values. The first step tests for possible impairment by applying a fair value-based test by weighing the results from the income approach and the market approach. The second step, if necessary, measures the amount of such impairment by applying fair value-based tests to individual assets and liabilities.
These income and market valuation approaches consider a number of factors that include, but are not limited to, prospective financial information, growth rates, residual values, discount rates and comparable multiples from publicly traded companies in our industry and require us to make certain assumptions and estimates regarding industry economic factors and the future profitability of our business. When performing an income approach valuation, we incorporate the use of projected financial information and a discount rate that are developed using market participant based assumptions to our discounted cash flow model. Our estimates of discounted cash flow were based upon, among other things, certain assumptions about our expected future operating performance, such as revenue growth rates, operating margins, risk-adjusted discount rates, and future economic and market conditions. The market method of determining the fair value of our reporting units requires us to use judgment in the selection of appropriate market comparables.
69
NVIDIA CORPORATION AND SUBSIDIARIES
NOTES TO THE CONSOLIDATED FINANCIAL STATEMENTS
(Continued)
The components of our amortizable intangible assets are as follows:
|
|
January 31, 2016
|
January 25, 2015
|
|||||||||||||||||||||||||
|
|
Gross
Carrying
Amount
|
Accumulated
Amortization
|
Net
Carrying
Amount
|
Weighted Average
Useful Life
|
Gross
Carrying
Amount
|
Accumulated
Amortization
|
Net
Carrying
Amount
|
Weighted Average
Useful Life
|
|||||||||||||||||||
|
|
(In millions)
|
(In years)
|
(In millions)
|
(In years)
|
|||||||||||||||||||||||
|
Acquisition-related intangible assets
|
$
|
193
|
|
$
|
(152
|
)
|
$
|
41
|
|
7.0
|
$
|
189
|
|
$
|
(134
|
)
|
$
|
55
|
|
6.8
|
|||||||
|
Patents and licensed technology
|
462
|
|
(337
|
)
|
125
|
|
7.0
|
449
|
|
(282
|
)
|
167
|
|
7.2
|
|||||||||||||
|
Total intangible assets
|
$
|
655
|
|
$
|
(489
|
)
|
$
|
166
|
|
|
$
|
638
|
|
$
|
(416
|
)
|
$
|
222
|
|
|
|||||||
Amortization expense associated with intangible assets for fiscal years
2016
,
2015
and
2014
was
$73 million
,
$77 million
and
$73 million
, respectively. Future amortization expense for the net carrying amount of intangible assets as of
January 31, 2016
is estimated to be
$67 million
in fiscal year
2017
,
$52 million
in fiscal year
2018
,
$24 million
in fiscal year
2019
,
$16 million
in fiscal year
2020
, and
$7 million
in fiscal year
2021
until fully amortized.
70
NVIDIA CORPORATION AND SUBSIDIARIES
NOTES TO THE CONSOLIDATED FINANCIAL STATEMENTS
(Continued)
Note 6
- Marketable Securities
All of our cash equivalents and marketable securities are classified as “available-for-sale” securities. These securities are reported at fair value with the related unrealized gains and losses included in accumulated other comprehensive income (loss), a component of shareholders’ equity, net of tax, and net realized gains and losses recorded in other income, net, on the Consolidated Statements of Income.
The following is a summary of cash equivalents and marketable securities as of
January 31, 2016
and
January 25, 2015
:
|
|
January 31, 2016
|
||||||||||||||
|
|
Amortized
Cost
|
Unrealized
Gain
|
Unrealized
Loss
|
Estimated
Fair Value
|
|||||||||||
|
|
(In millions)
|
||||||||||||||
|
Corporate debt securities
|
$
|
1,903
|
|
$
|
1
|
|
$
|
(3
|
)
|
$
|
1,901
|
|
|||
|
Debt securities of United States government agencies
|
1,170
|
|
1
|
|
(1
|
)
|
1,170
|
|
|||||||
|
Debt securities issued by United States Treasury
|
800
|
|
1
|
|
—
|
|
801
|
|
|||||||
|
Asset-backed securities
|
435
|
|
—
|
|
—
|
|
435
|
|
|||||||
|
Mortgage backed securities issued by United States government-sponsored enterprises
|
229
|
|
3
|
|
(1
|
)
|
231
|
|
|||||||
|
Foreign government bonds
|
92
|
|
—
|
|
—
|
|
92
|
|
|||||||
|
Money market funds
|
43
|
|
—
|
|
—
|
|
43
|
|
|||||||
|
Total
|
$
|
4,672
|
|
$
|
6
|
|
$
|
(5
|
)
|
$
|
4,673
|
|
|||
|
Classified as:
|
|
|
|
|
|||||||||||
|
Cash equivalents
|
|
|
|
$
|
232
|
|
|||||||||
|
Marketable securities
|
|
|
|
4,441
|
|
||||||||||
|
Total
|
|
|
|
$
|
4,673
|
|
|||||||||
|
|
January 25, 2015
|
||||||||||||||
|
|
Amortized
Cost
|
Unrealized
Gain
|
Unrealized
Loss
|
Estimated
Fair Value
|
|||||||||||
|
|
(In millions)
|
||||||||||||||
|
Corporate debt securities
|
$
|
2,185
|
|
$
|
3
|
|
$
|
(2
|
)
|
$
|
2,186
|
|
|||
|
Debt securities of United States government agencies
|
750
|
|
—
|
|
—
|
|
750
|
|
|||||||
|
Debt securities issued by United States Treasury
|
534
|
|
3
|
|
—
|
|
537
|
|
|||||||
|
Asset-backed securities
|
453
|
|
—
|
|
—
|
|
453
|
|
|||||||
|
Mortgage backed securities issued by United States government-sponsored enterprises
|
274
|
|
5
|
|
(1
|
)
|
278
|
|
|||||||
|
Money market funds
|
132
|
|
—
|
|
—
|
|
132
|
|
|||||||
|
Foreign government bonds
|
85
|
|
—
|
|
—
|
|
85
|
|
|||||||
|
Total
|
$
|
4,413
|
|
$
|
11
|
|
$
|
(3
|
)
|
$
|
4,421
|
|
|||
|
Classified as:
|
|
|
|
|
|||||||||||
|
Cash equivalents
|
|
|
|
$
|
295
|
|
|||||||||
|
Marketable securities
|
|
|
|
4,126
|
|
||||||||||
|
Total
|
|
|
|
$
|
4,421
|
|
|||||||||
71
NVIDIA CORPORATION AND SUBSIDIARIES
NOTES TO THE CONSOLIDATED FINANCIAL STATEMENTS
(Continued)
The following table provides the breakdown of the investments with unrealized losses as of
January 31, 2016
:
|
|
Less than 12 Months
|
12 Months or Greater
|
Total
|
||||||||||||||||||||
|
|
Fair Value
|
Gross
Unrealized
Losses
|
Fair Value
|
Gross
Unrealized
Losses
|
Fair Value
|
Gross
Unrealized
Losses
|
|||||||||||||||||
|
|
(In millions)
|
||||||||||||||||||||||
|
Corporate debt securities
|
$
|
950
|
|
$
|
(3
|
)
|
$
|
80
|
|
$
|
—
|
|
$
|
1,030
|
|
$
|
(3
|
)
|
|||||
|
Debt securities issued by United States government agencies
|
692
|
|
(1
|
)
|
—
|
|
—
|
|
692
|
|
(1
|
)
|
|||||||||||
|
Mortgage backed securities issued by United States government-sponsored enterprises
|
97
|
|
(1
|
)
|
31
|
|
—
|
|
128
|
|
(1
|
)
|
|||||||||||
|
Total
|
$
|
1,739
|
|
$
|
(5
|
)
|
$
|
111
|
|
$
|
—
|
|
$
|
1,850
|
|
$
|
(5
|
)
|
|||||
We performed an impairment review of our investment portfolio as of
January 31, 2016
. Factors considered included general market conditions, the duration and extent to which fair value is below cost, and our intent and ability to hold an investment for a sufficient period of time to allow for recovery in value. We also consider specific adverse conditions related to the financial health of and business outlook for an investee, including industry and sector performance, changes in technology, operational and financing cash flow factors, and changes in an investee’s credit rating. Investments that we identify as having an indicator of impairment are subject to further analysis to determine if the investment was other than temporarily impaired. Based on our quarterly impairment review and having considered the guidance in the relevant accounting literature, we concluded that our investments were appropriately valued and that no other-than-temporary impairment charges were necessary on our portfolio of available-for-sale investments as of
January 31, 2016
.
As of
January 31, 2016
, we had
nine
investments that were in an unrealized loss position with total unrealized losses amounting to
$5 million
and with a duration of less than one year. The gross unrealized losses related to fixed income securities were due to changes in interest rates. We have determined that the gross unrealized losses on investment securities as of
January 31, 2016
are temporary in nature. Currently, we have the intent and ability to hold our investments with impairment indicators until maturity.
Net realized gains were
$2 million
for both fiscal year
2016
and
2014
and were not significant for fiscal year 2015. As of
January 31, 2016
, net unrealized gain was not significant. As of
January 25, 2015
, we had a net unrealized gain of
$8 million
, which was comprised of gross unrealized gains of
$11 million
, offset by
$3 million
of gross unrealized losses.
The amortized cost and estimated fair value of cash equivalents and marketable securities, which are primarily debt instruments, are classified as available-for-sale as of
January 31, 2016
and
January 25, 2015
and are shown below by contractual maturity.
|
|
January 31, 2016
|
January 25, 2015
|
|||||||||||||
|
|
Amortized
Cost
|
Estimated
Fair Value
|
Amortized
Cost
|
Estimated
Fair Value
|
|||||||||||
|
|
(In millions)
|
||||||||||||||
|
Less than one year
|
$
|
1,619
|
|
$
|
1,619
|
|
$
|
1,570
|
|
$
|
1,570
|
|
|||
|
Due in 1 - 5 years
|
3,019
|
|
3,020
|
|
2,720
|
|
2,726
|
|
|||||||
|
Mortgage-backed securities issued by government-sponsored enterprises not due at a single maturity date
|
34
|
|
34
|
|
123
|
|
125
|
|
|||||||
|
Total
|
$
|
4,672
|
|
$
|
4,673
|
|
$
|
4,413
|
|
$
|
4,421
|
|
|||
72
NVIDIA CORPORATION AND SUBSIDIARIES
NOTES TO THE CONSOLIDATED FINANCIAL STATEMENTS
(Continued)
We measure our cash equivalents and marketable securities at fair value. The fair values of our financial assets and liabilities are determined using quoted market prices of identical assets or quoted market prices of similar assets from active markets. Our Level 1 assets consist of our money market funds. We classify securities within Level 1 assets when the fair value is obtained from real time quotes for transactions in active exchange markets involving identical assets. Our available-for-sale securities are classified as having Level 2 inputs. Our Level 2 assets are valued utilizing a market approach where the market prices of similar assets are provided by a variety of independent industry standard data providers to our investment custodian. We review the fair value hierarchy classification on a quarterly basis. Changes in the observability of valuation inputs may result in a reclassification of levels for certain securities within the fair value hierarchy. There were no significant transfers between Levels 1 and 2 assets for the year ended
January 31, 2016
. Level 3 assets are based on unobservable inputs to the valuation methodology and include our own data about assumptions market participants would use in pricing the asset or liability based on the best information available under the circumstances. Most of our cash equivalents and marketable securities are valued based on Level 2 inputs. We did not have any investments classified as Level 3 as of
January 31, 2016
.
|
|
Fair Value at
|
||||||||
|
Pricing Category
|
|
January 31, 2016
|
January 25, 2015
|
||||||
|
(In millions)
|
|||||||||
|
Assets
|
|||||||||
|
Cash equivalents and Marketable securities:
|
|||||||||
|
Corporate debt securities (1)
|
Level 2
|
$
|
1,901
|
|
$
|
2,186
|
|
||
|
Debt securities of U.S. government agencies (2)
|
Level 2
|
$
|
1,170
|
|
$
|
750
|
|
||
|
Debt securities issued by the U.S. Treasury (3)
|
Level 2
|
$
|
801
|
|
$
|
537
|
|
||
|
Asset-backed securities (4)
|
Level 2
|
$
|
435
|
|
$
|
453
|
|
||
|
Mortgage-backed securities issued by government-sponsored enterprises (3)
|
Level 2
|
$
|
231
|
|
$
|
278
|
|
||
|
Foreign government bonds (3)
|
Level 2
|
$
|
92
|
|
$
|
85
|
|
||
|
Money market funds (5)
|
Level 1
|
$
|
43
|
|
$
|
132
|
|
||
|
Liabilities
|
|||||||||
|
Current liability:
|
|||||||||
|
1.00% Convertible Senior Notes Due 2018 (6)
|
Level 2
|
$
|
2,273
|
|
$
|
1,680
|
|
||
|
Other noncurrent liability:
|
|||||||||
|
Interest rate swap (7)
|
Level 2
|
$
|
(7
|
)
|
$
|
—
|
|
||
|
(1)
|
Includes $
51 million
and
$147 million
in cash equivalents as of January 31, 2016 and January 25, 2015, respectively, and $
1.85 billion
and
$2.04 billion
in marketable securities as of January 31, 2016 and January 25, 2015, respectively, on the Consolidated Balance Sheets.
|
|
(2)
|
Includes
$90 million
and
$15 million
in cash equivalents as of January 31, 2016 and January 25, 2015, respectively, and
$1.08 billion
and
$735 million
in marketable securities as of January 31, 2016 and January 25, 2015, respectively, on the Consolidated Balance Sheets.
|
|
(3)
|
In marketable securities on the Consolidated Balance Sheets.
|
|
(4)
|
Includes
$435 million
and
$453 million
in marketable securities as of January 31, 2016 and January 25, 2015, respectively, on the Consolidated Balance Sheets.
|
|
(5)
|
In cash equivalents on the Consolidated Balance Sheets.
|
|
(6)
|
The Notes are carried on our Consolidated Balance Sheets at their original issuance value, net of unamortized debt discount, and are not marked to fair value each period. Please refer to Note 11 of these Notes to the Consolidated Financial Statements for additional information on the Notes.
|
|
(7)
|
Please refer to Note 9 of these Notes to the Consolidated Financial Statements for a discussion regarding our interest rate swap.
|
73
NVIDIA CORPORATION AND SUBSIDIARIES
NOTES TO THE CONSOLIDATED FINANCIAL STATEMENTS
(Continued)
Certain balance sheet components are as follows:
|
|
January 31,
2016 |
January 25,
2015 |
|||||
|
(In millions)
|
|||||||
|
Inventories:
|
|||||||
|
Raw materials
|
$
|
105
|
|
$
|
157
|
|
|
|
Work in-process
|
103
|
|
92
|
|
|||
|
Finished goods
|
210
|
|
234
|
|
|||
|
Total inventories
|
$
|
418
|
|
$
|
483
|
|
|
As of
January 31, 2016
, we had outstanding inventory purchase obligations totaling
$391 million
.
|
|
January 31,
2016 |
January 25,
2015 |
Estimated
Useful Life
|
||||||
|
(In millions)
|
(In years)
|
||||||||
|
Property and Equipment:
|
|||||||||
|
Land
|
$
|
218
|
|
$
|
218
|
|
(A)
|
||
|
Building
|
13
|
|
19
|
|
25
|
||||
|
Test equipment
|
354
|
|
397
|
|
3-5
|
||||
|
Software and licenses
|
98
|
|
113
|
|
3-5
|
||||
|
Leasehold improvements
|
174
|
|
174
|
|
(B)
|
||||
|
Computer equipment
|
155
|
|
153
|
|
3-5
|
||||
|
Office furniture and equipment
|
48
|
|
49
|
|
5
|
||||
|
Capital leases
|
28
|
|
28
|
|
(B)
|
||||
|
Construction in process
|
12
|
|
28
|
|
(C)
|
||||
|
Total property and equipment, gross
|
1,100
|
|
1,179
|
|
|
||||
|
Accumulated depreciation and amortization
|
(634
|
)
|
(622
|
)
|
|
||||
|
Total property and equipment, net
|
$
|
466
|
|
$
|
557
|
|
|
||
(A) Land is a non-depreciable asset.
(B) Leasehold improvements and capital leases are amortized based on the lesser of either the asset’s estimated useful life or the remaining expected lease term.
(C) Construction in process represents assets that are not in service as of the balance sheet date.
Depreciation expense for fiscal years
2016
,
2015
and
2014
was
$124 million
,
$143 million
and
$164 million
, respectively.
Accumulated amortization of leasehold improvements and capital leases was
$155 million
and
$140 million
as of
January 31, 2016
and
January 25, 2015
, respectively. Amortization of leasehold improvements and capital leases is included in depreciation and amortization expense.
74
NVIDIA CORPORATION AND SUBSIDIARIES
NOTES TO THE CONSOLIDATED FINANCIAL STATEMENTS
(Continued)
|
|
January 31,
2016 |
January 25,
2015 |
|||||
|
(In millions)
|
|||||||
|
Accrued Liabilities:
|
|||||||
|
Deferred revenue
|
$
|
322
|
|
$
|
296
|
|
|
|
Customer related liabilities (1)
|
160
|
|
143
|
|
|||
|
Accrued payroll and related expenses
|
79
|
|
112
|
|
|||
|
Accrued restructuring and other charges (2)
|
23
|
|
—
|
|
|||
|
Professional service fees
|
23
|
|
17
|
|
|||
|
Warranty accrual (3)
|
11
|
|
8
|
|
|||
|
Coupon interest on Notes
|
3
|
|
3
|
|
|||
|
Taxes payable, short- term
|
2
|
|
3
|
|
|||
|
Facilities related liabilities
|
1
|
|
8
|
|
|||
|
Other
|
18
|
|
13
|
|
|||
|
Total accrued liabilities and other
|
$
|
642
|
|
$
|
603
|
|
|
(1) Customer related liabilities primarily includes accrued customer programs, such as rebates and MDFs.
(2) Please refer to Note 17 of these Notes to the Consolidated Financial Statements for a discussion regarding restructuring and other charges.
(3) Please refer to Note 10 of these Notes to the Consolidated Financial Statements for a discussion regarding warranties.
|
|
January 31,
2016 |
January 25,
2015 |
|||||
|
(In millions)
|
|||||||
|
Other Long Term Liabilities:
|
|||||||
|
Deferred income tax liability
|
$
|
301
|
|
$
|
232
|
|
|
|
Income tax payable
|
78
|
|
121
|
|
|||
|
Deferred revenue (1)
|
44
|
|
108
|
|
|||
|
Interest rate swap (2)
|
7
|
|
—
|
|
|||
|
Asset retirement obligations
|
1
|
|
7
|
|
|||
|
Other
|
22
|
|
21
|
|
|||
|
Total other long-term liabilities
|
$
|
453
|
|
$
|
489
|
|
|
(1)
Consists primarily of consideration received in advance of our performance obligations under the patent cross licensing agreement that we entered into with Intel Corporation in January 2011. The decrease in deferred revenue, long-term, is a result of revenue recognized during fiscal year 2016.
(2) Please refer to Note 9 of these Notes to the Consolidated Financial Statements for a discussion regarding our interest rate swap.
75
NVIDIA CORPORATION AND SUBSIDIARIES
NOTES TO THE CONSOLIDATED FINANCIAL STATEMENTS
(Continued)
In August 2015, we entered into an interest rate swap for a portion of the operating lease financing arrangement for our new headquarters building, which entitles us to pay amounts based on a fixed interest rate in exchange for receipt of amounts based on variable interest rates. The objective of this interest rate swap is to mitigate variability in the benchmark interest rate on the first $200 million of existing operating lease financing payments.
This interest rate swap, designated as a cash flow hedge, will have settlements beginning in the second quarter of fiscal year 2019, and will terminate in the fourth quarter of fiscal year 2023. Gains or losses on this swap are currently recorded in accumulated other comprehensive income (loss) and will subsequently be recorded in earnings at the point when the related operating lease financing expense begins to affect earnings or if ineffectiveness of the swap should occur. As of January 31, 2016, accumulated other comprehensive income (loss) includes a
$7 million
loss due to the decrease in fair value of the interest rate swap.
A summary of the notional amount and fair value of the interest rate swap recorded on the Consolidated Balance Sheets at
January 31, 2016
and January 25, 2015 is as follows (in millions):
|
Notional Amount
|
Fair Value Asset (Liability)
|
||||||||||||||
|
January 31, 2016
|
January 25, 2015
|
January 31, 2016
|
January 25, 2015
|
||||||||||||
|
Cash Flow Hedge
|
|||||||||||||||
|
Interest rate swap
|
$
|
200
|
|
$
|
—
|
|
$
|
(7
|
)
|
$
|
—
|
|
|||
We formally assess, both at inception and on an ongoing basis, whether the interest rate swap is highly effective. For the year ended
January 31, 2016
, the interest rate swap was determined to be highly effective and there were no gains or losses associated with ineffectiveness.
The effect of the interest rate swap on other comprehensive income (loss), net of tax, is as follows (in millions):
|
January 31, 2016
|
January 25, 2015
|
||||||
|
Cash Flow Hedge
|
|
|
|
||||
|
Gain (loss) on interest rate swap
|
$
|
(4
|
)
|
$
|
—
|
|
|
Over the next twelve months, we do not expect to reclassify any amount from accumulated other comprehensive income (loss) to income as the underlying operating lease financing payments for our new headquarters building will not start within the next twelve months.
76
NVIDIA CORPORATION AND SUBSIDIARIES
NOTES TO THE CONSOLIDATED FINANCIAL STATEMENTS
(Continued)
Note 10
- Guarantees
U.S. GAAP requires that upon issuance of a guarantee, the guarantor must recognize a liability for the fair value of the obligation it assumes under that guarantee. In addition, U.S. GAAP requires disclosures about the guarantees that an entity has issued, including a tabular reconciliation of the changes of the entity’s product warranty liabilities.
Accrual for Product Warranty Liabilities
We record a reduction to revenue for estimated product returns at the time revenue is recognized primarily based on historical return rates. Cost of revenue includes the estimated cost of product warranties. Under limited circumstances, we may offer an extended limited warranty to customers for certain products. Additionally, we accrue for known warranty and indemnification issues if a loss is probable and can be reasonably estimated.
On July 31, 2015, we announced a voluntary recall and replacement of our SHIELD 8-inch tablets that were sold between July 2014 and July 2015. We had determined that the battery in these tablets can overheat, posing a fire hazard. The recall did not affect any other NVIDIA products. During fiscal year 2016, we recorded a
$26 million
charge against cost of revenue to cover anticipated customer warranty, repair, return, replacement and other associated costs.
The estimated product returns and estimated product warranty liabilities for fiscal years
2016
,
2015
and
2014
are as follows:
|
|
January 31,
2016 |
January 25,
2015 |
January 26,
2014 |
||||||||
|
|
(In millions)
|
||||||||||
|
Balance at beginning of period
|
$
|
8
|
|
$
|
8
|
|
$
|
15
|
|
||
|
Additions
|
27
|
|
5
|
|
7
|
|
|||||
|
Deductions
|
(24
|
)
|
(5
|
)
|
(14
|
)
|
|||||
|
Balance at end of period
|
$
|
11
|
|
$
|
8
|
|
$
|
8
|
|
||
In connection with certain agreements that we have executed in the past, we have at times provided indemnities to cover the indemnified party for matters such as tax, product and employee liabilities. We have also on occasion included intellectual property indemnification provisions in our technology related agreements with third parties. Maximum potential future payments cannot be estimated because many of these agreements do not have a maximum stated liability. As such, we have not recorded any liability in our Consolidated Financial Statements for such indemnifications.
77
NVIDIA CORPORATION AND SUBSIDIARIES
NOTES TO THE CONSOLIDATED FINANCIAL STATEMENTS
(Continued)
Note 11
- Convertible Debt
1.00 % Convertible Senior Notes Due 2018
On December 2, 2013, we issued
$1.50 billion
in Notes. The Notes are unsecured, unsubordinated obligations of the Company, which pay interest in cash semi-annually at a rate of 1.00% per annum. The Notes will mature on December 1, 2018 unless repurchased or converted prior to such date. The Notes were initially convertible at a rate of
49.5958
shares of common stock per
$1,000
principal amount of Notes (equivalent to an initial conversion price of
$20.1630
per share of common stock). The conversion rate and conversion price are adjusted upon the occurrence of certain events, including our cash dividends or distributions exceeding
$0.085
per share. Accordingly, as of January 31, 2016, the initial conversion rate has been adjusted to
49.7009
shares of common stock per
$1,000
principal amount of Notes (equivalent to an adjusted conversion price of
$20.1204
per share of common stock) for dividend increases made to that date.
Holders may convert all or any portion of their Notes at their option at any time prior to August 1, 2018 only under the following circumstances:
(1) during any fiscal quarter (and only during such fiscal quarter), if the last reported sale price of the common stock for at least 20 trading days (whether or not consecutive) during a period of 30 consecutive trading days ending on the last trading day of the immediately preceding fiscal quarter is greater than or equal to 130% of the conversion price on each applicable trading day; (2) during the five business day period after any five consecutive trading day period (the measurement period) in which the trading price per $1,000 principal amount of notes for each trading day of the measurement period was less than 98% of the product of the last reported sale price of our common stock and the conversion rate on each such trading day; or (3) upon the occurrence of specified corporate events. On or after August 1, 2018 to the close of business on the second scheduled trading day immediately preceding the maturity date, holders may convert all or any portion of their Notes regardless of the foregoing conditions.
The price of our common stock was greater than or equal to
130%
of the conversion price for at least 20 trading days during the 30 consecutive trading days ending on the last trading day of our fiscal quarter ended January 31, 2016. Therefore, as of January 31, 2016, the conversion threshold had been met and the Notes became convertible at the holders’ option beginning on February 1, 2016 and ending May 1, 2016. As such, the
$1.41 billion
carrying value of the Notes was classified as a current liability and the
$87 million
difference between the principal amount and the carrying value of the Notes was reclassified from shareholders’ equity to convertible debt conversion obligation in the mezzanine equity section of our Consolidated Balance Sheet as of January 31, 2016, and will remain there for as long as the Notes are convertible. The determination of whether or not the Notes are convertible must continue to be performed on a quarterly basis. Consequently, the Notes may be reclassified as long-term debt and the convertible debt conversion obligation may be reclassified within shareholders' equity if the conversion threshold is not met in future quarters.
If the notes are converted, we will pay cash up to the aggregate principal amount of the Notes. We may pay or deliver cash, shares of our common stock or a combination of cash and shares of our common stock, at our election, in respect of the remainder, if any, of our conversion obligation in excess of the aggregate principal amount of the Notes being converted. Based on the
$29.29
closing price of our common stock on January 29, 2016, the last trading day of fiscal year 2016, the if-converted value of our Notes exceeded their principal amount by approximately
$684 million
.
Concurrently with the issuance of the Notes, we entered into a convertible note hedge transaction, or the Note Hedges, structured to offset the potential common stock dilution, and/or offset potential cash payments to settle our excess conversion obligation. Cash-settled convertible debt is separated into debt and equity components at issuance and is assigned a fair value. The value assigned to the debt component is the estimated fair value, as of the issuance date, of a similar debt without the conversion feature. The difference between the net cash proceeds and this estimated fair value, represents the value assigned to the equity component and is recorded as a debt discount. The debt discount is amortized using the effective interest method from the origination date through its stated contractual maturity date.
78
NVIDIA CORPORATION AND SUBSIDIARIES
NOTES TO THE CONSOLIDATED FINANCIAL STATEMENTS
(Continued)
The initial debt component of the Notes was valued at
$1.35 billion
based on the contractual cash flows discounted at an appropriate market rate for a non-convertible debt at the date of issuance, which was determined to be
3.15%
. The carrying value of the permanent equity component reported in additional paid-in-capital was valued at
$126 million
and recorded as a debt discount. This amount, together with the
$23 million
purchaser's discount to the par value of the Notes, represents the total unamortized debt discount of
$148 million
we recorded at the time of issuance of the Notes. The aggregate debt discount is amortized as interest expense over the contractual term of the Notes using the effective interest method using an interest rate of
3.15%
. As of January 31, 2016, after reclassifying
$87 million
from the shareholders’ equity section of our Consolidated Balance Sheet to convertible debt conversion obligation in the mezzanine equity section of our Consolidated Balance Sheet, the remaining carrying value of the equity component in the shareholders’ equity section of our Consolidated Balance Sheet was
$39 million
.
The following table presents the carrying amounts of the liability and equity components:
|
January 31, 2016
|
January 25, 2015
|
||||||
|
(In millions)
|
|||||||
|
Amount of the equity component
|
$
|
39
|
|
$
|
126
|
|
|
|
1.00% Convertible Senior Notes Due 2018
|
$
|
1,500
|
|
$
|
1,500
|
|
|
|
Unamortized debt discount (1)
|
(87
|
)
|
(116
|
)
|
|||
|
Net carrying amount
|
$
|
1,413
|
|
$
|
1,384
|
|
|
(1) As of
January 31, 2016
, the remaining period over which the unamortized debt discount will be amortized is
2.8
years.
The following table presents the interest expense for the contractual interest and the accretion of debt discount:
|
Year Ended
|
|||||||||||
|
January 31, 2016
|
January 25, 2015
|
January 26, 2014
|
|||||||||
|
(In millions)
|
|||||||||||
|
Contractual coupon interest expense
|
$
|
15
|
|
$
|
15
|
|
$
|
2
|
|
||
|
Amortization of debt discount
|
29
|
|
28
|
|
5
|
|
|||||
|
Total interest expense related to Notes
|
$
|
44
|
|
$
|
43
|
|
$
|
7
|
|
||
Note Hedges and Warrants
The net proceeds from the Notes were approximately
$1.48 billion
after payment of the initial purchaser's discount. Concurrently with the offering of the Notes, we entered into Note Hedges with a strike price equal to the initial conversion price of the Notes, or
$20.1630
per share. Adjusting for dividends paid through January 31, 2016, the conversion price of the Notes has been adjusted to
$20.1204
per share. The Note Hedges allow us to receive shares of our common stock and/or cash related to the excess conversion value that we would deliver and/or pay, respectively, to the holders of the Notes upon conversion. We paid
$167 million
for the Note Hedges.
In addition, concurrent with the offering of the Notes and the purchase of the Note Hedges, we entered into a separate warrant transaction, or the Warrants, with an initial strike price to the holders of the Warrants of
$27.1425
per share. Under the terms of the Warrants, the strike price is adjusted upon the occurrence of certain events, including our cash dividends or distributions that deviate from
$0.085
per share. Accordingly, as of January 31, 2016, the strike price was adjusted to
$27.0851
per share, reflecting adjustments for our dividend increases made to that date. The Warrants are net share settled and cover, subject to customary antidilution adjustments,
74 million
shares of our common stock. We received
$59 million
for the Warrants transaction.
The
$108 million
net cost of the Note Hedges offset by the proceeds from the Warrants was included as a net reduction to additional paid-in capital in the shareholders’ equity section of our Consolidated Balance Sheets.
79
NVIDIA CORPORATION AND SUBSIDIARIES
NOTES TO THE CONSOLIDATED FINANCIAL STATEMENTS
(Continued)
Note 12
- Commitments and Contingencies
Inventory Purchase Obligations
As of
January 31, 2016
, we had outstanding inventory purchase obligations totaling
$391 million
.
Capital Purchase Obligations
As of
January 31, 2016
, we had outstanding capital purchase obligations totaling
$36 million
.
Lease Obligations
Our headquarters complex is located in Santa Clara, California and includes eight buildings that are leased properties. Future minimum lease payments related to headquarters operating leases total
$69 million
over the remaining terms of the leases, including predetermined rent escalations, and are included in the future minimum lease payment schedule below.
In addition to the commitment of our headquarters, we have other domestic and international office facilities under operating leases expiring through fiscal year 2026. We also include non-cancelable obligations under certain software licensing arrangements as operating leases.
Future minimum lease payments under our non-cancelable operating leases as of
January 31, 2016
, are as follows:
|
|
Future Minimum Lease Obligations
|
||
|
|
(In millions)
|
||
|
Fiscal Year:
|
|
||
|
2017
|
$
|
75
|
|
|
2018
|
65
|
|
|
|
2019
|
58
|
|
|
|
2020
|
35
|
|
|
|
2021
|
11
|
|
|
|
2022 and thereafter
|
20
|
|
|
|
Total
|
$
|
264
|
|
Rent expense for the years ended
January 31, 2016
,
January 25, 2015
and
January 26, 2014
was
$45 million
,
$47 million
and
$44 million
, respectively.
80
NVIDIA CORPORATION AND SUBSIDIARIES
NOTES TO THE CONSOLIDATED FINANCIAL STATEMENTS
(Continued)
Capital lease obligations include building and office equipment lease obligations. The building lease relates to our datacenter in Santa Clara, California. Future minimum lease payments under the building capital lease total
$17 million
over the remaining lease term, including predetermined rent escalations, and are included in the future minimum lease payment schedule below:
|
|
Future Capital Lease Obligations
|
||
|
|
(In millions)
|
||
|
Fiscal Year:
|
|
|
|
|
2017
|
$
|
5
|
|
|
2018
|
6
|
|
|
|
2019
|
6
|
|
|
|
Total
|
$
|
17
|
|
|
Present value of minimum lease payments
|
$
|
14
|
|
|
|
|
||
|
Current portion
|
$
|
4
|
|
|
Long-term portion
|
$
|
10
|
|
Operating Lease Financing Arrangement
In fiscal year 2016, we began to construct a new headquarters building in Santa Clara, California, which is currently targeted for completion in the fourth quarter of fiscal year 2018. We are financing this construction under an off-balance sheet, build-to-suit operating lease arrangement. As a part of this arrangement, we leased the real property we own where the building will be constructed under a
99
year ground lease to a syndicate of banks and concurrently leased back the building under a real property lease.
Under the real property lease, we pay rent, taxes, maintenance costs, utilities, insurance and other property related costs. The lease has an initial
7.5
year term expiring on December 19, 2022, consisting of an approximately
2.5
year construction period followed by a
5
year lease term. We have the option to renew this lease for up to
three
additional
5
year periods, subject to approval by the banks.
We will oversee the construction of the headquarters building. The banks have committed to fund up to
$380 million
of costs relating to construction. Advances will be made periodically to reimburse us for construction costs we incur. Once construction is complete, the lease balance will remain static at the completed cost for the remaining duration of the lease term. During construction, accrued interest will be capitalized into the lease balance. Following construction, we will pay rent in the form of interest. We have guaranteed the obligations under the lease held by our subsidiary.
During the term of the lease, we may elect to purchase the headquarters building for the amount of the banks’ investment in the building and any accrued but unpaid rent. At the end of the lease term, we may elect to buy the building for the outstanding balance on the maturity date or arrange for the cash sale of the building to an unaffiliated third party. The aggregate guarantee made by us under the lease is no more than
87.5%
of the costs incurred in connection with the construction of the building. However, under certain default circumstances, the lease guarantee may be 100% of the banks’ investment in the building plus any and all accrued but unpaid interest and all other rent due and payable under the operative agreements.
The operative agreements are subject to customary default provisions, including, for example, those relating to payment and performance defaults, and events of bankruptcy. We are also subject to financial covenants including a covenant to maintain a maximum total leverage ratio not to exceed
3.0
to
1.0
and a minimum interest coverage ratio in excess of
3.5
to
1.0
during the term. If certain events of default occur and are continuing under the operative agreements, the banks may accelerate repayment of their investment under the lease.
81
NVIDIA CORPORATION AND SUBSIDIARIES
NOTES TO THE CONSOLIDATED FINANCIAL STATEMENTS
(Continued)
Litigation
Patent Infringement Cases
On September 4, 2014, NVIDIA filed complaints against Qualcomm, Inc., or Qualcomm, and various Samsung entities in both the United States International Trade Commission, or ITC, and the United States District Court for the District of Delaware alleging infringement of seven patents relating to graphics processing. In the ITC action, NVIDIA seeks to exclude importation of Samsung Galaxy mobile phones and tablets and other consumer electronics and display devices containing Qualcomm’s Adreno, ARM’s Mali or Imagination’s PowerVR graphics architectures, or the Accused Products. On October 6, 2014, the ITC instituted an investigation of NVIDIA’s claim. In June 2015, NVIDIA moved to terminate all asserted claims on four patents and these motions were granted. The ITC held an evidentiary hearing on certain asserted claims of the three remaining patents from June 22 through June 26, 2015. On October 9, 2015, the ITC Administrative Law Judge, or ALJ, rendered an initial determination that importation of the Samsung Accused Products did not violate U.S. law. NVIDIA petitioned for review of the ALJ’s determination and Samsung and Qualcomm filed contingent petitions for review of the ALJ’s determination. On December 14, 2015, the ITC decided not to review the ALJ’s determination and terminated the Investigation. On February 11, 2016, NVIDIA petitioned the United States Court of Appeals for the Federal Circuit to review the ITC’s decision not to review the ALJ’s determination. The petition is currently pending.
In the Delaware action, NVIDIA seeks unspecified damages for Samsung and Qualcomm’s alleged patent infringement. On October 22, 2014, Samsung and Qualcomm exercised their statutory right to stay the Delaware proceedings in light of the pending ITC action and the court granted the motion to stay on October 23, 2014.
On November 10, 2014, Samsung filed a complaint against NVIDIA and Velocity Micro, Inc., in the United States District Court for the Eastern District of Virginia, alleging that NVIDIA infringed six patents and falsely advertised that the Tegra K1 processor is the world’s fastest mobile processor. Samsung amended its complaint twice, first on December 19, 2014, and then on April 10, 2015, without changing its legal claims. Samsung seeks monetary damages and certain injunctive relief as to some of the asserted patents. NVIDIA answered the second amended complaint on April 16, 2015, and asserted counter-claims against Samsung for infringing four of NVIDIA’s patents and for non-infringement and invalidity of the six patents asserted in Samsung’s second amended complaint. On April 24, 2015, Samsung moved to sever NVIDIA’s counter-claims for patent infringement and its motion was granted on May 19, 2015. NVIDIA voluntarily withdrew its counter-claims on May 19, 2015. On June 17, 2015, Velocity Micro, Inc. voluntarily agreed to a permanent injunction regarding two of the asserted patents and those patents were dismissed from the case with prejudice. Samsung’s false advertising claim was dismissed with prejudice on July 30, 2015. On October 15, 2015, NVIDIA’s Motion for Entry of Judgment of Noninfringement was granted as to one of Samsung’s patents. On January 6, 2016, the Court dismissed plaintiff Samsung Electronics America, Inc. due to lack of subject matter jurisdiction. On January 20, 2016, the Court dismissed with prejudice defendants Old Micro, Inc. and Velocity Holdings, LLC. On January 26, 2016, the Court dismissed with prejudice Samsung’s infringement claims as to one of the four remaining patents. Beginning January 26, 2016, a jury trial was held regarding Samsung’s patent infringement claims as to the three remaining patents. On February 1, 2016, the Court declared a mistrial as to two of the three remaining patents as a sanction based on Samsung’s failure to comply with its obligation to produce all materials its experts relied on in forming the experts’ opinions in the case. The trial continued as to the last patent. On February 5, 2016, the jury returned a verdict of non-infringement of that patent, that one of the four claims of that patent was invalid, and that Samsung was not entitled to any damages. The re-trial of Samsung’s infringement claims on the two remaining patents is scheduled to begin May 4, 2016.
82
NVIDIA CORPORATION AND SUBSIDIARIES
NOTES TO THE CONSOLIDATED FINANCIAL STATEMENTS
(Continued)
On November 23, 2014, Samsung filed a complaint against NVIDIA, among others, in the ITC claiming infringement of four United States patents and seeking exclusion and cease and desist orders barring importation of NVIDIA products alleged to infringe Samsung’s patents. On December 23, 2014, the ITC instituted an investigation of Samsung’s claims. On June 5, 2015, Samsung withdrew one patent from the case. A hearing on Samsung’s three remaining patents was held from August 18 through August 21, 2015. On December 22, 2015, the ALJ issued an Initial Determination, or ID, finding that NVIDIA and the other Respondents infringed the asserted claims of the three remaining asserted patents and had violated Section 337. On January 4, 2016, NVIDIA and the other Respondents filed a Petition for Review of the ALJ’s ID seeking review and reversal of his findings that the asserted claims were valid and infringed and that Section 337 had been violated. On January 4, 2016, the Office of Unfair Import Investigations also filed a Petition for Review of the ALJ’s ID seeking review and reversal of his findings that the asserted claims of one of the patents were valid and infringed and that Section 337 had been violated as to that patent. On February 24, 2016, the ITC determined to review in part the ALJ’s ID and asked for further briefing from the parties as to certain issues and patents. As the ITC did not seek to review the findings of infringement and validity of all three patents, the ITC may issue a limited exclusion order and a cease and desist order under one or more of the patents. The innovations claimed in these patents are minor and insignificant to the performance of our products. Based on our plans to modify certain impacted products and certain distribution operations in the United States, we do not believe that the possible entry of these orders will have a significant impact to our business. The target date for the final determination by the ITC is April 25, 2016, followed by the Presidential Review Period ending June 24, 2016.
NVIDIA and Samsung have also challenged the validity of certain of each other’s patents through inter partes review before the United States Patent and Trademark Office. NVIDIA has filed eleven requests for inter partes review on eight of Samsung’s asserted patents. Samsung has filed six requests for inter partes review on six patents asserted by NVIDIA, and Qualcomm has filed three additional requests for inter partes review on two patents asserted by NVIDIA. The United States Patent and Trademark Office has, to date, decided to review four patents owned by NVIDIA, and five patents owned by Samsung. The Patent and Trademark Office has declined to review two patents owned by Samsung. All other requests are currently pending.
On December 21, 2015, Advanced Silicon Technologies LLC filed a complaint in the United States District Court for the District of Delaware alleging infringement of four patents relating to graphics processing and memory management. Advanced Silicon Technologies seeks monetary damages. On February 22, 2016, the Court granted NVIDIA’s unopposed motion to stay that lawsuit pending final resolution of Advanced Silicon Technologies’ parallel lawsuit in the ITC. On December 28, 2015, Advanced Silicon Technologies LLC filed a complaint in the ITC asserting the same four patents and seeking an exclusion order barring importation of NVIDIA products alleged to infringe those patents. On January 29, 2016, the ITC instituted an investigation of Advanced Silicon Technologies’ claims. NVIDIA responded to the ITC complaint on February 25, 2016. A hearing is scheduled for October 3 through October 7, 2016. An initial determination from the ITC ALJ is due February 2, 2017, and the target date for the final determination by the ITC is June 2, 2017.
Accounting for Loss Contingencies
While there can be no assurance of favorable outcomes, we believe the claims made by other parties in the above ongoing matters are without merit and we intend to vigorously defend the actions. As of January 31, 2016, we have not recorded any accrual for contingent liabilities associated with the legal proceedings described above based on our belief that liabilities, while possible, are not probable. Further, any possible range of loss in these matters cannot be reasonably estimated at this time. We are engaged in other legal actions not described above arising in the ordinary course of its business and, while there can be no assurance of favorable outcomes, we believe that the ultimate outcome of these actions will not have a material adverse effect on our operating results, liquidity or financial position.
83
NVIDIA CORPORATION AND SUBSIDIARIES
NOTES TO THE CONSOLIDATED FINANCIAL STATEMENTS
(Continued)
Note 13
- Income Taxes
The income tax expense applicable to income before income taxes consists of the following:
|
|
Year Ended
|
||||||||||
|
|
January 31,
2016 |
January 25,
2015 |
January 26,
2014 |
||||||||
|
|
(In millions)
|
||||||||||
|
Current income taxes:
|
|
|
|
||||||||
|
Federal
|
$
|
(43
|
)
|
$
|
8
|
|
$
|
8
|
|
||
|
State
|
1
|
|
1
|
|
1
|
|
|||||
|
Foreign
|
25
|
|
17
|
|
19
|
|
|||||
|
Total current
|
(17
|
)
|
26
|
|
28
|
|
|||||
|
Deferred taxes:
|
|
|
|
||||||||
|
Federal
|
134
|
|
84
|
|
17
|
|
|||||
|
State
|
—
|
|
—
|
|
—
|
|
|||||
|
Foreign
|
—
|
|
(1
|
)
|
(2
|
)
|
|||||
|
Total deferred
|
134
|
|
83
|
|
15
|
|
|||||
|
Charge in lieu of taxes attributable to employer stock option plans
|
12
|
|
15
|
|
27
|
|
|||||
|
Income tax expense
|
$
|
129
|
|
$
|
124
|
|
$
|
70
|
|
||
Income before income tax consists of the following:
|
|
Year Ended
|
||||||||||
|
|
January 31,
2016 |
January 25,
2015 |
January 26,
2014 |
||||||||
|
|
(In millions)
|
||||||||||
|
Domestic
|
$
|
129
|
|
$
|
174
|
|
$
|
79
|
|
||
|
Foreign
|
614
|
|
581
|
|
431
|
|
|||||
|
Income before income tax
|
$
|
743
|
|
$
|
755
|
|
$
|
510
|
|
||
The income tax expense differs from the amount computed by applying the federal statutory income tax rate of
35%
to income before income taxes as follows:
|
|
Year Ended
|
||||||||||
|
|
January 31,
2016 |
January 25,
2015 |
January 26,
2014 |
||||||||
|
|
(In millions)
|
||||||||||
|
Tax expense computed at federal statutory rate
|
$
|
260
|
|
$
|
264
|
|
$
|
178
|
|
||
|
State income taxes, net of federal tax effect
|
1
|
|
1
|
|
2
|
|
|||||
|
Foreign tax rate differential
|
(95
|
)
|
(120
|
)
|
(94
|
)
|
|||||
|
U.S. federal R&D tax credit
|
(38
|
)
|
(34
|
)
|
(30
|
)
|
|||||
|
Stock-based compensation
|
13
|
|
4
|
|
9
|
|
|||||
|
Tax expense related to intercompany transaction
|
10
|
|
10
|
|
10
|
|
|||||
|
Restructuring and expiration of statute of limitations
|
(21
|
)
|
—
|
|
—
|
|
|||||
|
Other
|
(1
|
)
|
(1
|
)
|
(5
|
)
|
|||||
|
Income tax expense
|
$
|
129
|
|
$
|
124
|
|
$
|
70
|
|
||
84
NVIDIA CORPORATION AND SUBSIDIARIES
NOTES TO THE CONSOLIDATED FINANCIAL STATEMENTS
(Continued)
The tax effect of temporary differences that gives rise to significant portions of the deferred tax assets and liabilities are presented below:
|
|
January 31,
2016 |
January 25,
2015 |
|||||
|
|
(In millions)
|
||||||
|
Deferred tax assets:
|
|
||||||
|
Net operating loss carryforwards
|
$
|
57
|
|
$
|
72
|
|
|
|
Accruals and reserves, not currently deductible for tax purposes
|
58
|
|
109
|
|
|||
|
Property, equipment and intangible assets
|
50
|
|
46
|
|
|||
|
Research and other tax credit carryforwards
|
404
|
|
351
|
|
|||
|
Stock-based compensation
|
29
|
|
30
|
|
|||
|
Convertible debt
|
9
|
|
12
|
|
|||
|
Gross deferred tax assets
|
607
|
|
620
|
|
|||
|
Less valuation allowance
|
(272
|
)
|
(261
|
)
|
|||
|
Total deferred tax assets
|
335
|
|
359
|
|
|||
|
Deferred tax liabilities:
|
|
|
|||||
|
Acquired intangibles
|
(17
|
)
|
(25
|
)
|
|||
|
Unremitted earnings of foreign subsidiaries
|
(615
|
)
|
(500
|
)
|
|||
|
Gross deferred tax liabilities
|
(632
|
)
|
(525
|
)
|
|||
|
Net deferred tax liability
|
$
|
(297
|
)
|
$
|
(166
|
)
|
|
We recognized income tax expense of
$129 million
,
$124 million
and
$70 million
during fiscal years 2016, 2015, and 2014, respectively. Our annual effective tax rate, was
17.3%
in fiscal year 2016,
16.5%
in fiscal year 2015 and
13.8%
in fiscal year 2014. The difference in the effective tax rates amongst the three years was primarily due to an increase in the amount of earnings subject to United States tax in fiscal years 2016 and 2015, partially offset by a net income tax benefit related to the Icera modem restructuring in fiscal year 2016, and a higher percentage of research tax credit benefit in fiscal year 2014.
Our effective tax rate for each of the fiscal years was lower than the U.S. federal statutory rate of
35%
due primarily to income earned in jurisdictions, including British Virgin Islands, Hong Kong, China, Taiwan and United Kingdom, where the tax rate is lower than the United States federal statutory tax rate of
35%
, favorable recognition in these fiscal years of the U.S. federal research tax credit and favorable discrete events primarily attributable to the tax benefit recognized upon the expiration of the applicable statutes of limitations.
As of January 31, 2016 and January 25, 2015 we had a valuation allowance of
$272 million
and
$261 million
, respectively, related to state and certain foreign deferred tax assets that management determined not likely to be realized due, in part, to projections of future taxable income. To the extent realization of the deferred tax assets becomes more-likely-than-not, we would recognize such deferred tax asset as an income tax benefit during the period.
Our deferred tax assets do not include the excess tax benefit related to stock-based compensation that are a component of our federal and state net operating loss and research tax credit carryforwards in the amount of
$416 million
as of January 31, 2016. Consistent with prior years, the excess tax benefit reflected in our net operating loss and research tax credit carryforwards will be accounted for as a credit to shareholders' equity, if and when realized.
85
NVIDIA CORPORATION AND SUBSIDIARIES
NOTES TO THE CONSOLIDATED FINANCIAL STATEMENTS
(Continued)
As of January 31, 2016, we had federal, state and foreign net operating loss carryforwards of
$516 million
,
$664 million
and
$289 million
, respectively. The federal and state carryforwards will expire beginning in fiscal year 2022 and 2017, respectively. The foreign net operating loss carryforwards of
$275 million
may be carried forward indefinitely and the remainder of
$14 million
will begin to expire in fiscal year 2017. As of January 31, 2016, we had federal research tax credit carryforwards of
$476 million
that will begin to expire in fiscal year 2018. We have state research tax credit carryforwards of
$450 million
, of which
$432 million
is attributable to the State of California and may be carried over indefinitely, and
$18 million
is attributable to various other states and will expire beginning in fiscal year 2017. We have other state tax credit carryforwards of
$3 million
that will expire in fiscal year 2026 and foreign tax credit carryforwards of
$1 million
, which may be refunded in fiscal years 2017 through 2020 if not utilized. Our tax attributes, net operating loss and tax credit carryforwards, remain subject to audit and may be adjusted for changes or modification in tax laws, other authoritative interpretations thereof, or other facts and circumstances. Utilization of federal, state, and foreign net operating losses and tax credit carryforwards may also be subject to limitations due to ownership changes and other limitations provided by the Internal Revenue Code and similar state and foreign tax provisions. If any such limitations apply, the federal, states, or foreign net operating loss and tax credit carryforwards, as applicable, may expire or be denied before utilization.
As of January 31, 2016, U.S. federal and state income taxes have not been provided on approximately
$2.50 billion
of undistributed earnings of non-United States subsidiaries as such earnings are considered to be indefinitely reinvested. We have not provided the amount of unrecognized deferred tax liabilities for temporary differences related to investments in our foreign subsidiaries as the determination of such amount is not practicable.
As of January 31, 2016, we had
$230 million
of gross unrecognized tax benefits, of which
$202 million
would affect our effective tax rate if recognized. However, approximately
$50 million
of the unrecognized tax benefits were related to state income tax positions taken, that, if recognized, would be in the form of a carryforward deferred tax asset that would likely attract a full valuation allowance. The
$202 million
of unrecognized tax benefits as of January 31, 2016 consisted of
$67 million
recorded in non-current income taxes payable and
$135 million
reflected as a reduction to the related deferred tax assets.
A reconciliation of gross unrecognized tax benefits is as follows:
|
|
January 31,
2016 |
January 25,
2015 |
January 26,
2014 |
||||||||
|
|
(In millions)
|
||||||||||
|
Balance at beginning of period
|
$
|
254
|
|
$
|
238
|
|
$
|
221
|
|
||
|
Increases in tax positions for prior years
|
—
|
|
—
|
|
—
|
|
|||||
|
Decreases in tax positions for prior years
|
(1
|
)
|
(1
|
)
|
(1
|
)
|
|||||
|
Increases in tax positions for current year
|
28
|
|
23
|
|
23
|
|
|||||
|
Lapse in statute of limitations
|
(51
|
)
|
(6
|
)
|
(5
|
)
|
|||||
|
Balance at end of period
|
$
|
230
|
|
$
|
254
|
|
$
|
238
|
|
||
We classify an unrecognized tax benefit as a current liability, or amount refundable, to the extent that we anticipate payment or receipt of cash for income taxes within one year. The amount is classified as a long-term liability, or reduction of long-term deferred tax assets or amount refundable, if we anticipate payment or receipt of cash for income taxes during a period beyond a year.
Our policy is to include interest and penalties related to unrecognized tax benefits as a component of income tax expense. As of January 31, 2016, January 25, 2015, and January 26, 2014, we had accrued
$11 million
,
$14 million
, and
$13 million
, respectively, for the payment of interest and penalties related to unrecognized tax benefits, which is not included as a component of our unrecognized tax benefits. As of January 31, 2016, non-current income taxes payable of
$78 million
consisted of unrecognized tax benefits of
$67 million
and the related interest and penalties of
$11 million
.
While we believe that we have adequately provided for all tax positions, amounts asserted by tax authorities could be greater or less than our accrued position. Accordingly, our provisions on federal, state and foreign tax-related matters to be recorded in the future may change as revised estimates are made or the underlying matters are settled or otherwise resolved. As of January 31, 2016, we do not believe that our estimates, as otherwise provided for, on such tax positions will significantly increase or decrease within the next twelve months.
86
NVIDIA CORPORATION AND SUBSIDIARIES
NOTES TO THE CONSOLIDATED FINANCIAL STATEMENTS
(Continued)
We are subject to taxation by a number of taxing authorities both in the United States and throughout the world. As of January 31, 2016, the material tax jurisdictions that may be subject to examination include the United States, Taiwan, Canada, China, Germany, Hong Kong, France, Japan, and India for fiscal years 2003 through 2015. As of January 31, 2016, the material tax jurisdictions for which we are currently under examination include the state of California for fiscal years 2011 through 2012, and India, Taiwan, France and Germany for fiscal years 2003 through 2015.
Note 14
- Shareholders’ Equity
Share Repurchase Program
Beginning August 2004, our Board of Directors authorized us, subject to certain specifications, to repurchase shares of our common stock. In May 2015, the Board extended the previously authorized repurchase program through December 2018 and authorized an additional
$1.62 billion
under the repurchase program.
During fiscal year 2016, we repurchased a total of
25 million
shares for
$587 million
and paid
$213 million
in cash dividends to our shareholders, equivalent to
$0.085
per share for the three months ended April 26, 2015,
$0.0975
per share for the
six
months ended October 25, 2015, and $
0.115
per share for the three months ended January 31, 2016. As a result, we returned
$800 million
to shareholders during fiscal year 2016 in the form of share repurchases and dividend payments.
Through January 31, 2016, we have repurchased an aggregate of
231 million
shares under our share repurchase program for a total of
$3.85 billion
. All shares delivered from these repurchases have been placed into treasury stock. As of January 31, 2016, we were authorized, subject to certain specifications, to repurchase additional shares of our common stock up to
$1.47 billion
.
We intend to return approximately
$1.00 billion
to our shareholders in fiscal year 2017 through a combination of share repurchases and cash dividends. We also declared on February 17, 2016 that we would pay our next quarterly cash dividend of
$0.115
per share on March 23, 2016, to all shareholders of record on March 2, 2016.
In addition to our Board authorized share repurchases, we withhold common stock shares associated with net share settlements to cover tax withholding obligations upon the vesting of RSU and PSU awards under our equity incentive program. During fiscal year 2016, we withheld approximately
3 million
shares at a total cost of
$66 million
through net share settlements. Please refer to
Note 2
of these Notes to the Consolidated Financial Statements for further information regarding stock-based compensation related to equity awards granted under our equity incentive programs.
Convertible Preferred Stock
As of
January 31, 2016
and
January 25, 2015
, there were no shares of preferred stock outstanding.
Common
Stock
We are authorized to issue up to
2.00 billion
shares of our common stock at
$0.001
per share par value.
87
NVIDIA CORPORATION AND SUBSIDIARIES
NOTES TO THE CONSOLIDATED FINANCIAL STATEMENTS
(Continued)
We have a 401(k) retirement plan covering substantially all of our United States employees. Under the plan, participating employees may defer up to
100%
of their pre-tax earnings, subject to the Internal Revenue Service annual contribution limits. Effective January 2013, we began matching a portion of the employee contributions. Our contribution expense in fiscal years 2016, 2015 and 2014 was
$8 million
,
$6 million
and
$5 million
, respectively. We also have defined contribution retirement plans outside of the United States to which we contributed
$21 million
,
$20 million
and
$16 million
for fiscal years 2016, 2015 and 2014, respectively.
Note 16
- Segment Information
Our Chief Executive Officer, who is considered to be our chief operating decision maker, or CODM, reviews financial information presented on an operating segment basis for purposes of making operating decisions and assessing financial performance. Our operating segments are equivalent to our reportable segments.
We report our business in two primary reportable segments - the GPU business and the Tegra Processor business - based on a single underlying graphics architecture.
Our GPU product brands are aimed at specialized markets include GeForce for gamers; Quadro for designers; Tesla for researchers and analysts focused on artificial intelligence, deep learning and big-data; and GRID for cloud-based visual computing users. We also integrate our GPUs into powerful mobile system-on-a-chip (SOC) processors, which drive supercomputing capabilities for tablets and online gaming and entertainment devices, as well as autonomous robots, drones and cars. Our Tegra brand integrates an entire computer onto a single chip, incorporating GPUs and multi-core CPUs with audio, video and input/output capabilities.
We have a single unifying architecture for our GPU and Tegra Processors. This architecture unification leverages our visual computing expertise by charging the operating expenses of certain core engineering functions to the GPU business, while charging the Tegra Processor business for the incremental cost of the teams working directly for that business. In instances where the operating expenses of certain functions benefit both reportable segments, our CODM assigns 100% of those expenses to the reportable segment that benefits the most.
The “All Other” category presented below represents the revenue and expenses that our CODM does not assign to either the GPU business or the Tegra Processor business for purposes of making operating decisions or assessing financial performance. The revenue includes primarily patent licensing revenue and the expenses include corporate infrastructure and support costs, stock-based compensation costs, amortization of acquisition-related intangible assets, other acquisition-related costs, product warranty charge, restructuring and other charges, and other non-recurring charges and benefits that our CODM deems to be enterprise in nature.
88
NVIDIA CORPORATION AND SUBSIDIARIES
NOTES TO THE CONSOLIDATED FINANCIAL STATEMENTS
(Continued)
Our CODM does not review any information regarding total assets on a reportable segment basis. Reportable segments do not record intersegment revenue, and, accordingly, there is none to be reported. The accounting policies for segment reporting are the same as for NVIDIA as a whole. The table below presents details of our reportable segments and the “All Other” category.
|
|
GPU
|
Tegra Processor
|
All Other
|
Consolidated
|
|||||||||||
|
(In millions)
|
|||||||||||||||
|
Year Ended January 31, 2016:
|
|
|
|
|
|||||||||||
|
Revenue
|
$
|
4,187
|
|
$
|
559
|
|
$
|
264
|
|
$
|
5,010
|
|
|||
|
Depreciation and amortization expense
|
$
|
110
|
|
$
|
43
|
|
$
|
44
|
|
$
|
197
|
|
|||
|
Operating income (loss)
|
$
|
1,344
|
|
$
|
(239
|
)
|
$
|
(358
|
)
|
$
|
747
|
|
|||
|
Year Ended January 25, 2015:
|
|
|
|
|
|||||||||||
|
Revenue
|
$
|
3,839
|
|
$
|
579
|
|
$
|
264
|
|
$
|
4,682
|
|
|||
|
Depreciation and amortization expense
|
$
|
117
|
|
$
|
57
|
|
$
|
46
|
|
$
|
220
|
|
|||
|
Operating income (loss)
|
$
|
1,113
|
|
$
|
(254
|
)
|
$
|
(100
|
)
|
$
|
759
|
|
|||
|
Year Ended January 26, 2014:
|
|
|
|
|
|||||||||||
|
Revenue
|
$
|
3,468
|
|
$
|
398
|
|
$
|
264
|
|
$
|
4,130
|
|
|||
|
Depreciation and amortization expense
|
$
|
147
|
|
$
|
50
|
|
$
|
42
|
|
$
|
239
|
|
|||
|
Operating income (loss)
|
$
|
835
|
|
$
|
(268
|
)
|
$
|
(71
|
)
|
$
|
496
|
|
|||
|
Year Ended
|
||||||||||||
|
January 31,
2016 |
January 25,
2015 |
January 26,
2014 |
||||||||||
|
(In millions)
|
||||||||||||
|
Reconciling items included in "All Other" category:
|
||||||||||||
|
Unallocated revenue
|
$
|
264
|
|
$
|
264
|
|
$
|
264
|
|
|||
|
Unallocated cost of revenue and operating expenses
|
(244
|
)
|
(169
|
)
|
(167
|
)
|
||||||
|
Stock-based compensation
|
(204
|
)
|
(158
|
)
|
(136
|
)
|
||||||
|
Restructuring and other charges
|
(131
|
)
|
—
|
|
—
|
|
||||||
|
Acquisition-related costs
|
(22
|
)
|
(37
|
)
|
(32
|
)
|
||||||
|
Product warranty charges
|
(21
|
)
|
—
|
|
—
|
|
||||||
|
Total
|
$
|
(358
|
)
|
$
|
(100
|
)
|
$
|
(71
|
)
|
|||
Revenue by geographic region is allocated to individual countries based on the location to which the products are initially billed even if our customers’ revenue is attributable to end customers that are located in a different location. The following table summarizes information pertaining to our revenue from customers based on the invoicing address by geographic regions:
|
|
Year Ended
|
||||||||||
|
|
January 31,
2016 |
January 25,
2015 |
January 26,
2014 |
||||||||
|
Revenue:
|
(In millions)
|
||||||||||
|
Taiwan
|
$
|
1,912
|
|
$
|
1,594
|
|
$
|
1,321
|
|
||
|
China
|
806
|
|
922
|
|
794
|
|
|||||
|
Other Asia Pacific
|
749
|
|
638
|
|
675
|
|
|||||
|
United States
|
643
|
|
791
|
|
727
|
|
|||||
|
Europe
|
482
|
|
369
|
|
295
|
|
|||||
|
Other Americas
|
418
|
|
368
|
|
318
|
|
|||||
|
Total revenue
|
$
|
5,010
|
|
$
|
4,682
|
|
$
|
4,130
|
|
||
89
NVIDIA CORPORATION AND SUBSIDIARIES
NOTES TO THE CONSOLIDATED FINANCIAL STATEMENTS
(Continued)
The following table summarizes information pertaining to our revenue by each of the specialized markets we serve:
|
|
Year Ended
|
||||||||||
|
|
January 31,
2016 |
January 25,
2015 |
January 26,
2014 |
||||||||
|
Revenue:
|
(In millions)
|
||||||||||
|
Gaming
|
$
|
2,818
|
|
$
|
2,058
|
|
$
|
1,511
|
|
||
|
Professional Visualization
|
750
|
|
795
|
|
789
|
|
|||||
|
Datacenter
|
339
|
|
317
|
|
199
|
|
|||||
|
Automotive
|
320
|
|
183
|
|
99
|
|
|||||
|
OEM & IP
|
783
|
|
1,329
|
|
1,532
|
|
|||||
|
Total revenue
|
$
|
5,010
|
|
$
|
4,682
|
|
$
|
4,130
|
|
||
The following table presents summarized information for long-lived assets by geographic region. Long-lived assets consist of property and equipment and deposits and other assets, and exclude goodwill and intangible assets.
|
|
January 31,
2016 |
January 25,
2015 |
|||||
|
Long-lived assets:
|
(In millions)
|
||||||
|
United States
|
$
|
414
|
|
$
|
467
|
|
|
|
India
|
45
|
|
48
|
|
|||
|
Taiwan
|
39
|
|
52
|
|
|||
|
China
|
25
|
|
28
|
|
|||
|
Europe
|
9
|
|
52
|
|
|||
|
Other Asia Pacific
|
1
|
|
1
|
|
|||
|
Total long-lived assets
|
$
|
533
|
|
$
|
648
|
|
|
Revenue from significant customers, those representing 10% or more of total revenue for the respective dates, is summarized as follows:
|
|
Year Ended
|
|||||||
|
|
January 31,
2016 |
January 25,
2015 |
January 26,
2014 |
|||||
|
Revenue:
|
|
|
|
|||||
|
Customer A
|
11
|
%
|
11
|
%
|
11
|
%
|
||
|
Customer B
|
9
|
%
|
9
|
%
|
10
|
%
|
||
Revenue from both customers was attributable to the GPU business.
Accounts receivable from significant customers, those representing 10% or more of total accounts receivable for the respective periods, is summarized as follows:
|
|
January 31,
2016 |
January 25,
2015 |
|||
|
Accounts Receivable:
|
|
|
|||
|
Customer B
|
21
|
%
|
20
|
%
|
|
|
Customer C
|
8
|
%
|
10
|
%
|
|
90
NVIDIA CORPORATION AND SUBSIDIARIES
NOTES TO THE CONSOLIDATED FINANCIAL STATEMENTS
(Continued)
In May 2015, we announced our intent to wind down our Icera modem operations and that we were open to a sale of the technology or operations. We pursued the sale of Icera’s technology and operations but were unable to identify a viable buyer with genuine interest. As a result, we began the wind-down of Icera modem operations in the second quarter of fiscal year 2016.
The results of any ongoing Icera modem operations were reported in the Tegra Processor reportable segment during fiscal year 2016 and previous fiscal years, however, restructuring and other charges associated with the wind-down of the Icera modem operations are separately reported with other non-recurring charges and benefits that our CODM deems to be enterprise in nature. Please refer to Note 16 of these Notes to the Consolidated Financial Statements for a discussion regarding our reportable segments.
Our operating expenses for fiscal year 2016 included
$131 million
of restructuring and other charges. During fiscal year 2016, we also recognized an income tax benefit of
$49 million
from a tax reserve release upon the expiration of applicable statutes of limitations and a
$27 million
income tax charge for the write-down of a deferred tax asset, both of which related to our Icera modem operations.
|
Year Ended
|
|||
|
January 31,
|
|||
|
2016
|
|||
|
(In millions)
|
|||
|
Employee severance and related costs
|
$
|
82
|
|
|
Fixed assets impairment
|
18
|
|
|
|
Tax subsidy impairment
|
17
|
|
|
|
Facilities and related costs
|
9
|
|
|
|
Other exit costs
|
5
|
|
|
|
Restructuring and other charges
|
$
|
131
|
|
We expect to incur additional restructuring charges to operating expense of approximately
$1 million
to
$2 million
per quarter for each of the first two quarters of fiscal year 2017, after which we expect the restructuring of Icera operations to be substantially complete. These restructuring activities impacted approximately
5%
of our global workforce. The following table provides a summary of the restructuring activities and related liabilities recorded in accrued liabilities on our Consolidated Balance Sheets as of January 31, 2016:
|
January 31,
|
|||
|
2016
|
|||
|
(In millions)
|
|||
|
Balance at beginning of period
|
$
|
—
|
|
|
Restructuring and other charges
|
131
|
|
|
|
Cash payments
|
(63
|
)
|
|
|
Non-cash adjustments
|
(45
|
)
|
|
|
Balance at end of period
|
$
|
23
|
|
The remaining balance of
$23 million
as of January 31, 2016 is expected to be paid during the first half of fiscal year 2017.
91
NVIDIA CORPORATION AND SUBSIDIARIES
NOTES TO THE CONSOLIDATED FINANCIAL STATEMENTS
(Continued)
The following table sets forth our unaudited consolidated financial results, for the last eight fiscal quarters:
|
|
Fiscal Year 2016
Quarters Ended
|
||||||||||||||
|
|
January 31,
2016 |
October 25,
2015 |
July 26,
2015
|
April 26,
2015 |
|||||||||||
|
|
(In millions, except per share data)
|
||||||||||||||
|
Statement of Income Data:
|
|
|
|
|
|||||||||||
|
Revenue
|
$
|
1,401
|
|
$
|
1,305
|
|
$
|
1,153
|
|
$
|
1,151
|
|
|||
|
Cost of revenue
|
$
|
610
|
|
$
|
572
|
|
$
|
519
|
|
$
|
498
|
|
|||
|
Gross profit
|
$
|
791
|
|
$
|
733
|
|
$
|
634
|
|
$
|
653
|
|
|||
|
Net income
|
$
|
207
|
|
$
|
247
|
|
$
|
26
|
|
$
|
134
|
|
|||
|
Net income per share:
|
|||||||||||||||
|
Basic
|
$
|
0.38
|
|
$
|
0.45
|
|
$
|
0.05
|
|
$
|
0.24
|
|
|||
|
Diluted
|
$
|
0.35
|
|
$
|
0.44
|
|
$
|
0.05
|
|
$
|
0.24
|
|
|||
|
|
Fiscal Year 2015
Quarters Ended |
||||||||||||||
|
|
January 25,
2015 |
October 26,
2014 |
July 27,
2014
|
April 27,
2014 |
|||||||||||
|
|
(In millions, except per share data)
|
||||||||||||||
|
Statement of Income Data:
|
|
|
|
|
|||||||||||
|
Revenue
|
$
|
1,251
|
|
$
|
1,225
|
|
$
|
1,103
|
|
$
|
1,103
|
|
|||
|
Cost of revenue
|
$
|
552
|
|
$
|
548
|
|
$
|
484
|
|
$
|
499
|
|
|||
|
Gross profit
|
$
|
699
|
|
$
|
677
|
|
$
|
619
|
|
$
|
604
|
|
|||
|
Net income
|
$
|
193
|
|
$
|
173
|
|
$
|
128
|
|
$
|
137
|
|
|||
|
Net income per share:
|
|||||||||||||||
|
Basic
|
$
|
0.35
|
|
$
|
0.32
|
|
$
|
0.23
|
|
$
|
0.24
|
|
|||
|
Diluted
|
$
|
0.35
|
|
$
|
0.31
|
|
$
|
0.22
|
|
$
|
0.24
|
|
|||
92
NVIDIA CORPORATION AND SUBSIDIARIES
SCHEDULE II – VALUATION AND QUALIFYING ACCOUNTS
|
Description
|
Balance at
Beginning of Period
|
Additions
|
|
Deductions
|
|
Balance at
End of Period
|
||||||||||
|
|
(In millions)
|
|||||||||||||||
|
Year ended January 31, 2016
|
|
|
|
|
|
|
||||||||||
|
Allowance for doubtful accounts
|
$
|
3
|
|
$
|
—
|
|
(1)
|
$
|
(1
|
)
|
(1)
|
$
|
2
|
|
||
|
Sales return allowance
|
$
|
14
|
|
$
|
9
|
|
(2)
|
$
|
(14
|
)
|
(4)
|
$
|
9
|
|
||
|
Deferred tax valuation allowance
|
$
|
261
|
|
$
|
11
|
|
(3)
|
$
|
—
|
|
$
|
272
|
|
|||
|
Year ended January 25, 2015
|
|
|
|
|
|
|
||||||||||
|
Allowance for doubtful accounts
|
$
|
1
|
|
$
|
3
|
|
(1)
|
$
|
(1
|
)
|
(1)
|
$
|
3
|
|
||
|
Sales return allowance
|
$
|
14
|
|
$
|
12
|
|
(2)
|
$
|
(12
|
)
|
(4)
|
$
|
14
|
|
||
|
Deferred tax valuation allowance
|
$
|
244
|
|
$
|
17
|
|
(3)
|
$
|
—
|
|
$
|
261
|
|
|||
|
Year ended January 26, 2014
|
|
|
|
|
|
|
||||||||||
|
Allowance for doubtful accounts
|
$
|
2
|
|
|
$
|
—
|
|
(1)
|
$
|
(1
|
)
|
(1)
|
$
|
1
|
|
|
|
Sales return allowance
|
$
|
15
|
|
|
$
|
16
|
|
(2)
|
$
|
(17
|
)
|
(4)
|
$
|
14
|
|
|
|
Deferred tax valuation allowance
|
$
|
225
|
|
|
$
|
19
|
|
(3)
|
$
|
—
|
|
$
|
244
|
|
||
(1)
Additions represent allowance for doubtful accounts charged to expense and deductions represent amounts recorded as reduction to expense upon reassessment of allowance for doubtful accounts at period end.
(2)
Represents allowance for sales returns estimated at the time revenue is recognized primarily based on historical return rates and is charged as a reduction to revenue.
(3)
Represents change in valuation allowance primarily related to state and certain foreign deferred tax assets that management has determined not likely to be realized due, in part, to projections of future taxable income of the respective jurisdictions.
(4)
Represents sales returns.
93
EXHIBIT INDEX
|
Incorporated by Reference
|
|||||||||||
|
Exhibit No.
|
Exhibit Description
|
Schedule/Form
|
File Number
|
Exhibit
|
Filing Date
|
||||||
|
3.1
|
Amended and Restated Certificate of Incorporation
|
S-8
|
333-74905
|
4.1
|
3/23/1999
|
||||||
|
3.2
|
Certificate of Amendment of Amended and Restated Certificate of Incorporation
|
10-Q
|
0-23985
|
3.1
|
8/21/2008
|
||||||
|
3.3
|
Certificate of Amendment of Amended and Restated Certificate of Incorporation
|
8-K
|
0-23985
|
3.1
|
5/24/2011
|
||||||
|
3.4
|
Bylaws of NVIDIA Corporation, Amended and Restated as of November 11, 2013
|
8-K
|
0-23985
|
3.1
|
11/14/2013
|
||||||
|
4.1
|
Reference is made to Exhibits 3.1, 3.2, 3.3 and 3.4
|
||||||||||
|
4.2
|
Specimen Stock Certificate
|
S-1/A
|
333-47495
|
4.2
|
4/24/1998
|
||||||
|
4.3
|
Indenture (including the form of Notes) dated December 2, 2013 between NVIDIA Corporation and Wells Fargo Bank, National Association
|
8-K
|
0-23985
|
4.1
|
12/2/2013
|
||||||
|
4.4
|
Form of 1.00% Convertible Senior Note due 2018 (included in Exhibit 4.3)
|
8-K
|
0-23985
|
4.2
|
12/2/2013
|
||||||
|
10.1
|
Form of Indemnity Agreement between NVIDIA Corporation and each of its directors and officers
|
8-K
|
0-23985
|
10.1
|
3/7/2006
|
||||||
|
10.2+
|
Amended and Restated 2007 Equity Incentive Plan
|
10-Q
|
0-23985
|
10.1
|
8/20/2014
|
||||||
|
10.3+
|
2007 Equity Incentive Plan - Non Statutory Stock Option (Annual Grant - Board Service (2007))
|
10-Q
|
0-23985
|
10.2
|
8/22/2007
|
||||||
|
10.4+
|
2007 Equity Incentive Plan - Non Statutory Stock Option (Annual Grant - Committee Service (2007))
|
10-Q
|
0-23985
|
10.3
|
8/22/2007
|
||||||
|
10.5+
|
2007 Equity Incentive Plan - Non Statutory Stock Option (Initial Grant - Board Service (2007))
|
10-Q
|
0-23985
|
10.4
|
8/22/2007
|
||||||
|
10.6+
|
2007 Equity Incentive Plan - Non-Statutory Stock Option (Annual Grant - Board Service (2009))
|
10-Q
|
0-23985
|
10.1
|
8/20/2009
|
||||||
|
10.7+
|
2007 Equity Incentive Plan - Non-Statutory Stock Option (Annual Grant - Board Service (2011))
|
10-Q
|
0-23985
|
10.41
|
5/27/2011
|
||||||
|
10.8+
|
2007 Equity Incentive Plan - Non-Statutory Stock Option (Initial Grant - Board Service (2011))
|
8-K
|
0-23985
|
10.1
|
12/14/2011
|
||||||
|
10.9+
|
Amended and Restated 2007 Equity Incentive Plan - Non-Employee Director Stock Option Grant (2012 Annual Board Retainer)
|
10-Q
|
0-23985
|
10.4
|
5/23/2012
|
||||||
|
10.10+
|
2007 Equity Incentive Plan - Non Statutory Stock Option
|
8-K
|
0-23985
|
10.2
|
9/13/2010
|
||||||
|
10.11+
|
2007 Equity Incentive Plan - Incentive Stock Option
|
8-K
|
0-23985
|
10.21
|
9/13/2010
|
||||||
|
10.12+
|
Amended and Restated 2007 Equity Incentive Plan - Non Statutory Stock Option
|
10-Q
|
0-23985
|
10.1
|
8/22/2012
|
||||||
|
10.13+
|
Amended and Restated 2007 Equity Incentive Plan - Incentive Stock Option
|
10-Q
|
0-23985
|
10.2
|
8/22/2012
|
||||||
|
10.14+
|
2007 Equity Incentive Plan - Restricted Stock Unit Grant Notice and Restricted Stock Unit Purchase Agreement
|
10-Q
|
0-23985
|
10.22
|
12/7/2010
|
||||||
94
|
10.15+
|
Amended and Restated 2007 Equity Incentive Plan - Restricted Stock Unit Grant Notice and Restricted Stock Unit Purchase Agreement
|
10-Q
|
0-23985
|
10.3
|
8/22/2012
|
||||||
|
10.16+
|
Amended and Restated 2007 Equity Incentive Plan - Non-Employee Director Restricted Stock Unit (without deferral option)
|
10-Q
|
0-23985
|
10.2
|
5/23/2012
|
||||||
|
10.17+
|
Amended and Restated 2007 Equity Incentive Plan - Non-Employee Director Restricted Stock Unit (with deferral option)
|
10-Q
|
0-23985
|
10.3
|
5/23/2012
|
||||||
|
10.18+
|
Amended and Restated 2007 Equity Incentive Plan - Non Statutory Stock Option (Initial Grant - Board Service)
|
8-K
|
0-23985
|
10.1
|
7/23/2013
|
||||||
|
10.19+
|
Amended and Restated 2007 Equity Incentive Plan - Non-Employee Director Deferred Restricted Stock Unit Grant Notice and Deferred Restricted Stock Unit Agreement (2015)
|
10-K
|
0-23985
|
10.25
|
3/2/2015
|
||||||
|
10.20+
|
Amended and Restated 2007 Equity Incentive Plan - Non-Employee Director Deferred Restricted Stock Unit Grant Notice and Deferred Restricted Stock Unit Agreement (2016)
|
10-K
|
0-23985
|
10.26
|
3/2/2015
|
||||||
|
10.21+
|
Amended and Restated 2007 Equity Incentive Plan - Non-Employee Director Restricted Stock Unit Grant Notice and Restricted Stock Unit Agreement (2016)
|
10-K
|
0-23985
|
10.27
|
3/2/2015
|
||||||
|
10.22+
|
Amended and Restated 2007 Equity Incentive Plan - Non-Employee Director Restricted Stock Unit (Initial Grant - with deferral options)
|
10-Q
|
0-23985
|
10.1
|
5/20/2015
|
||||||
|
10.23+
|
Amended and Restated 2007 Equity Incentive Plan - Restricted Stock Unit Grant Notice and Restricted Stock Unit Agreement & Performance-Based Restricted Stock Unit Grant Notice and Performance-Based Restricted Stock Unit Agreement (2015)
|
10-Q
|
0-23985
|
10.2
|
5/20/2015
|
||||||
|
10.24+
|
Amended and Restated 2012 Employee Stock Purchase Plan
|
10-Q
|
0-23985
|
10.2
|
8/20/2014
|
||||||
|
10.25+
|
Fiscal Year 2015 Variable Compensation Plan
|
8-K
|
0-23985
|
10.1
|
4/15/2014
|
||||||
|
10.26+
|
Fiscal Year 2016 Variable Compensation Plan
|
8-K
|
0-23985
|
10.1
|
4/10/2015
|
||||||
|
10.27+
|
Offer Letter between NVIDIA Corporation and Colette Kress, dated September 13, 2013
|
8-K
|
0-23985
|
10.1
|
9/16/2013
|
||||||
|
10.28
|
Master Confirmation and Supplemental Confirmation between NVIDIA Corporation and Goldman, Sachs & Co., dated May 14, 2013
|
10-Q
|
0-23985
|
10.3
|
5/22/2013
|
||||||
|
10.29
|
Base Convertible Note Hedge Transaction Confirmation
|
8-K
|
0-23985
|
99.1
|
12/2/2013
|
||||||
|
10.3
|
Base Warrant Transaction Confirmation
|
8-K
|
0-23985
|
99.2
|
12/2/2013
|
||||||
|
10.31
|
Additional Convertible Note Hedge Transaction Confirmation
|
8-K
|
0-23985
|
99.3
|
12/2/2013
|
||||||
|
10.32
|
Additional Warrant Transaction Confirmation
|
8-K
|
0-23985
|
99.4
|
12/2/2013
|
||||||
|
10.33^
|
Participation Agreement dated June 19, 2015 among NVIDIA Land Development, LLC, Wachovia Service Corporation, Wells Fargo Bank, National Association, and a syndicate of other institutions
|
10-Q
|
0-23985
|
10.1
|
8/19/2015
|
||||||
|
10.34
|
Agency Agreement dated June 19, 2015 between NVIDIA Land Development, LLC and Wachovia Service Corporation
|
10-Q
|
0-23985
|
10.2
|
8/19/2015
|
||||||
95
|
10.35
|
Real Property Lease Agreement dated June 19, 2015 between Wachovia Service Corporation and NVIDIA Land Development, LLC
|
10-Q
|
0-23985
|
10.3
|
8/19/2015
|
||||||
|
21.1*
|
List of Registrant's Subsidiaries
|
||||||||||
|
23.1*
|
Consent of PricewaterhouseCoopers LLP
|
||||||||||
|
24.1*
|
Power of Attorney (included in signature page)
|
||||||||||
|
31.1*
|
Certification of Chief Executive Officer as required by Rule 13a-14(a) of the Securities Exchange Act of 1934
|
||||||||||
|
31.2*
|
Certification of Chief Financial Officer as required by Rule 13a-14(a) of the Securities Exchange Act of 1934
|
||||||||||
|
32.1#*
|
Certification of Chief Executive Officer as required by Rule 13a-14(b) of the Securities Exchange Act of 1934
|
||||||||||
|
32.2#*
|
Certification of Chief Financial Officer as required by Rule 13a-14(b) of the Securities Exchange Act of 1934
|
||||||||||
|
101.INS*
|
XBRL Instance Document
|
||||||||||
|
101.SCH*
|
XBRL Taxonomy Extension Schema Document
|
||||||||||
|
101.CAL*
|
XBRL Taxonomy Extension Calculation Linkbase Document
|
||||||||||
|
101.DEF*
|
XBRL Taxonomy Extension Definition Linkbase Document
|
||||||||||
|
101.LAB*
|
XBRL Taxonomy Extension Labels Linkbase Document
|
||||||||||
|
101.PRE*
|
XBRL Taxonomy Extension Presentation Linkbase Document
|
||||||||||
*
Filed herewith.
+ Management contract or compensatory plan or arrangement.
^ Confidential treatment has been granted with respect to portions of this exhibit.
# In accordance with Item 601(b)(32)(ii) of Regulation S-K and SEC Release Nos. 33-8238 and 34-47986, Final Rule: Management's Reports on Internal Control Over Financial Reporting and Certification of Disclosure in Exchange Act Periodic Reports, the certifications furnished in Exhibits 32.1 and 32.2 hereto are deemed to accompany this Annual Report on Form 10-K and will not be deemed “filed” for purpose of Section 18 of the Exchange Act. Such certifications will not be deemed to be incorporated by reference into any filing under the Securities Act or the Exchange Act, except to the extent that the registrant specifically incorporates it by reference.
Copies of above exhibits not contained herein are available to any shareholder upon written request to:
Investor Relations: NVIDIA Corporation, 2701 San Tomas Expressway, Santa Clara, CA 95050
96
SIGNATURES
Pursuant to the requirements of Section 13 or 15(d) of the Securities Exchange Act of 1934, the Registrant has duly caused this report to be signed on its behalf by the undersigned, thereunto duly authorized, on
March 16, 2016
.
|
NVIDIA Corporation
|
|
|
By:
|
/s/ Jen-Hsun Huang
|
|
|
Jen-Hsun Huang
|
|
|
President and Chief Executive Officer
|
POWER OF ATTORNEY
KNOW ALL PERSONS BY THESE PRESENTS, that each person whose signature appears below constitutes and appoints Jen-Hsun Huang and Colette M. Kress, and each or any one of them, his true and lawful attorney-in-fact and agent, with full power of substitution and resubstitution, for him and in his name, place and stead, in any and all capacities, to sign any and all amendments to this report, and to file the same, with all exhibits thereto, and other documents in connection therewith, with the Securities and Exchange Commission, granting unto said attorneys-in-facts and agents, and each of them, full power and authority to do and perform each and every act and thing requisite and necessary to be done in connection therewith, as fully to all intents and purposes as he might or could do in person, hereby ratifying and confirming all that said attorneys-in-fact and agents, or any of them, or their or his substitutes or substitutes, may lawfully do or cause to be done by virtue hereof.
Pursuant to the requirements of the Securities Exchange Act of 1934, this report has been signed below by the following persons on behalf of the registrant and in the capacities and on the dates indicated.
97
|
Signature
|
Title
|
Date
|
|
/s/ JEN-HSUN HUANG
|
President, Chief Executive Officer and Director
(Principal Executive Officer)
|
March 16, 2016
|
|
Jen-Hsun Huang
|
|
|
|
/s/ COLETTE M. KRESS
|
Executive Vice President and Chief Financial Officer
(Principal Financial Officer)
|
March 16, 2016
|
|
Colette M. Kress
|
|
|
|
/s/ MICHAEL J. BYRON
|
Vice President and Chief Accounting Officer
(Principal Accounting Officer)
|
March 16, 2016
|
|
Michael J. Byron
|
||
|
/s/ TENCH COXE
|
Director
|
March 16, 2016
|
|
Tench Coxe
|
|
|
|
/s/ MARK STEVENS
|
Director
|
March 16, 2016
|
|
Mark Stevens
|
|
|
|
/s/ JAMES C. GAITHER
|
Director
|
March 16, 2016
|
|
James C. Gaither
|
|
|
|
/s/ HARVEY C. JONES
|
Director
|
March 16, 2016
|
|
Harvey C. Jones
|
|
|
|
/s/ MARK L. PERRY
|
Director
|
March 16, 2016
|
|
Mark L. Perry
|
|
|
|
/s/ WILLIAM J. MILLER
|
Director
|
March 16, 2016
|
|
William J. Miller
|
|
|
|
/s/ A. BROOKE SEAWELL
|
Director
|
March 16, 2016
|
|
A. Brooke Seawell
|
||
|
/s/ ROBERT BURGESS
|
Director
|
March 16, 2016
|
|
Robert Burgess
|
||
|
/s/ DAWN HUDSON
|
Director
|
March 16, 2016
|
|
Dawn Hudson
|
||
|
/s/ MICHAEL MCCAFFERY
|
Director
|
March 16, 2016
|
|
Michael McCaffery
|
||
|
/s/ PERSIS DRELL
|
Director
|
March 16, 2016
|
|
Persis Drell
|
||
98
EXHIBIT INDEX
|
Incorporated by Reference
|
|||||||||||
|
Exhibit No.
|
Exhibit Description
|
Schedule/Form
|
File Number
|
Exhibit
|
Filing Date
|
||||||
|
3.1
|
Amended and Restated Certificate of Incorporation
|
S-8
|
333-74905
|
4.1
|
3/23/1999
|
||||||
|
3.2
|
Certificate of Amendment of Amended and Restated Certificate of Incorporation
|
10-Q
|
0-23985
|
3.1
|
8/21/2008
|
||||||
|
3.3
|
Certificate of Amendment of Amended and Restated Certificate of Incorporation
|
8-K
|
0-23985
|
3.1
|
5/24/2011
|
||||||
|
3.4
|
Bylaws of NVIDIA Corporation, Amended and Restated as of November 11, 2013
|
8-K
|
0-23985
|
3.1
|
11/14/2013
|
||||||
|
4.1
|
Reference is made to Exhibits 3.1, 3.2, 3.3 and 3.4
|
||||||||||
|
4.2
|
Specimen Stock Certificate
|
S-1/A
|
333-47495
|
4.2
|
4/24/1998
|
||||||
|
4.3
|
Indenture (including the form of Notes) dated December 2, 2013 between NVIDIA Corporation and Wells Fargo Bank, National Association
|
8-K
|
0-23985
|
4.1
|
12/2/2013
|
||||||
|
4.4
|
Form of 1.00% Convertible Senior Note due 2018 (included in Exhibit 4.3)
|
8-K
|
0-23985
|
4.2
|
12/2/2013
|
||||||
|
10.1
|
Form of Indemnity Agreement between NVIDIA Corporation and each of its directors and officers
|
8-K
|
0-23985
|
10.1
|
3/7/2006
|
||||||
|
10.2+
|
Amended and Restated 2007 Equity Incentive Plan
|
10-Q
|
0-23985
|
10.1
|
8/20/2014
|
||||||
|
10.3+
|
2007 Equity Incentive Plan - Non Statutory Stock Option (Annual Grant - Board Service (2007))
|
10-Q
|
0-23985
|
10.2
|
8/22/2007
|
||||||
|
10.4+
|
2007 Equity Incentive Plan - Non Statutory Stock Option (Annual Grant - Committee Service (2007))
|
10-Q
|
0-23985
|
10.3
|
8/22/2007
|
||||||
|
10.5+
|
2007 Equity Incentive Plan - Non Statutory Stock Option (Initial Grant - Board Service (2007))
|
10-Q
|
0-23985
|
10.4
|
8/22/2007
|
||||||
|
10.6+
|
2007 Equity Incentive Plan - Non-Statutory Stock Option (Annual Grant - Board Service (2009))
|
10-Q
|
0-23985
|
10.1
|
8/20/2009
|
||||||
|
10.7+
|
2007 Equity Incentive Plan - Non-Statutory Stock Option (Annual Grant - Board Service (2011))
|
10-Q
|
0-23985
|
10.41
|
5/27/2011
|
||||||
|
10.8+
|
2007 Equity Incentive Plan - Non-Statutory Stock Option (Initial Grant - Board Service (2011))
|
8-K
|
0-23985
|
10.1
|
12/14/2011
|
||||||
|
10.9+
|
Amended and Restated 2007 Equity Incentive Plan - Non-Employee Director Stock Option Grant (2012 Annual Board Retainer)
|
10-Q
|
0-23985
|
10.4
|
5/23/2012
|
||||||
|
10.10+
|
2007 Equity Incentive Plan - Non Statutory Stock Option
|
8-K
|
0-23985
|
10.2
|
9/13/2010
|
||||||
|
10.11+
|
2007 Equity Incentive Plan - Incentive Stock Option
|
8-K
|
0-23985
|
10.21
|
9/13/2010
|
||||||
|
10.12+
|
Amended and Restated 2007 Equity Incentive Plan - Non Statutory Stock Option
|
10-Q
|
0-23985
|
10.1
|
8/22/2012
|
||||||
|
10.13+
|
Amended and Restated 2007 Equity Incentive Plan - Incentive Stock Option
|
10-Q
|
0-23985
|
10.2
|
8/22/2012
|
||||||
99
|
10.14+
|
2007 Equity Incentive Plan - Restricted Stock Unit Grant Notice and Restricted Stock Unit Purchase Agreement
|
10-Q
|
0-23985
|
10.22
|
12/7/2010
|
||||||
|
10.15+
|
Amended and Restated 2007 Equity Incentive Plan - Restricted Stock Unit Grant Notice and Restricted Stock Unit Purchase Agreement
|
10-Q
|
0-23985
|
10.3
|
8/22/2012
|
||||||
|
10.16+
|
Amended and Restated 2007 Equity Incentive Plan - Non-Employee Director Restricted Stock Unit (without deferral option)
|
10-Q
|
0-23985
|
10.2
|
5/23/2012
|
||||||
|
10.17+
|
Amended and Restated 2007 Equity Incentive Plan - Non-Employee Director Restricted Stock Unit (with deferral option)
|
10-Q
|
0-23985
|
10.3
|
5/23/2012
|
||||||
|
10.18+
|
Amended and Restated 2007 Equity Incentive Plan - Non Statutory Stock Option (Initial Grant - Board Service)
|
8-K
|
0-23985
|
10.1
|
7/23/2013
|
||||||
|
10.19+
|
Amended and Restated 2007 Equity Incentive Plan - Non-Employee Director Deferred Restricted Stock Unit Grant Notice and Deferred Restricted Stock Unit Agreement (2015)
|
10-K
|
0-23985
|
10.25
|
3/2/2015
|
||||||
|
10.20+
|
Amended and Restated 2007 Equity Incentive Plan - Non-Employee Director Deferred Restricted Stock Unit Grant Notice and Deferred Restricted Stock Unit Agreement (2016)
|
10-K
|
0-23985
|
10.26
|
3/2/2015
|
||||||
|
10.21+
|
Amended and Restated 2007 Equity Incentive Plan - Non-Employee Director Restricted Stock Unit Grant Notice and Restricted Stock Unit Agreement (2016)
|
10-K
|
0-23985
|
10.27
|
3/2/2015
|
||||||
|
10.22+
|
Amended and Restated 2007 Equity Incentive Plan - Non-Employee Director Restricted Stock Unit (Initial Grant - with deferral options)
|
10-Q
|
0-23985
|
10.1
|
5/20/2015
|
||||||
|
10.23+
|
Amended and Restated 2007 Equity Incentive Plan - Restricted Stock Unit Grant Notice and Restricted Stock Unit Agreement & Performance-Based Restricted Stock Unit Grant Notice and Performance-Based Restricted Stock Unit Agreement (2015)
|
10-Q
|
0-23985
|
10.2
|
5/20/2015
|
||||||
|
10.24+
|
Amended and Restated 2012 Employee Stock Purchase Plan
|
10-Q
|
0-23985
|
10.2
|
8/20/2014
|
||||||
|
10.25+
|
Fiscal Year 2015 Variable Compensation Plan
|
8-K
|
0-23985
|
10.1
|
4/15/2014
|
||||||
|
10.26+
|
Fiscal Year 2016 Variable Compensation Plan
|
8-K
|
0-23985
|
10.1
|
4/10/2015
|
||||||
|
10.27+
|
Offer Letter between NVIDIA Corporation and Colette Kress, dated September 13, 2013
|
8-K
|
0-23985
|
10.1
|
9/16/2013
|
||||||
|
10.28
|
Master Confirmation and Supplemental Confirmation between NVIDIA Corporation and Goldman, Sachs & Co., dated May 14, 2013
|
10-Q
|
0-23985
|
10.3
|
5/22/2013
|
||||||
|
10.29
|
Base Convertible Note Hedge Transaction Confirmation
|
8-K
|
0-23985
|
99.1
|
12/2/2013
|
||||||
|
10.3
|
Base Warrant Transaction Confirmation
|
8-K
|
0-23985
|
99.2
|
12/2/2013
|
||||||
|
10.31
|
Additional Convertible Note Hedge Transaction Confirmation
|
8-K
|
0-23985
|
99.3
|
12/2/2013
|
||||||
|
10.32
|
Additional Warrant Transaction Confirmation
|
8-K
|
0-23985
|
99.4
|
12/2/2013
|
||||||
|
10.33^
|
Participation Agreement dated June 19, 2015 among NVIDIA Land Development, LLC, Wachovia Service Corporation, Wells Fargo Bank, National Association, and a syndicate of other institutions
|
10-Q
|
0-23985
|
10.1
|
8/19/2015
|
||||||
100
|
10.34
|
Agency Agreement dated June 19, 2015 between NVIDIA Land Development, LLC and Wachovia Service Corporation
|
10-Q
|
0-23985
|
10.2
|
8/19/2015
|
||||||
|
10.35
|
Real Property Lease Agreement dated June 19, 2015 between Wachovia Service Corporation and NVIDIA Land Development, LLC
|
10-Q
|
0-23985
|
10.3
|
8/19/2015
|
||||||
|
21.1*
|
List of Registrant's Subsidiaries
|
||||||||||
|
23.1*
|
Consent of PricewaterhouseCoopers LLP
|
||||||||||
|
24.1*
|
Power of Attorney (included in signature page)
|
||||||||||
|
31.1*
|
Certification of Chief Executive Officer as required by Rule 13a-14(a) of the Securities Exchange Act of 1934
|
||||||||||
|
31.2*
|
Certification of Chief Financial Officer as required by Rule 13a-14(a) of the Securities Exchange Act of 1934
|
||||||||||
|
32.1#*
|
Certification of Chief Executive Officer as required by Rule 13a-14(b) of the Securities Exchange Act of 1934
|
||||||||||
|
32.2#*
|
Certification of Chief Financial Officer as required by Rule 13a-14(b) of the Securities Exchange Act of 1934
|
||||||||||
|
101.INS*
|
XBRL Instance Document
|
||||||||||
|
101.SCH*
|
XBRL Taxonomy Extension Schema Document
|
||||||||||
|
101.CAL*
|
XBRL Taxonomy Extension Calculation Linkbase Document
|
||||||||||
|
101.DEF*
|
XBRL Taxonomy Extension Definition Linkbase Document
|
||||||||||
|
101.LAB*
|
XBRL Taxonomy Extension Labels Linkbase Document
|
||||||||||
|
101.PRE*
|
XBRL Taxonomy Extension Presentation Linkbase Document
|
||||||||||
* Filed herewith.
+ Management contract or compensatory plan or arrangement.
^ Confidential treatment has been granted with respect to portions of this exhibit.
# In accordance with Item 601(b)(32)(ii) of Regulation S-K and SEC Release Nos. 33-8238 and 34-47986, Final Rule: Management's Reports on Internal Control Over Financial Reporting and Certification of Disclosure in Exchange Act Periodic Reports, the certifications furnished in Exhibits 32.1 and 32.2 hereto are deemed to accompany this Annual Report on Form 10-K and will not be deemed “filed” for purpose of Section 18 of the Exchange Act. Such certifications will not be deemed to be incorporated by reference into any filing under the Securities Act or the Exchange Act, except to the extent that the registrant specifically incorporates it by reference.
Copies of above exhibits not contained herein are available to any shareholder upon written request to:
Investor Relations: NVIDIA Corporation, 2701 San Tomas Expressway, Santa Clara, CA 95050
101
TABLE OF CONTENTS
Part IItem 1. BusinessItem 1A. Risk FactorsItem 1B. Unresolved Staff CommentsItem 2. PropertiesItem 3. Legal ProceedingsItem 4. Mine Safety DisclosuresPart IIItem 5. Market For Registrant S Common Equity, Related Stockholder Matters and Issuer Purchases Of Equity SecuritiesItem 6. Selected Financial DataItem 7. Management S Discussion and Analysis Of Financial Condition and Results Of OperationsItem 7A. Quantitative and Qualitative Disclosures About Market RiskItem 8. Financial Statements and Supplementary DataItem 9. Changes in and Disagreements with Accountants on Accounting and Financial DisclosureItem 9A. Controls and ProceduresItem 9B. Other InformationPart IIIItem 10. Directors, Executive Officers and Corporate GovernanceItem 11. Executive CompensationItem 12. Security Ownership Of Certain Beneficial Owners and Management and Related Stockholder MattersItem 13. Certain Relationships and Related Transactions, and Director IndependenceItem 14. Principal Accounting Fees and ServicesPart IVItem 15. Exhibits, Financial Statement ScheduleNote 1 - Organization and Summary Of Significant Accounting PoliciesNote 2 - Stock-based CompensationNote 3 - Net Income Per ShareNote 4 - GoodwillNote 5 - Amortizable Intangible AssetsNote 6 - Marketable SecuritiesNote 7 - Fair Value Of Financial Assets and LiabilitiesNote 8 - Balance Sheet ComponentsNote 9 - Derivative Financial InstrumentNote 10 - GuaranteesNote 11 - Convertible DebtNote 12 - Commitments and ContingenciesNote 13 - Income TaxesNote 14 - Shareholders EquityNote 15 - Employee Retirement PlansNote 16 - Segment InformationNote 17 - Restructuring and Other ChargesNote 18 - Quarterly Summary (unaudited)