NVIDIA CORP
10-Ks and 10-Qs
|
|
|
|
|
|
|
|
|
|
|
|
|
|
|
|
|
|
|
|
|
|
|
|
|
|
|
|
|
|
|
|
|
|
|
|
|
|
|
|
|
|
|
|
|
|
|
|
|
|
|
|
|
|
|
|
UNITED STATES
SECURITIES AND EXCHANGE COMMISSION
Washington, D.C. 20549
____________________________________________________________________________________________
FORM 10-K
|
[x]
|
ANNUAL REPORT PURSUANT TO SECTION 13 OR 15(d) OF THE SECURITIES EXCHANGE ACT OF 1934
|
|
For the fiscal year ended January 27, 2019
|
|
OR
|
[_]
|
TRANSITION REPORT PURSUANT TO SECTION 13 OR 15(d) OF THE SECURITIES EXCHANGE ACT OF 1934
|
Commission file number: 0-23985

NVIDIA CORPORATION
(Exact name of registrant as specified in its charter)
|
Delaware
|
94-3177549
|
|
(State or other jurisdiction of
|
(I.R.S. Employer
|
|
Incorporation or Organization)
|
Identification No.)
|
2788 San Tomas Expressway
Santa Clara, California 95051
(408) 486-2000
(Address, including zip code, and telephone number, including area code, of principal executive offices)
Securities registered pursuant to Section 12(b) of the Act:
|
Title of each class
|
Name of each exchange on which registered
|
|
Common Stock, $0.001 par value per share
|
The Nasdaq Global Select Market
|
Securities registered pursuant to Section 12(g) of the Act:
None
Indicate by check mark if the registrant is a well-known seasoned issuer, as defined in Rule 405 of the Securities Act. Yes
ý
No
o
Indicate by check mark if the registrant is not required to file reports pursuant to Section 13 or Section 15(d) of the Act. Yes
o
No
ý
Indicate by check mark whether the registrant (1) has filed all reports required to be filed by Section 13 or 15(d) of the Securities Exchange Act of 1934 during the preceding 12 months (or for such shorter period that the registrant was required to file such reports), and (2) has been subject to such filing requirements for the past 90 days. Yes
ý
No
o
Indicate by check mark whether the registrant has submitted electronically every Interactive Data File required to be submitted pursuant to Rule 405 of Regulation S-T (§232.405 of this chapter) during the preceding 12 months (or for such shorter period that the registrant was required to submit such files). Yes
ý
No
o
Indicate by check mark if disclosure of delinquent filers pursuant to Item 405 of Regulation S-K (§ 229.405 of this chapter) is not contained herein, and will not be contained, to the best of registrant’s knowledge, in definitive proxy or information statements incorporated by reference in Part III of this Form 10-K or any amendment to this Form 10-K.
o
Indicate by check mark whether the registrant is a large accelerated filer, an accelerated filer, a non-accelerated filer, a smaller reporting company, or an emerging growth company. See definitions of “large accelerated filer”, “accelerated filer”, “smaller reporting company”, and "emerging growth company" in Rule 12b-2 of the Exchange Act.
|
Large accelerated filer
x
|
Accelerated filer
o
|
Non-accelerated filer
o
|
Smaller reporting company
o
|
Emerging growth company
o
|
If an emerging growth company, indicate by check mark if the registrant has elected not to use the extended transition period for complying with any new or revised financial accounting standards provided pursuant to Section 13(a) of the Exchange Act.
o
Indicate by check mark whether the registrant is a shell company (as defined in Rule 12b-2 of the Act). Yes
o
No
ý
The aggregate market value of the voting stock held by non-affiliates of the registrant as of July 27, 2018 was approximately $146.66 billion (based on the closing sales price of the registrant's common stock as reported by the Nasdaq Global Select Market on July 27, 2018). This calculation excludes 26 million shares held by directors and executive officers of the registrant. This calculation does not exclude shares held by such organizations whose ownership exceeds 5% of the registrant's outstanding common stock that have represented to the registrant that they are registered investment advisers or investment companies registered under section 8 of the Investment Company Act of 1940.
The number of shares of common stock outstanding as of
February 15, 2019
was
606 million
.
DOCUMENTS INCORPORATED BY REFERENCE
Portions of the registrant's Proxy Statement for its 2019 Annual Meeting of Shareholders to be filed with the Securities and Exchange Commission pursuant to Regulation 14A not later than 120 days after the end of the fiscal year covered by this Annual Report on Form 10-K are incorporated by reference into Part III, Items 10-14 of this Annual Report on Form 10-K.
NVIDIA CORPORATION
TABLE OF CONTENTS
|
|
|
Page
|
|
|
|
|
|
|
|
|
|
|
|
|
|
|
|
|
|
|
|
|
|
|
|
|
|
|
||
|
|
|
|
|
|
|
|
|
|
|
|
|
|
|
|
|
|
|
|
|
|
|
|
|
|
|
|
|
|
|
|
|
|
|
|
|
|
|
|
|
|
|
|
|
|
|
|
|
|
|
|
|
|
|
|
|
|
|
|
|
|
|
|
|
|
|
|
|
|
|
|
2
WHERE YOU CAN FIND MORE INFORMATION
Investors and others should note that we announce material financial information to our investors using our investor relations website, press releases, SEC filings and public conference calls and webcasts. We also use the following social media channels as a means of disclosing information about the company, our products, our planned financial and other announcements and attendance at upcoming investor and industry conferences, and other matters and for complying with our disclosure obligations under Regulation FD:
NVIDIA Twitter Account (https://twitter.com/nvidia)
NVIDIA Company Blog (http://blogs.nvidia.com)
NVIDIA Facebook Page (https://www.facebook.com/nvidia)
NVIDIA LinkedIn Page (http://www.linkedin.com/company/nvidia)
NVIDIA Instagram Page (https://www.instagram.com/nvidia)
In addition, investors and others can view NVIDIA videos on YouTube.
The information we post through these social media channels may be deemed material. Accordingly, investors should monitor these accounts and the blog, in addition to following our press releases, SEC filings and public conference calls and webcasts. This list may be updated from time to time. The information we post through these channels is not a part of this Annual Report on Form 10-K. These channels may be updated from time to time on NVIDIA's investor relations website.
Forward-Looking Statements
This Annual Report on Form 10-K contains forward-looking statements within the meaning of Section 27A of the Securities Act of 1933, as amended, and Section 21E of the Securities Exchange Act of 1934, as amended, which are subject to the “safe harbor” created by those sections. Forward-looking statements are based on our management's beliefs and assumptions and on information currently available to our management. In some cases, you can identify forward-looking statements by terms such as “may,” “will,” “should,” “could,” “goal,” “would,” “expect,” “plan,” “anticipate,” “believe,” “estimate,” “project,” “predict,” “potential” and similar expressions intended to identify forward-looking statements. These statements involve known and unknown risks, uncertainties and other factors, which may cause our actual results, performance, time frames or achievements to be materially different from any future results, performance, time frames or achievements expressed or implied by the forward-looking statements. We discuss many of these risks, uncertainties and other factors in this Annual Report on Form 10-K in greater detail under the heading “Risk Factors.” Given these risks, uncertainties and other factors, you should not place undue reliance on these forward-looking statements. Also, these forward-looking statements represent our estimates and assumptions only as of the date of this filing. You should read this Annual Report on Form 10-K completely and with the understanding that our actual future results may be materially different from what we expect. We hereby qualify our forward-looking statements by these cautionary statements. Except as required by law, we assume no obligation to update these forward-looking statements publicly, or to update the reasons actual results could differ materially from those anticipated in these forward-looking statements, even if new information becomes available in the future.
All references to “NVIDIA,” “we,” “us,” “our” or the “Company” mean NVIDIA Corporation and its subsidiaries.
In addition, statements that “we believe” and similar statements reflect our beliefs and opinions on the relevant subject. These statements are based upon information available to us as of the filing date of this Annual Report on Form 10-K , and while we believe such information forms a reasonable basis for such statements, such information may be limited or incomplete, and our statements should not be read to indicate that we have conducted an exhaustive inquiry into, or review of, all potentially available relevant information. These statements are inherently uncertain and investors are cautioned not to unduly rely upon these statements.
© 2019 NVIDIA Corporation. All rights reserved. NVIDIA, the NVIDIA logo, GeForce, Quadro, Tegra, Tesla, CUDA, GeForce Experience, GeForce NOW, GeForce RTX, Jetson, NVIDIA Clara, NVIDIA DGX, NVIDIA DRIVE, NVIDIA GameWorks, NVIDIA GRID, NVIDIA HGX, NVIDIA RTX, NVLink and SHIELD are trademarks and/or registered trademarks of NVIDIA Corporation in the United States and/or other countries. Other company and product names may be trademarks of the respective companies with which they are associated. Features, pricing, availability, and specifications are subject to change without notice.
3
PART I
ITEM 1. BUSINESS
Our Company
Starting with a focus on PC graphics, NVIDIA invented the graphics processing unit, or GPU, to solve some of the most complex problems in computer science. We have extended our focus in recent years to the revolutionary field of artificial intelligence, or AI. Fueled by the sustained demand for better 3D graphics and the scale of the gaming market, NVIDIA has evolved the GPU into a computer brain at the intersection of virtual reality, or VR, high performance computing, or HPC, and AI.
The GPU was initially used to simulate human imagination, enabling the virtual worlds of video games and films. Today, it also simulates human intelligence, enabling a deeper understanding of the physical world. Its parallel processing capabilities, supported by up to thousands of computing cores, are essential to running deep learning algorithms. This form of AI, in which software writes itself by learning from data, can serve as the brain of computers, robots and self-driving cars that can perceive and understand the world. GPU-powered deep learning continues to be adopted by thousands of enterprises to deliver services and features that would have been impossible with traditional coding.
NVIDIA has a platform strategy, bringing together hardware, system software, programmable algorithms, libraries, systems, and services to create unique value for the markets we serve. While the requirements of these end markets are diverse, we address them with a unified underlying architecture leveraging our GPUs and Compute Unified Device Architecture, or CUDA, as the fundamental building blocks. The programmable nature of our architecture allows us to support several multi-billion dollar end markets with the same underlying technology by using a variety of software stacks developed either internally or by third party developers and partners. The large and growing number of developers across our platforms strengthens our ecosystem and increases the value of our platform to our customers.
Innovation is at our core. We have invested over $17 billion in research and development since our inception, yielding inventions that are essential to modern computing. Our invention of the GPU in 1999 defined modern computer graphics and established NVIDIA as the leader in visual computing. With our introduction of the CUDA programming model in 2006, we opened the parallel processing capabilities of the GPU for general purpose computing. This approach significantly accelerates the performance of the most demanding applications in HPC in fields such as aerospace, bio-science research, mechanical and fluid simulations, and energy exploration. Today, our GPUs power the fastest supercomputers across the world. In addition, the massively parallel compute architecture of our GPUs and associated software have proven to be well suited for deep learning and are now expanding into machine learning, powering the era of AI. As the laws of physics have begun to slow down Moore’s Law, we continue to deliver GPU performance improvements ahead of Moore’s Law, giving the industry a path forward.
Gamers choose NVIDIA GPUs to enjoy immersive, increasingly cinematic virtual worlds. GPUs also help underpin the world’s fastest growing spectator sport, eSports, which attracts hundreds of millions of viewers to watch top-quality gaming. A rapidly growing new genre of Battle Royale games, such as Fortnite, is also expanding the gaming market.
Researchers use our GPUs to accelerate a wide range of important applications, from simulating viruses to exploring the origins of the universe. With support for more than 550 applications - including the top 15 HPC applications - NVIDIA GPUs enable some of the most promising areas of discovery, from weather prediction to materials science and from wind tunnel simulation to genomics. In 2018, NVIDIA GPUs powered the top two supercomputers in the world, located at Oak Ridge and Lawrence Livermore National Laboratories in the United States, as well as the top supercomputers in Europe and Japan. Five of the six finalists for the Gordon Bell Prize, awarded by the Association for Computing Machinery for outstanding achievement in the field of computing for applications in science, engineering and large-scale data science, did their work on the NVIDIA-powered top-two supercomputers.
The world’s leading cloud service providers use our GPUs to enable, accelerate or enrich the services they deliver to billions of end-users, including search, social networking, online shopping, live video, translation, AI assistants, navigation, and cloud computing.
A rapidly growing number of enterprises and startups use our GPUs to facilitate deep learning that meets, and in several cases surpasses, human perception, in fields ranging from radiology to precision agriculture. For example, the transportation industry is turning to our GPUs and AI to enable autonomous vehicles, or AVs, with several hundred companies and organizations working with NVIDIA’s DRIVE platform.
4
Professional designers use our GPUs to create visual effects in movies and design products ranging from soft drink bottles to commercial aircraft.
Headquartered in Santa Clara, California, NVIDIA was incorporated in California in April 1993 and reincorporated in Delaware in April 1998.
Our Businesses
Our two reportable segments - GPU and Tegra Processor - are based on a single underlying architecture. Our GPU product brands are aimed at specialized markets including GeForce for gamers; Quadro for designers; Tesla and DGX for AI data scientists and big data researchers; and GRID for cloud-based visual computing users. Our Tegra brand integrates an entire computer onto a single chip, and incorporates GPUs and multi-core CPUs to drive supercomputing for autonomous robots, drones, and cars, as well as for game consoles and mobile gaming and entertainment devices.
|
GPU
|
∙
|
GeForce
for PC gaming and mainstream PCs
|
|
∙
|
GeForce NOW
for cloud-based game-streaming service
|
|
|
∙
|
Quadro
for design professionals working in computer-aided design, video editing, special effects, and other creative applications
|
|
|
∙
|
Tesla
for AI utilizing deep learning and accelerated computing, leveraging the parallel computing capabilities of GPUs for general purpose computing
|
|
|
∙
|
GRID
to provide the power of NVIDIA graphics through the cloud and datacenters
|
|
|
∙
|
DGX
for AI scientists, researchers and developers
|
|
|
Tegra Processor
|
∙
|
Tegra
processors are primarily designed to enable branded platforms - DRIVE and SHIELD
|
|
∙
|
DRIVE AGX
automotive supercomputers and software stacks that provide self-driving capabilities
|
|
|
∙
|
Clara AGX
for intelligent medical instruments
|
|
|
∙
|
SHIELD
devices and services designed to harness the power of mobile-cloud to revolutionize home entertainment, AI and gaming
|
|
|
∙
|
Jetson AGX
is a power-efficient AI computing platform for robotics and other embedded use
|
|
Our Markets
We specialize in markets in which GPU-based visual computing and accelerated computing platforms can provide tremendous throughput for applications. These platforms incorporate processors, systems software, programmable algorithms, systems, and services to deliver value that is unique in the marketplace. From our proprietary processors, we have created platforms that address four large markets where our expertise is critical: Gaming, Professional Visualization, Datacenter, and Automotive.
Gaming
Computer gaming is the largest entertainment industry. Many factors propel computer gaming’s growth, including new high production value games and franchises, the rise of competitive online gaming, eSports, and the rise of virtual and augmented reality.
Our GPUs enhance the gaming experience by improving the visual quality of graphics, increasing the frame rate for smoother gameplay and improving realism by incorporating the behavior of light and physical objects. These can be enjoyed independently or together to extend the gaming experience across platforms.
Our gaming platforms utilize sophisticated 3D software and algorithms, including our GameWorks libraries that provide special effects for games. We further enhance gaming with GeForce Experience, our gaming application that optimizes the PC user’s settings for each title and enables players to record and share gameplay. It has been downloaded by more than 100 million users.
To enable VR, we provide developers with a suite of software libraries called VRWorks. VRWorks allows developers to create fully immersive experiences by enabling physically realistic visuals, sound, touch interactions, and simulated environments. VR requires advanced high-performance GPUs as the engine to simulate complete immersion.
Our products for the gaming market include GeForce RTX and GeForce GTX GPUs for PC gaming, SHIELD devices for gaming and streaming, GeForce NOW for cloud-based gaming, as well as platforms and development services for specialized console gaming devices.
5
Professional Visualization
We serve the Professional Visualization market by working closely with independent software vendors to optimize their offerings for NVIDIA GPUs. Our GPU computing solutions enhance productivity and introduce new capabilities for critical parts of the workflow for such major industries as automotive, media and entertainment, architectural engineering, oil and gas, and medical imaging.
Designers who build the products we use every day need the images that they view digitally to mirror reality. This requires simulating the physical behavior of light and materials, or physically-based rendering, an emerging trend in professional design. Our DesignWorks software delivers this to designers and enables an architect designing a building with a computer-aided design package to interact with the model in real time, view it in greater detail, and generate photorealistic renderings for the client. It also allows an automotive designer to create a highly realistic 3D image of a car, which can be viewed from all angles, reducing reliance on costly, time-consuming full-scale clay models.
Just as VR is becoming more important in gaming, it is also being incorporated in a growing number of enterprise applications, including within medicine, architecture, product design, and retail. Virtual car showrooms, surgical training, architectural walkthroughs, and bringing historical scenes to life all deploy this technology, powered by our GPUs.
Visual computing is vital to productivity in many environments, including design and manufacturing and digital content creation. Design and manufacturing includes computer-aided design, architectural design, consumer-products manufacturing, medical instrumentation, and aerospace. Digital content creation includes professional video editing and post production, special effects for films, and broadcast-television graphics.
Our brand for this market is Quadro for workstations. Quadro GPUs enhance the productivity of designers by improving performance and adding functionality, such as photorealistic rendering, high color fidelity, and advanced scalable display capabilities. During fiscal year 2019, we introduced the NVIDIA RTX platform, making it possible to render film-quality, photorealistic objects and environments with physically accurate shadows, reflections and refractions using ray tracing in real-time.
Datacenter
The NVIDIA accelerated computing platform addresses AI and HPC applications. The platform consists of our energy efficient GPUs, our CUDA programming language, specific libraries such as cuDNN and TensorRT, and innovations such as NVLink, which enables application scalability across multiple GPUs.
In the field of AI, NVIDIA’s platform accelerates both deep learning and machine learning workloads. Deep learning is a computer science approach where neural networks are trained to recognize patterns from massive amounts of data in the form of images, sounds and text - in some instances better than humans. Machine learning is a related approach that leverages algorithms as well as data to learn how to make determinations or predictions, often used in data science. HPC, also referred to as scientific computing, uses numerical computational approaches to solve large and complex problems. For both AI and HPC applications, the NVIDIA accelerated computing platform greatly increases the performance and power efficiency of high-performance computers and datacenters, as GPUs excel at parallel workloads. For example, an NVIDIA GPU-accelerated machine learning cluster for data science is 1/8 the cost, 1/15 the space, and 1/18 the power of a traditional CPU-based cluster.
We are engaged with thousands of organizations working on AI in a multitude of industries, from automating tasks such as reading medical images, to enabling fraud detection in financial services, to optimizing oil exploration and drilling. These organizations include the world’s leading cloud services companies such as Amazon, Baidu, and Facebook, which are infusing AI in applications that enable highly accurate voice recognition and real-time translation; enterprises that are increasingly turning to AI to improve products and services; and startups seeking to implement AI in transformative ways across multiple industries. We have partnered with industry leaders such as IBM, Microsoft, Oracle, and SAP to bring AI to enterprise users. We also have partnerships in healthcare and manufacturing, among others, to accelerate the adoption of AI.
To enable deep learning and machine learning, we provide a family of GPUs designed to speed up training and inferencing of neural networks. They are available in industry standard servers from every major computer maker worldwide, including Cisco, Dell, HP, Inspur, and Lenovo; from every major cloud service provider such as Alicloud, Amazon Web Services, Baidu Cloud, Google Cloud, IBM Cloud, Microsoft Azure, and Oracle Cloud; as well as in our DGX AI supercomputer, a purpose-built system for deep learning and GPU accelerated applications. DGX delivers performance equal to hundreds of conventional servers, comes fully integrated with hardware, software, development tools, support for AI frameworks, and runs popular accelerated applications. We also offer the NVIDIA GPU Cloud, or NGC, a comprehensive catalog of easy-to-use, optimized software stacks across a range of domains including scientific computing, deep learning, and machine learning. With NGC,
6
AI developers, researchers and data scientists can get started with the development of AI and HPC applications and deploy them on DGX systems, NGC-ready workstations or servers from our systems partners, or with NVIDIA’s cloud partners such as Amazon, Google Cloud, Microsoft Azure, or Oracle Cloud.
GPUs also increase the speed of applications used in such fields as aerospace, bio-science research, mechanical and fluid simulations, and energy exploration. They have already had a significant impact on scientific discovery, including improving heart surgery, mapping human genome folds, seismic modeling, and weather simulations.
Accelerated computing is recognized as the path forward for computing amid the slowing of Moore’s Law. The proportion of supercomputers utilizing accelerators has grown sharply over the past five years, now accounting for a significant proportion of both the total systems on the TOP500 list, which ranks the 500 most powerful commercially available computer systems, and the list’s total floating-point operations per second. Tesla GPU accelerators power many of the world’s fastest supercomputers, including the U.S. Department of Energy’s new generation of supercomputers, Summit and Sierra, at Oak Ridge and Lawrence Livermore National Laboratories, Europe’s fastest supercomputer - Piz Daint - in Switzerland, and Japan’s fastest supercomputer, ABCI.
We also serve the datacenter market with GRID for virtualized graphics. GRID makes it possible to run graphics-intensive applications remotely on a server in the datacenter. Applications include accelerating virtual desktop infrastructures and delivering graphics-intensive applications from the cloud for industries such as manufacturing, healthcare, and educational institutions, among others.
Automotive
NVIDIA’s Automotive market is comprised of cockpit infotainment solutions, AV platforms, and associated development agreements. Leveraging our technology leadership in AI and building on our long-standing automotive relationships, we are delivering a full solution for the AV market under the DRIVE brand. NVIDIA has demonstrated multiple applications of AI within the car. AI can drive the car itself as a pilot, in either partial or fully autonomous mode. AI can also be a co-pilot, assisting the human driver in creating a safer driving experience.
NVIDIA is working with several hundred partners in the automotive ecosystem including automakers, truck makers, tier-one suppliers, sensor manufacturers, automotive research institutions, HD mapping companies, and startups to develop and deploy AI systems for self-driving vehicles. Our unified AI computing architecture starts with training deep neural networks using our Tesla GPUs, and then running them within the vehicle on the NVIDIA DRIVE computing platform. The platform consists of high-performance, energy efficient hardware - DRIVE AGX, and open, modular software - including DRIVE AV for autonomous driving and DRIVE IX for in-vehicle AI assistance. In addition, we offer a scalable simulation solution, NVIDIA DRIVE Constellation, for testing and validating a self-driving platform before commercial deployment. This end-to-end, software-defined approach allows cars to receive over-the-air updates to add new features and capabilities throughout the life of a vehicle.
NVIDIA DRIVE can perceive and understand in real-time what's happening around the vehicle, precisely locate itself on an HD map, and plan a safe path forward. This advanced self-driving car platform combines deep learning, sensor fusion, and surround vision to change the driving experience. Our DRIVE platform scales from a palm-sized, energy-efficient module for automated highway-driving capabilities to a configuration with multiple systems aimed at enabling driverless cars. Our Xavier SoC, which started shipping in 2018, enables vehicles to use deep neural networks to process data from multiple cameras and sensors. It powers the DRIVE AutoPilot, the first commercially available Level 2+ automated driving system, combining the DRIVE AV self-driving solution with the DRIVE IX cockpit software, including a visualization system for allowing the driver to see what the car sees and plans to do.
Business Strategies
NVIDIA’s key strategies that shape our overall business approach include:
Advancing the GPU computing platform.
The massive parallel processing capabilities of NVIDIA GPUs can solve complex problems in significantly less time and with lower power consumption than alternative computational approaches. Indeed, GPUs can help solve problems that were previously deemed unsolvable. We work to deliver continued GPU performance leaps that outpace Moore’s Law by leveraging innovation across the architecture, chip design, system, and software layers. Our strategy is to target markets where GPUs deliver order-of-magnitude performance advantages relative to legacy approaches. Our target markets so far include gaming, professional visualization, datacenter, and automotive. While the requirements of these end markets are diverse, we address them with a unified underlying architecture leveraging our GPUs and CUDA as the fundamental building blocks. The programmable nature of our architecture allows us to make leveraged investments in R&D: we can support several multi-billion dollar end markets with the same underlying technology
7
by using a variety of software stacks developed either internally or by third party developers and partners. We utilize this platform approach in each of our target markets.
Extending our technology and platform leadership in AI.
We provide a complete, end-to-end GPU computing platform for deep learning and machine learning, addressing both training and inferencing. This includes GPUs, our CUDA programming language, algorithms, libraries, and system software. GPUs are uniquely suited to AI, and we will continue to add AI-specific features to our GPU architecture to further extend our leadership position. Our AI technology leadership is reinforced by our large and expanding ecosystem in a virtuous cycle. Our GPU platforms are available from virtually every major server maker and cloud service provider, as well as on our own AI supercomputer. There are over 1.2 million developers worldwide using CUDA and our other software tools to help deploy our technology in our target markets. We evangelize AI through partnerships with hundreds of universities and more than 3,600 startups through our Inception program. Additionally, our Deep Learning Institute provides instruction on the latest techniques on how to design, train, and deploy neural networks in applications using our accelerated computing platform.
Extending our technology and platform leadership in visual computing.
We believe that visual computing is fundamental to the continued expansion and evolution of computing. We apply our research and development resources to extending our leadership in visual computing, enabling us to enhance the user experience for consumer entertainment and professional visualization applications. Our technologies are instrumental in driving gaming forward, as developers leverage our libraries and algorithms to create near-cinematic and VR experiences. Our close collaboration with game developers allows us to deliver an optimized gaming experience on our GeForce platform. Our GeForce Experience gaming application further enhances each gamer’s experience by optimizing their PC’s settings, as well as enabling the recording and sharing of gameplay. We also enable interactive graphics applications - such as games, movie and photo editing and design software - to be accessed by almost any device, almost anywhere, through our cloud platforms such as GRID for enterprise and GeForce NOW for gaming.
Advancing the leading autonomous vehicle platform.
We believe the advent of AV will soon revolutionize the transportation industry. In our view, AI is the key technology enabler of this opportunity, as the algorithms required for autonomous driving - such as perception, localization, and planning - are too complex for legacy hand-coded approaches, and will run on multiple trained neural networks instead. Therefore, we have provided a full functionally safe AI-based hardware and software solution for the AV market under the DRIVE brand, which we are bringing to market through our partnerships with automotive original equipment manufacturers, or OEMs, tier-1 suppliers, and start-ups. Our AV solution also includes the GPU-based hardware required to train the neural networks before their in-vehicle deployment, as well as to re-simulate their operation prior to any over-the-air software updates. We believe our comprehensive, top-to-bottom and end-to-end approach will enable the transportation industry to solve the complex problems arising from the shift to autonomous driving.
Leveraging our intellectual property.
We believe our intellectual property is a valuable asset that can be accessed by our customers and partners through licenses and development agreements when they desire to build such capabilities directly into their own products, or have us do so through a custom development. Such license and development arrangements can further enhance the reach of our technology.
Sales and Marketing
Our sales strategy involves working with end customers and various industry ecosystems through our partner network. Our worldwide sales and marketing strategy is key to achieving our objective of providing markets with our high-performance and efficient GPU and embedded system-on-a-chip, or SOC, platforms. Our sales and marketing teams, located across our global markets, work closely with end customers in each industry. Our partner network incorporates each industry's respective OEMs, original device manufacturers, or ODMs, system builders, add-in board manufacturers, or AIBs, retailers/distributors, internet and cloud service providers, automotive manufacturers and tier-1 automotive suppliers, mapping companies, start-ups, and other ecosystem participants.
Members of our sales team have technical expertise and product and industry knowledge. We also employ a team of application engineers to assist our partner network in designing, testing, and qualifying system designs that incorporate our platforms. We believe that the depth and quality of our design support are key to improving our partner network’s time-to-market, maintaining a high level of customer satisfaction, and fostering relationships that encourage our end customers and partner network to use the next generation of our products within each platform.
To encourage the development of applications optimized for our GPUs, we seek to establish and maintain strong relationships in the software development community. Engineering and marketing personnel engage with key software developers to promote and discuss our platforms, as well as to ascertain individual product requirements and solve technical problems. Our developer program makes our products available to developers prior to launch in order to encourage the development of AI frameworks, Software Development Kits, and Application Programming Interfaces, or APIs, for software applications and game titles that are optimized for our platforms. Our Deep Learning Institute provides in-person and online training
8
for developers in industries and organizations around the world to build AI and accelerated computing applications that leverage our GPU and CUDA platforms. We now have over 700 thousand registered developers across our platforms, including accelerated computing, gaming, deep learning, autonomous machines, and others.
As NVIDIA’s business has evolved from a focus primarily on gaming products to broader markets, and from chips to platforms and complete systems, so, too, have our avenues to market. Thus, in addition to sales to customers in our partner network, certain of our platforms are also sold through e-tail channels, or direct to cloud service providers and enterprise customers.
Backlog
Our sales are primarily made pursuant to standard purchase orders. The quantity of products purchased by our customers as well as our shipment schedules are subject to revisions that reflect changes in both the customers' requirements and in manufacturing availability. Our industry is characterized by relatively short lead time orders and delivery schedules, thus, we believe that only a small portion of our backlog is non-cancelable and that the dollar amount associated with the non-cancelable portion is not significant.
Seasonality
Our GPU and Tegra processor platforms serve many markets from consumer PC gaming to enterprise workstations to government and cloud service provider datacenters, although a majority of our revenue stems from the consumer industry. Our consumer products have typically seen stronger revenue in the second half of our fiscal year. However, there can be no assurance that this trend will continue; for example, in fiscal year 2019 second half revenue was weaker than the first half.
Manufacturing
We do not directly manufacture semiconductors used for our products. Instead, we utilize a fabless manufacturing strategy, whereby we employ world-class suppliers for all phases of the manufacturing process, including wafer fabrication, assembly, testing, and packaging. This strategy uses the expertise of industry-leading suppliers that are certified by the International Organization for Standardization in such areas as fabrication, assembly, quality control and assurance, reliability, and testing. Additionally, we can avoid many of the significant costs and risks associated with owning and operating manufacturing operations. While we may directly procure certain raw materials used in the production of our products, such as substrates and a variety of components, our suppliers are responsible for procurement of the majority of the raw materials used in the production of our products. As a result, we can focus our resources on product design, additional quality assurance, marketing, and customer support.
We utilize industry-leading suppliers, such as Taiwan Semiconductor Manufacturing Company Limited and Samsung Electronics Co. Ltd, to produce our semiconductor wafers. We then utilize independent subcontractors, such as Advanced Semiconductor Engineering, Inc., Amkor Technology, BYD Auto Co. Ltd., Hon Hai Precision Industry Co., Ltd., JSI Logistics Ltd., King Yuan Electronics Co., Ltd., and Siliconware Precision Industries Company Ltd. to perform assembly, testing, and packaging of most of our products and platforms. We purchase substrates from IbidenCo. Ltd., Kinsus Interconnect Technology Corporation, and Unimicron Technology Corporation, and memory from Micron Technology, Samsung Semiconductor, Inc., and SK Hynix.
We typically receive semiconductor products from our subcontractors, perform incoming quality assurance and configuration, and then ship the semiconductors to contract equipment manufacturers, or CEMs, distributors, motherboard and AIB customers from our third-party warehouse in Hong Kong. Generally, these manufacturers assemble and test the boards based on our design kit and test specifications, and then ship our products to retailers, system builders, or OEMs as motherboard and AIB solutions.
We also utilize industry-leading contract manufacturers, or CMs, such as BYD and Hon Hai Precision Industry Co., and ODMs such as Quanta Computer and Wistron Corporation, to manufacture some of our products for sale directly to end customers. In those cases, key elements such as the GPU, SOC and memory are often consigned by us to the CMs, who are responsible for the procurement of other components used in the production process.
Working Capital
We focus considerable attention on managing our inventories and other working-capital-related items. We manage inventories by communicating with our customers and partners and then using our industry experience to forecast demand on a platform-by-platform basis. We then place manufacturing orders for our products that are based on forecasted demand. We generally maintain substantial inventories of our products because the semiconductor industry is characterized by short lead time orders and quick delivery schedules. A substantial amount of our inventories is maintained as semi-finished products that can be leveraged across a wide range of our processors to balance our customer demands.
9
Our existing cash, cash equivalents and marketable securities balances increased by
4%
to
$7.42 billion
at the end of fiscal year
2019
compared with the end of fiscal year
2018
.
Competition
The market for our products is intensely competitive and is characterized by rapid technological change and evolving industry standards. We believe that the principal competitive factors in this market are performance, breadth of product offerings, access to customers and partners and distribution channels, software support, conformity to industry standard APIs, manufacturing capabilities, processor pricing, and total system costs. We believe that our ability to remain competitive will depend on how well we are able to anticipate the features and functions that customers and partners will demand and whether we are able to deliver consistent volumes of our products at acceptable levels of quality and at competitive prices. We expect competition to increase from both existing competitors and new market entrants with products that may be less costly than ours, or may provide better performance or additional features not provided by our products. In addition, it is possible that new competitors or alliances among competitors could emerge and acquire significant market share.
A significant source of competition comes from companies that provide or intend to provide GPUs, embedded SOCs, and accelerated and AI computing processor products. Some of our competitors may have greater marketing, financial, distribution and manufacturing resources than we do and may be more able to adapt to customer or technological changes.
Our current competitors include:
|
•
|
suppliers or licensors of discrete and integrated GPUs and accelerated computing solutions, including chipsets that incorporate 3D graphics, or HPC or accelerated computing functionality as part of their solutions or platforms, such as Advanced Micro Devices, or AMD, Intel Corporation, or Intel, and Xilinx, Inc.; and
|
|
•
|
suppliers of SOC products that are embedded into automobiles, autonomous machines, and gaming devices, such as Ambarella, Inc., AMD, Broadcom Inc., Intel, Qualcomm Incorporated, Renesas Electronics Corporation, Samsung, Texas Instruments Incorporated, and Xilinx Inc.
|
Patents and Proprietary Rights
We rely primarily on a combination of patents, trademarks, trade secrets, employee and third-party nondisclosure agreements, and licensing arrangements to protect our intellectual property in the United States and internationally. Our currently issued patents have expiration dates from February 2019 to February 2038. We have numerous patents issued, allowed, and pending in the United States and in foreign jurisdictions. Our patents and pending patent applications primarily relate to our products and the technology used in connection with our products. We also rely on international treaties, organizations, and foreign laws to protect our intellectual property. The laws of certain foreign countries in which our products are or may be manufactured or sold, including various countries in Asia, may not protect our products or intellectual property rights to the same extent as the laws of the United States. This decreased protection makes the possibility of piracy of our technology and products more likely. We continuously assess whether and where to seek formal protection for particular innovations and technologies based on such factors as:
|
•
|
the location in which our products are manufactured;
|
|
•
|
our strategic technology or product directions in different countries;
|
|
•
|
the degree to which intellectual property laws exist and are meaningfully enforced in different jurisdictions; and
|
|
•
|
the commercial significance of our operations and our competitors' operations in particular countries and regions.
|
We have also licensed technology from third parties for incorporation in some of our products and for defensive reasons, and expect to continue to enter into such license agreements.
Employees
As of
January 27, 2019
, we had
13,277
employees,
9,486
of whom were engaged in research and development and
3,791
of whom were engaged in sales, marketing, operations, and administrative positions.
Environmental Regulatory Compliance
To date, we have not incurred significant expenses related to environmental regulatory compliance matters.
10
Executive Officers of the Registrant
The following sets forth certain information regarding our executive officers, their ages and positions as of
February 15, 2019
:
|
Name
|
Age
|
Position
|
||
|
Jen-Hsun Huang
|
55
|
President and Chief Executive Officer
|
||
|
Colette M. Kress
|
51
|
Executive Vice President and Chief Financial Officer
|
||
|
Ajay K. Puri
|
64
|
Executive Vice President, Worldwide Field Operations
|
||
|
Debora Shoquist
|
64
|
Executive Vice President, Operations
|
||
|
Timothy S. Teter
|
52
|
Executive Vice President and General Counsel
|
||
Jen-Hsun Huang
co-founded NVIDIA in 1993 and has served as our President, Chief Executive Officer and a member of the Board of Directors since our inception. From 1985 to 1993, Mr. Huang was employed at LSI Logic Corporation, a computer chip manufacturer, where he held a variety of positions including as Director of Coreware, the business unit responsible for LSI's SOC. From 1983 to 1985, Mr. Huang was a microprocessor designer for Advanced Micro Devices, Inc., a semiconductor company. Mr. Huang holds a B.S.E.E. degree from Oregon State University and an M.S.E.E. degree from Stanford University.
Colette M. Kress
joined NVIDIA in 2013 as Executive Vice President and Chief Financial Officer. Prior to NVIDIA, Ms. Kress most recently served as Senior Vice President and Chief Financial Officer of the Business Technology and Operations Finance organization at Cisco Systems, Inc., a networking equipment company, since 2010. At Cisco, Ms. Kress was responsible for financial strategy, planning, reporting and business development for all business segments, engineering and operations. From 1997 to 2010 Ms. Kress held a variety of positions at Microsoft Corporation, a software company, including, beginning in 2006, Chief Financial Officer of the Server and Tools division, where Ms. Kress was responsible for financial strategy, planning, reporting and business development for the division. Prior to joining Microsoft, Ms. Kress spent eight years at Texas Instruments Incorporated, a semiconductor company, where she held a variety of finance positions. Ms. Kress holds a B.S. degree in Finance from University of Arizona and an M.B.A. degree from Southern Methodist University.
Ajay K. Puri
joined NVIDIA in 2005 as Senior Vice President, Worldwide Sales and became Executive Vice President, Worldwide Field Operations in 2009. Prior to NVIDIA, he held positions in sales, marketing, and general management over a 22-year career at Sun Microsystems, Inc., a computing systems company. Mr. Puri previously held marketing, management consulting, and product development positions at Hewlett-Packard Company, an information technology company, Booz Allen Hamilton Inc., a management and technology consulting company, and Texas Instruments Incorporated. Mr. Puri holds a B.S.E.E. degree from the University of Minnesota, an M.S.E.E. degree from the California Institute of Technology and an M.B.A. degree from Harvard Business School.
Debora Shoquist
joined NVIDIA in 2007 as Senior Vice President of Operations and in 2009 became Executive Vice President of Operations. Her role has since expanded with responsibility added for Facilities in 2013, and for Information Technology in 2015. Prior to NVIDIA, Ms. Shoquist served from 2004 to 2007 as Executive Vice President of Operations at JDS Uniphase Corp., a provider of communications test and measurement solutions and optical products for the telecommunications industry. She served from 2002 to 2004 as Senior Vice President and General Manager of the Electro-Optics business at Coherent, Inc., a manufacturer of commercial and scientific laser equipment. Previously, she worked at Quantum Corp., a data protection company, as President of the Personal Computer Hard Disk Drive Division, and at Hewlett-Packard Corp. Ms. Shoquist holds a B.S. degree in Electrical Engineering from Kansas State University and a B.S. degree in Biology from Santa Clara University.
Timothy S. Teter
joined NVIDIA in 2017 as Senior Vice President, General Counsel and Secretary and became Executive Vice President, General Counsel and Secretary in February 2018. Prior to NVIDIA, Mr. Teter spent more than two decades at the law firm of Cooley LLP. He was most recently a partner at Cooley, where he focused on litigating patent and technology related matters. Prior to attending law school, he worked as an engineer at Lockheed Missiles and Space Company. Mr. Teter holds a B.S. degree in Mechanical Engineering from the University of California at Davis and a J.D. degree from Stanford Law School.
Available Information
Our annual reports on Form 10-K, quarterly reports on Form 10-Q, current reports on Form 8-K and, if applicable, amendments to those reports filed or furnished pursuant to Section 13(a) of the Securities Exchange Act of 1934, as amended, are available free of charge on or through our web site,
http://www.nvidia.com
, as soon as reasonably practicable after we electronically file such material with, or furnish it to, the Securities and Exchange Commission, or the SEC. The SEC’s website,
http://www.sec.gov
, contains reports, proxy and information statements, and other information regarding
11
issuers that file electronically with the SEC. Our web site and the information on it or connected to it are not a part of this Annual Report on Form 10-K.
ITEM 1A. RISK FACTORS
In evaluating NVIDIA and our business, the following factors should be considered in addition to the other information in this Annual Report on Form 10-K. Before you buy our common stock, you should know that making such an investment involves risks including, but not limited to, the risks described below. Any one of the following risks could harm our business, financial condition, results of operations or reputation, which could cause our stock price to decline, and you may lose all or a part of your investment. Additional risks, trends and uncertainties not presently known to us or that we currently believe are immaterial may also harm our business, financial condition, results of operations or reputation.
Risks Related to Our Business, Industry and Partners
If we fail to meet the evolving needs of our markets, or identify new products, services or technologies, our revenue and financial results may be adversely impacted.
We have created GPU-based visual and accelerated computing platforms that address four large markets: Gaming, Professional Visualization, Datacenter, and Automotive. These markets often experience rapid technological change, changes in customer requirements, new product introductions and enhancements, and evolving industry standards. Our success depends on our ability to identify these emerging industry changes and to develop new (or enhance our existing) products, services and technologies that meet the evolving needs of these markets. Such activities may require considerable technical, financial, compliance, sales and marketing investments. We currently devote significant resources to the development of technologies and business offerings in markets where we have a limited operating history, such as the automotive and datacenter markets, which presents additional risks to our business. We must also continue to develop the infrastructure needed to appropriately scale our business in these areas, including customer service and customer support. We also must meet customer safety and compliance standards, which are subject to change. Additionally, we continue to make considerable investments in research and development, which may not produce significant revenue for several years, if at all. If our investments are unsuccessful and we fail to develop new products, services and technologies, or if we focus on technologies that do not become widely adopted, our business, revenue, financial condition and results of operations could be adversely affected. We cannot assure you that our strategic direction will result in innovative products and technologies that provide value to our customers, partners and ultimately, our shareholders. If we fail to anticipate the changing needs of our target markets and emerging technology trends, or if we do not appropriately adapt that strategy as market conditions evolve, in a timely manner to exploit potential market opportunities, our business will be harmed.
Competition in our current and target markets could prevent us from growing our revenue.
Our target markets remain extremely competitive, and we expect competition to intensify as current competitors expand their product and/or service offerings, industry standards continue to evolve, customer needs change and new competitors enter these markets. Our competitors’ products, services and technologies may be less costly, or may offer superior functionality or better features, than ours, which may result, among other things, in lower than expected selling prices for our products. In addition, some of our competitors operate and maintain their own fabrication facilities, have longer operating histories, larger customer bases, more comprehensive intellectual property, or IP, portfolios and patent protections, and greater financial, sales, marketing and distribution resources than we do. These competitors may be able to more effectively identify and capitalize upon opportunities in new markets and end user customer trends, quickly transition their products, including semiconductor products, to increasingly smaller line width geometries, and obtain sufficient foundry capacity and packaging materials, which could harm our business. If we are unable to successfully compete in our target markets, respond to changes in our target markets or introduce new offerings to meet the needs of this competitive environment, including in significant international markets such as China, demand for our products, services and technologies could decrease, which would cause our revenue to decline and cause our results of operations to suffer. In addition, the competitive landscape in our target markets has changed and may continue to evolve due to a trend toward consolidation, which could lead to fewer customers, partners, or suppliers, any of which could negatively affect our financial results.
System security and data protection breaches, as well as cyber-attacks, could disrupt our operations, reduce our expected revenue and increase our expenses, which could adversely affect our stock price and damage our reputation.
Security breaches, computer malware and cyber-attacks have become more prevalent and sophisticated in recent years. These threats are constantly evolving, making it increasingly difficult to successfully defend against them or implement adequate preventative measures. These attacks have occurred on our systems in the past and are expected to occur in the future. Experienced computer programmers, hackers and employees may penetrate our security controls and misappropriate or compromise our confidential information, or that of our employees or third parties. These attacks may
12
create system disruptions or cause shutdowns. These hackers may also develop and deploy viruses, worms and other malicious software programs that attack or otherwise exploit security vulnerabilities in our products, including consumer and automotive products, where we utilize over-the-air updates to improve functionality over time. For portions of our IT infrastructure, including business management and communication software products, we rely on products and services provided by third parties. These providers may also experience breaches and attacks to their products which may impact our systems. Data security breaches may also result from non-technical means, such as actions by an employee with access to our systems. To defend against security threats, both to our internal systems and those of our customers, we must continuously engineer more secure products and enhance security and reliability features, which may result in increased expenses.
Actual or perceived breaches of our security measures or the accidental loss, inadvertent disclosure or unapproved dissemination of proprietary information or sensitive or confidential data about us, our partners, our customers or third parties could expose us and the parties affected to a risk of loss or misuse of this information, resulting in litigation and potential liability, paying damages, regulatory inquiries or actions, damage to our brand and reputation or other harm to our business. Our efforts to prevent and overcome these challenges could increase our expenses and may not be successful. We may experience interruptions, delays, cessation of service and loss of existing or potential customers. Such disruptions could adversely impact our ability to fulfill orders and interrupt other critical functions. Delayed sales, lower margins or lost customers as a result of these disruptions could adversely affect our financial results, stock price and reputation.
If our products contain significant defects, we could incur significant expenses to remediate such defects, our reputation could be damaged, and we could lose market share.
Our products are complex and may contain defects or security vulnerabilities, or experience failures or unsatisfactory performance due to any number of issues in design, fabrication, packaging, materials and/or use within a system. These risks may increase as our products are introduced into new devices, markets, technologies and applications, including into the automotive market, or as new versions are released. Some errors in our products or services may only be discovered after a product or service has been shipped or used by customers or the end users of such product. Undiscovered vulnerabilities in our products or services could expose our customers or end users to hackers or other unscrupulous third parties who develop and deploy viruses, worms and other malicious software programs that could attack our products or services. Failure of our products to perform to specifications, or other product defects, could lead to substantial damage to the products we sell directly to customers, the end product in which our device has been integrated by OEMs, ODMs, AIBs and Tier 1 automotive suppliers, and to the user of such end product. Any such defect may cause us to incur significant warranty, support and repair or replacement costs, write off the value of related inventory, cause us to lose market share, and divert the attention of our engineering personnel from our product development efforts to find and correct the issue. In addition, an error or defect in new products or releases or related software drivers after commencement of commercial shipments could result in failure to achieve market acceptance or loss of design wins, harm our relationships with customers and partners and harm consumers’ perceptions of our brand. Also, we may be required to reimburse our customers, partners or consumers, including costs to repair or replace products in the field. A product recall, including automotive recalls or a recall due to a bug in our products, or a significant number of product returns could be expensive, damage our reputation, harm our ability to attract new customers, result in the shifting of business to our competitors and result in litigation against us, such as product liability suits. If a product liability claim is brought against us, the cost of defending the claim could be significant and would divert the efforts of our technical and management personnel, and harm our business. Further, our business liability insurance may be inadequate or future coverage may be unavailable on acceptable terms, which could adversely impact our financial results.
We depend on third parties and their technology to manufacture, assemble, test and/or package our products, which reduces our control over product quantity and quality, manufacturing yields, development, enhancement and product delivery schedule and could harm our business.
We do not manufacture the silicon wafers used for our GPUs and Tegra processors and do not own or operate a wafer fabrication facility. Instead, we are dependent on industry-leading foundries, such as Taiwan Semiconductor Manufacturing Company Limited and Samsung Electronics Co. Ltd., to manufacture our semiconductor wafers using their fabrication equipment and techniques. Similarly, we do not directly assemble, test or package our products, but instead rely on independent subcontractors. We do not have long-term commitment contracts with these foundries or subcontractors. As a result, we face several significant risks which could have an adverse effect on our ability to meet customer demand and/or negatively impact our business operations, gross margin, revenue and/or financial results, including:
|
•
|
a lack of guaranteed supply of wafers and other components and potential higher wafer and component prices due to supply constraints;
|
|
•
|
a failure by our foundries to procure raw materials or to provide or allocate adequate or any manufacturing or test capacity for our products;
|
13
|
•
|
a failure to develop, obtain or successfully implement high quality, leading-edge process technologies, including transitions to smaller geometry process technologies such as advanced process node technologies and memory designs needed to manufacture our products profitably or on a timely basis;
|
|
•
|
loss of a supplier and additional expense and/or production delays as a result of qualifying a new foundry or subcontractor and commencing volume production or testing in the event of a loss of or a decision to add or change a supplier;
|
|
•
|
a lack of direct control over delivery schedules or product quantity and quality; and
|
|
•
|
delays in product shipments, shortages, a decrease in product quality and/or higher expenses in the event our subcontractors or foundries prioritize our competitors’ orders over our orders or otherwise.
|
In addition, low manufacturing yields could have an adverse effect on our ability to meet customer demand, increase manufacturing costs, harm customer or partner relationships, and/or negatively impact our business operations, gross margin, revenue and/or financial results. Manufacturing yields for our products are a function of product design, which is developed largely by us, and process technology, which typically is proprietary to the foundry. Low yields may result from either product design or process technology failure. We do not know whether a yield problem will exist until our design is actually manufactured by the foundry. As a result, yield problems may not be identified until well into the manufacturing process and require us and the foundry to cooperate to resolve the problem.
We also rely on third-party software development tools to assist us in the design, simulation and verification of new products or product enhancements, and to bring such new products and enhancements to market in a timely manner. In the past, we have experienced delays in the introduction of products and enhancements as a result of the inability of then available software development tools to fully simulate the complex features and functionalities of our products. The design requirements necessary to meet consumer demands for more features and greater functionality from our products may exceed the capabilities of available software development tools. If we miss design cycles or lose design wins due to the unavailability of such software development tools, we could lose market share and our revenues could decline. If we fail to achieve design wins for our products, our business will be harmed.
For our products that we do not sell directly to consumers, achieving design wins is an important success factor. Achieving design wins may involve a lengthy process in pursuit of a customer opportunity and depend on our ability to anticipate features and functionality that customers and consumers will demand. Failure to obtain a particular design win may prevent us from obtaining design wins in subsequent generations of a particular product. This could result in lost revenue and could weaken our position in future competitive bid selection processes.
Unanticipated changes in industry standards could render our products incompatible with products developed by major hardware manufacturers and software developers. Further, if our products are not in compliance with prevailing industry standards, including safety standards, our customers may not incorporate our products into their design strategies. Winning a product design does not guarantee sales to a customer or that we will realize as much revenue as anticipated, if any.
Business disruptions could harm our business, lead to a decline in revenues and increase our costs.
Our worldwide operations could be disrupted by earthquakes, telecommunications failures, power or water shortages, outages at cloud service providers, tsunamis, floods, hurricanes, typhoons, fires, extreme weather conditions, cyber-attacks, terrorist attacks, medical epidemics or pandemics and other natural or man-made disasters, catastrophic events or climate change. The occurrence of any of these disruptions could harm our business and result in significant losses, a decline in revenue and an increase in our costs and expenses. Any of these business disruptions could require substantial expenditures and recovery time in order to fully resume operations. Our corporate headquarters, and a portion of our research and development activities, are located in California, and other critical business operations, finished goods inventory, and some of our suppliers are located in Asia, near major earthquake faults known for seismic activity. In addition, a large portion of our current datacenter capacity is located in California, making our operations vulnerable to natural disasters or other business disruptions occurring in these geographical areas. The manufacture of product components, the final assembly of our products and other critical operations are concentrated in certain geographic locations, including Taiwan, China, and Korea. Geopolitical change or changes in government regulations and policies in the United States or abroad also may result in changing regulatory requirements, trade policies, import duties and economic disruptions that could impact our operating strategies, product demand, access to global markets, hiring, and profitability. In particular, revisions to laws or regulations or their interpretation and enforcement could result in increased taxation, trade sanctions, the imposition of import duties or tariffs, restrictions and controls on imports or exports, or other retaliatory actions, which could have an adverse effect on our business plans. For example, regulations to implement the Export Control Reform Act of 2018 could have an adverse effect on our business plans. Catastrophic events can also have an impact on third-party vendors who provide us critical infrastructure services for IT and research and development systems and personnel. Our operations
14
could be harmed if manufacturing, logistics or other operations in these locations are disrupted for any reason, including natural disasters, high heat events or water shortages, information technology system failures, military actions or economic, business, labor, environmental, public health, regulatory or political issues. The ultimate impact on us, our third-party foundries and other suppliers and our general infrastructure of being located near major earthquake faults and being consolidated in certain geographical areas is unknown. In the event a major earthquake or other disaster or catastrophic event affects us or the third-party systems on which we rely, our business could be harmed as a result of declines in revenue, increases in expenses, substantial expenditures and time spent to fully resume operations.
If we fail to estimate customer demand properly, our financial results could be harmed.
We manufacture our GPUs and Tegra processors based on estimates of customer demand and requirements. We sell many of our products through a channel model, and our channel customers sell to retailers, distributors, and/or end customers. As a result, the decisions made by our channel partners, retailers, and distributors in response to changing market conditions and the changing demand for our products could impact our financial results. In order to have shorter shipment lead times and quicker delivery schedules for our customers, we may build inventories for anticipated periods of growth which do not occur, may build inventory anticipating demand that does not materialize, or may build inventory to serve what we believe is pent-up demand. Such decisions may and have resulted in prolonged channel sell-through, as we experienced with our mid-range gaming GPUs in fiscal year 2019. In estimating demand, we make multiple assumptions, any of which may prove to be incorrect. Situations that may result in excess or obsolete inventory include:
|
•
|
changes in business and economic conditions, including downturns in our target markets and/or overall economy;
|
|
•
|
changes in consumer confidence caused by changes in market conditions, including changes in the credit market;
|
|
•
|
a sudden and significant decrease in demand for our products;
|
|
•
|
a higher incidence of inventory obsolescence because of rapidly changing technology or customer requirements;
|
|
•
|
our introduction of new products resulting in lower demand for older products;
|
|
•
|
less demand than expected for newly-introduced products; or
|
|
•
|
increased competition, including competitive pricing actions.
|
The cancellation or deferral of customer purchase orders could result in our holding excess inventory, which could adversely affect our gross margins. In addition, because we often sell a substantial portion of our products in the last month of each quarter, we may not be able to reduce our inventory purchase commitments in a timely manner in response to customer cancellations or deferrals. We could be required to write-down our inventory to the lower of cost or market or write-off excess inventory, and we could experience a reduction in average selling prices if we incorrectly forecast product demand, any of which could harm our financial results.
Conversely, if we underestimate our customers' demand for our products, our foundry partners may not have adequate lead-time or capacity to increase production and we may not be able to obtain sufficient inventory to fill customers' orders on a timely basis. We may also face supply constraints caused by natural disasters or other events. In such cases, even if we are able to increase production levels to meet customer demand, we may not be able to do so in a cost-effective or timely manner. If we fail to fulfill our customers' orders on a timely basis, or at all, our customer relationships could be damaged, we could lose revenue and market share and our reputation could be damaged.
We are subject to risks and uncertainties associated with international operations, which may harm our business.
We conduct our business worldwide and we have offices in various countries outside of the United States. Our semiconductor wafers are manufactured, assembled, tested and packaged by third parties located outside of the United States. We also generate a significant portion of our revenue from sales outside the United States. We allocate revenue to individual countries based on the location to which the products are initially billed even if our customers’ revenue is attributable to end customers that are located in a different location. Revenue from sales outside of the United States accounted for
87%
of total revenue for each of fiscal years
2019
,
2018
, and
2017
. Revenue from billings to China, including Hong Kong, was 24% of our revenue for fiscal year 2019, even if our customers' revenue is attributable to end customers that are located in a different location. Additionally, as of
January 27, 2019
, approximately 46% of our employees were located outside of the United States. The global nature of our business subjects us to a number of risks and uncertainties, which could have a material adverse effect on our business, financial condition and results of operations, including:
|
•
|
international economic and political conditions, including as a result of the United Kingdom's vote to withdraw from the European Union, and other political tensions between countries in which we do business;
|
|
•
|
unexpected changes in, or impositions of, legislative or regulatory requirements, including changes in tax laws;
|
|
•
|
differing legal standards with respect to protection of intellectual property and employment practices;
|
15
|
•
|
local business and cultural factors that differ from our normal standards and practices, including business practices that we are prohibited from engaging in by the Foreign Corrupt Practices Act and other anticorruption laws and regulations;
|
|
•
|
exporting or importing issues related to export or import restrictions, including deemed export restrictions, tariffs, quotas and other trade barriers and restrictions;
|
|
•
|
disruptions of capital and trading markets and currency fluctuations; and
|
|
•
|
increased costs due to imposition of climate change regulations, such as carbon taxes, fuel or energy taxes, and pollution limits.
|
If our sales outside of the United States are delayed or cancelled because of any of the above factors, our revenue may be negatively impacted.
If we are unable to attract, retain and motivate our executives and key employees, we may not be able to execute our business strategy effectively.
To be competitive and execute our business strategy successfully, we must attract, retain and motivate our executives and key employees. The market for highly skilled workers and leaders in our industry is extremely competitive. In particular, hiring qualified executives, scientists, engineers, technical staff and research and development personnel is critical to our business. Additionally, changes in immigration and work permit laws and regulations or the administration or interpretation of such laws or regulations could impair our ability to attract and retain highly qualified employees. If we are less successful in our recruiting efforts, or if we cannot retain key employees, our ability to develop and deliver successful products and services may be adversely affected. Additionally, competition for personnel results in increased costs in the form of cash and stock-based compensation. The interpretation and application of employment related laws to our workforce practices may result in increased operating costs and less flexibility in how we meet our workforce needs. Effective succession planning is also important to our long-term success. Failure to ensure effective transfer of knowledge and smooth transitions involving key employees could hinder our strategic planning and execution.
We may not be able to realize the potential financial or strategic benefits of business acquisitions or strategic investments and we may not be able to successfully integrate acquisition targets, which could hurt our ability to grow our business, develop new products or sell our products.
We have in the past acquired and invested in, and may continue to acquire and invest in, other businesses that offer products, services and technologies that we believe will help expand or enhance our existing products, strategic objectives and business. The risks associated with past or future acquisitions or investments could impair our ability to grow our business, develop new products or sell our products, and ultimately could have a negative impact on our growth or our financial results. Given that our resources are limited, our decision to pursue a transaction has opportunity costs; accordingly, if we pursue a particular transaction, we may need to forgo the prospect of entering into other transactions that could help us achieve our strategic objectives. Additional risks related to acquisitions or strategic investments include, but are not limited to:
|
•
|
difficulty in combining the technology, products, operations or workforce of the acquired business with our business;
|
|
•
|
diversion of capital and other resources, including management’s attention;
|
|
•
|
assumption of liabilities and incurring amortization expenses, impairment charges to goodwill or write-downs of acquired assets;
|
|
•
|
difficulty in realizing a satisfactory return, if at all;
|
|
•
|
difficulty in obtaining regulatory, other approvals or financing;
|
|
•
|
failure and costs associated with the failure to consummate a proposed acquisition or other strategic investment;
|
|
•
|
legal proceedings initiated as a result of an acquisition or investment;
|
|
•
|
uncertainties and time needed to realize the benefits of an acquisition or strategic investment, if at all;
|
|
•
|
the need to later divest acquired assets if an acquisition does not meet our expectations;
|
|
•
|
potential failure of our due diligence processes to identify significant issues with the acquired assets or company; and
|
|
•
|
impairment of relationships with, or loss of our or our target’s, employees, vendors and customers, as a result of our acquisition or investment.
|
16
Risks Related to Regulatory, Legal, Our Common Stock and Other Matters
Actions to adequately protect our IP rights could result in substantial costs to us and our ability to compete could be harmed if we are unsuccessful in doing so or if we are prohibited from making or selling our products.
We have in the past, currently are, and may in the future become involved in lawsuits or other legal proceedings alleging patent infringement or other intellectual property rights violations by us, our employees or parties that we have agreed to indemnify for certain claims of infringement. An unfavorable ruling in any such intellectual property related litigation could include significant damages, invalidation of a patent or family of patents, indemnification of customers, payment of lost profits, or, when it has been sought, injunctive relief. Claims that our products or processes infringe the IP rights of others, regardless of their merit, could cause us to incur significant costs to respond to, defend, and resolve such claims, and they may also divert the efforts and attention of management and technical personnel.
We may commence litigation or other legal proceedings in order to protect our intellectual property rights. Such proceedings may increase our operating expenses, which could negatively impact our operating results. Further, we could be subject to countersuits as a result of our initiation of litigation. If infringement claims are made against us or our products are found to infringe a third party’s patent or intellectual property, we or one of our indemnitees may have to seek a license to the third party’s patent or other intellectual property rights. However, we may not be able to obtain licenses at all or on terms acceptable to us particularly from our competitors. If we or one of our indemnitees is unable to obtain a license from a third party for technology that we use or that is used in one of our products, we could be subject to substantial liabilities or have to suspend or discontinue the manufacture and sale of one or more of our products. We may also have to make royalty or other payments, or cross license our technology. If these arrangements are not concluded on commercially reasonable terms, our business could be negatively impacted. Furthermore, the indemnification of a customer or other indemnitee may increase our operating expenses which could negatively impact our operating results.
Our success depends in part on protecting our intellectual property. To accomplish this, we rely primarily on a combination of patents, trademarks, trade secrets, employee and third-party nondisclosure agreements, licensing arrangements, and the laws of the countries in which we operate to protect our intellectual property in the United States and internationally. We may be required to spend significant resources to monitor and protect our intellectual property rights, and even with significant expenditures we may not be able to protect our intellectual property rights that are valuable to our business. The laws of certain foreign countries may not protect our products or intellectual property rights to the same extent as the laws of the United States. This makes the possibility of piracy of our technology and products more likely. In addition, the theft or unauthorized use or publication of our trade secrets and other confidential business information could harm our competitive position and reduce acceptance of our products; as a result, the value of our investment in research and development, product development, and marketing could be reduced. We continuously assess whether and where to seek formal protection for existing and new innovations and technologies, but cannot be certain whether our applications for such protections will be approved, and, if approved, whether we will be able to enforce such protections.
Our operating results have in the past fluctuated and may in the future fluctuate, and if our operating results are below the expectations of securities analysts or investors, our stock price could decline.
Our operating results have in the past fluctuated and may in the future continue to fluctuate due to numerous factors. Therefore, investors should not rely on quarterly comparisons of our results of operations as an indication of our future performance.
Factors, other than those described elsewhere in these risk factors, that could affect our results of operations in the future include, but are not limited to:
|
•
|
our ability to achieve volume production of our next-generation products;
|
|
•
|
our inability to adjust spending to offset revenue shortfalls due to the multi-year development cycle for some of our products and services;
|
|
•
|
fluctuations in the demand for our products related to cryptocurrencies;
|
|
•
|
changes in the timing of product orders due to unexpected delays in the introduction of our partners’ products;
|
|
•
|
our ability to cover the manufacturing and design costs of our products through competitive pricing;
|
|
•
|
our ability to comply and continue to comply with our customers’ contractual obligations;
|
|
•
|
product rates of return in excess of that forecasted or expected due to quality issues;
|
|
•
|
our ability to secure appropriate safety certifications and meet industry safety standards;
|
|
•
|
supply constraints for and changes in the cost of the other components incorporated into our products
|
|
•
|
inventory write-downs;
|
17
|
•
|
our ability to continue generating revenue from our partner network, including by generating sales within our partner network and ensuring our products are incorporated into our partners product ecosystems, and our partner network’s ability to sell products that incorporate our GPUs and Tegra processors;
|
|
•
|
the inability of certain of our customers to make required payments to us, and our ability to obtain credit insurance over the purchasing credit extended to these customers;
|
|
•
|
customer bad debt write-offs;
|
|
•
|
any unanticipated costs associated with environmental liabilities;
|
|
•
|
unexpected costs related to our ownership of real property;
|
|
•
|
changes in financial accounting standards or interpretations of existing standards; and
|
|
•
|
general macroeconomic or industry events and factors affecting the overall market and our target markets.
|
Any one or more of the factors discussed above could prevent us from achieving our expected future financial results. Any such failure to meet our expectations or the expectations of our investors or security analysts could cause our stock price to decline or experience substantial price volatility.
Privacy concerns relating to our products and services could damage our reputation, deter current and potential users from using our products and services, result in liability, or result in legal or regulatory proceedings.
Our products and services may provide us with access to sensitive, confidential or personal data or information that is subject to privacy and security laws and regulations. Concerns about our practices with regard to the collection, use, retention, security or disclosure of personal information or other privacy-related matters, even if unfounded, could damage our reputation and adversely affect our operating results. The theft, loss, or misuse of personal data collected, used, stored, or transferred by us to run our business or by one of our partners could result in significantly increased security costs, damage to our reputation, regulatory proceedings, disruption of our business activities or increased costs related to defending legal claims.
Worldwide regulatory authorities are considering and have approved various legislative proposals concerning data protection, which continue to evolve and apply to our business. For example, the European Union adopted the General Data Protection Regulation, or GDPR, which requires companies to meet new requirements beginning in May 2018 regarding the handling of personal data, including its use, protection and the ability of persons whose data is stored to correct or delete such data about themselves. Failure to meet GDPR requirements could result in penalties of up to 4% of worldwide revenue. In addition, the interpretation and application of consumer and data protection laws in the United States, Europe and elsewhere are often uncertain and fluid, and may be interpreted and applied in a manner that is inconsistent with our data practices. If so, we may be ordered to change our data practices and/or be fined. Complying with these changing laws has caused, and could continue to cause, us to incur substantial costs, which could have an adverse effect on our business and results of operations. Further, failure to comply with existing or new rules may result in significant penalties or orders to stop the alleged noncompliant activity.
We may have exposure to additional tax liabilities and our operating results may be adversely impacted by higher than expected tax rates.
As a multinational corporation, we are subject to income taxes as well as non-income based taxes, such as payroll, sales, use, value-added, net worth, property and goods and services taxes, in both the United States and various foreign jurisdictions. Our domestic and international tax liabilities are subject to the allocation of revenue and expenses in different jurisdictions. Significant judgment is required in determining our worldwide provision for income taxes and other tax liabilities. Further, changes in United States federal, and state or international tax laws applicable to multinational corporations or other fundamental law changes may materially impact our tax expense and cash flows, as we experienced in fiscal year 2018 with the passage of the Tax Cuts and Jobs Act, or TCJA.
Our future effective tax rate may be affected by such factors as changes in tax laws, changes in our business or statutory rates, changes in jurisdictions in which our profits are determined to be earned and taxed, changes in available tax credits, the resolution of issues arising from tax audits, changes in United States generally accepted accounting principles, adjustments to income taxes upon finalization of tax returns, increases in expenses not deductible for tax purposes, changes in the valuation of our deferred tax assets and liabilities and in deferred tax valuation allowances, changing interpretation of existing laws or regulations, the impact of accounting for stock-based compensation and the recognition of excess tax benefits and tax deficiencies within the income tax provision in the period in which they occur, the impact of accounting for business combinations, shifts in the amount of earnings in the United States compared with other regions in the world and overall levels of income before tax, changes in our international organization, as well as the expiration of statute of limitations and settlements of audits. Any changes in our effective tax rate may reduce our net income.
18
Our business is exposed to the risks associated with litigation, investigations and regulatory proceedings.
We currently and may in the future face legal, administrative and regulatory proceedings, claims, demands and/or investigations involving shareholder, consumer, competition and/or other issues relating to our business on a global basis. For example, multiple securities litigation claims have recently been filed against us and certain of our officers based on the dissemination of allegedly false and misleading statements related to channel inventory and the impact of cryptocurrency mining on GPU demand. In addition, a stockholder, purporting to act on behalf of the Company, filed a derivative lawsuit seeking to assert claims on behalf of the Company against the members of our board of directors and certain officers based on the dissemination of allegedly false and misleading statements related to channel inventory and the impact of cryptocurrency mining on GPU demand.
Litigation and regulatory proceedings are inherently uncertain, and adverse rulings could occur, including monetary damages, or an injunction stopping us from manufacturing or selling certain products, engaging in certain business practices, or requiring other remedies, such as compulsory licensing of patents. An unfavorable outcome or settlement may result in a material adverse impact on our business, results of operations, financial position, and overall trends. In addition, regardless of the outcome, litigation can be costly, time-consuming, and disruptive to our operations.
In addition, the laws and regulations our business is subject to are complex, and change frequently. We may be required to incur significant expense to comply with, or remedy violations of, these regulations.
Delaware law and provisions in our certificate of incorporation, our bylaws and our agreement with Microsoft Corporation could delay or prevent a change in control.
Our status as a Delaware corporation and the anti-takeover provisions of the Delaware General Corporation Law may discourage, delay, or prevent a change in control by prohibiting us from engaging in a business combination with an interested shareholder for a period of three years after the person becomes an interested shareholder, even if a change of control would be beneficial to our existing shareholders. In addition, our certificate of incorporation and bylaws contain provisions that could make it more difficult for a third party to acquire a majority of our outstanding voting stock. These provisions include the following:
|
•
|
the ability of our Board of Directors to create and issue preferred stock without prior shareholder approval;
|
|
•
|
the prohibition of shareholder action by written consent;
|
|
•
|
advance notice requirements for director nominations and shareholder proposals;
|
|
•
|
the ability of our Board of Directors to increase or decrease the number of directors without shareholder approval;
|
|
•
|
a super-majority voting requirement to amend some provisions in our certificate of incorporation and bylaws;
|
|
•
|
the inability of our shareholders to call special meetings of shareholders; and
|
|
•
|
the ability of our Board of Directors to make, amend or repeal our bylaws.
|
On March 5, 2000, we entered into an agreement with Microsoft in which we agreed to develop and sell graphics chips and to license certain technology to Microsoft and its licensees for use in the Xbox. Under the agreement, if an individual or corporation makes an offer to purchase shares equal to or greater than 30% of the outstanding shares of our common stock, Microsoft may have first and last rights of refusal to purchase the stock. The Microsoft provision and the other factors listed above could also delay or prevent a change in control of NVIDIA. These provisions could also discourage proxy contests and make it more difficult for shareholders to elect directors of their choosing and to cause us to take other corporate actions they desire.
ITEM 1B. UNRESOLVED STAFF COMMENTS
Not applicable.
ITEM 2. PROPERTIES
Our headquarters complex is located in Santa Clara, California. It includes ten leased commercial buildings totaling
981,389
square feet, and real property that we own totaling 1,257,346 square feet. Our owned property consists of two commercial buildings on
36
acres of land. In addition, we also lease datacenter space in Santa Clara, California.
Outside of Santa Clara, California, we lease facilities in Austin, Texas and a number of regional facilities in other U.S. locations that are used as research and development centers and/or sales and administrative offices. Outside of the United States, we own a building in Hyderabad, India, that is being used primarily as a research and development center. We also lease facilities in various international locations that are used as research and development centers and/or sales and
19
administrative offices. These leased facilities are located primarily in Asia and Europe. In addition, we also lease datacenter space in various locations around the world.
We believe that we currently have sufficient facilities to conduct our operations for the next twelve months. For additional information regarding obligations under leases, refer to
Note 12
of the Notes to the Consolidated Financial Statements in Part IV, Item 15 of this Annual Report on Form 10-K under the subheading “Lease Obligations,” which information is hereby incorporated by reference.
ITEM 3. LEGAL PROCEEDINGS
Please see
Note 12
of the Notes to the Consolidated Financial Statements in Part IV, Item 15 of this Annual Report on Form 10-K for a discussion of our legal proceedings.
ITEM 4. MINE SAFETY DISCLOSURES
Not Applicable.
PART II
ITEM 5. MARKET FOR REGISTRANT’S COMMON EQUITY, RELATED STOCKHOLDER MATTERS AND ISSUER PURCHASES OF EQUITY SECURITIES
Our common stock is traded on the Nasdaq Global Select Market under the symbol NVDA. Public trading of our common stock began on January 22, 1999. Prior to that, there was no public market for our common stock. As of
February 15, 2019
, we had approximately 317 registered shareholders, not including those shares held in street or nominee name.
Issuer Purchases of Equity Securities
Beginning August 2004, our Board of Directors authorized us to repurchase our stock.
Since the inception of our share repurchase program, we have repurchased an aggregate of
260 million
shares for a total cost of
$7.08 billion
through
January 27, 2019
. All shares delivered from these repurchases have been placed into treasury stock.
In November 2018, the Board authorized an additional
$7.00 billion
under our share repurchase program and extended it through the end of December 2022. As of
January 27, 2019
, we were authorized to repurchase additional shares of our common stock up to
$7.24 billion
.
We intend to return $3.00 billion to shareholders by the end of fiscal year 2020, including $700 million of share repurchases we made in the fourth quarter of fiscal year 2019.
The repurchases can be made in the open market, in privately negotiated transactions, or in structured share repurchase programs, and can be made in one or more larger repurchases, in compliance with Rule 10b-18 of the Securities Exchange Act of 1934, as amended, subject to market conditions, applicable legal requirements, and other factors. The program does not obligate NVIDIA to acquire any particular amount of common stock and the program may be suspended at any time at our discretion.
20
The following table presents details of our share repurchase transactions during the fourth quarter of fiscal year 2019:
|
Period
|
Total Number of Shares Purchased (In thousands)
|
Average Price Paid per Share
|
Total Number of Shares Purchased as Part of Publicly Announced Program (In thousands)
|
Approximate Dollar Value of Shares that May Yet Be Purchased Under the Program (In billions)
|
||||||||
|
October 29, 2018 - November 25, 2018
|
123
|
$
|
195.72
|
|
123
|
$
|
7.94
|
|
||||
|
November 26, 2018 - December 23, 2018
|
3,304
|
$
|
142.05
|
|
3,304
|
$
|
7.47
|
|
||||
|
December 24, 2018 - January 27, 2019
|
1,777
|
$
|
129.87
|
|
1,777
|
$
|
7.24
|
|
||||
|
Total
|
5,204
|
5,204
|
||||||||||
Transactions Related to our 1.00% Convertible Senior Notes Due 2018 and Note Hedges
During fiscal year
2019
, we issued an aggregate of
714 thousand
shares of our common stock upon settlement of
$16 million
in principal amount of
1.00%
Convertible Senior Notes Due 2018, or the Convertible Notes, submitted for conversion. In connection with these conversions, we exercised a portion of our Note Hedges to acquire an equal number of shares of our common stock. The counterparty to the Note Hedges may be deemed an “affiliated purchaser” and may have purchased the shares of our common stock deliverable to us upon this exercise of our option. Refer to
Note 11
of the Notes to the Consolidated Financial Statements in Part IV, Item 15 of this Annual Report on Form 10-K for further discussion regarding the Convertible Notes and the Note Hedges.
Restricted Stock Unit Share Withholding
We also withhold common stock shares associated with net share settlements to cover tax withholding obligations upon the vesting of restricted stock unit awards under our employee equity incentive program. During fiscal year
2019
, we withheld approximately
4 million
shares at a total cost of
$1.03 billion
through net share settlements. Refer to Note 3 of the Notes to the Consolidated Financial Statements in Part IV, Item 15 of this Annual Report on Form 10-K for further discussion regarding our equity incentive plans.
21
Stock Performance Graphs
The following graph compares the cumulative total shareholder return for our common stock, the S&P 500 Index, and the Nasdaq 100 Index for the five years ended
January 27, 2019
. The graph assumes that $100 was invested on January 26, 2014 in our common stock and in each of the S&P 500 Index and the Nasdaq 100 Index. Our common stock is a component of each of the presented indices. Total return assumes reinvestment of dividends in each of the indices indicated. Total return is based on historical results and is not intended to indicate future performance.
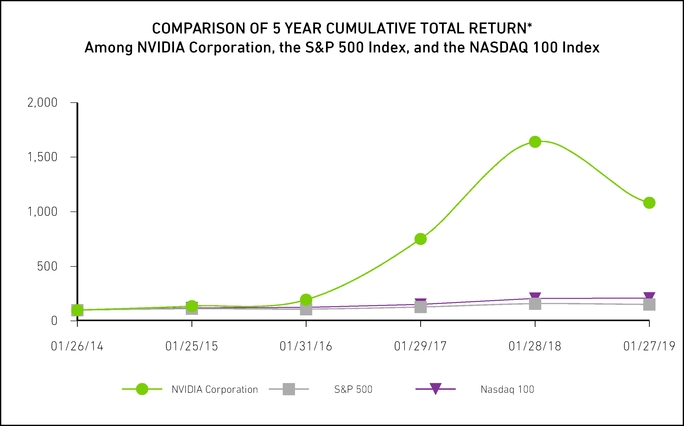
*$100 invested on 1/26/14 in stock and in indices, including reinvestment of dividends.
The S&P 500 index is proprietary to and are calculated, distributed and marketed by S&P Opco, LLC (a subsidiary of S&P Dow Jones Indices LLC), its affiliates and/or its licensors and has been licensed for use. S&P® and S&P 500®, among other famous marks, are registered trademarks of Standard & Poor’s Financial Services LLC, and Dow Jones® is a registered trademark of Dow Jones Trademark Holdings LLC. © 2016 S&P Dow Jones Indices LLC, its affiliates and/or its licensors. All rights reserved.
|
|
1/26/2014
|
1/25/2015
|
1/31/2016
|
1/29/2017
|
1/28/2018
|
1/27/2019
|
|||||||||||||||||
|
NVIDIA Corporation
|
$
|
100.00
|
|
$
|
135.49
|
|
$
|
194.78
|
|
$
|
750.36
|
|
$
|
1,639.87
|
|
$
|
1,082.30
|
|
|||||
|
S&P 500
|
$
|
100.00
|
|
$
|
111.92
|
|
$
|
108.84
|
|
$
|
127.84
|
|
$
|
158.41
|
|
$
|
151.70
|
|
|||||
|
Nasdaq 100
|
$
|
100.00
|
|
$
|
119.26
|
|
$
|
124.52
|
|
$
|
150.83
|
|
$
|
207.18
|
|
$
|
208.13
|
|
|||||
22
ITEM 6. SELECTED FINANCIAL DATA
The following selected financial data should be read in conjunction with our financial statements and the notes thereto, and with Item 7, “Management’s Discussion and Analysis of Financial Condition and Results of Operations.” The Consolidated Statements of Income data for fiscal years
2019
,
2018
, and
2017
and the Consolidated Balance Sheets data as of
January 27, 2019
and
January 28, 2018
have been derived from and should be read in conjunction with our audited consolidated financial statements and the notes thereto included in Part IV, Item 15 in this Annual Report on Form 10-K. We operate on a 52- or 53-week year, ending on the last Sunday in January. Fiscal years 2019, 2018, 2017, and 2015 were 52-week years and fiscal year 2016 was a 53-week year.
|
|
Year Ended
|
||||||||||||||||||
|
January 27,
2019
|
January 28,
2018
|
January 29,
2017
|
January 31,
2016 (A)
|
January 25,
2015 |
|||||||||||||||
|
Consolidated Statements of Income Data:
|
(In millions, except per share data)
|
||||||||||||||||||
|
Revenue
|
$
|
11,716
|
|
$
|
9,714
|
|
$
|
6,910
|
|
$
|
5,010
|
|
$
|
4,682
|
|
||||
|
Income from operations
|
$
|
3,804
|
|
$
|
3,210
|
|
$
|
1,934
|
|
$
|
747
|
|
$
|
759
|
|
||||
|
Net income
|
$
|
4,141
|
|
$
|
3,047
|
|
$
|
1,666
|
|
$
|
614
|
|
$
|
631
|
|
||||
|
Net income per share:
|
|||||||||||||||||||
|
Basic
|
$
|
6.81
|
|
$
|
5.09
|
|
$
|
3.08
|
|
$
|
1.13
|
|
$
|
1.14
|
|
||||
|
Diluted
|
$
|
6.63
|
|
$
|
4.82
|
|
$
|
2.57
|
|
$
|
1.08
|
|
$
|
1.12
|
|
||||
|
Weighted average shares used in per share computation:
|
|||||||||||||||||||
|
Basic
|
608
|
|
599
|
|
541
|
|
543
|
|
552
|
|
|||||||||
|
Diluted
|
625
|
|
632
|
|
649
|
|
569
|
|
563
|
|
|||||||||
|
Year Ended
|
|||||||||||||||||||
|
January 27,
2019 (B,C)
|
January 28,
2018 (B,C)
|
January 29,
2017 (B,C)
|
January 31,
2016 (B)
|
January 25,
2015
|
|||||||||||||||
|
Consolidated Balance Sheets Data:
|
(In millions, except per share data)
|
||||||||||||||||||
|
Cash, cash equivalents and marketable securities
|
$
|
7,422
|
|
$
|
7,108
|
|
$
|
6,798
|
|
$
|
5,037
|
|
$
|
4,623
|
|
||||
|
Total assets
|
$
|
13,292
|
|
$
|
11,241
|
|
$
|
9,841
|
|
$
|
7,370
|
|
$
|
7,201
|
|
||||
|
Debt obligations
|
$
|
1,988
|
|
$
|
2,000
|
|
$
|
2,779
|
|
$
|
1,413
|
|
$
|
1,384
|
|
||||
|
Convertible debt conversion obligation
|
$
|
—
|
|
$
|
—
|
|
$
|
31
|
|
$
|
87
|
|
$
|
—
|
|
||||
|
Total shareholders’ equity
|
$
|
9,342
|
|
$
|
7,471
|
|
$
|
5,762
|
|
$
|
4,469
|
|
$
|
4,418
|
|
||||
|
Cash dividends declared and paid per common share (D)
|
$
|
0.610
|
|
$
|
0.570
|
|
$
|
0.485
|
|
$
|
0.395
|
|
$
|
0.340
|
|
||||
|
(A)
|
In fiscal year 2016, we began the wind down of our Icera modem operations. As a result, our income from operations for fiscal year 2016 included
$131 million
of restructuring and other charges.
|
|
(B)
|
In fiscal year 2014, we issued Convertible Notes in the aggregate principal amount of
$1.50 billion
. The Convertible Notes first became convertible as of February 1, 2016 and matured on December 1, 2018. Refer to
Note 11
of the Notes to the Consolidated Financial Statements in Part IV, Item 15 of this Annual Report on Form 10-K for additional information.
|
|
(C)
|
In fiscal year 2017, we issued
$1.00 billion
of the Notes Due 2021, and
$1.00 billion
of the Notes Due 2026. Interest on the Notes is payable on March 16 and September 16 of each year, beginning on March 16, 2017. Refer to
Note 11
of the Notes to the Consolidated Financial Statements in Part IV, Item 15 of this Annual Report on Form 10-K for additional information.
|
|
(D)
|
In November 2012, we initiated a quarterly dividend payment of $0.075 per share, or $0.30 per share on an annual basis. In May 2015, we increased the quarterly cash dividend to $0.0975 per share, or $0.39 per share on an annual basis. In November 2015, we increased the quarterly cash dividend to $0.115 per share, or $0.46 per share on an annual basis. In November 2016, we increased the quarterly cash dividend to $0.14 per share, or $0.56 per share on an annual basis. In November 2017, we increased the quarterly cash dividend to $0.15 per share, or $0.60 per share on an annual basis. In November 2018, we increased the quarterly cash dividend to $0.16 per share, or $0.64 per share on an annual basis.
|
ITEM 7. MANAGEMENT’S DISCUSSION AND ANALYSIS OF FINANCIAL CONDITION AND RESULTS OF OPERATIONS
The following discussion and analysis of our financial condition and results of operations should be read in conjunction with “Item 1A. Risk Factors”, “Item 6. Selected Financial Data”, our Consolidated Financial Statements and related Notes thereto, as well as other cautionary statements and risks described elsewhere in this Annual Report on Form 10-K, before deciding to purchase, hold or sell shares of our common stock.
23
Overview
Our Company and Our Businesses
Starting with a focus on PC graphics, NVIDIA invented the GPU to solve some of the most complex problems in computer science. We have extended our focus in recent years to the revolutionary field of AI. Fueled by the sustained demand for better 3D graphics and the scale of the gaming market, NVIDIA has evolved the GPU into a computer brain at the intersection of VR, HPC, and AI.
Our two reportable segments - GPU and Tegra Processor - are based on a single underlying architecture. From our proprietary processors, we have created platforms that address four large markets where our expertise is critical: Gaming, Professional Visualization, Datacenter, and Automotive.
Our GPU product brands are aimed at specialized markets including GeForce for gamers; Quadro for designers; Tesla and DGX for AI data scientists and big data researchers; and GRID for cloud-based visual computing users. Our Tegra brand integrates an entire computer onto a single chip, and incorporates GPUs and multi-core CPUs to drive supercomputing for autonomous robots, drones, and cars, as well as for game consoles and mobile gaming and entertainment devices.
Headquartered in Santa Clara, California, NVIDIA was incorporated in California in April 1993 and reincorporated in Delaware in April 1998.
Recent Developments, Future Objectives and Challenges
Fiscal Year
2019
Summary
|
|
Year Ended
|
||||||||
|
|
January 27,
2019 |
January 28,
2018 |
Change
|
||||||
|
($ in millions, except per share data)
|
|||||||||
|
Revenue
|
$
|
11,716
|
|
$
|
9,714
|
|
Up 21%
|
||
|
Gross margin
|
61.2
|
%
|
59.9
|
%
|
Up 130 bps
|
||||
|
Operating expenses
|
$
|
3,367
|
|
$
|
2,612
|
|
Up 29%
|
||
|
Income from operations
|
$
|
3,804
|
|
$
|
3,210
|
|
Up 19%
|
||
|
Net income
|
$
|
4,141
|
|
$
|
3,047
|
|
Up 36%
|
||
|
Net income per diluted share
|
$
|
6.63
|
|
$
|
4.82
|
|
Up 38%
|
||
Revenue for fiscal year
2019
increased 21% year over year, reflecting growth in each of our market platforms - gaming, professional visualization, datacenter, and automotive. GPU business revenue was $10.17 billion, up 25% from a year earlier. Tegra Processor business revenue - which includes automotive, SOC modules for gaming platforms, and embedded edge AI platforms - was $1.54 billion, up slightly from a year ago.
Gaming revenue was $6.25 billion, up 13% from a year ago driven by growth in gaming GPUs. Gaming GPU growth was fueled by Turing-based GPUs for desktops and by gaming notebooks based on our Max-Q technology. We experienced significant volatility in our Gaming revenue during fiscal year 2019. We believe demand for our desktop gaming GPU products used by end users for cryptocurrency mining and its after-effects have distorted trends in Gaming revenue. We also believe that deteriorating macroeconomic conditions, particularly in China have impacted consumer demand for our GeForce gaming GPU products. In addition, sales of certain high-end GeForce gaming GPUs using our new Turing architecture that we released during fiscal year 2019 were lower than we expected for the launch of a new architecture. As a result, during a portion of fiscal year 2019, we shipped a higher amount of desktop gaming GPU products relative to where end user demand turned out to be and subsequently compensated by shipping a lower amount of desktop gaming GPU products relative to end user demand to allow the channel to work down that inventory. For fiscal year 2020, we expect our Gaming revenue to be slightly down compared to fiscal year 2019, with expected growth from sales of Turing-based GPU products and notebook GPU products partially offsetting decreases that we believe were caused by the previously-noted factors.
Professional visualization revenue was $1.13 billion, up 21% from a year earlier driven by strength across both desktop and mobile workstation products.
Datacenter revenue was $2.93 billion, up 52% from a year ago, led by strong sales of our Volta architecture-based products, including NVIDIA Tesla V100 and DGX systems. Toward the end of fiscal year 2019, we believe that customers across broad-based vertical markets and geographies became increasingly cautious due to economic uncertainty, and a number of
24
Datacenter deals did not close. While we believe the pause is temporary, our visibility remains relatively low and we do not expect a meaningful recovery in the Datacenter market until later in fiscal year 2020.
Automotive revenue of $641 million was up 15% from a year earlier, driven by infotainment modules, production DRIVE platforms, and development agreements with automotive companies.
OEM and IP revenue was $767 million, down 1% from a year ago, driven by the absence of Intel licensing revenue, which concluded in the first quarter of fiscal year 2018. Revenue from cryptocurrency-specific products in fiscal years 2019 and 2018 was $306 million and $273 million, respectively. We expect revenue from cryptocurrency-specific products to be negligible going forward.
Gross margin for fiscal year
2019
was 61.2%, compared with 59.9% a year earlier, which reflects our continued shift toward higher-value platforms, which more than offset the impact of approximately $128 million in charges for excess DRAM and other components we recorded in the fourth quarter of fiscal year 2019 and a charge of $57 million we recorded during the third quarter of fiscal year 2019 related to prior architecture components and chips.
Operating expenses for fiscal year
2019
were $3.37 billion, up 29% from a year earlier, reflecting primarily employee additions and increases in employee compensation and other related costs, including infrastructure costs.
Income from operations for fiscal year
2019
was $3.80 billion, up 19% from a year earlier. Net income and net income per diluted share for fiscal year
2019
were $4.14 billion and $6.63, respectively, up 36% and 38%, respectively, from a year earlier, fueled primarily by revenue growth and improved gross margin, as well as the impact of the U.S. tax reform benefit.
During fiscal year
2019
, we returned $1.95 billion to shareholders through a combination of $1.58 billion in share repurchases and $371 million in quarterly cash dividends. We intend to return $3.00 billion to shareholders by the end of fiscal year 2020, including $700 million of share repurchases we made in the fourth quarter of fiscal year 2019.
Cash, cash equivalents and marketable securities were $7.42 billion as of
January 27, 2019
, compared with $7.11 billion as of
January 28, 2018
. The increase was primarily related to the increase in net income, partially offset by changes in working capital and the increases in stock repurchases, dividends and taxes paid related to restricted stock units.
GPU Business
During fiscal year 2019, for gaming, we announced NVIDIA RTX - a computer graphics technology using our Turing architecture that produces movie-quality images in real time using ray tracing and AI. During the year, we released many new GeForce RTX desktop gaming GPU products, including RTX 2080Ti, 2080, 2070 and 2060, as well as many new Max-Q GeForce gaming notebook GPU products - the most recent of which are powered by RTX GPUs.
For our professional visualization platform, we announced the Quadro GV100 GPU with RTX technology, making real-time ray tracing possible on professional design and content creation applications. We also unveiled the Quadro RTX series, which is designed to revolutionize the workflow of designers and artists on the desktop, and announced the NVIDIA CUDA-accelerated REDCODE RAW decode SDK, enabling developers and studios to edit 8K video.
For our datacenter platform, we unveiled many advances to our deep learning computing platform - including NVIDIA Tesla V100 GPUs with 32GB memory, NVIDIA NVSwitch GPU interconnect fabric, the NVIDIA DGX-2 and HGX-2 for AI and HPC, the NVIDIA RTX Server, and TensorRT 4 AI inference accelerator software. In addition, we introduced RAPIDS, an open-source GPU-acceleration platform for data science and machine learning, launched the NVIDIA T4 cloud GPU and NVIDIA TensorRT Hyperscale Inference Platform for advanced acceleration in hyperscale datacenters, announced GPU acceleration for Kubernetes to facilitate enterprise inference deployment on multi-cloud GPU clusters, and announced that five of the world’s seven fastest supercomputers are powered by NVIDIA GPUs.
Tegra Processor Business
During fiscal year 2019, for the automotive market, we introduced the NVIDIA DRIVE AutoPilot Level 2+ automated driving system, announced NVIDIA DRIVE AGX design wins with Toyota, Volvo Cars and Isuzu Motors, and announced that Daimler and Bosch have selected NVIDIA’s DRIVE platform to bring automated and driverless vehicles to city streets. We also began production of our Xavier single-chip autopilot SOC, started shipping the NVIDIA DRIVE AGX Xavier developer kit, and introduced the NVIDIA DRIVE Constellation server with DRIVE Sim software to safely test drive autonomous vehicles over billions of miles in virtual reality by leveraging NVIDIA GPUs and NVIDIA DRIVE Pegasus.
In addition, we launched the NVIDIA Jetson AGX Xavier module to help build the next-generation of autonomous machines and announced that Yamaha Motor Co. will use NVIDIA to power its upcoming lineup of autonomous machines.
25
Critical Accounting Policies and Estimates
Management’s discussion and analysis of financial condition and results of operations are based upon our consolidated financial statements, which have been prepared in accordance with accounting principles generally accepted in the United States, or U.S. GAAP. The preparation of these financial statements requires us to make estimates and judgments that affect the reported amounts of assets, liabilities, revenue, cost of revenue, expenses and related disclosure of contingencies. On an on-going basis, we evaluate our estimates, including those related to revenue recognition, inventories, income taxes, goodwill, cash equivalents and marketable securities, stock-based compensation, and litigation, investigation and settlement costs and other contingencies. We base our estimates on historical experience and on various other assumptions that are believed to be reasonable under the circumstances, the results of which form the basis for making judgments about the carrying values of assets and liabilities.
We believe the following critical accounting policies affect our significant judgments and estimates used in the preparation of our consolidated financial statements. Our management has discussed the development and selection of these critical accounting policies and estimates with the Audit Committee of our Board of Directors. The Audit Committee has reviewed our disclosures relating to our critical accounting policies and estimates in this Annual Report on Form 10-K.
Revenue Recognition
We derive our revenue from product sales, including hardware and systems, license and development arrangements, and software licensing. We determine revenue recognition through the following steps: (1) identification of the contract with a customer; (2) identification of the performance obligations in the contract; (3) determination of the transaction price; (4) allocation of the transaction price to the performance obligations in the contract; and (5) recognition of revenue when, or as, we satisfy a performance obligation.
Product Sales Revenue
Revenue from product sales is recognized upon transfer of control of promised products to customers in an amount that reflects the consideration we expect to receive in exchange for those products. Revenue is recognized net of allowances for returns, customer programs and any taxes collected from customers.
For products sold with a right of return, we record a reduction to revenue by establishing a sales return allowance for estimated product returns at the time revenue is recognized, based primarily on historical return rates. However, if product returns for a fiscal period are anticipated to exceed historical return rates, we may determine that additional sales return allowances are required to properly reflect our estimated exposure for product returns.
Our customer programs involve rebates, which are designed to serve as sales incentives to resellers of our products in various target markets, and marketing development funds, or MDFs, which represent monies paid to our partners that are earmarked for market segment development and are designed to support our partners’ activities while also promoting NVIDIA products. We account for customer programs as a reduction to revenue and accrue for potential rebates and MDFs based on the amount we expect to be claimed by customers.
License and Development Arrangements
Our license and development arrangements with customers typically require significant customization of our intellectual property components. As a result, we recognize the revenue from the license and the revenue from the development services as a single performance obligation over the period in which the development services are performed. We measure progress to completion based on actual cost incurred to date as a percentage of the estimated total cost required to complete each project. If a loss on an arrangement becomes probable during a period, we record a provision for such loss in that period.
Software Licensing
Our software licenses provide our customers with a right to use the software when it is made available to the customer. Customers may purchase either perpetual licenses or subscriptions to licenses, which differ mainly in the duration over which the customer benefits from the software. Software licenses are frequently sold along with post-contract customer support, or PCS. For such arrangements, we allocate revenue to the software license and PCS on a relative standalone selling price basis by maximizing the use of observable inputs to determine the standalone selling price for each performance obligation. Revenue from software licenses is recognized up front when the software is made available to the customer. PCS revenue is recognized ratably over the service period, or as services are performed.
Refer to Note 1 of the Notes to the Consolidated Financial Statements in Part IV, Item 15 of this Annual Report on Form 10-K for additional information.
26
Inventories
Inventory cost is computed on an adjusted standard basis, which approximates actual cost on an average or first-in, first-out basis. We charge cost of sales for inventory provisions to write down our inventory to the lower of cost or net realizable value or to completely write off obsolete or excess inventory. Most of our inventory provisions relate to the write-off of excess quantities of products, based on our inventory levels and future product purchase commitments compared to assumptions about future demand and m
arket conditions.
Situations that may result in excess or obsolete inventory include changes in business and economic conditions, changes in market conditions, sudden and significant decreases in demand for our products, inventory obsolescence because of changing technology and customer requirements, failure to estimate customer demand properly, or unexpected competitive pricing actions by our competition. In addition, cancellation or deferral of customer purchase orders could result in our holding excess inventory.
The overall net effect on our gross margin from inventory provisions and sales of items previously written down was an unfavorable impact of 2.0% in fiscal year 2019 and insignificant in fiscal years
2018
and
2017
. The higher amount of charges we took to cost of sales for inventory provisions during fiscal year 2019 were primarily related to excess DRAM, other components, and prior architecture components and chips, whereas the charges we took during fiscal years 2018 and 2017 were primarily related to the write-off of excess quantities of GPU and Tegra products whose inventory levels were higher than our updated forecasts of future demand for those products. As a fabless semiconductor company, we must make commitments to purchase inventory based on forecasts of future customer demand. In doing so, we must account for our third-party manufacturers' lead times and constraints. We also adjust to other market factors, such as product offerings and pricing actions by our competitors, new product transitions, and macroeconomic conditions - all of which may impact demand for our products.
Refer to the Gross Profit and Gross Margin discussion below in this Management's Discussion and Analysis for further discussion.
Income Taxes
We recognize federal, state and foreign current tax liabilities or assets based on our estimate of taxes payable or refundable in the current fiscal year by tax jurisdiction. We recognize federal, state and foreign deferred tax assets or liabilities, as appropriate, for our estimate of future tax effects attributable to temporary differences and carryforwards; and we record a valuation allowance to reduce any deferred tax assets by the amount of any tax benefits that, based on available evidence and judgment, are not expected to be realized.
Our calculation of deferred tax assets and liabilities is based on certain estimates and judgments and involves dealing with uncertainties in the application of complex tax laws. Our estimates of deferred tax assets and liabilities may change based, in part, on added certainty or finality to an anticipated outcome, changes in accounting standards or tax laws in the United States, or foreign jurisdictions where we operate, or changes in other facts or circumstances. In addition, we recognize liabilities for potential United States and foreign income tax contingencies based on our estimate of whether, and the extent to which, additional taxes may be due. If we determine that payment of these amounts is unnecessary or if the recorded tax liability is less than our current assessment, we may be required to recognize an income tax benefit or additional income tax expense in our financial statements accordingly.
As of
January 27, 2019
, we had a valuation allowance of $562 million related to state and certain foreign deferred tax assets that management determined are not likely to be realized due to projections of future taxable income and potential utilization limitations of tax attributes acquired as a result of stock ownership changes. To the extent realization of the deferred tax assets becomes more-likely-than-not, we would recognize such deferred tax asset as an income tax benefit during the period.
We recognize the benefit from a tax position only if it is more-likely-than-not that the position would be sustained upon audit based solely on the technical merits of the tax position. Our policy is to include interest and penalties related to unrecognized tax benefits as a component of income tax expense.
The TCJA, which was enacted in December 2017, significantly changed U.S. tax law, including a reduction of the U.S. federal corporate income tax rate from 35% to 21%, a requirement for companies to pay a one-time transition tax on the earnings of certain foreign subsidiaries that were previously tax deferred, and the creation of new taxes (global intangible low-taxed income, or GILTI) on certain foreign-source earnings. As a fiscal year-end taxpayer, certain provisions of the TCJA began to impact us in the fourth quarter of fiscal year 2018, while other provisions impacted us beginning in fiscal year 2019. The SEC had provided guidance in Staff Accounting Bulletin No. 118, Income Tax Accounting Implications of the Tax Cuts and Jobs Act (SAB 118), which allowed companies to record provisional amounts during a measurement period up to one year
27
from the enactment date. As of January 27, 2019, we completed our accounting for all of the enactment-date income tax effects of the TCJA and elected to account for GILTI in deferred taxes. Refer to Note 13 of the Notes to the Consolidated Financial Statements in Part IV, Item 15 of this Annual Report on Form 10-K for additional information specific to accounting for income taxes and the impacts from the enactment of the TCJA.
Goodwill
Goodwill is subject to our annual impairment test during the fourth quarter of our fiscal year, or earlier, if indicators of potential impairment exist, using either a qualitative or a quantitative assessment. Our impairment review process compares the fair value of the reporting unit in which the goodwill resides to its carrying value. We have identified two reporting units, GPU and Tegra Processor, for the purposes of completing our goodwill analysis. Goodwill assigned to the GPU and Tegra Processor reporting units as of
January 27, 2019
was
$210 million
and
$408 million
, respectively. Determining the fair value of a reporting unit requires us to make judgments and involves the use of significant estimates and assumptions. We also make judgments and assumptions in allocating assets and liabilities to each of our reporting units. We base our fair value estimates on assumptions we believe to be reasonable but that are unpredictable and inherently uncertain.
During the fourth quarter of fiscal year
2019
, we used the qualitative assessment to test goodwill for impairment for each reporting unit and concluded there was no impairment.
Refe
r to Note 5 of the Notes to the Consolidated Financial Statements in Part IV, Item 15 of this Annual Report on Form 10-K for additional information.
Cash Equivalents and Marketable Securities
Cash equivalents consist of financial instruments which are readily convertible into cash and have original maturities of three months or less at the time of acquisition. Marketable securities consist of highly liquid debt investments with maturities greater than three months when purchased. We measure our cash equivalents and marketable securities at fair value. The fair values of our financial assets are determined using quoted market prices of identical assets or quoted market prices of similar assets from active markets. All of our available-for-sale debt investments are subject to a periodic impairment review. We record a charge to earnings when a decline in fair value is significantly below cost basis and judged to be other-than-temporary, or have other indicators of impairments.
We performed an impairment review of our debt investment portfolio as of
January 27, 2019
. We concluded that our debt investments were appropriately valued and that no other-than-temporary impairment charges were necessary on our portfolio of available-for-sale debt investments as of
January 27, 2019
.
Refe
r to Notes 7 and 8 of the Notes to the Consolidated Financial Statements in Part IV, Item 15 of this Annual Report on Form 10-K for additional information.
Stock-based Compensation
Our stock-based compensation expense is associated with restricted stock units, or RSUs, performance stock units that are based on our corporate financial performance targets, or PSUs, performance stock units that are based on market conditions, or market-based PSUs, and our employee stock purchase plan. The number of PSUs and market-based PSUs that will ultimately be awarded is contingent on the Company’s level of achievement compared with the corporate financial performance target established by our Compensation Committee in the beginning of each fiscal year.
Re
fer to Notes 1 and 3 of the Notes to the Consolidated Financial Statements in Part IV, Item 15 of this Annual Report on Form 10-K for additional information.
Litigation, Investigation and Settlement Costs
From time to time, we are involved in legal actions and/or investigations by regulatory bodies. We are aggressively defending our current litigation matters. However, there are many uncertainties associated with any litigation or investigations, and we cannot be certain that these actions or other third-party claims against us will be resolved without costly litigation, fines and/or substantial settlement payments. If that occurs, our business, financial condition and results of operations co
uld be materially and adversely affected. If information becomes available that causes us to determine that a loss in any of our pending litigation, investigations or settlements is probable, and we can reasonably estimate the loss associated with such events, we will record the loss in accordance with U.S. GAAP. However, the actual liability in any such litigation or investigation may be materially different from our estimates, which could require us to record additional costs.
28
Results of Operations
The following table sets forth, for the periods indicated, certain items in our Consolidated Statements of Income expressed as a percentage of revenue.
|
|
Year Ended
|
|||||||
|
|
January 27,
2019 |
January 28,
2018 |
January 29,
2017 |
|||||
|
Revenue
|
100.0
|
%
|
100.0
|
%
|
100.0
|
%
|
||
|
Cost of revenue
|
38.8
|
|
40.1
|
|
41.2
|
|
||
|
Gross profit
|
61.2
|
|
59.9
|
|
58.8
|
|
||
|
Operating expenses:
|
|
|||||||
|
Research and development
|
20.3
|
|
18.5
|
|
21.2
|
|
||
|
Sales, general and administrative
|
8.5
|
|
8.4
|
|
9.6
|
|
||
|
Total operating expenses
|
28.7
|
|
26.9
|
|
30.8
|
|
||
|
Income from operations
|
32.5
|
|
33.0
|
|
28.0
|
|
||
|
Interest income
|
1.2
|
|
0.7
|
|
0.8
|
|
||
|
Interest expense
|
(0.5
|
)
|
(0.6
|
)
|
(0.8
|
)
|
||
|
Other, net
|
0.1
|
|
(0.2
|
)
|
(0.4
|
)
|
||
|
Total other income (expense)
|
0.8
|
|
(0.1
|
)
|
(0.4
|
)
|
||
|
Income before income tax expense
|
33.3
|
|
32.9
|
|
27.6
|
|
||
|
Income tax expense (benefit)
|
(2.1
|
)
|
1.5
|
|
3.5
|
|
||
|
Net income
|
35.3
|
%
|
31.4
|
%
|
24.1
|
%
|
||
Revenue
Revenue by Reportable Segments
|
Year Ended
|
Year Ended
|
||||||||||||||||||||||||||||
|
January 27,
2019 |
January 28,
2018 |
$
Change
|
%
Change
|
January 28,
2018 |
January 29,
2017 |
$
Change
|
%
Change
|
||||||||||||||||||||||
|
($ in millions)
|
($ in millions)
|
||||||||||||||||||||||||||||
|
GPU
|
$
|
10,175
|
|
$
|
8,137
|
|
$
|
2,038
|
|
25
|
%
|
$
|
8,137
|
|
$
|
5,822
|
|
$
|
2,315
|
|
40
|
%
|
|||||||
|
Tegra Processor
|
1,541
|
|
1,534
|
|
7
|
|
—
|
%
|
1,534
|
|
824
|
|
710
|
|
86
|
%
|
|||||||||||||
|
All Other
|
—
|
|
43
|
|
(43
|
)
|
(100
|
)%
|
43
|
|
264
|
|
(221
|
)
|
(84
|
)%
|
|||||||||||||
|
Total
|
$
|
11,716
|
|
$
|
9,714
|
|
$
|
2,002
|
|
21
|
%
|
$
|
9,714
|
|
$
|
6,910
|
|
$
|
2,804
|
|
41
|
%
|
|||||||
GPU Business.
GPU business revenue increased by
25%
in fiscal year
2019
compared to fiscal year
2018
. This increase was due primarily to 18% growth in sales of GeForce GPU products for gaming, driven by initial sales of Turing-based GPUs for desktops and by high-performance notebooks based on our Max-Q technology. Datacenter revenue, including Tesla, GRID and DGX, increased 52%, reflecting strong sales of our Volta architecture products, including NVIDIA Tesla V100 and DGX systems. Revenue from Quadro GPUs for professional visualization increased 21% due primarily to higher sales across desktop and mobile workstation products. Our PC OEM revenue decreased by 1% driven by the absence of Intel licensing revenue in fiscal year 2019. Revenue from cryptocurrency-specific products in fiscal years 2019 and 2018 was $306 million and $273 million, respectively. We expect cryptocurrency-related revenue to be negligible going forward.
GPU business revenue increased by
40%
in fiscal year
2018
compared to fiscal year
2017
led by growth in gaming, datacenter and professional visualization. Revenue from sales of GeForce GPU products for gaming increased over 20%, reflecting continued strong demand for our Pascal-based GPU products. Datacenter revenue, including Tesla, GRID and DGX, increased 133%, reflecting strong demand from hyperscale and cloud customers for deep learning training and accelerated GPU computing as well as demand for HPC, DGX AI supercomputing and GRID virtualization platforms. Revenue from Quadro GPUs for professional visualization increased by 12% due primarily to higher sales in both high-end desktop and mobile
29
workstation products. Revenue from GeForce GPU products for mainstream PC OEMs increased by over 90% due primarily to strong demand for GPU products targeted for cryptocurrency mining.
Tegra Processor Business.
Tegra Processor business revenue was up slightly in
fiscal year 2019
compared to
fiscal year 2018
. This was driven by an increase of over 15% in automotive revenue, primarily from infotainment modules, production DRIVE PX platforms, and development agreements with automotive companies, offset by a decline of approximately 15% in SOC modules for gaming platforms and related development services.
Tegra Processor business revenue increased by 86% in
fiscal year 2018
compared to
fiscal year 2017
. This was driven by an increase of over 300% in revenue from SOC modules for gaming platforms and development services, and an increase of 15% in automotive revenue, primarily from infotainment modules, DRIVE PX platforms and development agreements for self-driving cars.
All Other.
Our patent license agreement with Intel concluded in the first quarter of fiscal year 2018. For fiscal year 2018, we recognized related revenue of $
43 million
, down from $
264 million
for fiscal year 2017.
Concentration of Revenue
Revenue from sales to customers outside of the United States accounted for
87%
of total revenue for each of fiscal years
2019
,
2018
, and
2017
. Revenue by geographic region is allocated to individual countries based o
n the location to which the products are initially billed even if the revenue is attributable to end customers in a different location.
No single customer represented more than 10% of total revenue for fiscal years 2019 and 2018. In fiscal year 2017, we had one customer that represented 12% of our total revenue.
Gross Profit and Gross Margin
Gross profit consists of total revenue, net of allowances, less cost of revenue. Cost of revenue consists primarily of the cost of semiconductors purchased from subcontractors, including wafer fabrication, assembly, testing and packaging, board and device costs, manufacturing support costs, including labor and overhead associated with such purchases, final test yield fallout, inventory and warranty provisions, memory and component costs, and shipping costs. Cost of revenue also includes development costs for license and service arrangements and stock-based compensation related to personnel associated with manufacturing.
Our overall gross margin was
61.2%
,
59.9%
, and
58.8%
for fiscal years
2019
,
2018
, and
2017
, respectively. The increase in fiscal year 2019 reflects our continued shift toward higher-value platforms, which more than offset the impact of approximately $128 million in charges for excess DRAM and other components we recorded in the fourth quarter of fiscal year 2019 and a charge of $57 million we recorded during the third quarter of fiscal year 2019 related to prior architecture components and chips. The increase in fiscal year 2018 was driven primarily by a favorable shift in mix, the growth of our GeForce gaming GPU revenue, and the growth of our datacenter revenue for cloud, deep learning, AI, and graphics virtualization. The increase in fiscal year 2018 was partially offset by the conclusion of our patent license agreement with Intel in the first quarter of fiscal year 2018.
Inventory provisions totaled $270 million, $48 million, and $62 million for fiscal years
2019
,
2018
, and
2017
, respectively. Sales of inventory that was previously written-off or written-down totaled $41 million, $35 million, and $51 million for fiscal years
2019
,
2018
, and
2017
, respectively. As a result, the overall net effect on our gross margin was an unfavorable impact of 2.0% in fiscal year 2019 and insignificant in fiscal years
2018
and
2017
.
A discussion of our gross margin results for each of our reportable segments is as follows:
GPU Business.
The gross margin of our GPU business increased during
fiscal year 2019
when compared to
fiscal year 2018
, primarily due to strong sales of high-end GeForce gaming GPUs and revenue growth in Datacenter, including Tesla, GRID and DGX, for cloud, deep learning, AI, and graphics virtualization. The gross margin of our GPU business increased during
fiscal year 2018
when compared to
fiscal year 2017
primarily due to strong sales of our GeForce gaming GPU products and revenue growth in datacenter, including Tesla, GRID and DGX, for cloud, deep learning, AI, and graphics virtualization.
Tegra Processor Business.
The gross margin of our Tegra Processor business increased during
fiscal year 2019
when compared to
fiscal year 2018
, primarily due to a favorable mix shift. The gross margin of our Tegra Processor business increased during
fiscal year 2018
when compared to
fiscal year 2017
, primarily due to revenue growth in gaming development platforms and automotive.
30
Operating Expenses
|
|
Year Ended
|
Year Ended
|
|||||||||||||||||||||||||||
|
|
January 27,
2019 |
January 28,
2018 |
$
Change
|
%
Change
|
January 28,
2018 |
January 29,
2017 |
$
Change
|
%
Change
|
|||||||||||||||||||||
|
|
($ in millions)
|
($ in millions)
|
|||||||||||||||||||||||||||
|
Research and development expenses
|
$
|
2,376
|
|
$
|
1,797
|
|
$
|
579
|
|
32
|
%
|
$
|
1,797
|
|
$
|
1,463
|
|
$
|
334
|
|
23
|
%
|
|||||||
|
% of net revenue
|
20.3
|
%
|
18.5
|
%
|
|
|
18.5
|
%
|
21.2
|
%
|
|
|
|||||||||||||||||
|
Sales, general and administrative expenses
|
991
|
|
815
|
|
176
|
|
22
|
%
|
815
|
|
663
|
|
152
|
|
23
|
%
|
|||||||||||||
|
% of net revenue
|
8.5
|
%
|
8.4
|
%
|
|
|
8.4
|
%
|
9.6
|
%
|
|
|
|||||||||||||||||
|
Restructuring and other charges
|
—
|
|
—
|
|
—
|
|
—
|
%
|
—
|
|
3
|
|
(3
|
)
|
(100
|
)%
|
|||||||||||||
|
% of net revenue
|
—
|
%
|
—
|
%
|
|
|
—
|
%
|
—
|
%
|
|||||||||||||||||||
|
Total operating expenses
|
$
|
3,367
|
|
$
|
2,612
|
|
$
|
755
|
|
29
|
%
|
$
|
2,612
|
|
$
|
2,129
|
|
$
|
483
|
|
23
|
%
|
|||||||
Research and Development
Research and development expenses increased by
32%
in fiscal year
2019
compared to fiscal year
2018
and increased by
23%
in fiscal year
2018
compared to fiscal year
2017
, driven primarily by employee additions and increases in employee compensation and other related costs, including infrastructure costs and stock-based compensation expense.
Sales, General and Administrative
Sales, general and administrative expenses increased by
22%
in fiscal year
2019
compared to fiscal year
2018
and increased by
23%
in fiscal year
2018
compared to fiscal year
2017
, driven primarily by employee additions and increases in employee compensation and other related costs, including infrastructure costs and stock-based compensation expense.
Total Other Income (Expense)
Interest Income and Interest Expense
Interest income consists of interest earned on cash, cash equivalents and marketable securities. Interest income was
$136 million
,
$69 million
, and
$54 million
in fiscal years
2019
,
2018
, and
2017
, respectively. The increase in interest income was primarily due to higher average invested balances and higher rates from our floating rate securities and the purchase of new securities.
Interest expense is primarily comprised of coupon interest and debt discount amortization related to the 2.20% Notes Due 2021 and 3.20% Notes Due 2026 issued in September 2016, and the Convertible Notes issued in December 2013. Interest expense was
$58 million
,
$61 million
, and
$58 million
in fiscal years
2019
,
2018
, and
2017
, respectively.
Other, Net
Other, net, consists primarily of realized or unrealized gains and losses from non-affiliated investments, losses on early debt conversions of the Convertible Notes, and the impact of changes in foreign currency rates. Other, net, was $14 million of income during fiscal year 2019, consisting primarily of $12 million unrealized gains from non-affiliated investments. Other, net, was $22 million and $25 million of expense in fiscal years 2018 and 2017, respectively, consisting primarily of $19 million and $21 million of losses recognized from early conversions of the Convertible Notes during fiscal years 2018 and 2017, respectively.
Income Taxes
The TCJA, which was enacted in December 2017, significantly changed U.S. tax law, including a reduction of the U.S. federal corporate income tax rate from 35% to 21%, a requirement for companies to pay a one-time transition tax on the earnings of certain foreign subsidiaries that were previously tax deferred and the creation of new taxes (GILTI) on certain foreign-source earnings. As a fiscal year-end taxpayer, certain provisions of the TCJA began to impact us in the fourth quarter of fiscal year 2018, while other provisions impacted us beginning in fiscal year 2019.
31
We recognized income tax benefit of $245 million for fiscal year 2019, and income tax expense of $149 million and $239 million for fiscal years 2018, and 2017, respectively. Our annual effective tax rate was (6.3)%, 4.7%, and 12.5% for fiscal years 2019, 2018, and 2017, respectively. The decrease in our effective tax rate in fiscal year 2019 as compared to fiscal years 2018 and 2017 was primarily due to a decrease in the U.S. statutory tax rate from 33.9% to 21%, the finalization of the enactment-date income tax effects of the TCJA, higher U.S federal research tax credits and excess tax benefits related to stock-based compensation in fiscal year 2019.
The decrease in our effective tax rate in fiscal year 2018 as compared to fiscal year 2017 was primarily due to the provisional impact of the tax law changes and recognition of excess tax benefits related to stock-based compensation.
Our effective tax rate for fiscal year 2019 was lower than the U.S. federal statutory rate of 21% due primarily to income earned in jurisdictions, including British Virgin Islands, Hong Kong, China, Taiwan and United Kingdom, where the tax rate was lower than the U.S. federal statutory tax rates, the finalization of the enactment-date income tax effects of the TCJA, favorable recognition of U.S. federal research tax credits, and excess tax benefits related to stock-based compensation.
Our effective tax rate for fiscal years 2018 and 2017 was lower than the blended U.S. federal statutory rate of 33.9% for fiscal year 2018 and 35% for fiscal year 2017 due primarily to income earned in jurisdictions, including British Virgin Islands, Hong Kong, China, Taiwan and United Kingdom, where the tax rate was lower than the U.S. federal statutory tax rates, favorable recognition of U.S. federal research tax credits, the provisional impact of the tax law changes in 2018, and excess tax benefits related to stock-based compensation.
In fiscal year 2018 and the first nine months of fiscal year 2019, we recorded provisional amounts for certain enactment-date effects of the TCJA by applying the SEC guidance in SAB 118 because we had not yet completed our accounting for these effects. Furthermore, under U.S. GAAP, we can make an accounting policy election to either treat taxes due on the GILTI as a current period expense or factor such amounts into our measurement of deferred taxes. Because we were still evaluating the GILTI provisions as of January 28, 2018, we recorded no GILTI-related deferred balances. After further evaluation, we elected to account for GILTI deferred taxes. As of January 27, 2019, we completed our accounting for all of the enactment-date income tax effects of the TCJA and recognized a reduction of
$368 million
to the provisional amount recorded at January 28, 2018, primarily relating to the effects of electing to account for GILTI in deferred taxes.
Refer to
Note 13
of the Notes to the Consolidated Financial Statements in Part IV, Item 15 of this Annual Report on Form 10-K for additional information.
Liquidity and Capital Resources
|
|
January 27,
2019 |
January 28,
2018 |
|||||
|
|
(In millions)
|
||||||
|
Cash and cash equivalents
|
$
|
782
|
|
$
|
4,002
|
|
|
|
Marketable securities
|
6,640
|
|
3,106
|
|
|||
|
Cash, cash equivalents, and marketable securities
|
$
|
7,422
|
|
$
|
7,108
|
|
|
|
|
Year Ended
|
||||||||||
|
January 27,
2019 |
January 28,
2018 |
January 29,
2017 |
|||||||||
|
|
(In millions)
|
||||||||||
|
Net cash provided by operating activities
|
$
|
3,743
|
|
$
|
3,502
|
|
$
|
1,672
|
|
||
|
Net cash provided by (used in) investing activities
|
$
|
(4,097
|
)
|
$
|
1,278
|
|
$
|
(793
|
)
|
||
|
Net cash provided by (used in) financing activities
|
$
|
(2,866
|
)
|
$
|
(2,544
|
)
|
$
|
291
|
|
||
As of
January 27, 2019
, we had
$7.42 billion
in cash, cash equivalents and marketable securities, an increase of
$314 million
from the end of fiscal year
2018
. Our investment policy requires the purchase of highly rated fixed income securities, the diversification of investment types and credit exposures, and certain limits on our portfolio duration.
Cash provided by operating activities increased in fiscal year
2019
compared to fiscal year
2018
, primarily due to higher net income, partially offset by changes in working capital. Cash provided by operating activities increased in fiscal year 2018 compared to fiscal year 2017, primarily due to higher net income and changes in working capital.
32
Cash used in investing activities increased in fiscal year
2019
compared to fiscal year
2018
, due to higher purchases and lower sales of marketable securities, partially offset by higher maturities of marketable securities. Cash provided by investing activities for fiscal year
2018
increased from fiscal year
2017
, primarily due to a reduction in purchases of marketable securities, partially offset by the purchase of our previously-financed Santa Clara campus building.
Cash used in financing activities increased in fiscal year
2019
compared to fiscal year
2018
, due to higher share repurchases and higher tax payments related to employee stock plans, partially offset by lower repayments of Convertible Notes. Cash used in financing activities in fiscal year
2018
increased from fiscal year
2017
, primarily due to cash provided from the issuance of $2.00 billion of Notes in fiscal year 2017 as well as higher repayments of Convertible Notes, tax payments related to employee stock plans, share repurchases and dividend payments in fiscal year 2018.
Liquidity
Our primary sources of liquidity are our cash and cash equivalents, our marketable securities, and the cash generated by our operations. As of
January 27, 2019
and
January 28, 2018
, we had $
7.42 billion
and $
7.11 billion
, respectively, in cash, cash equivalents and marketable securities. Our marketable securities consist of debt securities issued by the U.S. government and its agencies, highly rated corporations and financial institutions, asset-backed issuers, mortgage-backed securities by government-sponsored enterprises, and foreign government entities. These marketable securities are denominated in United States dollars. Refer to Critical Accounting Policies and Estimates in Part II, Item 7, Quantitative and Qualitative Disclosures About Market Risk in Part II, Item 7A and Note 7 of the Notes to the Consolidated Financial Statements in Part IV, Item 15 of this Annual Report on Form 10-K for additional information.
As a result of the TCJA, substantially all of our cash, cash equivalents and marketable securities held outside of the United States as of January 27, 2019 are available for use in the United States without incurring additional U.S. federal income taxes. Refer to Note 13 of the Notes to the Consolidated Financial Statements in Part IV, Item 15 of this Annual Report on Form 10-K for additional information.
Capital Return to Shareholders
We previously announced our plan to return $1.25 billion to shareholders in fiscal year 2019 and an additional $3.00 billion by the end of fiscal year 2020 - some of which would begin in the fourth quarter of fiscal year 2019. During fiscal year
2019
, we repurchased a total of
9 million
shares for
$1.58 billion
, including $700 million of the $3.00 billion, and paid
$371 million
in cash dividends.
We intend to return the remaining $2.30 billion of the $3.00 billion to shareholders by the end of fiscal year 2020 through a combination of share repurchases and cash dividends.
In November 2018, the Board authorized an additional
$7.00 billion
under our share repurchase program and extended it through the end of December 2022. As of
January 27, 2019
, we were authorized to repurchase additional shares of our common stock up to
$7.24 billion
.
In November 2018, we also announced a 7% increase in our quarterly cash dividend to $0.16 per share from $0.15 per share.
Our cash dividend program and the payment of future cash dividends under that program are subject to our Board's continuing determination that the dividend program and the declaration of dividends thereunder are in the best interests of our shareholders. Refer to Note 14 of the Notes to the Consolidated Financial Statements in Part IV, Item 15 of this Annual Report on Form 10-K for further discussion.
Notes Due 2021 and Notes Due 2026
In fiscal year 2017, we issued $1.00 billion of the Notes Due 2021 and $1.00 billion of the Notes Due 2026, collectively, the Notes. The net proceeds from the Notes were $1.98 billion, after deducting debt discounts and issuance costs.
Revolving Credit Facility
We have a Credit Agreement under which we may borrow up to $575 million for general corporate purposes and can obtain revolving loan commitments up to $425 million. As of
January 27, 2019
, we had not borrowed any amounts under this agreement.
Commercial Paper
We have a $575 million commercial paper program to support general corporate purposes. As of
January 27, 2019
, we had not issued any commercial paper.
33
Refer to Note 11 of the Notes to the Consolidated Financial Statements in Part IV, Item 15 of this Annual Report on Form 10-K for further discussion.
Operating Capital and Capital Expenditure Requirements
In fiscal year 2019, we began construction on a 750 thousand square foot building on our Santa Clara campus, which is currently targeted for completion in fiscal year 2022. We believe that our existing cash balances and anticipated cash flows from operations will be sufficient to meet our operating requirements for at least the next twelve months.
Off-Balance Sheet Arrangements
As of January 27, 2019, we had no material off-balance sheet arrangements as defined by applicable SEC regulations.
Contractual Obligations
The following table summarizes our contractual obligations as of
January 27, 2019
:
|
Payment Due By Period
|
|||||||||||||||||||||||
|
Contractual Obligations
|
Total
|
Less than
1 Year
|
1-3 Years
|
4-5 Years
|
More than
5 Years
|
All Other
|
|||||||||||||||||
|
|
(In millions)
|
||||||||||||||||||||||
|
Long-term debt (1)
|
$
|
2,302
|
|
$
|
54
|
|
$
|
1,100
|
|
$
|
64
|
|
$
|
1,084
|
|
$
|
—
|
|
|||||
|
Inventory purchase obligations
|
912
|
|
912
|
|
—
|
|
—
|
|
—
|
|
—
|
|
|||||||||||
|
Transition tax payable (2)
|
384
|
|
33
|
|
67
|
|
96
|
|
188
|
|
—
|
|
|||||||||||
|
Uncertain tax positions, interest and penalties (3)
|
163
|
|
—
|
|
—
|
|
—
|
|
—
|
|
163
|
|
|||||||||||
|
Operating leases
|
683
|
|
100
|
|
187
|
|
131
|
|
265
|
|
—
|
|
|||||||||||
|
Capital purchase obligations
|
258
|
|
192
|
|
66
|
|
—
|
|
—
|
|
—
|
|
|||||||||||
|
Total contractual obligations
|
$
|
4,702
|
|
$
|
1,291
|
|
$
|
1,420
|
|
$
|
291
|
|
$
|
1,537
|
|
$
|
163
|
|
|||||
|
(1)
|
Represents the aggregate principal amount of $2.00 billion and anticipated interest payments of $302 million for the Notes. Refer to
Note 11
of the Notes to the Consolidated Financial Statements in Part IV, Item 15 of this Annual Report on Form 10-K.
|
|
(2)
|
Represents our remaining tax payable of the one-time transition tax that resulted from enactment of the TCJA in fiscal year 2018. As of January 27, 2019, we have paid the first installment of $33 million. The remaining will be payable in seven annual installments. The next installment of $33 million is classified as a current income tax payable. The installment amounts are equal to 8% of the total liability, payable in fiscal years 2019 through 2023, 15% in fiscal year 2024, 20% in fiscal year 2025 and 25% in fiscal year 2026. Refer to Note 13 of the Notes to the Consolidated Financial Statements in Part IV, Item 15 of this Annual Report on Form 10-K, for additional information about the one-time transition tax.
|
|
(3)
|
Represents unrecognized tax benefits of
$163 million
which consists of
$142 million
and the related interest and penalties of
$21 million
recorded in non-current income tax payable as of January 27, 2019. We are unable to reasonably estimate the timing of any potential tax liability or interest/penalty payments in individual years due to uncertainties in the underlying income tax positions and the timing of the effective settlement of such tax positions.
|
Adoption of New and Recently Issued Accounting Pronouncements
Refer to
Note 1
of the Notes to the Consolidated Financial Statements in Part IV, Item 15 of this Annual Report on Form 10-K for a discussion of adoption of new and recently issued accounting pronouncements.
ITEM 7A. QUANTITATIVE AND QUALITATIVE DISCLOSURES ABOUT MARKET RISK
Investment and Interest Rate Risk
We are exposed to interest rate risk related to our floating and fixed-rate investment portfolio and outstanding debt. The investment portfolio is managed consistent with our overall liquidity strategy in support of both working capital needs and strategic growth of our businesses.
As of
January 27, 2019
, we performed a sensitivity analysis on our floating and fixed rate financial investments. According to our analysis, parallel shifts in the yield curve of plus or minus 0.5% would result in a decrease in fair value for these investments of $8 million, or an increase in fair value for these investments of
$7 million
, respectively.
In fiscal year 2017, we issued $1.00 billion of the Notes Due 2021 and $1.00 billion of the Notes Due 2026. We carry the Notes at face value less unamortized discount on our Consolidated Balance Sheets. As the Notes bear interest at a fixed rate, we have no financial statement risk associated with changes in interest rates. Refer to Note 11 of the Notes to the Consolidated Financial Statements in Part IV, Item 15 of this Annual Report on Form 10-K for additional information.
34
Foreign Exchange Rate Risk
We consider our direct exposure to foreign exchange rate fluctuations to be minimal. Gains or losses from foreign currency remeasurement are included in other income or expense and to date have not been significant. The impact of foreign currency transaction gain or loss included in determining net income was not significant for fiscal years 2019, 2018, and 2017.
Sales and arrangements with third-party manufacturers provide for pricing and payment in United States dollars, and, therefore, are not subject to exchange rate fluctuations. Increases in the value of the United States’ dollar relative to other currencies would make our products more expensive, which could negatively impact our ability to compete. Conversely, decreases in the value of the United States’ dollar relative to other currencies could result in our suppliers raising their prices in order to continue doing business with us. Additionally, we have international operations and incur expenditures in currencies other than U.S. dollars. Our operating expenses benefit from a stronger dollar and are adversely affected by a weaker dollar.
We use foreign currency forward contracts to mitigate the impact of foreign currency exchange rate movements on our operating expenses. We designate these contracts as cash flow hedges and assess the effectiveness of the hedge relationships on a spot to spot basis. Gains or losses on the contracts are recorded in accumulated other comprehensive income or loss, and then reclassified to operating expense when the related operating expenses are recognized in earnings or ineffectiveness should occur.
We also use foreign currency forward contracts to mitigate the impact of foreign currency movements on monetary assets and liabilities that are denominated in currencies other than U.S. dollar. These forward contracts were not designated for hedge accounting treatment. Therefore, the change in fair value of these contracts is recorded in other income or expense and offsets the change in fair value of the hedged foreign currency denominated monetary assets and liabilities, which is also recorded in other income or expense.
Refer to Note 10 of the Notes to the Consolidated Financial Statements in Part IV, Item 15 of this Annual Report on Form 10-K for additional information.
ITEM 8. FINANCIAL STATEMENTS AND SUPPLEMENTARY DATA
The information required by this Item is set forth in our Consolidated Financial Statements and Notes thereto included in this Annual Report on Form 10-K.
ITEM 9. CHANGES IN AND DISAGREEMENTS WITH ACCOUNTANTS ON ACCOUNTING AND FINANCIAL DISCLOSURE
None.
ITEM 9A. CONTROLS AND PROCEDURES
Controls and Procedures
Disclosure Controls and Procedures
Based on their evaluation as of
January 27, 2019
, our management, including our Chief Executive Officer and Chief Financial Officer, has concluded that our disclosure controls and procedures (as defined in Rule 13a-15(e) under the Securities Exchange Act of 1934, as amended, or the Exchange Act) were effective to provide reasonable assurance.
Management’s Annual Report on Internal Control Over Financial Reporting
Our management is responsible for establishing and maintaining adequate internal control over financial reporting, as such term is defined in Exchange Act Rule 13a-15(f). Under the supervision and with the participation of our management, including our Chief Executive Officer and Chief Financial Officer, we conducted an evaluation of the effectiveness of our internal control over financial reporting as of
January 27, 2019
based on the criteria set forth in
Internal Control - Integrated Framework (2013)
issued by the Committee of Sponsoring Organizations of the Treadway Commission. Based on our evaluation under the criteria set forth in
Internal Control — Integrated Framework
, our management concluded that our internal control over financial reporting was effective as of
January 27, 2019
.
The effectiveness of our internal control over financial reporting as of
January 27, 2019
has been audited by PricewaterhouseCoopers LLP, an independent registered public accounting firm, as stated in its report which is included herein.
35
Changes in Internal Control Over Financial Reporting
There were no changes in our internal control over financial reporting during our last fiscal quarter that have materially affected, or are reasonably likely to materially affect, our internal control over financial reporting.
Inherent Limitations on Effectiveness of Controls
Our management, including our Chief Executive Officer and Chief Financial Officer, does not expect that our disclosure controls and procedures or our internal controls, will prevent all error and all fraud. A control system, no matter how well conceived and operated, can provide only reasonable, not absolute, assurance that the objectives of the control system are met. Further, the design of a control system must reflect the fact that there are resource constraints, and the benefits of controls must be considered relative to their costs. Because of the inherent limitations in all control systems, no evaluation of controls can provide absolute assurance that all control issues and instances of fraud, if any, within NVIDIA have been detected.
ITEM 9B. OTHER INFORMATION
None.
PART III
Certain information required by Part III is omitted from this report because we will file with the SEC a definitive proxy statement pursuant to Regulation 14A, or the
2019
Proxy Statement, no later than 120 days after the end of fiscal year 2019, and certain information included therein is incorporated herein by reference.
ITEM 10. DIRECTORS, EXECUTIVE OFFICERS AND CORPORATE GOVERNANCE
Identification of Directors
Information regarding directors required by this item will be contained in our
2019
Proxy Statement under the caption “Proposal 1 - Election of Directors,” and is hereby incorporated by reference.
Identification of Executive Officers
Reference is made to the information regarding executive officers appearing under the heading “Executive Officers of the Registrant” in Part I of this Annual Report on Form 10-K, which information is hereby incorporated by reference.
Identification of Audit Committee and Financial Experts
Information regarding our Audit Committee required by this item will be contained in our
2019
Proxy Statement under the captions “Report of the Audit Committee of the Board of Directors” and “Information About the Board of Directors and Corporate Governance,” and is hereby incorporated by reference.
Material Changes to Procedures for Recommending Directors
Information regarding procedures for recommending directors required by this item will be contained in our
2019
Proxy Statement under the caption “Information About the Board of Directors and Corporate Governance,” and is hereby incorporated by reference.
Compliance with Section 16(a) of the Exchange Act
Information regarding compliance with Section 16(a) of the Exchange Act required by this item will be contained in our
2019
Proxy Statement under the caption “Section 16(a) Beneficial Ownership Reporting Compliance,” and is hereby incorporated by reference.
Code of Conduct
Information regarding our Code of Conduct required by this item will be contained in our
2019
Proxy Statement under the caption “Information About the Board of Directors and Corporate Governance - Code of Conduct,” and is hereby incorporated by reference. The full text of our Code of Conduct and Financial Team Code of Conduct are published on the Investor Relations portion of our website, under Corporate Governance, at www.nvidia.com. The contents of our website are not a part of this Annual Report on Form 10-K.
36
ITEM 11. EXECUTIVE COMPENSATION
Information regarding our executive compensation required by this item will be contained in our
2019
Proxy Statement under the captions “Executive Compensation”, “Compensation Committee Interlocks and Insider Participation”, “Director Compensation” and “Compensation Committee Report,” and is hereby incorporated by reference.
ITEM 12. SECURITY OWNERSHIP OF CERTAIN BENEFICIAL OWNERS AND MANAGEMENT AND RELATED STOCKHOLDER MATTERS
Ownership of NVIDIA Securities
Information regarding ownership of NVIDIA securities required by this item will be contained in our
2019
Proxy Statement under the caption “Security Ownership of Certain Beneficial Owners and Management,” and is hereby incorporated by reference.
Equity Compensation Plan Information
Information regarding our equity compensation plans required by this item will be contained in our
2019
Proxy Statement under the caption "Equity Compensation Plan Information," and is hereby incorporated by reference.
ITEM 13. CERTAIN RELATIONSHIPS AND RELATED TRANSACTIONS, AND DIRECTOR INDEPENDENCE
Information regarding related transactions and director independence required by this item will be contained in our
2019
Proxy Statement under the captions “Review of Transactions with Related Persons” and “Information About the Board of Directors and Corporate Governance - Independence of the Members of the Board of Directors,” and is hereby incorporated by reference.
ITEM 14. PRINCIPAL ACCOUNTING FEES AND SERVICES
Information regarding accounting fees and services required by this item will be contained in our
2019
Proxy Statement under the caption “Fees Billed by the Independent Registered Public Accounting Firm,” and is hereby incorporated by reference.
37
PART IV
ITEM 15. EXHIBITS, FINANCIAL STATEMENT SCHEDULE
|
|
|
Page
|
||
|
(a)
|
1.
|
Financial Statements
|
|
|
|
|
||||
|
|
||||
|
|
||||
|
|
||||
|
|
||||
|
|
||||
|
2.
|
Financial Statement Schedule
|
|
||
|
|
||||
|
3.
|
Exhibits
|
|
||
|
|
||||
38
REPORT OF INDEPENDENT REGISTERED PUBLIC ACCOUNTING FIRM
To the Stockholders and Board of Directors of NVIDIA Corporation
Opinions on the Financial Statements and Internal Control over Financial Reporting
We have audited the accompanying consolidated balance sheets of NVIDIA Corporation and its subsidiaries as of January 27, 2019 and January 28, 2018, and the related consolidated statements of income, comprehensive income, shareholders’ equity and cash flows for each of the three years in the period ended January 27, 2019, including the related notes and financial statement schedule listed in the index appearing under Item 15(a)(2) (collectively referred to as the “consolidated financial statements”). We also have audited the Company's internal control over financial reporting as of January 27, 2019, based on criteria established in Internal Control - Integrated Framework (2013) issued by the Committee of Sponsoring Organizations of the Treadway Commission (COSO).
In our opinion, the consolidated financial statements referred to above present fairly, in all material respects, the financial position of the Company as of January 27, 2019 and January 28, 2018, and the results of its operations and its cash flows for each of the three years in the period ended January 27, 2019 in conformity with accounting principles generally accepted in the United States of America. Also in our opinion, the Company maintained, in all material respects, effective internal control over financial reporting as of January 27, 2019, based on criteria established in Internal Control - Integrated Framework (2013) issued by the COSO.
Basis for Opinions
The Company's management is responsible for these consolidated financial statements, for maintaining effective internal control over financial reporting, and for its assessment of the effectiveness of internal control over financial reporting, included in Management's Annual Report on Internal Control over Financial Reporting appearing under Item 9A. Our responsibility is to express opinions on the Company’s consolidated financial statements and on the Company's internal control over financial reporting based on our audits. We are a public accounting firm registered with the Public Company Accounting Oversight Board (United States) (PCAOB) and are required to be independent with respect to the Company in accordance with the U.S. federal securities laws and the applicable rules and regulations of the Securities and Exchange Commission and the PCAOB.
We conducted our audits in accordance with the standards of the PCAOB. Those standards require that we plan and perform the audits to obtain reasonable assurance about whether the consolidated financial statements are free of material misstatement, whether due to error or fraud, and whether effective internal control over financial reporting was maintained in all material respects.
Our audits of the consolidated financial statements included performing procedures to assess the risks of material misstatement of the consolidated financial statements, whether due to error or fraud, and performing procedures that respond to those risks. Such procedures included examining, on a test basis, evidence regarding the amounts and disclosures in the consolidated financial statements. Our audits also included evaluating the accounting principles used and significant estimates made by management, as well as evaluating the overall presentation of the consolidated financial statements. Our audit of internal control over financial reporting included obtaining an understanding of internal control over financial reporting, assessing the risk that a material weakness exists, and testing and evaluating the design and operating effectiveness of internal control based on the assessed risk. Our audits also included performing such other procedures as we considered necessary in the circumstances. We believe that our audits provide a reasonable basis for our opinions.
Definition and Limitations of Internal Control over Financial Reporting
A company’s internal control over financial reporting is a process designed to provide reasonable assurance regarding the reliability of financial reporting and the preparation of financial statements for external purposes in accordance with generally accepted accounting principles. A company’s internal control over financial reporting includes those policies and procedures that (i) pertain to the maintenance of records that, in reasonable detail, accurately and fairly reflect the transactions and dispositions of the assets of the company; (ii) provide reasonable assurance that transactions are recorded as necessary to permit preparation of financial statements in accordance with generally accepted accounting principles, and that receipts and expenditures of the company are being made only in accordance with authorizations of management and directors of the company; and (iii) provide reasonable assurance regarding prevention or timely detection of unauthorized acquisition, use, or disposition of the company’s assets that could have a material effect on the financial statements.
39
Because of its inherent limitations, internal control over financial reporting may not prevent or detect misstatements. Also, projections of any evaluation of effectiveness to future periods are subject to the risk that controls may become inadequate because of changes in conditions, or that the degree of compliance with the policies or procedures may deteriorate.
/s/ PricewaterhouseCoopers LLP
San Jose, California
February 21, 2019
We have served as the Company’s auditor since 2004.
40
NVIDIA CORPORATION AND SUBSIDIARIES
CONSOLIDATED STATEMENTS OF INCOME
(In millions, except per share data)
|
Year Ended
|
|||||||||||
|
January 27,
2019 |
January 28,
2018 |
January 29,
2017 |
|||||||||
|
Revenue
|
$
|
11,716
|
|
$
|
9,714
|
|
$
|
6,910
|
|
||
|
Cost of revenue
|
4,545
|
|
3,892
|
|
2,847
|
|
|||||
|
Gross profit
|
7,171
|
|
5,822
|
|
4,063
|
|
|||||
|
Operating expenses
|
|
|
|
||||||||
|
Research and development
|
2,376
|
|
1,797
|
|
1,463
|
|
|||||
|
Sales, general and administrative
|
991
|
|
815
|
|
663
|
|
|||||
|
Restructuring and other charges
|
—
|
|
—
|
|
3
|
|
|||||
|
Total operating expenses
|
3,367
|
|
2,612
|
|
2,129
|
|
|||||
|
Income from operations
|
3,804
|
|
3,210
|
|
1,934
|
|
|||||
|
Interest income
|
136
|
|
69
|
|
54
|
|
|||||
|
Interest expense
|
(58
|
)
|
(61
|
)
|
(58
|
)
|
|||||
|
Other, net
|
14
|
|
(22
|
)
|
(25
|
)
|
|||||
|
Total other income (expense)
|
92
|
|
(14
|
)
|
(29
|
)
|
|||||
|
Income before income tax
|
3,896
|
|
3,196
|
|
1,905
|
|
|||||
|
Income tax expense (benefit)
|
(245
|
)
|
149
|
|
239
|
|
|||||
|
Net income
|
$
|
4,141
|
|
$
|
3,047
|
|
$
|
1,666
|
|
||
|
Net income per share:
|
|||||||||||
|
Basic
|
$
|
6.81
|
|
$
|
5.09
|
|
$
|
3.08
|
|
||
|
Diluted
|
$
|
6.63
|
|
$
|
4.82
|
|
$
|
2.57
|
|
||
|
Weighted average shares used in per share computation:
|
|||||||||||
|
Basic
|
608
|
|
599
|
|
541
|
|
|||||
|
Diluted
|
625
|
|
632
|
|
649
|
|
|||||
|
Cash dividends declared and paid per common share
|
$
|
0.610
|
|
$
|
0.570
|
|
$
|
0.485
|
|
||
See accompanying notes to the consolidated financial statements.
41
NVIDIA CORPORATION AND SUBSIDIARIES
CONSOLIDATED STATEMENTS OF COMPREHENSIVE INCOME
(In millions)
|
Year Ended
|
|||||||||||
|
January 27,
2019 |
January 28,
2018 |
January 29,
2017 |
|||||||||
|
Net income
|
$
|
4,141
|
|
$
|
3,047
|
|
$
|
1,666
|
|
||
|
Other comprehensive income (loss), net of tax
|
|||||||||||
|
Available-for-sale debt securities:
|
|||||||||||
|
Net unrealized gain (loss)
|
10
|
|
(5
|
)
|
(17
|
)
|
|||||
|
Reclassification adjustments for net realized gain included in net income
|
1
|
|
1
|
|
1
|
|
|||||
|
Net change in unrealized gain (loss)
|
11
|
|
(4
|
)
|
(16
|
)
|
|||||
|
Cash flow hedges:
|
|||||||||||
|
Net unrealized gain (loss)
|
6
|
|
(1
|
)
|
2
|
|
|||||
|
Reclassification adjustments for net realized gain (loss) included in net income
|
(11
|
)
|
3
|
|
2
|
|
|||||
|
Net change in unrealized gain (loss)
|
(5
|
)
|
2
|
|
4
|
|
|||||
|
Other comprehensive income (loss), net of tax
|
6
|
|
(2
|
)
|
(12
|
)
|
|||||
|
Total comprehensive income
|
$
|
4,147
|
|
$
|
3,045
|
|
$
|
1,654
|
|
||
See accompanying notes to the consolidated financial statements.
42
NVIDIA CORPORATION AND SUBSIDIARIES
CONSOLIDATED BALANCE SHEETS
(In millions, except par value)
|
|
January 27,
2019 |
January 28,
2018 |
|||||
|
ASSETS
|
|
|
|||||
|
Current assets:
|
|
|
|||||
|
Cash and cash equivalents
|
$
|
782
|
|
$
|
4,002
|
|
|
|
Marketable securities
|
6,640
|
|
3,106
|
|
|||
|
Accounts receivable, net
|
1,424
|
|
1,265
|
|
|||
|
Inventories
|
1,575
|
|
796
|
|
|||
|
Prepaid expenses and other current assets
|
136
|
|
86
|
|
|||
|
Total current assets
|
10,557
|
|
9,255
|
|
|||
|
Property and equipment, net
|
1,404
|
|
997
|
|
|||
|
Goodwill
|
618
|
|
618
|
|
|||
|
Intangible assets, net
|
45
|
|
52
|
|
|||
|
Other assets
|
668
|
|
319
|
|
|||
|
Total assets
|
$
|
13,292
|
|
$
|
11,241
|
|
|
|
LIABILITIES AND SHAREHOLDERS' EQUITY
|
|||||||
|
Current liabilities:
|
|
|
|||||
|
Accounts payable
|
$
|
511
|
|
$
|
596
|
|
|
|
Accrued and other current liabilities
|
818
|
|
542
|
|
|||
|
Convertible short-term debt
|
—
|
|
15
|
|
|||
|
Total current liabilities
|
1,329
|
|
1,153
|
|
|||
|
Long-term debt
|
1,988
|
|
1,985
|
|
|||
|
Other long-term liabilities
|
633
|
|
632
|
|
|||
|
Total liabilities
|
3,950
|
|
3,770
|
|
|||
|
Commitments and contingencies - see Note 12
|
|
|
|
|
|||
|
Shareholders’ equity:
|
|
|
|
|
|||
|
Preferred stock, $.001 par value; 2 shares authorized; none issued
|
—
|
|
—
|
|
|||
|
Common stock, $.001 par value; 2,000 shares authorized; 945 shares issued and 606 outstanding as of January 27, 2019; 932 shares issued and 606 outstanding as of January 28, 2018
|
1
|
|
1
|
|
|||
|
Additional paid-in capital
|
6,051
|
|
5,351
|
|
|||
|
Treasury stock, at cost (339 shares in 2019 and 326 shares in 2018)
|
(9,263
|
)
|
(6,650
|
)
|
|||
|
Accumulated other comprehensive loss
|
(12
|
)
|
(18
|
)
|
|||
|
Retained earnings
|
12,565
|
|
8,787
|
|
|||
|
Total shareholders' equity
|
9,342
|
|
7,471
|
|
|||
|
Total liabilities and shareholders' equity
|
$
|
13,292
|
|
$
|
11,241
|
|
|
See accompanying notes to the consolidated financial statements.
43
NVIDIA CORPORATION AND SUBSIDIARIES
CONSOLIDATED STATEMENTS OF SHAREHOLDERS’ EQUITY
|
Common Stock
Outstanding
|
Additional
|
Treasury
|
Accumulated Other Comprehensive
|
Retained
|
Total Shareholders'
|
|||||||||||||||||||||
|
(In millions, except per share data)
|
Shares
|
Amount
|
Paid-in Capital
|
Stock
|
Income (Loss)
|
Earnings
|
Equity
|
|||||||||||||||||||
|
Balances, January 31, 2016
|
539
|
|
$
|
1
|
|
$
|
4,170
|
|
$
|
(4,048
|
)
|
$
|
(4
|
)
|
$
|
4,350
|
|
$
|
4,469
|
|
||||||
|
Retained earnings adjustment due to adoption of an accounting standard related to stock-based compensation
|
—
|
|
—
|
|
—
|
|
—
|
|
—
|
|
353
|
|
353
|
|
||||||||||||
|
Other comprehensive loss
|
—
|
|
—
|
|
—
|
|
—
|
|
(12
|
)
|
—
|
|
(12
|
)
|
||||||||||||
|
Net income
|
—
|
|
—
|
|
—
|
|
—
|
|
—
|
|
1,666
|
|
1,666
|
|
||||||||||||
|
Issuance of common stock in exchange for warrants
|
44
|
|
—
|
|
(1
|
)
|
—
|
|
—
|
|
—
|
|
(1
|
)
|
||||||||||||
|
Convertible debt conversion
|
23
|
|
—
|
|
(6
|
)
|
—
|
|
—
|
|
—
|
|
(6
|
)
|
||||||||||||
|
Issuance of common stock from stock plans
|
20
|
|
—
|
|
167
|
|
—
|
|
—
|
|
—
|
|
167
|
|
||||||||||||
|
Tax withholding related to vesting of restricted stock units
|
(3
|
)
|
—
|
|
—
|
|
(177
|
)
|
—
|
|
—
|
|
(177
|
)
|
||||||||||||
|
Share repurchase
|
(15
|
)
|
—
|
|
—
|
|
(739
|
)
|
—
|
|
—
|
|
(739
|
)
|
||||||||||||
|
Exercise of convertible note hedges
|
(23
|
)
|
—
|
|
75
|
|
(75
|
)
|
—
|
|
—
|
|
—
|
|
||||||||||||
|
Cash dividends declared and paid ($0.485 per common share)
|
—
|
|
—
|
|
—
|
|
—
|
|
—
|
|
(261
|
)
|
(261
|
)
|
||||||||||||
|
Stock-based compensation
|
—
|
|
—
|
|
248
|
|
—
|
|
—
|
|
—
|
|
248
|
|
||||||||||||
|
Reclassification of convertible debt conversion obligation
|
—
|
|
—
|
|
55
|
|
—
|
|
—
|
|
—
|
|
55
|
|
||||||||||||
|
Balances, January 29, 2017
|
585
|
|
1
|
|
4,708
|
|
(5,039
|
)
|
(16
|
)
|
6,108
|
|
5,762
|
|
||||||||||||
|
Retained earnings adjustment due to adoption of an accounting standard related to income tax consequences of an intra-entity transfer of an asset
|
—
|
|
—
|
|
—
|
|
—
|
|
—
|
|
(27
|
)
|
(27
|
)
|
||||||||||||
|
Other comprehensive loss
|
—
|
|
—
|
|
—
|
|
—
|
|
(2
|
)
|
—
|
|
(2
|
)
|
||||||||||||
|
Net income
|
—
|
|
—
|
|
—
|
|
—
|
|
—
|
|
3,047
|
|
3,047
|
|
||||||||||||
|
Issuance of common stock in exchange for warrants
|
13
|
|
—
|
|
—
|
|
—
|
|
—
|
|
—
|
|
—
|
|
||||||||||||
|
Convertible debt conversion
|
33
|
|
—
|
|
(7
|
)
|
—
|
|
—
|
|
—
|
|
(7
|
)
|
||||||||||||
|
Issuance of common stock from stock plans
|
18
|
|
—
|
|
138
|
|
—
|
|
—
|
|
—
|
|
138
|
|
||||||||||||
|
Tax withholding related to vesting of restricted stock units
|
(4
|
)
|
—
|
|
—
|
|
(612
|
)
|
—
|
|
—
|
|
(612
|
)
|
||||||||||||
|
Share repurchase
|
(6
|
)
|
—
|
|
—
|
|
(909
|
)
|
—
|
|
—
|
|
(909
|
)
|
||||||||||||
|
Exercise of convertible note hedges
|
(33
|
)
|
—
|
|
90
|
|
(90
|
)
|
—
|
|
—
|
|
—
|
|
||||||||||||
|
Cash dividends declared and paid ($0.570 per common share)
|
—
|
|
—
|
|
—
|
|
—
|
|
—
|
|
(341
|
)
|
(341
|
)
|
||||||||||||
|
Stock-based compensation
|
—
|
|
—
|
|
391
|
|
—
|
|
—
|
|
—
|
|
391
|
|
||||||||||||
|
Reclassification of convertible debt conversion obligation
|
—
|
|
—
|
|
31
|
|
—
|
|
—
|
|
—
|
|
31
|
|
||||||||||||
|
Balances, January 28, 2018
|
606
|
|
1
|
|
5,351
|
|
(6,650
|
)
|
(18
|
)
|
8,787
|
|
7,471
|
|
||||||||||||
|
Retained earnings adjustment due to adoption of new revenue accounting standard
|
—
|
|
—
|
|
—
|
|
—
|
|
—
|
|
8
|
|
8
|
|
||||||||||||
|
Other comprehensive loss
|
—
|
|
—
|
|
—
|
|
—
|
|
6
|
|
—
|
|
6
|
|
||||||||||||
|
Net income
|
—
|
|
—
|
|
—
|
|
—
|
|
—
|
|
4,141
|
|
4,141
|
|
||||||||||||
|
Convertible debt conversion
|
1
|
|
—
|
|
—
|
|
—
|
|
—
|
|
—
|
|
—
|
|
||||||||||||
|
Issuance of common stock from stock plans
|
13
|
|
—
|
|
137
|
|
—
|
|
—
|
|
—
|
|
137
|
|
||||||||||||
|
Tax withholding related to vesting of restricted stock units
|
(4
|
)
|
—
|
|
—
|
|
(1,032
|
)
|
—
|
|
—
|
|
(1,032
|
)
|
||||||||||||
|
Share repurchase
|
(9
|
)
|
—
|
|
—
|
|
(1,579
|
)
|
—
|
|
—
|
|
(1,579
|
)
|
||||||||||||
|
Exercise of convertible note hedges
|
(1
|
)
|
—
|
|
2
|
|
(2
|
)
|
—
|
|
—
|
|
—
|
|
||||||||||||
|
Cash dividends declared and paid ($0.610 per common share)
|
—
|
|
—
|
|
—
|
|
—
|
|
—
|
|
(371
|
)
|
(371
|
)
|
||||||||||||
|
Stock-based compensation
|
—
|
|
—
|
|
561
|
|
—
|
|
—
|
|
—
|
|
561
|
|
||||||||||||
|
Balances, January 27, 2019
|
606
|
|
$
|
1
|
|
$
|
6,051
|
|
$
|
(9,263
|
)
|
$
|
(12
|
)
|
$
|
12,565
|
|
$
|
9,342
|
|
||||||
See accompanying notes to the consolidated financial statements.
44
NVIDIA CORPORATION AND SUBSIDIARIES
CONSOLIDATED STATEMENTS OF CASH FLOWS
(In millions)
|
Year Ended
|
|||||||||||
|
|
January 27,
2019 |
January 28,
2018 |
January 29,
2017 |
||||||||
|
Cash flows from operating activities:
|
|
|
|||||||||
|
Net income
|
$
|
4,141
|
|
$
|
3,047
|
|
$
|
1,666
|
|
||
|
Adjustments to reconcile net income to net cash provided by operating activities:
|
|
|
|||||||||
|
Stock-based compensation expense
|
557
|
|
391
|
|
247
|
|
|||||
|
Depreciation and amortization
|
262
|
|
199
|
|
187
|
|
|||||
|
Deferred income taxes
|
(315
|
)
|
(359
|
)
|
197
|
|
|||||
|
Loss on early debt conversions
|
—
|
|
19
|
|
21
|
|
|||||
|
Other
|
(45
|
)
|
20
|
|
33
|
|
|||||
|
Changes in operating assets and liabilities:
|
|
|
|||||||||
|
Accounts receivable
|
(149
|
)
|
(440
|
)
|
(321
|
)
|
|||||
|
Inventories
|
(776
|
)
|
—
|
|
(375
|
)
|
|||||
|
Prepaid expenses and other assets
|
(55
|
)
|
21
|
|
(18
|
)
|
|||||
|
Accounts payable
|
(135
|
)
|
90
|
|
184
|
|
|||||
|
Accrued and other current liabilities
|
256
|
|
33
|
|
(135
|
)
|
|||||
|
Other long-term liabilities
|
2
|
|
481
|
|
(14
|
)
|
|||||
|
Net cash provided by operating activities
|
3,743
|
|
3,502
|
|
1,672
|
|
|||||
|
Cash flows from investing activities:
|
|
|
|||||||||
|
Proceeds from maturities of marketable securities
|
7,232
|
|
1,078
|
|
969
|
|
|||||
|
Proceeds from sales of marketable securities
|
428
|
|
863
|
|
1,546
|
|
|||||
|
Purchases of marketable securities
|
(11,148
|
)
|
(36
|
)
|
(3,134
|
)
|
|||||
|
Purchases of property and equipment and intangible assets
|
(600
|
)
|
(593
|
)
|
(176
|
)
|
|||||
|
Investment in non-affiliates
|
(9
|
)
|
(36
|
)
|
(5
|
)
|
|||||
|
Proceeds from sale of long-lived assets and investments
|
—
|
|
2
|
|
7
|
|
|||||
|
Net cash provided by (used in) investing activities
|
(4,097
|
)
|
1,278
|
|
(793
|
)
|
|||||
|
Cash flows from financing activities:
|
|
|
|||||||||
|
Proceeds from issuance of debt
|
—
|
|
—
|
|
1,988
|
|
|||||
|
Payments related to repurchases of common stock
|
(1,579
|
)
|
(909
|
)
|
(739
|
)
|
|||||
|
Repayment of Convertible Notes
|
(16
|
)
|
(812
|
)
|
(673
|
)
|
|||||
|
Dividends paid
|
(371
|
)
|
(341
|
)
|
(261
|
)
|
|||||
|
Proceeds related to employee stock plans
|
137
|
|
139
|
|
167
|
|
|||||
|
Payments related to tax on restricted stock units
|
(1,032
|
)
|
(612
|
)
|
(176
|
)
|
|||||
|
Other
|
(5
|
)
|
(9
|
)
|
(15
|
)
|
|||||
|
Net cash provided by (used in) financing activities
|
(2,866
|
)
|
(2,544
|
)
|
291
|
|
|||||
|
Change in cash and cash equivalents
|
(3,220
|
)
|
2,236
|
|
1,170
|
|
|||||
|
Cash and cash equivalents at beginning of period
|
4,002
|
|
1,766
|
|
596
|
|
|||||
|
Cash and cash equivalents at end of period
|
$
|
782
|
|
$
|
4,002
|
|
$
|
1,766
|
|
||
45
|
|
Year Ended
|
||||||||||
|
|
January 27,
2019 |
January 28,
2018 |
January 29,
2017 |
||||||||
|
Supplemental disclosures of cash flow information:
|
|||||||||||
|
Cash paid for income taxes, net
|
$
|
61
|
|
$
|
22
|
|
$
|
14
|
|
||
|
Cash paid for interest
|
$
|
55
|
|
$
|
55
|
|
$
|
13
|
|
||
|
Non-cash investing and financing activity:
|
|
|
|||||||||
|
Assets acquired by assuming related liabilities
|
$
|
76
|
|
$
|
36
|
|
$
|
16
|
|
||
See accompanying notes to the consolidated financial statements.
46
NVIDIA CORPORATION AND SUBSIDIARIES
NOTES TO THE CONSOLIDATED FINANCIAL STATEMENTS
Note 1
- Organization and Summary of Significant Accounting Policies
Our Company
Headquartered in Santa Clara, California, NVIDIA was incorporated in California in April 1993 and reincorporated in Delaware in April 1998.
All references to “NVIDIA,” “we,” “us,” “our” or the “Company” mean NVIDIA Corporation and its subsidiaries.
Fiscal Year
We operate on a 52- or 53-week year, ending on the last Sunday in January. Fiscal years 2019, 2018 and 2017 were 52-week years.
Reclassifications
Certain prior fiscal year balances have been reclassified to conform to the current fiscal year presentation.
Principles of Consolidation
Our consolidated financial statements include the accounts of NVIDIA Corporation and our wholly-owned subsidiaries. All intercompany balances and transactions have been eliminated in consolidation.
Use of Estimates
The preparation of financial statements in conformity with U.S. GAAP requires management to make estimates and assumptions that affect the reported amounts of assets and liabilities and disclosures of contingent assets and liabilities at the date of the financial statements and the reported amounts of revenue and expenses during the reporting period. Actual results could differ materially from our estimates. On an on-going basis, we evaluate our estimates, including those related to revenue recognition, cash equivalents and marketable securities, accounts receivable, inventories, income taxes, goodwill, stock-based compensation, litigation, investigation and settlement costs, restructuring and other charges, and other contingencies. These estimates are based on historical facts and various other assumptions that we believe are reasonable.
Revenue Recognition
We derive our revenue from product sales, including hardware and systems, license and development arrangements, and software licensing. We determine revenue recognition through the following steps: (1) identification of the contract with a customer; (2) identification of the performance obligations in the contract; (3) determination of the transaction price; (4) allocation of the transaction price to the performance obligations in the contract; and (5) recognition of revenue when, or as, we satisfy a performance obligation.
Product Sales Revenue
Revenue from product sales is recognized upon transfer of control of promised products to customers in an amount that reflects the consideration we expect to receive in exchange for those products. Revenue is recognized net of allowances for returns, customer programs and any taxes collected from customers.
For products sold with a right of return, we record a reduction to revenue by establishing a sales return allowance for estimated product returns at the time revenue is recognized, based primarily on historical return rates. However, if product returns for a fiscal period are anticipated to exceed historical return rates, we may determine that additional sales return allowances are required to properly reflect our estimated exposure for product returns.
Our customer programs involve rebates, which are designed to serve as sales incentives to resellers of our products in various target markets, and marketing development funds, or MDFs, which represent monies paid to our partners that are earmarked for market segment development and are designed to support our partners’ activities while also promoting NVIDIA products. We account for customer programs as a reduction to revenue and accrue for potential rebates and MDFs based on the amount we expect to be claimed by customers.
47
NVIDIA CORPORATION AND SUBSIDIARIES
NOTES TO THE CONSOLIDATED FINANCIAL STATEMENTS
(Continued)
License and Development Arrangements
Our license and development arrangements with customers typically require significant customization of our intellectual property components. As a result, we recognize the revenue from the license and the revenue from the development services as a single performance obligation over the period in which the development services are performed. We measure progress to completion based on actual cost incurred to date as a percentage of the estimated total cost required to complete each project. If a loss on an arrangement becomes probable during a period, we record a provision for such loss in that period.
Software Licensing
Our software licenses provide our customers with a right to use the software when it is made available to the customer. Customers may purchase either perpetual licenses or subscriptions to licenses, which differ mainly in the duration over which the customer benefits from the software. Software licenses are frequently sold along with post-contract customer support, or PCS. For such arrangements, we allocate revenue to the software license and PCS on a relative standalone selling price basis by maximizing the use of observable inputs to determine the standalone selling price for each performance obligation. Revenue from software licenses is recognized up front when the software is made available to the customer. PCS revenue is recognized ratably over the service period, or as services are performed.
Advertising Expenses
We expense advertising costs in the period in which they are incurred. Advertising expenses for fiscal years
2019
,
2018
, and
2017
were $
21 million
,
$25 million
, and
$17 million
, respectively.
Product Warranties
We generally offer a limited warranty to end-users that ranges from one to three years for products in order to repair or replace products for any manufacturing defects or hardware component failures. Cost of revenue includes the estimated cost of product warranties that are calculated at the point of revenue recognition. Under limited circumstances, we may offer an extended limited warranty to customers for certain products. We also accrue for known warranty and indemnification issues if a loss is probable and can be reasonably estimated.
Stock-based Compensation
We use the closing trading price of our common stock on the date of grant, minus a dividend yield discount, as the fair value of awards of restricted stock units, or RSUs, and performance stock units that are based on our corporate financial performance targets, or PSUs. We use a Monte Carlo simulation on the date of grant to estimate the fair value of performance stock units that are based on market conditions, or market-based PSUs. The compensation expense for RSUs and market-based PSUs is recognized using a straight-line attribution method over the requisite employee service period while compensation expense for PSUs is recognized using an accelerated amortization model. We estimate the fair value of shares to be issued under our employee stock purchase plan, or ESPP, using the Black-Scholes model at the commencement of an offering period in March and September of each year. Stock-based compensation for our ESPP is expensed using an accelerated amortization model. Additionally, we estimate forfeitures annually based on historical experience and revise the estimates of forfeiture in subsequent periods if actual forfeitures differ from those estimates.
Litigation, Investigation and Settlement Costs
From time to time, we are involved in legal actions and/or investigations by regulatory bodies. There are many uncertainties associated with any litigation or investigation, and we cannot be certain that these actions or other third-party claims against us will be resolved without litigation, fines and/or substantial settlement payments. If information becomes available that causes us to determine that a loss in any of our pending litigation, investigations or settlements is probable, and we can reasonably estimate the loss associated with such events, we will record the loss in accordance with U.S. GAAP. However, the actual liability in any such litigation or investigation may be materially different from our estimates, which could require us to record additional costs.
Foreign Currency Remeasurement
We use the United States dollar as our functional currency for all of our subsidiaries. Foreign currency monetary assets and liabilities are remeasured into United States dollars at end-of-period exchange rates. Non-monetary assets and liabilities such as property and equipment, and equity are remeasured at historical exchange rates. Revenue and expenses are remeasured at average exchange rates in effect during each period, except for those expenses related to the previously noted balance sheet amounts, which are remeasured at historical exchange rates. Gains or losses from foreign currency
48
NVIDIA CORPORATION AND SUBSIDIARIES
NOTES TO THE CONSOLIDATED FINANCIAL STATEMENTS
(Continued)
remeasurement are included in other income or expense in our Consolidated Statements of Income and to date have not been significant.
Income Taxes
We recognize federal, state and foreign current tax liabilities or assets based on our estimate of taxes payable or refundable in the current fiscal year by tax jurisdiction. We recognize federal, state and foreign deferred tax assets or liabilities, as appropriate, for our estimate of future tax effects attributable to temporary differences and carryforwards; and we record a valuation allowance to reduce any deferred tax assets by the amount of any tax benefits that, based on available evidence and judgment, are not expected to be realized.
Our calculation of deferred tax assets and liabilities is based on certain estimates and judgments and involves dealing with uncertainties in the application of complex tax laws. Our estimates of deferred tax assets and liabilities may change based, in part, on added certainty or finality to an anticipated outcome, changes in accounting standards or tax laws in the United States, or foreign jurisdictions where we operate, or changes in other facts or circumstances. In addition, we recognize liabilities for potential United States and foreign income tax contingencies based on our estimate of whether, and the extent to which, additional taxes may be due. If we determine that payment of these amounts is unnecessary or if the recorded tax liability is less than our current assessment, we may be required to recognize an income tax benefit or additional income tax expense in our financial statements accordingly.
As of
January 27, 2019
, we had a valuation allowance of
$562 million
related to state and certain foreign deferred tax assets that management determined are not likely to be realized due to projections of future taxable income and potential utilization limitations of tax attributes acquired as a result of stock ownership changes. To the extent realization of the deferred tax assets becomes more-likely-than-not, we would recognize such deferred tax asset as an income tax benefit during the period.
We recognize the benefit from a tax position only if it is more-likely-than-not that the position would be sustained upon audit based solely on the technical merits of the tax position. Our policy is to include interest and penalties related to unrecognized tax benefits as a component of income tax expense.
The Tax Cuts and Jobs Act, or TCJA, which was enacted in December 2017, significantly changes U.S. tax law, including a reduction of the U.S. federal corporate income tax rate from 35% to 21%, a requirement for companies to pay a one-time transition tax on the earnings of certain foreign subsidiaries that were previously tax deferred, and the creation of new taxes (global intangible low-taxed income, or GILTI) on certain foreign-source earnings. As a fiscal year-end taxpayer, certain provisions of the TCJA began to impact us in the fourth quarter of fiscal year 2018, while other provisions impacted us beginning in fiscal year 2019. The Securities and Exchange Commission, or the SEC, had provided guidance in Staff Accounting Bulletin No. 118, Income Tax Accounting Implications of the Tax Cuts and Jobs Act (SAB 118), which allowed companies to record provisional amounts during a measurement period up to one year from the enactment date. As of January 27, 2019, we completed our accounting for all of the enactment-date income tax effects of the TCJA and elected to account for GILTI in deferred taxes. Refer to
Note 13
of these Notes to the Consolidated Financial Statements for additional information.
Net Income Per Share
Basic net income per share is computed using the weighted average number of common shares outstanding during the period. Diluted net income per share is computed using the weighted average number of common and potentially dilutive shares outstanding during the period, using the treasury stock method. Under the treasury stock method, the effect of equity awards outstanding is not included in the computation of diluted net income per share for periods when their effect is anti-dilutive. Additionally, we issued convertible notes with a net settlement feature that required us, upon conversion, to settle the principal amount of debt for cash and the conversion premium for cash or shares of our common stock. Our Convertible Notes, Note Hedges, and related Warrants contained various conversion features, which are further described in Note 11 of these Notes to the Consolidated Financial Statements. The potentially dilutive shares resulting from the Convertible Notes and Warrants under the treasury stock method were included in the calculation of diluted income per share when their inclusion was dilutive. However, the Note Hedges were not included in the calculation of diluted net income per share unless actually exercised, as their pre-exercised effect would have been anti-dilutive under the treasury stock method.
49
NVIDIA CORPORATION AND SUBSIDIARIES
NOTES TO THE CONSOLIDATED FINANCIAL STATEMENTS
(Continued)
Cash and Cash Equivalents
We consider all highly liquid investments that are readily convertible into cash and have an original maturity of three months or less at the time of purchase to be cash equivalents.
Marketable Securities
Marketable securities consist of highly liquid debt investments with maturities of greater than three months when purchased. We generally classify our marketable securities at the date of acquisition as available-for-sale. These debt securities are reported at fair value with the related unrealized gains and losses included in accumulated other comprehensive income or loss, a component of shareholders’ equity, net of tax. The fair value of interest-bearing debt securities includes accrued interest. Any unrealized losses which are considered to be other-than-temporary impairments are recorded in the other income or expense, net, section of our Consolidated Statements of Income. Realized gains and losses on the sale of marketable securities are determined using the specific-identification method and recorded in the other income or expense, net, section of our Consolidated Statements of Income.
All of our available-for-sale debt investments are subject to a periodic impairment review. We record a charge to earnings when a decline in fair value is significantly below cost basis and judged to be other-than-temporary or have other indicators of impairments. If the fair value of an available-for-sale debt instrument is less than its amortized cost basis, an other-than-temporary impairment is triggered in circumstances where (1) we intend to sell the instrument, (2) it is more likely than not that we will be required to sell the instrument before recovery of its amortized cost basis, or (3) a credit loss exists where we do not expect to recover the entire amortized cost basis of the instrument. In these situations, we recognize an other-than-temporary impairment in earnings equal to the entire difference between the debt instruments’ amortized cost basis and its fair value. For available-for-sale debt instruments that are considered other-than-temporarily impaired due to the existence of a credit loss, if we do not intend to sell and it is not more likely than not that we will not be required to sell the instrument before recovery of its remaining amortized cost basis (amortized cost basis less any current-period credit loss), we separate the amount of the impairment into the amount that is credit related and the amount due to all other factors. The credit loss component is recognized in earnings while loss related to all other factors is recorded in accumulated other comprehensive income or loss.
Fair Value of Financial Instruments
The carrying value of cash equivalents, accounts receivable, accounts payable and accrued liabilities approximate their fair values due to their relatively short maturities as of
January 27, 2019
and
January 28, 2018
. Marketable securities are comprised of available-for-sale securities that are reported at fair value with the related unrealized gains or losses included in accumulated other comprehensive income or loss, a component of shareholders’ equity, net of tax. Fair value of the marketable securities is determined based on quoted market prices. Derivative instruments are recognized as either assets or liabilities and are measured at fair value. The accounting for changes in the fair value of a derivative depends on the intended use of the derivative and the resulting designation. For derivative instruments designated as fair value hedges, the gains or losses are recognized in earnings in the periods of change together with the offsetting losses or gains on the hedged items attributed to the risk being hedged. For derivative instruments designated as cash-flow hedges, the effective portion of the gains or losses on the derivatives is initially reported as a component of other comprehensive income or loss and is subsequently recognized in earnings when the hedged exposure is recognized in earnings. For derivative instruments not designated for hedge accounting, changes in fair value are recognized in earnings.
Concentration of Credit Risk
Financial instruments that potentially subject us to concentrations of credit risk consist primarily of cash equivalents, marketable securities, and accounts receivable. Our investment policy requires the purchase of highly-rated fixed income securities, the diversification of investment type and credit exposures, and includes certain limits on our portfolio duration. Accounts receivable from significant customers, those representing 10% or more of total accounts receivable, aggregated approximately
19%
of our accounts receivable balance from
one
customer as of
January 27, 2019
and
28%
of our account receivable balance from
two
customers as of
January 28, 2018
. We perform ongoing credit evaluations of our customers’ financial condition and maintain an allowance for potential credit losses. This allowance consists of an amount identified for specific customers and an amount based on overall estimated exposure. Our overall estimated exposure excludes amounts covered by credit insurance and letters of credit.
50
NVIDIA CORPORATION AND SUBSIDIARIES
NOTES TO THE CONSOLIDATED FINANCIAL STATEMENTS
(Continued)
Accounts Receivable
We maintain an allowance for doubtful accounts receivable for estimated losses resulting from the inability of our customers to make required payments. We determine this allowance by identifying amounts for specific customer issues as well as amounts based on overall estimated exposure. Factors impacting the allowance include the level of gross receivables, the financial condition of our customers and the extent to which balances are covered by credit insurance or letters of credit.
Inventories
Inventory cost is computed on an adjusted standard basis, which approximates actual cost on an average or first-in, first-out basis. Inventory costs consist primarily of the cost of semiconductors purchased from subcontractors, including wafer fabrication, assembly, testing and packaging, manufacturing support costs, including labor and overhead associated with such purchases, final test yield fallout, and shipping costs, as well as the cost of purchased memory products and other component parts. We charge cost of sales for inventory provisions to write down our inventory to the lower of cost or net realizable value or to completely write off obsolete or excess inventory. Most of our inventory provisions relate to the write-off of excess quantities of products, based on our inventory levels and future product purchase commitments compared to assumptions about future demand and market conditions. Once inventory has been written-off or written-down, it creates a new cost basis for the inventory that is not subsequently written-up.
Property and Equipment
Property and equipment are stated at cost. Depreciation of property and equipment is computed using the straight-line method based on the estimated useful lives of the assets, generally
three
to
five
years. Once an asset is identified for retirement or disposition, the related cost and accumulated depreciation or amortization are removed, and a gain or loss is recorded. The estimated useful lives of our buildings are up to
thirty
years. Depreciation expense includes the amortization of assets recorded under capital leases. Leasehold improvements and assets recorded under capital leases are amortized over the shorter of the expected lease term or the estimated useful life of the asset.
Goodwill
Goodwill is subject to our annual impairment test during the fourth quarter of our fiscal year, or earlier if indicators of potential impairment exist. For the purposes of completing our impairment test, we perform either a qualitative or a quantitative analysis on a reporting unit basis.
Qualitative factors include industry and market considerations, overall financial performance, and other relevant events and factors affecting the reporting units.
Our quantitative impairment test considers both the income approach and the market approach to estimate a reporting unit’s fair value. The income and market valuation approaches consider a number of factors that include, but are not limited to, prospective financial information, growth rates, residual values, discount rates and comparable multiples from publicly traded companies in our industry and require us to make certain assumptions and estimates regarding industry economic factors and the future profitability of our business. Refer to
Note 5
of these Notes to the Consolidated Financial Statements for additional information.
Intangible Assets and Other Long-Lived Assets
Intangible assets primarily represent rights acquired under technology licenses, patents, acquired intellectual property, trademarks and customer relationships. We currently amortize our intangible assets with definitive lives over periods ranging from
three
to
ten
years using a method that reflects the pattern in which the economic benefits of the intangible asset are consumed or otherwise used up or, if that pattern cannot be reliably determined, using a straight-line amortization method.
Long-lived assets, such as property and equipment and intangible assets subject to amortization are reviewed for impairment whenever events or changes in circumstances indicate that the carrying amount of an asset or asset group may not be recoverable. Recoverability of assets to be held and used is measured by a comparison of the carrying amount of an asset or asset group to estimated undiscounted future cash flows expected to be generated by the asset, or asset group. If the carrying amount of an asset or asset group exceeds its estimated future cash flows, an impairment charge is recognized for the amount by which the carrying amount of the asset or asset group exceeds the estimated fair value of the asset or asset group. Fair value is determined based on the estimated discounted future cash flows expected to be generated by the asset or asset group. Assets and liabilities to be disposed of would be separately presented in the
51
NVIDIA CORPORATION AND SUBSIDIARIES
NOTES TO THE CONSOLIDATED FINANCIAL STATEMENTS
(Continued)
Consolidated Balance Sheet and the assets would be reported at the lower of the carrying amount or fair value less costs to sell, and would no longer be depreciated.
Adoption of New and Recently Issued Accounting Pronouncements
Recently Adopted Accounting Pronouncements
The Financial Accounting Standards Board, or FASB, issued an accounting standards update that creates a single source of revenue guidance under U.S. GAAP for all companies, in all industries. We adopted this guidance on January 29, 2018 using the modified retrospective approach. Refer to Note 2 of these Notes to the Consolidated Financial Statements for additional information.
In January 2016, the FASB issued an accounting standards update to amend certain aspects of recognition, measurement, presentation, and disclosure of financial instruments. We are now required to recognize changes in the fair value of our equity investments through net income rather than other comprehensive income. We adopted this guidance in the first quarter of fiscal year 2019 and applied it prospectively. The adoption of this guidance did not have a significant impact on our Consolidated Financial Statements.
Recent Accounting Pronouncements Not Yet Adopted
The FASB issued an accounting standards update regarding the accounting for leases under which we will begin recognizing lease assets and liabilities on the balance sheet for lease terms of more than 12 months. We will adopt this guidance using the optional transition method at the beginning of fiscal year 2020 and will not restate comparative prior periods. Additionally, we will elect the package of practical expedients as permitted by the guidance. We are in the process of finalizing changes to our systems and processes in conjunction with our review of lease agreements and currently expect the adoption of this accounting guidance to result in an increase in lease assets and a corresponding increase in lease liabilities on our Consolidated Balance Sheet of approximately
$500 million
.
In June 2016, the FASB issued a new accounting standard to replace the incurred loss impairment methodology under current GAAP with a methodology that reflects expected credit losses and requires consideration of a broader range of reasonable and supportable information to inform credit loss estimates. We will be required to use a forward-looking expected credit loss model for accounts receivable and other financial instruments, including available-for-sale debt securities. The standard will be effective for us beginning in the first quarter of fiscal year 2021, with early adoption permitted. We are currently evaluating the impact of this standard on our Consolidated Financial Statements.
Note 2 - New Revenue Accounting Standard
Method and Impact of Adoption
On January 29, 2018, we adopted the new revenue accounting standard using the modified retrospective method and applied it to contracts that were not completed as of that date. Upon adoption, we recognized the cumulative effect of the new standard as a
$7 million
increase to opening retained earnings, net of tax. Comparative information for prior periods has not been adjusted. The impact of the new standard on our consolidated financial statements for fiscal year 2019 was not significant.
Deferred Revenue and Performance Obligations
Deferred revenue is comprised mainly of customer advances and deferrals related to license and development arrangements and PCS related to software licensing. The following table shows the changes in deferred revenue during fiscal year 2019:
52
NVIDIA CORPORATION AND SUBSIDIARIES
NOTES TO THE CONSOLIDATED FINANCIAL STATEMENTS
(Continued)
|
|
January 27,
2019 |
||
|
|
(in millions)
|
||
|
Balance as of January 28, 2018
|
$
|
68
|
|
|
Adjustment to retained earnings upon adoption of new revenue standard
|
(5
|
)
|
|
|
Balance as of January 29, 2018
|
63
|
|
|
|
Deferred revenue added during the period
|
344
|
|
|
|
Revenue recognized during the period
|
(269
|
)
|
|
|
Balance as of January 27, 2019
|
$
|
138
|
|
Revenue related to remaining performance obligations represents the amount of contracted license and development arrangements and PCS that has not been recognized. As of January 27, 2019, the amount of our remaining performance obligations that has not been recognized as revenue was
$305 million
, of which we expect to recognize approximately
50%
as revenue over the next twelve months and the remainder thereafter. This amount excludes the value of remaining performance obligations for contracts with an original expected length of one year or less.
Refer to Note 16 of these Notes to the Consolidated Financial Statements for additional information, including disaggregated revenue disclosures.
Note 3
- Stock-Based Compensation
Our stock-based compensation expense is associated with restricted stock units, or RSUs, performance stock units that are based on our corporate financial performance targets, or PSUs, performance stock units that are based on market conditions, or market-based PSUs, and our ESPP.
Our Consolidated Statements of Income include stock-based compensation expense, net of amounts allocated to inventory, as follows:
|
|
Year Ended
|
||||||||||
|
January 27,
2019 |
January 28,
2018 |
January 29,
2017 |
|||||||||
|
|
(In millions)
|
||||||||||
|
Cost of revenue
|
$
|
27
|
|
$
|
21
|
|
$
|
15
|
|
||
|
Research and development
|
336
|
|
219
|
|
134
|
|
|||||
|
Sales, general and administrative
|
194
|
|
151
|
|
98
|
|
|||||
|
Total
|
$
|
557
|
|
$
|
391
|
|
$
|
247
|
|
||
Stock-based compensation capitalized in inventories was not significant during fiscal years
2019
,
2018
, and
2017
.
The following is a summary of equity awards granted under our equity incentive plans:
|
Year Ended
|
|||||||||||
|
January 27,
2019 |
January 28,
2018 |
January 29,
2017 |
|||||||||
|
(In millions, except per share data)
|
|||||||||||
|
RSUs, PSUs and Market-based PSUs
|
|||||||||||
|
Awards granted
|
4
|
|
6
|
|
12
|
|
|||||
|
Estimated total grant-date fair value
|
$
|
1,109
|
|
$
|
929
|
|
$
|
591
|
|
||
|
Weighted average grant-date fair value (per share)
|
$
|
258.26
|
|
$
|
145.91
|
|
$
|
50.57
|
|
||
|
ESPP
|
|||||||||||
|
Shares purchased
|
1
|
|
5
|
|
4
|
|
|||||
|
Weighted average price (per share)
|
$
|
107.48
|
|
$
|
21.24
|
|
$
|
18.51
|
|
||
|
Weighted average grant-date fair value (per share)
|
$
|
38.51
|
|
$
|
7.12
|
|
$
|
5.80
|
|
||
53
NVIDIA CORPORATION AND SUBSIDIARIES
NOTES TO THE CONSOLIDATED FINANCIAL STATEMENTS
(Continued)
Beginning fiscal year 2015, we shifted away from granting stock options and toward granting RSUs, PSUs and market-based PSUs to reflect changing market trends for equity incentives at our peer companies. The number of PSUs that will ultimately vest is contingent on the Company’s level of achievement versus the corporate financial performance target established by our Compensation Committee in the beginning of each fiscal year.
Of the total fair value of equity awards, we estimated that the stock-based compensation expense related to the equity awards that are not expected to vest for fiscal year
2019
was
$88 million
.
|
January 27,
2019 |
January 28,
2018 |
||||||
|
(In millions)
|
|||||||
|
Aggregate unearned stock-based compensation expense
|
$
|
1,580
|
|
$
|
1,091
|
|
|
|
Estimated weighted average remaining amortization period
|
(In years)
|
||||||
|
RSUs, PSUs and market-based PSUs
|
2.2
|
|
2.3
|
|
|||
|
ESPP
|
0.8
|
|
0.7
|
|
|||
The fair value of shares issued under our ESPP have been estimated with the following assumptions:
|
|
Year Ended
|
||||
|
|
January 27,
2019 |
January 28,
2018 |
January 29,
2017 |
||
|
(Using the Black-Scholes model)
|
|||||
|
ESPP
|
|||||
|
Weighted average expected life (in years)
|
0.1-2.0
|
0.5-2.0
|
0.5-2.0
|
||
|
Risk-free interest rate
|
1.6%-2.8%
|
0.8%-1.4%
|
0.5%-0.9%
|
||
|
Volatility
|
24%-75%
|
40%-54%
|
30%-39%
|
||
|
Dividend yield
|
0.3%-0.4%
|
0.3%-0.5%
|
0.7%-1.4%
|
||
For ESPP shares, the expected term represents the average term from the first day of the offering period to the purchase date. The risk-free interest rate assumption used to value ESPP shares is based upon observed interest rates on Treasury bills appropriate for the expected term. Our expected stock price volatility assumption for ESPP is estimated using historical volatility. For awards granted, we use the dividend yield at grant date. Our RSU, PSU, and market-based PSU awards are not eligible for cash dividends prior to vesting; therefore, the fair values of RSUs, PSUs, and market-based PSUs are discounted for the dividend yield.
Additionally, for RSU, PSU, and market-based PSU awards, we estimate forfeitures annually and revise the estimates of forfeiture in subsequent periods if actual forfeitures differ from those estimates. Forfeitures are estimated based on historical experience.
Equity Incentive Program
We grant or have granted stock options, RSUs, PSUs, market-based PSUs, and stock purchase rights under the following equity incentive plans.
Amended and Restated 2007 Equity Incentive Plan
In 2007, our shareholders approved the NVIDIA Corporation 2007 Equity Incentive Plan, as most recently amended and restated, the 2007 Plan.
The 2007 Plan authorizes the issuance of incentive stock options, non-statutory stock options, restricted stock, restricted stock units, stock appreciation rights, performance stock awards, performance cash awards, and other stock-based awards to employees, directors and consultants. Only our employees may receive incentive stock options. Up to
230 million
shares of our common stock may be issued pursuant to stock awards granted under the 2007 Plan. Currently, we grant RSUs, PSUs and market-based PSUs under the 2007 Plan, under which, as of
January 27, 2019
, there were
35 million
shares available for future issuance.
54
NVIDIA CORPORATION AND SUBSIDIARIES
NOTES TO THE CONSOLIDATED FINANCIAL STATEMENTS
(Continued)
Stock options previously granted to employees, subject to certain exceptions, vest over a
four
-year period, subject to continued service, with
25%
vesting on the anniversary of the hire date in the case of new hires or the anniversary of the date of grant in the case of grants to existing employees and
6.25%
vesting quarterly thereafter. These stock options generally expire
ten
years from the date of grant.
Subject to certain exceptions, RSUs and PSUs granted to employees vest over a
four
-year period, subject to continued service, with
25%
vesting on a pre-determined date that is close to the anniversary of the date of grant and (i) for grants made prior to May 18, 2016,
12.5%
vesting semi-annually thereafter, and (ii) for grants made on or after May 18, 2016,
6.25%
vesting quarterly thereafter. Market-based PSUs vest
100%
on approximately the
three
-year anniversary of the date of grant. However, the number of shares subject to both PSUs and market-based PSUs that are eligible to vest is generally determined by the Compensation Committee based on achievement of pre-determined criteria.
Unless terminated sooner, the 2007 Plan is scheduled to terminate on March 21, 2022. Our Board may suspend or terminate the 2007 Plan at any time. No awards may be granted under the 2007 Plan while the 2007 Plan is suspended or after it is terminated. The Board may also amend the 2007 Plan at any time. However, if legal, regulatory or listing requirements require shareholder approval, the amendment will not go into effect until the shareholders have approved the amendment.
Amended and Restated 2012 Employee Stock Purchase Plan
In 2012, our shareholders approved the 2012 Employee Stock Purchase Plan, as most recently amended and restated, the 2012 Plan, as the successor to the 1998 Employee Stock Purchase Plan.
Up to
89 million
shares of our common stock may be issued pursuant to purchases under the 2012 Plan. As of
January 27, 2019
, we had issued
29 million
shares and reserved
60 million
shares for future issuance under the 2012 Plan.
The 2012 Plan is intended to qualify as an “employee stock purchase plan” under Section 423 of the Internal Revenue Code. Under the current offerings adopted pursuant to the 2012 Plan, each offering period is approximately
24
months, which is generally divided into
four
purchase periods of
six
months.
Employees are eligible to participate if they are employed by us or an affiliate of us as designated by the Board. Employees who participate in an offering may have up to
10%
of their earnings withheld up to certain limitations and applied on specified dates determined by the Board to the purchase of shares of common stock. The Board may increase this percentage at its discretion, up to
15%
. The price of common stock purchased under our 2012 Plan will be equal to
85%
of the lower of the fair market value of the common stock on the commencement date of each offering period and the fair market value on each purchase date within the offering. Employees may end their participation in the 2012 Plan at any time during the offering period, and participation ends automatically on termination of employment with us. In each case, the employee’s contributions are refunded.
The following is a summary of our equity award transactions under our equity incentive plans:
|
RSUs, PSUs and Market-based PSUs Outstanding
|
||||||
|
|
Number of Shares
|
Weighted Average Grant-Date Fair Value
|
||||
|
(In millions, except years and per share data)
|
||||||
|
Balances, January 28, 2018
|
22
|
|
$
|
66.72
|
|
|
|
Granted (1)(2)
|
4
|
|
$
|
258.26
|
|
|
|
Vested restricted stock
|
(10
|
)
|
$
|
52.56
|
|
|
|
Canceled and forfeited
|
—
|
|
$
|
—
|
|
|
|
Balances, January 27, 2019
|
16
|
|
$
|
129.92
|
|
|
|
Vested and expected to vest after January 27, 2019
|
13
|
|
$
|
129.44
|
|
|
|
(1)
|
Includes PSUs that will be issued and eligible to vest based on the corporate financial performance level achieved for fiscal year
2019
.
|
|
(2)
|
Includes market-based PSUs that will be issued and eligible to vest if the maximum target for total shareholder return, or TSR, over the
3
-year measurement period is achieved. Depending on the ranking of our TSR compared to the respective TSRs of the companies comprising the Standard & Poor’s 500 Index during that period, the market-based PSUs issued could be up to
45 thousand
shares.
|
As of
January 27, 2019
and
January 28, 2018
, there were
35 million
and
16 million
shares, respectively, of common stock reserved for future issuance under our equity incentive plans.
55
NVIDIA CORPORATION AND SUBSIDIARIES
NOTES TO THE CONSOLIDATED FINANCIAL STATEMENTS
(Continued)
The total intrinsic value of options exercised was
$180 million
,
$318 million
, and
$246 million
for fiscal years
2019
,
2018
, and
2017
, respectively. Upon exercise of an option, we issue new shares of stock.
Note 4 - Net Income Per Share
The following is a reconciliation of the denominator of the basic and diluted net income per share computations for the periods presented:
|
|
Year Ended
|
||||||||||
|
|
January 27,
2019 |
January 28,
2018 |
January 29,
2017 |
||||||||
|
|
(In millions, except per share data)
|
||||||||||
|
Numerator:
|
|
|
|
||||||||
|
Net income
|
$
|
4,141
|
|
$
|
3,047
|
|
$
|
1,666
|
|
||
|
Denominator:
|
|
|
|
||||||||
|
Basic weighted average shares
|
608
|
|
599
|
|
541
|
|
|||||
|
Dilutive impact of outstanding securities:
|
|
|
|
||||||||
|
Equity awards
|
17
|
|
24
|
|
26
|
|
|||||
|
1.00% Convertible Senior Notes
|
—
|
|
5
|
|
44
|
|
|||||
|
Warrants issued with the 1.00% Convertible Senior Notes
|
—
|
|
4
|
|
38
|
|
|||||
|
Diluted weighted average shares
|
625
|
|
632
|
|
649
|
|
|||||
|
Net income per share:
|
|
|
|
||||||||
|
Basic (1)
|
$
|
6.81
|
|
$
|
5.09
|
|
$
|
3.08
|
|
||
|
Diluted (2)
|
$
|
6.63
|
|
$
|
4.82
|
|
$
|
2.57
|
|
||
|
Equity awards excluded from diluted net income per share because their effect would have been anti-dilutive
|
5
|
|
4
|
|
8
|
|
|||||
|
(1)
|
Calculated as net income divided by basic weighted average shares.
|
|
(2)
|
Calculated as net income divided by diluted weighted average shares.
|
The
1.00%
Convertible Senior Notes Due 2018, or the Convertible Notes, were included in the calculation of diluted net income per share. The Convertible Notes had a dilutive impact on net income per share if our average stock price for the reporting period exceeded the adjusted conversion price of
$20.02
per share. The warrants associated with our Convertible Notes, or the Warrants, outstanding were also included in the calculation of diluted net income per share. As of
January 27, 2019
, there were
no
Convertible Notes or Warrants outstanding.
Refer to Note 11 of these Notes to the Consolidated Financial Statements for additional discussion regarding the Convertible Notes, Note Hedges, and Warrants.
Note 5
- Goodwill
The carrying amount of goodwill was
$618 million
, and the amount of goodwill allocated to our GPU and Tegra Processor reporting units was
$210 million
and
$408 million
, respectively, as of both
January 27, 2019
and
January 28, 2018
. There were
no
changes to the carrying amount of goodwill during fiscal years 2019 and 2018. During the fourth quarters of fiscal years 2019, 2018, and 2017, we completed our annual impairment tests and concluded that goodwill was
no
t impaired in any of these years.
56
NVIDIA CORPORATION AND SUBSIDIARIES
NOTES TO THE CONSOLIDATED FINANCIAL STATEMENTS
(Continued)
Note 6 - Amortizable Intangible Assets
The components of our amortizable intangible assets are as follows:
|
|
January 27, 2019
|
January 28, 2018
|
|||||||||||||||||||||
|
|
Gross
Carrying
Amount
|
Accumulated
Amortization
|
Net
Carrying
Amount
|
Gross
Carrying
Amount
|
Accumulated
Amortization
|
Net
Carrying
Amount
|
|||||||||||||||||
|
|
(In millions)
|
(In millions)
|
|||||||||||||||||||||
|
Acquisition-related intangible assets
|
$
|
195
|
|
$
|
(188
|
)
|
$
|
7
|
|
$
|
195
|
|
$
|
(180
|
)
|
$
|
15
|
|
|||||
|
Patents and licensed technology
|
491
|
|
(453
|
)
|
38
|
|
469
|
|
(432
|
)
|
37
|
|
|||||||||||
|
Total intangible assets
|
$
|
686
|
|
$
|
(641
|
)
|
$
|
45
|
|
$
|
664
|
|
$
|
(612
|
)
|
$
|
52
|
|
|||||
The increase in gross carrying amount of intangible assets is due to purchases of licensed technology during fiscal year 2019. Amortization expense associated with intangible assets for fiscal years
2019
,
2018
, and
2017
was
$29 million
,
$55 million
, and
$68 million
, respectively. Future amortization expense related to the net carrying amount of intangible assets as of
January 27, 2019
is estimated to be
$21 million
in fiscal year
2020
,
$12 million
in fiscal year
2021
,
$5 million
in fiscal year
2022
, and
$5 million
in fiscal year
2023
, and
$2 million
in fiscal year 2024.
Note 7
- Marketable Securities
Our cash equivalents and marketable securities are classified as “available-for-sale” debt securities.
The following is a summary of cash equivalents and marketable securities as of
January 27, 2019
and
January 28, 2018
:
|
|
January 27, 2019
|
||||||||||||||||||||||
|
Amortized
Cost
|
Unrealized
Gain
|
Unrealized
Loss
|
Estimated
Fair Value
|
Reported as
|
|||||||||||||||||||
|
|
Cash Equivalents
|
Marketable Securities
|
|||||||||||||||||||||
|
|
(In millions)
|
||||||||||||||||||||||
|
Corporate debt securities
|
$
|
2,626
|
|
$
|
—
|
|
$
|
(6
|
)
|
$
|
2,620
|
|
$
|
25
|
|
$
|
2,595
|
|
|||||
|
Debt securities of United States government agencies
|
2,284
|
|
—
|
|
(4
|
)
|
2,280
|
|
—
|
|
2,280
|
|
|||||||||||
|
Debt securities issued by the United States Treasury
|
1,493
|
|
—
|
|
(1
|
)
|
1,492
|
|
176
|
|
1,316
|
|
|||||||||||
|
Money market funds
|
483
|
|
—
|
|
—
|
|
483
|
|
483
|
|
—
|
|
|||||||||||
|
Foreign government bonds
|
209
|
|
—
|
|
—
|
|
209
|
|
—
|
|
209
|
|
|||||||||||
|
Asset-backed securities
|
152
|
|
—
|
|
(1
|
)
|
151
|
|
—
|
|
151
|
|
|||||||||||
|
Mortgage-backed securities issued by United States government-sponsored enterprises
|
88
|
|
1
|
|
—
|
|
89
|
|
—
|
|
89
|
|
|||||||||||
|
Total
|
$
|
7,335
|
|
$
|
1
|
|
$
|
(12
|
)
|
$
|
7,324
|
|
$
|
684
|
|
$
|
6,640
|
|
|||||
57
NVIDIA CORPORATION AND SUBSIDIARIES
NOTES TO THE CONSOLIDATED FINANCIAL STATEMENTS
(Continued)
|
|
January 28, 2018
|
||||||||||||||||||||||
|
Amortized
Cost
|
Unrealized
Gain
|
Unrealized
Loss
|
Estimated
Fair Value
|
Reported as
|
|||||||||||||||||||
|
|
Cash Equivalents
|
Marketable Securities
|
|||||||||||||||||||||
|
|
(In millions)
|
||||||||||||||||||||||
|
Money market funds
|
$
|
3,789
|
|
$
|
—
|
|
$
|
—
|
|
$
|
3,789
|
|
$
|
3,789
|
|
$
|
—
|
|
|||||
|
Corporate debt securities
|
1,304
|
|
—
|
|
(9
|
)
|
1,295
|
|
—
|
|
1,295
|
|
|||||||||||
|
Debt securities of United States government agencies
|
822
|
|
—
|
|
(7
|
)
|
815
|
|
—
|
|
815
|
|
|||||||||||
|
Debt securities issued by the United States Treasury
|
577
|
|
—
|
|
(4
|
)
|
573
|
|
—
|
|
573
|
|
|||||||||||
|
Asset-backed securities
|
254
|
|
—
|
|
(2
|
)
|
252
|
|
—
|
|
252
|
|
|||||||||||
|
Mortgage backed securities issued by United States government-sponsored enterprises
|
128
|
|
2
|
|
—
|
|
130
|
|
—
|
|
130
|
|
|||||||||||
|
Foreign government bonds
|
42
|
|
—
|
|
(1
|
)
|
41
|
|
—
|
|
41
|
|
|||||||||||
|
Total
|
$
|
6,916
|
|
$
|
2
|
|
$
|
(23
|
)
|
$
|
6,895
|
|
$
|
3,789
|
|
$
|
3,106
|
|
|||||
The following table provides the breakdown of unrealized losses as of
January 27, 2019
, aggregated by investment category and length of time that individual securities have been in a continuous loss position:
|
|
Less than 12 Months
|
12 Months or Greater
|
Total
|
||||||||||||||||||||
|
|
Estimated Fair Value
|
Gross
Unrealized
Losses
|
Estimated Fair Value
|
Gross
Unrealized
Losses
|
Estimated Fair Value
|
Gross
Unrealized
Losses
|
|||||||||||||||||
|
|
(In millions)
|
||||||||||||||||||||||
|
Debt securities issued by United States government agencies
|
$
|
1,674
|
|
$
|
(1
|
)
|
$
|
401
|
|
$
|
(3
|
)
|
$
|
2,075
|
|
$
|
(4
|
)
|
|||||
|
Corporate debt securities
|
915
|
|
(3
|
)
|
649
|
|
(3
|
)
|
1,564
|
|
(6
|
)
|
|||||||||||
|
Debt securities issued by the United States Treasury
|
1,015
|
|
—
|
|
161
|
|
(1
|
)
|
1,176
|
|
(1
|
)
|
|||||||||||
|
Asset-backed securities
|
—
|
|
—
|
|
151
|
|
(1
|
)
|
151
|
|
(1
|
)
|
|||||||||||
|
Total
|
$
|
3,604
|
|
$
|
(4
|
)
|
$
|
1,362
|
|
$
|
(8
|
)
|
$
|
4,966
|
|
$
|
(12
|
)
|
|||||
The gross unrealized losses are related to fixed income securities, temporary in nature, and driven primarily by changes in interest rates. We have the intent and ability to hold our investments until maturity. For fiscal years
2019
,
2018
, and
2017
, there were no other-than-temporary impairment losses and net realized gains were not significant.
The amortized cost and estimated fair value of cash equivalents and marketable securities as of
January 27, 2019
and
January 28, 2018
are shown below by contractual maturity.
|
|
January 27, 2019
|
January 28, 2018
|
|||||||||||||
|
|
Amortized
Cost
|
Estimated
Fair Value
|
Amortized
Cost
|
Estimated
Fair Value
|
|||||||||||
|
|
(In millions)
|
||||||||||||||
|
Less than one year
|
$
|
5,042
|
|
$
|
5,034
|
|
$
|
5,381
|
|
$
|
5,375
|
|
|||
|
Due in 1 - 5 years
|
2,271
|
|
2,268
|
|
1,500
|
|
1,485
|
|
|||||||
|
Mortgage-backed securities issued by United States government-sponsored enterprises not due at a single maturity date
|
22
|
|
22
|
|
35
|
|
35
|
|
|||||||
|
Total
|
$
|
7,335
|
|
$
|
7,324
|
|
$
|
6,916
|
|
$
|
6,895
|
|
|||
58
NVIDIA CORPORATION AND SUBSIDIARIES
NOTES TO THE CONSOLIDATED FINANCIAL STATEMENTS
(Continued)
Note 8 - Fair Value of Financial Assets and Liabilities
The fair values of our financial assets and liabilities are determined using quoted market prices of identical assets or quoted market prices of similar assets from active markets. We review fair value hierarchy classification on a quarterly basis. There were no significant transfers between Levels 1 and 2 financial assets and liabilities for fiscal year
2019
. Level 3 financial assets and liabilities are based on unobservable inputs to the valuation methodology and include our own data about assumptions market participants would use in pricing the asset or liability based on the best information available under the circumstances.
|
|
Fair Value at
|
||||||||
|
Pricing Category
|
|
January 27, 2019
|
January 28, 2018
|
||||||
|
(In millions)
|
|||||||||
|
Assets
|
|||||||||
|
Cash equivalents and marketable securities:
|
|||||||||
|
Corporate debt securities
|
Level 2
|
$
|
2,620
|
|
$
|
1,295
|
|
||
|
Debt securities of United States government agencies
|
Level 2
|
$
|
2,280
|
|
$
|
815
|
|
||
|
Debt securities issued by the United States Treasury
|
Level 2
|
$
|
1,492
|
|
$
|
573
|
|
||
|
Money market funds
|
Level 1
|
$
|
483
|
|
$
|
3,789
|
|
||
|
Foreign government bonds
|
Level 2
|
$
|
209
|
|
$
|
41
|
|
||
|
Asset-backed securities
|
Level 2
|
$
|
151
|
|
$
|
252
|
|
||
|
Mortgage-backed securities issued by United States government-sponsored enterprises
|
Level 2
|
$
|
89
|
|
$
|
130
|
|
||
|
Liabilities
|
|||||||||
|
Current liability:
|
|||||||||
|
1.00% Convertible Senior Notes (1)
|
Level 2
|
$
|
—
|
|
$
|
189
|
|
||
|
Other noncurrent liabilities:
|
|||||||||
|
2.20% Notes Due 2021 (1)
|
Level 2
|
$
|
978
|
|
$
|
982
|
|
||
|
3.20% Notes Due 2026 (1)
|
Level 2
|
$
|
961
|
|
$
|
986
|
|
||
|
(1)
|
These liabilities are carried on our Consolidated Balance Sheets at their original issuance value, net of unamortized debt discount and issuance costs, and are not marked to fair value each period. Refer to Note 11 of these Notes to the Consolidated Financial Statements for additional information.
|
Note 9 - Balance Sheet Components
Certain balance sheet components are as follows:
|
|
January 27,
2019 |
January 28,
2018 |
|||||
|
(In millions)
|
|||||||
|
Inventories:
|
|||||||
|
Raw materials
|
$
|
613
|
|
$
|
227
|
|
|
|
Work in-process
|
238
|
|
192
|
|
|||
|
Finished goods
|
724
|
|
377
|
|
|||
|
Total inventories
|
$
|
1,575
|
|
$
|
796
|
|
|
59
NVIDIA CORPORATION AND SUBSIDIARIES
NOTES TO THE CONSOLIDATED FINANCIAL STATEMENTS
(Continued)
|
|
January 27,
2019 |
January 28,
2018 |
Estimated
Useful Life
|
||||||
|
(In millions)
|
(In years)
|
||||||||
|
Property and Equipment:
|
|||||||||
|
Land
|
$
|
218
|
|
$
|
218
|
|
(A)
|
||
|
Building
|
339
|
|
348
|
|
25-30
|
||||
|
Test equipment
|
516
|
|
462
|
|
3-5
|
||||
|
Computer equipment
|
522
|
|
285
|
|
3-5
|
||||
|
Leasehold improvements
|
263
|
|
198
|
|
(B)
|
||||
|
Software and licenses
|
109
|
|
88
|
|
3-5
|
||||
|
Office furniture and equipment
|
69
|
|
79
|
|
5
|
||||
|
Capital leases
|
28
|
|
28
|
|
(B)
|
||||
|
Construction in process
|
107
|
|
31
|
|
(C)
|
||||
|
Total property and equipment, gross
|
2,171
|
|
1,737
|
|
|
||||
|
Accumulated depreciation and amortization
|
(767
|
)
|
(740
|
)
|
|
||||
|
Total property and equipment, net
|
$
|
1,404
|
|
$
|
997
|
|
|
||
|
(A)
|
Land is a non-depreciable asset.
|
|
(B)
|
Leasehold improvements and capital leases are amortized based on the lesser of either the asset’s estimated useful life or the remaining expected lease term.
|
|
(C)
|
Construction in process represents assets that are not available for their intended use as of the balance sheet date.
|
Depreciation expense for fiscal years
2019
,
2018
, and
2017
was
$233 million
,
$144 million
, and
$118 million
, respectively.
Accumulated amortization of leasehold improvements and capital leases was
$189 million
and
$178 million
as of
January 27, 2019
and
January 28, 2018
, respectively.
|
|
January 27,
2019 |
January 28,
2018 |
|||||
|
(In millions)
|
|||||||
|
Accrued and Other Current Liabilities:
|
|||||||
|
Customer program accruals
|
$
|
302
|
|
$
|
181
|
|
|
|
Accrued payroll and related expenses
|
186
|
|
172
|
|
|||
|
Deferred revenue (1)
|
92
|
|
53
|
|
|||
|
Taxes payable
|
91
|
|
33
|
|
|||
|
Accrued legal settlement costs
|
24
|
|
—
|
|
|||
|
Coupon interest on debt obligations
|
20
|
|
20
|
|
|||
|
Warranty accrual (2)
|
18
|
|
15
|
|
|||
|
Professional service fees
|
14
|
|
15
|
|
|||
|
Accrued royalties
|
10
|
|
17
|
|
|||
|
Other
|
61
|
|
36
|
|
|||
|
Total accrued and other current liabilities
|
$
|
818
|
|
$
|
542
|
|
|
|
(1)
|
Deferred revenue primarily includes customer advances and deferrals related to license and development arrangements and PCS.
|
|
(2)
|
Refer to Note 12 of these Notes to the Consolidated Financial Statements for a discussion regarding warranties.
|
60
NVIDIA CORPORATION AND SUBSIDIARIES
NOTES TO THE CONSOLIDATED FINANCIAL STATEMENTS
(Continued)
|
|
January 27,
2019 |
January 28,
2018 |
|||||
|
(In millions)
|
|||||||
|
Other Long-Term Liabilities:
|
|||||||
|
Income tax payable (1)
|
$
|
513
|
|
$
|
559
|
|
|
|
Deferred revenue (2)
|
46
|
|
15
|
|
|||
|
Deferred rent
|
21
|
|
9
|
|
|||
|
Employee benefits liability
|
20
|
|
12
|
|
|||
|
Deferred income tax liability
|
19
|
|
18
|
|
|||
|
Other
|
14
|
|
19
|
|
|||
|
Total other long-term liabilities
|
$
|
633
|
|
$
|
632
|
|
|
|
(1)
|
As of January 27, 2019, represents the long-term portion of the one-time transition tax payable of
$350 million
, as well as unrecognized tax benefits of
$142 million
and related interest and penalties of
$21 million
.
|
|
(2)
|
Deferred revenue primarily includes deferrals related to license and development arrangements and PCS.
|
Note 10 - Derivative Financial Instruments
We enter into foreign currency forward contracts to mitigate the impact of foreign currency exchange rate movements on our operating expenses. We designate these contracts as cash flow hedges and assess the effectiveness of the hedge relationships on a spot to spot basis. Gains or losses on the contracts are recorded in accumulated other comprehensive income or loss and reclassified to operating expense when the related operating expenses are recognized in earnings or ineffectiveness should occur. The fair value of the contracts was not significant as of
January 27, 2019
and
January 28, 2018
.
We also enter into foreign currency forward contracts to mitigate the impact of foreign currency movements on monetary assets and liabilities that are denominated in currencies other than U.S. dollar. These forward contracts were not designated for hedge accounting treatment. Therefore, the change in fair value of these contracts is recorded in other income or expense and offsets the change in fair value of the hedged foreign currency denominated monetary assets and liabilities, which is also recorded in other income or expense.
The table below presents the notional value of our foreign currency forward contracts outstanding as of
January 27, 2019
and
January 28, 2018
:
|
January 27,
2019 |
January 28,
2018 |
||||||
|
|
(In millions)
|
||||||
|
Designated as cash flow hedges
|
$
|
408
|
|
$
|
104
|
|
|
|
Not designated for hedge accounting
|
$
|
241
|
|
$
|
94
|
|
|
As of
January 27, 2019
, all designated foreign currency forward contracts mature within
eighteen
months. The expected realized gains and losses deferred into accumulated other comprehensive income (loss) related to foreign currency forward contracts within the next twelve months was not significant.
During fiscal years
2019
and
2018
, the impact of derivative financial instruments designated for hedge accounting treatment on other comprehensive income or loss was not significant and all such instruments were determined to be highly effective. Therefore, there were
no
gains or losses associated with ineffectiveness.
Note 11
- Debt
Long-Term Debt
2.20% Notes Due 2021 and 3.20% Notes Due 2026
In fiscal year 2017, we issued
$1.00 billion
of the
2.20%
Notes Due 2021, and
$1.00 billion
of the
3.20%
Notes Due 2026, or collectively, the Notes. Interest on the Notes is payable on March 16 and September 16 of each year, beginning on March 16, 2017. Upon
30
days' notice to holders of the Notes, we may redeem the Notes for cash prior to maturity, at redemption
61
NVIDIA CORPORATION AND SUBSIDIARIES
NOTES TO THE CONSOLIDATED FINANCIAL STATEMENTS
(Continued)
prices that include accrued and unpaid interest, if any, and a make-whole premium. However, no make-whole premium will be paid for redemptions of the Notes Due 2021 on or after August 16, 2021, or for redemptions of the Notes Due 2026 on or after June 16, 2026. The net proceeds from the Notes were
$1.98 billion
, after deducting debt discount and issuance costs.
The Notes are our unsecured senior obligations and rank equally in right of payment with all existing and future unsecured and unsubordinated indebtedness. The Notes are structurally subordinated to the liabilities of our subsidiaries and are effectively subordinated to any secured indebtedness to the extent of the value of the assets securing such indebtedness. All existing and future liabilities of our subsidiaries will be effectively senior to the Notes.
The carrying value of the Notes and the associated interest rates were as follows:
|
|
|
Expected
Remaining Term (years)
|
|
Effective
Interest Rate
|
|
January 27,
2019 |
January 28,
2018 |
|||||
|
|
|
|
|
|
|
(In millions)
|
||||||
|
2.20% Notes Due 2021
|
|
2.6
|
|
2.38%
|
|
$
|
1,000
|
|
$
|
1,000
|
|
|
|
3.20% Notes Due 2026
|
|
7.6
|
|
3.31%
|
|
1,000
|
|
1,000
|
|
|||
|
Unamortized debt discount and issuance costs
|
|
|
|
|
|
(12
|
)
|
(15
|
)
|
|||
|
Net carrying amount
|
|
|
|
|
|
$
|
1,988
|
|
$
|
1,985
|
|
|
Convertible Debt
1.00% Convertible Senior Notes Due 2018
In fiscal year 2014, we issued
$1.50 billion
of Convertible Notes. During fiscal year
2019
, we paid cash to settle an aggregate of
$16 million
in principal amount of the Convertible Notes and issued
714 thousand
shares of our common stock for the excess conversion value. The related loss on early conversions was not significant. As of
January 27, 2019
, there were
no
Convertible Notes outstanding.
Note Hedges
Concurrently with the issuance of the Convertible Notes, we entered into the Note Hedges. Through
January 27, 2019
, we had received
57 million
shares of our common stock from the exercise of a portion of the Note Hedges related to the settlement of
$1.50 billion
in principal amount of the Convertible Notes. As of
January 27, 2019
, there were
no
Note Hedges outstanding.
Revolving Credit Facility
We have a Credit Agreement under which we may borrow up to
$575 million
for general corporate purposes and can obtain revolving loan commitments up to
$425 million
. As of
January 27, 2019
, we had
no
t borrowed any amounts under this agreement.
Commercial Paper
We have a
$575 million
commercial paper program to support general corporate purposes. As of
January 27, 2019
, we had
no
t issued any commercial paper.
Note 12
- Commitments and Contingencies
Inventory Purchase Obligations
As of
January 27, 2019
, we had outstanding inventory purchase obligations totaling
$912 million
.
Capital Purchase Obligations
As of
January 27, 2019
, we had outstanding capital purchase obligations totaling
$258 million
.
62
NVIDIA CORPORATION AND SUBSIDIARIES
NOTES TO THE CONSOLIDATED FINANCIAL STATEMENTS
(Continued)
Lease Obligations
Our headquarters complex is located in Santa Clara, California and includes
ten
buildings that are leased properties. Future minimum lease payments related to headquarters operating leases total
$326 million
over the remaining terms of the leases, including predetermined rent escalations, and are included in the future minimum lease payment schedule below.
Additionally, we have other domestic and international office facilities, including datacenter space, under operating leases expiring through fiscal year 2035.
Future minimum lease payments under our non-cancelable operating leases as of
January 27, 2019
, are as follows:
|
|
Future Minimum Lease Obligations
|
||
|
|
(In millions)
|
||
|
Fiscal Year:
|
|
||
|
2020
|
$
|
100
|
|
|
2021
|
97
|
|
|
|
2022
|
90
|
|
|
|
2023
|
77
|
|
|
|
2024
|
54
|
|
|
|
2025 and thereafter
|
265
|
|
|
|
Total
|
$
|
683
|
|
Rent expense for fiscal years
2019
,
2018
, and
2017
was
$80 million
,
$54 million
, and
$46 million
, respectively.
Accrual for Product Warranty Liabilities
The estimated amount of product returns and warranty liabilities was
$18 million
and
$15 million
as of
January 27, 2019
and
January 28, 2018
, respectively.
In connection with certain agreements that we have entered in the past, we have provided indemnities to cover the indemnified party for matters such as tax, product, and employee liabilities. We have included intellectual property indemnification provisions in our technology related agreements with third parties. Maximum potential future payments cannot be estimated because many of these agreements do not have a maximum stated liability. We have not recorded any liability in our Consolidated Financial Statements for such indemnifications.
Litigation
Polaris Innovations Limited
On May 16, 2016, Polaris Innovations Limited, or Polaris, a non-practicing entity and wholly-owned subsidiary of Quarterhill Inc. (formerly WiLAN Inc.), filed a complaint against NVIDIA for patent infringement in the United States District Court for the Western District of Texas. Polaris alleges that NVIDIA has infringed and is continuing to infringe six U.S. patents relating to the control of dynamic random-access memory, or DRAM. The complaint seeks unspecified monetary damages, enhanced damages, interest, fees, expenses, and costs against NVIDIA. On September 14, 2016, NVIDIA answered the Polaris Complaint and asserted various defenses including non-infringement and invalidity of the six Polaris patents.
On December 5, 2016, the Texas Court granted NVIDIA’s motion to transfer and ordered the case transferred to the Northern District of California.
Between December 7, 2016 and July 25, 2017, NVIDIA filed multiple petitions for inter partes review, or IPR, at the United States Patent and Trademark Office, or USPTO, challenging the validity of each of the patents asserted by Polaris in the U.S. litigation. The USPTO instituted IPRs for four U.S. patents and declined to institute IPRs on two U.S. patents. On June 19, 2018, the USPTO issued a Final Written Decision on one IPR, finding claims 1-23 and 28 unpatentable but that claims 24-27 were not proved unpatentable. On November 20, 2018, the USPTO issued Final Written Decisions on two IPRs, finding claims 1, 4, 8-12, 16, 18, 43, 45, and 48-51 unpatentable but that claims 2-3, 5, 14, 17, 19-23, 26-31, and 44 were not proved unpatentable. On December 4, 2018, the USPTO issued a Final Written Decision on one IPR, finding all claims unpatentable. On December 19, 2018, the USPTO issued a Final Written Decision on one IPR, finding claims 1-14 unpatentable.
63
NVIDIA CORPORATION AND SUBSIDIARIES
NOTES TO THE CONSOLIDATED FINANCIAL STATEMENTS
(Continued)
On June 15, 2017, the California Court granted NVIDIA’s motion to stay the district court litigation pending resolution of the petitions for IPR. The California Court has not set a trial date.
On December 30, 2016, Polaris filed a complaint against NVIDIA for patent infringement in the Regional Court of Düsseldorf, Germany. Polaris alleges that NVIDIA has infringed and is continuing to infringe three patents relating to control of DRAM. On July 14, 2017, NVIDIA filed defenses to the infringement allegations including non-infringement with respect to each of the three asserted patents. On September 3, 2018, NVIDIA filed a rejoinder with additional noninfringement arguments. On December 4, 2018, NVIDIA filed a further rejoinder with additional noninfringement, nullity, and FRAND arguments.
An oral hearing is scheduled for February 21, 2019.
Between March 31, 2017 and June 12, 2017, NVIDIA filed nullity actions with the German Patent Court challenging the validity of each of the patents asserted by Polaris in the German litigation.
ZiiLabs 1 Patents Lawsuit
On October 2, 2017, ZiiLabs Inc., Ltd., or ZiiLabs, a non-practicing entity, filed a complaint in the United States District Court for the District of Delaware alleging that NVIDIA has infringed and is continuing to infringe four U.S. patents relating to GPUs, or the ZiiLabs 1 Patents. ZiiLabs is a Bermuda corporation and a wholly-owned subsidiary of Creative Technology Asia Limited, a Hong Kong company which is itself is a wholly-owned subsidiary of Creative Technology Ltd., a publicly traded Singapore company. The complaint seeks unspecified monetary damages, enhanced damages, interest, costs, and fees against NVIDIA and an injunction against further direct or indirect infringement of the ZiiLabs 1 Patents. On November 27, 2017, NVIDIA answered the ZiiLabs complaint and asserted various defenses including non-infringement and invalidity of the ZiiLabs 1 Patents.
On January 10, 2018, ZiiLabs filed a first amended complaint asserting infringement of a fifth U.S. patent.
On February 22, 2018, the Delaware Court stayed the ZiiLabs 1 case pending the resolution of the U.S. International Trade Commission, or USITC, investigation over the ZiiLabs 2 patents.
On February 1, 2019, NVIDIA entered into an immaterial agreement in which it receives a license to the ZiiLabs patents and a dismissal of the ZiiLabs 1 and 2 Patent Lawsuits. The ZiiLabs 1 and 2 district court cases were dismissed pursuant to a stipulation of dismissal filed on February 8, 2019. The Administrative Law Judge issued an Initial Determination on February 12, 2019, granting the motion to terminate the USITC investigation addressing the ZiiLabs 2 patents.
ZiiLabs 2 Patents Lawsuits
On December 27, 2017, ZiiLabs filed a second complaint in the United States District Court for the District of Delaware alleging that NVIDIA has infringed four additional U.S. patents, or the ZiiLabs 2 Patents. The second complaint also seeks unspecified monetary damages, enhanced damages, interest, costs, and fees against NVIDIA and an injunction against further direct or indirect infringement of the ZiiLabs 2 Patents.
On February 22, 2018, the Delaware Court stayed the district court action on the ZiiLabs 2 patents pending the resolution of the USITC Investigation over the ZiiLabs 2 patents.
On December 29, 2017, ZiiLabs filed a request with the USITC to commence an Investigation pursuant to Section 337 of the Tariff Act of 1930 relating to the unlawful importation of certain graphics processors and products containing the same. ZiiLabs alleges that the unlawful importation results from the infringement of the ZiiLabs 2 Patents by products from respondents NVIDIA, ASUSTeK Computer Inc., ASUS Computer International, EVGA Corporation, Gigabyte Technology Co., Ltd., G.B.T. Inc., Micro-Star International Co., Ltd., MSI Computer Corp., Nintendo Co., Ltd., Nintendo of America Inc., PNY Technologies Inc., Zotac International (MCO) Ltd., and Zotac USA Inc.
On February 28, 2018, NVIDIA and the other respondents answered the USITC complaint and asserted various defenses including non-infringement and invalidity of the four asserted ZiiLabs 2 patents.
On May 10, 2018, the Administrative Law Judge then presiding over the investigation issued an Initial Determination terminating the investigation with respect to one of the patents. On July 17, 2018, the USITC affirmed this decision on modified grounds.
64
NVIDIA CORPORATION AND SUBSIDIARIES
NOTES TO THE CONSOLIDATED FINANCIAL STATEMENTS
(Continued)
On October 18, 2018, the Administrative Law Judge currently presiding over the investigation issued an order construing certain claims of the three remaining patents in the investigation.
The hearing in the investigation is currently scheduled to begin on April 8, 2019. The target date for completion of the investigation is September 9, 2019.
On February 1, 2019, NVIDIA entered into an immaterial agreement in which it receives a license to the ZiiLabs patents and a dismissal of the ZiiLabs 1 and 2 Patent Lawsuits. The ZiiLabs 1 and 2 district court cases were dismissed pursuant to a stipulation of dismissal filed on February 8, 2019. The Administrative Law Judge issued an Initial Determination on February 12, 2019, granting the motion to terminate the USITC investigation addressing the ZiiLabs 2 patents.
Securities Class Action and Derivative Lawsuits
On December 21, 2018, a purported securities class action lawsuit was filed in the United States District Court for the Northern District of California, captioned Iron Workers Joint Funds v. Nvidia Corporation, et al. (Case No. 18-cv-7669), naming as defendants NVIDIA and certain of NVIDIA’s officers. The complaint asserts that the defendants violated Section 10(b) of the Securities Exchange Act of 1934, as amended, or the Exchange Act, and SEC Rule 10b-5, by making materially false or misleading statements related to channel inventory and the impact of cryptocurrency mining on GPU demand between August 10, 2017 and November 15, 2018. The plaintiff also alleges that the NVIDIA officers who they named as defendants violated Section 20(a) of the Exchange Act. The plaintiff seeks class certification, an award of unspecified compensatory damages, an award of equitable/injunctive or other further relief as the Court may deem just and proper. On December 28, 2018, a substantially similar purported securities class action was commenced in the Northern District of California, captioned Oto v. Nvidia Corporation, et al. (Case No. 18-cv-07783), naming the same defendants, and seeking substantially similar relief. The two cases have been related and are before the same judge. A stipulation to consolidate the Iron Workers and Oto actions is pending before the Court. On February 19, 2019, a number of shareholders filed motions to consolidate the two cases and to be appointed lead plaintiff and for their respective counsel to be appointed lead counsel.
On January 18, 2019, a shareholder, purporting to act on the behalf of NVIDIA, filed a derivative lawsuit in the Northern District of California, captioned Han v. Huang, et al. (Case No. 19-cv-00341), seeking to assert claims on behalf of NVIDIA against the members of NVIDIA’s board of directors and certain officers. The lawsuit asserts claims for breach of fiduciary duty, unjust enrichment, waste of corporate assets, and violations of Sections 14(a), 10(b), and 20(a) of the Exchange Act based on the dissemination of allegedly false and misleading statements related to channel inventory and the impact of cryptocurrency mining on GPU demand. The plaintiff is seeking unspecified damages and other relief, including reforms and improvements to NVIDIA’s corporate governance and internal procedures. On February 12, 2019, a substantially similar derivative lawsuit was filed in the Northern District of California captioned Yang v. Huang, et. al. (Case No. 19-cv-00766), naming the same named defendants, and seeking the same relief. On February 19, 2019, a third substantially similar derivative lawsuit was filed in the Northern District of California captioned The Booth Family Trust v. Huang, et. al. (Case No. 3:19-cv-00876), naming the same named defendants, and seeking substantially the same relief.
It is possible that additional suits will be filed, or allegations received from shareholders, with respect to these same or other matters, naming us and/or our officers and directors as defendants.
Accounting for Loss Contingencies
We are engaged in legal actions not described above arising in the ordinary course of business and, while there can be no assurance of favorable outcomes, we believe that the ultimate outcome of these actions will not have a material adverse effect on our operating results, liquidity or financial position. As of January 27, 2019, with the exception of immaterial amounts, we have not recorded any accrual for contingent liabilities associated with the legal proceedings described above based on our belief that liabilities, while possible, are not probable. Further, except as specifically described above, any possible loss or range of loss in these matters cannot be reasonably estimated at this time.
65
NVIDIA CORPORATION AND SUBSIDIARIES
NOTES TO THE CONSOLIDATED FINANCIAL STATEMENTS
(Continued)
Note 13
- Income Taxes
The income tax expense (benefit) applicable to income before income taxes consists of the following:
|
|
Year Ended
|
||||||||||
|
|
January 27,
2019 |
January 28,
2018 |
January 29,
2017 |
||||||||
|
|
(In millions)
|
||||||||||
|
Current income taxes:
|
|
|
|
||||||||
|
Federal
|
$
|
1
|
|
$
|
464
|
|
$
|
7
|
|
||
|
State
|
—
|
|
1
|
|
1
|
|
|||||
|
Foreign
|
69
|
|
43
|
|
34
|
|
|||||
|
Total current
|
70
|
|
508
|
|
42
|
|
|||||
|
Deferred taxes:
|
|
|
|
||||||||
|
Federal
|
(315
|
)
|
(376
|
)
|
199
|
|
|||||
|
State
|
—
|
|
—
|
|
—
|
|
|||||
|
Foreign
|
—
|
|
17
|
|
(2
|
)
|
|||||
|
Total deferred
|
(315
|
)
|
(359
|
)
|
197
|
|
|||||
|
Income tax expense (benefit)
|
$
|
(245
|
)
|
$
|
149
|
|
$
|
239
|
|
||
Income before income tax consists of the following:
|
|
Year Ended
|
||||||||||
|
|
January 27,
2019 |
January 28,
2018 |
January 29,
2017 |
||||||||
|
|
(In millions)
|
||||||||||
|
Domestic (1)
|
$
|
1,843
|
|
$
|
1,600
|
|
$
|
600
|
|
||
|
Foreign
|
2,053
|
|
1,596
|
|
1,305
|
|
|||||
|
Income before income tax
|
$
|
3,896
|
|
$
|
3,196
|
|
$
|
1,905
|
|
||
|
(1)
|
The increase in domestic income is primarily due to jurisdictional allocation of stock-based compensation charges.
|
The income tax expense (benefit) differs from the amount computed by applying the U.S. federal statutory rate of
21%
,
33.9%
, and
35%
for fiscal years 2019, 2018, and 2017, respectively, to income before income taxes as follows:
|
|
Year Ended
|
||||||||||
|
|
January 27,
2019 |
January 28,
2018 |
January 29,
2017 |
||||||||
|
|
(In millions)
|
||||||||||
|
Tax expense computed at federal statutory rate
|
$
|
818
|
|
$
|
1,084
|
|
$
|
667
|
|
||
|
Expense (benefit) resulting from:
|
|||||||||||
|
State income taxes, net of federal tax effect
|
23
|
|
10
|
|
4
|
|
|||||
|
Foreign tax rate differential
|
(412
|
)
|
(545
|
)
|
(315
|
)
|
|||||
|
Stock-based compensation
|
(191
|
)
|
(181
|
)
|
(70
|
)
|
|||||
|
Tax Cuts and Jobs Act of 2017
|
(368
|
)
|
(133
|
)
|
—
|
|
|||||
|
U.S. federal R&D tax credit
|
(141
|
)
|
(87
|
)
|
(52
|
)
|
|||||
|
Other
|
26
|
|
1
|
|
5
|
|
|||||
|
Income tax expense (benefit)
|
$
|
(245
|
)
|
$
|
149
|
|
$
|
239
|
|
||
66
NVIDIA CORPORATION AND SUBSIDIARIES
NOTES TO THE CONSOLIDATED FINANCIAL STATEMENTS
(Continued)
The tax effect of temporary differences that gives rise to significant portions of the deferred tax assets and liabilities are presented below:
|
|
January 27,
2019 |
January 28,
2018 |
|||||
|
|
(In millions)
|
||||||
|
Deferred tax assets:
|
|
||||||
|
Net operating loss carryforwards
|
$
|
70
|
|
$
|
67
|
|
|
|
Accruals and reserves, not currently deductible for tax purposes
|
41
|
|
24
|
|
|||
|
Property, equipment and intangible assets
|
2
|
|
32
|
|
|||
|
Research and other tax credit carryforwards
|
626
|
|
579
|
|
|||
|
Stock-based compensation
|
25
|
|
24
|
|
|||
|
GILTI deferred tax assets
|
376
|
|
—
|
|
|||
|
Gross deferred tax assets
|
1,140
|
|
726
|
|
|||
|
Less valuation allowance
|
(562
|
)
|
(469
|
)
|
|||
|
Total deferred tax assets
|
578
|
|
257
|
|
|||
|
Deferred tax liabilities:
|
|
|
|||||
|
Acquired intangibles
|
(2
|
)
|
(4
|
)
|
|||
|
Unremitted earnings of foreign subsidiaries
|
(35
|
)
|
(26
|
)
|
|||
|
Gross deferred tax liabilities
|
(37
|
)
|
(30
|
)
|
|||
|
Net deferred tax asset (1)
|
$
|
541
|
|
$
|
227
|
|
|
We recognized an income tax benefit of
$245 million
for fiscal year 2019, and income tax expense of
$149 million
and
$239 million
for fiscal years
2018
, and
2017
, respectively. Our annual effective tax rate was
(6.3)%
,
4.7%
, and
12.5%
for fiscal years
2019
,
2018
, and
2017
, respectively.
In December 2017, the TCJA was enacted into law. The TCJA significantly changed U.S. tax law, including a reduction of the U.S. federal corporate income tax rate from
35%
to
21%
, a requirement for companies to pay a one-time transition tax on the earnings of certain foreign subsidiaries that were previously tax deferred and the creation of new taxes (global intangible low-taxed income, or GILTI) on certain foreign-source earnings. As a fiscal year-end taxpayer, certain provisions of the TCJA began to impact us in the fourth quarter of fiscal year 2018, while other provisions impacted us beginning in fiscal year 2019.
In fiscal year 2018 and the first nine months of fiscal year 2019, we recorded provisional amounts for certain enactment-date effects of the TCJA by applying the SEC guidance in SAB 118 because we had not yet completed our accounting for these effects. As of January 27, 2019, we completed our accounting for all of the enactment-date income tax effects of the TCJA and recognized a reduction of
$368 million
to the provisional amount recorded at January 28, 2018 as a component of income tax expense (benefit). This adjustment primarily relates to the effects of electing to account for GILTI in deferred taxes, as described below. Our final tax benefit from the TCJA was
$501 million
.
The one-time transition tax is based on the post-1986 earnings and profits, or E&P, of our foreign subsidiaries. We had previously accrued deferred taxes on a portion of these same earnings. We recorded a provisional one-time transition tax liability of
$971 million
at January 28, 2018. Upon further analysis of the TCJA and Notices and regulations issued by the US Department of the Treasury and Internal Revenue Service, we finalized our calculations of the transition tax liability during fiscal year 2019. For fiscal year 2019, we increased our transition tax provisional amount by
$33 million
.
As a result of the reduction of the corporate income tax rate to
21%
, companies were required to remeasure their deferred tax assets and liabilities as of the date of enactment. As a result, at January 28, 2018 we had recorded a provisional income tax expense of
$43 million
on the write-down of our deferred tax balance. Upon further analysis of certain aspects of the TJCA, including immediate expensing of qualified capital expenditures and refinement of our calculations, we reduced our provisional tax expense amount by
$20 million
.
67
NVIDIA CORPORATION AND SUBSIDIARIES
NOTES TO THE CONSOLIDATED FINANCIAL STATEMENTS
(Continued)
The TCJA subjects a U.S. corporation to tax on its GILTI. Under U.S. GAAP, we can make an accounting policy election to either treat taxes due on the GILTI as a current period expense or factor such amounts into our measurement of deferred taxes. Because we were still evaluating the GILTI provisions as of January 28, 2018, we recorded
no
GILTI-related deferred balances. After further evaluation, we elected to account for GILTI deferred taxes. In fiscal year 2019, we recorded additional deferred tax assets as a net
$370 million
income tax benefit related to GILTI in deferred taxes.
The decrease in the effective tax rate in fiscal year 2019 as compared to fiscal years 2018 and 2017 was primarily due to a decrease in the U.S. statutory tax rate from
33.9%
to
21%
, the finalization of the enactment-date income tax effects of the TCJA, higher U.S federal research tax credits and excess tax benefits related to stock-based compensation in fiscal year 2019.
The decrease in the effective tax rate in fiscal year 2018 as compared to fiscal year 2017 was primarily due to the provisional impact of the tax law changes and recognition of excess tax benefits related to stock-based compensation.
Our effective tax rate for fiscal year 2019 was lower than the U.S. federal statutory rate of
21%
due primarily to income earned in jurisdictions, including British Virgin Islands, Hong Kong, China, Taiwan and United Kingdom, where the tax rate was lower than the U.S. federal statutory tax rates, the finalization of the enactment-date income tax effects of the TCJA, favorable recognition of the U.S. federal research tax credits, and excess tax benefits related to stock-based compensation.
Our effective tax rate for fiscal years 2018 and 2017 was lower than the blended U.S. federal statutory rate of
33.9%
for fiscal year 2018 and
35%
for fiscal year 2017 due primarily to income earned in jurisdictions, including British Virgin Islands, Hong Kong, China, Taiwan and United Kingdom, where the tax rate was lower than the U.S. federal statutory tax rates, favorable recognition of U.S. federal research tax credits, the provisional impact of the tax law changes in 2018, and excess tax benefits related to stock-based compensation.
As of January 27, 2019 and January 28, 2018, we had a valuation allowance of
$562 million
and
$469 million
, respectively, related to state and certain foreign deferred tax assets that management determined not likely to be realized due, in part, to projections of future taxable income. To the extent realization of the deferred tax assets becomes more-likely-than-not, we would recognize such deferred tax asset as an income tax benefit during the period.
As of January 27, 2019, we had federal, state and foreign net operating loss carryforwards of
$72 million
,
$291 million
and
$290 million
, respectively. The federal and state carryforwards will expire beginning in fiscal year 2023 and 2020, respectively. The foreign net operating loss carryforwards of
$290 million
may be carried forward indefinitely. As of January 27, 2019, we had federal research tax credit carryforwards of
$347 million
that will begin to expire in fiscal year 2037. We have state research tax credit carryforwards of
$718 million
, of which
$687 million
is attributable to the State of California and may be carried over indefinitely, and
$31 million
is attributable to various other states and will expire beginning in fiscal year 2020. Our tax attributes, net operating loss and tax credit carryforwards, remain subject to audit and may be adjusted for changes or modification in tax laws, other authoritative interpretations thereof, or other facts and circumstances. Utilization of federal, state, and foreign net operating losses and tax credit carryforwards may also be subject to limitations due to ownership changes and other limitations provided by the Internal Revenue Code and similar state and foreign tax provisions. If any such limitations apply, the federal, states, or foreign net operating loss and tax credit carryforwards, as applicable, may expire or be denied before utilization.
As of January 27, 2019, we had
$477 million
of gross unrecognized tax benefits, of which
$432 million
would affect our effective tax rate if recognized. However, approximately
$82 million
of the unrecognized tax benefits were related to state income tax positions taken, that, if recognized, would be in the form of a carryforward deferred tax asset that would likely attract a full valuation allowance. The
$432 million
of unrecognized tax benefits as of January 27, 2019 consisted of
$142 million
recorded in non-current income taxes payable and
$290 million
reflected as a reduction to the related deferred tax assets.
68
NVIDIA CORPORATION AND SUBSIDIARIES
NOTES TO THE CONSOLIDATED FINANCIAL STATEMENTS
(Continued)
A reconciliation of gross unrecognized tax benefits is as follows:
|
|
January 27,
2019 |
January 28,
2018 |
January 29,
2017 |
||||||||
|
|
(In millions)
|
||||||||||
|
Balance at beginning of period
|
$
|
447
|
|
$
|
224
|
|
$
|
230
|
|
||
|
Increases in tax positions for prior years
|
52
|
|
7
|
|
3
|
|
|||||
|
Decreases in tax positions for prior years
|
(141
|
)
|
(1
|
)
|
—
|
|
|||||
|
Increases in tax positions for current year
|
129
|
|
222
|
|
46
|
|
|||||
|
Settlements
|
—
|
|
—
|
|
(48
|
)
|
|||||
|
Lapse in statute of limitations
|
(10
|
)
|
(5
|
)
|
(7
|
)
|
|||||
|
Balance at end of period
|
$
|
477
|
|
$
|
447
|
|
$
|
224
|
|
||
We classify an unrecognized tax benefit as a current liability, or amount refundable, to the extent that we anticipate payment or receipt of cash for income taxes within one year. The amount is classified as a long-term liability, or reduction of long-term deferred tax assets or amount refundable if we anticipate payment or receipt of cash for income taxes during a period beyond a year.
Our policy is to include interest and penalties related to unrecognized tax benefits as a component of income tax expense. As of
January 27, 2019
,
January 28, 2018
, and
January 29, 2017
, we had accrued
$21 million
,
$15 million
, and
$13 million
, respectively, for the payment of interest and penalties related to unrecognized tax benefits, which is not included as a component of our unrecognized tax benefits. As of
January 27, 2019
, unrecognized tax benefits of
$142 million
and the related interest and penalties of
$21 million
are included in non-current income taxes payable.
While we believe that we have adequately provided for all tax positions, amounts asserted by tax authorities could be greater or less than our accrued position. Accordingly, our provisions on federal, state and foreign tax-related matters to be recorded in the future may change as revised estimates are made or the underlying matters are settled or otherwise resolved. As of January 27, 2019, we do not believe that our estimates, as otherwise provided for, on such tax positions will significantly increase or decrease within the next twelve months.
We are subject to taxation by a number of taxing authorities both in the United States and throughout the world. As of January 27, 2019, the significant tax jurisdictions that may be subject to examination include the United States, Hong Kong, Taiwan, China, United Kingdom, Germany, and India for fiscal years 2003 through 2018. As of January 27, 2019, the significant tax jurisdictions for which we are currently under examination include India, Taiwan, China and UK for fiscal years 2003 through 2018.
Note 14
- Shareholders’ Equity
Capital Return Program
Beginning August 2004, our Board of Directors authorized us to repurchase our stock.
During fiscal year
2019
, we repurchased a total of
9 million
shares for
$1.58 billion
and also paid
$371 million
in cash dividends to our shareholders.
Through
January 27, 2019
, we have repurchased an aggregate of
260 million
shares under our share repurchase program for a total cost of
$7.08 billion
. All shares delivered from these repurchases have been placed into treasury stock. In November 2018, our board of directors authorized an additional
$7.00 billion
under our share repurchase program. As of
January 27, 2019
, we were authorized, subject to certain specifications, to repurchase additional shares of our common stock up to
$7.24 billion
through December 2022.
Preferred Stock
As of
January 27, 2019
and
January 28, 2018
, there were
no
shares of preferred stock outstanding.
Common Stock
We are authorized to issue up to
2.00 billion
shares of our common stock at
$0.001
per share par value.
69
NVIDIA CORPORATION AND SUBSIDIARIES
NOTES TO THE CONSOLIDATED FINANCIAL STATEMENTS
(Continued)
Note 15 - Employee Retirement Plans
We have a 401(k) retirement plan covering substantially all of our U.S. employees. Under the plan, participating employees may defer up to
80%
of their pre-tax earnings, subject to the Internal Revenue Service annual contribution limits and we match a portion of the employee contributions. Our contribution expense for fiscal years
2019
,
2018
, and
2017
was
$39 million
,
$23 million
, and
$12 million
, respectively. We also have defined contribution retirement plans outside of the United States to which we contributed
$31 million
,
$25 million
, and
$23 million
for fiscal years
2019
,
2018
, and
2017
, respectively.
Note 16
- Segment Information
Our Chief Executive Officer, who is considered to be our chief operating decision maker, or CODM, reviews financial information presented on an operating segment basis for purposes of making operating decisions and assessing financial performance. Our operating segments are equivalent to our reportable segments.
We report our business in
two
primary reportable segments - the GPU business and the Tegra Processor business - based on a single underlying graphics architecture.
Our GPU product brands are aimed at specialized markets including GeForce for gamers; Quadro for designers; Tesla and DGX for AI data scientists and big data researchers; and GRID for cloud-based visual computing users. Our Tegra brand integrates an entire computer onto a single chip, and incorporates GPUs and multi-core CPUs to drive supercomputing for autonomous robots, drones, and cars, as well as for game consoles and mobile gaming and entertainment devices.
Under the single unifying architecture for our GPU and Tegra Processors, we leverage our visual computing expertise by charging the operating expenses of certain core engineering functions to the GPU business, while charging the Tegra Processor business for the incremental cost of the teams working directly for that business. In instances where the operating expenses of certain functions benefit both reportable segments, our CODM assigns 100% of those expenses to the reportable segment that benefits the most.
The “All Other” category presented below represents the revenue and expenses that our CODM does not assign to either the GPU business or the Tegra Processor business for purposes of making operating decisions or assessing financial performance. The revenue includes primarily patent licensing revenue and the expenses include stock-based compensation expense, corporate infrastructure and support costs, acquisition-related costs, legal settlement costs, contributions, restructuring and other charges, product warranty charge, and other non-recurring charges and benefits that our CODM deems to be enterprise in nature.
Our CODM does not review any information regarding total assets on a reportable segment basis. Reportable segments do not record intersegment revenue, and, accordingly, there is none to be reported. The accounting policies for segment reporting are the same as for our consolidated financial statements. The table below presents details of our reportable segments and the “All Other” category.
70
NVIDIA CORPORATION AND SUBSIDIARIES
NOTES TO THE CONSOLIDATED FINANCIAL STATEMENTS
(Continued)
|
|
GPU
|
Tegra Processor
|
All Other
|
Consolidated
|
|||||||||||
|
(In millions)
|
|||||||||||||||
|
Year Ended January 27, 2019:
|
|
|
|
|
|||||||||||
|
Revenue
|
$
|
10,175
|
|
$
|
1,541
|
|
$
|
—
|
|
$
|
11,716
|
|
|||
|
Depreciation and amortization expense
|
$
|
197
|
|
$
|
47
|
|
$
|
18
|
|
$
|
262
|
|
|||
|
Operating income (loss)
|
$
|
4,443
|
|
$
|
241
|
|
$
|
(880
|
)
|
$
|
3,804
|
|
|||
|
Year Ended January 28, 2018:
|
|
|
|
|
|||||||||||
|
Revenue
|
$
|
8,137
|
|
$
|
1,534
|
|
$
|
43
|
|
$
|
9,714
|
|
|||
|
Depreciation and amortization expense
|
$
|
123
|
|
$
|
37
|
|
$
|
39
|
|
$
|
199
|
|
|||
|
Operating income (loss)
|
$
|
3,507
|
|
$
|
303
|
|
$
|
(600
|
)
|
$
|
3,210
|
|
|||
|
Year Ended January 29, 2017:
|
|
|
|
|
|||||||||||
|
Revenue
|
$
|
5,822
|
|
$
|
824
|
|
$
|
264
|
|
$
|
6,910
|
|
|||
|
Depreciation and amortization expense
|
$
|
116
|
|
$
|
29
|
|
$
|
42
|
|
$
|
187
|
|
|||
|
Operating income (loss)
|
$
|
2,180
|
|
$
|
(9
|
)
|
$
|
(237
|
)
|
$
|
1,934
|
|
|||
|
Year Ended
|
|||||||||||
|
January 27,
2019 |
January 28,
2018 |
January 29,
2017 |
|||||||||
|
(In millions)
|
|||||||||||
|
Reconciling items included in "All Other" category:
|
|||||||||||
|
Unallocated revenue
|
$
|
—
|
|
$
|
43
|
|
$
|
264
|
|
||
|
Stock-based compensation expense
|
(557
|
)
|
(391
|
)
|
(247
|
)
|
|||||
|
Unallocated cost of revenue and operating expenses
|
(277
|
)
|
(237
|
)
|
(215
|
)
|
|||||
|
Legal settlement costs
|
(44
|
)
|
—
|
|
(16
|
)
|
|||||
|
Acquisition-related and other costs
|
(2
|
)
|
(15
|
)
|
(23
|
)
|
|||||
|
Total
|
$
|
(880
|
)
|
$
|
(600
|
)
|
$
|
(237
|
)
|
||
Revenue by geographic region is allocated to individual countries based on the location to which the products are initially billed even if our customers’ revenue is attributable to end customers that are located in a different location. The following table summarizes information pertaining to our revenue from customers based on the invoicing address by geographic regions:
|
|
Year Ended
|
||||||||||
|
|
January 27,
2019 |
January 28,
2018 |
January 29,
2017 |
||||||||
|
Revenue:
|
(In millions)
|
||||||||||
|
Taiwan
|
$
|
3,360
|
|
$
|
2,991
|
|
$
|
2,546
|
|
||
|
China (including Hong Kong)
|
2,801
|
|
1,896
|
|
1,305
|
|
|||||
|
Other Asia Pacific
|
2,368
|
|
2,066
|
|
1,010
|
|
|||||
|
United States
|
1,506
|
|
1,274
|
|
904
|
|
|||||
|
Europe
|
914
|
|
768
|
|
659
|
|
|||||
|
Other countries
|
767
|
|
719
|
|
486
|
|
|||||
|
Total revenue
|
$
|
11,716
|
|
$
|
9,714
|
|
$
|
6,910
|
|
||
71
NVIDIA CORPORATION AND SUBSIDIARIES
NOTES TO THE CONSOLIDATED FINANCIAL STATEMENTS
(Continued)
The following table summarizes information pertaining to our revenue by each of the specialized markets we serve:
|
|
Year Ended
|
||||||||||
|
|
January 27,
2019 |
January 28,
2018 |
January 29,
2017 |
||||||||
|
Revenue:
|
(In millions)
|
||||||||||
|
Gaming
|
$
|
6,246
|
|
$
|
5,513
|
|
$
|
4,060
|
|
||
|
Professional Visualization
|
1,130
|
|
934
|
|
835
|
|
|||||
|
Datacenter
|
2,932
|
|
1,932
|
|
830
|
|
|||||
|
Automotive
|
641
|
|
558
|
|
487
|
|
|||||
|
OEM & IP
|
767
|
|
777
|
|
698
|
|
|||||
|
Total revenue
|
$
|
11,716
|
|
$
|
9,714
|
|
$
|
6,910
|
|
||
The following table presents summarized information for long-lived assets by geographic region. Long-lived assets consist of property and equipment and deposits and other assets, and exclude goodwill and intangible assets.
|
|
January 27,
2019 |
January 28,
2018 |
|||||
|
Long-lived assets:
|
(In millions)
|
||||||
|
United States
|
$
|
1,266
|
|
$
|
928
|
|
|
|
Taiwan
|
137
|
|
58
|
|
|||
|
India
|
44
|
|
40
|
|
|||
|
China (including Hong Kong)
|
38
|
|
33
|
|
|||
|
Europe
|
26
|
|
11
|
|
|||
|
Other Asia Pacific
|
1
|
|
1
|
|
|||
|
Total long-lived assets
|
$
|
1,512
|
|
$
|
1,071
|
|
|
No customer represented 10% or more of total revenue for fiscal years 2019 and 2018. In fiscal year 2017, we had one customer that represented
12%
of our total revenue. The revenue was attributable to the GPU business.
Accounts receivable from significant customers, those representing 10% or more of total accounts receivable, aggregated approximately
19%
of our accounts receivable balance from one customer as of
January 27, 2019
, and approximately
28%
of our accounts receivable balance from two customers as of
January 28, 2018
.
72
NVIDIA CORPORATION AND SUBSIDIARIES
NOTES TO THE CONSOLIDATED FINANCIAL STATEMENTS
(Continued)
Note 17 - Quarterly Summary (Unaudited)
The following table sets forth our unaudited consolidated financial results, for the last eight fiscal quarters:
|
|
Fiscal Year 2019
Quarters Ended |
||||||||||||||
|
|
January 27,
2019 |
October 28,
2018 |
July 29,
2018 |
April 29,
2018 |
|||||||||||
|
|
(In millions, except per share data)
|
||||||||||||||
|
Statements of Income Data:
|
|
|
|
|
|||||||||||
|
Revenue
|
$
|
2,205
|
|
$
|
3,181
|
|
$
|
3,123
|
|
$
|
3,207
|
|
|||
|
Cost of revenue
|
$
|
998
|
|
$
|
1,260
|
|
$
|
1,148
|
|
$
|
1,139
|
|
|||
|
Gross profit
|
$
|
1,207
|
|
$
|
1,921
|
|
$
|
1,975
|
|
$
|
2,068
|
|
|||
|
Net income (1)
|
$
|
567
|
|
$
|
1,230
|
|
$
|
1,101
|
|
$
|
1,244
|
|
|||
|
Net income per share (1):
|
|||||||||||||||
|
Basic
|
$
|
0.93
|
|
$
|
2.02
|
|
$
|
1.81
|
|
$
|
2.05
|
|
|||
|
Diluted
|
$
|
0.92
|
|
$
|
1.97
|
|
$
|
1.76
|
|
$
|
1.98
|
|
|||
|
(1)
|
In the third and fourth quarters of fiscal year 2019, we recorded U.S. tax reform benefits of
$138 million
and
$230 million
, respectively, associated with the completion of our accounting for the enactment-date income tax effects of the TCJA. Refer to Note 13 of these Notes to the Consolidated Financial Statements for a discussion regarding the U.S. tax reform.
|
|
|
Fiscal Year 2018
Quarters Ended
|
||||||||||||||
|
|
January 28,
2018 |
October 28,
2017 |
July 29,
2017
|
April 29,
2017 |
|||||||||||
|
|
(In millions, except per share data)
|
||||||||||||||
|
Statements of Income Data:
|
|
|
|
|
|||||||||||
|
Revenue
|
$
|
2,911
|
|
$
|
2,636
|
|
$
|
2,230
|
|
$
|
1,937
|
|
|||
|
Cost of revenue
|
$
|
1,110
|
|
$
|
1,067
|
|
$
|
928
|
|
$
|
787
|
|
|||
|
Gross profit
|
$
|
1,801
|
|
$
|
1,569
|
|
$
|
1,302
|
|
$
|
1,150
|
|
|||
|
Net income (1)
|
$
|
1,118
|
|
$
|
838
|
|
$
|
583
|
|
$
|
507
|
|
|||
|
Net income per share (1):
|
|||||||||||||||
|
Basic
|
$
|
1.84
|
|
$
|
1.39
|
|
$
|
0.98
|
|
$
|
0.86
|
|
|||
|
Diluted
|
$
|
1.78
|
|
$
|
1.33
|
|
$
|
0.92
|
|
$
|
0.79
|
|
|||
|
(1)
|
In the fourth quarter of fiscal year 2018, we recorded a U.S. tax reform provisional net tax benefit of
$133 million
associated with the one-time transition tax on our historical foreign earnings and the adjustment of deferred tax balances to the lower corporate tax rate. Refer to Note 13 of these Notes to the Consolidated Financial Statements for a discussion regarding the U.S. tax reform.
|
73
NVIDIA CORPORATION AND SUBSIDIARIES
SCHEDULE II – VALUATION AND QUALIFYING ACCOUNTS
|
Description
|
Balance at
Beginning of Period
|
Additions
|
|
Deductions
|
|
Balance at
End of Period
|
||||||||||
|
|
(In millions)
|
|||||||||||||||
|
Fiscal year 2019
|
|
|
|
|
|
|
||||||||||
|
Allowance for doubtful accounts
|
$
|
4
|
|
$
|
—
|
|
(1)
|
$
|
(2
|
)
|
(1)
|
$
|
2
|
|
||
|
Sales return allowance
|
$
|
9
|
|
$
|
21
|
|
(2)
|
$
|
(22
|
)
|
(4)
|
$
|
8
|
|
||
|
Deferred tax valuation allowance
|
$
|
469
|
|
$
|
93
|
|
(3)
|
$
|
—
|
|
$
|
562
|
|
|||
|
Fiscal year 2018
|
|
|
|
|
|
|
||||||||||
|
Allowance for doubtful accounts
|
$
|
3
|
|
$
|
1
|
|
(1)
|
$
|
—
|
|
(1)
|
$
|
4
|
|
||
|
Sales return allowance
|
$
|
10
|
|
$
|
15
|
|
(2)
|
$
|
(16
|
)
|
(4)
|
$
|
9
|
|
||
|
Deferred tax valuation allowance
|
$
|
353
|
|
$
|
116
|
|
(3)
|
$
|
—
|
|
$
|
469
|
|
|||
|
Fiscal year 2017
|
|
|
|
|
|
|
||||||||||
|
Allowance for doubtful accounts
|
$
|
2
|
|
|
$
|
1
|
|
(1)
|
$
|
—
|
|
(1)
|
$
|
3
|
|
|
|
Sales return allowance
|
$
|
9
|
|
|
$
|
9
|
|
(2)
|
$
|
(8
|
)
|
(4)
|
$
|
10
|
|
|
|
Deferred tax valuation allowance
|
$
|
272
|
|
|
$
|
81
|
|
(3)
|
$
|
—
|
|
$
|
353
|
|
||
|
(1)
|
Additions represent allowance for doubtful accounts charged to expense and deductions represent amounts recorded as reduction to expense upon reassessment of allowance for doubtful accounts at period end.
|
|
(2)
|
Represents allowance for sales returns estimated at the time revenue is recognized primarily based on historical return rates and is charged as a reduction to revenue.
|
|
(3)
|
Represents change in valuation allowance primarily related to state and certain foreign deferred tax assets that management has determined not likely to be realized due, in part, to projections of future taxable income of the respective jurisdictions. Refer to Note 13 of the Notes to the Consolidated Financial Statements in Part IV, Item 15 of this Annual Report on Form 10-K for additional information.
|
|
(4)
|
Represents sales returns.
|
74
EXHIBIT INDEX
|
Incorporated by Reference
|
|||||||||||
|
Exhibit No.
|
Exhibit Description
|
Schedule/Form
|
File Number
|
Exhibit
|
Filing Date
|
||||||
|
3.1
|
S-8
|
333-74905
|
4.1
|
3/23/1999
|
|||||||
|
3.2
|
10-Q
|
0-23985
|
3.1
|
8/21/2008
|
|||||||
|
3.3
|
8-K
|
0-23985
|
3.1
|
5/24/2011
|
|||||||
|
3.4
|
8-K
|
0-23985
|
3.1
|
12/1/2016
|
|||||||
|
4.1
|
Reference is made to Exhibits 3.1, 3.2, 3.3 and 3.4
|
||||||||||
|
4.2
|
S-1/A
|
333-47495
|
4.2
|
4/24/1998
|
|||||||
|
4.3
|
8-K
|
0-23985
|
4.1
|
12/2/2013
|
|||||||
|
4.4
|
8-K
|
0-23985
|
Exhibit A to Exhibit 4.1
|
12/2/2013
|
|||||||
|
4.5
|
8-K
|
0-23985
|
4.1
|
9/16/2016
|
|||||||
|
4.6
|
8-K
|
0-23985
|
4.2
|
9/16/2016
|
|||||||
|
4.7
|
8-K
|
0-23985
|
Annex A to Exhibit 4.2
|
9/16/2016
|
|||||||
|
4.8
|
8-K
|
0-23985
|
Annex B to Exhibit 4.2
|
9/16/2016
|
|||||||
|
10.1
|
8-K
|
0-23985
|
10.1
|
3/7/2006
|
|||||||
|
10.2+
|
8-K
|
0-23985
|
10.1
|
5/21/2018
|
|||||||
|
10.3+
|
10-Q
|
0-23985
|
10.41
|
5/27/2011
|
|||||||
|
10.4+
|
8-K
|
0-23985
|
10.1
|
12/14/2011
|
|||||||
|
10.5+
|
10-Q
|
0-23985
|
10.4
|
5/23/2012
|
|||||||
|
10.6+
|
8-K
|
0-23985
|
10.2
|
9/13/2010
|
|||||||
|
10.7+
|
8-K
|
0-23985
|
10.21
|
9/13/2010
|
|||||||
|
10.8+
|
10-Q
|
0-23985
|
10.1
|
8/22/2012
|
|||||||
|
10.9+
|
10-Q
|
0-23985
|
10.2
|
8/22/2012
|
|||||||
75
|
10.10+
|
10-Q
|
0-23985
|
10.3
|
8/22/2012
|
|||||||
|
10.11+
|
10-Q
|
0-23985
|
10.3
|
5/23/2012
|
|||||||
|
10.12+
|
8-K
|
0-23985
|
10.1
|
7/23/2013
|
|||||||
|
10.13+
|
10-K
|
0-23985
|
10.25
|
3/12/2015
|
|||||||
|
10.14+
|
10-K
|
0-23985
|
10.26
|
3/12/2015
|
|||||||
|
10.15+
|
10-K
|
0-23985
|
10.27
|
3/12/2015
|
|||||||
|
10.16+
|
10-Q
|
0-23985
|
10.1
|
5/20/2015
|
|||||||
|
10.17+
|
10-Q
|
0-23985
|
10.2
|
5/20/2015
|
|||||||
|
10.18+
|
10-Q
|
0-23985
|
10.2
|
5/22/2018
|
|||||||
|
10.19+*
|
|||||||||||
|
10.20+
|
10-Q
|
0-23985
|
10.2
|
5/21/2018
|
|||||||
|
10.21+
|
8-K
|
0-23985
|
10.1
|
3/13/2017
|
|||||||
|
10.22+
|
8-K
|
0-23985
|
10.1
|
3/13/2018
|
|||||||
|
10.23+
|
8-K
|
0-23985
|
10.1
|
9/16/2013
|
|||||||
|
10.24+
|
8-K
|
0-23985
|
10.1
|
1/19/2017
|
|||||||
|
10.25
|
8-K
|
0-23985
|
99.1
|
12/2/2013
|
|||||||
|
10.26
|
8-K
|
0-23985
|
99.3
|
12/2/2013
|
|||||||
76
|
10.27
|
8-K
|
0-23985
|
1.1
|
10/13/2016
|
|||||||
|
10.28
|
8-K
|
0-23985
|
10.1
|
12/15/2017
|
|||||||
|
21.1*
|
|||||||||||
|
23.1*
|
|||||||||||
|
24.1*
|
|||||||||||
|
31.1*
|
|||||||||||
|
31.2*
|
|||||||||||
|
32.1#*
|
|||||||||||
|
32.2#*
|
|||||||||||
|
101.INS*
|
XBRL Instance Document
|
||||||||||
|
101.SCH*
|
XBRL Taxonomy Extension Schema Document
|
||||||||||
|
101.CAL*
|
XBRL Taxonomy Extension Calculation Linkbase Document
|
||||||||||
|
101.DEF*
|
XBRL Taxonomy Extension Definition Linkbase Document
|
||||||||||
|
101.LAB*
|
XBRL Taxonomy Extension Labels Linkbase Document
|
||||||||||
|
101.PRE*
|
XBRL Taxonomy Extension Presentation Linkbase Document
|
||||||||||
*
Filed herewith.
+ Management contract or compensatory plan or arrangement.
# In accordance with Item 601(b)(32)(ii) of Regulation S-K and SEC Release Nos. 33-8238 and 34-47986, Final Rule: Management's Reports on Internal Control Over Financial Reporting and Certification of Disclosure in Exchange Act Periodic Reports, the certifications furnished in Exhibits 32.1 and 32.2 hereto are deemed to accompany this Annual Report on Form 10-K and will not be deemed “filed” for purpose of Section 18 of the Exchange Act. Such certifications will not be deemed to be incorporated by reference into any filing under the Securities Act or the Exchange Act, except to the extent that the registrant specifically incorporates it by reference.
Copies of above exhibits not contained herein are available to any shareholder upon written request to:
Investor Relations: NVIDIA Corporation, 2788 San Tomas Expressway, Santa Clara, CA 95051
77
SIGNATURES
Pursuant to the requirements of Section 13 or 15(d) of the Securities Exchange Act of 1934, the Registrant has duly caused this report to be signed on its behalf by the undersigned, thereunto duly authorized, on
February 21, 2019
.
|
NVIDIA Corporation
|
|
|
By:
|
/s/ Jen-Hsun Huang
|
|
|
Jen-Hsun Huang
|
|
|
President and Chief Executive Officer
|
POWER OF ATTORNEY
KNOW ALL PERSONS BY THESE PRESENTS, that each person whose signature appears below constitutes and appoints Jen-Hsun Huang and Colette M. Kress, and each or any one of them, his true and lawful attorney-in-fact and agent, with full power of substitution and resubstitution, for him and in his name, place and stead, in any and all capacities, to sign any and all amendments to this report, and to file the same, with all exhibits thereto, and other documents in connection therewith, with the Securities and Exchange Commission, granting unto said attorneys-in-facts and agents, and each of them, full power and authority to do and perform each and every act and thing requisite and necessary to be done in connection therewith, as fully to all intents and purposes as he might or could do in person, hereby ratifying and confirming all that said attorneys-in-fact and agents, or any of them, or their or his substitutes or substitutes, may lawfully do or cause to be done by virtue hereof.
Pursuant to the requirements of the Securities Exchange Act of 1934, this report has been signed below by the following persons on behalf of the registrant and in the capacities and on the dates indicated.
78
|
Signature
|
Title
|
Date
|
|
/s/ JEN-HSUN HUANG
|
President, Chief Executive Officer and Director
(Principal Executive Officer)
|
February 21, 2019
|
|
Jen-Hsun Huang
|
|
|
|
/s/ COLETTE M. KRESS
|
Executive Vice President and Chief Financial Officer
(Principal Financial Officer)
|
February 21, 2019
|
|
Colette M. Kress
|
|
|
|
/s/ MICHAEL J. BYRON
|
Vice President and Chief Accounting Officer
(Principal Accounting Officer)
|
February 21, 2019
|
|
Michael J. Byron
|
||
|
Director
|
February 21, 2019
|
|
|
Robert Burgess
|
||
|
/s/ TENCH COXE
|
Director
|
February 21, 2019
|
|
Tench Coxe
|
|
|
|
/s/ PERSIS DRELL
|
Director
|
February 21, 2019
|
|
Persis Drell
|
||
|
/s/ JAMES C. GAITHER
|
Director
|
February 21, 2019
|
|
James C. Gaither
|
|
|
|
/s/ DAWN HUDSON
|
Director
|
February 21, 2019
|
|
Dawn Hudson
|
||
|
/s/ HARVEY C. JONES
|
Director
|
February 21, 2019
|
|
Harvey C. Jones
|
|
|
|
/s/ MICHAEL MCCAFFERY
|
Director
|
February 21, 2019
|
|
Michael McCaffery
|
||
|
/s/ MARK L. PERRY
|
Director
|
February 21, 2019
|
|
Mark L. Perry
|
|
|
|
/s/ A. BROOKE SEAWELL
|
Director
|
February 21, 2019
|
|
A. Brooke Seawell
|
||
|
Director
|
February 21, 2019
|
|
|
Mark Stevens
|
|
|
79
TABLE OF CONTENTS
Part IItem 1. BusinessItem 1A. Risk FactorsItem 1B. Unresolved Staff CommentsItem 2. PropertiesItem 3. Legal ProceedingsItem 4. Mine Safety DisclosuresPart IIItem 5. Market For Registrant S Common Equity, Related Stockholder Matters and Issuer Purchases Of Equity SecuritiesItem 6. Selected Financial DataItem 7. Management S Discussion and Analysis Of Financial Condition and Results Of OperationsItem 7A. Quantitative and Qualitative Disclosures About Market RiskItem 8. Financial Statements and Supplementary DataItem 9. Changes in and Disagreements with Accountants on Accounting and Financial DisclosureItem 9A. Controls and ProceduresItem 9B. Other InformationPart IIIItem 10. Directors, Executive Officers and Corporate GovernanceItem 11. Executive CompensationItem 12. Security Ownership Of Certain Beneficial Owners and Management and Related Stockholder MattersItem 13. Certain Relationships and Related Transactions, and Director IndependenceItem 14. Principal Accounting Fees and ServicesPart IVItem 15. Exhibits, Financial Statement ScheduleNote 1 - Organization and Summary Of Significant Accounting PoliciesNote 2 - New Revenue Accounting StandardNote 3 - Stock-based CompensationNote 4 - Net Income Per ShareNote 5 - GoodwillNote 6 - Amortizable Intangible AssetsNote 7 - Marketable SecuritiesNote 8 - Fair Value Of Financial Assets and LiabilitiesNote 9 - Balance Sheet ComponentsNote 10 - Derivative Financial InstrumentsNote 11 - DebtNote 12 - Commitments and ContingenciesNote 13 - Income TaxesNote 14 - Shareholders EquityNote 15 - Employee Retirement PlansNote 16 - Segment InformationNote 17 - Quarterly Summary (unaudited)