NVR INC
10-Ks and 10-Qs
|
|
|
|
|
|
|
|
|
|
|
|
|
|
|
|
|
|
|
|
|
|
|
|
|
|
|
|
|
|
|
|
|
|
|
|
|
|
|
|
|
|
|
|
|
|
|
|
|
|
|
|
|
|
|
|
UNITED STATES
SECURITIES AND EXCHANGE COMMISSION
Washington, D.C. 20549
_____________________________________________________________
FORM 10-K
_____________________________________________________________
|
☒
|
ANNUAL REPORT PURSUANT TO SECTION 13 OR 15(d) OF THE SECURITIES EXCHANGE ACT OF 1934
|
For the fiscal year ended
December 31, 2018
OR
|
☐
|
TRANSITION REPORT PURSUANT TO SECTION 13 OR 15(d) OF THE SECURITIES EXCHANGE ACT OF 1934
|
For the transition period from to
Commission file number 1-12378
_________________________________________________
NVR, Inc.
(Exact Name of Registrant as Specified in its Charter)
_____________________________________________________________
|
Virginia
|
54-1394360
|
|
|
(State or Other Jurisdiction of Incorporation or Organization)
|
(IRS Employer Identification Number)
|
|
|
11700 Plaza America Drive, Suite 500
Reston, Virginia
|
20190
|
|
|
(Address of Principal Executive Offices)
|
(Zip Code)
|
|
Registrant’s telephone number, including area code:
(703) 956-4000
Securities registered pursuant to Section 12(b) of the Act:
|
Title of each class
|
Name of each exchange on which registered
|
|
|
Common stock, par value $0.01 per share
|
New York Stock Exchange
|
|
Securities registered pursuant to Section 12(g) of the Act: None
_____________________________________________________________
Indicate by check mark if the registrant is a well-known seasoned issuer, as defined in Rule 405 of the Securities Act. Yes ☒ No ☐
Indicate by check mark if the registrant is not required to file reports pursuant to Section 13 or Section 15(d) of the Exchange Act. Yes ☐ No ☒
Indicate by check mark whether the registrant (1) has filed all reports required to be filed by Section 13 or 15(d) of the Securities Exchange Act of 1934 during the preceding 12 months (or for such shorter period that the registrant was required to file such reports), and (2) has been subject to such filing requirements for the past 90 days. Yes ☒ No ☐
Indicate by check mark whether the registrant has submitted electronically and posted on its corporate Website, if any, every Interactive Data File required to be submitted and posted pursuant to Rule 405 of Regulation S-T (§232.405 of this chapter) during the preceding 12 months (or for such shorter period that the registrant was required to submit and post such files). Yes ☒ No ☐
Indicate by check mark if disclosure of delinquent filers pursuant to Item 405 of Regulation S-K (§229.405) is not contained herein, and will not be contained, to the best of registrant’s knowledge, in definitive proxy or information statements incorporated by reference in Part III of this Form 10-K or any amendment to this Form 10-K. ☒
Indicate by check mark whether the registrant is a large accelerated filer, an accelerated filer, a non-accelerated filer, smaller reporting company, or an emerging growth company. See the definitions of “large accelerated filer,” “accelerated filer,” “smaller reporting company,” and “emerging growth company” in Rule 12b-2 of the Exchange Act.
|
Large accelerated filer
|
☒
|
Accelerated filer
|
☐
|
|
|
Non-accelerated filer
|
☐
|
(Do not check if a smaller reporting company)
|
Smaller reporting company
|
☐
|
|
Emerging growth company
|
☐
|
|||
If an emerging growth company, indicate by check mark if the registrant has elected not to use the extended transition period for complying with any new or revised financial accounting standards provided pursuant to Section 13(a) of the Exchange Act.
☐
Indicate by check mark whether the registrant is a shell company (as defined in Rule 12b-2 of the Act). Yes ☐ No ☒
The aggregate market value of the voting stock held by non-affiliates of NVR, Inc. on June 30, 2018, the last business day of NVR, Inc.’s most recently completed second fiscal quarter, was approximately
$10,109,057,000
.
As of
February 11, 2019
there were
3,616,917
total shares of common stock outstanding.
DOCUMENTS INCORPORATED BY REFERENCE
Portions of the Proxy Statement of NVR, Inc. to be filed with the Securities and Exchange Commission pursuant to Regulation 14A of the Securities Exchange Act of 1934 on or prior to April 30,
2019
are incorporated by reference into Part III of this report.
NVR, Inc.
Form 10-K
TABLE OF CONTENTS
|
Page
|
||
|
PART I
|
||
|
Item 1.
|
||
|
Item 1A.
|
||
|
Item 1B.
|
||
|
Item 2.
|
||
|
Item 3.
|
||
|
Item 4.
|
||
|
PART II
|
||
|
Item 5.
|
||
|
Item 6.
|
||
|
Item 7.
|
||
|
Item 7A.
|
||
|
Item 8.
|
||
|
Item 9.
|
||
|
Item 9A.
|
||
|
Item 9B.
|
||
|
PART III
|
||
|
Item 10.
|
||
|
Item 11.
|
||
|
Item 12.
|
||
|
Item 13.
|
||
|
Item 14.
|
||
|
PART IV
|
||
|
Item 15.
|
||
PART I
Item 1. Business.
General
NVR, Inc., a Virginia corporation, was formed in 1980 as NVHomes, Inc. Our primary business is the construction and sale of single-family detached homes, townhomes and condominium buildings, all of which are primarily constructed on a pre-sold basis. To more fully serve customers of our homebuilding operations, we also operate a mortgage banking and title services business. We conduct our homebuilding activities directly. Our mortgage banking operations are operated primarily through a wholly owned subsidiary, NVR Mortgage Finance, Inc. (“NVRM”). Unless the context otherwise requires, references to “NVR”, “we”, “us” or “our” include NVR, Inc. and its consolidated subsidiaries.
We are one of the largest homebuilders in the United States. We operate in multiple locations in fourteen states, which are primarily in the eastern part of the country, and in Washington, D.C. During 2018, approximately 23% and 8% of our home settlements occurred in the Washington, D.C. and Baltimore, MD metropolitan areas, respectively, which accounted for approximately 30% and 10%, respectively, of our 2018 homebuilding revenues. Our homebuilding operations include the construction and sale of single-family detached homes, townhomes and condominium buildings under three trade names: Ryan Homes, NVHomes and Heartland Homes. Our Ryan Homes product is marketed primarily to first-time and first-time move-up buyers. Ryan Homes operates in thirty-two metropolitan areas located in Maryland, Virginia, Washington, D.C., West Virginia, Pennsylvania, New York, North Carolina, South Carolina, Florida, Ohio, New Jersey, Delaware, Indiana, Illinois and Tennessee. Our NVHomes and Heartland Homes products are marketed primarily to move-up and luxury buyers. NVHomes operates in Delaware and the Washington, D.C., Baltimore, MD and Philadelphia, PA metropolitan areas. Heartland Homes operates in the Pittsburgh, PA metropolitan area.
We generally do not engage in land development (see discussion below of our land development activities). Instead, we typically acquire finished building lots at market prices from various third party land developers pursuant to fixed price finished lot purchase agreements (“Lot Purchase Agreements”) that require deposits that may be forfeited if we fail to perform under the Lot Purchase Agreements. The deposits required under the Lot Purchase Agreements are in the form of cash or letters of credit in varying amounts and typically range up to 10% of the aggregate purchase price of the finished lots.
We believe that our lot acquisition strategy avoids the financial requirements and risks associated with direct land ownership and land development. We may, at our option, choose for any reason and at any time not to perform under these Lot Purchase Agreements by delivering notice of our intent not to acquire the finished lots under contract. Our sole legal obligation and economic loss for failure to perform under these Lot Purchase Agreements is limited to the amount of the deposit pursuant to the liquidated damage provision contained within the Lot Purchase Agreements. We do not have any financial guarantees or completion obligations and we typically do not guarantee lot purchases on a specific performance basis under these Lot Purchase Agreements. None of the creditors of any of the development entities with which we have entered these Lot Purchase Agreements have recourse to our general credit. We generally seek to maintain control over a supply of lots believed to be suitable to meet our five-year business plan.
In addition to constructing homes primarily on a pre-sold basis and utilizing what we believe is a conservative lot acquisition strategy, we focus on obtaining and maintaining a leading market position in each market we serve. This strategy allows us to gain valuable efficiencies and competitive advantages in our markets, which we believe contributes to minimizing the adverse effects of regional economic cycles and provides growth opportunities within these markets. Our continued success is contingent upon our ability to control an adequate supply of finished lots on which to build. As a result, in certain specific strategic circumstances we deviate from our historical lot acquisition strategy and engage in joint venture arrangements with land developers or directly acquire raw ground already zoned for its intended use for development. Once we acquire control of raw ground, we determine whether to sell the raw parcel to a developer and enter into a Lot Purchase Agreement with the developer to purchase the finished lots or hire a developer to develop the land on our behalf. While joint venture arrangements and direct land development activity are not our preferred method of acquiring finished building lots, we may enter into additional transactions in the future on a limited basis where there exists a compelling strategic or prudent financial reason to do so. We expect, however, to continue to acquire substantially all of our finished lot inventory using Lot Purchase Agreements with forfeitable deposits. See “Management’s Discussion and Analysis of Financial Condition and Results of Operations” in Item 7 of this Form 10-K for additional discussion of lots controlled. In addition, see Notes 3, 4 and 5 in the accompanying consolidated financial statements included herein for additional information regarding Lot Purchase Agreements, joint ventures and land under development, respectively.
In addition to building and selling homes, we provide a number of mortgage-related services through our mortgage banking operations. Through operations in each of our homebuilding markets, NVRM originates mortgage loans almost exclusively for our homebuyers. NVRM generates revenues primarily from origination fees, gains on sales of loans and title fees. NVRM sells all of the mortgage loans it closes into the secondary markets on a servicing released basis.
Segment information for our homebuilding and mortgage banking businesses is included in Note 2 in the accompanying consolidated financial statements.
1
Homebuilding
Products
We offer single-family detached homes, townhomes and condominium buildings with many different basic home designs. These home designs have a variety of elevations and numerous other options. Our homes combine traditional, transitional, cottage or urban exterior designs with contemporary interior designs and amenities, generally include two to four bedrooms and range from approximately 1,000 to 9,500 finished square feet. During 2018, the prices at which we settled homes ranged from approximately $130,000 to $1.5 million and averaged $379,700. During 2017, our average price of homes settled was $386,900.
Markets
Our four reportable homebuilding segments operate in the following geographic regions:
|
Mid Atlantic:
|
|
Maryland, Virginia, West Virginia, Delaware and Washington, D.C.
|
|
North East:
|
|
New Jersey and Eastern Pennsylvania
|
|
Mid East:
|
|
New York, Ohio, Western Pennsylvania, Indiana and Illinois
|
|
South East:
|
|
North Carolina, South Carolina, Florida and Tennessee
|
Backlog
Backlog, which represents homes sold but not yet settled with the customer, totaled 8,365 units and approximately $3.2 billion at December 31, 2018 compared to 8,531 units and approximately $3.3 billion at December 31, 2017. Backlog may be impacted by customer cancellations for various reasons that are beyond our control, such as the customer’s failure to obtain mortgage financing, inability to sell an existing home, job loss or a variety of other reasons. In any period, a portion of the cancellations that we experience are related to new sales that occurred during the same period, and a portion are related to sales that occurred in prior periods and therefore appeared in the opening backlog for the current period. Expressed as the total of all cancellations during the period as a percentage of gross sales during the period, our cancellation rate was approximately 15% in 2018, 14% in 2017 and 15% in 2016. Additionally, approximately 5% in 2018 and 6% in each of 2017 and 2016 of a reporting quarter’s opening backlog balance cancelled during the quarter. We can provide no assurance that our historical cancellation rates are indicative of the actual cancellation rate that may occur in future periods. Other than those units that are cancelled, we expect to settle substantially all of our December 31, 2018 backlog during 2019. See “Risk Factors” in Item 1A and “Seasonality” in Item 7 of this Form 10-K.
Further discussion of settlements, new orders and backlog activity by our homebuilding reportable segment for each of the last three years can be found in “Management’s Discussion and Analysis of Financial Condition and Results of Operations” in Item 7 of this Form 10-K.
Construction
We utilize independent subcontractors under fixed price contracts to perform construction work on our homes. We use many independent subcontractors in our various markets and we are not dependent on any single subcontractor or on a small number of subcontractors.
Sales and Marketing
Our preferred marketing method is for customers to visit a furnished model home featuring many built-in options and a landscaped lot. The garages of these model homes are usually converted into temporary sales centers where alternative facades and floor plans are displayed and designs for other models are available for review. Sales representatives are compensated predominantly on a commission basis.
Regulation
We and our subcontractors must comply with various federal, state and local zoning, building, environmental, advertising and consumer credit statutes, rules and regulations, as well as other regulations and requirements in connection with our construction and sales activities. All of these regulations have increased the cost to produce and market our products, and in some instances, have delayed our developers’ ability to deliver finished lots to us. Counties and cities in which we build homes have at times declared moratoriums on the issuance of building permits and imposed other restrictions in the areas in which sewage treatment facilities and other public facilities do not reach minimum standards. In addition, our homebuilding operations are regulated in certain areas by restrictive zoning and density requirements that limit the number of homes that can be built within the boundaries of a particular area. To date, restrictive zoning laws and the imposition of moratoriums have not had a material adverse effect on our construction activities.
Competition and Market Factors
The housing industry is highly competitive. We compete with numerous homebuilders of varying size, ranging from local to national in scope, some of which have greater financial resources than we do. We also face competition from the home resale market.
2
Our homebuilding operations compete primarily on the basis of price, location, design, quality, service and reputation. Historically, we have been one of the market leaders in each of the markets where we build homes.
The housing industry is cyclical and is affected by consumer confidence levels, prevailing economic conditions and interest rates. Other factors that affect the housing industry and the demand for new homes include: the availability and the cost of land, labor and materials; changes in consumer preferences; demographic trends; and the availability of mortgage finance programs. See “Risk Factors” in Item 1A of this Form 10-K for additional information regarding these risks.
We are dependent upon building material suppliers for a continuous flow of raw materials. Whenever possible, we utilize standard products available from multiple sources. In the past, such raw materials have been generally available to us in adequate supply.
Mortgage Banking
We provide a number of mortgage related services to our homebuilding customers through our mortgage banking operations. Our mortgage banking operations also include separate subsidiaries that broker title insurance and perform title searches in connection with mortgage loan closings for which they receive commissions and fees. Because NVRM originates mortgage loans almost exclusively for our homebuilding customers, NVRM is dependent on our homebuilding segment. In 2018, NVRM closed approximately 15,100 loans with an aggregate principal amount of approximately $4.8 billion as compared to approximately 13,100 loans with an aggregate principal amount of approximately $4.2 billion in 2017.
NVRM sells all of the mortgage loans it closes to investors in the secondary markets on a servicing released basis, typically within 30 days from the loan closing. NVRM is an approved seller/servicer for Fannie Mae (“FNMA”) and Freddie Mac ("FHLMC") mortgage loans and an approved seller/issuer of Ginnie Mae (“GNMA”), Department of Veterans Affairs (“VA”) and Federal Housing Administration (“FHA”) mortgage loans.
Regulation
NVRM is subject to the rules and regulations of FNMA, GNMA, FHLMC, VA and FHA. These rules and regulations restrict certain activities of NVRM. NVRM is currently eligible and expects to remain eligible to participate in such programs. In addition, NVRM is subject to regulation at the state and federal level, including regulations issued by the Consumer Financial Protection Bureau (the “CFPB”) with respect to specific origination, selling and servicing practices.
Competition and Market Factors
NVRM’s main competition comes from national, regional, and local mortgage bankers, mortgage brokers, credit unions and banks in each of these markets. NVRM competes primarily on the basis of customer service, variety of products offered, interest rates offered, prices of ancillary services and relative financing availability and costs.
Pipeline
NVRM’s mortgage loans in process that had not closed had an aggregate principal balance of approximately $2.2 billion as of both December 31, 2018 and 2017. NVRM’s cancellation rate was approximately 32%, 31% and 34% in 2018, 2017 and 2016, respectively. We can provide no assurance that our historical loan cancellation rates are indicative of the actual loan cancellation rate that may occur in future periods. See “Risk Factors” in Item 1A in this Form 10-K for additional information about factors that could increase our cancellation rate.
Employees
At December 31, 2018, we employed approximately 5,600 full-time persons. None of our employees are subject to a collective bargaining agreement and we have never experienced a work stoppage. We believe that our employee relations are good.
Available Information
We file annual, quarterly and current reports, proxy statements and other information with the Securities and Exchange Commission (the “SEC”). These filings are available to the public over the internet at the SEC’s website at
www.sec.gov
.
Our principal internet website can be found at
www.nvrinc.com
.
We make available free of charge on or through our website, access to our annual report on Form 10-K, quarterly reports on Form 10-Q, current reports on Form 8-K, and amendments to those reports as soon as reasonably practicable after such material is electronically filed, or furnished, to the SEC.
Our website also includes a corporate governance section which contains our Corporate Governance Guidelines (which includes our Directors’ Independence Standards), Code of Ethics, Board Committee Charters, Policies and Procedures for the Consideration of Board of Director Candidates, and Policies and Procedures Regarding Communications with the NVR, Inc. Board of Directors, the Independent Lead Director and the Non-Management Directors as a Group.
3
Forward-Looking Statements
Some of the statements in this Form 10-K, as well as statements made by us in periodic press releases or other public communications, constitute “forward-looking statements” within the meaning of the Private Securities Litigation Reform Act of 1995, Section 27A of the Securities Act of 1933, as amended, and Section 21E of the Securities Exchange Act of 1934, as amended. Certain, but not necessarily all, of such forward-looking statements can be identified by the use of forward-looking terminology, such as “believes,” “expects,” “may,” “will,” “should,” or “anticipates” or the negative thereof or other comparable terminology. All statements other than of historical facts are forward looking statements. Forward-looking statements contained in this document include those regarding market trends, NVR’s financial position, business strategy, the outcome of pending litigation, investigations or similar contingencies, projected plans and objectives of management for future operations. Such forward-looking statements involve known and unknown risks, uncertainties and other factors that may cause the actual results or performance of NVR to be materially different from future results, performance or achievements expressed or implied by the forward-looking statements. Such risk factors include, but are not limited to the following: general economic and business conditions (on both a national and regional level); interest rate changes; access to suitable financing by NVR and NVR’s customers; increased regulation in the mortgage banking industry; the ability of our mortgage banking subsidiary to sell loans it originates into the secondary market; competition; the availability and cost of land and other raw materials used by NVR in its homebuilding operations; shortages of labor; weather related slow-downs; building moratoriums; governmental regulation; fluctuation and volatility of stock and other financial markets; mortgage financing availability; and other factors over which NVR has little or no control. NVR undertakes no obligation to update such forward-looking statements except as required by law.
Item 1A. Risk Factors.
Our business is affected by the risks generally incident to the residential construction business, including, but not limited to:
|
•
|
actual and expected direction of interest rates, which affect our costs, the availability of construction financing, and long-term financing for potential purchasers of homes;
|
|
•
|
the availability of mortgage financing;
|
|
•
|
the availability of adequate land in desirable locations on favorable terms;
|
|
•
|
employment levels, consumer confidence and spending and unexpected changes in customer preferences; and
|
|
•
|
changes in the national economy and in the local economies of the markets in which we operate.
|
All of these risks are discussed in detail below.
An economic downturn or decline in economic conditions could adversely affect our business and our results of operations.
Demand for new homes is sensitive to economic changes driven by conditions such as employment levels, job growth, consumer confidence and interest rates. If the housing industry suffers a downturn, our sales may decline which could have a material adverse effect on our profitability, stock performance, ability to service our debt obligations and future cash flows.
Interest rate movements, inflation and other economic factors can negatively impact our business.
High rates of inflation generally affect the homebuilding industry adversely because of their adverse impact on interest rates. High interest rates not only increase the cost of borrowed funds to homebuilders but also have a significant adverse effect on housing demand and on the affordability of permanent mortgage financing to prospective purchasers. We are also subject to potential volatility in the price of commodities that impact costs of materials used in our homebuilding business. Increases in prevailing interest rates could have a material adverse effect on our sales, profitability, stock performance, ability to service our debt obligations and future cash flows.
Our financial results also are affected by the risks generally incident to our mortgage banking business, including interest rate levels, the impact of government regulation on mortgage loan originations and servicing and the need to issue forward commitments to fund and sell mortgage loans. Our homebuilding customers account for almost all of our mortgage banking business. The volume of our continuing homebuilding operations therefore affects our mortgage banking business.
Our mortgage banking business also is affected by interest rate fluctuations. We also may experience marketing losses resulting from daily increases in interest rates to the extent we are unable to match interest rates and amounts on loans we have committed to originate with forward commitments from third parties to purchase such loans. Increases in interest rates may have a material adverse effect on our mortgage banking revenue, profitability, stock performance, ability to service our debt obligations and future cash flows.
Our operations may also be adversely affected by other economic factors within our markets such as negative changes in employment levels, job growth, wage growth, consumer confidence and household formation and availability of mortgage financing, one or all of which could result in reduced demand or price depression from current levels. Such negative trends could have a material adverse effect on homebuilding operations.
4
These factors and thus, the homebuilding and mortgage banking businesses, have at times in the past been cyclical in nature. Any downturn in the national economy or the local economies of the markets in which we operate could have a material adverse effect on our sales, profitability, stock performance and ability to service our debt obligations. In particular, during
2018
, approximately 23% and 8% of our home settlements occurred in the Washington, D.C. and Baltimore, MD metropolitan areas, respectively, which accounted for approximately
30%
and
10%
, respectively, of our
2018
homebuilding revenues. Thus, we are dependent to a significant extent on the economy and demand for housing in those areas.
Because almost all of our customers require mortgage financing, the availability of suitable mortgage financing could impair the affordability of our homes, lower demand for our products, and limit our ability to fully deliver our backlog.
Our business and earnings depend on the ability of our potential customers to obtain mortgages for the purchase of our homes. In addition, many of our potential customers must sell their existing homes in order to buy a home from us. The tightening of credit standards and the availability of suitable mortgage financing could prevent customers from buying our homes and could prevent buyers of our customers’ homes from obtaining mortgages they need to complete that purchase, either of which could result in potential customers’ inability to buy a home from us. If potential customers or the buyers of our customers’ current homes are not able to obtain suitable financing, the result could have a material adverse effect on our sales, profitability, stock performance, ability to service our debt obligations and future cash flows.
If our ability to sell mortgages to investors is impaired, we may be required to fund these commitments ourselves, or we may not be able to originate loans at all.
Our mortgage banking business sells all of the loans it originates into the secondary market, usually within 30 days from the date of closing, and has up to $150 million available under a repurchase agreement to fund mortgage closings. See “Management’s Discussion and Analysis of Financial Condition and Results of Operations – Liquidity and Capital Resources” in Item 7 of this Form 10-K for more information about the repurchase agreement. In the event that disruptions to the secondary markets tighten or eliminate the available liquidity within the secondary markets for mortgage loans, or the underwriting requirements by our secondary market investors continue to become more stringent, our ability to sell future mortgages could decline and we could be required, among other things, to fund our commitments to our buyers with our own financial resources, which is limited, or require our home buyers to find another source of financing. The result of such secondary market disruption could have a material adverse effect on our sales, profitability, stock performance, ability to service our debt obligations and future cash flows.
If the market value of our inventory or controlled lot position declines, our profit could decrease and we may incur losses.
Inventory risk can be substantial for homebuilders. The market value of building lots and housing inventories can fluctuate significantly as a result of changing market conditions. In addition, inventory carrying costs can be significant and can result in losses in a poorly performing community or market. We must continuously seek and make acquisitions of lots for expansion into new markets as well as for replacement and expansion within our current markets, which we generally accomplish by entering into Lot Purchase Agreements and paying forfeitable deposits under the Lot Purchase Agreements to developers for the contractual right to acquire the lots. In the event of adverse changes in economic, market or community conditions, we may cease further building activities in certain communities or restructure existing Lot Purchase Agreements, resulting in forfeiture of some or all of any remaining land contract deposit paid to the developer. We may also have significant impairments of land under development. The forfeiture of land contract deposits or inventory impairments may result in a loss that could have a material adverse effect on our profitability, stock performance, ability to service our debt obligations and future cash flows.
If the underwriting quality of our mortgage originations is found to be deficient, our profit could decrease and we may incur losses.
We originate several different loan products to our customers to finance the purchase of their home. We sell all of the loans we originate into the secondary mortgage market generally within 30 days from the date of closing. All of the loans that we originate are underwritten to the standards and specifications of the ultimate investor. Insofar as we underwrite our originated loans to those standards, we bear no increased concentration of credit risk from the issuance of loans, except in certain limited instances where early payment default occurs. In the event that a substantial number of the loans that we have originated fall into default and the investors to whom we sold the loans determine that we did not underwrite the loans in accordance with their requirements, we could be required to repurchase the loans from the investor or indemnify the investor for any losses incurred. Any resulting losses could have a material adverse effect on our profitability, stock performance, ability to service our debt obligations and future cash flows.
We may be subject to claims on mortgage loans sold to third parties.
Our mortgage banking operations may be responsible for losses associated with mortgage loans originated and sold to investors in the event of errors or omissions relating to certain representations and warranties that the loans sold meet certain requirements, including representations as to underwriting standards, the type of collateral, the existence of private mortgage insurance, and the validity of certain borrower representations in connection with the loan. The resolution of claims related to alleged breaches of these representations and warranties and repurchase claims could have a material adverse effect on our financial condition, cash flows and results of operations and could result in losses that exceed existing estimates and accruals. Because of the uncertainties inherent in
5
estimating these matters, there can be no assurance that any amounts reserved will be adequate or that any potential inadequacies will not have a material adverse effect on our results of operations.
Our inability to secure and control an adequate inventory of lots could adversely impact our operations.
The results of our homebuilding operations depend upon our continuing ability to control an adequate number of homebuilding lots in desirable locations. There can be no assurance that an adequate supply of building lots will continue to be available to us on terms similar to those available in the past, or that we will not be required to devote a greater amount of capital to controlling building lots than we have historically. An insufficient supply of building lots in one or more of our markets, an inability of our developers to deliver finished lots in a timely fashion due to their inability to secure financing to fund development activities or for other reasons, or our inability to purchase or finance building lots on reasonable terms could have a material adverse effect on our sales, profitability, stock performance, ability to service our debt obligations and future cash flows.
Volatility in the credit and capital markets may impact our ability to access necessary financing.
If we require working capital greater than that provided by our operations and our credit facility, we may be required to seek to increase the amount available under the facility or seek alternative financing, which might not be available on terms that are favorable or acceptable. If we are required to seek financing to fund our working capital requirements, volatility in credit or capital markets may restrict our flexibility to access financing. If we are at any time unsuccessful in obtaining sufficient capital to fund our planned homebuilding expenditures, we may experience a substantial delay in the completion of homes then under construction, or we may be unable to control or purchase finished building lots. Any delay could result in cost increases and could have a material adverse effect on our sales, profitability, stock performance, ability to service our debt obligations and future cash flows.
Our mortgage banking operations depend in part on the availability, cost and other terms of mortgage financing facilities, and may be adversely affected by any shortage or increased cost of such financing. Additional or replacement financing might not be available on terms that are favorable or acceptable. Our mortgage banking operations are also dependent upon the securitization market for mortgage-backed securities, and could be materially adversely affected by any fluctuation or downturn in such market.
Our current indebtedness may impact our future operations.
Our existing indebtedness contains restrictive covenants and any future indebtedness may also contain such covenants. These covenants include, or could include, restrictions on our ability to create, incur, assume or guarantee secured debt, enter into sale and leaseback transactions and conditions related to mergers and/or the sale of assets. Substantial losses by us or other action or inaction by us or our subsidiaries could result in the violation of one or more of these covenants, which could result in decreased liquidity or a default on our current or future indebtedness, thereby having a material adverse effect on our sales, profitability, stock performance, ability to service our debt obligations and future cash flows.
Government regulations and environmental matters could negatively affect our operations.
We are subject to various local, state and federal statutes, ordinances, rules and regulations concerning zoning, building design, construction and similar matters, including local regulations that impose restrictive zoning and density requirements in order to limit the number of homes that can eventually be built within the boundaries of a particular area. These regulations may further increase the cost to produce and market our products. In addition, we have from time to time been subject to, and may also be subject in the future to, periodic delays in our homebuilding projects due to building moratoriums in the areas in which we operate or delays in receiving the necessary governmental approvals. Changes in regulations that restrict homebuilding activities in one or more of our principal markets could have a material adverse effect on our sales, profitability, stock performance, ability to service our debt obligations and future cash flows.
In addition, new housing developments are often subject to various assessments or impact fees for schools, parks, streets, highways and other public improvements. The cost of these assessments is subject to substantial change and could cause increases in the construction cost of our homes, which, in turn, could reduce our profitability.
We are also subject to a variety of local, state and federal statutes, ordinances, rules and regulations concerning the protection of health and the environment. We are subject to a variety of environmental conditions that can affect our business and our homebuilding projects. The particular environmental laws that apply to any given homebuilding site vary greatly according to the location and environmental condition of the site and the present and former uses of the site and adjoining properties. Environmental laws and conditions may result in delays, cause us to incur substantial compliance and other costs, or prohibit or severely restrict homebuilding activity in certain environmentally sensitive regions or areas, thereby adversely affecting our sales, profitability, stock performance, ability to service our debt obligations and future cash flows.
Increased regulation of the mortgage industry could harm our future sales and earnings.
The mortgage industry remains under intense scrutiny and continues to face increasing regulation at the federal, state and local level. Potential changes to federal laws and regulations could have the effect of limiting the activities of FNMA and FHLMC, the entities that provide liquidity to the secondary mortgage market, which could lead to increases in mortgage interest rates. Tighter
6
underwriting requirements and fee restrictions and the increasingly complex regulatory environment may negatively impact our mortgage loan origination business in the form of lower demand, decreased revenue and increased operating costs.
We are an approved seller/servicer of FNMA and FHLMC mortgage loans and an approved seller/issuer of GNMA, VA and FHA mortgage loans, and are subject to all of those agencies’ rules and regulations. Any significant impairment of our eligibility to sell/service these loans could have a material adverse impact on our mortgage operations. In addition, we are subject to regulation at the state and federal level with respect to specific origination, selling and servicing practices including the Real Estate Settlement and Protection Act. Adverse changes in governmental regulation may have a negative impact on our mortgage loan origination business.
We face competition in our homebuilding and mortgage banking operations.
The homebuilding industry is highly competitive. We compete with numerous homebuilders of varying size, ranging from local to national in scope, some of whom have greater financial resources than we do. We face competition:
|
•
|
for suitable and desirable lots at acceptable prices;
|
|
•
|
from selling incentives offered by competing builders within and across developments; and
|
|
•
|
from the existing home resale market.
|
Our homebuilding operations compete primarily on the basis of price, location, design, quality, service and reputation.
The mortgage banking industry is also competitive. Our main competition comes from national, regional and local mortgage bankers, credit unions, banks and mortgage brokers in each of these markets. Our mortgage banking operations compete primarily on the basis of customer service, variety of products offered, interest rates offered, prices of ancillary services and relative financing availability and costs.
We might not be able to continue to compete successfully in our homebuilding or mortgage banking operations. An inability to effectively compete may have an adverse impact on our sales, profitability, stock performance, ability to service our debt obligations and future cash flows.
A shortage of building materials or labor, or increases in materials or labor costs may adversely impact our operations.
The homebuilding business has from time to time experienced building material and labor shortages, including fluctuating lumber prices and supply. In addition, strong construction market conditions could restrict the labor force available to our subcontractors and us in one or more of our markets. Significant increases in costs resulting from these shortages, or delays in construction of homes, could have a material adverse effect on our sales, profitability, stock performance, ability to service our debt obligations and future cash flows.
We rely on subcontractors to construct our homes. The failure of our subcontractors to properly construct our homes may be costly.
We engage subcontractors to perform the actual construction of our homes. Despite our quality control efforts, we may discover that our subcontractors have engaged in improper construction practices. The occurrence of such events could require us to repair the homes in accordance with our standards and as required by law. The cost of satisfying our legal obligations in these instances may be significant, and we may be unable to recover the cost of repair from subcontractors, suppliers and insurers.
Product liability litigation and warranty claims may adversely impact our operations.
Construction defect and home warranty claims are common and can represent a substantial risk for the homebuilding industry. The cost of insuring against construction defect and product liability claims, as well as the claims themselves, can be high. In addition, insurance companies limit coverage offered to protect against these claims. Further restrictions on coverage availability, or significant increases in premium costs or claims, could have a material adverse effect on our financial results.
We are subject to litigation proceedings that could harm our business if an unfavorable ruling were to occur.
From time to time, we are involved in litigation and other legal proceedings relating to claims arising from our operations in the normal course of business. As described in, but not limited to, Item 3, “Legal Proceedings” of this Form 10-K, we are currently subject to certain legal proceedings. Litigation is subject to inherent uncertainties, and unfavorable rulings may occur. These or other litigation or legal proceedings could materially affect our ability to conduct our business in the manner that we expect or otherwise adversely affect us should an unfavorable ruling occur.
The loss of key personnel could adversely impact our business.
We rely on our key personnel to effectively operate and manage our business. Specifically, our future success depends heavily on the performance of our senior management team. Our business may be adversely affected if we are unable to retain key personnel or attract qualified personnel to manage our business.
7
Our failure to maintain the security of our electronic and other confidential information could expose us to liability and materially adversely affect our financial condition and results of operations.
Privacy, security, and compliance concerns have continued to increase as technology has evolved. As part of our normal business activities, we collect and store certain confidential information, including personal information of homebuyers/borrowers and information about employees, vendors and suppliers. This information is entitled to protection under a number of federal and state laws. We may share some of this information with vendors who assist us with certain aspects of our business, particularly our mortgage and title businesses. We have implemented systems and processes intended to secure our information technology systems and prevent unauthorized access to or loss of sensitive, confidential and personal data, including through the use of encryption and authentication technologies. Additionally, we have increased our monitoring capabilities to enhance early detection and rapid response to potential security anomalies. These security measures may not be sufficient for all possible occurrences and may be vulnerable to hacking, employee error, malfeasance, system error, faulty password management or other irregularities. Further, development and maintenance of these measures are costly and require ongoing monitoring and updating as technologies change and efforts to overcome security measures become increasingly sophisticated. Our failure to maintain the security of the data we are required to protect, including via the penetration of our network security and the misappropriation of confidential and personal information, could result in business disruption, damage to our reputation, financial obligations to third parties, fines, penalties, regulatory proceedings and private litigation with potentially large costs, and also in deterioration in customers’ confidence in us and other competitive disadvantages, and thus could have a material adverse effect on our sales, profitability, stock performance, ability to service our debt obligations and future cash flows.
Weather-related and other events beyond our control may adversely impact our operations.
Extreme weather or other events, such as significant snowfalls, hurricanes, tornadoes, earthquakes, forest fires, floods, terrorist attacks or war may affect our markets, our operations and our profitability. These events may impact our physical facilities or those of our suppliers or subcontractors and our housing inventories, causing us material increases in costs, or delays in construction of homes, which could have a material adverse effect upon our sales, profitability, stock performance, ability to service our debt obligations and future cash flows.
Item 1B. Unresolved Staff Comments.
None.
Item 2. Properties.
Our corporate offices are located in Reston, Virginia, where we currently lease approximately 61,000 square feet of office space. The current corporate office lease expires in April 2026.
In connection with the operation of the homebuilding segment, we lease production facilities in the following six locations: Thurmont, Maryland; Burlington County, New Jersey; Farmington, New York; Kings Mountain, North Carolina; Darlington, Pennsylvania; and Portland, Tennessee. These facilities range in size from approximately 40,000 square feet to 400,000 square feet and total approximately one million square feet. Each of these leases contains various options for extensions of the lease and for the purchase of the facility. These leases currently expire between 2019 and 2025. During 2018 we entered into a lease agreement for a new production facility in Richmond, Virginia of approximately 130,000 square feet. The lease has a term of 20 years from the commencement date which is expected to be in the second quarter of 2019. The lease contains an option for extension and for the purchase of the facility. In addition, we own a production facility of approximately 100,000 square feet in Dayton, Ohio. Our plant utilization was 52% and 47% of total capacity in 2018 and 2017, respectively.
In connection with both our homebuilding and mortgage banking businesses, we also lease office space in multiple locations for homebuilding divisional offices and mortgage banking and title services branches under leases expiring at various times through 2025, none of which are individually material to our business.
We anticipate that, upon expiration of existing production facility and office leases, we will be able to renew them or obtain comparable facilities on terms acceptable to us.
Item 3. Legal Proceedings.
We are involved in various litigation matters arising in the ordinary course of business. In the opinion of management, and based on advice of legal counsel, these matters are not expected to have a material adverse effect on our financial position, results of operations or cash flows. Legal costs incurred in connection with outstanding litigation matters are expensed as incurred.
Item 4. Mine Safety Disclosures.
Not applicable.
8
PART II
Item 5. Market for Registrant’s Common Equity, Related Stockholder Matters and Issuer Purchases of Equity Securities.
(dollars in thousands, except per share data)
Our shares of common stock are listed and principally traded on the New York Stock Exchange under the trading symbol “NVR.” As of the close of business on February 11, 2019, there were 218 shareholders of record of our common stock.
We have never paid a cash dividend on our shares of common stock and have no current intention to do so in the future.
We had three share repurchase authorizations outstanding during the quarter ended December 31, 2018. On February 14, 2018, August 1, 2018 and December 12, 2018, we publicly announced the Board of Directors’ approval to repurchase our outstanding common stock in one or more open market and/or privately negotiated transactions, up to an aggregate of $300,000 per authorization. The repurchase authorizations do not have expiration dates. The following table provides information regarding common stock repurchases during the quarter ended December 31, 2018:
|
Period
|
Total Number
of Shares
Purchased
|
Average
Price Paid
per Share
|
Total Number of
Shares Purchased
as Part of Publicly
Announced Plans
or Programs
|
Maximum Number
(or Approximate Dollar Value) of
Shares that May Yet
Be Purchased Under
the Plans or
Programs
|
||||||||||
|
October 1 - 31, 2018 (1)
|
8,500
|
|
$
|
2,382.65
|
|
8,500
|
|
$
|
284,070
|
|
||||
|
November 1 - 30, 2018
|
32,909
|
|
$
|
2,361.91
|
|
32,909
|
|
$
|
206,342
|
|
||||
|
December 1 - 31, 2018
|
37,182
|
|
$
|
2,441.61
|
|
37,182
|
|
$
|
415,558
|
|
||||
|
Total
|
78,591
|
|
$
|
2,401.86
|
|
78,591
|
|
|||||||
|
(1)
|
1,707 outstanding shares were repurchased under the February 14, 2018 share repurchase authorization, which fully utilized the authorization. The remaining 6,793 outstanding shares were repurchased under the August 1, 2018 share repurchase authorization.
|
The information required by this item in respect to securities authorized for issuance under equity compensation plans is provided under Item 12 of this annual report on Form 10-K.
9
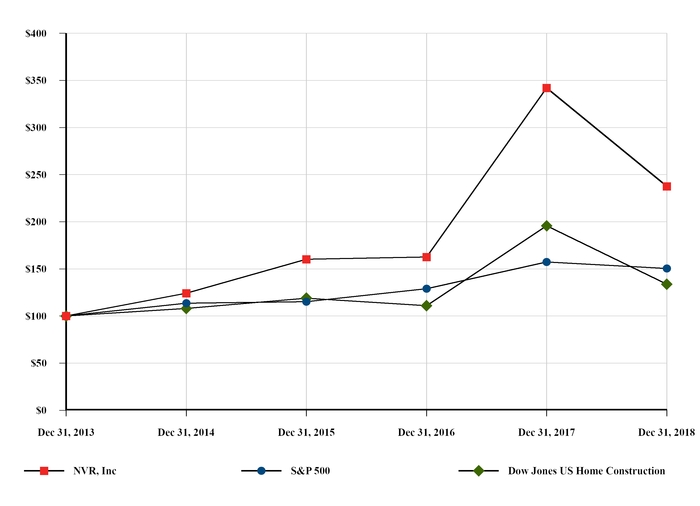
STOCK PERFORMANCE GRAPH
The following graph compares the cumulative total return to holders of our common stock since December 31, 2013 with the Dow Jones US Home Construction Index and the S&P 500 Index for that same period, assuming that $100 was invested in NVR stock and the indices on December 31, 2013.
|
|
For the Year Ended December 31,
|
|||||||||||||||||||||||
|
Comparison of 5 Year Cumulative Total Return
|
2013
|
2014
|
2015
|
2016
|
2017
|
2018
|
||||||||||||||||||
|
NVR, Inc.
|
$
|
100
|
|
$
|
124
|
|
$
|
160
|
|
$
|
163
|
|
$
|
342
|
|
$
|
238
|
|
||||||
|
S&P 500
|
$
|
100
|
|
$
|
114
|
|
$
|
115
|
|
$
|
129
|
|
$
|
157
|
|
$
|
150
|
|
||||||
|
Dow Jones US Home Construction
|
$
|
100
|
|
$
|
108
|
|
$
|
119
|
|
$
|
111
|
|
$
|
196
|
|
$
|
134
|
|
||||||
10
Item 6. Selected Financial Data.
(in thousands, except per share amounts)
The following tables set forth selected consolidated financial data. The selected income statement and balance sheet data have been derived from our consolidated financial statements for each of the periods presented and are not necessarily indicative of results of future operations. The selected financial data should be read in conjunction with, and are qualified in their entirety by, the accompanying consolidated financial statements and related notes included herein.
|
|
Year Ended December 31,
|
|||||||||||||||||||
|
|
2018
|
2017
|
2016
|
2015
|
2014
|
|||||||||||||||
|
Consolidated income statement data:
|
||||||||||||||||||||
|
Homebuilding data:
|
||||||||||||||||||||
|
Revenues
|
$
|
7,004,304
|
|
$
|
6,175,521
|
|
$
|
5,709,223
|
|
$
|
5,065,200
|
|
$
|
4,375,059
|
|
|||||
|
Gross profit
|
$
|
1,312,177
|
|
$
|
1,185,143
|
|
$
|
1,001,362
|
|
$
|
946,418
|
|
$
|
806,473
|
|
|||||
|
Homebuilding income
|
$
|
871,106
|
|
$
|
776,370
|
|
$
|
601,102
|
|
$
|
555,329
|
|
$
|
427,884
|
|
|||||
|
Mortgage Banking data:
|
||||||||||||||||||||
|
Mortgage banking fees
|
$
|
159,370
|
|
$
|
130,319
|
|
$
|
113,321
|
|
$
|
93,808
|
|
$
|
69,509
|
|
|||||
|
Mortgage banking income
|
$
|
88,626
|
|
$
|
70,541
|
|
$
|
60,595
|
|
$
|
47,883
|
|
$
|
25,662
|
|
|||||
|
Consolidated data:
|
||||||||||||||||||||
|
Net income
|
$
|
797,197
|
|
$
|
537,521
|
|
$
|
425,262
|
|
$
|
382,927
|
|
$
|
281,630
|
|
|||||
|
Earnings per share:
|
||||||||||||||||||||
|
Basic
|
$
|
219.58
|
|
$
|
144.00
|
|
$
|
110.53
|
|
$
|
95.21
|
|
$
|
65.83
|
|
|||||
|
Diluted
|
$
|
194.80
|
|
$
|
126.77
|
|
$
|
103.61
|
|
$
|
89.99
|
|
$
|
63.50
|
|
|||||
|
Weighted average number of shares outstanding:
|
||||||||||||||||||||
|
Basic
|
3,631
|
|
3,733
|
|
3,847
|
|
4,022
|
|
4,278
|
|
||||||||||
|
Diluted
|
4,092
|
|
4,240
|
|
4,104
|
|
4,255
|
|
4,435
|
|
||||||||||
|
December 31,
|
||||||||||||||||||||
|
2018
|
2017
|
2016
|
2015
|
2014
|
||||||||||||||||
|
Consolidated balance sheet data:
|
||||||||||||||||||||
|
Homebuilding inventory
|
$
|
1,253,110
|
|
$
|
1,246,199
|
|
$
|
1,092,100
|
|
$
|
1,006,526
|
|
$
|
869,486
|
|
|||||
|
Contract land deposits, net
|
$
|
396,177
|
|
$
|
370,429
|
|
$
|
379,844
|
|
$
|
343,295
|
|
$
|
294,676
|
|
|||||
|
Total assets
|
$
|
3,165,933
|
|
$
|
2,989,279
|
|
$
|
2,643,943
|
|
$
|
2,511,718
|
|
$
|
2,347,413
|
|
|||||
|
Notes and loans payable (1)
|
$
|
597,681
|
|
$
|
597,066
|
|
$
|
596,455
|
|
$
|
595,847
|
|
$
|
595,244
|
|
|||||
|
Shareholders’ equity
|
$
|
1,808,562
|
|
$
|
1,605,492
|
|
$
|
1,304,441
|
|
$
|
1,239,165
|
|
$
|
1,124,255
|
|
|||||
|
Cash dividends per share
|
$
|
—
|
|
$
|
—
|
|
$
|
—
|
|
$
|
—
|
|
$
|
—
|
|
|||||
____________________________
|
(1)
|
Balance does not include non-recourse debt related to the consolidated variable interest entity.
|
11
Item 7. Management’s Discussion and Analysis of Financial Condition and Results of Operations.
(dollars in thousands, except per share data)
Results of Operations for the Years Ended
December 31, 2018
,
2017
and
2016
Overview
Business
Our primary business is the construction and sale of single-family detached homes, townhomes and condominium buildings, all of which are primarily constructed on a pre-sold basis. To fully serve customers of our homebuilding operations, we also operate a mortgage banking and title services business. We primarily conduct our operations in mature markets. Additionally, we generally grow our business through market share gains in our existing markets and by expanding into markets contiguous to our current active markets. Our four homebuilding reportable segments consist of the following regions:
|
Mid Atlantic:
|
|
Maryland, Virginia, West Virginia, Delaware and Washington, D.C.
|
|
North East:
|
|
New Jersey and Eastern Pennsylvania
|
|
Mid East:
|
|
New York, Ohio, Western Pennsylvania, Indiana and Illinois
|
|
South East:
|
|
North Carolina, South Carolina, Florida and Tennessee
|
Our lot acquisition strategy is predicated upon avoiding the financial requirements and risks associated with direct land ownership and development. We generally do not engage in land development (see discussion below of our land development activities). Instead, we typically acquire finished lots at market prices from various third party land developers pursuant to Lot Purchase Agreements. These Lot Purchase Agreements require deposits, typically ranging up to 10% of the aggregate purchase price of the finished lots, in the form of cash or letters of credit that may be forfeited if we fail to perform under the Lot Purchase Agreement. This strategy has allowed us to maximize inventory turnover, which we believe enables us to minimize market risk and to operate with less capital, thereby enhancing rates of return on equity and total capital.
In addition to constructing homes primarily on a pre-sold basis and utilizing what we believe is a conservative lot acquisition strategy, we focus on obtaining and maintaining a leading market position in each market we serve. This strategy allows us to gain valuable efficiencies and competitive advantages in our markets, which we believe contributes to minimizing the adverse effects of regional economic cycles and provides growth opportunities within these markets. Our continued success is contingent upon our ability to control an adequate supply of finished lots on which to build.
In limited specific strategic circumstances, we deviate from our historical lot acquisition strategy and engage in joint venture arrangements with land developers or directly acquire raw ground already zoned for its intended use for development. Once we acquire control of raw ground, we determine whether to sell the raw parcel to a developer and enter into a Lot Purchase Agreement with the developer to purchase the finished lots or to hire a developer to develop the land on our behalf. While joint venture arrangements and direct land development activity are not our preferred method of acquiring finished building lots, we may enter into additional transactions in the future on a limited basis where there exists a compelling strategic or prudent financial reason to do so. We expect, however, to continue to acquire substantially all of our finished lot inventory using Lot Purchase Agreements with forfeitable deposits.
As of
December 31, 2018
, we controlled lots as described below.
Lot Purchase Agreements
We controlled approximately
95,750
lots under Lot Purchase Agreements with third parties through deposits in cash and letters of credit totaling approximately
$420,900
and
$3,800
, respectively. Included in the number of controlled lots are approximately 4,250 lots for which we have recorded a contract land deposit impairment reserve of approximately $29,200 as of
December 31, 2018
.
Joint Venture Limited Liability Corporations (“JVs”)
We had an aggregate investment totaling approximately
$29,400
in
six
JVs, expected to produce approximately
6,800
lots. Of the lots to be produced by the JVs, approximately
3,450
lots were controlled by us and approximately
3,350
lots were either under contract with unrelated parties or currently not under contract.
Land Under Development
We directly owned three separate raw land parcels, zoned for their intended use, with a current cost basis, including development costs, of approximately
$38,900
that we intend to develop into approximately
500
finished lots. We had additional funding commitments of approximately
$7,300
under a joint development agreement related to one parcel, a portion of which we expect will be offset by development credits of approximately
$4,600
.
See Notes 3, 4 and 5 to the consolidated financial statements included herein for additional information regarding Lot Purchase Agreements, JVs and land under development, respectively.
12
Raw Land Purchase Agreements
In addition to the lots we currently control as discussed above, we have certain properties under contract with land owners that are expected to yield approximately
7,500
lots. Some of these properties may require rezoning or other approvals to achieve the expected yield. These properties are controlled with cash deposits and letters of credit totaling approximately
$4,500
and
$150
, respectively, as of
December 31, 2018
, of which approximately
$1,700
is refundable if we do not perform under the contract. We generally expect to assign the raw land contracts to a land developer and simultaneously enter into a Lot Purchase Agreement with the assignee if the project is determined to be feasible.
Current Business Environment and Key Financial Results
During
2018
, general market conditions were favorably impacted by low unemployment and improved consumer confidence, leading to strong demand for new homes in the first half of 2018. However, during the second half of the year, demand for new homes softened due to affordability issues in part attributable to rising interest rates and some market uncertainty. We expect to experience pricing and sales pressure in future quarters due to higher interest rates and a competitive market environment, which includes rising new home inventory levels.
Our consolidated revenues for the year ended
December 31, 2018
totaled
$7,163,674
, an increase of 14% from
$6,305,840
in
2017
. Our net income for
2018
was
$797,197
, or
$194.80
per diluted share, increases of 48% and 54% compared to
2017
net income and diluted earnings per share, respectively. Our homebuilding gross profit margin percentage decreased to 18.7% in
2018
from 19.2% in
2017
. New orders, net of cancellations (“New Orders”) during
2018
were 18,281, an increase of 4% from
2017
while our average New Order sales price decreased 2% to $376.3 in
2018
. Our backlog of homes sold but not yet settled with the customer as of
December 31, 2018
decreased on a unit basis by 2% to 8,365 units and decreased on a dollar basis by 4% to $3,152,873 when compared to
December 31, 2017
.
We believe that the strength in demand for new homes is dependent upon sustained economic growth, driven by favorable unemployment levels and continued improvements in wage growth and household formation. We expect to continue to face gross profit margin pressure which will be impacted by modest pricing power and our ability to manage land and construction costs. We also expect to face pressure on mortgage banking profit due to the competitive pricing pressures in the mortgage market. We believe that we are well positioned to take advantage of opportunities that may arise from future economic and homebuilding market volatility due to the strength of our balance sheet.
Homebuilding Operations
The following table summarizes the results of our consolidated homebuilding operations and certain operating activity for each of the last three years:
|
|
Year Ended December 31,
|
|||||||||||
|
|
2018
|
2017
|
2016
|
|||||||||
|
Financial data:
|
||||||||||||
|
Revenues
|
$
|
7,004,304
|
|
$
|
6,175,521
|
|
$
|
5,709,223
|
|
|||
|
Cost of sales
|
$
|
5,692,127
|
|
$
|
4,990,378
|
|
$
|
4,707,861
|
|
|||
|
Gross profit margin percentage
|
18.7
|
%
|
19.2
|
%
|
17.5
|
%
|
||||||
|
Selling, general and administrative expenses
|
$
|
428,874
|
|
$
|
392,272
|
|
$
|
382,459
|
|
|||
|
Operating data:
|
||||||||||||
|
New orders (units)
|
18,281
|
|
17,608
|
|
15,583
|
|
||||||
|
Average new order price
|
$
|
376.3
|
|
$
|
383.2
|
|
$
|
386.4
|
|
|||
|
Settlements (units)
|
18,447
|
|
15,961
|
|
14,928
|
|
||||||
|
Average settlement price
|
$
|
379.7
|
|
$
|
386.9
|
|
$
|
381.2
|
|
|||
|
Backlog (units)
|
8,365
|
|
8,531
|
|
6,884
|
|
||||||
|
Average backlog price
|
$
|
376.9
|
|
$
|
384.2
|
|
$
|
392.8
|
|
|||
|
New order cancellation rate
|
14.5
|
%
|
14.0
|
%
|
15.5
|
%
|
||||||
Consolidated Homebuilding
2018
versus
2017
Homebuilding revenues increased
13%
in
2018
compared to
2017
, as a result of a
16%
increase in the number of units settled, offset by a 2% decrease in the average settlement price year over year. The increase in the number of units settled was primarily attributable to a 24% higher backlog unit balance entering
2018
compared to the backlog unit balance entering
2017
, offset partially by a lower backlog turnover rate year over year. The decrease in the average settlement price was attributable to a 2% lower average
13
price of units in backlog entering 2018 compared to the same period in 2017 and to a 2% decrease in the average sales price of New Orders in the first six months of 2018 compared to the same period in 2017.
Gross profit margin percentage in
2018
decreased to
18.7%
from
19.2%
in
2017
, due primarily
to higher lot and certain material costs.
The number of New Orders increased
4%
while the average sales price of New Orders decreased
2%
in
2018
when compared to
2017
. New Orders increased primarily due to more favorable market conditions in the first half of
2018
compared to the same period in
2017
, which led to higher community absorption rates year over year. New home demand began to soften in the second half of 2018 due to affordability issues in part attributable to rising mortgage interest rates, which led to lower sales in each of our reporting segments in the fourth quarter of 2018 compared to the fourth quarter of 2017 and an overall decrease in New Orders of 11% quarter over quarter. The decrease in the average sales price of New Orders was attributable to a relative shift in New Orders to lower price product and lower price markets.
Selling, general and administrative ("SG&A") expenses in
2018
increased by
9%
compared to
2017
, primarily due to an approximate $28,600 increase in equity-based compensation due to the equity grants in the second quarter of 2018, as further discussed in Note 12 in the accompanying consolidated financial statements, and an increase in personnel costs. SG&A expenses as a percentage of revenue decreased to
6.1%
in
2018
from
6.4%
in
2017
, primarily due to the
13%
increase in revenues.
Backlog units and dollars were
8,365
units and $3,152,873, respectively, as of
December 31, 2018
compared to
8,531
units and $3,277,888, respectively, as of December 31, 2017. The
2%
decrease in backlog units and dollars was primarily attributable to a 4% decrease in New Orders and a 2% decrease in the average New Order sales price for the six-month period ended
December 31, 2018
compared to the same period in
2017
.
Backlog may be impacted by customer cancellations for various reasons that are beyond our control, such as failure to obtain mortgage financing, inability to sell an existing home, job loss, or a variety of other reasons. In any period, a portion of the cancellations that we experience are related to New Orders that occurred during the same period, and a portion are related to New Orders that occurred in prior periods and therefore appeared in the beginning backlog for the current period. Expressed as the total of all cancellations during the period as a percentage of gross New Orders during the period, our cancellation rate was approximately
15%
in
2018
, approximately
14%
in
2017
, and approximately
15%
in
2016
. Additionally, approximately 5% in
2018
and 6% in each
2017
and
2016
, of a reporting quarter’s opening backlog cancelled during the quarter. We can provide no assurance that our historical cancellation rates are indicative of the actual cancellation rate that may occur in future years. Other than those units that are cancelled, we expect to settle substantially all of our
December 31, 2018
backlog during 2019. See “Risk Factors” in Item 1A of this Form 10-K.
The backlog turnover rate is impacted by various factors, including, but not limited to, changes in New Order activity, internal production capacity, external subcontractor capacity and other external factors over which we do not exercise control.
2017 versus 2016
Homebuilding revenues increased 8% in 2017 compared to 2016, primarily as a result of a 7% increase in the number of units settled year over year. The increase in the number of units settled was primarily attributable to an 11% higher backlog unit balance entering 2017 compared to the backlog unit balance entering 2016, offset partially by a lower backlog turnover rate year over year.
Gross profit margin percentage in 2017 increased to 19.2% from 17.5% in 2016, due primarily to modest improvement in pricing, moderating construction costs and the increase in the number of units settled, which allowed us to better leverage certain operating costs.
The number of New Orders increased 13% while the average sales price of New Orders decreased 1% in 2017 when compared to 2016. New Orders increased in each of our market segments due to more favorable market conditions in 2017 compared to 2016, which led to higher community absorption rates year over year.
SG&A expenses in 2017 increased by 3% compared to 2016, but as a percentage of revenue decreased to 6.4% in 2017 from 6.7% in 2016. SG&A expenses as a percentage of revenue were favorably impacted by the 8% increase in revenues.
Backlog units and dollars were 8,531 units and $3,277,888, respectively, as of December 31, 2017 compared to 6,884 units and $2,704,277, respectively, as of December 31, 2016. The 24% increase in backlog units was primarily attributable to a 19% increase in New Orders for the six-month period ended December 31, 2017 compared to the same period in 2016. Backlog dollars were favorably impacted by the increase in backlog units.
Reportable Homebuilding Segments
Homebuilding profit before tax includes all revenues and income generated from the sale of homes, less the cost of homes sold, SG&A expenses, and a corporate capital allocation charge determined by corporate management. The corporate capital allocation charge eliminates in consolidation and is based on the segment’s average net assets employed. The corporate capital allocation charged to the operating segment allows the Chief Operating Decision Maker to determine whether the operating segment’s results are providing the desired rate of return after covering our cost of capital.
14
We record charges on contract land deposits when we determine that it is probable that recovery of the deposit is impaired. For segment reporting purposes, impairments on contract land deposits are generally charged to the operating segment upon the termination of a Lot Purchase Agreement with the developer or the restructuring of a Lot Purchase Agreement resulting in the forfeiture of the deposit. For presentation purposes below, the contract land deposit reserve at December 31, 2018 and 2017 has been allocated to the reportable segments for the respective years to show contract land deposits on a net basis. The net contract land deposit balances below also include approximately $3,900 and $2,000 at December 31, 2018 and 2017, respectively, of letters of credit issued as deposits in lieu of cash.
The following tables summarize certain homebuilding operating activity by reportable segment for each of the last three years:
Selected Segment Financial Data:
|
|
Year Ended December 31,
|
|||||||||||
|
|
2018
|
2017
|
2016
|
|||||||||
|
Revenues:
|
||||||||||||
|
Mid Atlantic
|
$
|
3,893,358
|
|
$
|
3,543,687
|
|
$
|
3,319,776
|
|
|||
|
North East
|
580,726
|
|
517,141
|
|
462,385
|
|
||||||
|
Mid East
|
1,455,834
|
|
1,250,165
|
|
1,192,472
|
|
||||||
|
South East
|
1,074,386
|
|
864,528
|
|
734,590
|
|
||||||
|
|
Year Ended December 31,
|
|||||||||||
|
|
2018
|
2017
|
2016
|
|||||||||
|
Gross profit margin:
|
||||||||||||
|
Mid Atlantic
|
$
|
726,655
|
|
$
|
663,650
|
|
$
|
561,857
|
|
|||
|
North East
|
115,169
|
|
104,501
|
|
68,808
|
|
||||||
|
Mid East
|
279,050
|
|
244,832
|
|
215,335
|
|
||||||
|
South East
|
211,870
|
|
173,961
|
|
137,787
|
|
||||||
|
|
Year Ended December 31,
|
||||||||
|
|
2018
|
2017
|
2016
|
||||||
|
Gross profit margin percentage:
|
|||||||||
|
Mid Atlantic
|
18.7
|
%
|
18.7
|
%
|
16.9
|
%
|
|||
|
North East
|
19.8
|
%
|
20.2
|
%
|
14.9
|
%
|
|||
|
Mid East
|
19.2
|
%
|
19.6
|
%
|
18.1
|
%
|
|||
|
South East
|
19.7
|
%
|
20.1
|
%
|
18.8
|
%
|
|||
|
|
Year Ended December 31,
|
|||||||||||
|
|
2018
|
2017
|
2016
|
|||||||||
|
Segment profit:
|
||||||||||||
|
Mid Atlantic
|
$
|
462,178
|
|
$
|
398,494
|
|
$
|
301,173
|
|
|||
|
North East
|
69,789
|
|
60,218
|
|
21,947
|
|
||||||
|
Mid East
|
175,134
|
|
149,639
|
|
121,166
|
|
||||||
|
South East
|
118,296
|
|
95,826
|
|
71,098
|
|
||||||
15
Segment Operating Activity:
|
|
Year Ended December 31,
|
||||||||||||||||||||
|
|
2018
|
2017
|
2016
|
||||||||||||||||||
|
|
Units
|
Average
Price
|
Units
|
Average
Price
|
Units
|
Average
Price
|
|||||||||||||||
|
New orders, net of cancellations:
|
|
|
|
|
|
||||||||||||||||
|
Mid Atlantic
|
8,906
|
|
$
|
429.4
|
|
8,654
|
|
$
|
438.9
|
|
7,916
|
|
$
|
443.1
|
|
||||||
|
North East
|
1,296
|
|
$
|
400.4
|
|
1,362
|
|
$
|
409.7
|
|
1,314
|
|
$
|
387.1
|
|
||||||
|
Mid East
|
4,314
|
|
$
|
328.0
|
|
4,171
|
|
$
|
332.7
|
|
3,659
|
|
$
|
329.2
|
|
||||||
|
South East
|
3,765
|
|
$
|
297.7
|
|
3,421
|
|
$
|
293.5
|
|
2,694
|
|
$
|
296.9
|
|
||||||
|
Total
|
18,281
|
|
$
|
376.3
|
|
17,608
|
|
$
|
383.2
|
|
15,583
|
|
$
|
386.4
|
|
||||||
|
|
Year Ended December 31,
|
||||||||||||||||||||
|
|
2018
|
2017
|
2016
|
||||||||||||||||||
|
|
Units
|
Average
Price
|
Units
|
Average
Price
|
Units
|
Average
Price
|
|||||||||||||||
|
Settlements:
|
|
|
|
|
|
|
|||||||||||||||
|
Mid Atlantic
|
8,982
|
|
$
|
433.4
|
|
7,971
|
|
$
|
444.5
|
|
7,512
|
|
$
|
439.6
|
|
||||||
|
North East
|
1,415
|
|
$
|
410.4
|
|
1,288
|
|
$
|
401.5
|
|
1,246
|
|
$
|
371.1
|
|
||||||
|
Mid East
|
4,406
|
|
$
|
330.4
|
|
3,772
|
|
$
|
331.4
|
|
3,658
|
|
$
|
325.7
|
|
||||||
|
South East
|
3,644
|
|
$
|
294.8
|
|
2,930
|
|
$
|
295.1
|
|
2,512
|
|
$
|
292.4
|
|
||||||
|
Total
|
18,447
|
|
$
|
379.7
|
|
15,961
|
|
$
|
386.9
|
|
14,928
|
|
$
|
381.2
|
|
||||||
|
|
Year Ended December 31,
|
||||||||||||||||||||
|
|
2018
|
2017
|
2016
|
||||||||||||||||||
|
|
Units
|
Average
Price
|
Units
|
Average
Price
|
Units
|
Average
Price
|
|||||||||||||||
|
Backlog:
|
|
|
|
|
|
|
|||||||||||||||
|
Mid Atlantic
|
4,148
|
|
$
|
423.4
|
|
4,224
|
|
$
|
432.2
|
|
3,541
|
|
$
|
443.4
|
|
||||||
|
North East
|
563
|
|
$
|
404.1
|
|
682
|
|
$
|
424.3
|
|
608
|
|
$
|
408.7
|
|
||||||
|
Mid East
|
1,806
|
|
$
|
336.2
|
|
1,898
|
|
$
|
341.2
|
|
1,499
|
|
$
|
340.1
|
|
||||||
|
South East
|
1,848
|
|
$
|
304.1
|
|
1,727
|
|
$
|
298.4
|
|
1,236
|
|
$
|
304.1
|
|
||||||
|
Total
|
8,365
|
|
$
|
376.9
|
|
8,531
|
|
$
|
384.2
|
|
6,884
|
|
$
|
392.8
|
|
||||||
Operating Data:
|
|
Year Ended December 31,
|
||||||||
|
|
2018
|
2017
|
2016
|
||||||
|
New order cancellation rate:
|
|||||||||
|
Mid Atlantic
|
15.2
|
%
|
15.2
|
%
|
15.7
|
%
|
|||
|
North East
|
12.5
|
%
|
13.3
|
%
|
15.1
|
%
|
|||
|
Mid East
|
12.9
|
%
|
11.5
|
%
|
14.4
|
%
|
|||
|
South East
|
15.5
|
%
|
14.3
|
%
|
16.5
|
%
|
|||
|
|
Year Ended December 31,
|
||||||||
|
|
2018
|
2017
|
2016
|
||||||
|
Average active communities:
|
|||||||||
|
Mid Atlantic
|
234
|
|
238
|
|
239
|
|
|||
|
North East
|
36
|
|
42
|
|
42
|
|
|||
|
Mid East
|
119
|
|
121
|
|
128
|
|
|||
|
South East
|
88
|
|
84
|
|
76
|
|
|||
|
Total
|
477
|
|
485
|
|
485
|
|
|||
16
Homebuilding Inventory:
|
|
As of December 31,
|
|||||||
|
|
2018
|
2017
|
||||||
|
Sold inventory:
|
|
|
||||||
|
Mid Atlantic
|
$
|
622,997
|
|
$
|
617,471
|
|
||
|
North East
|
79,530
|
|
96,412
|
|
||||
|
Mid East
|
195,149
|
|
173,572
|
|
||||
|
South East
|
182,458
|
|
151,219
|
|
||||
|
Total (1)
|
$
|
1,080,134
|
|
$
|
1,038,674
|
|
||
|
|
As of December 31,
|
|||||||
|
|
2018
|
2017
|
||||||
|
Unsold lots and housing units inventory:
|
||||||||
|
Mid Atlantic
|
$
|
74,689
|
|
$
|
118,209
|
|
||
|
North East
|
11,088
|
|
6,666
|
|
||||
|
Mid East
|
9,045
|
|
7,112
|
|
||||
|
South East
|
20,611
|
|
13,511
|
|
||||
|
Total (1)
|
$
|
115,433
|
|
$
|
145,498
|
|
||
|
(1)
|
Total segment inventory differs from consolidated inventory due to certain consolidation adjustments necessary to convert the reportable segments’ results, which are predominantly maintained on a cash basis, to a full accrual basis for external financial statement presentation purposes. These consolidation adjustments are not allocated to our operating segments.
|
Lots Controlled and Land Deposits:
|
As of December 31,
|
||||||
|
2018
|
2017
|
|||||
|
Total lots controlled:
|
||||||
|
Mid Atlantic
|
40,350
|
|
38,450
|
|
||
|
North East
|
8,950
|
|
7,000
|
|
||
|
Mid East
|
24,350
|
|
22,250
|
|
||
|
South East
|
26,050
|
|
21,000
|
|
||
|
Total
|
99,700
|
|
88,700
|
|
||
|
As of December 31,
|
||||||||
|
2018
|
2017
|
|||||||
|
Contract land deposits, net:
|
||||||||
|
Mid Atlantic
|
$
|
199,917
|
|
$
|
209,759
|
|
||
|
North East
|
42,591
|
|
29,851
|
|
||||
|
Mid East
|
52,899
|
|
49,838
|
|
||||
|
South East
|
104,693
|
|
82,977
|
|
||||
|
Total
|
$
|
400,100
|
|
$
|
372,425
|
|
||
|
Year Ended December 31,
|
||||||||||||
|
2018
|
2017
|
2016
|
||||||||||
|
Contract land deposit impairments, net:
|
||||||||||||
|
Mid Atlantic
|
$
|
2,743
|
|
$
|
2,945
|
|
$
|
2,240
|
|
|||
|
North East
|
1,033
|
|
290
|
|
3,530
|
|
||||||
|
Mid East
|
211
|
|
11
|
|
303
|
|
||||||
|
South East
|
1,911
|
|
99
|
|
791
|
|
||||||
|
Total
|
$
|
5,898
|
|
$
|
3,345
|
|
$
|
6,864
|
|
|||
17
Mid Atlantic
2018
versus
2017
The Mid Atlantic segment had an approximate $63,700, or 16%, increase in segment profit in 2018 compared to 2017, driven primarily by an increase in segment revenues of approximately $349,700, or 10%, year over year. Segment revenues increased due to a 13% increase in the number of units settled, offset by a 2% decrease in the average settlement price year over year. The increase in the number of units settled is attributable primarily to a 19% higher backlog unit balance entering 2018 compared to the backlog unit balance entering 2017, partially offset by a lower backlog turnover rate year over year. The decrease in the average settlement price was attributable to a 2% lower average price of units in backlog entering 2018 compared to the same period in 2017 and to a 3% decrease in the average sales price of New Orders in the first six months of 2018 compared to the same period in 2017. The Mid Atlantic segment’s gross profit margin percentage remained flat year over year at 18.7%.
Segment New Orders increased 3% while the average sales price of New Orders decreased 2% in 2018 compared to 2017. The increase in New Orders was due primarily to higher sales in the first half of 2018 compared to the same period in 2017, due to more favorable market conditions during that period, which led to higher community absorption rates year over year. The decrease in the average sales price of New Orders is attributable to a shift in New Orders to lower price products and lower price markets.
2017 versus 2016
The Mid Atlantic segment had an approximate $97,300, or 32%, increase in segment profit in 2017 compared to 2016. The increase in segment profit was driven by an increase of segment revenues of approximately $223,900, or 7%, and improved gross profit margins year over year. Segment revenues increased due primarily to a 6% increase in the number of units settled year over year. The increase in the number of units settled was favorably impacted by a 13% higher backlog unit balance entering 2017 compared to the backlog unit balance entering 2016, partially offset by a lower backlog turnover rate. The Mid Atlantic segment’s gross profit margin percentage increased to 18.7% in 2017 from 16.9% in 2016, due primarily to modest improvement in pricing and moderating construction costs.
Segment New Orders increased 9% while the average sales price of New Orders decreased 1% in 2017 compared to 2016. The increase in New Orders was due to more favorable market conditions in 2017, which led to higher community absorption rates year over year. The decrease in the average sales price of New Orders is attributable to a shift in New Orders to lower priced products.
North East
2018
versus
2017
The North East segment had an approximate $9,600, or 16%, increase in segment profit in 2018 compared to 2017, driven primarily by an increase in segment revenues of approximately $63,600, or 12%, year over year. Segment revenues increased due to a 10% increase in the number of units settled and a 2% increase in the average settlement price year over year. The increase in the number of units settled was primarily attributable to a 12% higher backlog unit balance entering 2018 compared to the backlog entering 2017, coupled with a higher backlog turnover rate year over year. The increase in the average settlement price was primarily attributable to a 4% higher average sales price of units in backlog entering 2018 compared to the backlog entering 2017. The North East segment’s gross profit margin percentage decreased to 19.8% in 2018 from 20.2% in 2017, due primarily to higher lot, construction and certain material costs.
Segment New Orders and the average sales price of New Orders decreased 5% and 2%, respectively, in 2018 compared to 2017. New Orders decreased primarily due to a 13% decrease in the average number of active communities year over year. The average sales price of New Orders was negatively impacted primarily by a shift in New Orders to lower priced communities within certain markets.
2017 versus 2016
The North East segment had an approximate $38,300, or 174%, increase in segment profit in 2017 compared to 2016 due to an increase in segment revenues of approximately $54,800, or 12%, and improved gross profit margins year over year. The increase in segment revenues was due to a 3% increase in the number of units settled and an 8% increase in the average settlement price year over year. The increase in the number of units settled was primarily attributable to a 13% higher backlog unit balance entering 2017 compared to the backlog unit balance entering 2016, partially offset by a lower backlog turnover rate year over year. The increase in the average settlement price was attributable to a 9% higher average sales price of units in backlog entering 2017 compared to the same period in 2016, driven by a shift to higher priced markets in the segment and a shift to higher priced communities within certain markets. The North East segment’s gross profit margin percentage increased to 20.2% in 2017 from 14.9% in 2016. Gross profit margin and segment profit were favorably impacted by improvement in pricing, moderating construction costs and the increase in the number of units settled, which allowed us to better leverage certain operating costs.
Segment New Orders and the average sales price of New Orders increased 4% and 6%, respectively, in 2017 compared to 2016. New Orders were favorably impacted by more favorable market conditions in 2017, which led to higher community absorption rates
18
year over year. The increase in the average New Order sales price year over year, was attributable to a shift in New Orders to higher priced markets within the segment and a shift to higher priced communities within certain markets.
Mid East
2018
versus
2017
The Mid East segment had an approximate $25,500, or 17%, increase in segment profit in 2018 compared to 2017, driven primarily by an increase in segment revenues of approximately $205,700, or 16%, year over year. Segment revenues increased due to a 17% increase in the number of units settled year over year, due primarily to a 27% higher backlog unit balance entering 2018 compared to the backlog unit balance entering 2017. The segment’s gross profit margin percentage decreased to 19.2% in 2018 from 19.6% in 2017, primarily due to an increase in lot costs year over year.
Segment New Orders increased 3%, while the average sales price of New Orders decreased 1%, in 2018 compared to 2017. New Orders increased as more favorable market conditions in 2018 led to higher community absorption rates within the segment.
2017 versus 2016
The Mid East segment had an approximate $28,500, or 23%, increase in segment profit in 2017 compared to 2016. The increase in segment profit was driven by an increase of approximately $57,700, or 5%, in revenues and improved gross profit margins year over year. The increase in revenues was due to a 3% increase in the number of units settled and a 2% increase in the average settlement price. The increases in the number of units settled and average settlement price were primarily attributable to an 11% increase in segment New Orders and a 2% increase in the average sales price of New Orders for the first six months of 2017 compared to the same period in 2016. The segment’s gross profit margin percentage increased to 19.6% in 2017 from 18.1% in 2016, primarily due to modest improvement in pricing and moderating construction costs year over year.
Segment New Orders and the average sales price of New Orders increased 14% and 1%, respectively, in 2017 compared to 2016. New Orders increased despite a 5% decrease in the average number of active communities year over year as more favorable market conditions in 2017 led to higher community absorption rates within the segment.
South East
2018
versus
2017
T
he South East segment had an approximate $22,500, or 23%, increase in segment profit in 2018 compared to 2017, driven primarily by an increase in segment revenues of approximately $209,900, or 24%, year over year. Segment revenues increased due to a 24% increase in the number of units settled. The increase in settlements was primarily attributable to a 40% higher backlog unit balance entering 2018 compared to the backlog unit balance entering 2017. The South East segment’s gross profit margin percentage decreased to 19.7% in 2018 from 20.1% in 2017 primarily due to higher lot costs, offset partially by the increase in the number of units settled, which allowed us to better leverage certain operating costs year over year.
Segment New Orders and the average sales price of New Orders increased 10% and 1%, respectively, in 2018 compared to 2017. New Orders increased primarily due to more favorable market conditions in the first half of
2018
compared to the same period in
2017
, which led to higher community absorption rates year over year. Additionally, New Orders were favorably impacted by a 5% increase in the average number of active communities in 2018 compared to 2017.
2017 versus 2016
T
he South East segment had an approximate $24,700, or 35%, increase in segment profit in 2017 compared to 2016. The increase in segment profit was primarily driven by an increase of approximately $129,900, or 18%, in revenues and improved gross profit margins. The increase in revenues was primarily attributable to a 17% increase in the number of units settled. The increase in settlements was attributable to a 17% higher backlog unit balance entering 2017 compared to the backlog unit balance entering 2016. The South East segment’s gross profit margin percentage increased to 20.1% in 2017 from 18.8% in 2016 primarily due to modest improvement in pricing, partially offset by higher construction costs year over year.
Segment New Orders increased 27%, while the average sales price of New Orders decreased 1% in 2017 compared to 2016. New Orders were favorably impacted by a 10% increase in the average number of active communities in 2017 compared to 2016 and more favorable market conditions in 2017, which led to higher community absorption rat
es.
The average sales price of New Orders was negatively impacted by a shift in sales to lower priced markets within the South East segment.
19
Homebuilding Segment Reconciliations to Consolidated Homebuilding Operations
In addition to the corporate capital allocation and contract land deposit impairments discussed above, the other reconciling items between homebuilding segment profit and homebuilding consolidated profit before tax include unallocated corporate overhead (which includes all management incentive compensation), equity-based compensation expense, consolidation adjustments and external corporate interest expense. Our overhead functions, such as accounting, treasury and human resources, are centrally performed and the costs are not allocated to our operating segments. Consolidation adjustments consist of such items to convert the reportable segments’ results, which are predominantly maintained on a cash basis, to a full accrual basis for external financial statement presentation purposes, and are not allocated to our operating segments. External corporate interest expense is primarily comprised of interest charges on our 3.95% Senior Notes due 2022 (the “Senior Notes”), and is not charged to the operating segments because the charges are included in the corporate capital allocation discussed above.
|
|
Year Ended December 31,
|
|||||||||||
|
|
2018
|
2017
|
2016
|
|||||||||
|
Homebuilding consolidated gross profit:
|
||||||||||||
|
Mid Atlantic
|
$
|
726,655
|
|
$
|
663,650
|
|
$
|
561,857
|
|
|||
|
North East
|
115,169
|
|
104,501
|
|
68,808
|
|
||||||
|
Mid East
|
279,050
|
|
244,832
|
|
215,335
|
|
||||||
|
South East
|
211,870
|
|
173,961
|
|
137,787
|
|
||||||
|
Consolidation adjustments and other
|
(20,567
|
)
|
(1,801
|
)
|
17,575
|
|
||||||
|
Homebuilding consolidated gross profit
|
$
|
1,312,177
|
|
$
|
1,185,143
|
|
$
|
1,001,362
|
|
|||
|
|
Year Ended December 31,
|
|||||||||||
|
|
2018
|
2017
|
2016
|
|||||||||
|
Homebuilding consolidated profit before taxes:
|
||||||||||||
|
Mid Atlantic
|
$
|
462,178
|
|
$
|
398,494
|
|
$
|
301,173
|
|
|||
|
North East
|
69,789
|
|
60,218
|
|
21,947
|
|
||||||
|
Mid East
|
175,134
|
|
149,639
|
|
121,166
|
|
||||||
|
South East
|
118,296
|
|
95,826
|
|
71,098
|
|
||||||
|
Reconciling items:
|
||||||||||||
|
Contract land deposit impairment reserve (1)
|
783
|
|
1,307
|
|
10,933
|
|
||||||
|
Equity-based compensation expense (2)
|
(70,865
|
)
|
(41,144
|
)
|
(40,482
|
)
|
||||||
|
Corporate capital allocation (3)
|
213,903
|
|
198,384
|
|
189,992
|
|
||||||
|
Unallocated corporate overhead
|
(89,973
|
)
|
(89,514
|
)
|
(89,376
|
)
|
||||||
|
Consolidation adjustments and other
|
15,829
|
|
26,143
|
|
35,204
|
|
||||||
|
Corporate interest expense
|
(23,968
|
)
|
(22,983
|
)
|
(20,553
|
)
|
||||||
|
Reconciling items sub-total
|
45,709
|
|
72,193
|
|
85,718
|
|
||||||
|
Homebuilding consolidated profit before taxes
|
$
|
871,106
|
|
$
|
776,370
|
|
$
|
601,102
|
|
|||
|
(1)
|
This item represents changes to the contract land deposit impairment reserve, which are not allocated to the reportable segments.
|
|
(2)
|
The increase in equity-based compensation expense for the year ended December 31, 2018 was primarily attributable to equity grants in the second quarter of 2018. See Note 12 in the accompanying consolidated financial statements for additional discussion of equity-based compensation.
|
|
(3)
|
This item represents the elimination of the corporate capital allocation charge included in the respective homebuilding reportable segments. The corporate capital allocation charge is based on the segment’s monthly average asset balance and is as follows for the years presented:
|
|
|
Year Ended December 31,
|
|||||||||||
|
|
2018
|
2017
|
2016
|
|||||||||
|
Corporate capital allocation charge:
|
||||||||||||
|
Mid Atlantic
|
$
|
123,855
|
|
$
|
123,028
|
|
$
|
119,758
|
|
|||
|
North East
|
17,893
|
|
16,115
|
|
18,132
|
|
||||||
|
Mid East
|
35,803
|
|
29,663
|
|
28,303
|
|
||||||
|
South East
|
36,352
|
|
29,578
|
|
23,799
|
|
||||||
|
Total corporate capital allocation charge
|
$
|
213,903
|
|
$
|
198,384
|
|
$
|
189,992
|
|
|||
20
Mortgage Banking Segment
We conduct our mortgage banking activity through NVRM, a wholly owned subsidiary. NVRM focuses almost exclusively on serving the homebuilding segment customer base. The following table summarizes the results of our mortgage banking operations and certain statistical data for each of the last three years:
|
|
Year Ended December 31,
|
|||||||||||
|
|
2018
|
2017
|
2016
|
|||||||||
|
Loan closing volume:
|
|
|
|
|
|
|
||||||
|
Total principal
|
$
|
4,829,406
|
|
$
|
4,229,507
|
|
$
|
3,952,575
|
|
|||
|
Loan volume mix:
|
|
|
|
|
|
|
||||||
|
Adjustable rate mortgages
|
10
|
%
|
9
|
%
|
5
|
%
|
||||||
|
Fixed-rate mortgages
|
90
|
%
|
91
|
%
|
95
|
%
|
||||||
|
Operating profit:
|
|
|
|
|
|
|
||||||
|
Segment profit
|
$
|
93,462
|
|
$
|
73,959
|
|
$
|
63,711
|
|
|||
|
Equity-based compensation expense
|
(4,836
|
)
|
(3,418
|
)
|
(3,116
|
)
|
||||||
|
Mortgage banking income
|
$
|
88,626
|
|
$
|
70,541
|
|
$
|
60,595
|
|
|||
|
Capture rate:
|
88
|
%
|
88
|
%
|
88
|
%
|
||||||
|
Mortgage banking fees:
|
|
|
|
|
|
|
||||||
|
Net gain on sale of loans
|
$
|
122,755
|
|
$
|
99,132
|
|
$
|
85,535
|
|
|||
|
Title services
|
36,001
|
|
30,626
|
|
27,233
|
|
||||||
|
Servicing fees
|
614
|
|
561
|
|
553
|
|
||||||
|
|
$
|
159,370
|
|
$
|
130,319
|
|
$
|
113,321
|
|
|||
2018
versus
2017
Loan closing volume in
2018
increased by approximately $599,900, or 14%, from
2017
. The increase was primarily attributable to a 15% increase in the number of loans closed year over year due primarily to the aforementioned increase in the homebuilding segment’s number of settlements in
2018
as compared to
2017
.
Segment profit in
2018
increased by approximately $19,500, or 26%, from
2017
. The increase in segment profit was primarily attributable to an increase in mortgage banking fees, partially offset by an increase in general and administrative expenses. Mortgage banking fees increased by approximately $29,100, or 22%, resulting from the aforementioned increase in loan closing volume and an increase in secondary marketing gains on sales of loans. General and administrative expenses increased by approximately $13,900, due primarily to an increase in compensation costs as a result of an increase in average headcount compared to
2017
.
2017
versus
2016
Loan closing volume in 2017 increased by approximately $276,900, or 7%, from 2016. The increase was primarily attributable to a 6% increase in the number of loans closed year over year due primarily to an increase in the homebuilding segment’s number of settlements in 2017 as compared to 2016.
Segment profit in 2017 increased by approximately $10,200, or 16%, from 2016. The increase in segment profit was primarily attributable to an increase in mortgage banking fees, partially offset by an increase in general and administrative expenses. Mortgage banking fees increased by approximately $17,000, or 15%, resulting from an increase in loan closing volume and an increase in secondary marketing gains on sales of loans. General and administrative expenses increased by approximately $7,400, due primarily to an increase in compensation costs as a result of an increase in average headcount compared to 2016.
Mortgage Banking – Other
We sell all of the loans we originate into the secondary mortgage market. Insofar as we underwrite our originated loans to the standards and specifications of the ultimate investor, we have no further financial obligations from the issuance of loans, except in certain limited instances where early payment default occurs. Those underwriting standards are typically equal to or more stringent than the underwriting standards required by FNMA, FHLMC, VA and FHA. Because we sell all of our loans and do not service them, there is often a substantial delay between the time that a loan goes into default and the time that the investor requests us to reimburse them for losses incurred because of the default. We believe that all of the loans that we originate are underwritten to the standards and
21
specifications of the ultimate investor to whom we sell our originated loans. We employ a quality control department to ensure that our underwriting controls are effective, and further assess the underwriting function as part of our assessment of internal controls over financial reporting.
We maintain a reserve for losses on mortgage loans originated that reflects our judgment of the present loss exposure from the loans that we have originated and sold. The reserve is calculated based on an analysis of historical experience and exposure. At
December 31, 2018
, we had a repurchase reserve of approximately
$15,600
. Although we consider the repurchase reserve reflected on the
December 31, 2018
consolidated balance sheet to be adequate, there can be no assurance that this reserve will prove to be adequate to cover losses on loans previously originated.
NVRM is dependent on our homebuilding operation’s customers for business. If New Orders and selling prices of the homebuilding segment decline, NVRM’s operations will also be adversely affected. In addition, NVRM’s operating results may be adversely affected in future periods due to tightening and volatility of the credit markets, changes in investor funding times, increased regulation of mortgage lending practices and increased competition in the mortgage market.
Seasonality
We generally have higher New Order activity in the first half of the year and higher home settlements, revenues and net income in the second half of the year.
Effective Tax Rate
Our consolidated effective tax rate in
2018
,
2017
and
2016
was
16.94%
,
36.53%
and
35.73%
, respectively. The lower effective tax rate in
2018
resulted primarily from the enactment of the Tax Cuts and Jobs Act (the "Act") in December 2017, which had the following impacts on comparability between periods:
|
•
|
reduction in our federal statutory rate from 35% to 21% in 2018, and
|
|
•
|
remeasurement of our net deferred tax assets in the fourth quarter of 2017, which resulted in a charge to income tax expense of $62,702 in 2017.
|
Excluding the charge related to the net deferred tax asset remeasurement, our effective tax rate in 2017 would have been 29.13%.
Additionally, our effective tax rates in 2018 and 2017 were favorably impacted by the recognition of an income tax benefit related to excess tax benefits from stock option exercises of $77,478 and $58,681, respectively. Excess tax benefits in 2016 were recorded to additional paid-in-capital within shareholders' equity on the consolidated balance sheet. We expect continued rate volatility in future years attributable to the recognition of excess tax benefits from equity plan activity and distributions from the deferred compensation plans.
The Act eliminated the "performance-based compensation" exception from Section 162(m). The Act included a grandfathering provision for compensation pursuant to a written binding contract which was in effect on November 2, 2017, and which was not modified in any material respect after such date. We believe that our outstanding equity grants and amounts in the deferred compensation plans as of December 31, 2017 are in compliance with the grandfathering provision of the Act, and thus, will remain deductible to the extent they are considered "performance-based compensation."
Recent Accounting Pronouncements Pending Adoption
See Note 1 to the accompanying consolidated financial statements for discussion of recently issued accounting pronouncements applicable to us.
Liquidity and Capital Resources
Lines of Credit and Notes Payable
Senior Notes
Our homebuilding segment funds its operations from cash flows provided by operating activities, a short-term unsecured working capital revolving credit facility and capital raised in the public debt and equity markets. On September 10, 2012, we completed an offering for $600,000 aggregate principal amount of 3.95% Senior Notes due 2022 under a Shelf Registration Statement filed on September 5, 2012 with the SEC. The Senior Notes were issued at a discount to yield 3.97% and have been reflected net of the unamortized discount in the accompanying consolidated balance sheet. The Senior Notes mature on September 15, 2022 and bear interest at 3.95%, payable semi-annually in arrears on March 15 and September 15.
The Senior Notes are senior unsecured obligations and rank equally in right of payment with any of our existing and future unsecured senior indebtedness, will rank senior in right of payment to any of our future indebtedness that is by its terms expressly
22
subordinated to the Senior Notes and will be effectively subordinated to any of our existing and future secured indebtedness to the extent of the value of the collateral securing such indebtedness. The indenture governing the Senior Notes does not contain any financial covenants; however, it does contain, among other items, and subject to certain exceptions, covenants that restrict our ability to create, incur, assume or guarantee secured debt, enter into sale and leaseback transactions and conditions related to mergers and/or the sale of assets.
Credit Agreement
On July 15, 2016, we entered into an unsecured Credit Agreement (the “Credit Agreement”) with Bank of America, N.A., as Administrative Agent, Swing Line Lender and L/C Issuer, Merrill Lynch, Pierce, Fenner & Smith Incorporated as Sole Lead Arranger and Sole Book Runner, and the other lenders party thereto, which provides for aggregate revolving loan commitments of $200,000 (the “Facility”). Proceeds of the borrowings under the Facility will be used for working capital and general corporate purposes. Under the Credit Agreement, we may request increases of up to $300,000 to the Facility in the form of revolving loan commitments or term loans to the extent that new or existing lenders agree to provide additional revolving loan or term loan commitments.
The Credit Agreement provides for a $100,000 sublimit for the issuance of letters of credit of which there was approximately
$9,000
outstanding at
December 31, 2018
, and a $25,000 sublimit for a swing line commitment. Borrowings under the Credit Agreement generally bear interest for Base Rate Loans at a Base Rate equal to the highest of (i) a Federal Funds Rate plus one-half of one percent, (ii) Bank of America’s publicly announced “prime rate,” and (iii) the Eurodollar Rate plus one percent, plus the Applicable Rate which is based on our debt rating, or for Eurodollar Rate Loans, at the Eurodollar Rate equal to LIBOR plus the Applicable Rate.
The Credit Agreement contains various representations and affirmative and negative covenants that are generally customary for credit facilities of this type. Such covenants include, among others, the following financial maintenance covenants: (i) minimum consolidated tangible net worth, (ii) minimum interest coverage ratio or minimum liquidity and (iii) a maximum leverage ratio. The negative covenants include, among others, certain limitations on liens, investments and fundamental changes. The Credit Agreement termination date is July 15, 2021. We were in compliance with all covenants under the Credit Agreement at
December 31, 2018
. There were no borrowings outstanding under the Credit Agreement as of
December 31, 2018
.
Repurchase Agreement
Our mortgage banking subsidiary, NVRM, provides for its mortgage origination and other operating activities using cash generated from operations, borrowings from its parent company, NVR, as well as a revolving mortgage repurchase facility, which is non-recourse to NVR. On July 25, 2018, NVRM entered into the Tenth Amendment (the “Amendment”) to its Amended and Restated Master Repurchase Agreement dated August 2, 2011 with U.S. Bank National Association (as amended by the Amendment and nine earlier amendments, the “Repurchase Agreement”). The Repurchase Agreement provides borrowing capacity up to $150,000, subject to certain sublimits. The purpose of the Repurchase Agreement is to finance the origination of mortgage loans by NVRM. The Repurchase Agreement expires on July 24, 2019. Advances under the Repurchase Agreement carry a Pricing Rate based on the LIBOR Rate plus the LIBOR Margin, as determined under the Repurchase Agreement, provided that the Pricing Rate shall not be less than 1.95%. There are several restrictions on purchased loans, including that they cannot be sold to others, they cannot be pledged to anyone other than the agent, and they cannot support any other borrowing or repurchase agreement.
The Repurchase Agreement contains various affirmative and negative covenants. The negative covenants include among others, certain limitations on transactions involving acquisitions, mergers, the incurrence of debt, sale of assets and creation of liens upon any of its Mortgage Notes. Additional covenants include (i) a tangible net worth requirement, (ii) a minimum liquidity requirement, (iii) a minimum net income requirement, and (iv) a maximum leverage ratio requirement. We were in compliance with all covenants under the Repurchase Agreement at
December 31, 2018
. At
December 31, 2018
, there was no debt outstanding under the Repurchase Agreement and there were no borrowing base limitations.
Equity Repurchases
In addition to funding growth in our homebuilding and mortgage banking operations, we historically have used a substantial portion of our excess liquidity to repurchase outstanding shares of our common stock in open market and privately negotiated transactions. This ongoing repurchase activity is conducted pursuant to publicly announced Board authorizations, and is typically executed in accordance with the safe-harbor provisions of Rule 10b-18 promulgated under the Securities Exchange Act of 1934, as amended. In addition, the Board resolutions authorizing us to repurchase shares of our common stock specifically prohibit us from purchasing shares from our officers, directors, Profit Sharing Plan Trust or Employee Stock Ownership Plan Trust. The repurchase program assists us in accomplishing our primary objective, creating increases in shareholder value. See “Market for Registrant’s Common Equity, Related Stockholder Matters and Issuer Purchases of Equity Securities” in Item 5 of this Form 10-K for disclosure of amounts repurchased during the fourth quarter of
2018
. For the year ended
December 31, 2018
, we repurchased 300,815 shares of our common stock at an aggregate purchase price of
$846,134
. As of
December 31, 2018
, we had $415,558 available under Board approved repurchase authorizations.
23
Cash Flows
As a result of our adoption of ASU 2016-15 and ASU 2016-18 in 2018, we have retrospectively adjusted the presentation of our prior year statements of cash flows to conform with current year presentation. ASU 2016-15 resulted in the reclassification of a portion of the distributions received from our unconsolidated joint ventures between operating and investing activities. ASU 2016-18 requires that the statement of cash flows explain the change during the period in the total of cash, cash equivalents, and restricted cash or restricted cash equivalents. As a result, our beginning-of-period and end-of-period cash balances presented in the consolidated statements of cash flows were retrospectively adjusted to include restricted cash and restricted cash equivalents. See Note 1 for further discussion of the impact of the adoption of ASU 2016-15 and ASU 2016-18.
For the year ended
December 31, 2018
, cash and cash equivalents increased by
$42,691
. Net cash provided by operating activities was
$723,126
, due primarily to cash provided by earnings in
2018
and net proceeds of
$17,384
from mortgage loan activity. Cash was primarily used to fund the increase in contract land deposits of $30,863 and the decrease in accounts payable and accrued expenses of $30,713. Net cash used in investing activities in
2018
of
$8,177
was attributable primarily to cash used for purchases of property, plant and equipment of
$19,665
, offset partially by the receipt of capital distributions from our unconsolidated JVs totaling
$10,515
. Net cash used in financing activities of
$672,258
, was primarily impacted by our repurchase of 300,815 shares of our common stock for an aggregate purchase price of
$846,134
under our ongoing common stock repurchase program as discussed above, offset partially by
$174,110
in proceeds from stock option exercises.
For the year ended December 31, 2017, cash and cash equivalents increased by $273,520. Net cash provided by operating activities was $570,354, due primarily to cash provided by earnings in 2017 and net proceeds of $104,848 from mortgage loan activity. Cash was primarily used to fund the increase in homebuilding inventory of $154,099, which is attributable to an increase in the number of homes under construction at December 31, 2017 compared to December 31, 2016. Net cash used in investing activities in 2017 of $15,193 was attributable to cash used for purchases of property, plant and equipment of $20,269 and investments in unconsolidated JVs of $3,800, offset partially by the receipt of capital distributions from our unconsolidated JVs totaling $8,029. Net cash used in financing activities of $281,641, was primarily impacted by our repurchase of 166,520 shares of our common stock for an aggregate purchase price of $422,166 under our ongoing common stock repurchase program as discussed above, offset partially by $140,525 in proceeds from stock option exercises.
For the year ended December 31, 2016, cash and cash equivalents decreased by $34,757. Net cash provided by operating activities was $392,988. Cash provided by earnings in 2016 was used to fund the increase in homebuilding inventory of $85,194, as a result of an increase in units under construction at December 31, 2016 compared to December 31, 2015, and the increase of $32,280 in contract land deposits. Cash was favorably impacted by an increase of $58,532 in accounts payable and accrued expenses associated with the increase in homebuilding inventory and net proceeds of $49,981 from mortgage loan activity. Net cash used in investing activities in 2016 of $10,350 primarily included cash used for purchases of property, plant and equipment of $22,369, offset partially by the receipt of capital distributions from our unconsolidated JVs totaling $11,672. Net cash used in financing activities of $417,395, was primarily impacted by our repurchase of 280,288 shares of our common stock for an aggregate purchase price of $455,351 under our ongoing common stock repurchase program as discussed above, offset partially by $38,106 in proceeds from stock option exercises.
At
December 31, 2018
and
2017
, the homebuilding segment had restricted cash of
$16,982
and
$19,438
, respectively. Restricted cash in each year was attributable to customer deposits for certain home sales.
We believe that our current cash holdings, cash generated from operations, and cash available under our short-term unsecured credit agreement, revolving mortgage repurchase facility and the public debt and equity markets will be sufficient to satisfy near and long term cash requirements for working capital and debt service in both our homebuilding and mortgage banking operations.
Off-Balance Sheet Arrangements
Lot Acquisition Strategy
We generally do not engage in land development. Instead, we typically acquire finished building lots at market prices from various land developers under Lot Purchase Agreements that require deposits that may be forfeited if we fail to perform under the agreement. The deposits required under the Lot Purchase Agreements are in the form of cash or letters of credit in varying amounts and represent a percentage, typically ranging up to 10%, of the aggregate purchase price of the finished lots.
We believe that our lot acquisition strategy reduces the financial requirements and risks associated with direct land ownership and land development. We may, at our option, choose for any reason and at any time not to perform under these Lot Purchase Agreements by delivering notice of our intent not to acquire the finished lots under contract. Our sole legal obligation and economic loss for failure to perform under these purchase agreements is limited to the amount of the deposit pursuant to the liquidated damage provision contained in the Lot Purchase Agreements. We do not have any financial guarantees or completion obligations and we typically do not guarantee lot purchases on a specific performance basis under these Lot Purchase Agreements.
24
At
December 31, 2018
, we controlled approximately
99,700
lots through Lot Purchase Agreements, JVs and land under development, with an aggregate purchase price of approximately $9,400,000. These lots are controlled by making or committing to make deposits of approximately $618,300 in the form of cash and letters of credit. Our entire risk of loss pertaining to the aggregate purchase price contractual commitment resulting from our non-performance under the contracts is limited to
$420,900
in deposits paid and
$3,800
in letters of credit issued as of
December 31, 2018
, plus approximately $193,600 related to deposits to be paid subsequent to
December 31, 2018
assuming that contractual development milestones are met by the developers and we exercise our option, and approximately $1,500 in specific performance obligations (see
Contractual Obligations
section below). As of
December 31, 2018
, we had recorded an impairment valuation allowance of approximately
$29,200
related to certain cash deposits currently outstanding. Additionally, as of
December 31, 2018
, we had funding commitments totaling
$5,000
to three of our JVs and approximately
$7,300
under a joint development agreement related to our land under development, a portion of which we expect will be offset by development credits of approximately
$4,600
.
In addition, we have certain properties under contract with land owners that are expected to yield approximately
7,500
lots, which are not included in our number of total lots controlled above. Some of these properties may require rezoning or other approvals to achieve the expected yield. These properties are controlled with cash deposits and letters of credit of approximately
$4,500
and
$150
, respectively as of
December 31, 2018
, of which approximately
$1,700
is refundable if we do not perform under the contract and the remainder is at risk of loss. We generally expect to assign the raw land contracts to a land developer and simultaneously enter into a Lot Purchase Agreement with the assignee if the project is determined to be feasible. Please refer to Note 1 in the accompanying consolidated financial statements for a further discussion of the contract land deposits and Note 3 in the accompanying consolidated financial statements for a description of our lot acquisition strategy in relation to our accounting for variable interest entities.
Bonds and Letters of Credit
We enter into bond or letter of credit arrangements with local municipalities, government agencies, or land developers to collateralize our obligations under various contracts. We had approximately $37,600 of contingent obligations under such agreements as of
December 31, 2018
, inclusive of the
$3,800
of lot acquisition deposits in the form of letters of credit discussed above. We believe we will fulfill our obligations under the related contracts and do not anticipate any material losses under these bonds or letters of credit.
Mortgage Commitments and Forward Sales
In the normal course of business, NVRM enters into contractual commitments to extend credit to buyers of single-family homes with fixed expiration dates. The commitments become effective when the borrowers “lock-in” a specified interest rate within time frames established by us. All mortgagors are evaluated for credit worthiness prior to the extension of the commitment. Market risk arises if interest rates move adversely between the time of the “lock-in” of rates by the borrower and the sale date of the loan to a broker/dealer. To mitigate the effect of the interest rate risk inherent in providing rate lock commitments to borrowers, we enter into optional or mandatory delivery forward sale contracts to sell whole loans and mortgage-backed securities to broker/dealers. The forward sale contracts lock in an interest rate and price for the sale of loans similar to the specific rate lock commitments. We do not engage in speculative or trading derivative activities. Both the rate lock commitments to borrowers and the forward sale contracts to broker/dealers are undesignated derivatives, and, accordingly, are marked to fair value through earnings. At
December 31, 2018
, we had contractual commitments to extend credit to borrowers aggregating
$682,152
and open forward delivery contracts aggregating
$1,089,923
, which hedge both the rate lock commitments and closed loans held for sale (see Note 14 in the accompanying consolidated financial statements for a description of our fair value accounting).
Contractual Obligations
Our fixed, non-cancelable obligations as of
December 31, 2018
, were as follows:
|
|
Payments due by year
|
|||||||||||||||||||
|
|
Total
|
2019
|
2020 to 2021
|
2022 to 2023
|
2024 and Later
|
|||||||||||||||
|
Debt (1)
|
$
|
600,000
|
|
$
|
—
|
|
$
|
—
|
|
$
|
600,000
|
|
$
|
—
|
|
|||||
|
Interest on debt (1)
|
87,822
|
|
23,700
|
|
47,400
|
|
16,722
|
|
—
|
|
||||||||||
|
Operating leases (2)
|
107,703
|
|
31,564
|
|
39,541
|
|
23,991
|
|
12,607
|
|
||||||||||
|
Purchase obligations (3)
|
202,443
|
|
*
|
*
|
*
|
*
|
||||||||||||||
|
Uncertain tax positions (4)
|
34,300
|
|
*
|
*
|
*
|
*
|
||||||||||||||
|
Total
|
$
|
1,032,268
|
|
$
|
55,264
|
|
$
|
86,941
|
|
$
|
640,713
|
|
$
|
12,607
|
|
|||||
|
(1)
|
See Note 9 in the accompanying consolidated financial statements for additional information regarding the Senior Notes.
|
|
(2)
|
See Note 13 in the accompanying consolidated financial statements for additional information regarding operating leases.
|
|
(3)
|
Amount represents expected payments of forfeitable deposits with land developers under existing Lot Purchase Agreements assuming that contractual development milestones are met by the developers and we exercise our option, specific performance guarantees and estimated contractual obligations for land development agreements. We expect to make the majority of payments of the deposits with land developers within the next three years, but due to the nature of the contractual
|
25
development milestones that must be met we are unable to accurately estimate the portion of the deposit obligation that will be made within one year and that portion that will be made within one to three years.
|
(4)
|
Due to the nature of the uncertain tax positions, we are unable to make a reasonable estimate as to the period of settlement with the respective taxing authorities.
|
Critical Accounting Policies
General
The preparation of financial statements in conformity with GAAP requires us to make estimates and assumptions that affect the reported amounts of assets and liabilities, the disclosure of contingent assets and liabilities at the date of the financial statements, and the reported amounts of revenues and expenses during the reporting periods. We continually evaluate the estimates we use to prepare the consolidated financial statements and update those estimates as necessary. In general, our estimates are based on historical experience, on information from third party professionals, and other various assumptions that are believed to be reasonable under the facts and circumstances. Actual results could differ materially from those estimates made by management.
Homebuilding Inventory
The carrying value of inventory is stated at the lower of cost or market value. Cost of lots and completed and uncompleted housing units represent the accumulated actual cost of the units. Field construction supervisors’ salaries and related direct overhead expenses are included in inventory costs. Interest costs are not capitalized into inventory, with the exception of land under development and joint venture investments, as applicable (see below). Upon settlement, the cost of the unit is expensed on a specific identification basis. Cost of building materials is determined on a first-in, first-out basis.
Sold inventory is evaluated for impairment based on the contractual selling price compared to the total estimated cost to construct. Unsold inventory is evaluated for impairment by analyzing recent comparable sale prices within the applicable community compared to the costs incurred to date plus the expected costs to complete. Any calculated impairments are recorded immediately in cost of sales.
Contract Land Deposits and Land Under Development
Contract Land Deposits
We purchase finished lots under Lot Purchase Agreements that require deposits that may be forfeited if we fail to perform under the contract. The deposits are in the form of cash or letters of credit in varying amounts and represent a percentage of the aggregate purchase price of the finished lots.
We maintain an allowance for losses on contract land deposits that reflects our judgment of the present loss exposure in the existing contract land deposit portfolio at the end of the reporting period. To analyze contract land deposit impairments, we conduct a loss contingency analysis each quarter. In addition to considering market and economic conditions, we assess contract land deposit impairments on a community-by-community basis pursuant to the purchase contract terms, analyzing, as applicable, current sales absorption levels, recent sales’ direct profit, the dollar differential between the contractual purchase price and the current market price for lots, a developer’s financial stability, a developer’s financial ability or willingness to reduce lot prices to current market prices, if necessary, and the contract’s default status by either us or the developer along with an analysis of the expected outcome of any such default.
Our analysis is focused on whether we can sell houses at an acceptable margin and sales pace in a particular community in the current market with which we are faced. Because we do not own the finished lots on which we had placed a contract land deposit, if the above analysis leads to a determination that we cannot sell homes at an acceptable margin and sales pace at the current contractual lot price, we then determine whether we will elect to default under the contract, forfeit our deposit and terminate the contract, or whether we will attempt to restructure the lot purchase contract, which may require us to forfeit the deposit to obtain contract concessions from a developer. We also assess whether an impairment is present due to collectability issues resulting from a developer’s non-performance because of financial or other conditions.
Although we consider the allowance for losses on contract land deposits reflected on the
December 31, 2018
consolidated balance sheet to be adequate (see Note 1 to the accompanying consolidated financial statements included herein), there can be no assurance that this allowance will prove to be adequate over time to cover losses due to unanticipated adverse changes in the economy or other events adversely affecting specific markets or the homebuilding industry.
Land Under Development
On a limited basis, we directly acquire raw parcels of land already zoned for its intended use to develop into finished lots. Land under development includes the land acquisition costs, direct improvement costs, capitalized interest, where applicable, and real estate taxes.
26
Land under development, including the land under development held by our unconsolidated JVs and the related joint venture investments, is reviewed for potential write-downs when impairment indicators are present. In addition to considering market and economic conditions, we assess land under development impairments on a community-by-community basis, analyzing, as applicable, current sales absorption levels, recent sales’ direct profit, and the dollar differential between the projected fully-developed cost of the lots and the current market price for lots. If indicators of impairment are present for a community, we perform an analysis to determine if the undiscounted cash flows estimated to be generated by those assets are less than their carrying amounts, and if so, impairment charges are required to be recorded in an amount by which the carrying amount of the assets exceeds the fair value of such assets. Our determination of fair value is primarily based on discounting the estimated future cash flows at a rate commensurate with the inherent risks associated with the assets and related estimated cash flow streams.
At
December 31, 2018
, we had approximately
$38,900
in land under development in
three
separate communities. In addition, at
December 31, 2018
, we had an aggregate investment totaling approximately
$29,400
in
six
separate JVs that controlled land under development. During
2018
, the Company recognized an impairment of approximately
$7,400
, including approximately
$760
of capitalized interest, related to one of our JVs. None of the communities classified as land under development nor any of the undeveloped land held by the JVs had any indicators of impairment at
December 31, 2018
. As such, we do not believe that any of the land under development is impaired at this time. However, there can be no assurance that we will not incur impairment charges in the future due to unanticipated adverse changes in the economy or other events adversely affecting specific markets or the homebuilding industry.
Warranty/Product Liability Accruals
We establish warranty and product liability reserves to provide for estimated future expenses as a result of construction and product defects, product recalls and litigation incidental to our homebuilding business. Liability estimates are determined based on our judgment considering such factors as historical experience, the likely current cost of corrective action, manufacturers’ and subcontractors’ participation in sharing the cost of corrective action, consultations with third party experts such as engineers, and discussions with our General Counsel and outside counsel retained to handle specific product liability cases. Although we consider the warranty and product liability accrual reflected on the
December 31, 2018
consolidated balance sheet to be adequate (see Note 13 to the accompanying consolidated financial statements included herein), there can be no assurance that this accrual will prove to be adequate over time to cover losses due to increased costs for material and labor, the inability or refusal of manufacturers or subcontractors to financially participate in corrective action, unanticipated adverse legal settlements, or other unanticipated changes to the assumptions used to estimate the warranty and product liability accrual.
Equity-Based Compensation Expense
We recognize equity-based compensation expense within our income statement for all share-based payment arrangements, which includes non-qualified stock options to purchase shares of NVR common stock ("Options") and restricted share units ("RSUs"). Compensation expense is based on the grant-date fair value of the Options and RSUs granted, and is recognized on a straight-line basis over the requisite service period for the entire award (from the date of grant through the period of the last separately vesting portion of the grant). Options and RSUs which are subject to a performance condition are treated as a separate award from the “service-only” Options and RSUs, and compensation expense is recognized when it becomes probable that the stated performance target will be achieved. We calculate the fair value of our Options, which are non-publicly traded, using the Black-Scholes option-pricing model. The grant date fair value of the RSUs is the closing price of our common stock on the day immediately preceding the date of grant. The reversal of compensation expense previously recognized for grants forfeited is recorded in the period in which the forfeiture occurs.
As noted above, we calculate the fair value of our Options, which are non-publicly traded, using the Black-Scholes option-pricing model. While the Black-Scholes model is a widely accepted method to calculate the fair value of options, its results are dependent on input variables, two of which, expected term and expected volatility, are significantly dependent on management’s judgment. We have concluded that our historical exercise experience is the best estimate of future exercise patterns to determine an Option’s expected term. To estimate expected volatility, we analyze the historical volatility of our common stock over a period equal to the Option’s expected term. Changes in management’s judgment of the expected term and the expected volatility could have a material effect on the grant-date fair value calculated and expensed within the income statement.
In addition, when recognizing equity-based compensation cost related to “performance condition” Option and RSU grants, we are required to make a determination as to whether the performance conditions will be met prior to the completion of the actual performance period. The performance metric is based on our return on capital performance during a specified three year period based on the date of Option grant. While we currently believe that this performance condition will be satisfied at the target level and are recognizing compensation expense related to such Options and RSUs accordingly, our future expected activity levels could cause us to make a different determination, resulting in a change to the compensation expense to be recognized related to performance condition Option and RSU grants that would otherwise have been recognized to date.
Although we believe that the compensation costs recognized in
2018
are representative of the cumulative ratable amortization of the grant-date fair value of unvested Options and RSUs outstanding, changes to the estimated input values such as expected term
27
and expected volatility and changes to the determination of whether performance condition grants will vest, could produce widely different expense valuations and recognition.
Mortgage Repurchase Reserve
We originate several different loan products to our customers to finance the purchase of their home. We sell all of the loans we originate into the secondary mortgage market, on a servicing released basis, typically within 30 days from closing. All of the loans that we originate are underwritten to the standards and specifications of the ultimate investor. Those underwriting standards are typically equal to or more stringent than the underwriting standards required by FNMA, FHLMC, VA and FHA. Insofar as we underwrite our originated loans to those standards, we bear no increased concentration of credit risk from the issuance of loans, except in certain limited instances where early payment default occurs. We employ a quality control department to ensure that our underwriting controls are effectively operating, and further assess the underwriting function as part of our assessment of internal controls over financial reporting. We maintain a reserve for losses on mortgage loans originated that reflects our judgment of the present loss exposure in the loans that we have originated and sold. The reserve is calculated based on an analysis of historical experience and exposure. Although we consider the mortgage repurchase reserve reflected on the
December 31, 2018
consolidated balance sheet to be adequate (see Note 15 to the accompanying consolidated financial statements included herein), there can be no assurance that this reserve will prove to be adequate over time to cover losses due to unanticipated changes to the assumptions used to estimate the mortgage repurchase reserve.
Impact of Inflation, Changing Prices and Economic Conditions
See “Risk Factors” included in Item 1A of this Form 10-K for a description of the impact of inflation, changing prices and economic conditions on our business and our financial results. See also the discussion of the current business environment in the
Overview
section above.
Item 7A. Quantitative and Qualitative Disclosure About Market Risk.
(dollars in thousands)
Market risk is the risk of loss arising from adverse changes in market prices and interest rates. Our market risk arises from interest rate risk inherent in our financial instruments and debt obligations. Interest rate risk results from the possibility that changes in interest rates will cause unfavorable changes in net income or in the value of interest rate-sensitive assets, liabilities and commitments. Lower interest rates tend to increase demand for mortgage loans for home purchasers, while higher interest rates make it more difficult for potential borrowers to purchase residential properties and to qualify for mortgage loans. We have no market rate sensitive instruments held for speculative or trading purposes.
Our homebuilding segment is exposed to interest rate risk as it relates to its debt obligations. In September 2012, we issued $600,000 of Senior Notes. The Senior Notes mature on September 15, 2022 and bear interest at 3.95%, payable semi-annually in arrears on March 15 and September 15. Changes to interest rates generally affect the fair value of fixed-rate debt instruments, but not earnings or cash flows. We generally have no obligation to prepay the Senior Notes prior to maturity, and therefore, interest rate fluctuations should not have a significant impact on our fixed-rate debt.
In July 2016, we entered into a Credit Agreement which provides for aggregate revolving loan commitments of $200,000. Under the Credit Agreement, we may request increases of up to $300,000 to the Facility in the form of revolving loan commitments or term loans to the extent that new or existing lenders agree to provide additional revolving loan or term loan commitments. The Credit Agreement provides for a $100,000 sublimit for the issuance of letters of credit of which there was approximately
$9,000
outstanding at
December 31, 2018
, and a $25,000 sublimit for a swing line commitment. Borrowings under the Credit Agreement generally bear interest for Base Rate Loans at a Base Rate equal to the highest of (i) a Federal Funds Rate plus one-half of one percent, (ii) Bank of America’s publicly announced “prime rate,” and (iii) the Eurodollar Rate plus one percent, plus the Applicable Rate which is based on our debt rating, or for Eurodollar Rate Loans, at the Eurodollar Rate equal to LIBOR plus the Applicable Rate. At
December 31, 2018
, there was no debt outstanding under the Facility.
Our mortgage banking segment is exposed to interest rate risk as it relates to its lending activities. The mortgage banking segment originates mortgage loans, which are sold through either optional or mandatory forward delivery contracts into the secondary markets. All of the mortgage banking segment’s loan portfolio is held for sale and subject to forward sale commitments. NVRM also sells all of its mortgages held for sale on a servicing released basis.
NVRM has available a mortgage Repurchase Agreement, which as of
December 31, 2018
provided for loan repurchases up to $150,000. The Repurchase Agreement is used to fund NVRM’s mortgage origination activities. Advances under the Repurchase Agreement carry a Pricing Rate based on the LIBOR Rate plus the LIBOR Margin, as determined under the Repurchase Agreement, provided that the Pricing Rate shall not be less than 1.95%. At
December 31, 2018
, there was no debt outstanding under the Repurchase Agreement.
28
The following table represents the contractual balances of our on-balance sheet financial instruments at the expected maturity dates, as well as the fair values of those on-balance sheet financial instruments at
December 31, 2018
. The expected maturity categories take into consideration the actual and anticipated amortization of principal and do not take into consideration the reinvestment of cash or the refinancing of existing indebtedness. Because we sell all of the mortgage loans we originate into the secondary markets, we have made the assumption that the portfolio of mortgage loans held for sale will mature in the first year.
|
Maturities (000's)
|
|||||||||||||||||||||||||||
|
2019
|
2020
|
2021
|
2022
|
2023
|
Thereafter
|
Total
|
Fair
Value
|
||||||||||||||||||||
|
Mortgage banking segment
|
|||||||||||||||||||||||||||
|
Interest rate sensitive assets:
|
|||||||||||||||||||||||||||
|
Mortgage loans held for sale
|
$
|
447,444
|
|
—
|
|
—
|
|
—
|
|
—
|
|
—
|
|
$
|
447,444
|
|
$
|
458,324
|
|
||||||||
|
Average interest rate
|
4.8
|
%
|
—
|
|
—
|
|
—
|
|
—
|
|
—
|
|
4.8
|
%
|
|||||||||||||
|
Other:
|
|||||||||||||||||||||||||||
|
Forward trades of mortgage-backed securities (a)
|
$
|
(10,057
|
)
|
—
|
|
—
|
|
—
|
|
—
|
|
—
|
|
$
|
(10,057
|
)
|
$
|
(10,057
|
)
|
||||||||
|
Forward loan commitments (a)
|
$
|
13,486
|
|
—
|
|
—
|
|
—
|
|
—
|
|
—
|
|
$
|
13,486
|
|
$
|
13,486
|
|
||||||||
|
Homebuilding segment
|
|||||||||||||||||||||||||||
|
Interest rate sensitive assets:
|
|||||||||||||||||||||||||||
|
Interest-bearing deposits
|
$
|
571,841
|
|
—
|
|
—
|
|
—
|
|
—
|
|
—
|
|
$
|
571,841
|
|
$
|
571,841
|
|
||||||||
|
Average interest rate
|
2.4
|
%
|
—
|
|
—
|
|
—
|
|
—
|
|
—
|
|
2.4
|
%
|
|||||||||||||
|
Interest rate sensitive liabilities:
|
|||||||||||||||||||||||||||
|
Fixed rate obligations
|
$
|
—
|
|
—
|
|
—
|
|
600,000
|
|
—
|
|
—
|
|
$
|
600,000
|
|
$
|
594,000
|
|
||||||||
|
Average interest rate
|
—
|
|
—
|
|
—
|
|
4.0
|
%
|
—
|
|
—
|
|
4.0
|
%
|
|
|
|||||||||||
|
(a)
|
Represents the fair value recorded pursuant to ASC 815,
Derivatives and Hedging
.
|
29
Item 8. Financial Statements and Supplementary Data.
The financial statements listed in Item 15 are filed as part of this report and are incorporated herein by reference.
Item 9. Changes in and Disagreements with Accountants on Accounting and Financial Disclosure.
None.
Item 9A. Controls and Procedures.
Evaluation of Disclosure Controls and Procedures
As of the end of the period covered by this report, an evaluation was performed under the supervision and with the participation of our management, including the principal executive officer and principal financial officer, of the effectiveness of the design and operation of our disclosure controls and procedures, as defined in Rules 13a-15(e) and 15d-15(e) under the Securities Exchange Act of 1934, as amended (“Exchange Act”).
Based on that evaluation, the principal executive officer and principal financial officer concluded that the design and operation of these disclosure controls and procedures as of
December 31, 2018
were effective to provide reasonable assurance that information required to be disclosed in our reports under the Exchange Act, processed, summarized and reported within the time periods specified in the Securities and Exchange Commission’s rules and forms and that such information is accumulated and communicated to our management, including our principal executive officer and principal financial officer, as appropriate, to allow timely decisions regarding required disclosure.
Management’s Report on Internal Control Over Financial Reporting
Our management is responsible for establishing and maintaining adequate internal control over financial reporting, as such term is defined in Rule 13a-15(f) under the Exchange Act. Under the supervision and with the participation of our management, including our principal executive officer and principal financial officer, we conducted an evaluation of the effectiveness of our internal control over financial reporting based on the framework in
Internal Control – Integrated Framework (2013)
issued by the Committee of Sponsoring Organizations of the Treadway Commission. Based on our evaluation under the framework in
Internal Control – Integrated Framework (2013)
, our management concluded that our internal control over financial reporting was effective as of
December 31, 2018
. There have been no changes in our internal control over financial reporting identified in connection with the evaluation referred to above that have materially affected, or are reasonably likely to materially affect, our internal control over financial reporting.
Our internal control over financial reporting as of
December 31, 2018
has been audited by KPMG LLP, an independent registered public accounting firm, as stated in their attestation report which is included herein.
Item 9B. Other Information.
None.
PART III
Item 10. Directors, Executive Officers, and Corporate Governance.
Executive Officers of the Registrant
|
Name
|
Age
|
Positions
|
||
|
Paul C. Saville
|
63
|
President and Chief Executive Officer of NVR
|
||
|
Daniel D. Malzahn
|
49
|
Senior Vice President, Chief Financial Officer and Treasurer of NVR
|
||
|
Jeffrey D. Martchek
|
53
|
President of Homebuilding Operations of NVR
|
||
|
Paul W. Praylo
|
47
|
Senior Vice President and Chief Operating Officer
|
||
|
Robert W. Henley
|
52
|
President of NVRM
|
||
|
Eugene J. Bredow
|
49
|
Senior Vice President and Chief Administrative Officer
|
||
Paul C. Saville
was named President and Chief Executive Officer of NVR effective July 1, 2005. Mr. Saville has been employed by NVR since 1981.
Daniel D. Malzahn
was named Senior Vice President in February 2016, and continues to serve as Chief Financial Officer and Treasurer of NVR, roles he has occupied since February 20, 2013. From February 1, 2004 through February 20, 2013, Mr. Malzahn was Vice President of Planning and Investor Relations of NVR. Mr. Malzahn has been employed by NVR since 1994.
30
Jeffrey D. Martchek
was named President of Homebuilding Operations of NVR effective January 1, 2016. From February 2011 through January 1, 2016, Mr. Martchek was
Area President for the Maryland and Virginia
homebuilding operations.
Mr. Martchek has been employed by NVR since 1988.
Paul W. Praylo
was hired as Senior Vice President and Chief Operating Officer effective January 28, 2019. Prior to joining NVR, Mr. Praylo was employed by AECOM as Chief Operating Officer of the Construction Services Group from January 2017 to January 2019 and Chief Financial Officer of the Construction Services Group from July 2010 to December 2016.
Robert W. Henley
was named President of NVRM effective October 1, 2012. Mr. Henley served as interim acting President of NVRM from June 1, 2012 until October 1, 2012. Mr. Henley is retiring from NVR effective March 31, 2019 and will be succeeded by Eugene J. Bredow.
Eugene J. Bredow
has been named President of NVRM effective April 1, 2019, to succeed Mr. Henley. Mr. Bredow has served as Senior Vice President and Chief Administrative Officer since March 1, 2018. Mr. Bredow served as Vice President and Controller from June 1, 2012 and Chief Accounting Officer from February 2016 until March 1, 2018. Mr. Bredow has been employed by NVR since 2004.
The other information required by Item 10 is incorporated herein by reference to our Proxy Statement expected to be filed with the Securities and Exchange Commission on or prior to
April 30, 2019
.
Item 11. Executive Compensation.
Item 11 is incorporated herein by reference to our Proxy Statement expected to be filed with the Securities and Exchange Commission on or prior to
April 30, 2019
.
Item 12. Security Ownership of Certain Beneficial Owners and Management and Related Stockholder Matters.
Item 12 is incorporated herein by reference to our Proxy Statement expected to be filed with the Securities and Exchange Commission on or prior to
April 30, 2019
.
Equity Compensation Plan Information
The table below sets forth information as of
December 31, 2018
for (i) all equity compensation plans approved by our shareholders and (ii) all equity compensation plans not approved by our shareholders:
|
Plan category
|
Number of securities to be
issued upon exercise of
outstanding options,
warrants and rights
|
Weighted-average
exercise price of
outstanding options,
warrants and rights
|
Number of securities
remaining available for
future issuance under
equity compensation
plans (excluding
securities reflected in the
first column)
|
|||||||
|
Equity compensation plans approved by security holders (1)
|
1,007,378
|
|
$
|
1,796.52
|
|
257,485
|
|
|||
|
Equity compensation plans not approved by security holders
|
62,634
|
|
$
|
703.00
|
|
—
|
|
|||
|
Total
|
1,070,012
|
|
$
|
1,732.51
|
|
257,485
|
|
|||
|
(1)
|
This category includes the restricted share units (“RSUs”) authorized to be issued under the 2010 Equity Incentive Plan, which was approved by our shareholders at our May 4, 2010 Annual Meeting. At
December 31, 2018
, there are 20,812 RSUs outstanding. Of the total
257,485
shares remaining available for future issuance under the shareholder approved plans, up to a total of 61,694 may be issued as RSUs. The weighted-average exercise price of outstanding options under security holder approved plans, excluding outstanding RSUs, was $1,834.42.
|
Equity compensation plans approved by our shareholders include: the 2010 Equity Incentive Plan, the 2014 Equity Incentive Plan, and the 2018 Equity Incentive Plan. The only equity compensation plan that was not approved by our shareholders is the 2000 Broadly-Based Stock Option Plan. See Note 12 in the accompanying consolidated financial statements for a description of each of our equity compensation plans.
Item 13. Certain Relationships and Related Transactions, and Director Independence.
Item 13 is incorporated herein by reference to our Proxy Statement expected to be filed with the Securities and Exchange Commission on or prior to
April 30, 2019
.
31
Item 14. Principal Accountant Fees and Services.
Item 14 is incorporated herein by reference to our Proxy Statement expected to be filed with the Securities and Exchange Commission on or prior to
April 30, 2019
.
32
PART IV
Item 15. Exhibits and Financial Statement Schedules.
The following documents are filed as part of this report:
1. Financial Statements
NVR, Inc. - Consolidated Financial Statements
Reports of Independent Registered Public Accounting Firm
Consolidated Balance Sheets
Consolidated Statements of Income
Consolidated Statements of Shareholders’ Equity
Consolidated Statements of Cash Flows
Notes to Consolidated Financial Statements
2. Exhibits
|
Incorporated by Reference
|
||||||||||
|
Exhibit Number
|
Exhibit Description
|
Form
|
File
Number
|
Exhibit
Number
|
Filing Date
|
|||||
|
3.1
|
10-K
|
|
3.1
|
2/25/2011
|
||||||
|
3.2
|
8-K
|
|
3.1
|
3/17/2016
|
||||||
|
4.1
|
8-K
|
|
4.3
|
4/23/1998
|
||||||
|
4.2
|
8-K
|
|
4.5
|
4/23/1998
|
||||||
|
4.3
|
8-K
|
|
4.1
|
9/10/2012
|
||||||
|
4.4
|
8-K
|
|
4.2
|
9/10/2012
|
||||||
|
10.1*
|
10-Q
|
|
10.1
|
11/6/2015
|
||||||
|
10.2*
|
10-Q
|
|
10.2
|
11/6/2015
|
||||||
|
10.3*
|
10-Q
|
|
10.3
|
11/6/2015
|
||||||
|
10.4*
|
10-Q
|
|
10.4
|
11/6/2015
|
||||||
|
10.5*
|
10-K
|
|
10.5
|
2/17/2016
|
||||||
|
10.6*
|
8-K
|
10.1
|
4/18/2017
|
|||||||
|
10.7*
|
10-Q
|
10.1
|
5/1/2018
|
|||||||
|
10.8*
|
||||||||||
|
10.9*
|
S-8
|
333-29241
|
4.1
|
6/13/1997
|
||||||
|
10.10*
|
Employee Stock Ownership Plan of NVR, Inc.
|
10-K/A
|
|
|
12/31/1994
|
|||||
|
10.11*
|
S-8
|
333-79951
|
4
|
6/4/1999
|
||||||
|
10.12*
|
S-8
|
333-56732
|
99.1
|
3/8/2001
|
||||||
33
|
Incorporated by Reference
|
||||||||||
|
Exhibit Number
|
Exhibit Description
|
Form
|
File
Number
|
Exhibit
Number
|
Filing Date
|
|||||
|
10.13*
|
10-Q
|
|
10.5
|
11/6/2015
|
||||||
|
10.14*
|
10-K
|
|
10.36
|
2/15/2017
|
||||||
|
10.15*
|
|
|||||||||
|
10.16*
|
S-8
|
333-224629
|
10.1
|
5/3/2018
|
||||||
|
10.17*
|
8-K
|
10.1
|
5/14/2018
|
|||||||
|
10.18*
|
8-K
|
10.2
|
5/14/2018
|
|||||||
|
10.19*
|
8-K
|
10.3
|
5/14/2018
|
|||||||
|
10.20*
|
8-K
|
10.4
|
5/14/2018
|
|||||||
|
10.21*
|
8-K
|
10.5
|
5/14/2018
|
|||||||
|
10.22*
|
8-K
|
10.6
|
5/14/2018
|
|||||||
|
10.23*
|
S-8
|
333-195756
|
10.1
|
5/7/2014
|
||||||
|
10.24*
|
10-K
|
10.2
|
2/14/2018
|
|||||||
|
10.25*
|
8-K
|
|
10.2
|
5/7/2014
|
||||||
|
10.26*
|
10-K
|
10.17
|
2/14/2018
|
|||||||
|
10.27*
|
8-K
|
|
10.4
|
5/7/2014
|
||||||
|
10.28*
|
S-8
|
333-166512
|
10.1
|
5/4/2010
|
||||||
|
10.29*
|
||||||||||
|
10.30*
|
||||||||||
|
10.31*
|
8-K
|
|
10.2
|
5/6/2010
|
||||||
|
10.32*
|
10-Q
|
|
10.2
|
7/30/2013
|
||||||
|
10.33*
|
8-K
|
|
10.4
|
5/6/2010
|
||||||
34
|
Incorporated by Reference
|
||||||||||
|
Exhibit Number
|
Exhibit Description
|
Form
|
File
Number
|
Exhibit
Number
|
Filing Date
|
|||||
|
10.34*
|
8-K
|
|
10.1
|
1/7/2008
|
||||||
|
10.35*
|
8-K
|
|
10.1
|
1/21/2016
|
||||||
|
10.36*
|
8-K
|
|
10.2
|
1/21/2016
|
||||||
|
10.37*
|
8-K
|
|
10.3
|
1/21/2016
|
||||||
|
10.38*
|
8-K
|
|
10.4
|
1/21/2016
|
||||||
|
10.39*
|
8-K
|
|
10.5
|
1/21/2016
|
||||||
|
10.40*
|
8-K
|
|
10.6
|
1/21/2016
|
||||||
|
10.41*
|
8-K
|
|
10.7
|
1/21/2016
|
||||||
|
10.42*
|
8-K
|
|
10.8
|
1/21/2016
|
||||||
|
10.43*
|
10-Q
|
|
10.2
|
7/28/2016
|
||||||
|
10.44*
|
10-Q
|
|
10.1
|
7/28/2017
|
||||||
|
10.45*
|
10-Q
|
10.1
|
7/30/2018
|
|||||||
|
10.46*
|
8-K
|
|
10.1
|
7/18/2016
|
||||||
|
10.47*
|
|
|
|
|
||||||
|
21
|
|
|
|
|
||||||
|
23
|
|
|
|
|
||||||
35
|
Incorporated by Reference
|
||||||||||
|
Exhibit Number
|
Exhibit Description
|
Form
|
File
Number
|
Exhibit
Number
|
Filing Date
|
|||||
|
31.1
|
|
|
|
|
||||||
|
31.2
|
|
|
|
|
||||||
|
32
|
|
|
|
|
||||||
|
101.INS
|
XBRL Instance Document
|
|
|
|
|
|||||
|
101.SCH
|
XBRL Taxonomy Extension Schema Document
|
|
|
|
|
|||||
|
101.CAL
|
XBRL Taxonomy Extension Calculation Linkbase Document
|
|
|
|
|
|||||
|
101.DEF
|
XBRL Taxonomy Extension Definition Linkbase Document
|
|
|
|
|
|||||
|
101.LAB
|
XBRL Taxonomy Extension Label Linkbase Document
|
|
|
|
|
|||||
|
101.PRE
|
XBRL Taxonomy Extension Presentation Linkbase Document
|
|
|
|
|
|||||
|
|
* Exhibit is a management contract or compensatory plan or arrangement.
|
|
|
|
|
|||||
36
SIGNATURES
Pursuant to the requirements of Section 13 or 15(d) of the Securities Exchange Act of 1934, the registrant has duly caused this report to be signed on its behalf by the undersigned, thereunto duly authorized.
|
NVR, Inc.
|
|||
|
By:
|
/s/ Paul C. Saville
|
||
|
|
Paul C. Saville
|
||
|
|
President and Chief Executive Officer
|
||
Pursuant to the requirements of the Securities Exchange Act of 1934, this report has been signed by the following persons on behalf of the registrant and in the capacities and on the dates indicated.
|
Signature
|
|
Title
|
|
Date
|
|
/s/ Dwight C. Schar
|
|
Chairman
|
|
February 13, 2019
|
|
Dwight C. Schar
|
|
|
|
|
|
/s/ C. E. Andrews
|
|
Director
|
|
February 13, 2019
|
|
C. E. Andrews
|
|
|
|
|
|
/s/ Timothy M. Donahue
|
|
Director
|
|
February 13, 2019
|
|
Timothy M. Donahue
|
|
|
|
|
|
/s/ Thomas D. Eckert
|
|
Director
|
|
February 13, 2019
|
|
Thomas D. Eckert
|
|
|
|
|
|
/s/ Alfred E. Festa
|
|
Director
|
|
February 13, 2019
|
|
Alfred E. Festa
|
|
|
|
|
|
/s/ Ed Grier
|
|
Director
|
|
February 13, 2019
|
|
Ed Grier
|
|
|
|
|
|
/s/ Manuel H. Johnson
|
|
Director
|
|
February 13, 2019
|
|
Manuel H. Johnson
|
|
|
|
|
|
/s/ Alexandra A. Jung
|
|
Director
|
|
February 13, 2019
|
|
Alexandra A. Jung
|
|
|
|
|
|
/s/ Mel Martinez
|
|
Director
|
|
February 13, 2019
|
|
Mel Martinez
|
|
|
|
|
|
/s/ William A. Moran
|
|
Director
|
|
February 13, 2019
|
|
William A. Moran
|
|
|
|
|
|
/s/ David A. Preiser
|
|
Director
|
|
February 13, 2019
|
|
David A. Preiser
|
|
|
|
|
|
/s/ W. Grady Rosier
|
|
Director
|
|
February 13, 2019
|
|
W. Grady Rosier
|
|
|
|
|
|
/s/ Susan Williamson Ross
|
|
Director
|
|
February 13, 2019
|
|
Susan Williamson Ross
|
|
|
|
|
|
/s/ Paul C. Saville
|
|
Principal Executive Officer
|
|
February 13, 2019
|
|
Paul C. Saville
|
|
|
|
|
|
/s/ Daniel D. Malzahn
|
|
Principal Financial Officer
|
|
February 13, 2019
|
|
Daniel D. Malzahn
|
|
|
|
|
|
/s/ Matthew B. Kelpy
|
|
Principal Accounting Officer
|
|
February 13, 2019
|
|
Matthew B. Kelpy
|
|
|
|
|
37
Report of Independent Registered Public Accounting Firm
To the Board of Directors and Shareholders
NVR, Inc.:
Opinion on the Consolidated Financial Statements
We have audited the accompanying consolidated balance sheets of NVR, Inc. and subsidiaries (the “Company”) as of
December 31, 2018
and
2017
, the related consolidated statements of income, shareholders’ equity, and cash flows for each of the years in the three-year period ended
December 31, 2018
, and the related notes (collectively, the “consolidated financial statements”). In our opinion, the consolidated financial statements present fairly, in all material respects, the financial position of the Company as of
December 31, 2018
and
2017
, and the results of its operations and its cash flows for each of the years in the three-year period ended
December 31, 2018
, in conformity with U.S. generally accepted accounting principles.
We also have audited, in accordance with the standards of the Public Company Accounting Oversight Board (United Sates) (“PCAOB”), the Company’s internal control over financial reporting as of
December 31, 2018
, based on criteria established in
Internal Control - Integrated Framework (2013)
issued by the Committee of Sponsoring Organizations of the Treadway Commission, and our report dated
February 13, 2019
expressed an unqualified opinion on the effectiveness of the Company’s internal control over financial reporting.
Change in Accounting Principle
As discussed in Note 11 to the consolidated financial statements, the Company has changed its method of accounting for the excess tax benefit from stock option exercises prospectively beginning January 1, 2017, for fiscal years 2017 and 2018, due to the adoption of Accounting Standards Update (“ASU”) 2016-09,
Compensation - Stock Compensation: Improvements to Employee Shared-Based Payment Accounting.
Basis for Opinion
These consolidated financial statements are the responsibility of the Company’s management. Our responsibility is to express an opinion on these consolidated financial statements based on our audits. We are a public accounting firm registered with the PCAOB and are required to be independent with respect to the Company in accordance with the U.S. federal securities laws and the applicable rules and regulations of the Securities and Exchange Commission and the PCAOB.
We conducted our audits in accordance with the standards of the PCAOB. Those standards require that we plan and perform the audit to obtain reasonable assurance about whether the consolidated financial statements are free of material misstatement, whether due to error or fraud. Our audits included performing procedures to assess the risks of material misstatement of the consolidated financial statements, whether due to error or fraud, and performing procedures that respond to those risks. Such procedures included examining, on a test basis, evidence regarding the amounts and disclosures in the consolidated financial statements. Our audits also included evaluating the accounting principles used and significant estimates made by management, as well as evaluating the overall presentation of the consolidated financial statements. We believe that our audits provide a reasonable basis for our opinion.
KPMG LLP
We have served as the Company's auditor since 1987.
McLean, Virginia
February 13, 2019
38
Report of Independent Registered Public Accounting Firm
To the Board of Directors and Shareholders
NVR, Inc.:
Opinion on Internal Control Over Financial Reporting
We have audited NVR, Inc.’s and subsidiaries
’
(the “Company”) internal control over financial reporting as of
December 31, 2018
, based on criteria established in
Internal Control - Integrated Framework (2013)
issued by the Committee of Sponsoring Organizations of the Treadway Commission. In our opinion, the Company maintained, in all material respects, effective internal control over financial reporting as of
December 31, 2018
, based on criteria established in
Internal Control - Integrated Framework (2013)
issued by the Committee of Sponsoring Organizations of the Treadway Commission.
We also have audited, in accordance with the standards of the Public Company Accounting Oversight Board (United States) (“PCAOB”), the consolidated balance sheets of the Company as of
December 31, 2018
and
2017
, the related consolidated statements of income, shareholders’ equity, and cash flows for each of the years in the three-year period ended
December 31, 2018
, and the related notes (collectively, the “consolidated financial statements”), and our report dated
February 13, 2019
expressed an unqualified opinion on those consolidated financial statements.
Basis for Opinion
The Company’s management is responsible for maintaining effective internal control over financial reporting and for its assessment of the effectiveness of internal control over financial reporting, included in the accompanying
Management’s Report on Internal Control Over Financial Reporting
. Our responsibility is to express an opinion on the Company’s internal control over financial reporting based on our audit. We are a public accounting firm registered with the PCAOB and are required to be independent with respect to the Company in accordance with the U.S. federal securities laws and the applicable rules and regulations of the Securities and Exchange Commission and the PCAOB.
We conducted our audit in accordance with the standards of the PCAOB. Those standards require that we plan and perform the audit to obtain reasonable assurance about whether effective internal control over financial reporting was maintained in all material respects. Our audit of internal control over financial reporting included obtaining an understanding of internal control over financial reporting, assessing the risk that a material weakness exists, and testing and evaluating the design and operating effectiveness of internal control based on the assessed risk. Our audit also included performing such other procedures as we considered necessary in the circumstances. We believe that our audit provides a reasonable basis for our opinion.
Definition and Limitations of Internal Control Over Financial Reporting
A company’s internal control over financial reporting is a process designed to provide reasonable assurance regarding the reliability of financial reporting and the preparation of financial statements for external purposes in accordance with generally accepted accounting principles. A company’s internal control over financial reporting includes those policies and procedures that (1) pertain to the maintenance of records that, in reasonable detail, accurately and fairly reflect the transactions and dispositions of the assets of the company; (2) provide reasonable assurance that transactions are recorded as necessary to permit preparation of financial statements in accordance with generally accepted accounting principles, and that receipts and expenditures of the company are being made only in accordance with authorizations of management and directors of the company; and (3) provide reasonable assurance regarding prevention or timely detection of unauthorized acquisition, use, or disposition of the company’s assets that could have a material effect on the financial statements.
Because of its inherent limitations, internal control over financial reporting may not prevent or detect misstatements. Also, projections of any evaluation of effectiveness to future periods are subject to the risk that controls may become inadequate because of changes in conditions, or that the degree of compliance with the policies or procedures may deteriorate.
KPMG LLP
McLean, Virginia
February 13, 2019
39
NVR, Inc.
Consolidated Balance Sheets
(in thousands, except share and per share data)
|
December 31, 2018
|
December 31, 2017
|
||||||
|
ASSETS
|
|||||||
|
Homebuilding:
|
|||||||
|
Cash and cash equivalents
|
$
|
688,783
|
|
$
|
645,087
|
|
|
|
Restricted cash
|
16,982
|
|
19,438
|
|
|||
|
Receivables
|
18,641
|
|
20,026
|
|
|||
|
Inventory:
|
|||||||
|
Lots and housing units, covered under sales agreements with customers
|
1,076,904
|
|
1,046,094
|
|
|||
|
Unsold lots and housing units
|
115,631
|
|
148,620
|
|
|||
|
Land under development
|
38,857
|
|
34,212
|
|
|||
|
Building materials and other
|
21,718
|
|
17,273
|
|
|||
|
1,253,110
|
|
1,246,199
|
|
||||
|
Contract land deposits, net
|
396,177
|
|
370,429
|
|
|||
|
Property, plant and equipment, net
|
42,234
|
|
43,191
|
|
|||
|
Reorganization value in excess of amounts allocable to identifiable assets, net
|
41,580
|
|
41,580
|
|
|||
|
Deferred tax assets, net
|
112,333
|
|
111,953
|
|
|||
|
Other assets
|
71,671
|
|
86,977
|
|
|||
|
2,641,511
|
|
2,584,880
|
|
||||
|
Mortgage Banking:
|
|||||||
|
Cash and cash equivalents
|
23,092
|
|
21,707
|
|
|||
|
Restricted cash
|
3,071
|
|
2,256
|
|
|||
|
Mortgage loans held for sale, net
|
458,324
|
|
352,489
|
|
|||
|
Property and equipment, net
|
6,510
|
|
6,327
|
|
|||
|
Reorganization value in excess of amounts allocable to identifiable assets, net
|
7,347
|
|
7,347
|
|
|||
|
Other assets
|
26,078
|
|
14,273
|
|
|||
|
524,422
|
|
404,399
|
|
||||
|
Total assets
|
$
|
3,165,933
|
|
$
|
2,989,279
|
|
|
|
LIABILITIES AND SHAREHOLDERS' EQUITY
|
|||||||
|
Homebuilding:
|
|||||||
|
Accounts payable
|
$
|
244,496
|
|
$
|
261,973
|
|
|
|
Accrued expenses and other liabilities
|
332,871
|
|
341,891
|
|
|||
|
Customer deposits
|
138,246
|
|
150,033
|
|
|||
|
Senior notes
|
597,681
|
|
597,066
|
|
|||
|
1,313,294
|
|
1,350,963
|
|
||||
|
Mortgage Banking:
|
|||||||
|
Accounts payable and other liabilities
|
44,077
|
|
32,824
|
|
|||
|
44,077
|
|
32,824
|
|
||||
|
Total liabilities
|
1,357,371
|
|
1,383,787
|
|
|||
|
Commitments and contingencies
|
|
|
|
||||
|
Shareholders' equity:
|
|||||||
|
Common stock, $0.01 par value; 60,000,000 shares authorized; 20,555,330 shares issued as of both December 31, 2018 and December 31, 2017
|
206
|
|
206
|
|
|||
|
Additional paid-in capital
|
1,820,223
|
|
1,644,197
|
|
|||
|
Deferred compensation trust – 107,340 and 108,640 shares of NVR, Inc. common stock as of December 31, 2018 and December 31, 2017, respectively
|
(16,937
|
)
|
(17,383
|
)
|
|||
|
Deferred compensation liability
|
16,937
|
|
17,383
|
|
|||
|
Retained earnings
|
7,031,333
|
|
6,231,940
|
|
|||
|
Less treasury stock at cost – 16,977,499 and 16,864,324 shares as of December 31, 2018 and December 31, 2017, respectively
|
(7,043,200
|
)
|
(6,270,851
|
)
|
|||
|
Total shareholders' equity
|
1,808,562
|
|
1,605,492
|
|
|||
|
Total liabilities and shareholders' equity
|
$
|
3,165,933
|
|
$
|
2,989,279
|
|
|
See notes to consolidated financial statements.
40
NVR, Inc.
Consolidated Statements of Income
(in thousands, except per share data)
|
Year Ended December 31,
|
|||||||||||
|
2018
|
2017
|
2016
|
|||||||||
|
Homebuilding:
|
|||||||||||
|
Revenues
|
$
|
7,004,304
|
|
$
|
6,175,521
|
|
$
|
5,709,223
|
|
||
|
Other income
|
11,839
|
|
6,536
|
|
2,820
|
|
|||||
|
Cost of sales
|
(5,692,127
|
)
|
(4,990,378
|
)
|
(4,707,861
|
)
|
|||||
|
Selling, general and administrative
|
(428,874
|
)
|
(392,272
|
)
|
(382,459
|
)
|
|||||
|
Operating income
|
895,142
|
|
799,407
|
|
621,723
|
|
|||||
|
Interest expense
|
(24,036
|
)
|
(23,037
|
)
|
(20,621
|
)
|
|||||
|
Homebuilding income
|
871,106
|
|
776,370
|
|
601,102
|
|
|||||
|
Mortgage Banking:
|
|||||||||||
|
Mortgage banking fees
|
159,370
|
|
130,319
|
|
113,321
|
|
|||||
|
Interest income
|
11,593
|
|
7,850
|
|
7,569
|
|
|||||
|
Other income
|
2,546
|
|
2,048
|
|
1,652
|
|
|||||
|
General and administrative
|
(83,838
|
)
|
(68,528
|
)
|
(60,861
|
)
|
|||||
|
Interest expense
|
(1,045
|
)
|
(1,148
|
)
|
(1,086
|
)
|
|||||
|
Mortgage banking income
|
88,626
|
|
70,541
|
|
60,595
|
|
|||||
|
Income before taxes
|
959,732
|
|
846,911
|
|
661,697
|
|
|||||
|
Income tax expense
|
(162,535
|
)
|
(309,390
|
)
|
(236,435
|
)
|
|||||
|
Net income
|
$
|
797,197
|
|
$
|
537,521
|
|
$
|
425,262
|
|
||
|
Basic earnings per share
|
$
|
219.58
|
|
$
|
144.00
|
|
$
|
110.53
|
|
||
|
Diluted earnings per share
|
$
|
194.80
|
|
$
|
126.77
|
|
$
|
103.61
|
|
||
|
Basic weighted average shares outstanding
|
3,631
|
|
3,733
|
|
3,847
|
|
|||||
|
Diluted weighted average shares outstanding
|
4,092
|
|
4,240
|
|
4,104
|
|
|||||
See notes to consolidated financial statements.
41
NVR, Inc.
Consolidated Statements of Shareholders’ Equity
(in thousands)
|
|
Common
Stock
|
Additional
Paid-In
Capital
|
Retained
Earnings
|
Treasury
Stock
|
Deferred
Compensation
Trust
|
Deferred
Compensation
Liability
|
Total
|
||||||||||||||||||||
|
Balance, December 31, 2015
|
$
|
206
|
|
$
|
1,447,795
|
|
$
|
5,270,114
|
|
$
|
(5,478,950
|
)
|
$
|
(17,333
|
)
|
$
|
17,333
|
|
$
|
1,239,165
|
|
||||||
|
Net income
|
—
|
|
—
|
|
425,262
|
|
—
|
|
—
|
|
—
|
|
425,262
|
|
|||||||||||||
|
Deferred compensation activity, net
|
—
|
|
—
|
|
—
|
|
—
|
|
(42
|
)
|
42
|
|
—
|
|
|||||||||||||
|
Purchase of common stock for treasury
|
—
|
|
—
|
|
—
|
|
(455,351
|
)
|
—
|
|
—
|
|
(455,351
|
)
|
|||||||||||||
|
Equity-based compensation
|
—
|
|
43,598
|
|
—
|
|
—
|
|
—
|
|
—
|
|
43,598
|
|
|||||||||||||
|
Tax benefit from equity benefit plan activity
|
—
|
|
13,661
|
|
—
|
|
—
|
|
—
|
|
—
|
|
13,661
|
|
|||||||||||||
|
Proceeds from stock options exercised
|
—
|
|
38,106
|
|
—
|
|
—
|
|
—
|
|
—
|
|
38,106
|
|
|||||||||||||
|
Treasury stock issued upon option exercise and restricted share vesting
|
—
|
|
(27,332
|
)
|
—
|
|
27,332
|
|
—
|
|
—
|
|
—
|
|
|||||||||||||
|
Balance, December 31, 2016
|
206
|
|
1,515,828
|
|
5,695,376
|
|
(5,906,969
|
)
|
(17,375
|
)
|
17,375
|
|
1,304,441
|
|
|||||||||||||
|
Cumulative-effect adjustment from adoption of ASU 2016-09, net of tax
|
—
|
|
1,566
|
|
(957
|
)
|
—
|
|
—
|
|
—
|
|
609
|
|
|||||||||||||
|
Net income
|
—
|
|
—
|
|
537,521
|
|
—
|
|
—
|
|
—
|
|
537,521
|
|
|||||||||||||
|
Deferred compensation activity, net
|
—
|
|
—
|
|
—
|
|
—
|
|
(8
|
)
|
8
|
|
—
|
|
|||||||||||||
|
Purchase of common stock for treasury
|
—
|
|
—
|
|
—
|
|
(422,166
|
)
|
—
|
|
—
|
|
(422,166
|
)
|
|||||||||||||
|
Equity-based compensation
|
—
|
|
44,562
|
|
—
|
|
—
|
|
—
|
|
—
|
|
44,562
|
|
|||||||||||||
|
Proceeds from stock options exercised
|
—
|
|
140,525
|
|
—
|
|
—
|
|
—
|
|
—
|
|
140,525
|
|
|||||||||||||
|
Treasury stock issued upon option exercise and restricted share vesting
|
—
|
|
(58,284
|
)
|
—
|
|
58,284
|
|
—
|
|
—
|
|
—
|
|
|||||||||||||
|
Balance, December 31, 2017
|
206
|
|
1,644,197
|
|
6,231,940
|
|
(6,270,851
|
)
|
(17,383
|
)
|
17,383
|
|
1,605,492
|
|
|||||||||||||
|
Cumulative-effect adjustment from adoption of ASU 2014-09, net of tax
|
—
|
|
—
|
|
2,196
|
|
—
|
|
—
|
|
—
|
|
2,196
|
|
|||||||||||||
|
Net income
|
—
|
|
—
|
|
797,197
|
|
—
|
|
—
|
|
—
|
|
797,197
|
|
|||||||||||||
|
Deferred compensation activity, net
|
—
|
|
—
|
|
—
|
|
—
|
|
446
|
|
(446
|
)
|
—
|
|
|||||||||||||
|
Purchase of common stock for treasury
|
—
|
|
—
|
|
—
|
|
(846,134
|
)
|
—
|
|
—
|
|
(846,134
|
)
|
|||||||||||||
|
Equity-based compensation
|
—
|
|
75,701
|
|
—
|
|
—
|
|
—
|
|
—
|
|
75,701
|
|
|||||||||||||
|
Proceeds from stock options exercised
|
—
|
|
174,110
|
|
—
|
|
—
|
|
—
|
|
—
|
|
174,110
|
|
|||||||||||||
|
Treasury stock issued upon option exercise and restricted share vesting
|
—
|
|
(73,785
|
)
|
—
|
|
73,785
|
|
—
|
|
—
|
|
—
|
|
|||||||||||||
|
Balance, December 31, 2018
|
$
|
206
|
|
$
|
1,820,223
|
|
$
|
7,031,333
|
|
$
|
(7,043,200
|
)
|
$
|
(16,937
|
)
|
$
|
16,937
|
|
$
|
1,808,562
|
|
||||||
See notes to consolidated financial statements.
42
NVR, Inc.
Consolidated Statements of Cash Flows
(in thousands)
|
|
Year Ended December 31,
|
||||||||||
|
|
2018
|
2017
|
2016
|
||||||||
|
Cash flows from operating activities:
|
|||||||||||
|
Net income
|
$
|
797,197
|
|
$
|
537,521
|
|
$
|
425,262
|
|
||
|
Adjustments to reconcile net income to net cash provided by operating activities:
|
|||||||||||
|
Depreciation and amortization
|
20,168
|
|
22,667
|
|
22,269
|
|
|||||
|
Equity-based compensation expense
|
75,701
|
|
44,562
|
|
43,598
|
|
|||||
|
Contract land deposit and other impairments (recoveries), net
|
11,760
|
|
1,238
|
|
(4,269
|
)
|
|||||
|
Gain on sale of loans, net
|
(122,755
|
)
|
(99,132
|
)
|
(85,535
|
)
|
|||||
|
Deferred tax expense (benefit)
|
914
|
|
61,290
|
|
(10,024
|
)
|
|||||
|
Mortgage loans closed
|
(4,828,615
|
)
|
(4,077,372
|
)
|
(3,660,269
|
)
|
|||||
|
Mortgage loans sold and principal payments on mortgage loans held for sale
|
4,845,999
|
|
4,182,220
|
|
3,710,250
|
|
|||||
|
Distribution of earnings from unconsolidated joint ventures
|
4,596
|
|
4,788
|
|
10,016
|
|
|||||
|
Net change in assets and liabilities:
|
|||||||||||
|
Increase in inventory
|
(6,911
|
)
|
(154,099
|
)
|
(85,194
|
)
|
|||||
|
(Increase) decrease in contract land deposits
|
(30,863
|
)
|
8,177
|
|
(32,280
|
)
|
|||||
|
Increase in receivables
|
(1,008
|
)
|
(348
|
)
|
(8,779
|
)
|
|||||
|
(Decrease) increase in accounts payable and accrued expenses
|
(30,713
|
)
|
10,789
|
|
58,532
|
|
|||||
|
(Decrease) increase in customer deposits
|
(11,787
|
)
|
27,797
|
|
11,271
|
|
|||||
|
Other, net
|
(557
|
)
|
256
|
|
(1,860
|
)
|
|||||
|
Net cash provided by operating activities
|
723,126
|
|
570,354
|
|
392,988
|
|
|||||
|
Cash flows from investing activities:
|
|||||||||||
|
Investments in and advances to unconsolidated joint ventures
|
(284
|
)
|
(3,800
|
)
|
(653
|
)
|
|||||
|
Distribution of capital from unconsolidated joint ventures
|
10,515
|
|
8,029
|
|
11,672
|
|
|||||
|
Purchase of property, plant and equipment
|
(19,665
|
)
|
(20,269
|
)
|
(22,369
|
)
|
|||||
|
Proceeds from the sale of property, plant and equipment
|
1,257
|
|
847
|
|
1,000
|
|
|||||
|
Net cash used in investing activities
|
(8,177
|
)
|
(15,193
|
)
|
(10,350
|
)
|
|||||
|
Cash flows from financing activities:
|
|||||||||||
|
Purchase of treasury stock
|
(846,134
|
)
|
(422,166
|
)
|
(455,351
|
)
|
|||||
|
Distributions to partner in consolidated variable interest entity
|
(234
|
)
|
—
|
|
(150
|
)
|
|||||
|
Proceeds from the exercise of stock options
|
174,110
|
|
140,525
|
|
38,106
|
|
|||||
|
Net cash used in financing activities
|
(672,258
|
)
|
(281,641
|
)
|
(417,395
|
)
|
|||||
|
Net increase (decrease) in cash, restricted cash, and cash equivalents
|
42,691
|
|
273,520
|
|
(34,757
|
)
|
|||||
|
Cash, restricted cash, and cash equivalents, beginning of the year
|
689,557
|
|
416,037
|
|
450,794
|
|
|||||
|
Cash, restricted cash, and cash equivalents, end of the year
|
$
|
732,248
|
|
$
|
689,557
|
|
$
|
416,037
|
|
||
|
Supplemental disclosures of cash flow information:
|
|||||||||||
|
Interest paid during the year, net of interest capitalized
|
$
|
24,178
|
|
$
|
23,251
|
|
$
|
20,922
|
|
||
|
Income taxes paid during the year, net of refunds
|
$
|
181,166
|
|
$
|
260,232
|
|
$
|
218,984
|
|
||
See notes to consolidated financial statements.
43
NVR, Inc.
Notes to Consolidated Financial Statements
(dollars and shares in thousands, except per share data)
1. Summary of Significant Accounting Policies
Principles of Consolidation
The accompanying consolidated financial statements include the accounts of NVR, Inc. and its subsidiaries (“NVR” or the “Company”) and certain other entities in which the Company is deemed to be the primary beneficiary (see Notes 3 and 4 herein for additional information). All significant intercompany transactions have been eliminated in consolidation.
Use of Estimates in the Preparation of Financial Statements
The preparation of financial statements in conformity with accounting principles generally accepted in the United States of America (“GAAP”) requires management to make estimates and assumptions that affect the reported amounts of assets and liabilities, the disclosure of contingent assets and liabilities at the date of the financial statements, and the reported amounts of revenues and expenses during the reporting periods. Management continually evaluates the estimates used to prepare the consolidated financial statements and updates those estimates as necessary. In general, the Company’s estimates are based on historical experience, on information from third party professionals, and other various assumptions that are believed to be reasonable under the facts and circumstances. Actual results could differ materially from those estimates made by management.
Cash and Cash Equivalents
Cash and cash equivalents include short-term investments with original maturities of three months or less.
Homebuilding restricted cash was attributable to customer deposits for certain home sales. Mortgage banking restricted cash included amounts collected from customers for loans in process and closed mortgage loans held for sale.
At
December 31, 2018
and
2017
,
$320
and
$1,069
, respectively, of cash related to a consolidated variable interest entity is included in homebuilding “Other assets” on the accompanying consolidated balance sheet.
Homebuilding Inventory
The carrying value of inventory is stated at the lower of cost or market value. Cost of lots and completed and uncompleted housing units represent the accumulated actual cost of the units. Field construction supervisors’ salaries and related direct overhead expenses are included in inventory costs. Interest costs are not capitalized into inventory, with the exception of land under development and joint venture investments, as applicable (see below). Upon settlement, the cost of the unit is expensed on a specific identification basis. Cost of building materials is determined on a first-in, first-out basis.
Sold inventory is evaluated for impairment based on the contractual sales price compared to the total estimated cost to construct. Unsold inventory is evaluated for impairment by analyzing recent comparable sales prices within the applicable community compared to the costs incurred to date plus the expected costs to complete. Any calculated impairments are recorded immediately.
Contract Land Deposits
The Company purchases finished lots under fixed price lot purchase agreements (“Lot Purchase Agreements”) that require deposits that may be forfeited if NVR fails to perform under the contract. The deposits are in the form of cash or letters of credit in varying amounts and represent a percentage of the aggregate purchase price of the finished lots.
NVR maintains an allowance for losses on contract land deposits that reflects the Company’s judgment of the present loss exposure in the existing contract land deposit portfolio at the end of the reporting period. To analyze contract land deposit impairments, NVR conducts a loss contingency analysis each quarter. In addition to considering market and economic conditions, NVR assesses contract land deposit impairments on a community-by-community basis pursuant to the purchase contract terms, analyzing, as applicable, current sales absorption levels, recent sales’ direct profit, the dollar differential between the contractual purchase price and the current market price for lots, a developer’s financial stability, a developer’s financial ability or willingness to reduce lot prices to current market prices, if necessary, and the contract’s default status by either the Company or the developer along with an analysis of the expected outcome of any such default.
NVR’s analysis is focused on whether the Company can sell houses at an acceptable margin and sales pace in a particular community in the current market with which the Company is faced. Because the Company does not own the finished lots on which the Company has placed a contract land deposit, if the above analysis leads to a determination that the Company cannot sell homes at an acceptable margin and sales pace at the current contractual lot price, the Company then determines whether it will elect to default under the contract, forfeit the deposit and terminate the contract, or whether the Company will attempt to restructure the lot purchase contract, which may require it to forfeit the deposit to obtain contract concessions from a developer. The Company also assesses whether impairment is present due to collectability issues resulting from a developer’s non-performance because of financial or other conditions.
44
NVR, Inc.
Notes to Consolidated Financial Statements
(dollars and shares in thousands, except per share data)
For the years ended
December 31, 2018
and
2017
, the Company incurred net pre-tax charges of
$5,115
and
$1,238
, respectively, related to the impairment of contract land deposits. For the year ended December 31,
2016
, the Company recognized net pre-tax recoveries of
$4,269
of contract land deposits previously determined to be unrecoverable. The contract land deposit assets on the accompanying consolidated balance sheets are shown net of the allowance for losses of
$29,216
and
$29,999
at
December 31, 2018
and
2017
, respectively.
Land Under Development
On a limited basis, NVR directly acquires raw parcels of land already zoned for its intended use to develop into finished lots. Land under development includes the land acquisition costs, direct improvement costs, capitalized interest, where applicable, and real estate taxes.
Land under development, including the land under development held by the Company’s unconsolidated joint ventures and the related joint venture investments, is reviewed for potential write-downs when impairment indicators are present. In addition to considering market and economic conditions, the Company assesses land under development impairments on a community-by-community basis, analyzing, as applicable, current sales absorption levels, recent sales’ direct profit, and the dollar differential between the projected fully-developed cost of the lots and the current market price for lots. If indicators of impairment are present for a community, NVR performs an analysis to determine if the undiscounted cash flows estimated to be generated by those assets are less than their carrying amounts, and if so, impairment charges are required to be recorded in an amount by which the carrying amount of the assets exceeds the fair value of such assets. The Company’s determination of fair value is primarily based on discounting the estimated future cash flows at a rate commensurate with the inherent risks associated with the assets and related estimated cash flow streams. See Notes 4 and 5 for further discussion of land under development and joint venture investments, respectively.
Property, Plant, and Equipment
Property, plant, and equipment are carried at cost less accumulated depreciation and amortization. Depreciation is based on the estimated useful lives of the assets using the straight-line method. Model home furniture and fixtures are generally depreciated over a
two
-year period, office facilities and other equipment are depreciated over a period of
three
to
ten
years and production facilities are depreciated over periods of
five
to
forty
years.
Intangible Assets
On December 31, 2012, the Company acquired substantially all of the assets of Heartland Homes, Inc., which resulted in the Company recording finite-lived intangible assets and goodwill. The Company completed its annual assessment for impairment of goodwill and management determined that there was
no
impairment. As of
December 31, 2018
and
2017
, finite-lived intangible assets, net of accumulated amortization, totaled
$621
and
$776
, respectively. The remaining finite-lived intangible assets will be amortized on a straight-line basis over
4
years. As of both
December 31, 2018
and
2017
, the goodwill value was
$441
. Finite-lived intangible assets and goodwill are included in homebuilding "Other assets" in the accompanying consolidated balance sheets.
Warranty/Product Liability Reserves
The Company establishes warranty and product liability reserves to provide for estimated future expenses as a result of construction and product defects, product recalls and litigation incidental to NVR’s homebuilding business. Liability estimates are determined based on management’s judgment considering such factors as historical experience, the likely current cost of corrective action, manufacturers’ and subcontractors’ participation in sharing the cost of corrective action, consultations with third party experts such as engineers, and discussions with the Company’s General Counsel and outside counsel retained to handle specific product liability cases.
Mortgage Repurchase Reserve, Mortgage Loans Held for Sale and Derivatives and Hedging Activities
NVR originates several different loan products to its customers to finance the purchase of a home through its wholly-owned mortgage subsidiary, NVR Mortgage Finance, Inc. (“NVRM”). NVRM sells all of the loans it originates into the secondary market on a servicing released basis, typically within
30
days from closing. All of the loans that NVRM originates are underwritten to the standards and specifications of the ultimate investor. Those underwriting standards are typically equal to or more stringent than the underwriting standards required by Fannie Mae (“FNMA”), Freddie Mac ("FHLMC"), the Department of Veterans Affairs (“VA”) and the Federal Housing Administration (“FHA”). Insofar as NVRM underwrites its originated loans to those standards, NVRM bears no increased concentration of credit risk from the issuance of loans, except in certain limited instances where early payment default occurs. NVRM employs a quality control department to ensure that its underwriting controls are effectively operating, and further assesses the underwriting function as part of its assessment of internal controls over financial reporting. NVRM maintains a reserve for losses on mortgage loans originated that reflects NVR’s judgment of the present loss exposure in the loans that NVRM has originated and sold. The reserve is calculated based on an analysis of historical experience and exposure (see Note 15 herein for further information).
45
NVR, Inc.
Notes to Consolidated Financial Statements
(dollars and shares in thousands, except per share data)
Mortgage loans held for sale are recorded at fair value when closed, and thereafter are carried at the lower of cost or fair value, net of deferred origination costs, until sold.
In the normal course of business, NVRM enters into contractual commitments to extend credit to buyers of single-family homes with fixed expiration dates. The commitments become effective when the borrowers “lock-in” a specified interest rate within time frames established by NVRM. All mortgagors are evaluated for credit worthiness prior to the extension of the commitment. Market risk arises if interest rates move adversely between the time of the “lock-in” of rates by the borrower and the sale date of the loan to a broker/dealer. To mitigate the effect of the interest rate risk inherent in providing rate lock commitments to borrowers, NVRM enters into optional or mandatory delivery forward sale contracts to sell whole loans and mortgage-backed securities to broker/dealers. The forward sale contracts lock-in an interest rate and price for the sale of loans similar to the specific rate lock commitments. NVRM does not engage in speculative or trading derivative activities. Both the rate lock commitments to borrowers and the forward sale contracts to broker/dealers are undesignated derivatives, and, accordingly, are marked to fair value through earnings. At
December 31, 2018
, there were contractual commitments to extend credit to borrowers aggregating
$682,152
, and open forward delivery sale contracts aggregating
$1,089,923
, which hedge both the rate lock loan commitments and closed loans held for sale (see Note 14 herein for a description of the Company’s fair value accounting).
Earnings per Share
The following weighted average shares and share equivalents were used to calculate basic and diluted earnings per share for the years ended
December 31, 2018
,
2017
and
2016
:
|
|
Year Ended December 31,
|
||||||||
|
|
2018
|
2017
|
2016
|
||||||
|
Weighted average number of shares outstanding used to
calculate basic EPS
|
3,631
|
|
3,733
|
|
3,847
|
|
|||
|
Dilutive securities:
|
|
|
|
|
|||||
|
Stock options and restricted share units
|
461
|
|
507
|
|
257
|
|
|||
|
Weighted average number of shares and share equivalents outstanding used to calculate diluted EPS
|
4,092
|
|
4,240
|
|
4,104
|
|
|||
The assumed proceeds used in the treasury method for calculating NVR’s diluted earnings per share includes the amount the employee must pay upon exercise and the amount of compensation cost attributed to future services not yet recognized.
The following stock options issued under equity incentive plans were outstanding during the years ended
December 31, 2018
,
2017
and
2016
, but were not included in the computation of diluted earnings per share because the effect would have been anti-dilutive.
|
|
Year Ended December 31,
|
||||||||
|
|
2018
|
2017
|
2016
|
||||||
|
Anti-dilutive securities
|
370
|
|
15
|
|
87
|
|
|||
Revenues – Homebuilding Operations
NVR builds single-family detached homes, townhomes and condominium buildings, which generally are constructed on a pre-sold basis. Revenue is recognized on the settlement date at the contract sales price,when control is transferred to our customers.
Mortgage Banking Fees
Mortgage banking fees include income earned by NVRM for originating mortgage loans, servicing mortgage loans held on an interim basis, title fees, gains and losses on the sale of mortgage loans and mortgage servicing and other activities incidental to mortgage banking. Mortgage banking fees are generally recognized after the loan has been sold to an unaffiliated, third party investor.
Income Taxes
Income taxes are accounted for under the asset and liability method. Deferred tax assets and liabilities are recognized for the future tax consequences attributable to differences between the financial statement carrying amounts of existing assets and liabilities and their respective tax basis. Deferred tax assets and liabilities are measured using enacted tax rates expected to apply to taxable income in the years in which those temporary differences are expected to be recovered or settled. The effect on the deferred tax assets and liabilities of a change in tax rates is recognized in income in the period that includes the enactment date. See Note 11 herein for
46
NVR, Inc.
Notes to Consolidated Financial Statements
(dollars and shares in thousands, except per share data)
discussion of the impact on the Company's deferred tax asset resulting from the enactment of the Tax Cuts and Jobs Act in December 2017.
ASC 740-10,
Income Taxes
, provides that a tax benefit from an uncertain tax position may be recognized when it is more-likely-than-not (defined as a likelihood of more than 50%) that the position will be sustained upon examination, including resolution of any related appeals or litigation processes, based on the technical merits. If a tax position does not meet the more-likely-than-not recognition threshold, despite the Company’s belief that its filing position is supportable, the benefit of that tax position is not recognized in the statements of income. The Company recognizes interest related to unrecognized tax benefits as a component of income tax expense. Based on its historical experience in dealing with various taxing authorities, the Company has found that it is the administrative practice of the taxing authorities to not seek penalties from the Company for the tax positions it has taken on its returns related to its unrecognized tax benefits. Therefore, the Company does not accrue penalties for the positions in which it has an unrecognized tax benefit. However, if such penalties were to be accrued, they would be recorded as a component of income tax expense. The Company recognizes unrecognized tax benefits in the period that the uncertainty is eliminated by either affirmative agreement of the uncertain tax position by the applicable taxing authority, by expiration of the applicable statute of limitation, or by determination in accordance with certain states’ administrative practices that the uncertain tax position has been effectively settled (see Note 11 herein for further information).
Financial Instruments
Except as otherwise noted herein, NVR believes that the carrying value approximates the fair value of its financial instruments (see Note 14 herein for further information).
Equity-Based Compensation
The Company recognizes equity-based compensation expense within its income statement for all share-based payment arrangements, which includes non-qualified stock options to purchase shares of NVR common stock ("Options") and restricted share units ("RSUs"). Compensation expense is based on the grant-date fair value of the Options and RSUs granted, and is recognized on a straight-line basis over the requisite service period for the entire award (from the date of grant through the period of the last separately vesting portion of the grant). Options and RSUs which are subject to a performance condition are treated as a separate award from the “service-only” Options and RSUs, and compensation expense is recognized when it becomes probable that the stated performance target will be achieved. The Company calculates the fair value of its Options, which are non-publicly traded, using the Black-Scholes option-pricing model. The grant date fair value of the RSUs is the closing price of the Company’s common stock on the day immediately preceding the date of grant. The reversal of compensation expense previously recognized for grants forfeited is recorded in the period in which the forfeiture occurs. The Company’s equity-based compensation plans are accounted for as equity-classified awards (see Note 12 herein for further discussion of equity-based compensation plans).
Comprehensive Income
For the years ended
December 31, 2018
,
2017
and
2016
, comprehensive income equaled net income; therefore, a separate statement of comprehensive income is not included in the accompanying consolidated financial statements.
Reclassifications
Certain prior period amounts have been reclassified to conform to the current year's presentation.
Recent Accounting Pronouncements
Recently Adopted Accounting Pronouncements
Revenue from Contracts with Customers
On January 1, 2018, the Company adopted Accounting Standards Update ("ASU") 2014-09,
Revenue from Contracts with Customers (Topic 606)
, using the modified retrospective method applied to those contracts which were not completed as of January 1, 2018.
Revenue Recognition
Consistent with the Company’s previous revenue recognition practice, homebuilding revenue is recognized on the settlement date at the contract sales price, when control is transferred to our customers. Mortgage banking revenue recognition continues to be governed by Accounting Standards Codification ("ASC") Topic 815 -
Derivatives and Hedging
and ASC Topic 825 -
Financial Instruments,
and is not subject to Topic 606. See Note 2 for disclosure of revenue by reporting segment.
47
NVR, Inc.
Notes to Consolidated Financial Statements
(dollars and shares in thousands, except per share data)
The Company’s contract liabilities, consisting of deposits received from customers (“Handmoney”) on homes not settled, were
$138,246
and
$150,033
as of
December 31, 2018
and
2017
, respectively. For the year ended
December 31, 2018
, the Company recognized in revenue substantially all of the
$150,033
in Handmoney held as of
December 31, 2017
.
The Company’s prepaid sales compensation totaled approximately
$17,000
and
$19,500
, as of
December 31, 2018
and
December 31, 2017
, respectively. These amounts are included in homebuilding “Other assets” on the accompanying consolidated balance sheets.
Deferred Revenue
Topic 606 no longer requires sellers of real estate to consider the initial and continuing involvement criteria in ASC 360-20, but instead only conclude on the collectibility of the transaction price. On January 1, 2018, the Company recorded a cumulative-effect adjustment, net of tax, of
$2,196
to recognize deferred profit on home settlements for which the Company had previously determined that there was significant continuing involvement and believed to be fully collectible. Revenue recognized in 2018 would not have been materially different under prior GAAP.
Practical Expedients and Exemption
At contract inception, the performance obligation to complete and settle the home with a customer has an expected duration of less than one year. As a result, the Company does not disclose the value of unsatisfied performance obligations for contracts.
No other adjustments were made as a result of the adoption of Topic 606.
Other recently adopted accounting pronouncements
The Company adopted ASU 2016-15,
Classification of Certain Cash Receipts and Cash Payments,
effective January 1, 2018. In connection with the adoption of ASU 2016-15, the Company made the election to classify distributions received from unconsolidated joint ventures using the cumulative earnings approach. This election was applied retrospectively, which reclassified a portion of distributions received from the Company's unconsolidated joint ventures between operating and investing activities on the prior year consolidated statement of cash flows. The adoption of this standard did not have a material effect on the Company's consolidated statements of cash flows and related disclosures.
The Company adopted ASU 2016-18,
Statement of Cash Flows (Topic 230), Restricted Cash,
effective January 1, 2018. The amendments in the standard require that the statement of cash flows explain the change during the period in the total of cash, cash equivalents and restricted cash or restricted cash equivalents. As a result, the Company's beginning-of-period and end-of-period cash balances presented in the consolidated statements of cash flows were retrospectively adjusted to include restricted cash with cash and cash equivalents. The beginning-of-period and end-of-period cash, restricted cash, and cash equivalent balances presented on the accompanying consolidated statements of cash flows include cash related to a consolidated joint venture, which is included in homebuilding "Other assets" on the Company's consolidated balance sheets. The cash related to this consolidated joint venture as of
December 31, 2018
,
2017
and
2016
was
$320
,
$1,069
and
$1,214
, respectively. The adoption of this standard did not have a material effect on the Company's consolidated statements of cash flows and related disclosures.
Recently Issued Accounting Pronouncements
In February 2016, FASB issued ASU 2016-02,
Leases (Topic 842)
, which requires lessees to recognize most leases on-balance sheet with a liability equal to the present value of lease payments over the lease term and a right-of-use asset for the right to use the underlying asset over the lease term. Lessees will recognize expenses on their income statements in a manner similar to current GAAP. The standard also requires additional disclosures of key information about leasing arrangements. The standard was effective for the Company as of January 1, 2019. Based on its current portfolio of leases, the Company expects that the adoption of this standard will result in the recognition of less than
$100,000
of right-of-use assets and corresponding liabilities on its balance sheet, predominately related to real estate leases.
Additionally, in July 2018 the FASB issued ASU 2018-11,
Leases (Topic 842): Targeted Improvements
, which provides companies with relief from the costs of implementing certain aspects of the new lease standard. The ASU amends Topic 842 so that entities may elect not to restate their comparative periods during transition. Previously, the new lease standard required that an entity apply the new rules beginning with the earliest comparative period of financial statements presented (the modified retrospective approach). The Company has elected to use the transition relief provided under Topic 842 upon adoption of the standard effective January 1, 2019.
In June 2016, FASB issued ASU 2016-13,
Financial Instruments – Credit Losses (Topic 326)
, which significantly changes the way impairment of financial assets is recognized. The standard will require immediate recognition of estimated credit losses expected
48
NVR, Inc.
Notes to Consolidated Financial Statements
(dollars and shares in thousands, except per share data)
to occur over the remaining life of many financial assets, which will generally result in earlier recognition of allowances for credit losses on loans and other financial instruments. The standard’s provisions will be applied as a cumulative-effect adjustment to beginning retained earnings as of the effective date. The standard is effective for the Company as of January 1, 2020. The Company does not believe that the adoption of this standard will have a material effect on its consolidated financial statements and related disclosures.
In January 2017, FASB issued ASU 2017-04,
Intangibles – Goodwill and Other (Topic 350), Simplifying the Test for Goodwill Impairment
. The standard’s objective is to simplify the subsequent measurement of goodwill by eliminating the second step from the goodwill impairment test. Under the amendments in the standard, an entity would perform its annual, or interim, goodwill impairment test by comparing the fair value of a reporting unit with its carrying amount. If the carrying amount of a reporting unit exceeds its fair value, an impairment charge would then be recognized, not to exceed the amount of goodwill allocated to that reporting unit. The standard is effective for the Company on January 1, 2020, and early adoption is permitted. The Company does not believe that the adoption of this standard will have a material effect on its consolidated financial statements and related disclosures.
2. Segment Information, Nature of Operations, and Certain Concentrations
NVR’s homebuilding operations primarily construct and sell single-family detached homes, townhomes and condominium buildings under
three
trade names: Ryan Homes, NVHomes and Heartland Homes. The Ryan Homes product is marketed primarily to first-time and first-time move-up buyers. Ryan Homes operates in
thirty-two
metropolitan areas located in Maryland, Virginia, Washington, D.C., West Virginia, Pennsylvania, New York, North Carolina, South Carolina, Florida, Ohio, New Jersey, Delaware, Indiana, Illinois and Tennessee. The NVHomes and Heartland Homes products are marketed primarily to move-up and luxury buyers. NVHomes operates in Delaware and the Washington, D.C., Baltimore, MD and Philadelphia, PA metropolitan areas. Heartland Homes operates in the Pittsburgh, PA metropolitan area. NVR derived approximately
30%
and
10%
of its
2018
homebuilding revenues from the Washington, D.C. and Baltimore, MD metropolitan areas, respectively.
NVR’s mortgage banking segment is a regional mortgage banking operation. Substantially all of the mortgage banking segment’s loan closing activity is for NVR’s homebuilding customers. NVR’s mortgage banking business generates revenues primarily from origination fees, gains on sales of loans, and title fees. A substantial portion of the Company’s mortgage operations is conducted in the Washington, D.C. and Baltimore, MD metropolitan areas.
The following disclosure includes
four
homebuilding reportable segments that aggregate geographically the Company’s homebuilding operating segments, and the mortgage banking operations presented as a single reportable segment. The homebuilding reportable segments are comprised of operating divisions in the following geographic areas:
|
Mid Atlantic:
|
|
Maryland, Virginia, West Virginia, Delaware and Washington, D.C.
|
|
North East:
|
|
New Jersey and Eastern Pennsylvania
|
|
Mid East:
|
|
New York, Ohio, Western Pennsylvania, Indiana and Illinois
|
|
South East:
|
|
North Carolina, South Carolina, Florida and Tennessee
|
Homebuilding profit before tax includes all revenues and income generated from the sale of homes, less the cost of homes sold, selling, general and administrative expenses, and a corporate capital allocation charge. The corporate capital allocation charge is eliminated in consolidation and is based on the segment’s average net assets employed. The corporate capital allocation charged to the operating segment allows the Chief Operating Decision Maker (“CODM”) to determine whether the operating segment’s results are providing the desired rate of return after covering the Company’s cost of capital. In addition, certain assets including goodwill and intangible assets, and consolidation adjustments as discussed further below, are not allocated to the operating segments as those assets are neither included in the operating segment’s corporate capital allocation charge, nor in the CODM’s evaluation of the operating segment’s performance. The Company records charges on contract land deposits when it is determined that it is probable that recovery of the deposit is impaired. For segment reporting purposes, impairments on contract land deposits are charged to the operating segment upon the termination of a Lot Purchase Agreement with the developer, or the restructuring of a Lot Purchase Agreement resulting in the forfeiture of the deposit. Mortgage banking profit before tax consists of revenues generated from mortgage financing, title insurance and closing services, less the costs of such services and general and administrative costs. Mortgage banking operations are not charged a corporate capital allocation charge.
In addition to the corporate capital allocation and contract land deposit impairments discussed above, the other reconciling items between segment profit and consolidated profit before tax include unallocated corporate overhead (including all management incentive compensation), equity-based compensation expense, consolidation adjustments and external corporate interest expense. NVR’s overhead functions, such as accounting, treasury and human resources are centrally performed and the costs are not allocated to the Company’s operating segments. Consolidation adjustments consist of such items necessary to convert the reportable segments’ results, which are predominantly maintained on a cash basis, to a full accrual basis for external financial statement presentation purposes, and are not allocated to the Company’s operating segments. External corporate interest expense primarily consists of interest
49
NVR, Inc.
Notes to Consolidated Financial Statements
(dollars and shares in thousands, except per share data)
charges on the Company’s
3.95%
Senior Notes due 2022 (the “Senior Notes”) and is not charged to the operating segments because the charges are included in the corporate capital allocation discussed above.
Following are tables presenting segment revenues, profit before taxes, assets, interest income, interest expense, depreciation and amortization and expenditures for property and equipment, with reconciliations to the amounts reported for the consolidated enterprise, where applicable:
|
|
Year Ended December 31,
|
|||||||||||
|
|
2018
|
2017
|
2016
|
|||||||||
|
Revenues:
|
|
|
|
|||||||||
|
Homebuilding Mid Atlantic
|
$
|
3,893,358
|
|
$
|
3,543,687
|
|
$
|
3,319,776
|
|
|||
|
Homebuilding North East
|
580,726
|
|
517,141
|
|
462,385
|
|
||||||
|
Homebuilding Mid East
|
1,455,834
|
|
1,250,165
|
|
1,192,472
|
|
||||||
|
Homebuilding South East
|
1,074,386
|
|
864,528
|
|
734,590
|
|
||||||
|
Mortgage Banking
|
159,370
|
|
130,319
|
|
113,321
|
|
||||||
|
Consolidated revenues
|
$
|
7,163,674
|
|
$
|
6,305,840
|
|
$
|
5,822,544
|
|
|||
|
|
Year Ended December 31,
|
|||||||||||
|
|
2018
|
2017
|
2016
|
|||||||||
|
Profit before taxes:
|
|
|
|
|||||||||
|
Homebuilding Mid Atlantic
|
$
|
462,178
|
|
$
|
398,494
|
|
$
|
301,173
|
|
|||
|
Homebuilding North East
|
69,789
|
|
60,218
|
|
21,947
|
|
||||||
|
Homebuilding Mid East
|
175,134
|
|
149,639
|
|
121,166
|
|
||||||
|
Homebuilding South East
|
118,296
|
|
95,826
|
|
71,098
|
|
||||||
|
Mortgage Banking
|
93,462
|
|
73,959
|
|
63,711
|
|
||||||
|
Total segment profit
|
918,859
|
|
778,136
|
|
579,095
|
|
||||||
|
Reconciling items:
|
|
|
|
|||||||||
|
Contract land deposit reserve adjustment (1)
|
783
|
|
1,307
|
|
10,933
|
|
||||||
|
Equity-based compensation expense (2)
|
(75,701
|
)
|
(44,562
|
)
|
(43,598
|
)
|
||||||
|
Corporate capital allocation (3)
|
213,903
|
|
198,384
|
|
189,992
|
|
||||||
|
Unallocated corporate overhead
|
(89,973
|
)
|
(89,514
|
)
|
(89,376
|
)
|
||||||
|
Consolidation adjustments and other
|
15,829
|
|
26,143
|
|
35,204
|
|
||||||
|
Corporate interest expense
|
(23,968
|
)
|
(22,983
|
)
|
(20,553
|
)
|
||||||
|
Reconciling items sub-total
|
40,873
|
|
68,775
|
|
82,602
|
|
||||||
|
Consolidated profit before taxes
|
$
|
959,732
|
|
$
|
846,911
|
|
$
|
661,697
|
|
|||
|
(1)
|
This item represents changes to the contract land deposit impairment reserve, which are not allocated to the reportable segments.
|
|
(2)
|
The increase in equity-based compensation expense for the year ended December 31, 2018 was primarily attributable to the issuance of Options and RSUs in the second quarter of 2018. See Note 12 for additional discussion of equity-based compensation.
|
|
(3)
|
This item represents the elimination of the corporate capital allocation charge included in the respective homebuilding reportable segments. The corporate capital allocation charge is based on the segment’s monthly average asset balance, and was as follows for the years presented:
|
50
NVR, Inc.
Notes to Consolidated Financial Statements
(dollars and shares in thousands, except per share data)
|
|
Year Ended December 31,
|
|||||||||||
|
|
2018
|
2017
|
2016
|
|||||||||
|
Corporate capital allocation charge:
|
|
|
|
|
||||||||
|
Homebuilding Mid Atlantic
|
$
|
123,855
|
|
$
|
123,028
|
|
$
|
119,758
|
|
|||
|
Homebuilding North East
|
17,893
|
|
16,115
|
|
18,132
|
|
||||||
|
Homebuilding Mid East
|
35,803
|
|
29,663
|
|
28,303
|
|
||||||
|
Homebuilding South East
|
36,352
|
|
29,578
|
|
23,799
|
|
||||||
|
Total corporate capital allocation charge
|
$
|
213,903
|
|
$
|
198,384
|
|
$
|
189,992
|
|
|||
|
|
As of December 31,
|
|||||||
|
|
2018
|
2017
|
||||||
|
Assets:
|
|
|
||||||
|
Homebuilding Mid Atlantic
|
$
|
1,018,953
|
|
$
|
1,079,225
|
|
||
|
Homebuilding North East
|
144,412
|
|
143,008
|
|
||||
|
Homebuilding Mid East
|
290,815
|
|
263,019
|
|
||||
|
Homebuilding South East
|
332,468
|
|
277,705
|
|
||||
|
Mortgage Banking
|
517,075
|
|
397,052
|
|
||||
|
Total segment assets
|
2,303,723
|
|
2,160,009
|
|
||||
|
Reconciling items:
|
|
|
||||||
|
Cash and cash equivalents
|
688,783
|
|
645,087
|
|
||||
|
Deferred taxes
|
112,333
|
|
111,953
|
|
||||
|
Intangible assets and goodwill
|
49,989
|
|
50,144
|
|
||||
|
Contract land deposit reserve
|
(29,216
|
)
|
(29,999
|
)
|
||||
|
Consolidation adjustments and other
|
40,321
|
|
52,085
|
|
||||
|
Reconciling items sub-total
|
862,210
|
|
829,270
|
|
||||
|
Consolidated assets
|
$
|
3,165,933
|
|
$
|
2,989,279
|
|
||
|
|
Year Ended December 31,
|
|||||||||||
|
|
2018
|
2017
|
2016
|
|||||||||
|
Interest income:
|
|
|
|
|||||||||
|
Mortgage Banking
|
$
|
11,593
|
|
$
|
7,850
|
|
$
|
7,569
|
|
|||
|
Total segment interest income
|
11,593
|
|
7,850
|
|
7,569
|
|
||||||
|
Other unallocated interest income
|
8,588
|
|
4,554
|
|
1,111
|
|
||||||
|
Consolidated interest income
|
$
|
20,181
|
|
$
|
12,404
|
|
$
|
8,680
|
|
|||
|
|
Year Ended December 31,
|
|||||||||||
|
|
2018
|
2017
|
2016
|
|||||||||
|
Interest expense:
|
|
|
|
|||||||||
|
Homebuilding Mid Atlantic
|
$
|
123,908
|
|
$
|
123,075
|
|
$
|
119,808
|
|
|||
|
Homebuilding North East
|
17,897
|
|
16,117
|
|
18,141
|
|
||||||
|
Homebuilding Mid East
|
35,804
|
|
29,663
|
|
28,307
|
|
||||||
|
Homebuilding South East
|
36,362
|
|
29,583
|
|
23,804
|
|
||||||
|
Mortgage Banking
|
1,045
|
|
1,148
|
|
1,086
|
|
||||||
|
Total segment interest expense
|
215,016
|
|
199,586
|
|
191,146
|
|
||||||
|
Corporate capital allocation (3)
|
(213,903
|
)
|
(198,384
|
)
|
(189,992
|
)
|
||||||
|
Senior Notes and other interest
|
23,968
|
|
22,983
|
|
20,553
|
|
||||||
|
Consolidated interest expense
|
$
|
25,081
|
|
$
|
24,185
|
|
$
|
21,707
|
|
|||
51
NVR, Inc.
Notes to Consolidated Financial Statements
(dollars and shares in thousands, except per share data)
|
|
Year Ended December 31,
|
|||||||||||
|
|
2018
|
2017
|
2016
|
|||||||||
|
Depreciation and amortization:
|
|
|
|
|||||||||
|
Homebuilding Mid Atlantic
|
$
|
7,753
|
|
$
|
8,095
|
|
$
|
8,089
|
|
|||
|
Homebuilding North East
|
1,600
|
|
2,034
|
|
2,053
|
|
||||||
|
Homebuilding Mid East
|
3,481
|
|
3,590
|
|
3,748
|
|
||||||
|
Homebuilding South East
|
2,523
|
|
2,531
|
|
2,276
|
|
||||||
|
Mortgage Banking
|
1,489
|
|
1,297
|
|
1,117
|
|
||||||
|
Total segment depreciation and amortization
|
16,846
|
|
17,547
|
|
17,283
|
|
||||||
|
Unallocated corporate
|
3,322
|
|
5,120
|
|
4,986
|
|
||||||
|
Consolidated depreciation and amortization
|
$
|
20,168
|
|
$
|
22,667
|
|
$
|
22,269
|
|
|||
|
|
Year Ended December 31,
|
|||||||||||
|
|
2018
|
2017
|
2016
|
|||||||||
|
Expenditures for property and equipment:
|
|
|
|
|||||||||
|
Homebuilding Mid Atlantic
|
$
|
6,657
|
|
$
|
9,257
|
|
$
|
8,838
|
|
|||
|
Homebuilding North East
|
1,074
|
|
1,299
|
|
3,423
|
|
||||||
|
Homebuilding Mid East
|
4,302
|
|
3,117
|
|
4,027
|
|
||||||
|
Homebuilding South East
|
2,732
|
|
3,313
|
|
3,594
|
|
||||||
|
Mortgage Banking
|
1,677
|
|
2,723
|
|
726
|
|
||||||
|
Total segment expenditures for property and equipment
|
16,442
|
|
19,709
|
|
20,608
|
|
||||||
|
Unallocated corporate
|
3,223
|
|
560
|
|
1,761
|
|
||||||
|
Consolidated expenditures for property and equipment
|
$
|
19,665
|
|
$
|
20,269
|
|
$
|
22,369
|
|
|||
3. Variable Interest Entities
Lot Purchase Agreements
NVR generally does not engage in the land development business. Instead, the Company typically acquires finished building lots at market prices from various development entities under Lot Purchase Agreements. The Lot Purchase Agreements require deposits that may be forfeited if NVR fails to perform under the Lot Purchase Agreements. The deposits required under the Lot Purchase Agreements are in the form of cash or letters of credit in varying amounts, and typically range up to
10%
of the aggregate purchase price of the finished lots.
NVR believes this lot acquisition strategy reduces the financial requirements and risks associated with direct land ownership and land development. NVR may, at its option, choose for any reason and at any time not to perform under these Lot Purchase Agreements by delivering notice of its intent not to acquire the finished lots under contract. NVR’s sole legal obligation and economic loss for failure to perform under these Lot Purchase Agreements is limited to the amount of the deposit pursuant to the liquidated damage provisions contained within the Lot Purchase Agreements. In other words, if NVR does not perform under a Lot Purchase Agreement, NVR loses only its deposit. None of the creditors of any of the development entities with which NVR enters Lot Purchase Agreements have recourse to the general credit of NVR. NVR generally does not have any specific performance obligations to purchase a certain number or any of the lots, nor does NVR guarantee completion of the development by the developer or guarantee any of the developers’ financial or other liabilities.
NVR is not involved in the design or creation of the development entities from which the Company purchases lots under Lot Purchase Agreements. The developer’s equity holders have the power to direct 100% of the operating activities of the development entity. NVR has no voting rights in any of the development entities. The sole purpose of the development entity’s activities is to generate positive cash flow returns for the equity holders. Further, NVR does not share in any of the profit or loss generated by the project’s development. The profits and losses are passed directly to the developer’s equity holders.
The deposit placed by NVR pursuant to the Lot Purchase Agreement is deemed to be a variable interest in the respective development entities. Those development entities are deemed to be variable interest entities (“VIE”). Therefore, the development entities with which NVR enters into Lot Purchase Agreements, including the joint venture limited liability corporations, discussed below, are evaluated for possible consolidation by NVR. An enterprise must consolidate a VIE when that enterprise has a controlling financial interest in the VIE. An enterprise is deemed to have a controlling financial interest if it has i) the power to direct the activities
52
NVR, Inc.
Notes to Consolidated Financial Statements
(dollars and shares in thousands, except per share data)
of a VIE that most significantly impact the entity’s economic performance, and ii) the obligation to absorb losses of the VIE that could be significant to the VIE or the rights to receive benefits from the VIE that could be significant to the VIE.
NVR believes the activities that most significantly impact a development entity’s economic performance are the operating activities of the entity. Unless and until a development entity completes finished building lots through the development process to be able to sell, the process of which the development entity’s equity investors bear the full risk, the entity does not earn any revenues. The operating development activities are managed solely by the development entity’s equity investors.
The development entities with which NVR contracts to buy finished lots typically select the respective projects, obtain the necessary zoning approvals, obtain the financing required with no support or guarantees from NVR, select who will purchase the finished lots and at what price, and manage the completion of the infrastructure improvements, all for the purpose of generating a cash flow return to the development entity’s equity holders and all independent of NVR. The Company possesses no more than limited protective legal rights through the Lot Purchase Agreement in the specific finished lots that it is purchasing, and NVR possesses no participative rights in the development entities. Accordingly, NVR does not have the power to direct the activities of a developer that most significantly impact the developer’s economic performance. For this reason, NVR has concluded that it is not the primary beneficiary of the development entities with which the Company enters into Lot Purchase Agreements, and therefore NVR does not consolidate any of these VIEs.
As of
December 31, 2018
, NVR controlled approximately
95,750
lots under Lot Purchase Agreements with third parties through deposits in cash and letters of credit totaling approximately
$420,900
and
$3,800
, respectively. As noted above, NVR’s sole legal obligation and economic loss for failure to perform under these Lot Purchase Agreements is limited to the amount of the deposit pursuant to the liquidated damage provisions contained in the Lot Purchase Agreements and, in very limited circumstances, specific performance obligations.
In addition, NVR has certain properties under contract with land owners that are expected to yield approximately
7,500
lots, which are not included in the number of total lots controlled. Some of these properties may require rezoning or other approvals to achieve the expected yield. These properties are controlled with deposits in cash and letters of credit totaling approximately
$4,500
and
$150
, respectively, as of
December 31, 2018
, of which approximately
$1,700
is refundable if NVR does not perform under the contract. NVR generally expects to assign the raw land contracts to a land developer and simultaneously enter into a Lot Purchase Agreement with the assignee if the project is determined to be feasible.
NVR’s total risk of loss related to contract land deposits as of
December 31, 2018
and
2017
was as follows:
|
|
December 31,
|
|||||||
|
|
2018
|
2017
|
||||||
|
Contract land deposits
|
$
|
425,393
|
|
$
|
400,428
|
|
||
|
Loss reserve on contract land deposits
|
(29,216
|
)
|
(29,999
|
)
|
||||
|
Contract land deposits, net
|
396,177
|
|
370,429
|
|
||||
|
Contingent obligations in the form of letters of credit
|
3,923
|
|
1,996
|
|
||||
|
Contingent specific performance obligations (1)
|
1,505
|
|
1,505
|
|
||||
|
Total risk of loss
|
$
|
401,605
|
|
$
|
373,930
|
|
||
|
(1)
|
As of both
December 31, 2018
and
2017
, the Company was committed to purchase
10
finished lots under specific performance obligations.
|
4. Joint Ventures
On a limited basis, NVR obtains finished lots using joint venture limited liability corporations (“JVs”). The JVs are typically structured such that NVR is a non-controlling member and is at risk only for the amount the Company has invested, or committed to invest, in addition to any deposits placed under Lot Purchase Agreements with the joint venture. NVR is not a borrower, guarantor or obligor on any debt of the JVs, as applicable. The Company enters into a standard Lot Purchase Agreement to purchase lots from these JVs, and as a result has a variable interest in these JVs.
During
2018
, the Company recognized an impairment of approximately
$7,400
, including approximately
$760
of capitalized interest, related to one of these JVs. The charge was recorded to homebuilding "Cost of sales" on the accompanying consolidated statements of income. None of the other JVs had any indicators of impairment during 2018.
At
December 31, 2018
, the Company had an aggregate investment totaling approximately
$29,400
in
six
JVs that are expected to produce approximately
6,800
finished lots, of which approximately
3,450
lots were controlled by the Company and the remaining approximately
3,350
lots were either under contract with unrelated parties or not currently under contract. In addition, NVR had
53
NVR, Inc.
Notes to Consolidated Financial Statements
(dollars and shares in thousands, except per share data)
additional funding commitments in the aggregate totaling
$5,000
to
three
of the JVs at
December 31, 2018
. The Company has determined that it is not the primary beneficiary of
five
of the JVs because NVR and the other JV partner either share power or the other JV partner has the controlling financial interest. The aggregate investment in unconsolidated JVs was approximately
$29,400
and
$45,200
at
December 31, 2018
and
2017
, respectively, and is reported in the “Other assets” line item on the accompanying consolidated balance sheets. For the remaining JV, NVR has concluded that it is the primary beneficiary because the Company has the controlling financial interest in the JV.
The condensed balance sheets of the consolidated JV at
December 31, 2018
and
2017
were as follows:
|
December 31,
|
||||||||
|
2018
|
2017
|
|||||||
|
Assets:
|
||||||||
|
Cash
|
$
|
320
|
|
$
|
1,069
|
|
||
|
Other assets
|
—
|
|
37
|
|
||||
|
Total assets
|
$
|
320
|
|
$
|
1,106
|
|
||
|
Liabilities and equity:
|
||||||||
|
Accrued expenses
|
$
|
282
|
|
$
|
487
|
|
||
|
Equity
|
38
|
|
619
|
|
||||
|
Total liabilities and equity
|
$
|
320
|
|
$
|
1,106
|
|
||
At
December 31, 2017
, the Company had an aggregate investment totaling approximately
$45,500
in
six
JVs that were expected to produce approximately
7,300
finished lots, of which approximately
3,900
lots were controlled by the Company and the remaining approximately
3,400
lots were either under contract with unrelated parties or not currently under contract. In addition, at
December 31, 2017
, NVR had additional funding commitments in the aggregate totaling
$5,300
to
three
of the JVs.
With the Company's adoption of ASU 2016-15
effective January 1, 2018, the Company made the election to classify distributions received from unconsolidated JVs using the cumulative earnings approach. As a result, distributions received up to the amount of cumulative earnings recognized by the Company are reported as distributions of earnings and those in excess of that amount are reported as a distribution of capital. These distributions are classified within the accompanying consolidated statements of cash flows as cash flows from operating activities and investing activities, respectively. See Note 1 for additional discussion regarding the Company's adoption of ASU 2016-15.
5. Land Under Development
On a limited basis, NVR directly acquires raw land parcels already zoned for its intended use to develop into finished lots. Land under development includes the land acquisition costs, direct improvement costs, capitalized interest where applicable, and real estate taxes.
As of
December 31, 2018
, NVR directly owned
three
separate raw parcels of land with a carrying value of
$38,857
that it intends to develop into approximately
500
finished lots primarily for use in its homebuilding operations. The Company also has additional funding commitments of approximately
$7,300
under a joint development agreement related to one parcel, a portion of which the Company expects will be offset by development credits of approximately
$4,600
. None of the raw parcels had any indicators of impairment as of
December 31, 2018
.
As of
December 31, 2017
, NVR directly owned
four
separate raw parcels of land with a carrying value of
$34,212
, which were expected to produce approximately
500
finished lots.
6. Capitalized Interest
The Company capitalizes interest costs to land under development during the active development of finished lots. In addition, the Company capitalizes interest costs to its joint venture investments while the investments are considered qualified assets pursuant to ASC 835-20,
Interest
. Capitalized interest is transferred to sold or unsold inventory as the development of finished lots is completed, then charged to cost of sales upon the Company’s settlement of homes and the respective lots. Interest incurred in excess of the interest capitalizable based on the level of qualified assets is expensed in the period incurred.
54
NVR, Inc.
Notes to Consolidated Financial Statements
(dollars and shares in thousands, except per share data)
NVR’s interest costs incurred, capitalized, expensed and charged to cost of sales during the years ended
December 31, 2018
,
2017
and
2016
was as follows:
|
|
December 31,
|
|||||||||||
|
|
2018
|
2017
|
2016
|
|||||||||
|
Interest capitalized, beginning of year
|
$
|
5,583
|
|
$
|
5,106
|
|
$
|
4,434
|
|
|||
|
Interest incurred
|
26,277
|
|
26,384
|
|
25,951
|
|
||||||
|
Interest charged to interest expense
|
(25,081
|
)
|
(24,185
|
)
|
(21,707
|
)
|
||||||
|
Interest charged to cost of sales
|
(2,625
|
)
|
(1,722
|
)
|
(3,572
|
)
|
||||||
|
Interest capitalized, end of year
|
$
|
4,154
|
|
$
|
5,583
|
|
$
|
5,106
|
|
|||
7. Related Party Transactions
During the year ended
December 31, 2018
, NVR entered into Lot Purchase Agreements to purchase finished building lots for a total purchase price of approximately
$121,700
with Elm Street Development, Inc. (“Elm Street”), which is controlled by
one
of the Company’s directors, William Moran. The independent members of the Company’s Board of Directors approved these transactions. During
2018
,
2017
and
2016
, NVR purchased developed lots at market prices from Elm Street for approximately
$36,100
,
$37,100
and
$44,500
, respectively.
The Company also continues to control a parcel of raw land expected to yield approximately
2,300
finished lots through a JV entered into with Elm Street during 2009. NVR did not make any investments in the JV in
2018
. During 2017, NVR and Elm Street each made an additional investment of
$2,900
in the JV. Further, during
2016
, the Company paid Elm Street
$143
to manage the development of a property that the Company purchased from Elm Street in 2010. No management fees were paid to Elm Street in 2018 or 2017 related to this property.
8. Property, Plant and Equipment (“PP&E”)
|
|
December 31,
|
|||||||
|
|
2018
|
2017
|
||||||
|
Homebuilding:
|
|
|
||||||
|
Office facilities and other
|
$
|
37,789
|
|
$
|
35,219
|
|
||
|
Model home furniture and fixtures
|
31,593
|
|
33,901
|
|
||||
|
Production facilities
|
64,667
|
|
61,348
|
|
||||
|
Gross Homebuilding PP&E
|
134,049
|
|
130,468
|
|
||||
|
Less: accumulated depreciation
|
(91,815
|
)
|
(87,277
|
)
|
||||
|
Net Homebuilding PP&E
|
$
|
42,234
|
|
$
|
43,191
|
|
||
|
Mortgage Banking:
|
|
|
||||||
|
Office facilities and other
|
$
|
13,724
|
|
$
|
14,069
|
|
||
|
Less: accumulated depreciation
|
(7,214
|
)
|
(7,742
|
)
|
||||
|
Net Mortgage Banking PP&E
|
$
|
6,510
|
|
$
|
6,327
|
|
||
9. Debt
Senior Notes
On
September 10, 2012
, NVR completed an offering for
$600,000
of Senior Notes under a shelf registration statement filed on September 5, 2012 with the Securities and Exchange Commission. The Senior Notes were issued at a discount to yield
3.97%
and have been reflected net of the unamortized discount in the accompanying consolidated balance sheet. The offering of the Senior Notes resulted in aggregate net proceeds of approximately
$593,900
, after deducting underwriting discounts and other offering expenses. The Senior Notes mature on
September 15, 2022
and bear interest at
3.95%
, payable
semi-annually in arrears on March 15 and September 15
. The Senior Notes have been reflected net of unamortized debt issuance costs of
$1,886
and
$2,395
as of
December 31, 2018
and
2017
, respectively.
55
The Senior Notes are senior unsecured obligations and rank equally in right of payment with any of NVR’s existing and future unsecured senior indebtedness, will rank senior in right of payment to any of NVR’s future indebtedness that is by its terms expressly subordinated to the Senior Notes and will be effectively subordinated to any of NVR’s existing and future secured indebtedness to the extent of the value of the collateral securing such indebtedness. The indenture governing the Senior Notes has, among other items, and subject to certain exceptions, covenants that restrict the Company’s ability to create, incur, assume or guarantee secured debt, enter into sale and leaseback transactions and conditions related to mergers and/or the sale of assets.
Credit Agreement
On July 15, 2016, NVR entered into an unsecured Credit Agreement (the “Credit Agreement”) with Bank of America, N.A., as Administrative Agent, Swing Line Lender and L/C Issuer, Merrill Lynch, Pierce, Fenner & Smith Incorporated as Sole Lead Arranger and Sole Book Runner, and the other lenders party thereto, which provides for aggregate revolving loan commitments of
$200,000
(the “Facility”). Proceeds of the borrowings under the Facility will be used for working capital and general corporate purposes. Under the Credit Agreement, the Company may request increases of up to
$300,000
to the Facility in the form of revolving loan commitments or term loans to the extent that new or existing lenders agree to provide additional revolving loan or term loan commitments. The Credit Agreement provides for a
$100,000
sublimit for the issuance of letters of credit of which approximately
$9,000
was outstanding at
December 31, 2018
, and a
$25,000
sublimit for a swing line commitment.
Borrowings under the Credit Agreement generally bear interest for Base Rate Loans at a Base Rate equal to the highest of (i) a Federal Funds Rate plus one-half of one percent, (ii) Bank of America’s publicly announced “prime rate,” and (iii) the Eurodollar Rate plus one percent, plus the Applicable Rate which is based on the Company’s debt rating, or for Eurodollar Rate Loans, at the Eurodollar Rate equal to LIBOR plus the Applicable Rate.
The Credit Agreement contains various representations and affirmative and negative covenants that are generally customary for credit facilities of this type. Such covenants include, among others, the following financial maintenance covenants: (i) minimum consolidated tangible net worth, (ii) minimum interest coverage ratio or minimum liquidity and (iii) a maximum leverage ratio. The negative covenants include, among others, certain limitations on liens, investments and fundamental changes. The Credit Agreement termination date is
July 15, 2021
. The Company was in compliance with all covenants under the Credit Agreement at
December 31, 2018
. There was
no
debt outstanding under the Facility at
December 31, 2018
.
Repurchase Agreement
On July 25, 2018, NVRM entered into the Tenth Amendment (the “Amendment”) to its Amended and Restated Master Repurchase Agreement dated August 2, 2011 with U.S. Bank National Association (as amended by the Amendment and nine earlier amendments, the “Repurchase Agreement”). The purpose of the Repurchase Agreement is to finance the origination of mortgage loans by NVRM. The Repurchase Agreement provides for loan purchases up to
$150,000
, subject to certain sub limits.
Advances under the Repurchase Agreement carry a Pricing Rate based on the LIBOR Rate plus the LIBOR Margin, as determined under the Repurchase Agreement, provided that the Pricing Rate shall not be less than
1.95%
. The Pricing Rate at
December 31, 2018
was
4.513%
. There are several restrictions on purchased loans, including that they cannot be sold to others, they cannot be pledged to anyone other than the agent, and they cannot support any other borrowing or repurchase agreement. Amounts outstanding under the Repurchase Agreement are collateralized by the Company’s mortgage loans held for sale. At
December 31, 2018
, there were no borrowing base limitations reducing the amount available under the Repurchase Agreement. As of both
December 31, 2018
and
2017
, there was no debt outstanding under the Repurchase Agreement. The Repurchase Agreement expires on
July 24, 2019
.
The Repurchase Agreement contains various affirmative and negative covenants. The negative covenants include, among others, certain limitations on transactions involving acquisitions, mergers, the incurrence of debt, sale of assets and creation of liens upon any of its Mortgage Notes. Additional covenants include (i) a tangible net worth requirement, (ii) a minimum liquidity requirement, (iii) a minimum net income requirement, and (iv) a maximum leverage ratio requirement. The Company was in compliance with all covenants under the Repurchase Agreement at
December 31, 2018
.
56
NVR, Inc.
Notes to Consolidated Financial Statements
(dollars and shares in thousands, except per share data)
10. Common Stock
There were approximately
3,578
and
3,691
common shares outstanding at
December 31, 2018
and
2017
, respectively. The Company made the following share repurchases during the years indicated:
|
|
Year Ended December 31,
|
|||||||||||
|
|
2018
|
2017
|
2016
|
|||||||||
|
Aggregate purchase price
|
$
|
846,134
|
|
$
|
422,166
|
|
$
|
455,351
|
|
|||
|
Number of shares repurchased
|
301
|
|
167
|
|
280
|
|
||||||
The Company issues shares from the treasury account for all equity plan activity. The Company issued
188
,
165
and
83
such shares during
2018
,
2017
and
2016
, respectively.
11. Income Taxes
The provision for income taxes consists of the following:
|
|
Year Ended December 31,
|
|||||||||||
|
|
2018
|
2017
|
2016
|
|||||||||
|
Current:
|
|
|
|
|||||||||
|
Federal
|
$
|
126,358
|
|
$
|
211,641
|
|
$
|
209,454
|
|
|||
|
State
|
37,038
|
|
37,006
|
|
38,095
|
|
||||||
|
Deferred:
|
|
|
|
|||||||||
|
Federal
|
138
|
|
60,785
|
|
(9,230
|
)
|
||||||
|
State
|
(999
|
)
|
(42
|
)
|
(1,884
|
)
|
||||||
|
Income tax expense
|
$
|
162,535
|
|
$
|
309,390
|
|
$
|
236,435
|
|
|||
Deferred income taxes on NVR’s consolidated balance sheets were comprised of the following:
|
|
December 31,
|
|||||||
|
|
2018
|
2017
|
||||||
|
Deferred tax assets:
|
|
|
||||||
|
Other accrued expenses and contract land deposit reserve
|
$
|
51,316
|
|
$
|
49,063
|
|
||
|
Deferred compensation
|
4,693
|
|
4,743
|
|
||||
|
Equity-based compensation expense
|
40,744
|
|
36,799
|
|
||||
|
Inventory
|
9,242
|
|
9,393
|
|
||||
|
Unrecognized tax benefit
|
13,587
|
|
14,351
|
|
||||
|
Other
|
5,113
|
|
9,681
|
|
||||
|
Total deferred tax assets
|
124,695
|
|
124,030
|
|
||||
|
Less: Deferred tax liabilities
|
6,091
|
|
4,511
|
|
||||
|
Net deferred tax asset
|
$
|
118,604
|
|
$
|
119,519
|
|
||
Deferred tax assets arise principally as a result of various accruals required for financial reporting purposes and equity-based compensation expense, which are not currently deductible for tax return purposes.
Management believes that the Company will have sufficient future taxable income to make it more likely than not that the net deferred tax assets will be realized. Federal taxable income is estimated to be approximately
$636,849
for the year ended
December 31, 2018
, and was
$621,587
for the year ended
December 31, 2017
.
57
NVR, Inc.
Notes to Consolidated Financial Statements
(dollars and shares in thousands, except per share data)
A reconciliation of income taxes computed at the federal statutory rate (
21%
in 2018 and
35%
in 2017 and 2016) to income tax expense is as follows:
|
|
Year Ended December 31,
|
|||||||||||
|
|
2018
|
2017
|
2016
|
|||||||||
|
Income taxes computed at the federal statutory rate
|
$
|
201,544
|
|
$
|
296,419
|
|
$
|
231,595
|
|
|||
|
State income taxes, net of federal income tax benefit (1)
|
42,944
|
|
30,046
|
|
23,738
|
|
||||||
|
Excess tax benefits from equity-based compensation (2)
|
(77,478
|
)
|
(58,681
|
)
|
—
|
|
||||||
|
Remeasurement of net deferred tax assets due to enactment of Tax Cut and Jobs Act (3)
|
(497
|
)
|
62,702
|
|
—
|
|
||||||
|
Other, net (4)
|
(3,978
|
)
|
(21,096
|
)
|
(18,898
|
)
|
||||||
|
Income tax expense
|
$
|
162,535
|
|
$
|
309,390
|
|
$
|
236,435
|
|
|||
|
(1)
|
Excludes state excess tax benefits from equity-based compensation included in the line below.
|
|
(2)
|
ASU 2016-09 adopted January 1, 2017. Excess tax benefits related to equity-based compensation of
$13,661
in 2016 were recorded to shareholders' equity.
|
|
(3)
|
The enactment of the Tax Cuts and Jobs Act in December 2017 required a remeasurement of the Company's net deferred tax assets and resulted in additional income tax expense of
$62,702
.
|
|
(4)
|
Primarily attributable to tax benefits from certain energy credits for the year ended December 31, 2018. For the years ended December 31, 2017 and 2016, this was primarily attributable to tax benefits from the domestic production activities deduction. The domestic production activities deduction was eliminated effective January 1, 2018, following the enactment of the Tax Cuts and Jobs Act in December 2017.
|
The Company’s effective tax rate in
2018
,
2017
and
2016
was
16.94%
,
36.53%
and
35.73%
, respectively.
The Company files a consolidated U.S. federal income tax return, as well as state and local tax returns in all jurisdictions where the Company maintains operations. With few exceptions, the Company is no longer subject to income tax examinations by tax authorities for years prior to
2015
.
A reconciliation of the beginning and ending amount of unrecognized tax benefits is as follows:
|
|
Year Ended December 31,
|
|||||||
|
|
2018
|
2017
|
||||||
|
Balance at beginning of year
|
$
|
45,337
|
|
$
|
46,110
|
|
||
|
Additions based on tax positions related to the current year
|
4,340
|
|
4,793
|
|
||||
|
Reductions for tax positions of prior years
|
(6,259
|
)
|
(5,566
|
)
|
||||
|
Settlements
|
—
|
|
—
|
|
||||
|
Balance at end of year
|
$
|
43,418
|
|
$
|
45,337
|
|
||
If recognized, the total amount of unrecognized tax benefits that would affect the effective tax rate (net of the federal tax benefit) is
$34,300
as of
December 31, 2018
.
The Company recognizes interest related to unrecognized tax benefits as a component of income tax expense. For the years ended
December 31, 2018
,
2017
, and 2016, the Company recognized a net reversal of accrued interest on unrecognized tax benefits in the amount of
$1,384
,
$1,065
and
$1,582
, respectively. As of
December 31, 2018
and
2017
, the Company had a total of
$17,191
and
$18,575
, respectively, of accrued interest on unrecognized tax benefits which are included in “Accrued expenses and other liabilities” on the accompanying consolidated balance sheets. Based on its historical experience in dealing with various taxing authorities, the Company has found that it is the administrative practice of these authorities to not seek penalties from the Company for the tax positions it has taken on its returns, related to its unrecognized tax benefits. Therefore, the Company does not accrue penalties for the positions in which it has an unrecognized tax benefit. However, if such penalties were to be accrued, they would be recorded as a component of income tax expense.
The Company believes that within the next 12 months, it is reasonably possible that the unrecognized tax benefits as of
December 31, 2018
will be reduced by approximately
$11,570
due to statute expiration and effectively settled positions in various state jurisdictions.
58
NVR, Inc.
Notes to Consolidated Financial Statements
(dollars and shares in thousands, except per share data)
12. Equity-Based Compensation, Profit Sharing and Deferred Compensation Plans
Equity-Based Compensation Plans
NVR’s equity-based compensation plans provide for the granting of Options and RSUs to key management employees, including executive officers and members of our Board of Directors ("Directors"), of the Company. The exercise price of Options granted is equal to the closing price of the Company’s common stock on the New York Stock Exchange (the “NYSE”) on the day prior to the date of grant. Options are granted for a
ten
-year term and typically vest in separate tranches over periods of
3
to
6
years. RSUs generally vest in separate tranches over periods of
2
to
6
years. Grants are generally divided such that vesting for
50%
of the grant is contingent solely on continued employment or service as a Director, while vesting for the remaining
50%
of the grant is contingent upon both continued employment or service as a Director and the achievement of a performance metric based on the Company’s return on capital performance relative to a peer group during a
three
year period specified on the date of Option grant.
The following table provides a summary of each of the Company’s equity-based compensation plans for any plan with grants outstanding at
December 31, 2018
:
|
Equity-Based Compensation Plans
|
Shares
Authorized
|
Options/RSUs
Outstanding
|
Shares
Available to Issue
|
||||||
|
2000 Broadly-Based Stock Option Plan
|
2,000
|
|
63
|
|
—
|
|
|||
|
2010 Equity Incentive Plan (1)
|
700
|
|
160
|
|
26
|
|
|||
|
2014 Equity Incentive Plan (2)
|
950
|
|
701
|
|
102
|
|
|||
|
2018 Equity Incentive Plan (3)
|
275
|
|
146
|
|
129
|
|
|||
|
(1)
|
During 2010, the Company’s shareholders approved the 2010 Equity Incentive Plan (the “2010 Plan”). The 2010 Plan authorizes the Company to issue Options and RSUs to key management employees, including executive officers and Directors. Of the
700
aggregate shares available to issue, up to
240
may be granted in the form of RSUs. There were
139
Options and
21
RSUs outstanding as of
December 31, 2018
. Of the
26
shares available to be issued under the 2010 Plan,
22
may be granted as RSUs.
|
|
(2)
|
During 2014, the Company’s shareholders approved the 2014 Equity Incentive Plan (the “2014 Plan”). The 2014 Plan authorizes the Company to issue Options to key management employees, including executive officers and Directors.
|
|
(3)
|
The Company’s shareholders approved the 2018 Equity Incentive Plan (the "2018 Plan") at the Company’s Annual Meeting of Shareholders held on May 2, 2018. The 2018 Plan authorizes the Company to issue up to an aggregate of
275
shares of the Company’s common stock in the form of Options and RSUs to key management employees, including executive officers and Directors. Of the
275
aggregate shares available to issue, all may be granted in the form of Options and up to
40
may be granted in the form of RSUs.
|
During
2018
, the Company issued
345
Options and
16
RSUs under the 2010 Plan, the 2014 Plan, and the 2018 Plan as follows:
|
2010 Plan
|
2014 Plan
|
2018 Plan
|
|||||||
|
Options Granted
|
|||||||||
|
Options (4)
|
6
|
|
93
|
|
73
|
|
|||
|
Performance-based Options (5)
|
—
|
|
100
|
|
73
|
|
|||
|
Total Options Granted
|
6
|
|
193
|
|
146
|
|
|||
|
RSUs Granted
|
|||||||||
|
RSUs (6)
|
8
|
|
—
|
|
—
|
|
|||
|
Performance-based RSUs (7)
|
8
|
|
—
|
|
—
|
|
|||
|
Total RSUs Granted
|
16
|
|
—
|
|
—
|
|
|||
(4) Of the
172
service-only Options granted,
34
will generally vest over
two
years in
50%
increments on December 31, 2020 and 2021; the remaining
138
Options will generally vest over
four
years in
25%
increments on December 31, 2020, 2021,
59
NVR, Inc.
Notes to Consolidated Financial Statements
(dollars and shares in thousands, except per share data)
2022, and 2023. Vesting for the Options is contingent solely upon continued employment or continued service as a Director.
(5) Of the
173
performance-based Options granted,
34
will vest over
two
years in
50%
increments on December 31, 2020 and 2021; the remaining
139
performance-based Options will generally vest over
four
years in
25%
increments on December 31, 2020, 2021, 2022, and 2023. Vesting for the performance-based Options is contingent upon both continued employment or continued service as a Director and the Company's return on capital performance during 2018 through 2020.
(6) The service-only RSUs granted will vest over
two
years in
50%
increments on December 31, 2022 and 2023. Vesting for the RSUs is contingent solely upon continued employment.
(7) The performance-based RSUs granted will vest over
two
years in
50%
increments on December 31, 2022 and 2023. Vesting for the performance-based RSUs is contingent upon both continued employment and the Company's return on capital performance during 2018 through 2020.
The following table provides additional information relative to NVR’s equity-based compensation plans for the year ended
December 31, 2018
:
|
|
Shares
|
Weighted Avg. Per Share
Exercise Price
|
Weighted Avg. Remaining
Contract Life (years)
|
Aggregate
Intrinsic Value
|
|||||||||
|
Stock Options
|
|||||||||||||
|
Outstanding at December 31, 2017
|
916
|
|
$
|
1,119.92
|
|
||||||||
|
Granted
|
345
|
|
3,013.61
|
|
|||||||||
|
Exercised
|
(182
|
)
|
954.49
|
|
|||||||||
|
Forfeited
|
(30
|
)
|
1,283.48
|
|
|||||||||
|
Outstanding at December 31, 2018
|
1,049
|
|
$
|
1,766.87
|
|
6.5
|
$
|
910,014
|
|
||||
|
Exercisable at December 31, 2018
|
466
|
|
$
|
1,032.44
|
|
4.6
|
$
|
655,141
|
|
||||
|
RSUs
|
|||||||||||||
|
Outstanding at December 31, 2017
|
10
|
|
|||||||||||
|
Granted
|
16
|
|
|||||||||||
|
Vested
|
(5
|
)
|
|||||||||||
|
Forfeited
|
—
|
|
|||||||||||
|
Outstanding at December 31, 2018
|
21
|
|
$
|
50,719
|
|
||||||||
|
Vested, but not issued at December 31, 2018
|
5
|
|
$
|
11,532
|
|
||||||||
To estimate the grant-date fair value of its Options, the Company uses the Black-Scholes option-pricing model (the “Pricing Model”). The Pricing Model estimates the per share fair value of an option on its date of grant based on the following factors: the option’s exercise price; the price of the underlying stock on the date of grant; the estimated dividend yield; a risk-free interest rate; the estimated option term; and the expected volatility. For the risk-free interest rate, the Company uses U.S. Treasury STRIPS which mature at approximately the same time as the option’s expected holding term. For expected volatility, NVR has concluded that its historical volatility over the option’s expected holding term provides the most reasonable basis for this estimate.
The fair value of the Options granted during
2018
,
2017
and
2016
was estimated on the grant date using the Pricing Model, based on the following assumptions:
|
|
2018
|
2017
|
2016
|
|||||||||
|
Estimated option life (years)
|
5.06
|
5.26
|
5.27
|
|||||||||
|
Risk free interest rate (range)
|
2.19%-3.13%
|
|
1.53%-2.38%
|
|
0.86%-2.21%
|
|
||||||
|
Expected volatility (range)
|
16.57%-20.05%
|
|
15.09%-17.95%
|
|
15.91%-23.49%
|
|
||||||
|
Expected dividend rate
|
—
|
%
|
—
|
%
|
—
|
%
|
||||||
|
Weighted average grant-date fair value per share of options granted
|
$
|
687.81
|
|
$
|
494.17
|
|
$
|
320.21
|
|
|||
60
NVR, Inc.
Notes to Consolidated Financial Statements
(dollars and shares in thousands, except per share data)
The weighted-average grant date fair value per share of
$3,015.83
for the RSUs was the closing price of the Company’s common stock on the day immediately preceding the date of grant.
Compensation cost for Options and RSUs is recognized on a straight-line basis over the requisite service period for the entire award (from the date of grant through the period of the last separately vesting portion of the grant). For the recognition of equity-based compensation, the Options and RSUs which are subject to a performance condition are treated as a separate award from the “service-only” Options and RSUs, and compensation expense is recognized when it becomes probable that the stated performance target will be achieved. The Company currently believes that it is probable that the stated performance condition will be satisfied at the target level and is recognizing compensation expense related to such Options and RSUs accordingly. Compensation cost is recognized within the income statement in the same expense line as the cash compensation paid to the respective employees.
In connection with the adoption of ASU 2016-09 on January 1, 2017, the Company made the election to recognize forfeitures of equity-based awards as a reduction to compensation costs in the period in which they occur. For the year ended December 31, 2016, the Company estimated forfeitures based on its historical forfeiture rate. In
2018
,
2017
and
2016
, the Company recognized
$75,701
,
$44,562
, and
$43,598
in equity-based compensation costs, respectively, and approximately
$17,200
,
$17,100
, and
$17,000
in tax benefit related to equity-based compensation costs, respectively.
As of
December 31, 2018
, the total unrecognized compensation cost for all outstanding Options and RSUs equaled approximately
$302,000
. The unrecognized compensation cost will be recognized over each grant’s applicable vesting period with the latest vesting date being December 31, 2024. The weighted-average period over which the unrecognized compensation will be recorded is equal to approximately
2.6
years.
The Company settles Option exercises and vesting of RSUs by issuing shares of treasury stock. Shares are relieved from the treasury account based on the weighted average cost of treasury shares acquired. During the years ended
December 31, 2018
,
2017
and
2016
, the Company issued
188
,
165
and
83
shares, respectively, from the treasury account for Option exercises and vesting of RSUs. Information with respect to the vested RSUs and exercised Options is as follows:
|
|
Year Ended December 31,
|
|||||||||||
|
|
2018
|
2017
|
2016
|
|||||||||
|
Aggregate exercise proceeds
|
$
|
174,110
|
|
$
|
140,525
|
|
$
|
38,106
|
|
|||
|
Aggregate intrinsic value on exercise dates
|
$
|
355,318
|
|
$
|
206,890
|
|
$
|
96,600
|
|
|||
Profit Sharing Plans
NVR has a trustee-administered, profit sharing retirement plan (the “Profit Sharing Plan”) and an Employee Stock Ownership Plan (“ESOP”) covering substantially all employees. The Profit Sharing Plan and the ESOP provide for annual discretionary contributions in amounts as determined by the NVR Board of Directors. The combined plan contribution for the years ended
December 31, 2018
,
2017
and
2016
was approximately
$19,500
,
$18,400
and
$16,700
, respectively. The ESOP purchased approximately
7
and
6
shares of NVR common stock in the open market for the
2018
and
2017
plan year contributions, respectively, using cash contributions provided by the Company. As of
December 31, 2018
, all shares held by the ESOP had been allocated to participants’ accounts. The
2018
plan year contribution was funded and fully allocated to participants in February
2019
.
Deferred Compensation Plans
The Company has
two
deferred compensation plans (“Deferred Comp Plans”). The specific purpose of the Deferred Comp Plans is to i) establish a vehicle whereby named executive officers may defer the receipt of salary and bonus that otherwise would be nondeductible for Company tax purposes into a period where the Company would realize a tax deduction for the amounts paid, and ii) to enable certain employees who are subject to the Company’s stock holding requirements to acquire shares of the Company’s common stock on a pre-tax basis in order to more quickly meet, and maintain compliance with those stock holding requirements. Amounts deferred into the Deferred Comp Plans are invested in NVR common stock, held in a rabbi trust account, and are paid out in a fixed number of shares upon expiration of the deferral period.
The rabbi trust account held
107
and
109
shares of NVR common stock as of
December 31, 2018
and
2017
, respectively. Shares held by the Deferred Comp Plans are treated as outstanding shares in the Company’s earnings per share calculation for each of the years ended
December 31, 2018
,
2017
and
2016
.
61
NVR, Inc.
Notes to Consolidated Financial Statements
(dollars and shares in thousands, except per share data)
13. Commitments and Contingent Liabilities
NVR is committed under multiple non-cancelable operating leases involving office space, model homes, production facilities, automobiles and equipment. Future minimum lease payments under these operating leases as of
December 31, 2018
are as follows:
|
Year Ending December 31,
|
|||
|
2019
|
$
|
31,564
|
|
|
2020
|
22,210
|
|
|
|
2021
|
17,331
|
|
|
|
2022
|
13,667
|
|
|
|
2023
|
10,324
|
|
|
|
Thereafter
|
12,607
|
|
|
|
107,703
|
|
||
|
Sublease income
|
(25
|
)
|
|
|
$
|
107,678
|
|
|
Total rent expense incurred under operating leases was approximately
$52,900
,
$49,400
and
$45,800
for the years ended
December 31, 2018
,
2017
and
2016
, respectively.
The Company generally does not engage in the land development business. Instead, the Company typically acquires finished building lots at market prices from various development entities under Lot Purchase Agreements. The Lot Purchase Agreements require deposits that may be forfeited if the Company fails to perform under the agreement. The deposits required under the Lot Purchase Agreements are in the form of cash or letters of credit in varying amounts, and typically range up to
10%
of the aggregate purchase price of the finished lots. At
December 31, 2018
, assuming that contractual development milestones are met and the Company exercises its option, the Company expects to place additional forfeitable deposits with land developers under existing Lot Purchase Agreements of approximately
$193,600
. The Company also has
one
specific performance contract pursuant to which the Company is committed to purchase
10
finished lots at an aggregate purchase price of approximately
$1,505
. Additionally, as of
December 31, 2018
, we had funding commitments totaling approximately
$7,300
under a joint development agreement related to our land under development, a portion of which we expect will be offset by development credits of approximately
$4,600
.
During the ordinary course of operating the homebuilding and mortgage banking businesses, the Company is required to enter into bond or letter of credit arrangements with local municipalities, government agencies, or land developers to collateralize its obligations under various contracts. The Company had approximately
$37,600
of contingent obligations under such agreements, including approximately
$9,000
for letters of credit issued under the Credit Agreement as of
December 31, 2018
. The Company believes it will fulfill its obligations under the related contracts and does not anticipate any material losses under these bonds or letters of credit.
The following table reflects the changes in the Company’s warranty reserve (see Note 1 herein for further discussion of warranty/product liability reserves):
|
|
Year Ended December 31,
|
|||||||||||
|
|
2018
|
2017
|
2016
|
|||||||||
|
Warranty reserve, beginning of year
|
$
|
94,513
|
|
$
|
93,895
|
|
$
|
87,407
|
|
|||
|
Provision
|
62,553
|
|
44,652
|
|
50,787
|
|
||||||
|
Payments
|
(53,366
|
)
|
(44,034
|
)
|
(44,299
|
)
|
||||||
|
Warranty reserve, end of year
|
$
|
103,700
|
|
$
|
94,513
|
|
$
|
93,895
|
|
|||
The Company and its subsidiaries are also involved in various other litigation arising in the ordinary course of business. In the opinion of management, and based on advice of legal counsel, this litigation is not expected to have a material adverse effect on the financial position, results of operations or cash flows of the Company. Legal costs incurred in connection with outstanding litigation are expensed as incurred.
62
NVR, Inc.
Notes to Consolidated Financial Statements
(dollars and shares in thousands, except per share data)
14. Fair Value
GAAP assigns a fair value hierarchy to the inputs used to measure fair value. Level 1 inputs are quoted prices in active markets for identical assets and liabilities. Level 2 inputs are inputs other than quoted market prices that are observable for the asset or liability, either directly or indirectly. Level 3 inputs are unobservable inputs.
Financial Instruments
The estimated fair values of NVR’s Senior Notes as of
December 31, 2018
and
2017
were
$594,000
and
$630,000
, respectively. The estimated fair value is based on recent market prices of similar transactions, which is classified as Level 2 within the fair value hierarchy. The carrying values at
December 31, 2018
and
2017
were
$597,681
and
$597,066
, respectively. Except as otherwise noted below, NVR believes that insignificant differences exist between the carrying value and the fair value of its financial instruments, which consists primarily of cash equivalents, due to their short term nature.
Derivative Instruments and Mortgage Loans Held for Sale
In the normal course of business, NVRM, enters into contractual commitments to extend credit to buyers of single-family homes with fixed expiration dates. The commitments become effective when the borrowers “lock-in” a specified interest rate within time frames established by NVRM. All mortgagors are evaluated for credit worthiness prior to the extension of the commitment. Market risk arises if interest rates move adversely between the time of the “lock-in” of rates by the borrower and the sale date of the loan to a broker/dealer. To mitigate the effect of the interest rate risk inherent in providing rate lock commitments to borrowers, NVRM enters into optional or mandatory delivery forward sales contracts to sell whole loans and mortgage-backed securities to broker/dealers. The forward sales contracts lock-in an interest rate and price for the sale of loans similar to the specific rate lock commitments. NVRM does not engage in speculative or trading derivative activities. Both the rate lock commitments to borrowers and the forward sale contracts to broker/dealers are undesignated derivatives and, accordingly, are marked to fair value through earnings. At
December 31, 2018
, there were contractual commitments to extend credit to borrowers aggregating
$682,152
and open forward delivery contracts aggregating
$1,089,923
, which hedge both the rate lock loan commitments and closed loans held for sale.
The fair value of the Company’s rate lock commitments to borrowers and the related input levels includes, as applicable:
|
i)
|
the assumed gain/loss of the expected resultant loan sale (Level 2);
|
|
ii)
|
the effects of interest rate movements between the date of the rate lock and the balance sheet date (Level 2); and
|
|
iii)
|
the value of the servicing rights associated with the loan (Level 2).
|
The assumed gain/loss considers the excess servicing to be received or buydown fees to be paid upon securitization of the loan. The excess servicing and buydown fees are calculated pursuant to contractual terms with investors. To calculate the effects of interest rate movements, NVRM utilizes applicable published mortgage-backed security prices, and multiplies the price movement between the rate lock date and the balance sheet date by the notional loan commitment amount. NVRM sells all of its loans on a servicing released basis, and receives a servicing released premium upon sale. Thus, the value of the servicing rights is included in the fair value measurement and is based upon contractual terms with investors and varies depending on the loan type. NVRM assumes a fallout rate when measuring the fair value of rate lock commitments. Fallout is defined as locked loan commitments for which NVRM does not close a mortgage loan and is based on historical experience.
The fair value of NVRM’s forward sales contracts to broker/dealers solely considers the market price movement of the same type of security between the trade date and the balance sheet date (Level 2). The market price changes are multiplied by the notional amount of the forward sales contracts to measure the fair value.
Mortgage loans held for sale are recorded at fair value when closed, and thereafter are carried at the lower of cost or fair value, net of deferred origination costs, until sold. Fair value is measured using Level 2 inputs. As of
December 31, 2018
, the fair value of loans held for sale of
$458,324
included on the accompanying consolidated balance sheet has been increased by
$10,880
from the aggregate principal balance of
$447,444
. As of
December 31, 2017
, the fair value of loans held for sale of
$352,489
were increased by
$1,931
from the aggregate principal balance of
$350,558
.
63
NVR, Inc.
Notes to Consolidated Financial Statements
(dollars and shares in thousands, except per share data)
The fair value measurement of NVRM's undesignated derivative instruments was as follows:
|
As of December 31,
|
||||||||
|
|
2018
|
2017
|
||||||
|
Rate lock commitments:
|
||||||||
|
Gross assets
|
$
|
13,831
|
|
$
|
5,400
|
|
||
|
Gross liabilities
|
345
|
|
1,832
|
|
||||
|
Net rate lock commitments
|
$
|
13,486
|
|
$
|
3,568
|
|
||
|
Forward sales contracts:
|
||||||||
|
Gross assets
|
$
|
64
|
|
$
|
992
|
|
||
|
Gross liabilities
|
10,121
|
|
667
|
|
||||
|
Net forward sales contracts
|
$
|
(10,057
|
)
|
$
|
325
|
|
||
As of
December 31, 2018
, the net rate lock commitments are reported in mortgage banking "Other assets" and the net forward sales contracts are reported in mortgage banking "Accrued expenses and other liabilities" on the accompanying consolidated balance sheets. As of
December 31, 2017
, both the net rate lock commitments and the net forward sales contracts are reported in mortgage banking "Other assets."
The fair value measurement as of
December 31, 2018
was as follows:
|
Notional or
Principal
Amount
|
Assumed
Gain/(Loss)
From Loan
Sale
|
Interest
Rate
Movement
Effect
|
Servicing
Rights
Value
|
Security
Price
Change
|
Total Fair
Value
Measurement
Gain/(Loss)
|
|||||||||||||||||||
|
Rate lock commitments
|
$
|
682,152
|
|
$
|
1,360
|
|
$
|
4,630
|
|
$
|
7,496
|
|
$
|
—
|
|
$
|
13,486
|
|
||||||
|
Forward sales contracts
|
$
|
1,089,923
|
|
—
|
|
—
|
|
—
|
|
(10,057
|
)
|
(10,057
|
)
|
|||||||||||
|
Mortgages held for sale
|
$
|
447,444
|
|
1,267
|
|
3,637
|
|
5,976
|
|
—
|
|
10,880
|
|
|||||||||||
|
Total fair value measurement
|
$
|
2,627
|
|
$
|
8,267
|
|
$
|
13,472
|
|
$
|
(10,057
|
)
|
$
|
14,309
|
|
|||||||||
The total fair value measurement as of
December 31, 2017
was
$5,824
. For the years ended
December 31, 2018
, and
2017
, NVRM recorded a fair value adjustment to income of
$8,485
and
$1,638
, respectively. For the year ended
December 31, 2016
, NVRM recorded a fair value adjustment to expense of
$3,147
. Unrealized gains/losses from the change in the fair value measurements are included in earnings as a component of mortgage banking fees in the accompanying consolidated statements of income. The fair value measurement will be impacted in the future by the change in the value of the servicing rights, interest rate movements, security price fluctuations, and the volume and product mix of NVRM’s closed loans and locked loan commitments.
15. Mortgage Repurchase Reserve
During the years ended
December 31, 2018
,
2017
and
2016
, the Company recognized pre-tax charges for loan losses related to mortgage loans sold of approximately
$3,200
,
$2,900
and
$2,000
, respectively. Included in the Mortgage Banking segment’s “Accounts payable and other liabilities” line item on the accompanying consolidated balance sheets is a mortgage repurchase reserve equal to approximately
$15,600
and
$14,000
at
December 31, 2018
and
2017
, respectively.
64
NVR, Inc.
Notes to Consolidated Financial Statements
(dollars and shares in thousands, except per share data)
16. Quarterly Results (unaudited)
The following table sets forth unaudited selected financial data and operating information on a quarterly basis for the years ended
December 31, 2018
and
2017
.
|
|
Year Ended December 31, 2018
|
|||||||||||||||
|
|
4th
Quarter
|
3rd
Quarter
|
2nd
Quarter
|
1st
Quarter
|
||||||||||||
|
Revenues – homebuilding operations
|
$
|
1,954,403
|
|
$
|
1,809,345
|
|
$
|
1,750,463
|
|
$
|
1,490,093
|
|
||||
|
Gross profit – homebuilding operations
|
$
|
363,668
|
|
$
|
336,696
|
|
$
|
333,666
|
|
$
|
278,147
|
|
||||
|
Mortgage banking fees
|
$
|
40,145
|
|
$
|
43,062
|
|
$
|
36,842
|
|
$
|
39,321
|
|
||||
|
Net income
|
$
|
232,158
|
|
$
|
195,816
|
|
$
|
203,174
|
|
$
|
166,049
|
|
||||
|
Diluted earnings per share
|
$
|
58.57
|
|
$
|
48.28
|
|
$
|
49.05
|
|
$
|
39.34
|
|
||||
|
New orders (units)
|
3,841
|
|
4,302
|
|
4,964
|
|
5,174
|
|
||||||||
|
Settlements (units)
|
5,186
|
|
4,754
|
|
4,611
|
|
3,896
|
|
||||||||
|
Backlog, end of period (units)
|
8,365
|
|
9,710
|
|
10,162
|
|
9,809
|
|
||||||||
|
Loans closed
|
$
|
1,356,430
|
|
$
|
1,249,199
|
|
$
|
1,214,101
|
|
$
|
1,009,673
|
|
||||
|
|
Year Ended December 31, 2017
|
|||||||||||||||
|
|
4th
Quarter
|
3rd
Quarter
|
2nd
Quarter
|
1st
Quarter
|
||||||||||||
|
Revenues – homebuilding operations
|
$
|
1,781,494
|
|
$
|
1,633,726
|
|
$
|
1,512,714
|
|
$
|
1,247,587
|
|
||||
|
Gross profit – homebuilding operations
|
$
|
343,187
|
|
$
|
325,755
|
|
$
|
294,631
|
|
$
|
221,570
|
|
||||
|
Mortgage banking fees
|
$
|
34,842
|
|
$
|
34,194
|
|
$
|
31,778
|
|
$
|
29,505
|
|
||||
|
Net income
|
$
|
124,619
|
|
$
|
162,102
|
|
$
|
147,877
|
|
$
|
102,923
|
|
||||
|
Diluted earnings per share
|
$
|
28.88
|
|
$
|
38.02
|
|
$
|
35.19
|
|
$
|
25.12
|
|
||||
|
New orders (units)
|
4,306
|
|
4,200
|
|
4,678
|
|
4,424
|
|
||||||||
|
Settlements (units)
|
4,630
|
|
4,158
|
|
3,917
|
|
3,256
|
|
||||||||
|
Backlog, end of period (units)
|
8,531
|
|
8,855
|
|
8,813
|
|
8,052
|
|
||||||||
|
Loans closed
|
$
|
1,229,695
|
|
$
|
1,115,494
|
|
$
|
1,041,613
|
|
$
|
843,341
|
|
||||
65
TABLE OF CONTENTS
Part IItem 1. BusinessItem 1A. Risk FactorsItem 1B. Unresolved Staff CommentsItem 2. PropertiesItem 3. Legal ProceedingsItem 4. Mine Safety DisclosuresPart IIItem 5. Market For Registrant S Common Equity, Related Stockholder Matters and Issuer Purchases Of Equity SecuritiesItem 6. Selected Financial DataItem 7. Management S Discussion and Analysis Of Financial Condition and Results Of OperationsItem 7A. Quantitative and Qualitative Disclosure About Market RiskItem 8. Financial Statements and Supplementary DataItem 9. Changes in and Disagreements with Accountants on Accounting and Financial DisclosureItem 9A. Controls and ProceduresItem 9B. Other InformationPart IIIItem 10. Directors, Executive Officers, and Corporate GovernanceItem 11. Executive CompensationItem 12. Security Ownership Of Certain Beneficial Owners and Management and Related Stockholder MattersItem 13. Certain Relationships and Related Transactions, and Director IndependenceItem 14. Principal Accountant Fees and ServicesPart IVItem 15. Exhibits and Financial Statement Schedules