UNITED STATES
SECURITIES AND EXCHANGE COMMISSION
Washington, D.C. 20549
FORM
10-Q
(Mark One)
For the quarterly period ended
October 1, 2023
or
For the transition period from
to
.
Commission File Number:
001-34841
(Exact name of registrant as specified in its charter)
|
|
|
|||||||
|
(State or other jurisdiction
of incorporation or organization)
|
(I.R.S. employer identification number)
|
|||||||
|
|
|
|||||||
|
|
||||||||
|
|
||||||||
|
(Address of principal executive offices)
|
(Zip code)
|
|||||||
|
|
|
|
|||||||||
|
(Registrant’s telephone number, including area code)
|
|||||||||||
Securities registered pursuant to Section 12(b) of the Act:
|
Title of each class
|
Trading symbol(s)
|
Name of each exchange on which registered
|
||||||
|
|
|
|
||||||
Indicate by check mark whether the Registrant (1) has filed all reports required to be filed by Section 13 or 15(d) of the Securities Exchange Act of 1934 during the preceding 12 months (or for such shorter period that the Registrant was required to file such reports), and (2) has been subject to such filing requirements for the past 90 days.
Indicate by check mark whether the Registrant has submitted electronically every Interactive Data File required to be submitted pursuant to Rule 405 of Regulation S-T (§232.405 of this chapter) during the preceding 12 months (or for such shorter period that the Registrant was required to submit such files).
Indicate by check mark whether the Registrant is a large accelerated filer, an accelerated filer, a non-accelerated filer, a smaller reporting company, or an emerging growth company. See the definitions of “large accelerated filer,” “accelerated filer,” “smaller reporting company,” and “emerging growth company” in Rule 12b-2 of the Exchange Act.
|
|
☒
|
Accelerated filer
|
☐
|
||||||||
|
Non-accelerated filer
|
☐
|
Smaller reporting company
|
|
||||||||
|
Emerging growth company
|
|
||||||||||
If an emerging growth company, indicate by check mark if the Registrant has elected not to use the extended transition period for complying with any new or revised financial accounting standards provided pursuant to Section 13(a) of the Exchange Act. ☐
Indicate by check mark whether the Registrant is a shell company (as defined in Rule 12b-2 of the Exchange Act).
Yes
☐
No
☒
As of November 3, 2023, there were
257,763,301
shares of our common stock, €0.20 par value per share, issued and outstanding.
NXP Semiconductors N.V.
Form 10-Q
For the Fiscal Quarter Ended October 1, 2023
TABLE OF CONTENTS
|
Page
|
||||||||
|
Item 2.
|
Management’s Discussion and Analysis of Financial Condition and Results of Operations
|
|||||||
PART I — FINANCIAL INFORMATION
Item 1. Financial Statements
CONDENSED CONSOLIDATED STATEMENTS OF OPERATIONS (Unaudited)
($ in millions, unless otherwise stated)
| For the three months ended | For the nine months ended | ||||||||||||||||||||||
| October 1, 2023 | October 2, 2022 | October 1, 2023 | October 2, 2022 | ||||||||||||||||||||
| Revenue |
|
|
|
|
|||||||||||||||||||
| Cost of revenue |
(
|
(
|
(
|
(
|
|||||||||||||||||||
| Gross profit |
|
|
|
|
|||||||||||||||||||
| Research and development |
(
|
(
|
(
|
(
|
|||||||||||||||||||
| Selling, general and administrative |
(
|
(
|
(
|
(
|
|||||||||||||||||||
| Amortization of acquisition-related intangible assets |
(
|
(
|
(
|
(
|
|||||||||||||||||||
| Total operating expenses |
(
|
(
|
(
|
(
|
|||||||||||||||||||
| Other income (expense) |
(
|
|
(
|
|
|||||||||||||||||||
| Operating income (loss) |
|
|
|
|
|||||||||||||||||||
| Financial income (expense): | |||||||||||||||||||||||
| Extinguishment of debt |
|
|
|
(
|
|||||||||||||||||||
| Other financial income (expense) |
(
|
(
|
(
|
(
|
|||||||||||||||||||
| Income (loss) before income taxes |
|
|
|
|
|||||||||||||||||||
| Benefit (provision) for income taxes |
(
|
(
|
(
|
(
|
|||||||||||||||||||
| Results relating to equity-accounted investees |
(
|
(
|
(
|
|
|||||||||||||||||||
| Net income (loss) |
|
|
|
|
|||||||||||||||||||
| Less: Net income (loss) attributable to non-controlling interests |
|
|
|
|
|||||||||||||||||||
| Net income (loss) attributable to stockholders |
|
|
|
|
|||||||||||||||||||
| Earnings per share data: | |||||||||||||||||||||||
| Net income (loss) per common share attributable to stockholders in $ | |||||||||||||||||||||||
| Basic |
|
|
|
|
|||||||||||||||||||
| Diluted |
|
|
|
|
|||||||||||||||||||
| Weighted average number of shares of common stock outstanding during the period (in thousands): | |||||||||||||||||||||||
| Basic |
|
|
|
|
|||||||||||||||||||
| Diluted |
|
|
|
|
|||||||||||||||||||
See accompanying notes to the Condensed Consolidated Financial Statements
1
CONDENSED CONSOLIDATED STATEMENTS OF COMPREHENSIVE INCOME
(Unaudited)
($ in millions, unless otherwise stated)
| For the three months ended | For the nine months ended | ||||||||||||||||||||||
| October 1, 2023 | October 2, 2022 | October 1, 2023 | October 2, 2022 | ||||||||||||||||||||
| Net income (loss) |
|
|
|
|
|||||||||||||||||||
| Other comprehensive income (loss), net of tax: | |||||||||||||||||||||||
| Change in fair value cash flow hedges |
(
|
(
|
(
|
(
|
|||||||||||||||||||
| Change in foreign currency translation adjustment |
(
|
(
|
(
|
(
|
|||||||||||||||||||
| Change in net actuarial gain (loss) |
|
|
|
|
|||||||||||||||||||
| Total other comprehensive income (loss) |
(
|
(
|
(
|
(
|
|||||||||||||||||||
| Total comprehensive income (loss) |
|
|
|
|
|||||||||||||||||||
| Less: Comprehensive income (loss) attributable to non-controlling interests |
|
|
|
|
|||||||||||||||||||
| Total comprehensive income (loss) attributable to stockholders |
|
|
|
|
|||||||||||||||||||
See accompanying notes to the Condensed Consolidated Financial Statements
2
CONDENSED CONSOLIDATED BALANCE SHEETS (Unaudited)
($ in millions, unless otherwise stated)
| October 1, 2023 | December 31, 2022 | |||||||||||||
| ASSETS | ||||||||||||||
| Current assets: | ||||||||||||||
| Cash and cash equivalents |
|
|
||||||||||||
| Accounts receivable, net |
|
|
||||||||||||
| Inventories, net |
|
|
||||||||||||
| Other current assets |
|
|
||||||||||||
| Total current assets |
|
|
||||||||||||
| Non-current assets: | ||||||||||||||
| Other non-current assets |
|
|
||||||||||||
|
Property, plant and equipment, net of accumulated depreciation of $
|
|
|
||||||||||||
|
Identified intangible assets, net of accumulated amortization of $
|
|
|
||||||||||||
| Goodwill |
|
|
||||||||||||
| Total non-current assets |
|
|
||||||||||||
| Total assets |
|
|
||||||||||||
| LIABILITIES AND EQUITY | ||||||||||||||
| Current liabilities: | ||||||||||||||
| Accounts payable |
|
|
||||||||||||
| Restructuring liabilities-current |
|
|
||||||||||||
| Other current liabilities |
|
|
||||||||||||
| Short-term debt |
|
|
||||||||||||
| Total current liabilities |
|
|
||||||||||||
| Non-current liabilities: | ||||||||||||||
| Long-term debt |
|
|
||||||||||||
| Restructuring liabilities |
|
|
||||||||||||
| Deferred tax liabilities |
|
|
||||||||||||
| Other non-current liabilities |
|
|
||||||||||||
| Total non-current liabilities |
|
|
||||||||||||
| Total liabilities |
|
|
||||||||||||
| Equity: | ||||||||||||||
| Non-controlling interests |
|
|
||||||||||||
| Stockholders’ equity: | ||||||||||||||
|
Common stock, par value €
|
|
|
||||||||||||
| Capital in excess of par value |
|
|
||||||||||||
| Treasury shares, at cost: | ||||||||||||||
|
|
(
|
(
|
||||||||||||
| Accumulated other comprehensive income (loss) |
|
|
||||||||||||
| Accumulated deficit |
(
|
(
|
||||||||||||
| Total stockholders’ equity |
|
|
||||||||||||
| Total equity |
|
|
||||||||||||
| Total liabilities and equity |
|
|
||||||||||||
See accompanying notes to the Condensed Consolidated Financial Statements
3
CONDENSED CONSOLIDATED STATEMENTS OF CASH FLOWS (Unaudited)
($ in millions, unless otherwise stated)
| For the nine months ended | |||||||||||
| October 1, 2023 | October 2, 2022 | ||||||||||
| Cash flows from operating activities: | |||||||||||
| Net income (loss) |
|
|
|||||||||
| Adjustments to reconcile net income (loss) to net cash provided by (used for) operating activities: | |||||||||||
| Depreciation and amortization |
|
|
|||||||||
| Share-based compensation |
|
|
|||||||||
| Amortization of discount (premium) on debt, net |
|
|
|||||||||
| Amortization of debt issuance costs |
|
|
|||||||||
| Net (gain) loss on sale of assets |
(
|
(
|
|||||||||
| (Gain) loss on equity security, net |
(
|
|
|||||||||
| (Gain) loss on extinguishment of debt |
|
|
|||||||||
| Results relating to equity-accounted investees |
|
(
|
|||||||||
| Deferred tax expense (benefit) |
(
|
(
|
|||||||||
| Changes in operating assets and liabilities: | |||||||||||
| (Increase) decrease in receivables and other current assets |
(
|
(
|
|||||||||
| (Increase) decrease in inventories |
(
|
(
|
|||||||||
| Increase (decrease) in accounts payable and other liabilities |
(
|
|
|||||||||
| Decrease (increase) in other non-current assets |
(
|
(
|
|||||||||
| Exchange differences |
|
(
|
|||||||||
| Other items |
|
|
|||||||||
| Net cash provided by (used for) operating activities |
|
|
|||||||||
| Cash flows from investing activities: | |||||||||||
| Purchase of identified intangible assets |
(
|
(
|
|||||||||
| Capital expenditures on property, plant and equipment |
(
|
(
|
|||||||||
| Purchase of equipment leased to others |
|
(
|
|||||||||
| Proceeds from disposals of property, plant and equipment |
|
|
|||||||||
| Purchase of interests in businesses, net of cash acquired |
|
(
|
|||||||||
| Purchase of investments |
(
|
(
|
|||||||||
| Proceeds from sale of investments |
|
|
|||||||||
| Proceeds from return of equity investment |
|
|
|||||||||
| Net cash provided by (used for) investing activities |
(
|
(
|
|||||||||
| Cash flows from financing activities: | |||||||||||
| Repurchase of long-term debt |
|
(
|
|||||||||
| Proceeds from the issuance of long-term debt |
|
|
|||||||||
| Cash paid for debt issuance costs |
|
(
|
|||||||||
| Dividends paid to common stockholders |
(
|
(
|
|||||||||
| Proceeds from issuance of common stock through stock plans |
|
|
|||||||||
| Purchase of treasury shares and restricted stock unit withholdings |
(
|
(
|
|||||||||
| Other, net |
(
|
(
|
|||||||||
| Net cash provided by (used for) financing activities |
(
|
(
|
|||||||||
| Effect of changes in exchange rates on cash positions |
(
|
(
|
|||||||||
| Increase (decrease) in cash and cash equivalents |
|
|
|||||||||
| Cash and cash equivalents at beginning of period |
|
|
|||||||||
| Cash and cash equivalents at end of period |
|
|
|||||||||
| Supplemental disclosures to the condensed consolidated cash flows | |||||||||||
| Net cash paid during the period for: | |||||||||||
| Interest |
|
|
|||||||||
| Income taxes, net of refunds |
|
|
|||||||||
| Net gain (loss) on sale of assets: | |||||||||||
| Cash proceeds from the sale of assets |
|
|
|||||||||
| Non-cash investing activities: | |||||||||||
| Non-cash capital expenditures |
|
|
|||||||||
See accompanying notes to the Condensed Consolidated Financial Statements
4
CONDENSED CONSOLIDATED STATEMENTS OF CHANGES IN EQUITY (Unaudited)
($ in millions, unless otherwise stated)
|
Outstanding
number of shares (in thousands) |
Common
stock |
Capital in
excess of par value |
Treasury
shares at cost |
Accumulated
other comprehensive income (loss) |
Accumulated
deficit |
Total
stock- holders’ equity |
Non-
controlling interests |
Total
equity |
||||||||||||||||||||||||||||||||||||||||||||||||
| Balance as of December 31, 2022 |
|
|
|
(
|
|
(
|
|
|
|
|||||||||||||||||||||||||||||||||||||||||||||||
| Net income (loss) |
|
|
|
|
||||||||||||||||||||||||||||||||||||||||||||||||||||
| Other comprehensive income (loss) |
|
|
|
|||||||||||||||||||||||||||||||||||||||||||||||||||||
| Share-based compensation plans |
|
|
|
|||||||||||||||||||||||||||||||||||||||||||||||||||||
| Shares issued pursuant to stock awards |
|
|
(
|
|
|
|||||||||||||||||||||||||||||||||||||||||||||||||||
| Treasury shares repurchased and retired |
(
|
(
|
(
|
(
|
||||||||||||||||||||||||||||||||||||||||||||||||||||
|
Dividends common stock ($
|
(
|
(
|
(
|
|||||||||||||||||||||||||||||||||||||||||||||||||||||
| Balance as of April 2, 2023 |
|
|
|
(
|
|
(
|
|
|
|
|||||||||||||||||||||||||||||||||||||||||||||||
| Net income (loss) |
|
|
|
|
||||||||||||||||||||||||||||||||||||||||||||||||||||
| Other comprehensive income (loss) |
(
|
(
|
(
|
|||||||||||||||||||||||||||||||||||||||||||||||||||||
| Share-based compensation plans |
|
|
|
|||||||||||||||||||||||||||||||||||||||||||||||||||||
| Shares issued pursuant to stock awards |
|
|
(
|
|
|
|||||||||||||||||||||||||||||||||||||||||||||||||||
| Treasury shares repurchased and retired |
(
|
(
|
(
|
(
|
||||||||||||||||||||||||||||||||||||||||||||||||||||
|
Dividends common stock ($
|
(
|
(
|
(
|
|||||||||||||||||||||||||||||||||||||||||||||||||||||
| Balance as of July 2, 2023 |
|
|
|
(
|
|
(
|
|
|
|
|||||||||||||||||||||||||||||||||||||||||||||||
| Net income (loss) |
|
|
|
|
||||||||||||||||||||||||||||||||||||||||||||||||||||
| Other comprehensive income |
(
|
(
|
(
|
|||||||||||||||||||||||||||||||||||||||||||||||||||||
| Share-based compensation plans |
|
|
|
|||||||||||||||||||||||||||||||||||||||||||||||||||||
| Shares issued pursuant to stock awards |
|
|
(
|
|
|
|||||||||||||||||||||||||||||||||||||||||||||||||||
| Treasury shares and restricted stock unit withholdings |
(
|
(
|
(
|
(
|
||||||||||||||||||||||||||||||||||||||||||||||||||||
|
Dividends common stock ($
|
(
|
(
|
(
|
|||||||||||||||||||||||||||||||||||||||||||||||||||||
| Balance as of October 1, 2023 |
|
|
|
(
|
|
(
|
|
|
|
|||||||||||||||||||||||||||||||||||||||||||||||
5
CONDENSED CONSOLIDATED STATEMENTS OF CHANGES IN EQUITY (Unaudited)
($ in millions, unless otherwise stated)
|
Outstanding
number of
shares (in
thousands)
|
Common
stock
|
Capital in
excess of
par value
|
Treasury
shares at
cost
|
Accumulated
other
comprehensive
income (loss)
|
Accumulated
deficit
|
Total
stock-
holders’
equity
|
Non-
controlling
interests
|
Total
equity
|
||||||||||||||||||||||||||||||||||||||||||||||||
| Balance as of December 31, 2021 |
|
|
|
(
|
|
(
|
|
|
|
|||||||||||||||||||||||||||||||||||||||||||||||
| Net income (loss) |
|
|
|
|
||||||||||||||||||||||||||||||||||||||||||||||||||||
| Other comprehensive income (loss) |
(
|
(
|
(
|
|||||||||||||||||||||||||||||||||||||||||||||||||||||
| Share-based compensation plans |
|
|
|
|||||||||||||||||||||||||||||||||||||||||||||||||||||
| Shares issued pursuant to stock awards |
|
|
(
|
|
|
|||||||||||||||||||||||||||||||||||||||||||||||||||
|
Treasury shares repurchased and retired
|
(
|
(
|
(
|
(
|
||||||||||||||||||||||||||||||||||||||||||||||||||||
|
Dividends common stock ($
|
(
|
(
|
(
|
|||||||||||||||||||||||||||||||||||||||||||||||||||||
| Balance as of April 3, 2022 |
|
|
|
(
|
|
(
|
|
|
|
|||||||||||||||||||||||||||||||||||||||||||||||
| Net income (loss) |
|
|
|
|
||||||||||||||||||||||||||||||||||||||||||||||||||||
| Other comprehensive income (loss) |
(
|
(
|
(
|
|||||||||||||||||||||||||||||||||||||||||||||||||||||
| Share-based compensation plans |
|
|
|
|||||||||||||||||||||||||||||||||||||||||||||||||||||
| Shares issued pursuant to stock awards |
|
|
(
|
|
|
|||||||||||||||||||||||||||||||||||||||||||||||||||
| Treasury shares repurchased and retired |
(
|
(
|
(
|
(
|
||||||||||||||||||||||||||||||||||||||||||||||||||||
|
Dividends common stock ($
|
(
|
(
|
(
|
|||||||||||||||||||||||||||||||||||||||||||||||||||||
| Balance as of July 3, 2022 |
|
|
|
(
|
(
|
(
|
|
|
|
|||||||||||||||||||||||||||||||||||||||||||||||
| Net income (loss) |
|
|
|
|
||||||||||||||||||||||||||||||||||||||||||||||||||||
| Other comprehensive income |
(
|
(
|
(
|
|||||||||||||||||||||||||||||||||||||||||||||||||||||
| Share-based compensation plans |
|
|
|
|||||||||||||||||||||||||||||||||||||||||||||||||||||
| Shares issued pursuant to stock awards |
|
|
(
|
|
|
|||||||||||||||||||||||||||||||||||||||||||||||||||
|
Treasury shares and restricted stock unit withholdings
|
(
|
(
|
(
|
(
|
||||||||||||||||||||||||||||||||||||||||||||||||||||
|
Dividends common stock ($$
|
(
|
(
|
(
|
|||||||||||||||||||||||||||||||||||||||||||||||||||||
| Balance as of October 2, 2022 |
|
|
|
(
|
(
|
(
|
|
|
|
|||||||||||||||||||||||||||||||||||||||||||||||
See accompanying notes to the Condensed Consolidated Financial Statements
6
NXP SEMICONDUCTORS N.V.
NOTES TO THE UNAUDITED CONDENSED CONSOLIDATED FINANCIAL STATEMENTS
All amounts in millions of $ unless otherwise stated
1
Basis of Presentation and Overview
We prepared our interim condensed consolidated financial statements that accompany these notes in conformity with U.S. generally accepted accounting principles, consistent in all material respects with those applied in our Annual Report on Form 10-K for the year ended December 31, 2022.
We have made estimates and judgments affecting the amounts reported in our condensed consolidated financial statements and the accompanying notes. The actual results that we experience may differ materially from our estimates. The interim financial information is unaudited, but reflects all normal adjustments that are, in our opinion, necessary to provide a fair statement of results for the interim periods presented. This interim information should be read in conjunction with the consolidated financial statements in our Annual Report on Form 10-K for the year ended December 31, 2022.
2
Significant Accounting Policies and Recent Accounting Pronouncements
Significant Accounting Policies
For a discussion of our significant accounting policies see, “Part II – Item 8. Financial Statements and Supplementary Data – Notes to Consolidated Financial Statements – “Significant Accounting Policies” of our Annual Report on Form 10-K for the year ended December 31, 2022. There have been no changes to our significant accounting policies since our Annual Report on Form 10-K for the year ended December 31, 2022.
Accounting standards recently adopted
In September 2022, the FASB issued ASU 2022-04, Liabilities—Supplier Finance Programs (Subtopic 405-50): Disclosure of Supplier Finance Program Obligations. ASU 2022-04, which require that a buyer in a supplier finance program to disclose sufficient information about the program, is effective for fiscal years beginning after December 15, 2022, with early adoption permitted. ASU 2022-04 became effective for us on January 1, 2023. We have assessed our current positions and the interrelation to the amendments and the adoption of this update did not have a material impact on the Company's consolidated financial statements and related disclosures.
No other new accounting pronouncements were issued or became effective in the period that had, or are expected to have, a material impact on our Consolidated Financial Statements.
3 Acquisitions and Divestments
2023
There were no material acquisitions or divestments during the first nine months of 2023.
2022
On July 19, 2022, we acquired PL Sense for a total consideration of $
22.1
million, net of closing adjustments. There were no material divestments during 2022.
4
Supplemental Financial Information
Statement of Operations Information:
Disaggregation of revenue
The following table presents revenue disaggregated by sales channel:
| For the three months ended | For the nine months ended | ||||||||||||||||||||||
| October 1, 2023 | October 2, 2022 | October 1, 2023 | October 2, 2022 | ||||||||||||||||||||
| Distributors |
|
|
|
|
|||||||||||||||||||
| Original Equipment Manufacturers and Electronic Manufacturing Services |
|
|
|
|
|||||||||||||||||||
|
Other
|
|
|
|
|
|||||||||||||||||||
| Total |
|
|
|
|
|||||||||||||||||||
7
Depreciation, amortization and impairment
| For the three months ended | For the nine months ended | ||||||||||||||||||||||
| October 1, 2023 | October 2, 2022 | October 1, 2023 | October 2, 2022 | ||||||||||||||||||||
| Depreciation of property, plant and equipment |
|
|
|
|
|||||||||||||||||||
| Amortization of internal use software |
|
|
|
|
|||||||||||||||||||
| Amortization of other identified intangible assets |
|
|
|
|
|||||||||||||||||||
| Total - Depreciation, amortization and impairment |
|
|
|
|
|||||||||||||||||||
Financial income and expense
| For the three months ended | For the nine months ended | ||||||||||||||||||||||
| October 1, 2023 | October 2, 2022 | October 1, 2023 | October 2, 2022 | ||||||||||||||||||||
| Interest income |
|
|
|
|
|||||||||||||||||||
| Interest expense |
(
|
(
|
(
|
(
|
|||||||||||||||||||
| Total other financial income/ (expense) |
(
|
(
|
(
|
(
|
|||||||||||||||||||
| Total |
(
|
(
|
(
|
(
|
|||||||||||||||||||
Earnings per share
The computation of earnings per share (EPS) is presented in the following table:
| For the three months ended | For the nine months ended | ||||||||||||||||||||||
| October 1, 2023 | October 2, 2022 | October 1, 2023 | October 2, 2022 | ||||||||||||||||||||
| Net income (loss) |
|
|
|
|
|||||||||||||||||||
| Less: net income (loss) attributable to non-controlling interests |
|
|
|
|
|||||||||||||||||||
| Net income (loss) attributable to stockholders |
|
|
|
|
|||||||||||||||||||
| Weighted average number of shares outstanding (after deduction of treasury shares) during the year (in thousands) |
|
|
|
|
|||||||||||||||||||
| Plus incremental shares from assumed conversion of: | |||||||||||||||||||||||
|
Options
1)
|
|
|
|
|
|||||||||||||||||||
|
Restricted Share Units, Performance Share Units and Equity Rights
2)
|
|
|
|
|
|||||||||||||||||||
| Dilutive potential common shares |
|
|
|
|
|||||||||||||||||||
| Adjusted weighted average number of shares outstanding (after deduction of treasury shares) during the year (in thousands) |
|
|
|
|
|||||||||||||||||||
| EPS attributable to stockholders in $: | |||||||||||||||||||||||
| Basic net income (loss) |
|
|
|
|
|||||||||||||||||||
| Diluted net income (loss) |
|
|
|
|
|||||||||||||||||||
1)
There were
no
stock options to purchase shares of NXP’s common stock that were outstanding in Q3 2023 and YTD 2023 (Q3 2022 and YTD 2022:
no
shares) that were anti-dilutive and were not included in the computation of diluted EPS because the exercise price was greater than the average fair market value of the common stock or the number of shares assumed to be repurchased using the proceeds of unrecognized compensation expense and exercise prices were greater than the weighted average number of shares underlying outstanding stock options.
2)
There were
no
unvested RSUs, PSUs and equity rights that were outstanding in Q3 2023 and YTD 2023 (Q3 2022 and YTD 2022:
0.3
million shares) that were anti-dilutive and were not included in the computation of diluted EPS because the number of shares assumed to be repurchased using the proceeds of unrecognized compensation expense were greater than the weighted average number of outstanding unvested RSUs, PSUs and equity rights or the performance goal has not been met yet.
Balance Sheet Information
Cash and cash equivalents
8
At October 1, 2023 and December 31, 2022, our cash balance was $
4,042
million and $
3,845
million, respectively, of which $
225
million and $
227
million was held by SSMC, our consolidated joint venture company with TSMC. Under the terms of our joint venture agreement with TSMC, a portion of this cash can be distributed by way of a dividend to us, but
38.8
% of the dividend will be paid to our joint venture partner. During both first nine months of 2023 and 2022,
no
dividends were declared by SSMC.
Inventories
The portion of finished goods stored at customer locations under consignment amounted to $
10
million as of October 1, 2023 (December 31, 2022: $
8
million).
Inventories are summarized as follows:
| October 1, 2023 | December 31, 2022 | ||||||||||
| Raw materials |
|
|
|||||||||
| Work in process |
|
|
|||||||||
| Finished goods |
|
|
|||||||||
|
|
|
||||||||||
The amounts recorded above are net of allowance for obsolescence of $
153
million as of October 1, 2023 (December 31, 2022: $
125
million).
Equity Investments
At October 1, 2023 and December 31, 2022, the total carrying value of investments in equity securities is summarized as follows:
| October 1, 2023 | December 31, 2022 | ||||||||||
| Marketable equity securities |
|
|
|||||||||
| Non-marketable equity securities |
|
|
|||||||||
| Equity-accounted investments |
|
|
|||||||||
|
|
|
||||||||||
The total carrying value of investments in equity-accounted investees is summarized as follows:
| October 1, 2023 | December 31, 2022 | ||||||||||||||||||||||
| Shareholding % | Amount | Shareholding % | Amount | ||||||||||||||||||||
| SMART Growth Fund, L.P. |
|
% |
|
|
% |
|
|||||||||||||||||
| SigmaSense, LLC |
|
% |
|
|
|
||||||||||||||||||
| Others |
|
|
|
|
|||||||||||||||||||
|
|
|
||||||||||||||||||||||
Results related to equity-accounted investees at the end of each period were as follows:
| For the three months ended | For the nine months ended | ||||||||||||||||||||||
| October 1, 2023 | October 2, 2022 | October 1, 2023 | October 2, 2022 | ||||||||||||||||||||
| Company's share in income (loss) |
(
|
(
|
(
|
|
|||||||||||||||||||
| Other results |
|
|
|
|
|||||||||||||||||||
|
(
|
(
|
(
|
|
||||||||||||||||||||
Other current liabilities
9
Other current liabilities at October 1, 2023 and December 31, 2022 consisted of the following:
| October 1, 2023 | December 31, 2022 | ||||||||||
| Accrued compensation and benefits |
|
|
|||||||||
| Customer programs |
|
|
|||||||||
| Income taxes payable |
|
|
|||||||||
| Dividend payable |
|
|
|||||||||
| Other |
|
|
|||||||||
|
|
|
||||||||||
|
December 31,
2022 |
|||||
| Accounts payable: | |||||
| As reported |
|
||||
| Reclassification - customer programs |
(
|
||||
| Adjusted |
|
||||
| Other current liabilities: | |||||
| As reported |
|
||||
| Reclassification - customer programs |
|
||||
| Adjusted |
|
||||
10
Accumulated other comprehensive income (loss)
Total comprehensive income (loss) represents net income (loss) plus the results of certain equity changes not reflected in the condensed consolidated statements of operations.
The after-tax components of accumulated other comprehensive income (loss) and their corresponding changes are shown below:
|
Currency
translation differences |
Change in fair
value cash flow hedges |
Net actuarial
gain/(losses) |
Accumulated
Other Comprehensive Income (loss) |
||||||||||||||||||||
| As of December 31, 2022 |
|
(
|
(
|
|
|||||||||||||||||||
|
Other comprehensive income (loss) before
reclassifications |
(
|
(
|
|
(
|
|||||||||||||||||||
|
Amounts reclassified out of accumulated other
comprehensive income (loss) |
|
|
|
|
|||||||||||||||||||
| Tax effects |
|
|
|
|
|||||||||||||||||||
| Other comprehensive income (loss) |
(
|
(
|
|
(
|
|||||||||||||||||||
| As of October 1, 2023 |
|
(
|
|
|
|||||||||||||||||||
Cash dividends
The following dividends were declared during the first three quarters of 2023 and 2022 under NXP’s quarterly dividend program:
| Fiscal year 2023 | Fiscal year 2022 | ||||||||||||||||||||||
| Dividend per share | Amount | Dividend per share | Amount | ||||||||||||||||||||
| First quarter |
|
|
|
|
|||||||||||||||||||
| Second quarter |
|
|
|
|
|||||||||||||||||||
| Third quarter |
|
|
|
|
|||||||||||||||||||
The dividend declared in the third quarter (not yet paid) is classified in the condensed consolidated balance sheet in other current liabilities as of October 1, 2023 and was subsequently paid on October 5, 2023.
5
Restructuring
At each reporting date, we evaluate our restructuring liabilities, which consist primarily of termination benefits, to ensure that our accruals are still appropriate.
The following table presents the changes in restructuring liabilities in 2023:
| As of January 1, 2023 | Additions | Utilized | Released |
Other
changes |
As of October 1, 2023 | ||||||||||||||||||||||||||||||
| Restructuring liabilities |
|
|
(
|
(
|
(
|
|
|||||||||||||||||||||||||||||
The total restructuring liability as of October 1, 2023 of $
19
million is classified in the consolidated balance sheet under current liabilities ($
16
million) and non-current liabilities ($
3
million).
The restructuring charges for the nine month period ending October 1, 2023 consist of $
21
million for personnel related costs for a new restructuring program, offset by a $
7
million release for an earlier program. There were
no
significant restructuring costs incurred for the nine month period ended October 2, 2022 and the utilization of the restructuring liabilities mainly reflects the execution of ongoing restructuring programs the Company initiated in earlier years.
These restructuring charges recorded in operating income, for the periods indicated, are included in the following line items in the statement of operations:
| For the three months ended | For the nine months ended | ||||||||||||||||||||||
| October 1, 2023 | October 2, 2022 | October 1, 2023 | October 2, 2022 | ||||||||||||||||||||
| Cost of revenue |
|
|
(
|
(
|
|||||||||||||||||||
| Research and development |
(
|
|
|
(
|
|||||||||||||||||||
| Selling, general and administrative |
|
|
|
|
|||||||||||||||||||
| Net restructuring charges |
(
|
|
|
(
|
|||||||||||||||||||
11
6
Income Tax
| For the three months ended | For the nine months ended | ||||||||||||||||||||||
| October 1, 2023 | October 2, 2022 | October 1, 2023 | October 2, 2022 | ||||||||||||||||||||
| Benefit (provision) for income taxes |
(
|
(
|
(
|
(
|
|||||||||||||||||||
| Effective tax rate |
|
% |
|
% |
|
% |
|
% | |||||||||||||||
| Statutory income tax rate in the Netherlands |
|
% |
|
% |
|
% |
|
% | |||||||||||||||
Beginning with the first quarter of 2023, NXP was in a position to make a reliable estimate of its annual effective tax rate. This estimated annual effective tax rate ("EAETR") is then applied to the year-to-date
Income (loss) before income taxes
excluding discrete items, to determine the year-to-date benefit (provision) for income taxes. The income tax effects of any discrete items are recognized in the interim period in which they occur. As the year progresses, the Company continually refines the EAETR based upon actual events and the apportionment of our earnings (loss). This continual estimation process periodically may result in a change to our EAETR for the year. When this occurs, we adjust on an accumulated basis the benefit (provision) for income taxes during the quarter in which the change occurs.
Our provision for income taxes for 2023 is based on our EAETR of
16.1
%, which is lower than the Netherlands statutory tax rate of
25.8
%, primarily due to tax benefits from the Netherlands and foreign tax incentives.
The effective tax rate of
13.4
% for the third quarter of 2023 was lower than the EAETR due to the income tax benefit for discrete items of $
12
million. The discrete items are primarily related to changes in estimates for previous years, and the impact of foreign currency on income tax related items. Compared to prior quarters, the EAETR was lower due to a recapture of $
13
million tax benefit in the third quarter primarily as a result of new guidance released by the Internal Revenue Service to clarify the treatment of specified research and experimental expenditures under Section 174.
For the first nine months of 2023 the effective tax rate of
15.8
% was lower than
16.1
% due to the net result of favorable discrete items of $
8
million.
The effective tax rate of
15.8
% for the first nine months of 2022 was equal to the current period of
15.8
%.
7
Identified Intangible Assets
Identified intangible assets as of October 1, 2023 and December 31, 2022, respectively, were composed of the following:
| October 1, 2023 | December 31, 2022 | ||||||||||||||||||||||
|
Gross carrying
amount |
Accumulated
amortization |
Gross carrying
amount |
Accumulated
amortization |
||||||||||||||||||||
|
In-process R&D (IPR&D)
1)
|
|
— |
|
— | |||||||||||||||||||
| Customer-related |
|
(
|
|
(
|
|||||||||||||||||||
| Technology-based |
|
(
|
|
(
|
|||||||||||||||||||
| Identified intangible assets |
|
(
|
|
(
|
|||||||||||||||||||
|
1)
IPR&D is not subject to amortization until completion or abandonment of the associated research and development effort.
|
|||||||||||||||||||||||
The estimated amortization expense for these identified intangible assets for each of the five succeeding years is:
| 2023 (remaining) |
|
||||
| 2024 |
|
||||
| 2025 |
|
||||
| 2026 |
|
||||
| 2027 |
|
||||
| Thereafter |
|
||||
All intangible assets, excluding IPR&D and goodwill, are subject to amortization and have no assumed residual value.
The expected weighted average remaining life of identified intangibles is
4
years as of October 1, 2023 (December 31, 2022:
4
years).
12
8
Debt
The following table summarizes the outstanding debt as of October 1, 2023 and December 31, 2022:
| October 1, 2023 | December 31, 2022 | ||||||||||||||||||||||||||||
| Maturities | Amount |
Interest
rate |
Amount |
Interest
rate |
|||||||||||||||||||||||||
|
Fixed-rate
|
Mar, 2024 |
|
|
|
|
||||||||||||||||||||||||
|
Fixed-rate
|
May, 2025 |
|
|
|
|
||||||||||||||||||||||||
|
Fixed-rate
|
Mar, 2026 |
|
|
|
|
||||||||||||||||||||||||
|
Fixed-rate
|
Jun, 2026 |
|
|
|
|
||||||||||||||||||||||||
|
Fixed-rate
|
May, 2027 |
|
|
|
|
||||||||||||||||||||||||
|
Fixed-rate
|
Jun, 2027 |
|
|
|
|
||||||||||||||||||||||||
|
Fixed-rate
|
Dec, 2028 |
|
|
|
|
||||||||||||||||||||||||
|
Fixed-rate
|
Jun, 2029 |
|
|
|
|
||||||||||||||||||||||||
|
Fixed-rate
|
May, 2030 |
|
|
|
|
||||||||||||||||||||||||
|
Fixed-rate
|
May, 2031 |
|
|
|
|
||||||||||||||||||||||||
|
Fixed-rate
|
Feb, 2032 |
|
|
|
|
||||||||||||||||||||||||
|
Fixed-rate
|
Jan, 2033 |
|
|
|
|
||||||||||||||||||||||||
|
Fixed-rate
|
May, 2041 |
|
|
|
|
||||||||||||||||||||||||
|
Fixed-rate
|
Feb, 2042 |
|
|
|
|
||||||||||||||||||||||||
|
Fixed-rate
|
Nov, 2051 |
|
|
|
|
||||||||||||||||||||||||
| Floating-rate revolving credit facility (RCF) | Aug, 2027 |
|
|
|
|
||||||||||||||||||||||||
| Total principal |
|
|
|||||||||||||||||||||||||||
|
Unamortized discounts, premiums and debt
issuance costs |
(
|
(
|
|||||||||||||||||||||||||||
|
Total debt, including unamortized discounts,
premiums, debt issuance costs and fair value adjustments |
|
|
|||||||||||||||||||||||||||
| Current portion of long-term debt |
(
|
|
|||||||||||||||||||||||||||
| Long-term debt |
|
|
|||||||||||||||||||||||||||
9
Related-Party Transactions
The Company's related parties are the members of the board of directors of NXP Semiconductors N.V., the executive officers of NXP Semiconductors N.V. and equity-accounted investees.
The following table presents the amounts related to revenue and other income and purchase of goods and services incurred in transactions with these related parties:
| For the three months ended | For the nine months ended | ||||||||||||||||||||||
| October 1, 2023 | October 2, 2022 | October 1, 2023 | October 2, 2022 | ||||||||||||||||||||
| Revenue and other income |
|
|
|
|
|||||||||||||||||||
| Purchase of goods and services |
|
|
|
|
|||||||||||||||||||
The following table presents the amounts related to receivable and payable balances with these related parties:
| October 1, 2023 | December 31, 2022 | ||||||||||
| Receivables |
|
|
|||||||||
| Payables |
|
|
|||||||||
13
10
Fair Value Measurements
The following table summarizes the estimated fair value of our financial instruments which are measured at fair value on a recurring basis:
|
Estimated fair value
|
|||||||||||||||||
|
Fair value
hierarchy |
October 1, 2023 | December 31, 2022 | |||||||||||||||
| Assets: | |||||||||||||||||
| Money market funds | 1 |
|
|
||||||||||||||
| Marketable equity securities | 1 |
|
|
||||||||||||||
| Derivative instruments-assets | 2 |
|
|
||||||||||||||
| Liabilities: | |||||||||||||||||
| Derivative instruments-liabilities | 2 |
(
|
(
|
||||||||||||||
The following methods and assumptions were used to estimate the fair value of financial instruments:
Assets and liabilities measured at fair value on a recurring basis
Investments in money market funds (as part of our cash and cash equivalents) and marketable equity securities (as part of other non-current assets) have fair value measurements which are all based on quoted prices in active markets for identical assets or liabilities. For derivatives (as part of other current assets or accrued liabilities) the fair value is based upon significant other observable inputs depending on the nature of the derivative.
Assets and liabilities recorded at fair value on a non-recurring basis
We measure and record our non-marketable equity securities, equity method investments and non-financial assets, such as intangible assets and property, plant and equipment, at fair value when an impairment charge is required.
Assets and liabilities not recorded at fair value on a recurring basis
Financial instruments not recorded at fair value on a recurring basis include non-marketable equity securities and equity method investments that have not been remeasured or impaired in the current period and debt.
As of October 1, 2023, the estimated fair value of current and non-current debt was $
9.6
billion ($
9.8
billion as of December 31, 2022). The fair value is estimated on the basis of broker-dealer quotes, which are Level 2 inputs. Accrued interest is included under accrued liabilities and not within the carrying amount or estimated fair value of debt.
11
Commitments and Contingencies
Purchase Commitments
The Company maintains purchase commitments with certain suppliers, primarily for raw materials, semi-finished goods and manufacturing services and for some non-production items. Purchase commitments for inventory materials are generally restricted to a forecasted time-horizon as mutually agreed upon between the parties. This forecasted time-horizon can vary for different suppliers. As of October 1, 2023, the Company had purchase commitments of $
3.9
billion, which are due through
2044
. Our long-term obligations increased substantially in 2021 as we locked in long-term supply with our key manufacturing partners.
Legal Proceedings
We are regularly involved as plaintiffs or defendants in claims and litigation relating to a variety of matters such as contractual disputes, personal injury claims, employee grievances and intellectual property litigation. In addition, our acquisitions, divestments and financial transactions sometimes result in, or are followed by, claims or litigation. Some of these claims may possibly be recovered from insurance reimbursements. Although the ultimate disposition of asserted claims cannot be predicted with certainty, it is our belief that the outcome of any such claims, either individually or on a combined basis, will not have a material adverse effect on our consolidated financial position. However, such outcomes may be material to our condensed consolidated statement of operations for a particular period. The Company records an accrual for any claim that arises whenever it considers that it is probable that it is exposed to a loss contingency and the amount of the loss contingency can be reasonably estimated. The Company does not record a gain contingency until the period in which all contingencies are resolved and the gain is realized or realizable. Legal fees are expensed when incurred.
Impinj Patent Litigation
We are involved in a dispute with Impinj, Inc. (“Impinj”) regarding the infringement of IP rights. Impinj has initiated a number of lawsuits alleging infringement of their IP rights by certain of our products and we have initiated a lawsuit and countersuit alleging infringement of our IP rights by certain products of Impinj. Specifically, on June 6, 2019, Impinj filed a complaint against us in the U.S District Court for the Northern District of California (the “Court”) alleging that certain of our products (NXP’s UCODE8 and UCODE 9 integrated circuits) infringed
26
Impinj patents. The case was subsequently narrowed to
two
patents: U.S. patent nos. 9,633,302 (the “’302 patent”) and 8,115,597 (the “’597 patent”), seeking damages and injunctive relief. Before trial, the Court granted summary judgment of infringement on the ‘302 patent. At trial, on July 14, 2023, the jury returned a verdict finding that NXP infringed the asserted claims of the ‘597 patent. The jury awarde
d approximately $
19
million in
damages. The Court subsequently issued its judgment on October 3, 2023, reducing the award to approximately
$
13
million,
ordering a new trial on the ‘302 patent, and denying Impinj’s request for an injunction based on infringement of the
14
‘597 patent. NXP intends to appeal the judgment to the United States Court of Appeals for the Federal Circuit. On May 25, 2021, Impinj initiated a lawsuit in the United States District Court for the Western District of Texas (Waco) alleging that certain of our products infringe
9
Impinj patents. NXP countersued alleging that certain products of Impinj infringe
9
patents owned or licensed by NXP. This case commenced into trial beginning
October 30, 2023.
We dispute Impinj’s claims and intend to continue to pursue available defenses and appeals. We are unable to make a reasonable estimate of losses in excess of the currently accrued amounts given recent developments and future proceedings.
Motorola Personal Injury Lawsuits
The Company is currently assisting Motorola in the defense of personal injury lawsuits due to indemnity obligations included in the agreement that separated Freescale from Motorola in 2004. The multi-plaintiff Motorola lawsuits are pending in the Circuit Court of Cook County, Illinois. These claims allege a link between working in semiconductor manufacturing clean room facilities and birth defects in
22
individuals. The Motorola suits allege exposures between 1980 and 2005. Each claim seeks an unspecified amount of damages for the alleged injuries; however, legal counsel representing the plaintiffs has indicated they will seek substantial compensatory and punitive damages from Motorola for the entire inventory of claims which, if proven and recovered, the Company considers to be material. A portion of any indemnity due to Motorola will be reimbursed to NXP if Motorola receives an indemnification payment from its insurance coverage. Motorola has potential insurance coverage for many of the years indicated above, but with differing types and levels of coverage, self-insurance retention amounts and deductibles. We are in discussions with Motorola and their insurers regarding the availability of applicable insurance coverage for each of the individual cases. Motorola and NXP have denied liability for these alleged injuries based on numerous defenses.
Legal Proceedings Related Accruals and Insurance Coverage
The Company reevaluates at least on a quarterly basis the claims that have arisen to determine whether any new accruals need to be made or whether any accruals made need to be adjusted based on the most current information available to it and based on its best estimate. Based on the procedures described above, the Company has an aggregate amount of $
114
million accrued for potential and current legal proceedings pending as of October 1, 2023, compared to $
58
million accrued at December 31, 2022 (without reduction for any related insurance reimbursements). The accruals are included in “Other current liabilities” and in “Other non-current liabilities”. As of October 1, 2023, the Company’s related balance of insurance reimbursements was $
67
million (December 31, 2022: $
43
million) and is included in “Other non-current assets”.
The Company also estimates the aggregate range of reasonably possible losses in excess of the amount accrued based on currently available information for those cases for which such estimate can be made. The estimated aggregate range requires significant judgment, given the varying stages of the proceedings, the existence of multiple defendants (including the Company) in such claims whose share of liability has yet to be determined, the numerous yet-unresolved issues in many of the claims, and the attendant uncertainty of the various potential outcomes of such claims. Accordingly, the Company’s estimate will change from time to time, and actual losses may be more than the current estimate. As at October 1, 2023, the Company believes that for all litigation pending its potential aggregate exposure to loss in excess of the amount accrued (without reduction for any amounts that may possibly be recovered under insurance programs) could range between $
0
and $
100
million. Based upon our past experience with these matters, the Company would expect to receive additional insurance reimbursement of up to $
70
million on certain of these claims that would partially offset the potential aggregate exposure to loss in excess of the amount accrued.
15
Item 2. Management’s Discussion and Analysis of Financial Condition and Results of Operations
Management’s Discussion and Analysis (MD&A) should be read in conjunction with our consolidated financial statements and notes and the MD&A in our Annual Report on Form 10-K for the year ended December 31, 2022, and the financial statements and the related notes that appear elsewhere in this document. This discussion contains forward-looking statements that involve a number of risks and uncertainties, including any statements that refer to projections of our future financial performance, our anticipated growth and trends in our businesses, uncertain events or assumptions, and other characterizations of future events or circumstances. Such statements are based on our current expectations and could be affected by the uncertainties and risk factors described throughout this filing and in Part I, Item 1A “Risk Factors” of our Annual Report on Form 10-K. Our actual results may differ materially from those contained in any forward-looking statements. We undertake no obligation to update any forward-looking statement to reflect subsequent events or circumstances.
Overview
Q3 2023 compared to Q2 2023
Revenue for the three months ended October 1, 2023 was $3,434 million compared to $3,299 million for the three months ended July 2, 2023, an increase of $135 million or 4.1% quarter-on-quarter. NXP experienced growth in the Mobile end market of $93 million or 32.7%, Industrial IoT our end market of $29 million or 5.0%, and Automotive end market of $25 million or 1.3%. The positive trends were offset by declines in the Communications Infrastructure & Other end market of $12 million or 2.1%.
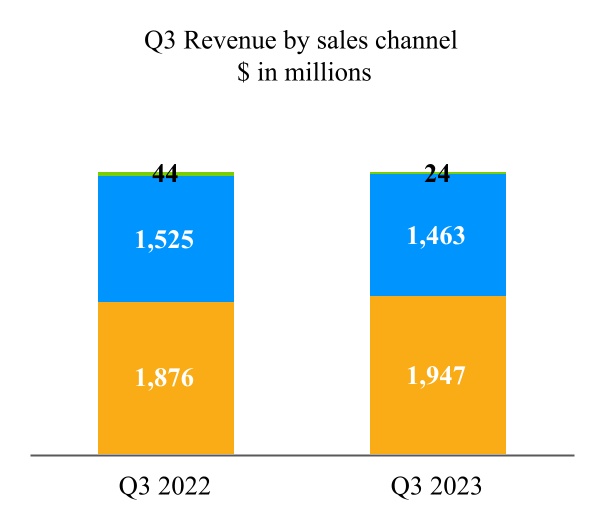
When aggregating all end markets together and reviewing sales channel performance, revenues through NXP's third party distribution partners was $1,947 million, an increase of $268 million or 16.0% compared to the previous period. Revenues through NXP's third party direct OEM and EMS customers was $1,463 million, a decline of $133 million or 8.3% versus the previous period.
From a geographic perspective, revenue increased across the China and EMEA regions, remaining flat in the Americas region, and declining in the Asia Pacific regions.
Our gross profit percentage for the three months ended October 1, 2023 of 57.2% was relatively consistent compared with 57.0% for the three months ended July 2, 2023.
Operating income for the three months ended October 1, 2023 was $992 million compared to $937 million for the three months ended July 2, 2023, an increase of $55 million or 5.9%. Higher revenue drove the sequential increase.
We continue to generate strong operating cash flows with our operating activities providing $988 million in cash flow in the third quarter of 2023, while we returned $568 million to our shareholders during the same period. Our cash position at the end of the third quarter of 2023 was $4,042 million.
Results of operations
The following table presents operating income for each of the three and nine month periods ended October 1, 2023 and October 2, 2022, respectively:
16
| ($ in millions, unless otherwise stated) | Q3 2023 | Q3 2022 | Increase/decrease | YTD 2023 | YTD 2022 | Increase/decrease | |||||||||||||||||||||||||||||
| Revenue | 3,434 | 3,445 | (11) | 9,854 | 9,893 | (39) | |||||||||||||||||||||||||||||
| % nominal growth | (0.3) | 20.4 | (20.7) | (0.4) | 23.3 | (23.7) | |||||||||||||||||||||||||||||
| Gross profit | 1,965 | 1,967 | (2) | 5,616 | 5,626 | (10) | |||||||||||||||||||||||||||||
| Gross margin | 57.2 | % | 57.1 | % | 0.1 | ppt | 57.0 | % | 56.9 | % | 0.1 | ppt | |||||||||||||||||||||||
| Research and development | (601) | (548) | (53) | (1,767) | (1,608) | (159) | |||||||||||||||||||||||||||||
| Selling, general and administrative | (294) | (289) | (5) | (848) | (805) | (43) | |||||||||||||||||||||||||||||
| Amortization of acquisition-related intangible assets | (71) | (131) | 60 | (237) | (400) | 163 | |||||||||||||||||||||||||||||
| Other income (expense) | (7) | 2 | (9) | (10) | 4 | (14) | |||||||||||||||||||||||||||||
| Operating income (loss) | 992 | 1,001 | (9) | 2,754 | 2,817 | (63) | |||||||||||||||||||||||||||||
| Financial income (expense) | (75) | (98) | 23 | (231) | (331) | 100 | |||||||||||||||||||||||||||||
| Benefit (provision) for income taxes | (123) | (149) | 26 | (399) | (392) | (7) | |||||||||||||||||||||||||||||
| Results relating to equity-accounted investees | (2) | (4) | 2 | (5) | 5 | (10) | |||||||||||||||||||||||||||||
| Net income (loss) | 792 | 750 | 42 | 2,119 | 2,099 | 20 | |||||||||||||||||||||||||||||
| Less: Net income (loss) attributable to non-controlling interests | 5 | 12 | (7) | 19 | 34 | (15) | |||||||||||||||||||||||||||||
| Net income (loss) attributable to stockholders | 787 | 738 | 49 | 2,100 | 2,065 | 35 | |||||||||||||||||||||||||||||
| Diluted earnings per share | 3.01 | 2.79 | 0.22 | 8.03 | 7.80 | 0.23 | |||||||||||||||||||||||||||||
Revenue
Q3 2023 compared to Q3 2022
Revenue for the three months ended October 1, 2023 was $3,434 million compared to $3,445 million for the three months ended October 2, 2022, a decrease of $11 million or 0.3%
.
NXP experienced growth in its Automotive and Communication Infrastructure & Other end markets, which were offset by declines in the Industrial IoT and the Mobile end markets versus the year ago period.
YTD 2023 compared to YTD 2022
Revenue for the nine months ended October 1, 2023 was $9,854 million compared to $9,893 million for the nine months ended October 2, 2022, a decrease of $39 million or 0.4%. NXP experienced growth in its Automotive and Communication Infrastructure & Other end markets which were offset by declines in the Industrial IoT and the Mobile end markets versus the year ago period.
17
Revenue by end market was as follows:
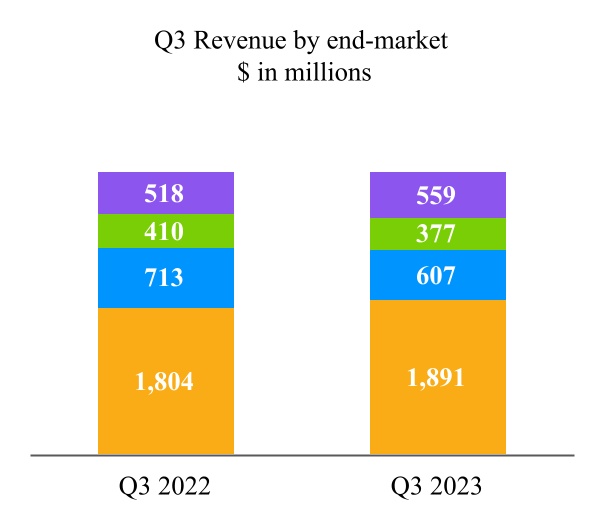
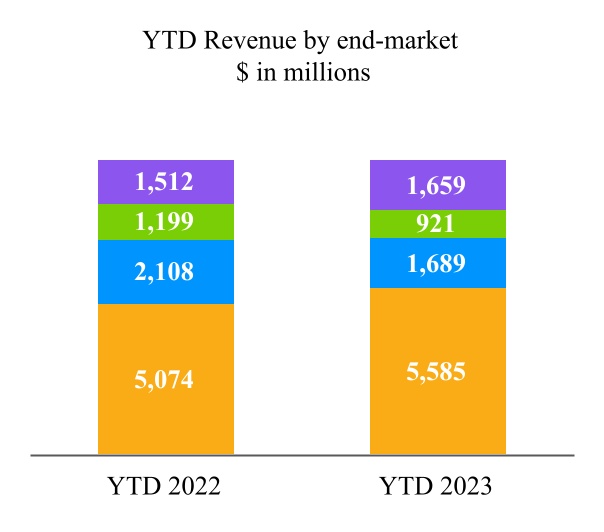
| ($ in millions, unless otherwise stated) | Q3 2023 | Q3 2022 | % change | YTD 2023 | YTD 2022 | % change | |||||||||||||||||||||||||||||
| Automotive | 1,891 | 1,804 | 4.8 | % | 5,585 | 5,074 | 10.1 | % | |||||||||||||||||||||||||||
| Industrial & IoT | 607 | 713 | (14.9) | % | 1,689 | 2,108 | (19.9) | % | |||||||||||||||||||||||||||
| Mobile | 377 | 410 | (8.0) | % | 921 | 1,199 | (23.2) | % | |||||||||||||||||||||||||||
| Communication Infrastructure & Other | 559 | 518 | 7.9 | % | 1,659 | 1,512 | 9.7 | % | |||||||||||||||||||||||||||
| Revenue | 3,434 | 3,445 | (0.3) | % | 9,854 | 9,893 | (0.4) | % | |||||||||||||||||||||||||||
| n | Automotive | n | Mobile | |||||||||||
| n | Industrial IoT | n | Comm Infra & Other | |||||||||||
Revenue by sales channel was as follows:
| ($ in millions, unless otherwise stated) | Q3 2023 | Q3 2022 | % change | YTD 2023 | YTD 2022 | % change | |||||||||||||||||||||||||||||
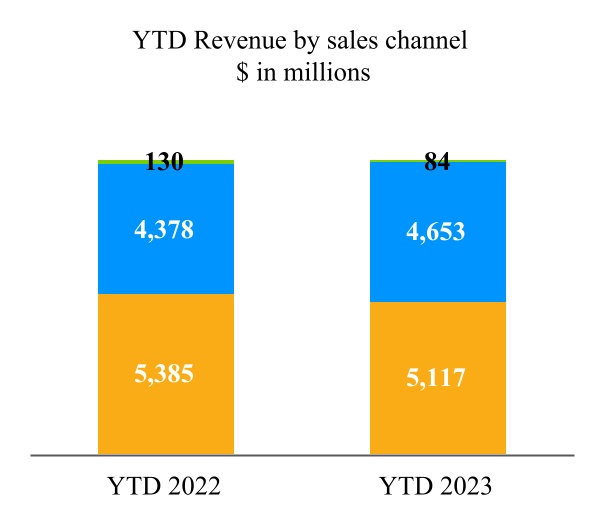
| Distributors | 1,947 | 1,876 | 3.8 | % | 5,117 | 5,385 | (5.0) | % | |||||||||||||||||||||||||||
| OEM/EMS | 1,463 | 1,525 | (4.1) | % | 4,653 | 4,378 | 6.3 | % | |||||||||||||||||||||||||||
| Other | 24 | 44 | (45.5) | % | 84 | 130 | (35.4) | % | |||||||||||||||||||||||||||
| Revenue | 3,434 | 3,445 | (0.3) | % | 9,854 | 9,893 | (0.4) | % | |||||||||||||||||||||||||||
| n | Distributors | n | Other | ||||||||||||||
| n | OEM/EMS | ||||||||||||||||
18
Revenue by geographic region, which is based on the customer’s shipped-to location was as follows:
| ($ in millions, unless otherwise stated) | Q3 2023 | Q3 2022 | % change | YTD 2023 | YTD 2022 | % change | |||||||||||||||||||||||||||||
|
China
1)
|
1,150 | 1,260 | (8.7) | % | 3,128 | 3,502 | (10.7) | % | |||||||||||||||||||||||||||
| APAC, excluding China | 906 | 1,046 | (13.4) | % | 2,839 | 3,080 | (7.8) | % | |||||||||||||||||||||||||||
| EMEA (Europe, the Middle East and Africa) | 866 | 672 | 28.9 | % | 2,388 | 1,978 | 20.7 | % | |||||||||||||||||||||||||||
| Americas | 512 | 467 | 9.6 | % | 1,499 | 1,333 | 12.5 | % | |||||||||||||||||||||||||||
| Revenue | 3,434 | 3,445 | (0.3) | % | 9,854 | 9,893 | (0.4) | % | |||||||||||||||||||||||||||
|
1)
China includes Mainland China and Hong Kong
|
|||||||||||||||||||||||||||||||||||
Q3 2023 compared to Q3 2022
When aggregating all end markets together, and reviewing sales channel performance, revenues through NXP’s third party distribution partners was $1,947 million, an increase of 3.8% versus the year ago period. Revenues through direct OEM and EMS customers was $1,463 million, a decrease of 4.1% versus the year ago period.
From a geographic perspective, revenue declined year-on-year in the China and in Asia Pacific regions, while revenue increased in the EMEA and Americas regions.
Revenue in the Automotive end market was $1,891 million, an increase of $87 million or 4.8% versus the year ago period. The increase in the Automotive end market revenue can be attributed to growth in advanced analog and processors. Offsetting these positive growth trends were declines in our ADAS – Safety products.
Revenue in the Industrial & IoT end market was $607 million, a decrease of $106 million or 14.9% versus the year ago period. Within the Industrial & IoT end market the year-on-year decline was across the entire product portfolio, including processors, advanced analog, connectivity, and security.
Revenue in the Mobile end market was $377 million, a decrease of $33 million or 8.0% versus the year ago period. The decrease in the Mobile end market revenue was from declines in our advanced analog and mobile wallet, offset by growth in connectivity.
Revenue in the Communication Infrastructure & Other end market was $559 million, an increase of $41 million or 7.9% versus the year ago period. The increase in revenue was due to growth in secure cards. Offsetting these positive growth trends were declines in our RF power products and processors.
YTD 2023 compared to YTD 2022
When aggregating all end markets together, and reviewing sales channel performance, revenues through NXP’s third party distribution partners was $5,117 million, a decrease of 5.0% versus the year ago period. Revenues through direct OEM and EMS customers was $4,653 million, an increase of 6.3% versus the year ago period.
From a geographic perspective, revenue declined in China and in Asia Pacific regions, while revenues increased in the EMEA and Americas regions.
Revenue in the Automotive end market was $5,585 million, an increase of $511 million or 10.1% versus the year ago period. The increase in the Automotive end market year-to-date revenues can be attributed to growth in processors, advanced analog, and connectivity. Offsetting these positive growth trends were declines in our ADAS – Safety products.
Revenue in the Industrial & IoT end market was $1,689 million, a decrease of $419 million or 19.9% versus the year ago period. Within the Industrial & IoT end market the year-to-date decline was across the entire product portfolio, including processors, advanced analog, connectivity, and security.
Revenue in the Mobile end market was $921 million, a decrease of $278 million or 23.2% versus the year ago period. The decrease in the Mobile end market revenue was from declines in our advanced analog and mobile wallet, offset by growth in connectivity.
Revenue in the Communication Infrastructure & Other end market was $1,659 million, an increase of $147 million or 9.7% versus the year ago period. The increase in revenue was growth in secure cards and processors. Offsetting these positive growth trends were declines in our RF power products.
Gross profit
Q3 2023 compared to Q3 2022
Gross profit for the three months ended October 1, 2023 was $1,965 million, or 57.2% of revenue, compared to $1,967 million, or 57.1% of revenue for the three months ended October 2, 2022, resulting from inflationary effects of increased input costs from suppliers which were passed along to end customers.
19
YTD 2023 compared to YTD 2022
Gross profit for the nine months ended October 1, 2023 was $5,616 million, or 57.0% of revenue, compared to $5,626 million, or 56.9% of revenue for the nine months ended October 2, 2022, resulting from inflationary effects of increased input costs from suppliers which were passed along to end customers.
Operating expenses
Research and development
| ($ in millions, unless otherwise stated) | Q3 2023 | Q3 2022 | % change | YTD 2023 | YTD 2022 | % change | |||||||||||||||||||||||||||||
| Research and development | 601 | 548 | 9.7 | % | 1,767 | 1,608 | 9.9 | % | |||||||||||||||||||||||||||
| As a percentage of revenue | 17.5 | % | 15.9 | % | 1.6 | ppt | 17.9 | % | 16.3 | % | 1.6 | ppt | |||||||||||||||||||||||
Q3 2023 compared to Q3 2022
R&D costs for the three months ended October 1, 2023 increased by $53 million, or 9.7%, when compared to the three months ended October 2, 2022 mainly driven by:
+
higher personnel-related costs;
+
higher variable compensation costs; and
-
lower pre-production related expenses.
YTD 2023 compared to YTD 2022
R&D costs for the nine months ended October 1, 2023 increased by $159 million, or 9.9%, when compared to the nine months ended October 2, 2022 mainly driven by:
+
higher personnel-related costs;
+
higher restructuring costs;
+
higher IP and other licenses related costs; and
-
lower pre-production related expenses.
Selling, general and administrative
| ($ in millions, unless otherwise stated) | Q3 2023 | Q3 2022 | % change | YTD 2023 | YTD 2022 | % change | |||||||||||||||||||||||||||||
| Selling, general and administrative | 294 | 289 | 1.7 | % | 848 | 805 | 5.3 | % | |||||||||||||||||||||||||||
| As a percentage of revenue | 8.6 | % | 8.4 | % | 0.2 | ppt | 8.6 | % | 8.1 | % | 0.5 | ppt | |||||||||||||||||||||||
Q3 2023 compared to Q3 2022
SG&A costs for the three months ended October 1, 2023 increased by $5 million, or 1.7%, when compared to the three months ended October 2, 2022 mainly due to:
+
higher legal expense.
YTD 2023 compared to YTD 2022
SG&A costs for the nine months ended October 1, 2023 increased by $43 million, or 5.3%, when compared to the nine months ended October 2, 2022 mainly due to:
+
higher personnel-related costs;
+
higher legal expense;
+
higher
communication & IT cost;
+
higher travel expense; and
-
lower variable compensation costs.
Amortization of acquisition-related intangible assets
| ($ in millions, unless otherwise stated) | Q3 2023 | Q3 2022 | % change | YTD 2023 | YTD 2022 | % change | |||||||||||||||||||||||||||||
| Amortization of acquisition-related intangible assets | 71 | 131 | (45.8) | % | 237 | 400 | (40.8) | % | |||||||||||||||||||||||||||
| As a percentage of revenue | 2.1 | % | 3.8 | % | (1.7) | ppt | 2.4 | % | 4.0 | % | (1.6) | ppt | |||||||||||||||||||||||
20
Q3 2023 compared to Q3 2022
Amortization of acquisition-related intangible assets for the three months ended October 1, 2023 decreased by $60 million, or 45.8%, when compared to the three months ended October 2, 2022 driven by:
-
certain intangibles became fully amortized during 2022.
YTD 2023 compared to YTD 2022
Amortization of acquisition-related intangible assets for the nine months ended October 1, 2023 decreased by $163 million, or 40.8%, when compared to the nine months ended October 2, 2022 driven by:
-
certain intangibles became fully amortized during 2022.
Financial income (expense)
The following table presents the details of financial income and expenses:
| ($ in millions, unless otherwise stated) | Q3 2023 | Q3 2022 | YTD 2023 | YTD 2022 | |||||||||||||||||||
| Interest income | 49 | 21 | 134 | 29 | |||||||||||||||||||
| Interest expense | (109) | (109) | (329) | (319) | |||||||||||||||||||
| Total other financial income/ (expense) | (15) | (10) | (36) | (41) | |||||||||||||||||||
| Total | (75) | (98) | (231) | (331) | |||||||||||||||||||
Interest income
Q3 2023 compared to Q3 2022
Interest income increased due to higher interest rates and to a lesser extent by a higher level of cash.
YTD 2023 compared to YTD 2022
Interest income increased due to higher interest rates and to a lesser extent by a higher level of cash.
Interest expense
Q3 2023 compared to Q3 2022
Interest expense remained flat.
YTD 2023 compared to YTD 2022
Interest expense increased due to the issuance of $1.5 billion of senior unsecured notes partially offset by the redemption of $900 million of senior unsecured notes in the second quarter of 2022.
Other, net
Q3 2023 compared to Q3 2022
Other, net, mainly increased due to foreign currency results (a loss of $5 million in the third quarter of 2023 versus a loss of $1 million in the third quarter of 2022).
YTD 2023 compared to YTD 2022
Other, net, decreased due to debt extinguishment cost of $18 million in the second quarter of 2022 and higher foreign currency results (a loss of $15 million in the first nine months of 2023 versus a profit of $2 million in the first nine months of 2022) Also included are fair value adjustments in equity securities (a profit of $1 million in the first nine months of 2023 versus a loss of $6 million in the first nine months of 2022).
Benefit (provision) for income taxes
| Q3 2023 | Q3 2022 | YTD 2023 | YTD 2022 | ||||||||||||||||||||
| Benefit (provision) for income taxes | (123) | (149) | (399) | (392) | |||||||||||||||||||
| Effective tax rate | 13.4 | % | 16.5 | % | 15.8 | % | 15.8 | % | |||||||||||||||
| Statutory income tax rate in the Netherlands | 25.8 | % | 25.8 | % | 25.8 | % | 25.8 | % | |||||||||||||||
Beginning with the first quarter of 2023, NXP was in a position to make a reliable estimate of its annual effective tax rate. This estimated annual effective tax rate ("EAETR") is then applied to the year-to-date
Income (loss) before income taxes
excluding discrete items, to determine the year-to-date benefit (provision) for income taxes. The income tax effects of any discrete items are recognized in the interim period in which they occur. As the year progresses, the Company continually refines the EAETR based upon actual events and the
21
apportionment of our earnings (loss). This continual estimation process periodically may result in a change to our EAETR for the year. When this occurs, we adjust on an accumulated basis the benefit (provision) for income taxes during the quarter in which the change occurs.
Our provision for income taxes for 2023 is based on our EAETR of 16.1%, which is lower than the Netherlands statutory tax rate of 25.8%, primarily due to tax benefits from the Netherlands and foreign tax incentives.
Q3 2023 compared to Q3 2022
The effective tax rate of 13.4% for the third quarter of 2023 was lower than the EAETR due to the income tax benefit for discrete items of $12 million. The discrete items are primarily related to changes in estimates for previous years, and the impact of foreign currency on income tax related items. Compared to prior quarters, the EAETR was lower due to a recapture of $13 million tax benefit in the third quarter primarily as a result of new guidance released by the Internal Revenue Service to clarify the treatment of specified research and experimental expenditures under Section 174.
YTD 2023 compared to YTD 2022
For the first nine months of 2023 the effective tax rate of 15.8% was lower than 16.1% due to the net result of favorable discrete items of $8 million.
The effective tax rate of 15.8% for the first nine months of 2022 was equal to the current period of 15.8%.
Liquidity and Capital Resources
We derive our liquidity and capital resources primarily from our cash flows from operations. We continue to generate strong positive operating cash flows. At the end of the third quarter of 2023, our cash balance was $4,042 million, an increase of $197 million compared to December 31, 2022. Taking into account the available amount of the Unsecured Revolving Credit Facility of $2,500 million, we had access to $6,542 million of liquidity as of October 1, 2023. We currently use cash to fund operations, meet working capital requirements, for capital expenditures and for potential common stock repurchases, dividends and strategic investments. Based on past performance and current expectations, we believe that our current available sources of funds (including cash and cash equivalents, RCF Agreement of $2.5 billion, plus anticipated cash generated from operations) will be adequate to finance our operations, working capital requirements, capital expenditures and potential dividends for at least the next twelve months.
|
($ in millions, unless otherwise stated)
|
YTD 2023
|
YTD 2022
|
|||||||||
| Cash from operations | 2,376 | 2,819 | |||||||||
| Capital expenditures | 652 | 830 | |||||||||
| Cash to shareholders | 1,364 | 1,514 | |||||||||
Cash and cash equivalents
At October 1, 2023, our cash balance was $4,042 million of which $225 million was held by SSMC, our consolidated joint venture company with TSMC. Under the terms of our joint venture agreement with TSMC, a portion of this cash can be distributed by way of a dividend to us, but 38.8% of the dividend will be paid to our joint venture partner.
Capital expenditures
Our cash outflows for capital expenditures were $652 million in the first nine months of 2023, compared to $830 million in the first nine months of 2022.
Capital return
Under our Quarterly Dividend Program, interim dividends of $0.845 per ordinary share were paid on January 6, 2023 ($219 million), dividends of $1.014 per ordinary share were paid on April 5, 2023 ($264 million) and dividends of $1.014 per ordinary share were paid on July 6, 2023 ($262 million).
Outstanding indebtedness
Our total debt amounted to $11,172 million as of Q3 2023, an increase of $7 million compared to December 31, 2022 ($11,165 million), with net debt amounting to $7,130 million. Our current debt amounted to $999 million as of Q3 2023 and consists of our 4.875% Senior Unsecured Notes due March 2024, which we currently expect to retire when it comes due with cash on hand.
Cash flows
Our cash and cash equivalents during the first nine months of 2023 increased by $201 million (excluding the effect of changes in exchange rates on our cash position of $(4) million as follows:
22
| ($ in millions, unless otherwise stated) | YTD 2023 | YTD 2022 | |||||||||
| Net cash provided by (used for) operating activities | 2,376 | 2,819 | |||||||||
| Net cash (used for) provided by investing activities | (879) | (977) | |||||||||
| Net cash provided by (used for) financing activities | (1,296) | (891) | |||||||||
| Increase (decrease) in cash and cash equivalents | 201 | 951 | |||||||||
Cash Flow from Operating Activities
For the first nine months of 2023 our operating activities provided $2,376 million in cash. This was primarily the result of net income of $2,119 million, adjustments to reconcile the net income of $982 million and changes in operating assets and liabilities of $(746) million. Adjustments to net income (loss) includes offsetting non-cash items, such as depreciation and amortization of $837 million, share-based compensation of $304 million and changes in deferred taxes of $(170) million. Changes in operating assets and liabilities were primarily driven by a $359 million increase in inventories due to improved supply capabilities, $118 million increase in receivables and other current assets from prepayments to secure production supply with multiple vendors, and $220 million decrease in accounts payable and other liabilities as a result of timing related to payments.
For the first nine months of 2022 our operating activities provided $2,819 million in cash. This was primarily the result of net income of $2,099 million, adjustments to reconcile the net income of $1,043 million and changes in operating assets and liabilities of $(337) million. Adjustments to net income (loss) includes offsetting non-cash items, such as depreciation and amortization of $948 million, share-based compensation of $267 million and changes in deferred taxes of $(196) million. Changes in operating assets and liabilities were primarily driven by a $392 million increase in inventories due to increased production levels in order to align inventory on hand with expected demand, $165 million increase in receivables and other current assets due to the linearity of revenue between the two periods, customer mix, and the related timing of cash collection, $325 million increase in other non-current assets from prepayments to secure long-term production supply with multiple vendors; partially offset by $545 million increase in accounts payable and other liabilities as a result of timing related to payments.
Cash Flow from Investing Activities
Net cash used for investing activities amounted to $879 million for the first nine months of 2023 and principally consisted of the cash outflows for capital expenditures of $652 million, $135 million for the purchase of identified intangible assets, and $93 million for the purchase of investments.
Net cash used for investing activities amounted to $977 million for the first nine months of 2022 and principally consisted of the cash outflows for capital expenditures of $830 million, $122 million for the purchase of identified intangible assets, and $27 million for the net purchase of interests of businesses.
Cash Flow from Financing Activities
Net cash used for financing activities was $1,296 million for the first nine months of 2023 was primarily driven by the dividend payment to common stockholders of $745 million, and purchase of treasury shares and restricted stock unit holdings of $619 million; partially offset by the $70 million proceeds from the issuance of common stock through stock plans.
Net cash used for financing activities was $891 million for the first nine months of 2022 was primarily driven by the repurchase of long-term debt of $917 million, purchase of treasury shares and restricted stock unit holdings of $920 million, dividend payment to common stockholders of $594 million; partially offset by the proceeds from the issuance of long-term debt of $1,496 million.
Additional Capital Requirements
Expected working and other capital requirements are described in our Annual Report on Form 10-K for the fiscal year ended December 31, 2022 in Part II, Item 7, “Management’s Discussion and Analysis of Financial Condition and Results of Operations”. At October 1, 2023, other than for changes disclosed in the “Notes to Condensed Consolidated Financial Statements” and “Liquidity and Capital Resources” in this Quarterly Report, there have been no other material changes to our expected working and other capital requirements described in our Annual Report on Form 10-K for the fiscal year ended December 31, 2022.
23
Information Regarding Guarantors of NXP (unaudited)
Summarized Combined Financial Information for Guarantee of Securities of Subsidiaries
All debt instruments are guaranteed, fully and unconditionally, jointly and severally, by NXP Semiconductors N.V. and issued or guaranteed by NXP USA, Inc., NXP B.V. and NXP LLC, (together, the “Subsidiary Obligors” and together with NXP Semiconductors N.V., the “Obligor Group”). Other than the Subsidiary Obligors, none of the Company’s subsidiaries (together the “Non-Guarantor Subsidiaries”) guarantee the Notes. The Company consolidates the Subsidiary Obligors in its consolidated financial statements and each of the Subsidiary Obligors are wholly owned subsidiaries of the Company.
All of the existing guarantees by the Company rank equally in right of payment with all of the existing and future senior indebtedness of the Obligor Group. There are no significant restrictions on the ability of the Obligor Group to obtain funds from respective subsidiaries by dividend or loan.
The following tables present summarized financial information of the Obligor Group on a combined basis, with intercompany balances and transactions between entities of the Obligor Group eliminated and investments and equity in the earnings of the Non-Guarantor Subsidiaries excluded. The Obligor Group’s amounts due from, amounts due to, and intercompany transactions with Non-Guarantor Subsidiaries have been disclosed below the table, when material.
Summarized Statements of Income
| For the nine months ended | |||||
| ($ in millions) | October 1, 2023 | ||||
| Revenue | 5,966 | ||||
| Gross Profit | 3,001 | ||||
| Operating income | 1,154 | ||||
| Net income | 539 | ||||
Summarized Balance Sheets
| As of | |||||||||||
| ($ in millions) | October 1, 2023 | December 31, 2022 | |||||||||
| Current assets | 4,003 | 3,740 | |||||||||
| Non-current assets | 11,655 | 11,572 | |||||||||
| Total assets | 15,658 | 15,312 | |||||||||
| Current liabilities | 1,937 | 1,067 | |||||||||
| Non-current liabilities | 10,561 | 11,528 | |||||||||
| Total liabilities | 12,498 | 12,595 | |||||||||
| Obligor's Group equity | 3,160 | 2,717 | |||||||||
| Total liabilities and Obligor's Group equity | 15,658 | 15,312 | |||||||||
NXP Semiconductors N.V. is the head of a fiscal unity for the corporate income tax and VAT that contains the most significant Dutch wholly-owned group companies. The Company is therefore jointly and severally liable for the tax liabilities of the tax entity as a whole, and as such the income tax expense of the Dutch fiscal unity has been included in the Net income of the Obligor Group.
The financial information of the Obligor Group includes sales executed through a Non-Guarantor Subsidiary single-billing entity as a sales agent on behalf of an entity in the Obligor Group. The Obligor Group has sales to non-guarantors (for the nine months ended October 1, 2023: $614 million). The Obligor Group has amounts due from equity financing (October 1, 2023: $5,463 million; December 31, 2022: $5,210 million) and due to debt financing (October 1, 2023: $1,709 million; December 31, 2022: $2,629 million) with non-guarantor subsidiaries.
Item 3. Quantitative and Qualitative Disclosures About Market Risk
There have been no material changes to the Company’s market risk during the first nine months of 2023. For a discussion of the Company’s exposure to market risk, refer to the Company’s market risk disclosures set forth in Part II, Item 7A, “Quantitative and Qualitative Disclosures About Market Risk” in our Annual Report on Form 10-K for the year ended December 31, 2022.
24
Item 4. Controls and Procedures
Evaluation of Disclosure Controls and Procedures
Our management, with the participation of the Chief Executive Officer and Chief Financial Officer (Certifying Officers), evaluated the effectiveness of the Company's disclosure controls and procedures (as defined in Rules 13a-15(e) or 15d-15(e) promulgated under the Securities Exchange Act of 1934, as amended) on October 1, 2023. Based on that evaluation, the Certifying Officers concluded the Company's disclosure controls and procedures were effective as of October 1, 2023.
Changes in Internal Control Over Financial Reporting
There were no changes in the Company's internal control over financial reporting during the three month period ended October 1, 2023, which were identified in connection with management's evaluation required by paragraph (d) of Rules 13a-15 and 15d-15 under the Exchange Act that have materially affected, or are reasonably likely to materially affect, our internal control over financial reporting.
PART II — OTHER INFORMATION
Item 1. Legal Proceedings
Not applicable.
Item 1A. Risk Factors
There have been no material changes from the risk factors previously disclosed in our Annual Report on Form 10-K for the year ended December 31, 2022.
Item 2. Unregistered Sales of Equity Securities and Use of Proceeds
Purchases of Equity Securities by the Issuer and Affiliated Purchasers
Our Board has approved the purchase of shares from participants in NXP's equity programs to satisfy participants' tax withholding obligations and this authorization will remain in effect until terminated by the Board. In March 2021, the Board approved the repurchase of shares up to a maximum of $2 billion (the "2021 Share Repurchase Program"), and in August 2021, the Board increased the 2021 Share Repurchase Program authorization by $2 billion, for a total of $4 billion approved for the repurchase of shares under the 2021 Share Repurchase Program. In January 2022, the Board approved the repurchase of shares up to a maximum of $2 billion (the "2022 Share Repurchase Program"). At October 1, 2023, there were no amounts remaining for repurchase of shares under the 2021 Share Repurchase Program and approximately $1.8 billion remaining for the repurchase of shares under the 2022 Share Repurchase Program.
The following share repurchase activity occurred under these programs
during the three months ended October 1, 2023:
|
Period
|
Total Number
of Shares Purchased |
Average Price
Paid per Share |
Number of Shares Purchased as Part of Publicly Announced Buy Back Programs
|
Maximum Number of
Shares That May Yet Be Purchased Under the Buy Back Program |
Number of Shares Purchased as Trade for Tax (1)
|
||||||||||||||||||||||||
| July 3, 2023 – August 6, 2023 | 578,190 | $214.81 | 553,059 | 9,442,425 | 25,131 | ||||||||||||||||||||||||
| August 7, 2023 – September 3, 2023 | 479,618 | $204.09 | 479,606 | 9,144,414 | 12 | ||||||||||||||||||||||||
| September 4, 2023 – October 1, 2023 | 416,462 | $200.41 | 416,462 | 9,186,161 | — | ||||||||||||||||||||||||
|
Total
|
1,474,270 | 1,449,127 | 25,143 | ||||||||||||||||||||||||||
(1)
Reflects shares surrendered by participants to satisfy tax withholding obligations in connection with the Company's equity programs.
Item 5. Other Information
Not applicable.
25
Item 6. Exhibits
|
Exhibit
Number
|
Exhibit Description
|
|||||||||||||
| 3.1 | ||||||||||||||
|
31.1*
|
Rule 13a-14(a) / 15d-14(a) Certification of Chief Executive Officer
|
|||||||||||||
|
31.2*
|
Rule 13a-14(a) / 15d-14(a) Certification of Chief Financial Officer
|
|||||||||||||
|
32.1*
|
Section 1350 Certifications of Chief Executive Officer and Chief Financial Officer
|
|||||||||||||
| 101 | The following materials from the Company’s Quarterly Report on Form 10-Q for the quarter ended October 1, 2023, formatted in iXBRL (Inline eXtensible Business Reporting Language): (i) Condensed Consolidated Statements of Operations for the three and nine months ended October 1, 2023 and October 2, 2022; (ii) Condensed Consolidated Statements of Comprehensive Income for the three and nine months ended October 1, 2023 and October 2, 2022; (iii) Condensed Consolidated Balance Sheets as of October 1, 2023 and December 31, 2022; (iv) Condensed Consolidated Statements of Cash Flows for the nine months ended October 1, 2023 and October 2, 2022; (v) Condensed Consolidated Statements of Changes in Equity for the three and nine months ended October 1, 2023 and October 2, 2022; and (vi) Notes to the Unaudited Condensed Consolidated Financial Statements. | |||||||||||||
| 104 |
Cover Page Interactive Data File (formatted as Inline XBRL and contained in Exhibit 101).
|
|||||||||||||
| * | Filed or furnished herewith. | ||||
| + | Indicates management contract or compensatory plan or arrangement. | ||||
26
SIGNATURE
Pursuant to the requirements of the Securities Exchange Act of 1934, the registrant has duly caused this report to be signed on its behalf by the undersigned, thereunto duly authorized.
Date: November 7, 2023
| NXP Semiconductors N.V. | |||||
| /s/ William J. Betz | |||||
| Name: William J. Betz, CFO | |||||
27
Exhibit 31.1
CERTIFICATION
I, Kurt Sievers, certify that:
1.
I have reviewed this quarterly report on Form 10-Q of NXP Semiconductors N.V.;
2.
Based on my knowledge, this report does not contain any untrue statement of a material fact or omit to state a material fact necessary to make the statements made, in light of the circumstances under which such statements were made, not misleading with respect to the period covered by this report;
3.
Based on my knowledge, the financial statements, and other financial information included in this report, fairly present in all material respects the financial condition, results of operations and cash flows of the Registrant as of, and for, the periods presented in this report;
4.
The Registrant’s other certifying officer and I are responsible for establishing and maintaining disclosure controls and procedures (as defined in Exchange Act Rules 13a-15(e) and 15d-15(e)) and internal control over financial reporting (as defined in Exchange Act Rules 13a-15(f) and 15d-15(f)) for the Registrant and have:
a)
Designed such disclosure controls and procedures, or caused such disclosure controls and procedures to be designed under our supervision, to ensure that material information relating to the Registrant, including its consolidated subsidiaries, is made known to us by others within those entities, particularly during the period in which this report is being prepared;
b)
Designed such internal control over financial reporting, or caused such internal control over financial reporting to be designed under our supervision, to provide reasonable assurance regarding the reliability of financial reporting and the preparation of financial statements for external purposes in accordance with generally accepted accounting principles;
c)
Evaluated the effectiveness of the Registrant’s disclosure controls and procedures and presented in this report our conclusions about the effectiveness of the disclosure controls and procedures, as of the end of the period covered by this report based on such evaluation; and
d)
Disclosed in this report any change in the Registrant’s internal control over financial reporting that occurred during the Registrant’s most recent fiscal quarter (the Registrant’s fourth fiscal quarter in the case of an annual report) that has materially affected, or is reasonably likely to materially affect, the Registrant’s internal control over financial reporting; and
5.
The Registrant’s other certifying officer and I have disclosed, based on our most recent evaluation of internal control over financial reporting, to the Registrant’s auditors and the audit committee of the Registrant’s board of directors (or persons performing the equivalent functions):
a)
All significant deficiencies and material weaknesses in the design or operation of internal control over financial reporting which are reasonably likely to adversely affect the Registrant’s ability to record, process, summarize, and report financial information; and
b)
Any fraud, whether or not material, that involves management or other employees who have a significant role in the Registrant’s internal control over financial reporting.
Date: November 7, 2023
| By: |
/s/ Kurt Sievers
|
|||||||
|
Kurt Sievers
|
||||||||
|
President & Chief Executive Officer
|
||||||||
Exhibit 31.2
CERTIFICATION
I, William J. Betz, certify that:
1.
I have reviewed this quarterly report on Form 10-Q of NXP Semiconductors N.V.;
2.
Based on my knowledge, this report does not contain any untrue statement of a material fact or omit to state a material fact necessary to make the statements made, in light of the circumstances under which such statements were made, not misleading with respect to the period covered by this report;
3.
Based on my knowledge, the financial statements, and other financial information included in this report, fairly present in all material respects the financial condition, results of operations and cash flows of the Registrant as of, and for, the periods presented in this report;
4.
The Registrant’s other certifying officer and I are responsible for establishing and maintaining disclosure controls and procedures (as defined in Exchange Act Rules 13a-15(e) and 15d-15(e)) and internal control over financial reporting (as defined in Exchange Act Rules 13a-15(f) and 15d-15(f)) for the Registrant and have:
a)
Designed such disclosure controls and procedures, or caused such disclosure controls and procedures to be designed under our supervision, to ensure that material information relating to the Registrant, including its consolidated subsidiaries, is made known to us by others within those entities, particularly during the period in which this report is being prepared;
b)
Designed such internal control over financial reporting, or caused such internal control over financial reporting to be designed under our supervision, to provide reasonable assurance regarding the reliability of financial reporting and the preparation of financial statements for external purposes in accordance with generally accepted accounting principles;
c)
Evaluated the effectiveness of the Registrant’s disclosure controls and procedures and presented in this report our conclusions about the effectiveness of the disclosure controls and procedures, as of the end of the period covered by this report based on such evaluation; and
d)
Disclosed in this report any change in the Registrant’s internal control over financial reporting that occurred during the Registrant’s most recent fiscal quarter (the Registrant’s fourth fiscal quarter in the case of an annual report) that has materially affected, or is reasonably likely to materially affect, the Registrant’s internal control over financial reporting; and
5.
The Registrant’s other certifying officer and I have disclosed, based on our most recent evaluation of internal control over financial reporting, to the Registrant’s auditors and the audit committee of the Registrant’s board of directors (or persons performing the equivalent functions):
a)
All significant deficiencies and material weaknesses in the design or operation of internal control over financial reporting which are reasonably likely to adversely affect the Registrant’s ability to record, process, summarize, and report financial information; and
b)
Any fraud, whether or not material, that involves management or other employees who have a significant role in the Registrant’s internal control over financial reporting.
Date: November 7, 2023
| By: |
/s/ William J. Betz
|
|||||||
|
William J. Betz
|
||||||||
|
Chief Financial Officer
|
||||||||
Exhibit 32.1
CERTIFICATIONS OF CHIEF EXECUTIVE OFFICER AND CHIEF FINANCIAL OFFICER
PURSUANT TO
18 U.S.C. SECTION 1350,
AS ADOPTED PURSUANT TO
SECTION 906 OF THE SARBANES-OXLEY ACT OF 2002
I, Kurt Sievers, certify, as of the date hereof, pursuant to 18 U.S.C. Section 1350, as adopted pursuant to Section 906 of the Sarbanes-Oxley Act of 2002, that the Quarterly Report of NXP Semiconductors N.V. on Form 10-Q for the period ended October 1, 2023 fully complies with the requirements of Section 13(a) or 15(d) of the Securities Exchange Act of 1934 and that information contained in such Form 10-Q fairly presents in all material respects the financial condition and results of operations of NXP Semiconductors N.V. at the dates and for the periods indicated.
Date: November 7, 2023
| By: |
/s/ Kurt Sievers
|
|||||||
|
Kurt Sievers
|
||||||||
|
President & Chief Executive Officer
|
||||||||
I, William J. Betz, certify, as of the date hereof, pursuant to 18 U.S.C. Section 1350, as adopted pursuant to Section 906 of the Sarbanes-Oxley Act of 2002, that the Quarterly Report of NXP Semiconductors N.V. on Form 10-Q for the period ended October 1, 2023 fully complies with the requirements of Section 13(a) or 15(d) of the Securities Exchange Act of 1934 and that information contained in such Form 10-Q fairly presents in all material respects the financial condition and results of operations of NXP Semiconductors N.V. at the dates and for the periods indicated.
Date: November 7, 2023
| By: |
/s/ William J. Betz
|
|||||||
|
William J. Betz
|
||||||||
|
Chief Financial Officer
|
||||||||
TABLE OF CONTENTS
Part I Financial InformationItem 1. Financial StatementsItem 2. Management S Discussion and Analysis Of Financial Condition and Results Of OperationsItem 3. Quantitative and Qualitative Disclosures About Market RiskItem 4. Controls and ProceduresPart II Other InformationItem 1. Legal ProceedingsItem 1A. Risk FactorsItem 2. Unregistered Sales Of Equity Securities and Use Of ProceedsItem 5. Other InformationItem 6. Exhibits