NEW YORK TIMES CO
10-Ks and 10-Qs
|
|
|
|
|
|
|
|
|
|
|
|
|
|
|
|
|
|
|
|
|
|
|
|
|
|
|
|
|
|
|
|
|
|
|
|
|
|
|
|
|
|
|
|
|
|
|
|
|
|
|
|
|
|
|
|
UNITED STATES SECURITIES AND EXCHANGE COMMISSION
WASHINGTON, D.C. 20549
FORM 10-K
Annual Report pursuant to Section 13 or 15(d) of the Securities Exchange Act of 1934
|
For the fiscal year ended
|
December 25, 2011
|
|
Commission file number
1-5837
|
|
THE NEW YORK TIMES COMPANY
(Exact name of registrant as specified in its charter)
|
New York
|
|
13-1102020
|
|
(State or other jurisdiction of
incorporation or organization)
|
|
(I.R.S. Employer
Identification No.)
|
|
620 Eighth Avenue, New York, N.Y.
|
|
10018
|
|
(Address of principal executive offices)
|
|
(Zip code)
|
Securities registered pursuant to Section 12(b) of the Act:
|
Title of each class
|
|
Name of each exchange on which registered
|
|
Class A Common Stock of $.10 par value
|
|
New York Stock Exchange
|
Indicate by check mark if the registrant is a well-known seasoned issuer, as defined in Rule 405 of the Securities Act. Yes
þ
No
¨
Indicate by check mark if the registrant is not required to file reports pursuant to Section 13 or Section 15(d) of the Exchange Act. Yes
¨
No
þ
Indicate by check mark whether the registrant (1) has filed all reports required to be filed by Section 13 or 15(d) of the Securities Exchange Act of 1934 during the preceding 12 months (or for such shorter period that the registrant was required to file such reports), and (2) has been subject to such filing requirements for the past 90 days. Yes
þ
No
¨
Indicate by check mark whether the registrant has submitted electronically and posted on its corporate Web site, if any, every Interactive Data File required to be submitted and posted pursuant to Rule 405 of Regulation S-T during the preceding 12 months (or for such shorter period that the registrant was required to submit and post such files).
Yes
þ
No
¨
Indicate by check mark if disclosure of delinquent filers pursuant to Item 405 of Regulation S-K is not contained herein, and will not be contained, to the best of registrant’s knowledge, in definitive proxy or information statements incorporated by reference in Part III of this Form 10-K or any amendment to this Form 10-K.
¨
Indicate by check mark whether the registrant is a large accelerated filer, an accelerated filer, a non-accelerated filer, or a smaller reporting company. See the definitions of “large accelerated filer,” “accelerated filer” and “smaller reporting company” in Rule 12b-2 of the Exchange Act. (Check one):
|
Large accelerated filer
þ
|
Accelerated filer
|
¨
|
|
|
Non-accelerated filer
¨
|
Smaller reporting company
|
¨
|
|
Indicate by check mark whether the registrant is a shell company (as defined in Rule 12b-2 of the Exchange Act). Yes
¨
No
þ
The aggregate worldwide market value of Class A Common Stock held by non-affiliates, based on the closing price on June 24, 2011, the last business day of the registrant’s most recently completed second quarter, as reported on the New York Stock Exchange, was approximately
$1.1 billion
. As of such date, non-affiliates held
71,859
shares of Class B Common Stock. There is no active market for such stock.
The number of outstanding shares of each class of the registrant’s common stock as of
February 17, 2012
(exclusive of treasury shares), was as follows:
147,047,756
shares of Class A Common Stock and
818,885
shares of Class B Common Stock.
Documents incorporated by reference
Portions of the Proxy Statement relating to the registrant’s
2012
Annual Meeting of Stockholders, to be held on
April 25, 2012
, are incorporated by reference into Part III of this report.
|
INDEX TO THE NEW YORK TIMES COMPANY 2011 ANNUAL REPORT ON FORM 10-K
|
|
|
ITEM NO.
|
|
||||
|
PART I
|
Forward-Looking Statements
|
|||||
|
1
|
Business
|
|||||
|
Introduction
|
||||||
|
News Media Group
|
||||||
|
The New York Times Media Group
|
||||||
|
New England Media Group
|
||||||
|
Regional Media Group
|
||||||
|
About Group
|
||||||
|
Forest Products Investments and Other Joint Ventures
|
||||||
|
Raw Materials
|
||||||
|
Competition
|
||||||
|
Employees
|
||||||
|
Labor Relations
|
||||||
|
1A
|
Risk Factors
|
|||||
|
1B
|
Unresolved Staff Comments
|
|||||
|
2
|
Properties
|
|||||
|
3
|
Legal Proceedings
|
|||||
|
4
|
Mine Safety Disclosures
|
|||||
|
Executive Officers of the Registrant
|
||||||
|
PART II
|
5
|
Market for the Registrant’s Common Equity, Related Stockholder
Matters and Issuer Purchases of Equity Securities
|
||||
|
6
|
Selected Financial Data
|
|||||
|
7
|
Management’s Discussion and Analysis of
Financial Condition and Results of Operations
|
|||||
|
7A
|
Quantitative and Qualitative Disclosures About Market Risk
|
|||||
|
8
|
Financial Statements and Supplementary Data
|
|||||
|
9
|
Changes in and Disagreements with Accountants on
Accounting and Financial Disclosure
|
|||||
|
9A
|
Controls and Procedures
|
|||||
|
9B
|
Other Information
|
|||||
|
PART III
|
10
|
Directors, Executive Officers and Corporate Governance
|
||||
|
11
|
Executive Compensation
|
|||||
|
12
|
Security Ownership of Certain Beneficial Owners and
Management and Related Stockholder Matters
|
|||||
|
13
|
Certain Relationships and Related Transactions, and Director Independence
|
|||||
|
14
|
Principal Accountant Fees and Services
|
|||||
|
PART IV
|
15
|
Exhibits and Financial Statement Schedules
|
||||
|
|
|
FORWARD-LOOKING STATEMENTS
|
This Annual Report on Form 10-K, including the sections titled “Item 1A — Risk Factors” and “Item 7 — Management’s Discussion and Analysis of Financial Condition and Results of Operations,” contains forward-looking statements that relate to future events or our future financial performance. We may also make written and oral forward-looking statements in our Securities and Exchange Commission (“SEC”) filings and otherwise. We have tried, where possible, to identify such statements by using words such as “believe,” “expect,” “intend,” “estimate,” “anticipate,” “will,” “project,” “plan” and similar expressions in connection with any discussion of future operating or financial performance. Any forward-looking statements are and will be based upon our then-current expectations, estimates and assumptions regarding future events and are applicable only as of the dates of such statements. We undertake no obligation to update or revise any forward-looking statements, whether as a result of new information, future events or otherwise.
By their nature, forward-looking statements are subject to risks and uncertainties that could cause actual results to differ materially from those anticipated in any such statements. You should bear this in mind as you consider forward-looking statements. Factors that we think could, individually or in the aggregate, cause our actual results to differ materially from expected and historical results include those described in “Item 1A — Risk Factors” below as well as other risks and factors identified from time to time in our SEC filings.
|
|
INTRODUCTION
The New York Times Company (the “Company”) was incorporated on August 26, 1896, under the laws of the State of New York. The Company is a leading global, multimedia news and information company that currently includes newspapers, digital businesses, investments in paper mills and other investments. The Company and its consolidated subsidiaries are referred to collectively in this Annual Report on Form 10-K as “we,” “our” and “us.”
We classify our businesses based on our operating strategies into two reportable segments, the News Media Group and the About Group. Financial information about our segments can be found in “Item 7 — Management’s Discussion and Analysis of Financial Condition and Results of Operations” and in Note 19 of the Notes to the Consolidated Financial Statements.
The News Media Group consists of the following:
|
•
|
The New York Times Media Group, which includes The New York Times (“The Times”), the International Herald Tribune (the “IHT”), NYTimes.com and related businesses;
|
|
•
|
the New England Media Group, which includes The Boston Globe (the “Globe”), BostonGlobe.com, Boston.com, the Worcester Telegram & Gazette (the “T&G”), Telegram.com and related businesses; and
|
|
•
|
the Regional Media Group, which included 16 regional newspapers, other print publications and related businesses in Alabama, California, Florida, Louisiana, North Carolina and South Carolina. On January 6, 2012, we completed the sale of the Regional Media Group to Halifax Media Holdings LLC for $143.0 million in cash, subject to certain adjustments.
|
The About Group consists of the Web sites of About.com, ConsumerSearch.com, CalorieCount.com and related businesses.
Additionally, we own equity interests in a Canadian newsprint company; a supercalendered paper manufacturing partnership in Maine; Metro Boston LLC (“Metro Boston”), which publishes a free daily newspaper in the greater Boston area; and quadrantONE LLC (“quadrantONE”), which is an online advertising network that sells bundled premium, targeted display advertising onto local newspaper and other Web sites.
We also own a 4.97% interest in Fenway Sports Group, which owns the Boston Red Sox baseball club; Liverpool Football Club (a soccer team in the English Premier League); approximately 80% of New England Sports Network (a regional cable sports network that televises the Red Sox and Boston Bruins hockey games); and 50% of Roush Fenway Racing (a leading NASCAR team). We sold 390 units in Fenway Sports Group in July 2011 and 100 units in February 2012. We continue to explore the sale of our remaining 210 units in Fenway Sports Group, in whole or in parts.
THE NEW YORK TIMES COMPANY – P.
1
Revenues, operating profit and identifiable assets of foreign operations are not significant.
Our businesses are affected in part by seasonal patterns in advertising, with generally higher advertising volume in the fourth quarter due to holiday advertising.
Our Annual Report on Form 10-K, Quarterly Reports on Form 10-Q, Current Reports on Form 8-K, and all amendments to those reports, and the Proxy Statement for our Annual Meeting of Stockholders are made available, free of charge, on our Web site http://www.nytco.com, as soon as reasonably practicable after such reports have been filed with or furnished to the SEC.
NEWS MEDIA GROUP
The News Media Group reportable segment consists of The New York Times Media Group, the New England Media Group and, through January 6, 2012, the Regional Media Group. The News Media Group generates revenues principally from advertising and circulation.
Advertising is sold in our newspapers and other publications, on our Web sites and across other digital platforms. We divide advertising into three main categories: national, retail and classified. Advertising revenue also includes preprints, which are advertising supplements. Our digital advertising offerings include mainly display advertising (such as banners, large-format units, half-page units and interactive multimedia), classified advertising and contextual advertising (links supplied by Google).
Circulation revenue is from amounts charged to readers or distributors for products in print, online or through other digital platforms. Charges vary by property and by city and depend on the type of sale (i.e., subscription or single copy) and distribution arrangements.
Advertising and circulation revenue information for the News Media Group appears under “Item 7 — Management’s Discussion and Analysis of Financial Condition and Results of Operations.”
The New York Times Media Group
The New York Times Media Group comprises The Times, the IHT, NYTimes.com and related businesses. The Times, a daily (Monday through Saturday) and Sunday newspaper, commenced publication in 1851. The IHT, a daily newspaper, commenced publishing in Paris in 1887 and serves as the global edition of The Times. NYTimes.com was launched in 1996.
In March 2011, The Times began charging consumers for content provided on NYTimes.com and other digital platforms, in addition to its other paid subscription offerings on several e-reader devices. The Times implemented a metered model that offers users free access to a set number of articles per month and then charges users who are not print home-delivery subscribers once they exceed that number. All print home-delivery subscribers receive free digital access.
In October 2011, the IHT launched digital subscription packages for full access to its news apps on the iPhone and iPad and on NYTimes.com. These digital packages are free to IHT home-delivery subscribers who subscribe for a minimum of five days per week.
Audience
The Times and the IHT reach a broad audience in print, online at NYTimes.com and global.nytimes.com (formerly iht.com) and on other digital platforms. The Times and the IHT have also expanded their reach and deepened engagement with readers and users by delivering content online and across other digital platforms, including mobile and e-reader applications and social networking sites.
According to reports filed with the Audit Bureau of Circulations (“ABC”), an independent agency that audits the circulation of most U.S. newspapers and magazines, for the six-month period ended
September 30, 2011
, The Times had the largest daily and Sunday circulation of all seven-day newspapers in the United States. For the year ended
December 25, 2011
, The Times’s average circulation, which includes paid and verified circulation of the newspaper in print, online and on other digital platforms, was 1,317,100 for weekday (Mon. - Fri.) and 1,781,100 for Sunday. Under ABC’s reporting guidance, verified circulation represents copies available for individual consumers that are either non-paid or paid by someone other than the individual, such as copies served to schools and colleges and copies purchased by businesses for free distribution. The Times’s average circulation for
2011
captures for the first time paid subscribers to its digital subscription packages since The Times began offering them in March 2011. In
2011
,
P.
2
– THE NEW YORK TIMES COMPANY
approximately 75% of the weekday and 81% of the Sunday circulation was sold through print or digital subscriptions; the remainder was sold primarily on newsstands. Approximately 40% of the weekday and Sunday average circulation, in print and on digital platforms, is in the 31 counties that make up the greater New York City area, which includes New York City, Westchester, Long Island, and parts of upstate New York, Connecticut, New Jersey and Pennsylvania; approximately 60% is elsewhere.
The IHT’s average circulation, which includes newspapers sold in print and electronic replica editions, for the years ended
December 25, 2011
, and
December 26, 2010
, was 226,207 (estimated) and 217,700, respectively. These figures follow the guidance of Office de Justification de la Diffusion, an agency based in Paris and a member of the International Federation of Audit Bureaux of Circulations that audits the circulation of most of France’s newspapers and magazines. The final
2011
figure will not be available until April
2012
.
According to comScore Media Metrix, an online audience measurement service, in
2011
NYTimes.com had a monthly average of approximately 33 million unique visitors in the United States and approximately 48 million unique visitors worldwide.
Paid subscribers to digital subscription packages, e-readers and replica editions of The Times and the IHT totaled approximately 390,000 as of our fiscal year ended
December 25, 2011
.
Advertising
According to data compiled by Kantar Media, an independent agency that measures advertising sales volume and estimates advertising revenue, The Times had the largest market share in
2011
in print advertising revenues among a national newspaper set that consists of USA Today, The Wall Street Journal and The Times. Approximately three-quarters of The New York Times Media Group’s total advertising revenues in
2011
came from national advertisers. Based on recent data provided by Kantar Media, we believe The Times ranks first by a substantial margin in print advertising revenues in the general weekday and Sunday newspaper field in the New York metropolitan area.
Production
and Distribution
The Times is currently printed at our production and distribution facility in College Point, N.Y., as well as under contract at 26 remote print sites across the United States. The Times is delivered to newsstands and retail outlets in the New York metropolitan area through a combination of third-party wholesalers and our own drivers. In other markets in the United States and Canada, The Times is delivered through agreements with other newspapers and third-party delivery agents.
The IHT is printed under contract at 40 sites throughout the world and is sold in more than 160 countries and territories.
Other Businesses
The New York Times Media Group’s other businesses include:
|
•
|
The New York Times Index, which produces and licenses The New York Times Index, a print publication;
|
|
•
|
Digital Archive Distribution, which licenses electronic archive databases to resellers of that information in the business, professional and library markets; and
|
|
•
|
The New York Times News Services Division, which is made up of Syndication Sales and Business Development. Syndication Sales transmits articles, graphics and photographs from The Times, the Globe and other publications to over 1,400 newspapers, magazines and Web sites in nearly 100 countries and territories worldwide. Business Development principally comprises photo archives, The New York Times store, book development and rights and permissions.
|
We also have a 57% ownership interest in Epsilen, LLC, an online education business, and its operating results are consolidated in the results of The New York Times Media Group.
In October 2011, we sold Baseline, a leading online subscription database and research service for information on the film and television industries and a provider of premium film and television data to Web sites.
THE NEW YORK TIMES COMPANY – P.
3
New England Media Group
The New England Media Group comprises the Globe, BostonGlobe.com, Boston.com, the T&G, Telegram.com and related businesses. The Globe is a daily and Sunday newspaper that commenced publication in 1872. The T&G is a daily and Sunday newspaper that began publishing in 1866.
In 2011, the Globe developed two distinct online brands to better serve a wide array of consumers and advertisers. In September 2011, the Globe launched a new paid subscription Web site, BostonGlobe.com, which offers exclusive access to the full range and depth of content produced by the newspaper’s journalists, in a format optimized for reading on a tablet, smartphone, laptop and desktop. The Globe began charging for content provided on BostonGlobe.com in October 2011 and all print home-delivery subscribers receive free digital access.
This new site complements Boston.com, a Web site that previously included all Globe content and has now been refocused and enhanced as a community portal for the greater Boston area. Boston.com remains free to consumers and continues to offer, among other things, breaking news and sports coverage, community conversations, blogs, daily deals, entertainment listings and classifieds, along with a wide array of new content and select offerings from the Globe.
Audience
The Globe reaches a broad audience in print, online and other digital platforms. The Globe is distributed in print throughout New England, although its circulation is concentrated in the Boston metropolitan area. The Globe has expanded its reach and deepened engagement with readers and users by delivering content online and across other digital platforms, including mobile and e-reader applications and social networking sites.
According to reports filed with ABC, for the six-month period ended
September 30, 2011
, the Globe ranked first in New England for both daily and Sunday circulation. For the year ended
December 25, 2011
, the Globe’s average circulation, which includes paid and verified circulation of the newspaper in print, online and other digital platforms, was 206,900 for weekday (Mon. - Fri.) and 354,800 for Sunday. The Globe’s average circulation for
2011
captures for the first time paid subscribers to the BostonGlobe.com pay site since its launch in the fall of 2011. Approximately 74% of the Globe’s weekday and 72% of its Sunday circulation was sold through print and digital subscriptions in
2011
; the remainder was sold primarily on newsstands.
Boston.com, New England’s largest regional news and information Web site, in
2011
had a monthly average of approximately 6 million unique visitors in the United States, according to comScore Media Metrix. In December
2011
, the new paid subscription Web site BostonGlobe.com had over 1 million unique visitors in the United States, according to comScore Media Metrix. Paid digital subscribers to BostonGlobe.com, e-readers and replica editions totaled approximately 16,000 as of our fiscal year end
December 25, 2011
.
The T&G and several Company-owned non-daily newspapers – some published under the name of Coulter Press – circulate throughout Worcester County and northeastern Connecticut. According to reports filed with ABC, for the six-month period ended September 30, 2011, the T&G ranked seventh in New England in daily and Sunday circulation volume. Telegram.com began offering paid digital subscriptions in August 2010, implementing a metered model that offers users free access to a set number of local news articles per month and then charges users who are not print home-delivery subscribers once they exceed that number for full access to articles produced by its staff on Telegram.com. All print home-delivery subscribers receive free digital access. For the year ended
December 25, 2011
, the T&G’s average circulation, which includes paid and verified circulation of the newspaper in print and online, was 74,100 for weekday (Mon. - Fri.) and 83,000 for Sunday.
Advertising
The sales forces of the New England Media Group sell retail, national and classified advertising across multiple channels, including print, digital, direct marketing, niche magazines and events, capitalizing on opportunities to deliver to national and local advertisers a broad audience in the New England region. Nearly one-third of the New England Media Group’s advertising revenues in
2011
came from national advertisers.
Production and Distribution
The Globe is currently printed at its facility in Boston, Mass. The T&G is currently printed at its facility in Millbury, Mass., and, beginning in the second quarter of 2012, will be printed at the Globe’s facility in Boston, Mass. All of the Globe’s and T&G’s print subscription circulation was delivered by a third-party service in
2011
.
P.
4
– THE NEW YORK TIMES COMPANY
Regional Media Group
On January 6, 2012, we completed the sale of the Regional Media Group, consisting of 16 regional newspapers, other print publications and related businesses, to Halifax Media Holdings LLC for $143.0 million in cash, subject to certain adjustments. The Regional Media Group comprised the following publications:
|
•
|
Sarasota Herald-Tribune in Sarasota, Fla.;
|
|
•
|
The Press Democrat in Santa Rosa, Calif.;
|
|
•
|
The Ledger in Lakeland, Fla.;
|
|
•
|
Star-News in Wilmington, N.C.;
|
|
•
|
Herald-Journal in Spartanburg, S.C.;
|
|
•
|
Star-Banner in Ocala, Fla.;
|
|
•
|
The Gainesville Sun in Gainesville, Fla.;
|
|
•
|
The Tuscaloosa News in Tuscaloosa, Ala.;
|
|
•
|
The Gadsden Times in Gadsden, Ala.;
|
|
•
|
The Courier in Houma, La.;
|
|
•
|
Times-News in Hendersonville, N.C.;
|
|
•
|
Daily Comet in Thibodaux, La.;
|
|
•
|
The Dispatch in Lexington, N.C.;
|
|
•
|
Petaluma Argus-Courier in Petaluma, Calif.;
|
|
•
|
News Chief in Winter Haven, Fla.; and
|
|
•
|
North Bay Business Journal in Santa Rosa, Calif.
|
ABOUT GROUP
The About Group includes the Web sites of About.com, ConsumerSearch.com, CalorieCount.com and related businesses.
About.com focuses on delivering at scale high-quality, expert content on everyday topics that is personally relevant to its users. The topic sites on the About.com platform are supported by independent, freelance subject-matter experts, or Guides, who create and publish original content across a variety of subject matters. At the end of
2011
, About.com had more than 900 topic sites supported by independent Guides across more than 115,000 topics, in over 3 million articles. The About.com platform has expanded its reach and deepened engagement with users by delivering content across other digital platforms, including mobile applications and social networking sites, launching a Spanish-language channel in
2011
and increasing the number of how-to and do-it-yourself videos across its 24 channels with more than 10,000 videos at the end of
2011
. According to comScore Media Metrix, in December
2011
About.com had approximately 60 million unique visitors in the United States and 108 million unique visitors worldwide.
ConsumerSearch.com analyzes expert and user-generated consumer product reviews and recommends the best products to purchase based on the findings. CalorieCount.com is an online resource that offers weight management tools, nutritional information and social support that is personally relevant to its users. In February 2011, we sold UCompareHealthCare.com, which provides dynamic Web-based interactive tools that enable users to measure the quality of certain healthcare services.
The About Group generates revenues through cost-per-click advertising (sponsored links for which the About Group is paid when a user clicks on the ad), display advertising and e-commerce (including sales lead generation). Almost all of its revenues (95% in
2011
) are derived from the sale of cost-per-click advertising and display advertising. Cost-per-click advertising, which in
2011
represented 56% of the About Group’s total advertising revenues, is principally derived from an arrangement with Google under which third-party advertising is placed on the About Group’s Web sites.
FOREST PRODUCTS INVESTMENTS AND OTHER JOINT VENTURES
We have ownership interests in one newsprint mill and one mill producing supercalendered paper, a polished paper used in some magazines, catalogs and preprinted inserts, which is a higher-value grade than newsprint (the “Forest Products Investments”), as well as in Fenway Sports Group, Metro Boston and quadrantONE. These investments were accounted for under the equity method and reported in “Investments in joint ventures” in our Consolidated Balance Sheets as of December 25, 2011. For additional information on our investments, see “Item 7 – Management’s Discussion and Analysis of Financial Condition and Results of Operations” and Note 7 of the Notes to
THE NEW YORK TIMES COMPANY – P.
5
the Consolidated Financial Statements.
Forest Products Investments
We have a
49%
equity interest in a Canadian newsprint company, Donohue Malbaie Inc. (“Malbaie”). The other 51% is owned by AbiBow Canada Inc., a subsidiary of AbitibiBowater Inc., currently doing business as Resolute Forest Products (“Resolute”), a large global manufacturer of paper, market pulp and wood products. Malbaie manufactures newsprint on the paper machine it owns within Resolute’s paper mill in Clermont, Quebec. Malbaie is wholly dependent upon Resolute for its pulp, which is purchased by Malbaie from Resolute’s paper mill in Clermont, Quebec. In
2011
, Malbaie produced approximately 205,000 metric tons of newsprint, of which approximately 17% was sold to us, with the balance sold to Resolute for resale.
We have a
40%
equity interest in Madison Paper Industries (“Madison”), a partnership operating a supercalendered paper mill in Madison, Maine. Madison purchases the majority of its wood from local suppliers, mostly under long-term contracts. In
2011
, Madison produced approximately 195,000 metric tons, of which approximately 6% was sold to us.
Malbaie and Madison are subject to comprehensive environmental protection laws, regulations and orders of provincial, federal, state and local authorities of Canada or the United States (the “Environmental Laws”). The Environmental Laws impose effluent and emission limitations and require Malbaie and Madison to obtain, and operate in compliance with the conditions of, permits and other governmental authorizations (“Governmental Authorizations”). Malbaie and Madison follow policies and operate monitoring programs designed to ensure compliance with applicable Environmental Laws and Governmental Authorizations and to minimize exposure to environmental liabilities. Various regulatory authorities periodically review the status of the operations of Malbaie and Madison. Based on the foregoing, we believe that Malbaie and Madison are in substantial compliance with such Environmental Laws and Governmental Authorizations.
Other Joint Ventures
We own a 4.97% interest in Fenway Sports Group, which owns the Boston Red Sox baseball club; Liverpool Football Club (a soccer team in the English Premier League); approximately
80%
of New England Sports Network (a regional cable sports network); and
50%
of Roush Fenway Racing (a leading NASCAR team). We sold 390 of our units in Fenway Sports Group in July 2011 and 100 units in February 2012. We continue to explore the sale of our remaining 210 units in Fenway Sports Group, in whole or in parts.
We own a
49%
interest in Metro Boston, which publishes a free daily newspaper in the greater Boston area.
We also own a
25%
interest in quadrantONE, which is an online advertising network that sells bundled premium, targeted display advertising onto local newspaper and other Web sites. The Web sites of the New England Media Group currently participate in this network.
RAW MATERIALS
The primary raw materials we use are newsprint and supercalendered paper. We purchase newsprint from a number of North American producers. In
2011
, the paper used by The New York Times, New England and Regional Media Groups was purchased from unrelated suppliers and related suppliers in which we hold equity interests (see “— Forest Products Investments”). A significant portion of newsprint is purchased from Resolute.
In
2011
and
2010
, we used the following types and quantities of paper:
|
|
Newsprint
|
Coated,
Supercalendered
and Other Paper
|
|||||||||||
|
(In metric tons)
|
2011
|
2010
|
2011
|
2010
|
|||||||||
|
The New York Times Media Group
(1)
|
138,000
|
|
145,000
|
|
15,300
|
|
14,900
|
|
|||||
|
New England Media Group
(1)
|
41,000
|
|
45,000
|
|
1,600
|
|
1,800
|
|
|||||
|
Regional Media Group
|
36,000
|
|
38,000
|
|
—
|
|
—
|
|
|||||
|
Total
|
215,000
|
|
228,000
|
|
16,900
|
|
16,700
|
|
|||||
|
(1)
|
The Times and the Globe use coated, supercalendered or other paper for The New York Times Magazine, T: The New York Times Style Magazine and the Globe’s Sunday Magazine.
|
P.
6
– THE NEW YORK TIMES COMPANY
COMPETITION
Our media properties and investments compete for advertising and consumers with other media in their respective markets, including paid and free newspapers, Web sites, digital platforms and applications, social media, broadcast, satellite and cable television, broadcast and satellite radio, magazines, other forms of media and direct marketing. Competition for advertising is generally based upon audience levels and demographics, price, service, targeting capabilities and advertising results, while competition for circulation and readership is generally based upon platform, format, content, quality, service, timeliness and price.
The Times competes for advertising and circulation primarily with national newspapers such as The Wall Street Journal and USA Today; newspapers of general circulation in New York City and its suburbs; other daily and weekly newspapers and television stations and networks in markets in which The Times circulates; and some national news and lifestyle magazines.
The IHT’s key competitors include all international sources of English-language news, including The Wall Street Journal’s European and Asian Editions, the Financial Times, Time, Newsweek International and The Economist; and news channels CNN, CNNi, Sky News International, CNBC and BBC.
The Globe competes primarily for advertising and circulation with other newspapers and television stations in Boston, its neighboring suburbs and the greater New England region, including, among others, The Boston Herald (daily and Sunday).
In addition, as a result of the secular shift from print to digital media, all of our newspapers increasingly face competition for audience and advertising from a wide variety of digital alternatives, including news and other Web sites, news aggregation sites, social media sites, online advertising networks and exchanges, online classified services and other new media formats.
NYTimes.com, Boston.com and BostonGlobe.com primarily compete for advertising and traffic with other advertising-supported news and information Web sites, such as Google News, Yahoo! News, MSNBC and CNN.com, online advertising networks and exchanges and classified advertising portals. Internationally, global.nytimes.com competes against international online sources of English language news, such as bbc.co.uk, guardian.co.uk and reuters.com.
About.com competes for advertising and traffic with large-scale portals, such as AOL, MSN and Yahoo!, and across a broad array of digital advertising media, including advertising networks and exchanges. About.com also competes with other content providers, such as Demand Media and Associated Content, as well as targeted Web sites, such as WebMD, CNET and iVillage, whose content overlaps with that of About.com’s individual topics.
EMPLOYEES
We had approximately 7,273 full-time equivalent employees as of
December 25, 2011
.
|
|
Employees
|
|
|
The New York Times Media Group
|
3,056
|
|
|
New England Media Group
|
1,909
|
|
|
Regional Media Group
(1)
|
1,689
|
|
|
About Group
|
214
|
|
|
Corporate
|
405
|
|
|
Total Company
|
7,273
|
|
|
(1)
|
On January 6, 2012, we sold the Regional Media Group.
|
THE NEW YORK TIMES COMPANY – P.
7
Labor Relations
As of
December 25, 2011
, more than half of the full-time equivalent employees of The Times and NYTimes.com were represented by nine unions with 10 labor agreements. As indicated below, certain collective bargaining agreements have expired and negotiations for new contracts are ongoing. We cannot predict the timing or the outcome of these negotiations.
|
|
|
Employee Category
|
|
Expiration Date
|
|
The Times and
|
|
Mailers
|
|
March 30, 2011 (expired)
|
|
NYTimes.com
|
|
New York Newspaper Guild
|
|
March 30, 2011 (expired)
|
|
|
Electricians
|
|
March 30, 2012
|
|
|
|
Machinists
|
|
March 30, 2012
|
|
|
|
Paperhandlers
|
|
March 30, 2014
|
|
|
|
Typographers
|
|
March 30, 2016
|
|
|
|
Pressmen
|
|
March 30, 2017
|
|
|
|
Stereotypers
|
|
March 30, 2017
|
|
|
|
Drivers
|
|
March 30, 2020
|
|
More than half of the full-time equivalent employees of the IHT are located in France, whose terms and conditions of employment are established by a combination of French national labor law, industry-wide collective agreements and Company-specific agreements.
More than half of the full-time equivalent employees of the Globe and Boston.com were represented by 10 unions with 12 labor agreements. As indicated below, certain collective bargaining agreements have expired and negotiations for new contracts are ongoing. We cannot predict the timing or the outcome of these negotiations.
|
|
|
Employee Category
|
|
Expiration Date
|
|
The Globe and
|
Drivers
|
December 31, 2010 (expired)
|
||
|
Boston.com
|
Paperhandlers
|
December 31, 2010 (expired)
|
||
|
Boston Newspaper Guild
|
December 31, 2012
|
|||
|
Engravers
|
December 31, 2012
|
|||
|
Boston Mailers Union
|
December 31, 2012
|
|||
|
Pressmen
|
December 31, 2012
|
|||
|
Technical services group
|
December 31, 2012
|
|||
|
Electricians
|
December 31, 2012
|
|||
|
Typographers
|
December 31, 2013
|
|||
|
Garage mechanics
|
December 31, 2013
|
|||
|
Machinists
|
December 31, 2013
|
|||
|
Warehouse employees
|
December 31, 2015
|
|||
As part of various cost-cutting measures in 2009 that resulted in amendments to certain collective bargaining agreements, the Globe agreed to a profit-sharing plan based on the performance of the Globe and Boston.com in 2011 and 2012. Pursuant to these collective bargaining agreements, the Globe expects to make profit-sharing payments in 2012 to eligible full-time union employees based on a formula tied to the 2011 operating profit of the Globe and Boston.com, calculated in accordance with accounting principles generally accepted in the United States of America (“GAAP”). Such payments will reflect the lowest threshold at which payments are required to be made.
Approximately one-third of the full-time equivalent employees of the T&G are represented by four unions. Labor agreements with production unions expired or will expire on
August 31, 2011
,
October 8, 2011
and
November 30, 2016
. The labor agreements with the Providence Newspaper Guild, representing newsroom and circulation employees, expire on
June 14, 2012
.
P.
8
– THE NEW YORK TIMES COMPANY
|
|
You should carefully consider the risk factors described below, as well as the other information included in this Annual Report on Form 10-K. Our business, financial condition or results of operations could be materially adversely affected by any or all of these risks, or by other risks or uncertainties not presently known or currently deemed immaterial, that may adversely affect us in the future.
Economic weakness and uncertainty in the United States, in the regions in which we operate and in key advertising categories have adversely affected and may continue to adversely affect our advertising revenues.
Advertising spending, which drives a significant portion of our revenues, is sensitive to economic conditions. National and local economic conditions, particularly in the New York City and Boston metropolitan regions, affect the levels of our national, retail and classified advertising revenues. Economic factors that have adversely affected advertising revenues include lower consumer and business spending, high unemployment, depressed home sales and other challenges affecting the economy. Our advertising revenues are particularly adversely affected if advertisers respond to weak and uneven economic conditions by reducing their budgets or shifting spending patterns or priorities, or if they are forced to consolidate or cease operations. Continuing weak and uncertain economic conditions and outlook would adversely affect our level of advertising revenues and our business, financial condition and results of operations.
O
ur businesses face substantial competition for advertisers.
We face substantial competition for advertising revenues in our various markets from free and paid newspapers, magazines, Web sites, digital platforms and applications, television, radio, other forms of media, direct marketing and digital advertising networks and exchanges. Competition for advertising is generally based on audience levels and demographics, price, service and advertising results. It has intensified as a result of both the continued development and fragmentation of digital media and adverse economic conditions. Competition from all of these media and services affects our ability to attract and retain advertisers and consumers and to maintain or increase our advertising rates.
The increasing popularity of digital media and the shift in consumer habits and advertising expenditures from traditional to digital media has adversely affected and may continue to adversely affect our print advertising revenues.
Web sites, applications for mobile devices, social networking tools and other digital platforms distributing news and other content continue to gain popularity. This migration to digital technologies among both providers and consumers of content is likely to continue with companies seeking greater efficiencies and consumers seeking more value, convenience and timeliness of digital technologies. As a result, print subscriptions may decline and advertising spending may continue to shift from traditional media forms to digital media. We expect that advertisers will continue to allocate increasing portions of their budgets to digital media, which through pay-for-performance and keyword-targeted advertising can offer more measurable returns than traditional print media. This secular shift has intensified competition for advertising in traditional media and has contributed to and is likely to continue to contribute to a decline in print advertising revenue.
We may not achieve sufficient subscribers or audience levels to make our digital pay models financially attractive.
During
2011
, we launched digital subscriptions at The Times, the IHT and the Globe, with the intention of developing a new consumer revenue stream while preserving our digital advertising business. Our ability to build a subscriber base on our digital platforms depends on market acceptance, consumer habits, pricing, an adequate online infrastructure, terms of delivery platforms and other factors. Traffic levels may stagnate or decline as a result of the implementation of a pay model, which may adversely affect our advertiser base and advertising rates and result in a decline in digital revenues. If we are unable to convert and retain a sufficient number of digital users to a paid status or maintain our digital audience for advertising sales, our business, financial condition and prospects may be adversely affected.
If we are unable to retain and grow our digital audience, our digital businesses will be adversely affected.
The increasing number of digital media options available on the Internet, through social networking tools and through mobile and other devices distributing news and other content, is expanding consumer choice significantly. Faced with a multitude of media choices and a dramatic increase in accessible information, consumers may place greater value on when, where, how and at what price they consume digital content than they do on the source or
THE NEW YORK TIMES COMPANY – P.
9
reliability of such content. News aggregation Web sites and customized news feeds (often free to users) may reduce our traffic levels by creating a disincentive for
the audience to visit our Web sites or use our digital applications. In addition, the undifferentiated presentation of some of our content in aggregation with other content may lead audiences to fail to distinguish our content from the content of other providers. Our reputation for quality journalism and content is important in competing for revenues in this environment and is based on consumer and advertiser perceptions. If consumers fail to differentiate our content from other content providers in digital media, or if the quality of our journalism or content is perceived as less reliable, we may not be able to increase our online traffic sufficiently or retain a base of frequent visitors to our digital platforms.
Online traffic is also driven by Internet search results, including search results provided by Google, the primary search engine directing traffic to the Web sites of the About Group and many of our other sites. Search engines frequently update and change the methods for directing search queries to Web pages or change methodologies and metrics for valuing the quality and performance of Internet traffic on delivering cost-per-click advertisements. Any such changes could decrease the amount of revenue that we generate from online advertisements. The failure to successfully manage search engine optimization efforts across our businesses could result in a significant decrease in traffic to our various Web sites, which could result in substantial decreases in conversion rates and repeat business, as well as increased costs if we were to replace free traffic with paid traffic, any or all of which would adversely affect our business, financial condition and results of operations.
If traffic levels stagnate or decline, we may not be able to create sufficient advertiser interest in our digital businesses or to maintain or increase the advertising rates of the inventory on our digital platforms. Even if we maintain traffic levels, the market position of our brands may not be enough to counteract a significant downward pressure on advertising rates as a result of a significant increase in inventory.
The About Group depends upon arrangements with Google, and any changes in this relationship or Google’s practices could adversely affect its business, financial condition and results of operations.
Cost-per-click revenue of the About Group is principally derived from an arrangement with Google. If the About Group is unable to continue the existing agreement with Google on favorable terms and conditions or if Google’s position in the marketplace wanes, the About Group’s business, financial condition and results of operations would be adversely affected. In addition, the amount of revenue we receive from Google depends upon a number of factors outside of our control, including the efficiency of Google’s system in attracting advertisers and serving up paid listings on our content pages and judgments made by Google about the relative attractiveness (to the advertiser) of clicks on paid listings on our Web pages. Changes to Google’s paid listings network efficiency or its judgment about the relative attractiveness of clicks on paid listings on our Web pages has had and may continue to have an adverse effect on the About Group’s business, financial condition and results of operations.
To remain competitive, we must be able to respond to and capitalize on changes in technology, services and standards and changes in consumer behavior, and significant capital investments may be required.
Technological developments in the media industry continue to evolve rapidly. Advances in technology have led to an increasing number of methods for the delivery of news and other content and have driven consumer demand and expectations in unanticipated directions. If we are unable to exploit new and existing technologies to distinguish our products and services from those of our competitors or adapt to new distribution methods that provide optimal user experiences, our business, financial condition and prospects may be adversely affected.
Technological developments also pose other challenges that could adversely affect our revenues and competitive position. New delivery platforms may lead to pricing restrictions, the loss of distribution control and the loss of a direct relationship with consumers. We may also be adversely affected if the use of technology developed to block the display of advertising on Web sites proliferates.
Technological developments and any changes we make to our business model may require significant capital investments. We may be limited in our ability to invest funds and resources in digital products, services or opportunities and we may incur costs of research and development in building and maintaining the necessary and continually evolving technology infrastructure. It may also be difficult to attract and retain talent for critical positions. Some of our existing competitors and new entrants may have greater operational, financial and other resources or may otherwise be better positioned to compete for opportunities and as a result, our digital businesses may be less successful.
P.
10
– THE NEW YORK TIMES COMPANY
Decreases in print circulation volume adversely affect our circulation and advertising revenues.
Advertising and circulation revenues are affected by circulation and readership levels of our newspaper properties. Competition for circulation and readership is generally based upon format, content, quality, service, timeliness and price. In recent years, our newspaper properties, and the newspaper industry as a whole, have experienced declining print circulation volume. This is due to, among other factors, increased competition from digital media formats and sources other than traditional newspapers (often free to users), declining discretionary spending by consumers affected by weak economic conditions, high subscription and single-copy rates, and a growing preference among some consumers to receive all or a portion of their news other than from a newspaper. We have also experienced volume declines as a result of our strategy to implement circulation
price increases at many of our newspaper properties and to focus on individually paid circulation that is preferred by advertisers. If these or other factors result in a continued decline in circulation volume, the rate and volume of advertising revenues may be adversely affected (as rates reflect circulation and readership, among other factors). These factors could also affect our ability to institute circulation price increases for our products at a rate sufficient to offset circulation volume declines. We may also incur increased spending on marketing designed to attract and retain subscribers or drive traffic to our digital products, and we may not be able to recover these costs through circulation and advertising revenues.
If we are unable to execute cost-control measures successfully, our total operating costs may be greater than expected, which may adversely affect our profitability.
We have significantly reduced operating costs by reducing staff and employee benefits and implementing general cost-control measures across the Company, and expect to continue these cost management efforts. If we do not achieve expected savings or our operating costs increase as a result of our strategic initiatives, our total operating costs may be greater than anticipated. In addition, if our cost-control strategy is not managed properly, such efforts may affect the quality of our products and our ability to generate future revenue. Reductions in staff and employee compensation and benefits could also adversely affect our ability to attract and retain key employees.
Significant portions of our expenses are fixed costs that neither increase nor decrease proportionately with revenues. If we are not able to implement further cost control efforts or reduce our fixed costs sufficiently in response to a decline in our revenues, we may experience a higher percentage decline in our income from continuing operations.
A significant increase in the price of newsprint, or limited availability of newsprint supply, would have an adverse effect on our operating results.
The cost of raw materials, of which newsprint is the major component, represented approximately 8% of our total operating costs in
2011
. The price of newsprint has historically been volatile and may increase as a result of various factors, including:
|
•
|
a reduction in the number of suppliers as a result of restructurings and consolidations in the North American newsprint industry;
|
|
•
|
declining newsprint supply as a result of paper mill closures and conversions to other grades of paper; and
|
|
•
|
other factors that adversely impact supplier profitability, including increases in operating expenses caused by raw material and energy costs, and a rise in the value of the Canadian dollar, which adversely affects Canadian suppliers whose costs are incurred in Canadian dollars but whose newsprint sales are priced in U.S. dollars.
|
In addition, we rely on our suppliers for deliveries of newsprint. The availability of our newsprint supply may be affected by various factors, including strikes and other disruptions that may affect deliveries of newsprint.
If newsprint prices increase significantly or we experience significant disruptions in the availability of our newsprint supply in the future, our operating results will be adversely affected.
The underfunded status of our pension plans may adversely affect our operations, financial condition and liquidity.
We sponsor several qualified defined benefit pension plans. We are required to make contributions to our qualified defined benefit pension plans to comply with minimum funding requirements imposed by laws governing these employee benefit plans. The difference between the obligations and assets of the qualified defined benefit plans, or the funded status of the qualified defined benefit plans, is a significant factor in determining pension expense and the ongoing funding requirements to those plans. Our qualified defined benefit pension plans were underfunded as
THE NEW YORK TIMES COMPANY – P.
11
of the January 1,
2012
, valuation date and we expect to make substantial contributions in the future to fund this deficiency. In addition, while we sold the Regional Media Group in January 2012, we retained pension assets and liabilities and postretirement obligations related to employees of that business. Future volatility and disruption in the stock and bond markets could cause declines in the asset values of our qualified defined benefit pension plans. In addition, a decrease in the discount rate used to determine the liabilities for pension obligations will result in increased liabilities. If investment returns on plan assets are below expectations or interest rates decrease or remain very low, our contributions may be higher than currently anticipated. As a result, we may have less cash available for working capital and other corporate uses, which may have an adverse impact on our operations, financial condition and liquidity.
Due to our participation in multiemployer pension plans, we have exposures under those plans that may extend beyond what our obligations would be with respect to our employees.
We participate in, and make periodic contributions to, various multiemployer pension plans that cover many of our union employees. Our required contributions to these plans could increase because of a shrinking contribution base as a result of the insolvency or withdrawal of other companies that currently contribute to these plans, inability or failure of withdrawing companies to pay their withdrawal liability, low interest rates, lower than expected returns on pension fund assets or other funding deficiencies.
We have incurred significant withdrawal liabilities to the multiemployer pension plans in which we participate, such as the liability assessed against us in 2009 in connection with amendments to various collective bargaining agreements affecting certain multiemployer pension plans. We may be required to make additional contributions under applicable law with respect to those plans or other multiemployer pension plans from which we may withdraw or partially withdraw. Our withdrawal liability for any multiemployer pension plan will depend on the extent of that plan’s funding of vested benefits. If a multiemployer pension plan in which we participate has significant underfunded liabilities, such underfunding will increase the size of our potential withdrawal liability.
A significant number of our employees are unionized, and our business and results of operations could be adversely affected if labor negotiations or contracts were to further restrict our ability to maximize the efficiency of our operations.
Approximately half of our full-time equivalent work force are unionized. As a result, we are required to negotiate the wages, salaries, benefits, staffing levels and other terms with many of our employees collectively. Our results could be adversely affected if future labor negotiations or contracts were to further restrict our ability to maximize the efficiency of our operations. If we were to experience labor unrest, strikes or other business interruptions in connection with labor negotiations or otherwise, or if we are unable to negotiate labor contracts on reasonable terms, our ability to produce and deliver our most significant products could be impaired. In addition, our ability to make short-term adjustments to control compensation and benefits costs, rebalance our portfolio of businesses or otherwise adapt to changing business needs may be limited by the terms and duration of our collective bargaining agreements.
We may buy or sell different properties as a result of our evaluation of our portfolio of businesses. Such acquisitions or divestitures would affect our costs, revenues, profitability and financial position.
From time to time, we evaluate the various components of our portfolio of businesses and may, as a result, buy or sell different properties. These acquisitions or divestitures affect our costs, revenues, profitability and financial position. We may also consider the acquisition of specific properties or businesses that fall outside our traditional lines of business if we deem such properties sufficiently attractive.
Divestitures have inherent risks, including possible delays in closing transactions (including potential difficulties in obtaining regulatory approvals), the risk of lower-than-expected sales proceeds for the divested businesses, unexpected costs associated with the separation of the business to be sold from our integrated information technology systems and other operating systems, and potential post-closing claims for indemnification. In addition, adverse economic or market conditions may result in fewer potential bidders and unsuccessful sales efforts. Expected cost savings, which are offset by revenue losses from divested businesses, may also be difficult to achieve or maximize due to our fixed cost structure, and we may experience varying success in reducing fixed costs or transferring liabilities previously associated with the divested businesses.
Acquisitions also involve risks, including difficulties in integrating acquired operations, diversions of management resources, debt incurred in financing these acquisitions (including the related possible reduction in our credit ratings and increase in our cost of borrowing), differing levels of management and internal control effectiveness
P.
12
– THE NEW YORK TIMES COMPANY
at the acquired entities and other unanticipated problems and liabilities. Competition for certain types of acquisitions, particularly digital properties, is significant. Even if successfully negotiated, closed and integrated, certain acquisitions or investments may prove not to advance our business strategy and may fall short of expected return on investment targets.
From time to time, we make noncontrolling minority investments in private entities and these investments may be subject to capital calls. We may have limited voting rights or an inability to influence the direction of such entities, although income from such investments may represent a significant portion of our income. Therefore, the success of these ventures may be dependent upon the efforts of our partners, fellow investors and licensees. These investments are generally illiquid, and the absence of a market inhibits our ability to dispose of them. This inhibition as well as an inability to control the timing or process relating to a disposition could adversely affect our liquidity and the value we may ultimately attain on a disposition. If the value of the companies in which we invest declines, we may be required to record a charge to earnings.
Our debt agreements contain restrictions that limit our flexibility in operating our business.
Our debt agreements contain various covenants that limit our ability to engage in specified types of transactions. For example, these covenants, among other things, restrict, subject to certain exceptions, our ability and the ability of our subsidiaries to:
|
•
|
incur or guarantee additional debt or issue certain preferred equity;
|
|
•
|
pay dividends on or make distributions to holders of our common stock or make other restricted payments;
|
|
•
|
create or incur liens on certain assets to secure debt;
|
|
•
|
make certain investments, acquisitions or dispositions;
|
|
•
|
consolidate, merge, sell or otherwise dispose of all or substantially all of our assets;
|
|
•
|
prepay debt; or
|
|
•
|
enter into certain transactions with affiliates.
|
In addition, our credit facility has a springing financial covenant that requires us to satisfy a minimum fixed charge coverage ratio when availability under the credit facility falls below the greater of $16.7 million or 15% of the commitment for three consecutive business days. These restrictions limit our flexibility in operating our business and responding to opportunities.
Changes in our credit ratings or macroeconomic conditions may affect our liquidity, increasing borrowing costs and limiting our financing options.
Our long-term debt is currently rated below investment grade by Standard & Poor’s and Moody’s Investors Service. If our credit ratings remain below investment grade or are lowered further, borrowing costs for future long-term debt or short-term borrowing facilities may increase and our financing options, including our access to the unsecured borrowing market, would be more limited. We may also be subject to additional restrictive covenants that would reduce our flexibility. In addition, macroeconomic conditions, such as continued or increased volatility or disruption in the credit markets, would adversely affect our ability to refinance existing debt or obtain additional financing to support operations or to fund new acquisitions or capital-intensive internal initiatives.
We may be required to record non-cash impairment charges with respect to certain of our assets.
Each year, we evaluate the various components of our portfolio in connection with annual impairment testing. We also continually evaluate whether current factors or indicators require the performance of an interim impairment assessment of those assets, as well as other investments and other long-lived assets. We may be required to record a non-cash charge if the financial statement carrying value of an asset is in excess of its estimated fair value. Fair value could be adversely affected by weak economic or market conditions within our industry that may have an adverse impact on our projected future cash flows or our stock price. An impairment charge would adversely affect our reported earnings.
We may not be able to protect intellectual property rights upon which our business relies, and if we lose intellectual property protection, our assets may lose value.
Our business depends on our intellectual property, including our valuable brands, content, services and
THE NEW YORK TIMES COMPANY – P.
13
internally developed technology. We believe our proprietary trademarks and other intellectual property rights are important to our continued success and our competitive position.
Unauthorized parties may attempt to copy or otherwise obtain and use our content, services, technology and other intellectual property, and we cannot be certain that the steps we have taken to protect our proprietary rights will prevent any misappropriation or confusion among consumers and merchants, or unauthorized use of these rights.
Advancements in technology have exacerbated the risk by making it easier to duplicate and disseminate content. In addition, as our business and the risk of misappropriation of our intellectual property rights have become more global in scope, we may not be able to protect our proprietary rights in a cost effective manner in a multitude of jurisdictions with varying laws.
If we are unable to procure, protect and enforce our intellectual property rights, we may not realize the full value of these assets, and our business may suffer. If we must litigate in the United States or elsewhere to enforce our intellectual property rights or determine the validity and scope of the proprietary rights of others, such litigation may be costly and divert the attention of our management.
Our Class B Common Stock is principally held by descendants of Adolph S. Ochs, through a family trust, and this control could create conflicts of interest or inhibit potential changes of control.
We have two classes of stock: Class A Common Stock and Class B Common Stock. Holders of Class A Common Stock are entitled to elect 30% of the Board of Directors and to vote, with holders of Class B Common Stock, on the reservation of shares for equity grants, certain material acquisitions and the ratification of the selection of our auditors. Holders of Class B Common Stock are entitled to elect the remainder of the Board and to vote on all other matters. Our Class B Common Stock is principally held by descendants of Adolph S. Ochs, who purchased The Times in 1896. A family trust holds approximately 90% of the Class B Common Stock. As a result, the trust has the ability to elect 70% of the Board of Directors and to direct the outcome of any matter that does not require a vote of the Class A Common Stock. Under the terms of the trust agreement, the trustees are directed to retain the Class B Common Stock held in trust and to vote such stock against any merger, sale of assets or other transaction pursuant to which control of The Times passes from the trustees, unless they determine that the primary objective of the trust can be achieved better by the implementation of such transaction. Because this concentrated control could discourage others from initiating any potential merger, takeover or other change of control transaction that may otherwise be beneficial to our businesses, the market price of our Class A Common Stock could be adversely affected.
Legislative and regulatory developments may result in increased costs and lower advertising revenues from our digital businesses.
All of our operations are subject to government regulation in the jurisdictions in which they operate. Due to the wide geographic scope of its operations, the IHT is subject to regulation by political entities throughout the world. In addition, our Web sites are available worldwide and are subject to laws regulating the Internet both within and outside the United States. We may incur increased costs necessary to comply with existing and newly adopted laws and regulations or penalties for any failure to comply. Advertising revenues from our digital businesses could be adversely affected, directly or indirectly, by existing or future laws and regulations relating to the use of consumer data in digital media.
P.
14
– THE NEW YORK TIMES COMPANY
|
|
None.
|
|
Our principal executive offices are located in our New York headquarters building in the Times Square area. The building was completed in 2007 and consists of approximately 1.54 million gross square feet, of which approximately 828,000 gross square feet of space have been allocated to us. We owned a leasehold condominium interest representing approximately 58% of the New York headquarters building until March 6, 2009, when one of our affiliates entered into an agreement to sell and simultaneously lease back a portion of our leasehold condominium interest (the “Condo Interest”). The sale-leaseback transaction encompassed 21 floors, or approximately 750,000 rentable square feet, currently occupied by us. The sale price for the Condo Interest was $225 million. We have an option exercisable in 2019 to repurchase the Condo Interest for $250 million. The lease term is 15 years, and we have three renewal options that could extend the term for an additional 20 years. We continue to own a leasehold condominium interest in seven floors in our New York headquarters building, totaling approximately 216,000 rentable square feet, that were not included in the sale-leaseback transaction, of which six floors are leased to a third party.
In addition, we built a printing and distribution facility with 570,000 gross square feet located in College Point, N.Y., on a 31-acre site for which we have a ground lease. We have an option to purchase the property at any time before the lease ends in
2019
. We own a facility in Boston, Mass., of 703,000 gross square feet that includes printing operations and offices. We also currently own properties with an aggregate of approximately 192,000 gross square feet and lease properties with an aggregate of approximately 398,000 rentable square feet in various locations, which does not include properties formerly used by the Regional Media Group, which was sold on January 6, 2012. These properties, our New York headquarters and the College Point and Boston properties are used by our News Media Group. Properties leased by the About Group total approximately 52,000 rentable square feet.
|
|
There are various legal actions that have arisen in the ordinary course of business and are now pending against us. Such actions are usually for amounts greatly in excess of the payments, if any, that may be required to be made. It is the opinion of management after reviewing such actions with our legal counsel that the ultimate liability that might result from such actions will not have a material adverse effect on our consolidated financial statements.
|
|
Not applicable.
THE NEW YORK TIMES COMPANY – P.
15
EXECUTIVE
OFFICERS OF THE REGISTRANT
|
Name
|
Age
|
Employed By
Registrant Since
|
Recent Position(s) Held as of February 23, 2012
(except as noted)
|
||||
|
Corporate Officers
|
|||||||
|
Arthur Sulzberger, Jr.
|
60
|
1978
|
Chairman (since 1997); Chief Executive Officer (since December 2011); Publisher of The Times (since 1992)
|
||||
|
Michael Golden
|
62
|
1984
|
Vice Chairman (since 1997); President and Chief Operating Officer, Regional Media Group (2009 to January 2012); Publisher of the IHT (2003 to 2008); Senior Vice President (1997 to 2004)
|
||||
|
James M. Follo
|
52
|
2007
|
Senior Vice President and Chief Financial Officer (since 2007); Chief Financial and Administrative Officer, Martha Stewart Living Omnimedia, Inc. (2001 to 2006)
|
||||
|
R. Anthony Benten
|
48
|
1989
|
Senior Vice President, Finance (since 2008); Corporate Controller (since 2007); Vice President (2003 to 2008); Treasurer (2001 to 2007)
|
||||
|
Todd C. McCarty
|
46
|
2009
|
Senior Vice President, Human Resources (since 2009); Senior Vice President, Global Human Resources, The Reader’s Digest Association (2008 to 2009); Senior Vice President, Human Resources, Rite Aid Corporation (2005 to 2008); Senior Vice President, North American Human Resources, Starwood Hotels & Resorts Worldwide, Inc. (2000 to 2005)
|
||||
|
Kenneth A. Richieri
|
60
|
1983
|
Senior Vice President (since 2007), General Counsel (since 2006) and Secretary (from 2008 to February 2011); Vice President (2002 to 2007); Deputy General Counsel (2001 to 2005); Vice President and General Counsel, New York Times Digital (1999 to 2003)
|
||||
|
Operating Unit Executives
|
|||||||
|
Scott H. Heekin-Canedy
|
60
|
1987
(1)
|
President and General Manager of The Times (since 2004); Senior Vice President, Circulation of The Times (1999 to 2004)
|
||||
|
Darline Jean
|
44
|
2005
|
President and Chief Executive Officer (since September 2011), Senior Vice President (2010 to September 2011), Chief Financial Officer (2006 to September 2011) and Vice President, Finance (2004 to 2006) of the About Group; Chief Operating Officer of About.com (2010 to September 2011)
|
||||
|
Christopher M. Mayer
|
50
|
1984
|
Publisher of the Globe and President of the New England Media Group (since 2010); Senior Vice President, Circulation and Operations, of the Globe (2008 to 2009); Chief Information Officer and Senior Vice President of the Globe (2005 to 2008); Vice President, Circulation Sales, of the Globe (2002 to 2005)
|
||||
|
(1)
|
Mr. Heekin-Canedy left the Company in 1989 and returned in 1992.
|
P.
16
– THE NEW YORK TIMES COMPANY
|
|
|
MATTERS AND ISSUER PURCHASES OF EQUITY SECURITIES
|
MARKET INFORMATION
The Class A Common Stock is listed on the New York Stock Exchange. The Class B Common Stock is unlisted and is not actively traded.
The number of security holders of record as of
February 17, 2012
, was as follows: Class A Common Stock:
6,738
; Class B Common Stock:
28
.
No dividends have been declared or paid on our Class A or Class B Common Stock since the fourth quarter of 2008. The decision to pay a dividend in future periods and the appropriate level of dividends will be considered by our Board of Directors on an ongoing basis in light of our earnings, capital requirements, financial condition and other factors considered relevant. In addition, our Board of Directors will consider restrictions in any existing indebtedness, such as the terms of our 6.625% senior unsecured notes due 2016, which restrict our ability to pay dividends. See “Item 7 — Management’s Discussion and Analysis of Financial Condition and Results of Operations — Third-Party Financing.”
The following table sets forth, for the periods indicated, the high and low closing sales prices for the Class A Common Stock as reported on the New York Stock Exchange.
|
|
2011
|
2010
|
||||||||||||||
|
Quarters
|
High
|
|
Low
|
|
High
|
|
Low
|
|
||||||||
|
First Quarter
|
$
|
10.90
|
|
$
|
8.86
|
|
$
|
14.67
|
|
$
|
10.62
|
|
||||
|
Second Quarter
|
9.67
|
|
7.19
|
|
12.80
|
|
8.35
|
|
||||||||
|
Third Quarter
|
9.21
|
|
5.76
|
|
9.76
|
|
7.18
|
|
||||||||
|
Fourth Quarter
|
7.97
|
|
5.65
|
|
10.00
|
|
7.60
|
|
||||||||
ISSUER PURCHASES OF EQUITY SECURITIES
(1)
|
Period
|
Total Number of
Shares of Class A
Common Stock
Purchased
(a)
|
Average
Price Paid
Per Share of
Class A
Common Stock
(b)
|
Total Number of
Shares of Class A
Common Stock
Purchased
as Part of
Publicly
Announced Plans
or Programs
(c)
|
Maximum
Number (or
Approximate
Dollar Value)
of Shares of
Class A
Common
Stock that May
Yet Be
Purchased
Under the Plans
or Programs
(d)
|
|||||||||||
|
September 26, 2011 - October 30, 2011
|
—
|
|
$
|
—
|
|
—
|
|
$
|
91,386,000
|
|
|||||
|
October 31, 2011 - November 27, 2011
|
—
|
|
—
|
|
—
|
|
$
|
91,386,000
|
|
||||||
|
November 28, 2011 - December 25, 2011
|
—
|
|
—
|
|
—
|
|
$
|
91,386,000
|
|
||||||
|
Total for the fourth quarter of 2011
|
—
|
|
$
|
—
|
|
—
|
|
$
|
91,386,000
|
|
|||||
|
(1)
|
On April 13, 2004, our Board of Directors authorized repurchases in an amount up to $400 million. During the fourth quarter of 2011, we did not purchase any shares of Class A Common Stock pursuant to our publicly announced share repurchase program. As of February 17, 2012, we had authorization from our Board of Directors to repurchase an amount of up to approximately $91 million of our Class A Common Stock. Our Board of Directors has authorized us to purchase shares from time to time as market conditions permit. There is no expiration date with respect to this authorization.
|
THE NEW YORK TIMES COMPANY – P.
17
EQUITY COMPENSATION PLAN INFORMATION
The following table presents information regarding our existing equity compensation plans as of
December 25, 2011
.
|
Plan category
|
Number of securities to
be issued upon
exercise of outstanding
options, warrants
and rights
(a)
|
Weighted average
exercise price of
outstanding options,
warrants and rights
(b)
|
Number of securities remaining
available for future issuance
under equity compensation
plans (excluding securities
reflected in column (a))
(c)
|
||||||
|
Equity compensation plans approved by security holders
|
|||||||||
|
Stock options and stock-based awards
|
18,166,000
|
|
(1)
|
$30
|
6,771,000
|
|
(2)
|
||
|
Employee Stock Purchase Plan
|
—
|
|
—
|
|
6,410,000
|
|
(3)
|
||
|
Total
|
18,166,000
|
|
—
|
|
13,181,000
|
|
|||
|
Equity compensation plans not approved by security holders
|
None
|
|
None
|
|
None
|
|
|||
|
(1)
|
Includes shares of Class A Common Stock to be issued upon exercise of outstanding stock options granted under the Company’s 1991 Executive Stock Incentive Plan (the “1991 Incentive Plan”) and the Company's 2010 Incentive Compensation Plan (the “2010 Incentive Plan”), as well as its Non-Employee Directors’ Stock Option Plan or Non-Employee Directors’ Stock Incentive Plan (together, the “Directors’ Plans”). Includes shares of Class A Common Stock to be issued upon conversion of stock-settled restricted stock units under the 1991 Incentive Plan and 2010 Incentive Plan.
|
|
(2)
|
Includes shares of Class A Common Stock available for future stock options to be granted under the 2010 Incentive Plan and the Directors’ Plans. As of December 25, 2011, the 2010 Incentive Plan had 6,539,000 shares remaining for issuance upon the grant, exercise or other settlement of share-based awards. The Directors’ Plans provide for the issuance of up to 496,000 shares of Class A Common Stock in the form of stock options or restricted stock units. The amount reported for stock options includes the aggregate number of securities remaining (approximately 232,000 as of December 25, 2011) for future issuances under those plans. Stock options granted under the 1991 Incentive Plan, 2010 Incentive Plan and the Directors’ Plans must provide for an exercise price of 100% of the fair market value on the date of grant and, except in the case of the 2010 Incentive Plan (which does not specify a maximum term), a maximum term of 10 years.
|
|
(3)
|
Includes shares of Class A Common Stock available for future issuance under the Company’s Employee Stock Purchase Plan (“ESPP”). We have not had an offering under the ESPP since 2010.
|
P.
18
– THE NEW YORK TIMES COMPANY
PERFORMANCE PRESENTATION
The following graph shows the annual cumulative total stockholder return for the five years ending December 30,
2011
, on an assumed investment of $100 on December 29,
2006
, in the Company, the Standard & Poor’s S&P 500 Stock Index and S&P MidCap 400 Stock Index and an index of peer group media companies. In December 2010, the Company was moved from the S&P 500 Stock Index to the S&P MidCap 400 Stock Index, and we believe the latter index now provides a more meaningful comparison. The peer group returns are weighted by market capitalization at the beginning of each year. The peer group is comprised of the Company and the following media companies: Gannett Co., Inc., Media General, Inc., The McClatchy Company and The Washington Post Company. Stockholder return is measured by dividing (a) the sum of (i) the cumulative amount of dividends declared for the measurement period, assuming monthly reinvestment of dividends, and (ii) the difference between the issuer’s share price at the end and the beginning of the measurement period by (b) the share price at the beginning of the measurement period. As a result, stockholder return includes both dividends and stock appreciation.
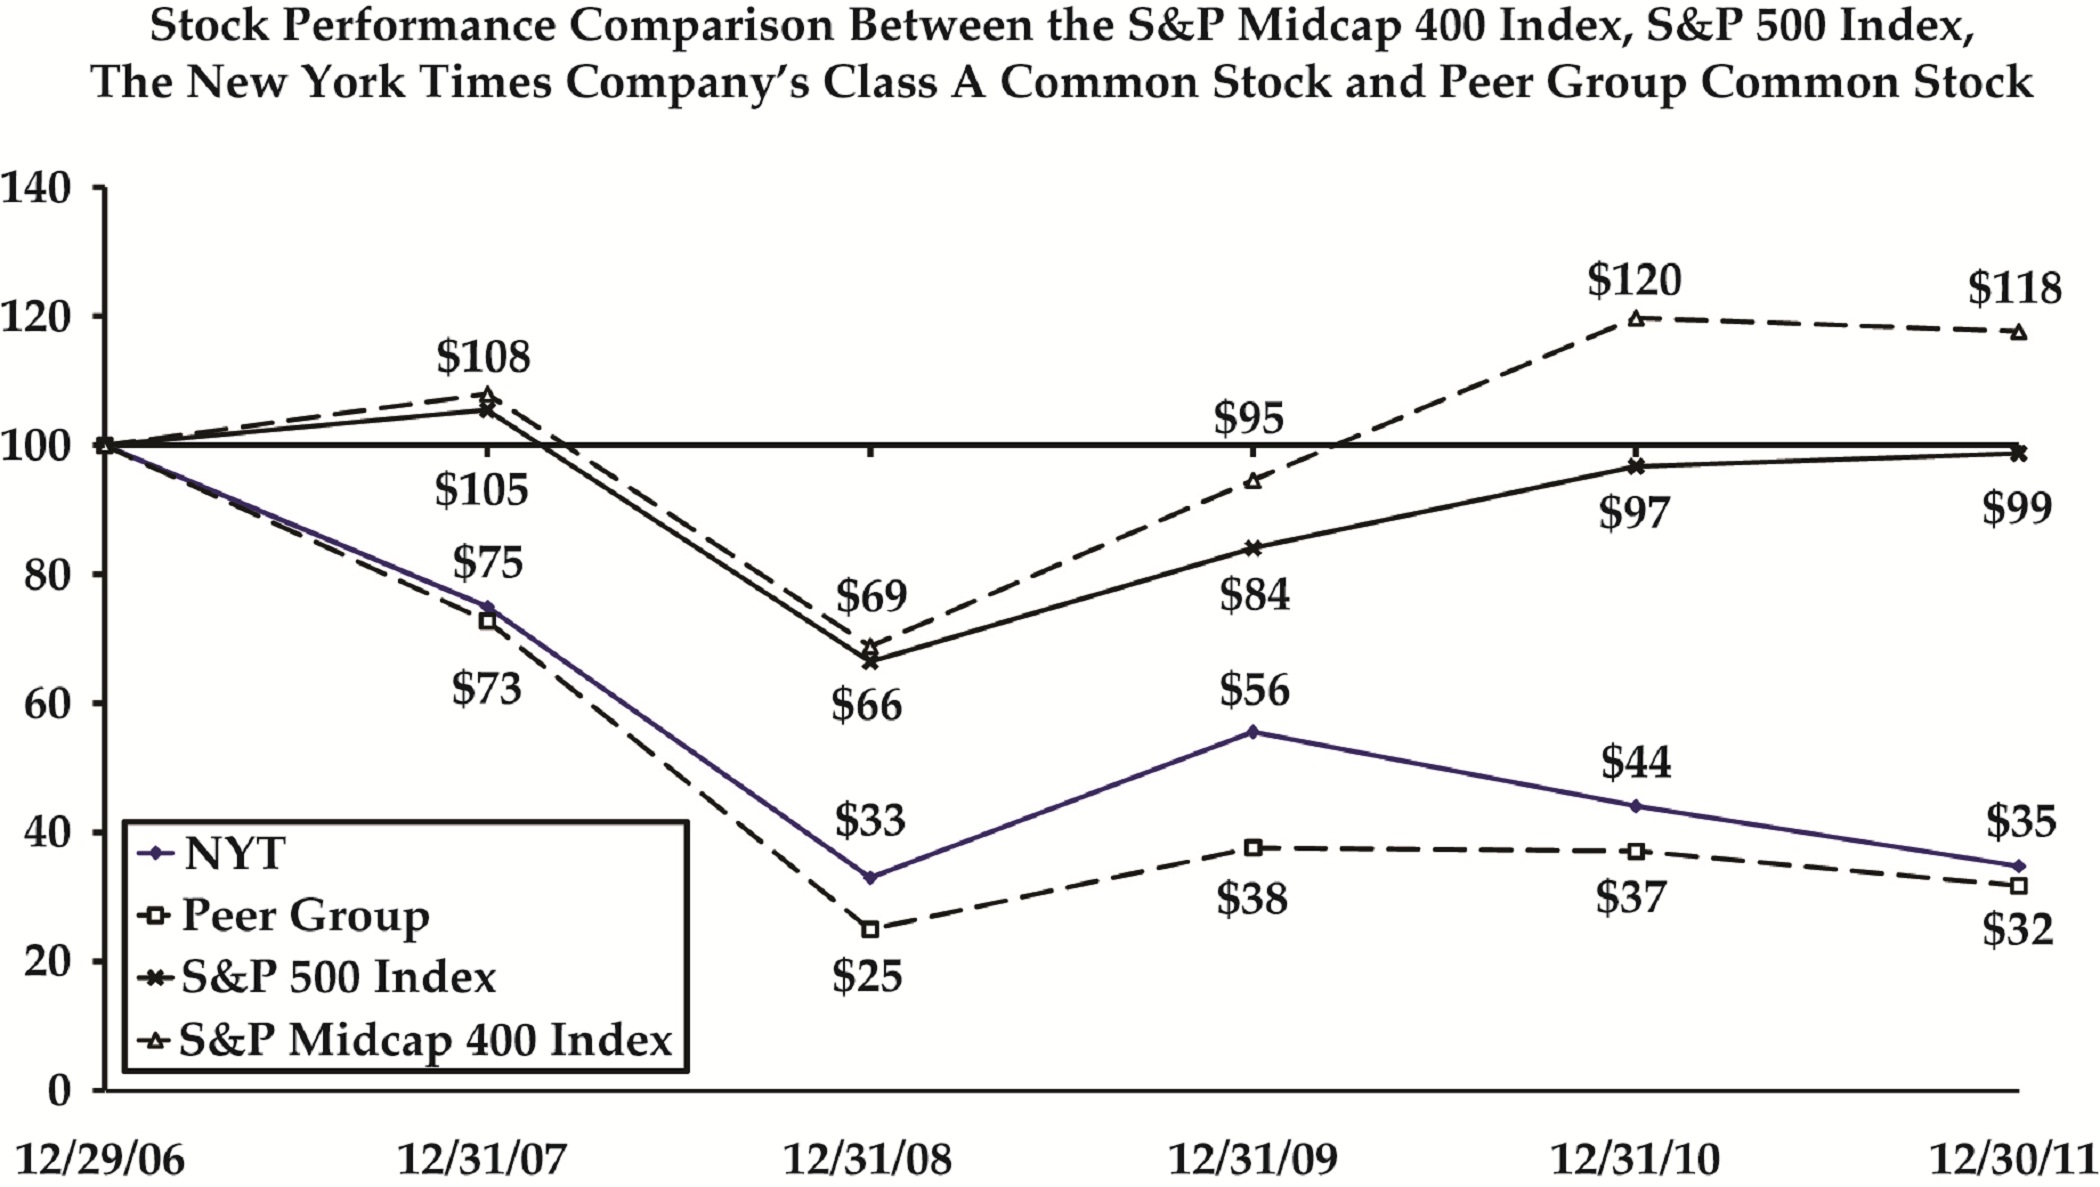
THE NEW YORK TIMES COMPANY – P.
19
|
|
|
The Selected Financial Data should be read in conjunction with “Item 7 — Management’s Discussion and Analysis of Financial Condition and Results of Operations” and the Consolidated Financial Statements and the related Notes in Item 8. The results of operations for WQXR-FM and WQEW-AM, previously included in The New York Times Media Group, which is part of the News Media Group, have been presented as discontinued operations for all periods presented before the sale of WQXR-FM in 2009. The Broadcast Media Group’s results of operations have been presented as discontinued operations in 2007. The pages following the table show certain items included in Selected Financial Data. All per share amounts on those pages are on a diluted basis. All fiscal years presented in the table below comprise 52 weeks.
|
|
As of and for the Years Ended
|
|||||||||||||||||||
|
(In thousands)
|
December 25,
2011 |
|
December 26,
2010 |
|
December 27,
2009 |
|
December 28,
2008 |
|
December 30,
2007 |
|
||||||||||
|
Statement of Operations Data
|
||||||||||||||||||||
|
Revenues
|
$
|
2,323,401
|
|
$
|
2,393,463
|
|
$
|
2,440,439
|
|
$
|
2,939,764
|
|
$
|
3,184,757
|
|
|||||
|
Operating costs
|
2,093,532
|
|
2,136,927
|
|
2,307,800
|
|
2,783,076
|
|
2,919,031
|
|
||||||||||
|
Impairment of assets
|
164,434
|
|
16,148
|
|
4,179
|
|
197,879
|
|
11,000
|
|
||||||||||
|
Pension withdrawal expense
|
4,228
|
|
6,268
|
|
78,931
|
|
—
|
|
—
|
|
||||||||||
|
Loss on leases and other expenses
|
4,500
|
|
—
|
|
34,633
|
|
—
|
|
—
|
|
||||||||||
|
Net pension curtailment gain
|
—
|
|
—
|
|
53,965
|
|
—
|
|
—
|
|
||||||||||
|
Gain/(loss) on sale of assets
|
—
|
|
—
|
|
5,198
|
|
—
|
|
(68,156
|
)
|
||||||||||
|
Operating profit/(loss)
|
56,707
|
|
234,120
|
|
74,059
|
|
(41,191
|
)
|
186,570
|
|
||||||||||
|
Income/(loss) from joint ventures
|
28
|
|
19,035
|
|
20,667
|
|
17,062
|
|
(2,618
|
)
|
||||||||||
|
Gain on sale of investments
|
71,171
|
|
9,128
|
|
—
|
|
—
|
|
—
|
|
||||||||||
|
Interest expense, net
|
85,243
|
|
85,062
|
|
81,701
|
|
47,790
|
|
39,842
|
|
||||||||||
|
Premium on debt redemptions
|
46,381
|
|
—
|
|
9,250
|
|
—
|
|
—
|
|
||||||||||
|
(Loss)/income from continuing operations before income taxes
|
(3,718
|
)
|
177,221
|
|
3,775
|
|
(71,919
|
)
|
144,110
|
|
||||||||||
|
(Loss)/income from continuing operations
|
(40,224
|
)
|
108,705
|
|
1,569
|
|
(65,940
|
)
|
86,960
|
|
||||||||||
|
Discontinued operations, net of income taxes
|
—
|
|
13
|
|
18,332
|
|
8,602
|
|
121,637
|
|
||||||||||
|
Net (loss)/income attributable to The New York Times Company common stockholders
|
$
|
(39,669
|
)
|
$
|
107,704
|
|
$
|
19,891
|
|
$
|
(57,839
|
)
|
$
|
208,704
|
|
|||||
|
Balance Sheet Data
|
||||||||||||||||||||
|
Property, plant and equipment, net
|
$
|
1,085,190
|
|
$
|
1,156,786
|
|
$
|
1,250,021
|
|
$
|
1,353,619
|
|
$
|
1,468,013
|
|
|||||
|
Cash and cash equivalents and short-term investments
|
279,997
|
|
399,642
|
|
36,520
|
|
56,784
|
|
51,532
|
|
||||||||||
|
Total assets
|
2,883,450
|
|
3,285,741
|
|
3,088,557
|
|
3,401,680
|
|
3,473,092
|
|
||||||||||
|
Total debt and capital lease obligations
|
773,140
|
|
996,443
|
|
769,217
|
|
1,059,375
|
|
1,034,979
|
|
||||||||||
|
Total New York Times Company stockholders’ equity
|
506,360
|
|
659,927
|
|
604,042
|
|
503,963
|
|
978,200
|
|
||||||||||
P.
20
– THE NEW YORK TIMES COMPANY
|
|
As of and for the Years Ended
|
||||||||||||||||||||
|
(In thousands, except ratios, per share
and employee data)
|
December 25,
2011 |
|
December 26,
2010 |
|
December 27,
2009 |
|
December 28,
2008 |
|
December 30,
2007 |
|
|||||||||||
|
Per Share of Common Stock
|
|||||||||||||||||||||
|
Basic (loss)/earnings per share attributable to The New York Times Company common stockholders:
|
|||||||||||||||||||||
|
(Loss)/income from continuing operations
|
$
|
(0.27
|
)
|
$
|
0.74
|
|
$
|
0.01
|
|
$
|
(0.46
|
)
|
$
|
0.61
|
|
||||||
|
Discontinued operations, net of income taxes
|
0.00
|
|
0.00
|
|
0.13
|
|
0.06
|
|
0.84
|
|
|||||||||||
|
Net (loss)/income
|
$
|
(0.27
|
)
|
$
|
0.74
|
|
$
|
0.14
|
|
$
|
(0.40
|
)
|
$
|
1.45
|
|
||||||
|
Diluted (loss)/earnings per share attributable to The New York Times Company common stockholders:
|
|||||||||||||||||||||
|
(Loss)/income from continuing operations
|
$
|
(0.27
|
)
|
$
|
0.71
|
|
$
|
0.01
|
|
$
|
(0.46
|
)
|
$
|
0.61
|
|
||||||
|
Discontinued operations, net of income taxes
|
0.00
|
|
0.00
|
|
0.13
|
|
0.06
|
|
0.84
|
|
|||||||||||
|
Net (loss)/income
|
$
|
(0.27
|
)
|
$
|
0.71
|
|
$
|
0.14
|
|
$
|
(0.40
|
)
|
$
|
1.45
|
|
||||||
|
Dividends per share
|
$
|
—
|
|
$
|
—
|
|
$
|
—
|
|
$
|
0.750
|
|
$
|
0.865
|
|
||||||
|
Stockholders’ equity per share
|
$
|
3.44
|
|
$
|
4.32
|
|
$
|
4.13
|
|
$
|
3.51
|
|
$
|
6.79
|
|
||||||
|
Average basic shares outstanding
|
147,190
|
|
145,636
|
|
144,188
|
|
143,777
|
|
143,889
|
|
|||||||||||
|
Average diluted shares outstanding
|
147,190
|
|
152,600
|
|
146,367
|
|
143,777
|
|
144,158
|
|
|||||||||||
|
Key Ratios
|
|||||||||||||||||||||
|
Operating profit/(loss) to revenues
|
2
|
%
|
10
|
%
|
3
|
%
|
(1
|
)%
|
6
|
%
|
|||||||||||
|
Return on average common stockholders’ equity
|
(7
|
)%
|
17
|
%
|
4
|
%
|
(8
|
)%
|
23
|
%
|
|||||||||||
|
Return on average total assets
|
(1
|
)%
|
3
|
%
|
1
|
%
|
(2
|
)%
|
6
|
%
|
|||||||||||
|
Total debt and capital lease obligations to total capitalization
|
60
|
%
|
60
|
%
|
56
|
%
|
68
|
%
|
51
|
%
|
|||||||||||
|
Current assets to current liabilities
|
1.46
|
|
1.70
|
|
1.00
|
|
0.60
|
|
0.68
|
|
|||||||||||
|
Ratio of earnings to fixed charges
(1)
|
—
|
|
2.78
|
|
—
|
|
—
|
|
3.14
|
|
|||||||||||
|
Full-Time Equivalent Employees
|
7,273
|
|
7,414
|
|
7,665
|
|
9,346
|
|
10,231
|
|
|||||||||||
|
(1)
|
In 2011, 2009 and 2008, earnings were inadequate to cover fixed charges by approximately $1 million, $16 million and $56 million, respectively, due to certain charges in each year.
|
THE NEW YORK TIMES COMPANY – P.
21
The items below are included in the Selected Financial Data.
2011
The items below had an unfavorable effect on our results of $161.9 million, or $.94 per share:
|
•
|
a $164.4 million pre-tax charge ($139.1 million after tax, or $.94 per share) for the impairment of assets, consisting of $152.1 million related to goodwill at the Regional Media Group, $9.2 million related to certain assets held for sale, primarily of Baseline, and $3.1 million related to an intangible asset at ConsumerSearch, Inc., which is part of the About Group.
|
|
•
|
a $71.2 million pre-tax gain ($41.4 million after tax, or $.28 per share) from the sales of 390 of our units in Fenway Sports Group and a portion of our interest in Indeed.com, a job listing aggregator.
|
|
•
|
a $46.4 million pre-tax charge ($27.6 million after tax, or $.19 per share) in connection with the prepayment of our $250.0 million 14.053% Notes.
|
|
•
|
a $13.6 million pre-tax charge ($8.0 million after tax, or $.05 per share) for severance costs.
|
|
•
|
a $4.5 million pre-tax charge ($2.6 million after tax, or $.02 per share) for a retirement and consulting agreement in connection with the retirement of our chief executive officer.
|
|
•
|
a $4.2 million estimated pre-tax charge ($2.7 million after tax, or $.02 per share) for a pension withdrawal obligation under a multiemployer pension plan at the Globe, whose results are included in the New England Media Group.
|
2010
The items below had an unfavorable effect on our results of $17.8 million, or $.13 per share:
|
•
|
a $16.1 million pre-tax charge ($10.1 million after tax, or $.07 per share) for the impairment of assets at the Globe’s printing facility in Billerica, Mass.
|
|
•
|
a $12.7 million pre-tax gain from the sale of an asset at one of the paper mills in which we have an investment. Our share of the pre-tax gain, after eliminating the noncontrolling interest portion, is $10.2 million ($6.4 million after tax, or $.04 per share).
|
|
•
|
an $11.4 million tax charge ($.07 per share) for the reduction in future tax benefits for retiree health benefits resulting from the federal health-care legislation enacted in 2010.
|
|
•
|
a $9.1 million pre-tax gain ($5.3 million after tax, or $.03 per share) from the sale of 50 of our units in Fenway Sports Group.
|
|
•
|
a $6.8 million pre-tax charge ($4.1 million after tax, or $.03 per share) for severance costs.
|
|
•
|
a $6.3 million pre-tax charge ($3.9 million after tax, or $.03 per share) for an adjustment to estimated pension withdrawal obligations under several multiemployer pension plans at the Globe.
|
2009
The items below had an unfavorable effect on our results of $56.3 million, or $.38 per share:
|
•
|
a $78.9 million pre-tax charge ($49.5 million after tax, or $.34 per share) for a pension withdrawal obligation under certain multiemployer pension plans primarily at the Globe.
|
|
•
|
a $54.0 million pre-tax net pension curtailment gain ($30.7 million after tax, or $.21 per share) resulting from freezing of benefits under various Company-sponsored qualified and non-qualified pension plans.
|
|
•
|
a $53.9 million pre-tax charge ($32.3 million after tax, or $.22 per share) for severance costs.
|
|
•
|
a $34.9 million pre-tax gain ($19.5 million after tax, or $.13 per share) from the sale of WQXR-FM.
|
|
•
|
a $34.6 million pre-tax charge ($20.0 million after tax, or $.13 per share) for a loss on leases ($31.1 million) and a fee ($3.5 million) for the early termination of a third-party printing contract. The lease charge included a $22.8 million charge for a loss on leases associated with the closure of City & Suburban, our retail and newsstand distribution subsidiary, and $8.3 million for office space at The New York Times Media Group.
|
P.
22
– THE NEW YORK TIMES COMPANY
|
•
|
a $9.3 million pre-tax charge ($5.3 million after tax, or $.04 per share) for a premium on the redemption of $250.0 million principal amount of our 4.5% notes, which was completed in April 2009.
|
|
•
|
a $5.2 million pre-tax gain ($3.2 million after tax, or $.02 per share) on the sale of surplus real estate assets at the Regional Media Group.
|
|
•
|
a $4.2 million pre-tax charge ($2.6 million after tax, or $.01 per share) for the impairment of assets due to the reduced scope of a systems project.
|
2008
The items below had an unfavorable effect on our results of $180.1 million, or $1.24 per share:
|
•
|
a $160.4 million pre-tax, non-cash charge ($109.3 million after tax, or $.76 per share) for the impairment of property, plant and equipment, intangible assets and goodwill at the New England Media Group.
|
|
•
|
an $81.0 million pre-tax charge ($46.2 million after tax, or $.32 per share) for severance costs.
|
|
•
|
a $19.2 million pre-tax, non-cash charge ($10.7 million after tax, or $.07 per share) for the impairment of an intangible asset at the IHT, whose results are included in The New York Times Media Group.
|
|
•
|
an $18.3 million pre-tax, non-cash charge ($10.4 million after tax, or $.07 per share) for the impairment of assets for a systems project.
|
|
•
|
a $5.6 million pre-tax, non-cash charge ($3.5 million after tax, or $.02 per share) for the impairment of our 49% ownership interest in Metro Boston.
|
2007
The items below increased net income by $18.8 million, or $.13 per share:
|
•
|
a $190.0 million pre-tax gain ($94.0 million after tax, or $.65 per share) from the sale of the Broadcast Media Group.
|
|
•
|
a $68.2 million net pre-tax loss ($41.3 million after tax, or $.29 per share) from the sale of assets, mainly our Edison, N.J., facility, which we closed in March 2008.
|
|
•
|
a $42.6 million pre-tax charge ($24.4 million after tax, or $.17 per share) for accelerated depreciation of certain assets at the Edison, N.J., facility.
|
|
•
|
a $39.6 million pre-tax gain ($21.2 million after tax, or $.15 per share) from the sale of WQEW-AM.
|
|
•
|
a $35.4 million pre-tax charge ($20.2 million after tax, or $.14 per share) for severance costs.
|
|
•
|
an $11.0 million pre-tax, non-cash charge ($6.4 million after tax, or $.04 per share) for the impairment of an intangible asset at the T&G, whose results are included in the New England Media Group.
|
|
•
|
a $7.1 million pre-tax, non-cash charge ($4.1 million after tax, or $.03 per share) for the impairment of our 49% ownership interest in Metro Boston.
|
THE NEW YORK TIMES COMPANY – P.
23
|
|
The following discussion and analysis provides information that management believes is relevant to an assessment and understanding of our consolidated financial condition as of
December 25, 2011
, and results of operations for the three years ended
December 25, 2011
. This item should be read in conjunction with our Consolidated Financial Statements and the related Notes included in this Annual Report.
EXECUTIVE OVERVIEW
We are a leading global, multimedia news and information company that currently includes newspapers, digital businesses, investments in paper mills and other investments. We classify our businesses based on our operating strategies into two reportable segments, the News Media Group and the About Group.
The News Media Group consists of the following divisions:
|
•
|
The New York Times Media Group, which includes The Times, the IHT, NYTimes.com and related businesses;
|
|
•
|
the New England Media Group, which includes the Globe, BostonGlobe.com, Boston.com, the T&G, Telegram.com and related businesses; and
|
|
•
|
the Regional Media Group, which included 16 regional newspapers, other print publications and related businesses in Alabama, California, Florida, Louisiana, North Carolina and South Carolina. On January 6, 2012, we completed the sale of the Regional Media Group to Halifax Media Holdings LLC for $143.0 million in cash, subject to certain adjustments.
|
The About Group consists of About.com, ConsumerSearch.com and CalorieCount.com and related businesses. In February 2011, we sold UCompareHealthCare.com.
Our revenues were $2.3 billion in
2011
. The percentage of revenues contributed by division is below.
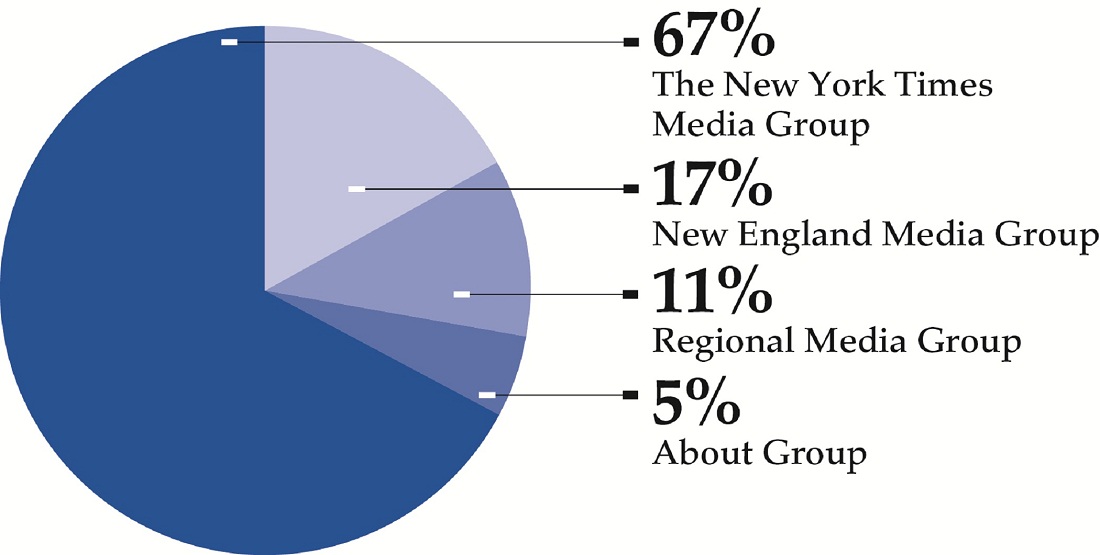
News Media Group
The News Media Group generates revenues principally from advertising and circulation. Other revenues primarily consist of revenues from news services/syndication, commercial printing, rental income, digital archives and direct mail advertising services. The News Media Group’s main operating costs are employee-related costs and raw materials, primarily newsprint.
News Media Group revenues in
2011
by category and percentage share are below.

P.
24
– THE NEW YORK TIMES COMPANY
About Group
The About Group generates revenues through cost-per-click advertising (sponsored links for which the About Group is paid when a user clicks on the ad), display advertising and e-commerce (including sales lead generation). Almost all of its revenues (95% in
2011
) are derived from the sale of cost-per-click and display advertising. Cost-per-click advertising accounted for 56% of the About Group’s total advertising revenues in
2011
. The About Group’s main operating costs are employee-related costs and content and hosting costs.
Joint Ventures
Our investments accounted for under the equity method are as follows:
|
•
|
a 49% interest in Metro Boston, which publishes a free daily newspaper in the greater Boston area;
|
|
•
|
a 49% interest in a Canadian newsprint company, Malbaie;
|
|
•
|
a 40% interest in a partnership, Madison, operating a supercalendered paper mill in Maine;
|
|
•
|
a 25% interest in quadrantONE, an online advertising network that sells bundled premium, targeted display advertising onto local newspaper and other Web sites; and
|
|
•
|
a 4.97% interest in Fenway Sports Group, which owns the Boston Red Sox baseball club; Liverpool Football Club (a soccer team in the English Premier League); approximately 80% of New England Sports Network (a regional cable sports network); and 50% of Roush Fenway Racing (a leading NASCAR team). We sold 390 of our units in Fenway Sports Group in July 2011 and 100 units in February 2012. We continue to explore the sale of our remaining 210 units in Fenway Sports Group, in whole or in parts.
|
Business Environment
We believe that a number of factors and industry trends have had, and will continue to have, an adverse effect on our business and prospects. These include the following:
Economic conditions
The business environment in
2011
remained challenging due in large part to the slow economic recovery in the United States and uncertain global conditions. Advertising spending, which drives a significant portion of our revenues, is susceptible to economic conditions. The level of advertising sales in any period may be affected by advertisers’ decisions to increase or decrease their advertising expenditures in response to anticipated consumer demand and general economic conditions. In
2011
, advertisers continued to exercise caution in response to uneven economic conditions and lingering uncertainty about the economic outlook. The challenging advertising marketplace contributed to declines in print advertising revenues and moderating growth trends in digital advertising revenues at the News Media Group in
2011
compared with
2010
. Weak national and local economic conditions, particularly in the New York City and Boston metropolitan regions, affect the levels of our national, classified and retail advertising revenues. Changes in spending patterns and priorities, including shifts in marketing strategies and budget cuts of key advertisers, in response to weak and uneven economic conditions, have depressed and may continue to depress our advertising revenues.
Secular shift to digital media choices
The competition for advertising revenues in various markets has intensified as a result of the continued development of digital media technologies. We expect that technological developments will continue to favor digital media choices, adding to the challenges posed by audience fragmentation.
We have expanded and will continue to expand our digital offerings; however, a significant portion of our revenues are currently from traditional print products where advertising revenues are declining. We believe that the shift from traditional media forms to a growing number of digital media choices and changing consumer behavior have contributed to, and is likely to continue to contribute to, a decline in print advertising. The digital advertising marketplace has experienced significant downward pressure on advertising rates as a result of significant increases in inventory. In addition, search technology has continued to improve the organization of and access to a broad range of Web sites and online information, reshaping consumer behavior and expectations for consuming news and information. As economic conditions and the advertising environment remain challenged, media companies have been re-evaluating their business models, with some moving toward various forms of digital pay models that will depend on greater market acceptance and a shift in consumer attitudes.
THE NEW YORK TIMES COMPANY – P.
25
Circulation
Circulation is another significant source of revenue for us and an increasingly important driver as the overall composition of our revenues is shifting in response to the transformations in our industry. Circulation revenues are affected by circulation and readership levels. In recent years, our newspaper properties, and the newspaper industry as a whole, have experienced declining print circulation volume. This is due to, among other factors, increased competition from digital platforms and sources other than traditional newspapers (often free to users), declining discretionary spending by consumers, higher subscription and single-copy rates and a growing preference among some consumers for receiving their news from a variety of sources.
Costs
A significant portion of our costs are fixed, and therefore we are limited in our ability to reduce them in the short term. Our most significant costs are employee-related costs and raw materials, which together accounted for approximately 50% of our total operating costs in
2011
. Changes in employee-related costs and the price and availability of newsprint can materially affect our operating results.
For a discussion of these and other factors that could affect our results of operations and financial condition, see “Forward-Looking Statements” and “Item 1A — Risk Factors.”
Our Strategy
Our results in
2011
reflect our ability to manage the business during a period of transformation for our industry and amidst weak and uneven economic conditions. We anticipate that the challenges we currently face will continue, and we believe that the following elements are key to our efforts to address them.
Diversifying our revenue streams and strengthening our digital businesses
As the advertising marketplace has changed, we have focused on diversifying our revenue streams and strengthening our digital businesses to make us less susceptible to the inevitable economic cycles and to respond to the secular changes in our industry.
Our digital businesses provide meaningful diversification during our transition to becoming an increasingly multiplatform company. Our goal is to grow our digital businesses by broadening our audiences, deepening engagement and further monetizing the usage of our Web sites and across other digital platforms. We are pursuing a multiplatform strategy across our Company with new digital products and platforms, such as mobile, social media networks and reader application products.
During
2011
, we launched digital subscriptions at The Times, the IHT and the Globe, with the intention of developing a new consumer revenue stream, while preserving our robust digital advertising business. Overall circulation revenues increased in
2011
compared with
2010
as the addition of digital subscription offerings at The Times offset a decline in print copies sold across the News Media Group. In addition, the rate of home-delivery circulation volume declines moderated at The Times due to an increase in new orders and improved retention rates following the launch of digital subscriptions at The Times, as print subscribers receive all-digital access for free. As our news and content are being featured in an increasingly broad range of platforms and devices, we will continue to examine our circulation pricing and pay models in coordination with our overall multiplatform strategy, and to focus on building on our digital subscriber base and strengthening our digital businesses.
Building on the strength of our brands
Because of our high-quality journalism and content, we believe we have very powerful and trusted brands that attract educated, affluent and influential audiences. As we continued to face weak and uneven economic conditions in
2011
and an increasingly fragmented media landscape, we focused on building on the strength of our brands, particularly The Times. We have significantly expanded our presence on new digital platforms, broadened our journalism and content and added new tools and multimedia features across our properties to increase the engagement of our users. We are also focused on continuing to offer a premier environment for integrated brand advertising across platforms through advertising product innovation and our integrated print and digital sales structure.
In
2011
, the Globe’s digital strategy focused on the development of two distinct online brands to better serve the distinct audiences of the Globe and Boston.com and a wide array of advertisers. In September 2011, the Globe launched a new paid subscription site, BostonGlobe.com, which offers exclusive access to the full range and depth of
P.
26
– THE NEW YORK TIMES COMPANY
content produced by the newspaper’s journalists, in a format optimized for reading on a tablet, smartphone, laptop and desktop. This new site complements Boston.com, a Web site that previously offered all Globe content and has now been enhanced as a community portal for the greater Boston area.
The initial digital subscription numbers and the growth in digital advertising revenues at the News Media Group in
2011
reaffirm that advertisers and readers are embracing our high-quality content across multiple platforms and underscore the value users place on our brands. Regardless of the distribution model of news and information, we remain committed to creating quality content and a quality user experience.
Managing our expenses
Over the past few years as we transform and rebalance our business for the evolving media landscape, we have focused on realigning our cost base to ensure that we are operating our businesses as efficiently as possible, while maintaining our commitment to investing in high-quality content and achieving our long-term strategy. In
2011
, we remained disciplined in our approach toward costs and focused on realigning our work force, even as we invested in new business models and other digital initiatives. We reduced our operating costs by approximately $43 million in
2011
and more than $890 million since
2006
. In
2012
, we expect costs to increase modestly for the first time in several years. We plan to prudently increase spending in
2012
as we continue to invest in our digital capabilities and subscription acquisition efforts, invest in the About Group’s sales and marketing efforts and reset our variable compensation targets, even as we expect expense savings in our production and distribution operations and from further leveraging our centralized processes and resources. Managing expenses will remain a priority and we will continue to identify operational efficiencies across our organization, such as in our production and distribution operations and from further leveraging centralized processes and resources, and to respond to the ongoing secular changes in our industry.
Rebalancing our portfolio of businesses
Over the past several years, we have been rebalancing our portfolio of businesses, focusing more on growth areas, such as digital. We have focused on investing in our expanding digital operations, including our new business models and other digital initiatives.
We also continuously evaluate our businesses to determine whether they are meeting our targets for financial performance, growth and return on investment and whether they remain relevant to our strategy and align with our core purpose to enhance society by creating, collecting and distributing high-quality news, information and entertainment. During
2011
, we sold Baseline and UCompareHealthCare.com. Over the past two years, we have sold almost three-quarters of our initial investment in Fenway Sports Group and we continue to market our remaining 210 units.
On January 6, 2012, we sold the Regional Media Group for $143.0 million in cash, subject to certain adjustments. The sale of our Regional Media Group will enable us to continue our transformation to a digitally focused multimedia news and information company.
Improving our liquidity
We have continued to manage our liquidity position by improving our financial flexibility and our debt profile.
Over the past two years, we have taken decisive steps to strengthen our liquidity position. With our strong cash flows from operations, along with proceeds from the sale of a portion of our interest in Fenway Sports Group and a $225.0 million private debt offering in November 2010, we prepaid all $250.0 million aggregate principal amount of our 14.053% senior unsecured notes due January 15, 2015 (“14.053% Notes”) on August 15, 2011. Eliminating this high-interest debt from our balance sheet more than three years ahead of maturity has increased our financial flexibility, and we expect interest expense savings of more than $39 million annually over the next three years.
At the end of
2011
, we had cash, cash equivalents and short-term investments of approximately $280 million, even after prepaying the 14.053% Notes and making pension contributions totaling approximately $151 million during the year. Our cash position further improved after the end of
2011
with the proceeds from the sale of the Regional Media Group in January 2012 and the sale of 100 of our units in Fenway Sports Group in February 2012. Our main priorities for cash in
2012
will be managing the underfunded levels of our pension plans and paying off our $75.0 million aggregate principal amount of 4.610% senior notes due in September 2012.
As of
December 25, 2011
, we had total debt and capital lease obligations of approximately $773 million and total
THE NEW YORK TIMES COMPANY – P.
27
debt and capital lease obligations, net of cash, cash equivalents and short-term investments, or “net debt,” of approximately $493 million. We believe “net debt” provides a useful measure of our liquidity and overall debt position. We have reduced our net debt by approximately $104 million as of the end of
2011
from $597 million at the end of
2010
. As of
December 26, 2010
, we had total debt and capital lease obligations of approximately $996 million and cash, cash equivalents and short-term investments of approximately $399 million.
By prepaying the 14.053% Notes more than three years ahead of maturity, we have improved our debt profile and the majority of our debt matures in 2015 or later. In addition, in June 2011, we entered into a new $125.0 million asset-backed five-year revolving credit facility that replaced our $400.0 million revolving credit facility. As of
December 25, 2011
, we had no outstanding borrowings under the new credit facility. We believe our cash balance and cash provided by operations, in combination with other financing sources, will be sufficient to meet our financing needs over the next 12 months.
Managing our pension-related obligations
The funded status of our qualified defined benefit pension plans has been adversely affected by the current interest rate environment, and required contributions for our qualified pension plans can have a significant effect on future cash flows.
For purposes of GAAP, our qualified pension plans were underfunded (meaning the present value of future obligations exceeded the fair value of plan assets) as of
December 25, 2011
, by approximately $522 million, compared with approximately $442 million as of
December 26, 2010
. The funded status of these pension plans was negatively affected primarily by the decline in interest rates in
2011
. We expect to fund the majority of the shortfall over the next four to five years, although the balance could fluctuate significantly depending on interest rate movements and asset performance.
We made contributions totaling approximately $151 million in
2011
to certain qualified pension plans, including $31 million in contractual obligations to The New York Times Newspaper Guild pension plan. We have addressed our minimum funding requirements for
2011
and a significant portion for
2012
through discretionary contributions. In connection with the sale of the Regional Media Group, we will continue to retain pension assets and liabilities and postretirement obligations related to the Regional Media Group’s employees. We expect to make mandatory contributions, primarily contractual contributions in connection with The New York Times Newspaper Guild pension plan, of approximately $45 million in
2012
and we may make discretionary contributions in
2012
to our Company-sponsored qualified pension plans depending on cash flows, pension asset performance, interest rates and other factors.
We have taken a number of other steps to manage our pension-related obligations. In the last two years, we have frozen accruals under certain qualified defined benefit pension plans that cover the majority of our employees, including our non-union pension plan and certain qualified pension plans in connection with collective bargaining agreements. For such frozen pension plans, any actuarial gains and losses from interest rate changes and asset performance are amortized over a longer period of time. As a result, we do not expect that such changes will have a significant impact on pension expense in
2012
relative to
2011
.
We also remain focused on managing our multiemployer pension plans. Certain of our cost management efforts have created significant withdrawal obligations under the multiemployer pension plans in which we participate, such as the liability assessed against us in 2009 in connection with amendments to various collective bargaining agreements affecting certain multiemployer pension plans. However, we believe these withdrawals are an important step to address pension obligations that we projected could otherwise have continued to grow over time.
P.
28
– THE NEW YORK TIMES COMPANY
Outlook
We remain in a challenging business environment, reflecting continuing uncertainty in economic conditions, and an increasingly competitive landscape. Advertising revenues continue to be affected by the slow economic recovery and visibility remains limited.
To date in the first quarter of 2012, digital advertising at the News Media Group is trending below the level of the fourth quarter of 2011. Thus, for the overall Company we expect total advertising revenue trends for the first quarter of 2012 to be slightly below the level of the fourth quarter of 2011.
Total circulation revenues are projected to increase in the high-single digits in the first quarter of
2012
as we expect to benefit from our digital subscription initiatives, as well as from the print circulation price increase at The Times implemented in the first quarter of 2012.
We expect operating costs to increase in the low-single digits in the first quarter of
2012
.
In addition, we expect the following on a pre-tax basis in
2012
:
|
•
|
Depreciation and amortization: $105 to $110 million, which includes approximately $7 million of accelerated depreciation, primarily in the first quarter, associated with the consolidation of most of the T&G’s printing into the Globe’s facility in Boston, Mass., beginning in the second quarter of 2012,
|
|
•
|
Interest expense, net: $60 to $65 million,
|
|
•
|
Capital expenditures: $50 to $60 million, and
|
|
•
|
Results from joint ventures: $8 to $10 million. Effective with the sale of 100 of our units in Fenway Sports Group in February 2012, given our reduced ownership level and lack of influence on the operations of Fenway Sports Group, we will change the accounting for our investment from the equity method to the cost method. Therefore, we will no longer recognize our proportionate share of the operating results of Fenway Sports Group in “Income from joint ventures” in our Consolidated Statements of Operations.
|
THE NEW YORK TIMES COMPANY – P.
29
RESULTS OF OPERATIONS
Overview
The following table presents our consolidated financial results:
|
December 25,
2011 |
|
December 26,
2010 |
|
December 27,
2009 |
|
% Change
|
||||||||||||
|
(In thousands)
|
11-10
|
|
10-09
|
|
||||||||||||||
|
Revenues
|
||||||||||||||||||
|
Advertising
|
$
|
1,221,497
|
|
$
|
1,300,361
|
|
$
|
1,336,291
|
|
(6.1
|
)
|
(2.7
|
)
|
|||||
|
Circulation
|
941,468
|
|
931,493
|
|
936,486
|
|
1.1
|
|
(0.5
|
)
|
||||||||
|
Other
|
160,436
|
|
161,609
|
|
167,662
|
|
(0.7
|
)
|
(3.6
|
)
|
||||||||
|
Total
|
2,323,401
|
|
2,393,463
|
|
2,440,439
|
|
(2.9
|
)
|
(1.9
|
)
|
||||||||
|
Operating costs
|
||||||||||||||||||
|
Production costs:
|
||||||||||||||||||
|
Raw materials
|
161,691
|
|
160,422
|
|
166,387
|
|
0.8
|
|
(3.6
|
)
|
||||||||
|
Wages and benefits
|
495,607
|
|
498,270
|
|
524,782
|
|
(0.5
|
)
|
(5.1
|
)
|
||||||||
|
Other
|
300,169
|
|
303,086
|
|
330,061
|
|
(1.0
|
)
|
(8.2
|
)
|
||||||||
|
Total production costs
|
957,467
|
|
961,778
|
|
1,021,230
|
|
(0.4
|
)
|
(5.8
|
)
|
||||||||
|
Selling, general and administrative costs
|
1,019,611
|
|
1,054,199
|
|
1,152,874
|
|
(3.3
|
)
|
(8.6
|
)
|
||||||||
|
Depreciation and amortization
|
116,454
|
|
120,950
|
|
133,696
|
|
(3.7
|
)
|
(9.5
|
)
|
||||||||
|
Total operating costs
|
2,093,532
|
|
2,136,927
|
|
2,307,800
|
|
(2.0
|
)
|
(7.4
|
)
|
||||||||
|
Impairment of assets
|
164,434
|
|
16,148
|
|
4,179
|
|
*
|
|
*
|
|
||||||||
|
Pension withdrawal expense
|
4,228
|
|
6,268
|
|
78,931
|
|
(32.5
|
)
|
(92.1
|
)
|
||||||||
|
Loss on leases and other expenses
|
4,500
|
|
—
|
|
34,633
|
|
N/A
|
|
N/A
|
|
||||||||
|
Net pension curtailment gain
|
—
|
|
—
|
|
53,965
|
|
N/A
|
|
N/A
|
|
||||||||
|
Gain on sale of assets
|
—
|
|
—
|
|
5,198
|
|
N/A
|
|
N/A
|
|
||||||||
|
Operating profit
|
56,707
|
|
234,120
|
|
74,059
|
|
(75.8
|
)
|
*
|
|
||||||||
|
Gain on sale of investments
|
71,171
|
|
9,128
|
|
—
|
|
*
|
|
N/A
|
|
||||||||
|
Income from joint ventures
|
28
|
|
19,035
|
|
20,667
|
|
(99.9
|
)
|
(7.9
|
)
|
||||||||
|
Premium on debt redemptions
|
46,381
|
|
—
|
|
9,250
|
|
N/A
|
|
N/A
|
|
||||||||
|
Interest expense, net
|
85,243
|
|
85,062
|
|
81,701
|
|
0.2
|
|
4.1
|
|
||||||||
|
(Loss)/income from continuing operations before income taxes
|
(3,718
|
)
|
177,221
|
|
3,775
|
|
*
|
|
*
|
|
||||||||
|
Income tax expense
|
36,506
|
|
68,516
|
|
2,206
|
|
(46.7
|
)
|
*
|
|
||||||||
|
(Loss)/income from continuing operations
|
(40,224
|
)
|
108,705
|
|
1,569
|
|
*
|
|
*
|
|
||||||||
|
Discontinued operations:
|
|
|
|
|
||||||||||||||
|
Loss from discontinued operations, net of income taxes
|
—
|
|
—
|
|
(1,156
|
)
|
N/A
|
|
N/A
|
|
||||||||
|
Gain on sale, net of income taxes
|
—
|
|
13
|
|
19,488
|
|
N/A
|
|
(99.9
|
)
|
||||||||
|
Income from discontinued operations, net of income taxes
|
—
|
|
13
|
|
18,332
|
|
N/A
|
|
(99.9
|
)
|
||||||||
|
Net (loss)/income
|
(40,224
|
)
|
108,718
|
|
19,901
|
|
*
|
|
*
|
|
||||||||
|
Net loss/(income) attributable to the noncontrolling interest
|
555
|
|
(1,014
|
)
|
(10
|
)
|
*
|
|
*
|
|
||||||||
|
Net (loss)/income attributable to The New York Times Company common stockholders
|
$
|
(39,669
|
)
|
$
|
107,704
|
|
$
|
19,891
|
|
*
|
|
*
|
|
|||||
* Represents an increase or decrease in excess of 100%.
P.
30
– THE NEW YORK TIMES COMPANY
Revenues
Revenues by reportable segment and for the Company as a whole were as follows:
|
|
December 25,
2011 |
|
December 26,
2010 |
|
December 27,
2009 |
|
% Change
|
|||||||||||
|
(In thousands)
|
11-10
|
|
10-09
|
|
||||||||||||||
|
News Media Group
|
$
|
2,212,575
|
|
$
|
2,257,386
|
|
$
|
2,319,378
|
|
(2.0
|
)
|
(2.7
|
)
|
|||||
|
About Group
|
110,826
|
|
136,077
|
|
121,061
|
|
(18.6
|
)
|
12.4
|
|
||||||||
|
Total revenues
|
$
|
2,323,401
|
|
$
|
2,393,463
|
|
$
|
2,440,439
|
|
(2.9
|
)
|
(1.9
|
)
|
|||||
News Media Group
Advertising, circulation and other revenues by division of the News Media Group and for the Group as a whole were as follows:
|
|
December 25,
2011 |
|
December 26,
2010 |
|
December 27,
2009 |
|
% Change
|
|||||||||||
|
(In thousands)
|
11-10
|
|
10-09
|
|
||||||||||||||
|
The New York Times Media Group
|
||||||||||||||||||
|
Advertising
|
$
|
756,148
|
|
$
|
780,424
|
|
$
|
797,298
|
|
(3.1
|
)
|
(2.1
|
)
|
|||||
|
Circulation
|
705,163
|
|
683,717
|
|
683,445
|
|
3.1
|
|
—
|
|
||||||||
|
Other
|
93,263
|
|
92,697
|
|
101,118
|
|
0.6
|
|
(8.3
|
)
|
||||||||
|
Total
|
$
|
1,554,574
|
|
$
|
1,556,838
|
|
$
|
1,581,861
|
|
(0.1
|
)
|
(1.6
|
)
|
|||||
|
New England Media Group
|
||||||||||||||||||
|
Advertising
|
$
|
198,383
|
|
$
|
213,720
|
|
$
|
230,886
|
|
(7.2
|
)
|
(7.4
|
)
|
|||||
|
Circulation
|
157,819
|
|
167,360
|
|
167,998
|
|
(5.7
|
)
|
(0.4
|
)
|
||||||||
|
Other
|
41,854
|
|
42,809
|
|
41,710
|
|
(2.2
|
)
|
2.6
|
|
||||||||
|
Total
|
$
|
398,056
|
|
$
|
423,889
|
|
$
|
440,594
|
|
(6.1
|
)
|
(3.8
|
)
|
|||||
|
Regional Media Group
|
||||||||||||||||||
|
Advertising
|
$
|
161,831
|
|
$
|
177,056
|
|
$
|
192,924
|
|
(8.6
|
)
|
(8.2
|
)
|
|||||
|
Circulation
|
78,486
|
|
80,416
|
|
85,043
|
|
(2.4
|
)
|
(5.4
|
)
|
||||||||
|
Other
|
19,628
|
|
19,187
|
|
18,956
|
|
2.3
|
|
1.2
|
|
||||||||
|
Total
|
$
|
259,945
|
|
$
|
276,659
|
|
$
|
296,923
|
|
(6.0
|
)
|
(6.8
|
)
|
|||||
|
Total News Media Group
|
||||||||||||||||||
|
Advertising
|
$
|
1,116,362
|
|
$
|
1,171,200
|
|
$
|
1,221,108
|
|
(4.7
|
)
|
(4.1
|
)
|
|||||
|
Circulation
|
941,468
|
|
931,493
|
|
936,486
|
|
1.1
|
|
(0.5
|
)
|
||||||||
|
Other
|
154,745
|
|
154,693
|
|
161,784
|
|
0.0
|
|
(4.4
|
)
|
||||||||
|
Total
|
$
|
2,212,575
|
|
$
|
2,257,386
|
|
$
|
2,319,378
|
|
(2.0
|
)
|
(2.7
|
)
|
|||||
Advertising Revenues
Advertising revenues are primarily determined by the volume, rate and mix of advertisements. Advertising spending, which drives a significant portion of revenues, is susceptible to economic conditions and the ongoing transformation in our industry. During 2011, the advertising marketplace remained challenging as advertisers continued to exercise caution in response to uneven economic conditions and lingering uncertainty about the outlook for the global economy. Changes in spending patterns and priorities, including shifts in marketing strategies and budget cuts of key advertisers in response to uneven economic conditions and alternative digital advertising platforms, contributed to the decline in print advertising revenues and the growth in digital advertising revenues. Total advertising revenue trends were slightly lower in 2011 compared with 2010 as the rate of decline in print advertising revenues was similar to the prior year, while the rate of growth in digital advertising revenues moderated.
THE NEW YORK TIMES COMPANY – P.
31
In 2011, News Media Group advertising revenues decreased primarily due to lower print volume across all advertising categories, offset in part by growth in digital advertising revenues. Print advertising revenues, which represented approximately 79% of total advertising revenues for the News Media Group, declined 7.9% in 2011, led by weakness in national and retail advertising. Digital advertising revenues grew 10.0% in 2011, primarily due to growth in national display advertising.
In 2010, News Media Group advertising revenues decreased primarily due to lower print volume across most advertising categories, offset in part by higher digital advertising revenues. Print advertising revenues, which represented approximately 82% of total advertising revenues for the News Media Group, declined 7.9% in 2010, mainly due to lower national and retail advertising. The rate of decline in print advertising revenues began to moderate in 2010 compared with 2009 as encouraging signs of improvement were seen in the overall economy. Digital advertising revenues grew 18.3% in 2010, mainly driven by growth in national display advertising.
Advertising revenues (print and digital) by category for the News Media Group were as follows:
|
|
December 25,
2011 |
|
December 26,
2010 |
|
December 27,
2009 |
|
% Change
|
|||||||||||
|
(In thousands)
|
11-10
|
|
10-09
|
|
||||||||||||||
|
National
|
$
|
647,356
|
|
$
|
664,377
|
|
$
|
667,732
|
|
(2.6
|
)
|
(0.5
|
)
|
|||||
|
Retail
|
257,115
|
|
277,196
|
|
301,075
|
|
(7.2
|
)
|
(7.9
|
)
|
||||||||
|
Classified
|
173,829
|
|
190,911
|
|
213,823
|
|
(8.9
|
)
|
(10.7
|
)
|
||||||||
|
Other
|
38,062
|
|
38,716
|
|
38,478
|
|
(1.7
|
)
|
0.6
|
|
||||||||
|
Total
|
$
|
1,116,362
|
|
$
|
1,171,200
|
|
$
|
1,221,108
|
|
(4.7
|
)
|
(4.1
|
)
|
|||||
Below is a percentage breakdown of 2011 advertising revenues by division:
|
|
National
|
Retail
and
Preprint
|
Classified
|
Total
Classified
|
Other
Advertising
Revenues
|
Total
|
||||||||||||
|
|
Help
Wanted
|
Real
Estate
|
Auto
|
Other
|
||||||||||||||
|
The New York Times Media Group
|
77
|
%
|
13
|
%
|
2
|
%
|
4
|
%
|
1
|
%
|
2
|
%
|
9
|
%
|
1
|
%
|
100
|
%
|
|
New England Media Group
|
30
|
|
32
|
|
5
|
|
6
|
|
9
|
|
8
|
|
28
|
|
10
|
|
100
|
|
|
Regional Media Group
|
5
|
|
60
|
|
5
|
|
6
|
|
8
|
|
9
|
|
28
|
|
7
|
|
100
|
|
|
Total News Media Group
|
58
|
|
23
|
|
3
|
|
5
|
|
3
|
|
4
|
|
15
|
|
4
|
|
100
|
|
The New York Times Media Group
Total advertising revenues declined in 2011 compared with 2010 due to lower print advertising revenues, offset in part by growth in digital advertising revenues. Print advertising revenues were negatively affected by the declines in the volume of spending in all advertising categories reflecting the continued uneven economic environment, global events and secular forces. Growth in digital advertising revenues was driven by increased spending on digital platforms, primarily in the national display category.
While total national, classified and retail advertising revenues declined, total classified advertising revenue trends improved as the rate of decline moderated in 2011 compared with 2010. The continued uneven economic conditions and secular changes in our industry contributed to lower advertising revenues in 2011 compared with 2010. Total national advertising revenues decreased led by declines in the travel, corporate and financial services categories offset in part by gains in the luxury and technology categories. The declines in total classified advertising revenues were primarily in the real estate and automotive categories. Total retail advertising revenues declined as advertisers reduced spending in the face of the uncertain economic climate primarily in the mass market, home furnishings and department stores advertising categories.
Total advertising revenues declined in 2010 compared with 2009 due to lower print advertising revenues, particularly in the national and classified advertising categories, offset in part by strong growth in digital advertising revenues. Print advertising revenues were negatively affected by the declines in the volume of spending in most advertising categories reflecting the uneven economic recovery during 2010. Increased spending on digital platforms, particularly in national display advertising, contributed to the strong growth in digital advertising revenues.
P.
32
– THE NEW YORK TIMES COMPANY
While total classified, retail and national advertising revenues declined, the advertising revenue trends improved in all categories in 2010 as the rates of decline moderated compared with 2009. Total classified advertising revenues declined in 2010 compared with 2009 as the soft economic environment and secular changes in our industry contributed to declines in the real estate, automotive and help-wanted categories. Total retail advertising revenues decreased in 2010 compared with the prior year as soft economic conditions throughout 2010 negatively affected retail advertising. While retail advertising experienced declines in the first three quarters of 2010 compared with the respective periods in 2009, both digital and print retail advertising revenues grew in the fourth quarter of 2010 compared with the fourth quarter of 2009 mainly as advertisers responded to increased consumer spending. Total national advertising revenues decreased in 2010 compared with the prior year, led by declines in the studio entertainment and telecommunications categories, offset in part by gains in the luxury and corporate categories.
New England Media Group
Total advertising revenues declined in 2011 compared with 2010 due to declines in print advertising revenues, partially offset by growth in digital advertising revenues. The decline in print advertising revenues was driven by lower advertising in all categories, reflecting uncertain national and local economic conditions and secular forces in our industry. The increase in digital advertising revenues was due to higher spending in the national and automotive classified categories.
While total retail, national and classified advertising revenues declined, an improvement was seen in the retail advertising revenue trend as the rate of decline moderated in 2011 compared with 2010. The uncertain national and local economic conditions continued to negatively affect total retail advertising revenues, as retailers cut the volume of spending mainly in the department stores and home furnishings categories in 2011 compared with 2010. The uneven economic environment coupled with secular changes in our industry contributed to declines in total national advertising revenues led by lower advertiser spending in the financial services, telecommunications and studio entertainment categories in 2011 compared with 2010. These factors also adversely affected total classified advertising revenues in 2011 compared with 2010, primarily in the real estate category.
Total advertising revenues declined in 2010 compared with 2009 mainly due to declines in print advertising revenues, partially offset by growth in digital advertising revenues. The decline in print advertising revenues was driven by lower advertising in most categories, reflecting challenging market conditions in the national and local economy and exacerbated by the secular shifts to digital advertising. The increase in digital advertising revenues was mainly due to higher national advertising spending.
While total retail, national and classified advertising revenues declined, advertising revenue trends improved in all categories in 2010 as the rates of decline moderated compared with 2009. Advertisers cut the level of total retail advertising spending in response to soft national and local economic conditions during 2010 compared with 2009, mainly in the department stores category. Similar factors contributed to the declines in total national advertising revenues in 2010 compared with 2009 led by reduced spending in the telecommunications and bank advertising categories. These factors also adversely affected total classified advertising revenues in 2010 compared with 2009, primarily in the real estate and automotive categories.
Regional Media Group
Total advertising revenues declined in 2011 compared with 2010 due to declines in print advertising revenues, partially offset by growth in digital advertising revenues. The decline in print advertising revenues was driven by lower advertising in all categories, reflecting uncertain local and national economic conditions, secular forces in our industry and regional events. The increase in digital advertising revenues was led by higher spending in the retail advertising category.
While total retail, classified and national advertising revenues declined, advertising revenue trends improved as the rates of decline in total retail and classified advertising revenues moderated in 2011 compared with 2010. Uneven local and national economic conditions continued to weigh on the retail sector, as advertisers reduced their volume of spending in 2011 compared with 2010. Total classified advertising revenues experienced declines in 2011 compared with 2010, primarily in the real estate and automotive categories, as economic conditions and secular changes occurring in our industry continued to have a negative impact. Total national advertising revenues declined in 2011 compared with 2010 mainly due to challenging comparisons with 2010 when there was higher spending related to the Gulf oil spill.
THE NEW YORK TIMES COMPANY – P.
33
Total advertising revenues declined in 2010 compared with 2009 due to lower print advertising revenues, partially offset by growth in digital advertising revenues. The decline in print advertising revenues was driven by lower advertising in most categories, reflecting soft local and national economic conditions, secular forces in our industry and regional events. The increase in digital advertising revenues was led by higher spending in the national advertising category.
Total retail and classified advertising revenues declined in 2010 compared with 2009, offset in part by higher total national advertising revenues. Total advertising revenue trends improved in 2010 in all categories as the rates of decline moderated compared with 2009. Soft local and national economic conditions adversely impacted the volume of advertising spending in the retail sector and resulted in declines in total retail advertising revenues in 2010 compared with 2009. Total classified advertising revenues decreased in 2010 compared with 2009, primarily in the real estate category, mainly as a result of the soft economic conditions in the Florida and California housing markets. These declines were offset in part by higher total national advertising revenues in 2010 primarily related to the Gulf oil spill.
Circulation Revenues
Circulation revenues are based on the number of copies of the printed newspaper (through home-delivery subscriptions and single-copy sales) and digital subscriptions sold and the rates charged to the respective customers. Total circulation revenues consist of revenues from our print and digital products, including The Times digital subscription packages on NYTimes.com and across other digital platforms beginning in the second quarter of 2011, as well as our new pay site, BostonGlobe.com, and digital subscription packages at the IHT in the fourth quarter of 2011.
Circulation revenues in 2011 increased compared with 2010 as the addition of digital subscription offerings primarily at The Times offset a decline in print copies sold across the News Media Group. In addition, during 2011, the rate of home-delivery circulation volume declines moderated at The Times, as we observed an increase in new home-delivery orders and improved retention rates following the launch of The Times digital subscriptions as print subscribers receive all-digital access for free.
Circulation revenues in 2010 were flat compared with 2009 primarily as declines in copies sold across the News Media Group offset the subscription and newsstand price increases implemented by both The Times and the Globe in the second quarter of 2009.
Other Revenues
Other revenues consist primarily of revenues from news services/syndication, commercial printing, rental income, digital archives and direct mail advertising services.
Other revenues for the News Media Group were flat in 2011 compared with 2010.
Other revenues for the News Media Group decreased in 2010 compared with 2009 primarily because of lower digital archives and commercial printing revenues.
About Group
About Group revenues decreased in 2011 compared with 2010 primarily due to lower cost-per-click and display advertising. The declines in cost-per-click advertising revenues were primarily due to lower click-through rates and page views. Design changes in cost-per-click advertisements served by Google, which were implemented in July 2010, continued to have a negative impact on click-through rates during the first half of 2011. After cycling through those design changes, click-through rates continued to experience downward pressure through the fourth quarter of 2011 and advertising rates for cost-per-click advertising began to decline in the fourth quarter in line with the marketplace. In addition, the increased competition in the content space and the algorithm changes Google implemented during the first quarter of 2011 contributed to the declines in page views experienced during most of 2011. In the fourth quarter of 2011, monthly page views increased compared with 2010. Lower display advertising revenues mainly resulted from competitive marketplace pressures as well as uneven economic conditions during 2011. In the second half of 2011, the About Group implemented a plan to better leverage the site’s reach and rebuild its sales force in order to revitalize display advertising.
About Group revenues increased in 2010 compared with 2009 primarily due to growth in display and cost-per-click advertising revenues as a result of higher click-through rates and page views. However, uneven economic conditions, as well as competitive pressures in the market, negatively impacted display advertising beginning in the fourth quarter of 2010. In addition, the design changes in cost-per-click advertisements served by Google had a negative impact on click-through rates in the second half of 2010.
P.
34
– THE NEW YORK TIMES COMPANY
Operating Costs
Operating costs were as follows:
|
|
December 25,
2011 |
|
December 26,
2010 |
|
December 27,
2009 |
|
% Change
|
|||||||||||
|
(In thousands)
|
11-10
|
|
10-09
|
|
||||||||||||||
|
Production costs:
|
||||||||||||||||||
|
Raw materials
|
$
|
161,691
|
|
$
|
160,422
|
|
$
|
166,387
|
|
0.8
|
|
(3.6
|
)
|
|||||
|
Wages and benefits
|
495,607
|
|
498,270
|
|
524,782
|
|
(0.5
|
)
|
(5.1
|
)
|
||||||||
|
Other
|
300,169
|
|
303,086
|
|
330,061
|
|
(1.0
|
)
|
(8.2
|
)
|
||||||||
|
Total production costs
|
957,467
|
|
961,778
|
|
1,021,230
|
|
(0.4
|
)
|
(5.8
|
)
|
||||||||
|
Selling, general and administrative costs
|
1,019,611
|
|
1,054,199
|
|
1,152,874
|
|
(3.3
|
)
|
(8.6
|
)
|
||||||||
|
Depreciation and amortization
|
116,454
|
|
120,950
|
|
133,696
|
|
(3.7
|
)
|
(9.5
|
)
|
||||||||
|
Total operating costs
|
$
|
2,093,532
|
|
$
|
2,136,927
|
|
$
|
2,307,800
|
|
(2.0
|
)
|
(7.4
|
)
|
|||||
The components of operating costs as a percentage of total operating costs were as follows:
|
December 25,
2011 |
|
December 26,
2010 |
|
December 27,
2009 |
|
|
|
Components of operating costs as a percentage of total operating costs
|
||||||
|
Wages and benefits
|
42
|
%
|
42
|
%
|
43
|
%
|
|
Raw materials
|
8
|
%
|
8
|
%
|
7
|
%
|
|
Other operating costs
|
45
|
%
|
44
|
%
|
44
|
%
|
|
Depreciation and amortization
|
5
|
%
|
6
|
%
|
6
|
%
|
|
Total
|
100
|
%
|
100
|
%
|
100
|
%
|
The components of operating costs as a percentage of total revenues were as follows:
|
December 25, 2011
|
|
December 26,
2010 |
|
December 27, 2009
|
|
|
|
Components of operating costs as a percentage of total revenues
|
||||||
|
Wages and benefits
|
37
|
%
|
38
|
%
|
40
|
%
|
|
Raw materials
|
7
|
%
|
7
|
%
|
7
|
%
|
|
Other operating costs
|
41
|
%
|
39
|
%
|
42
|
%
|
|
Depreciation and amortization
|
5
|
%
|
5
|
%
|
6
|
%
|
|
Total
|
90
|
%
|
89
|
%
|
95
|
%
|
Production Costs
Total production costs in 2011 decreased compared with 2010 primarily due to lower outside printing costs (approximately $5 million) and various other costs, offset by higher raw materials expense (approximately $1 million), primarily newsprint. Cost-saving initiatives primarily contributed to the declines in outside printing costs. Newsprint expense increased 1.7%, with 7.5% from higher pricing offset in part by 5.8% from lower consumption. While newsprint prices have remained stable since increasing steadily through the first half of 2010, newsprint prices were higher in the first half of 2011 compared with the same period in 2010.
Total production costs in 2010 decreased compared with 2009 primarily due to lower compensation and benefits costs (approximately $27 million) and outside printing costs (approximately $12 million), mainly reflecting the impact of a reduced workforce and cost-saving initiatives, as well as lower raw materials expense (approximately $6 million), primarily newsprint. In 2010, newsprint expense declined 6.7%, with 8.5% from lower consumption offset in part by 1.8% from higher pricing. Newsprint prices hit the bottom of the cycle in the third quarter of 2009, but increased steadily through the first half of 2010. Although we did not experience significant newsprint price increases in the second half of 2010, newsprint prices were higher than the same period in 2009.
THE NEW YORK TIMES COMPANY – P.
35
Selling, General and Administrative Costs
Total selling, general and administrative costs in 2011 decreased compared with 2010 primarily due to lower compensation costs (approximately $41 million) and professional fees (approximately $8 million), partially offset by higher promotion (approximately $12 million) and severance (approximately $7 million) costs. Compensation costs declined mainly as a result of lower variable compensation expense. The decline in professional fees mainly resulted from the costs incurred in the prior year associated with our digital initiatives as well as cost-saving initiatives. Promotion costs were higher mainly because of the launch of digital subscription packages at The Times in 2011. Severance costs were higher due to the level of workforce reduction programs year-over-year.
Total selling, general and administrative costs in 2010 decreased compared with 2009 primarily due to lower severance costs (approximately $48 million) as a result of a larger workforce reduction program in 2009, lower bad debt expense (approximately $16 million) due to improvements in the overall economy and lower benefits expense (approximately $11 million), professional fees (approximately $8 million) and various other costs.
Depreciation and Amortization
Consolidated depreciation and amortization by reportable segment and the Company as a whole, were as follows:
|
|
December 25,
2011 |
|
December 26,
2010 |
|
December 27,
2009 |
|
% Change
|
|||||||||||
|
(In thousands)
|
11-10
|
|
10-09
|
|
||||||||||||||
|
News Media Group
|
$
|
105,934
|
|
$
|
109,341
|
|
$
|
122,609
|
|
(3.1
|
)
|
(10.8
|
)
|
|||||
|
About Group
|
10,520
|
|
11,609
|
|
11,087
|
|
(9.4
|
)
|
4.7
|
|
||||||||
|
Total depreciation and amortization
|
$
|
116,454
|
|
$
|
120,950
|
|
$
|
133,696
|
|
(3.7
|
)
|
(9.5
|
)
|
|||||
Depreciation and amortization decreased at the News Media Group in 2010 compared with 2009 primarily due to the accelerated depreciation expense recognized in 2009 for assets at the Billerica, Mass., printing facility. We completed the consolidation of this printing facility with the Globe’s printing facility in Boston, Mass., in the second quarter of 2009.
Segment Operating Costs
The following table sets forth consolidated costs by reportable segment, Corporate and the Company as a whole:
|
|
December 25,
2011 |
|
December 26,
2010 |
|
December 27,
2009 |
|
% Change
|
|||||||||||
|
(In thousands)
|
11-10
|
|
10-09
|
|
||||||||||||||
|
News Media Group
|
$
|
1,986,176
|
|
$
|
2,015,728
|
|
$
|
2,182,964
|
|
(1.5
|
)
|
(7.7
|
)
|
|||||
|
About Group
|
67,036
|
|
74,125
|
|
70,180
|
|
(9.6
|
)
|
5.6
|
|
||||||||
|
Corporate
|
40,320
|
|
47,074
|
|
54,656
|
|
(14.3
|
)
|
(13.9
|
)
|
||||||||
|
Total operating costs
|
$
|
2,093,532
|
|
$
|
2,136,927
|
|
$
|
2,307,800
|
|
(2.0
|
)
|
(7.4
|
)
|
|||||
News Media Group
In 2011, operating costs for the News Media Group decreased compared with 2010 primarily due to declines in compensation and benefits costs (approximately $29 million), professional fees (approximately $8 million), outside printing costs (approximately $4 million) and various other costs, partially offset by higher promotion (approximately $12 million) and severance costs (approximately $6 million). Compensation costs declined mainly as a result of lower variable compensation expense. The decline in professional fees mainly resulted from the costs incurred in the prior year associated with our digital initiatives as well as cost-saving initiatives. Cost-saving initiatives primarily contributed to lower outside printing costs. Promotion costs were higher mainly in connection with the launch of digital subscription packages at The Times in 2011. Severance costs were higher due to the level of workforce reduction programs year-over-year.
P.
36
– THE NEW YORK TIMES COMPANY
In 2010, operating costs for the News Media Group decreased compared with 2009 primarily due to declines across most major categories. Lower severance costs (approximately $46 million), compensation and benefits costs (approximately $30 million), bad debt expense (approximately $17 million), outside printing and distribution costs (approximately $16 million), and depreciation and amortization costs (approximately $13 million) were the main drivers. Lower severance costs were due to a larger workforce reduction program in 2009 and lower compensation and benefits costs reflect the impact of our reduced workforce and cost-saving initiatives. Lower bad debt expense was a result of improved economic conditions compared with 2009. Lower outside printing and distribution costs mainly reflect the impact of cost-saving initiatives.
About Group
Operating costs for the About Group decreased in 2011 compared with 2010 primarily due to lower compensation costs ($3.1 million), driven by lower variable compensation expense, and a one-time benefit from the sale of UCompareHealthCare.com in February 2011.
Operating costs for the About Group increased in 2010 compared with 2009 primarily due to higher compensation and benefits costs ($2.2 million) and higher marketing costs ($0.5 million).
Corporate
Operating costs for Corporate decreased in 2011 compared with 2010 primarily due to lower compensation and benefits costs ($9.6 million) mainly driven by lower variable compensation expense, offset by various other costs.
Operating costs for Corporate decreased in 2010 compared with 2009 primarily due to lower professional fees ($6.7 million) and benefits and compensation costs ($3.2 million), offset in part by a one-time benefit from the sale of an asset ($1.8 million) in the second quarter of 2009.
Other Items
Impairment of Assets
2011
In 2011, we recorded a
$164.4 million
impairment charge. At the News Media Group, the impairment consisted of the write-down of goodwill at the Regional Media Group of
$152.1 million
and the write-down of certain assets held for sale, primarily of Baseline, totaling
$9.2 million
. At the About Group, the impairment consisted of a write-down of an intangible asset at ConsumerSearch, Inc. of
$3.1 million
.
Regional Media Group
Goodwill is not amortized but tested for impairment annually or in an interim period if certain circumstances indicate a possible impairment may exist. Our policy is to perform our annual goodwill impairment test in the fourth quarter of our fiscal year. However, due to certain impairment indicators at the Regional Media Group, including lower-than-expected operating results, we performed an interim impairment test of goodwill as of June 26, 2011. The Regional Media Group is part of the News Media Group reportable segment. See Note 21 of the Notes to the Consolidated Financial Statements for information regarding the sale of the Regional Media Group on January 6, 2012.
The interim test resulted in an impairment of goodwill of
$152.1 million
mainly from lower projected long-term operating results and cash flows of the Regional Media Group primarily due to the continued decline in print advertising revenues. These factors resulted in the carrying value of the net assets being greater than their fair value, and therefore a write-down to fair value was required. The impairment charge reduced the carrying value of goodwill at the Regional Media Group to zero.
In determining the fair value of the Regional Media Group, we made significant judgments and estimates regarding the expected severity and duration of the uneven economic environment and the secular changes affecting the newspaper industry in the Regional Media Group markets. The effect of these assumptions on projected long-term revenues, along with the continued benefits from reductions to the group’s cost structure, played a significant role in calculating the fair value of the Regional Media Group.
THE NEW YORK TIMES COMPANY – P.
37
Property, plant and equipment is tested for impairment if certain circumstances indicate a possible impairment may exist. Due to the factors discussed above, we completed an interim impairment test of property, plant and equipment as of June 26, 2011. The impairment test was completed at each newspaper (asset group level with the lowest level of cash flows) in the Regional Media Group. Our test did not result in an impairment because the sum of the future undiscounted cash flows at each newspaper was greater than the carrying value of property, plant and equipment.
About Group
Our 2011 annual impairment test, which was completed in the fourth quarter, resulted in a non-cash impairment charge of
$3.1 million
relating to the write-down of an intangible asset at ConsumerSearch, Inc. This impairment charge reduced the carrying value of the ConsumerSearch trade name to approximately $3 million. The fair value of the trade name was calculated using a relief-from-royalty method. The asset impairment was driven by lower cost-per-click advertising revenues.
There were no additional impairment charges in connection with our 2011 annual impairment test. However, the About Group's estimated fair value was 18% greater than its carrying value in our 2011 impairment test compared with 60% in our 2010 impairment test, a significant decline during 2011. The About Group had approximately $367 million of goodwill as of December 25, 2011.
In determining the fair value of the About Group, we made significant judgments and estimates regarding the expected recovery of display and cost-per-click advertising. The effect of these assumptions on projected long-term revenues, along with investments to grow content and traffic, play a significant role in calculating the fair value of the About Group. We believe if the long-term projected cash flows of the About Group are not met a goodwill impairment charge could be reasonably likely.
Assets Held for Sale
In the second quarter of 2011, we classified certain assets as held for sale, primarily of Baseline. The carrying value of these assets was greater than their fair value, less cost to sell, resulting in an impairment of certain intangible assets and property totaling
$9.2 million
. The impairment charge reduced the carrying value of intangible assets to zero and the property to a nominal value. The fair value for these assets was determined by estimating the most likely sale price with a third-party buyer based on market data. In October 2011, we completed the sale of Baseline, which resulted in a nominal gain.
2010
We consolidated the printing facility of the Globe in Billerica, Mass., into the Boston, Mass., printing facility in the second quarter of 2009. After exploring different opportunities for the assets at Billerica, we entered into an agreement in the third quarter of 2010 to sell the majority of these assets to a third party. Therefore, assets with a carrying value of approximately
$20 million
were written down to their fair value, resulting in a
$16.1 million
impairment charge in 2010.
2009
In the fourth quarter of 2009, we recorded a
$4.2 million
charge for an impairment of assets due to the reduced scope of a systems project at the News Media Group.
Pension Withdrawal Expense
Over the past three years, certain events, such as amendments to various collective bargaining agreements, resulted in withdrawals from multiemployer pension plans. These actions along with a reduction in covered employees have resulted in us estimating withdrawal liabilities to the respective plans for our proportionate share of any unfunded vested benefits. We recorded an estimated charge for pension plan withdrawal obligations of $4.2 million in 2011, $6.3 million in 2010 and $78.9 million in 2009. Our multiemployer pension plan withdrawal liability was approximately $100 million as of December 25, 2011. This liability is the present value of the obligations related to complete and partial withdrawals from certain plans as well as an estimate of future partial withdrawals that we considered probable and reasonably estimable. The actual liability will not be known until each plan completes a final assessment of the withdrawal liability and issues a demand to us. Therefore, the estimate of our multiemployer pension plan liability will be adjusted as more information becomes available that allows us to refine our estimates.
P.
38
– THE NEW YORK TIMES COMPANY
Pension Curtailment Gain
We did not make any significant changes to our pension plans during 2011 or 2010. However, in 2009, we made the following changes to certain of our pension plans, which resulted in a net pension curtailment gain of $54.0 million.
We amended a Company-sponsored qualified pension plan for non-union employees to discontinue future benefit accruals under the plan and freeze existing accrued benefits effective December 31, 2009. Benefits earned by participants under the pension plan prior to January 1, 2010 were not affected. We also froze a non-qualified pension plan that provides enhanced retirement benefits to select members of management. The accrued benefits under this supplemental benefit plan were determined and frozen based on eligible earnings through December 31, 2009. The reduction of benefits under the qualified and non-qualified plans mentioned above and various other non-qualified plans resulted in a curtailment gain of $56.7 million.
In 2009, we also froze a Company-sponsored qualified pension plan in connection with ratified amendments to a collective bargaining agreement covering the Newspaper Guild of the Globe. The amendments resulted in a curtailment loss of $2.5 million.
In 2009, we also eliminated certain non-qualified retirement benefits of various employees of the Globe in connection with the amendment of two union agreements. The amendments resulted in a curtailment loss of $0.2 million.
Loss on Leases and Other Expenses
In 2011, we recorded a $4.5 million charge for a retirement and consulting agreement in connection with the retirement of our chief executive officer at the end of 2011.
The total loss on leases and other expenses recorded in 2009 was $34.6 million as detailed below.
In 2009, we recorded a loss of $22.8 million for the present value of remaining rental payments under leases, for property previously occupied by City & Suburban Delivery Systems, Inc. (“City & Suburban”), in excess of rental income under potential subleases. We closed City & Suburban, which operated a wholesale distribution business that delivered The Times and other newspapers and magazines to newsstands and retail outlets in the New York metropolitan area, in January 2009. Also in 2009, we recorded a loss of $8.3 million for the present value of remaining rental payments under a lease for office space at The New York Times Media Group, in excess of rental income under potential subleases.
In the fourth quarter of 2009, we also recorded a $3.5 million charge for the early termination of a third-party printing contract.
Gain on Sale of Assets
In 2009, we sold certain surplus real estate assets at the Regional Media Group and recorded a gain on the sales totaling $5.2 million.
Operating Profit/(Loss)
Consolidated operating profit/(loss) by reportable segment, Corporate and the Company as a whole, were as follows:
|
|
December 25,
2011 |
|
December 26,
2010 |
|
December 27,
2009 |
|
% Change
|
|||||||||||
|
(In thousands)
|
11-10
|
|
10-09
|
|||||||||||||||
|
News Media Group
|
$
|
60,853
|
|
$
|
219,242
|
|
$
|
21,163
|
|
(72.2
|
)
|
*
|
||||||
|
About Group
|
40,674
|
|
61,952
|
|
50,881
|
|
(34.3
|
)
|
21.8
|
|||||||||
|
Corporate
|
(44,820
|
)
|
(47,074
|
)
|
2,015
|
|
(4.8
|
)
|
*
|
|||||||||
|
Total operating profit
|
$
|
56,707
|
|
$
|
234,120
|
|
$
|
74,059
|
|
(75.8
|
)
|
*
|
||||||
* Represents an increase or decrease in excess of 100%.
We discuss the reasons for the year-to-year changes in each segment’s and Corporate’s operating profit/(loss) in the “Revenues,” “Operating Costs,” and “Other Items” sections above.
THE NEW YORK TIMES COMPANY – P.
39
NON-OPERATING ITEMS
Income from Joint Ventures
We have investments in Metro Boston, two paper mills (Malbaie and Madison), quadrantONE and Fenway Sports Group, which were accounted for under the equity method as of December 25, 2011. Our proportionate share of the operating results of these investments is recorded in “Income from joint ventures” in our Consolidated Statements of Operations. See Note 7 of the Notes to the Consolidated Financial Statements for additional information regarding these investments.
In 2011, we had income from joint ventures of $28,000 compared with $19.0 million in 2010. In 2010, we recorded a pre-tax gain of $12.7 million from the sale of an asset at one of the paper mills in which we have an investment. Our share of the pre-tax gain, after eliminating the noncontrolling interest portion, was $10.2 million. The $12.7 million gain is included in “Income from joint ventures” in our Consolidated Statements of Operations. Excluding this gain, joint venture results in 2011 were negatively impacted by Fenway Sports Group’s acquisition of Liverpool Football Club, mainly due to the amortization expense associated with the purchase, offset in part by improved results driven by higher paper selling prices at both paper mills in which we have investments.
In 2010, we had income from joint ventures of $19.0 million compared with $20.7 million in 2009. Excluding the $12.7 million pre-tax gain from the sale of an asset at one of the paper mills, income from joint ventures declined in 2010 compared with 2009 primarily due to a decline in results driven by lower paper selling prices at both paper mills in which we have investments.
Gain on Sale of Investments
In 2011, we recognized a gain of $71.2 million resulting from the sale of 390 units in Fenway Sports Group ($65.3 million) and the sale of a portion of our interest in Indeed.com ($5.9 million), a job listing aggregator. We retain a substantial portion of our initial interest in Indeed.com.
In 2010, we recognized a gain of $9.1 million resulting from the sale of 50 units in Fenway Sports Group.
In February 2012, we sold 100 units in Fenway Sports Group for an aggregate price of $30.0 million. We will record a pre-tax gain of approximately $18 million in the first quarter of 2012. Following the sale, we own 210 units, or 4.97%, of Fenway Sports Group. We continue to market our remaining units in Fenway Sports Group, in whole or in parts.
Effective with this sale, given our reduced ownership level and lack of influence on the operations of Fenway Sports Group, we will change the accounting for our investment from the equity method to the cost method. Therefore, we will no longer recognize our proportionate share of the operating results of Fenway Sports Group in “Income from joint ventures” in our Consolidated Statements of Operations and our investment will be reclassified from “Investments in joint ventures” into “Miscellaneous assets” in our Consolidated Balance Sheet.
P.
40
– THE NEW YORK TIMES COMPANY
Interest Expense, Net
Interest expense, net, was as follows:
|
(In thousands)
|
December 25,
2011 |
|
December 26,
2010 |
|
December 27,
2009 |
|
||||||
|
Cash interest expense
|
$
|
79,187
|
|
$
|
79,349
|
|
$
|
78,606
|
|
|||
|
Non-cash amortization of discount on debt
|
6,933
|
|
7,251
|
|
6,084
|
|
||||||
|
Capitalized interest
|
(427
|
)
|
(299
|
)
|
(1,566
|
)
|
||||||
|
Interest income
|
(450
|
)
|
(1,239
|
)
|
(1,423
|
)
|
||||||
|
Total interest expense, net
|
$
|
85,243
|
|
$
|
85,062
|
|
$
|
81,701
|
|
|||
We had lower interest expense in 2011 due to the prepayment in August 2011 of our 14.053% Notes. However, this was more than offset by higher interest expense in connection with the issuance of our 6.625% Notes in November 2010 and lower interest income from a loan to a third-party, which was repaid in October 2010.
Interest expense, net, increased in 2010 compared with 2009 as a result of higher interest rates on our debt, offset in part by lower average debt outstanding.
On August 15, 2011, we prepaid in full all $250.0 million outstanding aggregate principal amount of the 14.053% Notes. The prepayment totaled approximately $280 million, comprising (1) the $250.0 million aggregate principal amount of the 14.053% Notes; (2) approximately $3 million representing all interest that was accrued and unpaid on the 14.053% Notes to August 15, 2011; and (3) a make-whole premium amount of approximately $27 million due in connection with the prepayment. We funded the prepayment from available cash. As a result of this prepayment, we recorded a $46.4 million pre-tax charge in the third quarter of 2011 and expect to save in excess of $39 million annually in interest expense through January 15, 2015, the original maturity date.
In April 2009, we settled the redemption of all $250.0 million outstanding aggregate principal amount of our 4.5% notes due March 15, 2010, that had been called for redemption in March 2009. The redemption price of approximately $260 million included a $9.3 million premium and was computed under the terms of the notes as the present value of the scheduled payments of principal and unpaid interest, plus accrued interest to the redemption settlement date.
Income Taxes
We had income tax expense of $36.5 million on a pre-tax loss of $3.7 million in 2011. The effective tax rate for the full year 2011 is not meaningful because a portion of the non-cash charge in the second quarter of 2011 for the impairment of the Regional Media Group’s goodwill was non-deductible.
We had income tax expense of $68.5 million on pre-tax income of $177.2 million in 2010. Our effective tax rate was 38.7% in 2010. The effective tax rate for 2010 was favorably affected by approximately $22 million for the reversal of reserves for uncertain tax positions due to the closing of tax audits and the lapse of applicable statutes of limitations and unfavorably affected by an $11.4 million tax charge as described below.
The Patient Protection and Affordable Care Act and the Health Care and Education Reconciliation Act of 2010, which were enacted in 2010, eliminated the tax deductibility of certain retiree health care costs, beginning January 1, 2013, to the extent of federal subsidies received by plan sponsors that provide retiree prescription drug benefits equivalent to Medicare Part D. Because the future anticipated retiree health-care liabilities and related subsidies were already reflected in our financial statements, this legislation required us to reduce the related deferred tax asset recognized in our financial statements. As a result, we recorded a tax charge of $11.4 million in 2010 for the reduction in future tax benefits for retiree health benefits resulting from the federal health-care legislation enacted in 2010.
We had $2.2 million of tax expense on pre-tax income of $3.8 million in 2009. Our effective tax rate was 58.4% in 2009. The high tax rate was driven by the impact of certain items, including the reduction of deferred tax asset balances resulting from lower income tax rates, on near break-even results in 2009.
THE NEW YORK TIMES COMPANY – P.
41
Discontinued Operations
Discontinued operations are summarized in the following chart:
|
(In thousands)
|
December 26,
2010 |
|
December 27,
2009 |
|
||||
|
Revenues
|
$
|
—
|
|
$
|
5,062
|
|
||
|
Total operating costs
|
—
|
|
7,082
|
|
||||
|
Pre-tax loss
|
—
|
|
(2,020
|
)
|
||||
|
Income tax benefit
|
—
|
|
(864
|
)
|
||||
|
Loss from discontinued operations, net of income taxes
|
—
|
|
(1,156
|
)
|
||||
|
Gain on sale, net of income taxes:
|
||||||||
|
Gain on sale
|
16
|
|
34,914
|
|
||||
|
Income tax expense
|
3
|
|
15,426
|
|
||||
|
Gain on sale, net of income taxes
|
13
|
|
19,488
|
|
||||
|
Income from discontinued operations, net of income taxes
|
$
|
13
|
|
$
|
18,332
|
|
||
WQXR-FM
The results of operations for WQXR-FM, a New York City classical radio station, which was sold in October 2009, are presented as discontinued operations. We received proceeds related to the sale of approximately
$45 million
and recorded a pre-tax gain of approximately
$35 million
(approximately
$19 million
after tax) in the fourth quarter of 2009. In 2010, we recorded post-closing adjustments to the gain.
The results of operations for WQXR-FM, which were previously consolidated in the results of the News Media Group, are presented as discontinued operations in our Consolidated Financial Statements for all periods presented.
LIQUIDITY AND CAPITAL RESOURCES
Overview
The following table presents information about our financial position.
Financial Position Summary
|
December 25,
2011 |
|
December 26,
2010 |
|
% Change
|
||||||||
|
(In thousands, except ratios)
|
11-10
|
|
||||||||||
|
Cash and cash equivalents
|
$
|
175,151
|
|
$
|
369,668
|
|
(52.6
|
)
|
||||
|
Short-term investments
|
104,846
|
|
29,974
|
|
*
|
|
||||||
|
Current portion of long-term debt and capital lease obligations
|
74,920
|
|
38
|
|
*
|
|
||||||
|
Long-term debt and capital lease obligations
|
698,220
|
|
996,405
|
|
(29.9
|
)
|
||||||
|
Total New York Times Company stockholders’ equity
|
506,360
|
|
659,927
|
|
(23.3
|
)
|
||||||
|
Ratios:
|
||||||||||||
|
Total debt to total capitalization
|
60
|
%
|
60
|
%
|
—
|
|
||||||
|
Current assets to current liabilities
|
1.46
|
|
1.70
|
|
(14.1
|
)
|
||||||
* Represents an increase in excess of 100%.
We meet our cash obligations with cash inflows from operations, in combination with other financing sources. Our primary sources of cash inflows from operations are advertising and circulation sales. Advertising and circulation provided about 53% and 41%, respectively, of total revenues in 2011. The remaining cash inflows from operations are from other revenue sources such as news services/syndication, commercial printing, rental income, digital archives and direct mail advertising services. Our primary source of cash outflows are for employee compensation, pension and other benefits, raw materials, services and supplies, interest and income taxes. Contributions to our qualified pension plans can have a significant impact on cash flows. See “— Pensions and Other Postretirement Benefits” for additional information regarding our pension plans.
P.
42
– THE NEW YORK TIMES COMPANY
We have continued to manage our liquidity position by improving our financial flexibility and our debt profile. As of December 25, 2011, we had total debt and capital lease obligations of approximately $773 million and cash, cash equivalents and short-term investments of approximately $280 million. Accordingly, our total debt and capital lease obligations, net of cash, cash equivalents and short-term investments, or “net debt,” was approximately $493 million even after the prepayment of the 14.053% Notes and making contributions totaling approximately $151 million to certain qualified pension plans in 2011. Our efforts to strengthen our liquidity position and improve our debt profile over the past two years allowed us to prepay on August 15, 2011, all of our $250.0 million 14.053% Notes. In addition, in June 2011, we entered into a new $125.0 million asset-backed five-year revolving credit facility that replaced our $400.0 million revolving credit facility. As of December 25, 2011, we had no outstanding borrowings under the new credit facility.
We believe our cash balance and cash provided by operations, in combination with other financing sources, will be sufficient to meet our financing needs over the next 12 months.
Capital Resources
Sources and Uses of Cash
Cash flows provided by/(used in) by category were as follows:
|
|
December 25,
2011 |
|
December 26,
2010 |
|
December 27,
2009 |
|
% Change
|
||||||||||||
|
(In thousands)
|
11-10
|
|
10-09
|
|
|||||||||||||||
|
Operating activities
|
$
|
73,927
|
|
$
|
153,327
|
|
$
|
247,253
|
|
(51.8
|
)
|
(38.0
|
)
|
||||||
|
Investing activities
|
$
|
(18,254
|
)
|
$
|
(40,520
|
)
|
$
|
8,073
|
|
(55.0
|
)
|
*
|
|
||||||
|
Financing activities
|
$
|
(250,226
|
)
|
$
|
220,666
|
|
$
|
(276,651
|
)
|
*
|
|
*
|
|
||||||
* Represents an increase or decrease in excess of 100%.
Operating Activities
Operating cash inflows include cash receipts from advertising and circulation sales and other revenue transactions. Operating cash outflows include payments for employee compensation, pension and other benefits, raw materials, services and supplies, interest and income taxes.
Net cash provided by operating activities decreased in 2011 compared with 2010 primarily due to higher working capital requirements, including approximately $30 million associated with the prepayment of the 14.053% Notes, partially offset by lower pension contributions to certain qualified pension plans, which totaled approximately $151 million in 2011 compared with $176 million in 2010.
Net cash provided by operating activities decreased in 2010 compared with 2009 primarily driven by contributions totaling approximately $176 million to certain qualified pension plans, offset in part by improved operating performance as a result of cost-saving initiatives in recent years.
Investing Activities
Cash from investing activities generally includes proceeds from short-term investments that have matured and the sale of assets or a business. Cash used in investing activities generally includes purchases of short-term investments, payments for capital projects, restricted cash subject to collateral requirements primarily for obligations under our workers’ compensation programs, acquisitions of new businesses and investments.
Net cash used in investing activities in 2011 was mainly due to purchases of short-term investments, capital expenditures and changes in restricted cash, offset in part by proceeds from the short-term investments that have matured, proceeds from the sales of 390 of our units in Fenway Sports Group and a portion of our interest in Indeed.com, as well as proceeds primarily from the sales of UCompareHealthCare.com and Baseline in 2011.
Net cash used in investing activities in 2010 was primarily for capital expenditures and the purchase of short-term investments, partially offset by loan repayments from a third-party circulation service provider, and proceeds from the sale of 50 of our units in Fenway Sports Group.
Net cash provided by investing activities in 2009 was primarily due to the proceeds from the sale of WQXR-FM and other assets, offset in part by capital expenditures.
Capital expenditures were $44.9 million in 2011, $33.6 million in 2010 and $51.1 million in 2009.
THE NEW YORK TIMES COMPANY – P.
43
Financing Activities
Cash from financing activities generally includes borrowings under third-party financing arrangements and the issuance of long-term debt. Cash used in financing activities generally includes the repayment of amounts outstanding under third-party financing arrangements and long-term debt.
Net cash used in financing activities in 2011 was primarily for the prepayment of our 14.053% Notes (see “— Third-Party Financing” below).
Net cash provided by financing activities in 2010 consisted mainly of debt incurred under the issuance of 6.625% senior unsecured notes (see “— Third-Party Financing” below).
Net cash used in financing activities in 2009 consisted mainly of repayments under our revolving credit agreements, repayments in connection with the early redemption of our 4.5% notes due March 15, 2010 and the repurchase of medium-term notes, partially offset by debt incurred under the issuance of 14.053% Notes and a sale-leaseback financing (see “— Third-Party Financing” below).
See our Consolidated Statements of Cash Flows for additional information on our sources and uses of cash.
Restricted Cash
We were required to maintain $27.6 million of restricted cash as of December 25, 2011, subject to certain collateral requirements primarily for obligations under our workers’ compensation programs. These collateral requirements were previously supported by letters of credit under our $400.0 million revolving credit facility that was replaced in June 2011.
Third-Party Financing
Our total debt and capital lease obligations consisted of the following:
|
(In thousands, except percentages)
|
Coupon Rate
|
December 25,
2011 |
|
December 26,
2010 |
|
||||||
|
Senior notes due in 2012, net of unamortized debt costs of $100 in 2011 and $229 in 2010
|
4.610
|
%
|
$
|
74,900
|
|
$
|
74,771
|
|
|||
|
Senior notes due in 2015, net of unamortized debt costs of $109 in 2011 and $140 in 2010
|
5.0
|
%
|
249,891
|
|
249,860
|
|
|||||
|
Senior notes due in 2015, called in 2011, net of unamortized debt costs of $22,320 in 2010
|
14.053
|
%
|
—
|
|
227,680
|
|
|||||
|
Senior notes due in 2016, net of unamortized debt costs of $4,213 in 2011 and $4,898 in 2010
|
6.625
|
%
|
220,787
|
|
220,102
|
|
|||||
|
Option to repurchase ownership interest in headquarters building in 2019, net of unamortized debt costs of $29,139 in 2011 and $32,694 in 2010
|
220,861
|
|
217,306
|
|
|||||||
|
Total debt
|
766,439
|
|
989,719
|
|
|||||||
|
Capital lease obligations
|
6,701
|
|
6,724
|
|
|||||||
|
Total debt and capital lease obligations
|
$
|
773,140
|
|
$
|
996,443
|
|
|||||
Based on borrowing rates currently available for debt with similar terms and average maturities, the fair value of our long-term debt was approximately $800 million as of December 25, 2011 and approximately $1.1 billion as of December 26, 2010. We were in compliance with our covenants under our third-party financing arrangements as of December 25, 2011.
4.610% Notes
We have
$75.0 million
aggregate principal amount of
4.610%
senior notes due September 26, 2012, outstanding (the “
4.610%
Notes”). The
4.610%
Notes were reclassified to “Current portion of long-term debt and capital lease obligations” in our Consolidated Balance Sheet in the fourth quarter of 2011.
The
4.610%
Notes may be redeemed, in whole or in part, at any time, at a price equal to 100% of the principal amount of the notes redeemed, plus accrued and unpaid interest to the redemption date plus a “make-whole” premium. The 4.610% Notes are not otherwise callable.
P.
44
– THE NEW YORK TIMES COMPANY
The
4.610%
Notes are subject to certain covenants that, among other things, limit (subject to customary exceptions) our ability and the ability of certain material subsidiaries to:
|
•
|
create liens on certain assets to secure debt; and
|
|
•
|
enter into certain sale-leaseback transactions.
|
5.0% Notes
We have
$250.0 million
aggregate principal amount of
5.0%
senior unsecured notes due March 15, 2015, outstanding (the “5.0% Notes”).
The
5.0%
Notes may be redeemed, in whole or in part, at any time, at a price equal to 100% of the principal amount of the notes redeemed, plus accrued and unpaid interest to the redemption date plus a “make-whole” premium. The
5.0%
Notes are not otherwise callable.
The
5.0%
Notes are subject to certain covenants that, among other things, limit (subject to customary exceptions) our ability and the ability of certain material subsidiaries to:
|
•
|
create liens on certain assets to secure debt; and
|
|
•
|
enter into certain sale-leaseback transactions.
|
14.053% Notes
In January 2009, pursuant to a securities purchase agreement with Inmobiliaria Carso, S.A. de C.V. and Banco Inbursa S.A., Institución de Banca Múltiple, Grupo Financiero Inbursa (each an “Investor” and collectively the “Investors”), we issued, for an aggregate purchase price of
$250.0 million
, (1)
$250.0 million
aggregate principal amount of
14.053%
senior unsecured notes due January 15, 2015, and (2) detachable warrants to purchase
15.9 million
shares of our Class A Common Stock at a price of $6.3572 per share. The warrants are exercisable at the holder’s option at any time and from time to time, in whole or in part, until January 15, 2015. Each Investor is an affiliate of Carlos Slim Helú, the beneficial owner of approximately
8%
of our Class A Common Stock (excluding the warrants). Each Investor purchased an equal number of
14.053%
Notes and warrants.
On August 15, 2011, we prepaid in full all
$250.0 million
outstanding aggregate principal amount of the
14.053%
Notes. The prepayment totaled approximately
$280 million
, comprising (1) the
$250.0 million
aggregate principal amount of the
14.053%
Notes, (2) approximately
$3 million
representing all interest that was accrued and unpaid on the
14.053%
Notes to August 15, 2011, and (3) a make-whole premium amount of approximately
$27 million
due in connection with the prepayment. We funded the prepayment from available cash. As a result of this prepayment, we recorded a
$46.4 million
pre-tax charge in the third quarter of 2011. This charge is included in “Premium on debt redemptions” in our Consolidated Statements of Operations.
6.625% Notes
In November 2010, we completed an offering of
$225.0 million
aggregate principal amount of
6.625%
senior unsecured notes due December 15, 2016 (“6.625% Notes”).
We received proceeds of approximately
$220 million
(purchase price of
$225.0 million
, net of approximately
$5 million
in transaction costs). The effective interest rate on this transaction was approximately
7%
.
We have the option to redeem all or a portion of the
6.625%
Notes, at any time, at a price equal to
100%
of the principal amount of the notes redeemed plus accrued and unpaid interest to the redemption date plus a “make-whole” premium. The
6.625%
Notes are not otherwise callable.
The
6.625%
Notes are subject to certain covenants that, among other things, limit (subject to customary exceptions) our ability and the ability of our subsidiaries to:
|
•
|
incur additional indebtedness and issue preferred stock;
|
|
•
|
pay dividends or make other equity distributions;
|
|
•
|
agree to any restrictions on the ability of our restricted subsidiaries to make payments to us;
|
|
•
|
create liens on certain assets to secure debt;
|
|
•
|
make certain investments;
|
THE NEW YORK TIMES COMPANY – P.
45
|
•
|
merge or consolidate with other companies or transfer all or substantially all of our assets; and
|
|
•
|
engage in sale and leaseback transactions.
|
Sale-Leaseback Financing
In March 2009, an affiliate of our Company entered into an agreement to sell and simultaneously lease back a portion of our leasehold condominium interest in our Company’s headquarters building located at 620 Eighth Avenue in New York City (the “Condo Interest”). The sale price for the Condo Interest was
$225.0 million
. We have an option, exercisable in 2019, to repurchase the Condo Interest for
$250.0 million
. The lease term is
15
years, and we have three renewal options that could extend the term for an additional
20
years.
The transaction is accounted for as a financing transaction. As such, we have continued to depreciate the Condo Interest and account for the rental payments as interest expense. The difference between the purchase option price of
$250.0 million
and the net sale proceeds of approximately
$211 million
, or approximately
$39 million
, is being amortized over a
10
-year period through interest expense. The effective interest rate on this transaction was approximately
13%
.
Revolving Credit Facility
In June 2011, we entered into a new
$125.0 million
asset-backed five-year revolving credit facility. This new credit facility replaced our
$400.0 million
revolving credit facility, which was to expire on June 21, 2011. As of
December 25, 2011
, there were no outstanding borrowings under the new credit facility.
Borrowings under the new credit facility will be secured by a lien on certain advertising receivables. In addition, borrowings bear interest at specified margins based on our utilization and at rates that vary between the LIBOR and prime rates (as defined by the credit agreement) depending on the term to maturities we specify. The new credit facility contains various customary affirmative and negative covenants, including a springing financial covenant and various incurrence-based negative covenants described below.
The springing financial covenant provides that when availability under the new credit facility falls below the greater of $16.7 million or 15% of the commitment for three consecutive business days, we will be required to maintain on a trailing four-quarter basis a fixed charge coverage ratio of not less than 1.00:1.00. The fixed charge coverage ratio is defined as the ratio of (1) EBITDA (as defined by the credit agreement) minus unfinanced capital expenditures and tax payments paid in cash during the applicable period to (2) fixed charges (as defined by the credit agreement) for such period. Under the credit agreement, EBITDA for a period is generally defined as the sum for such period of net income plus interest expense, provision for income taxes, depreciation and amortization, non-cash items, including, without limitation, stock compensation expenses and pension expenses, and other non-recurring expenses which do not represent a cash item in such period or any future period, minus, to the extent included in net income, income tax credits and non-cash items increasing net income for such period. Fixed charges for a period are generally defined by the credit agreement as the sum for such period of interest expense, cash dividends or other distributions paid, accrued or scheduled to be paid, scheduled payments of principal and mandatory pension payments made in cash.
In addition, the new credit facility contains incurrence-based negative covenants that, subject to customary exceptions and cure periods, restrict our ability and the ability of our subsidiaries to:
|
•
|
incur debt (directly or by third-party guarantees);
|
|
•
|
grant liens;
|
|
•
|
pay dividends;
|
|
•
|
make investments;
|
|
•
|
make acquisitions or dispositions; and
|
|
•
|
prepay debt.
|
As long as we have not drawn an amount in excess of $250,000 for a period of 90 days under the new credit facility, the negative covenants generally do not apply. In addition, to the extent we have borrowings under the new credit facility, we may engage in transactions restricted by the covenants so long as we meet, on a pro forma basis, the 1.00:1.00 fixed charge coverage ratio test, availability under the new credit facility for the preceding 30 days is equal to at least $62.5 million (net of restricted cash in an amount up to $25.0 million) and no default has occurred.
P.
46
– THE NEW YORK TIMES COMPANY
Contractual Obligations
The information provided is based on management’s best estimate and assumptions of our contractual obligations as of December 25, 2011. Actual payments in future periods may vary from those reflected in the table.
|
|
Payment due in
|
||||||||||||||||||||
|
(In thousands)
|
Total
|
|
2012
|
|
2013-2014
|
|
2015-2016
|
|
Later Years
|
|
|||||||||||
|
Long-term debt
(1)
|
$
|
1,111,511
|
|
$
|
131,497
|
|
$
|
106,414
|
|
$
|
564,224
|
|
$
|
309,376
|
|
||||||
|
Capital leases
(2)
|
11,130
|
|
573
|
|
1,104
|
|
1,104
|
|
8,349
|
|
|||||||||||
|
Operating leases
(2)
|
65,758
|
|
16,096
|
|
21,890
|
|
13,884
|
|
13,888
|
|
|||||||||||
|
Benefit plans
(3)
|
1,619,505
|
|
135,606
|
|
275,858
|
|
300,635
|
|
907,406
|
|
|||||||||||
|
Total
|
$
|
2,807,904
|
|
$
|
283,772
|
|
$
|
405,266
|
|
$
|
879,847
|
|
$
|
1,239,019
|
|
||||||
|
(1)
|
Includes estimated interest payments on long-term debt and our 4.610% Notes due September 26, 2012. See Note 8 of the Notes to the Consolidated Financial Statements for additional information related to our total debt.
|
|
(2)
|
See Note 20 of the Notes to the Consolidated Financial Statements for additional information related to our capital and operating leases.
|
|
(3)
|
Includes estimated benefits payments under our Company-sponsored pension and other postretirement benefit plans. Payments for these plans have been estimated over a 10-year period; therefore the amounts included in the “Later Years” column only include payments for the period of 2017-2021. While benefit payments under these plans are expected to continue beyond 2021, we believe that an estimate beyond this period is impracticable. Benefit plans in the table above also include estimated payments for multiemployer pension plan withdrawal liabilities. See Notes 11 and 12 of the Notes to the Consolidated Financial Statements for additional information related to our pension and other postretirement benefits plans.
|
“Other Liabilities – Other” in our Consolidated Balance Sheets include liabilities related to (1) deferred compensation, primarily consisting of our deferred executive compensation plan (the “DEC plan”), (2) our liability for uncertain tax positions, and (3) various other liabilities. These liabilities are not included in the table above primarily because the future payments are not determinable.
The DEC plan enables certain eligible executives to elect to defer a portion of their compensation on a pre-tax basis. While the initial deferral period is for a minimum of two years up to a maximum of 15 years (after which time taxable distributions must begin), the executive has the option to extend the deferral period. Therefore, the future payments under the DEC plan are not determinable. See Note 13 of the Notes to the Consolidated Financial Statements for additional information on “Other Liabilities – Other.”
Our tax liability for uncertain tax positions was approximately $64 million, including approximately $16 million of accrued interest and penalties as of December 25, 2011. Until formal resolutions are reached between us and the tax authorities, the timing and amount of a possible audit settlement for uncertain tax benefits is not practicable. Therefore, we do not include this obligation in the table of contractual obligations. See Note 14 of the Notes to the Consolidated Financial Statements for additional information on “Income Taxes.”
We have a contract with a major paper supplier to purchase newsprint. The contract requires us to purchase annually the lesser of a fixed number of tons or a percentage of our total newsprint requirement at market rate in an arm’s length transaction. Since the quantities of newsprint purchased annually under this contract are based on our total newsprint requirement, the amount of the related payments for these purchases is excluded from the table above.
Off-Balance Sheet Arrangements
We did not have any material off-balance sheet arrangements as of December 25, 2011. We had letters of credit outstanding of approximately $62 million as of December 26, 2010 under our $400.0 million revolving credit facility, which supported our obligations under our workers’ compensation program, sale-leaseback financing and the acquisition of our New York headquarters site. In June 2011, the $400.0 million revolving credit facility was replaced. See “— Third-Party Financing — Revolving Credit Facility” for additional information.
THE NEW YORK TIMES COMPANY – P.
47
CRITICAL ACCOUNTING POLICIES
Our Consolidated Financial Statements are prepared in accordance with GAAP. The preparation of these financial statements requires management to make estimates and assumptions that affect the amounts reported in the Consolidated Financial Statements for the periods presented.
We continually evaluate the policies and estimates we use to prepare our Consolidated Financial Statements. In general, management’s estimates are based on historical experience, information from third-party professionals and various other assumptions that are believed to be reasonable under the facts and circumstances. Actual results may differ from those estimates made by management.
We believe our critical accounting policies include our accounting for long-lived assets, retirement benefits, stock-based compensation, income taxes, self-insurance liabilities and accounts receivable allowances. Specific risks related to our critical accounting policies are discussed below.
Long-Lived Assets
We evaluate whether there has been an impairment of goodwill or intangible assets not amortized on an annual basis or in an interim period if certain circumstances indicate that a possible impairment may exist. All other long-lived assets are tested for impairment if certain circumstances indicate that a possible impairment exists.
|
(In thousands)
|
December 25,
2011 |
|
December 26,
2010 |
|
||||
|
Long-lived assets
|
$
|
1,591,699
|
|
$
|
1,836,665
|
|
||
|
Total assets
|
$
|
2,883,450
|
|
$
|
3,285,741
|
|
||
|
Percentage of long-lived assets to total assets
|
55
|
%
|
56
|
%
|
||||
T
he impairment analysis is considered critical to our segments because of the significance of long-lived assets to our Consolidated Balance Sheets.
We test for goodwill impairment at the reporting unit level, which are our operating segments. Separate financial information about these segments is regularly evaluated by our chief operating decision-maker in deciding how to allocate resources. We first perform a qualitative assessment to determine whether it is more likely than not that the fair value of a reporting unit is less than its carrying value. The result of this assessment determines whether it is necessary to perform the goodwill impairment two-step test.
If we determine that it is more likely than not that the fair value of a reporting unit is less than its carrying value, in the first step we compare the fair value of the reporting unit with its carrying amount, including goodwill. Fair value is calculated by a combination of a discounted cash flow model and a market approach model. In calculating fair value for each reporting unit, we generally weigh the results of the discounted cash flow model more heavily than the market approach because the discounted cash flow model is specific to our business and long-term projections. If the fair value exceeds the carrying amount, goodwill is not considered impaired. If the carrying amount exceeds the fair value, the second step must be performed to measure the amount of the impairment loss, if any. In the second step, we compare the implied fair value of the reporting unit’s goodwill with the carrying amount of that goodwill. An impairment loss would be recognized in an amount equal to the excess of the carrying amount of the goodwill over the implied fair value of the goodwill.
The discounted cash flow analysis requires us to make various judgments, estimates and assumptions, many of which are interdependent, about future revenues, operating margins, growth rates, capital expenditures, working capital and discount rates. The starting point for the assumptions used in our discounted cash flow analysis is the annual long-range financial forecast. The annual planning process that we undertake to prepare the long-range financial forecast takes into consideration a multitude of factors, including historical growth rates and operating performance, related industry trends, macroeconomic conditions, and marketplace data, among others. Assumptions are also made for perpetual growth rates for periods beyond the long-range financial forecast period. Our estimates of fair value are sensitive to changes in all of these variables, certain of which relate to broader macroeconomic conditions outside our control.
The market approach analysis includes applying a multiple, based on comparable market transactions, to certain operating metrics of the reporting unit.
P.
48
– THE NEW YORK TIMES COMPANY
We compare the sum of the fair values of our reporting units to our market capitalization to determine whether our estimates of reporting unit fair value are reasonable.
Intangible assets that are not amortized (trade names) are tested for impairment at the asset level by comparing the fair value of the asset with its carrying amount. Fair value is calculated as the discounted cash flows utilizing the relief-from-royalty method. This method is based on applying a royalty rate, which would be obtained through a lease, to the cash flows derived from the asset being tested. The royalty rate is derived from market data. If the fair value exceeds the carrying amount, the asset is not considered impaired. If the carrying amount exceeds the fair value, an impairment loss would be recognized in an amount equal to the excess of the carrying amount of the asset over the fair value of the asset.
All other long-lived assets (intangible assets that are amortized, such as content and customer lists) are tested for impairment at the asset group level associated with the lowest level of cash flows. An impairment exists if the carrying value of the asset (1) is not recoverable (the carrying value of the asset is greater than the sum of undiscounted cash flows) and (2) is greater than its fair value.
The significant estimates and assumptions used by management in assessing the recoverability of goodwill, other intangible assets acquired and other long-lived assets are estimated future cash flows, discount rates, growth rates, as well as other factors. Any changes in these estimates or assumptions could result in an impairment charge. The estimates, based on reasonable and supportable assumptions and projections, require management’s subjective judgment. Depending on the assumptions and estimates used, the estimated results of the impairment tests can vary within a range of outcomes.
In addition to annual testing, management uses certain indicators to evaluate whether the carrying values of its long-lived assets may not be recoverable and an interim impairment test may be required. These indicators include (1) current-period operating or cash flow declines combined with a history of operating or cash flow declines or a projection/forecast that demonstrates continuing declines in the cash flow or the inability to improve our operations to forecasted levels, (2) a significant adverse change in the business climate, whether structural or technological and (3) a decline in our stock price and market capitalization.
Management has applied what it believes to be the most appropriate valuation methodology for its impairment testing. See Note 5 of the Notes to the Consolidated Financial Statements.
Retirement Benefits
Our single-employer pension and other postretirement benefit costs are accounted for using actuarial valuations. We recognize the funded status of these plans – measured as the difference between plan assets, if funded, and the benefit obligation – on the balance sheet and recognize changes in the funded status that arise during the period but are not recognized as components of net periodic pension cost, within other comprehensive income, net of income taxes. The assets related to our funded pension plans are measured at fair value.
We consider accounting for retirement plans critical to all of our operating segments because management is required to make significant subjective judgments about a number of actuarial assumptions, which include discount rates, health-care cost trend rates, long-term return on plan assets and mortality rates. These assumptions may have an effect on the amount and timing of future contributions. Depending on the assumptions and estimates used, the impact from our pension and other postretirement benefits could vary within a range of outcomes and could have a material effect on our Consolidated Financial Statements.
We also recognize the present value of pension liabilities associated with the withdrawal from multiemployer pension plans.
See “— Pensions and Other Postretirement Benefits” below for more information on our retirement benefits.
Stock-Based Compensation
We account for stock-based compensation in accordance with the fair value recognition provisions. Stock-based compensation cost is measured at the grant date, and for certain awards at the end of each reporting period based on the fair value of the award, and is recognized as expense over the appropriate vesting period. Determining the fair value of stock-based awards at the grant date requires judgment, including estimating the expected term of stock options, the expected volatility of our stock and expected dividends. In addition, judgment is required in estimating the amount of stock-based awards that are expected to be forfeited. If actual results differ significantly from these estimates or different key assumptions were used, it could have a material effect on our Consolidated Financial
THE NEW YORK TIMES COMPANY – P.
49
Statements. See Note 17 of the Notes to the Consolidated Financial Statements for additional information regarding stock-based compensation expense.
Income Taxes
We consider accounting for income taxes critical to our operations because management is required to make significant subjective judgments in developing our provision for income taxes, including the determination of deferred tax assets and liabilities, and any valuation allowances that may be required against deferred tax assets.
Income taxes are recognized for the following: (1) amount of taxes payable for the current year and (2) deferred tax assets and liabilities for the future tax consequence of events that have been recognized differently in the financial statements than for tax purposes. Deferred tax assets and liabilities are established using statutory tax rates and are adjusted for tax rate changes in the period of enactment.
We assess whether our deferred tax assets shall be reduced by a valuation allowance if it is more likely than not that some portion or all of the deferred tax assets will not be realized. Our process includes collecting positive (e.g., sources of taxable income) and negative (e.g., recent historical losses) evidence and assessing, based on the evidence, whether it is more likely than not that the deferred tax assets will not be realized.
We recognize in our financial statements the impact of a tax position if that tax position is more likely than not of being sustained on audit, based on the technical merits of the tax position. This involves the identification of potential uncertain tax positions, the evaluation of tax law and an assessment of whether a liability for uncertain tax positions is necessary. Different conclusions reached in this assessment can have a material impact on the Consolidated Financial Statements.
We operate within multiple taxing jurisdictions and are subject to audit in these jurisdictions. These audits can involve complex issues, which could require an extended period of time to resolve. Until formal resolutions are reached between us and the tax authorities, the timing and amount of a possible audit settlement for uncertain tax benefits is difficult to predict.
Self-Insurance
We self-insure for workers’ compensation costs, automobile and general liability claims, up to certain deductible limits, as well as for certain employee medical and disability benefits. The recorded liabilities for self-insured risks are primarily calculated using actuarial methods. The liabilities include amounts for actual claims, claim growth and claims incurred but not yet reported. Actual experience, including claim frequency and severity as well as health-care inflation, could result in different liabilities than the amounts currently recorded. The recorded liabilities for self-insured risks were approximately $52 million as of December 25, 2011 and $63 million as of December 26, 2010.
Accounts Receivable Allowances
Credit is extended to our advertisers and subscribers based upon an evaluation of the customers’ financial condition, and collateral is not required from such customers. We use prior credit losses as a percentage of credit sales, the aging of accounts receivable and specific identification of potential losses to establish reserves for credit losses on accounts receivable. In addition, we establish reserves for estimated rebates, returns, rate adjustments and discounts based on historical experience.
|
(In thousands)
|
December 25,
2011 |
|
December 26,
2010 |
|
||||
|
Accounts receivable allowances
|
$
|
18,637
|
|
$
|
30,209
|
|
||
|
Accounts receivable, net
|
288,355
|
|
302,245
|
|
||||
|
Accounts receivable - gross
|
$
|
306,992
|
|
$
|
332,454
|
|
||
|
Total current assets
|
$
|
748,589
|
|
$
|
857,232
|
|
||
|
Percentage of accounts receivable allowances to gross accounts receivable
|
6
|
%
|
9
|
%
|
||||
|
Percentage of net accounts receivable to current assets
|
39
|
%
|
35
|
%
|
||||
We consider accounting for accounts receivable allowances critical to all of our operating segments because of the significance of accounts receivable to our current assets and operating cash flows. If the financial condition of our customers were to deteriorate, resulting in an impairment of their ability to make payments, additional allowances may be required, which could have a material effect on our Consolidated Financial Statements.
P.
50
– THE NEW YORK TIMES COMPANY
PENSIONS AND OTHER POSTRETIREMENT BENEFITS
We sponsor several single-employer defined benefit pension plans, the majority of which have been frozen; participate in The New York Times Newspaper Guild pension plan, a joint Company and Guild-sponsored plan; and make contributions to several multiemployer pension plans in connection with collective bargaining agreements. These plans cover the majority of our employees. The table below includes the liability for all of these plans.
|
(In thousands)
|
December 25, 2011
|
|
December 26, 2010
|
|
||||
|
Pension and other postretirement liabilities
|
$
|
1,013,091
|
|
$
|
931,638
|
|
||
|
Total liabilities
|
$
|
2,373,941
|
|
$
|
2,621,665
|
|
||
|
Percentage of pension and other postretirement liabilities to total liabilities
|
43
|
%
|
36
|
%
|
||||
Pension Benefits
Our Company-sponsored defined benefit pension plans include qualified plans (funded) as well as non-qualified plans (unfunded). These plans provide participating employees with retirement benefits in accordance with benefit formulas detailed in each plan. Our non-qualified plans provide enhanced retirement benefits to select members of management. The New York Times Newspaper Guild pension plan is a qualified plan and is also included in the table below.
We also have a foreign-based pension plan for certain IHT employees (the “foreign plan”). The information for the foreign plan is combined with the information for U.S. non-qualified plans. The benefit obligation of the foreign plan is immaterial to our total benefit obligation.
The funded status of our qualified and non-qualified pension plans as of December 25, 2011 is as follows:
|
|
December 25, 2011
|
|||||||||||
|
(In thousands)
|
Qualified
Plans
|
Non-Qualified
Plans
|
All Plans
|
|||||||||
|
Pension obligation
|
$
|
1,986,502
|
|
$
|
277,060
|
|
$
|
2,263,562
|
|
|||
|
Fair value of plan assets
|
1,464,729
|
|
—
|
|
1,464,729
|
|
||||||
|
Pension underfunded/unfunded obligation
|
$
|
521,773
|
|
$
|
277,060
|
|
$
|
798,833
|
|
|||
We made contributions of approximately $151 million to certain qualified pension plans in 2011. The majority of these contributions were discretionary. We expect to make mandatory contributions, primarily contractual contributions in connection with The New York Times Newspaper Guild pension plan, of approximately $45 million in 2012. We may make discretionary contributions in 2012 to our Company-sponsored qualified pension plans depending on cash flows, pension asset performance, interest rates and other factors.
Pension expense is calculated using a number of actuarial assumptions, including an expected long-term rate of return on assets (for qualified plans) and a discount rate. Our methodology in selecting these actuarial assumptions is discussed below.
In determining the expected long-term rate of return on assets, we evaluated input from our investment consultants, actuaries and investment management firms, including our review of asset class return expectations, as well as long-term historical asset class returns. Projected returns by such consultants and economists are based on broad equity and bond indices. Our objective is to select an average rate of earnings expected on existing plan assets and expected contributions to the plan during the year. The expected long-term rate of return determined on this basis was 8.25% in 2011. Our plan assets had a rate of return of approximately 2% in 2011 and an average annual return of approximately 13% over the three-year period 2009-2011. We regularly review our actual asset allocation and periodically rebalance our investments to meet our investment strategy.
The value (“market-related value”) of plan assets is multiplied by the expected long-term rate of return on assets to compute the expected return on plan assets, a component of net periodic pension cost. The market-related value of plan assets is a calculated value that recognizes changes in fair value over three years.
THE NEW YORK TIMES COMPANY – P.
51
Based on the composition of our assets at the beginning of the year, we estimated our 2012 expected long-term rate of return to be 8.00%, a decline from 8.25% in 2011. If we had decreased our expected long-term rate of return on our plan assets by 50 basis points to 7.75% in 2011, pension expense would have increased by approximately $7 million in 2011 for our qualified pension plans. Our funding requirements would not have been materially affected.
We determined our discount rate using a Ryan ALM, Inc. Curve (the “Ryan Curve”). The Ryan Curve provides the bonds included in the curve and allows adjustments for certain outliers (e.g., bonds on “watch”). We believe the Ryan Curve allows us to calculate an appropriate discount rate.
To determine our discount rate, we project a cash flow based on annual accrued benefits. For active participants, the benefits under the respective pension plans are projected to the date of termination. The projected plan cash flow is discounted to the measurement date, which is the last day of our fiscal year, using the annual spot rates provided in the Ryan Curve. A single discount rate is then computed so that the present value of the benefit cash flow equals the present value computed using the Ryan Curve rates.
The discount rate determined on this basis was 5.05% for our qualified plans and 4.80% for our non-qualified plans as of
December 25, 2011
.
If we had decreased the expected discount rate by 50 basis points to 4.55% for our qualified plans and 4.30% for our non-qualified plans in 2011, pension expense would have increased by approximately $4 million and $0.2 million, respectively, and as of December 25, 2011, our pension obligation would have increased by approximately $135 million and $14 million, respectively.
We will continue to evaluate all of our actuarial assumptions, generally on an annual basis, and will adjust as necessary. Actual pension expense will depend on future investment performance, changes in future discount rates, the level of contributions we make and various other factors.
We also recognize the present value of pension liabilities associated with the withdrawal from multiemployer pension plans. Our multiemployer pension plan withdrawal liability was approximately $100 million as of December 25, 2011. This liability is the present value of the obligations related to complete and partial withdrawals from certain plans as well as an estimate of future partial withdrawals that we considered probable and reasonably estimable. The actual liability will not be known until each plan completes a final assessment of the withdrawal liability and issues a demand to us. Therefore, the estimate of our multiemployer pension plan liability will be adjusted as more information becomes available that allows us to refine our estimates.
See Note 11 of the Notes to the Consolidated Financial Statements for additional information regarding our pension plans.
Other Postretirement Benefits
We provide health benefits to retired employees (and their eligible dependents) who meet the definition of an eligible participant and certain age and service requirements, as outlined in the plan document. While we offer pre-age 65 retiree medical coverage to employees who meet certain retiree medical eligibility requirements, we no longer provide post-age 65 retiree medical benefits for employees who retire on or after March 1, 2009. We also contribute to a postretirement plan under the provisions of a collective bargaining agreement. We accrue the costs of postretirement benefits during the employees’ active years of service and our policy is to pay our portion of insurance premiums and claims from our assets.
The annual postretirement expense was calculated using a number of actuarial assumptions, including a health-care cost trend rate and a discount rate. The health-care cost trend rate decreased to 7.33% as of
December 25, 2011
, from 7.75% as of December 26, 2010. A one-percentage point change in the assumed health-care cost trend rate would result in an increase of $0.4 million or a decrease of $0.3 million in our 2011 service and interest costs, respectively, two factors included in the calculation of postretirement expense. A one-percentage point change in the assumed health-care cost trend rate would result in an increase of approximately $5 million or a decrease of approximately $5 million, in our accumulated benefit obligation as of
December 25, 2011
. Our discount rate assumption for postretirement benefits is consistent with that used in the calculation of pension benefits. See “— Pension Benefits” above for information on our discount rate assumption.
See Notes 11 and 12 of the Notes to the Consolidated Financial Statements for additional information.
P.
52
– THE NEW YORK TIMES COMPANY
RECENT ACCOUNTING PRONOUNCEMENTS
In September 2011, the Financial Accounting Standards Board (“FASB”) amended its guidance on goodwill impairment testing to reduce the cost and complexity of testing goodwill for impairment by providing the option to first perform a qualitative assessment to determine whether it is more likely than not that the fair value of a reporting unit is less than its carrying value. The result of this assessment will determine whether it is necessary to perform the two-step test. The provisions of this new guidance are effective for fiscal years beginning after December 15, 2011, with early adoption permitted. We adopted the new guidance early when we conducted our annual goodwill impairment test in the fourth quarter of 2011. The adoption of this guidance did not have a material impact on our financial statements.
In June 2011, the FASB amended its guidance on the presentation of comprehensive income in financial statements to improve the comparability, consistency and transparency of financial reporting and to increase the prominence of items that are recorded in other comprehensive income. The new accounting guidance requires entities to report components of comprehensive income in either (1) a continuous statement of comprehensive income or (2) two separate but consecutive statements. The provisions of this guidance are effective for fiscal years, and interim periods within those years, beginning after December 15, 2011. We do not anticipate the adoption of this guidance will have a material impact on our financial statements.
In May 2011, the FASB amended its guidance related to fair value measurements in order to align the definition of fair value measurements and the related disclosure requirements between accounting principles generally accepted in the United States of America and International Financial Reporting Standards. These amendments, which are effective for interim and annual periods beginning after December 15, 2011, also change certain existing fair value measurement principles and disclosure requirements. We do not anticipate the adoption of this guidance will have a material impact on our financial statements.
THE NEW YORK TIMES COMPANY – P.
53
|
|
Our market risk is principally associated with the following:
|
•
|
We do not have interest rate risk related to our debt because, as of December 25, 2011, our portfolio does not include variable-rate debt.
|
|
•
|
Newsprint is a commodity subject to supply and demand market conditions. We have equity investments in two paper mills, which provide a partial hedge against price volatility. The cost of raw materials, of which newsprint expense is a major component, represented 8% of our total operating costs in 2011 and 2010. Based on the number of newsprint tons consumed in 2011 and 2010, a $10 per ton increase in newsprint prices would have resulted in additional newsprint expense of $2.2 million (pre-tax) in 2011 and $2.3 million (pre-tax) in 2010.
|
|
•
|
A significant portion of our employees are unionized and our results could be adversely affected if labor negotiations were to restrict our ability to maximize the efficiency of our operations. In addition, if we were to experience labor unrest, strikes or other business interruptions in connection with labor negotiations, or if we are unable to negotiate labor contracts on reasonable terms, our ability to produce and deliver our most significant products could be impaired.
|
See Notes 4, 7, 8 and 20 of the Notes to the Consolidated Financial Statements.
P.
54
– THE NEW YORK TIMES COMPANY
|
|
THE NEW YORK TIMES COMPANY 2011 FINANCIAL REPORT
|
INDEX
|
PAGE
|
|
Management’s Responsibilities Report
|
|
|
Management’s Report on Internal Control Over Financial Reporting
|
|
|
Report of Independent Registered Public Accounting Firm on Consolidated Financial Statements
|
|
|
Report of Independent Registered Public Accounting Firm on Internal Control Over Financial Reporting
|
|
|
Consolidated Statements of Operations for the years ended December 25, 2011, December 26, 2010 and December 27, 2009
|
|
|
Consolidated Balance Sheets as of December 25, 2011 and December 26, 2010
|
|
|
Consolidated Statements of Cash Flows for the years ended December 25, 2011, December 26, 2010 and December 27, 2009
|
|
|
Consolidated Statements of Changes in Stockholders’ Equity for the years ended December 25, 2011, December 26, 2010 and December 27, 2009
|
|
|
Notes to the Consolidated Financial Statements
|
|
|
1. Basis of Presentation
|
|
|
2. Summary of Significant Accounting Policies
|
|
|
3. Short-Term Investments
|
|
|
4. Inventories
|
|
|
5. Impairment of Assets
|
|
|
6. Goodwill and Other Intangible Assets Acquired
|
|
|
7. Investments in Joint Ventures
|
|
|
8. Debt Obligations
|
|
|
9. Other
|
|
|
10. Fair Value Measurements
|
|
|
11. Pension Benefits
|
|
|
12. Other Postretirement Benefits
|
|
|
13. Other Liabilities
|
|
|
14. Income Taxes
|
|
|
15. Discontinued Operations
|
|
|
16. Earnings/(Loss) Per Share
|
|
|
17. Stock-Based Awards
|
|
|
18. Stockholders’ Equity
|
|
|
19. Segment Information
|
|
|
20. Commitments and Contingent Liabilities
|
|
|
21. Subsequent Events
|
|
|
Quarterly Information (Unaudited)
|
|
|
Schedule II – Valuation and Qualifying Accounts for the three years ended December 25, 2011
|
|
THE NEW YORK TIMES COMPANY – P.
55
MANAGEMENT’S
RESPONSIBILITIES REPORT
The Company’s consolidated financial statements were prepared by management, who is responsible for their integrity and objectivity. The consolidated financial statements have been prepared in accordance with accounting principles generally accepted in the United States of America (“GAAP”) and, as such, include amounts based on management’s best estimates and judgments.
Management is further responsible for establishing and maintaining adequate internal control over financial reporting as defined in Rules 13a-15(f) and 15d-15(f) under the Securities Exchange Act of 1934. The Company’s internal control over financial reporting is a process designed to provide reasonable assurance regarding the reliability of financial reporting and the preparation of financial statements for external purposes in accordance with GAAP. The Company follows and continuously monitors its policies and procedures for internal control over financial reporting to ensure that this objective is met (see “Management’s Report on Internal Control Over Financial Reporting” below).
The consolidated financial statements were audited by Ernst & Young LLP, an independent registered public accounting firm, in 2011, 2010 and 2009. Its audits were conducted in accordance with the standards of the Public Company Accounting Oversight Board (United States) and its report is shown on Page 58.
The Audit Committee of the Board of Directors, which is composed solely of independent directors, meets regularly with the independent registered public accounting firm, internal auditors and management to discuss specific accounting, financial reporting and internal control matters. Both the independent registered public accounting firm and the internal auditors have full and free access to the Audit Committee. Each year the Audit Committee selects, subject to ratification by stockholders, the firm which is to perform audit and other related work for the Company.
|
T
HE
N
EW
Y
ORK
T
IMES
C
OMPANY
|
T
HE
N
EW
Y
ORK
T
IMES
C
OMPANY
|
||||
|
BY:
|
/s/ A
RTHUR
S
ULZBERGER,
J
R.
|
BY:
|
/s/ J
AMES
M. F
OLLO
|
||
|
Arthur Sulzberger, Jr.
|
James M. Follo
|
||||
|
Chairman and Chief Executive Officer
|
Senior Vice President and Chief Financial Officer
|
||||
|
February 23, 2012
|
February 23, 2012
|
||||
P.
56
– THE NEW YORK TIMES COMPANY
MANAGEMENT’S REPORT ON INTERNAL CONTROL OVER FINANCIAL REPORTING
Management of the Company is responsible for establishing and maintaining adequate internal control over financial reporting as defined in Rules 13a-15(f) and 15d-15(f) under the Securities Exchange Act of 1934. The Company’s internal control over financial reporting is a process designed to provide reasonable assurance regarding the reliability of financial reporting and the preparation of financial statements for external purposes in accordance with GAAP. The Company’s internal control over financial reporting includes those policies and procedures that:
|
•
|
pertain to the maintenance of records that, in reasonable detail, accurately and fairly reflect the transactions and dispositions of the assets of the Company;
|
|
•
|
provide reasonable assurance that transactions are recorded as necessary to permit preparation of financial statements in accordance with GAAP, and that receipts and expenditures of the Company are being made only in accordance with authorizations of management and directors of the Company; and
|
|
•
|
provide reasonable assurance regarding prevention or timely detection of unauthorized acquisition, use or disposition of the Company’s assets that could have a material effect on the financial statements.
|
Because of its inherent limitations, internal control over financial reporting may not prevent or detect misstatements. Also, projections of any evaluation of effectiveness to future periods are subject to the risk that controls may become inadequate because of changes in conditions, or that the degree of compliance with the policies or procedures may deteriorate.
Management assessed the effectiveness of the Company’s internal control over financial reporting as of
December 25, 2011
. In making this assessment, management used the criteria set forth by the Committee of Sponsoring Organizations of the Treadway Commission in Internal Control – Integrated Framework. Based on its assessment, management concluded that the Company’s internal control over financial reporting was effective as of
December 25, 2011
.
The Company’s independent registered public accounting firm, Ernst & Young LLP, that audited the consolidated financial statements of the Company included in this Annual Report on Form 10-K, has issued an attestation report on the Company’s internal control over financial reporting as of
December 25, 2011
, which is included on Page 59 in this Annual Report on Form 10-K.
THE NEW YORK TIMES COMPANY – P.
57
REPORT OF INDEPENDENT REGISTERED PUBLIC ACCOUNTING FIRM ON CONSOLIDATED FINANCIAL STATEMENTS
To the Board of Directors and Stockholders of
The New York Times Company
New York, NY
We have audited the accompanying consolidated balance sheets of The New York Times Company as of
December 25, 2011
and December 26, 2010, and the related consolidated statements of operations, changes in stockholders’ equity, and cash flows for each of the three fiscal years in the period ended
December 25, 2011
. Our audits also included the financial statement schedule listed at Item 15(A)(2) of The New York Times Company’s 2011 Annual Report on Form 10-K. These financial statements and schedule are the responsibility of The New York Times Company’s management. Our responsibility is to express an opinion on these financial statements and schedule based on our audits.
We conducted our audits in accordance with the standards of the Public Company Accounting Oversight Board (United States). Those standards require that we plan and perform the audit to obtain reasonable assurance about whether the financial statements are free of material misstatement. An audit includes examining, on a test basis, evidence supporting the amounts and disclosures in the financial statements. An audit also includes assessing the accounting principles used and significant estimates made by management, as well as evaluating the overall financial statement presentation. We believe that our audits provide a reasonable basis for our opinion.
In our opinion, the financial statements referred to above present fairly, in all material respects, the consolidated financial position of The New York Times Company at
December 25, 2011
and December 26, 2010, and the consolidated results of its operations and its cash flows for each of the three fiscal years in the period ended
December 25, 2011
, in conformity with U.S. generally accepted accounting principles. Also, in our opinion, the related financial statement schedule, when considered in relation to the basic financial statements taken as a whole, presents fairly in all material respects, the information set forth therein.
We also have audited, in accordance with the standards of the Public Company Accounting Oversight Board (United States), The New York Times Company’s internal control over financial reporting as of
December 25, 2011
, based on criteria established in Internal Control — Integrated Framework issued by the Committee of Sponsoring Organizations of the Treadway Commission, and our report dated
February 23, 2012
expressed an unqualified opinion thereon.
/s/ Ernst & Young LLP
New York, New York
February 23, 2012
P.
58
– THE NEW YORK TIMES COMPANY
REPORT OF INDEPENDENT REGISTERED PUBLIC ACCOUNTING FIRM ON INTERNAL CONTROL OVER FINANCIAL REPORTING
To the Board of Directors and Stockholders of
The New York Times Company
New York, NY
We have audited The New York Times Company’s internal control over financial reporting as of
December 25, 2011
, based on criteria established in Internal Control — Integrated Framework issued by the Committee of Sponsoring Organizations of the Treadway Commission (the COSO criteria). The New York Times Company’s management is responsible for maintaining effective internal control over financial reporting, and for its assessment of the effectiveness of internal control over financial reporting included in the accompanying Management’s Report on Internal Control over Financial Reporting. Our responsibility is to express an opinion on The New York Times Company’s internal control over financial reporting based on our audit.
We conducted our audit in accordance with the standards of the Public Company Accounting Oversight Board (United States). Those standards require that we plan and perform the audit to obtain reasonable assurance about whether effective internal control over financial reporting was maintained in all material respects. Our audit included obtaining an understanding of internal control over financial reporting, assessing the risk that a material weakness exists, testing and evaluating the design and operating effectiveness of internal control based on the assessed risk, and performing such other procedures as we considered necessary in the circumstances. We believe that our audit provides a reasonable basis for our opinion.
A company’s internal control over financial reporting is a process designed to provide reasonable assurance regarding the reliability of financial reporting and the preparation of financial statements for external purposes in accordance with generally accepted accounting principles. A company’s internal control over financial reporting includes those policies and procedures that (1) pertain to the maintenance of records that, in reasonable detail, accurately and fairly reflect the transactions and dispositions of the assets of the company; (2) provide reasonable assurance that transactions are recorded as necessary to permit preparation of financial statements in accordance with generally accepted accounting principles, and that receipts and expenditures of the company are being made only in accordance with authorizations of management and directors of the company; and (3) provide reasonable assurance regarding prevention or timely detection of unauthorized acquisition, use, or disposition of the company’s assets that could have a material effect on the financial statements.
Because of its inherent limitations, internal control over financial reporting may not prevent or detect misstatements. Also, projections of any evaluation of effectiveness to future periods are subject to the risk that controls may become inadequate because of changes in conditions, or that the degree of compliance with the policies or procedures may deteriorate.
In our opinion, The New York Times Company maintained, in all material respects, effective internal control over financial reporting as of
December 25, 2011
based on the COSO criteria.
We also have audited, in accordance with the standards of the Public Company Accounting Oversight Board (United States), the consolidated balance sheets of The New York Times Company as of
December 25, 2011
and December 26, 2010, and the related consolidated statements of operations, changes in stockholders’ equity, and cash flows for each of the three fiscal years in the period ended
December 25, 2011
and our report dated
February 23, 2012
expressed an unqualified opinion thereon.
/s/ Ernst & Young LLP
New York, New York
February 23, 2012
THE NEW YORK TIMES COMPANY – P.
59
|
|
Years Ended
|
|||||||||||
|
(In thousands)
|
December 25,
2011 |
|
December 26,
2010 |
|
December 27,
2009 |
|
||||||
|
Revenues
|
||||||||||||
|
Advertising
|
$
|
1,221,497
|
|
$
|
1,300,361
|
|
$
|
1,336,291
|
|
|||
|
Circulation
|
941,468
|
|
931,493
|
|
936,486
|
|
||||||
|
Other
|
160,436
|
|
161,609
|
|
167,662
|
|
||||||
|
Total
|
2,323,401
|
|
2,393,463
|
|
2,440,439
|
|
||||||
|
Operating costs
|
||||||||||||
|
Production costs:
|
||||||||||||
|
Raw materials
|
161,691
|
|
160,422
|
|
166,387
|
|
||||||
|
Wages and benefits
|
495,607
|
|
498,270
|
|
524,782
|
|
||||||
|
Other
|
300,169
|
|
303,086
|
|
330,061
|
|
||||||
|
Total production costs
|
957,467
|
|
961,778
|
|
1,021,230
|
|
||||||
|
Selling, general and administrative costs
|
1,019,611
|
|
1,054,199
|
|
1,152,874
|
|
||||||
|
Depreciation and amortization
|
116,454
|
|
120,950
|
|
133,696
|
|
||||||
|
Total operating costs
|
2,093,532
|
|
2,136,927
|
|
2,307,800
|
|
||||||
|
Impairment of assets
|
164,434
|
|
16,148
|
|
4,179
|
|
||||||
|
Pension withdrawal expense
|
4,228
|
|
6,268
|
|
78,931
|
|
||||||
|
Loss on leases and other expenses
|
4,500
|
|
—
|
|
34,633
|
|
||||||
|
Net pension curtailment gain
|
—
|
|
—
|
|
53,965
|
|
||||||
|
Gain on sale of assets
|
—
|
|
—
|
|
5,198
|
|
||||||
|
Operating profit
|
56,707
|
|
234,120
|
|
74,059
|
|
||||||
|
Gain on sale of investments
|
71,171
|
|
9,128
|
|
—
|
|
||||||
|
Income from joint ventures
|
28
|
|
19,035
|
|
20,667
|
|
||||||
|
Premium on debt redemptions
|
46,381
|
|
—
|
|
9,250
|
|
||||||
|
Interest expense, net
|
85,243
|
|
85,062
|
|
81,701
|
|
||||||
|
(Loss)/income from continuing operations before income taxes
|
(3,718
|
)
|
177,221
|
|
3,775
|
|
||||||
|
Income tax expense
|
36,506
|
|
68,516
|
|
2,206
|
|
||||||
|
(Loss)/income from continuing operations
|
(40,224
|
)
|
108,705
|
|
1,569
|
|
||||||
|
Discontinued operations:
|
||||||||||||
|
Loss from discontinued operations, net of income taxes
|
—
|
|
—
|
|
(1,156
|
)
|
||||||
|
Gain on sale, net of income taxes
|
—
|
|
13
|
|
19,488
|
|
||||||
|
Income from discontinued operations, net of income taxes
|
—
|
|
13
|
|
18,332
|
|
||||||
|
Net (loss)/income
|
(40,224
|
)
|
108,718
|
|
19,901
|
|
||||||
|
Net loss/(income) attributable to the noncontrolling interest
|
555
|
|
(1,014
|
)
|
(10
|
)
|
||||||
|
Net (loss)/income attributable to The New York Times Company common stockholders
|
$
|
(39,669
|
)
|
$
|
107,704
|
|
$
|
19,891
|
|
|||
|
Amounts attributable to The New York Times Company common stockholders:
|
||||||||||||
|
(Loss)/income from continuing operations
|
$
|
(39,669
|
)
|
$
|
107,691
|
|
$
|
1,559
|
|
|||
|
Income from discontinued operations, net of income taxes
|
—
|
|
13
|
|
18,332
|
|
||||||
|
Net (loss)/income
|
$
|
(39,669
|
)
|
$
|
107,704
|
|
$
|
19,891
|
|
|||
See Notes to the Consolidated Financial Statements
P.
60
– THE NEW YORK TIMES COMPANY
CONSOLIDATED STATEMENTS OF OPERATIONS — continued
|
|
Years Ended
|
|||||||||||
|
(In thousands, except per share data)
|
December 25,
2011 |
|
December 26,
2010 |
|
December 27,
2009 |
|
||||||
|
Average number of common shares outstanding:
|
||||||||||||
|
Basic
|
147,190
|
|
145,636
|
|
144,188
|
|
||||||
|
Diluted
|
147,190
|
|
152,600
|
|
146,367
|
|
||||||
|
Basic (loss)/earnings per share attributable to The New York Times Company common stockholders:
|
||||||||||||
|
(Loss)/income from continuing operations
|
$
|
(0.27
|
)
|
$
|
0.74
|
|
$
|
0.01
|
|
|||
|
Income from discontinued operations, net of income taxes
|
0.00
|
|
0.00
|
|
0.13
|
|
||||||
|
Net (loss)/income
|
$
|
(0.27
|
)
|
$
|
0.74
|
|
$
|
0.14
|
|
|||
|
Diluted (loss)/earnings per share attributable to The New York Times Company common stockholders:
|
||||||||||||
|
(Loss)/income from continuing operations
|
$
|
(0.27
|
)
|
$
|
0.71
|
|
$
|
0.01
|
|
|||
|
Income from discontinued operations, net of income taxes
|
0.00
|
|
0.00
|
|
0.13
|
|
||||||
|
Net (loss)/income
|
$
|
(0.27
|
)
|
$
|
0.71
|
|
$
|
0.14
|
|
|||
See Notes to the Consolidated Financial Statements
THE NEW YORK TIMES COMPANY – P.
61
|
(In thousands, except share and per share data)
|
December 25,
2011 |
|
December 26,
2010 |
|
||||
|
Assets
|
||||||||
|
Current assets
|
||||||||
|
Cash and cash equivalents
|
$
|
175,151
|
|
$
|
369,668
|
|
||
|
Short-term investments
|
104,846
|
|
29,974
|
|
||||
|
Restricted cash
|
27,628
|
|
—
|
|
||||
|
Accounts receivable (net of allowances: 2011 – $18,637; 2010 – $30,209)
|
288,355
|
|
302,245
|
|
||||
|
Inventories
|
21,087
|
|
16,132
|
|
||||
|
Deferred income taxes
|
73,055
|
|
68,875
|
|
||||
|
Other current assets
|
58,467
|
|
70,338
|
|
||||
|
Total current assets
|
748,589
|
|
857,232
|
|
||||
|
Investments in joint ventures
|
82,019
|
|
134,641
|
|
||||
|
Property, plant and equipment:
|
||||||||
|
Equipment
|
1,189,768
|
|
1,166,697
|
|
||||
|
Buildings, building equipment and improvements
|
865,330
|
|
873,801
|
|
||||
|
Land
|
140,413
|
|
140,997
|
|
||||
|
Assets in progress
|
15,032
|
|
24,247
|
|
||||
|
Total, at cost
|
2,210,543
|
|
2,205,742
|
|
||||
|
Less: accumulated depreciation and amortization
|
(1,125,353
|
)
|
(1,048,956
|
)
|
||||
|
Property, plant and equipment, net
|
1,085,190
|
|
1,156,786
|
|
||||
|
Intangible assets acquired:
|
||||||||
|
Goodwill (less accumulated impairment losses of $957,311 in 2011 and $805,218 in 2010)
|
488,894
|
|
644,464
|
|
||||
|
Other intangible assets acquired (less accumulated amortization of $71,223 in 2011 and $69,383 in 2010)
|
17,615
|
|
35,415
|
|
||||
|
Total intangible assets acquired
|
506,509
|
|
679,879
|
|
||||
|
Deferred income taxes
|
280,283
|
|
255,701
|
|
||||
|
Miscellaneous assets
|
180,860
|
|
201,502
|
|
||||
|
Total assets
|
$
|
2,883,450
|
|
$
|
3,285,741
|
|
||
See Notes to Consolidated Financial Statements
P.
62
– THE NEW YORK TIMES COMPANY
CONSOLIDATED BALANCE SHEETS — continued
|
(In thousands, except share and per share data)
|
December 25,
2011 |
|
December 26,
2010 |
|
||||
|
Liabilities and stockholders’ equity
|
||||||||
|
Current liabilities
|
||||||||
|
Accounts payable
|
$
|
103,894
|
|
$
|
113,968
|
|
||
|
Accrued payroll and other related liabilities
|
112,024
|
|
143,850
|
|
||||
|
Unexpired subscriptions
|
74,350
|
|
72,896
|
|
||||
|
Accrued expenses
|
148,120
|
|
173,625
|
|
||||
|
Current portion of long-term debt and capital lease obligations
|
74,920
|
|
38
|
|
||||
|
Total current liabilities
|
513,308
|
|
504,377
|
|
||||
|
Other liabilities
|
||||||||
|
Long-term debt and capital lease obligations
|
698,220
|
|
996,405
|
|
||||
|
Pension benefits obligation
|
880,504
|
|
772,785
|
|
||||
|
Postretirement benefits obligation
|
104,192
|
|
130,623
|
|
||||
|
Other
|
177,717
|
|
217,475
|
|
||||
|
Total other liabilities
|
1,860,633
|
|
2,117,288
|
|
||||
|
Stockholders’ equity
|
||||||||
|
Serial preferred stock of $1 par value – authorized 200,000 shares – none issued
|
—
|
|
—
|
|
||||
|
Common stock of $.10 par value:
|
||||||||
|
Class A – authorized 300,000,000 shares; issued: 2011 – 150,007,446; 2010 – 149,302,487 (including treasury shares: 2011 – 2,979,786; 2010 – 3,970,238)
|
15,001
|
|
14,930
|
|
||||
|
Class B – convertible – authorized and issued shares: 2011 – 818,885; 2010 – 819,125 (including treasury shares: 2011 – none; 2010 – none)
|
82
|
|
82
|
|
||||
|
Additional paid-in capital
|
32,024
|
|
40,155
|
|
||||
|
Retained earnings
|
1,086,625
|
|
1,126,294
|
|
||||
|
Common stock held in treasury, at cost
|
(110,974
|
)
|
(134,463
|
)
|
||||
|
Accumulated other comprehensive loss, net of income taxes:
|
||||||||
|
Foreign currency translation adjustments
|
10,928
|
|
11,298
|
|
||||
|
Unrealized derivative loss on cash-flow hedge of equity method investment
|
(652
|
)
|
(1,143
|
)
|
||||
|
Funded status of benefit plans
|
(526,674
|
)
|
(397,226
|
)
|
||||
|
Total accumulated other comprehensive loss, net of income taxes
|
(516,398
|
)
|
(387,071
|
)
|
||||
|
Total New York Times Company stockholders’ equity
|
506,360
|
|
659,927
|
|
||||
|
Noncontrolling interest
|
3,149
|
|
4,149
|
|
||||
|
Total stockholders’ equity
|
509,509
|
|
664,076
|
|
||||
|
Total liabilities and stockholders’ equity
|
$
|
2,883,450
|
|
$
|
3,285,741
|
|
||
See Notes to Consolidated Financial Statements
THE NEW YORK TIMES COMPANY – P.
63
|
|
Years Ended
|
||||||||
|
(In thousands)
|
December 25,
2011 |
|
December 26,
2010 |
|
December 27,
2009 |
|
|||
|
Cash flows from operating activities
|
|||||||||
|
Net (loss)/income
|
$
|
(40,224
|
)
|
$
|
108,718
|
|
$
|
19,901
|
|
|
Adjustments to reconcile net (loss)/income to net cash provided by operating activities:
|
|||||||||
|
Impairment of assets
|
164,434
|
|
16,148
|
|
4,179
|
|
|||
|
Pension withdrawal expense
|
4,228
|
|
6,268
|
|
78,931
|
|
|||
|
Loss on leases and other expenses
|
4,500
|
|
—
|
|
34,633
|
|
|||
|
Gain on sale of investments
|
(71,171
|
)
|
(9,128
|
)
|
—
|
|
|||
|
Premium on debt redemptions
|
46,381
|
|
—
|
|
9,250
|
|
|||
|
Net pension curtailment gain
|
—
|
|
—
|
|
(53,965
|
)
|
|||
|
Gain on sale of Radio Operations
|
—
|
|
(16
|
)
|
(34,914
|
)
|
|||
|
Gain on sale of assets
|
—
|
|
—
|
|
(5,198
|
)
|
|||
|
Depreciation and amortization
|
116,454
|
|
120,950
|
|
133,775
|
|
|||
|
Stock-based compensation expense
|
8,497
|
|
7,029
|
|
11,250
|
|
|||
|
Undistributed loss/(income) of equity method investments – net of dividends
|
3,435
|
|
(10,710
|
)
|
(17,892
|
)
|
|||
|
Deferred income taxes
|
60,741
|
|
61,271
|
|
44,431
|
|
|||
|
Long-term retirement benefit obligations
|
(141,714
|
)
|
(167,498
|
)
|
13,936
|
|
|||
|
Other – net
|
(462
|
)
|
5,611
|
|
9,816
|
|
|||
|
Changes in operating assets and liabilities – net of dispositions:
|
|||||||||
|
Accounts receivable – net
|
12,603
|
|
39,830
|
|
52,817
|
|
|||
|
Inventories
|
(4,955
|
)
|
171
|
|
8,324
|
|
|||
|
Other current assets
|
1,820
|
|
(572
|
)
|
15,798
|
|
|||
|
Accounts payable and other liabilities
|
(93,581
|
)
|
(20,137
|
)
|
(75,432
|
)
|
|||
|
Unexpired subscriptions
|
2,941
|
|
(4,608
|
)
|
(2,387
|
)
|
|||
|
Net cash provided by operating activities
|
73,927
|
|
153,327
|
|
247,253
|
|
|||
|
Cash flows from investing activities
|
|||||||||
|
Purchase of short-term investments
|
(279,721
|
)
|
(29,974
|
)
|
—
|
|
|||
|
Maturities of short-term investments
|
204,849
|
|
—
|
|
—
|
|
|||
|
Proceeds from sale/(purchase) of investments – net
|
117,966
|
|
9,254
|
|
(1,338
|
)
|
|||
|
Capital expenditures
|
(44,887
|
)
|
(33,565
|
)
|
(51,056
|
)
|
|||
|
Change in restricted cash
|
(27,628
|
)
|
—
|
|
—
|
|
|||
|
Proceeds from the sale of assets
|
11,167
|
|
2,265
|
|
26,543
|
|
|||
|
Loan repayments/(issuance) – net
|
—
|
|
11,500
|
|
(11,500
|
)
|
|||
|
Proceeds from the sale of Radio Operations
|
—
|
|
—
|
|
45,424
|
|
|||
|
Net cash (used in)/provided by investing activities
|
(18,254
|
)
|
(40,520
|
)
|
8,073
|
|
|||
|
Cash flows from financing activities
|
|||||||||
|
Long-term obligations:
|
|||||||||
|
Proceeds from issuance of senior unsecured notes
|
—
|
|
220,248
|
|
221,322
|
|
|||
|
Repayments
|
(590
|
)
|
(592
|
)
|
(98,958
|
)
|
|||
|
Proceeds from sale-leaseback financing
|
—
|
|
—
|
|
210,502
|
|
|||
|
Redemption of long-term debt
|
(250,000
|
)
|
—
|
|
(250,000
|
)
|
|||
|
Capital shares:
|
|||||||||
|
Issuance
|
364
|
|
1,010
|
|
443
|
|
|||
|
Repurchases
|
—
|
|
—
|
|
(489
|
)
|
|||
|
Proceeds from sale of warrants
|
—
|
|
—
|
|
20,529
|
|
|||
|
Repayments under revolving credit agreements – net
|
—
|
|
—
|
|
(380,000
|
)
|
|||
|
Net cash (used in)/provided by financing activities
|
(250,226
|
)
|
220,666
|
|
(276,651
|
)
|
|||
|
Net (decrease)/increase in cash and cash equivalents
|
(194,553
|
)
|
333,473
|
|
(21,325
|
)
|
|||
|
Effect of exchange rate changes on cash and cash equivalents
|
36
|
|
(325
|
)
|
1,061
|
|
|||
|
Cash and cash equivalents at the beginning of the year
|
369,668
|
|
36,520
|
|
56,784
|
|
|||
|
Cash and cash equivalents at the end of the year
|
$
|
175,151
|
|
$
|
369,668
|
|
$
|
36,520
|
|
See Notes to the Consolidated Financial Statements
P.
64
– THE NEW YORK TIMES COMPANY
SUPPLEMENTAL DISCLOSURES TO CONSOLIDATED STATEMENTS OF CASH FLOWS
Cash Flow Information
|
|
Years Ended
|
|||||||||
|
(In thousands)
|
December 25,
2011 |
|
December 26,
2010 |
|
December 27,
2009 |
|
||||
|
Cash payments
|
||||||||||
|
Interest
|
$
|
98,763
|
|
$
|
76,748
|
|
$
|
68,976
|
|
|
|
Income tax (refunds)/paid – net
|
$
|
(22,757
|
)
|
$
|
18,948
|
|
$
|
(23,692
|
)
|
|
See Notes to the Consolidated Financial Statements
THE NEW YORK TIMES COMPANY – P.
65
CONSOLIDATED STATEMENTS OF CHANGES IN STOCKHOLDERS’ EQUITY
|
(In thousands,
except share and
per share data)
|
Capital
Stock
Class A
and
Class B Common
|
Additional
Paid-in
Capital
|
Retained
Earnings
|
Common
Stock
Held in
Treasury,
at Cost
|
Accumulated
Other
Compre-
hensive
Loss, Net of
Income
Taxes
|
Total
New York
Times
Company
Stock-
holders’
Equity
|
Non-
controlling
Interest
|
Total
Stock-
holders’
Equity
|
|||||||||||||||||
|
Balance, December 28, 2008
|
$
|
14,889
|
|
$
|
22,149
|
|
$
|
998,699
|
|
$
|
(159,679
|
)
|
$
|
(372,095
|
)
|
$
|
503,963
|
|
$
|
3,066
|
|
$
|
507,029
|
|
|
|
Comprehensive income:
|
|||||||||||||||||||||||||
|
Net income
|
—
|
|
—
|
|
19,891
|
|
—
|
|
—
|
|
19,891
|
|
10
|
|
19,901
|
|
|||||||||
|
Foreign currency translation income (net of tax expense of $533)
|
—
|
|
—
|
|
—
|
|
—
|
|
2,345
|
|
2,345
|
|
—
|
|
2,345
|
|
|||||||||
|
Unrealized derivative loss on cash-flow hedge of equity method investment (net of tax benefit of $523)
|
—
|
|
—
|
|
—
|
|
—
|
|
(697
|
)
|
(697
|
)
|
—
|
|
(697
|
)
|
|||||||||
|
Change in unrecognized amounts included in pension and postretirement obligations (net of tax expense of $24,754)
|
—
|
|
—
|
|
—
|
|
—
|
|
46,683
|
|
46,683
|
|
125
|
|
46,808
|
|
|||||||||
|
Comprehensive income
|
68,222
|
|
135
|
|
68,357
|
|
|||||||||||||||||||
|
Issuance of warrants
|
—
|
|
20,529
|
|
—
|
|
—
|
|
—
|
|
20,529
|
|
—
|
|
20,529
|
|
|||||||||
|
Issuance of shares:
|
|||||||||||||||||||||||||
|
Retirement units – 3,385 Class A shares
|
—
|
|
(30
|
)
|
—
|
|
75
|
|
—
|
|
45
|
|
—
|
|
45
|
|
|||||||||
|
Employee stock purchase plan – 139,904 Class A shares
|
14
|
|
827
|
|
—
|
|
—
|
|
—
|
|
841
|
|
—
|
|
841
|
|
|||||||||
|
Stock options – 118,400 Class A shares
|
12
|
|
417
|
|
—
|
|
—
|
|
—
|
|
429
|
|
—
|
|
429
|
|
|||||||||
|
Stock conversions – 159 Class B shares to A shares
|
—
|
|
—
|
|
—
|
|
—
|
|
—
|
|
—
|
|
—
|
|
—
|
|
|||||||||
|
Restricted shares forfeited – 2,585 Class A shares
|
—
|
|
57
|
|
—
|
|
(57
|
)
|
—
|
|
—
|
|
—
|
|
—
|
|
|||||||||
|
Restricted stock units vested – 57,520 Class A shares
|
—
|
|
(1,079
|
)
|
—
|
|
908
|
|
—
|
|
(171
|
)
|
—
|
|
(171
|
)
|
|||||||||
|
401(k) Company stock match – 444,936 Class A shares
|
—
|
|
(7,466
|
)
|
—
|
|
9,940
|
|
—
|
|
2,474
|
|
—
|
|
2,474
|
|
|||||||||
|
Stock-based compensation
|
—
|
|
10,433
|
|
—
|
|
—
|
|
—
|
|
10,433
|
|
—
|
|
10,433
|
|
|||||||||
|
Tax shortfall from equity award exercises
|
—
|
|
(2,234
|
)
|
—
|
|
—
|
|
—
|
|
(2,234
|
)
|
—
|
|
(2,234
|
)
|
|||||||||
|
Repurchase of stock – 52,412 Class A shares
|
—
|
|
—
|
|
—
|
|
(489
|
)
|
—
|
|
(489
|
)
|
—
|
|
(489
|
)
|
|||||||||
|
Balance, December 27, 2009
|
14,915
|
|
43,603
|
|
1,018,590
|
|
(149,302
|
)
|
(323,764
|
)
|
604,042
|
|
3,201
|
|
607,243
|
|
|||||||||
See Notes to the Consolidated Financial Statements
P.
66
– THE NEW YORK TIMES COMPANY
CONSOLIDATED STATEMENTS OF CHANGES IN STOCKHOLDERS’ EQUITY — continued
|
(In thousands,
except share and
per share data)
|
Capital
Stock
Class A
and
Class B Common
|
Additional
Paid-in
Capital
|
Retained
Earnings
|
Common
Stock
Held in
Treasury,
at Cost
|
Accumulated
Other
Compre-
hensive
Loss, Net of
Income
Taxes
|
Total
New York
Times
Company
Stock-
holders’
Equity
|
Non-
controlling
Interest
|
Total
Stock-
holders’
Equity
|
|||||||||
|
Comprehensive income:
|
|||||||||||||||||
|
Net income
|
—
|
|
—
|
|
107,704
|
|
—
|
|
—
|
|
107,704
|
|
1,014
|
|
108,718
|
|
|
|
Foreign currency translation loss (net of tax benefit of $4,076)
|
—
|
|
—
|
|
—
|
|
—
|
|
(5,540
|
)
|
(5,540
|
)
|
—
|
|
(5,540
|
)
|
|
|
Unrealized derivative loss on cash-flow hedge of equity method investment (net of tax benefit of $316)
|
—
|
|
—
|
|
—
|
|
—
|
|
(446
|
)
|
(446
|
)
|
—
|
|
(446
|
)
|
|
|
Change in unrecognized amounts included in pension and postretirement obligations (net of tax benefit of $39,281)
|
—
|
|
—
|
|
—
|
|
—
|
|
(57,321
|
)
|
(57,321
|
)
|
(66
|
)
|
(57,387
|
)
|
|
|
Comprehensive income
|
44,397
|
|
948
|
|
45,345
|
|
|||||||||||
|
Issuance of shares:
|
|||||||||||||||||
|
Retirement units – 18,038 Class A shares
|
—
|
|
(109
|
)
|
—
|
|
427
|
|
—
|
|
318
|
|
—
|
|
318
|
|
|
|
Employee stock purchase plan – 722,916 Class A shares
|
72
|
|
3,761
|
|
—
|
|
—
|
|
—
|
|
3,833
|
|
—
|
|
3,833
|
|
|
|
Stock options – 257,600 Class A shares
|
25
|
|
913
|
|
—
|
|
—
|
|
—
|
|
938
|
|
—
|
|
938
|
|
|
|
Stock conversions – 6,350 Class B shares to A shares
|
—
|
|
—
|
|
—
|
|
—
|
|
—
|
|
—
|
|
—
|
|
—
|
|
|
|
Restricted stock units vested – 203,566 Class A shares
|
—
|
|
(6,180
|
)
|
—
|
|
4,828
|
|
—
|
|
(1,352
|
)
|
—
|
|
(1,352
|
)
|
|
|
401(k) Company stock match – 435,895 Class A shares
|
—
|
|
(5,106
|
)
|
—
|
|
9,584
|
|
—
|
|
4,478
|
|
—
|
|
4,478
|
|
|
|
Stock-based compensation
|
—
|
|
7,119
|
|
—
|
|
—
|
|
—
|
|
7,119
|
|
—
|
|
7,119
|
|
|
|
Tax shortfall from equity award exercises
|
—
|
|
(3,846
|
)
|
—
|
|
—
|
|
—
|
|
(3,846
|
)
|
—
|
|
(3,846
|
)
|
|
|
Balance, December 26, 2010
|
15,012
|
|
40,155
|
|
1,126,294
|
|
(134,463
|
)
|
(387,071
|
)
|
659,927
|
|
4,149
|
|
664,076
|
|
|
See Notes to the Consolidated Financial Statements
THE NEW YORK TIMES COMPANY – P.
67
CONSOLIDATED STATEMENTS OF CHANGES IN STOCKHOLDERS’ EQUITY — continued
|
(In thousands,
except share and
per share data)
|
Capital
Stock
Class A
and
Class B Common
|
Additional
Paid-in
Capital
|
Retained
Earnings
|
Common
Stock
Held in
Treasury,
at Cost
|
Accumulated
Other
Compre-
hensive
Loss, Net of
Income
Taxes
|
Total
New York
Times
Company
Stock-
holders’
Equity
|
Non-
controlling
Interest
|
Total
Stock-
holders’
Equity
|
|||||||||||||||||
|
Comprehensive loss:
|
|||||||||||||||||||||||||
|
Net loss
|
—
|
|
—
|
|
(39,669
|
)
|
—
|
|
—
|
|
(39,669
|
)
|
(555
|
)
|
(40,224
|
)
|
|||||||||
|
Foreign currency translation loss (net of tax benefit of $153)
|
—
|
|
—
|
|
—
|
|
—
|
|
(370
|
)
|
(370
|
)
|
—
|
|
(370
|
)
|
|||||||||
|
Unrealized derivative gain on cash-flow hedge of equity method investment (net of tax expense of $348)
|
—
|
|
—
|
|
—
|
|
—
|
|
491
|
|
491
|
|
—
|
|
491
|
|
|||||||||
|
Change in unrecognized amounts included in pension and postretirement obligations (net of tax benefit of $89,697)
|
—
|
|
—
|
|
—
|
|
—
|
|
(129,448
|
)
|
(129,448
|
)
|
(445
|
)
|
(129,893
|
)
|
|||||||||
|
Comprehensive loss
|
(168,996
|
)
|
(1,000
|
)
|
(169,996
|
)
|
|||||||||||||||||||
|
Issuance of shares:
|
|||||||||||||||||||||||||
|
Employee stock purchase plan – 603,114 Class A shares
|
60
|
|
4,258
|
|
—
|
|
—
|
|
—
|
|
4,318
|
|
—
|
|
4,318
|
|
|||||||||
|
Stock options – 100,200 Class A shares
|
11
|
|
353
|
|
—
|
|
—
|
|
—
|
|
364
|
|
—
|
|
364
|
|
|||||||||
|
Stock conversions – 240 Class B shares to A shares
|
—
|
|
—
|
|
—
|
|
—
|
|
—
|
|
—
|
|
—
|
|
—
|
|
|||||||||
|
Restricted stock units vested – 210,769 Class A shares
|
—
|
|
(6,250
|
)
|
—
|
|
4,965
|
|
—
|
|
(1,285
|
)
|
—
|
|
(1,285
|
)
|
|||||||||
|
401(k) Company stock match – 781,088 Class A shares
|
—
|
|
(11,800
|
)
|
—
|
|
18,524
|
|
—
|
|
6,724
|
|
—
|
|
6,724
|
|
|||||||||
|
Stock-based compensation
|
—
|
|
9,410
|
|
—
|
|
—
|
|
—
|
|
9,410
|
|
—
|
|
9,410
|
|
|||||||||
|
Tax shortfall from equity award exercises
|
—
|
|
(4,102
|
)
|
—
|
|
—
|
|
—
|
|
(4,102
|
)
|
—
|
|
(4,102
|
)
|
|||||||||
|
Balance, December 25, 2011
|
$
|
15,083
|
|
$
|
32,024
|
|
$
|
1,086,625
|
|
$
|
(110,974
|
)
|
$
|
(516,398
|
)
|
$
|
506,360
|
|
$
|
3,149
|
|
$
|
509,509
|
|
|
See Notes to the Consolidated Financial Statements
P.
68
– THE NEW YORK TIMES COMPANY
NOTES TO THE CONSOLIDATED FINANCIAL STATEMENTS
1. Basis of Presentation
Nature of Operations
The New York Times Company is a leading global, multimedia news and information company that currently includes newspapers, digital businesses, investments in paper mills and other investments (see Note 7). The New York Times Company and its consolidated subsidiaries are referred to collectively as the “Company,” “we,” “us” or “our.” Our major source of revenue is advertising, predominantly from our newspaper business. The newspapers primarily operate in the Northeast markets in the United States.
Principles of Consolidation
The Consolidated Financial Statements include the accounts of our Company and our wholly and majority-owned subsidiaries after elimination of all significant intercompany transactions.
The portion of the net income or loss and equity of a subsidiary attributable to the owners of a subsidiary other than the Company (a noncontrolling interest) is included within net income or loss in our Consolidated Statements of Operations and as a component of consolidated stockholders’ equity in our Consolidated Balance Sheets and Consolidated Statements of Changes in Stockholders’ Equity.
Fiscal Year
Our fiscal year end is the last Sunday in December. Fiscal years
2011
,
2010
and
2009
each comprise
52
weeks. Our fiscal years ended as of
December 25, 2011
,
December 26, 2010
and
December 27, 2009
.
Reclassifications
For comparability, certain prior year amounts have been reclassified to conform with the
2011
presentation.
2. Summary of Significant Accounting Policies
Cash and Cash Equivalents
We consider all highly liquid debt instruments with original maturities of 3 months or less to be cash equivalents.
Short-Term Investments
We have the intention and ability to hold our short-term investments to maturity. These investments are classified as held-to-maturity and are reported at amortized cost. The changes in the value of these securities, other than impairment charges, are not reported in our Consolidated Financial Statements.
Accounts Receivable
Credit is extended to our advertisers and our subscribers based upon an evaluation of the customer’s financial condition, and collateral is not required from such customers. Allowances for estimated credit losses, rebates, returns, rate adjustments and discounts are generally established based on historical experience.
Inventories
Inventories are stated at the lower of cost or current market value. Inventory cost is generally based on the last-in, first-out (“LIFO”) method for newsprint and the first-in, first-out (“FIFO”) method for other inventories.
Investments
Investments in which we have at least a
20%
, but not more than a
50%
, interest are generally accounted for under the equity method. Investment interests below
20%
are generally accounted for under the cost method, except if we could exercise significant influence, the investment would be accounted for under the equity method. We have an investment interest below
20%
in Fenway Sports Group, which is accounted for under the equity method (see Notes 7 and 21).
THE NEW YORK TIMES COMPANY – P.
69
Property, Plant and Equipment
Property, plant and equipment are stated at cost. Depreciation is computed by the straight-line method over the shorter of estimated asset service lives or lease terms as follows: buildings, building equipment and improvements –
10
to
40
years; equipment –
3
to
30
years. We capitalize interest costs and certain staffing costs as part of the cost of major projects.
We evaluate whether there has been an impairment of long-lived assets, primarily property, plant and equipment, if certain circumstances indicate that a possible impairment may exist. These assets are tested for impairment at the asset group level associated with the lowest level of cash flows. An impairment exists if the carrying value of the asset (1) is not recoverable (the carrying value of the asset is greater than the sum of undiscounted cash flows) and (2) is greater than its fair value.
Goodwill and Intangible Assets Acquired
Goodwill is the excess of cost over the fair value of tangible and other intangible net assets acquired. Goodwill is not amortized but tested for impairment annually or in an interim period if certain circumstances indicate a possible impairment may exist. Our annual impairment testing date is the first day of our fiscal fourth quarter.
Other intangible assets acquired consist primarily of trade names on various acquired properties, content, customer lists and other assets. Other intangible assets acquired that have indefinite lives (trade names) are not amortized but tested for impairment annually or in an interim period if certain circumstances indicate a possible impairment may exist. Certain other intangible assets acquired (content, customer lists and other assets) are amortized over their estimated useful lives and tested for impairment if certain circumstances indicate an impairment may exist.
We test for goodwill impairment at the reporting unit level, which are our operating segments. Separate financial information about these segments is regularly evaluated by our chief operating decision-maker in deciding how to allocate resources. We first perform a qualitative assessment to determine whether it is more likely than not that the fair value of a reporting unit is less than its carrying value. The result of this assessment will determine whether it is necessary to perform the goodwill impairment two-step test.
If we determine that it is more likely than not that the fair value of a reporting unit is less than its carrying value, in the first step, we compare the fair value of the reporting unit with its carrying amount, including goodwill. Fair value is calculated by a combination of a discounted cash flow model and a market approach model. In calculating fair value for each reporting unit, we generally weigh the results of the discounted cash flow model more heavily than the market approach because the discounted cash flow model is specific to our business and long-term projections. If the fair value exceeds the carrying amount, goodwill is not considered impaired. If the carrying amount exceeds the fair value, the second step must be performed to measure the amount of the impairment loss, if any. In the second step, we compare the implied fair value of the reporting unit’s goodwill with the carrying amount of that goodwill. An impairment loss would be recognized in an amount equal to the excess of the carrying amount of the goodwill over the implied fair value of the goodwill.
The discounted cash flow analysis requires us to make various judgments, estimates and assumptions, many of which are interdependent, about future revenues, operating margins, growth rates, capital expenditures, working capital and discount rates. The starting point for the assumptions used in our discounted cash flow analysis is the annual long-range financial forecast. The annual planning process that we undertake to prepare the long-range financial forecast takes into consideration a multitude of factors, including historical growth rates and operating performance, related industry trends, macroeconomic conditions, and marketplace data, among others. Assumptions are also made for perpetual growth rates for periods beyond the long-range financial forecast period. Our estimates of fair value are sensitive to changes in all of these variables, certain of which relate to broader macroeconomic conditions outside our control.
The market approach analysis includes applying a multiple, based on comparable market transactions, to certain operating metrics of the reporting unit.
We compare the sum of the fair values of our reporting units to our market capitalization to determine whether our estimates of reporting unit fair value are reasonable.
P.
70
– THE NEW YORK TIMES COMPANY
Intangible assets that are not amortized (trade names) are tested for impairment at the asset level by comparing the fair value of the asset with its carrying amount. Fair value is calculated as the discounted cash flows utilizing the relief-from-royalty method. This method is based on applying a royalty rate, which would be obtained through a lease, to the cash flows derived from the asset being tested. The royalty rate is derived from market data. If the fair value exceeds the carrying amount, the asset is not considered impaired. If the carrying amount exceeds the fair value, an impairment loss would be recognized in an amount equal to the excess of the carrying amount of the asset over the fair value of the asset.
All other long-lived assets (intangible assets that are amortized, such as content and customer lists) are tested for impairment at the asset group level associated with the lowest level of cash flows. An impairment exists if the carrying value of the asset (1) is not recoverable (the carrying value of the asset is greater than the sum of undiscounted cash flows) and (2) is greater than its fair value.
The significant estimates and assumptions used by management in assessing the recoverability of goodwill, other intangible assets acquired and other long-lived assets are estimated future cash flows, discount rates, growth rates, as well as other factors. Any changes in these estimates or assumptions could result in an impairment charge. The estimates, based on reasonable and supportable assumptions and projections, require management’s subjective judgment. Depending on the assumptions and estimates used, the estimated results of the impairment tests can vary within a range of outcomes.
In addition to annual testing, management uses certain indicators to evaluate whether the carrying values of its long-lived assets may not be recoverable and an interim impairment test may be required. These indicators include (1) current-period operating or cash flow declines combined with a history of operating or cash flow declines or a projection/forecast that demonstrates continuing declines in the cash flow or the inability to improve our operations to forecasted levels, (2) a significant adverse change in the business climate, whether structural or technological and (3) a decline in our stock price and market capitalization.
Management has applied what it believes to be the most appropriate valuation methodology for its impairment testing. See Note 5.
Self-Insurance
We self-insure for workers’ compensation costs, automobile and general liability claims, up to certain deductible limits, as well as for certain employee medical and disability benefits. The recorded liabilities for self-insured risks are primarily calculated using actuarial methods. The liabilities include amounts for actual claims, claim growth and claims incurred but not yet reported. The recorded liabilities for self-insured risks were approximately
$52 million
as of
December 25, 2011
and
$63 million
as of
December 26, 2010
.
Pension and Other Postretirement Benefits
Our single-employer pension and other postretirement benefit costs are accounted for using actuarial valuations. We recognize the funded status of these plans – measured as the difference between plan assets, if funded, and the benefit obligation – on the balance sheet and recognize changes in the funded status that arise during the period but are not recognized as components of net periodic pension cost, within other comprehensive income, net of income taxes. The assets related to our funded pension plans are measured at fair value.
We make significant subjective judgments about a number of actuarial assumptions, which include discount rates, health-care cost trend rates, long-term return on plan assets and mortality rates. Depending on the assumptions and estimates used, the impact from our pension and other postretirement benefits could vary within a range of outcomes and could have a material effect on our Consolidated Financial Statements.
We also recognize the present value of pension liabilities associated with the withdrawal from multiemployer pension plans. We assess a liability for obligations related to complete and partial withdrawals from multiemployer pension plans as well as estimate obligations for future partial withdrawals that we consider probable and reasonably estimable. The actual liability is not known until each plan completes a final assessment of the withdrawal liability and issues a demand to us. Therefore, we adjust the estimate of our multiemployer pension plan liability as more information becomes available that allows us to refine our estimates.
See Notes 11 and 12 for additional information regarding pension and other postretirement benefits.
THE NEW YORK TIMES COMPANY – P.
71
Revenue Recognition
Advertising revenues are recognized when advertisements are published in newspapers or placed on digital platforms or, with respect to certain digital advertising, each time a user clicks on certain ads, net of provisions for estimated rebates, rate adjustments and discounts.
|
•
|
We recognize a rebate obligation as a reduction of revenues, based on the amount of estimated rebates that will be earned and claimed, related to the underlying revenue transactions during the period. Measurement of the rebate obligation is estimated based on the historical experience of the number of customers that ultimately earn and use the rebate.
|
|
•
|
Rate adjustments primarily represent credits given to customers related to billing or production errors and discounts represent credits given to customers who pay an invoice prior to its due date. Rate adjustments and discounts are accounted for as a reduction of revenues, based on the amount of estimated rate adjustments or discounts related to the underlying revenues during the period. Measurement of rate adjustments and discount obligations are estimated based on historical experience of credits actually issued.
|
Circulation revenues include single-copy and subscription revenues. Circulation revenues are based on the number of copies of the printed newspaper (through home-delivery subscriptions and single-copy sales) and digital subscriptions sold and the rates charged to the respective customers. Single-copy revenue is recognized based on date of publication, net of provisions for related returns. Proceeds from subscription revenues are deferred at the time of sale and are recognized in earnings on a pro rata basis over the terms of the subscriptions.
Other revenues are recognized when the related service or product has been delivered.
Income Taxes
Income taxes are recognized for the following: (1) amount of taxes payable for the current year and (2) deferred tax assets and liabilities for the future tax consequence of events that have been recognized differently in the financial statements than for tax purposes. Deferred tax assets and liabilities are established using statutory tax rates and are adjusted for tax rate changes in the period of enactment.
We assess whether our deferred tax assets should be reduced by a valuation allowance if it is more likely than not that some portion or all of the deferred tax assets will not be realized. Our process includes collecting positive (e.g., sources of taxable income) and negative (e.g., recent historical losses) evidence and assessing, based on the evidence, whether it is more likely than not that the deferred tax assets will not be realized.
We recognize in our financial statements the impact of a tax position if that tax position is more likely than not of being sustained on audit, based on the technical merits of the tax position. This involves the identification of potential uncertain tax positions, the evaluation of tax law and an assessment of whether a liability for uncertain tax positions is necessary. Different conclusions reached in this assessment can have a material impact on our Consolidated Financial Statements.
We operate within multiple taxing jurisdictions and are subject to audit in these jurisdictions. These audits can involve complex issues, which could require an extended period of time to resolve. Until formal resolutions are reached between us and the tax authorities, the timing and amount of a possible audit settlement for uncertain tax benefits is difficult to predict.
Stock-Based Compensation
We establish fair value for our stock-based awards to determine our cost and recognize the related expense over the appropriate vesting period. We recognize compensation expense for outstanding stock options, stock-settled restricted stock units, cash-settled restricted stock units, stock appreciation rights, Common Stock under our Employee Stock Purchase Plan (“ESPP”) and awards under a Long-Term Incentive Plan (“LTIP”) (together, the “Stock-Based Awards”). See Note 17 for additional information related to stock-based compensation expense.
P.
72
– THE NEW YORK TIMES COMPANY
Earnings/(Loss) Per Shar
e
Basic earnings/(loss) per share is calculated by dividing net earnings/(loss) available to common stockholders by the weighted-average common shares outstanding. Diluted earnings/(loss) per share is calculated similarly, except that it includes the dilutive effect of the assumed exercise of securities, including outstanding warrants and the effect of shares issuable under our Company’s stock-based incentive plans if such effect is dilutive.
Foreign Currency Translation
The assets and liabilities of foreign companies are translated at year-end exchange rates. Results of operations are translated at average rates of exchange in effect during the year. The resulting translation adjustment is included as a separate component in the Stockholders’ Equity section of our Consolidated Balance Sheets, in the caption “Accumulated other comprehensive loss, net of income taxes.”
Use of Estimates
The preparation of financial statements in conformity with accounting principles generally accepted in the United States of America (“GAAP”) requires management to make estimates and assumptions that affect the amounts reported in our Consolidated Financial Statements. Actual results could differ from these estimates.
Recent Accounting Pronouncements
In September 2011, the Financial Accounting Standards Board (“FASB”) amended its guidance on goodwill impairment testing to reduce the cost and complexity of testing goodwill for impairment by providing the option to first perform a qualitative assessment to determine whether it is more likely than not that the fair value of a reporting unit is less than its carrying value. The result of this assessment will determine whether it is necessary to perform the two-step test. The provisions of this new guidance are effective for fiscal years beginning after December 15, 2011, with early adoption permitted. We adopted the new guidance early when we conducted our annual goodwill impairment test in the fourth quarter of 2011. The adoption of this guidance did not have a material impact on our financial statements.
In June 2011, the FASB amended its guidance on the presentation of comprehensive income in financial statements to improve the comparability, consistency and transparency of financial reporting and to increase the prominence of items that are recorded in other comprehensive income. The new accounting guidance requires entities to report components of comprehensive income in either (1) a continuous statement of comprehensive income or (2) two separate but consecutive statements. The provisions of this guidance are effective for fiscal years, and interim periods within those years, beginning after December 15, 2011. We do not anticipate the adoption of this guidance will have a material impact on our financial statements.
In May 2011, the FASB amended its guidance related to fair value measurements in order to align the definition of fair value measurements and the related disclosure requirements between GAAP and International Financial Reporting Standards. These amendments, which are effective for interim and annual periods beginning after December 15, 2011, also change certain existing fair value measurement principles and disclosure requirements. We do not anticipate the adoption of this guidance will have a material impact on our financial statements.
3. Short-Term Investments
We have short-term investments, with original maturities of longer than
3 months
, in U.S. Treasury securities as of
December 25, 2011
and as of
December 26, 2010
. The carrying value of the short-term investments (which approximated the fair value) was
$104.8 million
in U.S. Treasury securities as of
December 25, 2011
and
$30.0 million
in U.S. Treasury securities as of
December 26, 2010
. The short-term investments have remaining maturities of about
1 month
to
6 months
as of
December 25, 2011
.
THE NEW YORK TIMES COMPANY – P.
73
4. Inventories
Inventories as shown in the accompanying Consolidated Balance Sheets were as follows:
|
(In thousands)
|
December 25,
2011 |
|
December 26,
2010 |
|
||||
|
Newsprint and magazine paper
|
$
|
16,927
|
|
$
|
12,596
|
|
||
|
Other inventory
|
4,160
|
|
3,536
|
|
||||
|
Total
|
$
|
21,087
|
|
$
|
16,132
|
|
||
Inventories are stated at the lower of cost or current market value. Cost was determined utilizing the LIFO method for
71%
of inventory in
2011
and
66%
of inventory in
2010
. The excess of replacement or current cost over stated LIFO value was approximately
$5 million
as of
December 25, 2011
and
December 26, 2010
. The remaining portion of inventory is accounted for under the FIFO method.
5. Impairment of Assets
2011
In 2011, we recorded a
$164.4 million
impairment charge. At the News Media Group, the impairment consisted of the write-down of goodwill at the Regional Media Group of
$152.1 million
and the write-down of certain assets held for sale, primarily of Baseline, totaling
$9.2 million
. At the About Group, the impairment consisted of a write-down of an intangible asset at ConsumerSearch, Inc. of
$3.1 million
.
Regional Media Group
Goodwill is not amortized but tested for impairment annually or in an interim period if certain circumstances indicate a possible impairment may exist. Our policy is to perform our annual goodwill impairment test in the fourth quarter of our fiscal year. However, due to certain impairment indicators at the Regional Media Group, including lower-than-expected operating results, we performed an interim impairment test of goodwill as of June 26, 2011. The Regional Media Group is part of the News Media Group reportable segment. See Note 21 for information regarding the sale of the Regional Media Group on January 6, 2012.
The interim test resulted in an impairment of goodwill of
$152.1 million
mainly from lower projected long-term operating results and cash flows of the Regional Media Group primarily due to the continued decline in print advertising revenues. These factors resulted in the carrying value of the net assets being greater than their fair value, and therefore a write-down to fair value was required. The impairment charge reduced the carrying value of goodwill at the Regional Media Group to
$0
.
In determining the fair value of the Regional Media Group, we made significant judgments and estimates regarding the expected severity and duration of the uneven economic environment and the secular changes affecting the newspaper industry in the Regional Media Group markets. The effect of these assumptions on projected long-term revenues, along with the continued benefits from reductions to the group’s cost structure, played a significant role in calculating the fair value of the Regional Media Group.
The fair value of the Regional Media Group’s goodwill was the residual fair value after allocating the total fair value of the Regional Media Group to its other assets, net of liabilities. The total fair value of the Regional Media Group was determined using a combination of a discounted cash flow model (present value of future cash flows) and a market approach model based on comparable businesses. We estimated a flat annual growth rate to arrive at a residual year representing the perpetual cash flows of the Regional Media Group. The residual year cash flow was capitalized to arrive at the terminal value of the Regional Media Group. Utilizing a discount rate of
10.7%
, the present value of the cash flows during the projection period and terminal value were aggregated to estimate the fair value of the Regional Media Group. In the 2010 annual impairment test, we assumed a
2.0%
annual growth rate and a discount rate of
10.5%
. In determining the appropriate discount rate, we considered the weighted-average cost of capital for comparable companies.
P.
74
– THE NEW YORK TIMES COMPANY
Property, plant and equipment is tested for impairment if certain circumstances indicate a possible impairment may exist. Due to the factors discussed above, we completed an interim impairment test of property, plant and equipment as of June 26, 2011. The impairment test was completed at each newspaper (asset group level with the lowest level of cash flows) in the Regional Media Group. Our test did not result in an impairment because the sum of the future undiscounted cash flows at each newspaper was greater than the carrying value of property, plant and equipment.
About Group
Our 2011 annual impairment test, which was completed in the fourth quarter, resulted in a non-cash impairment charge of
$3.1 million
relating to the write-down of an intangible asset at ConsumerSearch, Inc. This impairment charge reduced the carrying value of the ConsumerSearch trade name to approximately
$3 million
. The fair value of the trade name was calculated using a relief-from-royalty method. The impairment was driven by lower cost-per-click advertising revenues.
There were no additional impairment charges in connection with our 2011 annual impairment test. However, the About Group's estimated fair value was
18%
greater than its carrying value in our 2011 impairment test compared with
60%
in our 2010 impairment test, a significant decline during 2011. The About Group had approximately
$367 million
of goodwill as of December 25, 2011.
I
n determining the f
air value of the About Group, we made significant judgments and estimates regarding the expected recovery of display and cost-per-click advertising. The effect of these assumptions on projected long-term revenues, along with investments to grow content and traffic, play a significant role in calculating the fair value of the About Group. We believe if the long-term projected cash flows of the About Group are not met a goodwill impairment charge could be reasonably likely.
Assets Held for Sale
In the second quarter of 2011, we classified certain assets as held for sale, primarily of Baseline. The carrying value of these assets was greater than their fair value, less cost to sell, resulting in an impairment of certain intangible assets and property totaling
$9.2 million
. The impairment charge reduced the carrying value of intangible assets to
$0
and the property to a nominal value. The fair value for these assets was determined by estimating the most likely sale price with a third-party buyer based on market data. In October 2011, we completed the sale of Baseline, which resulted in a nominal gain.
2010
We consolidated the printing facility of The Boston Globe (the “Globe”) in Billerica, Mass., into the Boston, Mass., printing facility in the second quarter of 2009. After exploring different opportunities for the assets at Billerica, we entered into an agreement in the third quarter of 2010 to sell the majority of these assets to a third party. Therefore, assets with a carrying value of approximately
$20 million
were written down to their fair value, resulting in a
$16.1 million
impairment charge in 2010. The fair value for these assets was calculated utilizing an offer from a third party to buy equipment from us and a real estate appraisal.
2009
In the fourth quarter of 2009, we recorded a
$4.2 million
charge for an impairment of assets due to the reduced scope of a systems project at the News Media Group. The assets were written down to
$0
as the costs associated with this portion of the systems project was not utilized.
THE NEW YORK TIMES COMPANY – P.
75
6. Goodwill and Other Intangible Assets Acquired
Goodwill
The changes in the carrying amount of goodwill in
2011
and
2010
were as follows:
|
(In thousands)
|
News Media
Group
|
About
Group
|
Total
|
|||||||
|
Balance as of December 27, 2009
|
||||||||||
|
Goodwill
|
$
|
1,087,436
|
|
$
|
369,978
|
|
$
|
1,457,414
|
|
|
|
Accumulated impairment losses
|
(805,218
|
)
|
—
|
|
(805,218
|
)
|
||||
|
Balance as of December 27, 2009
|
282,218
|
|
369,978
|
|
652,196
|
|
||||
|
Foreign currency translation
|
(7,732
|
)
|
—
|
|
(7,732
|
)
|
||||
|
Balance as of December 26, 2010
|
||||||||||
|
Goodwill
|
1,079,704
|
|
369,978
|
|
1,449,682
|
|
||||
|
Accumulated impairment losses
|
(805,218
|
)
|
—
|
|
(805,218
|
)
|
||||
|
Balance as of December 26, 2010
|
274,486
|
|
369,978
|
|
644,464
|
|
||||
|
Goodwill impaired during year
|
(152,093
|
)
|
—
|
|
(152,093
|
)
|
||||
|
Goodwill disposed during year
|
(300
|
)
|
(2,702
|
)
|
(3,002
|
)
|
||||
|
Foreign currency translation
|
(475
|
)
|
—
|
|
(475
|
)
|
||||
|
Balance as of December 25, 2011
|
||||||||||
|
Goodwill
|
1,078,929
|
|
367,276
|
|
1,446,205
|
|
||||
|
Accumulated impairment losses
|
(957,311
|
)
|
—
|
|
(957,311
|
)
|
||||
|
Balance as of December 25, 2011
|
$
|
121,618
|
|
$
|
367,276
|
|
$
|
488,894
|
|
|
The table above includes goodwill impaired during
2011
(see Note 5). Goodwill disposed of during
2011
was related to the sales of UCompareHealthCare.com, which was part of the About Group, and Baseline, which was part of the News Media Group. The foreign currency translation line item reflects changes in goodwill resulting from fluctuating exchange rates related to the consolidation of the International Herald Tribune (“IHT”).
Other Intangible Assets Acquired
Other intangible assets acquired were as follows:
|
|
December 25, 2011
|
December 26, 2010
|
|||||||||||||||||||||
|
(In thousands, except years)
|
Gross
Carrying
Amount
|
Accumulated
Amortization
|
Net
|
Weighted Average Useful Life (years)
|
Gross
Carrying
Amount
|
Accumulated
Amortization
|
Net
|
Weighted Average Useful Life (years)
|
|||||||||||||||
|
Amortized other intangible assets:
|
|||||||||||||||||||||||
|
Content
|
$
|
21,384
|
|
$
|
(18,133
|
)
|
$
|
3,251
|
|
1
|
|
$
|
25,712
|
|
$
|
(16,510
|
)
|
$
|
9,202
|
|
7
|
|
|
|
Customer lists
|
24,495
|
|
(21,842
|
)
|
2,653
|
|
2
|
|
28,316
|
|
(21,281
|
)
|
7,035
|
|
6
|
|
|||||||
|
Other
|
33,074
|
|
(31,248
|
)
|
1,826
|
|
4
|
|
36,390
|
|
(31,592
|
)
|
4,798
|
|
3
|
|
|||||||
|
Total
|
78,953
|
|
(71,223
|
)
|
7,730
|
|
90,418
|
|
(69,383
|
)
|
21,035
|
|
|||||||||||
|
Unamortized other intangible assets:
|
|||||||||||||||||||||||
|
Trade names
|
9,885
|
|
14,380
|
|
|||||||||||||||||||
|
Total other intangible assets acquired
|
|
|
|
|
$
|
17,615
|
|
|
|
|
|
$
|
35,415
|
|
|||||||||
The table above includes the foreign currency translation adjustment related to the consolidation of the IHT. In addition, the table above includes other intangible assets impaired during the second and fourth quarters of 2011 (see Note 5) and disposed of during the first quarter of 2011 related to the sale of UCompareHealthCare.com, which was part of the About Group.
P.
76
– THE NEW YORK TIMES COMPANY
Amortization expense related to other intangible assets acquired that are subject to amortization was
$7.1 million
in
2011
,
$8.1 million
in
2010
, and
$8.2 million
in
2009
.
Amortization expense for the next five years related to these intangible assets is expected to be as follows:
|
(In thousands)
|
|
||
|
Year
|
Amount
|
|
|
|
2012
|
$
|
4,800
|
|
|
2013
|
1,600
|
|
|
|
2014
|
600
|
|
|
|
2015
|
350
|
|
|
|
2016
|
270
|
|
|
7. Investments in Joint Ventures
As of
December 25, 2011
, our Company’s investments in joint ventures consisted of equity ownership interests in the following entities:
|
Company
|
Approximate %
Ownership
|
|
|
Metro Boston LLC (“Metro Boston”)
|
49
|
%
|
|
Donohue Malbaie Inc. (“Malbaie”)
|
49
|
%
|
|
Madison Paper Industries (“Madison”)
|
40
|
%
|
|
quadrantONE LLC (“quadrantONE”)
|
25
|
%
|
|
Fenway Sports Group
|
7.3
|
%
|
Our Company’s investments above are accounted for under the equity method, and are recorded in “Investments in joint ventures” in our Consolidated Balance Sheets. Our proportionate shares of the operating results of our investments are recorded in “Income from joint ventures” in our Consolidated Statements of Operations and in “Investments in joint ventures” in our Consolidated Balance Sheets.
Metro Boston
We own a
49%
interest in Metro Boston, which publishes a free daily newspaper in the greater Boston area.
Malbaie & Madison
We also have investments in a Canadian newsprint company, Malbaie, and a partnership operating a supercalendered paper mill in Maine, Madison (together, the “Paper Mills”).
Our Company and UPM-Kymmene Corporation, a Finnish paper manufacturing company, are partners through subsidiary companies in Madison. Our Company’s percentage ownership of Madison, which represents
40%
, is through an
80%
-owned consolidated subsidiary. UPM-Kymmene owns a
10%
interest in Madison through a
20%
noncontrolling interest in the consolidated subsidiary of our Company.
We received distributions from Malbaie of
$0 million
in
2011
,
$0 million
in
2010
and
$2.8 million
in
2009
.
We received distributions from Madison of
$0 million
in
2011
,
$5.3 million
in
2010
and
$0 million
in
2009
.
The News Media Group purchased newsprint and supercalendered paper from the Paper Mills at competitive prices. Such purchases aggregated approximately
$34 million
in
2011
,
$33 million
in
2010
and
$39 million
in
2009
.
In 2010, we recorded a pre-tax gain of
$12.7 million
from the sale of an asset at one of the Paper Mills. Our share of the pre-tax gain, after eliminating the noncontrolling interest portion, was
$10.2 million
. The
$12.7 million
gain is included in “Income from joint ventures” in our Consolidated Statements of Operations.
THE NEW YORK TIMES COMPANY – P.
77
quadrantONE
We own a
25%
interest in quadrantONE, an online advertising network that sells bundled premium, targeted display advertising onto local newspaper and other Web sites.
Fenway Sports Group
As of December 25, 2011, we owned a
7.3%
interest in Fenway Sports Group, which owns the Boston Red Sox baseball club; Liverpool Football Club (a soccer team in the English Premier League); approximately
80%
of New England Sports Network (a regional cable sports network); and
50%
of Roush Fenway Racing (a leading NASCAR team).
On July 1, 2011, we sold
390
of our units in Fenway Sports Group for
$117.0 million
. We recorded a pre-tax gain of
$65.3 million
in the third quarter of 2011. This transaction is in addition to the sale of
50
of our units in Fenway Sports Group that resulted in a pre-tax gain of
$9.1 million
in the second quarter of 2010. Following these transactions, we owned
310
units, or
7.3%
, of Fenway Sports Group.
On February 3, 2012, we sold additional units of Fenway Sports Group. See Note 21 for additional information regarding the sale. We continue to market our remaining units in Fenway Sports Group, in whole or in parts.
The following tables present summarized combined information for our Company’s unconsolidated joint ventures. Separate financial statements of these unconsolidated joint ventures are not required since none of our investments are considered individually significant. Summarized unaudited condensed combined balance sheets of our Company’s unconsolidated joint ventures were as follows as of:
|
(In thousands)
|
December 31,
2011 |
|
December 31,
2010 |
|
||||
|
Current assets
|
$
|
262,203
|
|
$
|
272,672
|
|
||
|
Non-current assets
|
1,405,110
|
|
1,421,083
|
|
||||
|
Total assets
|
1,667,313
|
|
1,693,755
|
|
||||
|
Current liabilities
|
551,105
|
|
426,020
|
|
||||
|
Non-current liabilities
|
518,723
|
|
613,971
|
|
||||
|
Total liabilities
|
1,069,828
|
|
1,039,991
|
|
||||
|
Equity
|
522,930
|
|
580,603
|
|
||||
|
Noncontrolling interest
|
74,555
|
|
73,161
|
|
||||
|
Total liabilities and equity
|
$
|
1,667,313
|
|
$
|
1,693,755
|
|
||
Summarized unaudited condensed combined income statements of our Company’s unconsolidated joint ventures were as follows for the years ended:
|
(In thousands)
|
December 31,
2011 |
|
December 31,
2010 |
|
December 31,
2009 |
|
||||||
|
Revenues
|
$
|
1,203,537
|
|
$
|
936,223
|
|
$
|
844,950
|
|
|||
|
Costs and expenses
|
1,203,181
|
|
850,950
|
|
739,289
|
|
||||||
|
Operating income
|
356
|
|
85,273
|
|
105,661
|
|
||||||
|
Other (expense)/income
|
(10,014
|
)
|
14,724
|
|
5,418
|
|
||||||
|
Pre-tax (loss)/income
|
(9,658
|
)
|
99,997
|
|
111,079
|
|
||||||
|
Income tax (benefit)/expense
|
(25,004
|
)
|
(111
|
)
|
932
|
|
||||||
|
Net income
|
15,346
|
|
100,108
|
|
110,147
|
|
||||||
|
Net income attributable to noncontrolling interest
|
(23,517
|
)
|
(23,725
|
)
|
(20,631
|
)
|
||||||
|
Net (loss)/income less noncontrolling interest
|
$
|
(8,171
|
)
|
$
|
76,383
|
|
$
|
89,516
|
|
|||
P.
78
– THE NEW YORK TIMES COMPANY
8. Debt Obligations
Our total debt and capital lease obligations consisted of the following:
|
(In thousands, except percentages)
|
Coupon Rate
|
December 25,
2011 |
|
December 26,
2010 |
|
||||||
|
Senior notes due in 2012, net of unamortized debt costs of $100 in 2011 and $229 in 2010
|
4.610
|
%
|
$
|
74,900
|
|
$
|
74,771
|
|
|||
|
Senior notes due in 2015, net of unamortized debt costs of $109 in 2011 and $140 in 2010
|
5.0
|
%
|
249,891
|
|
249,860
|
|
|||||
|
Senior notes due in 2015, called in 2011, net of unamortized debt costs of $22,320 in 2010
|
14.053
|
%
|
—
|
|
227,680
|
|
|||||
|
Senior notes due in 2016, net of unamortized debt costs of $4,213 in 2011 and $4,898 in 2010
|
6.625
|
%
|
220,787
|
|
220,102
|
|
|||||
|
Option to repurchase ownership interest in headquarters building in 2019, net of unamortized debt costs of $29,139 in 2011 and $32,694 in 2010
|
220,861
|
|
217,306
|
|
|||||||
|
Total debt
|
766,439
|
|
989,719
|
|
|||||||
|
Capital lease obligations
|
6,701
|
|
6,724
|
|
|||||||
|
Total debt and capital lease obligations
|
$
|
773,140
|
|
$
|
996,443
|
|
|||||
Based on borrowing rates currently available for debt with similar terms and average maturities, the fair value of our long-term debt was approximately
$800 million
as of
December 25, 2011
and approximately
$1.1 billion
as of
December 26, 2010
.
The aggregate face amount of maturities of debt over the next five years and thereafter is as follows:
|
(In thousands)
|
Amount
|
||
|
2012
|
$
|
75,000
|
|
|
2013
|
—
|
|
|
|
2014
|
—
|
|
|
|
2015
|
250,000
|
|
|
|
2016
|
225,000
|
|
|
|
Thereafter
|
250,000
|
|
|
|
Total face amount of maturities
|
800,000
|
|
|
|
Less: Unamortized debt costs
|
(33,561
|
)
|
|
|
Carrying value of debt
|
$
|
766,439
|
|
Interest expense, net, as shown in the accompanying Consolidated Statements of Operations was as follows:
|
(In thousands)
|
December 25,
2011 |
|
December 26,
2010 |
|
December 27,
2009 |
|
||||||
|
Cash interest expense
|
$
|
79,187
|
|
$
|
79,349
|
|
$
|
78,606
|
|
|||
|
Non-cash amortization of discount on debt
|
6,933
|
|
7,251
|
|
6,084
|
|
||||||
|
Capitalized interest
|
(427
|
)
|
(299
|
)
|
(1,566
|
)
|
||||||
|
Interest income
|
(450
|
)
|
(1,239
|
)
|
(1,423
|
)
|
||||||
|
Total interest expense, net
|
$
|
85,243
|
|
$
|
85,062
|
|
$
|
81,701
|
|
|||
THE NEW YORK TIMES COMPANY – P.
79
4.610% Notes
We have
$75.0 million
aggregate principal amount of
4.610%
senior notes due September 26, 2012, outstanding (the “
4.610%
Notes”). The
4.610%
Notes were reclassified to “Current portion of long-term debt and capital lease obligations” in our Consolidated Balance Sheet in the fourth quarter of 2011.
The
4.610%
Notes may be redeemed, in whole or in part, at any time, at a price equal to
100%
of the principal amount of the notes redeemed, plus accrued and unpaid interest to the redemption date plus a “make-whole” premium. The
4.610%
Notes are not otherwise callable.
The
4.610%
Notes are subject to certain covenants that, among other things, limit (subject to customary exceptions) our ability and the ability of certain material subsidiaries to:
|
•
|
create liens on certain assets to secure debt; and
|
|
•
|
enter into certain sale-leaseback transactions.
|
5.0% Notes
We have
$250.0 million
aggregate principal amount of
5.0%
senior unsecured notes due March 15, 2015, outstanding (the “
5.0%
Notes”).
The
5.0%
Notes may be redeemed, in whole or in part, at any time, at a price equal to
100%
of the principal amount of the notes redeemed, plus accrued and unpaid interest to the redemption date plus a “make-whole” premium. The
5.0%
Notes are not otherwise callable.
The
5.0%
Notes are subject to certain covenants that, among other things, limit (subject to customary exceptions) our ability and the ability of certain material subsidiaries to:
|
•
|
create liens on certain assets to secure debt; and
|
|
•
|
enter into certain sale-leaseback transactions.
|
14.053% Notes
In January 2009, pursuant to a securities purchase agreement with Inmobiliaria Carso, S.A. de C.V. and Banco Inbursa S.A., Institución de Banca Múltiple, Grupo Financiero Inbursa (each an “Investor” and collectively the “Investors”), we issued, for an aggregate purchase price of
$250.0 million
, (1)
$250.0 million
aggregate principal amount of
14.053%
senior unsecured notes due January 15, 2015 (the “
14.053%
Notes”), and (2) detachable warrants to purchase
15.9 million
shares of our Class A Common Stock at a price of
$6.3572
per share. The warrants are exercisable at the holder’s option at any time and from time to time, in whole or in part, until January 15, 2015. Each Investor is an affiliate of Carlos Slim Helú, the beneficial owner of approximately
8%
of our Class A Common Stock (excluding the warrants). Each Investor purchased an equal number of
14.053%
Notes and warrants.
On August 15, 2011, we prepaid in full all
$250.0 million
outstanding aggregate principal amount of the
14.053%
Notes. The prepayment totaled approximately
$280 million
, comprising (1) the
$250.0 million
aggregate principal amount of the
14.053%
Notes; (2) approximately
$3 million
representing all interest that was accrued and unpaid on the
14.053%
Notes to August 15, 2011; and (3) a make-whole premium amount of approximately
$27 million
due in connection with the prepayment. We funded the prepayment from available cash. As a result of this prepayment, we recorded a
$46.4 million
pre-tax charge in the third quarter of 2011. This charge is included in “Premium on debt redemptions” in our Consolidated Statements of Operations.
6.625% Notes
In November 2010, we completed an offering of
$225.0 million
aggregate principal amount of
6.625%
senior unsecured notes due December 15, 2016 (“
6.625%
Notes”).
We received proceeds of approximately
$220 million
(purchase price of
$225.0 million
, net of approximately
$5 million
in transaction costs). The effective interest rate on this transaction was approximately
7%
.
We have the option to redeem all or a portion of the
6.625%
Notes, at any time, at a price equal to
100%
of the principal amount of the notes redeemed plus accrued and unpaid interest to the redemption date plus a “make-whole” premium. The
6.625%
Notes are not otherwise callable.
P.
80
– THE NEW YORK TIMES COMPANY
The
6.625%
Notes are subject to certain covenants that, among other things, limit (subject to customary exceptions) our ability and the ability of our subsidiaries to:
|
•
|
incur additional indebtedness and issue preferred stock;
|
|
•
|
pay dividends or make other equity distributions;
|
|
•
|
agree to any restrictions on the ability of our restricted subsidiaries to make payments to us;
|
|
•
|
create liens on certain assets to secure debt;
|
|
•
|
make certain investments;
|
|
•
|
merge or consolidate with other companies or transfer all or substantially all of our assets; and
|
|
•
|
engage in sale and leaseback transactions.
|
Sale-Leaseback Financing
In March 2009, an affiliate of our Company entered into an agreement to sell and simultaneously lease back a portion of our leasehold condominium interest in our Company’s headquarters building located at 620 Eighth Avenue in New York City (the “Condo Interest”). The sale price for the Condo Interest was
$225.0 million
. We have an option, exercisable in 2019, to repurchase the Condo Interest for
$250.0 million
. The lease term is
15
years, and we have three renewal options that could extend the term for an additional
20
years.
The transaction is accounted for as a financing transaction. As such, we have continued to depreciate the Condo Interest and account for the rental payments as interest expense. The difference between the purchase option price of
$250.0 million
and the net sale proceeds of approximately
$211 million
, or approximately
$39 million
, is being amortized over a
10
-year period through interest expense. The effective interest rate on this transaction was approximately
13%
.
Revolving Credit Facility
In June 2011, we entered into a new
$125.0 million
asset-backed
5
-year revolving credit facility. This new credit facility replaced our
$400.0 million
revolving credit facility, which was to expire on June 21, 2011. As of
December 25, 2011
, there were
$0
outstanding borrowings under the new credit facility.
Borrowings under the new credit facility will be secured by a lien on certain advertising receivables. In addition, borrowings bear interest at specified margins based on our utilization and at rates that vary between the LIBOR and prime rates (as defined by the credit agreement) depending on the term to maturities we specify. The new credit facility contains various customary affirmative and negative covenants.
Premium on Debt Redemptions
In August 2011, we recorded a
$46.4 million
pre-tax charge in connection with the prepayment of our
14.053%
Notes.
In April 2009, we settled the redemption of all
$250.0 million
outstanding aggregate principal amount of our
4.5%
notes due March 15, 2010, that had been called for redemption in March 2009. The redemption price of approximately
$260 million
included a
$9.3 million
premium and was computed under the terms of the notes as the present value of the scheduled payments of principal and unpaid interest, plus accrued interest to the redemption settlement date.
9. Other
Severance Costs
We recognized severance costs of
$13.6 million
in
2011
,
$6.8 million
in
2010
, and
$53.9 million
in
2009
. In
2011
,
2010
and
2009
, these costs were primarily recognized at the News Media Group related to various initiatives and are primarily recorded in “Selling, general and administrative costs” in our Consolidated Statements of Operations. We had a severance liability of
$13.1 million
and
$11.1 million
included in “Accrued expenses” in our Consolidated Balance Sheets as of
December 25, 2011
and
December 26, 2010
, respectively, of which the majority of the
December 25, 2011
balance will be paid in
2012
.
THE NEW YORK TIMES COMPANY – P.
81
Gain on Sale of Investments
We recognized a gain on the sale of investments of
$71.2 million
in 2011 and
$9.1 million
in 2010. See Note 7 for information regarding the gain in 2011 (
$65.3 million
) and 2010 (
$9.1 million
) related to the sales of our units in Fenway Sports Group.
In addition, we sold a minor portion of our interest in Indeed.com, a job listing aggregator, resulting in a gain of
$5.9 million
in 2011. We retain a substantial portion of our initial interest in Indeed.com.
Loss on Leases and Other Expenses
In 2011, we recorded a
$4.5 million
charge for a retirement and consulting agreement in connection with the retirement of our chief executive officer at the end of 2011.
The total loss on leases and other expenses recorded in 2009 was
$34.6 million
as detailed below.
In 2009, we recorded a loss of
$22.8 million
for the present value of remaining rental payments under leases, for property previously occupied by City & Suburban Delivery Systems, Inc. (“City & Suburban”), in excess of rental income under potential subleases. We closed City & Suburban, which operated a wholesale distribution business that delivered The New York Times (“The Times”) and other newspapers and magazines to newsstands and retail outlets in the New York metropolitan area, in January 2009. Also in 2009, we recorded a loss of
$8.3 million
for the present value of remaining rental payments under a lease for office space at The New York Times Media Group, in excess of rental income under potential subleases.
In the fourth quarter of 2009, we also recorded a
$3.5 million
charge for the early termination of a third-party printing contract.
Gain on Sale of Assets
In 2009, we sold certain surplus real estate assets at the Regional Media Group and recorded a gain on the sales totaling
$5.2 million
.
P.
82
– THE NEW YORK TIMES COMPANY
10. Fair Value Measurements
Fair value is the price that would be received upon the sale of an asset or paid upon transfer of a liability in an orderly transaction between market participants at the measurement date. The transaction would be in the principal or most advantageous market for the asset or liability, based on assumptions that a market participant would use in pricing the asset or liability.
The fair value hierarchy consists of three levels:
Level 1 – quoted prices in active markets for identical assets or liabilities that the reporting entity has the ability to access at the measurement date;
Level 2 – inputs other than quoted prices included within Level 1 that are observable for the asset or liability, either directly or indirectly; and
Level 3 – unobservable inputs for the asset or liability.
Assets/Liabilities Measured and Recorded at Fair Value on a Recurring Basis
As of
December 25, 2011
and
December 26, 2010
, we had assets related to our qualified pension plans measured at fair value. The required disclosures regarding such assets are presented in Note 11. The disclosure of the fair value of our short-term investments, which are classified as Level 1, is included in Note 3.
Assets Measured and Recorded at Fair Value on a Non-Recurring Basis
Our non-financial assets, such as goodwill, other intangible assets and property, plant and equipment are only recorded at fair value if an impairment charge is recognized. The following tables present non-financial assets that were measured and recorded at fair value on a non-recurring basis and the total impairment losses recorded during 2011, 2010 and 2009 on those assets:
|
(In thousands)
|
Net Carrying
Value as of
|
Fair Value Measured and Recorded Using
|
Impairment Losses
|
||||||||||||
|
December 25, 2011
|
Level 1
|
Level 2
|
Level 3
|
December 25, 2011
|
|||||||||||
|
Goodwill
|
$
|
—
|
|
$
|
—
|
|
$
|
—
|
|
$
|
—
|
|
$
|
152,093
|
|
|
Other intangible assets
|
2,864
|
|
—
|
|
—
|
|
2,864
|
|
10,574
|
|
|||||
|
Property, plant and equipment, net
|
—
|
|
—
|
|
—
|
|
—
|
|
1,767
|
|
|||||
|
Total impairment losses
|
$
|
164,434
|
|
||||||||||||
|
(In thousands)
|
Net Carrying
Value as of
|
Fair Value Measured and Recorded Using
|
Impairment Losses
|
||||||||||||
|
December 26, 2010
|
Level 1
|
Level 2
|
Level 3
|
December 26, 2010
|
|||||||||||
|
Property, plant and equipment, net
|
$
|
4,838
|
|
$
|
—
|
|
$
|
—
|
|
$
|
4,838
|
|
$
|
16,148
|
|
|
Total impairment losses
|
$
|
16,148
|
|
||||||||||||
|
(In thousands)
|
Net Carrying
Value as of
|
Fair Value Measured and Recorded Using
|
Impairment Losses
|
||||||||||||
|
December 27, 2009
|
Level 1
|
Level 2
|
Level 3
|
December 27, 2009
|
|||||||||||
|
Property, plant and equipment, net
|
$
|
—
|
|
$
|
—
|
|
$
|
—
|
|
$
|
—
|
|
$
|
4,179
|
|
|
Total impairment losses
|
$
|
4,179
|
|
||||||||||||
We recorded impairment charges during 2011, 2010 and 2009 related to the write-down of certain assets to their fair value. We classified all these measurements as Level 3, as we used unobservable inputs within the valuation methodologies that were significant to the fair value measurements, and the valuations required management judgment due to the absence of quoted market prices. See Note 5 for information regarding the valuation techniques utilized to determine fair value.
THE NEW YORK TIMES COMPANY – P.
83
11. Pension Benefits
We sponsor several single-employer defined benefit pension plans, the majority of which have been frozen; participate in The New York Times Newspaper Guild pension plan, a joint Company and Guild-sponsored plan; and make contributions to several multiemployer pension plans in connection with collective bargaining agreements. These plans cover the majority of our employees.
Single-Employer Plans
Our Company-sponsored defined benefit pension plans include qualified plans (funded) as well as non-qualified plans (unfunded). These plans provide participating employees with retirement benefits in accordance with benefit formulas detailed in each plan. Our non-qualified plans provide enhanced retirement benefits to select members of management. The New York Times Newspaper Guild pension plan is a qualified plan and is included in the tables below.
We also have a foreign-based pension plan for certain IHT employees (the “foreign plan”). The information for the foreign plan is combined with the information for U.S. non-qualified plans. The benefit obligation of the foreign plan is immaterial to our total benefit obligation.
Net Periodic Pension Cost
The components of net periodic pension cost/(income) were as follows:
|
|
December 25, 2011
|
December 26, 2010
|
December 27, 2009
|
||||||||||||||||||||||||||
|
(In thousands)
|
Qualified
Plans
|
Non-
Qualified
Plans
|
All
Plans
|
Qualified
Plans
|
Non-
Qualified
Plans
|
All
Plans
|
Qualified
Plans
|
Non-
Qualified
Plans
|
All
Plans
|
||||||||||||||||||||
|
Service cost
|
$
|
12,079
|
|
$
|
1,660
|
|
$
|
13,739
|
|
$
|
12,045
|
|
$
|
1,896
|
|
$
|
13,941
|
|
$
|
28,266
|
|
$
|
1,687
|
|
$
|
29,953
|
|
||
|
Interest cost
|
99,991
|
|
13,293
|
|
113,284
|
|
102,523
|
|
13,602
|
|
116,125
|
|
102,757
|
|
14,431
|
|
117,188
|
|
|||||||||||
|
Expected return on plan assets
|
(111,813
|
)
|
—
|
|
(111,813
|
)
|
(113,625
|
)
|
—
|
|
(113,625
|
)
|
(113,359
|
)
|
—
|
|
(113,359
|
)
|
|||||||||||
|
Recognized actuarial loss
|
25,781
|
|
3,214
|
|
28,995
|
|
16,496
|
|
4,103
|
|
20,599
|
|
21,901
|
|
4,061
|
|
25,962
|
|
|||||||||||
|
Amortization of prior service cost/(credit)
|
803
|
|
—
|
|
803
|
|
803
|
|
—
|
|
803
|
|
(4,728
|
)
|
562
|
|
(4,166
|
)
|
|||||||||||
|
Curtailment (gain)/loss
|
—
|
|
—
|
|
—
|
|
—
|
|
—
|
|
—
|
|
(58,283
|
)
|
4,318
|
|
(53,965
|
)
|
|||||||||||
|
Net periodic pension cost/(income)
|
$
|
26,841
|
|
$
|
18,167
|
|
$
|
45,008
|
|
$
|
18,242
|
|
$
|
19,601
|
|
$
|
37,843
|
|
$
|
(23,446
|
)
|
$
|
25,059
|
|
$
|
1,613
|
|
||
The net pension curtailment gain of
$54.0 million
in 2009 was as a result of the following changes to certain pension plans.
|
•
|
We amended a Company-sponsored qualified pension plan for non-union employees to discontinue future benefit accruals under the plan and freeze existing accrued benefits effective December 31, 2009. Benefits earned by participants under the plan prior to January 1, 2010, were not affected. We also froze a non-qualified pension plan that provides enhanced retirement benefits to select members of management. The accrued benefits under this supplemental benefit plan were determined and frozen based on eligible earnings through December 31, 2009. The reduction of benefits under the qualified and non-qualified plans mentioned above and various other non-qualified plans resulted in a curtailment gain of
$56.7 million
.
|
|
•
|
We froze a Company-sponsored qualified pension plan in connection with ratified amendments to a collective bargaining agreement covering the Newspaper Guild of the Globe. The amendments resulted in a curtailment loss of
$2.5 million
.
|
|
•
|
We eliminated certain non-qualified retirement benefits of various employees of the Globe in connection with the amendment of two union agreements. The amendments resulted in a curtailment loss of
$0.2 million
.
|
P.
84
– THE NEW YORK TIMES COMPANY
Other changes in plan assets and benefit obligations recognized in other comprehensive income/loss were as follows:
|
(In thousands)
|
December 25,
2011 |
|
December 26,
2010 |
|
December 27,
2009 |
|
||||||
|
Net loss/(gain)
|
$
|
255,907
|
|
$
|
122,879
|
|
$
|
(69,416
|
)
|
|||
|
Prior service cost
|
—
|
|
—
|
|
2,115
|
|
||||||
|
Amortization of loss
|
(28,995
|
)
|
(20,599
|
)
|
(25,962
|
)
|
||||||
|
Amortization of prior service (cost)/credit
|
(803
|
)
|
(803
|
)
|
4,166
|
|
||||||
|
Effect of curtailment
|
—
|
|
(1,083
|
)
|
(2,375
|
)
|
||||||
|
Total recognized in other comprehensive income/loss
|
226,109
|
|
100,394
|
|
(91,472
|
)
|
||||||
|
Net periodic pension cost
|
45,008
|
|
37,843
|
|
1,613
|
|
||||||
|
Total recognized in net periodic benefit cost and other comprehensive income/loss
|
$
|
271,117
|
|
$
|
138,237
|
|
$
|
(89,859
|
)
|
|||
The estimated actuarial loss and prior service cost that will be amortized from accumulated other comprehensive loss into net periodic pension cost over the next fiscal year is approximately
$34 million
and
$1 million
, respectively.
The amount of cost recognized for defined contribution benefit plans was approximately
$23 million
for 2011,
$23 million
for 2010 and
$14 million
for 2009. Effective January 1, 2010, we increased our contribution under a defined contribution plan for non-union employees, including among other things, providing an incremental contribution equal to
3%
of the employee’s eligible earnings, up to applicable limits under the Internal Revenue Code. This change to the defined contribution plan was made in conjunction with freezing our Company-sponsored qualified pension plan for non-union employees.
THE NEW YORK TIMES COMPANY – P.
85
Benefit Obligation and Plan Assets
The changes in the benefit obligation and plan assets and other amounts recognized in other comprehensive income/loss were as follows:
|
|
December 25, 2011
|
December 26, 2010
|
|||||||||||||||||||||||
|
(In thousands)
|
Qualified
Plans
|
Non-
Qualified
Plans
|
All Plans
|
Qualified
Plans
|
Non-
Qualified
Plans
|
All Plans
|
|||||||||||||||||||
|
Change in benefit obligation
|
|||||||||||||||||||||||||
|
Benefit obligation at beginning of year
|
$
|
1,823,625
|
|
$
|
253,743
|
|
$
|
2,077,368
|
|
$
|
1,671,244
|
|
$
|
230,602
|
|
$
|
1,901,846
|
|
|||||||
|
Service cost
|
12,079
|
|
1,660
|
|
13,739
|
|
12,045
|
|
1,896
|
|
13,941
|
|
|||||||||||||
|
Interest cost
|
99,991
|
|
13,293
|
|
113,284
|
|
102,523
|
|
13,602
|
|
116,125
|
|
|||||||||||||
|
Plan participants’ contributions
|
34
|
|
—
|
|
34
|
|
32
|
|
—
|
|
32
|
|
|||||||||||||
|
Actuarial loss
|
140,186
|
|
25,621
|
|
165,807
|
|
131,759
|
|
25,333
|
|
157,092
|
|
|||||||||||||
|
Curtailments
|
—
|
|
—
|
|
—
|
|
(1,083
|
)
|
—
|
|
(1,083
|
)
|
|||||||||||||
|
Benefits paid
|
(89,413
|
)
|
(17,224
|
)
|
(106,637
|
)
|
(92,895
|
)
|
(17,367
|
)
|
(110,262
|
)
|
|||||||||||||
|
Effects of change in currency conversion
|
—
|
|
(33
|
)
|
(33
|
)
|
—
|
|
(323
|
)
|
(323
|
)
|
|||||||||||||
|
Benefit obligation at end of year
|
1,986,502
|
|
277,060
|
|
2,263,562
|
|
1,823,625
|
|
253,743
|
|
2,077,368
|
|
|||||||||||||
|
Change in plan assets
|
|||||||||||||||||||||||||
|
Fair value of plan assets at beginning of year
|
1,381,811
|
|
—
|
|
1,381,811
|
|
1,150,915
|
|
—
|
|
1,150,915
|
|
|||||||||||||
|
Actual return on plan assets
|
21,712
|
|
—
|
|
21,712
|
|
147,837
|
|
—
|
|
147,837
|
|
|||||||||||||
|
Employer contributions
|
150,585
|
|
17,224
|
|
167,809
|
|
175,922
|
|
17,367
|
|
193,289
|
|
|||||||||||||
|
Plan participants’ contributions
|
34
|
|
—
|
|
34
|
|
32
|
|
—
|
|
32
|
|
|||||||||||||
|
Benefits paid
|
(89,413
|
)
|
(17,224
|
)
|
(106,637
|
)
|
(92,895
|
)
|
(17,367
|
)
|
(110,262
|
)
|
|||||||||||||
|
Fair value of plan assets at end of year
|
1,464,729
|
|
—
|
|
1,464,729
|
|
1,381,811
|
|
—
|
|
1,381,811
|
|
|||||||||||||
|
Net amount recognized
|
$
|
(521,773
|
)
|
$
|
(277,060
|
)
|
$
|
(798,833
|
)
|
$
|
(441,814
|
)
|
$
|
(253,743
|
)
|
$
|
(695,557
|
)
|
|||||||
|
Amount recognized in the Consolidated Balance Sheets
|
|||||||||||||||||||||||||
|
Current liabilities
|
$
|
—
|
|
$
|
(18,784
|
)
|
$
|
(18,784
|
)
|
$
|
—
|
|
$
|
(16,436
|
)
|
$
|
(16,436
|
)
|
|||||||
|
Noncurrent liabilities
|
(521,773
|
)
|
(258,276
|
)
|
(780,049
|
)
|
(441,814
|
)
|
(237,307
|
)
|
(679,121
|
)
|
|||||||||||||
|
Net amount recognized
|
$
|
(521,773
|
)
|
$
|
(277,060
|
)
|
$
|
(798,833
|
)
|
$
|
(441,814
|
)
|
$
|
(253,743
|
)
|
$
|
(695,557
|
)
|
|||||||
|
Amount recognized in accumulated other comprehensive loss
|
|||||||||||||||||||||||||
|
Actuarial loss
|
$
|
904,214
|
|
$
|
99,130
|
|
$
|
1,003,344
|
|
$
|
699,709
|
|
$
|
76,723
|
|
$
|
776,432
|
|
|||||||
|
Prior service cost
|
1,959
|
|
—
|
|
1,959
|
|
2,762
|
|
—
|
|
2,762
|
|
|||||||||||||
|
Total
|
$
|
906,173
|
|
$
|
99,130
|
|
$
|
1,005,303
|
|
$
|
702,471
|
|
$
|
76,723
|
|
$
|
779,194
|
|
|||||||
P.
86
– THE NEW YORK TIMES COMPANY
The accumulated benefit obligation for all pension plans was
$2.22 billion
and
$2.04 billion
as of
December 25, 2011
and
December 26, 2010
, respectively.
Information for pension plans with an accumulated benefit obligation in excess of plan assets was as follows:
|
(In thousands)
|
December 25,
2011 |
|
December 26,
2010 |
|
||||
|
Projected benefit obligation
|
$
|
2,263,562
|
|
$
|
2,077,368
|
|
||
|
Accumulated benefit obligation
|
$
|
2,223,755
|
|
$
|
2,035,644
|
|
||
|
Fair value of plan assets
|
$
|
1,464,729
|
|
$
|
1,381,811
|
|
||
Assumptions
Weighted-average assumptions used in the actuarial computations to determine benefit obligations for qualified pension plans were as follows:
|
(Percent)
|
December 25,
2011 |
|
December 26,
2010 |
|
||
|
Discount rate
|
5.05
|
%
|
5.60
|
%
|
||
|
Rate of increase in compensation levels
|
3.00
|
%
|
4.00
|
%
|
||
The rate of increase in compensation levels is applicable only for qualified pension plans that have not been frozen.
Weighted-average assumptions used in the actuarial computations to determine net periodic pension cost for qualified plans were as follows:
|
(Percent)
|
December 25,
2011 |
|
December 26,
2010 |
|
December 27,
2009 |
|
|||
|
Discount rate
|
5.60
|
%
|
6.30
|
%
|
6.45
|
%
|
|||
|
Rate of increase in compensation levels
|
4.00
|
%
|
4.00
|
%
|
3.50
|
%
|
|||
|
Expected long-term rate of return on assets
|
8.25
|
%
|
8.75
|
%
|
8.75
|
%
|
|||
Weighted-average assumptions used in the actuarial computations to determine benefit obligations for non-qualified plans were as follows:
|
(Percent)
|
December 25,
2011 |
|
December 26,
2010 |
|
||
|
Discount rate
|
4.80
|
%
|
5.45
|
%
|
||
|
Rate of increase in compensation levels
|
3.50
|
%
|
3.50
|
%
|
||
The rate of increase in compensation levels is applicable only for the non-qualified pension plans that have not been frozen.
Weighted-average assumptions used in the actuarial computations to determine net periodic pension cost for non-qualified plans were as follows:
|
(Percent)
|
December 25,
2011 |
|
December 26,
2010 |
|
December 27,
2009 |
|
|||
|
Discount rate
|
5.45
|
%
|
6.00
|
%
|
6.55
|
%
|
|||
|
Rate of increase in compensation levels
|
3.50
|
%
|
3.50
|
%
|
3.50
|
%
|
|||
We determined our discount rate using a Ryan ALM, Inc. Curve (the “Ryan Curve”). The Ryan Curve provides the bonds included in the curve and allows adjustments for certain outliers (e.g., bonds on “watch”). We believe the Ryan Curve allows us to calculate an appropriate discount rate.
THE NEW YORK TIMES COMPANY – P.
87
To determine our discount rate, we project a cash flow based on annual accrued benefits. For active participants, the benefits under the respective pension plans are projected to the date of termination. The projected plan cash flow is discounted to the measurement date, which is the last day of our fiscal year, using the annual spot rates provided in the Ryan Curve. A single discount rate is then computed so that the present value of the benefit cash flow equals the present value computed using the Ryan Curve rates.
In determining the expected long-term rate of return on assets, we evaluated input from our investment consultants, actuaries and investment management firms, including our review of asset class return expectations, as well as long-term historical asset class returns. Projected returns by such consultants and economists are based on broad equity and bond indices. Our objective is to select an average rate of earnings expected on existing plan assets and expected contributions to the plan during the year.
The value (“market-related value”) of plan assets is multiplied by the expected long-term rate of return on assets to compute the expected return on plan assets, a component of net periodic pension cost. The market-related value of plan assets is a calculated value that recognizes changes in fair value over three years.
Plan Assets
Company-Sponsored Pension Plans
The assets underlying the Company-sponsored qualified pension plans are managed by professional investment managers. These investment managers are selected and monitored by the pension investment committee, composed of certain senior executives, who are appointed by the Finance Committee of the Board of Directors of the Company. The Finance Committee is responsible for adopting our investment policy, which includes rules regarding the selection and retention of qualified advisors and investment managers. The pension investment committee is responsible for implementing and monitoring compliance with our investment policy, selecting and monitoring investment managers and communicating the investment guidelines and performance objectives to the investment managers.
Our contributions are made on a basis determined by the actuaries in accordance with the funding requirements and limitations of the Employee Retirement Income Security Act (“ERISA”) and the Internal Revenue Code.
Investment Policy and Strategy
The primary long-term investment objective is to allocate assets in a manner that produces a total rate of return that meets or exceeds the growth of our pension liabilities.
The intermediate-term objective is to allocate assets in a manner that outperforms each of the capital markets in which assets are invested, net of costs, measured over a complete market cycle. Overall fund performance is compared to a Target Allocation Index based on the target allocations and comparable portfolios with similar investment objectives.
Asset Allocation Guidelines
In accordance with our asset allocation strategy, for substantially all of our Company-sponsored pension plan assets, investments are categorized into long duration fixed income investments whose value is highly correlated to that of the pension plan obligations (“Long Duration Assets”) or other investments, such as equities and high-yield fixed income securities, whose return over time is expected to exceed pension plan obligations (“Return-Seeking Assets”).
The proportional allocation of assets between Long Duration Assets and Return-Seeking Assets is dependent on the funded status of each pension plan. Under our policy, for example, a funded status of
85%
to
90%
requires an allocation of total assets of
45%
to
55%
to Long Duration Assets and
45%
to
55%
to Return-Seeking Assets. As our funded status increases, the allocation to Long Duration Assets will increase and the allocation to Return-Seeking Assets will decrease.
P.
88
– THE NEW YORK TIMES COMPANY
The following asset allocation guidelines apply to the Return-Seeking Assets:
|
Asset Category
|
Percentage Range
|
|||||
|
U.S. Equities
|
55%
|
-
|
70
|
%
|
||
|
International Equities
|
20%
|
-
|
30
|
%
|
||
|
Total Equity
|
75%
|
-
|
95
|
%
|
||
|
Fixed Income
|
0%
|
-
|
5
|
%
|
||
|
Fixed Income Alternative Investments
|
0%
|
-
|
5
|
%
|
||
|
Equity Alternative Investments
|
0%
|
-
|
5
|
%
|
||
|
Cash Reserves
|
0%
|
-
|
5
|
%
|
||
The weighted-average asset allocations of our Company-sponsored pension plans by asset category for both Long Duration and Return-Seeking Assets, as of
December 25, 2011
, were as follows:
|
Asset Category
|
Percentage
|
|
|
U.S. Equities
|
43
|
%
|
|
International Equities
|
17
|
%
|
|
Total Equity
|
60
|
%
|
|
Fixed Income
|
37
|
%
|
|
Fixed Income Alternative Investments
|
0
|
%
|
|
Equity Alternative Investments
|
3
|
%
|
|
Cash Reserves
|
0
|
%
|
The specified target allocation of assets and ranges set forth above are maintained and reviewed on a periodic basis by the pension investment committee. The pension investment committee may direct the transfer of assets between investment managers in order to rebalance the portfolio in accordance with approved asset allocation ranges to accomplish the investment objectives for the pension plan assets.
The New York Times Newspaper Guild Pension Plan
The assets underlying The New York Times Newspaper Guild pension plan are managed by investment managers selected and monitored by the Board of Trustees of the Newspaper Guild of New York. These investment managers are provided the authority to manage the investment assets of The New York Times Newspaper Guild pension plan, including acquiring and disposing of assets, subject to certain guidelines.
Investment Policy and Strategy
Assets of The New York Times Newspaper Guild pension plan are to be invested in a manner that is consistent with the fiduciary standards set forth by ERISA, the provisions of The New York Times Newspaper Guild pension plan’s Trust Agreement and all other relevant laws. The long-term objective is to maximize return within a reasonable and prudent risk level, maintain sufficient income and liquidity to fund benefit payments and preserve the principal value of The New York Times Newspaper Guild pension plan.
Asset Allocation Guidelines
The following asset allocations guidelines apply to the assets of The New York Times Newspaper Guild pension plan:
|
Asset Category
|
Percentage Range
|
|||||
|
U.S. Equities
|
50%
|
-
|
60
|
%
|
||
|
International Equities
|
5%
|
-
|
15
|
%
|
||
|
Total Equity
|
50%
|
-
|
75
|
%
|
||
|
Fixed Income
|
25%
|
-
|
45
|
%
|
||
THE NEW YORK TIMES COMPANY – P.
89
The specified target allocation of assets and ranges set forth above are maintained and reviewed on a regular basis by the Trustees. If any strategic target allocation is outside the specified target asset allocation range, assets shall be shifted, in a prudent manner and over a reasonable time period, to return the strategy to within the target range. The Trustees have the responsibility for taking the necessary actions to rebalance The New York Times Newspaper Guild pension plan within the established targets.
The New York Times Newspaper Guild pension plan’s weighted-average asset allocations by asset category, as of
December 25, 2011
, were as follows:
|
Asset Category
|
Percentage
|
|
|
U.S. Equities
|
56
|
%
|
|
International Equities
|
8
|
%
|
|
Total Equity
|
64
|
%
|
|
Fixed Income
|
29
|
%
|
|
Cash Equivalents
|
7
|
%
|
Fair Value of Plan Assets
The fair value of the assets underlying our Company-sponsored qualified pension plans and The New York Times Newspaper Guild pension plan by asset category are as follows:
|
|
Fair Value Measurement at December 25, 2011
|
|||||||||||||||||
|
(In thousands)
|
Quoted Prices
Markets for
Identical Assets
|
Significant
Observable
Inputs
|
Significant
Unobservable
Inputs
|
|
||||||||||||||
|
Asset Category
|
(Level 1)
|
(Level 2)
|
(Level 3)
|
Total
|
||||||||||||||
|
Equity Securities:
|
||||||||||||||||||
|
U.S. Equities
|
$
|
173,988
|
|
$
|
—
|
|
$
|
—
|
|
$
|
173,988
|
|
||||||
|
International Equities
|
74,426
|
|
—
|
|
—
|
|
74,426
|
|
||||||||||
|
Common/Collective Funds
(1)
|
—
|
|
714,300
|
|
—
|
|
714,300
|
|
||||||||||
|
Fixed Income Securities:
|
||||||||||||||||||
|
Corporate Bonds
|
—
|
|
266,510
|
|
—
|
|
266,510
|
|
||||||||||
|
U.S. Treasury and Other Government Securities
|
—
|
|
98,531
|
|
—
|
|
98,531
|
|
||||||||||
|
Insurance Contracts
|
—
|
|
31,847
|
|
—
|
|
31,847
|
|
||||||||||
|
Municipal and Provincial Bonds
|
—
|
|
16,850
|
|
—
|
|
16,850
|
|
||||||||||
|
Government Sponsored Enterprises
(2)
|
—
|
|
15,394
|
|
—
|
|
15,394
|
|
||||||||||
|
Other
|
—
|
|
7,268
|
|
—
|
|
7,268
|
|
||||||||||
|
Cash and Cash Equivalents
|
—
|
|
22,865
|
|
—
|
|
22,865
|
|
||||||||||
|
Private Equity
|
—
|
|
—
|
|
37,393
|
|
37,393
|
|
||||||||||
|
Assets at Fair Value
|
$
|
248,414
|
|
$
|
1,173,565
|
|
$
|
37,393
|
|
$
|
1,459,372
|
|
||||||
|
Other Assets
|
5,357
|
|
||||||||||||||||
|
Total
|
$
|
1,464,729
|
|
|||||||||||||||
|
(1)
|
The underlying assets of the common/collective funds are primarily comprised of equity and fixed income securities. The fair value in the above table represents our ownership share of the net asset value of the underlying funds.
|
|
(2)
|
Represents investments that are not backed by the full faith and credit of the United States government.
|
P.
90
– THE NEW YORK TIMES COMPANY
|
|
Fair Value Measurement at December 26, 2010
|
||||||||||||||||
|
(In thousands)
|
Quoted Prices
Markets for
Identical Assets
|
Significant
Observable
Inputs
|
Significant
Unobservable
Inputs
|
|
|||||||||||||
|
Asset Category
|
(Level 1)
|
(Level 2)
|
(Level 3)
|
Total
|
|||||||||||||
|
Equity Securities:
|
|||||||||||||||||
|
U.S. Equities
|
$
|
191,559
|
|
$
|
—
|
|
$
|
—
|
|
$
|
191,559
|
|
|||||
|
International Equities
|
95,880
|
|
—
|
|
—
|
|
95,880
|
|
|||||||||
|
Common/Collective Funds
(1)
|
—
|
|
570,244
|
|
—
|
|
570,244
|
|
|||||||||
|
Fixed Income Securities:
|
|||||||||||||||||
|
Corporate Bonds
|
—
|
|
309,223
|
|
—
|
|
309,223
|
|
|||||||||
|
Insurance Contracts
|
—
|
|
55,235
|
|
—
|
|
55,235
|
|
|||||||||
|
U.S. Treasury and Other Government Securities
|
—
|
|
35,924
|
|
—
|
|
35,924
|
|
|||||||||
|
Government Sponsored Enterprises
(2)
|
—
|
|
19,799
|
|
—
|
|
19,799
|
|
|||||||||
|
Municipal and Provincial Bonds
|
—
|
|
12,551
|
|
—
|
|
12,551
|
|
|||||||||
|
Other
|
—
|
|
8,208
|
|
—
|
|
8,208
|
|
|||||||||
|
Cash and Cash Equivalents
|
—
|
|
9,207
|
|
—
|
|
9,207
|
|
|||||||||
|
Real Estate
|
—
|
|
—
|
|
37,471
|
|
37,471
|
|
|||||||||
|
Private Equity
|
—
|
|
—
|
|
31,187
|
|
31,187
|
|
|||||||||
|
Assets at Fair Value
|
$
|
287,439
|
|
$
|
1,020,391
|
|
$
|
68,658
|
|
$
|
1,376,488
|
|
|||||
|
Other Assets
|
5,323
|
|
|||||||||||||||
|
Total
|
$
|
1,381,811
|
|
||||||||||||||
|
(1)
|
The underlying assets of the common/collective funds are primarily comprised of equity and fixed income securities. The fair value in the above table represents our ownership share of the net asset value of the underlying funds.
|
|
(2)
|
Represents investments that are not backed by the full faith and credit of the United States government.
|
Level 1 and Level 2 Investments
Where quoted prices are available in an active market for identical assets, such as equity securities traded on an exchange, transactions for the asset occur with such frequency that the pricing information is available on an ongoing/daily basis. We, therefore, classify these types of investments as Level 1 where the fair value represents the closing/last trade price for these particular securities.
For our investments where pricing data may not be readily available, fair values are estimated by using quoted prices for similar assets, in both active and not active markets, and observable inputs, other than quoted prices, such as interest rates and credit risk. We classify these types of investments as Level 2 because we are able to reasonably estimate the fair value through inputs that are observable, either directly or indirectly.
Level 3 Investments
We have investments in private equity funds as of December 25, 2011 and December 26, 2010 and a real estate investment fund as of December 26, 2010 that have been determined to be Level 3 investments, within the fair value hierarchy, because the inputs to determine fair value are considered unobservable.
The general valuation methodology used for the private equity investment funds is the market approach. The market approach utilizes prices and other relevant information such as similar market transactions, type of security, size of the position, degree of liquidity, restrictions on the disposition, latest round of financing data, current financial position and operating results among other factors.
The general valuation methodology used for the real estate investment fund is developed by a third-party appraisal. The appraisal is performed in accordance with guidelines set forth by the Appraisal Institute and take into account projected income and expenses of the property, as well as recent sales of similar properties.
THE NEW YORK TIMES COMPANY – P.
91
As a result of the inherent limitations related to the valuations of the Level 3 investments, due to the unobservable inputs of the underlying funds, the estimated fair value may differ significantly from the values that would have been used had a market for those investments existed.
The reconciliation of the beginning and ending balances of the fair value measurements using significant unobservable inputs (Level 3) as of
December 25, 2011
is as follows:
|
|
Fair Value Measurements Using Significant
Unobservable Inputs (Level 3)
|
|||||||||||
|
(In thousands)
|
Real Estate
|
Private Equity
|
Total
|
|||||||||
|
Balance at beginning of year
|
$
|
37,471
|
|
$
|
31,187
|
|
$
|
68,658
|
|
|||
|
Actual gain on plan assets:
|
||||||||||||
|
Relating to assets still held
|
—
|
|
4,021
|
|
4,021
|
|
||||||
|
Related to assets sold during the period
|
541
|
|
—
|
|
541
|
|
||||||
|
Capital contribution
|
—
|
|
5,196
|
|
5,196
|
|
||||||
|
Sales
|
(38,012
|
)
|
(3,011
|
)
|
(41,023
|
)
|
||||||
|
Balance at end of year
|
$
|
—
|
|
$
|
37,393
|
|
$
|
37,393
|
|
|||
The reconciliation of the beginning and ending balances of the fair value measurements using significant unobservable inputs (Level 3) as of
December 26, 2010
is as follows:
|
|
Fair Value Measurements Using Significant
Unobservable Inputs (Level 3)
|
|||||||||||
|
(In thousands)
|
Real Estate
|
Private Equity
|
Total
|
|||||||||
|
Balance at beginning of year
|
$
|
33,938
|
|
$
|
20,564
|
|
$
|
54,502
|
|
|||
|
Actual loss on plan assets:
|
||||||||||||
|
Relating to assets still held
|
3,533
|
|
4,503
|
|
8,036
|
|
||||||
|
Related to assets sold during the period
|
—
|
|
—
|
|
—
|
|
||||||
|
Capital contribution
|
—
|
|
6,120
|
|
6,120
|
|
||||||
|
Sales
|
—
|
|
—
|
|
—
|
|
||||||
|
Balance at end of year
|
$
|
37,471
|
|
$
|
31,187
|
|
$
|
68,658
|
|
|||
Cash Flows
We made contributions of approximately
$151 million
to certain qualified pension plans in 2011. The majority of these contributions were discretionary. We expect to make mandatory contributions, primarily contractual contributions in connection with The New York Times Newspaper Guild pension plan, of approximately
$45 million
in 2012. We may make discretionary contributions in 2012 to our Company-sponsored qualified pension plans depending on cash flows, pension asset performance, interest rates and other factors.
The following benefit payments under our pension plans, which reflect expected future services, are expected to be paid:
|
|
Plans
|
|
||||||||||
|
(In thousands)
|
Qualified
|
Non-
Qualified
|
Total
|
|||||||||
|
2012
|
$
|
95,978
|
|
$
|
19,858
|
|
$
|
115,836
|
|
|||
|
2013
|
97,043
|
|
18,860
|
|
115,903
|
|
||||||
|
2014
|
98,806
|
|
18,917
|
|
117,723
|
|
||||||
|
2015
|
103,391
|
|
19,583
|
|
122,974
|
|
||||||
|
2016
|
106,758
|
|
20,407
|
|
127,165
|
|
||||||
|
2017-2021
|
594,463
|
|
101,577
|
|
696,040
|
|
||||||
P.
92
– THE NEW YORK TIMES COMPANY
Multiemployer Plans
We contribute to a number of multiemployer defined benefit pension plans under the terms of various collective bargaining agreements that cover our union-represented employees. Over the past 3 years, certain events, such as amendments to various collective bargaining agreements, resulted in withdrawals from multiemployer pension plans. These actions, along with a reduction in covered employees, have resulted in us estimating withdrawal liabilities to the respective plans for our proportionate share of any unfunded vested benefits. We recorded an estimated charge for pension plan withdrawal obligations of
$4.2 million
in 2011,
$6.3 million
in 2010 and
$78.9 million
in 2009. Our multiemployer pension plan withdrawal liability was approximately
$100 million
as of December 25, 2011. This liability is the present value of the obligations related to complete and partial withdrawals from certain plans as well as an estimate of future partial withdrawals that we considered probable and reasonably estimable. The actual liability will not be known until each plan completes a final assessment of the withdrawal liability and issues a demand to us. Therefore, the estimate of our multiemployer pension plan liability will be adjusted as more information becomes available that allows us to refine our estimates.
The risks of participating in multiemployer plans are different from single-employer plans in the following aspects:
|
•
|
Assets contributed to the multiemployer plan by one employer may be used to provide benefits to employees of other participating employers.
|
|
•
|
If a participating employer stops contributing to the plan, the unfunded obligations of the plan may be borne by the remaining participating employers.
|
|
•
|
If we choose to stop participating in some multiemployer pension plans, we may be required to pay those plans an amount based on the underfunded status of the plan (a withdrawal liability).
|
Our participation in significant plans for the fiscal period ended December 25, 2011, is outlined in the table below. The “EIN/Pension Plan Number” column provides the Employer Identification Number (“EIN”) and the three digit plan number. The zone status is based on the latest information that we received from the plan and is certified by the plan’s actuary. Among other factors, plans in the red zone are generally less than
65
percent funded, plans in the yellow zone are less than
80
percent funded, and plans in the green zone are at least
80
percent funded. The “FIP/RP Status Pending/Implemented” column indicates plans for which a financial improvement plan (“FIP”) or a rehabilitation plan (“RP”) is either pending or has been implemented. The “Surcharge Imposed” column includes plans in a red zone status that are required to pay a surcharge in excess of regular contributions. The last column lists the expiration date(s) of the collective bargaining agreement(s) to which the plans are subject.
THE NEW YORK TIMES COMPANY – P.
93
|
EIN/Pension Plan Number
|
Pension Protection Act Zone Status
|
FIP/RP Status Pending/Implemented
|
(In thousands)
Contributions of the Company
|
Surcharge Imposed
|
Collective Bargaining Agreement Expiration Date
|
||||||||||||
|
Pension Fund
|
2011
|
2010
|
2011
|
2010
|
2009
|
||||||||||||
|
CWA/ITU Negotiated Pension Plan
|
13-6212879-001
|
Red as of 12/31/11
|
Red as of 12/31/10
|
Implemented
|
$
|
776
|
|
$
|
862
|
|
$
|
1,417
|
|
Yes
|
3/30/2011 & 3/30/2016
|
(1) (2)
|
|
|
Newspaper and Mail Deliverers'-Publishers' Pension Fund
|
13-6122251-001
|
Green as of 5/31/12
|
Yellow as of 5/31/11
|
No
|
1,298
|
|
1,242
|
|
1,475
|
|
No
|
3/30/2020
|
(3)
|
||||
|
GCIU-Employer Retirement Benefit Plan
|
91-6024903-001
|
Red as of 12/31/11
|
Red as of 12/31/10
|
Implemented
|
116
|
|
116
|
|
433
|
|
No
|
11/30/2016 & 3/30/2017
|
(2) (4)
|
||||
|
Pressmen's Publishers' Pension Fund
|
13-6121627-001
|
Green as of 3/31/12
|
Green as of 3/31/11
|
No
|
1,113
|
|
1,132
|
|
1,335
|
|
No
|
3/30/2017
|
(3)
|
||||
|
New England Teamsters & Trucking Industry Pension
|
04-6372430-001
|
Red as of 9/30/12
|
Red as of 9/30/11
|
Yes
|
46
|
|
205
|
|
1,380
|
|
No
|
12/31/2015
|
(2)
|
||||
|
Paper-Handlers'-Publishers' Pension Fund
|
13-6104795-001
|
Green as of 3/31/12
|
Green as of 3/31/11
|
No
|
153
|
|
151
|
|
202
|
|
No
|
3/30/2014
|
(3)
|
||||
|
Contributions for individually significant plans
|
$
|
3,502
|
|
$
|
3,708
|
|
$
|
6,242
|
|
||||||||
|
Contributions to other multiemployer plans
|
2,250
|
|
2,127
|
|
3,385
|
|
|||||||||||
|
Total Contributions
|
$
|
5,752
|
|
$
|
5,835
|
|
$
|
9,627
|
|
||||||||
|
(1)
|
There are two collective bargaining agreements requiring contributions to this plan. These agreements cover approximately 220 employees, with the majority covered by the agreement that expired on March 30, 2011. A new agreement is currently being negotiated.
|
|
(2)
|
In 2009, employees of the Globe represented by various unions ratified amendments to their collective bargaining agreements that allowed us to partially withdraw from these plans. These actions resulted in lower contributions to these plans in years after 2009.
|
|
(3)
|
Board of Trustees elected funding relief as allowed under the Preservation of Access to Care for Medicare Beneficiaries and Pension Relief Act of 2010.
|
|
(4)
|
There are two collective bargaining agreements requiring contributions to this plan. These agreements cover approximately 40 employees, with the majority covered by the agreement that expires on March 30, 2017.
|
The rehabilitation plan for the GCIU-Employer Retirement Benefit Plan includes minimum annual contributions no less than the total annual contribution made by us from September 1, 2008 through August 31, 2009.
The Company was listed in its plans’ Forms 5500 as providing more than
5%
of the total contributions for the following plans and plan years:
|
Pension Fund
|
Year Contributions to Plan Exceeded More Than 5 Percent of Total Contributions (as of Plan's Year-End)
|
|
|
CWA/ITU Negotiated Pension Plan
|
12/31/2010 & 12/31/2009
(1)
|
|
|
Newspaper and Mail Deliverers'-Publishers' Pension Fund
|
5/31/2010 & 5/31/2009
(1)
|
|
|
Pressmen's Publisher's Pension Fund
|
3/31/2011, 3/31/2010 & 3/31/2009
|
|
|
Paper-Handlers'-Publishers' Pension Fund
|
3/31/2011, 3/31/2010 & 3/31/2009
|
|
(1) Form 5500 for the plan year 12/31/11 and 5/31/11 was not available as of the date we filed our financial statements.
12. Other Postretirement Benefits
We provide health benefits to retired employees (and their eligible dependents) who meet the definition of an eligible participant and certain age and service requirements, as outlined in the plan document. While we offer pre-age
65
retiree medical coverage to employees who meet certain retiree medical eligibility requirements, we no longer provide post-age
65
retiree medical benefits for employees who retire on or after March 1, 2009. We also contribute to a postretirement plan under the provisions of a collective bargaining agreement. We accrue the costs of postretirement benefits during the employees’ active years of service and our policy is to pay our portion of insurance premiums and claims from our assets.
P.
94
– THE NEW YORK TIMES COMPANY
In October 2011, we amended our retiree medical plan by, among other things, placing a cap (effective January 1, 2012) on our contributions for certain retiree groups. In connection with this plan amendment, we remeasured our postretirement obligation as of the plan amendment date. The plan amendment and remeasurement resulted in a decrease in the postretirement liability and an increase in other comprehensive income (before taxes) of approximately
$20 million
in October 2011.
The Patient Protection and Affordable Care Act, which was enacted on March 23, 2010, and the Health Care and Education Reconciliation Act of 2010, which was enacted on March 30, 2010, eliminated the tax deductibility of certain retiree health care costs, beginning January 1, 2013, to the extent of federal subsidies received by plan sponsors that provide retiree prescription drug benefits equivalent to Medicare Part D. Because the future anticipated retiree health-care liabilities and related subsidies are already reflected in our financial statements, this legislation required us to reduce the related deferred tax asset recognized in our financial statements. As a result, we recorded a tax charge of
$11.4 million
in 2010 for the reduction in future tax benefits for retiree health benefits resulting from the federal health care legislation enacted in 2010. The impact of this legislation was not material and was included in our 2010 year-end measurement of our postretirement benefits obligation.
The components of net periodic postretirement benefit income were as follows:
|
(In thousands)
|
December 25,
2011 |
|
December 26,
2010 |
|
December 27,
2009 |
|
||||||
|
Service cost
|
$
|
1,143
|
|
$
|
1,076
|
|
$
|
1,551
|
|
|||
|
Interest cost
|
6,890
|
|
9,340
|
|
10,355
|
|
||||||
|
Recognized actuarial loss
|
2,289
|
|
3,129
|
|
2,014
|
|
||||||
|
Amortization of prior service credit
|
(16,593
|
)
|
(15,602
|
)
|
(14,902
|
)
|
||||||
|
Net periodic postretirement benefit income
|
$
|
(6,271
|
)
|
$
|
(2,057
|
)
|
$
|
(982
|
)
|
|||
The changes in the benefit obligations recognized in other comprehensive income/loss were as follows:
|
(In thousands)
|
December 25,
2011 |
|
December 26,
2010 |
|
December 27,
2009 |
|
||||||
|
Net loss/(gain)
|
$
|
13,436
|
|
$
|
(16,865
|
)
|
$
|
15,749
|
|
|||
|
Prior service credit
|
(35,712
|
)
|
—
|
|
(9,581
|
)
|
||||||
|
Amortization of loss
|
(2,289
|
)
|
(3,129
|
)
|
(2,014
|
)
|
||||||
|
Amortization of prior service credit
|
16,593
|
|
15,602
|
|
14,902
|
|
||||||
|
Total recognized in other comprehensive income/loss
|
(7,972
|
)
|
(4,392
|
)
|
19,056
|
|
||||||
|
Net periodic postretirement benefit income
|
(6,271
|
)
|
(2,057
|
)
|
(982
|
)
|
||||||
|
Total recognized in net periodic postretirement benefit income and other comprehensive income/loss
|
$
|
(14,243
|
)
|
$
|
(6,449
|
)
|
$
|
18,074
|
|
|||
The estimated actuarial loss and prior service credit that will be amortized from accumulated other comprehensive loss into net periodic benefit cost over the next fiscal year is approximately
$3 million
and
$15 million
, respectively.
In connection with collective bargaining agreements, we contribute to several multiemployer welfare plans. These plans provide medical benefits to active and retired employees covered under the respective collective bargaining agreement. Contributions are made in accordance with the formula in the relevant agreement. Postretirement costs related to these plans are not reflected above and were approximately
$16 million
in
2011
and
$18 million
in
2010
and
2009
.
THE NEW YORK TIMES COMPANY – P.
95
The changes in the benefit obligation and plan assets and other amounts recognized in other comprehensive income/loss were as follows:
|
(In thousands)
|
December 25,
2011 |
|
December 26,
2010 |
|
||||
|
Change in benefit obligation
|
||||||||
|
Benefit obligation at beginning of year
|
$
|
142,417
|
|
$
|
164,811
|
|
||
|
Service cost
|
1,143
|
|
1,076
|
|
||||
|
Interest cost
|
6,890
|
|
9,340
|
|
||||
|
Plan participants’ contributions
|
4,659
|
|
4,569
|
|
||||
|
Actuarial loss/(gain)
|
13,436
|
|
(16,865
|
)
|
||||
|
Plan amendments
|
(35,712
|
)
|
—
|
|
||||
|
Benefits paid
|
(20,247
|
)
|
(21,438
|
)
|
||||
|
Medicare subsidies received
|
1,217
|
|
924
|
|
||||
|
Benefit obligation at the end of year
|
113,803
|
|
142,417
|
|
||||
|
Change in plan assets
|
||||||||
|
Fair value of plan assets at beginning of year
|
—
|
|
—
|
|
||||
|
Employer contributions
|
14,371
|
|
15,945
|
|
||||
|
Plan participants’ contributions
|
4,659
|
|
4,569
|
|
||||
|
Benefits paid
|
(20,247
|
)
|
(21,438
|
)
|
||||
|
Medicare subsidies received
|
1,217
|
|
924
|
|
||||
|
Fair value of plan assets at end of year
|
—
|
|
—
|
|
||||
|
Net amount recognized
|
$
|
(113,803
|
)
|
$
|
(142,417
|
)
|
||
|
Amount recognized in the Consolidated Balance Sheets
|
||||||||
|
Current liabilities
|
$
|
(9,611
|
)
|
$
|
(11,794
|
)
|
||
|
Noncurrent liabilities
|
(104,192
|
)
|
(130,623
|
)
|
||||
|
Net amount recognized
|
$
|
(113,803
|
)
|
$
|
(142,417
|
)
|
||
|
Amount recognized in accumulated other comprehensive loss
|
||||||||
|
Actuarial loss
|
$
|
43,114
|
|
$
|
31,967
|
|
||
|
Prior service credit
|
(136,469
|
)
|
(117,350
|
)
|
||||
|
Total
|
$
|
(93,355
|
)
|
$
|
(85,383
|
)
|
||
Weighted-average assumptions used in the actuarial computations to determine the postretirement benefit obligations were as follows:
|
December 25,
2011 |
|
December 26,
2010 |
|
|||
|
Discount rate
|
4.64
|
%
|
5.35
|
%
|
||
|
Estimated increase in compensation level
|
3.50
|
%
|
3.50
|
%
|
||
Weighted-average assumptions used in the actuarial computations to determine net periodic postretirement cost were as follows:
|
December 25,
2011 |
|
December 26,
2010 |
|
December 27,
2009 |
|
||||
|
Discount rate
|
5.14
|
%
|
5.92
|
%
|
6.67
|
%
|
|||
|
Estimated increase in compensation level
|
3.50
|
%
|
3.50
|
%
|
3.50
|
%
|
|||
P.
96
– THE NEW YORK TIMES COMPANY
The assumed health-care cost trend rates were as follows:
|
December 25,
2011 |
|
December 26,
2010 |
|
|||
|
Health-care cost trend rate assumed next year
|
7.33
|
%
|
7.75
|
%
|
||
|
Rate to which the cost trend rate is assumed to decline (ultimate trend rate)
|
5.00
|
%
|
5.00
|
%
|
||
|
Year that the rate reaches the ultimate trend rate
|
2019
|
|
2019
|
|
||
Assumed health-care cost trend rates have a significant effect on the amounts reported for the health-care plans. A one-percentage point change in assumed health-care cost trend rates would have the following effects:
|
|
One-Percentage Point
|
|||||||
|
(In thousands)
|
Increase
|
|
Decrease
|
|
||||
|
Effect on total service and interest cost for 2011
|
$
|
386
|
|
$
|
336
|
|
||
|
Effect on accumulated postretirement benefit obligation as of December 25, 2011
|
$
|
5,227
|
|
$
|
4,618
|
|
||
The following benefit payments (net of plan participant contributions) under our Company’s postretirement plans, which reflect expected future services, are expected to be paid:
|
(In thousands)
|
Amount
|
|
|
|
2012
|
$
|
10,601
|
|
|
2013
|
10,484
|
|
|
|
2014
|
10,177
|
|
|
|
2015
|
9,875
|
|
|
|
2016
|
9,529
|
|
|
|
2017-2021
|
41,712
|
|
|
We accrue the cost of certain benefits provided to former or inactive employees after employment, but before retirement, during the employees’ active years of service. Benefits include life insurance, disability benefits and health-care continuation coverage. The accrued cost of these benefits amounted to
$20.3 million
as of
December 25, 2011
and
$20.2 million
as of
December 26, 2010
.
13. Other Liabilities
The components of the “Other Liabilities – Other” balance in our Consolidated Balance Sheets were as follows:
|
(In thousands)
|
December 25,
2011 |
|
December 26,
2010 |
|
||||
|
Deferred compensation
|
$
|
75,394
|
|
$
|
87,102
|
|
||
|
Other liabilities
|
102,323
|
|
130,373
|
|
||||
|
Total
|
$
|
177,717
|
|
$
|
217,475
|
|
||
Deferred compensation consists primarily of deferrals under our deferred executive compensation plan (the “DEC Plan”). The DEC plan enables certain eligible executives to elect to defer a portion of their compensation on a pre-tax basis. While the initial deferral period is for a minimum of
2
years up to a maximum of
15
years (after which time taxable distributions must begin), the executive has the option to extend the deferral period. Employees’ contributions earn income based on the performance of investment funds they select.
We invest deferred compensation in life insurance products designed to closely mirror the performance of the investment funds that the participants select. Our investments in life insurance products are included in “Miscellaneous assets” in our Consolidated Balance Sheets, and were
$75.4 million
as of
December 25, 2011
and
$88.6 million
as of
December 26, 2010
.
Other liabilities in the preceding table primarily included our contingent tax liability as of
December 25, 2011
and
December 26, 2010
.
THE NEW YORK TIMES COMPANY – P.
97
14. Income Taxes
Reconciliations between the effective tax rate on income/(loss) from continuing operations before income taxes and the federal statutory rate are presented below.
|
|
December 25, 2011
|
December 26, 2010
|
December 27, 2009
|
||||||||||||||||||
|
(In thousands)
|
Amount
|
% of
Pre-tax
|
Amount
|
% of
Pre-tax
|
Amount
|
% of
Pre-tax
|
|||||||||||||||
|
Tax at federal statutory rate
|
$
|
(1,302
|
)
|
35.0
|
%
|
$
|
62,027
|
|
35.0
|
%
|
$
|
1,321
|
|
35.0
|
%
|
||||||
|
State and local taxes, net
|
15,095
|
|
(406.0
|
)
|
19,010
|
|
10.7
|
|
12,418
|
|
329.1
|
|
|||||||||
|
Effect of enacted changes in tax laws
|
(1,520
|
)
|
40.9
|
|
11,370
|
|
6.4
|
|
11,743
|
|
311.2
|
|
|||||||||
|
Reduction in uncertain tax positions
|
(12,105
|
)
|
325.6
|
|
(21,722
|
)
|
(12.2
|
)
|
(22,338
|
)
|
(592.0
|
)
|
|||||||||
|
Loss/(gain) on Company-owned life insurance
|
36
|
|
(1.0
|
)
|
(3,319
|
)
|
(1.9
|
)
|
(4,156
|
)
|
(110.1
|
)
|
|||||||||
|
Non-deductible goodwill
|
34,992
|
|
(941.2
|
)
|
—
|
|
—
|
|
852
|
|
22.5
|
|
|||||||||
|
Other, net
|
1,310
|
|
(35.2
|
)
|
1,150
|
|
0.7
|
|
2,366
|
|
62.7
|
|
|||||||||
|
Income tax expense
|
$
|
36,506
|
|
*
|
|
$
|
68,516
|
|
38.7
|
|
$
|
2,206
|
|
58.4
|
|
||||||
|
*
|
The effective tax rate in 2011 is not meaningful because a portion of the non-cash charge in the second quarter of 2011 for the impairment of the Regional Media Group's goodwill was non-deductible.
|
The components of income tax expense as shown in our Consolidated Statements of Operations were as follows:
|
(In thousands)
|
December 25,
2011 |
|
December 26,
2010 |
|
December 27,
2009 |
|
||||||
|
Current tax (benefit)/expense
|
||||||||||||
|
Federal
|
$
|
(19,559
|
)
|
$
|
14,354
|
|
$
|
(23,748
|
)
|
|||
|
Foreign
|
1,110
|
|
682
|
|
784
|
|
||||||
|
State and local
|
(5,786
|
)
|
(7,791
|
)
|
(19,261
|
)
|
||||||
|
Total current tax (benefit)/expense
|
(24,235
|
)
|
7,245
|
|
(42,225
|
)
|
||||||
|
Deferred tax expense/(benefit)
|
||||||||||||
|
Federal
|
14,523
|
|
52,735
|
|
27,320
|
|
||||||
|
Foreign
|
37,471
|
|
(1,384
|
)
|
(3,546
|
)
|
||||||
|
State and local
|
8,747
|
|
9,920
|
|
20,657
|
|
||||||
|
Total deferred tax expense
|
60,741
|
|
61,271
|
|
44,431
|
|
||||||
|
Income tax expense
|
$
|
36,506
|
|
$
|
68,516
|
|
$
|
2,206
|
|
|||
We recognized a net operating loss carryforward (“loss carryforward”) for federal tax purposes of
$23.1 million
as of
December 25, 2011
and
$0
as of
December 26, 2010
. In accordance with federal tax law, the loss carryforward has a life of
20
years.
State tax operating loss carryforwards totaled
$15.1 million
as of
December 25, 2011
and
$8.7 million
as of
December 26, 2010
. Such loss carryforwards expire in accordance with provisions of applicable tax laws and have remaining lives generally ranging from
1
to
20
years.
P.
98
– THE NEW YORK TIMES COMPANY
The components of the net deferred tax assets and liabilities recognized in our Consolidated Balance Sheets were as follows:
|
(In thousands)
|
December 25,
2011 |
|
December 26,
2010 |
|
||||
|
Deferred tax assets
|
||||||||
|
Retirement, postemployment and deferred compensation plans
|
$
|
447,156
|
|
$
|
420,745
|
|
||
|
Accruals for other employee benefits, compensation, insurance and other
|
39,572
|
|
56,280
|
|
||||
|
Accounts receivable allowances
|
7,114
|
|
9,587
|
|
||||
|
Other
|
109,946
|
|
91,424
|
|
||||
|
Gross deferred tax assets
|
603,788
|
|
578,036
|
|
||||
|
Valuation allowance
|
(39,824
|
)
|
—
|
|
||||
|
Net deferred tax assets
|
$
|
563,964
|
|
$
|
578,036
|
|
||
|
Deferred tax liabilities
|
||||||||
|
Property, plant and equipment
|
$
|
143,308
|
|
$
|
141,052
|
|
||
|
Intangible assets
|
42,150
|
|
44,568
|
|
||||
|
Investments in joint ventures
|
15,095
|
|
11,796
|
|
||||
|
Other
|
10,073
|
|
56,044
|
|
||||
|
Gross deferred tax liabilities
|
210,626
|
|
253,460
|
|
||||
|
Net deferred tax asset
|
$
|
353,338
|
|
$
|
324,576
|
|
||
|
Amounts recognized in the Consolidated Balance Sheets
|
||||||||
|
Deferred tax asset – current
|
$
|
73,055
|
|
$
|
68,875
|
|
||
|
Deferred tax asset – long-term
|
280,283
|
|
255,701
|
|
||||
|
Net deferred tax asset
|
$
|
353,338
|
|
$
|
324,576
|
|
||
We assess whether a valuation allowance should be established against deferred tax assets based on the consideration of both positive and negative evidence using a “more likely than not” standard. In making such judgments, significant weight is given to evidence that can be objectively verified. We evaluated our deferred tax assets for recoverability using a consistent approach that considers our three-year historical cumulative income/(loss), including an assessment of the degree to which any such losses were due to items that are unusual in nature (e.g., impairments of non-deductible goodwill and intangible assets).
In 2011, we recorded a valuation allowance of
$39.8 million
for deferred tax assets primarily associated with net operating losses of non-U.S. operations as we determined these assets were not realizable on a more-likely-than-not basis. In connection with this assessment, we also reversed a deferred tax liability, included in the “Deferred tax liabilities - other” line in the table above, originally established for the U.S. tax consequences associated with recognizing the net operating losses of the non-U.S. operations. The net impact on 2011 income tax expense was nominal as the valuation allowance was almost completely offset by the reversal of the deferred tax liability.
Income tax benefits related to the exercise or vesting of equity awards reduced current taxes payable by
$1.6 million
in
2011
,
$2.1 million
in
2010
and
$1.0 million
in
2009
.
As of
December 25, 2011
and
December 26, 2010
, “Accumulated other comprehensive loss, net of income taxes” in our Consolidated Balance Sheets and for the years then ended in our Consolidated Statements of Changes in Stockholders’ Equity was net of deferred tax assets of approximately
$370 million
and
$280 million
, respectively.
THE NEW YORK TIMES COMPANY – P.
99
A reconciliation of unrecognized tax benefits is as follows:
|
(In thousands)
|
December 25,
2011 |
|
December 26,
2010 |
|
December 27,
2009 |
|
||||||
|
Balance at beginning of year
|
$
|
55,636
|
|
$
|
70,578
|
|
$
|
92,582
|
|
|||
|
Gross additions to tax positions taken during the current year
|
4,094
|
|
2,565
|
|
3,545
|
|
||||||
|
Gross reductions to tax positions taken during the current year
|
—
|
|
—
|
|
—
|
|
||||||
|
Gross additions to tax positions taken during the prior year
|
460
|
|
—
|
|
—
|
|
||||||
|
Gross reductions to tax positions taken during the prior year
|
(970
|
)
|
(13,347
|
)
|
(13,484
|
)
|
||||||
|
Reductions from settlements with taxing authorities
|
(1,941
|
)
|
—
|
|
—
|
|
||||||
|
Reductions from lapse of applicable statutes of limitations
|
(9,308
|
)
|
(4,160
|
)
|
(12,065
|
)
|
||||||
|
Balance at end of year
|
$
|
47,971
|
|
$
|
55,636
|
|
$
|
70,578
|
|
|||
The total amount of unrecognized tax benefits that would, if recognized, affect the effective income tax rate was approximately
$31 million
as of
December 25, 2011
and
$36 million
as of
December 26, 2010
.
We also recognize accrued interest expense and penalties related to the unrecognized tax benefits within income tax expense or benefit. The total amount of accrued interest and penalties was approximately
$16 million
as of
December 25, 2011
and approximately
$18 million
as of
December 26, 2010
. The total amount of accrued interest and penalties was a net benefit of
$1.4 million
in
2011
,
$6.3 million
in
2010
and
$4.4 million
in
2009
.
With few exceptions, we are no longer subject to U.S. federal, state and local, or non-U.S. income tax examinations by tax authorities for years prior to 2004. Management believes that our accrual for tax liabilities is adequate for all open audit years. This assessment relies on estimates and assumptions and may involve a series of complex judgments about future events.
It is reasonably possible that certain income tax examinations may be concluded, or statutes of limitation may lapse, during the next 12 months, which could result in a decrease in unrecognized tax benefits of approximately
$19 million
that would, if recognized, impact the effective tax rate.
15. Discontinued Operations
Discontinued operations are summarized in the following table.
|
(In thousands)
|
December 26,
2010 |
|
December 27,
2009 |
|
||||
|
Revenues
|
$
|
—
|
|
$
|
5,062
|
|
||
|
Total operating costs
|
—
|
|
7,082
|
|
||||
|
Pre-tax loss
|
—
|
|
(2,020
|
)
|
||||
|
Income tax benefit
|
—
|
|
(864
|
)
|
||||
|
Loss from discontinued operations, net of income taxes
|
—
|
|
(1,156
|
)
|
||||
|
Gain on sale, net of income taxes:
|
||||||||
|
Gain on sale
|
16
|
|
34,914
|
|
||||
|
Income tax expense
|
3
|
|
15,426
|
|
||||
|
Gain on sale, net of income taxes
|
13
|
|
19,488
|
|
||||
|
Income from discontinued operations, net of income taxes
|
$
|
13
|
|
$
|
18,332
|
|
||
WQXR-FM
The results of operations for WQXR-FM, a New York City classical radio station, which was sold in October 2009, are presented as discontinued operations. We received proceeds related to the sale of approximately
$45 million
and recorded a pre-tax gain of approximately
$35 million
(approximately
$19 million
after tax) in the fourth quarter of 2009. In 2010, we recorded post-closing adjustments to the gain.
The results of operations for WQXR-FM, which were previously consolidated in the results of the News Media Group, are presented as discontinued operations in our Consolidated Financial Statements for all periods presented.
P.
100
– THE NEW YORK TIMES COMPANY
16. Earnings/(Loss) Per Share
Basic and diluted earnings/(loss) per share were as follows:
|
(In thousands, except per share data)
|
December 25,
2011 |
|
December 26,
2010 |
|
December 27,
2009 |
|
||||||
|
Amounts attributable to The New York Times Company common stockholders:
|
||||||||||||
|
(Loss)/income from continuing operations
|
$
|
(39,669
|
)
|
$
|
107,691
|
|
$
|
1,559
|
|
|||
|
Income from discontinued operations, net of income taxes
|
—
|
|
13
|
|
18,332
|
|
||||||
|
Net (loss)/income
|
$
|
(39,669
|
)
|
$
|
107,704
|
|
$
|
19,891
|
|
|||
|
Average number of common shares outstanding – Basic
|
147,190
|
|
145,636
|
|
144,188
|
|
||||||
|
Incremental shares for assumed exercise of securities
|
—
|
|
6,964
|
|
2,179
|
|
||||||
|
Average number of common shares outstanding – Diluted
|
147,190
|
|
152,600
|
|
146,367
|
|
||||||
|
Basic (loss)/earnings per share attributable to The New York Times Company common stockholders:
|
||||||||||||
|
(Loss)/income from continuing operations
|
$
|
(0.27
|
)
|
$
|
0.74
|
|
$
|
0.01
|
|
|||
|
Income from discontinued operations, net of income taxes
|
0.00
|
|
0.00
|
|
0.13
|
|
||||||
|
Net (loss)/income – Basic
|
$
|
(0.27
|
)
|
$
|
0.74
|
|
$
|
0.14
|
|
|||
|
Diluted (loss)/earnings per share attributable to The New York Times Company common stockholders:
|
||||||||||||
|
(Loss)/income from continuing operations
|
$
|
(0.27
|
)
|
$
|
0.71
|
|
$
|
0.01
|
|
|||
|
Income from discontinued operations, net of income taxes
|
0.00
|
|
0.00
|
|
0.13
|
|
||||||
|
Net (loss)/income – Diluted
|
$
|
(0.27
|
)
|
$
|
0.71
|
|
$
|
0.14
|
|
|||
The difference between basic and diluted shares is that diluted shares include the dilutive effect of the assumed exercise of outstanding securities. Our stock options and warrants could have the most significant impact on diluted shares.
Securities that could potentially be dilutive are excluded from the computation of diluted earnings per share when a loss from continuing operations exists or when the exercise price exceeds the market value of our Class A Common Stock (“Common Stock”), because their inclusion would result in an anti-dilutive effect on per share amounts.
The number of stock options that were excluded from the computation of diluted earnings per share because they were anti-dilutive were approximately
22 million
in
2011
,
24 million
in
2010
and
29 million
in
2009
, respectively.
A total of
15.9 million
warrants were excluded from the computation of diluted earnings per share in
2011
because they were anti-dilutive.
17. Stock-Based Awards
Under our Company’s 1991 Executive Stock Incentive Plan (the “1991 Incentive Plan”) and our 1991 Executive Cash Bonus Plan (together, the “1991 Executive Plans”), the Board of Directors was authorized to grant awards to key employees of cash, restricted and unrestricted shares of our Common Stock, retirement units (stock equivalents) or such other awards as the Board of Directors deemed appropriate. Effective April 27, 2010, our 2010 Incentive Compensation Plan (the “2010 Incentive Plan”) was approved by our Company’s stockholders and replaced the 1991 Executive Plans.
Our 2004 Non-Employee Directors’ Stock Incentive Plan (the “2004 Directors’ Plan”) provides for the issuance of up to
500,000
shares of Common Stock in the form of stock options or restricted stock awards. Under our 2004 Directors’ Plan, each non-employee director of our Company has historically received annual grants of non-qualified stock options with
10
-year terms to purchase
4,000
shares of Common Stock from our Company at the average market price of such shares on the date of grant. Restricted stock has not been awarded under the 2004 Directors’ Plan for the purpose of stock-based compensation.
We recognize stock-based compensation expense for outstanding stock options, cash-settled restricted stock units, stock-settled restricted stock units, stock appreciation rights, Common Stock under our ESPP and LTIP awards (together, “Stock-Based Awards”). Stock-based compensation expense was
$8.5 million
in
2011
,
$8.4 million
in
2010
and
$20.4 million
in
2009
.
THE NEW YORK TIMES COMPANY – P.
101
Stock-based compensation expense is recognized over the period from the date of grant to the date when the award is no longer contingent on the employee providing additional service. Our Company’s 1991 Incentive Plan, 2010 Incentive Plan and 2004 Directors’ Plan provide that awards generally vest over a stated vesting period or upon the retirement of an employee or director, as the case may be.
Our pool of excess tax benefits (“APIC Pool”) available to absorb tax deficiencies was approximately
$22 million
as of
December 25, 2011
.
Stock Options and Stock Appreciation Rights
Our Company’s 1991 Incentive Plan provided, and the 2010 Incentive Plan provides, for grants of both incentive and non-qualified stock options at an exercise price equal to the market value of our Common Stock on the date of grant. Stock options have generally been granted with a
3
-year vesting period and a
10
-year term and vest in equal annual installments.
Our 2004 Directors’ Plan provides for grants of stock options to non-employee Directors at an exercise price equal to the market value of our Common Stock on the date of grant. Stock options are granted with a
1
-year vesting period and a
10
-year term. Our Company’s Directors are considered employees for this purpose.
During 2009, we discovered that portions of previously awarded stock option grants exceeded that permitted to be granted to a single individual during any calendar year under the terms of our Company’s plans. A total of 250,000 options in 2008 and 200,000 options in 2009 granted in excess of applicable plan limits were determined to be null and void. The independent directors of our Company’s Board of Directors, after consultation with all non-management directors, approved the grant of deferred payment stock appreciation rights equal in number and on the same economic terms comparable to the void options. Stock appreciation rights are classified as liability awards because we incur a liability, payable in cash, based on the fair value of the stock appreciation rights. These rights are measured at their fair value at the end of each reporting period utilizing the Black-Scholes valuation model and, therefore, will fluctuate based on the changes in our stock price.
Changes in our Company’s stock options in
2011
were as follows:
|
|
December 25, 2011
|
|||||||||||||
|
(Shares in thousands)
|
Options
|
Weighted
Average
Exercise
Price
|
Weighted
Average
Remaining
Contractual
Term
(Years)
|
Aggregate
Intrinsic
Value
$(000s)
|
||||||||||
|
Options outstanding at beginning of year
|
21,414
|
|
$
|
33
|
|
4
|
|
$
|
10,629
|
|
||||
|
Granted
|
856
|
|
10
|
|
|
|||||||||
|
Exercised
|
(100
|
)
|
4
|
|
|
|||||||||
|
Forfeited/Expired
|
(4,670
|
)
|
41
|
|
|
|||||||||
|
Options outstanding at end of period
|
17,500
|
|
$
|
30
|
|
4
|
|
$
|
6,522
|
|
||||
|
Options expected to vest at end of period
|
17,478
|
|
$
|
30
|
|
4
|
|
$
|
6,522
|
|
||||
|
Options exercisable at end of period
|
15,207
|
|
$
|
33
|
|
3
|
|
$
|
4,262
|
|
||||
The total intrinsic value for stock options exercised was
$0.6 million
in
2011
,
$1.7 million
in
2010
and
$0.5 million
in
2009
.
P.
102
– THE NEW YORK TIMES COMPANY
The fair value of the stock options granted was estimated on the date of grant using a Black-Scholes valuation model that uses the assumptions noted in the following table. The risk-free rate is based on the U.S. Treasury yield curve in effect at the time of grant. The expected life (estimated period of time outstanding) of stock options granted was determined using the average of the vesting period and term, an acceptable method. Expected volatility was based on historical volatility for a period equal to the stock option’s expected life, ending on the date of grant, and calculated on a monthly basis. The fair value for stock options granted with different vesting periods are calculated separately.
|
|
December 25, 2011
|
December 26, 2010
|
December 27, 2009
|
|||||||||||||||||||||
|
Term (In years)
|
10
|
|
10
|
|
10
|
|
10
|
|
10
|
|
10
|
|
||||||||||||
|
Vesting (In years)
|
3
|
|
1
|
|
3
|
|
1
|
|
3
|
|
1
|
|
||||||||||||
|
Risk-free interest rate
|
2.90
|
%
|
2.25
|
%
|
3.19
|
%
|
2.69
|
%
|
2.72
|
%
|
2.45
|
%
|
||||||||||||
|
Expected life (In years)
|
6
|
|
5
|
|
6
|
|
5
|
|
6
|
|
5
|
|
||||||||||||
|
Expected volatility
|
43.79
|
%
|
47.93
|
%
|
41.60
|
%
|
45.93
|
%
|
31.01
|
%
|
35.00
|
%
|
||||||||||||
|
Expected dividend yield
|
0
|
%
|
0
|
%
|
0
|
%
|
0
|
%
|
0
|
%
|
0
|
%
|
||||||||||||
|
Weighted-average fair value
|
$
|
4.81
|
|
$
|
3.78
|
|
$
|
4.99
|
|
$
|
4.68
|
|
$
|
1.29
|
|
$
|
1.71
|
|
||||||
Restricted Stock Units
Our 1991 Incentive Plan provided, and the 2010 Incentive Plan provides, for grants of other awards, including restricted stock units. Restricted stock units granted in 2010 and 2009 are “cash-settled,” while restricted stock units granted in 2011 are “stock-settled.” For “stock-settled” restricted stock units, each restricted stock unit represents our obligation to deliver to the holder one share of Common Stock upon vesting. For “cash-settled” restricted stock units, each restricted stock unit represents our obligation to deliver to the holder cash, equivalent to the market value of the underlying shares of Common Stock, upon vesting.
In 2011, we granted stock-settled restricted stock units with a
3
-year vesting period. The fair value of “stock-settled” restricted stock units is the average market price at date of grant.
Changes in our Company’s stock-settled restricted stock units in
2011
were as follows:
|
|
December 25, 2011
|
||||||
|
(Shares in thousands)
|
Restricted
Stock
Units
|
Weighted
Average
Grant-Date
Fair Value
|
|||||
|
Unvested stock-settled restricted stock units at beginning of period
|
355
|
|
$
|
22
|
|
||
|
Granted
|
677
|
|
10
|
|
|||
|
Vested
|
(345
|
)
|
21
|
|
|||
|
Forfeited
|
(21
|
)
|
16
|
|
|||
|
Unvested stock-settled restricted stock units at end of period
|
666
|
|
$
|
11
|
|
||
|
Unvested stock-settled restricted stock units expected to vest at end of period
|
607
|
|
$
|
11
|
|
||
The intrinsic value of stock-settled restricted stock units vested was
$3.3 million
in
2011
,
$3.3 million
in
2010
and
$0.5 million
in
2009
.
In 2010 and 2009, we granted cash-settled restricted stock units with a
3
-year vesting period. The fair value of “cash-settled” restricted stock units is the average market price at date of grant. “Cash-settled” restricted stock units are classified as liability awards because we incur a liability, payable in cash, based on our stock price. The cash-settled restricted stock unit is measured at its fair value at the end of each reporting period and, therefore, will fluctuate based on the fluctuations in our stock price.
THE NEW YORK TIMES COMPANY – P.
103
Changes in our cash-settled restricted stock units in
2011
were as follows:
|
|
December 25, 2011
|
||||||
|
(Shares in thousands)
|
Restricted
Stock
Units
|
Weighted
Average
Grant-Date
Fair Value
|
|||||
|
Unvested cash-settled restricted stock units at beginning of period
|
788
|
|
$
|
6
|
|
||
|
Granted
|
—
|
|
—
|
|
|||
|
Vested
|
(9
|
)
|
7
|
|
|||
|
Forfeited
|
(21
|
)
|
6
|
|
|||
|
Unvested cash-settled restricted stock units at end of period
|
758
|
|
$
|
6
|
|
||
|
Unvested cash-settled restricted stock units expected to vest at end of period
|
735
|
|
$
|
6
|
|
||
The intrinsic value of restricted stock units vested was
$80,000
in
2011
,
$0.3 million
in
2010
and
$0.1 million
in
2009
.
LTIP Awards
Our Company’s 1991 Executive Plans provided for grants of cash awards to key executives payable at the end of a multi-year performance period. The target awards were determined at the beginning of each period and could have increased to a maximum of
175%
of the target or decreased to
0%
.
For the award granted for the cycle beginning in 2005 paid in 2010, the total payment was based on a key performance measure, Total Shareholder Return (“TSR”), which was calculated as stock appreciation plus reinvested dividends. For the award granted for the cycle beginning in 2006 paid in 2011,
50%
of the payment was based on TSR. The payment was subject to approval by the Board’s Compensation Committee. There were payments of approximately
$4 million
in 2011 and
$7 million
in 2010. No cycle was payable in 2009.
The LTIP awards based on TSR were classified as liability awards because we incurred a liability, payable in cash, indexed to our stock price. The LTIP award liability was measured at its fair value at the end of each reporting period and, therefore, fluctuated based on the operating results and the performance of our TSR relative to the peer group’s TSR. The fair value of the LTIP awards was calculated by comparing our TSR against a predetermined peer group’s TSR over the performance period. The payout of the LTIP awards was based on relative performance; therefore, correlations in stock price performance among the peer group companies also factored into the valuation.
For awards granted for the cycle beginning in 2007 and subsequent periods, the actual payment, if any, do not have a performance measure based on TSR. Therefore, these awards are not considered stock-based compensation.
As of
December 25, 2011
, unrecognized compensation expense related to the unvested portion of our Stock-Based Awards was approximately
$4 million
and is expected to be recognized over a weighted-average period of
1.4
years.
We generally issue shares for the exercise of stock options, stock-settled restricted stock units granted in 2011 and shares under our Employee Stock Purchase Plan from unissued reserved shares and issue shares for stock-settled restricted stock units granted prior to 2011 and our Company stock match under a 401(k) plan from treasury shares.
P.
104
– THE NEW YORK TIMES COMPANY
Shares of Class A Common Stock reserved for issuance were as follows:
|
(In thousands)
|
December 25,
2011 |
December 26,
2010 |
||
|
Stock options, stock–settled restricted stock units, retirement units and other awards
|
||||
|
Outstanding
|
18,166
|
21,769
|
||
|
Available
|
6,771
|
8,252
|
||
|
Employee Stock Purchase Plan
|
||||
|
Available
|
6,410
|
7,013
|
||
|
401(k) Company stock match
|
||||
|
Available
|
3,838
|
4,619
|
||
|
Total Outstanding
|
18,166
|
21,769
|
||
|
Total Available
|
17,019
|
19,884
|
||
In addition to the shares available in the table above, there were approximately
819,000
shares as of
December 25, 2011
and
December 26, 2010
of Class B Common Stock available for conversion into shares of Class A Common Stock.
18. Stockholders’ Equity
Shares of our Company’s Class A and Class B Common Stock are entitled to equal participation in the event of liquidation and in dividend declarations. The Class B Common Stock is convertible at the holders’ option on a share-for-share basis into Class A Common Stock. Upon conversion, the previously outstanding shares of Class B Common Stock are automatically and immediately retired, resulting in a reduction of authorized Class B Common Stock. As provided for in our Company’s Certificate of Incorporation, the Class A Common Stock has limited voting rights, including the right to elect
30%
of the Board of Directors, and the Class A and Class B Common Stock have the right to vote together on the reservation of our Company shares for stock options and other stock-based plans, on the ratification of the selection of a registered public accounting firm and, in certain circumstances, on acquisitions of the stock or assets of other companies. Otherwise, except as provided by the laws of the State of New York, all voting power is vested solely and exclusively in the holders of the Class B Common Stock.
The Adolph Ochs family trust holds approximately
90%
of the Class B Common Stock and, as a result, has the ability to elect
70%
of the Board of Directors and to direct the outcome of any matter that does not require a vote of the Class A Common Stock.
We can repurchase Class A Common Stock under our stock repurchase program from time to time either in the open market or through private transactions. These repurchases may be suspended from time to time or discontinued. In
2011
and
2010
, we did not repurchase any shares of Class A Common Stock pursuant to our stock repurchase program.
We may issue preferred stock in one or more series. The Board of Directors is authorized to set the distinguishing characteristics of each series of preferred stock prior to issuance, including the granting of limited or full voting rights; however, the consideration received must be at least $
100
per share. No shares of preferred stock were issued or outstanding as of
December 25, 2011
.
THE NEW YORK TIMES COMPANY – P.
105
19. Segment Information
Our Company’s reportable segments consist of the News Media Group and the About Group. These segments are evaluated regularly by key management in assessing performance and allocating resources.
Revenues, operating profit and identifiable assets of foreign operations are not significant. The About Group generated more than
50%
of its revenue in
2011
through cost-per-click advertising, which is principally derived from an arrangement with Google.
Below is a description of our Company’s reportable segments:
News Media Group
The News Media Group consists of The New York Times Media Group, which includes The Times, the IHT, NYTimes.com, and related businesses; the New England Media Group, which includes the Globe, BostonGlobe.com, Boston.com, the Worcester Telegram & Gazette, Telegram.com and related businesses; and the Regional Media Group, which includes
16
regional newspapers, other print publications and related businesses in Alabama, California, Florida, Louisiana, North Carolina and South Carolina. See Note 21 for information on the sale of the Regional Media Group in the first quarter of 2012.
About Group
The About Group consists of About.com, ConsumerSearch.com, CalorieCount.com and related businesses. In February 2011, we sold UCompareHealthCare.com.
Our Statements of Operations by segment and Corporate were as follows:
|
(In thousands)
|
December 25,
2011 |
|
December 26,
2010 |
|
December 27,
2009 |
|
||||||
|
Revenues
|
||||||||||||
|
News Media Group
|
$
|
2,212,575
|
|
$
|
2,257,386
|
|
$
|
2,319,378
|
|
|||
|
About Group
|
110,826
|
|
136,077
|
|
121,061
|
|
||||||
|
Total
|
$
|
2,323,401
|
|
$
|
2,393,463
|
|
$
|
2,440,439
|
|
|||
|
Operating profit/(loss)
|
||||||||||||
|
News Media Group
|
$
|
60,853
|
|
$
|
219,242
|
|
$
|
21,163
|
|
|||
|
About Group
|
40,674
|
|
61,952
|
|
50,881
|
|
||||||
|
Corporate
|
(44,820
|
)
|
(47,074
|
)
|
2,015
|
|
||||||
|
Total
|
$
|
56,707
|
|
$
|
234,120
|
|
$
|
74,059
|
|
|||
|
Gain on sale of investments
|
71,171
|
|
9,128
|
|
—
|
|
||||||
|
Income from joint ventures
|
28
|
|
19,035
|
|
20,667
|
|
||||||
|
Premium on debt redemptions
|
46,381
|
|
—
|
|
9,250
|
|
||||||
|
Interest expense, net
|
85,243
|
|
85,062
|
|
81,701
|
|
||||||
|
(Loss)/income from continuing operations before income taxes
|
(3,718
|
)
|
177,221
|
|
3,775
|
|
||||||
|
Income tax expense
|
36,506
|
|
68,516
|
|
2,206
|
|
||||||
|
(Loss)/income from continuing operations
|
(40,224
|
)
|
108,705
|
|
1,569
|
|
||||||
|
Discontinued operations:
|
||||||||||||
|
Loss from discontinued operations, net of income taxes
|
—
|
|
—
|
|
(1,156
|
)
|
||||||
|
Gain on sale, net of income taxes
|
—
|
|
13
|
|
19,488
|
|
||||||
|
Income from discontinued operations, net of income taxes
|
—
|
|
13
|
|
18,332
|
|
||||||
|
Net (loss)/income
|
(40,224
|
)
|
108,718
|
|
19,901
|
|
||||||
|
Net loss/(income) attributable to the noncontrolling interest
|
555
|
|
(1,014
|
)
|
(10
|
)
|
||||||
|
Net (loss)/income attributable to The New York Times Company common stockholders
|
$
|
(39,669
|
)
|
$
|
107,704
|
|
$
|
19,891
|
|
|||
P.
106
– THE NEW YORK TIMES COMPANY
The News Media Group’s operating profit included:
|
•
|
2011
– a
$164.4 million
charge for the impairment of assets, primarily related to goodwill at the Regional Media Group and a
$4.2 million
charge for a pension withdrawal obligation under a multiemployer pension plan at the Globe,
|
|
•
|
2010
– a
$16.1 million
charge for the impairment of assets at the Globe’s printing facility in Billerica, Mass., which was consolidated into the Boston, Mass., printing facility and a
$6.3 million
charge for an adjustment to estimated pension withdrawal obligations under several multiemployer pension plans at the Globe,
|
|
•
|
2009
– a
$78.9 million
charge primarily for a pension withdrawal obligation under certain multiemployer pension plans, a
$34.6 million
charge for loss on leases and the early termination of a third-party printing contract, a
$5.2 million
gain on sale of assets, a
$4.2 million
charge for the impairment of assets due to the reduced scope of a systems project, and a
$2.7 million
curtailment loss.
|
Corporate’s operating loss included:
|
•
|
2011 – a
$4.5 million
charge for a retirement and consulting agreement in connection with the retirement of our chief executive officer,
|
|
•
|
2009 – a pension curtailment gain of
$56.7 million
.
|
See Notes 5, 9 and 11 for additional information regarding these items.
Advertising, circulation and other revenues, by division of the News Media Group, were as follows:
|
(In thousands)
|
December 25,
2011 |
|
December 26,
2010 |
|
December 27,
2009 |
|
||||||
|
The New York Times Media Group
|
||||||||||||
|
Advertising
|
$
|
756,148
|
|
$
|
780,424
|
|
$
|
797,298
|
|
|||
|
Circulation
|
705,163
|
|
683,717
|
|
683,445
|
|
||||||
|
Other
|
93,263
|
|
92,697
|
|
101,118
|
|
||||||
|
Total
|
$
|
1,554,574
|
|
$
|
1,556,838
|
|
$
|
1,581,861
|
|
|||
|
New England Media Group
|
||||||||||||
|
Advertising
|
$
|
198,383
|
|
$
|
213,720
|
|
$
|
230,886
|
|
|||
|
Circulation
|
157,819
|
|
167,360
|
|
167,998
|
|
||||||
|
Other
|
41,854
|
|
42,809
|
|
41,710
|
|
||||||
|
Total
|
$
|
398,056
|
|
$
|
423,889
|
|
$
|
440,594
|
|
|||
|
Regional Media Group
|
||||||||||||
|
Advertising
|
$
|
161,831
|
|
$
|
177,056
|
|
$
|
192,924
|
|
|||
|
Circulation
|
78,486
|
|
80,416
|
|
85,043
|
|
||||||
|
Other
|
19,628
|
|
19,187
|
|
18,956
|
|
||||||
|
Total
|
$
|
259,945
|
|
$
|
276,659
|
|
$
|
296,923
|
|
|||
|
Total News Media Group
|
||||||||||||
|
Advertising
|
$
|
1,116,362
|
|
$
|
1,171,200
|
|
$
|
1,221,108
|
|
|||
|
Circulation
|
941,468
|
|
931,493
|
|
936,486
|
|
||||||
|
Other
|
154,745
|
|
154,693
|
|
161,784
|
|
||||||
|
Total
|
$
|
2,212,575
|
|
$
|
2,257,386
|
|
$
|
2,319,378
|
|
|||
THE NEW YORK TIMES COMPANY – P.
107
Our Company’s segment depreciation and amortization, capital expenditures and assets and Corporate’s capital expenditures and assets reconciled to consolidated amounts were as follows:
|
(In thousands)
|
December 25,
2011 |
|
December 26,
2010 |
|
December 27,
2009 |
|
||||||
|
Depreciation and Amortization
|
||||||||||||
|
News Media Group
|
$
|
105,934
|
|
$
|
109,341
|
|
$
|
122,609
|
|
|||
|
About Group
|
10,520
|
|
11,609
|
|
11,087
|
|
||||||
|
Total
|
$
|
116,454
|
|
$
|
120,950
|
|
$
|
133,696
|
|
|||
|
Capital Expenditures
|
||||||||||||
|
News Media Group
|
$
|
34,576
|
|
$
|
26,417
|
|
$
|
38,136
|
|
|||
|
About Group
|
4,809
|
|
4,856
|
|
4,339
|
|
||||||
|
Corporate
|
5,142
|
|
3,423
|
|
2,965
|
|
||||||
|
Total
|
$
|
44,527
|
|
$
|
34,696
|
|
$
|
45,440
|
|
|||
|
Assets
|
||||||||||||
|
News Media Group
|
$
|
1,619,950
|
|
$
|
1,869,798
|
|
$
|
1,993,482
|
|
|||
|
About Group
|
417,321
|
|
429,509
|
|
437,597
|
|
||||||
|
Corporate
|
764,160
|
|
851,793
|
|
526,066
|
|
||||||
|
Investments in joint ventures
|
82,019
|
|
134,641
|
|
131,357
|
|
||||||
|
WQXR-FM – Discontinued Operations
|
—
|
|
—
|
|
55
|
|
||||||
|
Total
|
$
|
2,883,450
|
|
$
|
3,285,741
|
|
$
|
3,088,557
|
|
|||
20. Commitments and Contingent Liabilities
Operating Leases
Operating lease commitments are primarily for office space and equipment. Certain office space leases provide for rent adjustments relating to changes in real estate taxes and other operating costs.
Rental expense amounted to approximately
$21 million
in
2011
,
$25 million
in
2010
and
$26 million
in
2009
. The approximate minimum rental commitments under noncancelable leases, net of subleases, as of
December 25, 2011
were as follows:
|
(In thousands)
|
Amount
|
|
|
|
2012
|
$
|
16,096
|
|
|
2013
|
11,727
|
|
|
|
2014
|
10,163
|
|
|
|
2015
|
8,639
|
|
|
|
2016
|
5,245
|
|
|
|
Later years
|
13,888
|
|
|
|
Total minimum lease payments
|
65,758
|
|
|
|
Less: noncancelable subleases
|
(16,072
|
)
|
|
|
Total minimum lease payments, net of noncancelable subleases
|
$
|
49,686
|
|
P.
108
– THE NEW YORK TIMES COMPANY
Capital Leases
Future minimum lease payments for all capital leases, and the present value of the minimum lease payments as of
December 25, 2011
, were as follows:
|
(In thousands)
|
Amount
|
|
|
|
2012
|
$
|
573
|
|
|
2013
|
552
|
|
|
|
2014
|
552
|
|
|
|
2015
|
552
|
|
|
|
2016
|
552
|
|
|
|
Later years
|
8,349
|
|
|
|
Total minimum lease payments
|
11,130
|
|
|
|
Less: imputed interest
|
(4,429
|
)
|
|
|
Present value of net minimum lease payments including current maturities
|
$
|
6,701
|
|
Restricted Cash
We were required to maintain
$27.6 million
of restricted cash as of
December 25, 2011
, subject to certain collateral requirements primarily for obligations under our workers’ compensation programs. These collateral requirements were previously supported by letters of credit under our revolving credit facility that was replaced in June 2011.
Other
There are various legal actions that have arisen in the ordinary course of business and are now pending against us. These actions are generally for amounts greatly in excess of the payments, if any, that may be required to be made. It is the opinion of management after reviewing these actions with our legal counsel that the ultimate liability that might result from these actions would not have a material adverse effect on our Consolidated Financial Statements.
21. Subsequent Events
Fenway Sports Group
On February 3, 2012, we sold
100
of our units in Fenway Sports Group for an aggregate price of
$30.0 million
. We will record a pre-tax gain of approximately
$18 million
in the first quarter of 2012. Following the sale, we own
210
units, or
4.97%
, of Fenway Sports Group. We continue to market our remaining units in Fenway Sports Group for sale, in whole or in parts.
Effective with the sale, given our reduced ownership level and lack of influence on the operations of Fenway Sports Group, we will change the accounting for our investment from the equity method to the cost method. Therefore, we will no longer recognize our proportionate share of the operating results of Fenway Sports Group in “Income from joint ventures” in our Consolidated Statements of Operations and our investment will be reclassified from “Investments in joint ventures” into “Miscellaneous assets” in our Consolidated Balance Sheet.
Regional Media Group
On January 6, 2012, we completed the sale of the Regional Media Group, consisting of
16
regional newspapers, other print publications and related businesses, to Halifax Media Holdings LLC for
$143.0 million
in cash, subject to certain adjustments. We will record an after-tax gain estimated to be approximately
$30 million
on the sale in the first quarter of 2012. We estimate the net after-tax proceeds from the sale, including a tax benefit, will be approximately
$150 million
, which we plan to use for general corporate purposes.
The requirements to report the net assets of the Regional Media Group as held for sale and its operating results as a discontinued operation were not met as of December 25, 2011. Therefore, the operating results of the Regional Media Group are reported within continuing operations for the 3-year period ending December 25, 2011.
THE NEW YORK TIMES COMPANY – P.
109
The results of operations for the Regional Media Group and the estimated carrying amounts of the major classes of assets and liabilities included as part of the sale are summarized in the following charts.
|
(In thousands)
|
December 25,
2011 |
|
December 26,
2010 |
|
December 27,
2009 |
|
||||||
|
Revenues
|
$
|
259,945
|
|
$
|
276,659
|
|
$
|
296,923
|
|
|||
|
Production costs and selling, general and administrative costs
|
223,367
|
|
236,699
|
|
257,710
|
|
||||||
|
Depreciation and amortization
|
11,665
|
|
12,655
|
|
14,893
|
|
||||||
|
Total operating costs
|
235,032
|
|
249,354
|
|
272,603
|
|
||||||
|
Impairment of assets
|
152,093
|
|
—
|
|
—
|
|
||||||
|
Gain on sale of assets
|
—
|
|
—
|
|
5,198
|
|
||||||
|
Pre-tax (loss)/income
|
(127,180
|
)
|
27,305
|
|
29,518
|
|
||||||
|
Income tax (benefit)/expense
|
(10,879
|
)
|
10,783
|
|
13,122
|
|
||||||
|
Net (loss)/income
|
$
|
(116,301
|
)
|
$
|
16,522
|
|
$
|
16,396
|
|
|||
|
(In thousands)
|
December 25,
2011 |
|
December 26,
2010 |
|
||||
|
Accounts receivable, net
|
$
|
26,550
|
|
$
|
27,417
|
|
||
|
Property, plant and equipment, net
|
146,287
|
|
157,603
|
|
||||
|
Goodwill
|
—
|
|
152,093
|
|
||||
|
Other assets
|
5,344
|
|
7,299
|
|
||||
|
Total assets
|
178,181
|
|
344,412
|
|
||||
|
Total liabilities
|
19,568
|
|
22,016
|
|
||||
|
Net assets
|
$
|
158,613
|
|
$
|
322,396
|
|
||
P.
110
– THE NEW YORK TIMES COMPANY
QUARTERLY INFORMATION (UNAUDITED)
|
|
2011 Quarters
|
|
||||||||||||||
|
March 27,
2011 |
|
June 26,
2011 |
|
September 25,
2011 |
|
December 25,
2011 |
|
Full Year
|
|
|||||||
|
(In thousands, except per share data)
|
(13 weeks)
|
|
(13 weeks)
|
|
(13 weeks)
|
|
(13 weeks)
|
|
(52 weeks)
|
|
||||||
|
Revenues
|
$
|
566,504
|
|
$
|
576,702
|
|
$
|
537,235
|
|
$
|
642,960
|
|
$
|
2,323,401
|
|
|
|
Operating costs
|
535,430
|
|
525,233
|
|
504,190
|
|
528,679
|
|
2,093,532
|
|
||||||
|
Impairment of assets
(1)
|
—
|
|
161,318
|
|
—
|
|
3,116
|
|
164,434
|
|
||||||
|
Pension withdrawal expense
(2)
|
—
|
|
4,228
|
|
—
|
|
—
|
|
4,228
|
|
||||||
|
Other expense
(3)
|
—
|
|
—
|
|
—
|
|
4,500
|
|
4,500
|
|
||||||
|
Operating profit/(loss)
|
31,074
|
|
(114,077
|
)
|
33,045
|
|
106,665
|
|
56,707
|
|
||||||
|
Gain on sale of investments
(4)
|
5,898
|
|
—
|
|
65,273
|
|
—
|
|
71,171
|
|
||||||
|
(Loss)/income from joint ventures
|
(5,749
|
)
|
2,791
|
|
(1,068
|
)
|
4,054
|
|
28
|
|
||||||
|
Premium on debt redemption
(5)
|
—
|
|
—
|
|
46,381
|
|
—
|
|
46,381
|
|
||||||
|
Interest expense, net
|
24,591
|
|
25,152
|
|
20,039
|
|
15,461
|
|
85,243
|
|
||||||
|
Income/(loss) before income taxes
|
6,632
|
|
(136,438
|
)
|
30,830
|
|
95,258
|
|
(3,718
|
)
|
||||||
|
Income tax expense/(benefit)
|
1,406
|
|
(16,615
|
)
|
15,362
|
|
36,353
|
|
36,506
|
|
||||||
|
Net income/(loss)
|
5,226
|
|
(119,823
|
)
|
15,468
|
|
58,905
|
|
(40,224
|
)
|
||||||
|
Net loss attributable to the noncontrolling interest
|
193
|
|
105
|
|
217
|
|
40
|
|
555
|
|
||||||
|
Net income/(loss) attributable to The New York Times Company common stockholders
|
$
|
5,419
|
|
$
|
(119,718
|
)
|
$
|
15,685
|
|
$
|
58,945
|
|
$
|
(39,669
|
)
|
|
|
Average number of common shares outstanding:
|
||||||||||||||||
|
Basic
|
146,777
|
|
147,176
|
|
147,355
|
|
147,451
|
|
147,190
|
|
||||||
|
Diluted
|
153,760
|
|
147,176
|
|
151,293
|
|
149,887
|
|
147,190
|
|
||||||
|
Earnings/(loss) per share attributable to The New York Times Company common stockholders – Basic
|
$
|
0.04
|
|
$
|
(0.81
|
)
|
$
|
0.11
|
|
$
|
0.40
|
|
$
|
(0.27
|
)
|
|
|
Earnings/(loss) per share attributable to The New York Times Company common stockholders – Diluted
|
$
|
0.04
|
|
$
|
(0.81
|
)
|
$
|
0.10
|
|
$
|
0.39
|
|
$
|
(0.27
|
)
|
|
|
(1)
|
In the second quarter of 2011, we recorded a
$161.3 million
charge for the impairment of assets at the News Media Group, consisting of
$152.1 million
related to goodwill at the Regional Media Group and
$9.2 million
related to certain assets held for sale primarily of Baseline. In the fourth quarter of 2011, we recorded a
$3.1 million
charge for the impairment of an intangible asset at ConsumerSearch, Inc., which is part of the About Group.
|
|
(2)
|
In the second quarter of 2011, we recorded a
$4.2 million
estimated charge for our pension withdrawal obligation under a multiemployer pension plan at the Globe.
|
|
(3)
|
In the fourth quarter of 2011, we recorded a
$4.5 million
charge for a retirement and consulting agreement in connection with the retirement of our chief executive officer.
|
|
(4)
|
In the first quarter of 2011, we recorded a
$5.9 million
gain from the sale of a portion of our interest in Indeed.com, a job listing aggregator. In the third quarter of 2011, we recorded a
$65.3 million
gain from the sale of
390
units in Fenway Sports Group.
|
|
(5)
|
In the third quarter of 2011, we recorded a
$46.4 million
charge in connection with the prepayment of our
$250.0 million
14.053%
Notes.
|
THE NEW YORK TIMES COMPANY – P.
111
As described in Note 15 of the Notes to the Consolidated Financial Statements, WQXR-FM’s results of operations have been presented as discontinued operations.
|
|
2010 Quarters
|
|
||||||||||||||
|
March 28, 2010
|
|
June 27,
2010 |
|
September 26, 2010
|
|
December 26, 2010
|
|
Full Year
|
|
|||||||
|
(In thousands, except per share data)
|
(13 weeks)
|
|
(13 weeks)
|
|
(13 weeks)
|
|
(13 weeks)
|
|
(52 weeks)
|
|
||||||
|
Revenues
|
$
|
587,867
|
|
$
|
589,587
|
|
$
|
554,333
|
|
$
|
661,676
|
|
$
|
2,393,463
|
|
|
|
Operating costs
|
535,209
|
|
528,762
|
|
522,924
|
|
550,032
|
|
2,136,927
|
|
||||||
|
Impairment of assets
(1)
|
—
|
|
—
|
|
16,148
|
|
—
|
|
16,148
|
|
||||||
|
Pension withdrawal expense
(2)
|
—
|
|
—
|
|
6,268
|
|
—
|
|
6,268
|
|
||||||
|
Operating profit
|
52,658
|
|
60,825
|
|
8,993
|
|
111,644
|
|
234,120
|
|
||||||
|
Gain on sale of investment
(3)
|
—
|
|
9,128
|
|
—
|
|
—
|
|
9,128
|
|
||||||
|
Income/(loss) from joint ventures
(4)
|
9,111
|
|
7,678
|
|
5,482
|
|
(3,236
|
)
|
19,035
|
|
||||||
|
Interest expense, net
|
20,584
|
|
20,614
|
|
20,627
|
|
23,237
|
|
85,062
|
|
||||||
|
Income/(loss) from continuing operations before income taxes
|
41,185
|
|
57,017
|
|
(6,152
|
)
|
85,171
|
|
177,221
|
|
||||||
|
Income tax expense/(benefit)
(5)
|
27,027
|
|
25,435
|
|
(2,018
|
)
|
18,072
|
|
68,516
|
|
||||||
|
Income/(loss) from continuing operations
|
14,158
|
|
31,582
|
|
(4,134
|
)
|
67,099
|
|
108,705
|
|
||||||
|
Income/(loss) from discontinued operations, net of income taxes
|
—
|
|
237
|
|
(224
|
)
|
—
|
|
13
|
|
||||||
|
Net income/(loss)
|
14,158
|
|
31,819
|
|
(4,358
|
)
|
67,099
|
|
108,718
|
|
||||||
|
Net (income)/loss attributable to the noncontrolling interest
|
(1,365
|
)
|
214
|
|
97
|
|
40
|
|
(1,014
|
)
|
||||||
|
Net income/(loss) attributable to The New York Times Company common stockholders
|
$
|
12,793
|
|
$
|
32,033
|
|
$
|
(4,261
|
)
|
$
|
67,139
|
|
$
|
107,704
|
|
|
|
Amounts attributable to The New York Times Company common stockholders:
|
||||||||||||||||
|
Income/(loss) from continuing operations
|
$
|
12,793
|
|
$
|
31,796
|
|
$
|
(4,037
|
)
|
$
|
67,139
|
|
$
|
107,691
|
|
|
|
Income/(loss) from discontinued operations, net of income taxes
|
—
|
|
237
|
|
(224
|
)
|
—
|
|
13
|
|
||||||
|
Net income/(loss)
|
$
|
12,793
|
|
$
|
32,033
|
|
$
|
(4,261
|
)
|
$
|
67,139
|
|
$
|
107,704
|
|
|
|
Average number of common shares outstanding:
|
||||||||||||||||
|
Basic
|
145,195
|
|
145,601
|
|
145,803
|
|
145,947
|
|
145,636
|
|
||||||
|
Diluted
|
153,924
|
|
152,962
|
|
145,803
|
|
151,048
|
|
152,600
|
|
||||||
|
Basic earnings/(loss) per share attributable to The New York Times Company common stockholders:
|
||||||||||||||||
|
Income/(loss) from continuing operations
|
$
|
0.09
|
|
$
|
0.22
|
|
$
|
(0.03
|
)
|
$
|
0.46
|
|
$
|
0.74
|
|
|
|
Income from discontinued operations, net of income taxes
|
0.00
|
|
0.00
|
|
0.00
|
|
0.00
|
|
0.00
|
|
||||||
|
Net income/(loss)
|
$
|
0.09
|
|
$
|
0.22
|
|
$
|
(0.03
|
)
|
$
|
0.46
|
|
$
|
0.74
|
|
|
|
Diluted earnings/(loss) per share attributable to The New York Times Company common stockholders:
|
||||||||||||||||
|
Income/(loss) from continuing operations
|
$
|
0.08
|
|
$
|
0.21
|
|
$
|
(0.03
|
)
|
$
|
0.44
|
|
$
|
0.71
|
|
|
|
Income from discontinued operations, net of income taxes
|
0.00
|
|
0.00
|
|
0.00
|
|
0.00
|
|
0.00
|
|
||||||
|
Net income/(loss)
|
$
|
0.08
|
|
$
|
0.21
|
|
$
|
(0.03
|
)
|
$
|
0.44
|
|
$
|
0.71
|
|
|
|
(1)
|
In the third quarter of 2010, we recorded a
$16.1 million
charge for the impairment of assets at the Globe's printing facility in Billerica, Mass.
|
|
(2)
|
In the third quarter of 2010, we recorded a
$6.3 million
charge for an adjustment to estimated pension withdrawal obligations under several multiemployer pension plans at the Globe.
|
|
(3)
|
In the second quarter of 2010, we recorded a
$9.1 million
gain from the sale of
50
units in Fenway Sports Group.
|
|
(4)
|
In the first quarter of 2010, we recorded a
$12.7 million
gain from the sale of an asset at one of the paper mills in which we have an investment. Our share of the gain, after eliminating the noncontrolling interest portion, was
$10.2 million
.
|
|
(5)
|
In the first and fourth quarters of 2010, we recorded
$10.9 million
and
$0.5 million
, respectively, related to tax charges for the reduction in future tax benefits for retiree health benefits resulting from the federal health care reform legislation enacted in 2010.
|
P.
112
– THE NEW YORK TIMES COMPANY
Earnings/(loss) per share amounts for the quarters do not necessarily equal the respective year-end amounts for earnings or loss per share due to the weighted-average number of shares outstanding used in the computations for the respective periods. Earnings/(loss) per share amounts for the respective quarters and years have been computed using the average number of common shares outstanding.
Our largest source of revenue is advertising. Our business has historically experienced higher advertising volume in the fourth quarter than the remaining quarters because of holiday advertising.
THE NEW YORK TIMES COMPANY – P.
113
SCHEDULE II – VALUATION AND QUALIFYING ACCOUNTS
For the Three Years Ended
December 25, 2011
|
(In thousands)
Description
|
Balance at
beginning
of period
|
Additions
charged to
operating
costs and other
|
Deductions
(1)
|
Balance at
end of period
|
||||||||||||
|
Accounts receivable allowances:
|
||||||||||||||||
|
Year ended December 25, 2011
|
$
|
30,209
|
|
$
|
10,531
|
|
$
|
22,103
|
|
$
|
18,637
|
|
||||
|
Year ended December 26, 2010
|
$
|
36,485
|
|
$
|
20,326
|
|
$
|
26,602
|
|
$
|
30,209
|
|
||||
|
Year ended December 27, 2009
|
$
|
33,838
|
|
$
|
59,367
|
|
$
|
56,720
|
|
$
|
36,485
|
|
||||
|
Valuation allowance for deferred tax assets:
|
||||||||||||||||
|
Year ended December 25, 2011
|
$
|
—
|
|
$
|
39,824
|
|
$
|
—
|
|
$
|
39,824
|
|
||||
|
Year ended December 26, 2010
|
$
|
—
|
|
$
|
—
|
|
$
|
—
|
|
$
|
—
|
|
||||
|
Year ended December 25, 2009
|
$
|
1,156
|
|
$
|
—
|
|
$
|
1,156
|
|
$
|
—
|
|
||||
|
(1)
|
Includes write-offs, net of recoveries.
|
P.
114
– THE NEW YORK TIMES COMPANY
|
|
|
Not applicable.
|
|
|
EVALUATION OF DISCLOSURE CONTROLS AND PROCEDURES
Our management, with the participation of our principal executive officer and our principal financial officer, evaluated the effectiveness of our disclosure controls and procedures (as defined in Rules 13a-15(e) and 15d-15(e) of the Securities Exchange Act of 1934) as of
December 25, 2011
. Based upon such evaluation, our principal executive officer and principal financial officer concluded that our disclosure controls and procedures were effective to ensure that the information required to be disclosed by us in the reports that we file or submit under the Securities Exchange Act of 1934 is recorded, processed, summarized and reported within the time periods specified in the SEC’s rules and forms, and is accumulated and communicated to our management, including our principal executive officer and principal financial officer, as appropriate to allow timely decisions regarding required disclosure.
MANAGEMENT’S REPORT ON INTERNAL CONTROL OVER FINANCIAL REPORTING
Management’s report on internal control over financial reporting and the attestation report of our independent registered public accounting firm on our internal control over financial reporting are set forth in Item 8 of this Annual Report on Form 10-K and are incorporated by reference herein.
CHANGES IN INTERNAL CONTROL OVER FINANCIAL REPORTING
There were no changes in our internal control over financial reporting during the quarter ended
December 25, 2011
, that have materially affected, or are reasonably likely to materially affect, our internal control over financial reporting.
|
|
|
Not applicable.
THE NEW YORK TIMES COMPANY – P.
115
|
|
|
|
|
In addition to the information set forth under the caption “Executive Officers of the Registrant” in Part I of this Annual Report on Form 10-K, the information required by this item is incorporated by reference to the sections titled “Section 16(a) Beneficial Ownership Reporting Compliance,” “Proposal Number 1 – Election of Directors,” “Interests of Related Persons in Certain Transactions of the Company,” “Board of Directors and Corporate Governance,” beginning with the section titled “Independent Directors,” but only up to and including the section titled “Audit Committee Financial Experts,” and “Board Committees” of our Proxy Statement for the
2012
Annual Meeting of Stockholders.
The Board has adopted a code of ethics that applies not only to the chief executive officer and senior financial officers, as required by the SEC, but also to our Chairman and Vice Chairman. The current version of such code of ethics can be found on the Corporate Governance section of our Web site, http://www.nytco.com.
|
|
|
The information required by this item is incorporated by reference to the sections titled “Compensation Committee,” “Directors’ Compensation,” “Directors’ and Officers’ Liability Insurance” and “Compensation of Executive Officers” of our Proxy Statement for the
2012
Annual Meeting of Stockholders.
|
|
|
The information required by this item is incorporated by reference to the sections titled “Principal Holders of Common Stock,” “Security Ownership of Management and Directors” and “The
1997
Trust” of our Proxy Statement for the
2012
Annual Meeting of Stockholders.
|
|
|
The information required by this item is incorporated by reference to the sections titled “Interests of Related Persons in Certain Transactions of the Company,” “Board of Directors and Corporate Governance – Independent Directors,” “Board of Directors and Corporate Governance – Board Committees” and “Board of Directors and Corporate Governance – Policy on Transactions with Related Persons” of our Proxy Statement for the
2012
Annual Meeting of Stockholders.
|
|
|
The information required by this item is incorporated by reference to the section titled “Proposal Number 3 – Selection of Auditors,” beginning with the section titled “Audit Committee’s Pre-Approval Policies and Procedures,” but only up to and not including the section titled “Recommendation and Vote Required” of our Proxy Statement for the
2012
Annual Meeting of Stockholders.
P.
116
– THE NEW YORK TIMES COMPANY
|
|
|
|
|
(A) DOCUMENTS FILED AS PART OF THIS REPORT
(1) Financial Statements
As listed in the index to financial information in “Item 8 — Financial Statements and Supplementary Data.”
(2) Supplemental Schedules
The following additional consolidated financial information is filed as part of this Annual Report on Form 10-K and should be read in conjunction with the Consolidated Financial Statements set forth in “Item 8 — Financial Statements and Supplementary Data.” Schedules not included with this additional consolidated financial information have been omitted either because they are not applicable or because the required information is shown in the Consolidated Financial Statements.
|
|
Page
|
|
Consolidated Schedule for the Three Years Ended December 25, 2011
|
|
|
II – Valuation and Qualifying Accounts
|
|
Separate financial statements and supplemental schedules of associated companies accounted for by the equity method are omitted in accordance with the provisions of Rule 3-09 of Regulation S-X.
(3) Exhibits
An exhibit index has been filed as part of this Annual Report on Form 10-K and is incorporated herein by reference.
THE NEW YORK TIMES COMPANY – P.
117
|
SIGNATURES
|
Pursuant to the requirements of Section 13 or 15(d) of the Securities Exchange Act of 1934, the registrant has duly caused this report to be signed on its behalf by the undersigned, thereunto duly authorized.
Date:
February 23, 2012
|
THE NEW YORK TIMES COMPANY
(Registrant)
|
||
|
BY:
|
/s/ K
ENNETH
A. R
ICHIERI
|
|
|
Kenneth A. Richieri
|
||
|
Senior Vice President and General Counsel
|
||
We, the undersigned directors and officers of The New York Times Company, hereby severally constitute Kenneth A. Richieri and James M. Follo, and each of them singly, our true and lawful attorneys with full power to them and each of them to sign for us, in our names in the capacities indicated below, any and all amendments to this Annual Report on Form 10-K filed with the Securities and Exchange Commission.
Pursuant to the requirements of the Securities Exchange Act of 1934, this report has been signed below by the following persons on behalf of the registrant and in the capacities and on the dates indicated.
|
Signature
|
Title
|
Date
|
|
/s/ Arthur Sulzberger, Jr.
|
Chairman, Chief Executive Officer and Director
(Principal Executive Officer)
|
February 23, 2012
|
|
/s/ Michael Golden
|
Vice Chairman and Director
|
February 23, 2012
|
|
/s/ James M. Follo
|
Senior Vice President and Chief Financial Officer
(Principal Financial Officer)
|
February 23, 2012
|
|
/s/ R. Anthony Benten
|
Senior Vice President, Finance and Corporate Controller
(Principal Accounting Officer)
|
February 23, 2012
|
|
/s/ Raul E. Cesan
|
Director
|
February 23, 2012
|
|
/s/ Robert E. Denham
|
Director
|
February 23, 2012
|
|
/s/ Lynn G. Dolnick
|
Director
|
February 23, 2012
|
|
/s/ Carolyn D. Greenspon
|
Director
|
February 23, 2012
|
|
/s/ James A. Kohlberg
|
Director
|
February 23, 2012
|
|
/s/ David E. Liddle
|
Director
|
February 23, 2012
|
|
/s/ Ellen R. Marram
|
Director
|
February 23, 2012
|
|
/s/ Thomas Middelhoff
|
Director
|
February 23, 2012
|
|
/s/ Doreen A. Toben
|
Director
|
February 23, 2012
|
P.
118
– THE NEW YORK TIMES COMPANY
|
INDEX TO EXHIBITS
|
Exhibit numbers 10.17 through 10.34 are management contracts or compensatory plans or arrangements.
|
Exhibit
Number
|
|
Description of Exhibit
|
|
(2.1)
|
Asset Purchase Agreement, dated as of December 27, 2011, by and among NYT Holdings, Inc., The Houma Courier Newspaper Corporation, Lakeland Ledger Publishing Corporation, The Spartanburg Herald-Journal, Inc., Hendersonville Newspaper Corporation, The Dispatch Publishing Company, Inc., NYT Management Services, Inc., The New York Times Company and Halifax Media Holdings LLC (filed as an Exhibit to the Company’s Form 8-K dated December 27, 2011, and incorporated by reference herein).
|
|
|
(3.1)
|
|
Certificate of Incorporation as amended and restated to reflect amendments effective July 1, 2007 (filed as an Exhibit to the Company’s Form 10-Q dated August 9, 2007, and incorporated by reference herein).
|
|
(3.2)
|
|
By-laws as amended through November 19, 2009 (filed as an Exhibit to the Company’s Form 8-K dated November 20, 2009, and incorporated by reference herein).
|
|
(4)
|
|
The Company agrees to furnish to the Commission upon request a copy of any instrument with respect to long-term debt of the Company and any subsidiary for which consolidated or unconsolidated financial statements are required to be filed, and for which the amount of securities authorized thereunder does not exceed 10% of the total assets of the Company and its subsidiaries on a consolidated basis.
|
|
(4.1)
|
|
Indenture, dated March 29, 1995, between the Company and The Bank of New York Mellon (as successor to Chemical Bank), as trustee (filed as an Exhibit to the Company’s registration statement on Form S-3 File No. 33-57403, and incorporated by reference herein).
|
|
(4.2)
|
|
First Supplemental Indenture, dated August 21, 1998, between the Company and The Bank of New York Mellon (as successor to The Chase Manhattan Bank (formerly known as Chemical Bank)), as trustee (filed as an Exhibit to the Company’s registration statement on Form S-3 File No. 333-62023, and incorporated by reference herein).
|
|
(4.3)
|
|
Second Supplemental Indenture, dated July 26, 2002, between the Company and The Bank of New York Mellon (as successor to JPMorgan Chase Bank, N.A. (formerly known as Chemical Bank and The Chase Manhattan Bank)), as trustee (filed as an Exhibit to the Company’s registration statement on Form S-3 File No. 333-97199, and incorporated by reference herein).
|
|
(4.4)
|
|
Securities Purchase Agreement, dated January 19, 2009, among the Company, Inmobiliaria Carso, S.A. de C.V. and Banco Inbursa S.A., Institución de Banca Múltiple, Grupo Financiero Inbursa (including forms of notes, warrants and registration rights agreement) (filed as an Exhibit to the Company’s Form 8-K dated January 21, 2009, and incorporated by reference herein).
|
|
(4.5)
|
|
Form of Preemptive Rights Certificate (filed as an Exhibit to the Company’s Form 8-K dated January 21, 2009, and incorporated by reference herein).
|
|
(4.6)
|
|
Form of Preemptive Rights Warrant Agreement between the Company and Mellon Investor Services LLC (filed as an Exhibit to the Company’s Form 8-K dated January 21, 2009, and incorporated by reference herein).
|
|
(4.7)
|
|
Indenture, dated as of November 4, 2010, by and between the Company and Wells Fargo Bank, National Association, as trustee (filed as an Exhibit to the Company’s Form 8-K dated November 4, 2010, and incorporated by reference herein).
|
|
(4.8)
|
|
Form of 6.625% Senior Notes due 2016 (included as an Exhibit to Exhibit 4.7 above).
|
|
(4.9)
|
|
Registration Rights Agreement, dated as of November 4, 2010, by and between the Company and Barclays Capital Inc. (filed as an Exhibit to the Company’s Form 8-K dated November 4, 2010, and incorporated by reference herein).
|
|
(10.1)
|
|
Agreement of Lease, dated as of December 15, 1993, between The City of New York, as landlord, and the Company, as tenant (as successor to New York City Economic Development Corporation (the “EDC”), pursuant to an Assignment and Assumption of Lease With Consent, made as of December 15, 1993, between the EDC, as Assignor, to the Company, as Assignee) (filed as an Exhibit to the Company’s Form 10-K dated March 21, 1994, and incorporated by reference herein).
|
|
(10.2)
|
|
Funding Agreement #4, dated as of December 15, 1993, between the EDC and the Company (filed as an Exhibit to the Company’s Form 10-K dated March 21, 1994, and incorporated by reference herein).
|
|
(10.3)
|
|
New York City Public Utility Service Power Service Agreement, dated as of May 3, 1993, between The City of New York, acting by and through its Public Utility Service, and The New York Times Newspaper Division of the Company (filed as an Exhibit to the Company’s Form 10-K dated March 21, 1994, and incorporated by reference herein).
|
|
(10.4)
|
|
Letter Agreement, dated as of April 8, 2004, amending Agreement of Lease, between the 42nd St. Development Project, Inc., as landlord, and The New York Times Building LLC, as tenant (filed as an Exhibit to the Company’s Form 10-Q dated November 3, 2006, and incorporated by reference herein).
|
|
(10.5)
|
|
Agreement of Sublease, dated as of December 12, 2001, between The New York Times Building LLC, as landlord, and NYT Real Estate Company LLC, as tenant (filed as an Exhibit to the Company’s Form 10-Q dated November 3, 2006, and incorporated by reference herein).
|
|
(10.6)
|
|
First Amendment to Agreement of Sublease, dated as of August 15, 2006, between 42nd St. Development Project, Inc., as landlord, and NYT Real Estate Company LLC, as tenant (filed as an Exhibit to the Company’s Form 10-Q dated November 3, 2006, and incorporated by reference herein).
|
THE NEW YORK TIMES COMPANY – P.
119
|
Exhibit
Number
|
|
Description of Exhibit
|
|
(10.7)
|
|
Second Amendment to Agreement of Sublease, dated as of January 29, 2007, between 42nd St. Development Project, Inc., as landlord, and NYT Real Estate Company LLC, as tenant (filed as an Exhibit to the Company’s Form 8-K dated February 1, 2007, and incorporated by reference herein).
|
|
(10.8)
|
|
Third Amendment to Agreement of Sublease (NYT), dated as of March 6, 2009, between 42nd St. Development Project, Inc., as landlord, and NYT Real Estate Company LLC, as tenant (filed as an Exhibit to the Company’s Form 8-K dated March 9, 2009, and incorporated by reference herein).
|
|
(10.9)
|
|
Fourth Amendment to Agreement of Sublease (NYT), dated as of March 6, 2009, between 42nd St. Development Project, Inc., as landlord, and 620 Eighth NYT (NY) Limited Partnership, as tenant (filed as an Exhibit to the Company’s Form 8-K dated March 9, 2009, and incorporated by reference herein).
|
|
(10.10)
|
|
Fifth Amendment to Agreement of Sublease (NYT), dated as of August 31, 2009, between 42nd St. Development Project, Inc., as landlord, and 620 Eighth NYT (NY) Limited Partnership, as tenant (filed as an Exhibit to the Company’s Form 10-Q dated November 4, 2009, and incorporated by reference herein).
|
|
(10.11)
|
|
Agreement of Sublease (NYT-2), dated as of March 6, 2009, between 42nd St. Development Project, Inc., as landlord, and NYT Real Estate Company LLC, as tenant (filed as an Exhibit to the Company’s Form 8-K dated March 9, 2009, and incorporated by reference herein).
|
|
(10.12)
|
|
First Amendment to Agreement of Sublease (NYT-2), dated as of March 6, 2009, between 42nd St. Development Project, Inc., as landlord, and NYT Building Leasing Company LLC, as tenant (filed as an Exhibit to the Company’s Form 8-K dated March 9, 2009, and incorporated by reference herein).
|
|
(10.13)
|
|
Agreement of Purchase and Sale, dated as of March 6, 2009, between NYT Real Estate Company LLC, as seller, and 620 Eighth NYT (NY) Limited Partnership, as buyer (filed as an Exhibit to the Company’s Form 8-K dated March 9, 2009, and incorporated by reference herein).
|
|
(10.14)
|
|
Lease Agreement, dated as of March 6, 2009, between 620 Eighth NYT (NY) Limited Partnership, as landlord, and NYT Real Estate Company LLC, as tenant (filed as an Exhibit to the Company’s Form 8-K dated March 9, 2009, and incorporated by reference herein).
|
|
(10.15)
|
|
First Amendment to Lease Agreement, dated as of August 31, 2009, 620 Eighth NYT (NY) Limited Partnership, as landlord, and NYT Real Estate Company LLC, as tenant (filed as an Exhibit to the Company’s Form 10-Q dated November 4, 2009, and incorporated by reference herein).
|
|
(10.16)
|
Credit Agreement, dated as of June 9, 2011, among the Company and certain of its domestic subsidiaries as borrowers, the financial institutions party thereto as lenders, SunTrust Bank, as issuing bank and administrative agent, SunTrust Robinson Humphrey, Inc., Wells Fargo Capital Finance, LLC and J.P. Morgan Securities LLC, as joint lead arrangers and joint book runners, SunTrust Robinson Humphrey, Inc. and Wells Fargo Capital Finance, LLC, as co-collateral agents, and JP Morgan Chase Bank, N.A., as syndication agent (filed as an Exhibit to the Company’s Form 8-K dated June 9, 2011, and incorporated by reference herein).
|
|
|
(10.17)
|
|
The Company’s 2010 Incentive Compensation Plan (filed as an exhibit to the Company’s Form 8-K dated April 28, 2010, and incorporated by reference herein).
|
|
(10.18)
|
|
The Company’s 1991 Executive Stock Incentive Plan, as amended and restated through October 11, 2007 (filed as an Exhibit to the Company’s Form 8-K dated October 12, 2007, and incorporated by reference herein).
|
|
(10.19)
|
|
The Company’s 1991 Executive Cash Bonus Plan, as amended and restated through October 11, 2007 (filed as an Exhibit to the Company’s Form 8-K dated October 12, 2007, and incorporated by reference herein).
|
|
(10.20)
|
|
The Company’s Supplemental Executive Retirement Plan, amended and restated effective December 31, 2009 (filed as an Exhibit to the Company’s Form 8-K dated November 12, 2009, and incorporated by reference herein).
|
|
(10.21)
|
|
Amendment to the Company’s Supplemental Executive Retirement Plan, amended effective April 27, 2010 (filed as an Exhibit to the Company’s Form 10-Q dated August 5, 2010, and incorporated by reference herein).
|
|
(10.22)
|
|
The Company’s Deferred Executive Compensation Plan, as amended and restated effective January 1, 2012.
|
|
(10.23)
|
|
The Company’s Non-Employee Directors’ Stock Option Plan, as amended through September 21, 2000 (filed as an Exhibit to the Company’s Form 10-Q dated November 8, 2000, and incorporated by reference herein).
|
|
(10.24)
|
|
The Company’s 2004 Non-Employee Directors’ Stock Incentive Plan, effective April 13, 2004 (filed as an Exhibit to the Company’s Form 10-Q dated May 5, 2004, and incorporated by reference herein).
|
|
(10.25)
|
|
The Company’s Non-Employee Directors Deferral Plan, as amended through October 11, 2007 (filed as an Exhibit to the Company’s Form 8-K dated October 12, 2007, and incorporated by reference herein).
|
|
(10.26)
|
|
The Company’s Savings Restoration Plan, effective as of January 1, 2010 (filed as an Exhibit to the Company’s Form 8-K dated November 12, 2009, and incorporated by reference herein).
|
|
(10.27)
|
Amendment No. 1 to the Company’s Savings Restoration Plan, amended effective March 28, 2011 (filed as an Exhibit to the Company's Form 10-Q dated May 5, 2011, and incorporated by reference herein).
|
|
|
(10.28)
|
|
The Company’s Supplemental Executive Savings Plan, effective as of January 1, 2010 (filed as an Exhibit to the Company’s Form 8-K dated November 12, 2009, and incorporated by reference herein).
|
P.
120
– THE NEW YORK TIMES COMPANY
|
Exhibit
Number
|
|
Description of Exhibit
|
|
(10.29)
|
|
Amendment to the Company’s Supplemental Executive Savings Plan, amended effective April 27, 2010 (filed as an Exhibit to the Company’s Form 10-Q dated August 5, 2010, and incorporated by reference herein).
|
|
(10.30)
|
Amendment No. 2 to the Company’s Supplemental Executive Savings Plan, amended effective March 28, 2011 (filed as an Exhibit to the Company's Form 10-Q dated May 5, 2011, and incorporated by reference herein).
|
|
|
(10.31)
|
The New York Times Companies Supplemental Retirement and Investment Plan, amended and restated effective January 1, 2011 (filed as an Exhibit to the Company’s Form 10-Q dated November 3, 2011, and incorporated by reference herein).
|
|
|
(10.32)
|
|
Stock Appreciation Rights Agreement, dated as of September 17, 2009, between the Company and Arthur Sulzberger, Jr. (filed as an Exhibit to the Company’s Form 8-K dated September 18, 2009, and incorporated by reference herein).
|
|
(10.33)
|
|
Stock Appreciation Rights Agreement, dated as of September 17, 2009, between the Company and Janet L. Robinson (filed as an Exhibit to the Company’s Form 8-K dated September 18, 2009, and incorporated by reference herein).
|
|
(10.34)
|
Retirement and Consulting Agreement, dated as of December 15, 2011, between the Company and Janet L. Robinson.
|
|
|
(12)
|
|
Ratio of Earnings to Fixed Charges.
|
|
(21)
|
|
Subsidiaries of the Company.
|
|
(23.1)
|
|
Consent of Ernst & Young LLP.
|
|
(24)
|
|
Power of Attorney (included as part of signature page).
|
|
(31.1)
|
|
Rule 13a-14(a)/15d-14(a) Certification.
|
|
(31.2)
|
|
Rule 13a-14(a)/15d-14(a) Certification.
|
|
(32.1)
|
|
Certification pursuant to 18 U.S.C. Section 1350, as adopted pursuant to Section 906 of the Sarbanes-Oxley Act of 2002.
|
|
(32.2)
|
|
Certification pursuant to 18 U.S.C. Section 1350, as adopted pursuant to Section 906 of the Sarbanes-Oxley Act of 2002.
|
|
(101.INS)*
|
XBRL Instance Document.
|
|
|
(101.SCH)*
|
XBRL Taxonomy Extension Schema.
|
|
|
(101.CAL)*
|
XBRL Taxonomy Extension Calculation Linkbase.
|
|
|
(101.DEF)*
|
XBRL Taxonomy Extension Definition Linkbase.
|
|
|
(101.LAB)*
|
XBRL Taxonomy Extension Label Linkbase.
|
|
|
(101.PRE)*
|
XBRL Taxonomy Extension Presentation Linkbase.
|
|
|
*
|
Pursuant to Rule 406 T of Regulation S-T, these interactive data files are deemed not filed or part of a registration statement or prospectus for purposes of Sections 11 or 12 of the Securities Act of 1933 or Section 18 of the Securities Exchange Act of 1934, as amended, and otherwise are not subject to liability under those sections.
|
THE NEW YORK TIMES COMPANY – P.
121
TABLE OF CONTENTS
Part IItem 1. BusinessItem 1A. Risk FactorsItem 1B. Unresolved Staff CommentsItem 2. PropertiesItem 3. Legal ProceedingsItem 4. Mine Safety DisclosuresPart IIItem 5. Market For The Registrant S Common Equity, Related Stockholder Matters and Issuer Purchases Of Equity SecuritiesItem 5. Market For The Registrant S Common Equity, Related StockholderItem 6. Selected Financial DataItem 7. Management S Discussion and Analysis Of Financial Condition and Results Of OperationsItem 7A. Quantitative and Qualitative Disclosures About Market RiskItem 8. Financial Statements and Supplementary DataItem 9. Changes in and Disagreements with Accountants on Accounting and Financial DisclosureItem 9A. Controls and ProceduresItem 9B. Other InformationPart IIIItem 10. Directors, Executive Officers and Corporate GovernanceItem 11. Executive CompensationItem 12. Security Ownership Of Certain Beneficial Owners and Management and Related Stockholder MattersItem 13. Certain Relationships and Related Transactions, and Director IndependenceItem 14. Principal Accountant Fees and ServicesPart IVItem 15. Exhibits and Financial Statement Schedules