NEW YORK TIMES CO
10-Ks and 10-Qs
|
|
|
|
|
|
|
|
|
|
|
|
|
|
|
|
|
|
|
|
|
|
|
|
|
|
|
|
|
|
|
|
|
|
|
|
|
|
|
|
|
|
|
|
|
|
|
|
|
|
|
|
|
|
|
|
UNITED STATES
SECURITIES AND EXCHANGE COMMISSION
Washington, D.C. 20549
FORM
10-Q
For the quarterly period ended
June 30, 2023
For the transition period from ___ to ___
Commission file number
1-5837
(Exact name of registrant as specified in its charter)
|
|
|
|||||||
| (State or other jurisdiction of incorporation or organization) | (I.R.S. Employer Identification No.) | |||||||
(Address and zip code of principal executive offices)
Registrant’s telephone number, including area code
212
-
556-1234
Securities registered pursuant to Section 12(b) of the Act:
| Title of each class | Trading Symbol(s) | Name of each exchange on which registered | ||||||||||||
|
|
|
|
||||||||||||
Indicate by check mark whether the registrant (1) has filed all reports required to be filed by Section 13 or 15(d) of the Securities Exchange Act of 1934 during the preceding 12 months (or for such shorter period that the registrant was required to file such reports), and (2) has been subject to such filing requirements for the past 90 days.
Yes
x
No
o
Indicate by check mark whether the registrant has submitted electronically every Interactive Data File required to be submitted pursuant to Rule 405 of Regulation S-T (§232.405 of this chapter) during the preceding 12 months (or for such shorter period that the registrant was required to submit such files).
Yes
x
No
o
Indicate by check mark whether the registrant is a large accelerated filer, an accelerated filer, a non-accelerated filer, a smaller reporting company, or an emerging growth company. See definitions of “large accelerated filer,” “accelerated filer,” “smaller reporting company” and “emerging growth company” in Rule 12b-2 of the Exchange Act.
|
|
☒ | Accelerated filer | ☐ | Non-accelerated filer | ☐ | ||||||||||||
| Smaller reporting company |
|
Emerging growth company |
|
||||||||||||||
I
f an emerging growth company, indicate by the check mark if the registrant has elected not to use the extended transition period for complying with any new or revised financial accounting standards provided pursuant to section 13(a) of the Exchange Act.
☐
If securities are registered pursuant to Section 12(b) of the Act, indicate by check mark whether the financial statements of the registrant included in the filing reflect the correction of an error to previously issued financial statements.
☐
Indicate by check mark whether any of those error corrections are restatements that required a recovery analysis of incentive-based compensation received by any of the registrant's executive officers during the relevant recovery period pursuant to § 240.10D-1(b).
☐
Indicate by check mark whether the registrant is a shell company (as defined in Rule 12b-2 of the Exchange Act). Yes
☐
No
x
Number of shares of each class of the registrant’s common stock outstanding as of August 4, 2023 (exclusive of treasury shares):
| Class A Common Stock |
|
shares | ||||||
| Class B Common Stock |
|
shares | ||||||
THE NEW YORK TIMES COMPANY
INDEX
| PART I | Financial Information | |||||||||||||||||||
| Item | 1 | Financial Statements | ||||||||||||||||||
|
Condensed Consolidated Balance Sheets as of June 30, 2023
(unaudited) and December 31, 2022
|
||||||||||||||||||||
| Condensed Consolidated Statements of Operations (unaudited) for the quarters and six months ended June 30, 2023 and June 26, 2022 | ||||||||||||||||||||
| Condensed Consolidated Statements of Comprehensive Income (unaudited) for the quarters and six months ended June 30, 2023 and June 26, 2022 | ||||||||||||||||||||
| Condensed Consolidated Statements of Changes In Stockholders’ Equity (unaudited) for the quarters and six months ended June 30, 2023 and June 26, 2022 | ||||||||||||||||||||
| Condensed Consolidated Statements of Cash Flows (unaudited) for the six months ended June 30, 2023 and June 26, 2022 | ||||||||||||||||||||
| Notes to the Condensed Consolidated Financial Statements | ||||||||||||||||||||
| Item | 2 | Management’s Discussion and Analysis of Financial Condition and Results of Operations | ||||||||||||||||||
| Item | 3 | Quantitative and Qualitative Disclosures About Market Risk | ||||||||||||||||||
| Item | 4 | Controls and Procedures | ||||||||||||||||||
| PART II | Other Information | |||||||||||||||||||
| Item | 1 | Legal Proceedings | ||||||||||||||||||
| Item | 1A | Risk Factors | ||||||||||||||||||
| Item | 2 | Unregistered Sales of Equity Securities and Use of Proceeds | ||||||||||||||||||
| Item | 5 | Other Information | ||||||||||||||||||
| Item | 6 | Exhibits | ||||||||||||||||||
PART I. FINANCIAL INFORMATION
Item 1. Financial Statements
THE NEW YORK TIMES COMPANY
CONDENSED CONSOLIDATED BALANCE SHEETS
(In thousands, except share and per share data)
| June 30, 2023 | December 31, 2022 | |||||||||||||
| (Unaudited) | ||||||||||||||
| Assets | ||||||||||||||
| Current assets | ||||||||||||||
| Cash and cash equivalents | $ |
|
$ |
|
||||||||||
| Short-term marketable securities |
|
|
||||||||||||
|
Accounts receivable (net of allowances of $
|
|
|
||||||||||||
| Prepaid expenses |
|
|
||||||||||||
| Other current assets |
|
|
||||||||||||
| Total current assets |
|
|
||||||||||||
| Other assets | ||||||||||||||
| Long-term marketable securities |
|
|
||||||||||||
|
Property, plant and equipment (less accumulated depreciation and amortization of $
|
|
|
||||||||||||
| Goodwill |
|
|
||||||||||||
| Intangible assets, net |
|
|
||||||||||||
| Deferred income taxes |
|
|
||||||||||||
| Miscellaneous assets |
|
|
||||||||||||
| Total assets | $ |
|
$ |
|
||||||||||
See Notes to Condensed Consolidated Financial Statements.
1
THE NEW YORK TIMES COMPANY
CONDENSED CONSOLIDATED BALANCE SHEETS-(Continued)
(In thousands, except share and per share data)
| June 30, 2023 | December 31, 2022 | |||||||||||||
| (Unaudited) | ||||||||||||||
| Liabilities and stockholders’ equity | ||||||||||||||
| Current liabilities | ||||||||||||||
| Accounts payable | $ |
|
$ |
|
||||||||||
| Accrued payroll and other related liabilities |
|
|
||||||||||||
| Unexpired subscriptions revenue |
|
|
||||||||||||
|
Accrued expenses and other
|
|
|
||||||||||||
| Total current liabilities |
|
|
||||||||||||
| Other liabilities | ||||||||||||||
|
Pension benefits obligation
|
|
|
||||||||||||
|
Postretirement benefits obligation
|
|
|
||||||||||||
|
Other
|
|
|
||||||||||||
| Total other liabilities |
|
|
||||||||||||
| Stockholders’ equity | ||||||||||||||
|
Common stock of $
|
||||||||||||||
|
Class A – authorized:
|
|
|
||||||||||||
|
Class B – convertible – authorized and issued shares: 2022 –
|
|
|
||||||||||||
|
Additional paid-in capital
|
|
|
||||||||||||
|
Retained earnings
|
|
|
||||||||||||
|
Common stock held in treasury, at cost
|
(
|
(
|
||||||||||||
|
Accumulated other comprehensive loss, net of income taxes:
|
||||||||||||||
|
Foreign currency translation adjustments
|
|
(
|
||||||||||||
|
Funded status of benefit plans
|
(
|
(
|
||||||||||||
| Net unrealized loss on available-for-sale securities |
(
|
(
|
||||||||||||
|
Total accumulated other comprehensive loss, net of income taxes
|
(
|
(
|
||||||||||||
|
Total New York Times Company stockholders’ equity
|
|
|
||||||||||||
|
Noncontrolling interest
|
|
|
||||||||||||
| Total stockholders’ equity |
|
|
||||||||||||
| Total liabilities and stockholders’ equity | $ |
|
$ |
|
||||||||||
See Notes to Condensed Consolidated Financial Statements.
2
THE NEW YORK TIMES COMPANY
CONDENSED CONSOLIDATED STATEMENTS OF OPERATIONS
(Unaudited)
(In thousands, except per share data)
| For the Quarters Ended | For the Six Months Ended | |||||||||||||||||||||||||
| June 30, 2023 | June 26, 2022 | June 30, 2023 | June 26, 2022 | |||||||||||||||||||||||
| Revenues | ||||||||||||||||||||||||||
| Subscription | $ |
|
$ |
|
$ |
|
$ |
|
||||||||||||||||||
| Advertising |
|
|
|
|
||||||||||||||||||||||
| Other |
|
|
|
|
||||||||||||||||||||||
|
Total revenues
|
|
|
|
|
||||||||||||||||||||||
| Operating costs | ||||||||||||||||||||||||||
| Cost of revenue (excluding depreciation and amortization) |
|
|
|
|
||||||||||||||||||||||
| Sales and marketing |
|
|
|
|
||||||||||||||||||||||
| Product development |
|
|
|
|
||||||||||||||||||||||
| General and administrative |
|
|
|
|
||||||||||||||||||||||
| Depreciation and amortization |
|
|
|
|
||||||||||||||||||||||
| Total operating costs |
|
|
|
|
||||||||||||||||||||||
| Acquisition-related costs |
|
|
|
|
||||||||||||||||||||||
| Lease-related impairment charge |
|
|
|
|
||||||||||||||||||||||
| Operating profit |
|
|
|
|
||||||||||||||||||||||
| Other components of net periodic benefit (income)/costs |
(
|
|
(
|
|
||||||||||||||||||||||
| Interest income and other, net |
|
|
|
|
||||||||||||||||||||||
| Income before income taxes |
|
|
|
|
||||||||||||||||||||||
| Income tax expense |
|
|
|
|
||||||||||||||||||||||
| Net income | $ |
|
$ |
|
$ |
|
$ |
|
||||||||||||||||||
| Average number of common shares outstanding: | ||||||||||||||||||||||||||
| Basic |
|
|
|
|
||||||||||||||||||||||
| Diluted |
|
|
|
|
||||||||||||||||||||||
| Basic earnings per share attributable to common stockholders | $ |
|
$ |
|
$ |
|
$ |
|
||||||||||||||||||
| Diluted earnings per share attributable to common stockholders | $ |
|
$ |
|
$ |
|
$ |
|
||||||||||||||||||
| Dividends declared per share | $ |
|
$ |
|
$ |
|
$ |
|
||||||||||||||||||
See Notes to Condensed Consolidated Financial Statements.
3
THE NEW YORK TIMES COMPANY
CONDENSED CONSOLIDATED STATEMENTS OF COMPREHENSIVE INCOME/(LOSS)
(Unaudited)
(In thousands)
| For the Quarters Ended | For the Six Months Ended | |||||||||||||||||||||||||
| June 30, 2023 | June 26, 2022 | June 30, 2023 | June 26, 2022 | |||||||||||||||||||||||
| Net income | $ |
|
$ |
|
$ |
|
$ |
|
||||||||||||||||||
| Other comprehensive income/(loss), before tax: | ||||||||||||||||||||||||||
| Gain/(Loss) on foreign currency translation adjustments |
|
(
|
|
(
|
||||||||||||||||||||||
| Pension and postretirement benefits obligation |
|
|
|
|
||||||||||||||||||||||
| Net unrealized gain/(loss) on available-for-sale securities |
|
(
|
|
(
|
||||||||||||||||||||||
| Other comprehensive income/(loss), before tax |
|
(
|
|
(
|
||||||||||||||||||||||
| Income tax expense/(benefit) |
|
(
|
|
(
|
||||||||||||||||||||||
| Other comprehensive income/(loss), net of tax |
|
(
|
|
(
|
||||||||||||||||||||||
| Comprehensive income attributable to common stockholders | $ |
|
$ |
|
$ |
|
$ |
|
||||||||||||||||||
See Notes to Condensed Consolidated Financial Statements.
4
THE NEW YORK TIMES COMPANY
CONDENSED CONSOLIDATED STATEMENTS OF CHANGES IN STOCKHOLDERS’ EQUITY
For the Quarters Ended June 30, 2023 and June 26, 2022
(Unaudited)
(In thousands, except share data)
|
|
Capital Stock -
Class A and Class B Common |
Additional
Paid-in Capital |
Retained
Earnings |
Common
Stock Held in Treasury, at Cost |
Accumulated
Other Comprehensive Loss, Net of Income Taxes |
Total
New York Times Company Stockholders’ Equity |
Non-
controlling Interest |
Total
Stock- holders’ Equity |
||||||||||||||||||
| Balance, March 27, 2022 | $ |
|
$ |
|
$ |
|
$ |
(
|
$ |
(
|
$ |
|
$ |
|
$ |
|
||||||||||
| Net income | — | — |
|
— | — |
|
— |
|
||||||||||||||||||
| Dividends | — | — |
|
— | — |
|
— |
|
||||||||||||||||||
| Other comprehensive loss | — | — | — | — |
(
|
(
|
— |
(
|
||||||||||||||||||
| Issuance of stock-based awards, net of withholding taxes: | ||||||||||||||||||||||||||
|
Restricted stock units vested –
|
|
(
|
— | — | — |
(
|
— |
(
|
||||||||||||||||||
|
Share repurchases –
|
— | — | — |
(
|
— |
(
|
— |
(
|
||||||||||||||||||
| Stock-based compensation | — |
|
— | — | — |
|
— |
|
||||||||||||||||||
| Balance, June 26, 2022 | $ |
|
$ |
|
$ |
|
$ |
(
|
$ |
(
|
$ |
|
$ |
|
$ |
|
||||||||||
| Balance, March 31, 2023 | $ |
|
$ |
|
$ |
|
$ |
(
|
$ |
(
|
$ |
|
$ |
|
$ |
|
||||||||||
| Net income | — | — |
|
— | — |
|
— |
|
||||||||||||||||||
| Dividends | — | — |
(
|
— | — |
(
|
— |
(
|
||||||||||||||||||
| Other comprehensive income | — | — | — | — |
|
|
— |
|
||||||||||||||||||
| Issuance of stock-based awards, net of withholding taxes: | ||||||||||||||||||||||||||
|
Restricted stock units vested –
|
|
(
|
— | — | — |
(
|
— |
(
|
||||||||||||||||||
|
Share repurchases –
|
— | — | — |
(
|
— |
(
|
— |
(
|
||||||||||||||||||
| Stock-based compensation | — |
|
— | — | — |
|
— |
|
||||||||||||||||||
| Balance, June 30, 2023 | $ |
|
$ |
|
$ |
|
$ |
(
|
$ |
(
|
$ |
|
$ |
|
$ |
|
||||||||||
5
THE NEW YORK TIMES COMPANY
CONDENSED CONSOLIDATED STATEMENTS OF CHANGES IN STOCKHOLDERS’ EQUITY
For the Six Months Ended June 30, 2023 and June 26, 2022
(Unaudited)
(In thousands, except share data)
|
|
Capital Stock -
Class A and Class B Common |
Additional
Paid-in Capital |
Retained
Earnings |
Common
Stock Held in Treasury, at Cost |
Accumulated
Other Comprehensive Loss, Net of Income Taxes |
Total
New York Times Company Stockholders’ Equity |
Non-
controlling Interest |
Total
Stock- holders’ Equity |
||||||||||||||||||
| Balance, December 26, 2021 | $ |
|
$ |
|
$ |
|
$ |
(
|
$ |
(
|
$ |
|
$ |
|
$ |
|
||||||||||
| Net income | — | — |
|
— | — |
|
— |
|
||||||||||||||||||
| Dividends | — | — |
(
|
— | — |
(
|
— |
(
|
||||||||||||||||||
| Other comprehensive loss |
(
|
(
|
(
|
|||||||||||||||||||||||
| Issuance of stock-based awards, net of withholding taxes: | ||||||||||||||||||||||||||
|
Stock options –
|
— |
|
— | — | — |
|
— |
|
||||||||||||||||||
|
Restricted stock units vested –
|
|
(
|
— | — | — |
(
|
— |
(
|
||||||||||||||||||
|
Performance-based awards –
|
|
(
|
— | — | — |
(
|
— |
(
|
||||||||||||||||||
|
Share repurchases –
|
— | — | — |
(
|
— |
(
|
— |
(
|
||||||||||||||||||
| Stock-based compensation | — |
|
— | — | — |
|
— |
|
||||||||||||||||||
| Balance, June 26, 2022 | $ |
|
$ |
|
$ |
|
$ |
(
|
$ |
(
|
$ |
|
$ |
|
$ |
|
||||||||||
| Balance, December 31, 2022 | $ |
|
$ |
|
$ |
|
$ |
(
|
$ |
(
|
$ |
|
$ |
|
$ |
|
||||||||||
| Net income | — | — |
|
— | — |
|
— |
|
||||||||||||||||||
| Dividends | — | — |
(
|
— | — |
(
|
— |
(
|
||||||||||||||||||
| Other comprehensive income | — | — | — | — |
|
|
— |
|
||||||||||||||||||
| Issuance of stock-based awards, net of withholding taxes: | ||||||||||||||||||||||||||
|
Restricted stock units vested –
|
|
(
|
— | — | — |
(
|
— |
(
|
||||||||||||||||||
|
Performance-based awards –
|
|
(
|
— | — | — |
(
|
— |
(
|
||||||||||||||||||
|
Share repurchases –
|
— | — | — |
(
|
— |
(
|
— |
(
|
||||||||||||||||||
| Stock-based compensation | — |
|
— | — | — |
|
— |
|
||||||||||||||||||
| Balance, June 30, 2023 | $ |
|
$ |
|
$ |
|
$ |
(
|
$ |
(
|
$ |
|
$ |
|
$ |
|
||||||||||
6
THE NEW YORK TIMES COMPANY
CONDENSED CONSOLIDATED STATEMENTS OF CASH FLOWS
(Unaudited)
(In thousands)
| For the Six Months Ended | ||||||||||||||
| June 30, 2023 | June 26, 2022 | |||||||||||||
| Cash flows from operating activities | ||||||||||||||
| Net income | $ |
|
$ |
|
||||||||||
| Adjustments to reconcile net income to net cash provided by operating activities: | ||||||||||||||
| Depreciation and amortization |
|
|
||||||||||||
| Amortization of right of use asset |
|
|
||||||||||||
| Stock-based compensation expense |
|
|
||||||||||||
| Lease-related impairment charge |
|
|
||||||||||||
| Gain on sale of land |
|
(
|
||||||||||||
| Change in long-term retirement benefit obligations |
(
|
(
|
||||||||||||
| Other – net |
|
|
||||||||||||
| Changes in operating assets and liabilities, net of business acquisitions: | ||||||||||||||
| Accounts receivable – net |
|
|
||||||||||||
| Other assets |
(
|
(
|
||||||||||||
| Accounts payable, accrued payroll and other liabilities |
(
|
(
|
||||||||||||
| Unexpired subscriptions |
|
|
||||||||||||
| Net cash provided by operating activities |
|
|
||||||||||||
| Cash flows from investing activities | ||||||||||||||
| Purchases of marketable securities |
(
|
(
|
||||||||||||
| Maturities of marketable securities |
|
|
||||||||||||
| Business acquisitions, net of cash acquired |
|
(
|
||||||||||||
| Capital expenditures |
(
|
(
|
||||||||||||
| Other – net |
|
|
||||||||||||
| Net cash used in investing activities |
(
|
(
|
||||||||||||
| Cash flows from financing activities | ||||||||||||||
| Long-term obligations: | ||||||||||||||
| Dividends paid |
(
|
(
|
||||||||||||
| Payment of contingent consideration |
(
|
(
|
||||||||||||
| Capital shares: | ||||||||||||||
| Proceeds from stock option exercises |
|
|
||||||||||||
| Repurchases |
(
|
(
|
||||||||||||
| Share-based compensation tax withholding |
(
|
(
|
||||||||||||
| Net cash used in financing activities |
(
|
(
|
||||||||||||
| Net increase/(decrease) in cash, cash equivalents and restricted cash |
|
(
|
||||||||||||
| Effect of exchange rate changes on cash |
(
|
(
|
||||||||||||
| Cash, cash equivalents and restricted cash at the beginning of the period |
|
|
||||||||||||
| Cash, cash equivalents and restricted cash at the end of the period | $ |
|
$ |
|
||||||||||
See Notes to Condensed Consolidated Financial Statements.
7
THE NEW YORK TIMES COMPANY
NOTES TO THE CONDENSED CONSOLIDATED FINANCIAL STATEMENTS
(Unaudited)
NOTE 1.
BASIS OF PRESENTATION
In the opinion of management of The New York Times Company (the “Company”), the Condensed Consolidated Financial Statements present fairly the financial position of the Company as of June 30, 2023, and December 31, 2022, and the results of operations, changes in stockholders’ equity and cash flows of the Company for the periods ended June 30, 2023, and June 26, 2022. The Company and its consolidated subsidiaries are referred to collectively as “we,” “us” or “our.” All adjustments necessary for a fair presentation have been included and are of a normal and recurring nature. All significant intercompany accounts and transactions have been eliminated in consolidation. The financial statements were prepared in accordance with the requirements of the United States Securities and Exchange Commission (“SEC”) for interim reporting. As permitted under those rules, certain notes or other financial information that are normally required by accounting principles generally accepted in the United States of America (“GAAP”) have been condensed or omitted from these interim financial statements. These financial statements, therefore, should be read in conjunction with the Consolidated Financial Statements and related Notes included in our Annual Report on Form 10-K for the year ended December 31, 2022. Due to the seasonal nature of our business, operating results for the interim periods are not necessarily indicative of a full year’s operations. The first six months of 2022 included an additional day compared with the first six months of 2023 as a result of the change in the Company’s fiscal year to the calendar year.
The Company has
two
reportable segments: The New York Times Group (“NYTG”) and The Athletic.
The preparation of financial statements in conformity with GAAP requires management to make estimates and assumptions that affect the amounts reported in our Condensed Consolidated Financial Statements. Actual results could differ from these estimates.
NOTE 2.
SUMMARY OF SIGNIFICANT ACCOUNTING POLICIES
As of June 30, 2023, our significant accounting policies, which are detailed in our Annual Report on Form 10-K for the year ended December 31, 2022, have not changed.
NOTE 3.
REVENUE
We generate revenues principally from subscriptions and advertising.
Subscription revenues consist of revenues from subscriptions to our digital and print products (which include our news product, as well as The Athletic and our Cooking, Games and Wirecutter products), and single-copy and bulk sales of our print products. Subscription revenues are based on both the number of copies of the printed newspaper sold and digital-only subscriptions, and the rates charged to the respective customers.
Advertising revenue is generated principally from advertisers (such as technology, financial and luxury goods companies) promoting products, services or brands on digital platforms in the form of display ads, audio and video, and in print in the form of column-inch ads. Advertising revenue is generated primarily from offerings sold directly to marketers by our advertising sales teams. A smaller proportion of our total advertising revenues is generated through programmatic auctions run by third-party ad exchanges. Advertising revenue is primarily determined by the volume (e.g., impressions), rate and mix of advertisements. Digital advertising includes our core digital advertising business and other digital advertising. Our core digital advertising business includes direct-sold website, mobile application, podcast, email and video advertisements. Direct-sold display advertising, a component of core digital advertising, includes offerings on websites and mobile applications sold directly to marketers by our advertising sales teams. Other digital advertising includes open-market programmatic advertising and creative services fees. Print advertising includes revenue from column-inch ads and classified advertising as well as preprinted advertising, also known as freestanding inserts. NYTG has revenue from all categories discussed above. The Athletic has revenue from direct-sold display advertising, podcast, email and video advertisements and open-market programmatic advertising. There is no print advertising revenue generated from The Athletic.
Other revenues primarily consist of revenues from licensing, Wirecutter affiliate referrals, commercial printing, the leasing of floors in the New York headquarters building located at 620 Eighth Avenue, New York, New York (the “Company Headquarters”), television and film, retail commerce, our live events business and our student subscription sponsorship program.
8
THE NEW YORK TIMES COMPANY
NOTES TO THE CONDENSED CONSOLIDATED FINANCIAL STATEMENTS
(Unaudited)
Subscription, advertising and other revenues were as follows:
| For the Quarters Ended | For the Six Months Ended | |||||||||||||||||||||||||||||||||||||||||||||||||
| (In thousands) | June 30, 2023 | As % of total | June 26, 2022 | As % of total | June 30, 2023 | As % of total | June 26, 2022 | As % of total | ||||||||||||||||||||||||||||||||||||||||||
| Subscription | $ |
|
|
% | $ |
|
|
% | $ |
|
|
% | $ |
|
|
% | ||||||||||||||||||||||||||||||||||
| Advertising |
|
|
% |
|
|
% |
|
|
% |
|
|
% | ||||||||||||||||||||||||||||||||||||||
|
Other
(1)
|
|
|
% |
|
|
% |
|
|
% |
|
|
% | ||||||||||||||||||||||||||||||||||||||
|
Total
|
$ |
|
|
% | $ |
|
|
% | $ |
|
|
% | $ |
|
|
% | ||||||||||||||||||||||||||||||||||
(1)
Other revenues include building rental revenue, which is not under the scope of Revenue from Contracts with Customers (Topic 606). Building rental revenue was $
6.5
million and $
7.2
million for the second quarters of 2023 and 2022, respectively, and $
13.7
million and $
14.3
million for the first six months of 2023 and 2022, respectively.
The following table summarizes digital and print subscription revenues, which are components of subscription revenues above, for the second quarters and first six months ended June 30, 2023, and June 26, 2022:
| For the Quarters Ended | For the Six Months Ended | |||||||||||||||||||||||||||||||||||||||||||||||||
| (In thousands) | June 30, 2023 | As % of total | June 26, 2022 | As % of total | June 30, 2023 | As % of total | June 26, 2022 | As % of total | ||||||||||||||||||||||||||||||||||||||||||
|
Digital-only subscription revenues
(1)
|
$ |
|
|
% | $ |
|
|
% | $ |
|
|
% | $ |
|
|
% | ||||||||||||||||||||||||||||||||||
| Print subscription revenues: | ||||||||||||||||||||||||||||||||||||||||||||||||||
|
Domestic home-delivery subscription revenues
(2)
|
|
|
% |
|
|
% |
|
|
% |
|
|
% | ||||||||||||||||||||||||||||||||||||||
|
Single-copy, NYT International and Other subscription revenues
(3)
|
|
|
% |
|
|
% |
|
|
% |
|
|
% | ||||||||||||||||||||||||||||||||||||||
| Subtotal print subscription revenues |
|
|
% |
|
|
% |
|
|
% |
|
|
% | ||||||||||||||||||||||||||||||||||||||
| Total subscription revenues | $ |
|
|
% | $ |
|
|
% | $ |
|
|
% | $ |
|
|
% | ||||||||||||||||||||||||||||||||||
|
(1)
Includes revenue from bundled and standalone subscriptions to our news product, as well as to The Athletic and to our Cooking, Games and Wirecutter products.
|
||||||||||||||||||||||||||||||||||||||||||||||||||
|
(2)
Domestic home-delivery subscriptions include access to our digital products.
|
||||||||||||||||||||||||||||||||||||||||||||||||||
|
(3)
NYT International is the international edition of our print newspaper.
|
||||||||||||||||||||||||||||||||||||||||||||||||||
The following table summarizes digital and print advertising revenues, which are components of advertising revenues above, for the second quarters and first six months ended June 30, 2023, and June 26, 2022:
| For the Quarters Ended | For the Six Months Ended | |||||||||||||||||||||||||||||||||||||||||||||||||
| (In thousands) | June 30, 2023 | As % of total | June 26, 2022 | As % of total | June 30, 2023 | As % of total | June 26, 2022 | As % of total | ||||||||||||||||||||||||||||||||||||||||||
| Advertising revenues: | ||||||||||||||||||||||||||||||||||||||||||||||||||
| Digital | $ |
|
|
% | $ |
|
|
% | $ |
|
|
% | $ |
|
|
% | ||||||||||||||||||||||||||||||||||
|
|
|
% |
|
|
% |
|
|
% |
|
|
% | |||||||||||||||||||||||||||||||||||||||
| Total advertising | $ |
|
|
% | $ |
|
|
% | $ |
|
|
% | $ |
|
|
% | ||||||||||||||||||||||||||||||||||
Performance Obligations
We have remaining performance obligations related to digital archive and other licensing and certain advertising contracts. As of June 30, 2023, the aggregate amount of the transaction price allocated to the remaining performance obligations for contracts with a duration greater than one year was approximately $
207
million. The Company will recognize this revenue as performance obligations are satisfied. We expect that approximately $
40
million, $
76
million and $
91
million will be recognized in the remainder of 2023, 2024 and thereafter through 2028, respectively.
9
THE NEW YORK TIMES COMPANY
NOTES TO THE CONDENSED CONSOLIDATED FINANCIAL STATEMENTS
(Unaudited)
Unexpired Subscriptions
Payments for subscriptions are typically due upfront and the revenue is recognized ratably over the subscription period. The proceeds are recorded within
Unexpired subscriptions revenue
in the Condensed Consolidated Balance Sheet. Total unexpired subscriptions as of December 31, 2022, were $
155.9
million, of which approximately $
132
million was recognized as revenues during the six months ended June 30, 2023.
Contract Assets
As of June 30, 2023, and December 31, 2022, the Company had $
3.8
million, respectively, in contract assets recorded in the Condensed Consolidated Balance Sheets related to digital archiving licensing revenue. The contract asset is reclassified to
Accounts receivable
when the customer is invoiced based on the contractual billing schedule.
NOTE 4.
MARKETABLE SECURITIES
The Company accounts for its marketable securities as available for sale (“AFS”). The Company recorded $
7.3
million and $
11.4
million of pre-tax net unrealized losses in
Accumulated other comprehensive income
(“AOCI”) as of June 30, 2023, and December 31, 2022, respectively.
The following tables present the amortized cost, gross unrealized gains and losses, and fair market value of our AFS securities as of June 30, 2023, and December 31, 2022:
| June 30, 2023 | ||||||||||||||||||||||||||
| (In thousands) | Amortized Cost | Gross Unrealized Gains | Gross Unrealized Losses | Fair Value | ||||||||||||||||||||||
| Short-term AFS securities | ||||||||||||||||||||||||||
| Corporate debt securities | $ |
|
$ |
|
$ |
(
|
$ |
|
||||||||||||||||||
| U.S. governmental agency securities |
|
|
(
|
|
||||||||||||||||||||||
| U.S. Treasury securities |
|
|
(
|
|
||||||||||||||||||||||
| Municipal securities |
|
|
(
|
|
||||||||||||||||||||||
| Total short-term AFS securities | $ |
|
$ |
|
$ |
(
|
$ |
|
||||||||||||||||||
| Long-term AFS securities | ||||||||||||||||||||||||||
| U.S. Treasury securities | $ |
|
$ |
|
$ |
(
|
$ |
|
||||||||||||||||||
| Corporate debt securities |
|
|
(
|
|
||||||||||||||||||||||
| U.S. governmental agency securities |
|
|
(
|
|
||||||||||||||||||||||
| Total long-term AFS securities | $ |
|
$ |
|
$ |
(
|
$ |
|
||||||||||||||||||
| December 31, 2022 | ||||||||||||||||||||||||||
| (In thousands) | Amortized Cost | Gross Unrealized Gains | Gross Unrealized Losses | Fair Value | ||||||||||||||||||||||
| Short-term AFS securities | ||||||||||||||||||||||||||
| Corporate debt securities | $ |
|
$ |
|
$ |
(
|
$ |
|
||||||||||||||||||
| U.S. governmental agency securities |
|
|
(
|
|
||||||||||||||||||||||
| U.S. Treasury securities |
|
|
(
|
|
||||||||||||||||||||||
| Municipal securities |
|
|
(
|
|
||||||||||||||||||||||
| Total short-term AFS securities | $ |
|
$ |
|
$ |
(
|
$ |
|
||||||||||||||||||
| Long-term AFS securities | ||||||||||||||||||||||||||
| U.S. Treasury securities | $ |
|
$ |
|
$ |
(
|
$ |
|
||||||||||||||||||
| Corporate debt securities |
|
|
(
|
|
||||||||||||||||||||||
| U.S. governmental agency securities |
|
|
(
|
|
||||||||||||||||||||||
| Total long-term AFS securities | $ |
|
$ |
|
$ |
(
|
$ |
|
||||||||||||||||||
10
THE NEW YORK TIMES COMPANY
NOTES TO THE CONDENSED CONSOLIDATED FINANCIAL STATEMENTS
(Unaudited)
The following tables represent the AFS securities as of June 30, 2023, and December 31, 2022, that were in an unrealized loss position for which an allowance for credit losses has not been recorded, aggregated by investment category and the length of time that individual securities have been in a continuous unrealized loss position:
| June 30, 2023 | ||||||||||||||||||||||||||||||||||||||
| Less than 12 Months | 12 Months or Greater | Total | ||||||||||||||||||||||||||||||||||||
| (In thousands) | Fair Value | Gross Unrealized Losses | Fair Value | Gross Unrealized Losses | Fair Value | Gross Unrealized Losses | ||||||||||||||||||||||||||||||||
| Short-term AFS securities | ||||||||||||||||||||||||||||||||||||||
| Corporate debt securities | $ |
|
$ |
(
|
$ |
|
$ |
(
|
$ |
|
$ |
(
|
||||||||||||||||||||||||||
| U.S. governmental agency securities |
|
|
|
(
|
|
(
|
||||||||||||||||||||||||||||||||
| U.S. Treasury securities |
|
|
|
(
|
|
(
|
||||||||||||||||||||||||||||||||
| Municipal securities |
|
|
|
(
|
|
(
|
||||||||||||||||||||||||||||||||
| Total short-term AFS securities | $ |
|
$ |
(
|
$ |
|
$ |
(
|
$ |
|
$ |
(
|
||||||||||||||||||||||||||
| Long-term AFS securities | ||||||||||||||||||||||||||||||||||||||
| U.S. Treasury securities | $ |
|
$ |
(
|
$ |
|
$ |
(
|
$ |
|
$ |
(
|
||||||||||||||||||||||||||
| Corporate debt securities |
|
(
|
|
(
|
|
(
|
||||||||||||||||||||||||||||||||
| U.S. governmental agency securities |
|
(
|
|
(
|
|
(
|
||||||||||||||||||||||||||||||||
| Total long-term AFS securities | $ |
|
$ |
(
|
$ |
|
$ |
(
|
$ |
|
$ |
(
|
||||||||||||||||||||||||||
| December 31, 2022 | ||||||||||||||||||||||||||||||||||||||
| Less than 12 Months | 12 Months or Greater | Total | ||||||||||||||||||||||||||||||||||||
| (In thousands) | Fair Value | Gross Unrealized Losses | Fair Value | Gross Unrealized Losses | Fair Value | Gross Unrealized Losses | ||||||||||||||||||||||||||||||||
| Short-term AFS securities | ||||||||||||||||||||||||||||||||||||||
| Corporate debt securities | $ |
|
$ |
(
|
$ |
|
$ |
(
|
$ |
|
$ |
(
|
||||||||||||||||||||||||||
| U.S. governmental agency securities |
|
|
|
(
|
|
(
|
||||||||||||||||||||||||||||||||
| U.S. Treasury securities |
|
|
|
(
|
|
(
|
||||||||||||||||||||||||||||||||
| Municipal securities |
|
|
|
(
|
|
(
|
||||||||||||||||||||||||||||||||
| Total short-term AFS securities | $ |
|
$ |
(
|
$ |
|
$ |
(
|
$ |
|
$ |
(
|
||||||||||||||||||||||||||
| Long-term AFS securities | ||||||||||||||||||||||||||||||||||||||
| U.S. Treasury securities | $ |
|
$ |
(
|
$ |
|
$ |
(
|
$ |
|
$ |
(
|
||||||||||||||||||||||||||
| Corporate debt securities |
|
(
|
|
(
|
|
(
|
||||||||||||||||||||||||||||||||
| U.S. governmental agency securities |
|
|
|
(
|
|
(
|
||||||||||||||||||||||||||||||||
| Total long-term AFS securities | $ |
|
$ |
(
|
$ |
|
$ |
(
|
$ |
|
$ |
(
|
||||||||||||||||||||||||||
We assess AFS securities on a quarterly basis or more often if a potential loss-triggering event occurs.
As of June 30, 2023
,
and December 31, 2022, we did not intend to sell and it was not likely that we would be required to sell these investments before recovery of their amortized cost basis, which may be at maturity. Unrealized losses related to these investments are primarily due to interest rate fluctuations as opposed to changes in credit quality. Therefore, as of June 30, 2023
,
and December 31, 2022, we have recognized
no
losses or allowance for credit losses related to AFS securities.
11
THE NEW YORK TIMES COMPANY
NOTES TO THE CONDENSED CONSOLIDATED FINANCIAL STATEMENTS
(Unaudited)
NOTE 5.
GOODWILL AND INTANGIBLES
Goodwill and Intangibles
The changes in the carrying amount of goodwill as of June 30, 2023, and since December 26, 2021, were as follows:
| (In thousands) | NYTG | The Athletic | Total | |||||||||||||||||
| Balance as of December 26, 2021 | $ |
|
$ |
|
$ |
|
||||||||||||||
| Foreign currency translation |
(
|
|
(
|
|||||||||||||||||
| Acquisition of The Athletic Media Company |
|
|
|
|||||||||||||||||
| Measurement period adjustments |
|
|
|
|||||||||||||||||
| Balance as of December 31, 2022 |
|
|
|
|||||||||||||||||
| Foreign currency translation |
|
|
|
|||||||||||||||||
| Balance as of June 30, 2023 | $ |
|
$ |
|
$ |
|
||||||||||||||
The foreign currency translation line item reflects changes in goodwill resulting from fluctuating exchange rates related to the consolidation of certain international subsidiaries.
| (In thousands) | Gross Book Value | Accumulated Amortization | Net Book Value | Remaining Weighted-Average Useful Life (Years) | ||||||||||||||||||||||
| Trademark | $ |
|
$ |
(
|
$ |
|
|
|||||||||||||||||||
| Existing subscriber base |
|
(
|
|
|
||||||||||||||||||||||
| Developed technology |
|
(
|
|
|
||||||||||||||||||||||
| Content archive |
|
(
|
|
|
||||||||||||||||||||||
| Total finite-lived intangibles | $ |
|
$ |
(
|
$ |
|
|
|||||||||||||||||||
Amortization expense for intangible assets included in
Depreciation and amortization
in our Condensed Consolidated Statements of Operations was $
7.3
million and $
5.0
million for the second quarters of 2023 and 2022, respectively, and $
14.7
million and $
11.4
million for the first six months of 2023 and 2022, respectively.
The estimated aggregate amortization expense for the remainder of 2023 and each of the following fiscal years ending December 31 is presented below:
| (In thousands) | ||||||||
| Remainder of 2023 | $ |
|
||||||
| 2024 |
|
|||||||
| 2025 |
|
|||||||
| 2026 |
|
|||||||
| 2027 |
|
|||||||
| Thereafter |
|
|||||||
| Total amortization expense | $ |
|
||||||
The aggregate carrying amount of intangible assets of $
302.7
million, which includes an indefinite-lived intangible of $
5.0
million, is included in
Intangible assets, net
in our Condensed Consolidated Balance Sheet as of June 30, 2023.
12
THE NEW YORK TIMES COMPANY
NOTES TO THE CONDENSED CONSOLIDATED FINANCIAL STATEMENTS
(Unaudited)
NOTE 6.
INVESTMENTS
Non-Marketable Equity Securities
Our non-marketable equity securities are investments in privately held companies/funds without readily determinable market values. Gains and losses on non-marketable securities revalued, sold or impaired are recognized in
Interest income and other, net
in our Condensed Consolidated Statements of Operations.
As of June 30, 2023, and December 31, 2022, non-marketable equity securities included in
Miscellaneous assets
in our Condensed Consolidated Balance Sheets had a carrying value of $
29.8
million.
NOTE 7.
OTHER
Capitalized Computer Software Costs
Amortization of capitalized computer software costs included in
Depreciation and amortization
in our Condensed Consolidated Statements of Operations was $
1.8
million and $
1.9
million for the second quarters of 2023 and 2022, respectively, and $
3.6
million and $
3.9
million for the first six months of 2023 and 2022, respectively.
Interest income and other, net
Interest income and other, net
, as shown in the accompanying Condensed Consolidated Statements of Operations, was as follows:
| For the Quarters Ended | For the Six Months Ended | |||||||||||||||||||||||||
| (In thousands) | June 30, 2023 | June 26, 2022 | June 30, 2023 | June 26, 2022 | ||||||||||||||||||||||
| Interest income | $ |
|
$ |
|
$ |
|
$ |
|
||||||||||||||||||
|
Gain on the sale of land
(1)
|
|
|
|
|
||||||||||||||||||||||
| Interest expense |
(
|
(
|
(
|
(
|
||||||||||||||||||||||
| Total interest income and other, net | $ |
|
$ |
|
$ |
|
$ |
|
||||||||||||||||||
(1)
On December 9, 2020, we entered into an agreement to lease and subsequently sell approximately four acres of land at our printing and distribution facility in College Point, N.Y., subject to certain conditions. The lease commenced on April 11, 2022. At the time of the lease expiration in February 2025, we will sell the parcel to the lessee for approximately $
36
million. The transaction is accounted for as a sales-type lease and as a result, we recognized a gain of approximately $
34
million (net of commissions) at the time of lease commencement.
Restricted Cash
A reconciliation of cash, cash equivalents and restricted cash as of June 30, 2023, and June 26, 2022, from the Condensed Consolidated Balance Sheets to the Condensed Consolidated Statements of Cash Flows is as follows:
| (In thousands) | June 30, 2023 | June 26, 2022 | ||||||||||||
| Reconciliation of cash, cash equivalents and restricted cash | ||||||||||||||
| Cash and cash equivalents | $ |
|
$ |
|
||||||||||
| Restricted cash included within miscellaneous assets |
|
|
||||||||||||
| Total cash, cash equivalents and restricted cash shown in the Condensed Consolidated Statements of Cash Flows | $ |
|
$ |
|
||||||||||
Substantially all of the amount included in restricted cash is set aside to collateralize workers’ compensation obligations.
Revolving Credit Facility
On July 27, 2022, the Company entered into an amendment and restatement of its previous credit facility that, among other changes, increased the committed amount to $
350.0
million and extended the maturity date to July 27, 2027 (as amended and restated, the “Credit Facility”). Certain of the Company’s domestic subsidiaries have guaranteed the Company’s obligations under the Credit Facility. Borrowings under the Credit Facility bear interest at specified rates based on our utilization and consolidated leverage ratio. The Credit Facility contains various customary affirmative and negative covenants. In addition, the Company is obligated to pay a quarterly unused commitment fee at an annual rate of
0.20
%.
As of June 30, 2023, and December 31, 2022, there were
no
borrowings and approximately $
0.6
million in outstanding letters of credit, with the remaining committed amount available. As of June 30, 2023, the Company was in compliance with the financial covenants contained in the Credit Facility.
13
THE NEW YORK TIMES COMPANY
NOTES TO THE CONDENSED CONSOLIDATED FINANCIAL STATEMENTS
(Unaudited)
Severance Costs
We recognized $
0.7
million and $
2.7
million in severance costs for the second quarters of 2023 and 2022, respectively, and $
4.5
million and $
2.7
million for the first six months of 2023 and 2022, respectively. These costs are recorded in
General and administrative costs
in our Condensed Consolidated Statements of Operations.
We had a severance liability of $
5.6
million and $
4.4
million included in
Accrued expenses and other
in our Condensed Consolidated Balance Sheets as of June 30, 2023, and December 31, 2022, respectively.
Impairment of Long-Lived Assets
NOTE 8.
FAIR VALUE MEASUREMENTS
Fair value is the price that would be received upon the sale of an asset or paid upon transfer of a liability in an orderly transaction between market participants at the measurement date. The transaction would be in the principal or most advantageous market for the asset or liability, based on assumptions that a market participant would use in pricing the asset or liability. The fair value hierarchy consists of three levels:
Level 1–quoted prices in active markets for identical assets or liabilities that the reporting entity has the ability to access at the measurement date;
Level 2–inputs other than quoted prices included within Level 1 that are observable for the asset or liability, either directly or indirectly; and
Level 3–unobservable inputs for the asset or liability.
Assets/Liabilities Measured and Recorded at Fair Value on a Recurring Basis
The following table summarizes our financial assets and liabilities measured at fair value on a recurring basis as of June 30, 2023, and December 31, 2022:
| (In thousands) | June 30, 2023 | December 31, 2022 | ||||||||||||||||||||||||||||||||||||||||||||||||
| Total | Level 1 | Level 2 | Level 3 | Total | Level 1 | Level 2 | Level 3 | |||||||||||||||||||||||||||||||||||||||||||
| Assets: | ||||||||||||||||||||||||||||||||||||||||||||||||||
|
Short-term AFS securities
(1)
|
||||||||||||||||||||||||||||||||||||||||||||||||||
| Corporate debt securities | $ |
|
$ |
|
$ |
|
$ |
|
$ |
|
$ |
|
$ |
|
$ |
|
||||||||||||||||||||||||||||||||||
| U.S. governmental agency securities |
|
|
|
|
|
|
|
|
||||||||||||||||||||||||||||||||||||||||||
| U.S. Treasury securities |
|
|
|
|
|
|
|
|
||||||||||||||||||||||||||||||||||||||||||
| Municipal securities |
|
|
|
|
|
|
|
|
||||||||||||||||||||||||||||||||||||||||||
| Total short-term AFS securities | $ |
|
$ |
|
$ |
|
$ |
|
$ |
|
$ |
|
$ |
|
$ |
|
||||||||||||||||||||||||||||||||||
|
Long-term AFS securities
(1)
|
||||||||||||||||||||||||||||||||||||||||||||||||||
| U.S. Treasury securities | $ |
|
$ |
|
$ |
|
$ |
|
$ |
|
$ |
|
$ |
|
$ |
|
||||||||||||||||||||||||||||||||||
| Corporate debt securities |
|
|
|
|
|
|
|
|
||||||||||||||||||||||||||||||||||||||||||
| U.S. governmental agency securities |
|
|
|
|
|
|
|
|
||||||||||||||||||||||||||||||||||||||||||
| Total long-term AFS securities | $ |
|
$ |
|
$ |
|
$ |
|
$ |
|
$ |
|
$ |
|
$ |
|
||||||||||||||||||||||||||||||||||
| Liabilities: | ||||||||||||||||||||||||||||||||||||||||||||||||||
|
Deferred compensation
(2)(3)
|
$ |
|
$ |
|
$ |
|
$ |
|
$ |
|
$ |
|
$ |
|
$ |
|
||||||||||||||||||||||||||||||||||
|
Contingent consideration
(4)
|
$ |
|
$ |
|
$ |
|
$ |
|
$ |
|
$ |
|
$ |
|
$ |
|
||||||||||||||||||||||||||||||||||
14
THE NEW YORK TIMES COMPANY
NOTES TO THE CONDENSED CONSOLIDATED FINANCIAL STATEMENTS
(Unaudited)
(1)
We classified these investments as Level 2 since the fair value is based on market observable inputs for investments with similar terms and maturities.
(2)
The deferred compensation liability, included in
Other liabilities—other
in our Condensed Consolidated Balance Sheets, consists of deferrals under The New York Times Company Deferred Executive Compensation Plan (the “DEC”), a frozen plan that enabled certain eligible executives to elect to defer a portion of their compensation on a pre-tax basis. The deferred amounts are invested at the executives’ option in various mutual funds. The fair value of deferred compensation is based on the mutual fund investments elected by the executives and on quoted prices in active markets for identical assets. Participation in the DEC was frozen effective December 31, 2015.
(3)
The Company invests the assets associated with the deferred compensation liability in life insurance products. Our investments in life insurance products are included in
Miscellaneous assets
in our Condensed Consolidated Balance Sheets, and were $
51.1
million as of June 30, 2023, and $
48.4
million as of December 31, 2022. The fair value of these assets is measured using the net asset value per share (or its equivalent) and has not been classified in the fair value hierarchy.
(4)
The remaining contingent consideration balances (as discussed below) are included in Accrued expenses and other, for the current portion of the liability, and Other non-current liabilities, for the long-term portion of the liability, in our Condensed Consolidated Balance Sheets
.
Level 3 Liabilities
The contingent consideration liability is related to the 2020 acquisition of substantially all the assets and certain liabilities of Serial Productions, LLC and represents contingent payments based on the achievement of certain operational targets, as defined in the acquisition agreement, over the
five years
following the acquisition. The Company estimated the fair value using a probability-weighted discounted cash flow model. The estimate of the fair value of contingent consideration requires subjective assumptions to be made regarding probabilities assigned to operational targets and the discount rate. As the fair value is based on significant unobservable inputs, this is a Level 3 liability.
The following table presents changes in the contingent consideration balances for the second quarters and six months ended June 30, 2023, and June 26, 2022:
| Quarters Ended | Six Months Ended | |||||||||||||||||||||||||
| (In thousands) | June 30, 2023 | June 26, 2022 | June 30, 2023 | June 26, 2022 | ||||||||||||||||||||||
|
Balance at the beginning of the period
|
$ |
|
$ |
|
$ |
|
$ |
|
||||||||||||||||||
| Payments |
|
|
(
|
(
|
||||||||||||||||||||||
|
Fair value adjustments
(1)
|
|
|
|
|
||||||||||||||||||||||
| Contingent consideration at the end of the period | $ |
|
$ |
|
$ |
|
$ |
|
||||||||||||||||||
|
(1)
Fair value adjustments are included in General and administrative costs in our Condensed Consolidated Statements of Operations.
|
||||||||||||||||||||||||||
NOTE 9.
PENSION AND OTHER POSTRETIREMENT BENEFITS
Pension
Single-Employer Plans
We maintain The New York Times Companies Pension Plan, a frozen single-employer defined benefit pension plan. The Company also jointly sponsors a defined benefit plan with The NewsGuild of New York known as the Guild-Times Adjustable Pension Plan (the “APP”) that continues to accrue active benefits.
We also have a foreign-based pension plan for certain employees (the “foreign plan”). The information for the foreign plan is combined with the information for U.S. non-qualified plans. The benefit obligation of the foreign plan is immaterial to our total benefit obligation.
15
THE NEW YORK TIMES COMPANY
NOTES TO THE CONDENSED CONSOLIDATED FINANCIAL STATEMENTS
(Unaudited)
The components of net periodic pension (income)/cost were as follows:
| For the Quarters Ended | ||||||||||||||||||||||||||||||||||||||
| June 30, 2023 | June 26, 2022 | |||||||||||||||||||||||||||||||||||||
| (In thousands) |
Qualified
Plans |
Non-
Qualified Plans |
All
Plans |
Qualified
Plans |
Non-
Qualified Plans |
All
Plans |
||||||||||||||||||||||||||||||||
| Service cost | $ |
|
$ |
|
$ |
|
$ |
|
$ |
|
$ |
|
||||||||||||||||||||||||||
| Interest cost |
|
|
|
|
|
|
||||||||||||||||||||||||||||||||
| Expected return on plan assets |
(
|
|
(
|
(
|
|
(
|
||||||||||||||||||||||||||||||||
| Amortization of actuarial loss |
|
|
|
|
|
|
||||||||||||||||||||||||||||||||
| Amortization of prior service credit |
(
|
|
(
|
(
|
|
(
|
||||||||||||||||||||||||||||||||
| Net periodic pension (income)/cost | $ |
(
|
$ |
|
$ |
(
|
$ |
|
$ |
|
$ |
|
||||||||||||||||||||||||||
| For the Six Months Ended | ||||||||||||||||||||||||||||||||||||||
| June 30, 2023 | June 26, 2022 | |||||||||||||||||||||||||||||||||||||
| (In thousands) |
Qualified
Plans |
Non-
Qualified Plans |
All
Plans |
Qualified
Plans |
Non-
Qualified Plans |
All
Plans |
||||||||||||||||||||||||||||||||
| Service cost | $ |
|
$ |
|
$ |
|
$ |
|
$ |
|
$ |
|
||||||||||||||||||||||||||
| Interest cost |
|
|
|
|
|
|
||||||||||||||||||||||||||||||||
| Expected return on plan assets |
(
|
|
(
|
(
|
|
(
|
||||||||||||||||||||||||||||||||
| Amortization of actuarial loss |
|
|
|
|
|
|
||||||||||||||||||||||||||||||||
| Amortization of prior service credit |
(
|
|
(
|
(
|
|
(
|
||||||||||||||||||||||||||||||||
| Net periodic pension (income)/cost | $ |
(
|
$ |
|
$ |
(
|
$ |
|
$ |
|
$ |
|
||||||||||||||||||||||||||
During the first six months of 2023 and 2022, we made pension contributions of $
4.5
million and $
5.1
million, respectively, to the APP. We expect to make contractual contributions in 2023 of approximately $
10
million, which more than satisfy minimum funding requirements.
Other Postretirement Benefits
The components of net periodic postretirement benefit cost were as follows:
| For the Quarters Ended | For the Six Months Ended | |||||||||||||||||||||||||
| (In thousands) | June 30, 2023 | June 26, 2022 | June 30, 2023 | June 26, 2022 | ||||||||||||||||||||||
| Service cost | $ |
|
$ |
|
$ |
|
$ |
|
||||||||||||||||||
| Interest cost |
|
|
|
|
||||||||||||||||||||||
| Amortization of actuarial loss |
|
|
|
|
||||||||||||||||||||||
| Amortization of prior service credit |
|
(
|
|
(
|
||||||||||||||||||||||
| Net periodic postretirement benefit cost | $ |
|
$ |
|
$ |
|
$ |
|
||||||||||||||||||
16
THE NEW YORK TIMES COMPANY
NOTES TO THE CONDENSED CONSOLIDATED FINANCIAL STATEMENTS
(Unaudited)
NOTE 10.
INCOME TAXES
The Company had income tax expense of $
14.4
million and $
23.8
million in the second quarter and first six months of 2023, r
espectively. The Company had income tax expense of $
23.9
million and $
25.0
million in the second quarter and first six months of 2022, respectively. The Company’s effective tax rates were
23.6
% and
25.7
% for the second quarter and first six months of 2023, respectively. The Company’s effective tax rates were
27.9
% and
27.3
% for the second quarter and first six months of 2022, respectively. The decrease in income tax expense was primarily due to lower income in the second quarter of 2023. The decrease in the effective tax rate was primarily due to a reduction in the Company’s reserve for uncertain tax positions in the second quarter of 2023.
Beginning in 2022, the Tax Cuts and Jobs Act of 2017 eliminated the option to deduct research and development expenditures immediately in the year incurred and instead requires taxpayers to capitalize and amortize such expenditures over five years. In 2022, our cash from operations decreased approximately $
60
million and our net deferred tax assets increased by a similar amount as a result of this legislation. In 2023, we expect a negative impact on our cash from operations of approximately $
45
million. The actual impact on fiscal 2023 cash from operations will depend on the amount of research and development costs we incur, on whether Congress modifies or repeals this provision, and on whether new guidance and interpretive rules are issued by the U.S. Treasury, among other factors.
On August 16, 2022, the President signed the Inflation Reduction Act of 2022 (the “IRA”) into law. We do not expect the tax-related provisions of the IRA, which are effective beginning in 2023, to have a material impact on our consolidated financial statements.
NOTE 11.
EARNINGS PER SHARE
We compute earnings per share based upon the lower of the two-class method or the treasury stock method. The two-class method is an earnings allocation method used when a company’s capital structure includes either two or more classes of common stock or common stock and participating securities. This method determines earnings per share based on dividends declared on common stock and participating securities (i.e., distributed earnings), as well as participation rights of participating securities in any undistributed earnings.
Earnings per share is computed using both basic shares and diluted shares. The difference between basic and diluted shares is that diluted shares include the dilutive effect of the assumed exercise of outstanding securities. Our stock-settled long-term performance awards and restricted stock units could have a significant impact on diluted shares. The difference between basic and diluted shares was approximately
0.3
million and
0.5
million in the second quarter and first six months of 2023, respectively, and resulted primarily from the dilutive effect of our stock-based awards. The difference between basic and diluted shares was de minimis in the second quarter and first six months of 2022, respectively.
Securities that could potentially be dilutive are excluded from the computation of diluted earnings per share when a loss from continuing operations exists or when the exercise price exceeds the market value of our Class A Common Stock because their inclusion would result in an anti-dilutive effect on per share amounts.
There were approximately
0.2
million and
1.7
million restricted stock units excluded from the computation of diluted earnings per share in the second quarter and first six months of 2023, respectively, because they were anti-dilutive. There were approximately
1.4
million and
0.3
million restricted stock units excluded from the computation of diluted earnings per share in the second quarter and first six months of 2022, respectively, because they were anti-dilutive. There were
no
anti-dilutive stock-settled long-term performance awards excluded from the computation of diluted earnings per share in the second quarters and first six months of 2023 and 2022.
NOTE 12.
SUPPLEMENTAL STOCKHOLDERS’ EQUITY INFORMATION
Share Repurchases
In February 2022, the Board of Directors approved a $
150.0
million Class A share repurchase program that replaced the previous program, which was approved in 2015. In February 2023, in addition to the remaining 2022 authorization, the Board of Directors approved a $
250.0
million Class A share repurchase program. The authorizations provide that shares of Class A Common Stock may be purchased from time to time as market conditions warrant, through open-market purchases, privately negotiated transactions or other means, including Rule 10b5-1 trading plans. We expect to repurchase shares to offset the impact of dilution from our equity compensation program and to return capital to our stockholders. There is no expiration date with respect to these authorizations.
As of June 30, 2023, repurchases under these authorizations totaled approximately $
148.6
million (excluding commissions) and approximately $
251.4
million remained. During the six months ended June 30, 2023, repurchases under these authorizations totaled approximately $
43.6
million (excluding commissions).
17
THE NEW YORK TIMES COMPANY
NOTES TO THE CONDENSED CONSOLIDATED FINANCIAL STATEMENTS
(Unaudited)
Accumulated Other Comprehensive Income
The following table summarizes the changes in AOCI by component as of June 30, 2023:
| (In thousands) | Foreign Currency Translation Adjustments | Funded Status of Benefit Plans | Net Unrealized Loss on Available-For-Sale Securities | Total Accumulated Other Comprehensive Loss | ||||||||||||||||||||||
| Balance as of December 31, 2022 | $ |
(
|
$ |
(
|
$ |
(
|
$ |
(
|
||||||||||||||||||
| Other comprehensive income before reclassifications, before tax |
|
|
|
|
||||||||||||||||||||||
| Amounts reclassified from accumulated other comprehensive loss, before tax |
|
|
|
|
||||||||||||||||||||||
| Income tax expense |
|
|
|
|
||||||||||||||||||||||
| Net current-period other comprehensive income, net of tax |
|
|
|
|
||||||||||||||||||||||
| Balance as of June 30, 2023 | $ |
|
$ |
(
|
$ |
(
|
$ |
(
|
||||||||||||||||||
The following table summarizes the reclassifications from AOCI for the six months ended June 30, 2023:
|
(In thousands)
Detail about accumulated other comprehensive loss components
|
Amounts reclassified from accumulated other comprehensive loss | Affects line item in the statement where net income is presented | ||||||||||||
| Funded status of benefit plans: | ||||||||||||||
|
Amortization of prior service credit
(1)
|
$ |
(
|
Other components of net periodic benefit (income)/costs | |||||||||||
|
Amortization of actuarial loss
(1)
|
|
Other components of net periodic benefit (income)/costs | ||||||||||||
|
Total reclassification, before tax
(2)
|
|
|||||||||||||
| Income tax expense |
|
Income tax expense | ||||||||||||
| Total reclassification, net of tax | $ |
|
||||||||||||
|
(1)
These AOCI components are included in the computation of net periodic benefit (income)/cost for pension and other postretirement benefits. See Note 9 for more information.
|
||||||||||||||
|
(2)
There were no reclassifications relating to noncontrolling interest for the quarter ended June 30, 2023.
|
||||||||||||||
Stock-based Compensation Expense
Total stock-based compensation expense included in the Condensed Consolidated Statements of Operations is as follows:
| For the Quarters Ended | For the Six Months Ended | |||||||||||||||||||||||||
| (In thousands) | June 30, 2023 | June 26, 2022 | June 30, 2023 | June 26, 2022 | ||||||||||||||||||||||
| Cost of revenue | $ |
|
$ |
|
$ |
|
$ |
|
||||||||||||||||||
| Sales and marketing |
|
|
|
|
||||||||||||||||||||||
| Product development |
|
|
|
|
||||||||||||||||||||||
| General and administrative |
|
|
|
|
||||||||||||||||||||||
| Total stock-based compensation expense | $ |
|
$ |
|
$ |
|
$ |
|
||||||||||||||||||
NOTE 13.
SEGMENT INFORMATION
18
THE NEW YORK TIMES COMPANY
NOTES TO THE CONDENSED CONSOLIDATED FINANCIAL STATEMENTS
(Unaudited)
Since the acquisition of The Athletic in the first quarter of 2022, the Company has had
two
reportable segments: NYTG and The Athletic. These segments are evaluated regularly by the Company’s Chief Operating Decision Maker in assessing performance and allocating resources. Management uses adjusted operating profit (loss) by segment in assessing performance and allocating resources. The Company includes in its presentation revenues and adjusted operating costs to arrive at adjusted operating profit (loss) by segment. Adjusted operating costs are defined as operating costs before depreciation and amortization, severance and multiemployer pension plan withdrawal costs. Adjusted operating profit is defined as operating profit before depreciation and amortization, severance, multiemployer pension plan withdrawal costs and special items. Asset information by segment is not a measure of performance used by the Company’s Chief Operating Decision Maker. Accordingly, we have not disclosed asset information by segment.
Subscription revenue from and expenses associated with our digital subscription package (or “bundle”) are allocated to NYTG and The Athletic. The Athletic was first introduced into our bundle in June 2022. Therefore, The Athletic’s results for the second quarter of 2022 include bundle revenue and expenses for only part of the quarter, whereas the second quarter of 2023 includes bundle revenue and expenses for the entire quarter.
Prior to April 1, 2023, we allocated bundle revenue first to our digital news product based on its standalone list price and then the remaining bundle revenue was allocated to the other products in the bundle, including The Athletic, based on their relative standalone list prices. Starting April 1, 2023, we allocate
10
% of bundle revenue to The Athletic based on management’s view of The Athletic’s relative value to the bundle, which is derived based on analysis of various metrics, and allocate the remaining bundle revenues to NYTG.
Prior to April 1, 2023, we allocated to NYTG and The Athletic direct variable expenses associated with the bundle, which include credit card fees, third party fees and sales taxes, based on a historical actual percentage of these costs to bundle revenue. Starting April 1, 2023, we allocate
10
% of product development, marketing and subscriber servicing expenses (including the direct variable expenses referenced above) associated with the bundle to The Athletic, and the remaining costs are allocated to NYTG, in each case, in line with the revenues allocations.
For comparison purposes, the Company has recast segment results for the quarters following the second quarter of 2022 to reflect the updated allocation methodology. The second quarter of 2022 was not recast as the change was de minimis for that quarter in light of the timing of the introduction of The Athletic to the bundle.
The results of The Athletic have been included in our Condensed Consolidated Financial Statements beginning February 1, 2022, the date of the acquisition. Results for the first six months of 2022 included The Athletic for approximately five months, while results for the first six months of 2023 included The Athletic for the full six months.
19
THE NEW YORK TIMES COMPANY
NOTES TO THE CONDENSED CONSOLIDATED FINANCIAL STATEMENTS
(Unaudited)
The following tables present segment information:
| For the Quarters Ended | For the Six Months Ended | |||||||||||||||||||||||||||||||||||||
| (In thousands) | June 30, 2023 | June 26, 2022 | % Change | June 30, 2023 | June 26, 2022 | % Change | ||||||||||||||||||||||||||||||||
| Revenues | ||||||||||||||||||||||||||||||||||||||
| NYTG | $ |
|
$ |
|
|
% | $ |
|
$ |
|
|
% | ||||||||||||||||||||||||||
| The Athletic |
|
|
|
% |
|
|
|
% | ||||||||||||||||||||||||||||||
| Total revenues | $ |
|
$ |
|
|
% | $ |
|
$ |
|
|
% | ||||||||||||||||||||||||||
| Adjusted operating costs | ||||||||||||||||||||||||||||||||||||||
| NYTG | $ |
|
$ |
|
|
% | $ |
|
$ |
|
|
% | ||||||||||||||||||||||||||
| The Athletic |
|
|
|
% |
|
|
|
% | ||||||||||||||||||||||||||||||
| Total adjusted operating costs | $ |
|
$ |
|
|
% | $ |
|
$ |
|
|
% | ||||||||||||||||||||||||||
| Adjusted operating profit (loss) | ||||||||||||||||||||||||||||||||||||||
| NYTG | $ |
|
$ |
|
|
% | $ |
|
$ |
|
|
% | ||||||||||||||||||||||||||
| The Athletic |
(
|
(
|
(
|
% |
(
|
(
|
(
|
% | ||||||||||||||||||||||||||||||
| Total adjusted operating profit | $ |
|
$ |
|
|
% | $ |
|
$ |
|
|
% | ||||||||||||||||||||||||||
| AOP margin % - NYTG |
|
% |
|
% |
|
|
% |
|
% |
|
||||||||||||||||||||||||||||
| * Represents a change equal to or in excess of 100% or not meaningful. | ||||||||||||||||||||||||||||||||||||||
| Revenues detail by segment | ||||||||||||||||||||||||||||||||||||||
| For the Quarters Ended | For the Six Months Ended | |||||||||||||||||||||||||||||||||||||
| (In thousands) | June 30, 2023 | June 26, 2022 | % Change | June 30, 2023 | June 26, 2022 | % Change | ||||||||||||||||||||||||||||||||
| NYTG | ||||||||||||||||||||||||||||||||||||||
| Subscription | $ |
|
$ |
|
|
% | $ |
|
$ |
|
|
% | ||||||||||||||||||||||||||
| Advertising |
|
|
(
|
% |
|
|
(
|
% | ||||||||||||||||||||||||||||||
| Other |
|
|
|
% |
|
|
|
% | ||||||||||||||||||||||||||||||
| Total | $ |
|
$ |
|
|
% | $ |
|
$ |
|
|
% | ||||||||||||||||||||||||||
| The Athletic | ||||||||||||||||||||||||||||||||||||||
| Subscription | $ |
|
$ |
|
|
% | $ |
|
$ |
|
|
% | ||||||||||||||||||||||||||
| Advertising |
|
|
* |
|
|
* | ||||||||||||||||||||||||||||||||
| Other |
|
|
* |
|
|
* | ||||||||||||||||||||||||||||||||
| Total | $ |
|
$ |
|
|
% | $ |
|
$ |
|
|
% | ||||||||||||||||||||||||||
| The New York Times Company | ||||||||||||||||||||||||||||||||||||||
| Subscription | $ |
|
$ |
|
|
% | $ |
|
$ |
|
|
% | ||||||||||||||||||||||||||
| Advertising |
|
|
|
% |
|
|
(
|
% | ||||||||||||||||||||||||||||||
| Other |
|
|
|
% |
|
|
|
% | ||||||||||||||||||||||||||||||
| Total | $ |
|
$ |
|
|
% | $ |
|
$ |
|
|
% | ||||||||||||||||||||||||||
| * Represents a change equal to or in excess of 100% or not meaningful. | ||||||||||||||||||||||||||||||||||||||
20
THE NEW YORK TIMES COMPANY
NOTES TO THE CONDENSED CONSOLIDATED FINANCIAL STATEMENTS
(Unaudited)
| Adjusted operating costs (operating costs before depreciation and amortization, severance and multiemployer pension plan withdrawal costs) detail by segment | ||||||||||||||||||||||||||||||||||||||
| For the Quarters Ended | For the Six Months Ended | |||||||||||||||||||||||||||||||||||||
| (In thousands) | June 30, 2023 | June 26, 2022 | % Change | June 30, 2023 | June 26, 2022 | % Change | ||||||||||||||||||||||||||||||||
| NYTG | ||||||||||||||||||||||||||||||||||||||
| Cost of revenue (excluding depreciation and amortization) | $ |
|
$ |
|
|
% | $ |
|
$ |
|
|
% | ||||||||||||||||||||||||||
| Sales and marketing |
|
|
(
|
% |
|
|
(
|
% | ||||||||||||||||||||||||||||||
| Product development |
|
|
|
% |
|
|
|
% | ||||||||||||||||||||||||||||||
|
Adjusted general and administrative
(1)
|
|
|
|
% |
|
|
|
% | ||||||||||||||||||||||||||||||
| Total | $ |
|
$ |
|
|
% | $ |
|
$ |
|
|
% | ||||||||||||||||||||||||||
| The Athletic | ||||||||||||||||||||||||||||||||||||||
| Cost of revenue (excluding depreciation and amortization) | $ |
|
$ |
|
|
% | $ |
|
$ |
|
|
% | ||||||||||||||||||||||||||
| Sales and marketing |
|
|
|
% |
|
|
* | |||||||||||||||||||||||||||||||
| Product development |
|
|
|
% |
|
|
|
% | ||||||||||||||||||||||||||||||
|
Adjusted general and administrative
(2)
|
|
|
(
|
% |
|
|
(
|
% | ||||||||||||||||||||||||||||||
| Total | $ |
|
$ |
|
|
% | $ |
|
$ |
|
|
% | ||||||||||||||||||||||||||
| The New York Times Company | ||||||||||||||||||||||||||||||||||||||
| Cost of revenue (excluding depreciation and amortization) | $ |
|
$ |
|
|
% | $ |
|
$ |
|
|
% | ||||||||||||||||||||||||||
| Sales and marketing |
|
|
(
|
% |
|
|
(
|
% | ||||||||||||||||||||||||||||||
| Product development |
|
|
|
% |
|
|
|
% | ||||||||||||||||||||||||||||||
| Adjusted general and administrative |
|
|
|
% |
|
|
|
% | ||||||||||||||||||||||||||||||
| Total | $ |
|
$ |
|
|
% | $ |
|
$ |
|
|
% | ||||||||||||||||||||||||||
|
(1)
Excludes severance of $
|
||||||||||||||||||||||||||||||||||||||
|
(2)
Excludes severance of $
|
||||||||||||||||||||||||||||||||||||||
| * Represents a change equal to or in excess of 100% or not meaningful. | ||||||||||||||||||||||||||||||||||||||
| Reconciliation of operating costs before depreciation and amortization, severance and multiemployer pension plan withdrawal costs (or adjusted operating costs) | ||||||||||||||||||||||||||||||||||||||
| For the Quarters Ended | For the Six Months Ended | |||||||||||||||||||||||||||||||||||||
| (In thousands) | June 30, 2023 | June 26, 2022 | % Change | June 30, 2023 | June 26, 2022 | % Change | ||||||||||||||||||||||||||||||||
| Operating costs | $ |
|
$ |
|
|
% | $ |
|
$ |
|
|
% | ||||||||||||||||||||||||||
| Less: | ||||||||||||||||||||||||||||||||||||||
| Depreciation and amortization |
|
|
|
% |
|
|
|
% | ||||||||||||||||||||||||||||||
| Severance |
|
|
(
|
% |
|
|
|
% | ||||||||||||||||||||||||||||||
| Multiemployer pension plan withdrawal costs |
|
|
(
|
% |
|
|
|
% | ||||||||||||||||||||||||||||||
| Adjusted operating costs | $ |
|
$ |
|
|
% | $ |
|
$ |
|
|
% | ||||||||||||||||||||||||||
| * Represents a change equal to or in excess of 100% or not meaningful. | ||||||||||||||||||||||||||||||||||||||
21
THE NEW YORK TIMES COMPANY
NOTES TO THE CONDENSED CONSOLIDATED FINANCIAL STATEMENTS
(Unaudited)
| Reconciliation of operating profit before depreciation and amortization, severance, multiemployer pension plan withdrawal costs and special items (or adjusted operating profit) | ||||||||||||||||||||||||||||||||||||||
| For the Quarters Ended | For the Six Months Ended | |||||||||||||||||||||||||||||||||||||
| (In thousands) | June 30, 2023 | June 26, 2022 | % Change | June 30, 2023 | June 26, 2022 | % Change | ||||||||||||||||||||||||||||||||
| Operating profit | $ |
|
$ |
|
|
% | $ |
|
$ |
|
|
% | ||||||||||||||||||||||||||
| Add: | ||||||||||||||||||||||||||||||||||||||
| Depreciation and amortization |
|
|
|
% |
|
|
|
% | ||||||||||||||||||||||||||||||
| Severance |
|
|
(
|
% |
|
|
|
% | ||||||||||||||||||||||||||||||
| Multiemployer pension plan withdrawal costs |
|
|
(
|
% |
|
|
|
% | ||||||||||||||||||||||||||||||
| Special items: | ||||||||||||||||||||||||||||||||||||||
| Acquisition-related costs |
|
|
— |
|
|
* | ||||||||||||||||||||||||||||||||
| Lease-related impairment charge |
|
|
* |
|
|
* | ||||||||||||||||||||||||||||||||
| Adjusted operating profit | $ |
|
$ |
|
|
% | $ |
|
$ |
|
|
% | ||||||||||||||||||||||||||
| * Represents a change equal to or in excess of 100% or not meaningful. | ||||||||||||||||||||||||||||||||||||||
NOTE 14.
CONTINGENT LIABILITIES
Legal Proceedings
We are involved in various legal actions incidental to our business that are now pending against us. These actions generally have damage claims that are greatly in excess of the payments, if any, that we would be required to pay if we lost or settled the cases. Although the Company cannot predict the outcome of these matters, it is possible that an unfavorable outcome in one or more matters could be material to the Company’s consolidated results of operations or cash flows for an individual reporting period. However, based on currently available information, management does not believe that the ultimate resolution of these matters, individually or in the aggregate, is likely to have a material effect on the Company’s financial position.
22
Item 2. Management’s Discussion and Analysis of Financial Condition and Results of Operations
EXECUTIVE OVERVIEW
We are a global media organization focused on creating, collecting and distributing high-quality news and information that helps our audience understand and engage with the world. We believe that our original, independent and high-quality reporting, storytelling and journalistic excellence set us apart from other news organizations and are at the heart of what makes our journalism worth paying for.
We generate revenues principally from the sale of subscriptions and advertising. Subscription revenues consist of revenues from standalone subscriptions to our digital products, our digital subscription package (or “bundle”) and subscriptions to and single-copy and bulk sales of our print products. Advertising revenue is derived from the sale of our advertising products and services. Other revenues primarily consist of revenues from licensing, Wirecutter affiliate referrals, commercial printing, the leasing of floors in our headquarters (the “Company Headquarters”), television and film, retail commerce, our live events business and our student subscription sponsorship program.
Our main operating costs are employee-related costs.
In the accompanying analysis of financial information, we present certain information derived from our consolidated financial information but not presented in our financial statements prepared in accordance with generally accepted accounting principles in the United States of America (“GAAP”). We are presenting in this report supplemental non-GAAP financial performance measures that exclude depreciation, amortization, severance, non-operating retirement costs, and certain identified special items, as applicable. In addition, we present our free cash flow, defined as net cash provided by operating activities less capital expenditures. These non-GAAP financial measures should not be considered in isolation from or as a substitute for the related GAAP measures and should be read in conjunction with financial information presented on a GAAP basis. For further information and reconciliations of these non-GAAP measures to the most directly comparable GAAP measures, see “— Results of Operations — Non-GAAP Financial Measures.”
The first six months of 2022 included an additional day compared with the first six months of 2023 as a result of the change in the Company’s fiscal year to the calendar year.
The Company has two reportable segments: The New York Times Group (“NYTG”) and The Athletic.
The results of The Athletic have been included in our Condensed Consolidated Financial Statements beginning February 1, 2022, the date of the acquisition. Results for the first six months of 2022 included The Athletic for approximately five months, while results for the first six months of 2023 included The Athletic for the full six months.
Financial Highlights
•
Operating profit increased to $55.8 million in the second quarter of 2023, compared with $51.7 million in the second quarter of 2022. Operating profit before depreciation, amortization, severance, multiemployer pension plan withdrawal costs and special items discussed below under “Non-GAAP Financial Measures” (or “adjusted operating profit,” a non-GAAP measure) increased 20.9% to $92.2 million in the second quarter of 2023, compared with $76.2 million in the second quarter of 2022. In each case, the increase was due to higher digital subscription and other revenues partially offset by higher operating costs. Operating profit margin (operating profit expressed as a percentage of revenues) increased to 9.4% in the second quarter of 2023, compared with 9.3% in the second quarter of 2022. Adjusted operating profit margin (adjusted operating profit expressed as a percentage of revenues) increased to 15.6% in the second quarter of 2023, compared with 13.7% in the second quarter of 2022.
•
Total revenues increased 6.3% to $590.9 million in the second quarter of 2023 from $555.7 million in the second quarter of 2022.
•
Total subscription revenues increased 6.8% to $409.6 million in the second quarter of 2023 from $383.6 million in the second quarter of 2022. Digital-only subscription revenues increased 13.0% to $269.8 million in the second quarter of 2023 from $238.7 million in the second quarter of 2022. Paid digital-only subscribers totaled approximately 9.19 million at the end of the second quarter of 2023, a net increase of 180,000 compared with the end of the first quarter of 2023 and a net increase of 780,000
compared with the end of the second quarter of 2022.
•
Total advertising revenues were approximately flat at $117.8 million in the second quarter of 2023.
23
•
Operating costs increased 3.6% to $522.3 million in the second quarter of 2023 from $504.0 million in the second quarter of 2022. Operating costs before depreciation, amortization, severance and multiemployer pension plan withdrawal costs (or “adjusted operating costs,” a non-GAAP measure) increased 4.0% to $498.7 million in the second quarter of 2023 from $479.5 million in the second quarter of 2022.
•
Operating costs that we refer to as “technology costs,” consisting of product development costs as well as components of costs of revenues and general and administrative costs, increased 9.4% to $101.3 million compared with $92.6 million in the second quarter of 2022.
•
Diluted earnings per share were $0.28 and $0.37 for the second quarters of 2023 and 2022, respectively. The decrease in diluted EPS was primarily driven by the gain in the second quarter of 2022 relating to an agreement to lease and subsequently sell approximately four acres of land at our printing and distribution facility in College Point, N.Y (the “College Point parcel sale”) and an impairment charge related to excess leased office space that is being marketed for sublet (the “lease-related impairment”) in the second quarter of 2023. Diluted earnings per share excluding severance, non-operating retirement costs and special items discussed below under “Non-GAAP Financial Measures” (or “adjusted diluted earnings per share,” a non-GAAP measure) were $0.38 and $0.28 for the second quarters of 2023 and 2022, respectively.
Industry Trends, Economic Conditions, Challenges and Risks
We operate in a highly competitive environment that is subject to rapid change. Companies shaping our competitive environment include information providers and distributors, as well as news aggregators, search engines and social media platforms. Competition among these companies is robust, and new competitors can quickly emerge. We have designed our strategy to take advantage of both the challenges and opportunities presented by this period of transformation in our industry.
We and the companies with which we do business are subject to risks and uncertainties caused by factors beyond our control, including economic, public health and geopolitical conditions. These include economic weakness, uncertainty and volatility, including the potential for a recession; a competitive labor market and evolving workforce expectations (including for unionized employees); inflation; supply chain disruptions; rising interest rates; and political and sociopolitical uncertainties and conflicts (including the war in Ukraine). These factors may result in declines and/or volatility in our results.
We believe the macroeconomic environment has had and may continue to have an adverse impact on both digital and print advertising spend.
We are experiencing a competitive labor market and pressure on compensation and benefit costs for certain employees, mainly in technology roles. In addition, although we have not seen a significant impact from inflation on our recent financial results to date, if it remains at current levels, or increases, for an extended period, our employee-related costs are likely to increase. Our printing and distribution costs also have been impacted and may be further impacted by inflation and higher costs, including those associated with raw materials, delivery costs and/or utilities.
We actively monitor industry trends, economic conditions, challenges and risks to remain flexible and to optimize and evolve our business as appropriate; however, the full impact they will have on our business, operations and financial results is uncertain and will depend on numerous factors and future developments. The risks related to our business are further described in the section titled “Item 1A — Risk Factors” in our Annual Report on Form 10-K for the year ended December 31, 2022.
24
RESULTS OF OPERATIONS
The following table presents our consolidated financial results:
| For the Quarters Ended | For the Six Months Ended | |||||||||||||||||||||||||||||||||||||
| (In thousands) | June 30, 2023 | June 26, 2022 | % Change | June 30, 2023 | June 26, 2022 | % Change | ||||||||||||||||||||||||||||||||
| Revenues | ||||||||||||||||||||||||||||||||||||||
| Subscription | $ | 409,590 | $ | 383,619 | 6.8 | % | $ | 807,132 | $ | 755,598 | 6.8 | % | ||||||||||||||||||||||||||
| Advertising | 117,770 | 117,379 | 0.3 | % | 224,011 | 233,649 | (4.1) | % | ||||||||||||||||||||||||||||||
| Other | 63,493 | 54,682 | 16.1 | % | 120,449 | 103,858 | 16.0 | % | ||||||||||||||||||||||||||||||
|
Total revenues
|
590,853 | 555,680 | 6.3 | % | 1,151,592 | 1,093,105 | 5.4 | % | ||||||||||||||||||||||||||||||
| Operating costs | ||||||||||||||||||||||||||||||||||||||
| Cost of revenue (excluding depreciation and amortization) | 309,923 | 300,583 | 3.1 | % | 616,775 | 581,948 | 6.0 | % | ||||||||||||||||||||||||||||||
| Sales and marketing | 62,241 | 62,769 | (0.8) | % | 129,275 | 140,357 | (7.9) | % | ||||||||||||||||||||||||||||||
| Product development | 56,047 | 50,822 | 10.3 | % | 113,109 | 98,255 | 15.1 | % | ||||||||||||||||||||||||||||||
| General and administrative | 72,273 | 69,141 | 4.5 | % | 153,324 | 140,498 | 9.1 | % | ||||||||||||||||||||||||||||||
| Depreciation and amortization | 21,858 | 20,704 | 5.6 | % | 42,698 | 39,390 | 8.4 | % | ||||||||||||||||||||||||||||||
|
Total operating costs
|
522,342 | 504,019 | 3.6 | % | 1,055,181 | 1,000,448 | 5.5 | % | ||||||||||||||||||||||||||||||
| Acquisition-related costs | — | — | — | — | 34,712 | * | ||||||||||||||||||||||||||||||||
| Lease-related impairment charge | 12,736 | — | * | 12,736 | — | * | ||||||||||||||||||||||||||||||||
| Operating profit | 55,775 | 51,661 | 8.0 | % | 83,675 | 57,945 | 44.4 | % | ||||||||||||||||||||||||||||||
| Other components of net periodic benefit (income)/costs | (684) | 1,624 | * | (1,369) | 3,146 | * | ||||||||||||||||||||||||||||||||
| Interest income and other, net | 4,517 | 35,604 | * | 7,690 | 36,679 | (79.0) | % | |||||||||||||||||||||||||||||||
| Income before income taxes | 60,976 | 85,641 | (28.8) | % | 92,734 | 91,478 | 1.4 | % | ||||||||||||||||||||||||||||||
| Income tax expense | 14,402 | 23,864 | (39.6) | % | 23,839 | 24,976 | (4.6) | % | ||||||||||||||||||||||||||||||
| Net income | $ | 46,574 | $ | 61,777 | (24.6) | % | $ | 68,895 | $ | 66,502 | 3.6 | % | ||||||||||||||||||||||||||
* Represents a change equal to or in excess of 100% or not meaningful.
25
Revenues
Subscription Revenues
Subscription revenues consist of revenues from subscriptions to our digital and print products (which include our news product, as well as The Athletic and our Cooking, Games and Wirecutter products), and single-copy and bulk sales of our print products (which represent less than 5% of these revenues). Subscription revenues are based on both the number of copies of the printed newspaper sold and digital-only subscriptions, and the rates charged to the respective customers.
We offer a bundle that includes access to our digital news product, as well as The Athletic and our Cooking, Games and Wirecutter products. We also offer standalone digital subscriptions to our digital news product, as well as to The Athletic, and to our Cooking, Games and Wirecutter products. Access to our new Audio product, which we launched in the second quarter of 2023, is included in bundle subscriptions and subscriptions to our digital and print news products.
Subscription revenues increased 6.8% in both the second quarter and first six months of 2023 compared with the same prior-year periods, primarily due to the larger number of subscribers who are paying higher prices, growth in the number of subscribers to the Company’s digital-only products and subscribers who have upgraded to the bundle. The larger number of subscribers who are paying higher prices is primarily a result of subscribers whose introductory promotional prices have graduated to higher prices and the implementation of price increases on tenured non-bundle digital news and Games subscribers. The increase
in digital subscription revenue was partially offset by a decrease in print subscription revenue. That decline was due to a lower number of print subscriptions, reflecting secular trends, partially offset by an increase in domestic home-delivery prices. There is no print subscription revenue generated from The Athletic.
The following table summarizes digital and print subscription revenues for the second quarters and first six months of 2023 and 2022:
| For the Quarters Ended | For the Six Months Ended | |||||||||||||||||||||||||||||||||||||
| (In thousands) | June 30, 2023 | June 26, 2022 | % Change | June 30, 2023 | June 26, 2022 | % Change | ||||||||||||||||||||||||||||||||
|
Digital-only subscription revenues
(1)
|
$ | 269,774 | $ | 238,727 | 13.0 | % | $ | 528,541 | $ | 465,489 | 13.5 | % | ||||||||||||||||||||||||||
| Print subscription revenues: | ||||||||||||||||||||||||||||||||||||||
|
Domestic home-delivery subscription revenues
(2)
|
126,024 | 131,080 | (3.9) | % | 251,901 | 262,472 | (4.0) | % | ||||||||||||||||||||||||||||||
|
Single-copy, NYT International and Other subscription revenues
(3)
|
13,792 | 13,812 | (0.1) | % | 26,690 | 27,637 | (3.4) | % | ||||||||||||||||||||||||||||||
| Subtotal print subscription revenues | 139,816 | 144,892 | (3.5) | % | 278,591 | 290,109 | (4.0) | % | ||||||||||||||||||||||||||||||
| Total subscription revenues | $ | 409,590 | $ | 383,619 | 6.8 | % | $ | 807,132 | $ | 755,598 | 6.8 | % | ||||||||||||||||||||||||||
|
(1)
Includes revenue from bundled and standalone subscriptions to our news product, as well as to The Athletic and to our Cooking, Games and Wirecutter products.
|
||||||||||||||||||||||||||||||||||||||
|
(2)
Domestic home-delivery subscriptions include access to our digital products.
|
||||||||||||||||||||||||||||||||||||||
|
(3)
NYT International is the international edition of our print newspaper.
|
||||||||||||||||||||||||||||||||||||||
A subscriber is defined as a customer who has subscribed (and provided a valid method of payment) for the right to access one or more of the Company’s products. The Company ended the second quarter of 2023 with approximately 9.88 million subscribers across its print and digital products, including approximately 9.19 million digital-only subscribers.
Compared with the end of the first quarter of 2023, there was a net increase of 180,000 digital-only subscribers. Compared with the end of the second quarter of 2022, there was a net increase of 780,000 digital-only subscribers.
Print domestic home-delivery subscribers totaled approximately 690,000 at the end of the second quarter of 2023, a net decrease of 20,000 subscribers compared with the end of the first quarter of 2023 and a net decrease of 70,000 subscribers compared with the end of the second quarter of 2022. Subscribers with a domestic home-delivery print subscription to The New York Times, which includes access to our digital products, are excluded from digital-only subscribers.
Beginning with the second quarter of 2023, we report three mutually exclusive digital-only subscriber categories: bundle and multiproduct, news-only and other single-product, which collectively sum to Total digital-only subscribers, as well as the average revenue per user for each of these categories.
26
The following table sets forth subscribers as of the end of the five most recent fiscal quarters:
| For the Quarters Ended | ||||||||||||||||||||||||||||||||
| (In thousands) | June 30, 2023 | March 31, 2023 | December 31, 2022 | September 25, 2022 | June 26, 2022 | |||||||||||||||||||||||||||
| Digital-only subscribers: | ||||||||||||||||||||||||||||||||
|
Bundle and multiproduct
(1)(2)
|
3,300 | 3,020 | 2,500 | 2,130 | 1,980 | |||||||||||||||||||||||||||
|
News-only
(2)(3)
|
3,320 | 3,580 | 3,920 | 4,130 | 4,210 | |||||||||||||||||||||||||||
|
Other single-product
(2)(4)
|
2,580 | 2,420 | 2,410 | 2,330 | 2,230 | |||||||||||||||||||||||||||
|
Total digital-only subscribers
(2)(5)
|
9,190 | 9,020 | 8,830 | 8,590 | 8,410 | |||||||||||||||||||||||||||
|
Print subscribers
(6)
|
690 | 710 | 730 | 740 | 760 | |||||||||||||||||||||||||||
| Total subscribers | 9,880 | 9,730 | 9,550 | 9,330 | 9,170 | |||||||||||||||||||||||||||
|
(1)
Subscribers with a bundle subscription or standalone digital-only subscriptions to two or more of the Company’s products.
|
||||||||||||||||||||||||||||||||
|
(2)
Includes group corporate and group education subscriptions, which collectively represented approximately 5% of total digital-only subscribers as of the end of the second quarter of 2023. The number of group subscribers is derived using the value of the relevant contract and a discounted subscription rate.
|
||||||||||||||||||||||||||||||||
|
(3)
Subscribers with only a digital-only news product subscription.
|
||||||||||||||||||||||||||||||||
|
(4)
Subscribers with only one digital-only subscription to The Athletic or to our Cooking, Games or Wirecutter products.
|
||||||||||||||||||||||||||||||||
|
(5)
Subscribers with digital-only subscriptions to one or more of our news product, The Athletic, or our Cooking, Games and Wirecutter products.
|
||||||||||||||||||||||||||||||||
|
(6)
Subscribers with a domestic home-delivery or mail print subscription to The New York Times, which includes access to our digital products, or a print subscription to our Book Review or Large Type Weekly products.
|
||||||||||||||||||||||||||||||||
|
The sum of individual metrics may not always equal total amounts indicated due to rounding. Subscribers (including net subscriber additions) are rounded to the nearest ten thousand.
|
||||||||||||||||||||||||||||||||
The following table sets forth the subset of subscribers above who have a paid digital-only standalone subscription or a bundle subscription that includes the ability to access The Athletic as of the end of the five most recent fiscal quarters:
| For the Quarters Ended | ||||||||||||||||||||||||||||||||
| June 30, 2023 | March 31, 2023 | December 31, 2022 | September 25, 2022 | June 26, 2022 | ||||||||||||||||||||||||||||
|
Digital-only subscribers with The Athletic
(1)(2)
|
3,640 | 3,270 | 2,680 | 2,290 | 1,690 | |||||||||||||||||||||||||||
|
(1)
In June 2022, we provided all bundle subscribers with the ability to access The Athletic and all bundle subscribers are included in this metric.
|
||||||||||||||||||||||||||||||||
|
(2)
Subscribers (including net subscriber additions) are rounded to the nearest ten thousand.
|
||||||||||||||||||||||||||||||||
“Average revenue per user” or “ARPU,” a metric we calculate to track the revenue generation of our digital subscriber base, represents the average revenue per subscriber over a 28-day billing cycle during the applicable quarter. The following table sets forth ARPU metrics relating to the above digital-only subscriber categories for the five most recent fiscal quarters:
| For the Quarters Ended | ||||||||||||||||||||||||||||||||
| June 30, 2023 | March 31, 2023 | December 31, 2022 | September 25, 2022 | June 26, 2022 | ||||||||||||||||||||||||||||
| Digital-only ARPU: | ||||||||||||||||||||||||||||||||
| Bundle and multiproduct | $ | 13.40 | $ | 14.33 | $ | 15.20 | $ | 15.77 | $ | 16.09 | ||||||||||||||||||||||
| News-only | $ | 9.29 | $ | 8.69 | $ | 8.49 | $ | 8.30 | $ | 8.11 | ||||||||||||||||||||||
|
Other single-product
|
$ | 3.57 | $ | 3.67 | $ | 3.65 | $ | 3.69 | $ | 3.82 | ||||||||||||||||||||||
| Total digital-only ARPU | $ | 9.15 | $ | 9.04 | $ | 8.93 | $ | 8.87 | $ | 8.83 | ||||||||||||||||||||||
|
ARPU metrics are calculated by dividing the digital subscription revenue in the quarter by the average number of digital-only subscribers divided by the number of days in the quarter multiplied by 28 to reflect a 28-day billing cycle. In calculating ARPU metrics, for our subscriber categories (Bundle and multiproduct, News-only and Other single-product), we use the monthly average number of digital-only subscribers (calculated as the sum of the number of subscribers in each category at the beginning and end of the month, divided by two) and for Total digital-only ARPU, we use the daily average number of digital-only subscribers.
|
||||||||||||||||||||||||||||||||
27
The following charts illustrate ARPU and net additions metrics relating to our digital-only subscriber categories for the five most recent fiscal quarters:
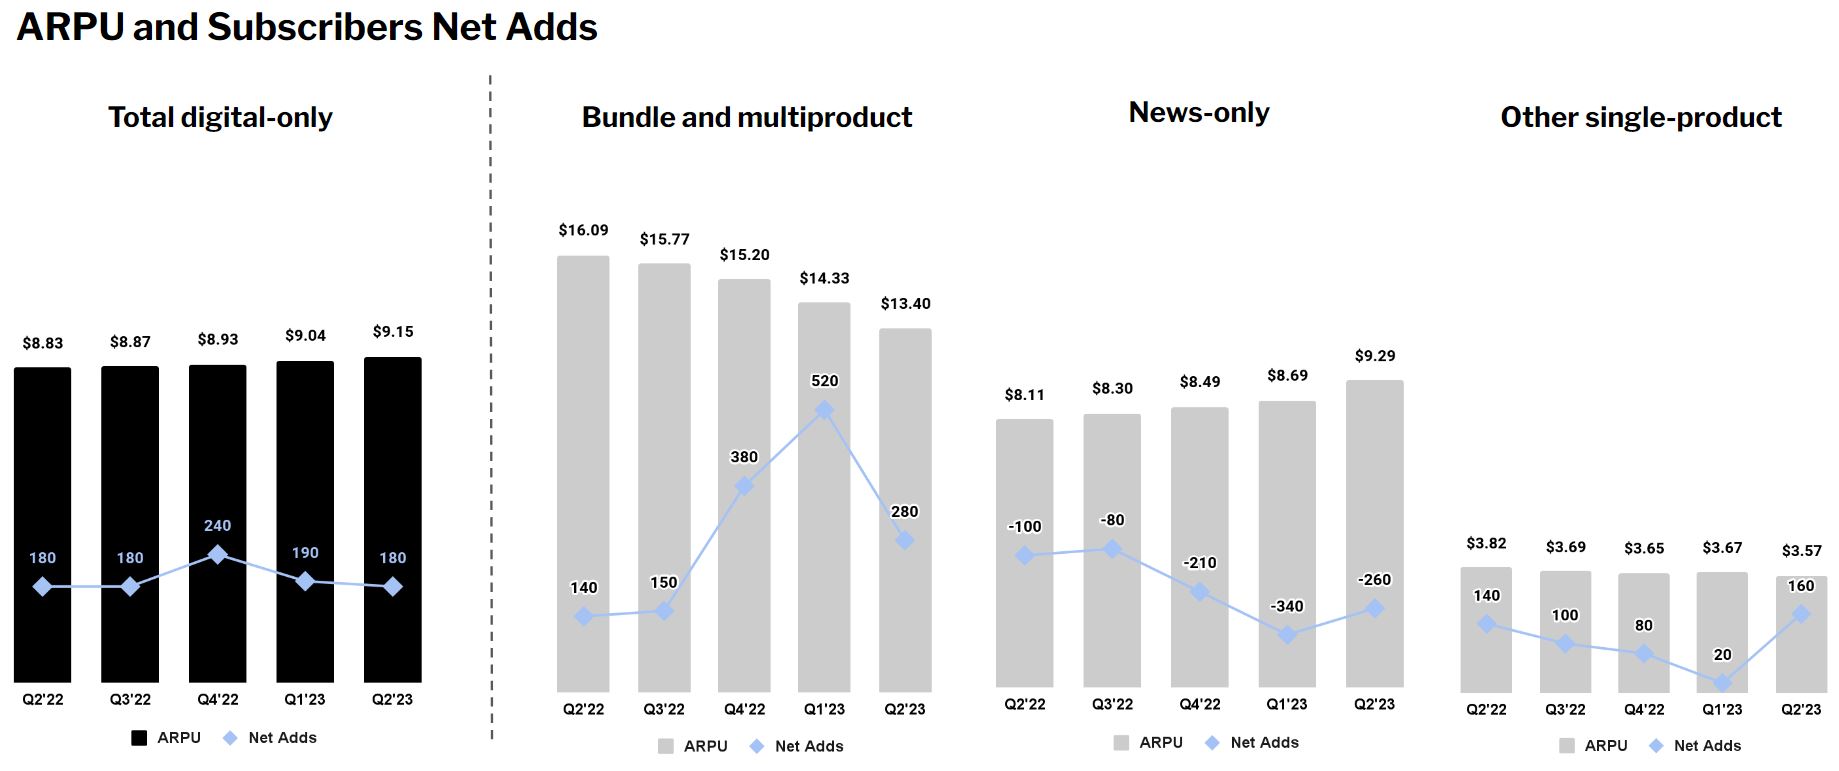
The sum of the subscriber categories net additions may not always equal total digital-only subscribers net additions due to rounding. Subscribers (including net subscriber additions) are rounded to the nearest ten thousand.
Total digital-only ARPU was $9.15 for the second quarter of 2023, an increase of 3.6 percent compared with the second quarter of 2022 and 1.2 percent compared with the first quarter of 2023. Both the year-over-year and quarter-over-quarter increases were driven primarily by the price increases on tenured non-bundle digital news and Games subscribers.
The following chart illustrates the growth in subscription revenues as well as the relative stability of our print domestic home-delivery subscription product.
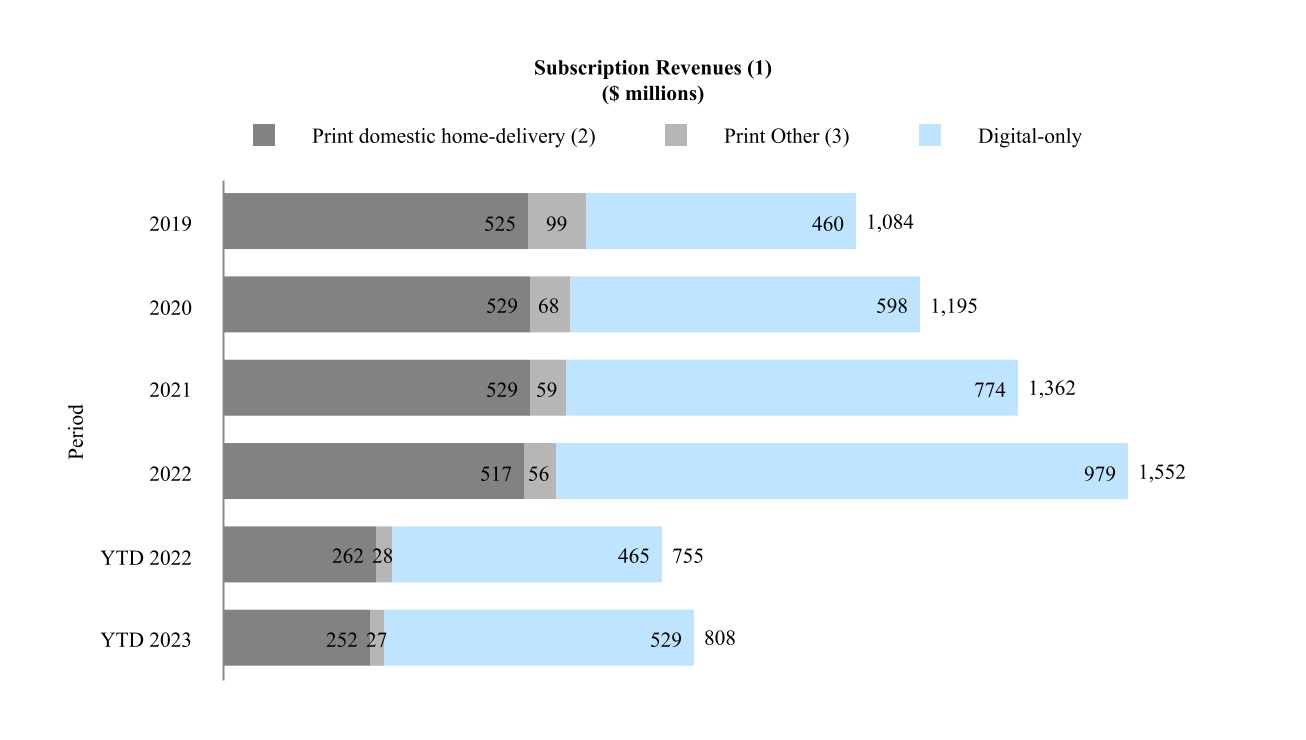
(1)
Amounts may not add due to rounding.
(2)
Includes access to our digital products.
(3)
Print Other includes single-copy, NYT International and other subscription revenues.
28
Advertising Revenues
Advertising revenue is principally from advertisers (such as technology, financial and luxury goods companies) promoting products, services or brands on digital platforms in the form of display ads, audio and video ads, and in print in the form of column-inch ads. Advertising revenue is primarily derived from offerings sold directly to marketers by our advertising sales teams. A smaller proportion of our total advertising revenues is generated through programmatic auctions run by third-party ad exchanges
.
Advertising revenue is primarily determined by the volume (e.g., impressions or column inches), rate and mix of advertisements. Digital advertising includes our core digital advertising business and other digital advertising. Our core digital advertising business includes direct-sold website, mobile application, podcast, email and video advertisements. Direct-sold display advertising, a component of core digital advertising, includes offerings on websites and mobile applications sold directly to marketers by our advertising sales teams. Other digital advertising includes open-market programmatic advertising and creative services fees. NYTG has revenue from all categories discussed above. The Athletic has revenue from direct-sold display advertising, podcast, video and email advertisements and open-market programmatic advertising. Print advertising includes revenue from column-inch ads and classified advertising, as well as preprinted advertising, also known as freestanding inserts. There is no print advertising revenue generated from The Athletic.
The following table summarizes digital and print advertising revenues for the second quarters and first six months of 2023 and 2022:
| For the Quarters Ended | For the Six Months Ended | |||||||||||||||||||||||||||||||||||||
| (In thousands) | June 30, 2023 | June 26, 2022 | % Change | June 30, 2023 | June 26, 2022 | % Change | ||||||||||||||||||||||||||||||||
| Advertising revenues: | ||||||||||||||||||||||||||||||||||||||
| Digital | $ | 73,804 | $ | 69,292 | 6.5 | % | $ | 135,075 | $ | 136,306 | (0.9) | % | ||||||||||||||||||||||||||
| 43,966 | 48,087 | (8.6) | % | 88,936 | 97,343 | (8.6) | % | |||||||||||||||||||||||||||||||
| Total advertising | $ | 117,770 | $ | 117,379 | 0.3 | % | $ | 224,011 | $ | 233,649 | (4.1) | % | ||||||||||||||||||||||||||
Digital advertising revenues, which represented 62.7% of total advertising revenues in the second quarter of 2023, increased $4.5 million, or 6.5%, to $73.8 million compared with $69.3 million in the same prior-year period. The increase was primarily a result of higher revenues from direct-sold advertising as well as higher open-market programmatic revenues, primarily driven by new offerings including on the desktop version of Wordle (a daily digital word game), partially offset by lower revenues from our podcasts and creative services. Core digital advertising revenue increased $2.9 million due to an increase in direct-sold display advertising, partially offset by a decrease in podcast advertising revenues. Direct-sold display impressions increased 33%, while the average rate decreased 7%. Other digital advertising revenue increased $1.6 million, primarily due to a 43.8% increase in open-market programmatic advertising revenue, partially offset by 34.9% decrease in creative services fees, primarily as a result of fewer advertising campaigns in 2023. Programmatic impressions increased 74%, while the average rate decreased 28%.
Digital advertising revenues, which represented 60.3% of the total advertising revenues in the first six months of 2023, decreased $1.2 million, or 0.9%, to $135.1 million compared with $136.3 million in the same prior-year period. The decrease was primarily a result of lower revenues from our podcasts and creative services, partially offset by the addition of digital advertising revenue from The Athletic. Core digital advertising revenue was flat compared with the prior year as a decrease in podcast advertising revenues was largely offset by an increase in direct-sold display advertising. Direct-sold display impressions increased 48%, while the average rate decreased 17%. Other digital advertising revenue decreased $1.4 million, primarily due to a 45.3% decrease in creative services fees, primarily as a result of fewer advertising campaigns in 2023, partially offset by 20.7% increase in open-market programmatic advertising revenue. Programmatic impressions increased 45%, while the average rate decreased 25%.
Print advertising revenues, which represented 37.3% of total advertising revenues in the second quarter of 2023, decreased $4.1 million, or 8.6%, to $44.0 million compared with $48.1 million in the same prior-year period. The decrease in the second quarter of 2023 was primarily in the entertainment, finance, healthcare and advocacy categories, partially offset by growth in the luxury category. Print advertising revenues, which represented 39.7% of total advertising revenues in the first six months of 2023, decreased $8.4 million, or 8.6%, to $88.9 million compared with $97.3 million in the same prior-year period. The decrease in the first six months of 2023 was primarily in the media, finance, advocacy, and entertainment categories, partially offset by growth in the luxury category. Print advertising revenue in both the second quarter and the first six months of 2023 was impacted by secular trends.
In addition, we believe the macroeconomic environment has had and may continue to have an adverse impact on both digital and print advertising spend.
29
Other Revenues
Other revenues primarily consist of revenues from licensing, Wirecutter affiliate referrals, commercial printing, the leasing of floors in the Company Headquarters, television and film, retail commerce, our live events business and our student subscription sponsorship program. Digital other revenues, which consist primarily of Wirecutter affiliate referral revenue, digital licensing revenue and our student subscription sponsorship program, totaled $38.0 million and $27.2 million in the second quarters of 2023 and 2022, respectively, and $64.1 million and $53.0 million in the first six months of 2023 and 2022, respectively. Building rental revenue from the leasing of floors in the Company Headquarters totaled $6.5 million and $7.2 million in the second quarters of 2023 and 2022, respectively, and $13.7 million and $14.3 million in the first six months of 2023 and 2022, respectively.
Other revenues increased 16.1% in the second quarter of 2023 compared with the same prior-year period, primarily as a result of higher Wirecutter affiliate referral revenues, content licensing revenues related to a Google commercial agreement and television and film revenues.
Other revenues increased 16.0% in the first six months of 2023 compared with the same prior-year period, primarily as a result of higher revenues from television and film, Wirecutter affiliate referral revenues and content licensing revenues related to a Google commercial agreement.
Operating Costs
Operating costs were as follows:
| For the Quarters Ended | For the Six Months Ended | |||||||||||||||||||||||||||||||||||||
| (In thousands) | June 30, 2023 | June 26, 2022 | % Change | June 30, 2023 | June 26, 2022 | % Change | ||||||||||||||||||||||||||||||||
| Operating costs: | ||||||||||||||||||||||||||||||||||||||
|
Cost of revenue (excluding depreciation and amortization)
(1)
|
$ | 309,923 | $ | 300,583 | 3.1 | % | $ | 616,775 | $ | 581,948 | 6.0 | % | ||||||||||||||||||||||||||
| Sales and marketing | 62,241 | 62,769 | (0.8) | % | 129,275 | 140,357 | (7.9) | % | ||||||||||||||||||||||||||||||
|
Product development
(1)
|
56,047 | 50,822 | 10.3 | % | 113,109 | 98,255 | 15.1 | % | ||||||||||||||||||||||||||||||
|
General and administrative
(1)
|
72,273 | 69,141 | 4.5 | % | 153,324 | 140,498 | 9.1 | % | ||||||||||||||||||||||||||||||
| Depreciation and amortization | 21,858 | 20,704 | 5.6 | % | 42,698 | 39,390 | 8.4 | % | ||||||||||||||||||||||||||||||
| Total operating costs | $ | 522,342 | $ | 504,019 | 3.6 | % | $ | 1,055,181 | $ | 1,000,448 | 5.5 | % | ||||||||||||||||||||||||||
|
(1)
Technology costs, which include product development costs and certain components of cost of revenue and general and administrative costs as described below, increased 9.4% to $101.3 million compared with $92.6 million in the second quarter of 2022 and increased 14.0% to $205.7 million compared with $180.5 million in the first six months of 2022.
|
||||||||||||||||||||||||||||||||||||||
30
Cost of Revenue (excluding depreciation and amortization)
Cost of revenue includes all costs related to content creation, subscriber and advertiser servicing, and print production and distribution as well as infrastructure costs related to delivering digital content, which include all cloud and cloud-related costs as well as compensation for employees that enhance and maintain that infrastructure.
Cost of revenue in the second quarter of 2023 increased $9.3 million, or 3.1%, compared with the same prior-year period. The increase was largely due to higher journalism costs of $11.1 million and higher digital content delivery costs of $2.4 million, partially offset by lower advertising servicing costs of $3.6 million and lower print production and distribution costs of $0.6 million. Subscriber servicing costs were flat to prior year. The increase in journalism costs was largely due to growth in the number of employees who work in our newsrooms and higher compensation expense. The increase in digital content delivery costs was primarily due to an increase in the number of employees. Advertising servicing costs decreased primarily due to fewer live events in 2023, and a decrease in the number of employees. The decrease in print production and distribution costs was primarily due to lower paper consumption. Technology costs in cost of revenue, which include costs related to content delivery and subscriber technology, increased 11.2% to $28.6 million compared with $25.8 million in the same prior-year period, primarily due to growth in the number of employees associated with digital content delivery and higher compensation expense.
Cost of revenue in the first six months of 2023 increased $34.8 million, or 6.0%, compared with the same prior-year period. The increase was largely due to higher journalism costs of $31.5 million, higher digital content delivery costs of $6.3 million, higher subscriber servicing costs of $2.5 million, higher print production and distribution costs of $0.7 million, partially offset by lower advertising servicing costs of $6.2 million. The increase in journalism costs was largely due to growth in the number of employees who work in our newsrooms and higher content creation costs as a result of additional television episodes in 2023. The increase in digital content delivery costs was primarily due to an increase in the number of employees and higher cloud-related costs. The increase in subscriber servicing costs was largely due to an increase in the number of employees and higher credit card processing fees and third-party commissions due to increased subscriptions. The increase in print production and distribution costs was primarily due to an increase in newsprint pricing, partially offset by lower distribution costs. Advertising servicing costs decreased primarily due to a decrease in the number of employees and fewer live events in 2023. Technology costs in Cost of revenue, which include costs related to content delivery and subscriber technology, increased 14.8% to $57.7 million compared with $50.2 million in the same prior-year period, primarily due to growth in the number of employees associated with digital content delivery and increases in cloud-related costs.
Sales and Marketing
Sales and marketing includes costs related to the Company’s subscription and brand marketing efforts as well as advertising sales costs.
Sales and marketing costs in the second quarter of 2023 decreased $0.5 million, or 0.8%, compared with the same prior-year period. The decrease was primarily due to lower media expenses at NYTG, partially offset by higher sales and marketing expenses at The Athletic largely driven by the timing of introducing The Athletic into the bundle.
Sales and marketing costs in the first six months of 2023 decreased $11.1 million, or 7.9%, compared with the same prior-year period. The decrease was largely due to factors identified above.
Media expenses, a component of sales and marketing costs that represents the cost to promote our subscription business, decreased
9.5%
to $28.0 million in the second quarter of 2023 from $30.9 million in the second quarter of 2022, and decreased 22.6% to $59.8 million in the first six months of 2023 from $77.3 million in the first six months of 2022. The decreases in both periods were largely a result of lower subscriber acquisition spend at NYTG, partially offset by higher brand marketing expenses at The Athletic.
Product Development
Product development includes costs associated with the Company’s investment in developing and enhancing new and existing product technology, including engineering, product development and data insights. All product development costs are technology costs.
Product development costs in the second quarter of 2023 increased $5.2 million, or 10.3%, compared with the same prior-year period. The increase was largely due to growth in the number of digital product development employees in connection with digital subscription strategic initiatives.
Product development costs in the first six months of 2023 increased $14.9 million, or 15.1%, compared with the same prior-year period. The increase was largely due to factors identified above.
31
General and Administrative Costs
General and administrative costs include general management, corporate enterprise technology, building operations, unallocated overhead costs, severance and multiemployer pension plan withdrawal costs.
General and administrative costs in the second quarter of 2023 increased $3.1 million, or 4.5%, compared with the same prior-year period. The increase was primarily due to stock price appreciation on stock-based awards and higher compensation and benefits expenses, partially offset by lower severance expense. Technology costs in general and administrative, which include costs related to enterprise technology and information security, increased 3.9% to $16.6 million compared with $16.0 million in the same prior-year period, primarily due to growth in the number of employees.
General and administrative costs in the first six months of 2023 increased $12.8 million, or 9.1%, compared with the same prior-year period. The increase was primarily due to higher compensation and benefits expenses, stock price appreciation on stock-based awards as well as higher severance expense, primarily in the general and administrative functions, which was partially offset by lower severance expense related to our commercial printing operations in the first six months of 2022. Technology costs in general and administrative, which include costs related to enterprise technology and information security, increased 9.2% to $34.9 million compared with $32.0 million in the same prior-year period, primarily due to growth in the number of employees.
Depreciation and Amortization
Depreciation and amortization costs in the second quarter of 2023 increased $1.2 million, or 5.6%, compared with the same prior-year period. The increase was due to assets placed in service in connection with the improvements in our Company Headquarters in 2022.
Depreciation and amortization costs in the first six months of 2023 increased $3.3 million, or 8.4%, compared with the same prior-year period. The increase was due to the impact from the additional month of The Athletic costs in 2023, as well as assets placed in service in connection with the improvements in our Company Headquarters in 2022.
32
Segment Information
Since the acquisition of The Athletic in the first quarter of 2022, we have had two reportable segments: NYTG and The Athletic. Management uses adjusted operating profit (loss) by segment in assessing performance and allocating resources. The Company includes in its presentation revenues and adjusted operating costs to arrive at adjusted operating profit (loss) by segment. Adjusted operating costs are defined as operating costs before depreciation and amortization, severance and multiemployer pension plan withdrawal costs. Adjusted operating profit is defined as operating profit before depreciation and amortization, severance, multiemployer pension plan withdrawal costs and special items. Adjusted operating profit expressed as a percentage of revenues is referred to as adjusted operating profit margin.
Subscription revenue from and expenses associated with our bundle are allocated to NYTG and The Athletic. The Athletic was first introduced into our bundle in June 2022. Therefore, The Athletic’s results for the second quarter of 2022 include bundle revenue and expenses for only part of the quarter, whereas the second quarter of 2023 includes bundle revenue and expenses for the entire quarter.
Prior to April 1, 2023, we allocated bundle revenue first to our digital news product based on its standalone list price and then the remaining bundle revenue was allocated to the other products in the bundle, including The Athletic, based on their relative standalone list prices. Starting April 1, 2023, we allocate 10% of bundle revenue to The Athletic based on management’s view of The Athletic’s relative value to the bundle, which is derived based on analysis of various metrics, and allocate the remaining bundle revenues to NYTG.
Prior to April 1, 2023, we allocated to NYTG and The Athletic direct variable expenses associated with the bundle, which include credit card fees, third party fees and sales taxes, based on a historical actual percentage of these costs to bundle revenue. Starting April 1, 2023, we allocate 10% of product development, marketing and subscriber servicing expenses (including the direct variable expenses referenced above) associated with the bundle to The Athletic, and the remaining costs are allocated to NYTG, in each case, in line with the revenues allocations.
For comparison purposes, the Company has recast segment results for the quarters following the second quarter of 2022 to reflect the updated allocation methodology. The second quarter of 2022 was not recast as the change was de minimis for that quarter in light of the timing of the introduction of The Athletic to the bundle.
The results of The Athletic have been included in our Condensed Consolidated Financial Statements beginning February 1, 2022, the date of the acquisition. Results for the first six months of 2022 included The Athletic for approximately five months, while results for the first six months of 2023 included the Athletic for the full six months.
| For the Quarters Ended | For the Six Months Ended | |||||||||||||||||||||||||||||||||||||
| (In thousands) | June 30, 2023 | June 26, 2022 | % Change | June 30, 2023 | June 26, 2022 | % Change | ||||||||||||||||||||||||||||||||
| Revenues | ||||||||||||||||||||||||||||||||||||||
| NYTG | $ | 560,494 | $ | 536,134 | 4.5 | % | $ | 1,093,276 | $ | 1,061,402 | 3.0 | % | ||||||||||||||||||||||||||
| The Athletic | 30,359 | 19,546 | 55.3 | % | 58,316 | 31,703 | 83.9 | % | ||||||||||||||||||||||||||||||
| Total revenues | $ | 590,853 | $ | 555,680 | 6.3 | % | $ | 1,151,592 | $ | 1,093,105 | 5.4 | % | ||||||||||||||||||||||||||
| Adjusted operating costs | ||||||||||||||||||||||||||||||||||||||
| NYTG | $ | 460,525 | $ | 447,316 | 3.0 | % | $ | 928,020 | $ | 904,860 | 2.6 | % | ||||||||||||||||||||||||||
| The Athletic | 38,162 | 32,145 | 18.7 | % | 77,431 | 51,123 | 51.5 | % | ||||||||||||||||||||||||||||||
| Total adjusted operating costs | $ | 498,687 | $ | 479,461 | 4.0 | % | $ | 1,005,451 | $ | 955,983 | 5.2 | % | ||||||||||||||||||||||||||
| Adjusted operating profit (loss) | ||||||||||||||||||||||||||||||||||||||
| NYTG | $ | 99,969 | $ | 88,818 | 12.6 | % | $ | 165,256 | $ | 156,542 | 5.6 | % | ||||||||||||||||||||||||||
| The Athletic | (7,803) | (12,599) | (38.1) | % | (19,115) | (19,420) | (1.6) | % | ||||||||||||||||||||||||||||||
| Total adjusted operating profit | $ | 92,166 | $ | 76,219 | 20.9 | % | $ | 146,141 | $ | 137,122 | 6.6 | % | ||||||||||||||||||||||||||
| Adjusted operating profit margin % - NYTG | 17.8 | % | 16.6 | % | 120 bps | 15.1 | % | 14.7 | % | 40 bps | ||||||||||||||||||||||||||||
| * Represents a change equal to or in excess of 100% or not meaningful. | ||||||||||||||||||||||||||||||||||||||
33
| Revenues detail by segment | ||||||||||||||||||||||||||||||||||||||
| For the Quarters Ended | For the Six Months Ended | |||||||||||||||||||||||||||||||||||||
| (In thousands) | June 30, 2023 | June 26, 2022 | % Change | June 30, 2023 | June 26, 2022 | % Change | ||||||||||||||||||||||||||||||||
| NYTG | ||||||||||||||||||||||||||||||||||||||
| Subscription | $ | 385,037 | $ | 366,620 | 5.0 | % | $ | 759,193 | $ | 728,222 | 4.3 | % | ||||||||||||||||||||||||||
| Advertising | 112,329 | 114,832 | (2.2) | % | 214,419 | 229,322 | (6.5) | % | ||||||||||||||||||||||||||||||
| Other | 63,128 | 54,682 | 15.4 | % | 119,664 | 103,858 | 15.2 | % | ||||||||||||||||||||||||||||||
| Total | $ | 560,494 | $ | 536,134 | 4.5 | % | $ | 1,093,276 | $ | 1,061,402 | 3.0 | % | ||||||||||||||||||||||||||
| The Athletic | ||||||||||||||||||||||||||||||||||||||
| Subscription | $ | 24,553 | $ | 16,999 | 44.4 | % | $ | 47,939 | $ | 27,376 | 75.1 | % | ||||||||||||||||||||||||||
| Advertising | 5,441 | 2,547 | * | 9,592 | 4,327 | * | ||||||||||||||||||||||||||||||||
| Other | 365 | — | * | 785 | — | * | ||||||||||||||||||||||||||||||||
| Total | $ | 30,359 | $ | 19,546 | 55.3 | % | $ | 58,316 | $ | 31,703 | 83.9 | % | ||||||||||||||||||||||||||
| NYTG | ||||||||||||||||||||||||||||||||||||||
| Subscription | $ | 409,590 | $ | 383,619 | 6.8 | % | $ | 807,132 | $ | 755,598 | 6.8 | % | ||||||||||||||||||||||||||
| Advertising | 117,770 | 117,379 | 0.3 | % | 224,011 | 233,649 | (4.1) | % | ||||||||||||||||||||||||||||||
| Other | 63,493 | 54,682 | 16.1 | % | 120,449 | 103,858 | 16.0 | % | ||||||||||||||||||||||||||||||
| Total | $ | 590,853 | $ | 555,680 | 6.3 | % | $ | 1,151,592 | $ | 1,093,105 | 5.4 | % | ||||||||||||||||||||||||||
| * Represents a change equal to or in excess of 100% or not meaningful. | ||||||||||||||||||||||||||||||||||||||
34
| Adjusted operating costs (operating costs before depreciation and amortization, severance and multiemployer pension plan withdrawal costs) details by segment | ||||||||||||||||||||||||||||||||||||||
| For the Quarters Ended | For the Six Months Ended | |||||||||||||||||||||||||||||||||||||
| (In thousands) | June 30, 2023 | June 26, 2022 | % Change | June 30, 2023 | June 26, 2022 | % Change | ||||||||||||||||||||||||||||||||
| NYTG | ||||||||||||||||||||||||||||||||||||||
| Cost of revenue (excluding depreciation and amortization) | $ | 287,789 | $ | 279,985 | 2.8 | % | $ | 572,112 | $ | 549,460 | 4.1 | % | ||||||||||||||||||||||||||
| Sales and marketing | 54,247 | 58,183 | (6.8) | % | 113,179 | 132,643 | (14.7) | % | ||||||||||||||||||||||||||||||
| Product development | 50,049 | 46,773 | 7.0 | % | 100,880 | 91,952 | 9.7 | % | ||||||||||||||||||||||||||||||
|
Adjusted general and administrative
(1)
|
68,440 | 62,375 | 9.7 | % | 141,849 | 130,805 | 8.4 | % | ||||||||||||||||||||||||||||||
| Total | $ | 460,525 | $ | 447,316 | 3.0 | % | $ | 928,020 | $ | 904,860 | 2.6 | % | ||||||||||||||||||||||||||
| The Athletic | ||||||||||||||||||||||||||||||||||||||
| Cost of revenue (excluding depreciation and amortization) | $ | 22,134 | $ | 20,598 | 7.5 | % | $ | 44,663 | $ | 32,488 | 37.5 | % | ||||||||||||||||||||||||||
| Sales and marketing | 7,994 | 4,586 | 74.3 | % | 16,096 | 7,714 | * | |||||||||||||||||||||||||||||||
| Product development | 5,998 | 4,049 | 48.1 | % | 12,229 | 6,303 | 94.0 | % | ||||||||||||||||||||||||||||||
|
Adjusted general and administrative
(2)
|
2,036 | 2,912 | (30.1) | % | 4,443 | 4,618 | (3.8) | % | ||||||||||||||||||||||||||||||
| Total | $ | 38,162 | $ | 32,145 | 18.7 | % | $ | 77,431 | $ | 51,123 | 51.5 | % | ||||||||||||||||||||||||||
| The New York Times Company | ||||||||||||||||||||||||||||||||||||||
| Cost of revenue (excluding depreciation and amortization) | $ | 309,923 | $ | 300,583 | 3.1 | % | $ | 616,775 | $ | 581,948 | 6.0 | % | ||||||||||||||||||||||||||
| Sales and marketing | 62,241 | 62,769 | (0.8) | % | 129,275 | 140,357 | (7.9) | % | ||||||||||||||||||||||||||||||
| Product development | 56,047 | 50,822 | 10.3 | % | 113,109 | 98,255 | 15.1 | % | ||||||||||||||||||||||||||||||
|
Adjusted general and administrative
(1)
|
70,476 | 65,287 | 7.9 | % | 146,292 | 135,423 | 8.0 | % | ||||||||||||||||||||||||||||||
| Total | $ | 498,687 | $ | 479,461 | 4.0 | % | $ | 1,005,451 | $ | 955,983 | 5.2 | % | ||||||||||||||||||||||||||
|
(1)
Excludes severance of $3.3 million for the first six months of 2023. There were no severance costs for the second quarter of 2023. Excludes multiemployer pension withdrawal costs of $1.1 million and $2.5 million for the second quarter and first six months of 2023, respectively. Excludes severance of $2.5 million for the second quarter and first six months of 2022, and multiemployer pension withdrawal costs of $1.2 million and $2.4 million for the second quarter and first six months of 2022, respectively.
|
||||||||||||||||||||||||||||||||||||||
|
(2)
Excludes severance of $0.7 million and $1.2 million for the second quarter and first six months of 2023, respectively. Excludes severance of $0.2 million for the second quarter and first six months of 2022.
|
||||||||||||||||||||||||||||||||||||||
| * Represents a change equal to or in excess of 100% or not meaningful. | ||||||||||||||||||||||||||||||||||||||
35
| Segment Results Recast | ||||||||||||||||||||
| (In thousands) | First Quarter 2023 Recast | Fourth Quarter 2022 Recast | Third Quarter 2022 Recast | |||||||||||||||||
| NYTG | ||||||||||||||||||||
| Subscription | $ | 374,156 | $ | 390,585 | $ | 361,488 | ||||||||||||||
| Advertising | 102,090 | 173,865 | 108,134 | |||||||||||||||||
| Other | 56,536 | 73,763 | 54,439 | |||||||||||||||||
| Total revenues | 532,782 | 638,213 | 524,061 | |||||||||||||||||
| Cost of revenue (excluding depreciation and amortization) | 284,323 | 310,586 | 274,506 | |||||||||||||||||
| Sales and marketing | 58,932 | 53,187 | 56,503 | |||||||||||||||||
| Product development | 50,832 | 49,936 | 45,546 | |||||||||||||||||
| Adjusted general and administrative | 73,408 | 73,028 | 66,476 | |||||||||||||||||
| Total adjusted operating costs | $ | 467,495 | $ | 486,737 | $ | 443,031 | ||||||||||||||
| Adjusted operating profit | $ | 65,287 | $ | 151,476 | $ | 81,030 | ||||||||||||||
| The Athletic | ||||||||||||||||||||
| Subscription | $ | 23,386 | $ | 23,507 | $ | 21,184 | ||||||||||||||
| Advertising | 4,151 | 5,307 | 2,333 | |||||||||||||||||
| Other | 420 | 509 | 102 | |||||||||||||||||
| Total revenues | 27,957 | 29,323 | 23,619 | |||||||||||||||||
| Cost of revenue (excluding depreciation and amortization) | 22,529 | 21,543 | 20,350 | |||||||||||||||||
| Sales and marketing | 8,102 | 9,277 | 8,229 | |||||||||||||||||
| Product development | 6,230 | 5,520 | 4,928 | |||||||||||||||||
| Adjusted general and administrative | 2,408 | 2,627 | 2,165 | |||||||||||||||||
| Total adjusted operating costs | $ | 39,269 | $ | 38,967 | $ | 35,672 | ||||||||||||||
| Adjusted operating loss | $ | (11,312) | $ | (9,644) | $ | (12,053) | ||||||||||||||
| The New York Times Company | ||||||||||||||||||||
| Subscription | $ | 397,542 | $ | 414,092 | $ | 382,672 | ||||||||||||||
| Advertising | 106,241 | 179,172 | 110,467 | |||||||||||||||||
| Other | 56,956 | 74,272 | 54,541 | |||||||||||||||||
| Total revenues | 560,739 | 667,536 | 547,680 | |||||||||||||||||
| Cost of revenue (excluding depreciation and amortization) | 306,852 | 332,129 | 294,856 | |||||||||||||||||
| Sales and marketing | 67,034 | 62,464 | 64,732 | |||||||||||||||||
| Product development | 57,062 | 55,456 | 50,474 | |||||||||||||||||
| Adjusted general and administrative | 75,816 | 75,655 | 68,641 | |||||||||||||||||
| Total adjusted operating costs | $ | 506,764 | $ | 525,704 | $ | 478,703 | ||||||||||||||
| Adjusted operating profit | $ | 53,975 | $ | 141,832 | $ | 68,977 | ||||||||||||||
36
The New York Times Group
NYTG revenues increased 4.5% in the second quarter of 2023 to $560.5 million from $536.1 million in the second quarter of 2022 and increased 3.0% in the first six months of 2023 to $1,093 million from $1,061 million in the first six months of 2022. Subscription revenues increased 5.0% to $385.0 million from $366.6 million in the second quarter of 2022 and increased 4.3% in the first six months of 2023 to $759.2 million from $728.2 million in the first six months of 2022 due to growth in subscription revenues from digital-only products, partially offset by decreases in print subscription revenues. Advertising revenues decreased 2.2% to $112.3 million from $114.8 million in the second quarter of 2022 due to lower print advertising revenues, primarily in the entertainment, finance, healthcare and advocacy categories, partially offset by growth in the luxury category. The decrease in print advertising revenues was partially offset by higher digital advertising revenues due to higher revenues from programmatic and direct-sold display advertising, partially offset by lower revenues from creative services and podcasts. Advertising revenues decreased 6.5% to $214.4 million from $229.3 million in the first six months of 2022 due to lower digital advertising revenues, primarily a result of lower revenues from podcasts and creative services, which were partially offset by higher programmatic and direct-sold display advertising, and lower print advertising revenues, primarily in the media, finance, advocacy and entertainment categories, partially offset by growth in the luxury category. Print advertising revenue was impacted by secular trends. In addition, we believe the macroeconomic environment adversely impacted both digital and print advertising spend.
NYTG adjusted operating costs increased 3.0% in the second quarter of 2023 to $460.5 million from $447.3 million in the second quarter of 2022 and increased 2.6% in the first six months of 2023 to $928.0 million from $904.9 million in the first six months of 2022. The increase in costs in both periods was primarily related to growth in the numbers of employees who work in the newsroom as well as higher general and administrative and product development costs, partially offset by lower sales and marketing costs.
NYTG adjusted operating profit increased 12.6% in the second quarter of 2023 to $100.0 million from $88.8 million in the second quarter of 2022 and increased 5.6% in the first six months of 2023 to $165.3 million from $156.5 million in the first six months of 2022 primarily as a result of higher digital subscription and other revenues, partially offset by higher adjusted operating costs and lower advertising revenues.
The Athletic
The results of The Athletic have been included in our Condensed Consolidated Financial Statements beginning February 1, 2022, the date of the acquisition. Results for the first six months of 2022 included The Athletic for approximately five months, while results for the first six months of 2023 included the Athletic for the full six months.
The Athletic revenues increased 55.3% in the second quarter of 2023 to $30.4 million from $19.5 million in the second quarter of 2022 and increased 83.9% in the first six months of 2023 to $58.3 million from $31.7 million in the first six months of 2022. Subscription revenues increased 44.4% to $24.6 million from $17.0 million in the second quarter of 2022 and increased 75.1% in the first six months of 2023 to $47.9 million from $27.4 million in the first six months of 2022, primarily due to the impact of the additional months of bundle-related revenues in 2023, as well as growth in digital-only subscribers with The Athletic. Advertising revenues increased to $5.4 million from $2.5 million in the second quarter of 2022 and increased in the first six months of 2023 to $9.6 million from $4.3 million in the first six months of 2022, primarily due to the launch of display advertising in the third quarter of 2022.
The Athletic adjusted operating costs increased 18.7% in the second quarter of 2023 to $38.2 million from $32.1 million in the second quarter of 2022 and increased 51.5% in the first six months of 2023 to $77.4 million from $51.1 million in the first six months of 2022. The increase in costs in the second quarter of 2023 was primarily due to higher sales and marketing costs, product development costs, and digital content delivery costs, all of which were largely driven by the impact of the additional months of bundle-related costs in 2023, partially offset by lower general and administrative expenses. The increase in costs in the first six months of 2023 was primarily due to higher journalism costs, sales and marketing costs, product development costs, and digital content delivery costs, partially offset by lower general and administrative expenses.
The Athletic adjusted operating loss decreased 38.1% to $7.8 million in the second quarter of 2023 from $12.6 million in the second quarter of 2022 and decreased 1.6% to $19.1 million in the first six months of 2023 from $19.4 million in the first six months of 2022, primarily as a result of higher digital subscription and advertising revenues partially offset by higher adjusted operating costs.
NON-OPERATING ITEMS
Other Components of Net Periodic Benefit (Income)/Costs
See Note 9 of the Notes to the Condensed Consolidated Financial Statements for information regarding other components of net periodic benefit (income)/costs.
37
Interest Income and other, net
See Note 7 of the Notes to the Condensed Consolidated Financial Statements for information regarding interest income and other, net.
Income Taxes
See Note 10 of the Notes to the Condensed Consolidated Financial Statements for information regarding income taxes.
NON-GAAP FINANCIAL MEASURES
We have included in this report certain supplemental financial information derived from consolidated financial information but not presented in our financial statements prepared in accordance with GAAP. Specifically, we have referred to the following non-GAAP financial measures in this report:
•
diluted earnings per share excluding severance, non-operating retirement costs and the impact of special items (or adjusted diluted earnings per share);
•
operating profit before depreciation, amortization, severance, multiemployer pension plan withdrawal costs and special items (or adjusted operating profit), and expressed as a percentage of revenues, adjusted operating profit margin;
•
operating costs before depreciation, amortization, severance and multiemployer pension plan withdrawal costs (or adjusted operating costs); and
•
free cash flow (defined as net cash provided by operating activities less capital expenditures).
The special items in 2023 consisted of:
•
a $12.7 million lease-related impairment charge ($9.3 million or $0.06 per share after tax) in the second quarter.
The special items in 2022 consisted of:
•
a $34.2 million gain ($24.9 million or $0.15 per share after tax) in the second quarter related to College Point parcel sale. The gain is included in Interest income and other, net in our Condensed Consolidated Statements of Operations.
•
a $34.7 million pre-tax charge ($25.4 million or $0.15 per share after tax) in the first quarter related to the acquisition of The Athletic. Acquisition-related costs primarily include expenses paid in connection with the acceleration of The Athletic stock options, and legal, accounting, financial advisory and integration planning expenses.
We have included these non-GAAP financial measures because management reviews them on a regular basis and uses them to evaluate and manage the performance of our operations. We believe that, for the reasons outlined below, these non-GAAP financial measures provide useful information to investors as a supplement to reported diluted earnings/(loss) per share, operating profit/(loss) and operating costs. However, these measures should be evaluated only in conjunction with the comparable GAAP financial measures and should not be viewed as alternative or superior measures of GAAP results.
Adjusted diluted earnings per share provides useful information in evaluating the Company’s period-to-period performance because it eliminates items that the Company does not consider to be indicative of earnings from ongoing operating activities. Adjusted operating profit and adjusted operating profit margin are useful in evaluating the ongoing performance of the Company’s businesses as they exclude the significant non-cash impact of depreciation and amortization as well as items not indicative of ongoing operating activities. Total operating costs include depreciation, amortization, severance and multiemployer pension plan withdrawal costs. Total operating costs, excluding these items, provides investors with helpful supplemental information on the Company’s underlying operating costs that is used by management in its financial and operational decision-making.
Management considers special items, which may include impairment charges, pension settlement charges, acquisition-related costs and other items that arise from time to time, to be outside the ordinary course of our operations. Management believes that excluding these items provides a better understanding of the underlying trends in the Company’s operating performance and allows more accurate comparisons of the Company’s operating results to historical performance. In addition, management excludes severance costs, which may fluctuate significantly from quarter to quarter, because it believes these costs do not necessarily reflect expected future operating costs and do not contribute to a meaningful comparison of the Company’s operating results to historical performance.
Excluded from our non-GAAP financial measures are non-operating retirement costs which are primarily tied to financial market performance and changes in market interest rates and investment performance. Management considers non-operating retirement costs to be outside the performance of the business and believes that presenting adjusted diluted earnings per share excluding non-operating retirement costs and presenting adjusted operating results excluding multiemployer pension plan withdrawal costs, in addition to the Company’s GAAP diluted earnings per share and GAAP operating results, provide increased transparency and a better understanding of the underlying trends in the Company’s operating business performance.
38
The Company considers free cash flow, which is defined as net cash provided by operating activities less capital expenditures, to provide useful information to management and investors about the amount of cash that is available to be used to strengthen the Company’s balance sheet and for strategic opportunities including, among others, investing in the Company’s business, strategic acquisitions, dividend payouts and repurchasing stock. See “Liquidity and Capital Resources — Free Cash Flow” below for more information and a reconciliation of free cash flow to net cash provided by operating activities.
Reconciliations of these non-GAAP financial measures to the most directly comparable GAAP measures are set out in the tables below.
| Reconciliation of diluted earnings per share excluding severance, non-operating retirement costs and special items (or adjusted diluted earnings per share) | ||||||||||||||||||||||||||||||||||||||
| For the Quarters Ended | For the Six Months Ended | |||||||||||||||||||||||||||||||||||||
| June 30, 2023 | June 26, 2022 | % Change | June 30, 2023 | June 26, 2022 | % Change | |||||||||||||||||||||||||||||||||
| Diluted earnings per share | $ | 0.28 | $ | 0.37 | (24.3) | % | $ | 0.42 | $ | 0.40 | 5.0 | % | ||||||||||||||||||||||||||
| Add: | ||||||||||||||||||||||||||||||||||||||
| Amortization of acquired intangible assets | 0.04 | 0.04 | — | 0.09 | 0.07 | 28.6 | % | |||||||||||||||||||||||||||||||
| Severance | — | 0.02 | * | 0.03 | 0.02 | 50.0 | % | |||||||||||||||||||||||||||||||
| Non-operating retirement costs: | ||||||||||||||||||||||||||||||||||||||
| Multiemployer pension plan withdrawal costs | 0.01 | 0.01 | — | 0.02 | 0.01 | 100.0 | % | |||||||||||||||||||||||||||||||
| Other components of net periodic benefit costs/(income) | — | 0.01 | * | (0.01) | 0.02 | * | ||||||||||||||||||||||||||||||||
| Special items: | ||||||||||||||||||||||||||||||||||||||
| Acquisition-related costs | — | — | — | — | 0.21 | * | ||||||||||||||||||||||||||||||||
| Lease-related impairment charge | 0.08 | — | * | 0.08 | — | * | ||||||||||||||||||||||||||||||||
| Gain on the sale of land | — | (0.20) | * | — | (0.20) | * | ||||||||||||||||||||||||||||||||
| Income tax expense of adjustments | (0.03) | 0.03 | * | (0.05) | (0.03) | 66.7 | % | |||||||||||||||||||||||||||||||
|
Adjusted diluted earnings per share
(1)
|
$ | 0.38 | $ | 0.28 | 35.7 | % | $ | 0.56 | $ | 0.49 | 14.3 | % | ||||||||||||||||||||||||||
(1)
Amounts may not add due to rounding.
* Represents a change equal to or in excess of 100% or not meaningful.
39
| Reconciliation of operating profit before depreciation and amortization, severance, multiemployer pension plan withdrawal costs and special items (or adjusted operating profit) | ||||||||||||||||||||||||||||||||||||||
| For the Quarters Ended | For the Six Months Ended | |||||||||||||||||||||||||||||||||||||
| (In thousands) | June 30, 2023 | June 26, 2022 | % Change | June 30, 2023 | June 26, 2022 | % Change | ||||||||||||||||||||||||||||||||
| Operating profit | $ | 55,775 | $ | 51,661 | 8.0 | % | $ | 83,675 | $ | 57,945 | 44.4 | % | ||||||||||||||||||||||||||
| Add: | ||||||||||||||||||||||||||||||||||||||
| Depreciation and amortization | 21,858 | 20,704 | 5.6 | % | 42,698 | 39,390 | 8.4 | % | ||||||||||||||||||||||||||||||
| Severance | 713 | 2,660 | (73.2) | % | 4,493 | 2,660 | 68.9 | % | ||||||||||||||||||||||||||||||
| Multiemployer pension plan withdrawal costs | 1,084 | 1,194 | (9.2) | % | 2,539 | 2,415 | 5.1 | % | ||||||||||||||||||||||||||||||
| Special items: | ||||||||||||||||||||||||||||||||||||||
| Acquisition-related costs | — | — | — | — | 34,712 | * | ||||||||||||||||||||||||||||||||
| Lease-related impairment charge | 12,736 | — | * | 12,736 | — | * | ||||||||||||||||||||||||||||||||
| Adjusted operating profit | $ | 92,166 | $ | 76,219 | 20.9 | % | $ | 146,141 | $ | 137,122 | 6.6 | % | ||||||||||||||||||||||||||
| Divided by: | ||||||||||||||||||||||||||||||||||||||
| Revenue | 590,853 | 555,680 | 6.3 | % | 1,151,592 | 1,093,105 | 5.4 | % | ||||||||||||||||||||||||||||||
| Operating profit margin | 9.4 | % | 9.3 | % | 10 bps | 7.3 | % | 5.3 | % | 200 bps | ||||||||||||||||||||||||||||
| Adjusted operating profit margin | 15.6 | % | 13.7 | % | 190 bps | 12.7 | % | 12.5 | % | 20 bps | ||||||||||||||||||||||||||||
| * Represents a change equal to or in excess of 100% or not meaningful. | ||||||||||||||||||||||||||||||||||||||
| Reconciliation of operating costs before depreciation and amortization, severance and multiemployer pension plan withdrawal costs (or adjusted operating costs) | ||||||||||||||||||||||||||||||||||||||
| For the Quarters Ended | For the Six Months Ended | |||||||||||||||||||||||||||||||||||||
| (In thousands) | June 30, 2023 | June 26, 2022 | % Change | June 30, 2023 | June 26, 2022 | % Change | ||||||||||||||||||||||||||||||||
| Operating costs | $ | 522,342 | $ | 504,019 | 3.6 | % | $ | 1,055,181 | $ | 1,000,448 | 5.5 | % | ||||||||||||||||||||||||||
| Less: | ||||||||||||||||||||||||||||||||||||||
| Depreciation and amortization | 21,858 | 20,704 | 5.6 | % | 42,698 | 39,390 | 8.4 | % | ||||||||||||||||||||||||||||||
| Severance | 713 | 2,660 | (73.2) | % | 4,493 | 2,660 | 68.9 | % | ||||||||||||||||||||||||||||||
| Multiemployer pension plan withdrawal costs | 1,084 | 1,194 | (9.2) | % | 2,539 | 2,415 | 5.1 | % | ||||||||||||||||||||||||||||||
| Adjusted operating costs | $ | 498,687 | $ | 479,461 | 4.0 | % | $ | 1,005,451 | $ | 955,983 | 5.2 | % | ||||||||||||||||||||||||||
| * Represents a change equal to or in excess of 100% or not meaningful. | ||||||||||||||||||||||||||||||||||||||
40
LIQUIDITY AND CAPITAL RESOURCES
We believe our cash balance and cash provided by operations, in combination with other sources of cash, will be sufficient to meet our financing needs over the next twelve months. As of June 30, 2023, we had cash, cash equivalents and short- and long-term marketable securities of $510.4 million. Our cash and marketable securities balances between December 31, 2022, and June 30, 2023, increased primarily due to cash proceeds from operating activities, partially offset by share repurchases, dividend payments and share-based compensation withholding tax payments.
We have paid quarterly dividends on the Class A and Class B Common Stock each quarter since late 2013. In February 2023, the Board of Directors approved an increase in the quarterly dividend to $0.11 per share, which was paid in April 2023. On June 29, 2023, the Board of Directors declared a quarterly dividend of $0.11 per shares on the Class A and Class B Common Stock, which was paid in July 2023. We currently expect to continue to pay comparable cash dividends in the future, although changes in our dividends will be considered by our Board of Directors in light of our earnings, capital requirements, financial condition and other factors considered relevant.
In February 2023, the Board of Directors approved a $250.0 million Class A share repurchase program in addition to the amount remaining under the existing $150.0 million authorization approved in February 2022. The authorizations provide that shares of Class A Common Stock may be purchased from time to time as market conditions warrant, through open market purchases, privately negotiated transactions or other means, including Rule 10b5-1 trading plans. We expect to repurchase shares to offset the impact of dilution from our equity compensation program and to return capital to our stockholders. There is no expiration date with respect to these authorizations. As of June 30, 2023, and August 4, 2023, repurchases under these authorizations totaled approximately $148.6 million (excluding commissions), respectively, and approximately $251.4 million remained. During the six months ended June 30, 2023, repurchases under these authorizations totaled approximately $43.6 million (excluding commissions).
Beginning in 2022, the Tax Cuts and Jobs Act of 2017 eliminated the option to deduct research and development expenditures immediately in the year incurred and instead requires taxpayers to capitalize and amortize such expenditures over five years. In 2022, our cash from operations decreased approximately $60 million and our net deferred tax assets increased by a similar amount as a result of this legislation. In 2023, we expect a negative impact on our cash from operations of approximately $45 million. The actual impact on fiscal 2023 cash from operations will depend on the amount of research and development costs we incur, on whether Congress modifies or repeals this provision, and on whether new guidance and interpretive rules are issued by the U.S. Treasury, among other factors.
Capital Resources
Sources and Uses of Cash
Cash flows provided by/(used in) by category were as follows:
| For the Six Months Ended | ||||||||||||||||||||
| (In thousands) | June 30, 2023 | June 26, 2022 | % Change | |||||||||||||||||
| Operating activities | $ | 119,782 | $ | 16,148 | * | |||||||||||||||
| Investing activities | $ | (5,030) | $ | (81,190) | * | |||||||||||||||
| Financing activities | $ | (90,159) | $ | (92,714) | (2.8) | % | ||||||||||||||
| * Represents a change equal to or in excess of 100% or not meaningful. | ||||||||||||||||||||
Operating Activities
Cash from operating activities is generated by cash receipts from subscriptions, advertising sales and other revenue. Operating cash outflows include payments for employee compensation, pension and other benefits, raw materials, marketing expenses and income taxes.
Net cash provided by operating activities increased in the first six months of 2023 compared with the same prior-year period primarily due to higher net income (which in 2022 was impacted by a payment related to the acceleration of Athletic stock options in connection with the acquisition) and lower cash payments for incentive compensation.
Investing Activities
Cash from investing activities generally includes proceeds from marketable securities that have matured and the sale of assets, investments or a business. Cash used in investing activities generally includes purchases of marketable securities, payments for capital projects and acquisitions of new businesses and investments.
Net cash used in investing activities in the first six months of 2023 was primarily related to capital expenditures of $10.8 million, partially offset by $3.5 million in net maturities of marketable securities.
41
Financing Activities
Cash used in financing activities generally includes the payment of dividends, share-based compensation withholding tax payments and share repurchases.
Net cash used in financing activities in the first six months of 2023 was primarily related to share repurchases of $43.6 million (excluding commissions), dividend payments of $33.2 million and share-based compensation tax withholding payments of $11.6 million.
Free Cash Flow
Free cash flow is a non-GAAP financial measure defined as net cash provided by operating activities, less capital expenditures. The Company considers free cash flow to provide useful information to management and investors about the amount of cash that is available to be used to strengthen the Company’s balance sheet and for strategic opportunities including, among others, investing in the Company’s business, strategic acquisitions, dividend payouts and repurchasing stock. In addition, management uses free cash flow to set targets for return of capital to stockholders in the form of dividends and share repurchases.
The following table presents a reconciliation of net cash provided by operating activities to free cash flow:
| For the Six Months Ended | ||||||||||||||
| (In thousands) | June 30, 2023 | June 26, 2022 | ||||||||||||
| Net cash provided by operating activities | $ | 119,782 | $ | 16,148 | ||||||||||
| Less: Capital expenditures | (10,792) | (19,005) | ||||||||||||
| Free cash flow | $ | 108,990 | $ | (2,857) | ||||||||||
Free cash flow in the first six months of 2022 was negatively impacted by a one-time payment related to the acceleration of The Athletic Media Company stock options in connection with the acquisition.
Restricted Cash
We were required to maintain $14.1 million of restricted cash as of June 30, 2023, and $13.8 million as of December 31, 2022, substantially all of which is set aside to collateralize workers’ compensation obligations.
Capital Expenditures
Capital expenditures totaled approximately $11 million and $20 million in the first six months of 2023 and 2022, respectively. The decrease in capital expenditures in 2023 was primarily driven by higher expenditures in the prior year related to improvements in our Company Headquarters. The cash payments related to capital expenditures totaled approximately $11 million and $19 million in the first six months of 2023 and 2022, respectively.
Revolving Credit Facility
On July 27, 2022, we entered into a $350.0 million five-year unsecured revolving credit facility that amended and restated a prior facility (as amended and restated, the “Credit Facility”). Certain of our domestic subsidiaries have guaranteed our obligations under the Credit Facility. As of June 30, 2023, and December 31, 2022, there were no borrowings and approximately $0.6 million in outstanding letters of credit, with the remaining committed amount available. As of June 30, 2023, the Company was in compliance with the financial covenants contained in the Credit Facility.
CRITICAL ACCOUNTING ESTIMATES AND POLICIES
Our critical accounting policies are detailed in our Annual Report on Form 10-K for the year ended December 31, 2022. Other than as described in Note 2 of the Notes to the Condensed Consolidated Financial Statements, as of June 30, 2023, our critical accounting policies have not changed from December 31, 2022.
42
FORWARD-LOOKING STATEMENTS
This Quarterly Report on Form 10-Q, including the section titled “Management’s Discussion and Analysis of Financial Condition and Results of Operations,” contains forward-looking statements within the meaning of Section 27A of the Securities Act of 1933, as amended, and Section 21E of the Securities Exchange Act of 1934, as amended. Terms such as “aim,” “anticipate,” “believe,” “confidence,” “contemplate,” “continue,” “conviction,” “could,” “drive,” “estimate,” “expect,” “forecast,” “future,” “goal,” “guidance,” “intend,” “likely,” “may,” “might,” “objective,” “opportunity,” “optimistic,” “outlook,” “plan,” “position,” “potential,” “predict,” “project,” “seek,” “should,” “strategy,” “target,” “will,” “would” or similar statements or variations of such words and other similar expressions are intended to identify forward-looking statements, although not all forward-looking statements contain such terms. Forward-looking statements are based upon our current expectations, estimates and assumptions and involve risks and uncertainties that change over time; actual results could differ materially from those predicted by such forward-looking statements. These risks and uncertainties include, but are not limited to: significant competition in all aspects of our business; our ability to grow the size and profitability of our subscriber base; our dependence on user and other metrics that are subject to inherent challenges in measurement; numerous factors that affect our advertising revenues, including market dynamics, evolving digital advertising trends and the evolution of our strategy; economic, market, public health (including Covid-19-related) and geopolitical conditions or other events; damage to our brand or reputation; significant disruptions in our newsprint supply chain or newspaper printing and distribution channels or a significant increase in the costs to print and distribute our newspaper; risks associated with the international scope of our business and foreign operations; risks associated with environmental, social and governance matters and any related reporting obligations; adverse results from litigation or governmental investigations; risks associated with acquisitions (including The Athletic), divestitures, investments and similar transactions; the risks and challenges associated with investments we make in new and existing products and services; risks associated with attracting and maintaining a talented and diverse workforce; the impact of labor negotiations and agreements; potential limits on our operating flexibility due to the nature of significant portions of our expenses; the effects of the size and volatility of our pension plan obligations; liabilities that may result from our participation in multiemployer pension plans; our ability to improve and scale our technical and data infrastructure; security incidents and other network and information systems disruptions; our ability to comply with laws and regulations with respect to privacy, data protection and consumer marketing practices; payment processing risk; defects, delays or interruptions in the cloud-based hosting services we utilize; our ability to protect our intellectual property; claims against us of intellectual property infringement; our ability to meet our publicly announced guidance and/or targets; the effects of restrictions on our operations as a result of the terms of our credit facility; our future access to capital markets and other financing options; and the concentration of control of our company due to our dual-class capital structure.
More information regarding these risks and uncertainties and other important factors that could cause actual results to differ materially from those in the forward-looking statements is set forth in “Item 1A — Risk Factors” in our Annual Report on Form 10-K for the year ended December 31, 2022, and “Item 2. Management’s Discussion and Analysis of Financial Condition and Results of Operations” of this Quarterly Report on Form 10-Q. Investors are cautioned not to place undue reliance on any such forward-looking statements, which speak only as of the date they are made. The Company undertakes no obligation to publicly update or revise any forward-looking statement, whether as a result of new information, future events or otherwise.
Item 3. Quantitative and Qualitative Disclosures About Market Risk
Our Annual Report on Form 10-K for the year ended December 31, 2022, details our disclosures about market risk. As of June 30, 2023, there were no material changes in our market risks from December 31, 2022.
43
Item 4. Controls and Procedures
EVALUATION OF DISCLOSURE CONTROLS AND PROCEDURES
Our management, with the participation of our principal executive officer and our principal financial officer, evaluated the effectiveness of our disclosure controls and procedures (as defined in Rules 13a-15(e) and 15d-15(e) of the Securities Exchange Act of 1934, as amended) as of June 30, 2023. Based upon such evaluation, our principal executive officer and principal financial officer concluded that our disclosure controls and procedures were effective as of June 30, 2023, to ensure that the information required to be disclosed by us in the reports that we file or submit under the Securities Exchange Act of 1934, as amended, is recorded, processed, summarized and reported within the time periods specified in the SEC’s rules and forms, and is accumulated and communicated to our management, including our principal executive officer and principal financial officer, as appropriate to allow timely decisions regarding required disclosure.
CHANGES IN INTERNAL CONTROL OVER FINANCIAL REPORTING
There were no changes in our internal control over financial reporting during the quarter ended June 30, 2023, that have materially affected, or are reasonably likely to materially affect, our internal control over financial reporting.
44
PART II. OTHER INFORMATION
Item 1. Legal Proceedings
We are involved in various legal actions incidental to our business that are now pending against us. These actions generally have damage claims that are greatly in excess of the payments, if any, that we would be required to pay if we lost or settled the cases. Although the Company cannot predict the outcome of these matters, it is possible that an unfavorable outcome in one or more matters could be material to the Company’s consolidated results of operations or cash flows for an individual reporting period. However, based on currently available information, management does not believe that the ultimate resolution of these matters, individually or in the aggregate, is likely to have a material effect on the Company’s financial position.
Item 1A. Risk Factors
There have been no material changes to our risk factors as set forth in “Item 1A—Risk Factors” in our Annual Report on Form 10-K for the year ended December 31, 2022.
Item 2. Unregistered Sales of Equity Securities and Use of Proceeds
(c) Issuer Purchases of Equity Securities
In February 2023, in addition to the amount remaining under the 2022 authorization, the Board of Directors approved a $250.0 million Class A share repurchase program. The authorizations provide that shares of Class A Common Stock may be purchased from time to time as market conditions warrant, through open market purchases, privately negotiated transactions or other means, including Rule 10b5-1 trading plans. We expect to repurchase shares to offset the impact of dilution from our equity compensation program and to return capital to our stockholders. There is no expiration date with respect to these authorizations. As of June 30, 2023, repurchases under these authorizations totaled approximately $148.6 million (excluding commissions) and approximately $251.4 million remained.
| Period | Total numbers of shares of Class A Common Stock purchased | Average price paid per share of Class A Common Stock | Total number of shares of Class A Common Stock purchased as part of publicly announced plans or programs | Maximum number (or approximate dollar value) of shares of Class A Common Stock that may yet be purchased under the plans or programs | ||||||||||||||||||||||
| April 1, 2023 - April 30, 2023 | — | $ | — | — | $ | 264,302,000 | ||||||||||||||||||||
| May 1, 2023 - May 31, 2023 | 262,288 | $ | 36.21 | 262,288 | $ | 251,983,000 | ||||||||||||||||||||
| June 1, 2023 - June 30, 2023 | 95,200 | $ | 35.60 | 95,200 | $ | 251,438,000 | ||||||||||||||||||||
| Total for the second quarter of 2023 | 357,488 | $ | 36.00 | 357,488 | $ | 251,438,000 | ||||||||||||||||||||
Item 5. Other Information
Securities Trading Plans of Directors and Executive Officers
During the three months ended June 30, 2023, none of our directors or executive officers
adopted
or
terminated
any contract, instruction or written plan for the purchase or sale of the Company’s securities that was intended to satisfy the affirmative defense conditions of Rule 10b5-1(c) or any “non-Rule 10b5-1 trading arrangement” (as defined in Item 408(c) of Regulation S-K).
45
Item 6. Exhibits
| Exhibit No. |
|
|||||||
| 31.1 | ||||||||
| 31.2 | ||||||||
| 32.1 | ||||||||
| 32.2 | ||||||||
| 101.INS | XBRL Instance Document - the instance document does not appear in the Interactive Data File because its XBRL tags are embedded within the Inline XBRL document. | |||||||
| 101.SCH | Inline XBRL Taxonomy Extension Schema Document. | |||||||
| 101.CAL | Inline XBRL Taxonomy Extension Calculation Linkbase Document. | |||||||
| 101.DEF | Inline XBRL Taxonomy Extension Definition Linkbase Document. | |||||||
| 101.LAB | Inline XBRL Taxonomy Extension Label Linkbase Document. | |||||||
| 101.PRE | Inline XBRL Taxonomy Extension Presentation Linkbase Document. | |||||||
| 104 | Cover Page Interactive Data File (formatted as Inline XBRL and contained in Exhibit 101). | |||||||
46
SIGNATURES
Pursuant to the requirements of the Securities Exchange Act of 1934, the registrant has duly caused this report to be signed on its behalf by the undersigned thereunto duly authorized.
| THE NEW YORK TIMES COMPANY | ||||||||
| (Registrant) | ||||||||
| Date: | August 8, 2023 | /s/ William Bardeen | ||||||
|
William Bardeen
Executive Vice President and Chief Financial Officer (Principal Financial Officer) |
||||||||
47
TABLE OF CONTENTS
Part I. Financial InformationItem 1. Financial StatementsNote 1. Basis Of PresentationNote 2. Summary Of Significant Accounting PoliciesNote 3. RevenueNote 4. Marketable SecuritiesNote 5. Goodwill and IntangiblesNote 6. InvestmentsNote 7. OtherNote 8. Fair Value MeasurementsNote 9. Pension and Other Postretirement BenefitsNote 10. Income TaxesNote 11. Earnings Per ShareNote 12. Supplemental Stockholders Equity InformationNote 13. Segment InformationNote 14. Contingent LiabilitiesItem 2. Management S Discussion and Analysis Of Financial Condition and Results Of OperationsItem 3. Quantitative and Qualitative Disclosures About Market RiskItem 4. Controls and ProceduresPart II. Other InformationItem 1. Legal ProceedingsItem 1A. Risk FactorsItem 2. Unregistered Sales Of Equity Securities and Use Of ProceedsItem 5. Other InformationItem 6. Exhibits