UNITED STATES
SECURITIES AND EXCHANGE COMMISSION
Washington, D.C. 20549
FORM 20-F
|
o
|
Registration statement pursuant to Section 12(b) or 12(g) of the Securities Exchange Act of 1934
|
or
|
x
|
Annual report pursuant to Section 13 or 15(d) of the Securities Exchange Act of 1934 for the fiscal year ended December 31, 2017
|
or
|
o
|
Transition report pursuant to Section 13 or 15(d) of the Securities Exchange Act of 1934
|
or
|
o
|
Shell company report pursuant to Section 13 or 15(d) of the Securities Exchange Act of 1934
|
Commission file number: 001- 36563
ORION ENGINEERED CARBONS S.A.
(Exact Name of Registrant as Specified in its Charter)
N/A
(Translation of Registrant’s Name into English)
Grand Duchy of Luxembourg
(Jurisdiction of Incorporation or Organization)
6, Route de Trèves
L-2633 Senningerberg (Municipality of Niederanven),
Grand Duchy of Luxembourg
(Address of Principal Executive Office)
Christian Eggert, General Counsel Global and Head of Group Legal
+352 270 48 06 0
christian.eggert@orioncarbons.com
6, Route de Trèves
L-2633 Senningerberg (Municipality of Niederanven),
Grand Duchy of Luxembourg
(Name, Telephone, E-Mail and/or Facsimile number and Address of Company Contact Person)
Securities registered or to be registered pursuant to Section 12(b) of the Act:
|
Title of Each Class
|
Name of Each Exchange On Which Registered
|
|
|
Common Shares, no par value
|
New York Stock Exchange
|
|
Securities registered or to be registered pursuant to Section 12(g) of the Act:
None
Securities for which there is a reporting obligation pursuant to Section 15(d) of the Act:
None
Indicate the number of outstanding shares of each of the issuer’s classes of capital or common stock as of the close of the period covered by the annual report.
59,320,214
common shares, no par value
Indicate by check mark if the registrant is a well-known seasoned issuer, as defined in Rule 405 of the Securities
Act. Yes
x
No
¨
If this report is an annual or transition report, indicate by check mark if the registrant is not required to file reports pursuant to Section 13 or 15(d) of the Securities Exchange Act of 1934. Yes
¨
No
x
Note—checking the box above will not relieve any registrant required to file reports pursuant to Section 13 or 15(d) of the Securities Exchange Act of 1934 from their obligations under those Sections.
Indicate by check mark whether the registrant (1) has filed all reports required to be filed by Section 13 or 15(d) of the Securities Exchange Act of 1934 during the preceding 12 months (or for such shorter period that the registrant was required to file such reports), and (2) has been subject to such filing requirements for the past 90 days. Yes
x
No
¨
Indicate by check mark whether the registrant has submitted electronically and posted on its corporate Web site, if any, every Interactive Data File required to be submitted and posted pursuant to Rule 405 of Regulation S-T (§232.405 of this chapter) during the preceding 12 months (or for such shorter period that the registrant was required to submit and post such files). Yes
x
No
¨
Indicate by check mark whether the registrant is a large accelerated filer, an accelerated filer, a non-accelerated filer, or an emerging growth company. See definition of “large accelerated filer,” “accelerated filer,” and “emerging growth company” in Rule 12b-2 of the Exchange Act (Check one):
Large accelerated filer
¨
Accelerated Filer
x
Non-accelerated filer
¨
Emerging growth company
¨
If an emerging growth company that prepares its financial statements in accordance with U.S. GAAP, indicate by check mark if the registrant has elected not to use the extended transition period for complying with any new or revised financial accounting standards† provided pursuant to Section 13(a) of the Exchange Act.
†The term “new or revised financial accounting standard” refers to any update issued by the Financial Accounting Standards Board to its Accounting Standard Codification after April 5, 2012.
Indicate by check mark which basis of accounting the registrant has used to prepare the financial statements included in this filing:
|
U.S. GAAP
o
|
International Financial Reporting Standards as issued
by the International Accounting Standards Board
x
|
Other
o
|
||
If “Other” has been checked in response to the previous question indicate by check mark which financial statement item the registrant has elected to follow Item 17
¨
Item 18
¨
If this is an annual report, indicate by check mark whether the registrant is a shell company (as defined in Rule 12b-2 of the Exchange Act). Yes
¨
No
x
TABLE OF CONTENTS
3
CERTAIN DEFINED TERMS
In this annual report, unless otherwise specified or if the context so requires:
|
•
|
References to the “Company” are exclusively to Orion Engineered Carbons S.A., a Luxembourg joint stock corporation (
société anonyme
);
|
|
•
|
References in this report to “Orion,” the “Group,” “we,” “us” or “our” are to Orion Engineered Carbons S.A. and its consolidated subsidiaries;
|
|
•
|
References in this report to “Kinove Holdings” are to Kinove Luxembourg Holdings 1 S.à r.l., a Luxembourg limited liability company (
société à responsabilité limitée
), owned by investment funds managed by affiliates of Rhône Capital L.L.C., investment funds managed directly or indirectly by Triton Managers III Limited and TFF III Limited and Luxinva S.A., a wholly-owned subsidiary of the Abu Dhabi Investment Authority, a public institution wholly-owned by the Government of the Emirate of Abu Dhabi;
|
|
•
|
References in this report to “Luxco Coinvest” are to Kinove Luxembourg Coinvestment S.C.A., an investment vehicle owned by members of the Company’s management;
|
|
•
|
References to the “Acquisition” are to the acquisition of the carbon black business line from Evonik Industries AG, completed on July 29, 2011; and
|
|
•
|
References to the “Credit Agreement” are to the Credit Agreement, dated as of July 25, 2014, among the Company, Orion Engineered Carbons Holdings GmbH, Orion Engineered Carbons Bondco GmbH, Orion Engineered Carbons GmbH, OEC Finance US LLC, the revolving borrowers named therein, the guarantors named on the signature page thereto, the lenders named therein, and Goldman Sachs Bank USA as administrative agent, as amended.
|
i
PRESENTATION OF CERTAIN FINANCIAL AND OTHER INFORMATION
The Company was incorporated on April 13, 2011 as Kinove Luxembourg 2 S.à r.l. On July 29, 2011, the Company completed the Acquisition from Evonik Industries AG (“Evonik”) of its carbon black business line (referred to in this report as “Evonik Carbon Black”). On July 28, 2014 the Company changed its legal form into a joint stock corporation named Orion Engineered Carbons S.A.
In this report, references to “Euro” and “€” are to the single currency adopted by participating member states of the European Union (the “EU”) relating to Economic and Monetary Union, references to “$”, “US$” and “U.S. Dollars” are to the lawful currency of the United States of America and references to “Korean Won” are to the lawful currency of the Republic of Korea.
Non-IFRS Financial Measures
The financial statements included in this report were prepared in accordance with International Financial Reporting Standards as issued by the International Accounting Standards Board (“IFRS”).
In this report, we present certain financial measures that are not recognized by IFRS and that may not be permitted to appear on the face of IFRS-compliant financial statements or notes thereto.
The non-IFRS financial measures used in this report are Contribution Margin, Contribution Margin per Metric Ton (collectively, “Contribution Margins”), Adjusted EBITDA, Net Working Capital and Capital Expenditures. We define Contribution Margin as revenue less variable costs (such as raw materials, packaging, utilities and distribution costs). We define Contribution Margin per Metric Ton as Contribution Margin divided by volume measured in metric tons. We define Adjusted EBITDA as operating result (EBIT) before depreciation and amortization, adjusted for acquisition related expenses, restructuring expenses, consulting fees related to Group strategy, share of profit or loss of joint venture and certain other items. Adjusted EBITDA is defined similarly in the Credit Agreement. Adjusted EBITDA is used by our management to evaluate our operating performance and make decisions regarding allocation of capital because it excludes the effects of items that have less bearing on the performance of our underlying core business. We define Net Working Capital as inventories plus current trade receivables minus trade payables. We define Capital Expenditures as cash paid for the acquisition of intangible assets and property, plant and equipment as shown in the consolidated financial statements.
We also use Segment Adjusted EBITDA Margin, which we define as Adjusted EBITDA for the relevant segment divided by the revenue for that segment. Adjusted EBITDA for our segments and Segment Adjusted EBITDA Margin are financial measures permitted under IFRS.
We use Adjusted EBITDA, Contribution Margins and Net Working Capital, as well as Adjusted EBITDA by segment and Segment Adjusted EBITDA Margin, as internal measures of performance to benchmark and compare performance among our own operations. We use these measures, together with other measures of performance under IFRS, to compare the relative performance of operations in planning, budgeting and reviewing the performance of our business. We believe these measures are useful measures of financial performance in addition to consolidated profit (or loss) for the period, operating result (EBIT) and other profitability measures under IFRS because they facilitate operating performance comparisons from period to period and company to company and, with respect to Contribution Margin, eliminate volatility in feedstock prices. By eliminating potential differences in results of operations between periods or companies caused by factors such as depreciation and amortization methods, historic cost and age of assets, financing and capital structures and taxation positions or regimes, we believe that Adjusted EBITDA can provide a useful additional basis for comparing the current performance of the underlying operations being evaluated. For these reasons, we believe EBITDA-based measures are often used by the investment community as a means of comparison of companies in our industry. By deducting variable costs (such as raw materials, packaging, utilities and distribution costs) from revenue, we believe that Contribution Margins can provide a useful basis for comparing the current performance of the underlying operations being evaluated by indicating the portion of revenue that is not consumed by variable costs (such as raw materials packaging, utilities and distribution costs) and therefore contributes to the coverage of all costs and profits.
Different companies and analysts may calculate measures based on EBITDA, contribution margins and working capital differently, so making comparisons among companies on this basis should be done carefully. Adjusted EBITDA, Contribution Margins and Net Working Capital are not measures of performance under IFRS and should not be considered in isolation or construed as substitutes for revenue, consolidated profit (loss) for the period, operating result (EBIT), gross profit and other IFRS measures as an indicator of our operations in accordance with IFRS.
Reconciliation of Non-IFRS Financial Measures
The non-IFRS financial measures contained in this report are unaudited (except for Adjusted EBITDA, being the total of our Adjusted EBITDA by segment) and have not been prepared in accordance with IFRS or the accounting standards of any other jurisdiction and may not be comparable to other similarly titled measures of other companies. For a reconciliation of these non-IFRS financial measures to the most directly comparable IFRS measures, see “
Item 5. Operating and Financial Review and Prospects
—
Reconciliation of Non-IFRS Financial Measures
.”
ii
INDUSTRY, RANKING AND OTHER DATA
Information included in this report relating to industries, industry size, share of industry sales, industry position, industry capacities, industry demand, growth rates, penetration rates, average prices and other industry data pertaining to our business consists of estimates based on data reports compiled by professional third-party organizations and analysts, on data from external sources, on our best knowledge of our sales and industries in which we operate and on our own calculations based on such information. In many cases we are required to rely on internally developed estimates because there is no readily available external information (whether from trade associations, government bodies or other organizations) to validate industry-related analysis and estimates. While we have compiled, extracted and reproduced industry data from external sources, including third-party, industry or general publications, we have not independently verified the data and cannot guarantee its accuracy or completeness. Similarly, while we believe our internal estimates to be reasonable, they have not been verified by any independent sources, and we cannot guarantee their accuracy. Forecasts and other forward-looking information with respect to industry and ranking are subject to the same qualifications and additional uncertainties regarding the other forward-looking statements in this report.
TRADEMARKS AND TRADE NAMES
We own or have rights to certain trademarks and trade names that we use in conjunction with the operations of our business. Each trademark, trade name or service mark of any other company appearing in this report belongs to its holder. Solely for convenience, trademarks and trade names referred to in this report may appear without the “®” or “™” symbols, but such references are not intended to indicate, in any way, that we will not assert, to the fullest extent possible under applicable law, our rights or the rights of the applicable licensor to these trademarks and trade names. We do not intend our use or display of other companies’ trade names, trademarks or service marks to imply a relationship with, or endorsement or sponsorship of us by, such other companies.
NOTE REGARDING FORWARD-LOOKING STATEMENTS
This report contains and refers to certain forward-looking statements with respect to our financial condition, results of operations and business. These statements constitute forward-looking statements within the meaning of Section 21E of the Securities Exchange Act of 1934, as amended (the “Exchange Act”). Forward-looking statements are statements of future expectations that are based on management’s current expectations and assumptions and involve known and unknown risks and uncertainties that could cause actual results, performance or events to differ materially from those expressed or implied in these statements. Forward-looking statements include, among others, statements concerning the potential exposure to market risks, statements expressing management’s expectations, beliefs, estimates, forecasts, projections and assumptions and statements that are not limited to statements of historical or present facts or conditions.
Forward-looking statements are typically identified by words such as “anticipate,” “believe,” “could,” “estimate,” “expect,” “intend,” “may,” “plan,” “objectives,” “outlook,” “probably,” “project,” “will,” “seek,” “target” and other words of similar meaning. These forward-looking statements include, without limitation, statements about the following matters:
|
•
|
our strategies for (i) strengthening our position in specialty carbon blacks and rubber carbon blacks, (ii) increasing our rubber carbon black margins and (iii) strengthening the competitiveness of our operations;
|
|
•
|
the outcome of any in-progress, pending or possible litigation or regulatory proceedings, including the U.S. Environmental Protection Agency (the “EPA”) enforcement action described herein; and
|
|
•
|
our expectation that the markets we serve will continue to grow.
|
All these forward-looking statements are based on estimates and assumptions that, although believed to be reasonable, are inherently uncertain. Therefore, undue reliance should not be placed upon any forward-looking statements. There are important factors that could cause actual results to differ materially from those contemplated by such forward-looking statements. These factors include, among others:
|
•
|
negative or uncertain worldwide economic conditions;
|
|
•
|
volatility and cyclicality in the industries in which we operate;
|
|
•
|
operational risks inherent in chemicals manufacturing, including disruptions as a result of severe weather conditions and natural disasters;
|
|
•
|
our dependence on major customers;
|
|
•
|
our ability to compete in the industries and markets in which we operate;
|
|
•
|
our ability to develop new products and technologies successfully and the availability of substitutes for our products;
|
|
•
|
our ability to implement our business strategies;
|
|
•
|
volatility in the costs and availability of raw materials and energy;
|
iii
|
•
|
our ability to realize benefits from investments, joint ventures, acquisitions or alliances;
|
|
•
|
our ability to realize benefits from planned plant capacity expansions and site development projects and the potential delays to such expansions and projects;
|
|
•
|
information technology systems failures, network disruptions and breaches of data security;
|
|
•
|
our relationships with our workforce, including negotiations with labor unions, strikes and work stoppages;
|
|
•
|
our ability to recruit or retain key management and personnel;
|
|
•
|
our exposure to political or country risks inherent in doing business in some countries;
|
|
•
|
environmental, health and safety regulations, including nanomaterial and greenhouse gas emissions regulations, and the related costs of maintaining compliance and addressing liabilities;
|
|
•
|
possible future investigations and enforcement actions by governmental or supranational agencies;
|
|
•
|
our operations as a company in the chemical sector, including the related risks of leaks, fires and toxic releases;
|
|
•
|
market and regulatory changes that may affect our ability to sell or otherwise benefit from co-generated energy;
|
|
•
|
tax audits, litigation or legal proceedings, including product liability and environmental claims;
|
|
•
|
our ability to protect our intellectual property rights and know-how;
|
|
•
|
our ability to generate the funds required to service our debt and finance our operations;
|
|
•
|
fluctuations in foreign currency exchange and interest rates;
|
|
•
|
the availability and efficiency of hedging;
|
|
•
|
changes in international and local economic conditions, including with regard to the Euro, dislocations in credit and capital markets and inflation or deflation;
|
|
•
|
potential impairments or write-offs of certain assets;
|
|
•
|
required increases in our pension fund contributions;
|
|
•
|
the adequacy of our insurance coverage;
|
|
•
|
changes in our jurisdictional earnings mix or in the tax laws or accepted interpretations of tax laws in those jurisdictions;
|
|
•
|
our indemnities to and from Evonik (as defined below);
|
|
•
|
challenges to our decisions and assumptions in assessing and complying with our tax obligations;
|
|
•
|
the effect of exchange rate fluctuations on U.S. Dollar amounts received as dividends;
|
|
•
|
our status as a foreign private issuer; and
|
|
•
|
potential difficulty in obtaining or enforcing judgments or bringing actions against us in the United States.
|
In light of these risks, our results could differ materially from the forward-looking statements contained in this report. For further information regarding factors that could affect our business and financial results and the related forward-looking statements, see “
Item 3. Key Information
—D. Risk Factors
.”
iv
Not applicable.
Not applicable.
Item 3. Key Information
|
A.
|
Selected Financial Data
|
The following table sets forth selected historical financial information for fiscal years
2017
,
2016
,
2015
,
2014
and
2013
and as of
December 31, 2017
,
2016
,
2015
,
2014
and
2013
. The financial information for fiscal years
2017
,
2016
and
2015
and balance sheet information as of December 31,
2017
and
2016
has been derived from our audited consolidated financial statements included elsewhere in this report. The financial information for fiscal years 2014 and 2013 and balance sheet information as of December 31, 2015, 2014 and 2013 has been derived from our audited consolidated financial statements, which are not included in this report. This information should be read in conjunction with the consolidated financial statements included elsewhere in this report, the related notes and other financial information included herein, as well as in conjunction with quarterly financial information previously filed with or furnished to the Securities and Exchange Commission (the “SEC”).
|
Income Statement Data
|
Year Ended December 31,
|
||||
|
2017
|
2016
|
2015
|
2014
|
2013
|
|
|
(in €
million)
|
|||||
|
Revenue
|
1,177.2
|
1,030.1
|
1,111.8
|
1,318.4
|
1,339.6
|
|
Cost of sales
|
(842.4)
|
(691.8)
|
(791.5)
|
(1,017.3)
|
(1,070.8)
|
|
Gross profit
|
334.8
|
338.3
|
320.3
|
301.1
|
268.8
|
|
Selling expenses
|
(115.1)
|
(114.6)
|
(108.1)
|
(99.6)
|
(92.1)
|
|
Research and development costs
|
(16.1)
|
(14.5)
|
(13.4)
|
(13.0)
|
(10.1)
|
|
General and administrative expenses
|
(68.7)
|
(68.6)
|
(62.1)
|
(54.6)
|
(52.5)
|
|
Other operating income
|
4.3
|
5.9
|
7.5
|
4.4
|
8.3
|
|
Other operating expenses
|
(10.8)
|
(13.8)
|
(21.8)
|
(29.9)
|
(38.7)
|
|
Restructuring expenses
|
(4.6)
|
(27.9)
|
—
|
(4.1)
|
N/A
*
|
|
Operating result (EBIT)
|
123.8
|
104.8
|
122.4
|
104.3
|
83.8
|
|
Finance income
|
40.4
|
25.1
|
17.3
|
39.3
|
17.1
|
|
Finance costs
|
(77.1)
|
(62.5)
|
(73.4)
|
(182.7)
|
(112.7)
|
|
Share of profit or loss of joint ventures
|
0.5
|
0.4
|
0.5
|
0.5
|
0.4
|
|
Financial result
|
(36.2)
|
(36.9)
|
(55.7)
|
(142.8)
|
(95.2)
|
|
Profit or (loss) before income taxes
|
87.6
|
67.9
|
66.7
|
(38.5)
|
(11.4)
|
|
Income taxes
|
(20.7)
|
(23.2)
|
(23.8)
|
(17.4)
|
(7.5)
|
|
Profit or (loss) for the period
|
66.8
|
44.6
|
42.9
|
(55.9)
|
(19.0)
|
|
Earnings Per Share - basic (€ per share)
(1)
|
1.13
|
0.75
|
0.72
|
(1.11)
|
(0.43)
|
|
Earnings Per Share - diluted (€ per share)
(1)
|
1.10
|
0.74
|
0.72
|
—
|
—
|
|
Dividends per share (€ per share)
|
0.67
|
0.67
|
0.67
|
0.67
|
—
|
* Restructuring expenses for 2013 are included in other operating expenses.
1
|
Statement of Cash Flows Data
|
Year Ended December 31,
|
||||
|
2017
|
2016
|
2015
|
2014
|
2013
|
|
|
(in €
million)
|
|||||
|
Cash flows from (used in)operating activities
|
151.8
|
199.2
|
214.4
|
172.4
|
190.9
|
|
Cash flows from (used in) investing activities
|
(80.7)
|
(62.2)
|
(74.8)
|
(64.5)
|
(77.2)
|
|
Cash flows from (used in) financing activities
|
(84.0)
|
(130.4)
|
(143.5)
|
(110.0)
|
(114.7)
|
|
Balance Sheet Data
|
As of December 31,
|
||||
|
2017
|
2016
|
2015
|
2014
|
2013
|
|
|
(in €
million)
|
|||||
|
Cash and cash equivalents
|
60.3
|
73.9
|
65.3
|
70.5
|
70.5
|
|
Property, plant and equipment
|
385.3
|
387.7
|
385.9
|
358.2
|
333.5
|
|
Total assets
|
974.6
|
998.6
|
970.5
|
1,022.2
|
1,007.0
|
|
Total liabilities
|
891.3
|
945.7
|
920.8
|
966.9
|
1,081.2
|
|
Total equity
(1)
|
83.3
|
52.9
|
49.7
|
55.3
|
(74.3)
|
|
(1)
|
Our share capital as of
December 31, 2017
was €59,635,126, represented by 59,635,126 common shares with no par value of which 314,912 common shares are held in treasury.
|
Our reporting currency is the Euro. Fluctuations in the exchange rate between the Euro and the U.S. Dollar will affect the U.S. Dollar amounts received by owners of our common shares on conversion of dividends, if any, declared in Euro on the common shares and will affect the U.S. Dollar price of our common shares on the New York Stock Exchange (the “NYSE”). The following tables set forth, for the periods and dates indicated, the period end, average, high and low exchange rates in U.S. Dollars per €1.00.
Exchange Rates for the Previous Six Months
|
|
Period End
|
Average Rate
(1)
|
High
|
Low
|
|
September 2017
|
1.1813
|
1.1913
|
1.2041
|
1.1747
|
|
October 2017
|
1.1648
|
1.1755
|
1.1847
|
1.158
|
|
November 2017
|
1.1898
|
1.1743
|
1.1936
|
1.1577
|
|
December 2017
|
1.2022
|
1.1836
|
1.2022
|
1.1725
|
|
January 2018
|
1.2428
|
1.2196
|
1.2488
|
1.1922
|
|
February 2018 (through February 16, 2018)
|
1.2442
|
1.2368
|
1.2482
|
1.2226
|
Exchange Rates for the Previous Five Years Ended December 31, 2017
|
|
Period End
|
Average Rate
(2)
|
High
|
Low
|
|
2013
|
1.3779
|
1.3303
|
1.3816
|
1.2774
|
|
2014
|
1.2101
|
1.321
|
1.3927
|
1.2101
|
|
2015
|
1.0859
|
1.1032
|
1.2015
|
1.0524
|
|
2016
|
1.0552
|
1.1072
|
1.1516
|
1.0375
|
|
2017
|
1.2022
|
1.13
|
1.2041
|
1.0416
|
|
(1)
|
The average of the daily exchange rates during the relevant period.
|
|
(2)
|
The average of the month-end rates during the relevant period.
|
2
Our inclusion of these exchange rates and other exchange rates specified elsewhere in this report should not be construed as representations that Euro amounts included in this report actually represent such U.S. Dollar amounts or could have been or could be converted into U.S. Dollars at any particular rate, if at all. The Euro foreign exchange reference rate used in this report is the noon buying rate in New York City for cable transfers in foreign currencies as certified for customs purposes by the Federal Reserve Bank of New York. On February 16, 2018, this rate was $1.2442 per €1.00. These exchange rates may differ from the exchange rate in effect on and as of the date of this report.
|
B.
|
|
Not applicable.
|
C.
|
Reasons for the Offer and Use of Proceeds
|
Not applicable.
|
D.
|
Risk Factors
|
The following risks may have material adverse effects on our business, financial condition and results of operations. Additional risks and uncertainties of which we are not presently aware or that we currently deem immaterial could also materially affect our business operations and financial condition.
Risks Related to Our Business
Negative or uncertain worldwide economic conditions may result in business volatility and may adversely impact our business, financial condition, results of operations and cash flows.
Our operations and performance are materially affected by worldwide economic conditions. Because carbon black is used in a diverse group of end products, demand for carbon black has historically been related to real gross domestic product (“GDP”) and general global economic conditions. In particular, a large part of our sales has direct exposure to the cyclical automotive industry and, to a lesser extent, the construction industry. As a result, our business experiences a level of inherent cyclicality. The nature of our business and our large fixed asset base make it difficult to rapidly adjust our fixed costs downward when demand for our products declines, which could materially affect our profitability. A global or regional economic downturn may reduce demand for our products, which would decrease our revenue and could have a material adverse effect on our business, financial condition, results of operations and cash flows. For example, our results of operations dropped sharply in the wake of the global financial and economic crisis in the second half of 2008 and 2009. In periods with significant market turmoil and tightened credit availability, we expect to experience difficulty in collecting accounts receivable, pricing pressure and reduced global business activity.
Structural changes in the industries in which we operate may result in business volatility and may adversely affect our business, financial condition, results of operations and cash flows.
Our business is influenced by structural changes in the industries in which we operate, such as the entry of new suppliers, product substitution, changing technologies, industry consolidation and the migration of customers to lower-cost countries. Some of our customers have shifted, and may continue to shift, manufacturing capacity from mature regions, such as North America and Europe, to emerging regions, such as Asia and South America. Although we have developed and implemented strategies to meet these changes in demand, we cannot be certain that we will be able to successfully expand capacity in emerging regions. Our ability to expand in these regions depends in part on their economic and political conditions and on our ability to establish and finance operations, construct additional manufacturing capacity or form strategic business alliances including acquisitions and joint ventures. Over the last few years, for instance, our competitors in China have aggressively added capacity at a far greater rate than demand has increased, which has resulted in pressured margins in the region, particularly with respect to standard tire grades. In addition, we may not be successful in reducing capacity in mature regions commensurate with industry demand. Similarly, demand for our customers’ products and our competitors’ reactions to market conditions could affect our results. Our business is also sensitive to changes in industry capacity utilization. Prices tend to decrease when capacity utilization decreases, which could adversely affect our business, financial condition, results of operations and cash flows.
Our business is subject to operational risks, which could adversely affect our business, financial condition, results of operations and cash flows.
Our operations are subject to hazards inherent in chemicals manufacturing and the related use, storage, transportation and disposal of feedstocks, products and wastes, including but not limited to, fires and explosions, accidents, severe weather and natural disasters (including hurricanes, tornados, ice storms, droughts, floods and earthquakes), mechanical failures, unscheduled downtime at our production facilities, transportation interruptions, pipeline leaks and ruptures, quality problems, technical difficulties, energy grid shutdowns, discharges or releases of toxic or hazardous substances or gases, other environmental risks, and sabotage, terrorist attacks or other acts of violence as well as potential boycotts, general strikes, sanctions or blockades.
Such events could disrupt our supply of raw materials or otherwise affect production, transportation and delivery of our products or affect demand for our products. We could incur significant expenditures in connection with such operational risks. These may be caused both by external factors, such as natural disasters, war, acts of terrorism, strikes, official orders, technical interruptions or material defects and
3
accidents or mistakes in internal procedures, such as fire, explosion or release of toxic or hazardous substances. In all of these cases, our property, third-party property or the environment may sustain damage, or there may be human exposure to hazardous substances, personal injuries or fatalities. Such events could result in material financial liabilities, civil or criminal law consequences, the temporary or permanent closure of the relevant production or administrative sites or power plant and a negative impact on our financial condition, results of operations and cash flows.
We are dependent on major customers for a significant portion of our sales, and a significant adverse change in a customer relationship could adversely affect our business, financial condition, results of operations and cash flows.
Customer concentration is driven by the consolidated nature of the industries we serve. In
2017
, our top ten customers accounted for approximately 48% of our volume in kmt. The top five customers in our Specialty Carbon Black segment and the top five customers in our Rubber Carbon Black segment represented approximately 26% and approximately 51% of our Specialty Carbon Black and Rubber Carbon Black segment volumes measured in kmt for
2017
, respectively. Our success in strengthening relationships and growing business with our largest customers and retaining their business over extended time periods could affect our future results. The loss of any of our major customers (including due to industry consolidation) or a reduction in volumes sold to them, could adversely affect our results of operations. Any deterioration in the financial condition of any of our customers or the industries they serve that impairs our customers’ ability to make payments to us could increase our uncollectible receivables and could adversely affect our business, financial condition, results of operations and cash flows.
We may not be able to compete successfully in the industries and markets in which we operate.
The industries in which we operate are highly competitive and this competition could harm our business, financial condition, results of operations and cash flows. Competition is based on price, product innovation, product quality, distribution capability, and industry and customer knowledge. We face competition from global and regional suppliers, both in developed and in emerging regions. More recently, a significant percentage of tire demand is met by imports from, and a shift in production to, low-cost emerging regions. This has adversely affected utilization rates of carbon black producers in developed regions and resulted in plant closures. While we aim to operate at low cost and are focused on reducing our fixed and variable cost base across our production chain, there may be improvements in the cost competitiveness of other manufacturers relative to us or in the performance properties of substitutable products and raw materials, which could result in advantages for our competitors and adversely affect our business. Furthermore, some of our competitors may have greater financial and other resources and larger capitalization than we do. If we are unable to respond successfully to changing competitive conditions, the demand for our products could be adversely affected.
The markets in which we operate are highly competitive and this competition, and the challenges we face to gain share in those markets and new markets, could harm our business, financial condition, results of operations and cash flows.
We may not successfully develop new products and technologies that address our customers’ changing requirements or competitive challenges, and our customers may substitute our products by using other products we do not offer.
The industries into which we sell our products are subject to periodic technological changes, ongoing product improvements, product substitution and changes in customer requirements. Increased competition from existing or newly developed products offered by our competitors or companies whose products offer a similar or better functionality to our products may negatively affect demand for our products. We work to identify, develop and market innovative products on a timely basis to meet our customers’ changing requirements and competitive challenges. Should we not be able to substantially maintain or further develop our product portfolio, customers may elect to source comparable products from competitors, which could adversely affect our business, financial condition, results of operations and cash flows.
Although carbon black continues to offer opportunities for product and process innovation, we cannot be certain that the investments we make in our Innovation Group will result in proportional increases in revenue or profits. In addition, the timely commercialization of products that we are developing may be disrupted or delayed by manufacturing or other technical difficulties, industry acceptance or insufficient industry size to support a new product, competitors’ new products, and difficulties in moving from the experimental stage to the production stage. These disruptions or delays could adversely affect our business, financial condition, results of operations and cash flows.
As a reinforcing agent in rubber, carbon black competes primarily with precipitated silica in combination with silane, which is not part of our product portfolio. Historically, silica has offered some performance benefits over carbon black in the area of rolling resistance. To date, silica-based tire applications have gained position in passenger car tire treads. Although substitution has not been significant due to carbon black’s cost advantage, technological advances and changing customer requirements may lead to increased demand for silica-based tires, especially in developed regions. For example, Evonik announced in 2010 plans to significantly increase its capacity for precipitated silica to satisfy increasing demand and has since increased its global capacity for precipitated silica significantly. Increased substitution and competition from precipitated silica producers, including Evonik, could adversely affect our business, financial condition, results of operations and cash flows. If we should decide to include precipitated silica in combination with silane in our product portfolio in the future, we may be restricted in our ability to do so under our intellectual property sharing arrangements with Evonik.
Alternative materials, procedures or technologies may be developed, or existing ones may be improved, and may replace those currently offered in the carbon black industry. If such newly developed or improved products are being offered at lower prices, have preferable features or other advantages, in particular from a regulatory perspective, and we are not able to offer similar new or improved products, we may lose substantial business, which could have an adverse effect on our business, financial condition, results of operations and cash flows.
4
We may be unable to implement our business strategies in an effective manner.
Our future financial performance and success largely depend on our ability to maintain our current position and to implement our business strategies for growth successfully. We have undertaken, and will continue to undertake, various initiatives to realign our product portfolio away from standard specialty carbon black and rubber carbon black products to higher margin applications (including the restructuring of our rubber footprint in Korea), and we continue to focus on cost reduction initiatives to optimize our asset base, improve operating efficiencies and generate cost savings. We cannot guarantee that we will successfully implement our business strategies or that implementing these strategies will sustain or improve and not harm our results of operations. In particular, we may not be able to increase or sustain our manufacturing efficiency or asset utilization, enhance our current portfolio of products or achieve other fixed or variable cost savings. In addition, the costs involved in implementing our strategies may be significantly higher than we currently anticipate. For example, our ability to complete capacity expansions as planned may be delayed or interrupted by the need to obtain environmental and other regulatory approvals, the availability of labor and materials, unforeseen hazards, such as weather conditions, adverse political or market developments, and other risks customarily associated with construction projects. Moreover, the cost of expanding capacity could have a negative impact on our financial results until capacity utilization is sufficient to absorb the incremental costs associated with the expansion. Further, labor or governmental restrictions could impede or delay our ability to reduce headcount.
Our business strategies are based on our assumptions about future demand for our products and the new products and applications we are developing and on our continuing ability to produce our products profitably. Each of these factors depends on, among other things, our ability to realign our product portfolio, divest businesses or discontinue product lines on favorable terms and with minimal disruptions, finance our operations and product development activities, maintain high-quality and efficient manufacturing operations, relocate and close certain manufacturing facilities with minimal disruption to our operations, respond to competitive and regulatory changes, access quality raw materials in a cost-effective and timely manner, and retain and attract highly skilled technical, managerial, marketing and finance personnel. Any failure to develop, revise or implement our business strategies in a timely and effective manner may adversely affect our business, financial condition, results of operations and cash flows.
We are subject to volatility in the costs and availability of raw materials and energy, which could decrease our margins and adversely affect our business, financial condition, results of operations and cash flows.
Our manufacturing processes consume significant amounts of raw materials and energy, the costs of which are subject to fluctuations in worldwide supply and demand as well as other factors beyond our control. In
2017
, raw materials accounted for
71%
of our cost of sales. Approximately
90%
of the cost of raw material used in the production of carbon black is related to petroleum-based or coal-based feedstock known as carbon black oil, with some limited use of other raw materials, such as nitrogen tetroxide, hydrogen and natural gas. We obtain a considerable portion of our raw materials and energy from selected key suppliers. Although we maintain raw material reserves, if any of these suppliers is unable to meet its obligations under supply agreements with us on a timely basis or at all, we may be forced to incur higher costs to obtain the necessary raw materials and energy elsewhere or, in certain limited cases, we may not be able to obtain carbon black oil or raw materials at all. Additionally, raw material sourcing and related infrastructure in certain jurisdictions where we operate may be subject to local regulations that may reduce, delay or halt the physical supply of raw materials. Our inability to source quality raw materials or energy in a timely fashion and pass through cost increases to our customers could have an adverse impact on our business, financial condition, results of operations and cash flows.
Most of our carbon black supply contracts contain provisions that adjust prices to account for changes in a relevant feedstock price index. While we have re-negotiated many of our customer contracts to reduce the time-lag after which we are able to pass through changes in carbon black oil prices to our customers, we are still exposed to oil price fluctuations and there can be no assurance that we will be able to shift price risks to our customers. Success in offsetting increased raw material and energy costs with price increases is also influenced by competitive and economic conditions, as well as the speed and severity of such changes, and could vary significantly, depending on the segment served. Such increases may not be accepted by our customers, may not be fully reflected in the indices used in our pricing formulas, may not be sufficient to compensate for increased raw material and energy costs or may decrease demand for our products and our volume of sales. Rapid and significant oil or energy price fluctuations have had and are likely to continue to have significant and varying effects on our earnings and results of operations, partly because oil price changes affect our sales prices and our cost of raw materials and energy at different times and amounts, and partly due to other factors, such as differentials affecting the ultimate carbon black oil price paid by us (versus a particular reference price index), carbon black oil usage amounts and ongoing efficiency initiatives. Failure to fully offset the effects of fluctuating raw material or energy costs could have a material adverse effect on our business, financial condition, results of operations and cash flows. Further, volatility in costs and pricing could result in commercial disputes with suppliers and customers regarding the interpretations of complex contractual pricing arrangements, which could adversely affect our business.
Significant movements in the market price for crude oil tend to create volatility in our carbon black feedstock costs, which can affect both our Net Working Capital and operating results. Changes in raw material and energy prices have a direct impact on our Net Working Capital levels. In general, increases in the cost of raw materials lead to an increase in our Net Working Capital requirements, as our inventories and current trade receivables increase as a result of higher carbon black oil and other feedstock prices and related sales price levels, partially offset by an increase in trade payables. Due to the quantity of carbon black oil and finished goods that we typically keep in stock together with the levels of receivables and payables maintained, increases occur gradually over a two to three-month period but can vary depending on inventory levels and working capital levels generally. Conversely, decreases in the cost of raw materials lead to a decrease in our Net Working Capital requirements within a two to three-month period following the decrease in costs. Net Working Capital swings are particularly significant in an environment of high price volatility such as those seen in the fourth quarter of 2014.
5
Any failure to realize benefits from investments, joint ventures, acquisitions or alliances could adversely affect our business, financial condition, results of operations and cash flows.
We have made, and may continue to make, investments and acquisitions and enter into joint ventures. The success of acquisitions of new technologies, companies and products, or arrangements with third parties is not always predictable and we may not achieve our anticipated objectives. Our investments may require high initial expenditures, and as in the case of Deutsche Gasrußwerke GmbH & Co. KG (the “German JV”), our joint venture with, among others, the tire manufacturers Continental, Pirelli and Goodyear, ongoing expenditures for modernization and expansion may be required. The German JV finances itself independently. However, any potential future lack of external financing sources may jeopardize the joint venture and may result in negative impacts on our own supply chain and business. Our investments can only be operated profitably if their utilization is warranted by corresponding demands. Should we build up overcapacities that remain unused due to erroneous assessments of market development, this could have a material adverse effect on our business, financial condition, results of operations and cash flows.
Plant capacity expansions and site development projects may be delayed or may not achieve the expected benefits.
Our ability to complete as planned capacity expansions and consolidations, including capacity conversions from rubber carbon black to specialty carbon black, and other site development projects, including those associated with yield efficiency improvements, may be delayed, interrupted, or otherwise limited by the need to obtain environmental and other regulatory approvals, unexpected cost increases, availability of labor and materials, unforeseen hazards such as weather conditions, and other risks customarily associated with construction projects. In addition, lower oil prices may result in lower yield efficiency improvements. Moreover, the costs of these activities could have a negative impact on our results of operations, and in the case of capacity expansion projects, until capacity utilization at the particular facility is sufficient to absorb the incremental costs associated with the expansion. In addition, our ability to expand capacity in emerging countries depends in part on economic and political conditions in these regions and, in some cases, on our ability to establish operations, construct additional manufacturing capacity or form strategic business alliances.
The Capital Expenditures we might need to incur in connection with the settlement of our enforcement case with the EPA.
On December 22, 2017, a consent decree between Orion Engineered Carbons LLC and the United States on behalf of U.S. Environmental Protection Agency (“EPA”), as well as the Louisiana Department of Environmental Quality, was lodged in the U.S. District Court for the Western District of Louisiana. Once the consent decree is entered by the court, it will resolve and settle the EPA’s claims of noncompliance set forth in the notices and finding of violations from the EPA with respect to the Company's U.S. facilities. Under the consent decree, amongst other obligations, Orion Engineered Carbons LLC will install certain pollution control technology in order to further reduce SO2, NOx and particulate matter (PM) emissions at its four U.S. manufacturing facilities in Ivanhoe (Louisiana), Belpre (Ohio), Borger (Texas), and Orange (Texas). We estimate that the capital expenditures for these installments, to be incurred over approximately
six
years, are U.S. Dollar
110
to
140
million.
However, the actual capital expenditures we might need to incur in order to fulfill the requirements of the consent decree remain uncertain. In particular, the consent decree allows some flexibility in both locations and technology solutions. The solutions we choose to implement may differ in scope and operation from those we currently anticipate and factors, such as timing, locations, target levels and local regulations, could also make capital expenditures different from what we currently estimate.
We may be subject to information technology systems failures, network disruptions and breaches of data security.
Our information technology systems are an important element for effectively operating our business. Information technology systems failures, particularly in connection with running SAP, including risks associated with upgrading our systems, network disruptions and breaches of data security, could disrupt our operations by impeding our processing of transactions, our ability to protect customer or company information and our financial reporting, and lead to increased costs. It is possible that future technological developments could adversely affect the functionality of our computer systems and require further action and substantial funds to prevent or repair computer malfunctions. Our computer systems, including our back-up systems, could be damaged or interrupted by power outages, computer and telecommunications failures, computer viruses, cybercrimes, internal or external security breaches, events such as fires, earthquakes, floods, tornadoes and hurricanes, or errors by our employees or third party providers. Although we have taken steps to address these concerns by implementing sophisticated network security, back-up systems and internal control measures, there can be no assurance that a system failure or data security breach will not have a material adverse effect on our business, financial condition, results of operations and cash flows.
In addition to supporting our operations, we use our systems to collect and store confidential and sensitive data, including information about our business, our customers and our employees. As our technology continues to evolve, we anticipate that we will collect and store even more data in the future, and that our systems will increasingly use remote communication features that are sensitive to both willful and unintentional security breaches. Much of our value is derived from our confidential business information, including customer data, proprietary technology and trade secrets. To the extent the confidentiality of such information is compromised, we may lose our competitive advantage, and our business, financial condition, results of operations and cash flows may suffer. We also collect, retain and use personal information, including data we gather from customers for product development and marketing purposes, and data we obtain from employees. In the event of a breach in security that allows third parties access to this personal information, we are subject to a variety of laws on a global basis that require us to provide notification to the data owners, and that subject us to lawsuits, fines and other means of regulatory enforcement. Our
6
reputation could suffer in the event of such a data breach, which could cause customers to purchase from our competitors. Ultimately, any compromise of our data security could have a material adverse effect on our business, financial condition, results of operations and cash flows.
If we are unable to successfully negotiate with the representatives of our employees, including labor unions and works councils, we may experience strikes and work stoppages.
We are party to collective bargaining agreements and social plans with our employees’ labor unions. We also are required to consult with our employee representatives, such as works councils, on certain matters such as restructuring, acquisitions and divestitures. Although we believe that our relations with our employees are good, there can be no assurance that new agreements will be reached or consultations will be completed without union or works council actions or on terms satisfactory to us. Current and future negotiations and consultations with employee representatives could have a material adverse effect on our business. In addition, a material work stoppage or union dispute could adversely affect our business, financial condition, results of operations and cash flows.
In 2017, 35 of the former employees in our closed facility in Ambès, France filed claims with the labor court of Bordeaux contesting the termination of their employment and seeking damages. The court has scheduled several hearings on the claims in 2018. We intend to contest these claims and do not believe that their ultimate resolution will have a material adverse effect on our results of operations or financial condition.
We may not be able to recruit or retain key management and personnel.
Our success is dependent on the management and leadership skills of our key management and personnel. The loss of any member of our key management team and personnel or an inability to attract, retain, develop and maintain additional personnel could prevent us from implementing our business strategy. In addition, our future growth and success also depend on our ability to attract, train, retain and motivate skilled managerial, sales, administration, research and development (“R&D”), operating and technical personnel. The loss of one or more member of our key management or operating personnel, or the failure to attract, retain and develop additional key personnel, could have a material adverse effect on our business, financial condition, results of operations and cash flows.
We are exposed to political or country risk inherent in doing business in some countries.
We operate a global network of production plants, located in Europe, North America, South Korea, China, South Africa and Brazil. Accordingly, our business is subject to risks related to the different legal, political, social and regulatory requirements and economic conditions of many jurisdictions. Risks inherent in international operations include the following: changes in the rate of economic growth, unsettled political or economic conditions, expropriation or other governmental actions; social unrest, war, terrorist activities or other armed conflict; national and regional labor strikes, confiscatory taxation or other adverse tax policies, deprivation of contract rights, trade regulations affecting production, pricing and marketing of products; reduced protection of intellectual property rights; restrictions on the repatriation of income or capital, exchange controls, inflation, deflation, currency fluctuations and devaluation, the effect of global environmental, health and safety issues on economic conditions, market opportunities and operating restrictions, changes in foreign laws and tax rates, changes in trade sanctions that result in losing access to customers and suppliers in those countries, costs associated with compliance with anti-bribery and anti-corruption laws, nationalization of private enterprises by foreign governments, and changes in financial policy and availability of credit or financing sources. These factors could adversely affect our business, financial condition, results of operations and cash flows.
Legal and Regulatory Risks
Our operations are subject to environmental, health and safety regulations. We have been and may in the future be subject to investigations by regulatory authorities in respect of alleged violations and may incur significant costs to maintain compliance with, and to address liabilities under, these laws and regulations.
We are subject to extensive domestic, foreign, federal, state and local laws and regulations governing environmental protection and occupational health and safety, all of which may be subject to change in the future. The production and processing of carbon black and other chemicals we produce involve the handling, transportation, manufacture, use and disposal of substances or components that may pose environmental risks or be considered toxic, hazardous or carcinogenic under these laws. We are also required to obtain permits or other approvals from various regulatory authorities for our operations, which may be required for matters including air emissions; wastewater and storm water discharges; storage, handling and disposal of hazardous substances; and operation, maintenance and closure of landfills. If we violate or otherwise fail to comply with these laws, regulations or permits or other approvals, we may incur fines or other sanctions, be required to undertake significant capital expenditures to achieve compliance, or be subject to other obligations by one or more regulatory authorities.
If environmental harm to soil, groundwater, surface water or natural resources is found to have occurred as a result of our current or historical operations, we may be required to incur significant remediation costs at our current or former production facilities or at third-party sites. Many of our facilities have a long history of operation, which may contribute to our environmental compliance and remediation costs due to past spills, chemical storage, wastewater treatment and waste disposal practices and other activities. For instance, many of our facilities have onsite landfills that have been in use for a number of years, and we may incur significant costs when these landfills reach capacity in order to close them in accordance with applicable laws and regulations and to address contamination of soil and groundwater at, under or migrating from the facilities, including costs to address impacts to natural resources. Under certain laws and regulations, the obligations to investigate and remediate contamination at a facility or site may be imposed on current and former owners or operators, or on persons who may have sent waste to that facility or site for disposal. Liability under such laws and regulations may be without regard to fault or to the
7
legality of the activities giving rise to the contamination. As a result, we may incur liabilities for wastes, including hazardous wastes, generated by our operations and disposed of onsite or at offsite locations, even if we were not responsible for the disposal. Further, we may also incur additional closure and cleanup costs in connection with the closure of plants, including costs relating to decommissioning of equipment, asbestos removal and closure of features such as storage tanks, wastewater treatment systems, ponds and landfills.
Environmental and safety regulations are subject to frequent change, as are the priorities of those who enforce them, and we could incur substantial costs to comply with future laws and regulations. The trend in environmental regulation is imposing increasingly stringent restrictions on activities that may affect the environment. Any new or amended environmental laws and regulations may result in costly measures for matters subject to regulation, including but not limited to more stringent limits or control requirements for our air emissions; new or increased compliance obligations relating to greenhouse gas (“GHG”) emissions; stricter requirements for noise, waste handling, storage, transport, disposal, wastewater and storm water discharges; and more stringent cleanup and remediation standards, which, in each case, could have a material adverse effect on our operations and financial condition.
Certain national and international health organizations have classified carbon black as a possible or suspect human carcinogen. To the extent that, in the future, (i) these organizations re-classify carbon black as a known or confirmed carcinogen, (ii) other organizations or government authorities in other jurisdictions classify carbon black or any of our other finished products, raw materials or intermediates as suspected or known carcinogens or (iii) there is discovery of adverse health effects attributable to the production or use of carbon black or any of our other finished products, raw materials or intermediates, we could be required to incur significantly higher costs to comply with environmental, health and safety laws, or to comply with restrictions on sales of our products, and our reputation and business could be adversely affected. In addition, chemicals that are currently classified as harmless may be classified as dangerous in the future, and our products may have characteristics that are not recognized today but may be found in the future to impair human health or to be carcinogenic. See “
Item 4. Information on the Company
—B. Business Overview —Environmental, Health and Safety Matters
.”
Developing regulation of carbon black as a nano-scale material could require us to comply with costly new requirements.
Carbon black consists of aggregates or agglomerates of primary particles that are nano-scale. The EPA and other governmental agencies are currently developing a regulatory approach under which they will collect further data on nano-scale materials, including carbon black, under the Toxic Substances Control Act. The EPA has proposed rules that would require manufacturers of nano-scale materials to submit additional manufacturing information, exposure and release information and available health and safety data. The EPA and other nations’ environmental regulatory authorities, including the European Commission, are also conducting extensive environmental health and safety testing of nano-scale materials. If carbon black is found to be harmful to humans or to the environment, it could be subject to more stringent regulatory control, which could require us to incur significantly higher costs to comply with new environmental, health and safety laws and could adversely affect our reputation and business. See “
Item 4. Information on the Company
—B. Business Overview—Environmental, Health and Safety Matters
.”
In connection with such regulation, the European Commission is in the process of defining “nano-material. According to its recommendation of October 18, 2011 (2011/696/EU) carbon black is defined as a nano-material. In a similar approach, the International Organization for Standardization (“ISO”) developed the ISO TC 229 “Nanotechnologies,” which considers carbon black a “nano-structured material.” The industry is not yet generally affected by these definitions. However, certain regulations regarding cosmetics applications or articles which are intended for food contact have already been implemented, and other regulations are being discussed which may affect the use of carbon black in the future. This development may significantly affect our business in a manner we cannot predict, including by increasing the costs of doing business.
Regulations requiring a reduction of greenhouse gas emissions could adversely affect our business, financial condition, results of operations and cash flows.
Significant volumes of carbon dioxide (“CO
2
”), a GHG, are emitted in carbon black manufacturing processes. Over the past few decades, concerns about the relationship between GHGs and global climate change have resulted in increased levels of scrutiny from regulators and the public alike, and have led to proposed and enacted regulations on both national and supranational levels, to monitor, regulate and control emissions of CO
2
and other GHGs.
In December 2005, the European Commission published a directive that includes carbon black manufacturing in the combustion sector and in Phase II of the Emissions Trading Scheme for GHGs for the period from 2008 to 2012. The European Commission has developed allowable emission credits for Phase III of the Emissions Trading Scheme (the “ETS”), which apply for the period 2013 to 2020. The ETS is anticipated to become progressively more stringent over time, which could have an impact on our costs of compliance under the ETS. The European Union member states (“EU Member States”) have included carbon black facilities in their national allocation plans, and we have taken actions to comply with applicable CO
2
emission requirements. Certain industry sectors in the European Union, including the carbon black industry, currently receive a certain share of their emission allowances for free. This list of industry sectors is reviewed by the European Commission every five years, with the latest review in October 2014. Although the carbon black industry retained its placement in the 2014 review, we cannot predict the outcome of a future review by the European Commission. On January 24, 2017 the European Commission issued a decision with recalculated correction factors for CO
2
emission certificates from 2013 to 2020. Currently, it is not clear whether the German Emissions Trading Authority (DEHSt) will apply the new factors to allocations granted in the past. Additionally, there can be no assurance that we will be able to purchase emissions credits if our carbon black operations generate more CO
2
than our allocations permit or that the cost of such credits will not be excessive.
8
In addition, effective January 2015, South Korea commenced a GHG emissions trading scheme (“South Korean ETS”), with the goal of achieving a 37% reduction in GHG emissions relative to the projected business-as-usual case by 2030. Participation is mandatory for South Korean legal entities that emit over 125,000 tons of CO2 equivalent (“tCO2e”) annually and for workplaces that discharge over 25,000 tCO2e annually. The design concept of the South Korean ETS is similar to the European ETS. The South Korean ETS covers industries (including the petrochemical sector), electric power producers, the transportation sector and commercial properties, among others, including our South Korean operating entity. The emissions allowance allocated to our South Korean operating entity in 2015 was set at 88% (“Allocation Rate”) of the projected emissions when operating at full capacity. The Allocation Rate was reduced to 84% in 2016 and 82% in 2017. We initially sought administrative relief by appealing to South Korea’s Environment Ministry—subsequently succeeded by the Ministry of Trade, Industry and Energy (“Ministry”)—under Article 38 of the GHG Emissions Allowance and Trading Act to effectively seek an increase in the allowance. When this appeal failed to deliver the desired outcome, we filed a legal action with the Seoul Administrative Court (“Trial Court”) against the Ministry in February, 2015 to seek judicial relief. On February 2, 2017, the Trial Court rendered a verdict in favor of the Ministry. We filed an appeal to the appellate court in February 2017, but the Trial Court's decision was affirmed on July 11, 2017. We have purchased adequate amount of carbon credits to cover the expected deficits for the first three year carbon trading period (2015-17). On August 8, 2017, we appealed the appellate court's decision with the South Korean Supreme Court, where the case remains pending. It is difficult to assess at this time our chances of success in the appeal process.
In June 2016 the Republic of South Africa issued a draft regulation pertaining to “Carbon Offsets.” Our business operation in South Africa is subject to the newly developed GHG-related law Carbon Tax Bill. Although this law was intended to be in effect from January 1, 2017, it is still in draft form, the second draft proposal has been issued by the SA Treasury Ministry on Dec 26, 2017. As the next step, a public hearing process has been started and led by the Parliament sometime in 2018, therefore the final law may not be in force until 2019. The carbon black process is listed on Table 3 of this bill and a process emission factor was determined for a ton of carbon black produced using furnace black technology. The required tax payment would become due semi-annually. Taking into consideration our expected production levels in Port Elizabeth, the bill likely will have a significant financial impact on our business performance in South Africa.
The international community continues to negotiate a binding treaty that would require reductions in GHG emissions by developed countries. In addition, a number of further measures addressing GHG emissions may be implemented, such as a successor international agreement, if any, to the Kyoto Protocol and the European Union’s proposal to consider raising its commitment to reduce carbon emissions by 2020 from a 20% to a 40% reduction by 2030 (compared to 1990 emission levels). The United Nations Conference on Climate Change in December 2015 led to the creation of the Paris Agreement and encourages countries to continuously review and improve their GHG emission reduction goals. While signing the Paris Agreement does not legally bind countries to reduce GHG emissions, countries that participate may respond by enacting legislation or regulations in order to progress in lowering GHG emissions. In the United States, Congress has from time to time considered legislation to reduce emissions of GHGs, but no comprehensive legislation has been enacted to date, and significant uncertainty currently exists as to how any such GHG legislation or regulations would impact large stationary sources, such as our facilities in Belpre (Ohio), Borger (Texas), Orange (Texas) and Ivanhoe (Louisiana), and what costs or operational changes these regulations may require in the future. Further, almost one-half of the U.S. states have taken legal measures to reduce emissions of GHGs, primarily through the development of GHG emission inventories and/or regional or state GHG cap-and-trade programs. There are also ongoing discussions and regulatory initiatives in other countries, including in Brazil where we have facilities, regarding GHG emission reduction programs, but those programs have not yet been defined. There is no assurance that, in the future, the current level of regulation will continue in the jurisdictions where we operate.
Compliance with current or future GHG regulations governing our operations, including those discussed above, may result in significantly increased capital expenditures for measures such as the installation of more environmentally efficient technology or the purchase of allowances to emit carbon dioxide or other GHGs. While their potential effect on our manufacturing operations or financial results cannot be estimated, it could be substantial. There is no way to predict the form that future regulations may take or to estimate any costs that we may be required to incur with respect to these or any other future requirements. In addition to the increased expenditures outlined above, such requirements could also adversely affect our energy supply, or the costs (and types) of raw materials we use, and ultimately may directly or indirectly restrict our operations or reduce demand for our products. The realization of any or all of these consequences could have a material adverse effect on our business, financial condition, results of operations and cash flows. See “
Item 4. Information on the Company
—B. Business Overview—Environmental, Health and Safety Matters.”
As a company in the chemical sector, our operations have the potential to cause environmental and other damage as well as personal injury.
The operation of a chemical manufacturing business as well as the sale and distribution of chemical products involve safety, health and environmental risks. For example, the production and processing of carbon black and other chemicals involves the storage, handling, transportation, manufacture or use of certain substances or components that may be considered toxic or hazardous. Our manufacturing processes and the storage and transportation of chemical products entail risks such as leaks, fires, explosions, toxic releases or mechanical failures. If operational risks materialize, they could result in injury or loss of life, damage to the environment or damage to property. In addition, the occurrence of material operating problems at our facilities due to any of these hazards may result in loss of production, which, in turn, may make it difficult for us to meet customer needs. Accordingly, these hazards and their consequences could have a material adverse effect on our business, financial condition, results of operations and cash flows, both during and after the period of operational difficulties, and could harm our reputation.
9
The European Union REACh legislation or similar legislation in other countries may affect our ability to manufacture and sell certain products.
In December 2006, the European Union signed the REACh (Registration, Evaluation, Authorisation and Restriction of Chemicals) legislation. This legislation requires chemical manufacturers and importers in the European Union to demonstrate the safety of the chemical substances contained in their products through a substance registration process. We have registered under REACh, which is a functional prerequisite to the continued sale of our products in the European Union markets. REACh presents a risk to the continued sale of our products in the European Union should our existing classification registration no longer apply as a result of changes in the interpretation of REACh by the authorities, changes in our product mix or purity, or if the European Union seeks to ban or materially restrict the production or importation of the chemical substances used in our products. In March 2016, the European Chemical Agency (ECHA) announced a carbon black substance evaluation, and carbon black was included in the Community Rolling Action Plan (CoRAP). CoRAP listed substances have been prioritized for substance evaluation. The reasons for including carbon black in CoRAP are carbon black being suspected of posing a risk to human health (carcinogenic, suspected reproduction toxicant), exposure of workers, exposure of sensitive populations and a high (aggregated) tonnage and use potential. The start of this evaluation, which will be conducted by ANSES (the French Agency for Food, Environmental and Occupational Health & Safety) is scheduled for 2019 and its outcome will be of significant importance for the carbon black industry.
Additionally, other organizations and countries, including South Korea and China, have adopted or may in the future adopt comparable or even more restrictive regulations than REACh, which could affect our ability to manufacture and sell certain products in the future.
In certain jurisdictions, carbon black has been added to lists of hazardous products that are subject to labeling and other requirements. Compliance with these requirements is required to sell our products in these jurisdictions, and noncompliance may result in material fines or penalties. Changes in the classification of carbon black on these lists or to the applicable regulations could result in more stringent or new requirements and adversely affect our compliance costs. See “
Item 4. Information on the Company
—B. Business Overview—Environmental, Health and Safety Matters
.”
Market and regulatory changes may affect our ability to sell or otherwise benefit from co-generated energy, which may adversely affect our business, results of operations and cash flows.
Currently, nine of our manufacturing sites have some form of co-generation transforming combustible exhaust gas, the main by-product of the carbon black production process, into electricity, steam or hot water. Some of this co-generated energy is self-consumed and the excess may be sold to third parties. Our ability to benefit from co-generation, and in particular our ability to sell it to third parties, may be limited due to general market conditions or regulatory changes, which may adversely affect our business, results of operations and cash flows.
For example, in December 2013, the European Commission opened an in-depth investigation procedure regarding certain exemptions from an energy surcharge granted under the German Renewable Energies Act (Erneuerbare-Energien-Gesetz or “EEG”). Under the EEG, energy intensive industries are exempted to a large extent from the energy surcharge that aims to balance above-market payments for green energy. Another exemption exists for the consumption of self-generated electricity. The German legislature amended the national regulations of the EEG in August 2014. Under new regulations, the exemption regarding self-consumption (
Eigenverbrauch
) of self-produced electricity is grandfathered for power plants that were installed before August 1, 2014. We are exempted from the energy surcharge under the current law to the extent that we consume our self-produced energy. However, a potential loss of this benefit due to a future change in legislation or a change in the setup of any of our plants may adversely affect our business, results of operations and cash flows.
Litigation or legal proceedings could expose us to significant liabilities and thus adversely affect our business, financial condition, results of operations and cash flows.
We become, from time to time, involved in various claims and lawsuits arising in the ordinary course of our business. Also, certain asbestos related claims have been filed with respect to time periods when Evonik and other preceding owners were in control of our business. Some of those claims are subject to a limited indemnity from Evonik under the agreements related to the Acquisition. Some matters involve claims for large amounts of damages as well as other relief. Additional claims by (former) employees based on alleged past exposure to asbestos may be received in the future.
The outcome of legal proceedings is extremely difficult to predict and we offer no assurances in this regard. Adverse rulings, judgments or settlements in pending or future litigation, including employment-related litigation, contract litigation, product liability claims, personal injury claims, claims based on alleged exposure to asbestos, chemicals or to carbon black, environmental permitting disputes or in connection with environmental remediation activities, could have an adverse effect on our business, financial condition, results of operations and cash flows.
Because many of our products provide critical performance attributes to our customers’ applications and products, the sale of these products involves a risk of product liability claims against us, including claims arising in connection with the use of, or exposure to, our products. Our products have widespread end-uses in a variety of consumer industries. A successful product liability claim, or series of claims, arising out of these various uses that results in liabilities in excess of our insurance coverage or for which we are not indemnified or have not otherwise provided, could have a material adverse effect on our business, financial condition, results of operations and cash flows. In particular, we could be required to increase our debt or divert resources from other investments in our business in order to discharge any such liabilities.
10
We may not be able to protect our intellectual property rights successfully and we are still subject to restrictions and risks associated with our intellectual property sharing arrangements with Evonik.
Our intellectual property rights are important to our success and competitive position. We own various patents and other intellectual property rights, and have licenses to use intellectual property rights covering some of our products as well as certain processes and product uses. We often choose not to seek to patent a production method or product in order to avoid disclosure of business specific know-how. In addition to patents, a significant part of our intellectual property are our trade secrets, general know-how and experience regarding manufacturing technology, plant operation and quality management, which third parties, including our competitors, may develop independently without violating our trade secret rights. We make careful assessments with respect to production process improvements and decide whether to apply for patents or retain and protect them as trade secrets. In some of the countries in which we operate or sell products, such as China, the laws protecting patent holders are significantly weaker than in the United States, the European Union and certain other developed countries. When we file a patent application, it is usually filed for all countries with active competition, where we have existing customers. Nonetheless, because the laws and enforcement mechanisms in some countries may not be as effective as in others, and because our intellectual property rights may, if asserted, ultimately be found to be invalid or unenforceable, we may not be able to protect all of our intellectual property rights successfully. Insufficient protection of intellectual property may limit our ability to make use of technological advantages or result in a reduction of future profits. This may cause competitive restrictions with an adverse effect on our business, financial condition, results of operations and cash flows.
Irrespective of our intellectual property rights, we may be subject to claims that our products, processes or product uses infringe or misappropriate the intellectual property rights of others. These claims, even if without merit, could be expensive and time consuming to litigate. If we were to lose such proceedings, we could be subject to injunctions, obliged to pay damages or enter into licensing agreements requiring royalty payments and use restrictions, all of which could adversely affect our business, financial condition, results of operations and cash flows. In addition, licensing agreements may not be available to us, and, if available, may not be available to us on acceptable terms.
In connection with the separation of our business from Evonik as part of the Acquisition, Evonik assigned to us intellectual property that was exclusively used in its carbon black business as well as certain intellectual property rights that are still in use in its retained business. Evonik retained ownership of certain intellectual property that is not material to us. Evonik has granted us a non-exclusive license to use such retained intellectual property in the field of carbon black. In addition, we have granted back to Evonik licenses relating to some of our intellectual property rights to use such intellectual property in all fields outside the field of carbon black, which licenses are exclusive, subject to certain exceptions in areas adjacent to carbon black. Accordingly, we may be restricted in leveraging the intellectual property that we use on the basis of a license from Evonik or the intellectual property that is subject to the grant-back licenses to expand our business into fields outside of carbon black.
We may be affected by recently enacted tax legislation in the United States.
On December 22, 2017, the president of in the United States signed into law the Tax Cuts and Jobs Act of 2017, which includes substantial changes to the U.S. federal income taxation of individuals and businesses. Although the new law substantially decreases tax rates applicable to corporations in the U.S., we do not yet know what all of the consequences of this new statute will be. In particular, significant uncertainties remain as to how the U.S. government will implement the new law. Given the swift enactment late in the year, it is possible that the Company has not yet fully considered potential implications of the new legislation, including any unintended consequences.
Risks Related to Indebtedness, Currency Exposure and Other Financial Matters
Our significant leverage may make it difficult for us to service our debt and operate our businesses.
Although we have repaid
€120.7
million of our €665 million debt since the refinancing in July 2014, we are highly leveraged with significant debt service obligations and expect to continue to have high leverage for the foreseeable future. We may also incur more debt in the future. This may have important negative consequences for our business and investors, including requiring that a substantial portion of the cash flows from our operations be dedicated to debt service obligations; reducing the availability of cash flows to fund internal growth through working capital, capital expenditures, other general corporate purposes and payments of dividends; increasing our vulnerability to economic downturns in our industry; exposing us to interest rate increases on our existing indebtedness and indebtedness that we may incur in the future; placing us at a competitive disadvantage compared to our competitors that have less debt in relation to cash flows; limiting our flexibility in planning for or reacting to changes in our business and our industry; restricting us from pursuing strategic acquisitions or exploiting certain business opportunities; and limiting, among other things, our ability to borrow additional funds or raise equity capital in the future and increasing the costs of such additional financings.
If our future cash flows from operations and other capital resources are insufficient to pay our obligations as they mature or to fund our liquidity needs, we may be forced to reduce or delay our business activities and capital expenditures, sell assets, obtain additional debt or equity financing or restructure or refinance all or a portion of our debt on or before maturity. In the worst case scenario, an actual or impending inability to pay debts as they become due and payable could result in our insolvency.
Restrictive covenants in our debt instruments may limit our ability to operate our business. Our failure to comply with these covenants, including as a result of events beyond our control, could result in an event of default that may adversely affect our business, financial condition, results of operations and cash flows.
11
Our current debt instruments impose significant operating and financial restrictions on us. These restrictions include limitations on our ability to, among other things, merge or consolidate with other companies; sell, lease, transfer or dispose of assets; pay dividends, redeem share capital or redeem or reduce subordinated indebtedness; and make acquisitions or investments.
Our debt instruments contain covenants that may adversely affect our ability to finance our future operations and capital needs and to pursue available business opportunities. Our ability to comply with these provisions may be affected by changes in economic or business conditions or other events beyond our control. In addition, our debt instruments contain cross-default provisions such that a default under one particular financing arrangement could automatically trigger defaults under other financing arrangements and cause such indebtedness to become due and payable, together with accrued and unpaid interest. As a result, any default under an indebtedness to which we are party could result in a substantial loss to us and could adversely affect our business, financial condition, results of operations and cash flows.
A deterioration in our financial position or a downgrade of our ratings by a credit rating agency could increase our borrowing costs and our business relationships could be adversely affected.
A deterioration of our financial position or a downgrade of our credit ratings for any reason could increase our borrowing costs and have an adverse effect on our business relationships with customers, suppliers and hedging counterparties. We may enter into various forms of hedging arrangements against currency, interest rate or oil price fluctuations. Financial strength and credit ratings are important to the availability and pricing of these hedging activities. As a result, any downgrade of our credit ratings may make it more costly for us to engage in these activities, and changes to our level of indebtedness may make it more difficult or costly for us to engage in these activities in the future.
In addition, a downgrade could adversely affect our existing financing, limit access to the capital or credit markets, or otherwise adversely affect the availability of other new financing on favorable terms, if at all, result in more restrictive covenants in agreements governing the terms of any future indebtedness that we incur, increase our borrowing costs, or otherwise adversely affect our business, financial condition, results of operations and cash flows.
Fluctuations in foreign currency exchange and interest rates could adversely affect our business, financial condition, results of operations and cash flows.
We are exposed to market risks relating to fluctuations in foreign currency exchange and interest rates. Our results of operations may be affected by both the transaction effects and the translation effects of foreign currency exchange rate fluctuations. We are exposed to currency fluctuation when we convert currencies that we may receive for our products into currencies required to pay our debt, or into currencies in which we purchase raw materials, meet our fixed costs or pay for services, which could result in a gain or loss depending on fluctuations in exchange rates. Fluctuations in currency exchange rates could require us to reduce our prices to remain competitive in foreign markets. In each case, the relevant income or expense is reported in the relevant local currency and translated into Euro at the applicable currency exchange rate for inclusion in our consolidated financial statements. Therefore, our financial results in any given period are materially affected by fluctuations in the value of the Euro relative to other currencies, in particular the U.S. Dollar and the Korean Won. Generally, an appreciation of the U.S. Dollar has a negative impact on (by increasing) our Net Working Capital, because a large part of our raw material purchases is in U.S. Dollars. In addition, 42.2% of our outstanding debt obligations are denominated, pay interest in and must be repaid in U.S. Dollars (and certain of our future debt obligations may be denominated in U.S. Dollars), and therefore expose us to additional exchange rate risks. An appreciation of the U.S. Dollar would make our financing under U.S. Dollar-denominated instruments more expensive. Significant changes in the value of the Euro relative to the other currencies could have a material adverse effect on our business, financial condition, results of operations and cash flows. In addition, we are exposed to adverse changes in interest rates. We manage our foreign exchange risk through normal operating and financing activities and, when deemed appropriate, through the selective use of derivative transactions, the effectiveness of which is dependent, in part, upon the counterparties to these contracts honoring their financial obligations to us. We cannot be certain that we will be successful in reducing the risks inherent in exposures to foreign currency and interest rate fluctuations, and our financial results could be adversely affected.
From time to time, it may be necessary for us to enter into hedging arrangements to reduce the impact of price and exchange rate volatility. Unavailability or inefficiency of hedging could adversely affect our business, financial condition, results of operations and cash flows.
In the past, we have entered into certain hedging arrangements to reduce the impact of raw material and energy price volatility as well as interest rate and currency exchange rate fluctuations. Since 2011, we began the discontinuation of our raw material hedging policy to protect us against the time-lag exposure between contract oil price adjustments. Generally, we incorporate flexible pricing formulas into our feedstock and sales contracts in an effort to offset price volatility. Based on volumes in kmt in
2017
, approximately 35% of our contracts were non-indexed (approximately 26% in our Rubber Carbon Black segment and approximately 65% in our Specialty Carbon Black segment). Approximately 65% of our contracts are formally based on index price adjustments. In regions where pricing formulas are less prevalent we stipulate regular raw material cost adjustments in our customer agreements. A one-month price adjustment mechanism typically results in a two-month delay in reflecting oil price changes in our customer pricing, while the quarterly price adjustment mechanism typically results in a four-month delay. There is no assurance that such formulas in our contracts will fully protect against price volatility, particularly in periods of rapid and significant oil price fluctuations. Starting in 2016, we have entered from time to time into limited short-term commodity derivatives for a specific carbon black oil grade. It may be necessary for us to enter into hedging arrangements in the future to reduce the impact of raw material or energy price volatility or currency and exchange rate fluctuation, which may or may not be effective. The use of derivative hedging instruments is generally dependent on the availability of adequate credit lines with appropriate financial institutions. As a result, we could be
12
unable to use derivative financial instruments in the future, to the extent necessary or on commercially reasonable terms, and any hedging strategy we employ could therefore be adversely affected. The effectiveness of our derivative hedging instruments will also depend on the relevant hedging counterparties honoring their financial obligations. Any failure by a hedging counterparty to perform its obligations could adversely affect our business, financial condition, results of operations and cash flows.
We are exposed to substantial risks with regard to the Euro.
Since 2010, global markets and economic conditions have been negatively affected by market perceptions regarding the ability of certain EU Member States to service their sovereign debt obligations, including Greece, Italy, Ireland, Portugal and Spain. Concerns also persist regarding the outcome of the EU governments’ financial support programs, the possibility that other EU Member States may experience similar financial difficulties, the overall stability of the Euro and the suitability of the Euro as a single currency given the diverse economic and political circumstances in individual EU Member States. This has in the past disrupted equity markets and resulted in volatile bond yields on the sovereign debt of EU Member States leading to a general increase in credit spreads, together with reduced liquidity on the market.
Ongoing deterioration of the sovereign debt of certain EU Member States together with the risk of contagion to other, more stable, countries have raised multiple concerns as to the stability and the overall standing of the European Monetary Union. Concerns that the Eurozone sovereign debt crisis could worsen may lead to the re-introduction of individual currencies in one or more EU Member States, or, in particularly dire circumstances, the possible dissolution of the Euro entirely. This has caused macroeconomic disruption and might also do so going forward. In addition, uncertainties remain in Europe following the United Kingdom’s “Brexit” vote, which has caused significant volatility in global financial markets and had an adverse effect in the exchange rate of the Euro with respect to the U.S. Dollar. “Brexit” and upcoming elections in Europe may further affect global financial markets and the Euro - U.S. Dollar exchange rate.
Furthermore, should the Euro dissolve entirely, the legal and contractual consequences for holders of Euro-denominated obligations and for parties subject to other contractual provisions referencing the Euro would be determined by laws in effect at such time. These potential developments, or market perceptions concerning these and related issues, could have adverse consequences for us with respect to our outstanding Euro-denominated debt obligations and, as we have a substantial amount of debt denominated in Euro, could adversely affect our business, financial condition, results of operations and cash flows.
Dislocations in credit and capital markets may make it more difficult for us and our suppliers and customers to borrow money or raise capital.
The ongoing economic weakness in many regions worldwide has affected, and may continue to affect, us in several ways. Dislocations in the credit markets may result in less credit being made available by banks and other lending institutions. As a result, we may not be able to obtain financing for our business and acquisitions or to pursue other business plans or make necessary investments, which could have a material adverse effect on our business, financial condition, results of operations and cash flows.
Furthermore, a number of our customers and suppliers rely on access to credit to adequately fund their operations, which may also be limited due to dislocations in the credit markets. The inability of our customers to obtain credit facilities or capital market financing may adversely affect our business by reducing our sales and increasing our exposure to bad debt, while the inability of our suppliers to access adequate financing may adversely affect our business by increasing prices for raw materials, energy and transportation.
In addition, payments received from customers that later enter into insolvency or comparable proceedings under applicable laws may be subject to clawback risks.
Inflation or deflation could adversely affect our business, financial condition, results of operations and cash flows.
Inflation in certain countries where we operate may adversely affect our business by increasing the cost of raw materials, energy, labor and transportation. Current or future efforts by governments to stimulate the economy may increase the risk of significant inflation. In the event of an increase in inflation, we may seek to increase the sales prices of our products in order to maintain satisfactory margins; however such increases may not be accepted by our customers, may not be sufficient to compensate for the negative impact of inflation or may decrease demand for our products and our volume of sales. If we are not able to fully offset the effects of increased inflation, it could have a material adverse effect on our business, financial condition, results of operations and cash flows.
Alternatively, a significant period of deflation could cause a decrease in overall spending and borrowing levels. This could lead to a further deterioration in economic conditions. Deflation also may delay consumption of our customers’ products resulting in lower demand for our products.
We may be required to impair or write off certain assets if our assumptions about future sales and profitability prove incorrect.
In analyzing the value of our inventory, property, plants and equipment, investments and intangible assets, we have made assumptions about future sales (prices and volume), costs and cash generation. These assumptions are based on management’s best estimates and, if the actual results differ significantly from these assumptions, we may not be able to realize the value of the assets recorded, which could lead to an impairment or write-off of certain of these assets. We may be required to impair or write off other assets in the future, which could have a material adverse effect on our business, financial condition and results of operations.
13
We may be required to increase our pension fund contributions.
We have made pension commitments to our existing and some of our former employees. These commitments are partially covered by pension schemes, pension and benevolent funds and insurance policies some of which are maintained by previous employers. The amount of obligations is based on certain actuarial assumptions, including discount factors, life expectancy, pension trends and future salary development as well as expected interest rates applicable to the plan assets. Actual results deviating from these assumptions could result in a considerable increase of our pension commitments and liabilities and higher allocations to the pension reserves in future years, which could have a material adverse effect on our business, financial condition, results of operations and cash flows. For a more detailed description of our defined benefit plans see our consolidated financial statements and the related notes included in “
Item 18. Financial Statements
”
of this report.
Our insurance coverage may not be adequate to cover all the risks we may face and it may be difficult to obtain replacement insurance on acceptable terms or at all.
Our plants, equipment and other assets are insured for property damage and business interruption risks, and our business as a whole is insured for public and products liability risks as well as certain bad debt losses in Europe under insurance policies with reputable insurance companies. We believe these insurance policies are generally in accordance with customary industry practices, including deductibles and coverage limits. However, we cannot be fully insured against all potential hazards incident to our business, including losses resulting from war risks or terrorist acts, or all potential losses, including damage to our reputation. Chemical-related assets may be at greater risk of future terrorist attacks than other possible targets in the United States or elsewhere. A direct attack on our assets or assets used by us could have a material adverse effect on our business, financial condition, results of operations and cash flows. Insurance that provides adequate coverage against terrorist attacks has become increasingly expensive and difficult to obtain. If we were to incur a significant liability for which we were not fully insured, it could have a material adverse effect on our business, financial condition, results of operations and cash flows.
Although we attempt to keep insurance premiums low, as a result of market conditions, premiums and deductibles for certain insurance policies can increase substantially and, in some instances, certain insurance may become unavailable at a reasonable cost or available only for certain risks. We can provide no assurances that we would be able to obtain replacement insurance on acceptable terms or at all.
Significant changes in our jurisdictional earnings mix or in the tax laws of those jurisdictions, as well as changes in their interpretation, could adversely affect our business, financial condition, results of operations and cash flows.
Our future tax rates may be adversely affected by a number of factors, including the enactment of new tax legislation such as the recent U.S. tax reform, other changes in tax laws or the interpretation of such tax laws, changes in the estimated realization of our net deferred tax assets (arising, among other things, from tax loss carry forwards and the Acquisition), the jurisdictions in which profits are determined to be earned and taxed, adjustments to estimated taxes upon finalization of various tax returns, increases in expenses that are not deductible for tax purposes, including write-offs of acquired in process R&D and impairment of goodwill in connection with acquisitions, changes in available tax credits and additional tax or interest payments resulting from tax audits with various tax authorities. Losses for which no tax benefits can be recorded could materially impact our tax rate and its volatility from period to period. Any significant change in our jurisdictional earnings mix or in the tax laws in those jurisdictions, as well as changes in their interpretation, could increase our tax rates and adversely affect our financial results in those periods.
Our agreements with Evonik in connection with the Acquisition require us to indemnify Evonik with respect to certain aspects of our business and require Evonik to indemnify us for certain retained liabilities. We cannot offer assurance that we will be able to enforce claims under these indemnities as we expect.
In connection with the Acquisition, we agreed to indemnify Evonik with respect to future liabilities related to our business and Evonik agreed to indemnify us, subject to certain limitations, for certain liabilities that it agreed to retain. Our potential exposure for such liabilities could be significant and the scope and terms of these indemnities may be less favorable than the potential terms of a similar agreement with an unaffiliated third party. There can be no assurance that we will be able to enforce our claims under the indemnity from Evonik. Even if we ultimately succeed in recovering from Evonik any amounts for which we are held liable, we may be temporarily required to bear these losses ourselves. In addition, our ability to enforce claims under our indemnity from Evonik is dependent on Evonik’s creditworthiness at the time we seek to enforce these claims, and there can be no assurance as to what Evonik’s financial condition will be in the future.
In particular, the agreement with Evonik provides for a partial indemnity from Evonik against various exposures, including, but not limited to, capital investments, fines and costs arising in connection with Clean Air Act violations that occurred prior to July 29, 2011. Almost all of the allegations made by the EPA with regard to Company’s U.S. facilities relate to alleged violations before July 29, 2011. The indemnity provides for a recovery from Evonik of a share of the costs (including fines), expenses (including reasonable attorney’s fees, but excluding costs for maintenance and control in the ordinary course of business and any internal cost of monitoring the remedy), liabilities, damages and losses suffered and is subject to various contractual provisions including provisions set forth in the Share Purchase Agreement with Evonik, such as a de minimis clause, a basket, overall caps (which apply to all covered exposures and all covered environmental exposures, in the aggregate), damage mitigation and cooperating requirements, as well as a statute of limitations provision. Due to the cost-sharing and cap provisions in Evonik’s indemnity, we expect that substantial costs we will incur in the EPA enforcement initiative and its respective settlement could exceed the scope of the indemnity, perhaps in the tens of millions of Euros. In addition, Evonik has signaled that it may likely defend itself against claims under the indemnity; while we intend to enforce our rights vigorously, there is no assurance that we will be able to recover costs or expenditures incurred under the indemnity as we expect or at all.
14
We could experience a material adverse effect on our financial condition if the tax authorities were to successfully challenge decisions and assumptions we have made in assessing and complying with our tax obligations.
We make, and have in the past made, numerous decisions and assumptions in assessing and complying with our tax obligations, including in respect of the tax treatment of the separation of our business from Evonik, the Acquisition, assumptions regarding the tax deductibility of certain interest expenses under German tax regulations, the upholding and recognition of our German tax group and the applicability of the regulations to our business as a group headquartered by a Luxembourg company. Many of the tax laws that apply to us, including tax laws that apply to the separation of our business from Evonik and the Acquisition, are complex and often require judgments to be made when the law is unclear or the facts are uncertain. While we believe the decisions we have made and the assumptions and practices we have applied are reasonable and accurate, we cannot guarantee that these decisions, assumptions and practices will not be questioned or rejected by the tax authorities. In particular, we are subject to tax audits for the period in which the Acquisition occurred by tax authorities in multiple jurisdictions worldwide, and in many cases these audits have not yet begun or have not been completed and could give rise to issues of this kind. If these tax authorities were to successfully challenge such decisions or assumptions, we could be required to pay additional amounts to such authorities to satisfy our tax obligations, which could have a material adverse effect on our business, financial condition, results of operations and cash flows.
Risks Related to Ownership of our Common Shares
Exchange rate fluctuations may reduce the amount of U.S. Dollars shareholders receive in respect of any dividends or other distributions we may pay in the future in connection with our common shares.
Our common shares are quoted in U.S. Dollars on the NYSE. Our financial statements are prepared in Euros. Under Luxembourg law, the determination of whether we have sufficient distributable profits to pay dividends is made on the basis of our unconsolidated annual financial statements prepared under the Luxembourg Company Law in accordance with accounting principles generally accepted in Luxembourg. Exchange rate fluctuations may affect the amount in Euro that we are able to distribute, and the amount in U.S. Dollars that our shareholders receive upon the payment of cash dividends or other distributions we declare and pay in Euro, if any. Such fluctuations could adversely affect the value of our common shares, and, in turn, the U.S. Dollar proceeds that holders receive from the sale of our common shares.
Failure to maintain effective internal controls in accordance with Section 404 of Sarbanes-Oxley could have a material adverse effect on our business and share price.
As a public company, we are required to document and test our internal control over financial reporting in order to satisfy the requirements of Section 404 of the Sarbanes-Oxley Act of 2002 (“Sarbanes-Oxley”), which requires, an annual report on management’s assessment of the effectiveness of our internal control over financial reporting and a report by our independent registered public accounting firm that addresses the effectiveness of internal control over financial reporting. During this process, we may identify deficiencies that we may not be able to remediate in a timely manner to meet our deadline for compliance with Section 404 or that constitute a material weakness, which could require a restatement or other revision of our financial statements. Testing and maintaining internal control could divert our management’s attention from other matters that are important to the operation of our business, increase our legal and financial compliance costs and make some management activities more difficult, time consuming and costly. We may not be able to conclude on an ongoing basis that we have effective internal control over financial reporting in accordance with Section 404 or our independent registered public accounting firm may not issue an unqualified report on the effectiveness of our internal control over financial reporting. In such an event, we could not be certain that our financial statements will be accurate and investors could lose confidence in our reported financial information, which would likely have a negative effect on the trading price of our common shares. In addition, if we do not maintain effective internal controls, we may not be able to accurately report our financial information on a timely basis, which could harm the trading price of our common shares, impair our ability to raise additional capital, or jeopardize our stock exchange listing.
If securities or industry analysts do not or not continue to publish research or reports about our business, or if they adversely change their recommendations regarding our common shares, the market price and trading volume of our common shares could decline.
The trading market for our common shares will be influenced by research or reports that industry or securities analysts publish about our business. If one or more analysts who cover us downgrade our common shares, the market price for our common shares would likely decline. If one or more of these analysts cease to cover us or fail to regularly publish reports on us, we could lose visibility in the financial markets, which, in turn, could cause the market price or trading volume for our common shares to decline.
Our exemption as a foreign private issuer from certain rules under the U.S. securities laws may result in less information about us being available to investors than for U.S. companies.
As a foreign private issuer (as such term is defined in Rule 405 under the Securities Act of 1933), we are exempt from certain rules under the U.S. securities laws and are permitted to file less information with the SEC than U.S. companies. As a foreign private issuer, we are exempt from certain rules under the Exchange Act, that impose certain disclosure obligations and procedural requirements for proxy solicitations under Section 14 of the Exchange Act. In addition, our officers, directors and principal shareholders are exempt from the reporting and “short-swing” profit recovery provisions of Section 16 of the Exchange Act and the rules under the Exchange Act with respect to their purchases and sales of our common shares. Moreover, we are not required to file periodic reports and financial statements with the SEC (such as quarterly reports on Form 10-Q or current reports on Form 8-K) as frequently or as promptly as companies that are not foreign private issuers whose
15
securities are registered under the Exchange Act. In addition, we are not required to comply with Regulation FD, which restricts the selective disclosure of material information. As a result, there may be less publicly available information about us than is regularly published by or about U.S. issuers and our shareholders may not have access to information they deem important, which may result in our common shares being less attractive to investors. In addition, while we voluntarily comply with the governance requirements of the NYSE, as a foreign private issuer we are not required to comply with most of these requirements, including those relating to the independence of the members of our Board of Directors and its committees, and we could decide in the future not to comply with them.
We may lose our foreign private issuer status in the future, which could result in significant additional costs and expenses.
Although we expect that we will continue to maintain our status as a foreign private issuer for the time being, we could cease to be a foreign private issuer if a majority of our shareholders, directors or management are U.S. citizens or residents and we fail to meet certain additional requirements necessary to avoid loss of foreign private issuer status. The regulatory and compliance costs to us under U.S. securities laws as a U.S. domestic issuer may be significantly higher than costs we incur as a foreign private issuer, which could have a material adverse effect on our business and financial results.
The rights of our shareholders may differ from the rights they would have as shareholders of a U.S. corporation, which could adversely affect trading in our common shares and our ability to conduct equity financings.
Our corporate affairs are governed by our Articles of Association and the laws of Luxembourg, including the Luxembourg Company Law (
loi du 10 août 1915 concernant les sociétés commerciales, telle quelle a été modifiée
). The rights of our shareholders and the responsibilities of our directors and officers under Luxembourg law are different from those applicable to a corporation incorporated in the United States. Luxembourg laws may not be as extensive as those in effect in the United States, and Luxembourg law and regulations in respect of corporate governance matters might not be as protective of minority shareholders as state corporation laws in the United States. As a result, our shareholders may have more difficulty in protecting their interests in connection with actions taken by our directors and officers than they would as shareholders of a corporation incorporated in the United States.
We are organized under the laws of the Grand Duchy of Luxembourg and it may be difficult to obtain or enforce judgments or bring original actions against us or the members of our Board of Directors in the United States.
We are organized under the laws of the Grand Duchy of Luxembourg and the majority of our assets are located outside the United States. Furthermore, the majority of the members of our Board of Directors and officers reside outside the United States and a substantial portion of their assets are located outside the United States. Investors may not be able to effect service of process within the United States upon us or these persons or to enforce judgments obtained against us or these persons in U.S. courts, including judgments in actions predicated upon the civil liability provisions of the U.S. federal securities laws. Likewise, it may also be difficult for an investor to enforce in U.S. courts judgments obtained against us or these persons in courts located in jurisdictions outside the United States, including judgments predicated upon the civil liability provisions of the U.S. federal securities laws. Awards of punitive damages in actions brought in the United States or elsewhere are generally not enforceable in Luxembourg.
As there is no treaty in force on the reciprocal recognition and enforcement of judgments in civil and commercial matters between the United States and the Grand Duchy of Luxembourg, courts in Luxembourg will not automatically recognize and enforce a final judgment rendered by a U.S. court. The enforceability in Luxembourg courts of judgments rendered by U.S. courts will be subject, prior to any enforcement in Luxembourg, to the procedure and the conditions set forth in the Luxembourg procedural code, which conditions may include the following as of the date of this report (which may change):
|
•
|
the judgment of the U.S. court is final and enforceable (
exécutoire
) in the United States;
|
|
•
|
the U.S. court had jurisdiction over the subject matter leading to the judgment (that is, its jurisdiction was in compliance both with Luxembourg private international law rules and with the applicable domestic U.S. federal or state jurisdictional rules);
|
|
•
|
the U.S. court applied to the dispute the substantive law that would have been applied by Luxembourg courts (based on recent case law and legal doctrine, it is not certain that this condition would still be required for enforcement (
exequatur)
to be granted by a Luxembourg court);
|
|
•
|
the judgment was granted following proceedings where the counterparty had the opportunity to appear and, if it appeared, to present a defense, and the decision of the foreign court must not have been obtained by fraud, but in compliance with the rights of the defendant;
|
|
•
|
the U.S. court acted in accordance with its own procedural laws; and
|
|
•
|
the decisions and the considerations of the U.S. court must not be contrary to Luxembourg international public policy rules or have been given in proceedings of a tax or criminal nature or rendered subsequent to an evasion of Luxembourg law (
fraude à la loi
). Awards of damages made under civil liability provisions of the U.S. federal securities laws, or other laws, which are classified by Luxembourg courts as being of a penal or punitive nature (for example, fines or punitive damages), might not be recognized by Luxembourg courts. Ordinarily, an award of monetary damages would not be considered as a penalty, but if the monetary damages include punitive damages, such punitive damages may be considered a penalty.
|
16
In addition, actions brought in a Luxembourg court against us or the members of our Board of Directors and our officers to enforce liabilities based on U.S. federal securities laws may be subject to certain restrictions. In particular, Luxembourg courts generally do not award punitive damages. Litigation in Luxembourg is also subject to rules of procedure that differ from the U.S. rules, including with respect to the taking and admissibility of evidence, the conduct of the proceedings and the allocation of costs. Proceedings in Luxembourg would have to be conducted in the French or German language, and all documents submitted to the court would, in principle, have to be translated into French or German. For these reasons, it may be difficult for a U.S. investor to bring an original action in a Luxembourg court predicated upon the civil liability provisions of the U.S. federal securities laws against us, the members of our Board of Directors or our officers. In addition, even if a judgment is obtained against our company, the non-U.S. members of our Board of Directors or our officers based on the civil liability provisions of the U.S. federal securities laws, a U.S. investor may not be able to enforce it in U.S. or Luxembourg courts.
Under our Articles of Association, we may indemnify our directors for and hold them harmless against all claims, actions, suits or proceedings brought against them, subject to limited exceptions. The right to indemnification does not exist in the case of gross negligence, fraud or wrongful misconduct. The rights and obligations among or between us and any of our current or former directors and officers are generally governed by the laws of the Grand Duchy of Luxembourg and are subject to the jurisdiction of the Luxembourg courts, unless such rights or obligations do not relate to or arise out of such persons’ capacities listed above. Although there is doubt as to whether U.S. courts would enforce this indemnification provision in an action brought in the United States under U.S. federal or state securities laws, this provision could make judgments obtained outside Luxembourg more difficult to enforce against our assets in Luxembourg or in jurisdictions that would apply Luxembourg law.
Luxembourg and European insolvency and bankruptcy laws are substantially different from U.S. insolvency laws and may offer our shareholders less protection than they would have under U.S. insolvency and bankruptcy laws.
As a joint stock corporation organized under the laws of Luxembourg with its registered office in Luxembourg, we are subject to Luxembourg insolvency and bankruptcy laws in the event any insolvency proceedings are initiated against us including, among other things, Council Regulation (EC) No. 1346/2000 of May 29, 2000 on insolvency proceedings. Should courts in another European country determine that the insolvency and bankruptcy laws of that country apply to us in accordance with and subject to such EU regulations, the courts in that country could have jurisdiction over the insolvency proceedings initiated against us. Insolvency and bankruptcy laws in Luxembourg or the relevant other European country, if any, may offer our shareholders less protection than they would have under U.S. insolvency and bankruptcy laws and make it more difficult for them to recover the amount they could expect to recover in a liquidation under U.S. insolvency and bankruptcy laws.
Item 4. Information on the Company
|
A.
|
History and Development of the Company
|
The Company
Orion Engineered Carbons S.A. is a Luxembourg joint stock corporation (
société anonyme
or S.A.), incorporated on July 28, 2014, with a registered office at 6, Route de Trèves, L-2633 Senningerberg (Municipality of Niederanven), Grand Duchy of Luxembourg. Previously, the Company was a Luxembourg limited liability company (
société à responsabilité limitée
) under the name Orion Engineered Carbons S.à r.l., and before that under the name Kinove Luxembourg Holdings 2 S.à r.l. Our telephone number is +352 270 48 06 0. Our website address is www.orioncarbons.com. The information contained on, or that can be accessed through, our website is not part of, and is not incorporated into, this report.
Historically, our business operated as a business line of Evonik. Effective July 29, 2011, private investors indirectly acquired from Evonik the entities operating its carbon black business.
On July 30, 2014, the Company completed the initial public offering of 19.5 million of its common shares at a price to the public of $18.00 per share (the “IPO”). The common shares were sold by Kinove Holdings, the former majority shareholder in the Company. The Company did not receive any proceeds from the sale of common shares in the IPO, although Kinove Holdings made a contribution to the subscribed capital and the reserves of the Company of approximately $286 million (€212 million, based on the exchange rate at the time) as part of the refinancing that occurred substantially simultaneously with the IPO. During 2017, Kinove Holdings sold off all its remaining common shares in four registered secondary public offerings. The Company did not receive any proceeds from the sale of common shares in those offerings. Currently, we operate on a fully stand-alone basis with all our shares held by public investors except for
314.912
shares held by us in treasury.
In 2015 we completed the acquisition of Qingdao Evonik Chemical Co., Ltd. now operating as OECQ. OECQ has an annual production capacity of 75 kmt, mainly designated for rubber carbon black products. By the end of 2016 we ceased production at our Ambès (France) plant. This side accounted for a production capacity of 40 kmt in standard rubber carbon black products.
|
B.
|
Business Overview
|
Overview
17
We are a leading global producer of carbon black. Carbon black is a form of carbon used to improve certain properties of materials into which it is added. It is used as a pigment and as a performance additive in coatings, polymers, printing and special applications (specialty carbon black) and in the reinforcement of rubber in tires and mechanical rubber goods (rubber carbon black).
We operate a diversified carbon black business with more than
280
specialty carbon black grades and approximately
80
rubber carbon black grades. Our product portfolio is one of the broadest in the industry and is divided into the following segments:
|
•
|
Specialty Carbon Black.
We are one of the largest global producers of specialty carbon black with an estimated share of global industry sales of approximately
26%
in
2017
measured by volume in kmt.
Our estimated share of global industry specialty carbon black sales remained relatively stable in the past three years (26% in
2016
and 25% in
2015
). We believe that our share of global industry sales measured by revenue is higher, since our product portfolio is weighted towards higher priced premium grades. We manufacture specialty carbon black at multiple sites for a broad range of specialized applications. Specialty carbon black imparts specific characteristics, such as high-quality pigmentation, UV light protection, viscosity control and electrical conductivity.
|
|
•
|
Rubber Carbon Black
. We are one of the largest global producers of rubber carbon black. We have a global supply network and an estimated share of global industry sales of approximately
7%
in
2017
measured by volume in kmt, with industry sales shares by volume equal to or exceeding 13% in each of our major operating regions.
Our estimated market share for this segment decreased in 2017 to 7% from 8% as a result of ceased production at our Ambès (France) plant end of 2016.
|
We have over 80 years of experience and enjoy a long-standing reputation for technical capability in the carbon black industry and its served applications. We provide consistent product quality, reliability, technical expertise and innovation, built upon continually improving processes and know-how through our advanced Innovation Group and through supply chain execution.
Our Innovation Group works closely with our clients to develop innovative products and applications, while strengthening customer relationships and improving communication. Long-term R&D alliances and sophisticated technical interfaces with customers allow us to develop solutions to meet specific customer requirements. As a result, we have been able to generate attractive margins for our specialized carbon black products. Additionally, our Innovation Group works closely with our operations group to improve process economics with new process equipment designs, operating techniques and raw material selection.
We operate a modern global supply chain network currently comprising
13
wholly owned production facilities in Europe, North and South America, Asia and South Africa and
3
sales companies
, as well as one jointly-owned production plant in Germany. Our Ambès (France) plant ceased production as of December 31, 2016.
Products and Applications
We have a diversified carbon black production platform across the Specialty Carbon Black and Rubber Carbon Black operating segments. In
2017
we offered more than
280
specialty carbon black grades and approximately
80
rubber carbon black grades under a number of well-recognized brand names and trademarks. Our product portfolio is one of the broadest in the industry. Our product and geographic diversity exposes us to a wide variety of applications and industries, which in turn lowers our dependency on individual customers or regions. Our overall product portfolio benefits from higher margin specialty and technical grade rubber carbon black products and stable margin rubber carbon black products.
We continuously strive to meet our customers’ changing demands and adjust our products accordingly, as well as to enhance our product portfolio with innovations. In our Specialty Carbon Black segment, we launched several new post-treated specialty carbon black grades for coatings and printing applications, as well as several new conductive carbon black grades for polymers, printing and new markets, such as for battery electrodes. In our Rubber Carbon Black segment, we developed two product families: PUREX
®
for mechanical rubber goods (“MRG”) applications, which complies with high cleanliness requirements, and ECORAX
®
for tires, which is characterized by improved tire properties of wear and fuel consumption.
Specialty Carbon Black
Overview
We are one of the largest global producers of specialty carbon black with an estimated share of global industry sales of approximately
26%
measured by volume in kmt in
2017
. We believe that our share of global industry sales measured by revenue is higher, since our product portfolio is weighted towards higher priced premium grades. We manufacture specialty carbon black at multiple sites for specialized applications. Specialty carbon black imparts specific characteristics, such as high-quality pigmentation, UV light protection, viscosity control and electrical conductivity.
In
2017
, our Specialty Carbon Black segment generated €
424.6 million
in revenues,
261.4
kmt in volume, €
128.9 million
in Segment Adjusted EBITDA and Segment Adjusted EBITDA Margin of
30.4%
.The Specialty Carbon Black segment has a relatively balanced product mix divided into four sectors: Coatings, Polymers, Printing and Special Applications. In
2017
, Polymer applications accounted for about 68% of our volume measured in kmt, Printing accounted for nearly 16%, while Coatings, Special Applications and cross-sector sales to distributors represented the remainder. Our mix of specialty carbon black products is more balanced when measured in terms of Adjusted EBITDA.
18
Our Specialty Carbon Black segment generates higher margins per metric ton than our Rubber Carbon Black segment, with the highest margin per metric ton in Coatings. We believe the key driver of attractive margins in specialty carbon black is innovation supported by our Innovation Group, which works in close coordination with our customers and technical marketing support. We provide assistance to our customers through the whole value chain, including product formulation, technical support, product handling, packaging, logistics, supply chain management and final application.
We are recognized by our customers as a leading innovator and manufacturer of customized products fitting specific application needs. Our specialty carbon black customer base is relatively diverse, with the top five customers accounting for approximately
25%
of the Specialty Carbon Black segment volume in
2017
. We have been supplying most of our blue-chip customers for a period of over 30 years.
Coatings
Product and Application Portfolio
We have a broad Coatings product portfolio, which includes products used for pigmentation in pure black coatings (for example, in automotive basecoats), for conductivity and for tinting in all other coatings, as well as for paints and for light tinting in transparent coatings (for example, for metallic effects and wood glazing). The variety of our manufacturing processes allows the creation of specialty carbon black with different morphological and chemical properties, thereby giving some of our products unique characteristics. Coatings-related specialty carbon black products are manufactured in Cologne (Germany), Yeosu (South Korea) and Belpre (Ohio), as well as at the German JV in Dortmund (Germany).
The following table provides examples of our Coatings applications.
|
Coatings
|
Automotive
|
General Industrial
|
Architectural & Decorative
|
|||
|
Applications
|
Automotive original
equipment manufacturing Automotive refinish Automotive parts |
Wood, coil and plastic coatings
Protective and marine Aerospace Packaging |
Architectural
Decorative |
|||
|
Attributes
|
Pigmentation High
jetness and blue undertone Conductivity |
High-performance tinting
Conductivity |
Tinting
|
|||
|
Brands
|
PRINTEX
®
NEROX
®
LAMP BLACK
GAS BLACK
SPECIAL BLACK
|
PRINTEX
®
NEROX
®
LAMP BLACK
GAS BLACK
SPECIAL BLACK
|
PRINTEX
®
NEROX
®
LAMP BLACK
GAS BLACK
SPECIAL BLACK
|
|||
Customers
We believe that the global Coatings industry consists of a few key suppliers that account for approximately half of the global Coatings capacity. However, the mid-size players are driving innovation for formulations, specific product customization and quality. We believe we have demonstrated the ability and have the application technology platform to play a substantial role in this process and to meet demanding customer requirements. The customized nature of Coatings products leads to attractive margins in the industry.
We supply many of the Coatings industry’s blue chip and mid-size customers and have longstanding relationships with several major global customers. We have been serving several of the key industry players, including AkzoNobel, Axalta, Nippon Paint and PPG, for over 30 years. The Coatings market is relatively fragmented, although our top five customers account for approximately 36% of Coatings volume in
2017
.
19
Polymers
Product and Application Portfolio
Polymers are the largest end-use market for specialty carbon blacks. Our Polymer portfolio is one of the broadest in the industry and, supported by an application technology platform, enables us to cover most of the product demand spectrum. Our Polymer applications products are manufactured in Cologne (Germany), Malmö (Sweden), Yeosu (South Korea), Bupyeong (South Korea), Belpre (Ohio), Borger (Texas) and Paulinia (Brazil), as well as at the German JV in Dortmund (Germany).
Our Polymers portfolio is tailored to meet specific industry and customer needs. For example, potable water pipes made of polyethylene, agricultural films, cables and other articles exposed to UV radiation (sunlight) need to be protected against polymer degradation and subsequent deterioration of mechanical strength. We offer tailor-made products that not only provide efficient UV protection but also provide additional benefits, such as good processing properties and easy handling. Products offered also meet special performance criteria, including food-contact compliance and spin-fiber quality.
In addition to UV protection, our portfolio includes products from standard- to high-performance grades designed and modified to provide electrical conductivity, antistatic and reinforcing properties to many different polymer articles, including high-voltage cables, films, boxes and high pressure pipes.
Our portfolio offering targeted at fiber products and technology represents a niche growth area and provides a combination of a broad range of jetness with good filterability. Certain of our polymer products have a bluish undertone, which makes these grades especially attractive for high-performance fibers in textiles, with luxury touch and feel. Ultra clean products provide good process stability during the small and thin fiber manufacturing processes.
The following table provides examples of our polymers applications.
|
Polymers
|
Pipe
|
Wire & Cable
|
Films
|
Blow &
Incection Molding |
Fiber
|
Thermal
Insulation |
Other
|
|||||||
|
Applications
|
Pressure pipes (water, gas) Irrigation Sewage pipes Conductive pipes/hoses
|
Power cables (LV to HV) Jacketing
|
Agricultural Packaging Geomembrane Foil Laminations
|
Packaging Housing Container Automotive
|
Textile Industrial Non-Woven
|
Construction
|
Thermosets TPE profiles Plastics
|
|||||||
|
Attributes
|
Dispersibility UV protection Conductivity
|
Dispersibility UV protection Conductivity
|
Dispersibility UV protection Coloring
|
Dispersibility UV protection Conductivity
|
Dispersibility Coloring
|
IR absorption
|
Thixotrophy Dispersibility Coloring Reinforcing UV protection
|
|||||||
|
Brands
|
PRINTEX
®
AROSPERSE HIBLACK
®
|
PRINTEX
®
HIBLACK
®
|
PRINTEX
®
AROSPERSE HIBLACK
®
|
PRINTEX
®
AROSPERSE HIBLACK
®
|
PRINTEX
®
AROSPERSE GAS BLACK
|
LAMP BLACK AROSPERSE
|
PRINTEX
®
AROSPERSE HIBLACK
®
LAMP BLACK
|
|||||||
Customers
Due to the diverse nature of Polymer applications (construction, general industrial, engineering, automotive and packaging), the customer base for Polymers tends to be wide-ranging from regional and international master batch producers to global integrated petrochemical and polyolefin producers. We supply many of the plastics industry’s blue-chip customers and supply leading customers in each region. We have been serving certain of our key customers, including Ampacet, Borealis, DYM, MDI and Schulman, for over 30 years. Our top five customers accounted for approximately 33% of Polymers volume in
2017
.
Printing
Product and Application Portfolio
We have a broad Printing product portfolio with a large number of grades for different printing technologies and applications. We apply different process technologies to offer highly specialized products that meet specific requirements, including compliance with food-contact regulations and specially formulated products with different coloristic properties (such as undertone, optical density and gloss), rheological effects and dispersibility functions. Specialty carbon black products for the Printing industry are mainly manufactured in Cologne (Germany), Yeosu (South Korea), Belpre (Ohio) and Paulinia (Brazil), as well as at the German JV in Dortmund (Germany).
20
We focus on Printing products with the highest potential for specialty applications, such as packaging and specialty niches. Consequently, relatively low-end newspaper and other print media applications represented only a small portion of our overall specialty carbon black sales in
2017
. Margins in specialty Printing applications are relatively high, as their producers must meet and balance numerous technical properties. These properties include ease of dispersion, processing, handling, formulation requirements, final product performance hold-out, rub resistance and, most importantly, coloristic properties, such as optical density, gloss, light-fastness and color tone. Our specialty carbon black product portfolio supports printing ink manufactures in achieving these attributes.
Packaging inks require special rheology, dispersion and wetting behavior properties. For example, UV curing inks on nonporous substrates require special surface chemistry for wetting, flow, color and stability. We are recognized by our customers for our low structure, surface after-treated, post-oxidized Printing carbon black products.
The following table provides examples of our printing applications.
|
Packaging
|
Print Media
|
|||||||||||||
|
Printing
|
High-end
Packaging |
Packaging
|
Display
Advertising |
Publication
(magazines) |
Special
Applications |
Books, Posters,
Brochures |
Newspaper
|
|||||||
|
Applications
|
Liquid inks
UV curing Sheetfed Screen |
Liquid inks
|
Heatset
Sheetfed Screen |
Heatset
Sheetfed Publication gravure |
Screen
Water- based gravure UV curing |
Sheetfed
UV curing |
Water-based
flexo Coldset |
|||||||
|
Attributes
|
Coloring
Gloss Food contact regulations Wettability |
Coloring
|
Coloring
Gloss Moderate flow Wettability |
Coloring
Gloss Good flow Low abrasion |
Coloring
Gloss Moderate flow Wettability |
Coloring
Gloss Moderate flow Wettability |
Coloring
|
|||||||
|
Brands
|
NEROX
®
PRINTEX ® SPECIAL BLACK |
PRINTEX
®
HIBLACK ® |
NEROX
®
HIBLACK ® PRINTEX ® SPECIAL BLACK |
PRINTEX
®
HIBLACK ® |
PRINTEX
®
SPECIAL BLACK |
PRINTEX
®
SPECIAL BLACK |
PRINTEX
®
HIBLACK ® |
|||||||
Customers
The global Printing industry has been undergoing consolidation over the past few years. Currently, the industry is dominated by a few key players. Sourcing decisions are largely based on specialty carbon black product attributes. For low-end applications, decisions are made based primarily on price. For high-end applications, the required degree of product and technology know-how makes purchasing decisions less price sensitive. We play an important role in helping our customers develop customized Printing solutions and are recognized by customers as a preferred strategic and technical partner. We have been serving certain of our key customers, including major positions at CRT Graphics, Flint Group, Siegwerk, Sun/DIC and Toyo Ink, for over 30 years. Due to the relatively consolidated nature of the Printing industry, our top five Printing customers accounted for approximately 71% of Printing volume in
2017
.
Special Applications
The Special Applications product category comprises applications not included into our Coatings, Polymers and Printing portfolios, such as, silicones, non-woven textile, building materials, battery electrodes metallurgical, agrochemicals and carbon brushes. Our top five customers accounted for approximately 33% of Special Applications volume in
2017
.
Distribution
We sell most of our specialty carbon black products directly to our customers and only a smaller part of our sales is made via external channel partners and distributors. External channel partners and distributors generally sell our products to smaller customers, who do not negotiate with us directly. These sales are made across all our specialty carbon black applications, including Coatings, Polymers, Printing and Special Applications.
Competition
We are one of the largest global producers of specialty carbon black with an estimated share of global industry sales of approximately
26%
measured by volume in kmt in
2017
. We believe that our share of global industry sales measured by revenue is significantly higher, since our product portfolio is weighted towards the higher priced premium segment of the specialty carbon black market. Cabot and Birla are the
21
other two large global producers of specialty carbon black with shares of global industry sales of approximately 22% and 15%, respectively, in
2017
based on volume (
Source: Orion internal study
). All top three producers of specialty carbon black use their R&D and applications technology platforms to tailor products to customer needs and to introduce their products into new application niches.
Rubber Carbon Black
Overview
We are one of the largest global producers of rubber carbon black with an estimated global industry sales share of approximately
7%
in
2017
measured by volume in kmt. Rubber carbon black sales are largely regional, since transportation costs are high relative to sales price. Accordingly, we believe that in most of our key regions, our estimated rubber carbon black share of industry sales is higher than our global share based on volumes. For example, we estimate that in
2017
we held higher rubber carbon black shares of industry sales relative to our
7%
global share
in the European Union (19%), North America (16%), South Korea (47%), South Africa (91%) and Brazil (21%)
. In
2017
, our largest rubber carbon black customer accounted for approximately 16%, the second and third largest for approximately 10% each of our consolidated revenue with no other customer exceeding 10% of our consolidated revenue.
In
2017
, our Rubber Carbon Black segment generated €
752.6 million
in revenues,
826.0
kmt in volume, €
98.8 million
in Segment Adjusted EBITDA and Segment Adjusted EBITDA Margin of
13.1%
. Rubber carbon black is primarily used for reinforcement of rubber compounds and to adjust specific performances of rubber articles. Based on the application of rubber carbon black, we have divided the Rubber Carbon Black segment into two categories: Tires and Mechanical Rubber Goods (MRG). Relative to our competitors, we believe that we have higher sales revenue from mechanical rubber goods due to higher margins on such products.
We hold leading positions in the major rubber carbon black industries and have access to emerging regions through our production sites and sales offices in Asia, South America, Eastern Europe and South Africa. Our plant in Brazil provides an additional platform for growth in rubber carbon black in South America, with the ability to shift production capacity from tires to mechanical rubber goods and specialty carbon black applications. Our 2015 acquisition of OECQ in China is further strengthening our Asia-Pacific footprint.
Tires
Product and Application Portfolio
We offer a broad Tire product portfolio which includes high reinforcing grades and semi-reinforcing grades. Fine particle reinforcing grade carbon blacks are used mostly in the tread of tires. Other reinforcing grade carbon blacks are also used in different components of the tire carcass. In addition to standardized grades, we produce advanced grades tailored to meet specific customer performance requirements, such as ECORAX
®
grades designed to lower rolling resistance and HP grades for truck tires and high- and ultra-high-performance passenger car tires. Semi-reinforcing grade carbon blacks are used in several components of the tire carcass like sidewall and bead area. We cover the full portfolio of standard semi-reinforcing grade carbon blacks and have a portfolio of special semi-reinforcing grade carbon blacks, which fulfill special customer requirements using special production technology. These special semi-reinforcing grade carbon blacks are part of our ECORAX
®
product family and are already growing in the regions.
Customers
Given the highly consolidated nature of the tire industry, our top ten customers represented slightly more than 85% of our tires volume in
2017
. A significant portion of our Tire products are sold to top-tier tire manufacturers. We have longstanding relationships with most of these customers and have the capacity to serve them in major global regions. We have been serving certain of our key customers for over 20 years.
We believe that our customers value the quality, consistency and reliability of our operations and are generally reluctant to switch suppliers without due cause. In addition, because automotive tires have safety implications, tire manufacturers are often required to go through lab and extensive plant approval processes before they change their supplier of carbon black. Furthermore, our extensive pan-European, North American and pan-Asian supply chain network ensures that we are in close proximity to our core customers.
Mechanical Rubber Goods
Product and Application Portfolio
We produce a wide range of mechanical rubber goods products for a variety of end-uses, including automotive production, construction, manufacturing of wires and cables, as well as certain food and medical applications. Our MRG products can be divided into four main groups: (i) standardized ASTM furnace grades, (ii) specialized ASTM furnace grades, (iii) specialized non-ASTM furnace grades and rubber carbon blacks from special production processes lampblack (Durex O) and (iv) thermal black (N990) and gas black (CK3). In the field of special ASTM and non-ASTM blacks we offer an extensive portfolio of “PUREX
®
” grades. These grades are mainly used in automotive rubber parts like window sealings and hoses. These grades have an exceptionally high purity, high consistency and can be dispersed well in rubber compounds. The grades of the PUREX
®
family aiming at the adjustment of special requirements like smooth surface, special surface appearance of sealing systems, electrical resistance and other specific requirements. The trend towards light weight construction of cars and the resulting use of aluminum require more attention to electrical resistivity of MRG parts.
22
The following table presents examples of our mechanical rubber goods applications.
|
Mechanical
Rubber Goods
|
Transportation
Construction and Others |
Automotive
|
Wire & Cable
|
Food &
Medical |
||||||||||
|
Applications
|
Conveyor belts Construction profiles Mechanical rubber goods
|
Extruded and other profiles
|
Damping elements Hoses Transmission belts
|
Molded goods with high resistance
|
Seals Rubber- to-metal bonding Unvulcanized sheets and adhesives
|
Electrically conductive and antistatic rubber goods
|
Profiles Tubing Hoses Sealings
|
|||||||
|
Attributes
|
Tensile strength Tear and abrasion resistance Reinforcement
|
Filler loadings Compression Smooth surfaces Processibility Consistency
|
Processibility Injection molding and calendaring
|
Low hysteresis Reinforcement Processing
|
Scorch safety Tensile strength
|
Electrical conductivity or antistatic behavior
|
Dispersion Filler loadings
|
|||||||
|
Brands
|
CORAX
®
|
PUREX
®
DUREX
®
CORAX
®
N990
|
CORAX
®
PUREX
®
DUREX
®
|
PUREX
®
|
CK 3
|
PRINTEX
®
CORAX
®
PUREX
®
|
PUREX
®
CORAX
®
N990
|
|||||||
Customers
We serve customers across the whole value chain and MRG applications, including compounders, parts and component manufacturers and automotive system suppliers. The mechanical rubber goods industry is fragmented in nature and supports a large number of suppliers. The industry, however, is undergoing a consolidation process. Our top ten global customers accounted for approximately 50% of our mechanical rubber goods volume in
2017
. We have a diversified geographic presence with significant exposure to the European, North and South American and Asian MRG markets. We supply various blue-chip customers and have longstanding relationships with several of them. We have been serving certain key customers for over 20 years.
Competition
We are one of the largest global producers of rubber carbon black in the world with an estimated share of global industry sales of
7%
in
2017
measured by volume in kmt. Cabot, Birla and Black Cat were the three largest global producers of rubber carbon black in
2017
with estimated shares of global industry sales of approximately 14%, 11% and we believe in the range of 8%, respectively, based on our best estimates.
Rubber carbon black sales are largely regional, since transportation costs are high relative to sales price. As a result, the global rubber carbon black industry is more fragmented compared to the specialty carbon black industry. We believe that in the regions where we have production units, our rubber carbon black share of industry sales is higher than our global share. For example, we estimate that in
2017
we held higher rubber carbon black shares of industry sales relative to our
7%
global share
in the European Union (19%), North America (16%), South Korea (47%), South Africa (91%) and Brazil (21%)
.The smaller regional suppliers participate mainly in standard tire and mechanical rubber goods applications and are less prevalent in more specialized products for the higher-end tire and mechanical rubber goods applications.
Procurement and Raw Materials
In
2017
, raw materials accounted for
71%
of our cost of sales. Approximately
90%
of the cost of raw material used in the production of carbon black is related to petroleum-based or coal-based feedstock known as carbon black oil, with some limited use of other raw materials, such as nitrogen tetroxide, hydrogen and natural gas. Carbon black oil comes from three main sources: (i) fluid catalytic cracking bottoms, a by-product of fuel producing refineries, (ii) steam cracker tar, a by-product of ethylene producing crackers, and (iii) certain coal tar products.
The efficient procurement of carbon black oil is an important factor in achieving optimal production costs and profitability. We employ a dedicated global carbon black oil procurement group which is fully integrated within our value chain and management team. Our carbon black oil procurement strategy entails global sourcing of carbon black oil, using proprietary optimization tools to maximize value.
We maintain close relationships with our suppliers, which include global and national oil companies, as well as independent refiners and blenders across different regions. We purchase carbon black oil from more than 30 different suppliers to limit our dependence on certain individual key suppliers. Since the carbon black industry utilizes only a low share of total heavy fuel oil supply worldwide, we believe that
23
the risk of raw material shortage is low. In regions where the number of suppliers is low, we have back-up plans to import carbon black oil from other regions in the event of a local carbon black oil shortage.
Approximately 50% of our carbon black oil supply is covered by short- and long-term contracts with a wide variety of suppliers.
The pricing of carbon black oil is typically indexed to the price of fuel oil and is generally benchmarked against Thomson Reuters indices of mainly three regions, namely the U.S. Gulf Coast, Amsterdam / Rotterdam / Antwerp and Singapore. While the majority of our purchases are based on underlying fuel oil indices, the ultimate carbon black oil price also depends on carbon black oil specific quality characteristics, differentials (premiums or discounts), freight costs and region specific supply and demand as well as regulatory factors. Carbon black oil procurement is an important factor in achieving best-in-class production costs.
Production
Production Facilities
We currently operate a global platform of
13
wholly owned production facilities in Europe, North and South America, Asia and South Africa and
3
sales companies
as well as one jointly-owned production plant in Germany. Our Ambès (France) plant ceased production as of December 31, 2016. Our worldwide state-of-the-art manufacturing facilities allow us to produce consistent, high-quality products for our customers in each operating region. All of our production plants are ISO 9001 (Quality Management) and ISO 14001 (Environmental Management) certified. Our global production capacity totaled approximately 1,275 kmt in
2017
, of which 420 kmt was in Europe, 375 kmt was in North America, 245 kmt in South Korea, 95 kmt was in Brazil, 75 kmt was in China, 65 kmt was in South Africa, and the capacity of the German JV proportionate to our shareholding. We estimate that our average plant utilization rate was
90%
in
2017
.
The following map provides an overview of the geographical footprint of our production network as of
December 31, 2017
.
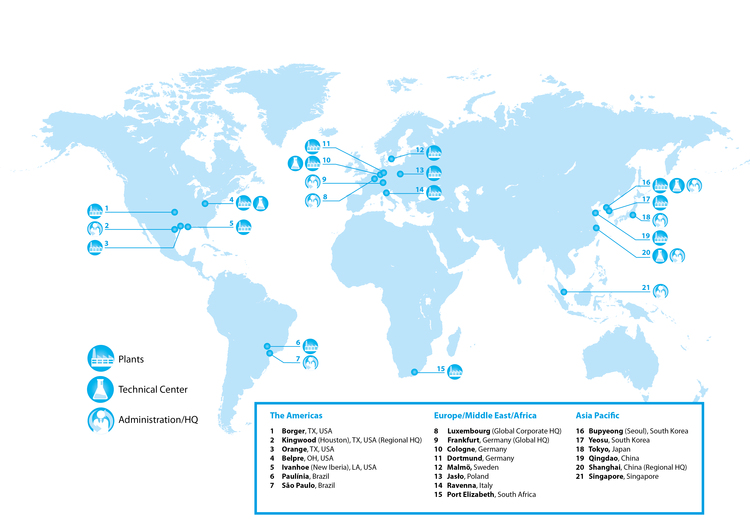
24
Our Principal Production Facilities
In Germany, we operate one wholly-owned production plant located in Cologne and our German JV owns one production plant located in Dortmund. Our Cologne production site occupies a total area of approximately 380,000 square meters (“sqm”) and has a total annual production capacity of approximately 142 kmt, of which 98 kmt are currently designated for specialty carbon black products and 44 kmt are designated for rubber carbon black products. The plant utilizes the furnace, gas and lamp black production processes, and is equipped with co-generation facilities. Our global technical innovation center is also located at our Cologne facility. Kommanditgesellschaft Deutsche Gasrußwerke GmbH & Co., our joint venture with tire manufacturers is located in Dortmund and has a total annual production capacity of approximately 128 kmt, of which 8 kmt are currently designated for specialty carbon black products and 120 kmt are designated for rubber carbon black products. The plant utilizes the furnace and the gas black production processes. Our shareholding in the German JV amounts to 54.0% (with 50% voting rights). Continental holds 33.7%, Pirelli 7.0%, Goodyear 3.3% and Vorwerk 1.6%. The German JV specialty production capacity is fully attributable to us, and the rubber production capacity is split between us and our German JV partners. We account for our holdings in the German JV using the equity method.
In other European countries, we have one wholly-owned production plant in each of Italy, Sweden and Poland. Our Ravenna (Italy) production site occupies a total area of approximately 125,000 sqm and has a total annual production capacity of approximately 75 kmt, of which 5 kmt are currently designated for specialty carbon black products and 70 kmt are designated for rubber carbon black products. The plant utilizes the furnace black production process, and is equipped with co-generation facilities. Our Malmö (Sweden) production site occupies a total area of approximately 46,000 sqm and has a total annual production capacity of approximately 45 kmt. The plant has two production lines, one designated for specialty carbon black and one for rubber carbon black. The plant utilizes the furnace black production process, and is equipped with co-generation facilities. Our Jaslo (Poland) production site occupies a total area of approximately 100,000 sqm and has a total annual production capacity of approximately 40 kmt currently designated for rubber carbon black products. The plant utilizes the furnace black production process, and is equipped with co-generation facilities. Our Ambès (France) production site, which had a total annual production capacity of approximately 50 kmt ceased production as of December 31, 2016.
In the United States, we have four wholly-owned production plants. Our Ivanhoe (Louisiana) production site occupies a total area of approximately 376,000 sqm and has a total annual production capacity of approximately 122 kmt currently designated for rubber carbon black products. The plant utilizes the furnace black production process. Our Borger (Texas) production site occupies a total area of approximately 688,000 sqm and has a total annual production capacity of approximately 105 kmt. In 2014 we converted one of the rubber carbon black production lines at the Borger production site into a specialty carbon black production line. The plant utilizes the furnace and the thermal black production processes, and is equipped with co-generation facilities. Our Orange (Texas) production site occupies a total area of approximately 77,000 sqm and has a total annual production capacity of approximately 74 kmt currently designated for rubber carbon black products. The plant utilizes the furnace black production process, and is equipped with co-generation facilities. Our Belpre (Ohio) production site occupies a total area of approximately 202,500 sqm and has a total annual production capacity of approximately 74 kmt. The plant has four production lines, only one of which is designated for rubber carbon black products. The production site utilizes the furnace black production process. For our U.S. production sites we have recently settled with the EPA to implement install certain pollution control technology that could potentially affect their utilization. See “
Item 4. Information on the Company—B. Business Overview—Environmental, Health and Safety Matters
-
Environmental—Environmental Proceedings
.”
In South Korea, we have two wholly-owned production plants. Our Bupyeong production site occupies a total area of approximately 35,500 sqm and has a total annual production capacity of approximately 55 kmt, of which 22 kmt are currently designated for specialty carbon black products and 33 kmt are designated for rubber carbon black products. The plant utilizes the furnace black production process, and is equipped with co-generation facilities. In addition, one of our technical centers is located at our Bupyeong facility. Our Yeosu production site occupies a total area of approximately 154,000 sqm and has a total annual production capacity of approximately 190 kmt. The plant has ten production lines, three of which are currently designated for specialty carbon black products. The production site utilizes the furnace black production process. In connection with our global rubber footprint initiative we expect to consolidate our two Korean plants at the Yeosu facility and close our Bupyeong plant in the course of 2018.
In 2015 we completed the acquisition of OECQ, located in Qingdao (China), which is since then wholly-owned. OECQ has a total annual production capacity of approximately 75 kmt
designated for rubber carbon black products. The plant is equipped with three production lines and its main manufacturing focus is on high-end mechanical rubber goods applications.
In other regions, we have one wholly-owned production plant in each of Brazil and South Africa. Our Paulinia (Brazil) production site occupies a total area of approximately 97,000 sqm and has a total annual production capacity of approximately 95 kmt currently designated for rubber carbon black products. The plant utilizes the furnace black production process. Our Port Elizabeth (South Africa) production site occupies a total area of approximately 127,000 sqm and has a total annual production capacity of approximately 65 kmt currently designated for rubber carbon black products. The plant has three production lines, which utilize the furnace black production process.
Characteristics of Production Network
Production Know-how
We produce rubber carbon black at all, and specialty carbon blacks at many of, our production sites. We have the production know-how to manufacture a wide range of specialty carbon blacks and rubber carbon blacks worldwide. We believe we are currently the only supplier
25
with core production competencies across all leading production processes (furnace black, gas black, lamp black and thermal black). This provides us flexibility to offer a wide range of specialty carbon black and rubber carbon black products that are best suited to customers’ needs.
Flexible Specialty Carbon Black and Rubber Carbon Black Production Platform
Our existing flexible production platform allows us to convert production lines from tire carbon blacks to mechanical rubber goods and specialty carbon blacks to meet changing industry dynamics with often only minor investment. For example, we have migrated production lines from rubber carbon blacks to specialty carbon blacks at our Malmö (Sweden), Belpre (Ohio) and Borger (Texas) plants. Our flexible production platform also enables us to shift additional production capacity to higher margin carbon black products, at the same time reducing or discontinuing less profitable product lines. We have made investments in strategic sites to increase the flexibility of our production platform. We have upgraded our rubber carbon black production lines for mechanical rubber goods in South Korea and Italy and added a new rubber carbon black production line in South Korea and further increase the flexibility in South Korea through the currently ongoing strategic realignment of our Rubber Carbon Black segment.
Over the last ten years, we have undertaken selective gradual capacity realignment initiatives aimed at meeting changing industry dynamics and increasing profitability. Although such capacity realignments entailed additional Capital Expenditures, they have contributed to improving our profitability profile. We have successfully moved our specialty carbon black and rubber carbon black product portfolios up the value chain and increased our global higher margin product capacity, which resulted in cession of production at our Sines (Portugal) facility in December 2013. As an initial step of a global rubber footprint initiative, our French subsidiary ceased carbon black production at our Ambès (France) facility as of December 31, 2016 and commenced the consolidation of our two production facilities in South Korea which is expected to be finalized by the end of 2018.
Location of Production Network
Our production sites are strategically located throughout the world in close proximity to key customer sites. This is particularly important for our rubber carbon black business, which is largely regional. Since specialty carbon black’s freight costs represent a smaller component of the final cost (relative to rubber carbon black), it is commercially viable to ship specialty carbon blacks across geographic regions from our key production sites in Germany, South Korea, China and the United States. The regional spread of our production network also offers access to high-growth regions globally.
Flexibility of Asset Base
We have implemented a flexible and intelligent production and supply chain network under the concept of operating all regional production sites as one large virtual plant. This allows us to shift production of specialty carbon black and rubber carbon black among different plants in order to optimize costs and plant utilization. In most cases, more than one plant is approved by our customers for specific products, which not only increases production flexibility but also ensures a higher supply security for customers.
Cost Improvements
We have implemented various initiatives to realize cost improvements throughout our production network, including:
|
•
|
Headcount adjustments.
We have implemented certain headcount reduction initiatives and substantially reduced our personnel on a like-to-like basis from over 1,500 employees at the time of the Acquisition to 1,343 prior to the OECQ acquisition, despite having to hire more than 60 administrative personnel to provide a range of services previously provided by Evonik. 184 employees joined the Orion family upon our acquisition of OECQ which increased our headcount at the end of 2015 to 1,527. At the end of 2016 we had a headcount of 1,460 reflecting in particular a layoff of 48 employees at our Ambès (France) plant by end of December 2016. At the end of 2017 we had a headcount of 1,441. Despite these headcount reductions (excluding increase from OECQ acquisition), the number of independent contractors that we use has remained relatively stable.
|
|
•
|
Energy saving and efficiency improvements
. We have implemented and will continue to implement production and energy efficiency initiatives by exploiting alternative feedstock sources, while optimizing our feedstock and energy purchasing and pricing methods. Our new reactor designs, higher temperature air pre-heating equipment and state-of-the-art energy recovery equipment are being installed throughout our production network.
|
|
•
|
Co-generation
. The main by-product of the carbon black production process is a combustible exhaust gas that can be used for the generation of electricity, steam and hot water, a process which is known as co-generation. In recent years, we have increased our co-generation capabilities, and currently nine of our manufacturing sites have some form of co-generation, with analyses underway to expand co-generation to more locations.
|
|
•
|
Productivity improvements
. We have realized certain savings relating to the implementation of high performance work teams and other productivity improvement initiatives. We link our employee bonus levels to the achievement of predetermined objectives, including individual, team and company-wide targets.
|
|
•
|
Global strategic rubber footprint initiative
. We initiated an in depth review of our global rubber engagement in 2016 to shift production and capacities from lower margin standard grades towards higher specialized technical grade rubber products providing
|
26
higher margins. This strategic realignment of our Rubber segment is an essential transition that requires complementary actions. As a first step, the cost-manufacturing contract between our German entity and its Ambès (France) subsidiary was terminated. Following an intensive review, local French management concluded that no profitable standalone operation was feasible. As a consequence, it was decided to cease the production by end of December 2016. Our Ambès (France) facility had a capacity of approximately 50 kmt per year utilized in production of unviable standard grades. Further steps under this initiative are either at an advanced stage (consolidation of our two Korean plants at the Yeosu facility with the closing of our Bupyeong plant expected to be effected by mid of 2018) or under detailed evaluation (consolidation of further rubber carbon black facilities).
Innovation
We enjoy a long-standing reputation within the industry for carbon black product and process technology, applications knowledge, and innovation. Carbon black products are highly versatile and meet specific performance requirements across many industries. This creates significant opportunities for product and process innovation. The final properties of the carbon black product depend on the mixture of raw materials used and to a large extent on the configuration and operating conditions of the specific reactor and the further processing of the initial product in beading, drying and after-treatment steps. Minimal changes to just one of the many process parameters can result in completely different carbon black products with different properties and potential end uses. Accordingly, further product innovations are a key competitive factor in the industry, even after decades of R&D in this field.
We maintain multiple product applications and process development centers in Europe, Asia and the Americas. Our Innovation Group is divided into applications technology and process development teams. The applications technology team works closely with our major clients to develop innovative products and expand the applications range for carbon black products. Additional benefits of these efforts are the further strengthening of customer relationships and improved communications. Success in applications development deepens our understanding of customer and industry requirements gained through these interactions. The process development team works closely with our manufacturing and procurement teams to enhance company competitiveness. This team focuses on efforts that lead to improved production processes, improved product quality and improved cost structure.
Our leading competence center is located in Cologne (Germany) to support and enhance our global Innovation Group activities. This center includes carbon black technologists, applications technology laboratories and process development staff, co-located with our pilot process development facilities. Staffing in our Cologne technical center includes physicists, chemists and engineers who can effectively and efficiently collaborate to create and analyze various carbon black properties with a goal to develop new products to meet customer requirements. Common processes and information technology tools further enhance coordination and communication with our regional technical centers located in South Korea, China and the United States. Overall, a total of more than 90 FTEs were employed in the Innovation Group in
2017
.
Applications Technology
Our goal is to remain at the forefront of the industry in terms of product development by having dedicated applications technology facilities. Success relies on close collaboration with customers, often through long-term R&D alliances, which create superior technical interfaces. These interactions enable us to develop tailored solutions and meet unique customer requirements.
The applications technology team employs approximately 40% of our Innovation Group FTEs globally. The applications technology team can be subdivided into (i) specialty carbon black, with the majority of employees in Cologne (Germany) and some employees in the United States and Asia, and (ii) rubber carbon black, with most employees in Cologne (Germany).
Our applications technology teams bring together a deep knowledge of carbon black technology with an understanding of the key applications practiced by our customers. This team has access to extensive laboratory and testing facilities using similar formulations, processing and test methods employed by our customers. Customer collaborations often include cooperative testing with customers’ staff in our facilities. Applications technology provides a key customer and market interface and translates specific customer needs into carbon black product attributes. Product attributes are used to design and select relevant product prototypes and make specific product recommendations. This team has all the needed capabilities to develop and evaluate new products.
Applications technology plays a supporting role in the process of new product launch by providing technical data and presentations, training and support and establishment and monitoring of quality targets. This team works closely with customers to provide support during the qualification cycle, which can be long and may last over one year. This close cooperation decreases the likelihood of customer switching suppliers once a product has been approved.
Product quality test methods and applications testing are defined within the applications technology team. Methods are developed centrally and deployed worldwide to relevant production and applications laboratories to assure consistency in measurements and reporting.
Spending on Innovation, including both applications technology and process development, amounted to €
16.1 million
in
2017
and €
14.5 million
in
2016
and was mostly directed towards the development of new specialty carbon black products, new applications for carbon black products and the improvement of process efficiencies. We believe that this level of spending on Innovation is among the highest in the industry and intend to maintain our spending on Innovation at this level going forward.
Process Development
27
We believe our process development capabilities represent a key competitive advantage. Product customization relies upon extensive process capabilities. Unique products and products that are difficult to replicate add value to customers’ end-products. Our customers have come to rely upon a continuous improvement in product quality and performance. Process development also enables improvements in manufacturing costs and efficiencies.
Our process development department employs approximately 40% of our Innovation Group FTEs globally, most of whom are located in Cologne (Germany). Our efforts include three main areas: (i) process development focused on improving efficiency and optimization of raw materials use, (ii) specialty carbon black product development and (iii) rubber carbon black product development. Professional staff in this group includes chemists, chemical engineers and process engineers with an understanding of critical process parameters to control carbon black manufacturing. This group also includes physicists and theoreticians who carry out computer modeling of carbon black production processes.
Pilot Plants
Process development operates special “pilot plants” which we believe are significant enablers for development efforts and provide us with a competitive advantage. These pilot plants are small scale production facilities used for real-world trials of new carbon black grades, feedstocks and production processes. We operate two pilot plants at the Cologne site in Germany, with the main pilot plant being a 25% scale semi-commercial sized furnace reactor line based on the standard configuration of a full production furnace line. This unit is constructed with a modular reactor set-up which provides flexibility to carry out experimental process developments. The plant is also used for the small-scale production and sale of carbon black grades that are in their initial stage of commercialization. This enables market introduction of specialty products. We also have a smaller gas black pilot plant in Cologne (Germany), which further enhances our flexibility in conducting gas black product research.
Mini-Plants and Simulations Centers
In addition to the semi-commercial pilot plants, we operate a family of “mini-plants” in Cologne (Germany). The mini-plants include a smaller furnace reactor for basic studies as well as various facilities for chemical after-treatment, granulation and drying to tailor new products to specific customer requirements, especially in the specialty carbon black area. Experiments in the pilot plants for product and process development rely on world-class expertise in process simulation. Process simulation is used to predict the outcome from planned experiments thereby limiting costly experiments, accelerating our development cycle and increasing our likelihood of success at full-scale production.
Product and Process Innovation
Product and process efforts are focused on technical targets that have specific, quantified value-creation opportunities. Global portfolio management, R&D and project management processes assure that efforts are prioritized, aligned and tracked. Intellectual property creation is also a key outcome from innovation efforts.
This approach has yielded several recent successes. For example, our Specialty Carbon Black segment developed a clean and highly dispersible carbon black for use in high-voltage power cables in response to industry requirements for increased efficiency. Our Rubber Carbon Black segment developed a carbon black with unique particle characteristics that increase wear resistance, thereby extending the life of truck tires. These product successes rely on our proprietary production processes. In addition, process improvements have been successfully deployed, creating improved efficiencies and lower costs and is under continued further deployment.
Marketing, Sales and Customer Contracts
We have an integrated sales and marketing process that combines key management, regional sales and technical marketing and applications support. This allows us to focus on customer solutions tailored to particular industries or regions. The Sales and Marketing departments employed approximately 255 FTEs globally at the end of
2017
.
Sales
Our Sales department is organized into two main groups: Key Account Management and Regional Sales. The Key Account Management team deals with the largest customers (approximately 70 key accounts) and has dedicated sales people by global account. The Regional sales team covers all other customers (approximately 900 customers, of which approximately 420 are located in Europe, the Middle East and Africa, approximately 230 in the Americas and approximately 290 in Asia-Pacific). The field sales force operates along geographical regions and, where necessary, is combined across our Specialty Carbon Black and Rubber Carbon Black segments. In addition to selling carbon black directly, we work with third-party distributors serving our markets with all required smaller volume lots.
Marketing
Marketing is organized between our two operating segments: Specialty Carbon Black and Rubber Carbon Black. The Marketing teams support the expansion of our business and its substantial and sustainable profit development. They design and implement short and mid-term marketing strategies, as well as monitor relevant market trends, gather market intelligence and identify niches for new product launches. In addition, Marketing teams are in charge of strategic and operational price setting.
28
Flexible Contracts
Most of our long-term contracts contain formula-driven price adjustment mechanisms for changes in raw material and/or energy costs. We sell carbon black under the following two main categories of contracts based on price adjustment mechanisms:
|
•
|
Contracts with feedstock adjustments (indexed contracts).
This category includes contracts with monthly or, in some cases, quarterly automatic feedstock and/or energy costs adjustments, which cover approximately
75%
of volumes in our Rubber Carbon Black segment and selected large customers
volumes exceeding 90 kmt
in our Specialty Carbon Black segment in
2017
. Considering as well those volumes subject to regular raw material cost adjustment ("de facto formula") the cover rate would increase to 88% in our Rubber Carbon Black segment and to approximately 110 kmt in our Specialty Carbon Black segment in 2017.
|
|
•
|
Non-indexed contracts.
This category includes short-term contracts (usually shorter than three months) where sales prices of our carbon black products are not linked to carbon black oil market prices.
|
Many of our indexed contracts allow for monthly price adjustments, while a small portion (by volume sold) allows for quarterly price adjustments. The one-month oil price adjustment mechanism typically results in a two-month delay in reflecting oil price changes in our customers pricing, while the three-month price adjustment mechanism typically results in a four-month delay. We believe that these contracts have enabled us generally to maintain our Segment Adjusted EBITDA Margins, however, rapid and significant oil or energy price fluctuations have had and are likely to continue to have significant and varying effects on our earnings and results of operations, partly because oil price changes affect our sales prices and our and our cost of raw materials and energy at different times and amounts, and partly due to other factors, such as differentials affecting the ultimate carbon black oil prices paid by us (versus a particular reference price index), actual carbon black oil usage amounts and our ongoing efficiency initiatives. See “
Item 5. Operating and Financial Review and Prospects
—Key Factors Affecting Our Results of Operations—Raw Material and Energy Costs
.” Sales prices under non-indexed contracts (covering approximately
25%
of the volumes in the Rubber Carbon Black segment and
volumes exceeding 90 kmt
in the Specialty Carbon Black segment in
2017
) are reviewed on a regular basis, with one to three month intervals to reflect raw material and energy price fluctuations as well as overall market conditions. We believe that the current competitive environment usually allows us to implement price adjustments in a reasonably timely manner when oil prices are relatively stable. In any event, our reliance on indexing and short-term contracts will not fully protect us from significant price fluctuations, in part as a portion of our contracts are not indexed or short-term, and those that are remain subject to lag-time effects. As of 2016 we entered into a commodity hedge to address the exposure resulting from the supply of a specific carbon black oil type for our Korean production. See “
Item 3. Key Information
—D. Risk Factors—Risks Related to Our Business—We are subject to volatility in the costs and availability of raw materials and energy, which could decrease our margins and adversely affect our business, financial condition, results of operations and cash flows
.” In addition, specific contract price adjustment details also affect the pass through of these costs.
Outbound Logistics and Distribution
Our outbound logistics and distribution function has critical importance given the high cost involved in the transportation of carbon black, in particular rubber carbon black. Each of our plants has different logistics demands based on the products manufactured and the region’s export requirements. Unlike rubber carbon blacks, which are mostly sold regionally, specialty carbon blacks are sold globally, since freight costs typically represent a smaller component of the final price. Europe and North America, which export high volumes of specialty carbon black, have complex and demanding logistics requirements. Other regions, such as South Africa, South Korea and Brazil, are relatively self-contained with the vast majority of production sold within the respective countries.
The primary method of the carbon black transportation to customers is by truck and rail. The majority of the regions use primarily trucks, with the exception of the United States, where rail transport accounts for approximately half of transportation modes. We lease our trucks and the majority of rail cars and have a variety of third-party agreements with railroad and trucking companies for the management of vehicles.
Carbon black is packaged and sold in bulk (on average 20 metric ton packages for trucks and 50 metric ton packages for rail), flexible intermediate bulk containers (on average 0.5-1.0 metric ton packages) and small bags (on average 10-20 kg packages). We choose a packaging method based on cost considerations and client preferences. We estimate that 54% of our volume in
2017
was delivered in bulk, 36% in intermediate bulk containers and 10% in bags.
Intellectual Property
We consider intellectual property development and management as a source of strategic competitive advantage. We maintain patents and trademarks on a number of our products and processes. However, we often do not patent a production method or product to avoid disclosure of business specific know-how. We proactively make careful assessments with respect to production process improvements and decide whether to apply for patents or retain and protect these improvements as trade secrets. When we file a patent application, it is usually filed in the relevant countries with active competition and markets for our products. In addition to patents, a significant part of our intellectual property is our trade secrets, general know-how and experience regarding the manufacturing technology, plant operation and quality management.
We rely on intellectual property laws, confidentiality procedures and contractual provisions to protect our intellectual property rights. We regard our patents, trade secrets and other intellectual property as valuable assets and take action when we deem it necessary to protect them. We proactively monitor competing patents and patent applications to ensure that we do not infringe the rights of other industry participants and/or challenge patent applications that may be without merit and would inhibit our ability to utilize our technology.
29
In connection with the separation of our business from Evonik, Evonik assigned to us its intellectual property that was exclusively used in its carbon black business, as well as certain intellectual property rights that are still in use in its retained business. Evonik retained ownership of certain intellectual property that is not material to us. Evonik has granted us a non-exclusive license to use such retained intellectual property in the field of carbon black. In addition, we have granted back to Evonik licenses relating to some of our intellectual property rights to use such intellectual property in all fields outside of carbon black, which licenses are exclusive, subject to certain exceptions in areas adjacent to carbon black. Accordingly, we may be restricted in leveraging our intellectual property that we use on the basis of a license from Evonik or the intellectual property that is subject to the grant-back license to expand our business into fields outside of carbon black. For additional information, see “
Item 3. Key Information
—D. Risk Factors—Legal and Regulatory Risks—We may not be able to protect our intellectual property rights successfully and we are still subject to restrictions and risks associated with our intellectual property sharing arrangements with Evonik
.”
Environmental, Health and Safety Matters
Protection of humans and the environment, fair treatment of our partners and a clear alignment to the needs of customers are the essential components of our activities. Therefore, we strive not only comply with all applicable laws and voluntary obligations, but strive to continuously improve our performance and management systems. Our integrated global management system with established standards and processes is based on the principles of the Responsible Care, ISO 9001 Quality Management System, ISO 14001 Environmental Management Systems, and OSHAS 18001 Safety Management Systems. All our operating sites are third-party certified by ISO 14001 and ISO 9001. The global management system outlines our processes and procedures practiced in relation to environmental protection, occupational and process safety, health protection and quality management including sustainable compliance, social accountability and product stewardship.
Our operations involve the use, processing, handling, storage and transportation of materials that are subject to numerous supranational, national and local environmental and safety laws and regulations. Our production facilities require operating permits that are subject to renewal or modification. We could incur significant costs, including fines, penalties and other sanctions, third-party claims and environmental cleanup costs, as a result of violations of or liabilities under environmental, health and safety laws and regulations or operational permits required thereunder. We believe that our operations are currently in substantial compliance with all applicable environmental, health and safety laws and regulations. Although our management systems and practices are designed to ensure compliance with laws and regulations, future developments and increasingly stringent regulation could require us to make additional unforeseen environmental, health and safety expenditures. See as well risks described in “
Item 3. Key Information—D. Risk Factors—Legal and Regulatory Risks—Our operations are subject to environmental, health and safety regulations. We have been and may in the future be subject to investigations by regulatory authorities in respect of alleged violations and may incur significant costs to maintain compliance with, and to address liabilities under, these laws and regulations
”
.
Environmental
Air Quality
One of the main environmental challenges of a carbon black plant is the management of exhaust gas from production processes. This exhaust gas contains a number of regulated pollutants, including carbon monoxide and sulfur compounds. The most common method for controlling these gases is through combustion, which produces useable energy as a by-product. Currently, nine manufacturing sites have the capability to beneficially utilize these gases through some form of energy co-generation, such as the sale or reuse of steam, gas or electricity. In addition, we are evaluating initiatives to build additional co-generation facilities.
The primary air pollutants of concern include sulfur dioxide (SO
2
), nitrogen oxides (NOx) and particulates. In order to maintain compliance with emission requirements, we utilize various desulfurization and de-NOx processes. We control the particulate matter by using our state-of-the-art bag filter technology.
With regard to air quality we are subject to emission control provisions at the national as well as at the EU level. The EU Directive No. 2010/75/EU on industrial emissions (“IED Directive”) entered into force on January 6, 2011. It provides for regulation on the prevention and control of pollution from industrial activities and includes rules aiming to reduce emissions into air, water, and land and to prevent the generation of waste. Starting January 2013, the EU member states had to comply with emissions limits for certain industries. Moreover, the IED Directive amended the former EU Directive 2008/1/EC on integrated pollution prevention and control (“IPPC Directive”) by defining best available techniques as binding industry standards. The Best Available Techniques Reference (BREF Notes) document applied to the carbon black industry was developed and implemented in August 2007 and it is subjected to be revised and updated in the next 2 or 3 years by the European Commission.
Germany, for example, implemented the IED Directive by amendments to certain German statutes (among other things, the Federal Emissions Control Act (
Bundes-Immissionsschutzgesetz
), the Federal Water Act (
Wasserhaushaltsgesetz
) and the Act on Recycling (
Kreislaufwirtschaftsgesetz
). With respect to new emissions thresholds and new binding industry standards, permits need to comply with these standards and will, in general, not be grandfathered.
Besides the IED Directive and its implementation, European jurisdictions in which we operate may provide for further regulations regarding emission reduction and safety technology standards that apply to our facilities (for example, the German Emissions Control Act). Therefore, under such regulations we would have to modernize our facilities regularly to meet the required standards.
30
In the United States, we are subject to emissions limitations under the federal Clean Air Act (“CAA”) and analogous state and local laws and regulations, which regulate the emission of air pollutants from our facilities and impose significant monitoring, record keeping and reporting requirements. In addition, these laws and regulations require us to obtain pre-approval for the construction or modification of facilities expected to produce or significantly increase air emissions and to obtain and comply with air permits that include stringent conditions on air emissions and operations. In certain cases, we may need to incur capital and operating expenditures for specific equipment or technologies to control emissions. All our U.S. facilities are required to obtain federal “Title V” permits, which are required for stationary sources classified as “major” on the basis of their emissions. Obtaining permits and approvals required for the construction, modification and operation of our facilities, or the appeal of such permits and approvals once they are issued, has the potential to delay the development of our projects. We have incurred, and expect to continue to incur, substantial administrative and capital expenditures to maintain compliance with CAA requirements that have been promulgated or may be promulgated or revised in the future.
Pursuant to the CAA, the EPA has developed industry-specific National Emission Standards for Hazardous Air Pollutants (“NESHAPs”) for stationary sources classified as “major” on the basis of their hazardous air pollutant emissions. Our U.S. facilities are subject to NESHAPs applicable to carbon black facilities, as well as NESHAPs applicable to industrial boilers. The NESHAPs establish emissions reduction requirements and require use of control technology requirements that meet a minimum standard and which may entail a combination of technology, processes, and techniques. These requirements are imposed through our Title V permits, and require specific monitoring, recordkeeping and reporting requirements. See “
—Environmental Proceedings
” for information regarding our compliance with the CAA.
In China a reduction of NOx emission limits for a boiler from 300 parts per million (“ppm”) to 200 ppm and dust from 30 micro gram per cubic meter (“mg/m
3
”
)
to 20 mg/m
3
was required following a change in Chinas Air Pollution Prevention law in October 2017. In addition Chinese government announced that SO
2
limits for the boiler will be reduced from 200 ppm to 50 ppm effective in 2018.
Further reduction of NOx emissions from 200 to 100 ppm and dust from 20mg/m
3
to 10mg/m
3
will become effective in 2019. With effect from calendar year 2020 SO
2
emission limits for a dryer will be reduced from 200 ppm to 50 ppm.
In Korea the Clean Air Conservation Act changed, leading to reduced air emission limits for SO
2
from 400 ppm to 200 ppm,
NOx from 250 ppm to 150 ppm and dust from 50ppm to 30 ppm. These changes will become effective in calendar year 2020. These regulation changes may require additional capital and operating expenditures for specific equipment or technologies to control emissions.
Greenhouse Gas Regulation and Emissions Trading
Our facilities also emit significant volumes of CO
2
. In the European Union, all our production facilities are subject to the European Emission Trading Scheme (“ETS”) for CO
2
emissions. The ETS was set up in 2003 by the Directive 2003/87/EC in order to considerably reduce the output of GHGs. The directive has been implemented into German law as the Greenhouse Gas Emissions Trading Act (
Treibhausgas-Emissionshandelsgesetz
). Industrial sites to which the ETS applies receive a certain number of allowances to emit GHGs and must surrender one allowance for each metric ton of GHG emitted. For the third trading period that commenced in 2013, the ETS has been revised such that the EU-wide quantity of emission allowances allocated each year have been significantly reduced as compared to the average annual total quantity of allowances issued in the EU between 2008 and 2012 and no free-of-charge allocation for any electricity producing entity exists anymore.
The latest amendment regulation to ETS regime of the European Commission (Regulation (EU) No. 176/2014) postpones the auctioning of 900 million emission allowances from 2013 to 2015 to later in the third trading period, which will end in 2020 (“Backloading”). Based on that amendment, the auction volume was reduced by 400 million allowances in 2014, by 300 million in 2015, and by 200 million in 2016. Backloading does not affect the overall volume of allowances to be auctioned in the third trading period, but only the distribution of auction volumes over the eight-year period.
The ETS affects carbon black manufacturers in the European Union. Carbon black production is currently listed on the carbon leakage list, which allows receiving the major share of needed emission allowances free of charge. Nevertheless, this list is reviewed regularly and Carbon Black may be removed from the Carbon Leakage List. See “
Item 3. Key Information
—D. Risk Factors—Legal and Regulatory Risks—Regulations requiring a reduction of greenhouse gas emissions could adversely affect our business, financial condition, results of operations and cash flows.
” The preparation for the ETS Phase IV (2021-2030) has been started in 2017 by the European Commission, the European Council and the European Parliament in cooperation and possible new rules will be announced during 2018 with regard to ETS Phase IV. As part of International Carbon Black Association's (“ICBA”) joint activity towards ETS, OEC has initiated an emission data collection. This data collection shall contribute to help developing an industrial benchmark of emission data. Data shall provide a basis for expected discussions and exchanges between environmental agencies across the EU to complete the emission allocation process for ETS Phase IV.
In the U.S., comprehensive climate change legislation has not yet been adopted. After determining that emissions of carbon dioxide, methane, and certain other gases endanger public health and the environment in December 2009, the EPA has regulated GHG emissions under various provisions of the Clean Air Act. The EPA adopted rules that require reporting of GHG emissions by owners and operators of facilities in certain source categories or that exceed certain GHG emissions thresholds, and our facilities are subject to this rule. Further, EPA issued the GHG “Tailoring Rule” in May 2010, to address GHG permitting requirements pursuant to its determination that GHG emissions triggered permitting requirements for stationary sources starting in January 2011, and has since continued efforts to regulate GHG emissions.
31
Apart from the EPA’s efforts, Congress has from time to time considered legislation to reduce emissions of GHGs, but no legislation has been enacted to date. At the state level, approximately one-half of the states have already taken legal measures to reduce emissions of GHGs, primarily through the planned development of GHG emission inventories and/or regional GHG cap-and-trade programs. There is no assurance that the current level of regulation will continue at the federal or state level in the future, or that future changes would not materially affect our operations or require material capital expenditures. The adoption of legislation or regulations that require reporting of GHGs, establish permitting thresholds based on GHG emissions or otherwise limit or impose compliance obligations for emissions of GHGs from our equipment and operations could require us to incur costs to obtain and comply with permits, reduce emissions of GHGs associated with our operations or purchase carbon offsets or allowances.
The design concept of the South Korean ETS is similar to the European ETS. Each participant receives an allocation of allowed emissions. If the emissions exceed the allocated allowance, then the participant is required to offset such excess emissions through various legally authorized means, such as purchasing certified credits, applying authorized offset credits and borrowing (the use of proceeding year’s allocation). A failure to offset excessive emissions will result in a monetary penalty, equaling three times the market price for the carbon credit traded at the Korean exchange. However, the maximum penalty is set at 100,000 Korean Won (approximately €78 applying an exchange rate of 1,279.61 Korean Won per EUR as of December 31, 2017). As of end-January, the market price for carbon credit is around 22,000 Korean Won (approximately, €17.19). The combined carbon deficit over the first three year period (from 2015 to 2017) was 276,864 tCO2e. We purchased emission rights amount to 2.3 billion Korean Won (approximately €1.8 million) to address this deficit and we are taking steps to mitigate our exposure for future periods through various means, including improvements in the feedstock-to-carbon black conversion ratio, energy optimization to reduce the use of energy at our two sites and pricing the cost of GHG offsets in our offers to our customers. We are also considering taking bid positions in the Korean Exchange to acquire carbon credits at reasonable prices.
Although the South African Carbon Offsets Law was intended to be in effect from January 1, 2017, it is still in draft form, the second draft proposal has been issued by the SA Treasury Ministry on Dec 26, 2017. As the next step, a public hearing process has been started and led by the Parliament sometime in 2018, therefore the final law may not be in force until 2019. The carbon black process is listed on Table 3 of this bill and a process emission factor was determined for a ton of carbon black produced using furnace black technology. The current amount of tax is determined to be 120 ZAR per ton of CO2 emitted into the atmosphere. Our facility in Port Elizabeth is currently in contact with the relevant authority to minimize the impact, however, the final outcome of that negotiation is not known at this time.
There are also ongoing discussions and regulatory initiatives in other countries in which we have facilities, including Brazil, regarding GHG emission reduction programs, but those programs have not yet been defined.
Water Quality
Our plants are net consumers of water. Most of our plants recycle a substantial amount of the water used in the manufacturing process, which is used as “quench water” in the cooling process. Water discharge from most plants consists primarily of storm-water during and after heavy rain, as well as limited wastewater from ancillary operations such as boiler blowdown and equipment washing; these discharges only take place under permitted conditions. For those plants that discharge water, the treatment generally is a settling pond system. Some facilities operate more advanced wastewater treatment systems, such as filtration and aeration systems incorporating chlorination or ozonation, depending on local requirements.
At the EU level, the European Directive No. 2000/60/EC, also known as the Water Framework Directive (“WTD”), aims to achieve a good qualitative and quantitative status of all water bodies by 2015. Its main goals include expanding the scope of water protection to all waters, including surface waters and groundwater, water management based on river basins, a “combined approach” of emission limit values and quality standards and streamlining legislation. A lot of effort has been put into the preparation and drafting of the River Basin Management Plans by 2009. The Plans should have identified all actions to be taken in the river basin district to deliver the objectives of the WFD. An interim Commission’s Assessment with respect to the status of water conditions in the EU, and activities influencing it, is attesting best water qualities ever since. However, the assessment shows that a more determined effort is needed to ensure achievement of WFD objectives in the enacted 6-year cycles ending in 2021 and 2027.
Moreover, the use of water for the manufacturing process may require permits or licenses as, for example, under the German Federal Water Act or German local laws. Permits may also be required for the discharge of wastewater into the public sewer system. Such permit or license may be revoked without compensation under certain circumstances.
In the United States, our facilities are subject to the federal Clean Water Act (“CWA”), and analogous state laws and regulations that impose restrictions on the discharge of pollutants into waters of the United States. Any such discharge of pollutants must be in accordance with the terms of the permit issued by EPA or the analogous state agency. In addition, the CWA and implementing state laws and regulations require individual permits or coverage under general permits for discharges of storm water runoff from certain types of facilities. Federal and state regulatory agencies can impose administrative, civil and criminal penalties for non-compliance with discharge permits or other requirements of the CWA and analogous state laws and regulations. These permits generally have a term of five years. Our facilities are subject to CWA permitting requirements, and must obtain and comply with National Pollutant Discharge Elimination System permits, which establish standards for, and require monitoring of, our discharges. We are subject to categorical pretreatment standards for the Carbon Black Manufacturing Point Source category, which, among other requirements, prohibits discharges of process wastewater pollutants to navigable water.
32
Contamination
As we handle chemicals that could cause water or soil contamination, we may be subject to remediation obligations under national law. Additionally, third parties may be able to file claims for personal injury and property damage allegedly caused by the release of hazardous substances or other pollutants into the environment.
In particular, the German Federal Act on Soil Protection (
Bundes-Bodenschutzgesetz
) requires the prevention of soil contamination by taking adequate precautions. In case of discovery of any contamination or past pollution (
Altlasten
) the owner, the current controlling person of the property, the polluter, its universal successor (
Gesamtrechtsnachfolger
) or the previous owner (if such owner transferred title to the real property after March 1, 1999 and knew or should have known of the contamination or past pollution) may be held responsible for remediation measures. Responsibility may be placed on either or several of the persons even in the absence of any fault or negligence. The competent authorities may also take remediation measures themselves and require the responsible party to bear the costs of such remediation. If several parties are responsible, they are jointly or severally liable and each party has the legal claim to reimbursement against the other parties. Such reimbursement may be contractually modified or waived among the parties.
In case of contamination of ground or surface water, the responsibility for remediation measures results from the Federal Act on Soil Protection in conjunction with the Federal Water Act and local water protection laws.
In the United States, our facilities are subject to the Comprehensive Environmental Response, Compensation, and Liability Act (“CERCLA”), the Resource Conservation and Recovery Act (“RCRA”) and similar state laws. CERCLA establishes liability for parties, including current and former site owners and operators, generators, and transporters, in connection with releases of hazardous substances. Under CERCLA, we may be subject to liability without regard to fault or the lawfulness of the disposal or other activity. Our operations involve the storage, handling, transportation and disposal of hazardous substances within the meaning of CERCLA. As a result, we may be jointly and severally liable under CERCLA for all or part of the costs required to clean up sites at which hazardous substances have been released into the environment. Under CERCLA and similar state laws, we could be required to remove previously disposed substances and wastes, remediate contaminated property and groundwater, conduct natural resource damage assessments and pay compensation and penalties. RCRA is the principal federal statute regulating the generation, treatment, storage and disposal of hazardous and other wastes. RCRA and state hazardous waste regulations impose detailed operating, inspection, training and response standards and requirements for permitting, closure, remediation, financial responsibility, record keeping and reporting. Our sites have areas currently and formerly used as landfills for wastes generated by our operations. These landfills may be subject to regulation under RCRA, and certain of our facilities have been investigated and remediated under RCRA. These laws and regulations may also expose us to liability for acts that were in compliance with applicable laws at the time we performed those acts. We could incur significant costs in connection with investigation and remediation activities or claims asserted at current or former facilities or third-party sites.
Non-hazardous and Hazardous Waste
In some jurisdictions in which we operate we are subject to provisions regarding waste management and the handling and storage of hazardous substances. Those provisions may require documentation on the disposal of waste or compliance with certain safety standards (for example, as set forth in Council Directive 96/82/EC on the control of major-accident hazards involving dangerous substances, known as Seveso II Directive). The directive was implemented into German law by the 12th Ordinance under the German Emissions Control Act.
We generate hazardous waste in the form of spent solvents at our plant labs. In addition, coal tar fractions, a common raw material at some plants, are considered hazardous waste if spilled or otherwise require disposal, as are certain refractories that contain hexavalent chromium, which are generated infrequently. Certain facilities have on-site landfills permitted for the current disposal of non-hazardous solid waste.
Energy Surcharge
The German Renewable Energies Act grants above-market payments to the producers of energy generated from renewable sources. To balance these payments, an energy surcharge is imposed on the consumers of energy. Certain exemptions regarding that surcharge are provided in the EEG, in particular for energy intensive industries and self-consumption of self-produced energy.
The European Commission opened an in-depth investigation procedure in December 2013 to examine whether the reductions granted under the EEG comply with EU state aid rules.
Currently, the European Commission and the German government are working out an agreement regarding future benefits in that respect. Accordingly, the German legislator is amending the national regulations and setting up a new regime regarding energy intensive industries. It is expected that the exemption from the energy surcharge regarding electricity generated for the Company’s own consumption will be grandfathered. However, there is no assurance that we can maintain the exemption status permanently.
33
Environmental Proceedings
During 2008 and 2009, the U.S. Environmental Protection Agency (“EPA”) contacted all U.S. carbon black producers as part of an industry-wide EPA initiative, requesting extensive and comprehensive information under Section 114 of the U.S. Clean Air Act, to determine, for each facility, that either: (i) the facility has been in compliance with the Clean Air Act; (ii) violations have occurred and enforcement litigation may be undertaken; or (iii) violations have occurred and a settlement of an enforcement case is appropriate. In response to information requests received by the Company’s U.S. facilities, the Company furnished information to the EPA on each of its U.S. facilities. The Company’s Belpre (Ohio) facility was an initial subject of these investigations and received notices under Section 113(a) of the Clean Air Act from the EPA in 2010 alleging violations of Prevention of Significant Deterioration (“PSD”) and Title V permitting requirements under the Clean Air Act. In October 2012, the Company received a corresponding notice and finding of violation (an “NOV”) alleging the failure to obtain PSD and Title V permits reflecting Best Available Control Technology (“BACT”) at several units of the Company’s Ivanhoe (Louisiana) facility. In January 2013 the Company also received an NOV issued by the EPA for its facility in Borger (Texas) alleging the failure to obtain PSD and Title V permits reflecting BACT during the years 1996 to 2008. The Company received a comparable NOV from the EPA for the Company’s U.S. facility in Orange (Texas) in February 2013; and an NOV in March 2016 alleging more recent non-PSD air emissions violations primarily at the dryers and the incinerator of the Orange facility.
In November 2013, Orion began discussions with the EPA and the U.S. Department of Justice (“DOJ”) about a potential settlement to resolve the NOVs. On December 22, 2017, a consent decree between Orion Engineered Carbons LLC and the United States (on behalf of EPA), as well as the Louisiana Department of Environmental Quality, was lodged in the U.S. District Court for the Western District of Louisiana. Once the consent decree is entered by the court, it will resolve and settle the EPA’s claims of noncompliance set forth in the NOVs and in a respective complaint filed in court by the United States on December 22, 2017. All
five
U.S. carbon black producers have now settled with the U.S. government. We were one of the two last carbon black companies to sign a consent decree.
Under its consent decree, Orion Engineered Carbons LLC will install certain pollution control technology in order to further reduce SO2, NOx and particulate matter (PM) emissions at our four U.S. manufacturing facilities in Ivanhoe (Louisiana), Belpre (Ohio), Borger (Texas), and Orange (Texas). We estimate that the capital expenditures for these installments, to be incurred over approximately
six
years, are U.S. Dollar
110
to
140
million. Orion Engineered Carbons LLC also agreed to pay a civil penalty of $
800,000
and to perform environmental mitigation projects totaling $
550,000
. The penalty and mitigation project costs are in line with the respective reserves already established by us for this purpose. The consent decree also requires the continuous monitoring of emissions reductions by the ÈPA that Orion Engineered Carbons LLC will need to comply with over a number of years. Noncompliance with applicable emissions limits would lead to further penalty payments to EPA.
We caution, however, that the actual capital expenditures we might need to incur in order to fulfill the requirements of the consent decree remain uncertain. In particular, the consent decree allows some flexibility in both locations and technology solutions. The solutions we choose to implement may differ in scope and operation from those we currently anticipate and factors, such as timing, locations, target levels and local regulations, could also make capital expenditures different from what we currently estimate.
Our agreement with Evonik in connection with the Acquisition provides for a partial indemnity from Evonik against various exposures, including, but not limited to, capital investments, fines and costs arising in connection with Clean Air Act violations that occurred prior to July 29, 2011. Except for certain relatively less relevant allegations contained in the second NOV received for our facility in Orange (Texas) in March 2016, all of the other allegations made by the EPA with regard to all
four
of our U.S. facilities–as discussed above–relate to alleged violations before July 29, 2011. The indemnity provides for a recovery from Evonik of a share of the costs (including fines), expenses (including reasonable attorney’s fees, but excluding costs for maintenance and control in the ordinary course of business and any internal cost of monitoring the remedy), liabilities, damages and losses suffered and is subject to various contractual provisions including provisions set forth in the Share Purchase Agreement with Evonik, such as a de minimis clause, a basket, overall caps (which apply to all covered exposures and all covered environmental exposures, in the aggregate), damage mitigation and cooperating requirements, as well as a statute of limitations provision. Due to the cost-sharing and cap provisions in Evonik’s indemnity, we expect that substantial costs we will incur in this EPA enforcement initiative and its respective settlement could exceed the scope of the indemnity, perhaps in the tens of millions of Euros. In addition, Evonik has signaled that it may likely defend itself against claims under the indemnity; while we intend to enforce our rights vigorously, there is no assurance that we will be able to recover costs or expenditures incurred under the indemnity as we expect or at all.
See
“
Item 3. Key Information -D. Risk-Factors-Risks Related to Indebtedness, Currency Exposure and Other Financial Matters-Our agreements with Evonik in connection with the Acquisition require us to indemnify Evonik with respect to certain aspects of our business and require Evonik to indemnify us for certain retained liabilities. We cannot offer assurance that we will be able to enforce claims under these indemnities as we expect.”
Chemical Regulations
Some jurisdictions we operate in have established regimes to regulate or control chemical products to ensure the safe manufacture, use and disposal of chemicals.
In the European Union, the Regulation on Registration, Evaluation, Authorisation of Chemicals was signed in December 2006, came into effect on June 1, 2007 and requires chemical manufacturers and importers in the European Union to register all chemicals manufactured in, or imported into the European Union in quantities of more than one ton annually. Registration has to be made at the European Chemicals Agency (“ECHA”). The registration process requires capital and resource commitments to compile and file comprehensive chemical dossiers regarding the use and attributes of each chemical substance manufactured or imported by us and requires us to perform chemical safety
34
assessments. Moreover, the use of certain “highly hazardous chemicals” must be authorized by ECHA. Furthermore, REACh Regulation contains rules on bringing substances to the market that have been identified as substances of very high concern (“SVHC”). If identified as SVHC, manufactured substances will be listed on the “candidate list” and potentially prioritized for or inclusion into Annex XIV to the REACh Regulation which may mean a full ban or requirement for authorization to be granted by the European Commission at its discretion. Carbon black oils used as raw materials in the carbon black production are considered intermediates under REACh. Use of intermediates is exempted from authorization under REACh.
Registration of certain chemicals with ECHA has been compulsory since June 1, 2008. For pre-registered substances, three registration deadlines are applicable, depending on the tonnage of the substance. Substances manufactured or imported into the EU exceeding 1000 mt/y and specific SVHC in lower volumes had to be registered before December 1, 2010. The second period regarding substances in quantities of 100 to 1000 mt/y ended on May 31, 2013. The last deadline for substances of more than 1 mt/y will be May 31, 2018.
Further national provisions exist that apply to our business. For example, under German law, the Chemicals Act (
Chemikaliengesetz
) and related ordinances impose particular obligations on producers, processors, and handlers of chemical agents. We have to comply with safety obligations in this respect, particularly regarding the handling and storage of hazardous substances.
In the United States, we are subject to federal and state requirements relating to our business and products. In particular, we are subject to the California Safe Water and Toxic Enforcement Act, known as Proposition 65. Among other requirements, Proposition 65 imposes labeling and record keeping requirements. Non-compliance may result in significant penalties or fines, and future amendments to Proposition 65 could result in increased labeling or other compliance obligations applicable to our products.
In South Korea the so called Chemical Control Act was enacted. According to the act coal based feedstock oils such as CCT, CTD, SPO containing more than 0.001% quinolone are treated as hazardous chemicals requiring production sites to be duly licensed to use these coal based feedstock from 2019. We may incur capital and operational expenses to meet the relevant requirements to become duly licensed.
We are a member of the International Carbon Black Association (the “ICBA”), which currently consists of representatives from carbon black manufacturers in Canada, Europe, the United States, South America, Asia and Africa. The ICBA seeks to address common environmental, health and safety issues, undertakes research on health implications of carbon black, and serves as the leading advocate for the industry in the regulatory and public-interest arenas. The ICBA funds research on international environmental, health, product safety and workplace safety matters and is currently in the process of founding a regional subgroup covering Asia.
We are also a member of the European consortium for carbon black (“
cb4reach Consortium
”) which has pre-registered and registered carbon black with ECHA as required by the REACh Regulation. Besides the Company, the following companies are members of the cb4reach Consortium: Cabot Corporation, Cancarb Limited, Birla Carbon, Continental Carbon Company, Sid Richardson Carbon & Energy Company, and Imerys S.A.
Health and Safety
The health and safety of our employees and customers is one of our highest priorities. We maintain very good performance in occupational injury and illness rates. New employees and contractors working on site are given environmental, health and safety training and we keep track of environmental, health and safety matters. Employees are required to report and log incidents including near misses into the electronic environmental, health and safety (“EHS”) management system. Our sites are required to implement and report EHS leading and lagging indicators for EHS performance. Plant managers are required to track and monitor these leading and lagging indicators and take action as appropriate. Leading and lagging indicator data and incidents are reviewed by senior management on a monthly basis. A strategic safety team provides for development, implementation and auditing of safety activities and promotes safety accountability by our personnel.
Carbon black is produced under controlled conditions and has high purity levels. It therefore differs from other combustion products that may contain high concentrations of hazardous compounds. Due to its high purity, certain carbon black grades are permitted for use in cosmetics or in products in contact with food.
The International Agency for Research on Cancer (“IARC”) classifies carbon black as a Group 2B substance (known animal carcinogen, possible human carcinogen). We have communicated IARC’s classification of carbon black to our customers and employees in accordance with applicable regulatory requirements. The Permanent Senate Commission for the Investigation of Health Hazards of Chemical Compounds in the Work Area (the “MAK Commission”) of the German Research Foundation (
Deutsche Forschungsgemeinschaft
), which uses a different rating system, classifies carbon black as a suspect carcinogen (Category 3B). Other national and international health organizations have not rated carbon black. Any risk reclassification of our raw materials, intermediates or finished product could result in increased operating costs or affect product lines or sales.
In March 2017 the ECHA updated the Community Rolling Action Plan (“CoRAP”). The CoRAP indicates substances for evaluation by the European Member States. The evaluation aims to clarify the initial concern that manufacturing and/or use of these substances could pose a risk to human health or the environment. Carbon black is included in CoRAP for substance evaluation in 2019. The substance evaluation for carbon black was proposed by France. The initial reasons of concern raised by the French Agency for Food, Environmental and Occupational Health & Safety (“ANSES”) relate to carbon black being a carcinogenic substance and a suspected reproduction toxicant. Orion is working as a member of the cb4reach Consortium and ICBA to address the reasons for nomination. The conclusion of the evaluation may have significant business impact should ANSES conclude that carbon black poses a risk to human health. A potential outcome could be a harmonized
35
classification and labeling of carbon black for carcinogenicity and toxicity to reproduction. These developments may significantly affect our business, including increasing costs of doing business.
According to the recommendation of October 18, 2011 (2011/696/EU), carbon black is defined as a nano-material in Europe. In a similar approach the ISO developed the ISO TC 229 “Nanotechnologies,” which considers carbon black as a “nano-structured material.” Other countries (such as, US, Canada, France, Belgium, Switzerland etc.) have implemented or are considering implementing notification schemes related to nano materials. The notification of carbon black under the different notification schemes requires capital and resource commitments to compile and file dossiers. Furthermore, more and more specific requirements for substances regarded as nanomaterials are emerging with Europe. For example, Germany is planning to introduce a more stringent Occupational Exposure Limit for nanomaterials. These developments may significantly affect our business, including increasing costs of doing business.
Further Regulatory Matters
We are subject to further governmental regulation from national, European Union and other international regulatory authorities concerning, among other things: product safety, export and import control regulations and other customs regulations, data protection and our competitive and marketplace conduct. We believe that we are in compliance in all material respects with these regulations. We cannot guarantee, however, that any future changes in the requirements or mode of enforcement of these laws and regulations will not have a material adverse effect on our business, financial condition, results of operations or cash flows.
36
|
C.
|
Organizational Structure
|
Below is a simplified diagram of the Company’s corporate structure as of
December 31, 2017
.
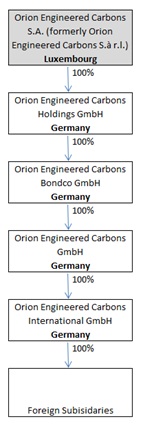
Subsidiaries
For a list of our subsidiaries see note
(4)
List of shareholdings
to the consolidated financial statements.
|
D.
|
Property, Plants and Equipment
|
See “
—B. Business Overview—Production—Production Facilities
.”
Not applicable.
The following discussion and analysis summarizes the significant factors affecting our results of operations and financial condition during the years ended
December 31, 2017
,
2016
and
2015
and should be read in conjunction with the information included under
Item 4. Information on the Company
and
Item 18. Financial Statements
. Our consolidated financial statements have been prepared in accordance with IFRS.
Overview
In
2017
, we generated revenue of €
1,177.2
million on a volume of
1,087.4
kmt, a profit for the period of €
66.8
million, and Adjusted EBITDA of €
227.7
million. Adjusted EBITDA for our Specialty Carbon Black segment was €
128.9
million, and the Segment Adjusted EBITDA Margin was
30.4%
. This segment accounted for
36.1%
of our total revenue,
56.6%
of total Adjusted EBITDA and
24.0%
of our volume in kmt in
2017
. Adjusted EBITDA for our Rubber Carbon Black segment was €
98.8
million, and Segment Adjusted EBITDA Margin was
13.1%
. This segment accounted for
63.9%
of our total revenue,
43.4%
of total Adjusted EBITDA and
76.0%
of our total volume in kmt in
2017
.
37
Key Factors Affecting Our Results of Operations
We believe that the following factors have had, and will continue to have, a material effect on our results of operations and financial condition. As many of these factors are beyond our control and certain of these factors have historically been volatile, past performance will not necessarily be indicative of future performance and it is difficult to predict future performance with any degree of certainty. In addition, important factors that could cause our actual results of operations or financial conditions to differ materially from those expressed or implied below, include, but are not limited to, factors indicated in this report under “
Item 3. Key Information
–D.
Risk Factors
” and “
Note Regarding Forward-Looking Statements.
”
General Economic Conditions, Cyclicality and Seasonality
Our results of operations are affected by worldwide economic conditions. Because carbon black is used in a diverse group of end products, demand for carbon black has historically been related to real GDP and general global economic conditions. In particular, a large part of our sales has direct exposure to the cyclical automotive industry and, to a lesser extent, the construction industry. As a result, our results of operations experience a level of inherent cyclicality. The nature of our business and our large fixed asset base make it difficult to rapidly adjust our fixed costs downward when demand for our products declines, which materially affects our results of operations. For example, we experienced a decrease in volume of approximately 15% in 2009, in the wake of the global financial and economic crisis, followed by a recovery in volume of 14.8% in 2010. As a result, our results of operations dropped sharply in the second half of 2008 and 2009, and recovered again in 2010. Our overall results improved thereafter in line with the global economic recovery and recovery in underlying industries, which varied by region.
Our business is generally not seasonal in nature, although we may experience some regional seasonal declines during holiday periods and our results of operations are generally weaker in the last three months of the year.
Drivers of Demand
Besides general global economic conditions, certain specific drivers of demand for carbon black differ among our operating segments. Specialty carbon black has a wide variety of end-uses and demand is largely driven by the development of the coatings, polymers and printing industries. Demand for specialty carbon black in the coatings and polymers industries is mainly influenced by the levels of industrialization, infrastructure, construction and car ownership. Demand for specialty carbon black in the printing industry is mainly influenced by developments in print media and packaging materials. Demand for rubber carbon black is largely driven by the development of the tire and mechanical rubber goods industries. Demand for rubber carbon black in tires is mainly influenced by the number of replacement and original equipment tires produced, which in turn is driven by (i) vehicle trends, including the number of vehicles produced and registered, and the number of miles driven, (ii) demand for high-performance tires, (iii) demand for larger vehicles, such as trucks and buses and (iv) changes in regulatory requirements. Demand for rubber carbon black in mechanical rubber goods is mainly influenced by vehicle trends, construction activity and general industrial production.
Demand in the developed West European and North American regions is mainly driven by demographic changes, customers’ high-quality requirements, stringent tire regulation standards and relatively stable tire replacement demand. Demand in emerging markets, such as China, Southeastern Asia, South America and Eastern Europe, is mainly driven by the growing middle class, rapid industrialization, new infrastructure spending and increasing car ownership trends. The growth in vehicle production in turn drives demand for both original equipment tire manufacturing and replacement tires in developing regions.
Asset Utilization
Margins in the carbon black industry, and the chemical industry generally, are strongly influenced by industry utilization. As demand for products approaches available supply, utilization rates rise, and prices and margins typically increase over time. Historically, this relationship has been highly cyclical, due to fluctuations in supply resulting from the timing of new investments in capacity and general economic conditions affecting the relative strength or weakness of demand. Generally, capacity is more likely to be added in periods when current or expected future demand is strong and margins are, or are expected to be, high. Investments in new capacity can result, and in the past frequently have resulted, in over-capacity, which typically leads to a reduction of margins. For example, some of our customers have shifted, and may continue to shift, manufacturing capacity from mature regions, such as North America and Europe, to emerging regions, such as Asia and South America. Consequently, competitors in China have recently (particularly regarding production of standard tire grades), added capacity at far greater proportion than demand has risen, which resulted in pressured margins in the region. In response, producers typically reduce capacity utilization or limit further capacity additions, eventually causing the industry to be relatively undersupplied. In recent years, a systematic reduction in capacity in North America and Europe, together with increased manufacturing efficiencies, has enabled us to largely preserve margins and increase our utilization rates.
Although utilization levels can differ significantly by plant, these levels tend to be driven more by variations in demand from specific customers served by each plant rather than by general trends in the region where the plant is located. We estimate our average plant utilization rate to have been at approximately
90%
in
2017
, approximately 87% in
2016
and approximately 86% in
2015
. We have made recent investments in strategic sites to increase the flexibility of our production platform and closed a production facility in Europe in order to consolidate capacities in the European region. Both actions allow us to opportunistically upgrade and expand our capacity to produce higher margin products, as demand allows, and positions us better to shift additional production capacity to specialty carbon black products and rubber carbon black for higher-end mechanical rubber goods. We intend to achieve further growth in production volume, as customer demand allows, by improving utilization rates, improving the availability of our assets by minimizing planned and unplanned facility downtime and improving the capacity of our assets through systematic supply chain planning and improved operating technologies. Unplanned outages can impact our operating
38
results. Similarly, planned or unplanned outages of our competitors can positively affect our operating results by decreasing the product supply in the industry.
Efficiency Initiatives
Our results of operations are affected by our energy consumption, manufacturing costs and efficiency improvements. We have implemented and will continue to implement production and energy efficiency initiatives by exploiting alternative feedstock sources with a strong focus on feedstock yields, as well as on feedstock prices. As further discussed below under “–
Raw Material and Energy Costs
,” the benefits arising from these feedstock-related efficiency initiatives are reduced as oil prices fall.
We have developed new energy efficient reactor designs and state-of-the-art energy recovery equipment that have already been installed in many of our production sites. In recent years, we have increased our co-generation capabilities and currently nine of our manufacturing sites have some form of co-generation, transforming combustible exhaust gas, the main by-product of the carbon black production process, into electricity, steam or hot water. We are analyzing available energy recovery options for our production sites currently not equipped with co-generation facilities and plan to expand co-generation capacity of our plants in the future, if economically viable.
Raw Material and Energy Costs
Our results of operations are affected, directly and indirectly, by fluctuations in raw material and energy prices. Our manufacturing processes consume significant amounts of raw materials and energy, the costs of which are subject to fluctuations in worldwide supply and demand, in addition to other factors beyond our control. In
2017
, raw materials accounted for
71%
of our cost of sales. Approximately
90%
of the cost of raw material used in the production of carbon black is related to petroleum-based or coal-based feedstock known as carbon black oil, with some limited use of other raw materials, such as nitrogen tetroxide, hydrogen and natural gas.
The pricing of carbon black oil is typically indexed to the price of fuel oil and is generally benchmarked against Thomson Reuters indices of mainly three regions, namely the U.S. Gulf Coast, Amsterdam / Rotterdam / Antwerp and Singapore. While the majority of our purchases are based on underlying fuel oil indices, the ultimate carbon black oil price also depends on carbon black oil specific quality characteristics, differentials (premiums or discounts), freight costs and region specific supply and demand as well as regulatory factors. Carbon black oil procurement is an important factor in achieving best-in-class production costs.
Approximately 50% of our carbon black oil supply is covered by short- and long-term contracts with a wide variety of suppliers.
A significant portion of our volume is sold based on formula-driven price adjustment mechanisms for changes in costs of raw materials, that is, approximately
75%
in the Rubber Carbon Black segment and volumes of approximately 90 kmt in the Specialty Carbon Black segment, based on volumes in
2017
. Most of our indexed contracts allow for monthly price adjustments, while a relatively small portion allows for quarterly price adjustments. The one-month oil price adjustment mechanism typically results in a two-month delay in reflecting oil price changes in our customers pricing, while the three-month price adjustment mechanism typically results in a four-month delay. Sales prices under our non-indexed contracts (approximately
25%
in the Rubber Carbon Black segment and volumes exceeding approximately 90kmt in the Specialty Carbon Black segment based on volume in kmt in
2017
) are reviewed regularly with a view to reflecting raw material and energy price fluctuations as overall market conditions allow. We believe that the current competitive environment generally allows us to implement price adjustments in a reasonably timely manner, although, as discussed below, the timing of price adjustments and other contract terms relating to price adjustments may have unpredictable and varying effects on our profitability. In addition, there can be no guarantee that we will be able to timely adjust prices under our non-indexed contracts in the future, see “
Item 3. Key Information
—
D.
Risk Factors
—
Risks Related to Our Business
—
We are subject to volatility in the costs and availability of raw materials and energy, which could decrease our margins and adversely affect our business, financial condition, results of operations and cash flows.
”
Costs for raw materials and energy have fluctuated significantly and may continue to fluctuate in the future. For example, Brent crude oil prices continuously increased from $76 per barrel in May 2010 to a peak of $127 per barrel in April 2011, and then declined to approximately $30 at end of December 2015. At end of December
2017
the price increased again to $67 per barrel. We believe that our contracts have enabled us generally to maintain our Segment Adjusted EBITDA Margins since the Acquisition, however, rapid and significant oil or energy price fluctuations have had and are likely to continue to have significant and varying effects on our earnings and results of operations, partly because oil price changes affect our sales prices and our cost of raw materials and energy at different times and amounts, and partly due to other factors, such as differentials affecting the ultimate carbon black oil price paid by us (versus a particular reference price index), actual carbon black oil usage amounts and our ongoing efficiency initiatives. As a result of the significant decline in oil prices in particular in 2014, we have seen one or more of these factors come into play at different times and adversely affect our profitability, and this is likely to be seen again in future periods of a declining oil pricing environment. It is also possible that in this environment, other factors come into play and interact adversely with our longer-term formula-based customer pricing arrangements. It is difficult to predict the impact of these factors going forward. In general, our customer pricing arrangements, and in particular the price adjustment formulas, are designed to protect us against rising or higher oil prices, and while we may seek to adjust them to accommodate the current environment, they may be difficult to change quickly, and if changed, may not be as protective if and when oil prices begin to rise.
39
Foreign Currency Exchange Rate Fluctuations
Our results of operations and Net Working Capital are affected by foreign currency exchange rate fluctuations. Our exposure to foreign currencies comes from three main sources: (i) currency translation, when we translate results of our subsidiaries denominated in local functional currencies into Euros, (ii) commercial transactions, such as when we contract purchases of our feedstock, which are mostly in U.S. Dollars, and (iii) financing transactons, as a large portion of our financial obligations are denominated in U.S. Dollars, some of which are hedged. In
2017
, 40%, 25% and 19% of our revenues were generated by our subsidiaries whose functional currency is the Euro, the U.S. Dollar and the Korean Won respectively, with the remainder in other currencies. Fluctuations in currency exchange rates could require us to reduce our prices to remain competitive in foreign regions. In each case, the relevant income or expense is reported in the respective local currency and translated into Euro at the applicable currency exchange rate for inclusion in our consolidated financial statements. Therefore, our financial results in any given period are materially affected by fluctuations in the value of the Euro relative to other currencies, in particular the U.S. Dollar and the Korean Won. Our foreign currency transaction exposure is partially offset by costs and expenses incurred by our subsidiaries in their local functional currencies.
The pricing of carbon black oil, our main raw material, is linked to the price of heavy fuel oil and is generally benchmarked against Platts indices of three regions: the U.S. Gulf Coast, Rotterdam and Singapore. Most of our carbon black oil purchase contracts are denominated in U.S. Dollars. Generally, an appreciation of the U.S. Dollar has a negative impact on our results of operations and Net Working Capital, because our raw material purchases in U.S. Dollars may not be fully offset by our ability to pass-through changes in raw material costs to customers and by the translation effect of our results of operations in the United States.
We manage our foreign currency exchange exposure through the use of derivative instruments to economically hedge on balance sheet foreign currency denominated receivables and payables. Effective as of January 2015, we consider the U.S. Dollar-denominated portion of our indebtedness under the Term Loan economically hedged our investment in our U.S. operations. As a result, as of the beginning of 2015, we do not use derivative instruments to hedge the U.S. Dollar-denominated portion of our Term Loan. We use customary products to manage other foreign exchange risk, including forward exchange contracts and currency options. We do not generally use foreign exchange hedging for expected exposure, as our expected exposure from sales is largely offset by our expected exposure from purchases.
Current and Future Environmental Regulations
Our operations are subject to extensive environmental laws and regulations, which require us to invest significant financial and technical resources to maintain compliance with applicable requirements. If environmental harm is found to have occurred as a result of our current or historical operations, we may incur significant remediation costs at current or former production facilities or third-party sites and may have to pay fines and damages. Many of our facilities have a long history of operation and have never been the subject of comprehensive environmental investigations. As a result, our environmental compliance and remediation costs could increase. Future closure and decommissioning at any one of these facilities, or of process units at these facilities, could result in significant remediation costs. For instance, many of our facilities have onsite landfills, storage tanks, wastewater treatment systems, ponds and other units that have been in use for a number of years, and we may incur significant costs when closing these units in accordance with applicable laws and regulations and when addressing related contamination of soil and groundwater. For more information about information requests made by the EPA to, and alleged violations of the U.S. Clean Air Act by, certain of our facilities located in the United States, see “
Item 4. Information on the Company
—B. Business Overview—Environmental, Health and Safety Matters—Environmental—Environmental Proceedings
.”
Changes to environmental regulations or laws that may affect previously unregulated aspects of our business may also require us to incur significant compliance costs. New regulations requiring further reductions of GHG and other emissions are being considered in Europe, the United States, China, Brazil and South Korea. Our carbon black operations may generate more CO
2
than is permitted under current or future allocation schemes for GHG emissions, requiring us either to purchase emission credits or to modify our production processes to reduce emissions. Additionally, nano-scale materials, including carbon black, are under increased and ongoing scrutiny in multiple jurisdictions, including the European Union, and are likely to be subject to stricter regulation in the future, which may require us to incur significant costs in order to comply with new laws and requirements. Further, carbon black has been classified by certain national and international health organizations as a possible or suspected human carcinogen. A negative reclassification of carbon black by these organizations, or similar classifications of carbon black or other finished products, raw materials or intermediates by other organizations or governmental authorities could adversely affect our compliance costs, operations, sales and reputation.
Environmental considerations can also affect the industries in which we operate, including our position with respect to our competitors. For example, new tire labeling regulatory requirements globally (particularly in Europe) are expected to reduce the threat of low-cost tire imports significantly and to favorably affect demand in developed regions.
In connection with the Acquisition, Evonik agreed, subject to certain deductibles, caps, exclusions and procedural requirements, to indemnify us for certain historical environmental liabilities. See “
Item 3. Key Information
—D. Risk Factors—Risks Related to Indebtedness, Currency Exposure and Other Financial Matters—Our Agreements with Evonik in connection with the Acquisition require us to indemnify Evonik with respect to certain aspects of our business and require Evonik to indemnify us for certain retained liabilities. We cannot offer assurance that we will be able to enforce claims under these indemnities as we expect
.”
40
Critical Accounting Policies
The preparation of our financial statements requires management to make estimates and judgments that affect the reported amounts of assets, liabilities, revenues, and expenses and related disclosure of contingent assets and liabilities. We consider an accounting estimate to be critical to the financial statements if (i) the estimate is complex in nature or requires a high degree of judgment and (ii) different estimates and assumptions were used, the results could have a material impact on the consolidated financial statements. We evaluate our estimates and application of our policies on an ongoing basis. We base our estimates on historical experience, current conditions and on various other assumptions that we believe are reasonable under the circumstances, the results of which form the basis for making judgments about the carrying values of assets and liabilities that are not readily apparent from other sources. Actual results may differ from these estimates under different assumptions or conditions. The policies that we believe are critical to the preparation of the consolidated financial statements are the following:
•
Revenue and expense recognition;
•
Goodwill;
•
Inventories;
•
Pension provisions;
•
Deferred taxes, current income taxes;
•
Derivative financial instruments;
•
Hedge accounting; and
•
Contingent liabilities and other financial obligations.
These critical accounting policies and other significant accounting policies are discussed in note
(2.5)
Significant accounting policies
to our audited consolidated financial statements included elsewhere in this report. See also note
(7.8)
Pension provisions and post-retirement benefits
to our audited consolidated financial statements for information about sensitivities of inputs used with respect to pension provisions. See also note
(7.1)
Goodwill and other intangible assets
to our audited consolidated financial statements with respect to goodwill. In particular, with regard to the assessment of the value in use of the groups of cash generating units (“CGUs”) to which goodwill is allocated, management believes that no reasonably possible change in any of the key assumptions would cause the carrying value of the groups of CGUs to materially exceed their recoverable amounts.
Effective from January 1, 2018 IFRS 15 with respect to revenue recognition will become effective. The adoption of this standard will not result in a difference in our revenue recognition.
Effective from January 1, 2018 IFRS 9 with respect to financial instruments will become effective. For potential impacts see also note (2.2) Accounting standards issued but not yet effective.
Effective from January 1, 2019 changes to IFRS 16 with respect to treatment and recognition of lease agreements will become effective. We have not early adopted this standard. For our current lease obligation see also note
(9.5)
Contingent liabilities and other financial obligations
.
For additional information see also note
(2.2)
New accounting standards
.
Certain of the significant accounting policies include the use of estimates, but do not meet the definition of critical because they generally do not require estimates or judgments that are as difficult or subjective to measure. However, these policies are important to an understanding of the consolidated financial statements.
U.S. Dollar Reporting
We will begin reporting our results in U.S. dollars rather than euros effective with the first quarter of 2018. U.S. dollar reporting could introduce greater volatility into our reported Adjusted EBITDA, net income and EPS, because substantial portions of our revenues and costs are denominated in non-dollar currencies.
Reconciliation of Non-IFRS Financial Measures
We focus on Contribution Margin and Adjusted EBITDA as measures of our operating performance. Contribution Margin and Adjusted EBITDA presented in this Management Discussion and Analysis have not been prepared in accordance with IFRS or the accounting standards of any other jurisdiction. Other companies may use similar non-IFRS financial measures that are calculated differently from the way we calculate these measures. Accordingly, our Contribution Margin and Adjusted EBITDA may not be comparable to similar measures used by other companies and should not be considered in isolation, or construed as substitutes for, revenue, consolidated profit or loss for the period, operating result (EBIT), gross profit and other IFRS measures as indicators of our results of operations in accordance with IFRS.
Contribution Margin and Contribution Margin per Metric Ton (Non-IFRS Financial Measures)
41
We calculate Contribution Margin by subtracting variable costs (such as raw materials, packaging, utilities and distribution costs) from our revenue. We believe that Contribution Margin is useful because we see this measure as indicating the portion of revenue that is not consumed by such variable costs and therefore contributes to the coverage of all other costs and profits. The following table reconciles Contribution Margin and Contribution Margin per Metric Ton to revenue:
|
Year Ended December 31,
|
||||||
|
2017
|
2016
|
2015
|
||||
|
unaudited
(in € million, unless otherwise indicated)
|
||||||
|
Revenue
(1)
|
1,177.2
|
1,030.1
|
1,111.8
|
|||
|
Variable costs
(2)
|
(712.2)
|
(560.9)
|
(673.1)
|
|||
|
Contribution Margin
|
465.0
|
469.2
|
438.7
|
|||
|
Volume (in kmt)
|
1,087.4
|
1,127.9
|
1,035.2
|
|||
|
Contribution Margin per Metric Ton (in €)
|
427.6
|
416.0
|
423.8
|
|||
(1) Separate line item in Audited Financial Statements.
(2) Includes costs such as raw materials, packaging, utilities and distribution.
Adjusted EBITDA (Non-IFRS Financial Measure)
We define Adjusted EBITDA as operating result (EBIT) before depreciation and amortization, adjusted for acquisition related expenses, restructuring expenses, consulting fees related to Group strategy, share of profit or loss of joint venture and certain other items. Adjusted EBITDA is defined similarly in our Credit Agreements. Adjusted EBITDA is used by our management to evaluate our operating performance and make decisions regarding allocation of capital because it excludes the effects of items that have less bearing on the performance of our underlying core business.
Our use of Adjusted EBITDA has limitations as an analytical tool, and should not be considered in isolation or as a substitute for analysis of our financial results as reported under IFRS. Some of these limitations are: (a) although Adjusted EBITDA excludes the impact of depreciation and amortization, the assets being depreciated and amortized may have to be replaced in the future and thus the cost of replacing assets or acquiring new assets, which will affect our operating results over time, is not reflected; (b) Adjusted EBITDA does not reflect interest or certain other costs that we will continue to incur over time and will adversely affect our profit or loss, which is the ultimate measure of our
financial performance and (c) other companies, including companies in our industry, may calculate Adjusted EBITDA or similarly titled measures differently. Because of these and other limitations, Adjusted EBITDA should be considered alongside our other IFRS-based financial performance measures, such as consolidated profit or loss for the period. The following table presents a reconciliation of Adjusted EBITDA to consolidated profit for each of the periods indicated:
42
|
Year Ended December 31,
|
|||||||||
|
2017
|
2016
|
2015
|
|||||||
|
(in € million)
|
|||||||||
|
Profit for the period
|
66.8
|
|
44.6
|
|
42.9
|
|
|||
|
Income taxes
|
20.7
|
|
23.2
|
|
23.8
|
|
|||
|
Profit before income taxes
|
87.6
|
|
67.9
|
|
66.7
|
|
|||
|
Add back finance costs, net
(4)
|
36.7
|
|
37.3
|
|
56.2
|
|
|||
|
Deduction share of profit of joint ventures
|
(0.5
|
)
|
(0.4
|
)
|
(0.5
|
)
|
|||
|
Earnings before taxes and finance income/costs (operating result (EBIT))
|
123.8
|
|
104.8
|
|
122.4
|
|
|||
|
Add back depreciation, amortization and impairment of intangible assets and property, plant and equipment
|
85.9
|
|
88.7
|
|
72.8
|
|
|||
|
EBITDA
|
209.7
|
|
193.5
|
|
195.2
|
|
|||
|
Share of profit of joint venture
|
0.5
|
|
0.4
|
|
0.5
|
|
|||
|
Restructuring expenses
(1)
|
4.6
|
|
17.6
|
|
—
|
|
|||
|
Consulting fees related to Group strategy
(2)
|
2.5
|
|
2.6
|
|
1.5
|
|
|||
|
Long Term Incentive Plan
|
7.8
|
|
3.6
|
|
0.9
|
|
|||
|
Other adjustments
(3)
|
2.6
|
|
5.1
|
|
10.6
|
|
|||
|
Adjusted EBITDA
|
227.7
|
|
222.8
|
|
208.7
|
|
|||
|
Thereof Adjusted EBITDA Specialty Carbon Black
|
128.9
|
|
136.7
|
|
115.0
|
|
|||
|
Thereof Adjusted EBITDA Rubber Carbon Black
|
98.8
|
|
86.1
|
|
93.7
|
|
|||
(1) Restructuring expenses for the period ended December 31, 2017 are related to further actions undertaken to realign our worldwide Rubber footprint in particular in Korea and to a lesser extent in the USA. Restructuring expenses for the period ended December 31, 2016 relate to the strategic realignment of the worldwide Rubber footprint, resulting in a decision to cease production by December 31, 2016 of the plant in Ambès, France. These expenses comprise personnel related costs of
€
6.1 million
and demolishing, site remediation and securing as well as accrued other expenses for the cessation of
€
11.5 million
.
|
(2)
|
Consulting fees related to the Orion strategy include external consulting fees from establishing and implementing our operating, tax and organizational strategies including merger and acquisition strategies.
|
(3) Other adjustments (from items with less bearing on the underlying performance of the Company's core business) in the period ended December 31, 2017 primarily relate to costs associated with our EPA enforcement action of
€2.1 million
, costs to remediate damages incurred by hurricane Harvey of
€1.4 million
and costs associate with the secondary offering of our shares, offset by
€1.3 million
of reimbursements of reassessed real estate transfer taxes.
Other adjustments for the period ended December 31, 2016 primarily relate to cost of
€
4.1 million
associated with our EPA enforcement action (including accrued expenses for penalties and mitigation projects). Other adjustments in 2015 mainly include
€
5.0 million
costs related to address the EPA enforcement action, in particular to evaluate emission-removal technologies and legal advice,
€
1.8 million
Sarbanes-Oxley first time implementation costs,
€
1.8 million
OECQ post acquisition-related costs and
€
1.5 million
reassessed real estate transfer tax related to the 2011 acquisition.
(4) Finance costs, net consists of finance income and finance costs.
43
|
A.
|
Operating Results
|
2017
Compared to
2016
The table below presents our historical results derived from our audited consolidated financial statements for the periods indicated.
|
Income Statement Data
|
Year Ended December 31,
|
|||||
|
2017
|
2016
|
|||||
|
(in € million)
|
||||||
|
Revenue
|
1,177.2
|
1,030.1
|
||||
|
Cost of sales
|
(842.4)
|
(691.8)
|
||||
|
Gross profit
|
334.8
|
338.3
|
||||
|
Selling expenses
|
(115.1)
|
(114.6)
|
||||
|
Research and development costs
|
(16.1)
|
(14.5)
|
||||
|
General and administrative expenses
|
(68.7)
|
(68.6)
|
||||
|
Other operating income
|
4.3
|
5.9
|
||||
|
Other operating expenses
|
(10.8)
|
(13.8)
|
||||
|
Restructuring expenses
|
(4.6
|
)
|
(27.9
|
)
|
||
|
Operating result (EBIT)
|
123.8
|
104.8
|
||||
|
Finance costs, net
(1)
|
(36.7
|
)
|
(37.3
|
)
|
||
|
Share of profit or loss of joint ventures
|
0.5
|
0.4
|
||||
|
Financial result
|
(36.2)
|
(36.9)
|
||||
|
Profit before income taxes
|
87.6
|
|
67.9
|
|
||
|
Income taxes
|
(20.7)
|
(23.2)
|
||||
|
Profit for the period
|
66.8
|
44.6
|
||||
(1) Finance costs, net consists of finance income and finance expenses
Revenue
Revenue
increased
overall by €
147.1
million, or
14.3%
, from €
1,030.1 million
(€
385.9
million in our Specialty Carbon Black segment and €
644.2
million in our Rubber Carbon Black segment) in
2016
to €
1,177.2 million
(€
424.6
million in our Specialty Carbon Black segment and €
752.6
million in our Rubber Carbon Black segment) in
2017
.
This revenue increase was primarily due to contractually indexed sales price increases in our Rubber Carbon Black segment resulting from the pass through of higher feedstock costs to customers with agreements that link price to the cost of feedstock and certain base price increases, offset partly by impacts resulting from a different product mix, by lower volumes and foreign exchange rate translation impacts.
Volume
decreased
by
40.5
kmt, or
3.6%
, from
1,127.9
kmt (
241.8
kmt in our Specialty Carbon Black segment and
886.1
kmt in our Rubber Carbon Black segment) in
2016
to
1,087.4
kmt (
261.4
kmt in our Specialty Carbon Black segment and
826.0
kmt in our Rubber Carbon Black segment) in
2017
. This decrease is mainly a result of a decrease in volumes sold of rubber carbon black products in all regions except South America and China and as a result of the closure of our Rubber standard grade production capacity in France and the U.S. and the ongoing conversion of capacity in South Korea. The decrease in our rubber carbon black products was partly offset by increased volumes for specialty carbon black products increased in all regions. The decrease in volume contributed a decrease of revenue of 1.1%, or €11.0 million (Volume in our Specialty Carbon Black segment increased and contributed an increase in revenue of 3.1%, or €35.5 million, while decreased volumes in our Rubber Carbon Black segment decreased revenue by 4.1%, or €42.5 million) in
2017
compared to
2016
. The volume related decrease of revenue as well as negative impacts from our product mix of €12.9 million was offset mainly by positive impacts on revenue in
2017
compared to
2016
resulting from oil price changes of 14.9%, or €153.0 million, and increases of certain base prices of 2.0%, or €20.9 million. Foreign exchange translation effects had a negative impact of €3.6 million on our revenues.
Cost of Sales and Gross Profit
Cost of sales
increased
by €
150.6
million, or
21.8%
, from €
691.8
million (€
208.4
million in our Specialty Carbon Black segment and €
483.3
million in our Rubber Carbon Black segment) in
2016
to €
842.4
million (€
256.4
million in our Specialty Carbon Black segment and €
586.0
million in our Rubber Carbon Black segment) in
2017
. The
3.6%
decrease in volume in
2017
compared to
2016
resulted in a decrease of cost of sales of 2.6%, or €14.4 million (2.2%, or €12.3 million, increase in our Specialty Carbon Black segment and 4.8%, or €26.8 million, decrease in our Rubber Carbon Black segment) in
2017
compared to
2016
. This volume-related decrease of cost of sales as well as a decrease associated with a change in our product mix was offset by higher oil prices of 30.3%, or €170.1 million, with other impacts on cost of sales
44
almost netting out each other.
Revenues of our Specialty Carbon Black segment increased by
10.0%
in
2017
compared to
2016
. The cost of sales in this segment increased by
23.0%
. This increase in cost of sales reflects the timing impact of price increases for non-indexed customers during rising carbon black oil prices as well higher depreciation charges. The percentage increase in cost of sales of our Rubber Carbon Black segment (
21.2%
) was higher than the percentage increase in revenue (
16.8%
) of that segment. This increase in cost of sales reflects the effects of the increase in carbon black oil prices and timing impacts associated with higher oil prices, higher regional feedstock mix costs as well as higher depreciation charges in part due to hurricane Harvey impairments and accelerated depreciation at our Bupyeong, South Korea plant. These negative impacts were partly offset by lower cost of sales due to lower volumes in the Rubber segment.
Higher overall revenue as a result of the above mentioned impacts was not fully sufficient to offset the increased cost of sales. Gross profit
decreased
by €
3.5
million, or
1.0%
, from €
338.3
million (€
177.4
million in our Specialty Carbon Black segment and €
160.9
million in our Rubber Carbon Black segment) in
2016
to €
334.8
million (€
168.2
million in our Specialty Carbon Black segment and €
166.7
million in our Rubber Carbon Black segment) in
2017
for reasons described above.
Selling Expenses
Selling expenses
increased
slightly by €
0.5
million, or
0.5%
, from €
114.6
million in
2016
to €
115.1
million in
2017
, despite a decrease in volume from
1,127.9
kmt in
2016
to
1,087.4
kmt in
2017
in part due to salary increases.
Research and Development Costs
R&D expenses increased by €
1.6
million, from €
14.5
million in
2016
to €
16.1
million in
2017
. This increase is primarily related to the timing of expenditures for individual development of programs as well as extended research to meet EPA related requirements resulting in our recent settlement with the EPA.
General Administrative Expenses
General administrative expenses remained essentially flat and
increased
by €
0.1
million, or
0.3%
, from €
68.6
million in
2016
to €
68.7
million in
2017
, increases in annual salary costs were compensated by foreign exchange translation effects.
Other Operating Income and Expenses
In
2017
, other operating income amounted to €
4.3
million and included, among other things, €1.3 million of income from the reversal of provisions and €1.3 million of reimbursement of real estate transfer taxes. Other operating expenses in
2017
amounted to €
10.8
million, comprising primarily €2.5 consulting fees related to group strategy, €2.1 million expenses related to the EPA enforcement action, €1.4 million costs to remediate damages incurred by hurricane Harvey as well as cost associated with our secondary public offerings.
In 2016, other operating income amounted to €5.9 million and included, among other things, €1.2 million of income from the reversal of provisions. Other operating expenses in 2016 amounted to €13.8 million, comprising primarily €4.1 million of expenses related to the EPA enforcement action (including accrued expenses for penalties and mitigation projects), €2.6 million related to group strategy consulting fees,€1.0 million related to loss on disposal of assets and €0.8 million of currency translation effects.
For additional details on other operating income and expenses see notes
(6.2)
and
(6.3)
to the audited consolidated financial statements.
Restructuring Expenses
As part of the strategic repositioning of the Rubber business footprint, we concluded consultations with local works council at our Ambès (France) plant to implement a restructuring and down staffing with a cessation of production at the site at the end of 2016. Expenses relating to this restructuring activity totaled €27.9 million in 2016 comprising cash costs of €15.8 million and non-cash items of €12.1 million (of which €10.3 million relate to impairments of fixed assets). Further activities in repositioning the Rubber footprint resulted in expenses of €
4.6
million in 2017 mainly due to our efforts to consolidate our two Korean production sites.
Operating Result (EBIT)
Operating result
increased
by €
19.0
million, or
18.1%
, from €
104.8
million in
2016
to €
123.8
million in
2017
, mainly driven by the one time effect incurred in 2016 relating to our restructuring expenses of repositioning of our Rubber business footprint and the effects described above.
45
Finance Costs, Net
Finance cost, net amounted to €
36.7 million
in
2017
compared to €
37.3 million
in
2016
. Finance cost, net in
2017
includes, among others, €20.3 million of regular interest expenses, €4.1 million of amortization of capitalized transaction costs and €5.4 million net expenses of foreign currency revaluation effects.
Finance cost, net in 2016 includes, among others, €29.8 million of regular interest expenses, €3.8 million of amortization of capitalized transaction costs, interest expenses related to pension obligations of € 1.5 million and a net income of foreign currency exchange rate revaluation effects of €1.8 million.
Share of Profit of Associates
Share of profit of associates represents the equity income from our German JV, which was comparable in
2017
and
2016
.
Financial Result
Financial result comprises finance income, finance expenses and share of profit or loss of associates and
improved
by €
0.7
million, or
1.9%
, from €
36.9 million
finance expenses in
2016
to €
36.2 million
finance expenses in
2017
.
Profit or Loss for the Period before Income Taxes
Our profit before taxes in
2017
was €
87.6
million, reflecting an improvement of €
19.7
million from a profit before taxes of €
67.9
million in
2016
, mainly due to the effects of expenses related to the strategic repositioning of the Rubber business footprint affecting 2016.
Income Taxes
Income taxes amounted to €
20.7 million
in
2017
compared to €
23.2 million
in
2016
. While the profit before taxes increased significantly our income taxes were reduced by a one-time effect of €7.4 million from the re–measurement of our net deferred tax liabilities in the United States following the Tax Cuts and Jobs Act reform enacted as of December 22, 2017.
In
2017
, the effective tax rate of
23.7%
deviated from the expected group rate of 32% in particular due to the one-time effect associated with the U.S. tax reform. For details regarding this deviation see note (6.6) to the audited consolidated financial statements.
In
2016
, the effective tax rate of
34.2%
deviated from the expected group rate of 32%. For details regarding this deviation see note (6.6) to the audited consolidated financial statements.
Profit or Loss for the Period
Our
profit
for the period in
2017
amounted to €
66.8
million, an improvement of €
22.2
million, reflecting all the factors described above.
Contribution Margin and Contribution Margin per Metric Ton (Non-IFRS Financial Measures)
Contribution Margin decreased by €
4.2
million, or
0.9%
, from €
469.2
million in
2016
to €
465.0
million in
2017
, primarily due to changes in our product mix and negative impacts from feedstock mix. However, Contribution Margin per Metric Ton increased by
2.8
%, from €
416.0
per Metric Ton in
2016
to €
427.6
per Metric Ton in
2017
, reflecting higher proportional Specialty Carbon Black volumes in 2017 compared to 2016.
46
Adjusted EBITDA (Non-IFRS Financial Measure)
Adjusted EBITDA
increased
by €
4.9
million, or
2.2%
, from €
222.8
million in
2016
to €
227.7
million in
2017
.
2016
Compared to
2015
The table below presents our historical results derived from our audited consolidated financial statements for the periods indicated.
|
Income Statement Data
|
Year Ended December 31,
|
|||||
|
2016
|
2015
|
|||||
|
(in € million)
|
||||||
|
Revenue
|
1,030.1
|
1,111.8
|
||||
|
Cost of sales
|
(691.8)
|
(791.5)
|
||||
|
Gross profit
|
338.3
|
320.3
|
||||
|
Selling expenses
|
(114.6)
|
(108.1)
|
||||
|
Research and development costs
|
(14.5)
|
(13.4)
|
||||
|
General and administrative expenses
|
(68.6)
|
(62.1)
|
||||
|
Other operating income
|
5.9
|
7.5
|
||||
|
Other operating expenses
|
(13.8)
|
(21.8)
|
||||
|
Restructuring expenses
|
(27.9
|
)
|
0
|
|
||
|
Operating result (EBIT)
|
104.8
|
122.4
|
||||
|
Finance costs, net
(1)
|
(37.3
|
)
|
(56.2
|
)
|
||
|
Share of profit or loss of joint ventures
|
0.4
|
0.5
|
||||
|
Financial result
|
(36.9)
|
(55.7)
|
||||
|
Profit or (loss) before income taxes
|
67.9
|
|
66.7
|
|
||
|
Income taxes
|
(23.2)
|
(23.8)
|
||||
|
Profit or (loss) for the period
|
44.6
|
42.9
|
||||
(1) Finance costs, net consists of finance income and finance expenses
Revenue
Revenue decreased overall by €81.7 million or 7.4%, from €1,111.8 million (€381.5 million in our Specialty Carbon Black segment and €730.3 million in our Rubber Carbon Black segment) in 2015 to €1,030.1 million (€385.9 million in our Specialty Carbon Black segment and €644.2 million in our Rubber Carbon Black segment) in 2016.
This revenue decrease was primarily due to contractually indexed sales price declines in our Rubber Carbon Black segment resulting from the pass through of lower feedstock costs and, to a much lesser extent, product mix and foreign exchange translation effects. This decrease was offset by positive impacts from increased volumes and additional revenues of €32.7 million contributed by OECQ.
Volume increased by 92.7 kmt, or 9.0%, from 1,035.2 kmt (215.6 kmt in our Specialty Carbon Black segment and 819.6 kmt in our Rubber Carbon Black segment) in 2015 to 1,127.9 kmt (241.8 kmt in our Specialty Carbon Black segment and 886.1 kmt in our Rubber Carbon Black segment) in 2016. This increase is mainly a result of an increase in volumes sold of specialty carbon black products in all regions and an increase in demand for rubber carbon black products in Europe, South America and Korea. OECQ contributed 61.2 kmt (in the two months in 2015 following its acquisition at the end of October 2015. OECQ contributed 11.4 kmt). Demand for rubber carbon black declined in North America and South Africa. The increase in volume contributed an increase of revenue of 5.1%, or €56.5 million (11.0%, or €41.9 million, in our Specialty Carbon Black segment and 2.0%, or €14.6 million, in our Rubber Carbon Black segment) in 2016 compared to 2015. The volume related increase of revenue was offset mainly by negative impacts on revenue in 2016 compared to 2015 resulting from oil price changes of 13.6%, or €151.0 million, and changes in product mix of 1.1%, or €12.0 million. Foreign exchange translation effects had a negative impact of €9.0 million on our revenues due to a stronger U.S. Dollar.
Cost of Sales and Gross Profit
Cost of sales decreased by €99.7 million, or 12.6%, from €791.5 million (€226.9 million in our Specialty Carbon Black segment and €564.6 million in our Rubber Carbon Black segment) in 2015 to €691.8 million (€208.4 million in our Specialty Carbon Black segment and €483.3 million in our Rubber Carbon Black segment) in 2016. The 9.0% increase in volume in 2016 compared to 2015 resulted in an increase of cost of sales of 4.2%, or €28.4 million (10.9%, or €18.5 million, in our Specialty Carbon Black segment and 2.0%, or €9.9 million, in our
47
Rubber Carbon Black segment) in 2016 compared to 2015. This volume-related increase of cost of sales was offset mainly by changes in oil prices of 21.2%, or €142.2 million, reduction in price differentials of 3.2%, or €21.5 million, and a change in product mix of 1.3%, or €8.6 million.
Although revenues of our Specialty Carbon Black segment increased by 1.2%, cost of sales in this segment decreased by (8.1%). This decrease in cost of sales reflects the decline in price differentials incurred in last year and the decline in carbon black oil price and timing impacts associated with lower oil prices. The percentage decrease in cost of sales of our Rubber Carbon Black segment (14.4%) was distinctly higher than the percentage decrease in revenue (11.8%) of that segment. This decrease in cost of sales reflects the effects of the decrease in carbon black oil prices and timing impacts associated with lower oil prices, changes in product mix and foreign currency related decreases on the cost of sales of that segment.
Lower overall revenue as a result of the above mentioned impacts was more than offset by the reduced cost of sales. Gross profit increased by €18.0 million, or 5.6%, from €320.3 million (€154.6 million in our Specialty Carbon Black segment and €165.7 million in our Rubber Carbon Black segment) in 2015 to €338.3 million (€177.4 million in our Specialty Carbon Black segment and €160.9 million in our Rubber Carbon Black segment) in 2016. The 9.0% increase in volume in 2016 compared to 2015 contributed an increase of gross profit of 8.8%, or €28.1 million (15.1%, or €23.4 million, in our Specialty Carbon Black segment and 2.8%, or €4.7 million, in our Rubber Carbon Black segment) in 2016 compared to 2015. The volume related increase of gross profit was accompanied by positive impacts to gross profit mainly resulting from a combination of reduced price differentials and base price improvements.
Selling Expenses
Selling expenses increased by €6.5 million, or 6.0%, from €108.1 million in 2015 to €114.6 million in 2016, mainly due to the increase in volume from 1,035.2 kmt in 2015 to 1,127.9 kmt in 2016.
Research and Development Costs
R&D expenses increased by €1.1 million, from €13.4 million in 2015 to €14.5 million in 2016. This increase is primarily related to the timing of expenditures for individual development of programs.
General Administrative Expenses
General administrative expenses increased by €6.5 million, or 10.4%, from €62.1 million in 2015 to €68.6 million in 2016, due in part to annual salary cost increases and foreign exchange translation effects.
Other Operating Income and Expenses
In 2016, other operating income amounted to €5.9 million and included, among other things, €1.2 million of income from the reversal of provisions. Other operating expenses in 2016 amounted to €13.8 million, comprising primarily €4.1 million of expenses related to the EPA enforcement action (including accrued expenses for penalties and mitigation projects), €2.6 million related to group strategy consulting fees,€1.0 million related to loss on disposal of assets and €0.8 million of currency translation effects.
In 2015, other operating income amounted to €7.5 million and included, among other things, €2.2 million of income from valuation of derivatives. Other operating expenses in 2015 amounted to €21.8 million, comprising primarily €5.0 million of expenses related to the EPA enforcement action (in particular in connection with the evaluation of emission-removal technologies and legal advice), €3.1 million of valuation effects from derivatives, €1.8 million of costs related to implementation of Section 404 compliance, €1.8 million of OECQ related post-acquisition costs, €1.7 million of currency translation effects and €1.5 million related to group strategy consulting fees.
For additional details on other operating income and expenses see notes (6.2) and (6.3) to the audited consolidated financial statements.
Restructuring Expenses
As part of the strategic repositioning of the Rubber business footprint, we concluded consultations with local works council at our Ambès (France) plant to implement a restructuring and down staffing with a cessation of production at the site at the end of 2016. Expenses relating to this restructuring activity totaled €27.9 million comprising cash costs of €15.8 million and non-cash items of €12.1 million (of which €10.3 million relate to impairments of fixed assets).
Operating Result (EBIT)
Operating result decreased by €17.6 million, or 14.4%, from €122.4 million in 2015 to €104.8 million in 2016, mainly driven by our restructuring expenses relating to the strategic repositioning of the Rubber business footprint.
48
Finance Costs, Net
Finance cost, net amounted to €37.3 million in 2016 compared to €56.2 million in 2015. Finance cost, net in 2016 includes, among others, €29.8 million of regular interest expenses, €3.8 million of amortization of capitalized transaction costs associated with the refinancing, interest expenses related to pension obligations of € 1.5 million and a net income of foreign currency exchange rate revaluation effects of €1.8 million. Finance cost, net in 2015 includes, among others, €36.4 million regular interest expenses, €11.7 million net impact of foreign currency exchange rate revaluation effects and €4.8 million of amortization of capitalized transaction costs associated with the refinancing.
Share of Profit of Associates
Share of profit of associates represents the equity income from our German JV, which was comparable in 2016 and 2015.
Financial Result
Financial result comprises finance income, finance expenses and share of profit or loss of associates and improved by €18.8 million, or 33.7%, from €55.7 million finance expenses in 2015 to €36.9 million finance expenses in 2016, mainly as a result of a swing from foreign currency exchange rate revaluation losses in 2015 into foreign currency exchange rate revaluation gains in 2016, reduced interest expenses following our voluntary debt repayments in 2015 and 2016 and the re-pricing of debt as of September 30, 2016.
Profit or Loss for the Period before Income Taxes
Our profit before taxes in 2016 was €67.9 million, reflecting an improvement of €1.2 million from a profit before taxes of €66.7 million in 2015, despite the effects of expenses related to the strategic repositioning of the Rubber business footprint.
Income Taxes
Income taxes amounted to €23.2 million in 2016 compared to €23.8 million in 2015, reflecting the mix of profit or loss of our subsidiaries across multiple jurisdictions in these periods.
In 2016, the effective tax rate of 34.2% deviated from the expected group rate of 32%. For details regarding this deviation see note (6.6) to the audited consolidated financial statements.
In 2015, the effective tax rate of 35.7% deviated from the expected group rate of 32%.
Profit or Loss for the Period
Our profit for the period in 2016 amounted to €44.6 million, an improvement of €1.7 million after a profit of €42.9 million in 2015, reflecting all the factors described above.
Contribution Margin and Contribution Margin per Metric Ton (Non-IFRS Financial Measures)
Contribution Margin increased by €30.5 million, or 6.9%, from €438.7 million in 2015 to €469.2 million in 2016, primarily due to increased volumes, some benefit from sales price changes and the effect of the consolidation of OECQ. As a result, Contribution Margin per Metric Ton slightly decreased by 1.9%, from €423.8 per Metric Ton in 2015 to €416.0 per Metric Ton in 2016.
Adjusted EBITDA (Non-IFRS Financial Measure)
Adjusted EBITDA increased by €14.1 million, or 6.7%, from €208.7 million in 2015 to €222.8 million in 2016.
49
Segment Discussion
Our business operations are divided into two operating segments: the Specialty Carbon Black segment and the Rubber Carbon Black segment. We use segment revenue, segment gross profit, segment volume, Segment Adjusted EBITDA and Segment Adjusted EBITDA Margin as measures of segment performance and profitability.
The table below presents our segment results derived from our audited consolidated financial statements for
2017
,
2016
and
2015
.
|
Year Ended December 31,
|
|||||||||
|
2017
|
2016
|
2015
|
|||||||
|
(in € million, unless otherwise
indicated) |
|||||||||
|
Specialty Carbon Black
|
|||||||||
|
Revenue
|
424.6
|
|
385.9
|
|
381.5
|
|
|||
|
Cost of sales
|
(256.4
|
)
|
(208.4
|
)
|
(226.9
|
)
|
|||
|
Gross profit
|
168.2
|
|
177.4
|
|
154.6
|
|
|||
|
Volume (kmt)
(1)
|
261.4
|
|
241.8
|
|
215.6
|
|
|||
|
Adjusted EBITDA
|
128.9
|
|
136.7
|
|
115.0
|
|
|||
|
Adjusted EBITDA Margin (%)
(2)
|
30.4
|
|
35.4
|
|
30.1
|
|
|||
|
Rubber Carbon Black
|
|||||||||
|
Revenue
|
752.6
|
|
644.2
|
|
730.3
|
|
|||
|
Cost of sales
|
(586.0
|
)
|
(483.3
|
)
|
(564.6
|
)
|
|||
|
Gross profit
|
166.7
|
|
160.9
|
|
165.7
|
|
|||
|
Volume (kmt)
(1)
|
826.0
|
|
886.1
|
|
819.6
|
|
|||
|
Adjusted EBITDA
|
98.8
|
|
86.1
|
|
93.7
|
|
|||
|
Adjusted EBITDA Margin (%)
(2)
|
13.1
|
|
13.4
|
|
12.8
|
|
|||
(1) Unaudited.
(2) Defined as Adjusted EBITDA divided by revenue.
Specialty Carbon Black
2017
Compared to
2016
Revenue of the Specialty Carbon Black segment
increased
by €
38.7
million, or
10.0%
, from €
385.9
million in
2016
to €
424.6
million in
2017
, primarily due to increased volumes, pass through of higher feedstock costs and base price increases, offset by impacts from changes in our product mix.
Volume of the Specialty Carbon Black segment
increased
by
19.5
kmt, or
8.1%
, from
241.8
kmt in
2016
to
261.4
kmt in
2017
, as a result of increased volumes in all regions, in particular from our European and North American facilities.
Gross profit of the Specialty Carbon Black segment
decreased
by €
9.2
million, or
5.2%
, from €
177.4
million in
2016
to €
168.2
million in
2017
, mainly due to a lag in recovering higher feedstock costs and impacts from changes in product mix as well as higher depreciation charges more than offsetting the increase in revenue from increased volumes.
Adjusted EBITDA of the Specialty Carbon Black segment
decreased
by €
7.8
million, or
5.7%
, from €
136.7
million in
2016
to €
128.9
million in
2017
, as a result of decrease in gross profit (excluding the impact of increased depreciation on gross profit).
2016 Compared to 2015
Revenue of the Specialty Carbon Black segment increased by €4.4 million, or 1.2%, from €381.5 million in 2015 to €385.9 million in 2016, primarily due to a increased volumes offset by sales price declines resulting from pass through of lower feedstock costs.
Volume of the Specialty Carbon Black segment increased by 26.2 kmt, or 12.1%, from 215.6 kmt in 2015 to 241.8 kmt in 2016, mainly as a result of increased volumes in all regions, in particular from our North American and the European facilities.
50
Gross profit of the Specialty Carbon Black segment increased by €22.8 million, or 14.8%, from €154.6 million in 2015 to €177.4 million in 2016, mainly due to higher volumes.
Adjusted EBITDA of the Specialty Carbon Black segment increased by €21.7 million, or 18.8%, from €115.0 million in 2015 to €136.7 million in 2016, in line with gross profit development.
Rubber Carbon Black
2017
Compared to
2016
Revenue of the Rubber Carbon Black segment
increased
by €
108.4
million, or
16.8%
, from €
644.2
million in
2016
to €
752.6
million in
2017
, primarily due to an increase in contractually indexed sales prices resulting from the pass through of lower feedstock costs and certain base price increases in the 2017 agreements, offset primarily by impacts associated with decreased volumes.
Volume of the Rubber Carbon Black segment
decreased
by
60.1
kmt, or
6.8%
, from
886.1
kmt in
2016
to
826.0
kmt in
2017
mainly due to weaker demand in in all regions except for South America and China and as a result of the closure of our Rubber standard grade capacity in France and the U.S. and the ongoing conversion of capacity in South Korea.
Gross profit of the Rubber Carbon Black segment
increased
by €
5.8
million, or
3.6%
, from €
160.9
million in
2016
to €
166.7
million in
2017
, with favorable effects resulting from cost reductions mainly related to the closure of our Ambès, France, plant by end of 2016 as well as the impact of base price increases on our revenues.
Adjusted EBITDA of the Rubber Carbon Black segment
increased
by €
12.7
million, or
14.7%
, from €
86.1
million in
2016
to €
98.8
million in
2017
, due to development of gross profit and the impact of cost savings from effects related to our Rubber footprint restructuring efforts initiated in 2016 on sales, marketing and general administrative expenses.
2016 Compared to 2015
Revenue of the Rubber Carbon Black segment decreased by €86.1 million, or 11.8%, from €730.3 million in 2015 to €644.2 million in 2016, primarily due to a decrease in contractually indexed sales prices resulting from the pass through of lower feedstock costs. A change in product mix and negative foreign exchange effects were offset by additional revenue from OECQ and base price increases.
Volume of the Rubber Carbon Black segment increased by 66.5 kmt, or 8.1%, from 819.6 kmt in 2015 to 886.1 kmt in 2016 mainly due to higher demand in Europe, South America and Korea. OECQ contributed an additional 49.8 kmt in China.
Gross profit of the Rubber Carbon Black segment decreased by €4.8 million, or 2.9%, from €165.7 million in 2015 to €160.9 million in 2016, with unfavorable feedstock effects, declines in production efficiency and negative foreign exchange effects offsetting the positive impact of OECQ.
Adjusted EBITDA of the Rubber Carbon Black segment decreased by €7.6 million, or 8.1%, from €93.7 million in 2015 to €86.1 million in 2016, due to development of gross profit and the impact on below gross profit costs associated with OECQ.
51
|
B.
|
Liquidity and Capital Resources
|
Historical Cash Flows
The tables below present our historical cash flows derived from our audited consolidated financial statements for
2017
,
2016
and
2015
.
|
Year Ended December 31,
|
|||||||||
|
2017
|
2016
|
2015
|
|||||||
|
(in € million)
|
|||||||||
|
Cash flows from operating activities
|
151.8
|
|
199.2
|
|
214.4
|
|
|||
|
Cash flows from (used in) investing activities
|
(80.7
|
)
|
(62.2
|
)
|
(74.8
|
)
|
|||
|
Cash flows used in financing activities
|
(84.0
|
)
|
(130.4
|
)
|
(143.5
|
)
|
|||
|
Cash and cash equivalents at the end of the period
|
60.3
|
|
73.9
|
|
65.3
|
|
|||
2017
Cash inflows from operating activities in
2017
amounted to €
151.8
million and consisted of a consolidated profit for the period of €
66.8 million
, adjustments primarily for depreciation of €
85.9 million
and income taxes of €
20.7 million
, cash outflows from Net Working Capital of €
22.5
million, cash outflows from decreases in provision of €
14.2
million, cash taxes paid of €
34.0 million
and the exclusion of net financing costs of €
36.7
million.
Cash outflows from investing activities in
2017
amounted to €
80.7
million for capital expenditure projects mainly related to preservation and overhaul projects as well as expenditures associated with our efforts to consolidate our to productions plants in South Korea.
Cash outflows from financing activities in
2017
amounted to €
84.0
million. €
26.6 million
were used for repayments of borrowing, of which €20.0 million were paid as voluntary redemption of our Term Loan. €27.5 million, net, were used for regular interest payments and other financing activities such as settlements of hedging transactions. In addition €
40.0 million
were used for dividend payments. Cash inflow of €
10.0
million are related to a local bank loan facility.
2016
Cash inflows from operating activities in 2016 amounted to €199.2 million and consisted of a consolidated profit for the period of €44.6 million, adjustments primarily for depreciation of €88.7 million and income taxes of €23.2 million, cash inflows from Net Working Capital of €7.6 million and the exclusion of net financing costs of €37.3 million.
Cash outflows from investing activities in 2016 amounted to €62.2 million, comprising €64.3 million for capital expenditure projects mainly related to preservation and overhaul projects offset by the receipt of cash indemnifications of €2.1 million in connection with the acquisition of OECQ (cash outflows related to OECQ in 2015 were €27.9 million of cash paid less acquired cash of €4.7 million).
Cash outflows from financing activities in 2016 amounted to €130.4 million. €47.4 million were used for repayments of borrowing, of which €40.1 million were paid as voluntary redemption of our Term Loan. €42.6 million were used for regular interest payments and other finance costs and €40.0 million for dividend payments.
2015
Cash inflows from operating activities in 2015 amounted to €214.4 million and consisted of a consolidated profit for the period of €42.9 million, adjustments primarily for depreciation of €72.8 million and income taxes of €23.8 million, cash inflows from Net Working Capital of €44.2 million and the exclusion of net financing costs of €56.2 million.
Cash outflows from investing activities in 2015 amounted to €74.8 million, of which €23.2 million were used for the acquisition of OECQ (cash paid €27.9 million less acquired cash of €4.7 million) and €51.5 million were capital expenditure projects mainly related to preservation and overhaul projects.
Cash outflows from financing activities in 2015 amounted to €143.5 million. €56.8 million were used for repayments of borrowing, of which €50.0 million were paid as voluntary redemption of our Term Loan. €41.9 million were used for regular interest payments and other finance costs and €40.0 million for dividend payments.
52
Sources of Liquidity
Our principal sources of liquidity are the net cash generated from our operating activities, as well as available cash balances, amounts available under our multicurrency, senior secured Revolving Credit Facility providing a line of credit of up to €115 million and to a certain extent our subsidiaries facilities with local financial institutions. We cannot guarantee that our cash position and cash generated from operations will be adequate to support the further growth of our business. Our ability to generate cash from operations depends on our future operating performance, which in turn is dependent on general economic, financial, competitive, market, regulatory and other conditions and factors, many of which are beyond our control. See “
Item 3. Key Information
–D. Risk Factors.
”
In addition, there are some statutory restrictions on the ability of our subsidiaries to transfer funds to us (e.g., legislation on permitted dividend payments or currency transfers), although we believe that we have structured our treasury operations to minimize the impact of such statutory restrictions on our operations. We intend to use cash from operating activities, as well as cash balances, to finance our capital needs. Based on our current operating performance and liquidity, we believe that cash provided by our operating activities and available cash balances will be sufficient to cover our Net Working Capital requirements, Capital Expenditures, interest payments and scheduled debt repayments in the next year.
Net Working Capital (Non-IFRS Financial Measure)
We define Net Working Capital as the total of inventories and current trade receivables, less trade payables. Net Working Capital is a non-IFRS financial measure, and other companies may use a similarly titled financial measure that is calculated differently from the way we calculate Net Working Capital. The following tables set forth the principal components of our Net Working Capital as of the dates indicated.
|
As of December 31,
|
|||||||||
|
2017
|
2016
|
2015
|
|||||||
|
Inventories
|
132.9
|
|
114.4
|
|
105.1
|
|
|||
|
Trade receivables
|
195.3
|
|
190.5
|
|
172.1
|
|
|||
|
Trade payables
|
(141.4
|
)
|
(122.9
|
)
|
(94.2
|
)
|
|||
|
Net Working Capital
|
186.8
|
181.9
|
183.0
|
||||||
Our Net Working Capital position can vary significantly from month to month, mainly due to fluctuations in oil prices and receipts of carbon black oil shipments. In general, increases in the cost of raw materials lead to an increase in our Net Working Capital requirements, as our inventories and trade receivables increase as a result of higher carbon black oil prices and related sales levels. These increases are partially offset by related increases in trade payables. Due to the quantity of carbon black oil that we typically keep in stock, such increases in Net Working Capital occur gradually over a period of two to three months. Conversely, decreases in the cost of raw materials lead to a decrease in our Net Working Capital requirements over the same period of time. Based on 2017 Net Working Capital requirements, we estimate that a $10 per barrel movement in the Brent crude oil price correlates to a movement in our Net Working Capital of approximately €19 to €21 million within about a two to three month period. In times of relatively stable oil prices, the effects on our Net Working Capital levels are less significant and Net Working Capital swings increase in an environment of high price volatility.
Our Net Working Capital gradually increased from €
181.9 million
as of
December 31, 2016
to €
186.8 million
as of
December 31, 2017
primarily due to the impact from higher feedstock cost. If oil-prices recover to 2014 levels we may need considerable amounts to serve our Net Working Capital requirements.
Capital Expenditures (Non-IFRS Financial Measure)
We define Capital Expenditures as cash paid for the acquisition of intangible assets and property, plant and equipment as shown in the consolidated financial statements.
Our Capital Expenditures amounted to €
51.5 million
in
2015
, €
64.3 million
in
2016
and €
80.7 million
in
2017
. We plan to finance our Capital Expenditures with cash generated by our operating activities.
While, prior to the Acquisition, Capital Expenditures mainly consisted of expenditures incurred in connection with the maintenance of our assets, we have increased our investment in expansion and rationalization projects to increase the efficiency of our production facilities for both the Specialty Carbon Black and Rubber Carbon Black segments. The main capital expansion project initiated following the Acquisition was the addition of a new rubber carbon black production line in South Korea driven by growing customer demand. This production line commenced operations in the summer of 2013. We also completed a number of debottlenecking and production expansion projects globally, in both the Specialty and Rubber segments. We estimate that our maintenance Capital Expenditure requirements will be approximately €20 million to €25 million per year. With the exception of required expenditures in association with our recent settlement with the EPA we currently do not have any material commitments to make Capital Expenditures, and do not plan to make Capital Expenditures, outside the ordinary course of our business. See note
(9.5)
Contingent liabilities and other financial obligations
for further details regarding the EPA settlement.
Capital Expenditures in
2017
amounted to €
80.7 million
and were mainly composed of preservation and overhaul projects as well as expenditures associated with our efforts to consolidate our to productions plants in South Korea.
53
Capital Expenditures in 2016 amounted to €64.3 million and were mainly composed of mainly of preservation and overhaul projects.
Capital Expenditures in 2015 amounted to €51.5 million and were mainly composed of mainly of preservation and overhaul projects.
|
C.
|
Research and Development, Patents and Licenses, Etc.
|
See “
Item 4. Information on the Company—B. Business Overview—Innovation
.”
|
D.
|
Trend Information
|
See “
Item 4. Information on the Company
—B. Business Overview
.”
|
E.
|
Off-Balance Sheet Arrangements
|
As of
December 31, 2017
, we did not have any off-balance sheet arrangements.
|
F.
|
Contractual Obligations
|
The following table sets forth our contractual obligations as of
December 31, 2017
.
|
|
less than 1 year
|
1-3 years
|
4-5 years
|
more than 5 years
|
total
|
|||||
|
Long-term debt obligations
(1)
|
26.0
|
|
53.9
|
|
56.6
|
|
570.5
|
|
707.0
|
|
|
Revolving Credit Facility
(2)
|
—
|
|
—
|
|
—
|
|
—
|
|
—
|
|
|
Term Loan
(3)
|
7.0
|
|
14.0
|
|
14.0
|
|
535.6
|
|
570.5
|
|
|
Interest expense on long-term debt
(4)
|
19.0
|
|
39.9
|
|
42.7
|
|
34.8
|
|
136.4
|
|
|
Purchase commitments
(5)
|
91.1
|
|
117.2
|
|
80.1
|
|
—
|
|
288.4
|
|
|
Operating leases
|
4.4
|
|
11.4
|
|
2.3
|
|
9.6
|
|
27.8
|
|
|
Total contractual obligations
(6)
|
121.5
|
|
182.5
|
|
139.0
|
|
580.1
|
|
1,023.1
|
|
|
(1)
|
Sets forth obligations to repay principal and interest under our long-term debt obligations.
|
|
(2)
|
Represents the obligation under the Revolving Credit Facility. As of December 31, 2017, there were no cash amounts drawn under our Revolving Credit Facility of €175.0 million.
|
|
(3)
|
Represents the Term Loans and includes the outstanding principal amount of $288.4 million which has been translated at an assumed exchange rate at the maturity date of $
1.1993
per €1.00. The borrowing costs on the principal of the U.S. Dollar-denominated Term Loan have been translated applying the same exchange rate. The amounts presented include a voluntary repayment of €20.0 million made in January 2017.
|
|
(4)
|
Represents interest expenses related to indebtedness from our Term Loans, assuming future interest based on a forward rate assumption.
|
|
(5)
|
Represents purchase commitments under long-term supply agreements for the supply of raw materials, mainly oil and gas.
|
|
(6)
|
This amount does not reflect the Company’s obligations under its existing pension arrangements, which as of
December 31, 2017
amounted to €
54.5 million
. See note 7.8 Pension provisions and post-retirement benefits to the audited financial statements included elsewhere herein.
|
The level of performance bonds, guarantees and letters of credit required for carbon black oil purchasing could increase as a result of increasing oil prices or other factors (such as our ownership structure). As at December 31, 2017 Orion Engineered Carbons GmbH has four guarantees issued by Euler Hermes S.A. with a total volume of €17,588k (in prior year three guarantees by Euler Hermes S.A. of €14,598k); one guarantee insurance issued by Deutsche Bank AG with a volume of EUR 2,000k (in prior year one guarantee issued by HSBC AG with a volume of €2,000k). In addition there is cash collateral provided by Norcarb Engineered Carbons AB of €30k. None of these guarantees reduce the possible utilization limit of the current RCF.
Item 6. Directors, Senior Management and Employees
|
A.
|
Directors and Senior Management
|
Board of Directors
The Company is managed by a board of directors (
conseil d’administration
) (the “Board of Directors”), composed of six members appointed for terms of up to six years in accordance with Luxembourg Company Law. The general meeting of shareholders may, without prior
54
notice (
ad nutum
) remove a director with or without cause by a simple majority of the votes validly cast. A vacancy in the office of a director because of death, legal incapacity, bankruptcy, resignation or otherwise may be filled on a temporary basis by the remaining directors until the next general meeting of shareholders.
The Board of Directors is vested with the broadest powers to take any actions necessary or useful to fulfill the Company’s corporate purpose, with the exception of actions reserved by law or by the Articles of Association (
statuts
) to the general meeting of shareholders. Reserved matter include, in particular, all decisions affecting the Articles of Association, such as capital increases, capital reductions, mergers and a change of the legal form of the Company. At least half of the directors are required to be present or represented at a meeting for the Board of Directors to validly act and deliberate. Resolutions or the Board of Directors are adopted with the approval of a majority of the directors present or represented at a meeting of the Board of Directors. Meetings of the Board of Directors are convened and held in accordance with the rules of procedure of the Board of Directors and the Articles of Association.
In accordance with article 60 of the Luxembourg Company Law, the Company’s daily management and representation in connection with such daily management may be delegated to two or several members of the Board of Directors or to any other person (whether or not a shareholder), acting alone or jointly with others. The appointment, revocation and powers of such persons shall be determined by a resolution of the Board of Directors. The Company may also grant special powers by notarized proxy or private instrument. According to the Articles of Association, the Company will be bound to third parties in all circumstances by (i) the joint signature of any two directors or (ii) the sole signature of any person to whom such signatory power has been granted by the Board of Directors. With respect to matters that constitute daily management of the Company, the Company will be bound to third parties by the joint signatures of (i) two class A daily managers, (ii) one class A daily manager and one class B daily manager or (iii) any other person(s) to whom such power in relation to the daily management of the Company has been delegated in accordance with the Articles of Association.
Directors
Our Board of Directors consists of the following six members.
|
Name
|
Age
|
Years in Office
|
Title
|
|||
|
Dan F. Smith
|
71
|
3
|
Chairman of the Board
|
|||
|
Marc Jean Pierre Faber
|
59
|
since June 29, 2017
|
Director
|
|||
|
Paul Huck
|
68
|
3
|
Director
|
|||
|
Romeo Kreinberg
|
67
|
3
|
Director
|
|||
|
Didier Miraton
|
59
|
3
|
Director
|
|||
|
Hans-Dietrich Winkhaus
|
80
|
3
|
Director
|
|||
The current term for all of our directors expires on July 28, 2020, except for Mr. Marc Jean Pierre Faber, who was appointed on a temporary basis in accordance with Section 17.5 of the Articles of Association.
The following is a brief summary of the business experience of the directors.
Dan F. Smith
. Mr. Smith serves as chairman of the board of Kraton Corp., He is also a director of Nexeo Solutions, Inc. and, since May 2017, TPG Pace Energy Holdings Corp. During the past five years, Mr. Smith served on the board of directors of Cooper Industries plc. He began his career with ARCO (Atlantic Richfield Company) in 1968 as an engineer. He was elected president of Lyondell Chemical Company in August 1994, chief executive officer in December 1996 and chairman of the board of directors in May 2007. Mr. Smith retired in December 2007 as chairman, president and chief executive officer of Lyondell Chemical Company following the acquisition of Lyondell by Basell. Mr. Smith also serves as a member of the College of Engineering Advisory Council at Lamar University. Mr. Smith is a graduate of Lamar University with a B.S. degree in chemical engineering.
Marc Jean Pierre Faber
. Mr. Faber has been a daily manager of the Company since 2014. Mr. Faber holds various directorship positions, amongst others at AXA Real Estate Investments Corporation. Between 2003 and 2010, Mr. Faber served as chief executive officer of BIP Investment Partners S.A. Previously, he was the Chief Financial Officer of Cerametal Sarl, Luxembourg between 2001 and 2002, after various other functions within that company since 1991. Mr. Faber holds an MBA from INSEAD (Fontainbleau, France) and a civil engineer degree from the University of Liege, Belgium.
Paul Huck
. Mr. Huck previously served for nine years as the chief financial officer and senior vice president of Air Products and Chemicals, Inc., a global $10 billion industrial gas and chemical company. Prior to this he served for ten years at Air Products and Chemicals as a vice president and corporate controller. He served as a director of NewPage Corporation and as a member of NewPage’s audit committee from 2012 until its sale in 2015. He also is a director of AdvanSix Inc. since 2016. In addition, he serves on the boards of numerous charities.
55
Mr. Huck holds a B.S. in mathematics from the United States Naval Academy and an MBA from the Johnson Graduate School of Management at Cornell University.
Romeo Kreinberg
. Mr. Kreinberg has over thirty-five years of experience in executive management of public and private companies in the chemical industry. In addition, he currently serves as chairman of the board of directors of Rain Carbon Inc. and Befesa SRL. Throughout the course of his career, Mr. Kreinberg has served as a director of companies in the United States, Europe, Latin America, and Asia and is fluent in six languages. Mr. Kreinberg holds a degree from The National University of Architecture and City Planning in Buenos Aires.
Didier Miraton
. Mr. Miraton is currently an adviser to several senior executives and a professor in the MBA program at the
Collège des Ingénieurs
(CDI) in Paris. He was the chief executive officer of Almérys SAS, a French information technology company operating in the health insurance data sphere, until late 2015. He is the former chief executive officer of the
Laboratoires Pierre Fabre
, a leading French pharmaceutical company. He also served as a managing partner of the
Compagnie Generale des Etablissements Michelin SCA
from May 11, 2007 to June 30, 2011. During his time at Michelin, Mr. Miraton also acted as president of Michelin’s worldwide Research & Technology group and was a member of the Michelin Group Executive Council. Mr. Miraton has been an independent director of
Vilmorin Clause & Cie SA
since November 2007. He holds a civil engineering degree from the
École Nationale des Ponts-et-Chaussées
.
Hans-Dietrich Winkhaus
. Mr.Winkhaus previously served as chief executive officer of Henkel KGaA. He served also as Chairman of the Board of Deutsche Telekom AG and Schwarz Pharma AG. He was a board member at Lufthansa AG, ERGO AG and Degussa AG. Mr. Winkhaus studied Business Administration at and received a Ph.D. from Ludwig Maximilian University, Munich.
Senior Management
The following table sets forth certain information concerning our senior management:
|
Name
|
Age
|
Title
|
||
|
Jack Clem
|
64
|
Chief Executive Officer
|
||
|
Charles Herlinger
|
62
|
Chief Financial Officer
|
||
|
Erik Thiry
|
47
|
Senior Vice President–Business Line Rubber Carbon Black and Business Development
|
||
|
Claudine Mollenkopf
|
50
|
Senior Vice President–Business Line Specialty Carbon Black
|
||
|
Lixing Min
|
57
|
Senior Vice President and General Manager–Asia Pacific Region
|
||
|
David Deters
|
52
|
Senior Vice President–Innovation
|
||
|
Mark Peters
|
59
|
Senior Vice President and General Manager–Americas
|
||
|
Christian Eggert
|
44
|
General Counsel Global and Head of Group Legal
|
||
|
Jeffrey Malenky
|
62
|
Senior Vice President–Global Human Resources
|
||
|
Michael Reers
|
49
|
Vice President and Group Controller
|
||
|
André Schulze Isfort
|
43
|
Chief Accounting Officer, Head of Consolidation & Reporting
|
||
Jack Clem.
Mr. Clem has been the Chief Executive Officer of Orion since July 2011, and had been the head of Evonik Degussa GmbH’s global carbon black business since August 2009. He joined Degussa in 2001 and shortly after was named CEO of their joint venture in carbon black with a U.S.-based private equity firm. He has over 35 years of experience in the performance and specialty minerals and chemicals industry. Prior to joining Degussa, he held various senior management positions in North America and Europe at J.M. Huber Corporation and started his career in engineering and plant management at Occidental Chemical Corporation. Mr. Clem holds a master’s degree in business administration from West Texas A&M University and a bachelor’s degree in mechanical engineering from Texas Tech University.
Charles Herlinger.
Mr. Herlinger has been the Chief Financial Officer of Orion since July 2011. He has considerable experience from previous public and private chief financial officer positions. Most recently, he was chief financial officer of the Almatis Group, a leading worldwide manufacturer of specialty alumina-based chemical products. Prior to that, he served as chief financial officer of Cable & Wireless plc., a London Stock Exchange listed public company. Mr. Herlinger started his career as audit manager with KPMG and spent over 15 years with Siemens in Germany and North America, where he progressed to chief financial officer of Siemens Corporation in North America. Mr. Herlinger holds a bachelor’s degree in business administration and qualified both as a certified public accountant in the United States and a chartered accountant in the United Kingdom.
Erik Thiry.
Mr. Thiry has been the Senior Vice President–Business Line Rubber Carbon Black since September 2015 and prior to that served as Senior Vice President–Business Development. He has been a member of the executive management team since May 2012. He
56
has over 15 years of experience in management consulting, including the chemical industry, at a global consulting firm. Mr. Thiry holds a master’s degree in business management and mechanical engineering from the University of Kaiserslautern, Germany.
Claudine Mollenkopf.
Dr. Mollenkopf has been our Senior Vice President–Business Line Specialty Carbon Black since August 2011 and prior to that served the business as vice president of mechanical rubber goods. Dr. Mollenkopf joined Evonik in 1996. She has over 20 years of experience in the chemicals industry, including various positions at Evonik, such as head of aerosil and silanes sales Europe. Ms. Mollenkopf holds a doctorate and engineering degree (EHICS) in chemistry from the University Louis Pasteur, France.
Lixing Min.
Dr. Min has been our Senior Vice President and General Manager–Asia-Pacific Region since April 1, 2013. He has over 23 years of experience in the chemical industry, including positions of general management of the Asia-Pacific region for both American- and German-based chemical companies. Dr. Min holds a bachelor’s degree in chemistry from Fudan University in China and master’s and doctoral degrees in chemistry from the University of Rochester.
David Deters.
David Deters has been the Senior Vice President–Innovation and a member of the executive management team since August 2015. He has over 30 years of global experience within coatings, printing inks and specialty chemical sectors. Prior to joining Orion, he held executive management positions at Hempel as GVP R&D and Marine Marketing and King Industries as VPGM Specialty Chemicals. He worked for 20 years at DuPont holding various Technical Director and Global Product Management positions throughout the world. Mr. Deters holds a Bachelor of Science Degree in Engineering from Michigan State University.
Mark Peters.
Mark Peters has been Senior Vice President and General Manager–Americas since July 2015. He has over 29 years of experience in the chemical industry, including roles in manufacturing and business development. Mr. Peters holds a Bachelor of Science Degree in Chemical Engineering from Mississippi State University.
Christian Eggert.
Dr. Eggert has been the General Counsel and Head of Group Legal since August 2012, also serving as the Chief Compliance Officer. Prior to Orion, he worked as a lawyer in private practice for more than nine years, and with two major international law firms (one as a partner) while specializing in mergers & acquisitions, restructurings and corporate law. Dr. Eggert holds a law degree from the University of Münster, a doctorate degree from the University of Jena and a master’s degree (LL.M) in comparative law from the University of Miami School of Law. He is admitted to practice law in Germany, is a member of the American Bar Association and an elected fellow of the American Bar Foundation.
Jeffrey Malenky.
Mr. Malenky has been Senior Vice President–Global Human Resources since July 29, 2011. Mr. Malenky joined Evonik in 1996 and has over 30 years of experience in human resources, including a position of vice president human resources at Evonik in the United States. Mr. Malenky holds a bachelor’s degree in liberal arts from St. Vincent College,
juris doctor
and master’s degrees in business administration from the University of Pittsburgh. Mr. Malenky is admitted to the practice of law in the Commonwealth of Pennsylvania.
Michael Reers.
Mr. Reers has been Vice President and Group Controller since September 1, 2012. He has over 19 years of broad experience in different industries and served in several financial positions such as chief financial officer, controller or head of corporate accounting/controlling. Before joining Orion, he was responsible for all finance aspects in Europe and Asia at BELFOR in Duisburg/Germany and prior to that served in different financial positions at Danaher Corporation, a U.S. public listed company. Mr. Reers holds a master’s degree in business administration from the University of Münster.
André Schulze Isfort.
André Schulze Isfort has been Head of Consolidation & Reporting since August 15, 2011, also serving as Chief Accounting Officer. He has almost 10 years of experience in the chemical industry including as head of a restructuring project and as head of internal audit. Prior to joining the industry he worked for 5 years at Deloitte. Mr. Schulze Isfort holds a master’s degree in business administration from the University of Applied Science of Münster.
|
B.
|
Compensation
|
Executive Compensation
For
2017
, our current executive officers named in the table above under “
Senior Management
,” received total aggregate compensation of €6.8 million, which included base salary, annual cash bonus, other benefits, and amounts set aside or accrued to provide pension, retirement or similar benefits of €0.5 million, and €6.2 million accrued expenses related to the share-based payment program. In determining the foregoing aggregate amounts, compensation paid to certain of our executive officers in currencies other than the Euro were converted using the average conversion rate over
2017
from the applicable currency to the Euro.
For additional information regarding compensation, including social security costs, pension expenses and other personnel see note
(9.4)
Related parties
to the consolidated financial statements.
|
C.
|
Board Practices
|
See “
—A. Directors and Senior Management
.”
57
Audit Committee
Messrs. Huck, Kreinberg and Winkhaus serve on our Audit Committee, chaired by Mr. Huck. All members of our Audit Committee qualify as independent under the listing rules of the NYSE and SEC Rule 10A-3 under the Exchange Act. Each independent member of our Audit Committee is financially literate, and Mr. Huck is an “audit committee financial expert” as defined in Item 407 of SEC Regulation S‑K. Our Audit Committee’s responsibilities include:
|
•
|
reviewing and making recommendations to the Board of Directors with regard to the appointment and approval of the compensation of our independent auditors;
|
|
•
|
overseeing the work of our independent auditors and resolving any disagreements between management and our independent auditors regarding financial reporting;
|
|
•
|
pre-approving audit and permissible non-audit services to be provided by our independent auditors;
|
|
•
|
reviewing and approving the annual audit plan;
|
|
•
|
reviewing and discussing our annual and quarterly financial statements and related disclosures with management and our independent auditors, as well as accounting policies and practices used by us;
|
|
•
|
coordinating the oversight and reviewing the adequacy of our internal control over financial reporting;
|
|
•
|
establishing policies and procedures for the receipt and retention of accounting-related complaints and concerns;
|
|
•
|
reviewing guidelines and policies regarding the Company’s exposure to risk; and
|
|
•
|
reviewing quarterly earnings releases.
|
Compensation Committee
Messrs. Smith, Huck and Miraton serve on our Compensation Committee, chaired by Mr. Smith. All members of our Compensation Committee qualify as independent under the listing rules of the NYSE. Our Compensation Committee’s responsibilities include:
|
•
|
annually reviewing and approving corporate goals and objectives relevant to the compensation of our chief executive officer;
|
|
•
|
evaluating the performance of our chief executive officer in light of such corporate goals and objectives and determining the compensation of our chief executive officer;
|
|
•
|
reviewing the performance and approving the compensation of our other executive officers;
|
|
•
|
making recommendations to the Board of Directors with respect to incentive-compensation plans and equity-based plans that are subject to approval by the Board of Directors and overseeing the activities of the individuals and committees responsible for administering these plans; and
|
|
•
|
reviewing and approving any new equity compensation plan or any material change to an existing plan where shareholder approval has not been obtained.
|
Nominating and Governance Committee
Messrs. Smith and Huck serve on our Nominating and Governance Committee, chaired by Mr. Smith. All members of our Nominating and Governance Committee qualify as independent under the listing rules of the NYSE. Our Nominating and Governance Committee’s responsibilities include:
|
•
|
identifying individuals qualified to become members of our Board of Directors and its committees;
|
|
•
|
recommending potential nominees for election to the Board of Directors;
|
|
•
|
identifying directors qualified to fill vacancies on any committee of the Board of Directors;
|
|
•
|
developing, recommending and reviewing our corporate governance guidelines and other policies;
|
|
•
|
reviewing proposed waivers and amendments of the code of conduct;
|
|
•
|
overseeing the process of evaluating the performance of our Board of Directors; and
|
58
|
•
|
advising our Board of Directors on corporate governance matters.
|
None of our directors is party to service contracts with the Company or any of its subsidiaries that would provide for benefits upon termination of employment.
|
D.
|
Employees
|
As of
December 31, 2017
, we had 1,441 employees and approximately 333 contractors in our wholly-owned entities.
The table below shows our number of employees and contractors by activity as well as per country as of the end of the periods indicated. This data does not include employees and contractors employed by, or performing services for, joint ventures.
|
As of December 31,
|
||||||
|
2017
|
2016
|
2015
|
||||
|
By Activity
|
||||||
|
Production
|
1,191
|
1,198
|
1,176
|
|||
|
Sales and marketing
|
268
|
279
|
291
|
|||
|
General and administration
|
218
|
228
|
228
|
|||
|
Research and development
|
97
|
91
|
86
|
|||
|
Total
|
1,774
|
1,796
|
1,781
|
|||
|
Contractors
|
333
|
336
|
254
|
|||
|
Internal Employees
|
1,441
|
1,460
|
1,527
|
|||
|
By Country
|
||||||
|
Germany
|
541
|
514
|
522
|
|||
|
The rest of Europe/Middle East
|
202
|
206
|
249
|
|||
|
North America
|
297
|
319
|
320
|
|||
|
South Korea
|
305
|
309
|
276
|
|||
|
China
|
223
|
260
|
275
|
|||
|
South Africa
|
127
|
110
|
59
|
|||
|
Brazil
|
65
|
63
|
64
|
|||
|
The rest of Asia-Pacific
|
7
|
7
|
5
|
|||
|
Japan
|
7
|
8
|
11
|
|||
|
Total
|
1,774
|
1,796
|
1,781
|
|||
|
Contractors
|
333
|
336
|
254
|
|||
|
Internal Employees
|
1,441
|
1,460
|
1,527
|
|||
Labor Relations
We actively manage our labor relations and place high importance on transparent dialogue, which we believe has resulted in constructive union relations. There have been no significant strikes or labor disruptions at any site since 2004.
In 2017, 35 of the former employees in our closed facility in Ambès, France filed claims with the labor court of Bordeaux contesting the termination of their employment and seeking damages. The court has scheduled several hearings on the claims in 2018. We intend to contest these claims and do not believe that their ultimate resolution will have a material adverse effect on our results of operations or financial condition.
59
Our employees in Germany and certain other countries are represented by workers’ councils in accordance with local law and practices, which provide workers’ councils with participation and information rights. Certain of our employees are organized in trade unions. Membership of trade unions varies in accordance with the business area, local practice and country in which we operate. We have entered into collective bargaining agreements with trade unions either directly or as members of employer organizations. These agreements typically govern, among other things, terms and conditions of employment and reflect the prevailing practices in each country. We believe we have stable relations with our employees and voluntary turnover has been low in recent years.
|
E.
|
Share Ownership
|
To our knowledge, the total number of common shares of the Company owned by our directors and executive officers as of February 22, 2018 was 136,200, which represents less than 1% of our issued and outstanding shares. Our directors, collectively (6 persons) beneficially owned 14,000 shares and our executive officers, collectively (9 persons) beneficially owned 122,200 shares.
Equity Plans
2014 Omnibus Incentive Compensation Plan
Types of Awards
.
The 2014 Plan provides for the grant of stock options (both stock options intended to be incentive stock options under Sections 421 or 422 of the Internal Revenue Code of 1986, as amended and non-qualified stock options), stock appreciation rights, restricted stock awards, restricted stock units, dividend equivalent rights, performance-based stock awards and other stock-based awards (collectively, “stock awards”) based on our common shares, as well as the grant of cash awards.
Eligibility and Administration
. Current employees or consultants
of Orion or, solely with respect to their final year of service, former employees, will be eligible for awards under the 2014 Plan. The 2014 Plan generally is administered by our Compensation Committee (or its delegates). The Compensation Committee (or its delegates) determines the persons who will receive awards under the 2014 Plan, the time when awards will be granted, the terms of such awards and the number of common shares, if any, which will be subject to the awards. The Board of Directors, in its sole discretion, also may grant awards or administer the 2014 Plan.
Authorized Shares
.
If any award that is granted under the 2014 Plan is forfeited, expires or is settled for cash, then the shares covered by such forfeited, expired or settled award will again become available to be delivered pursuant to awards granted under the 2014 Plan. In the event that tax withholding obligations from an award granted under the 2014 Plan (other than a stock option or stock appreciation right) are satisfied by the withholding or tendering of common shares, the shares so withheld or tendered will be added back to the shares available for issuance under the 2014 Plan. In the case of an acquisition, any common shares issued in connection with awards that are assumed, converted or substituted as a result of our acquisition of another company will not count against the number of shares that may be issued under the 2014 Plan.
Adjustments
. In connection with stock splits, extraordinary dividends, stock dividends, recapitalizations and certain other events affecting our common shares, the Compensation Committee (or its delegates) will make adjustments as it deems appropriate in the number of shares available for issuance under the 2014 Plan, the number and kind of shares covered by outstanding grants, the kind of shares that may be issued under the 2014 Plan and the exercise price of all outstanding stock awards, if applicable.
Amendment and Termination
. The 2014 Plan has a term of ten years. The Board of Directors may from time to time suspend, discontinue, revise or amend the 2014 Plan. Unless otherwise determined by the Board, shareholder approval of any suspension, discontinuance, revision or amendment will be obtained only to the extent necessary to comply with any applicable laws, regulations or rules of a securities exchange or self-regulatory agency.
In 2015, the company established a Long Term Incentive Plan (“LTIP”) under the 2014 Plan, which is an equity settled share-based payment in the form of performance share units (“PSU”) for a defined group of executive managers. See note
(6.8)
Share-based payments
to to the consolidated financial statements.
2014 Non-Employee Director Compensation Plan
The terms of the 2014 Director Plan are substantially similar to those of the 2014 Plan, except for the following key differences: (1) only non-employee directors are permitted to participate in the 2014 Director Plan; (2) incentive stock options may not be granted to non-employee directors; (3) cash-based awards may include retainers or meeting-based fees; and (4) award grants will be limited by the aggregate amount of non-employee director compensation approved by the general meeting of the shareholders on an annual basis in accordance with Luxembourg law.
Co-Investment Program
In January 2012, we adopted a management co-investment program for certain of our senior personnel, including our executive officers and directors, to enable them to acquire an indirect ownership interest in the Company. Co-investors held interests in Luxco Coinvest, a shareholder of the Company. The co-investment program qualified as an equity settled share-based payment plan because the terms and conditions under which the participating managers acquired the shares include defined lock-up periods and neither the Company nor any other
60
Group entity had an obligation to settle the share-based payment. No expenses were recognized in profit or loss as consideration for the services received by the co-invested managers.
On March 23, 2017, an extraordinary general meeting of shareholders of Luxco Coinvest resolved to dissolve Luxco Coinvest and put it into liquidation. The liquidation is currently in process. During 2017, the liquidator of Luxco Co-Invest paid in-kind advances on the liquidation proceeds to the co-investors by transferring to them our common shares, which were then sold by the co-investors in four registered public offerings. After payment of the Liabilities of Luxco Coinvest and setting aside the necessary funds for the payment of liabilities of Luxco Coinvest, the liquidator will proceed with the closing of the liquidation.
|
A.
|
Major Shareholders
|
As of February 22, 2018, we had 59,320,214 common shares outstanding and 314,912 common shares that have been repurchased by us pursuant to a share repurchase plan in 2016. The following table sets forth information relating to the ownership of our common shares by shareholders known to us to beneficially own more than 5% of our common shares outstanding:
|
Shareholder
|
Number of Common Shares Beneficially owned
|
Percentage of Outstanding Common Shares
|
||
|
Wellington Management Group LLP
(1)
|
7,112,786
|
11.99%
|
||
|
T. Rowe Price Associates, Inc.
(2)
|
3,732,985
|
6.29%
|
||
|
Rovida Advisors Inc.
(3)
|
3,515,059
|
5.92%
|
||
|
Victory Capital Management Inc.
(4)
|
3,091,701
|
5.21%
|
||
|
(1)
|
As reported in a Schedule 13G/A filed on February 8, 2018 by (i) Wellington Management Group LLP, organized in Massachusetts (“WMG”), (ii) Wellington Group Holdings LLP, a holding company organized in Delaware (“WGH”), (iii) Wellington Investment Advisors Holdings LLP, a holding company organized in Delaware (“WIAH”), and (iv) Wellington Management Company LLP, an investment adviser organized in Delaware (“WMC”). Pursuant to the Schedule 13G/A, the common shares are owned of record by clients of one more investment advisers controlled directly or indirectly by WIAH and those clients have the right to receive, or the power to direct the receipt of, dividends from, or the proceeds from the sale of, the common shares. According to the Schedule 13G/A, no such client is known to have such right or power with respect to more than 5% of the common shares. According to the Schedule 13G/A, WIAH is owned by WGH and WGH is owned by WMG, and the address of the principal office of each such entity is c/o Wellington Management Group Company LLP, 280 Congress Street, Boston MA 02210.
|
|
(2)
|
As reported in a Schedule 13G filed by T. Rowe Price Associates Inc. (“Price Associates”) on February 14, 2018. Pursuant to the Schedule 13G, Price Associates is an Investment Adviser registered under Section 203 of the Investment Advisers Act, organized in Maryland. As set forth in the Schedule 13G, the ultimate power to direct the receipt of dividends paid with respect to, and the proceeds from the sale of, the common shares, is vested in the individual and institutional clients which Price Associates serves as investment adviser, and not more than 5% of the common shares is owned by any one client subject to the investment advice of Price Associates. According to the Schedule 13G, the address of the principal office of Price Associates is 100 E. Pratt Street, Baltimore, MD 21202.
|
|
(3)
|
As reported in a Schedule 13G/A filed on February 7, 2018 by Rovida Advisors Inc. (“Rovida”), an investment adviser organized in Delaware. According to the Schedule 13G/A, the address of the principal office of Rovida is 1 Gateway Center, Suite 2530, Newark, NJ 07102.
|
|
(4)
|
As reported in a Schedule 13G filed by Victory Capital Management Inc. (“Victory”) on February 9, 2018. Pursuant to the Schedule 13G, Victory is a registered investment adviser, organized in New York. As set forth in the Schedule 13G, the clients of Victory, including investment companies registered under the Investment Company Act of 1940 and separately managed accounts, have the right to receive or the power to direct the receipt of dividends from the sale of the common shares and no client has the right to receive or the power to direct the receipt of dividends from, or the proceeds from the sale of, more than 5% of the common shares. According to the Schedule 13G, the address of the principal office of Victory is 4900 Tiedeman Rd. 4th Floor, Brooklyn OH 44144.
|
Each common share carries one vote
.
As of February 22, 2018, there were nine holders of record of our common shares (including the Company as holder of repurchased common shares), two of which have a U.S. mailing address. One of these two holders is CEDE & Co., a nominee company for The Depository Trust Company (a registered clearing agency with the SEC), which held approximately 99.88% of our outstanding common shares as of such date. The beneficial owners of the common shares held by CEDE & Co. may include persons who reside outside the United States.
B. Related Party Transactions
61
As of February 23, 2017, Kinove Holdings and Luxco Coinvest owned 57.58% and 10.08% of our common shares, respectively. During 2017, Kinove Holdings and the co-investors in Luxco Coinvest (who received common shares from the liquidator of Luxco Coinvest as in-kind advances on the liquidation proceeds) sold all of their holdings of our common shares in four registered secondary public offerings pursuant to the registration rights agreement with Kinove Holdings and Luxco Coinvest. Both Kinove Holdings and Luxco Coinvest are currently in liquidation and, to our knowledge, do not hold any of our common shares as of February 22, 2018. Kinove Holdings, Luxco Coinvest and the shareholders of Kinove Holdings ceased to be related parties on December 9, 2017.
In the normal course of business Orion from time to time receives services from, or sells products to, other related unconsolidated parties, in transactions that are either not material or approved in accordance with our Related Party Transaction Approval Policy. In addition, Orion purchased carbon black products for retail from the DGW KG joint venture for an aggregate amount of EUR
70,169k
in
2017
(
52,194k
and EUR
58,368k
for
2016
and
2015
EUR, respectively). Payables to DGW amount to EUR
16,352k
at year end (Prior year: EUR
10,353k
). Sales and service provided to DGW were not material in
2017
and
2016
and amounted to EUR
2,453k
in
2015
. Receivables at December 31,
2017
and
2016
were nil.
Remuneration paid to corporate management and other members of management amounted to €13.5 million in
2017
and except for contributions into pension scheme benefits comprised short-term benefits. For additional information regarding compensation, including social security costs, pension expenses and other personnel see note
(9.4)
Related parties
to the consolidated financial statements.
Related Party Transaction Approval Policy
Our Board of Directors has implemented a written related party transaction approval policy pursuant to which an independent committee, which may be a standing or ad hoc committee of our Board of Directors, reviews and approves or takes such other action as it may deem appropriate with respect to the following transactions:
|
•
|
a transaction in which we are a participant and which involves an amount exceeding $120,000 and in which any of our directors, officers or 5% shareholders, or any other “related person” as defined in Item 404 of SEC Regulation S-K (“Item 404”), has or will have a direct or indirect material interest; and
|
|
•
|
any other transaction that meets the related party disclosure requirements of the SEC as set forth in Item 404.
|
This policy sets forth factors to be considered by an independent committee in determining whether to approve any such transaction, including the nature of our involvement in the transaction, whether we have demonstrable business reasons to enter into the transaction, whether the transaction would impair the independence of a director and whether the proposed transaction involves any potential reputational or other risk issues.
To simplify the administration of the approval process under this policy, an independent committee may, where appropriate, establish guidelines for certain types of related party transactions or designate certain types of such transactions that will be deemed pre-approved. This policy also provides that the following transactions are deemed pre-approved:
|
•
|
decisions on compensation or benefits or the hiring or retention of our directors or executive officers, if approved by the applicable committee of the Board of Directors;
|
|
•
|
the indemnification and advancement of expenses pursuant to our articles of association or an indemnification agreement; and
|
|
•
|
transactions where the related person’s interest or benefit arises solely from such person’s ownership of our securities and holders of such securities receive the same benefit on a pro rata basis.
|
If our Board of Directors appoints an ad hoc independent committee to review and take action with regard to any one or more related party transactions, the committee will be comprised of at least three independent directors. If at the applicable time our Board of Directors has designated an independent director as its “lead director,” he or she will be a member and the chairperson of the independent committee. A director on any committee considering a related party transaction who has an interest in the transaction will not participate in the consideration of that transaction unless requested by the chairperson of the committee.
|
C.
|
Interest of Experts and Counsel
|
Not applicable.
|
A.
|
Consolidated Statements and Other Financial Information
|
See “
Item 18. Financial Statements
” and our audited consolidated financial statement beginning on page F-1.
62
Legal Proceedings
We become involved from time to time in various claims and lawsuits arising in the ordinary course of our business, such as employment related claims and asbestos litigation, against some of which we have limited indemnification from Evonik under the agreements relating to the Acquisition. Some matters involve claims for large amounts of damages as well as other relief. With respect to our settlement of the EPA’s enforcement initiative under Sections 114 and 113a of the Clean Air Act see “
Item 4. Information on the Company
—B. Business Overview—Environmental, Health and Safety Matters—Environmental—Environmental Proceedings
.” We believe, based on currently available information, that the results of the proceedings referenced above, in the aggregate, will not have a material adverse effect on our financial condition, but may be material to our operating results and cash flow for any particular period when the relevant costs are incurred. We note that the outcome of legal proceedings is inherently uncertain, and we offer no assurances as to the outcome of any of these matters or their effect on the Company.
Dividend Policy
In accordance with the Luxembourg Company Law, the general meeting of shareholders has the power to make a resolution on the payment of dividends upon the recommendation of the Board of Directors. In deciding whether to recommend any future dividend, the Board of Directors would take into account any legal or contractual limitation, our actual and anticipated future earnings, cash flows, debt service and capital requirements, our business plans and such other matters as the Board of Directors believes appropriate, in its discretion. Generally, any dividend approved by a general meeting of shareholders would be paid out shortly after the meeting.
Our ability to pay dividends depends on the existence of legally distributable amounts, which include available profit, distributable reserves and share premium, as determined in accordance with the Luxembourg Company Law and on the basis of the Company’s unconsolidated balance sheet. In order to determine the distributable amounts, the financial profit or loss for the relevant financial period must be adjusted by the profit/loss carried forward from the previous financial years as well as any withdrawals or contributions made to the distributable reserves and share premium. Certain reserves must be established by law (e.g., the Company’s legal reserve, equal to 10% of the Company’s share capital or, in the case of a buy back of its own shares by the Company, a reserve equal to the value of the shares bought back) and deducted when calculating the amount available for distribution. Because the Company is a holding company, it does not generate any distributable profits of its own and is dependent on the transfer of distributable profits by its operating subsidiaries.
During the fiscal year
2017
, our board of directors declared dividends of €0.67 per common share, equivalent to a total distribution of €40 million. The dividends were paid in quarterly installments of €10 million each. Luxembourg withholding tax at a rate of 15% was deducted from the dividends, subject to certain exemptions and reductions in certain circumstances.
|
B.
|
Significant Changes
|
Except as otherwise disclosed in this report, there has been no undisclosed significant change since the date of the annual financial statements.
|
A.
|
Offer and Listing Details
|
The Company’s common shares are listed on the New York Stock Exchange, or NYSE, under the symbol “OEC.” Trading on the NYSE began on July 25, 2014. As of February 22, 2018, a total of 59,635,126 common shares were registered in the Company’s shareholder register, of which 314,912 common shares have been repurchased by the company pursuant to a share repurchase plan in 2016.
On February 21, 2018, the closing price for the Company’s common shares reported by the NYSE was $28.00.
The following tables set forth, for the periods indicated, the high and low of quoted prices for the Company’s common shares as reported by the NYSE.
63
|
Fiscal year ended December 31,
|
High
|
Low
|
||||||
|
2017
|
$
|
25.70
|
|
$
|
17.15
|
|
||
|
2016
|
$
|
20.85
|
|
$
|
10.33
|
|
||
|
2015
|
$
|
21.06
|
|
$
|
9.69
|
|
||
|
2014
(1)
|
$
|
18.40
|
|
$
|
12.60
|
|
||
|
Fiscal quarter ended
|
||||||||
|
March 31, 2018 (through February 21, 2018)
|
$
|
30.25
|
|
$
|
25.4
|
|
||
|
December 31, 2017
|
$
|
25.70
|
|
$
|
22.25
|
|
||
|
September 30, 2017
|
$
|
24.55
|
|
$
|
19.70
|
|
||
|
June 30, 2017
|
$
|
20.85
|
|
$
|
17.15
|
|
||
|
March 31, 2017
|
$
|
22.20
|
|
$
|
18.50
|
|
||
|
December 31, 2016
|
$
|
20.85
|
|
$
|
17.7
|
|
||
|
September 30, 2016
|
$
|
19.51
|
|
$
|
15.13
|
|
||
|
June 30, 2016
|
$
|
17.01
|
|
$
|
13.52
|
|
||
|
March 31, 2016
|
$
|
14.95
|
|
$
|
10.33
|
|
||
|
Most recent six months
|
||||||||
|
February 2018 (through February 21, 2018)
|
$
|
30.25
|
|
$
|
27.05
|
|
||
|
January 2018
|
$
|
29.90
|
|
$
|
25.40
|
|
||
|
December 2017
|
$
|
25.7
|
|
$
|
22.25
|
|
||
|
November 2017
|
$
|
25.45
|
|
$
|
22.85
|
|
||
|
October 2017
|
$
|
23.95
|
|
$
|
22.45
|
|
||
|
September 2017
|
$
|
22.60
|
|
$
|
21.10
|
|
||
|
August 2017
|
$
|
21.95
|
|
$
|
19.90
|
|
||
(1)
Since beginning of trading on July 25, 2014
|
B.
|
Plan of Distribution
|
Not applicable.
|
C.
|
Markets
|
See “
—A. Offer and Listing Details
.”
|
D.
|
Selling Shareholders
|
Not applicable.
|
E.
|
Dilution
|
Not applicable
|
F.
|
Expenses of the Issue
|
Not applicable.
|
A.
|
Share Capital
|
Not applicable.
|
B.
|
Memorandum and Articles of Association
|
Information relating to our Articles of Association is incorporated by reference to the Registration Statement on Form F-1 (File No. 333-196593), as filed with the SEC on July 21, 2014.
On August 23, 2016, certain amendments to the Luxembourg Company Law, as amended (l
oi du 10 août 1915 concernant les sociétés commerciales, telle quelle a été modifiée
) (the “Luxembourg Company Law”), entered into force. The purpose of the amendments was to increase the flexibility and legal certainty of certain Luxembourg corporate law concepts. The amendments are therefore rather
64
technical and cover a wide range of areas, including the creation of new types of companies, clarifications on non-voting agreements and non-voting shares and the creation of a new liquidation regime. One change that applies to the Company relates to the provisions on the publication of convening notices for general meetings, which have been simplified to require that the convening notice be filed with the Luxembourg Trade and Companies Register and published once in the Luxembourg electronic platform and in one Luxembourg newspaper, at least 15 days before the meeting.
Companies incorporated before the entry into force of the amendments, including the Company, remain subject to the existing regime of the Luxembourg Company Law for a transitional period of 24 months (i.e., until 23 August 2018). The Company has not yet taken any actions to amend its Articles of Association to reflect the changes effected by the amendments. Such adjustments will need to be submitted to the general meeting of shareholders for approval before August 23, 2018. In the absence of shareholder resolutions to amend the Articles of Association of the Company, the mandatory provisions of the amended Luxembourg Company Law will apply to the Company by default.
|
C.
|
Material Contracts
|
Credit Agreement
We are party to the Credit Agreement with, among others, Goldman Sachs Bank USA, as administrative agent, Goldman Sachs Bank USA and UBS Securities LLC, as joint global coordinators and joint bookrunners, Barclays Capital, J.P. Morgan Limited, J.P. Morgan Chase Bank, N.A., and Morgan Stanley Bank, N.A. as joint bookrunners and DZ Bank AG, Fifth Third Bank, HSBC Bank N.A. and Mediobanca S.p.A as mandated lead arrangers. The borrowers under the Credit Agreement are Orion Engineered Carbons GmbH and a U.S. subsidiary, which are indirect subsidiaries of the Company. The Credit Agreement was most recently amended on November 7, 2017.
The Credit Agreement consists of (i) senior secured term loans in the principal amount of €553.6 million as of December 31, 2017, having a final maturity in 2024 and bearing interest at an annual rate of LIBOR/EURIBOR (minimum 0.00%) plus 2.50%, subject to downward adjustment based on Orion’s leverage ratio as set forth in the Credit Agreement and (ii) a multicurrency, senior secured revolving line of credit of up to €175 million, having a final maturity in 2021 and bearing interest at an annual rate of LIBOR/EURIBOR plus 2.50% to 3.00%, depending on the leverage ratio. We are required to pay a commitment fee equal to 35% of the applicable interest rate then in effect to the lenders under the New Revolving Credit Facility in respect of the unutilized commitments thereunder. For more details see note
(7.10)
Trade payables, other financial liabilities
.
We are required to prepay the Terms Loans, subject to certain exceptions, with the net cash proceeds (that are not reinvested) from all non-ordinary course asset sales or other dispositions or any incurrence of debt by the borrowers, certain parent companies (including the Company), and their respective restricted subsidiaries. In addition, if our first lien net leverage ratios exceed specified levels, we will be required to prepay the Term Loans, subject to certain exception, with up to 50% of our annual excess cash flow. Currently, our first lien net leverage ratio does not exceed the specified levels. We also have the ability to voluntarily repay outstanding loans at any time without premium or penalty, subject to certain exceptions.
The obligations under the Credit Agreement are unconditionally guaranteed by certain parent companies of the borrowers, including the Company, and, subject to certain exceptions, each of the borrowers’ existing and future material wholly-owned subsidiaries. In addition, the Credit Agreement is collateralized by first priority or equivalent security interests, subject to certain exceptions and qualifications, in (i) all the capital stock of, or other equity interests in, the borrowers and each of the borrowers’ and guarantors’ material direct or indirect wholly-owned restricted subsidiaries, and (ii) certain tangible and intangible assets of the borrowers and the guarantors.
The Credit Agreement contains a number of significant affirmative and negative covenants and events of default. Such covenants, among other things, restrict, subject to certain exceptions, the ability of the borrowers, certain parent companies (including the Company), and their respective restricted subsidiaries to incur additional indebtedness and make guarantees; create liens on assets; enter into sale and leaseback transactions; engage in mergers or consolidations; sell assets; make fundamental changes; pay dividends and distributions or repurchase our capital stock; make investments, loans and advances, including acquisitions; engage in certain transactions with affiliates; make changes in the nature of their business; and make prepayments of junior debt or permitted subordinated unsecured debt. The borrowers, certain parent companies (including the Company), and their respective restricted subsidiaries are also required to maintain a maximum first lien net leverage ratio if borrowings under the New Revolving Credit Facility exceed a certain threshold.
Registration Rights Agreement
We were party to a registration rights agreement with Kinove Holdings and Luxco Conivest, pursuant to which Kinove Holdings was able to require us, subject to certain limitations, to file one or more registration statements with the SEC covering the public resale of common shares beneficially owned by Kinove Holdings. Luxco Coinvest was able to join registrations pursuant to a demand made by Kinove Holdings. In connection with the registration rights agreement, we filed a shelf registration statement on Form F-3, which was declared effective on April 1, 2016. As of December 9, 2017, all “Registrable Securities” (as defined in the registration rights agreement) were sold in registered public offerings pursuant to the registration rights agreement and accordingly, the registration rights agreement terminated.
|
D.
|
Exchange Controls
|
None.
65
|
E.
|
Taxation
|
This section describes the material Luxembourg tax and material United States federal income tax consequences of owning common shares. Insofar as it relates to United States federal income tax consequences, this section applies only to U.S. holders (as defined below) who hold common shares as capital assets for tax purposes and does not apply to members of special classes of holders subject to special rules, including:
|
•
|
a dealer in securities,
|
|
•
|
a trader in securities that elects to use a mark-to-market method of accounting for securities holdings,
|
|
•
|
a tax-exempt organization,
|
|
•
|
a life insurance company,
|
|
•
|
a person liable for alternative minimum tax,
|
|
•
|
a person that actually or constructively owns 10% or more of the combined voting power of our voting stock or of the total value of our stock,
|
|
•
|
a person that holds common shares as part of a straddle or a hedging or conversion transaction,
|
|
•
|
a person that purchases or sells common shares as part of a wash sale for tax purposes, or
|
|
•
|
a person whose functional currency is not the U.S. Dollar.
|
This section is based on the laws of Luxembourg, and the Internal Revenue Code of 1986, as amended, its legislative history, existing and proposed regulations, published rulings and court decisions, all as currently in effect, as well as on the Convention Between the Government of the Grand Duchy of Luxembourg and the Government of the United States of America for the Avoidance of Double Taxation and the Prevention of Fiscal Evasion with Respect to Taxes on Income and Capital (the “Treaty”). These laws are subject to change, possibly on a retroactive basis.
If an entity treated as a partnership for United States federal income tax purposes holds the common shares, the United States federal income tax treatment of a partner will generally depend on the status of the partner and the tax treatment of the partnership. A partner in a partnership holding the common shares should consult its tax advisor with regard to the United States federal income tax treatment of an investment in the common shares.
A U.S. holder is a beneficial owner of common shares that is, for United States federal income tax purposes:
|
•
|
a citizen or resident of the United States,
|
|
•
|
a domestic corporation,
|
|
•
|
an estate whose income is subject to United States federal income tax regardless of its source, or
|
|
•
|
a trust if a United States court can exercise primary supervision over the trust’s administration and one or more United States persons are authorized to control all substantial decisions of the trust, or a trust that has elected to be treated as a domestic trust for United States federal income tax purposes.
|
Investors should consult their own tax advisors regarding the United States federal, state and local and the Luxembourg and other tax consequences of owning and disposing of common shares in their particular circumstances. In particular, investors should confirm their eligibility for Treaty benefits with their advisors and should discuss any possible consequences of failing to qualify for such benefits.
This discussion addresses only United States federal income taxation and Luxembourg income taxation, net worth taxation and inheritance taxation.
Luxembourg Taxation of Common Shares
The following information is of a general nature only and is based on the laws in force in Luxembourg as of the date of this report. It does not purport to be a comprehensive description of all the tax considerations that might be relevant to an investment decision. It is included herein solely for preliminary information purposes. It is not intended to be, nor should it be construed to be, legal or tax advice. It is a description of the essential material Luxembourg tax consequences with respect to any offerings of our common stock and may not include tax considerations that arise from rules of general application or that are generally assumed to be known to shareholders. This summary is based on the laws in force in Luxembourg on the date of this report and is subject to any change in law that may take effect after such date. Prospective shareholders should consult their professional advisors with respect to particular circumstances, the effects of state, local or foreign laws to which they may
66
be subject, and as to their tax position. Please be aware that the residence concept used under the respective headings applies for Luxembourg income tax assessment purposes only. Any reference in the present section to a tax, duty, levy impost or other charge or withholding of a similar nature refers to Luxembourg tax law and/or concepts only. Also, please note that a reference to Luxembourg income tax encompasses corporate income tax (
impôt sur le revenu des collectivités
), municipal business tax (
impôt commercial communal
), a solidarity surcharge (
contribution au fonds pour l’emploi
), as well as personal income tax (
impôt sur le revenu
) generally. Corporate taxpayers may further be subject to net wealth tax (
impôt sur la fortune
) as well as other duties, levies or taxes. Corporate income tax, municipal business tax as well as the solidarity surcharge invariably apply to most corporate taxpayers resident in Luxembourg for tax purposes. Individual taxpayers are generally subject to personal income tax and the solidarity surcharge. Under certain circumstances, where an individual taxpayer acts in the course of the management of a professional or business undertaking, municipal business tax may apply as well.
Taxation of the Company
Income Tax
Profits of the Company are as a general rule subject to corporate income tax (
impôt sur le revenu des collectivités
– ‘‘CIT’’) and municipal business tax (
impôt commercial communal
–‘‘MBT’’). The tax profit as determined for CIT purposes is applicable, with minor adjustments, for MBT purposes. CIT is levied at an effective rate of 19.26% as from 2018 (inclusive of the 7% surcharge for the employment fund). MBT is levied at a variable rate according to the municipality in which a company is located and amounts to 6.75% (in Luxembourg-city). The maximum aggregate CIT and MBT rate consequently amounts to 26.01% as from 2018 (in Luxembourg-city).
As a general rule, dividends, liquidation proceeds and capital gains received or realised by the Company are regarded as ordinary business income and are consequently included in the taxable base for CIT and MBT purposes. In case of dividends, a tax credit may be available for Luxembourg or foreign withholding tax retained by the distributing entity. The same is valid for liquidation proceeds. Capital gains are taxable only upon realisation. No special lower taxation rates apply to capital gains.
Dividends, liquidation proceeds and capital gains may however be tax exempt if the conditions of the participation exemption regime, as described below, are satisfied. If these conditions are not met, under current Luxembourg tax laws, 50% of the gross amount of dividends (excluding liquidation proceeds) received from (i) a Luxembourg resident fully-taxable company limited by share capital, or (ii) a company limited by share capital resident in a State with which the Grand Duchy of Luxembourg has concluded a double tax treaty and liable to a tax corresponding to Luxembourg CIT, or (iii) a company resident in a EU Member State and covered by Article 2 of the amended Council Directive 2011/96/EU of November 30, 2016 (the “EU Parent-Subsidiary Directive”) are exempt from income tax.
Under the participation exemption regime, dividends derived by the Company from its shareholdings may be exempt from income tax if at the time the dividend is made available, (i) the distributing entity is a qualified subsidiary (“Qualified Subsidiary”) i.e. a Luxembourg resident fully-taxable company limited by share capital (
société de capitaux
), a company covered by Article 2 of the Parent-Subsidiary Directive or a non-resident company limited by share capital (
société de capitaux
) liable in its country of residence to a tax corresponding to Luxembourg CIT and (ii) the Company has held or commits itself to hold for an uninterrupted period of at least 12 months a direct participation of at least 10% of the share capital of the distributing entity or a direct participation of an acquisition price of at least €1.2 million (“Qualified Shareholding”). According to the administrative practice of the Luxembourg tax administration, a foreign tax is generally considered comparable to Luxembourg CIT if it is levied at a rate of at least 9% on a taxable base that is similar to the basis used for Luxembourg CIT purposes. Liquidation proceeds are assimilated to dividends received and may be exempt under the same conditions. Participations held through a tax transparent entity are considered as being direct participations proportionally to the percentage held in the net assets of the transparent entity.
Under the participation exemption regime, capital gains realised by the Company on its shareholdings in eligible entities (as defined above) may be exempt from income tax if the above mentioned conditions are met, except that, if the 10% threshold condition is not met, the acquisition price must be of at least €6 million for capital gains purposes. Taxable gains are determined as being the difference between the price for which shares have been disposed of and the lower of their cost or book value.
Tax treaties signed by Luxembourg can further broaden the scope of the participation exemption regime.
Net Wealth Tax
The Company is subject to Luxembourg net wealth tax on its net assets as determined for net wealth tax purposes. Net wealth tax is levied at the rate of 0.5% on net assets not exceeding €500 million and at the rate of 0.05% on the portion of the net assets exceeding €500 million. Net wealth is referred to as the unitary value (
valeur unitaire
), as generally determined on January 1 of each year. The unitary value is in principle calculated as the difference between (i) assets estimated at their fair market value (
valeur estimée de réalisation
), and (ii) liabilities
vis-à-vis
third parties
Under the participation exemption regime, a Qualified Shareholding held in a Qualified Subsidiary by the Company is exempt from net wealth tax.
As from 1 January 2016, a minimum net wealth tax (“MNWT”) is levied on companies having their statutory seat or central administration in Luxembourg. For entities for which the sum of fixed financial assets, receivables against related companies, transferable securities and cash at bank exceeds 90% of their total gross assets and €350,000, the MNWT is set at €4,815. For all other companies
67
having their statutory seat or central administration in Luxembourg which do not fall within the scope of the €4,815 MNWT, the MNWT ranges from €535 to €32,100, depending on the company’s total gross assets.
Other taxes
The incorporation of the Company through a contribution in cash to its share capital as well as further share capital increase or any other amendment to the articles of incorporation of the Company are subject to a fixed registration duty of €75.
Withholding Tax
Dividends paid by the Company to its shareholders are generally subject to a 15% withholding tax in Luxembourg. A corresponding tax credit may be granted to the shareholders in the countries of their residence based on their local applicable legislation.
Where a withholding needs to be applied, the rate of the withholding tax may be reduced pursuant to the double tax treaty existing between Luxembourg and the country of residence of the relevant holder, subject to the fulfillment of the conditions set forth therein. If the Company and a U.S. relevant holder are eligible for the benefits of the Treaty, the rate of withholding on distributions generally is 15%, or 5% if the U.S. relevant holder is a qualified resident company as defined in Article 24 of the Treaty that owns at least 10% of the Company's voting stock.
A withholding tax exemption applies under the participation exemption regime if cumulatively (i) the shareholder is an eligible parent (“Eligible Parent”) and (ii) at the time the income is made available, the shareholder has held or commits itself to hold for an uninterrupted period of at least 12 months a Qualified Shareholding. Holding a participation through a tax transparent entity is deemed to be a direct participation in the proportion of the net assets held in this entity. An Eligible Parent includes (a) a company covered by Article 2 of the Parent-Subsidiary Directive or a Luxembourg permanent establishment thereof, (b) a company resident in a State having a double tax treaty with Luxembourg and liable to a tax corresponding to Luxembourg CIT or a Luxembourg permanent establishment thereof, (c) a company limited by share capital (
société de capitaux
) or a cooperative society (
société coopérative
) resident in a Member State of the European Economic Area other than an EU Member State and liable to a tax corresponding to Luxembourg CIT or a Luxembourg permanent establishment thereof or (d) a Swiss company limited by share capital (
société de capitaux
) which is subject to corporate income tax in Switzerland without benefiting from an exemption.
No withholding tax is levied on capital gains and liquidation proceeds.
Non-Luxembourg holders of the shares who have neither a permanent establishment, nor a permanent representative in Luxembourg to which or whom the shares would be attributable are not liable for any Luxembourg tax on dividends paid on the shares, other than a potential withholding tax as described above.
The responsibility for the withholding of withholding tax will be borne by the Company.
Taxation of the Shareholders
Tax Residency of the Shareholders
A shareholder will not become resident, nor be deemed to be resident, in Luxembourg by reason only of the holding and/or disposal of the common shares or the execution, performance or enforcement of his/her rights thereunder.
Income Tax
For the purposes of this paragraph, a disposal may include a sale, an exchange, a contribution, a redemption and any other kind of alienation of the participation.
Luxembourg Resident Shareholders
Luxembourg Resident Individuals
Dividends and other payments derived from the common shares held by resident individual shareholders, who act in the course of the management of either their private wealth or their professional/business activity, are subject to income tax at the ordinary progressive rates. Under current Luxembourg tax laws, 50% of the gross amount of dividends received by resident individuals from the Company may, however, be exempt from income tax.
Capital gains realized on the disposal of the common shares by resident individual shareholders, who act in the course of the management of their private wealth, are not subject to income tax, unless said capital gains qualify either as speculative gains or as gains on a substantial participation. Capital gains are deemed to be speculative if the common shares are disposed of within 6 months after their acquisition or if their disposal precedes their acquisition. Speculative gains are subject to income tax as miscellaneous income at ordinary rates. A participation is deemed to be substantial where a resident individual shareholder holds or has held, either alone or together with his/her spouse or partner and/or minor children, directly or indirectly at any time within the 5 years preceding the disposal, more than 10% of the share capital of the company whose common shares are being disposed of. A shareholder is also deemed to alienate a substantial participation if he acquired free
68
of charge, within the 5 years preceding the transfer, a participation that was constituting a substantial participation in the hands of the alienator (or the alienators in case of successive transfers free of charge within the same 5-year period). Capital gains realized on a substantial participation more than 6 months after the acquisition thereof are taxed according to the half-global rate method (i.e.
,
the average rate applicable to the total income is calculated according to progressive income tax rates and half of the average rate is applied to the capital gains realized on the substantial participation).
Capital gains realized on the disposal of the common shares by resident individual shareholders, who act in the course of their professional/business activity, are subject to income tax at ordinary rates. Taxable gains are determined as being the difference between the price for which the common shares have been disposed of and the lower of their cost or book value.
Luxembourg Resident Companies
Dividends and other payments derived from the common shares held by Luxembourg resident fully taxable companies are subject to income taxes, unless the conditions of the participation exemption regime, as described below, are satisfied. If the conditions of the participation exemption regime are not met, 50% of the dividends distributed by the Company to a Luxembourg fully taxable resident company are nevertheless exempt from income tax.
Under the participation exemption regime, dividends derived from the common shares may be exempt from income tax at the level of the shareholder if cumulatively (i) the shareholder is a Luxembourg fully taxable resident company (“Qualified Parent”) and (ii) at the time the dividend is put at the shareholder’s disposal, the shareholder has held or commits itself to hold for an uninterrupted period of at least 12 months a Qualified Shareholding. Liquidation proceeds are assimilated to dividends and may be exempt under the same conditions.
Capital gains realized by a Luxembourg fully taxable resident company on the disposal of the common shares are subject to income tax at ordinary rates, unless the conditions of the participation exemption regime, as described below, are satisfied. Under the participation exemption regime, capital gains realized on the common shares may be exempt from income tax at the level of the shareholder if cumulatively (i) the shareholder is a Qualified Parent and (ii) at the time the capital gain is realized, the shareholder has held or commits itself to hold for an uninterrupted period of at least 12 months common shares representing either (a) a direct participation of at least 10% in the share capital of the Company or (b) a direct participation in the Company of an acquisition price of at least €6 million. Taxable gains are determined as being the difference between the price for which the common shares have been disposed of and the lower of their cost or book value.
For the purposes of the participation exemption regime, common shares held through a tax transparent entity are considered as being a direct participation proportionally to the percentage held in the net assets of the transparent entity.
Luxembourg Resident Companies Benefiting from a Special Tax Regime
A shareholder which is a Luxembourg resident company benefiting from a special tax regime, such as (i) an undertaking for collective investment (“UCI”) governed by the amended law of December 17, 2010, (ii) a specialized investment fund (“SIF”) governed by the amended law of February 13, 2007 or (iii) a family wealth management company governed by the amended law of May 11, 2007, or (iv) a reserved alternative investment fund (“RAIF”) treated as a SIF for Luxembourg tax purposes and governed by the law of July 23, 2016 is exempt from income tax in Luxembourg. Dividends and capital gains derived from the common shares are thus not subject to Luxembourg income tax in their hands.
Luxembourg Non-Resident Shareholders
Non-resident shareholders, who have neither a permanent establishment nor a permanent representative in Luxembourg to which or whom the common shares are attributable, are not liable to any Luxembourg income tax, whether they receive payments of dividends or realize capital gains on the disposal of the common shares, except capital gains realized on a substantial participation before the acquisition or within the first 6 months of the acquisition thereof, that are subject to income tax in Luxembourg at ordinary rates (subject to the provisions of any relevant double tax treaty), or capital gains realized by a shareholder who has been a former Luxembourg resident for more than fifteen years and has become a non-resident, at the time of transfer, less than five years ago. A participation is deemed to be substantial where a shareholder holds or has held, either alone or, in case of an individual shareholder, together with his/her spouse or partner and/or minor children, directly or indirectly at any time within the 5 years preceding the disposal, more than 10% of the share capital of the company whose common shares are being disposed of. A shareholder is also deemed to alienate a substantial participation if he acquired free of charge, within the 5 years preceding the transfer, a participation that was constituting a substantial participation in the hands of the alienator (or the alienators in case of successive transfers free of charge within the same 5-year period).
If the Company and a U.S. relevant holder are eligible for the benefits of the Treaty, such U.S. relevant holder generally should not be subject to Luxembourg tax on the gain from the disposal of such common shares unless such gain is attributable to a permanent establishment of such U.S. relevant holder in Luxembourg.
Non-resident shareholders having a permanent establishment or a permanent representative in Luxembourg to which or whom the common shares are attributable, must include any income received, as well as any gain realized on the disposal of the common shares, in their taxable income for Luxembourg tax assessment purposes, unless the conditions of the participation exemption regime, as described below, are satisfied. If the conditions of the participation exemption regime are not fulfilled, 50% of the gross amount of dividends received by a
69
Luxembourg permanent establishment or permanent representative are, however, exempt from income tax. Taxable gains are determined as being the difference between the price for which the common shares have been disposed of and the lower of their cost or book value.
Under the participation exemption regime, dividends derived from the common shares may be exempt from income tax if cumulatively (i) the common shares are attributable to a qualified permanent establishment (“Qualified Permanent Establishment”) and (ii) at the time the dividend is put at the disposal of the Qualified Permanent Establishment, it has held or commits itself to hold a Qualified Shareholding in the Company. A Qualified Permanent Establishment means (a) a Luxembourg permanent establishment of a company covered by Article 2 of the Parent-Subsidiary Directive, (b) a Luxembourg permanent establishment of a company limited by share capital (
société de capitaux
) resident in a State having a double tax treaty with Luxembourg and (c) a Luxembourg permanent establishment of a company limited by share capital (
société de capitaux
) or a cooperative society (
société coopérative
) resident in a Member State of the European Economic Area other than an EU Member State. Liquidation proceeds are assimilated to a received dividend and may be exempt under the same conditions. Common shares held through a tax transparent entity are considered as being a direct participation proportionally to the percentage held in the net assets of the transparent entity.
Under the participation exemption regime, capital gains realized on the common shares may be exempt from income tax if cumulatively (i) the common shares are attributable to a Qualified Permanent Establishment and (ii) at the time the capital gain is realized, the Qualified Permanent Establishment has held or committed itself to hold for an uninterrupted period of at least 12 months common shares representing either (a) a direct participation in the share capital of the Company of at least 10% or (b) a direct participation in the Company of an acquisition price of at least €6 million.
Net Wealth Tax
Luxembourg Shareholders
Luxembourg resident shareholders, as well as non-resident shareholders who have a permanent establishment or a permanent representative in Luxembourg to which or whom the common shares are attributable, are subject to Luxembourg net wealth tax on such common shares, except if the shareholder is (i) a resident or non-resident individual taxpayer, (ii) a UCI governed by the amended law of December 17, 2010, (iii) a securitization company governed by the amended law of March 22, 2004 on securitization, (iv) a company governed by the amended law of June 15, 2004 on venture capital vehicles, (v) a SIF governed by the amended law of February 13, 2007, (vi) a family wealth management company governed by the amended law of May 11, 2007, (vii) a professional pension institution governed by the amended law of July 13, 2005, or (viii) a RAIF governed by the law of July 23, 2016. However, (i) a securitization company governed by the amended law of March 22, 2004 on securitization, (ii) a company governed by the amended law of June 15, 2004 on venture capital vehicles, (iii) a professional pension institution governed by the amended law dated July 13, 2005 and (iv) a RAIF treated as a venture capital vehicle for Luxembourg tax purposes and governed by the law of July 23, 2016 remain subject to MNWT.
Under the participation exemption regime, a Qualified Shareholding held in a Qualified Subsidiary by a Qualified Parent or attributable to a Qualified Permanent Establishment may be exempt from Luxembourg net wealth tax.
Non-Luxembourg Shareholders
Luxembourg net wealth tax will not be levied on a non-Luxembourg shareholder with respect to the common shares held unless the common shares are attributable to an enterprise or part thereof which is carried on through a permanent establishment or a permanent representative in Luxembourg.
Other Taxes
Under current Luxembourg tax laws, no registration tax or similar tax is in principle payable to shareholders upon the acquisition, holding or disposal of the shares. However, a fixed registration duty of €12 may be due upon registration of the shares in Luxembourg in the case of a registration of the shares on a voluntary basis.
No inheritance tax is levied on the transfer of the common shares upon death of a shareholder in cases where the deceased was not a resident of Luxembourg for inheritance tax purposes.
Gift tax may be due on a gift or donation of the shares, if the gift is recorded in a Luxembourg notarial deed or otherwise registered in Luxembourg.
The disposal of the shares is not subject to a Luxembourg registration tax or stamp duty, unless recorded in a Luxembourg notarial deed or otherwise registered in Luxembourg.
U.S. Taxation of Common Shares
Dividends
Under the United States federal income tax laws, and subject to the passive foreign investment company (“PFIC”) rules discussed below, the gross amount of any distribution the Company pays out of its current or accumulated earnings and profits (as determined for United States federal income tax purposes) is subject to United States federal income taxation as a dividend for U.S. holders. For noncorporate U.S.
70
holders, dividends that constitute qualified dividend income will be taxable at the preferential rates applicable to long-term capital gains provided that such holders hold the common shares for more than 60 days during the 121-day period beginning 60 days before the ex-dividend date and meet other holding period requirements. Dividends the Company pays with respect to the common shares generally will be qualified dividend income provided that, in the year that the dividend is received, the common shares are readily tradable on an established securities market in the United States. The common shares should generally be treated as readily tradable on an established securities market in the United States so long as they are listed on the NYSE.
U.S. holders must include any Luxembourg tax withheld from the dividend payment in this gross amount even if not in fact received. The dividend is taxable when received, actually or constructively. The dividend will not be eligible for the dividends-received deduction generally allowed to United States corporations in respect of dividends received from other United States corporations. Distributions in excess of current and accumulated earnings and profits, as determined for United States federal income tax purposes, will be treated as a non-taxable return of capital to the extent of a U.S. holder’s basis in the common shares and thereafter as capital gain. However, we do not expect to calculate earnings and profits in accordance with United States federal income tax principles. Accordingly, holders should expect that any distribution will be treated as a dividend.
Subject to certain limitations, the Luxembourg tax withheld in accordance with the Treaty and paid over to Luxembourg will be creditable or deductible against a U.S. holder’s United States federal income tax liability. Special rules apply in determining the foreign tax credit limitation with respect to dividends that are subject to the preferential tax rates.
Dividends will generally be income from sources outside the United States and will, depending on the holder’s circumstances, generally be “passive” income for purposes of computing the foreign tax credit allowable to such holder.
U.S. holders should consult their own tax advisors regarding the utilization of Luxembourg withholding taxes.
Capital Gains
Subject to the PFIC rules discussed below, U.S. holders that sell or otherwise dispose of their common shares will recognize capital gain or loss for United States federal income tax purposes equal to the difference between the U.S. Dollar value of the amount realized and the U.S. holder’s tax basis, determined in U.S. Dollars, in their common shares. Capital gain of a noncorporate U.S. holder is generally taxed at preferential rates where the property is held for more than one year. The deductibility of capital losses is subject to limitations. The gain or loss will generally be income or loss from sources within the United States for foreign tax credit limitation purposes.
PFIC Rules
The Company believes that it currently is not, and the Company does not expect to become, a PFIC. Therefore, the common shares should not be treated as stock of a PFIC for United States federal income tax purposes, but this conclusion is a factual determination that is made annually and thus may be subject to change. In general, a non-U.S. corporation will be classified as a PFIC for any taxable year if at least (i) 75% of its gross income is classified as passive income or (ii) 50% of its assets (determined on the basis of a quarterly average) produce or are held for the production of passive income. If the Company were to be treated as a PFIC, gain realized on the sale or other disposition of the common shares would in general not be treated as capital gain. Instead, unless a U.S. holder elects to be taxed annually on a mark-to-market basis with respect to its common shares, such holder would be treated as if it had realized such gain and certain “excess distributions” ratably over its holding period for the common shares and would be taxed at the highest tax rate in effect for each such year to which the gain was allocated, together with an interest charge in respect of the tax attributable to each such year. With certain exceptions, common shares will be treated as stock in a PFIC if the Company were a PFIC at any time during the U.S. holder’s holding period in the common shares. Dividends received from the Company will not be eligible for the special tax rates applicable to qualified dividend income if the Company is treated as a PFIC with respect to holders either in the taxable year of the distribution or the preceding taxable year, but instead will be taxable at rates applicable to ordinary income.
|
F.
|
Dividends and Paying Agents
|
Not applicable.
|
G.
|
Statement by Experts
|
Not applicable.
|
H.
|
Documents on Display
|
We are subject to the reporting requirements of the Exchange Act, as applied to foreign private issuer. We furnish or file quarterly financial information to the SEC on Form 6-K and file annual reports on Form 20-F within the time period required by the SEC, which is currently four months from the end of the fiscal year on December 31. Any documents filed or furnished by the Company may be read or copied at the SEC’s public reference room at 100 F Street, N.E., Room 1580, Washington, D.C. 20549. Please call the SEC at 1-800-SEC-0330 for further information on the public reference room. The SEC also maintains a website at http://www.sec.gov which contains reports and other information regarding registrants that file electronically with the SEC.
71
Whenever a reference is made in this report to a contract or other document, please be aware that such reference is not necessarily complete and reference should be made to the exhibits that are a part of this report for a copy of the contract or other document.
|
I.
|
Subsidiary Information
|
Not applicable.
Our activities expose us to a variety of market risks. Our primary market risk exposures relate to foreign exchange, interest rate and commodity risks. To manage these risks and our exposure to the unpredictability of financial markets, we seek to minimize potential adverse effects on our financial performance and capital. Where appropriate, we use derivative financial instruments solely for the purpose of hedging the currency, interest and commodity risks arising from our operations and sources of finance. For this purpose, a systematic financial and risk management system has been established. We do not enter into derivative financial instruments for speculative purposes.
The following discussion and analysis only addresses our market risk and does not address other financial risks that we face in the normal course of business, including credit risk and liquidity risk. Please see note
(9.3)
Financial risk management to our audited consolidated financial statements for 2015 included herein for a further discussion of our financial risk management policies and markets risks.
Interest Rate Risk
Interest rate risk management aims to protect consolidated profit or loss from negative effects from market interest rate fluctuations. Orion would be exposed to interest rate risk which might arise from incurring new liabilities at this time due to higher interest rates. Since the new Term Loans are variable interest rate instruments, we are exposed to the market risk arising from changes in the yield curve. Appropriate hedging instruments are in place to mitigate the exposure arising from increasing interest rates.
The table below shows the sensitivity of the interest expense to changes in the interest rate, after the impact of hedge accounting. It shows the change resulting from a hypothetical fluctuation in the three-month LIBOR of 50 basis points (0.50%) as of
December 31, 2017
assuming that all other variables remain unchanged. For example changes in USD/EUR currency rate would have an impact on our interest exposure and vice versa. Changes in interest rates would also have a related impact on our foreign currency (USD) exposure. The sensitivity analysis assumes that the hypothetical interest rate was valid and that the New Revolving Credit Facilities was utilized in the full amount over the course of the entire year. The effect of this hypothetical change in the interest rate of the variable rate loan on our consolidated profit or loss before taxes for the year ended
December 31, 2017
is as follows:
|
December 31, 2017
|
||||
|
in EUR million
|
||||
|
Increase by
0.50% |
Decrease by
0.50% |
|||
|
Increase (decrease) in the interest expense
|
0.7
|
|
(0.1
|
)
|
|
Increase (decrease) in income before taxes
|
(0.7
|
)
|
0.1
|
|
|
Increase (decrease) in equity (Cash flow hedge reserve)
|
4.4
|
|
(2.8
|
)
|
|
Increase (decrease) in total comprehensive income before taxes
|
3.8
|
|
(2.7
|
)
|
Currency Risk
Our functional currency is the Euro. Currency risks primarily stem from future cash flows related to interest payments and the U.S. Dollar-denominated Term Loan. In addition to currency risks from operating activities and from net investments in foreign subsidiaries, these interest and principal repayments mainly represent the risk in connection with exchange rate fluctuations.
The table below shows the sensitivity with regard to the effect of a change in the Euro/U.S. Dollar exchange rate using the outstanding amount and the interest for the U.S. Dollar-denominated Term Loan. A fluctuation of the Euro/U.S. Dollar exchange rate of 10% as of
December 31, 2017
with other conditions remaining unchanged, would have the following effect before taxes on our earnings or capital:
72
|
December 31, 2017
|
||||
|
In EUR k
|
Value of the Euro in relation to the U.S. Dollar
|
|||
|
in EUR million
(1)
|
Increase by
10% |
Decrease by
10% |
||
|
FX gain / (FX loss) in finance result
|
8.2
|
|
(10.0
|
)
|
|
Increase (decrease) in income before taxes
|
8.2
|
|
(10.0
|
)
|
|
Increase (decrease) in equity (Reserve for hedges of a net investment in foreign operation)
|
13.6
|
|
(16.7
|
)
|
|
Increase (decrease) in total comprehensive income before taxes
|
21.9
|
|
(26.7
|
)
|
(1) Euro/U.S. Dollar exchange rate as of
December 31, 2017
:
1.1993
Commodity Risk
Commodity risk results from changes in market prices for raw materials, mainly carbon black oil. Raw materials are primarily purchased to meet our production requirements. Factors of importance to our risk position are the availability and price of raw materials, energy, starting products and intermediates. In particular, our raw material prices depend on exchange rates and the price of crude oil. Pricing and procurement risks are reduced through worldwide procurement and optimized processes to ensure immediate sourcing of additional raw material requirements. Costs for raw materials and energy have fluctuated significantly in past years and may continue to fluctuate in the future. For example, Brent crude oil prices continuously increased from $76 per barrel in May 2010, to a peak of $127 per barrel in April 2011, and then declined to $110 per barrel by the end of December 2013, dropped sharply to $60 in December 2014 and further declined to $30 per barrel by end of December 2015. At December
2017
the price per barrel was at $67 per barrel. We endeavor to reduce purchasing risks on the procurement markets through worldwide purchasing activities and optimized processes for the purchase of additional raw materials. Raw materials are purchased exclusively to cover our own requirements.
A significant portion of our volume is sold based on formula-driven price adjustment mechanisms for changes in costs of raw materials (volumes of
75%
in the Rubber Carbon Black segment and volumes of approximately 90 kmt in the Specialty Carbon Black segment in
2017
). Most of our indexed contracts allow for monthly price adjustments, while a relatively small portion allows for quarterly price adjustments. The one-month oil price adjustment mechanism typically results in a two-month delay in reflecting oil price changes in our customer pricing, while the three-month price adjustment mechanism typically results in a four-month delay. We believe that our contracts have enabled us to generally maintain our Segment Adjusted EBITDA Margins since the Acquisition. We discontinued our raw material hedging strategy in 2011 and all our raw material hedging arrangements elapsed by the end of 2013. Beginning in 2016 we entered into limited short term commodity derivatives for a specific carbon black oil grade. We also have short-term non-indexed contracts covering approximately
25%
of volumes in the Rubber Carbon Black segment and volumes exceeding 90 kmt in the Specialty Carbon Black segment in
2017
. Sales prices under non-indexed contracts are reviewed on a quarterly basis to reflect raw material and market fluctuation.
|
A.
|
Debt Securities
|
Not applicable.
|
B.
|
Warrants and Rights
|
Not applicable.
|
C.
|
Other Securities
|
Not applicable.
|
D.
|
American Depositary Shares
|
Not applicable.
None.
73
None.
Disclosure Controls and Procedures
An evaluation was carried out, under the supervision and with the participation of management, including the Chief Executive Officer (“CEO”) and Chief Financial Officer (
“
CFO
”
), of the effectiveness of the design and operation of our disclosure controls and procedures as defined in Rule 13a-15(e) and 15d-15(e) of the Securities Exchange Act as of December 31,
2017
. Based on that evaluation, the CEO and the CFO have concluded that as of December 31,
2017
, our disclosure controls and procedures are effective in ensuring that material information that is required to be disclosed in our reports filed under the Exchange Act is recorded, processed, summarized and reported within the time periods specified in the SEC’s rules and forms, and that such information is accumulated and communicated to our management, including our CEO and CFO, as appropriate, to allow timely decisions regarding required disclosure.
In designing and evaluating our disclosure controls and procedures, management, including the CEO and the CFO, recognized that any controls and procedures, no matter how well designed and operated, can provide only reasonable assurance of achieving the desired control objectives, and management necessarily was required to apply its judgment in evaluating the cost-benefit relationship of possible controls and procedures. Because of the inherent limitations in all control systems, no evaluation of controls can provide absolute assurance that all control issues and instances of fraud, if any, within the Company have been detected.
Management’s Annual Report on Internal Control over Financial Reporting
Management is responsible for establishing and maintaining adequate internal control over financial reporting (as such term is defined in Rules 13a-15(f) and 15d-15(f) under the Exchange Act). The Company’s internal control over financial reporting was designed to provide reasonable assurance regarding the reliability of financial reporting and the preparation and fair presentation of the Company’s financial statements for external purposes in accordance with IFRS.
Because of its inherent limitations, internal control over financial reporting may not prevent or detect misstatements or omissions. In addition, projections of any evaluation of effectiveness to future periods are subject to the risk that controls may become inadequate because of changes in conditions, or that the degree of compliance with the policies or procedures may deteriorate.
Management conducted its assessment of the effectiveness of our internal control over financial reporting as of December 31,
2017
based on the framework in Internal Control-Integrated Framework (2013) issued by the Committee of Sponsoring Organizations of the Treadway Commission (COSO). Based on that assessment, management has concluded that, as of December 31,
2017
, the Company’s internal control over financial reporting was effective.
Attestation Report of the Independent Registered Public Accounting Firm
The Company’s independent registered public accounting firm, Ernst & Young GmbH Wirtschaftsprüfungsgesellschaft, has issued their attestation report on management’s internal control over financial reporting which is set forth in Item 18 of this form.
Changes in Control over Financial Reporting
During the period covered by this report, there were no changes in our internal control over financial reporting that have materially affected, or are reasonably likely to materially affect, our internal control over financial reporting.
See “
Item 6. Directors, Senior Management and Employees
—C. Board Practices—Audit Committee
.”
In accordance with NYSE listing requirements and SEC rules, the Company adopted code of business conduct and ethics that applies to all of its employees, the members of its Board of Directors and its officers.
The text of our code of ethics for senior financial officers and code of conduct for employees is posted on our web site at: http://investor.orioncarbons.com/corporate-governance.
The Audit Committee has adopted a pre-approval policy that requires the pre-approval of all services performed for us by our independent registered public accounting firm. Additionally, the Audit Committee has delegated to its Chairman full authority to approve any management request for pre-approval, provided the Chairman presents any approval given at its next scheduled meeting. All audit-related services, tax services and other services rendered by our independent registered public accounting firm or their affiliates were pre-approved by the Audit Committee and are compatible with maintaining the auditor’s independence.
Ernst & Young GmbH Wirtschaftsprüfungsgesellschaft has served as our principal independent public auditor for the years 2017 and 2016 for which audited Consolidated Financial Statements appear in this report. Set forth below are the total fees billed (or expected to
74
be billed), on a consolidated basis, by Ernst & Young GmbH Wirtschaftsprüfungsgesellschaft and affiliates for providing audit and other professional services in each of the last two years:
|
(in € millions)
|
2017
|
2016
|
|||
|
Audit fees
|
1.9
|
|
1.7
|
|
|
|
Audit-related fees
|
—
|
|
—
|
|
|
|
Tax fees
|
0.3
|
|
0.3
|
|
|
|
All other fees
|
—
|
|
—
|
|
|
|
Total
|
2.2
|
|
2.0
|
|
|
Audit fees consist of fees and expenses billed for the annual audit and quarterly review of Orion’s consolidated financial statements and the provision of comfort letters to Underwriters in connection with secondary offerings of our shares during 2017.
Tax fees include fees and expenses billed for tax compliance services, including assistance on the preparation of tax returns, requests to extend filing dates and assistance and representation in connection with tax audits, and for tax consultancy in connection with international tax issues and mergers and acquisitions deals.
Not applicable.
A total of 314,912 common shares have been repurchased by the Company pursuant to a share repurchase plan in 2016. The term of the repurchase plan has expired. Accordingly, no additional shares may be purchased under the plan.
None.
As a foreign private issuer with registered office in Luxembourg that is listed on the NYSE, we are generally entitled to follow the corporate governance practices applicable to Luxembourg issuers under the corporate and securities laws of the Grand Duchy of Luxembourg (“Luxembourg Law”). The following is a summary of any significant ways in which our corporate governance practices differ from those required to be followed by U.S. domestic companies under NYSE listing standards.
Rule 10A-3(b)(2) under the Exchange Act requires that a U.S. public company’s independent auditors be appointed by the company’s audit committee. As required under Luxembourg Law and our Articles of Association, our independent auditors are appointed by a general meeting of shareholders upon the recommendation of the Audit Committee.
Not applicable.
We have responded to Item 18 in lieu of responding to this Item.
75
See page F-1 of this report.
INDEX TO FINANCIAL STATEMENTS
|
Audited Consolidated Financial Statements as at December 31, 2017 and for the three years ended December 31, 2017
|
||
|
F-3
|
||
|
Notes to the consolidated financial statements of Orion Engineered Carbons S.A., as at December 31, 2017 and 2016 and for the three years ended December 31, 2017
|
||
F-1
Report of Independent Registered Public Accounting Firm
To the Shareholders and the Board of Directors of Orion Engineered Carbons S.A.
Opinion on the Financial Statements
We have audited the accompanying consolidated statements of financial position of Orion Engineered Carbons S.A. (the Company) as of December 31, 2017 and 2016, and the related consolidated income statements, statements of comprehensive income, changes in equity and cash flows for each of the three years in the period ended December 31, 2017, and the related notes (collectively referred to as the “financial statements”). In our opinion, the financial statements present fairly, in all material respects, the consolidated financial position of the Company at December 31, 2017 and 2016, and the consolidated results of its operations and its cash flows for each of the three years in the period ended December 31, 2017, in conformity with International Financial Reporting Standards as issued by the International Accounting Standards Board.
We also have audited, in accordance with the standards of the Public Company Accounting Oversight Board (United States) (PCAOB), the Company's internal control over financial reporting as of December 31, 2017, based on criteria established in Internal Control-Integrated Framework issued by the Committee of Sponsoring Organizations of the Treadway Commission (2013 framework) and our report dated February 22, 2018 expressed an unqualified opinion thereon.
Basis for Opinion
These financial statements are the responsibility of the Company's management. Our responsibility is to express an opinion on the Company’s financial statements based on our audits. We are a public accounting firm registered with the PCAOB and are required to be independent with respect to the Company in accordance with the U.S. federal securities laws and the applicable rules and regulations of the Securities and Exchange Commission and the PCAOB.
We conducted our audits in accordance with the standards of the PCAOB. Those standards require that we plan and perform the audit to obtain reasonable assurance about whether the financial statements are free of material misstatement, whether due to error or fraud. Our audits included performing procedures to assess the risks of material misstatement of the financial statements, whether due to error or fraud, and performing procedures that respond to those risks. Such procedures included examining, on a test basis, evidence regarding the amounts and disclosures in the financial statements. Our audits also included evaluating the accounting principles used and significant estimates made by management, as well as evaluating the overall presentation of the financial statements. We believe that our audits provide a reasonable basis for our opinion.
/s/Tobias Schlebusch /s/Titus Zwirner
Wirtschaftsprüfer Wirtschaftsprüfer
(German Public Auditor) (German Public Auditor)
Ernst & Young GmbH Wirtschaftsprüfungsgesellschaft
We have served as the Company’s auditor since 2011
Cologne, Germany
February 22, 2018
F-2
REPORT OF INDEPENDENT REGISTERED PUBLIC ACCOUNTING FIRM
To the Shareholders and the Board of Directors of Orion Engineered Carbons S.A.
Opinion on Internal Control over Financial Reporting
We have audited Orion Engineered Carbons S.A.’s internal control over financial reporting as of December 31, 2017, based on criteria established in Internal Control-Integrated Framework issued by the Committee of Sponsoring Organizations of the Treadway Commission (2013 framework) (the COSO criteria). In our opinion, Orion Engineered Carbons S.A. (the Company) maintained, in all material respects, effective internal control over financial reporting as of December 31, 2017, based on the COSO criteria.
We also have audited, in accordance with the standards of the Public Company Accounting Oversight Board (United States) (PCAOB), the consolidated statements of financial position of the Company as of December 31, 2017 and 2016, the related consolidated income statements, statements of comprehensive income, changes in equity and cash flows for each of the three years in the period ended December 31, 2017, and the related notes and our report dated February 22, 2018 expressed an unqualified opinion thereon.
Basis for Opinion
The Company’s management is responsible for maintaining effective internal control over financial reporting and for its assessment of the effectiveness of internal control over financial reporting included in the accompanying Management’s Annual Report on Internal Control over Financial Reporting. Our responsibility is to express an opinion on the Company’s internal control over financial reporting based on our audit. We are a public accounting firm registered with the PCAOB and are required to be independent with respect to the Company in accordance with the U.S. federal securities laws and the applicable rules and regulations of the Securities and Exchange Commission and the PCAOB.
We conducted our audit in accordance with the standards of the PCAOB. Those standards require that we plan and perform the audit to obtain reasonable assurance about whether effective internal control over financial reporting was maintained in all material respects.
Our audit included obtaining an understanding of internal control over financial reporting, assessing the risk that a material weakness exists, testing and evaluating the design and operating effectiveness of internal control based on the assessed risk, and performing such other procedures as we considered necessary in the circumstances. We believe that our audit provides a reasonable basis for our opinion.
Definition and Limitations of Internal Control Over Financial Reporting
A company’s internal control over financial reporting is a process designed to provide reasonable assurance regarding the reliability of financial reporting and the preparation of financial statements for external purposes in accordance with generally accepted accounting principles. A company’s internal control over financial reporting includes those policies and procedures that (1) pertain to the maintenance of records that, in reasonable detail, accurately and fairly reflect the transactions and dispositions of the assets of the company; (2) provide reasonable assurance that transactions are recorded as necessary to permit preparation of financial statements in accordance with generally accepted accounting principles, and that receipts and expenditures of the company are being made only in accordance with authorizations of management and directors of the company; and (3) provide reasonable assurance regarding prevention or timely detection of unauthorized acquisition, use, or disposition of the company’s assets that could have a material effect on the financial statements.
Because of its inherent limitations, internal control over financial reporting may not prevent or detect misstatements. Also, projections of any evaluation of effectiveness to future periods are subject to the risk that controls may become inadequate because of changes in conditions, or that the degree of compliance with the policies or procedures may deteriorate.
/s/Tobias Schlebusch /s/Titus Zwirner
Wirtschaftsprüfer Wirtschaftsprüfer
(German Public Auditor) (German Public Auditor)
Ernst & Young GmbH Wirtschaftsprüfungsgesellschaft
Cologne, Germany
February 22, 2018
F-3
Consolidated income statements of Orion Engineered Carbons S.A.
for the three years ended December 31, 2017
for the three years ended December 31, 2017
|
2017
|
2016
|
2015
|
|||||||||
|
Note
|
In EUR k
|
In EUR k
|
In EUR k
|
||||||||
|
Revenue
|
(6.1)
|
1,177,210
|
|
1,030,094
|
|
1,111,776
|
|
||||
|
Cost of sales
|
(842,399
|
)
|
(691,784
|
)
|
(791,467
|
)
|
|||||
|
Gross profit
|
334,811
|
|
338,310
|
|
320,309
|
|
|||||
|
Selling expenses
|
(115,118
|
)
|
(114,553
|
)
|
(108,100
|
)
|
|||||
|
Research and development costs
|
(16,074
|
)
|
(14,530
|
)
|
(13,404
|
)
|
|||||
|
General and administrative expenses
|
(68,743
|
)
|
(68,560
|
)
|
(62,107
|
)
|
|||||
|
Other operating income
|
(6.2)
|
4,315
|
|
5,862
|
|
7,456
|
|
||||
|
Other operating expenses
|
(6.3)
|
(10,801
|
)
|
(13,817
|
)
|
(21,761
|
)
|
||||
|
Restructuring expenses
|
(6.4)
|
(4,612
|
)
|
(27,920
|
)
|
—
|
|
||||
|
Operating result (EBIT)
|
123,778
|
|
104,792
|
|
122,393
|
|
|||||
|
Finance income
|
(6.5)
|
40,424
|
|
25,145
|
|
17,275
|
|
||||
|
Finance costs
|
(6.5)
|
(77,126
|
)
|
(62,490
|
)
|
(73,448
|
)
|
||||
|
Share of profit or loss of joint ventures
|
484
|
|
419
|
|
492
|
|
|||||
|
Financial result
|
(36,218
|
)
|
(36,926
|
)
|
(55,681
|
)
|
|||||
|
Profit before income taxes
|
87,560
|
|
67,866
|
|
66,712
|
|
|||||
|
Income taxes
|
(6.6)
|
(20,737
|
)
|
(23,240
|
)
|
(23,838
|
)
|
||||
|
Profit for the period
|
66,823
|
|
44,626
|
|
42,874
|
|
|||||
|
Earnings per share (EUR per share), basic
|
(6.9)
|
1.13
|
|
0.75
|
|
0.72
|
|
||||
|
Weighted average shares, basic (in thousand of shares)
|
59,320
|
|
59,353
|
|
59,635
|
|
|||||
|
Earnings per share (EUR per share), diluted
|
1.10
|
|
0.74
|
|
0.72
|
|
|||||
|
Weighted average shares, diluted (in thousand of shares)
|
60,674
|
|
60,154
|
|
59,830
|
|
|||||
F-4
Consolidated statement of comprehensive income of Orion Engineered Carbons S.A.
for the three years ended December 31, 2017
for the three years ended December 31, 2017
|
Note
|
2017
|
2016
|
2015
|
||||||||
|
In EUR k
|
In EUR k
|
In EUR k
|
|||||||||
|
Profit for the period
|
66,823
|
|
44,626
|
|
42,874
|
|
|||||
|
Exchange differences on translation of foreign operations
|
|||||||||||
|
Change in unrealized gains/(losses)
|
(17,227
|
)
|
6,890
|
|
1,065
|
|
|||||
|
Income tax effects
|
(549
|
)
|
1,588
|
|
(369
|
)
|
|||||
|
(17,776
|
)
|
8,478
|
|
696
|
|
||||||
|
Unrealized net gains/(losses) on hedges of a net investment in a foreign operation
|
|||||||||||
|
Change in unrealized gains/(losses)
|
(9.3)
|
20,674
|
|
(5,427
|
)
|
(17,077
|
)
|
||||
|
Income tax effects
|
(6,682
|
)
|
1,599
|
|
5,674
|
|
|||||
|
13,992
|
|
(3,828
|
)
|
(11,403
|
)
|
||||||
|
Unrealized net gains/(losses) on cash flow hedges
|
|||||||||||
|
Change in unrealized gains/(losses)
|
(9.3)
|
(1,367
|
)
|
964
|
|
—
|
|
||||
|
Income tax effects
|
353
|
|
(212
|
)
|
—
|
|
|||||
|
(1,014
|
)
|
752
|
|
—
|
|
||||||
|
Net other comprehensive income (loss) to be reclassified to profit or loss in subsequent periods
|
(4,798
|
)
|
5,402
|
|
(10,707
|
)
|
|||||
|
Actuarial gains/(losses) on defined benefit plans
|
|||||||||||
|
Change in unrealized gains/(losses)
|
(7.8)
|
593
|
|
(10,574
|
)
|
1,956
|
|
||||
|
Income tax effects
|
(8
|
)
|
3,576
|
|
(609
|
)
|
|||||
|
585
|
|
(6,998
|
)
|
1,347
|
|
||||||
|
Net other comprehensive income (loss) not to be reclassified to profit or loss in subsequent periods
|
585
|
|
(6,998
|
)
|
1,347
|
|
|||||
|
Other comprehensive income (loss), net of tax
|
(4,213
|
)
|
(1,596
|
)
|
(9,360
|
)
|
|||||
|
Total comprehensive income, net of tax all attributable to equity holders of the parent
|
62,610
|
|
43,030
|
|
33,514
|
|
|||||
F-5
Consolidated statements of financial position of Orion Engineered Carbons S.A.
as at December 31, 2017 and 2016
as at December 31, 2017 and 2016
|
December 31, 2017
|
December 31, 2016
|
|||||||
|
A S S E T S
|
||||||||
|
Note
|
In EUR k
|
In EUR k
|
||||||
|
Non‑current assets
|
||||||||
|
Goodwill
|
(7.1)
|
48,512
|
|
48,512
|
|
|||
|
Other intangible assets
|
(7.1)
|
58,969
|
|
77,984
|
|
|||
|
Property, plant and equipment
|
(7.2)
|
385,332
|
|
387,727
|
|
|||
|
Investment in joint ventures
|
4,657
|
|
4,657
|
|
||||
|
Other financial assets
|
(7.3)
|
2,972
|
|
2,178
|
|
|||
|
Other assets
|
(7.5)
|
3,238
|
|
2,858
|
|
|||
|
Deferred tax assets
|
(7.11)
|
36,309
|
|
60,955
|
|
|||
|
539,989
|
|
584,871
|
|
|||||
|
Current assets
|
||||||||
|
Inventories
|
(7.4)
|
132,856
|
|
114,351
|
|
|||
|
Trade receivables
|
(7.3)
|
195,341
|
|
190,503
|
|
|||
|
Other financial assets
|
(7.3)
|
3,244
|
|
5,264
|
|
|||
|
Other assets
|
(7.5)
|
29,216
|
|
21,985
|
|
|||
|
Income tax receivables
|
(7.11)
|
13,655
|
|
7,704
|
|
|||
|
Cash and cash equivalents
|
(7.6)
|
60,272
|
|
73,907
|
|
|||
|
434,584
|
|
413,714
|
|
|||||
|
974,573
|
|
998,585
|
|
|||||
|
December 31, 2017
|
December 31, 2016
|
|||||||
|
E Q U I T Y A N D L I A B I L I T I E S
|
||||||||
|
Note
|
In EUR k
|
In EUR k
|
||||||
|
Equity
|
||||||||
|
Subscribed capital
|
(7.7)
|
59,635
|
|
59,635
|
|
|||
|
Treasury shares
|
(8.7)
|
(3,415
|
)
|
(3,415
|
)
|
|||
|
Reserves
|
(7.7)
|
(39,781
|
)
|
(47,964
|
)
|
|||
|
Profit for the period
|
(7.7)
|
66,823
|
|
44,626
|
|
|||
|
83,262
|
|
52,882
|
|
|||||
|
Non-current liabilities
|
||||||||
|
Pension provisions
|
(7.8)
|
54,524
|
|
54,736
|
|
|||
|
Other provisions
|
(7.9)
|
11,126
|
|
13,747
|
|
|||
|
Financial liabilities
|
(7.10)
|
567,581
|
|
613,659
|
|
|||
|
Other liabilities
|
5
|
|
425
|
|
||||
|
Deferred tax liabilities
|
(7.11)
|
20,946
|
|
44,557
|
|
|||
|
654,182
|
|
727,124
|
|
|||||
|
Current liabilities
|
||||||||
|
Other provisions
|
(7.9)
|
49,588
|
|
60,056
|
|
|||
|
Trade payables
|
(7.10)
|
141,436
|
|
122,913
|
|
|||
|
Other financial liabilities
|
(7.10)
|
5,848
|
|
5,465
|
|
|||
|
Income tax liabilities
|
(7.11)
|
12,956
|
|
16,759
|
|
|||
|
Other liabilities
|
27,301
|
|
13,386
|
|
||||
|
237,129
|
|
218,579
|
|
|||||
|
974,573
|
|
998,585
|
|
|||||
F-6
for the three years ended December 31,
2017
|
2017
|
2016
|
2015
|
|||||||||
|
Note
|
In EUR k
|
In EUR k
|
In EUR k
|
||||||||
|
Profit for the period
|
66,823
|
|
44,626
|
|
42,874
|
|
|||||
|
Income taxes
|
(6.6)
|
20,737
|
|
23,240
|
|
23,838
|
|
||||
|
Profit before income taxes
|
87,560
|
|
67,866
|
|
66,712
|
|
|||||
|
Depreciation and impairment of property, plant and equipment and amortization of intangible assets
|
(7.1) (7.2)
|
85,910
|
|
88,716
|
|
72,778
|
|
||||
|
Other non-cash expenses
|
8,557
|
|
3,103
|
|
957
|
|
|||||
|
(Increase)/decrease in trade receivables
|
(15,213
|
)
|
(14,059
|
)
|
46,839
|
|
|||||
|
(Increase)/decrease in inventories
|
(23,060
|
)
|
(8,227
|
)
|
25,777
|
|
|||||
|
Increase/(decrease) in trade payables
|
15,801
|
|
29,856
|
|
(28,425
|
)
|
|||||
|
Increase/(decrease) in provisions
|
(14,163
|
)
|
16,374
|
|
(8,831
|
)
|
|||||
|
Increase/(decrease) in other assets and liabilities that cannot be allocated to investing or financing activities
|
3,719
|
|
(4,338
|
)
|
(7,078
|
)
|
|||||
|
Finance income
|
(6.5)
|
(40,424
|
)
|
(25,145
|
)
|
(17,275
|
)
|
||||
|
Finance costs
|
(6.5)
|
77,126
|
|
62,490
|
|
73,448
|
|
||||
|
Cash paid for income taxes
|
(34,003
|
)
|
(17,486
|
)
|
(10,540
|
)
|
|||||
|
Cash flows from operating activities
|
151,810
|
|
199,150
|
|
214,362
|
|
|||||
|
Cash paid for the acquisition of intangible assets and property, plant and equipment
|
(80,681
|
)
|
(64,296
|
)
|
(51,541
|
)
|
|||||
|
Cash flows to acquire entities less cash acquired
|
(3)
|
—
|
|
2,126
|
|
(23,240
|
)
|
||||
|
Cash flows from investing activities
|
(80,681
|
)
|
(62,170
|
)
|
(74,781
|
)
|
|||||
|
Share buyback
|
—
|
|
(3,415
|
)
|
—
|
|
|||||
|
Proceeds from borrowings, net of transaction costs
|
9,995
|
|
—
|
|
—
|
|
|||||
|
Repayments of non-current financial liabilities
|
(26,572
|
)
|
(47,357
|
)
|
(56,825
|
)
|
|||||
|
Cash inflows related to current financial liabilities
|
10,846
|
|
7,139
|
|
—
|
|
|||||
|
Cash outflows related to current financial liabilities
|
(10,747
|
)
|
(7,139
|
)
|
(5,680
|
)
|
|||||
|
Interest and similar expenses paid
|
(37,798
|
)
|
(42,629
|
)
|
(41,894
|
)
|
|||||
|
Interest and similar income received
|
10,302
|
|
2,988
|
|
862
|
|
|||||
|
Dividends paid to shareholders
|
(40,000
|
)
|
(39,994
|
)
|
(40,000
|
)
|
|||||
|
Cash flows from financing activities
|
(83,974
|
)
|
(130,407
|
)
|
|
(143,537
|
)
|
||||
|
Change in cash
|
(12,845
|
)
|
6,573
|
|
(3,956
|
)
|
|||||
|
Change in cash resulting from exchange rate differences
|
(790
|
)
|
2,073
|
|
(1,327
|
)
|
|||||
|
Cash and cash equivalents at the beginning of the period
|
73,907
|
|
65,261
|
|
70,544
|
|
|||||
|
Cash and cash equivalents at the end of the period
|
60,272
|
|
73,907
|
|
65,261
|
|
|||||
F-7
Consolidated statements of changes in equity of Orion Engineered Carbons S.A.
for the three years ended December 31,
2017
|
In EUR k
|
Subscribed capital
|
Treasury Shares
|
Capital
reserves
|
Translation
reserve
|
Cash flow
hedge
reserve
|
Reserve for hedges of a net investment in foreign operation
|
Reserve for
actuarial
gains
(losses) on
defined
benefit plans
|
Retained
earnings
|
Total equity
|
||||||||||||
|
Number of common shares
|
Amount
|
||||||||||||||||||||
|
Note
|
(7.7)
|
(7.7)
|
(7.7)
|
(9.3)
|
(7.8)
|
||||||||||||||||
|
2015
|
As at January 1, 2015
|
59,635,126
|
|
59,635
|
|
—
|
|
159,421
|
|
18,590
|
|
—
|
|
—
|
|
(14,277
|
)
|
(168,104
|
)
|
55,265
|
|
|
Profit for the period
|
—
|
|
—
|
|
|
—
|
|
—
|
|
—
|
|
—
|
|
—
|
|
42,874
|
|
42,874
|
|
||
|
Other comprehensive income, net of tax
|
—
|
|
—
|
|
|
—
|
|
696
|
|
—
|
|
(11,403
|
)
|
1,347
|
|
—
|
|
(9,360
|
)
|
||
|
Total comprehensive income, net of tax
|
—
|
|
—
|
|
—
|
|
—
|
|
696
|
|
—
|
|
(11,403
|
)
|
1,347
|
|
42,874
|
|
33,514
|
|
|
|
Dividends paid
|
—
|
|
—
|
|
|
|
(40,000
|
)
|
—
|
|
—
|
|
—
|
|
—
|
|
—
|
|
(40,000
|
)
|
|
|
Share based payments
|
—
|
|
—
|
|
|
|
907
|
|
—
|
|
—
|
|
—
|
|
—
|
|
—
|
|
907
|
|
|
|
As at December 31, 2015
|
59,635,126
|
|
59,635
|
|
—
|
|
120,328
|
|
19,286
|
|
—
|
|
(11,403
|
)
|
(12,930
|
)
|
(125,230
|
)
|
49,686
|
|
|
|
As at January 1, 2016
|
59,635,126
|
|
59,635
|
|
—
|
|
120,328
|
|
19,286
|
|
—
|
|
(11,403
|
)
|
(12,930
|
)
|
(125,230
|
)
|
49,686
|
|
|
|
2016
|
Profit for the period
|
—
|
|
—
|
|
|
|
—
|
|
—
|
|
—
|
|
—
|
|
—
|
|
44,626
|
|
44,626
|
|
|
Other comprehensive income, net of tax
|
—
|
|
—
|
|
|
|
—
|
|
8,478
|
|
752
|
|
(3,828
|
)
|
(6,998
|
)
|
—
|
|
(1,596
|
)
|
|
|
Total comprehensive income, net of tax
|
—
|
|
—
|
|
—
|
|
—
|
|
8,478
|
|
752
|
|
(3,828
|
)
|
(6,998
|
)
|
44,626
|
|
43,030
|
|
|
|
Dividends paid
|
—
|
|
—
|
|
—
|
|
(39,994
|
)
|
—
|
|
—
|
|
—
|
|
—
|
|
—
|
|
(39,994
|
)
|
|
|
Share Buyback
|
(314,912
|
)
|
—
|
|
(3,415
|
)
|
—
|
|
—
|
|
—
|
|
—
|
|
—
|
|
—
|
|
(3,415
|
)
|
|
|
Share based payments
|
—
|
|
—
|
|
—
|
|
3,575
|
|
—
|
|
—
|
|
—
|
|
—
|
|
—
|
|
3,575
|
|
|
|
As at December 31, 2016
|
59,320,214
|
|
59,635
|
|
(3,415
|
)
|
83,909
|
|
27,764
|
|
752
|
|
(15,231
|
)
|
(19,928
|
)
|
(80,604
|
)
|
52,882
|
|
|
|
2017
|
As at January 1, 2017
|
59,320,214
|
|
59,635
|
|
(3,415
|
)
|
83,909
|
|
27,764
|
|
752
|
|
(15,231
|
)
|
(19,928
|
)
|
(80,604
|
)
|
52,882
|
|
|
Profit for the period
|
—
|
|
—
|
|
|
|
—
|
|
—
|
|
—
|
|
—
|
|
—
|
|
66,823
|
|
66,823
|
|
|
|
Other comprehensive income, net of tax
|
—
|
|
—
|
|
|
|
—
|
|
(17,776
|
)
|
(1,014
|
)
|
13,992
|
|
585
|
|
—
|
|
(4,213
|
)
|
|
|
Total comprehensive income, net of tax
|
—
|
|
—
|
|
—
|
|
—
|
|
(17,776
|
)
|
(1,014
|
)
|
13,992
|
|
585
|
|
66,823
|
|
62,610
|
|
|
|
Dividends paid
|
|
|
|
|
|
|
(40,000
|
)
|
—
|
|
—
|
|
—
|
|
—
|
|
—
|
|
(40,000
|
)
|
|
|
Share based payments
|
—
|
|
—
|
|
—
|
|
7,770
|
|
—
|
|
—
|
|
—
|
|
—
|
|
—
|
|
7,770
|
|
|
|
As at December 31, 2017
|
59,320,214
|
|
59,635
|
|
(3,415
|
)
|
51,679
|
|
9,988
|
|
(262
|
)
|
(1,239
|
)
|
(19,343
|
)
|
(13,781
|
)
|
83,262
|
|
|
F-8
Notes to the consolidated financial statements of Orion Engineered Carbons S.A. as at December 31,
2017
and
2016
and for the three years ended December 31,
2017
|
(1)
|
Organization and principal activities
|
|||
|
(2)
|
Basis of preparation of the financial statements
|
|||
|
(2.1)
|
Compliance with IFRS
|
|||
|
(2.2)
|
New accounting standards
|
|||
|
(2.3)
|
Basis of consolidation
|
|||
|
(2.4)
|
Currency translation
|
|||
|
(2.5)
|
Significant accounting policies
|
|||
|
(3)
|
Assumptions, the use of judgment and accounting estimates
|
|||
|
(4)
|
List of shareholdings
|
|||
|
(5)
|
Operating segments
|
|||
|
(6)
|
Notes to income statement
|
|||
|
(6.1)
|
Revenue
|
|||
|
(6.2)
|
Other operating income
|
|||
|
(6.3)
|
Other operating expenses
|
|||
|
(6.4)
|
Restructuring expenses
|
|||
|
(6.5)
|
Finance income and costs
|
|||
|
(6.6)
|
Income taxes
|
|||
|
(6.7)
|
Additional income statement information
|
|||
|
(6.8)
|
Share based payments
|
|||
|
(6.9)
|
||||
|
(7)
|
Notes to the statement of financial position
|
|||
|
(7.1)
|
Goodwill and other intangible assets
|
|||
|
(7.2)
|
Property, plant and equipment
|
|||
|
(7.3)
|
Trade receivables, other financial assets
|
|||
|
(7.4)
|
Inventories
|
|||
|
(7.5)
|
Other assets
|
|||
|
(7.6)
|
Cash and cash equivalents
|
|||
|
(7.7)
|
Equity
|
|||
|
(7.8)
|
Pension provisions and post-retirement benefits
|
|||
|
(7.9)
|
Other provisions
|
|||
|
(7.10)
|
Trade payables, other financial liabilities
|
|||
|
(7.11)
|
Deferred and current taxes
|
|||
|
(8)
|
Notes to the statement of cash flows
|
|||
|
(9)
|
Other notes
|
|||
F-9
F-10
(1)
Organization and principal activities
Orion Engineered Carbons S.A. (“Orion”) is entered in the commercial register of Luxembourg under no. B160558; the Company’s registered office is in Luxembourg; its business address is 6, Route de Trèves, L-2633 Senningerberg (Municipality of Niederanven), Grand Duchy of Luxembourg. Orion was incorporated on April 13, 2011.
Orion’s consolidated financial statements comprise Orion and its subsidiaries (the “Orion Group”, or the “Group” or the “Company”). The parent’s fiscal year is the same as that of the Orion Group, comprising the period from January 1 to
December 31, 2017
.
Orion Group is a leading global manufacturer of carbon black products and is based in Luxembourg. Carbon black is a powdered form of carbon that is used to create the desired physical, electrical and optical qualities of various materials. Carbon black products are primarily used as consumables and additives for the production of polymers, printing inks and coatings (“Specialty Carbon Black” or “Specialties”) and in the reinforcement of rubber polymers (“Rubber Carbon Black” or “Rubber”).
Specialty Carbon Black are high-tech materials which are mainly used for polymers, printing systems and coatings applications. The various production processes result in a wide range of different Specialty Carbon Black pigment grades with respect to their primary particle size, structure and surface area/surface chemistry. These parameters affect jetness, tinting strength, undertone, dispersibility, oil absorption, electrical conductivity and other characteristics.
The types of Rubber Carbon Black used in the rubber industry are manufactured according to strict specifications and quality standards. Structure and specific surface area are the key factors in optimizing reinforcement properties in rubber polymers.
As at
December 31, 2017
, the Orion Group operates
13
wholly owned production facilities in Europe, North and South America, Asia and South Africa and
three
sales companies
. Another
ten
holding companies and
two
service companies, as well as
two
former operating entities in Portugal and France (currently in dissolution), are consolidated in the Orion Group. Additionally, the Group operates a joint venture with
one
production facility in Germany.
The Group’s global presence enables it to supply Specialty Carbon Black customers as well as international customers in the tire and rubber industry with the full range of carbon black grades and particle sizes. Sales activities are supported by sales and representative offices all around the globe. Integrated sales activities with key account managers and customer services are carried out in the United States, Brazil, South Korea and Germany and China.
The Group’s consolidated financial statements are prepared in Euros, the presentation currency of the Group. Except where stated otherwise, all figures are presented in thousands of Euros (EUR k). Due to rounding, numbers presented throughout the tables and these notes may not add up precisely to the totals presented and percentages may not precisely reflect the absolute figures.
The Group’s audited consolidated financial statements were authorized for issue by the board of directors on
February 22, 2018
.
|
(2)
|
Basis of preparation of the financial statements
|
|
(2.1)
|
Compliance with IFRS
|
The Group’s financial statements are prepared in accordance with International Financial Reporting Standards (“IFRS”) as issued by the International Accounting Standards Board (“IASB”). All IFRSs, interpretations (IFRICs, SICs) originated by the IFRS Interpretations Committee (IFRS IC, formerly International Financial Reporting Interpretations Committee) applicable for financial years ended on or before
December 31, 2017
have been applied.
The accounting policies and the presentation of items in the consolidated financial statements are applied consistently throughout the Group.
F-11
|
(2.2)
|
New accounting standards
|
First-time adoption of accounting standards
The accounting policies adopted in the preparation of the consolidated financial statements are consistent with those followed in the preparation of the Group’s annual financial statements for the year ended December 31, 2016. The following amendments to IFRS standards adopted on January 1, 2017 did not have material impact on the accounting policies, financial position or performance of the Group:
• IAS 7 Statement of Cash Flow
As part of its disclosure initiative, the IASB published in January 2016 amendments to IAS 7 Statement of Cash Flow which requires a reconciliation of balance sheet movements for all liabilities for which cash flows are disclosed as
“
Cash flows from financing activities
”
. The adoption of the amendment is reflected in the disclosures for the Group (for details see note
(9.3)
).
•
Improvements to IFRSs (2014-2016 cycle)
In December 2016, the IASB issued a cycle of Annual Improvements to IFRSs (cycle 2014-2016) that contains three changes to three standards, primarily related to minor amendments that clarify, correct or remove redundant wording and a narrow-scope amendment to clarify particular aspects of a Standard. These changes with respect to IFRS 12 had no significant effect on the Group's financial statements, improvements with respect to IFRS 1 and IAS 28 are not yet effective and will not have any impact on the Group's financial statements.
•
Amendments to IAS 12 Income Taxes
In January 2016, the IASB issued final amendments to IAS 12 Income Taxes. The amendments consist of some clarifying paragraphs and an illustrating example with respect to the recognition of deferred tax assets that are related to debt instrument measured at fair value. These changes had no impact on the Group's financial statements.
Accounting standards issued but not yet effective
The IASB has issued accounting standards which were not yet effective in the current fiscal year. Any new accounting standards which are relevant for the Group’s consolidated financial statements will be adopted when they become effective.
The following relevant pronouncements by the IASB and IFRSIC were not effective as at the reporting date on
December 31, 2017
and were not applied by the Group:
|
•
|
IFRS 9 Financial instruments
|
IFRS 9 issued on July 24, 2014 replaces IAS 39 Financial Instruments: Recognition and Measurement. IFRS 9 determines requirements for recognition and measurement, impairment, derecognition and general hedge accounting. The latest issued version supersedes all previous versions. IFRS 9 will be effective as of January 1, 2018.
The adoption of IFRS 9 will have an effect on the classification and measurement of certain of Orion’s financial instruments and potentially may impact the hedge accounting models used by the Group. The impact from the new impairment approach outlined in section 5.4 of IFRS 9 would have resulted in a recognition of a loss allowance at an amount equal to lifetime expected credit losses for trade receivables of less than EUR
1 million
at December 31, 2017.
In July 2017 the IASB clarified the accounting treatment for modification of financial liabilities under IFRS 9. A modification gains or loss is required to be calculated as the difference between the original contractual cash flows and the modified cash flows discounted at the original effective interest rate. Such modification gain or loss is recognized in the Income Statement in the period of modification, and the modified cash flows are then amortized using the new effective interest rate.
IFRS 9 is generally required to be applied retrospectively; however the recognition of a modification gain or loss for historic modifications made to financial liabilities outstanding on the adoption date is recorded as an accumulative catch up adjustment in retained earnings on the adoption date. The Group is currently assessing the impact of such historic modifications of the Group's financial liabilities on its financial statements and this will be completed within the first quarter of 2018.
F-12
• IFRS 15 Revenue from contracts with customers
The IASB issued IFRS 15 on May 28, 2014. IFRS 15 intends to combine and harmonize the revenue recognition methods issued in several standards and interpretations. IFRS 15 also determines the time and extent of revenue recognition. IFRS 15 replaces IAS 18 Revenue, IAS 11 Construction Contracts, IFRIC 13 Customer Loyalty Programs, IFRIC 15 Agreements for Construction of Real Estate, IFRIC 18 Transfer of Assets from Customers and SIC 31 Revenue-Barter Transactions. IFRS 15 will be effective as of January 1, 2018. The company have completed a group wide review of our material contracts with our customers. The changes will not impact our revenue recognition. Our performance obligation is almost entirely the transfer of goods. In a limited number of cases the service to ship goods to our customers may qualify as a separate performance obligation while the price of such ancillary services are deemed to be immaterial and the realization of such services usually occurs at same point of time as the transfer of our main performance obligation. As the changes have no impact on our revenue recognition there will be no cumulative catch up adjustment recorded in retained earnings under the modified retrospective approach of adoption that we intend to apply.
• IFRS 16 Leases
In January 2016, the IASB issued the new standard IFRS 16 “Leases”, which supersedes the existing lease accounting according to IAS 17. The existing concept of operating and finance leases will be replaced and most leases will be recognized in the statement of financial position. IFRS 16 will be effective as of January 1, 2019.
The Group has operating lease contracts as well as very limited finance leases and the new standard will have an impact on Group accounting policies, procedures as well as financial statements and our key performance indicators. The Group has started to analyze the impact of IFRS 16. Refer to note
(9.5)
Contingent liabilities and other financial obligations for details of our current lease obligations on an undiscounted basis. While the Group has not finalized our assessment, according to the provisions of the Standard, the right–to-use leased assets that do not meet the exemption criteria will increase our Property, plant and equipment and will result in the recognition of a corresponding lease obligation based on the existing contracts at the transition date. The exemption criteria will be applicable in rare cases In
2017
we recorded €
8.6 million
as operating lease expenses. The Group estimates that a comparable amount of expenses will in the future be recorded as amortization and to a certain amount as finance expenses.
•
IFRIC 23
On 7 June 2017, the IASB issued IFRIC Interpretation 23 — Uncertainty over Income Tax Treatments. This interpretation clarifies application of recognition and measurement requirements in IAS 12 Income Taxes when there is uncertainty over income tax treatments. It provides guidance on considering uncertain tax treatments separately or together, examination by tax authorities, the appropriate method to reflect uncertainty and accounting for changes in facts and circumstances. The interpretation is effective for annual reporting periods beginning on or after 1 January 2019, but certain transition reliefs are available. The Group currently assesses the impact of the application of IFRIC 23 on the group's financial statements.
|
(2.3)
|
Basis of consolidation
|
All subsidiaries indirectly or directly controlled by Orion are consolidated. Entities are consolidated from the date the Orion Group obtains control, which generally is the acquisition date, and are deconsolidated when control is lost.
Control is achieved when the Orion Group is exposed, or has the right, to variable returns from its involvement with the investee and has the ability to affect those returns through its power over the investee. The Orion Group re-assesses whether or not it controls an investee if facts and circumstances indicate that there are changes to one or more of these three elements of control.
The Orion Group consolidated financial statements are prepared in accordance with uniform accounting policies. Income and expenses, intercompany profits and losses, and receivables and liabilities between consolidated subsidiaries are eliminated.
Changes in the ownership interest of a subsidiary, without a loss of control, is accounted for as an equity transaction. See note
(4)
List of shareholdings for the list of subsidiaries consolidated as part of the Orion Group.
|
(2.4)
|
Currency translation
|
Foreign currency transactions are measured at the exchange rate at the date of initial recognition. Any gains or losses resulting from the valuation of foreign currency monetary assets and liabilities using the currency exchange rates as at the
F-13
reporting date are recognized in other operating income or other operating expenses. Currency exchange differences relating to financing activities are part of the financial result.
The functional currency method is used to translate the financial statements of foreign entities. The assets and liabilities of foreign operations with functional currencies different from the presentation currency Euro are translated using closing rates as at the reporting date. Income and expense items are translated at average exchange rates for the respective period. The translation of equity is performed using historical exchange rates. The overall foreign currency impact from translating the statement of financial position and income statement of all the foreign entities is recognized in other comprehensive income.
The following exchange rates were used for currency translation:
|
EUR 1 equivalent to
|
Annual average exchange rate
|
Closing rate as at Dec 31,
|
||||||||
|
2017
|
2016
|
2015
|
2017
|
2016
|
||||||
|
U.S. Dollar (USD)
|
1.1297
|
|
1.1069
|
|
1.1130
|
|
1.1993
|
|
1.0541
|
|
|
Pound Sterling (GBP)
|
0.8767
|
|
0.8195
|
|
0.7284
|
|
0.8872
|
|
0.8562
|
|
|
Japanese Yen (JPY)
|
126.7112
|
|
120.1967
|
|
134.5231
|
|
135.0100
|
|
123.4000
|
|
|
Swedish Krona (SEK)
|
9.6351
|
|
9.4689
|
|
9.3414
|
|
9.8438
|
|
9.5525
|
|
|
Singapore Dollar (SGD)
|
1.5588
|
|
1.5275
|
|
1.5288
|
|
1.6024
|
|
1.5234
|
|
|
South African Rand (ZAR)
|
15.0490
|
|
16.2645
|
|
14.2616
|
|
14.8054
|
|
14.4570
|
|
|
Polish Zloty (PLN)
|
4.2570
|
|
4.3632
|
|
4.1909
|
|
4.1770
|
|
4.4103
|
|
|
Brazilian Real (BRL)
|
3.6054
|
|
3.8561
|
|
3.7024
|
|
3.9729
|
|
3.4305
|
|
|
South Korean Won (KRW)
|
1,276.7381
|
|
1,284.1811
|
|
1,259.6731
|
|
1,279.6100
|
|
1,269.3600
|
|
|
Chinese Renminbi (CNY)
|
7.6290
|
|
7.3522
|
|
6.9924
|
|
7.8044
|
|
7.3202
|
|
|
(2.5)
|
Significant accounting policies
|
Amounts in the financial statements are measured at amortized/depreciated historical cost, except for derivatives and certain primary financial instruments, which are measured at fair value in accordance with the relevant standards, as described below. The accounting policies below apply to the Group.
Revenue and expense recognition
|
(a)
|
Revenue and income recognition and related accounts receivable
|
Revenue from the sale of goods and services generated through ordinary activities and other income are recognized as follows:
The Group mainly generates sales by selling carbon black to industrial customers for further processing. Revenue recognition and measurement is governed by the following principles. The amount of revenue is contractually specified between the parties and is measured at the fair value of the consideration received or to be received less value-added tax and any trade discounts and volume rebates granted.
Revenue is only recognized if revenue and the related costs incurred or to be incurred can be measured reliably and it is sufficiently probable that the economic benefits will flow to the Group. If these conditions are satisfied, revenue from the sale of goods is recognized when ownership and the associated risks from the sale have been transferred to the buyer. The timing of the transfer of risks and rewards varies depending on the individual terms of the sales agreement. The Group records a provision for warranty costs, based on historical trends of warranty costs incurred as a percentage of sales, which management has determined to be a reasonable estimate of the probable losses to be incurred for warranty claims in a period.
Interest income is recognized using the effective interest method.
|
(b)
|
Expense recognition
|
Expenses are recognized in the period in which they are incurred.
Interest expenses are recognized using the effective interest method.
Business combinations, goodwill and intangible assets
F-14
Business combinations are accounted for using the acquisition method. The cost of an acquisition is measured as the aggregate of the consideration transferred, which is measured at acquisition date fair value, and the amount of any non-controlling interests in the acquiree. For each business combination, the Group elects whether to measure the non-controlling interests in the acquiree at fair value or at the proportionate share of the acquiree’s identifiable net assets. Acquisition-related costs are expensed as incurred and included in other operating expenses.
When the Group acquires a business, it assesses the financial assets and liabilities assumed for appropriate classification and designation in accordance with the contractual terms, economic circumstances and pertinent conditions as at the acquisition date. This includes the separation of embedded derivatives in host contracts by the acquiree.
Any contingent consideration to be transferred by the acquirer is recognized at fair value at the acquisition date. Contingent consideration classified as an asset or liability that is a financial instrument and within the scope of IAS 39 Financial Instruments: Recognition and Measurement, is measured at fair value with the changes in fair value recognized in the statement of profit or loss.
Goodwill is initially measured at cost (being the excess of the aggregate of i) the consideration transferred, ii) the amount recognized for non–controlling interest and iii) any previous interest held over the net assets acquired, over the fair value of the identifiable assets acquired and liabilities assumed). If the fair value of the net assets acquired is in excess of the aggregate consideration transferred, the Group re-assesses whether it has correctly identified all of the assets acquired and all of the liabilities assumed and reviews the procedures used to measure the amounts to be recognized at the acquisition date. If the reassessment still results in an excess of the fair value of net assets acquired over the aggregate consideration transferred, then the gain is recognized in profit or loss.
After initial recognition, goodwill is measured at cost less any accumulated impairment losses. For the purpose of impairment testing, goodwill acquired in a business combination is, from the acquisition date, allocated to each of the Group’s cash-generating units that are expected to benefit from the combination, irrespective of whether other assets or liabilities of the acquiree are assigned to those units.
Where goodwill has been allocated to a cash-generating unit (“CGU”) and part of the operation within that unit is disposed of, the goodwill associated with the disposed operation is included in the carrying amount of the operation when determining the gain or loss on disposal. Goodwill disposed in these circumstances is measured based on the relative values of the disposed operation and the portion of the cash-generating unit retained.
Intangible assets acquired separately are recognized initially at cost. The cost of intangible assets acquired in a business combination is their fair value at the date of acquisition.
Intangible assets with finite useful lives are amortized and, if events or changes in circumstances indicate that the carrying amount of an asset may not be recoverable, tested for impairment, see below in this note under “Impairment test”. Intangible assets with indefinite useful lives are not amortized, but are tested for impairment at least once a year. The useful lives of intangible assets are also re-assessed once a year.
(a) Goodwill
Goodwill has an indefinite useful life and is tested for impairment at least once a year.
(b) Technology and patents, trademarks and other intangible assets
Technology and patents (including capitalized development costs), trademarks and other intangible assets are amortized straight line over a useful life of
15
years. Other intangible assets are amortized straight line over a useful life of
3
to
10
years.
Customer relationships acquired in the business combination in 2011 from Evonik are amortized over their useful life. The useful life is estimated on the basis of contractual arrangements and historical values and is approximately
8
years. The amortization amount is based on the economic life and the probability of continuing the customer relationship in the form of a churn rate.
Property, plant and equipment
Property, plant and equipment are carried at historical acquisition or production cost less accumulated depreciation. If events or changes in circumstances indicate that the carrying amount of an asset may not be recoverable, an impairment test is conducted as outlined in this section under “Impairment test”.
The cost of acquisition includes the purchase price and any costs directly attributable in bringing the asset to the location and condition necessary for it to be capable of operating in the manner intended. The cost of self-constructed assets within the Group includes the direct cost of materials and labor, plus the applicable proportion of material and manufacturing
F-15
overheads, including depreciation. Costs relating to obligations to dismantle or remove non-current assets at the end of their useful life are capitalized as acquisition or production costs at the time of acquisition or production.
Property, plant and equipment are depreciated using the straight-line method over the expected remaining useful life. The expected remaining useful lives are determined based upon the point at which an asset is acquired. In certain cases, assets acquired were nearing the end of their useful life, resulting in a shorter period by comparison to those properties acquired new. There is no significant difference in the types of assets that have shorter useful lives (for example 5 years for a building or 3 years for plant and machinery) as compared to the entire asset class. The assets’ residual values and useful lives are reviewed and adjusted if appropriate, at the end of each reporting period.
|
In years
|
|
|
Buildings
|
5-50
|
|
Plant and machinery
|
3-25
|
|
Furniture, fixtures and office equipment
|
3-25
|
For further information on the expected remaining useful life of the existing assets as at December 31,
2017
see note
(7.2)
Property, plant and equipment
.
Expenses for overhauls and major servicing (major repairs) are generally capitalized if it is probable that they will result in future economic benefits from an existing asset. They are then depreciated over the period until the next expected major repair date. Routine repairs and other maintenance work are expensed in the period in which they are incurred.
If major components of an asset have different useful lives, they are recognized and depreciated separately.
Gains and losses from the disposal of property, plant and equipment are calculated as the difference between the net proceeds of sale and the carrying amount and recognized in other operating income or other operating expenses.
Impairment test
Impairment of property, plant and equipment and other intangible assets with finite useful lives
The Group assesses property, plant and equipment and other intangible assets with finite useful lives for impairment whenever events or changes in circumstances indicate that the carrying amount of an asset or CGU may not be recoverable. If assets or CGUs are determined to be impaired, the carrying amount of these assets or CGUs is written down to their recoverable amount, which is the higher of fair value less costs to sell and value in use determined as the amount of estimated discounted future cash flows. Recoverable amount is determined for an individual asset, unless the asset does not generate cash inflows that are largely independent of those from other assets or groups of assets. For this purpose, assets are grouped based on separately identifiable and largely independent cash flows.
A previously recognized impairment loss is reversed only if there has been a change in the assumptions used to determine the asset’s recoverable amount since the last impairment loss was recognized. The reversal is limited so that the carrying amount of the asset or CGU does not exceed its recoverable amount, nor exceed the carrying amount that would have been determined, net of depreciation, had no impairment loss been recognized for the asset in prior years. Such reversal is recognized in the income statement.
Impairment of goodwill
Goodwill is not amortized, but instead tested for impairment annually in the fourth quarter based on September 30 actual results, as well as whenever there are events or changes in circumstances (triggering events) which suggest that the carrying amount may not be recoverable.
CGUs may be combined into a group of CGUs when they have similar economic characteristics. For the purpose of testing goodwill for impairment, goodwill is allocated pursuant to IAS 36 to the CGU or group of CGUs that represents the lowest level within the entity at which the goodwill is monitored by management and is not larger than an operating segment within the meaning of IFRS 8. At the date of the annual impairment test Orion had
two
groups of CGUs to which the goodwill was allocated. Goodwill impairment testing was performed at the level of the
two
groups of CGUs, “Rubber” and “Specialties” representing the
two
operating segments. These
two
groups were defined as lowest level within Orion at which goodwill is monitored, because Orion has the possibility to switch capacities as well as products between its various locations within each group.
F-16
If the carrying amount of one of the cash generating units exceeds its recoverable amount, an impairment loss on goodwill is recognized accordingly. The recoverable amount is the higher of the CGU’s fair value less cost to sell and its value in use. Impairment losses on goodwill are not reversed in future periods if the recoverable amount exceeds the carrying amount.
Value in use is determined by calculating the future cash flows to be derived from the continuing use of the operating assets of the cash-generating unit using the discounted cash flow (“DCF”) method. The DCF method is applied by first calculating the free cash flows to be derived from the relevant cash-generating unit and then discounting them as at the reporting date using a risk-adequate discount rate.
The discount rate is based on the specific circumstances of the Group and its operating segments and is derived from its weighted average cost of capital (“WACC”). The WACC takes into account both debt and equity.
The cost of equity is derived from the expected return on investment by the Group’s investors, which is derived from a peer group. The cost of debt is based on standard market borrowing rates for peer group companies. Segment-specific risk is incorporated by applying individual beta factors which lead to segment-specific WACC. The beta factors are determined annually based on publicly available market data.
Investments in joint ventures
A joint venture is a type of joint arrangement whereby the parties that have joint control of the arrangement have rights to the net assets of the joint venture. Joint control is the contractually agreed sharing of control of an arrangement, which exists only when decisions about the relevant activities require unanimous consent of the parties sharing control.
Investments in joint ventures are accounted for using the equity method.
Under the equity method, the investment in a joint venture is initially recognized at cost. Cost includes all directly attributable acquisition-related costs. The concepts underlying the procedures in accounting for the acquisition of a subsidiary are also adopted in accounting for the acquisition of an investment in a joint venture. Goodwill relating to the joint venture is included in the carrying amount of the investment and is neither amortized nor individually tested for impairment.
The carrying amount of the investment is adjusted to recognize changes in the Group’s share of net assets of the joint venture since the acquisition date. Distributions received from the investee reduce the carrying amount of the investment.
The Group’s income statement reflects the Group’s share of the results of operations of the joint venture. Any change in other comprehensive income (“OCI”) of those investees is presented as part of OCI. In addition, when there has been a change recognized directly in the equity of the joint venture, the Group recognizes its share of such change, when applicable, in the statement of changes in equity. Unrealized gains and losses resulting from transactions between the Group and the joint venture are eliminated to the extent of the interest in the joint venture.
The financial statements of the joint venture are prepared for the same reporting period as the Group. When necessary, adjustments are made to bring the accounting policies in line with those of the Group.
After application of the equity method, the Group determines whether it is necessary to recognize an impairment loss on the investment in its joint venture. At each reporting date, the Group determines whether there is objective evidence that the investment in the joint venture is impaired. If there is such evidence, the Group calculates the amount of impairment as the difference between the recoverable amount of the joint venture and its carrying value and recognizes the loss in the Group’s combined income statement.
Inventories
The cost of inventories (raw materials, consumables and supplies, and merchandise) that have a similar nature or use is assigned by using the weighted average cost method. The cost of work in process and finished goods comprises the cost of raw materials, consumables and supplies (direct materials costs), direct personnel expenses (direct production costs), other direct costs and overheads attributable to production (based on normal operating capacity).
Inventory is reviewed for both potential obsolescence and potential loss of value periodically. In this review, assumptions are made about the future demand for, and market value of, the inventory and based on these assumptions the amount of any obsolete, unmarketable or slow moving inventory is estimated.
Cash and cash equivalents
Cash and cash equivalents comprise bank balances, checks and cash on hand.
F-17
Pension provisions
Pension provisions are measured in accordance with the projected unit credit method prescribed in IAS 19 Employee Benefits for defined benefit plans. This method takes into account the pensions known and expectancies earned by the employees as at the reporting date as well as the increases in salaries and pensions to be expected in the future.
The provisions for the German entities of the Group are measured on the basis of the biometric data in the 2005G mortality tables by Klaus Heubeck. Pension obligations outside Germany are determined in accordance with actuarial parameters applicable to such plans.
Actuarial gains and losses arise from the difference between the previously expected and the actual obligation parameters at year-end.
Actuarial gains and losses, net of tax, for the defined benefit plan are recognized in full in the period in which they occur in other comprehensive income and are not reclassified to profit or loss in subsequent periods.
The discount rate applied is determined based on a yield curve considering interest rates of corporate bonds with at least AA rating in the currencies consistent with the currencies of the post-employment obligation (e.g. iBoxx € Corporates AA sub-indices) as set by an internationally acknowledged actuarial agency. The interest rate is extrapolated as needed along the yield curve to meet the expected term of our obligation. Assumptions are reviewed each reporting period.
Net interest is calculated by applying the discount rate to the net defined benefit liability or asset. Changes in the net defined benefit obligation from service costs comprising current service costs, past-service costs, gains and losses on curtailments are recorded in cost of sales, administration expenses or selling and distribution expenses and the net interest expense or income is recorded in finance costs and finance income.
Defined contribution obligations result in an expense in the period in which payment is made and arise from commitments and state pension schemes (statutory pension insurance).
Other provisions
Provisions are liabilities of uncertain timing or amount. They are recognized if a present obligation (legal or constructive) exists toward a third party as a result of a past event which will probably result in a future outflow of resources. The probable amount of the obligation must be reliably measurable.
If there are a number of similar obligations, the probability that there will be an outflow of economic benefits is determined by considering the class of obligations as a whole.
Provisions are recognized at their settlement value, which represents the best estimate of the expected outflow of economic benefits, and take future cost increases into account. Non-current provisions are discounted. Current provisions and current portions of non-current provisions are not discounted. Provisions are subsequently updated to reflect new facts and circumstances.
Restructuring provisions are recognized only when the recognition criteria for provisions are fulfilled. A constructive obligation for severance obligation exists when the main features of a detailed formal plan that identifies the business or part of the business concerned, the location and number of employees affected, a detailed estimate of the associated costs and an appropriate time line, has been communicated to the employees affected. Other costs related to the restructuring are recognized when obligation criteria are met and the costs can be reliably measured.
If the effect of the time value of money is material, provisions are discounted using a current pre-tax rate that reflects when appropriate, the risks specific to the liability. When discounting is used, the increase in the provision due to the passage of time is recognized as a finance cost.
Regarding part-time early retirement agreements the Group uses the block model. During the first block the employee works fulltime. After completing the first block, the employee retires early, which reflects the second block. However, the employee receives a reduced remuneration for the entire period of the agreement. The early retirement scheme is considered a long-term employee benefit that is measured using the projected unit method and past service costs are considered in determining the respective obligation.
F-18
Deferred taxes and current income taxes
Current income tax receivables and liabilities are measured at the amount expected to be recovered from or paid to the taxation authorities. They are calculated based on the tax rates and tax laws that are enacted or substantively enacted by the reporting date.
In accordance with IAS 12 Income Taxes, deferred taxes are determined using the liability method on temporary differences between the carrying amounts of assets and liabilities in the statement of financial position and their tax bases including differences arising as a result of consolidation as well as on loss and interest carryforwards and tax credits. They are measured at the tax rates that are expected to apply in the year when the asset is realized or the liability is settled, based on tax rates and tax laws that have been enacted or substantively enacted by the end of the reporting period.
Deferred tax assets are initially recognized only to the extent it is probable that sufficient taxable profit will be available in the future to allow the benefit of part or all of the deferred tax assets to be utilized and their carrying amounts are subsequently reviewed at the end of each reporting period and reduced to the extent that the utilization is no longer probable. Unrecognized deferred tax assets are re-assessed at each reporting date and are recognized to the extent that the utilization has become probable.
Income taxes relating to items recognized directly in equity are recognized in equity and not in the income statement.
Deferred tax assets and deferred tax liabilities are offset if there is a legally enforceable right to set off a current tax asset against a current tax liability when they relate to income taxes levied by the same taxation authority.
Deferred tax assets and liabilities are recognized for all taxable temporary differences, except when the deferred tax asset or liability arises from the initial recognition of goodwill or an asset or liability in a transaction that is not a business combination and, at the time of the transaction, affects neither the accounting profit nor taxable profit or loss.
Financial instruments
A financial instrument is any contractual right or obligation that gives rise to a financial asset of one entity and a financial liability or equity instrument of another entity. They are recognized in the statement of financial position under financial assets or liabilities and trade receivables or payables.
When initially recognized, financial instruments are measured at fair value. In the case of financial instruments not measured subsequently at fair value through profit or loss, transaction costs that are directly attributable to their acquisition are also included.
Subsequent measurement depends on the classification of the financial instruments; non-current financial assets not measured at fair value are recognized at amortized cost using the effective interest method. The effective interest rate includes all attributable charges that represent interest.
A distinction is made between primary and derivative financial instruments.
|
(a)
|
Primary financial instruments
|
Primary financial assets
Primary financial assets are accounted for as loans and receivables in accordance with IAS 39.
Loans and receivables are non-derivative financial assets with fixed or determinable payments that are not quoted in an active market. After initial measurement, such financial assets are subsequently measured at amortized cost using the effective interest rate (“EIR”) method, less impairment if applicable and indicated. Financial assets are derecognized if the contractual rights to receive payments have expired or have been transferred and the Group has substantially transferred all risks and rewards incidental to ownership.
Loans and receivables mainly comprise trade receivables and loans. Such assets are measured initially at fair value and subsequently at amortized cost using the effective interest method. If there is any objective evidence (triggering event) that the settlement values due will not be fully collectible in the normal course of business, an impairment loss is charged. The amount of the impairment loss is based on historical values and is measured as the difference between the asset’s carrying amount and the present value of estimated future cash flows calculated using the effective interest rate.
Impairment losses are recognized in the income statement. If the cause of the impairment loss no longer exists, the impairment loss is reversed through profit or loss to a maximum of the asset’s amortized cost.
F-19
Primary financial liabilities
Primary financial liabilities are classified as “at amortized cost” and are measured at amortized cost in accordance with the effective interest method. Financial liabilities are derecognized when they have been settled, i.e., when the obligations have been fulfilled, canceled or have expired.
Non-current financial instruments which do not bear interest at market rates are initially measured at fair value. Fair value is determined by discounting the expected cash flows as at acquisition date using the effective interest rate (present value).
(b)
Derivative financial instruments
Derivative financial instruments (derivatives) are used to hedge exchange rate, commodity and interest rate risks. Hedging instruments in the form of forward exchange contracts and interest rate derivatives are accounted for, and are recognized initially as at the trade date and are subsequently remeasured at fair value. If there is no quoted price in an active market for a derivative, its fair value is determined using financial valuation models. Forward exchange contracts are valued using the forward exchange rate on the reporting date.
Derivative financial instruments not qualifying as hedging instruments are recognized at fair value through profit or loss and are classified as held for trading.
(c)
Hedge accounting
Within the Group, all hedging relationships except the net investment hedge are cash flow hedges. The purpose of cash flow hedges is to hedge the exposure to variability in future cash flows from a recognized asset or liability or a highly probable forecast transaction.
In 2016 the Group has entered into commodity derivative agreements to hedge the price fluctuations of certain carbon black oil purchases and the related indexed sales which are designated as cash flow hedges to hedge the impact of raw material price fluctuations on cost of sales for specific sales. The effective portion of the change in fair value of the derivative is recorded in accumulated other comprehensive income until revenues and hence cost of sales are recorded for the specific sales.
A hedge of a net investment in a foreign operation is a foreign currency financial instrument used to hedge future changes in currency exposure of a foreign operation denominated in that same foreign currency. For financial instruments that qualify as a hedge of a net investment in foreign operations, the effective portion of the change in fair value of the hedging instrument is recorded in accumulated other comprehensive income. Any ineffective portion of the net investment hedge is recognized in finance result in the income statement during the period of change. On the disposal of the foreign operation, the cumulative value of any such gains and losses recorded in equity is transferred to profit and loss.
The Group uses a portion of its U.S. Dollar term loan as a hedge of its exposure to foreign exchange risk on its investments in foreign subsidiaries. Refer to note
(9.2)
Additional disclosures on financial instruments for more details.
A hedging relationship must meet certain criteria to qualify for hedge accounting. At the inception of a hedge relationship, the Group formally designates and documents the hedge relationship to which it wishes to apply hedge accounting and the risk management objective and strategy for undertaking the hedge. Detailed documentation of the hedging relationship includes identification of the hedging instrument, the hedged item, the nature of the risk being hedged and how the Group asses the expected and actual effectiveness of the hedge (hedge accounting requires effectivity between 80% and 125%). Hedge accounting must be discontinued when these conditions are no longer met. In the case of cash flow hedges, hedge accounting must also be discontinued when the forecast transaction is no longer probable, in which case any amount that has been recognized in other comprehensive income is reclassified from equity to profit or loss.
Changes in the fair value of the effective portion of hedging instruments are recognized in other comprehensive income. The ineffective portion of the changes in fair value is recognized in the income statement. Amounts recognized in other comprehensive income are reclassified to the income statement as soon as the hedged item is recognized in the income statement.
When the hedged item is the cost of a non-financial asset or non-financial liability, the amounts recognized as other comprehensive income are transferred to the initial carrying amount of the non-financial asset or liability.
F-20
Fair value measurement
The Group measures financial instruments, such as derivatives, at fair value at each balance sheet date. Also, fair values of financial instruments measured at amortized cost are disclosed. Fair value is the price that would be received to sell an asset or paid to transfer a liability in an orderly transaction between market participants at the measurement date. The fair value of an asset or a liability is measured using the assumptions that market participants would use when pricing the asset or liability, assuming that market participants act in their economic best interest. The Group uses valuation techniques that are appropriate in the circumstances and for which sufficient data are available to measure fair value, maximizing the use of relevant observable inputs and minimizing the use of unobservable inputs.
All assets and liabilities for which fair value is measured or disclosed in the financial statements are categorized within the following fair value hierarchy based on the lowest level input that is significant to the fair value measurement as a whole:
•
Level 1 — Quoted (unadjusted) market prices in active markets for identical assets or liabilities.
•
Level 2 — Valuation techniques for which the lowest level input that is significant to the fair value measurement is directly or indirectly observable.
•
Level 3 — Valuation techniques for which the lowest level input that is significant to the fair value measurement is unobservable.
For assets and liabilities that are recognized in the financial statements on a recurring basis, the Group determines whether transfers have occurred between levels in the hierarchy by re-assessing categorization at the end of each reporting period.
For the purpose of fair value disclosures, the Group has determined classes of assets and liabilities on the basis of the nature, characteristics and risks of the asset or liability and the level of the fair value hierarchy as explained above.
Leases
A lease is an agreement whereby the lessor conveys to the lessee in return for a payment or series of payments the right to use an asset for an agreed period of time. The Group mainly acts as a lessee in operating leases.
Operating leases are all leases that do not qualify as finance leases (leases where, in accordance with the contractual terms, the lessee substantially bears all the risks and rewards of ownership of the asset).
Any resulting income and expenses are recognized in the income statement in the period in which they arise.
Treasury shares
In December 2015, Orion announced the Board of Directors' approval to repurchase common shares of the Company in an amount of up to
$20 million
. The repurchase plan commenced during the period January to March 2016.
The repurchased shares (treasury shares) are deducted from equity based on their cost. The repurchased shares reduce the amount of outstanding shares for purposes of the calculation of weighted average of outstanding shares in the computation of basic and dilutive earnings per share. No gains or losses resulting from transactions in treasury shares are recorded in the income statement.
For further information on treasury shares see note
(7.7)
Equity.
Share-based payments
In 2015, the company established a Long Term Incentive Plan (“LTIP”), which is an equity settled share-based payment in the form of performance share units (“PSU”) for a defined group of executive managers of the group. Refer to note
(6.8)
Share-based payments
for more details.
The cost of the equity settled transactions is determined by the fair value of the PSU at grant date using an appropriate valuation model and is recognized as expense in appropriate functional costs in the income statement, and against capital reserves in equity over the vesting period. At each reporting date the cumulative expense is calculated based on the extent to which the vesting period has expired and the Group’s best estimate of the number of equity instruments that will ultimately vest. The expenses or income for a period represents the movement in cumulative expense recognized as at the beginning and end of that period and is recognized in respective functional costs in the income statement. No expense is recognized for awards that do not ultimately vest, except for equity-settled transactions for which vesting is conditional upon a market or non-vesting condition.
F-21
These are treated as vesting irrespective of whether or not the market or non-vesting condition is satisfied, provided that all other performance and/or service conditions are satisfied.
When the terms of an equity settled award are modified, the minimum expense recognized is the expense had the terms not been modified, if those original terms of the award are met. An additional expense is recognized for any modification that increases the total fair value of the share-based payment transaction, or is otherwise beneficial to the employee as measured at the date of modification.
The dilutive effect of granted PSUs is reflected in the computation of diluted earnings per share.
Contingent liabilities and other financial obligations
Other than those recognized as part of a business combination, contingent liabilities include
(a)
possible obligations that arise from past events and the existence of which will be confirmed only by the occurrence or non-occurrence of one or more uncertain future events (e.g., financial guarantees), and
(b) present obligations that arise from past events but are not recognized because (i) it is not probable that an outflow of resources embodying economic benefits will be required to settle the obligation or (ii) the amount of the obligation cannot be measured with sufficient reliability.
Contingent liabilities are not recognized in the financial position but are disclosed, unless the possibility of an outflow of resources embodying economic benefits is remote.
Other financial obligations include off-balance sheet obligations where there is a contractual commitment to pay at a fixed time, including future minimum lease payments for assets under operating lease agreements under IAS 17 and contractual purchase commitments under long-term supply agreements for raw materials under IAS 39. Those financial obligations are based on the future financial commitments included in the respective agreements.
|
(3)
|
Assumptions, the use of judgment and accounting estimates
|
The preparation of the consolidated financial statements requires management to make estimates and assumptions about the future.
The use of judgment and estimates will not always correspond to subsequent circumstances.
Estimates are adjusted, with any changes being recognized in profit and loss, as and when better knowledge is available. The assumptions and estimates entailing a significant risk of an adjustment of carrying amounts of assets and liabilities during the next fiscal year are presented below.
(a)
Impairment of goodwill
Impairment is determined for goodwill by assessing the recoverable amount of each group of cash generating units to which the goodwill relates. Assumptions and judgments of future developments are inherent in the determination of the recoverable amount. For further details, see note
(7.1)
Goodwill and other intangible assets
.
(b)
Recognition and measurement of deferred tax assets
Deferred tax assets may only be recognized if it is probable that sufficient taxable income will be available in the future. If these expectations are not met, a write-down would have to be recognized in income for the deferred tax assets. For further details, see notes
(6.6)
Income taxes and
(7.11)
Deferred and current taxes
.
Effects resulting from the changes in U.S. tax legislation (Tax Cuts and Jobs Act) are fully considered based on all available information as of the date of this report.
(c)
Measurement of pension provisions
Pension provisions are measured applying assumptions about discount rates, expected future pension increases and mortality tables. These assumptions may differ from the actual data due to a change in economic conditions or markets. These include the determination of the discount rate, future salary increases, mortality rates and future pension increases. Due to the complexity of the valuation and its long-term nature, a defined benefit obligation is sensitive to changes in these assumptions. All assumptions are reviewed at each reporting date by obtaining actuarial reports for all material obligations.
In determining the appropriate discount rate, management considers the interest rates of corporate bonds in the respective currency with at least AA rating, with extrapolated maturities corresponding to the expected duration of the defined
F-22
benefit obligation. The underlying bonds are further reviewed for quality. Those having excessive credit spreads are removed from the population of bonds on which the discount rate is based, on the basis that they do not represent high quality bonds.
The mortality rate is based on publicly available mortality tables for the specific country. Future salary increases and pension increases are based on expected future inflation rates for the respective country.
Further details about the assumptions used, including those used for the sensitivity analysis, are given in note
(7.8)
Pension provisions and post-retirement benefits
.
(d)
Measurement of other provisions
Other provisions, especially provisions for restoration and environmental protection, litigation risks and restructuring are naturally exposed to significant forecasting uncertainties regarding the level and timing of the obligation. The Group has to make assumptions about the probability of occurrence of an obligation or future trends, such as expected costs, on the basis of experience. Non-current provisions are exposed to forecasting uncertainties. In addition, the level of non-current provisions depends to a large extent on the selection and development of the market-oriented discount rate (see also note
(7.9)
Other provisions
) as well as on estimates for the Rubber footprint restructuring as described in note
(6.4)
Restructuring expenses
.
F-23
(4)
List of shareholdings
The following entities are included in the Group consolidated financial statements as subsidiaries or joint ventures at
December 31, 2017
.
|
As at December 31, 2017
|
||
|
Shareholding
|
||
|
Orion Engineered Carbons S.A., Luxembourg
|
||
|
Controlled entities
|
||
|
Orion Engineered Carbons Holdings GmbH, Frankfurt am Main, Germany
|
100
|
%
|
|
Orion Engineered Carbons Bondco GmbH, Frankfurt am Main, Germany
|
100
|
%
|
|
Orion Engineered Carbons International GmbH, Frankfurt am Main, Germany
|
100
|
%
|
|
Kinove Italian Bidco S.r. l., Ravenna, Italy
|
100
|
%
|
|
Orion Engineered Carbons France Holdco SAS, Paris, France
|
100
|
%
|
|
Blackstar Engineered Carbons Portugal Holdco, Unipessoal, Lda., Sines, Portugal*
|
100
|
%
|
|
Orion Engineered Carbons USA Holdco, LLC, Kingwood, USA
|
100
|
%
|
|
Orion Engineered Carbons Korea Co. Ltd., Bupyeong-gu, South Korea
|
100
|
%
|
|
Norcarb Engineered Carbons Sweden HoldCo AB, Malmö, Sweden
|
100
|
%
|
|
Orion Engineered Carbons S.r.l. Italy, Ravenna, Italy
|
100
|
%
|
|
Orion Engineered Carbons S.A.S. France, Ambès, France
|
100
|
%
|
|
Carbogal Engineered Carbons S.A. Portugal, Sines, Portugal*
|
100
|
%
|
|
Orion Engineered Carbons LLC USA, Kingwood, USA
|
100
|
%
|
|
Orion Engineered Carbons Co. Ltd., Bupyeong-gu, South Korea
|
100
|
%
|
|
Orion Engineered Carbons sp. z o.o. Poland, Jaslo, Poland
|
100
|
%
|
|
Norcarb Engineered Carbons AB Sweden, Malmö, Sweden
|
100
|
%
|
|
Orion Engineered Carbons Ltda. Brazil, São Paulo, Brazil
|
100
|
%
|
|
Orion Engineered Carbons Proprietary Limited South Africa, Port Elizabeth, South Africa
|
100
|
%
|
|
Orion Engineered Carbons GmbH, Frankfurt am Main, Germany
|
100
|
%
|
|
Orion Engineered Carbons KK Japan, Tokyo, Japan
|
100
|
%
|
|
Orion Engineered Carbons Pte. Ltd., Singapore, Singapore
|
100
|
%
|
|
Orion Engineered Carbons Trading Co. Ltd., Shanghai, China
|
100
|
%
|
|
Orion Engineered Carbons Material Technology (Shanghai) Co., Ltd., Shanghai, China
|
100
|
%
|
|
Orion Engineered Carbons Qingdao Co., Ltd., China
|
100
|
%
|
|
CB International Services Company GmbH, Frankfurt am Main, Germany
|
100
|
%
|
|
Carbon Black OpCo GmbH, Frankfurt am Main, Germany*
|
100
|
%
|
|
Joint ventures
|
||
|
Kommanditgesellschaft Deutsche Gasrusswerke GmbH & Co., Dortmund, Germany
|
54
|
%
|
|
Deutsche Gasrusswerke Gesellschaft mit beschränkter Haftung, Dortmund, Germany
|
50
|
%
|
* in liquidation
Although Orion holds
54%
of shares as at
December 31, 2017
and
2016
in Kommanditgesellschaft Deutsche Gasrusswerke GmbH & Co., Dortmund, Germany (“DGW KG”), the terms and conditions of DGW KG’s articles of association and other bylaws impede Orion from controlling DGW KG. Therefore DGW KG is recognized as a joint venture applying the equity method.
F-24
|
(5)
|
Operating segments
|
The Group’s business is organized by product for corporate management purposes and has the following
two
reportable operating segments for all periods presented: “Rubber” and “Specialties”.
The executive management committee, which is composed of the CEO, CFO and certain other senior management members is the chief operating decision maker in accordance with IFRS 8.7. The executive management committee monitors the operating segments’ results separately in order to facilitate decisions regarding the allocation of resources and determine the segments’ performance. “Adjusted EBITDA” is the management’s measure of the segment result.The executive management committee does not review reportable segment asset or liability information for purposes of assessing performance or allocating resources.
Adjustment items are not allocated to the individual segments as they are managed on a group basis.
Segment reconciliation for the years ended December 31,
2017
,
2016
and
2015
:
|
In EUR k
|
In EUR k
|
In EUR k
|
||||||||||||||||
|
2017
|
2016
|
2015
|
||||||||||||||||
|
Rubber
|
Specialties
|
Total
segments |
Rubber
|
Specialties
|
Total
segments |
Rubber
|
Specialties
|
Total
segments |
||||||||||
|
Revenue
|
752,639
|
|
424,571
|
|
1,177,210
|
|
644,217
|
|
385,877
|
|
1,030,094
|
|
730,288
|
|
381,488
|
|
1,111,776
|
|
|
Cost of sales
|
(585,988
|
)
|
(256,411
|
)
|
(842,399
|
)
|
(483,339
|
)
|
(208,445
|
)
|
(691,784
|
)
|
(564,559
|
)
|
(226,908
|
)
|
(791,467
|
)
|
|
Gross profit
|
166,651
|
|
168,160
|
|
334,811
|
|
160,878
|
|
177,432
|
|
338,310
|
|
165,729
|
|
154,580
|
|
320,309
|
|
|
Adjusted EBITDA
|
98,757
|
|
128,900
|
|
227,657
|
|
86,108
|
|
136,658
|
|
222,766
|
|
93,704
|
|
115,006
|
|
208,710
|
|
|
Adjusted EBITDA Margin
|
13.1
|
%
|
30.4
|
%
|
19.3
|
%
|
13.4
|
%
|
35.4
|
%
|
21.6
|
%
|
12.8
|
%
|
30.1
|
%
|
18.8
|
%
|
|
Depreciation amortization and impairment of intangible assets and property, plant and equipment
|
(52,277
|
)
|
(33,633
|
)
|
(85,910
|
)
|
(59,116
|
)
|
(29,600
|
)
|
(88,716
|
)
|
(44,815
|
)
|
(27,963
|
)
|
(72,778
|
)
|
|
Share of profit of joint venture
|
(484
|
)
|
—
|
|
(484
|
)
|
(419
|
)
|
—
|
|
(419
|
)
|
(492
|
)
|
—
|
|
(492
|
)
|
|
Adjustment items
|
(17,485
|
)
|
(28,839
|
)
|
(13,047
|
)
|
||||||||||||
|
EBIT
|
123,778
|
|
104,792
|
|
122,393
|
|
||||||||||||
Definition of “adjusted EBITDA”
“EBIT” (operating result) is defined as profit or loss for the period before income taxes and finance income and finance costs. “EBITDA” is defined as EBIT before depreciation, amortization and impairment losses. For management reporting purposes and as defined in the credit agreement governing our term loans “Adjusted EBITDA” is defined as EBITDA adjusted for acquisition related expenses, restructuring expenses, consulting fees related to Group strategy, share of profit or loss of joint venture and certain other adjustments. The Company believes that each of these items have less bearing on its performance of the underlying core business.
F-25
Adjusted EBITDA is reconciled to profit or (loss) as follows:
|
Reconciliation of profit or (loss)
|
In EUR k
|
|||||
|
2017
|
2016
|
2015
|
||||
|
Profit for the period
|
66,823
|
|
44,626
|
|
42,874
|
|
|
Income taxes
|
20,737
|
|
23,240
|
|
23,838
|
|
|
Profit before income taxes
|
87,560
|
|
67,866
|
|
66,712
|
|
|
Add back finance costs
|
77,126
|
|
62,490
|
|
73,448
|
|
|
Deduction share of profit of joint ventures
|
(484
|
)
|
(419
|
)
|
(492
|
)
|
|
Deduction other finance income
|
(40,424
|
)
|
(25,145
|
)
|
(17,275
|
)
|
|
Earnings before taxes and finance income/costs (operating result (EBIT))
|
123,778
|
|
104,792
|
|
122,393
|
|
|
Add back depreciation, amortization and impairment of intangible assets and property, plant and equipment
(4)
|
85,910
|
|
88,716
|
|
72,778
|
|
|
EBITDA
|
209,688
|
|
193,508
|
|
195,171
|
|
|
Share of profit of joint venture
|
484
|
|
419
|
|
492
|
|
|
Restructuring expenses
(1)
|
4,612
|
|
17,623
|
|
—
|
|
|
Consulting fees related to Group strategy
(2)
|
2,485
|
|
2,563
|
|
1,502
|
|
|
Long Term Incentive Plan
|
7,770
|
|
3,575
|
|
907
|
|
|
Other adjustments
(3)
|
2,618
|
|
5,078
|
|
10,638
|
|
|
Adjusted EBITDA
|
227,657
|
|
222,766
|
|
208,710
|
|
(1) Restructuring expenses for the period ended December 31, 2017 are related to further actions undertaken to realign our worldwide Rubber footprint in particular in Korea and to a lesser extent in the USA. Restructuring expenses for the period ended December 31, 2016 relate to the strategic realignment of the worldwide Rubber footprint, resulting in a decision to cease production by December 31, 2016 of the plant in Ambès, France. These expenses comprise personnel related costs of
EUR
6.1 million
and demolishing, site remediation and securing as well as accrued other expenses for the cessation of
€
11.5 million
.
(2) Consulting fees related to the Group strategy include external consulting fees relating to the restructuring of our rubber footprint and associated activities of EUR1.2 million, external consulting fees relating to the Acquisition of EUR 0.5 million and other external consulting fees for establishing and implementing our operating, tax and organizational strategies including merger and acquisition strategies.
(3) Other adjustments (from items with less bearing on the underlying performance of the Company's core business) in the period ended December 31, 2017 primarily relate to costs associated with our EPA enforcement action of
EUR
2.1 million
, costs to remediate damages incurred by hurricane Harvey of
EUR
1.4 million
and costs associate with the secondary offering of our shares, offset by
EUR
1.3 million
of reimbursements of reassessed real estate transfer taxes.
Other adjustments for the period ended December 31, 2016 primarily relate to cost of
EUR
4.1 million
associated with our EPA enforcement action (including accrued expenses for penalties and mitigation projects). Other adjustments in 2015 mainly include
EUR
5.0 million
costs related to address the EPA enforcement action, in particular to evaluate emission-removal technologies and legal advice,
EUR
1.8 million
Sarbanes-Oxley first time implementation costs,
EUR
1.8 million
OECQ post acquisition-related costs and
EUR
1.5 million
reassessed real estate transfer tax related to the 2011 acquisition.
(4) Includes
EUR
10.3 million
impairment of fixed assets at our Ambès, France plant for the period ended December 31, 2016 following the decision to cease production by December 31, 2016.
F-26
Geographic information
|
Revenues
|
In EUR k
|
||||
|
2017
|
2016
|
2015
|
|||
|
Germany
|
464,638
|
398,430
|
|
415,944
|
|
|
United States
|
293,148
|
273,177
|
|
329,669
|
|
|
South Korea
|
218,377
|
199,772
|
|
234,442
|
|
|
Brazil
|
71,016
|
55,175
|
|
51,793
|
|
|
China
|
56,849
|
41,062
|
|
8,361
|
|
|
South Africa
|
41,592
|
33,231
|
|
43,669
|
|
|
Other
|
20,560
|
21,319
|
|
20,175
|
|
|
Rest of Europe*
|
11,030
|
7,928
|
|
7,723
|
|
|
Total
|
1,177,210
|
1,030,094
|
|
1,111,776
|
|
* Only a holding company is located in Luxembourg, accordingly no revenue is generated in the country of domicile.
Revenue generated for the year ended
December 31, 2017
from the largest customer in the “Rubber”segment amounted to EUR
127,805k
. Revenue from the largest customer in the “Rubber” segment for the year ended
December 31, 2016
was EUR
102,699k
and for the year ended
December 31, 2015
revenue from the largest
two
customers in the “Rubber” segment were EUR
120,609k
and EUR
110,387k
, respectively. There are no other customers with more than 10% of revenue in the three periods presented.
|
Goodwill, intangible assets, property, plant and equipment
|
In EUR k
|
|
|
As at Dec 31,
|
||
|
2017
|
2016
|
|
|
Germany
|
121,602
|
131,975
|
|
Sweden
|
67,518
|
67,432
|
|
Italy
|
60,852
|
61,438
|
|
Poland
|
41,635
|
40,319
|
|
Rest of Europe
|
3,705
|
3,321
|
|
Subtotal Europe
|
295,312
|
304,485
|
|
United States
|
58,809
|
85,123
|
|
South Korea
|
91,641
|
71,590
|
|
South Africa
|
26,688
|
27,684
|
|
Brazil
|
11,391
|
16,839
|
|
China
|
8,949
|
8,468
|
|
Other
|
23
|
34
|
|
Total
|
492,813
|
514,223
|
|
(6)
|
|
(6.1)
Revenue
Revenue is generated almost entirely from the sales of goods.
F-27
|
(6.2)
|
Other operating income
|
|
In EUR k
|
||||||
|
2017
|
2016
|
2015
|
||||
|
Income from the currency translation of monetary items
|
65
|
|
—
|
|
10
|
|
|
Income from the valuation of derivatives
|
—
|
|
19
|
|
2,202
|
|
|
Income from the reversal of provisions
|
1,319
|
|
1,196
|
|
478
|
|
|
Miscellaneous income
|
2,931
|
|
4,647
|
|
4,766
|
|
|
Total
|
4,315
|
|
5,862
|
|
7,456
|
|
Miscellaneous income for the period ended
December 31, 2017
includes EUR
1,275k
reimbursement of property tax paid.
Miscellaneous income for the period ended December 31, 2016 includes, in particular, proceeds from OECQ-related receivables, which were impaired in 2015 post acquisition, releases of allowances and reimbursements from insurance claims in connection with the Orange (Texas) flooding.
|
(6.3)
|
Other operating expenses
|
|
In EUR k
|
||||||
|
2017
|
2016
|
2015
|
||||
|
Consulting fees related to Group strategy
|
2,485
|
|
2,563
|
|
1,502
|
|
|
Expenses from the currency translation of monetary items
|
15
|
|
807
|
|
1,742
|
|
|
Expenses from the valuation of derivatives
|
—
|
|
33
|
|
3,079
|
|
|
Impairment loss on trade receivables
|
—
|
|
6
|
|
1,616
|
|
|
Loss on Disposal of Assets
|
219
|
|
1,013
|
|
—
|
|
|
Miscellaneous expenses
|
8,082
|
|
9,395
|
|
13,822
|
|
|
Total
|
10,801
|
|
13,817
|
|
21,761
|
|
Expenses from the currency translation relate to trade receivables and payables only. Expenses from currency translation on financing items is shown in finance result and are explained in note
(6.5)
Finance income and costs
.
For the year ended
December 31, 2017
, miscellaneous expenses include costs associated with our EPA enforcement action of EUR
2.1 million
, costs to remediate damages incurred by hurricane Harvey of
EUR
1.4 million
as well as costs associated with our secondary filing of shares.
For the year ended
December 31, 2016
, miscellaneous expenses mainly include EUR
4.1 million
costs associated to the EPA enforcement action. For the year ended
December 31, 2015
, miscellaneous expenses mainly include EUR
5.0 million
costs related to addressing the EPA enforcement action, EUR
1.8 million
Sarbanes-Oxley first time implementation costs, and EUR
1.5 million
reassessed real estate transfer tax related to the 2011 acquisition.
|
(6.4)
|
Restructuring expenses
|
As part of a strategic repositioning of the global Rubber footprint in 2016 a shift of production and capacities from lower margin standard grades towards higher specialized technical rubber products providing higher margins commenced. This strategic realignment of the Rubber segment is an essential transition which requires complementary actions. As a first step the Company's German operating subsidiary terminated with effect as of December 31, 2016, the Contract Manufacturing Agreement then in place between the Company's German operating subsidiary and the Company's French subsidiary, Orion Engineered Carbons SAS ("OEC SAS"), which has a plant in Ambès with a maximum capacity of mostly standard rubber grades of 50 kmt per year. Consequently, the management of OEC SAS concluded consultations with the local Works Council at this facility to implement a restructuring and down staffing with a cessation of production at the site by the end of 2016. Expenses relating to this restructuring activity of
€27.9 million
were recognized in 2016, of which cash relevant costs amounted to
€15.8 million
and non-cash items totaled
€12.1 million
. Cash relevant costs primarily composed of personnel related expenses of
€6.1 million
,
€4.6 million
demolition and removal related costs and
€3.6 million
ground remediation costs. The non-cash items mainly
F-28
composed of impairments of fixed assets of
€10.3 million
. Impairment charges related to the property, plant and equipment of OEC SAS were calculated based on an estimated recoverable amount of zero and are fully charged to the Rubber Carbon Black segment. The recoverable amount was determined based on the expectation that any potential sale would result in minimal proceeds. In 2017 further actions were taken with respect to the repositioning of the global Rubber footprint. In particular the consolidation of the
two
Korean plants and the overall transfer of production to the Yeosu facility commenced and evaluated certain initiatives in the USA.
|
(6.5)
|
Finance income and costs
|
|
In EUR k
|
||||||
|
2017
|
2016
|
2015
|
||||
|
Income from exchange differences
|
39,274
|
|
24,476
|
|
15,330
|
|
|
Other interest income
|
745
|
|
669
|
|
1,945
|
|
|
Income from commodity hedging activities
|
405
|
|
—
|
|
—
|
|
|
Finance income
|
40,424
|
|
25,145
|
|
17,275
|
|
|
Interest expenses from loans
|
(20,292
|
)
|
(29,757
|
)
|
(36,370
|
)
|
|
Amortisation of transaction costs
|
(4,123
|
)
|
(3,810
|
)
|
(4,804
|
)
|
|
Expenses from exchange differences
|
(44,692
|
)
|
(22,691
|
)
|
(27,073
|
)
|
|
Other interest expenses
|
(3,433
|
)
|
(2,846
|
)
|
(3,335
|
)
|
|
Net interest cost from pensions
|
(1,525
|
)
|
(1,541
|
)
|
(1,485
|
)
|
|
Interest expenses from the unwinding of discounts on other provisions
|
(213
|
)
|
(127
|
)
|
(88
|
)
|
|
Expenses from commodity hedging activities
|
(410
|
)
|
—
|
|
—
|
|
|
Other finance expenses
|
(2,438
|
)
|
(1,718
|
)
|
(293
|
)
|
|
Finance costs
|
(77,126
|
)
|
(62,490
|
)
|
(73,448
|
)
|
|
Financial result without share of profit or loss from joint ventures
|
(36,702
|
)
|
(37,345
|
)
|
(56,173
|
)
|
Expenses for loans include:
|
In EUR k
|
||||||
|
2017
|
2016
|
2015
|
||||
|
Interest on term loans
|
(20,292
|
)
|
(29,757
|
)
|
(36,370
|
)
|
|
Commitment fee for the revolving facility
|
(1,433
|
)
|
(1,265
|
)
|
(1,488
|
)
|
|
Total expenses from loans
|
(21,725
|
)
|
(31,022
|
)
|
(37,858
|
)
|
|
(6.6)
|
Income taxes
|
Income tax expense is as follows:
|
In EUR k
|
||||||
|
2017
|
2016
|
2015
|
||||
|
Current income taxes
|
(24,167
|
)
|
(18,678
|
)
|
(21,440
|
)
|
|
(thereof income taxes attributable to the prior year)
|
1,769
|
|
155
|
|
6,751
|
|
|
Deferred taxes
|
3,430
|
|
(4,562
|
)
|
(2,398
|
)
|
|
(thereof on temporary differences)
|
1,356
|
|
(4,241
|
)
|
6,739
|
|
|
Total net tax expenses from continuing activities
|
(20,737
|
)
|
(23,240
|
)
|
(23,838
|
)
|
|
Tax expense recognized directly in equity
|
(6,886
|
)
|
6,551
|
|
4,696
|
|
A corporate income tax rate of
15%
was used to calculate the current and deferred taxes for the German entities. A solidarity surcharge of
0.825%
(calculated as
5.5%
on the corporate income tax rate) and a trade tax rate of
16.18%
, for the years ended
December 31, 2017
,
2016
and
2015
respectively were also taken into account in the calculation. As a result, the
F-29
overall tax rate for the German entities was
32.00%
, for the years ended
December 31, 2017
,
2016
and
2015
respectively. The current and deferred taxes for the non-German entities were calculated using their respective country-specific tax rates.
The following tax reconciliation shows the difference between the expected income taxes using the German overall tax rate of
32.00%
and the effective income taxes in the income statement, for the years ended
December 31, 2017
,
2016
and
2015
, respectively.
|
In EUR k
|
||||||
|
2017
|
2016
|
2015
|
||||
|
Profit or (loss) before income taxes
|
87,560
|
|
67,866
|
|
66,712
|
|
|
Expected income tax expense/(benefit) thereon
|
28,019
|
|
21,717
|
|
21,348
|
|
|
Tax rate differential
|
(1,985
|
)
|
(4,698
|
)
|
(4,189
|
)
|
|
Change in valuation allowance on deferred tax assets and for movement in tax loss carryforwards without recognition of deferred taxes
|
(3,265
|
)
|
1,572
|
|
8,783
|
|
|
Change in the tax rate and tax laws
|
(8,447
|
)
|
(67
|
)
|
26
|
|
|
Income taxes for prior years
|
496
|
|
29
|
|
450
|
|
|
Tax on non-deductible interest expenses
|
1,347
|
|
1,545
|
|
2,054
|
|
|
Taxes on other non-deductible expenses, and non-deductible taxes
|
5,489
|
|
4,647
|
|
6,254
|
|
|
Effects of changes in permanent differences
|
(778
|
)
|
136
|
|
34
|
|
|
Tax effect on tax-free income
|
(914
|
)
|
(1,141
|
)
|
(2,557
|
)
|
|
Tax effect on profit or loss from investments accounted for using the equity method
|
—
|
|
—
|
|
(159
|
)
|
|
Other tax effects
|
775
|
|
(500
|
)
|
(8,206
|
)
|
|
Effective income taxes as reported in the income statement expense
|
20,737
|
|
23,240
|
|
23,838
|
|
|
Effective tax rate in %
|
23.68
|
%
|
34.24
|
%
|
35.73
|
%
|
Change in the tax rate and tax laws in an amount of EUR
7,354k
are related to the effect of the U.S. tax reform reducing the corporate income tax rate from 35% to 21% in the USA. In addition EUR
420k
were recorded directly through other comprehensive income applying the backward tracing provisions of IAS 12. As a result the net deferred tax liabilities for the US entities are now based on the new tax rate of 21%.
Other tax effects for the year ended December 31, 2015 include a benefit of EUR (
4,665k
) for reversal of accrued interest and currency effects related to an internal debt/equity swap in Brazil that took place in July 2015, but with an effective date for IFRS as of Jan 1, 2015. Also included is an additional benefit of EUR (
5,890k
) related to the restructuring of Orion Engineered Carbons Ltda., Brazil and subsequent Check-the-Box election to be treated as a disregarded entity for U.S. tax purposes.
|
(6.7)
|
Additional income statement information
|
Personnel expenses were recognized as follows:
|
In EUR k
|
||||||
|
2017
|
2016
|
2015
|
||||
|
Wages and salaries
|
113,500
|
|
111,415
|
|
107,222
|
|
|
Social security costs
|
11,333
|
|
11,522
|
|
11,091
|
|
|
Pension expenses
|
5,664
|
|
4,658
|
|
5,598
|
|
|
Other personnel expenses
|
20,847
|
|
16,161
|
|
12,422
|
|
|
Total
|
151,344
|
|
143,756
|
|
136,333
|
|
|
(6.8)
|
Share-based payments
|
On July 31, 2015 the Company initiated the first LTIP providing for the grant of PSUs to employees and officers selected by the Compensation Committee of the Board of Directors (the “Compensation Committee”). PSU awards will be earned based on achievement against one or more performance metrics established by the Compensation Committee in respect of a specified performance period. Earned PSUs will range from zero to a specified maximum percentage of a participant’s target award based
F-30
on the performance of applicable performance metrics, and will also be subject to vesting terms based on continued employment. The first performance period will run from January 1, 2015 through December 31, 2017, with PSUs earned to be based on achievement of EBITDA metrics established by the Compensation Committee and total shareholder return relative to a peer group. Once earned and vested, PSUs will be settled in
one
share of Company common stock per vested PSU (or, at the Company’s election, cash equal to the fair market value thereof). The first vesting period will run through March 31, 2018 (the “2015 Plan”). All PSUs are granted under, and are subject to the terms and conditions of, the Company’s 2014 Omnibus Incentive Compensation Plan, and do not increase the number of shares previously reserved for issuance under that plan. On August 2, 2016 the Compensation Committee established a consecutive LTIP (the"2016 Plan") having consistent terms as compared to the 2015 Plan. On July 31, 2017 the Compensation Committee established a consecutive LTIP (the "2017 Plan") having consistent terms as compared to the 2015 and 2016 Plan.
The following table provides detail as to expenses recorded within the profit and loss with respect to the LTIP.
|
EUR k
|
||||||
|
2017
|
2016
|
2015
|
||||
|
Expense arising from equity-settled share based payment transactions (2015 Plan)
|
2,439
|
|
2,120
|
|
907
|
|
|
Expense arising from equity-settled share based payment transactions (2016 Plan)
|
3,592
|
|
1,455
|
|
—
|
|
|
Expense arising from equity-settled share based payment transactions (2017 Plan)
|
1,739
|
|
—
|
|
—
|
|
|
Total expenses
|
7,770
|
|
3,575
|
|
907
|
|
The following table illustrates the number of, and movements in, PSUs during the year.
|
Number of PSUs
|
||||||
|
2017
|
2016
|
2015
|
||||
|
Total
|
Total
|
Total
|
||||
|
Outstanding at January 1,
|
1,145,238
|
|
463,830
|
|
—
|
|
|
Granted during the period
|
474,660
|
|
690,279
|
|
491,835
|
|
|
Forfeited during the period
|
(9,004
|
)
|
(8,871
|
)
|
(28,005
|
)
|
|
Settled during the period
|
—
|
|
—
|
|
—
|
|
|
Outstanding at December 31,
|
1,610,894
|
|
1,145,238
|
|
463,830
|
|
The following table lists the inputs to the model used for calculating the grant date fair value under the 2015 and 2016 Plan:
|
2015 Plan
|
2016 Plan
|
2017 Plan
|
|
|
Dividend Yield (%)
|
2.14%
|
2.23%
|
1.88%
|
|
Expected Volatility OEC (%)
|
25.16%
|
32.07%
|
33.77%
|
|
Expected Volatility Peer Group (%)
|
13.90%
|
18.12%
|
17.30%
|
|
Correlation
|
0.5234
|
0.4952
|
0.4574
|
|
Risk-free interest rate (%)
|
0.90%
|
0.76%
|
1.45%
|
|
Model used
|
Monte Carlo
|
Monte Carlo
|
Monte Carlo
|
|
Weighted average fair value of PSUs granted in EUR
|
15.88
|
15.38
|
21.67
|
|
(6.9)
|
Earnings per share
|
Basic EPS is calculated by dividing the profit for the year attributable to ordinary equity holders of the parent by the weighted average number of ordinary shares outstanding during the year.
F-31
Diluted EPS is calculated by dividing the profit for the year attributable to ordinary equity holders of the parent by the weighted average number of ordinary shares outstanding during the year plus the weighted average number of ordinary shares arising from exercising all dilutive ordinary shares.
The following table reflects the income and share data used in the basic and diluted EPS computations:
|
2017
|
2016
|
2015
|
||||
|
Profit or (loss) for the period- attributable to ordinary equity holders of the parent (in EUR k)
|
66,823
|
|
44,626
|
|
42,874
|
|
|
Weighted average number of ordinary shares (in thousands of shares)
|
59,320
|
|
59,353
|
|
59,635
|
|
|
Basic EPS (in EUR per share)
|
1.13
|
|
0.75
|
|
0.72
|
|
|
dilutive effect of share based payments (in thousands of shares)
|
1,354
|
|
801
|
|
195
|
|
|
Weighted average number of diluted ordinary shares (in thousands of shares)
|
60,674
|
|
60,154
|
|
59,830
|
|
|
Diluted EPS (in EUR per share)
|
1.10
|
|
0.74
|
|
0.72
|
|
The weighted average number of shares for
2017
and 2015 were constant over the year. For
2016
the weighted average number of shares was determined by the weighted average number of shares taking into account the weighted average effect of the repurchase of treasury shares. The dilutive effect of the share-based payment transaction is the weighted number of shares considering the grant date and forfeitures during the respective fiscal years.
|
(7)
|
|
|
(7.1)
|
Goodwill and other intangible assets
|
Intangible assets developed as follows:
|
In EUR k
|
||||||||||||
|
Cost
|
Goodwill
|
Developed Technology and Patents
|
Customer
Relationships
|
Trademarks
|
Other intangible
assets
|
Total
|
||||||
|
As at January 1, 2016
|
48,512
|
|
55,900
|
|
64,571
|
|
17,200
|
|
40,387
|
|
226,570
|
|
|
Currency translation
|
—
|
|
—
|
|
233
|
|
—
|
|
1,037
|
|
1,270
|
|
|
Additions
|
—
|
|
—
|
|
—
|
|
—
|
|
2,672
|
|
2,672
|
|
|
Acquisition of a subsidiary
|
—
|
|
—
|
|
—
|
|
—
|
|
—
|
|
—
|
|
|
Disposals
|
—
|
|
—
|
|
—
|
|
—
|
|
(11
|
)
|
(11
|
)
|
|
As at December 31, 2016
|
48,512
|
|
55,900
|
|
64,804
|
|
17,200
|
|
44,085
|
|
230,501
|
|
|
As at January 1, 2017
|
48,512
|
|
55,900
|
|
64,804
|
|
17,200
|
|
44,085
|
|
230,501
|
|
|
Currency translation
|
—
|
|
—
|
|
(432
|
)
|
—
|
|
(3,909
|
)
|
(4,341
|
)
|
|
Additions
|
—
|
|
390
|
|
—
|
|
—
|
|
632
|
|
1,022
|
|
|
Disposals
|
—
|
|
—
|
|
—
|
|
—
|
|
(66
|
)
|
(66
|
)
|
|
As at December 31, 2017
|
48,512
|
|
56,290
|
|
64,372
|
|
17,200
|
|
40,742
|
|
227,116
|
|
F-32
|
In EUR k
|
||||||||||||
|
Amortization
|
Goodwill
|
Developed Technology and Patents
|
Customer Relationships
|
Trademarks
|
Other intangible assets
|
Total
|
||||||
|
As at January 1, 2016
|
—
|
|
16,461
|
|
34,757
|
|
5,066
|
|
26,971
|
|
83,255
|
|
|
Currency translation
|
—
|
|
—
|
|
31
|
|
—
|
|
915
|
|
946
|
|
|
Amortization Expense
|
—
|
|
3,727
|
|
7,266
|
|
1,147
|
|
7,681
|
|
19,821
|
|
|
Impairment Segment Restructruing
|
—
|
|
—
|
|
—
|
|
—
|
|
(6
|
)
|
(6
|
)
|
|
Disposals
|
—
|
|
—
|
|
—
|
|
—
|
|
(11
|
)
|
(11
|
)
|
|
As at December 31, 2016
|
—
|
|
20,188
|
|
42,054
|
|
6,213
|
|
35,550
|
|
104,005
|
|
|
As at January 1, 2017
|
—
|
|
20,188
|
|
42,054
|
|
6,213
|
|
35,550
|
|
104,005
|
|
|
Currency translation
|
—
|
|
—
|
|
(25
|
)
|
—
|
|
(3,194
|
)
|
(3,219
|
)
|
|
Amortization Expense
|
—
|
|
3,727
|
|
6,984
|
|
1,147
|
|
7,057
|
|
18,915
|
|
|
Disposals
|
—
|
|
—
|
|
—
|
|
—
|
|
(66
|
)
|
(66
|
)
|
|
As at December 31, 2017
|
—
|
|
23,915
|
|
49,013
|
|
7,360
|
|
39,347
|
|
119,635
|
|
|
In EUR k
|
||||||||||||
|
Net carrying value
|
Goodwill
|
Developed Technology and Patents
|
Customer Relationships
|
Trademarks
|
Other intangible assets
|
Total
|
||||||
|
As at December 31, 2016
|
48,512
|
|
35,712
|
|
22,750
|
|
10,987
|
|
8,535
|
|
126,496
|
|
|
As at December 31, 2017
|
48,512
|
|
32,375
|
|
15,359
|
|
9,840
|
|
1,395
|
|
107,481
|
|
F-33
Impairment testing of goodwill and intangible assets with indefinite lives
Goodwill acquired through business combinations has been allocated to the
two
groups of CGUs below for all periods presented, which are also operating and reportable segments for impairment testing:
|
•
|
Rubber
|
|
•
|
Specialties
|
Carrying amount of goodwill allocated to each of the groups of CGUs
|
•
|
Rubber EUR
27,547k
as at
December 31, 2017
and
2016
|
|
•
|
Specialties EUR
20,965k
as at
December 31, 2017
and
2016
|
The Group performs its annual impairment test in the fourth quarter based on September 30 actual results.
A comparison of each group of cash-generating units’ carrying amount with their recoverable amount did not result in impairment.
|
•
|
Rubber
|
The recoverable amount of the Rubber group of CGUs has been determined based on a value in use calculation using cash flow projections from financial budgets approved by senior management covering a
five
-year period. The post-tax discount rate applied to post-tax cash flow projections is
8.29%
(
2016
:
8.4%
) and cash flows beyond the
five
-year period are extrapolated using a
1.1%
growth rate (
2016
:
1.15%
). As a result of this analysis, there was
no
impairment charged against goodwill in
2017
,
2016
or
2015
.
|
•
|
Specialties
|
The recoverable amount of the Specialties group of CGUs has been determined based on a value in use calculation using cash flow projections from financial budgets approved by senior management covering a
five
-year period. The post-tax discount rate applied to the post-tax cash flow projections is
10.17%
(
2016
:
8.47%
). The growth rate used to extrapolate the cash flows of the unit beyond the
five
-year period is
1.1%
(
2016
:
1.15%
). As a result of this analysis, there was
no
impairment charged against goodwill in
2017
,
2016
or
2015
.
Key assumptions used in value in use calculations
The calculation of value in use for both Rubber and Specialties is most sensitive to the following assumptions:
|
•
|
EBITDA
|
|
•
|
Discount rates
|
EBITDA
– the EBITDA applied are based on the projections from financial budgets approved by senior management covering a
five
-year period.
Discount rates
- Discount rates represent the current market assessment of the risks specific to each group of CGUs, taking into consideration the time value of money and individual risks of the underlying assets that have not been incorporated in the cash flow estimates. The discount rate calculation is based on the specific circumstances of the Group and its operating segments and is derived from its weighted average cost of capital (WACC). The WACC takes into account both debt and equity and other factors derived from a peer group. The beta factors are evaluated annually based on publicly available market data.
Sensitivity to changes in assumptions
With regard to the assessment of the value in use of the groups of CGUs to which goodwill is allocated, management believes that no reasonably possible change in any of the key assumptions would cause the carrying value of the groups of CGUs to materially exceed their recoverable amounts.
Technology and patents (including capitalized development costs), customer relationships, trademarks and other intangible assets mainly include assets with a remaining useful lifetime of
2.5
years (customer relationships with historical cost totaling EUR
64,372k
) and
9.5
years (know-how, production technologies and patents with historical cost totaling EUR
56,290k
and trademarks with historical cost totaling EUR
17,200k
).
F-34
|
(7.2)
|
Property, plant and equipment
|
Property, plant and equipment developed as follows:
|
In EUR k
|
||||||||||||
|
Cost
|
Land
|
Land rights and buildings
|
Plant and machinery
|
Other equipment,
furniture and fixtures
|
Prepayments and constructions in progress
|
Total
|
||||||
|
As at January 1, 2016
|
42,076
|
|
80,850
|
|
429,726
|
|
18,581
|
|
32,942
|
|
604,175
|
|
|
Currency translation
|
802
|
|
4,225
|
|
14,094
|
|
364
|
|
1,023
|
|
20,508
|
|
|
Additions
|
220
|
|
978
|
|
33,015
|
|
2,440
|
|
21,112
|
|
57,765
|
|
|
Disposals
|
—
|
|
(281
|
)
|
(2,410
|
)
|
(224
|
)
|
(550
|
)
|
(3,465
|
)
|
|
Reclassifications
|
270
|
|
(586
|
)
|
22,116
|
|
699
|
|
(22,499
|
)
|
—
|
|
|
As at December 31, 2016
|
43,368
|
|
85,186
|
|
496,541
|
|
21,860
|
|
32,028
|
|
678,983
|
|
|
As at January 1, 2017
|
43,368
|
|
85,186
|
|
496,541
|
|
21,860
|
|
32,028
|
|
678,983
|
|
|
Currency translation
|
(1,313
|
)
|
(4,594
|
)
|
(27,248
|
)
|
(564
|
)
|
(1,293
|
)
|
(35,012
|
)
|
|
Additions
|
6
|
|
2,167
|
|
57,190
|
|
1,665
|
|
26,037
|
|
87,065
|
|
|
Disposals
|
(104
|
)
|
(721
|
)
|
(8,567
|
)
|
(2,006
|
)
|
(179
|
)
|
(11,577
|
)
|
|
Reclassifications
|
149
|
|
615
|
|
15,775
|
|
1,271
|
|
(17,810
|
)
|
—
|
|
|
As at December 31, 2017
|
42,106
|
|
82,653
|
|
533,691
|
|
22,226
|
|
38,783
|
|
719,459
|
|
|
In EUR k
|
||||||||||||
|
Depreciation
|
Land
|
Land rights and buildings
|
Plant and machinery
|
Other equipment, furniture and fixtures
|
Prepayments and constructions in progress
|
Total
|
||||||
|
As at January 1, 2016
|
—
|
|
22,026
|
|
184,408
|
|
11,885
|
|
—
|
|
218,319
|
|
|
Currency translation
|
—
|
|
1,312
|
|
5,415
|
|
217
|
|
—
|
|
6,944
|
|
|
Depreciation expense
|
—
|
|
4,622
|
|
51,346
|
|
2,496
|
|
—
|
|
58,464
|
|
|
Impairment Segment Restructuring
|
446
|
|
1,107
|
|
8,546
|
|
171
|
|
20
|
|
10,290
|
|
|
Disposals
|
—
|
|
(310
|
)
|
(2,225
|
)
|
(226
|
)
|
—
|
|
(2,761
|
)
|
|
As at December 31, 2016
|
446
|
|
28,757
|
|
247,490
|
|
14,543
|
|
20
|
|
291,256
|
|
|
As at January 1, 2017
|
446
|
|
28,757
|
|
247,490
|
|
14,543
|
|
20
|
|
291,256
|
|
|
Currency translation
|
—
|
|
(1,242
|
)
|
(12,621
|
)
|
(368
|
)
|
—
|
|
(14,231
|
)
|
|
Depreciation expense
|
—
|
|
5,776
|
|
59,122
|
|
2,969
|
|
—
|
|
67,867
|
|
|
Reversal of Impairment Segment Restructuring
|
—
|
|
—
|
|
(972
|
)
|
—
|
|
—
|
|
(972
|
)
|
|
Disposals
|
—
|
|
(353
|
)
|
(7,444
|
)
|
(1,996
|
)
|
—
|
|
(9,793
|
)
|
|
Reclassifications
|
—
|
|
(3
|
)
|
20
|
|
(17
|
)
|
—
|
|
—
|
|
|
As at December 31, 2017
|
446
|
|
32,935
|
|
285,595
|
|
15,131
|
|
20
|
|
334,127
|
|
F-35
|
In EUR k
|
||||||||||||
|
Carrying amount
|
Land
|
Land rights and buildings
|
Plant and machinery
|
Other equipment, furniture and fixtures
|
Prepayments and constructions in progress
|
Total
|
||||||
|
As at December 31, 2016
|
42,922
|
|
56,429
|
|
249,051
|
|
7,317
|
|
32,008
|
|
387,727
|
|
|
As at December 31, 2017
|
41,660
|
|
49,718
|
|
248,096
|
|
7,095
|
|
38,763
|
|
385,332
|
|
The expected remaining depreciation per useful life range of the existing assets as at
December 31, 2017
is as follows:
|
In EUR k
|
||||||||||
|
Depreciation per useful life range
|
0-5 years
|
6-10 years
|
11-20 years
|
21 years and beyond
|
Total
|
|||||
|
Land rights and buildings
|
20,307
|
|
12,930
|
|
10,906
|
|
5,575
|
|
49,718
|
|
|
Plant and machinery
|
169,884
|
|
62,859
|
|
15,353
|
|
—
|
|
248,096
|
|
|
Other equipment, furniture and fixtures
|
6,058
|
|
951
|
|
86
|
|
—
|
|
7,095
|
|
(7.3)
Trade receivables, other financial assets
|
In EUR k
|
||||||||||||
|
As at Dec 31,
|
||||||||||||
|
2017
|
2016
|
|||||||||||
|
Total
|
Thereof
current
|
Thereof
non‑current
|
Total
|
Thereof
current
|
Thereof
non‑current
|
|||||||
|
Trade receivables
|
195,341
|
|
195,341
|
|
—
|
|
190,503
|
|
190,503
|
|
—
|
|
|
Receivables from hedges/ derivatives
|
2,964
|
|
757
|
|
2,207
|
|
2,826
|
|
1,599
|
|
1,227
|
|
|
Loans
|
574
|
|
—
|
|
574
|
|
1,357
|
|
593
|
|
764
|
|
|
Miscellaneous financial assets
|
2,678
|
|
2,487
|
|
191
|
|
3,259
|
|
3,072
|
|
187
|
|
|
Other financial assets
|
6,216
|
|
3,244
|
|
2,972
|
|
7,442
|
|
5,264
|
|
2,178
|
|
|
Total
|
201,557
|
|
198,585
|
|
2,972
|
|
197,945
|
|
195,767
|
|
2,178
|
|
Cash and cash equivalents which are also financial assets are presented under note
(7.6)
Cash and cash equivalents
.
(a)
Trade receivables
The aging of trade receivables is as follows:
F-36
|
In EUR k
|
||||
|
As at Dec 31,
|
||||
|
2017
|
2016
|
|||
|
Impaired receivables, net
|
4,353
|
|
2,497
|
|
|
Gross amount (before impairment losses and allowances)
|
8,706
|
|
9,773
|
|
|
Impairment provision (including allowances)
|
4,353
|
|
7,276
|
|
|
Unimpaired receivables
|
190,988
|
|
188,006
|
|
|
Not due
|
179,048
|
|
173,722
|
|
|
Past due by
|
||||
|
Up to 3 months
|
11,476
|
|
13,888
|
|
|
3 to 6 months
|
394
|
|
150
|
|
|
6 to 9 months
|
37
|
|
70
|
|
|
9 to 12 months
|
4
|
|
53
|
|
|
More than 1 year
|
29
|
|
123
|
|
|
Total
|
195,341
|
|
190,503
|
|
See below for the movements in the provision for impairment of receivables:
|
In EUR k
|
||||
|
2017
|
2016
|
|||
|
As at January 1,
|
7,276
|
|
5,814
|
|
|
Addition
|
3,780
|
|
4,585
|
|
|
Utilization
|
(680
|
)
|
(28
|
)
|
|
Unused amounts reversed
|
(5,736
|
)
|
(3,099
|
)
|
|
Currency translation
|
(287
|
)
|
4
|
|
|
As at December 31,
|
4,353
|
|
7,276
|
|
(b)
Receivables from derivatives/hedges
On August 28, 2014, September 2, 2014 and November 10, 2017 the Group acquired interest rate caps to hedge interest rate risk on current term loan financing (for more details, see note
(9.3)
Financial risk management
). These interest rate caps were measured at fair value as at December 31,
2017
of EUR
2,207k
(prior year: EUR
1,022k
). In 2017 the Group has entered into commodity derivative agreements to hedge the impact of raw material price fluctuations on cost of sales for specific sales. As of December 31,
2017
commodity derivatives accounted for receivables from derivatives of EUR
198k
(prior year: EUR
1,328k
). EUR
559k
of receivables from derivatives relates to the fair value of current foreign currency derivatives (prior year: EUR
271k
) and fair value of combined interest rate and foreign currency derivatives. The amounts of EUR
559k
and EUR
198k
reflect the current portion, EUR
2,207k
are non-current.
(c)
Loans
The loans are neither due nor impaired.
(7.4)
Inventories
|
In EUR k
|
||||
|
As at Dec 31,
|
||||
|
2017
|
2016
|
|||
|
Raw materials, consumables and supplies
|
53,487
|
|
54,694
|
|
|
Work in process
|
9
|
|
34
|
|
|
Finished goods and merchandise
|
79,360
|
|
59,623
|
|
|
Total
|
132,856
|
|
114,351
|
|
F-37
In the periods ending
December 31, 2017
,
2016
and
2015
EUR
2,446k
, EUR
5,865k
and EUR
3,021k
, respectively, were recognized as an expense for damaged, obsolete and lost inventories.
In fiscal years
2017
and
2016
, impairment losses were recognized on raw materials, consumables and supplies, merchandise and on finished goods. Impairment allowance on inventories as of
December 31, 2017
and
December 31, 2016
amounted to EUR
1,432k
and EUR
4,208k
, respectively, and developed as following:
|
In EUR k
|
||||
|
2017
|
2016
|
|||
|
As at January 1, 2017
|
4,208
|
|
3,399
|
|
|
Addition
|
1,432
|
|
4,175
|
|
|
Utilization
|
(3,528
|
)
|
(3,283
|
)
|
|
Release
|
(680
|
)
|
(83
|
)
|
|
As at December 31, 2017
|
1,432
|
|
4,208
|
|
|
(7.5)
|
Other assets
|
|
In EUR k
|
In EUR k
|
|||||||||||
|
As at Dec 31,
|
As at Dec 31,
|
|||||||||||
|
2017
|
2016
|
|||||||||||
|
Total
|
Thereof current
|
There of non‑current
|
Total
|
Thereof current
|
There of non‑current
|
|||||||
|
Miscellaneous other receivables
|
28,248
|
|
28,044
|
|
204
|
|
21,876
|
|
20,921
|
|
955
|
|
|
Prepaid expenses
|
4,206
|
|
1,172
|
|
3,034
|
|
2,967
|
|
1,064
|
|
1,903
|
|
|
Total
|
32,454
|
|
29,216
|
|
3,238
|
|
24,843
|
|
21,985
|
|
2,858
|
|
Miscellaneous other receivables in the financial year are mainly related to VAT (EUR
14,767k
and EUR
8,338k
as at
December 31, 2017
and
2016
, respectively), advance payments (EUR
4,550k
and EUR
6,992k
as at December 31,
2017
and
2016
, respectively) and guarantee deposits (EUR
1,385k
and EUR
1,658k
as at December 31,
2017
and
2016
, respectively).
Prepaid expenses mainly include other unamortized transaction costs of EUR
2,751k
and EUR
1,422k
as at
December 31, 2017
and
2016
, respectively (of which EUR
2,200k
and EUR
871k
, respectively, is non-current) incurred in connection with the revolving credit facility that has not been utilized by the respective reporting dates (see note
(7.10)
(b)
Revolving credit facility
for further information on transaction costs in connection with the refinancing on July 25, 2014).
|
(7.6)
|
Cash and cash equivalents
|
The cash and cash equivalents as of
December 31, 2017
and
2016
of EUR
60,272k
and EUR
73,907k
, respectively, include bank balances and cash on hand of EUR
59,648k
and EUR
73,895k
and checks of EUR
624k
and EUR
12k
.
|
(7.7)
|
Equity
|
(a)
Subscribed capital
The Company’s fully paid-in subscribed capital as at December 31, 2017 amounted to EUR
59,635k
, represented by
59,320,214
shares held in total by public shareholders, except for
314,912
shares held in treasury by Orion Engineered Carbons S.A.
Since July 28, 2014, the Company’s authorized unissued share capital is EUR
29,818k
consisting of
29,817,500
common shares with no par value. During a period of
five
years the Board of Directors is authorized to issue common shares, to grant options to subscribe for common shares (see also
(6.8)
Share-based payments
) and to issue any other instruments convertible into common shares within the limit of authorized capital.
F-38
(b) Treasury Shares
On January 15, 2016, the Company adopted a share repurchase plan. The board of directors of the Company authorized the repurchase of up to US-Dollar
20 million
worth of shares of Orion's issued and outstanding common shares.
The following table sets forth the numbers and average prices of the shares repurchased during the year ended December 31, 2016:
|
Period
|
Total Number of Shares Purchased
|
Average Price Paid per Share in US-Dollar
|
Maximum approximate Dollar Value of shares that may yet be purchased under the Program as of December 31, 2016
|
|
|
January 1, 2016 – January 31, 2016
|
104,438
|
|
$11.1647
|
$18,833,978
|
|
February 1, 2016 – February 29, 2016
|
199,874
|
|
$12.3170
|
$16,372,123
|
|
March 1, 2016 – March 31, 2016
|
10,600
|
|
$12.9293
|
$16,235,072
|
|
April 1, 2016 – December, 2016
|
—
|
|
$0.0000
|
$16,235,072
|
|
Total
|
314,912
|
|
$11.9555
|
$16,235,072
|
The Euro-equivalent of shares repurchased during the year 2016 is EUR
3,415k
. The average share price paid per share in Euro was EUR
10.8441
, applying the daily US-Dollar exchange rates as published by the European Central Bank. The term of the repurchase plan has expired.
(c) Reserves
The capital reserves include the effects from the contribution in kind of EUR
196,357k
in conjunction with the IPO. Furthermore, the equity–settled share–based payments at a total accumulated amount of EUR
12,252k
, EUR
4,482k
and EUR
907k
are recognised in the capital reserve as of December 31, 2017, 2016 and 2015. Refer to note
(6.8)
Share based payments for further details of the plan.
In the year ended December 31, 2015, the Group paid interim cash dividends of EUR
0.67
per common share, equivalent to a total distribution of EUR
40m
in quarterly installments of EUR
10m
each, subsequently ratified in the annual general meeting in 2016.
In the year ended December 31, 2016, the Group paid interim cash dividends of EUR
0.67
per common share, equivalent to a total distribution of EUR
40m
in quarterly installments of EUR
10m
each, subsequently ratified in the annual general meeting in 2017.
In the year ended December 31, 2017, the Group paid interim cash dividends of EUR
0.67
per common share, equivalent to a total distribution of EUR
40m
in quarterly installments of EUR
10m
each.
The accumulated other reserves include gains and losses that are recognized directly in equity rather than in profit or loss. The reserve for hedges of a net investment in foreign operation includes net gains and losses from the change in the fair value of the effective portion of the hedge in investment in foreign operation. Refer to note (9.3) Financial risk management. The foreign currency translation reserve includes accumulated translation differences from consolidation of financial statements of our subsidiaries that have a foreign functional currency.
F-39
|
(7.8)
|
Pension provisions and post-retirement benefits
|
Provisions for pensions are established to cover benefit plans for retirement, disability and surviving dependents’ pensions. The benefit obligations vary depending on the legal, tax and economic circumstances in the various countries in which the Group companies operate. Generally, the level of benefit depends on the length of service and the remuneration.
In
2017
, Germany accounted for approximately
89%
(
89%
in
2016
) of provisions for defined benefit pension obligations. There are also defined contribution pension plans in Germany and the United States for which our Group companies make regular contributions to off-balance sheet pension funds managed by third party insurance companies.
In South Korea, the company’s pension plan provides, at the option of employees for either defined benefit or defined contribution benefits. Plan assets relating to this plan reduce pension provision disclosed.
In
2017
and
2016
, pension provisions developed as follows:
|
In EUR k
|
||||
|
2017
|
2016
|
|||
|
At the beginning of the period
|
54,736
|
|
44,994
|
|
|
Actuarial (gain)/ loss
|
(593
|
)
|
10,574
|
|
|
Net pension expense
|
2,178
|
|
243
|
|
|
Net (contribution)/return into/from plan assets
|
450
|
|
(880
|
)
|
|
Net benefits paid
|
(2,137
|
)
|
(827
|
)
|
|
Exchange difference
|
(110
|
)
|
632
|
|
|
Pension provisions at the end of the period
|
54,524
|
|
54,736
|
|
The weighted averages in the table below were used in the actuarial valuation of the assumptions underlying the obligations:
|
Assumptions
|
As at Dec 31,
|
|
|
2017
|
2016
|
|
|
Discount rate
|
1.90%
|
1.90%
|
|
Mortality
|
Heubeck Richttafeln 2005G
|
Heubeck Richttafeln 2005G
|
|
Future pension increase
|
1.5%
|
1.5%
|
A quantitative sensitivity analysis for the significant assumptions as at
December 31, 2017
is shown below:
|
In EUR k
|
|||||
|
As at Dec 31,
|
|||||
|
2017
|
|||||
|
Discount Rate
|
Pension Trend
|
Mortality
|
|||
|
Sensitivity level
|
1.40%
|
2.40%
|
1.00%
|
2.00%
|
+ 2 Years
|
|
Impact on defined benefit obligation
|
(5,515)
|
4,751
|
7,179
|
(7,931)
|
(3,444)
|
A quantitative sensitivity analysis for the significant assumptions as at
December 31, 2016
is shown below:
|
In EUR k
|
|||||
|
As at Dec 31,
|
|||||
|
2016
|
|||||
|
Discount Rate
|
Pension Trend
|
Mortality
|
|||
|
Sensitivity level
|
1.40%
|
2.40%
|
1.00%
|
2.00%
|
+ 2 Years
|
|
Impact on defined benefit obligation
|
(5,708)
|
4,896
|
6,954
|
(7,715)
|
(3,435)
|
F-40
The present value of the defined benefit obligation developed as follows:
|
In EUR k
|
||||
|
2017
|
2016
|
|||
|
Present value of defined benefit obligation at the beginning of the period
|
61,379
|
|
50,589
|
|
|
Actuarial (gain)/ loss
|
(661
|
)
|
10,544
|
|
|
Current service cost
|
684
|
|
712
|
|
|
Interest cost
|
1,525
|
|
1,541
|
|
|
Benefits paid
|
(2,137
|
)
|
(827
|
)
|
|
Other adjustments
|
128
|
|
(1,874
|
)
|
|
Currency translation
|
(162
|
)
|
694
|
|
|
Present value of defined benefit obligation at the end of the period
|
60,756
|
|
61,379
|
|
Based on the weighted Macaulay method the defined benefit obligation has maturity respectively duration of
21.2
(prior year:
21.9
years).
The fair value of plan assets developed as follows:
|
In EUR k
|
||||
|
2017
|
2016
|
|||
|
Fair value of plan assets at the beginning of the period
|
6,643
|
|
5,595
|
|
|
Expected return on plan assets
|
159
|
|
136
|
|
|
Employer contributions
|
888
|
|
1,006
|
|
|
Employee contributions
|
—
|
|
50
|
|
|
Actuarial gain/(loss)
|
(68
|
)
|
(30
|
)
|
|
Benefits paid
|
(1,338
|
)
|
(176
|
)
|
|
Currency translation
|
(52
|
)
|
62
|
|
|
Fair value of plan assets
|
6,232
|
|
6,643
|
|
The plan assets are held by Orion Engineered Carbons Co. Ltd. Korea, Bupyeong-gu, South Korea, and relate to qualifying insurance policies. These insurance policies do not have a quoted market price. The actual return on plan assets amounted to EUR
91k
and EUR
106k
for the years ended
December 31, 2017
and
2016
, respectively.
Financing as at
December 31, 2017
and
2016
was as follows:
|
In EUR k
|
||||
|
As at Dec 31,
|
||||
|
2017
|
2016
|
|||
|
Defined benefit obligation
|
60,756
|
|
61,379
|
|
|
Fair value of plan assets
|
(6,232
|
)
|
(6,643
|
)
|
|
Pension provision
|
54,524
|
|
54,736
|
|
F-41
The total pension expense for continuing operations breaks down as follows:
|
In EUR k
|
||||||
|
2017
|
2016
|
2015
|
||||
|
Current service cost
|
684
|
|
712
|
|
762
|
|
|
Interest expense
|
1,525
|
|
1,541
|
|
1,485
|
|
|
Return on plan assets
|
(159
|
)
|
(136
|
)
|
(160
|
)
|
|
Past service cost/(income) and other adjustments
|
128
|
|
(1,874
|
)
|
(1,247
|
)
|
|
Net pension expense/(income)
|
2,178
|
|
243
|
|
840
|
|
Effective at the end of 2013, all defined benefit plans in Germany were modified to close access to new participants and freeze benefits accrued under these plans at December 31, 2013 levels. Interest expense on the frozen obligation relating to these plans will continue to accrue. Due to minor contractual amendments (either individually or collectively) OEC benefited in terms of past service costs. In addition
one
program during the year ended December 31, 2016 ceased due to the closure of our Ambès (France) plant.
The interest cost and return on plan assets is shown in the finance result, see note
(6.5)
Finance income and costs
. The other amounts are recorded as personnel expenses (pension expenses) in the functional areas. The expected pension contributions for
2018
amount to EUR
1,667k
. The weighted average term of the pension obligation is
21.2
years (prior year:
21.9
years).
The Group paid EUR
11,333k
, EUR
11,522k
and
11,091k
for the years ended
December 31, 2017
,
2016
and
2015
for state defined contribution pension schemes (statutory pension insurance) in Germany and other countries. This amount is also recognized as personnel expenses (social security costs).
|
(7.9)
|
Other provisions
|
|
In EUR k
|
In EUR k
|
|||||||||||
|
As at Dec 31,
|
||||||||||||
|
2017
|
2016
|
|||||||||||
|
Total
|
Thereof current
|
Thereof non-current
|
Total
|
Thereof current
|
Thereof non-current
|
|||||||
|
Personnel provisions
|
31,804
|
|
23,805
|
|
7,999
|
|
34,195
|
|
24,628
|
|
9,567
|
|
|
Provisions for sales and procurement
|
2,822
|
|
2,822
|
|
—
|
|
2,749
|
|
2,749
|
|
—
|
|
|
Provisions for environmental protection measures
|
1,640
|
|
431
|
|
1,209
|
|
1,686
|
|
507
|
|
1,179
|
|
|
Provisions for restoration
|
1,918
|
|
—
|
|
1,918
|
|
3,001
|
|
—
|
|
3,001
|
|
|
Restructuring provision related to Rubber footprint
|
7,268
|
|
7,268
|
|
—
|
|
15,819
|
|
15,819
|
|
—
|
|
|
Other provisions
|
15,262
|
|
15,262
|
|
—
|
|
16,353
|
|
16,353
|
|
—
|
|
|
Total
|
60,714
|
|
49,588
|
|
11,126
|
|
73,803
|
|
60,056
|
|
13,747
|
|
Personnel provisions are recognized for a number of different contingencies. These include management bonuses and variable compensation, statutory phased retirement arrangements and other company early retirement agreements, accrued vacation and other outstanding overtime obligations. The majority of the provisions will be utilized within
five
years.
Provisions for sales and procurement mainly relate to guarantee obligations, outstanding sales commissions, price reductions such as discounts and bonuses, purchased goods and services not yet invoiced. All the provisions will be utilized within the subsequent year.
Provisions for restoration and environmental protection measures are mandatory due to agreements, laws and requirements imposed by authorities. They include soil treatment, water protection, landfill restoration and soil decontamination obligations. The majority of these provisions will be utilized on a long-term basis after more than
five
years.
Provisions related to Rubber footprint restructuring include severances, demolition, site remediation and securing expenses, as further described in notes
(6.4)
Restructuring expenses
.
F-42
The provision for other obligations relates to product liability and patent, tax, anti-trust, legal and advisory services and similar accrued obligations.
The Company does not anticipate any reimbursements related to the provisions recorded.
Other provisions as at December 31,
2017
and
2016
developed as follows:
|
In EUR k
|
||||||||||||||
|
Personnel
provisions
|
Provisions for sales and
procure-ment
|
Provisions for environ-
mental protection measures
|
Provisions
for
restoration
|
Restructuring provision related to Rubber footprint
|
Other
provisions
|
Total
|
||||||||
|
As at Dec 31, 2016
|
34,195
|
|
2,749
|
|
1,686
|
|
3,001
|
|
15,819
|
|
16,353
|
|
73,803
|
|
|
Currency translation
|
(1,078
|
)
|
(125
|
)
|
5
|
|
(393
|
)
|
—
|
|
(743
|
)
|
(2,334
|
)
|
|
Additions
|
21,250
|
|
2,799
|
|
122
|
|
—
|
|
2,000
|
|
7,615
|
|
33,786
|
|
|
Utilization
|
(22,405
|
)
|
(2,597
|
)
|
(255
|
)
|
(730
|
)
|
(10,551
|
)
|
(6,897
|
)
|
(43,435
|
)
|
|
Reversals
|
(248
|
)
|
(4
|
)
|
(1
|
)
|
—
|
|
—
|
|
(1,066
|
)
|
(1,319
|
)
|
|
Unwinding of the discount/change in interest rate
|
90
|
|
—
|
|
83
|
|
40
|
|
—
|
|
—
|
|
213
|
|
|
As at Dec 31, 2017
|
31,804
|
|
2,822
|
|
1,640
|
|
1,918
|
|
7,268
|
|
15,262
|
|
60,714
|
|
|
In EUR k
|
||||||||||||||
|
Personnel provisions
|
Provisions for sales and procure-ment
|
Provisions for environ-mental protection measures
|
Provisions for restoration
|
Restructuring provision related to Rubber footprint
|
Other provisions
|
Total
|
||||||||
|
As at Dec 31, 2015
|
35,579
|
|
2,670
|
|
1,691
|
|
3,070
|
|
—
|
|
10,503
|
|
53,513
|
|
|
Currency translation
|
245
|
|
94
|
|
(3
|
)
|
101
|
|
—
|
|
883
|
|
1,320
|
|
|
Additions
|
21,695
|
|
2,803
|
|
98
|
|
159
|
|
15,960
|
|
12,476
|
|
53,191
|
|
|
Utilization
|
(23,329
|
)
|
(2,761
|
)
|
(100
|
)
|
(329
|
)
|
(141
|
)
|
(6,988
|
)
|
(33,648
|
)
|
|
Reversals
|
(133
|
)
|
(57
|
)
|
—
|
|
—
|
|
—
|
|
(521
|
)
|
(711
|
)
|
|
Unwinding of the discount/change in interest rate
|
138
|
|
—
|
|
—
|
|
—
|
|
—
|
|
—
|
|
138
|
|
|
As at Dec 31, 2016
|
34,195
|
|
2,749
|
|
1,686
|
|
3,001
|
|
15,819
|
|
16,353
|
|
73,803
|
|
F-43
|
(7.10)
|
Trade payables, other financial liabilities
|
|
In EUR k
|
||||||||||||
|
As at Dec 31,
|
||||||||||||
|
2017
|
2016
|
|||||||||||
|
Total
|
Thereof current
|
Thereof non-current
|
Total
|
Thereof current
|
Thereof non-current
|
|||||||
|
Term Loan
|
558,569
|
|
5,007
|
|
553,562
|
|
618,059
|
|
4,526
|
|
613,533
|
|
|
Local bank loans
|
10,433
|
|
15
|
|
10,418
|
|
—
|
|
—
|
|
—
|
|
|
Liabilities from derivatives
|
4,330
|
|
774
|
|
3,556
|
|
863
|
|
863
|
|
—
|
|
|
Other financial liabilities
|
97
|
|
52
|
|
45
|
|
202
|
|
76
|
|
126
|
|
|
Total financial liabilities
|
573,429
|
|
5,848
|
|
567,581
|
|
619,124
|
|
5,465
|
|
613,659
|
|
|
Trade payables
|
141,436
|
|
141,436
|
|
—
|
|
122,913
|
|
122,913
|
|
—
|
|
|
Total
|
714,865
|
|
147,284
|
|
567,581
|
|
742,037
|
|
128,378
|
|
613,659
|
|
(a)
Term Loans
On July 25, 2014, Orion entered into a refinancing of its indebtedness. Orion entered into its current EUR-equivalent
665m
credit facility term loan (term loan liability denominated in USD:
358m
, term loan liability denominated in EUR:
399m
) with an original maturity date of July 25, 2021 (the “Term Loans”). Interest is calculated based on 3-M-EURIBOR (for EUR denominated loan), or 3-M-USD-LIBOR (for USD denominated loan) plus a
3.75%
-
4.00%
margin (depending on leverage ratio). For both EURIBOR and USD-LIBOR a floor of
1.0%
applied. At least
1%
of the principal amount is required to be repaid per annum; Orion may make additional voluntary repayments. On December 30, 2015, a voluntary repayment of EUR
25.0 million
and USD
27.0 million
was made. Further debt repayments of EUR
20.0 million
and USD
22.0 million
were made on January 29, 2016 and July 15, 2016 as well as EUR
11.0 million
and USD
9.0 million
were made on January 23, 2017.
On September 30, 2016 the Company signed an amendment to the credit agreement, dated as of July 25, to reprice its EUR- and USD- denominated outstanding term loans. The repricing resulted in a
100 basis point
reduction to interest, from the previous annual interest rate of
4.75%
(
3.75%
margin plus floor of
1.00%
) to an annual interest rate of
3.75%
(
3.00%
margin plus floor of
0.75%
), and it reduced Orion’s annual cost of debt by approximately €
6.2 million
. Other provisions of this credit agreement remained unchanged.
On May 5, 2017, the Company signed another amendment to the credit agreement, dated as of July 25, 2014 to reprice its EUR- and USD- denominated outstanding term loans. The repricing resulted in a
100 basis point
reduction to interest for the EUR denominated loan, from the previous annual interest rate of currently
3.75%
(
3.00%
margin plus 3-M-EURIBOR (minimum floor of
0.75%
) to an annual interest rate of currently
2.75%
(
2.75%
margin plus 3-M-EURIBOR (minimum floor of
0.00%
)), and in a
50 basis points
reduction to interest for the USD denominated loan, from the previous annual interest rate of
3.00%
margin plus 3-M-USD-LIBOR (minimum floor of
0.75%
)) to an annual interest rate of
2.50%
margin plus 3-M-USD-LIBOR (minimum floor of
0.00%
). It reduced Orion’s annual cost of debt by approximately EUR
4.7 million
. Other provisions of this credit agreement remained unchanged.
On November 7, 2017, the company signed an additional amendment to the credit agreement, dated as of July 25, 2014 to reprice its EUR denominated outstanding term loan, and to extend the term of the Term Loans. The repricing resulted in a
25 basis points
reduction to interest for the EUR denominated loan, from the previous annual interest rate of currently
2.75%
margin plus 3-M-EURIBOR (minimum floor of
0.00%
) to an annual interest rate of currently
2.50%
margin plus 3-M-EURIBOR (minimum floor of
0.00%
). It reduced Orion’s annual cost of debt by approximately EUR
0.8 million
. The term extension resulted in a new maturity date of July 25, 2024 (previously July 25, 2021). Other provisions of this credit agreement remained unchanged.
Transaction costs incurred directly in connection with the incurrence of the Euro and U.S. Dollar denominated term loans, thereby reducing their carrying amount, are amortized as finance costs over the term of the loans. The transaction costs incurred upon issuance of the Term Loans in 2014 amount to EUR
19,277k
. In connection with the repricing described above further transaction costs of EUR
2,916k
in
2017
and EUR
1,878k
in
2016
were incurred and capitalized. In
2017
, an amount of EUR
3,110k
related to capitalized transaction costs was amortized and recognized as finance costs in this regard (prior year: EUR
2,547k
). In addition an amount of EUR
389k
was amortized as finance costs due to the voluntary redemption in the first quarter of
2017
(prior year: EUR
712k
).
F-44
The carrying value as at
December 31, 2017
includes the nominal amount of the Term Loans plus accrued unpaid interest less deferred transaction costs of EUR
11,959k
(December 31,
2016
: EUR
12,522k
).
(b)
Revolving credit facility
To generally safeguard the Company’s liquidity, the Company has entered into revolving credit facilities (“RCF”).
As part of the refinancing, on July 25, 2014 the then-existing revolving facility was replaced by a EUR
115m
multicurrency revolving credit facility with an original maturity date July 25, 2019. Interest is calculated based on EURIBOR (for EUR drawings), and USD-LIBOR (for USD drawings) plus
2.5%
-
3.0%
margin (depending on leverage ratio). The RCF has not been drawn. Transaction costs in the amount of EUR
2,752k
originally incurred in connection with the RCF are also recorded as deferred expenses and are amortized as finance costs on a straight-line basis over the term of the facility (until July 25, 2019).
The amendment to the Credit Agreement entered into on May 5, 2017 (i) reduces the commitment fee paid on the unused commitments from
40%
of the Applicable Rate (as defined in the Credit Agreement) to
35%
of the Applicable Rate, (ii) extends the maturity date for the revolving credit facility to April 25, 2021 and (iii) increases the aggregate amount of revolving credit commitments to
€175 million
. All other terms of the Credit Agreement remained unchanged.
Additional Transaction costs in conjunction with the RCF in the amount of EUR
1,952k
incurred in connection with the Amendment to the Credit Agreement are also recorded as deferred expenses and are amortized as finance costs on a straight-line basis over the term of the facility (until April 25, 2021).
During
2017
, transaction costs of EUR
624k
were amortized (prior year: EUR
551k
). Unamortized transaction costs that were incurred in conjunction with the RCF in July 2014 and the Amendment on May 30, 2017, amount to EUR
2,751k
as at
December 31, 2017
and EUR
1,422k
as at December 31,
2016
.
(c) Liabilities from derivatives/hedges
O
n November 14, 2017 the Group acquired floored forward interest rate swaps to hedge interest rate risk on current term loan financing (for more details, see note
(9.3)
Financial risk management).
(d) Local bank loans
On August 10, 2017, OEC Co. Ltd. in Korea has closed a term loan facility with Hana Bank with an amount of KRW
24 billion
and a term of
three
years to finance the consolidation of our
two
plants in Korea. The loan is collateralized by real estate and machinery of our plant in Bupyong. As of December 31, 2017 the loan is drawn with an amount of EUR
10,418k
.
F-45
|
(7.11)
|
Deferred and current taxes
|
|
Deferred tax assets
|
In EUR k
|
|||
|
As at Dec 31,
|
||||
|
2017
|
2016
|
|||
|
Assets
|
||||
|
Intangible assets
|
1,004
|
|
1,062
|
|
|
Property, plant and equipment
|
1,928
|
|
2,796
|
|
|
Financial assets
|
6,094
|
|
18,773
|
|
|
Inventories
|
1,825
|
|
2,577
|
|
|
Receivables, other assets
|
2,320
|
|
1,999
|
|
|
Liabilities
|
||||
|
Provisions
|
16,710
|
|
18,542
|
|
|
Liabilities
|
21,939
|
|
39,106
|
|
|
Other
|
||||
|
Loss carryforwards
|
15,807
|
|
20,593
|
|
|
Total deferred tax assets
|
67,627
|
|
105,448
|
|
|
Netting with deferred tax liabilities
|
(31,318
|
)
|
(44,493
|
)
|
|
Deferred tax assets (net)
|
36,309
|
|
60,955
|
|
|
Deferred tax liability
|
In EUR k
|
|||
|
As at Dec 31,
|
||||
|
2017
|
2016
|
|||
|
Assets
|
||||
|
Intangible assets
|
684
|
|
1,198
|
|
|
Property, plant and equipment
|
27,336
|
|
45,858
|
|
|
Financial assets
|
5,527
|
|
20,233
|
|
|
Receivables, other assets
|
11,321
|
|
14,795
|
|
|
Liabilities
|
||||
|
Provisions
|
5,677
|
|
5,129
|
|
|
Liabilities
|
1,719
|
|
1,837
|
|
|
Total deferred tax liabilities
|
52,264
|
|
89,050
|
|
|
Netting with deferred tax assets
|
(31,318
|
)
|
(44,493
|
)
|
|
Deferred tax liabilities (net)
|
20,946
|
|
44,557
|
|
|
Net deferred tax
|
(15,363
|
)
|
(16,398
|
)
|
Management assesses the recoverability of deferred tax assets. The assessment depends on future taxable profits being generated during the periods in which tax measurement differences reverse and tax loss carryforwards can be claimed. Orion expects that sufficient taxable income will be available to recover deferred tax assets due to the tax group in place.
As of
December 31, 2017
and
2016
, certain loss carryforwards were subject to restrictions with respect to the offsetting of losses. No deferred tax assets were recorded on these loss carryforwards if it is not likely that they will be used by future taxable income.
F-46
The following tax loss and interest carryforwards were recognized as at
December 31, 2017
and
2016
(gross amounts):
|
In EUR k
|
||||
|
As at Dec 31,
|
||||
|
2017
|
2016
|
|||
|
Corporate income tax loss carryforwards
|
95,515
|
|
86,384
|
|
|
Trade tax loss carryforwards
|
—
|
|
40,370
|
|
|
Total
|
95,515
|
|
126,754
|
|
No deferred tax assets were recognized for the following items (gross amounts):
|
In EUR k
|
||||
|
As at Dec 31,
|
||||
|
2017
|
2016
|
|||
|
Deductible temporary differences
|
28,366
|
|
28,449
|
|
|
Corporate income tax loss carryforwards
|
104,772
|
|
154,009
|
|
|
Trade tax loss carryforwards
|
213
|
|
2,353
|
|
|
Interest carryforwards for tax purposes
|
20,535
|
|
17,771
|
|
|
Total
|
153,886
|
|
202,582
|
|
The tax loss carryforwards for which no deferred tax assets were recorded and which do not expire amount to EUR
92,222k
(prior year: EUR
149,826k
). EUR
3,514k
(prior year: EUR
5,878k
) expires within
1
to
5
years.
EUR
9,250k
(prior year: EUR
658k
) expires later than
5
years.
No deferred taxes were recognized on a taxable temporary difference of EUR
14,873k
(prior year: EUR
21,263k
) in connection with subsidiaries (IAS 12.39).
Deferred tax liabilities in the USA were reduced by EUR
7,354k
, deferred tax assets were reduced by EUR
358k
and taxes within other comprehensive income were reduced by EUR
420k
mainly reflecting the changes following the U.S. tax reform and the future corporate tax rate of 21%.
|
(8)
|
Notes to the statement of cash flows
|
Significant non-cash expenses for the year ended
December 31, 2017
mainly consist of unrealized foreign currency gains on our USD Term Loan amounting to EUR
12,834k
(net of offsetting effects due to the hedge of an net investment in a foreign operation) due to the Euro appreciating against the U.S. Dollar from
1.0541
USD/EUR as at
December 31, 2016
to
1.1993
USD/EUR as at
December 31, 2017
and amortization of capitalized transaction costs of EUR
4,123k
. Additions to property, plant and equipment unpaid as at December 31 are reflected in trade payables.
For the year ended
December 31, 2016
the unrealized foreign exchange rate losses on the Term Loan amounted to EUR
3,283k
(net of offsetting effects due to the hedge of an net investment in a foreign operation) due to a decrease of USD foreign exchange rate from
1.0887
USD/EUR as at
December 31, 2015
to
1.0541
as at
December 31, 2016
. Additionally, amortized capitalized transaction expenses for term loans amounted to EUR
3,810k
. Additions to property, plant and equipment unpaid as at December 31 are reflected in trade payables.
For the year ended December 31, 2015 the unrealized foreign exchange rate loss on the Term Loan amounted to EUR
16,553k
(net of offsetting effects due to the hedge of an net investment in a foreign operation) due to a decrease of USD foreign exchange rate from
1.2141
USD/EUR as at December 31, 2014 to
1.0887
as at December 31, 2015. Additionally, amortized capitalized transaction expenses for term loans amounted to EUR
4,804k
. Additions to property, plant and equipment unpaid as at December 31 are reflected in trade payables.
F-47
|
(9)
|
Other notes
|
|
(9.1)
|
Capital management
|
Equity within the meaning of our capital management means invested capital. This consists of the reported equity and the Term Loans incurred less reported cash and cash equivalents.
The primary objective of the Group’s capital management is to ensure that it maintains an adequate credit rating and demonstrates an optimized cost structure to minimize cost of capital in order to support its business and maximize shareholder value, thereby safeguarding the Group’s ability to continue as a going concern. In order to achieve this overall objective, the Group’s capital management, amongst other things, observes its covenants in the credit agreement to ensure compliance with covenants at all times.
The capital management goals, guidelines and procedures as described in the following sections have remained unchanged since the Group commenced operations on July 29, 2011.
As at
December 31, 2017
and
2016
invested capital consists of the following:
|
Interest rate
|
Maturity
|
Comment
|
In EUR k
|
||||
|
As at Dec 31,
|
|||||||
|
2017
|
2016
|
||||||
|
Reported equity
|
N/A
|
N/A
|
83,262
|
|
52,882
|
|
|
|
Term Loans (see note (7.10(a)))
|
Interest after November 2017 repricing: EURIBOR / LIBOR (Floor 0.0%) plus 2.50% Margin.
|
July 25, 2024
|
1% minimum repayment / year; voluntary additional repayments
|
558,569
|
|
|
|
|
Interest as at 31 December 2016:
EURIBOR / LIBOR (Floor 0.75%) plus 3.00% Margin |
July 25, 2021
|
1% minimum repayment / year; voluntary additional repayments
|
618,059
|
|
|||
|
Cash and cash equivalents
|
N/A
|
N/A
|
N/A
|
(60,272
|
)
|
(73,907
|
)
|
|
Total invested capital
|
581,559
|
|
597,034
|
|
|||
|
(9.2)
|
Additional disclosures on financial instruments
|
The income and expenses and gains and losses from financial instruments recognized in the income statement are presented as net items by measurement category as listed in IAS 39
Financial Instruments: Recognition and Measurement
.
F-48
|
In EUR k
|
||||||||||||
|
2017
|
2016
|
2015
|
2017
|
2016
|
2015
|
|||||||
|
Loans and
receivables
|
Financial assets held
for trading / Financial assets designated as hedging instruments
|
|||||||||||
|
Income from the reversal of bad debt allowances
|
5,736
|
|
3,099
|
|
1,285
|
|
—
|
|
—
|
|
—
|
|
|
Income from the currency translation of monetary items
|
26,505
|
|
20,598
|
|
5,008
|
|
—
|
|
—
|
|
—
|
|
|
Income from the valuation of derivatives
|
—
|
|
—
|
|
—
|
|
404
|
|
217
|
|
2,202
|
|
|
Expenses from the currency translation of monetary items
|
(44,707
|
)
|
(23,498
|
)
|
(1,930
|
)
|
—
|
|
—
|
|
—
|
|
|
Expenses from the valuation of derivatives
|
—
|
|
—
|
|
—
|
|
(980
|
)
|
(999
|
)
|
(2,247
|
)
|
|
Expenses for bad debt allowances on trade receivables
|
(3,780
|
)
|
(4,585
|
)
|
(1,957
|
)
|
—
|
|
—
|
|
—
|
|
|
Result from loans and receivables
|
370
|
|
157
|
|
1,577
|
|
—
|
|
—
|
|
—
|
|
|
Other interest-like income
|
374
|
|
514
|
|
368
|
|
—
|
|
—
|
|
—
|
|
|
Total
|
(15,502
|
)
|
(3,715
|
)
|
4,351
|
|
(576
|
)
|
(782
|
)
|
(45
|
)
|
|
In EUR k
|
||||||||||||
|
2017
|
2016
|
2015
|
2017
|
2016
|
2015
|
|||||||
|
Liabilities held for
trading
|
Liabilities measured
at amortized cost
|
|||||||||||
|
Income from the currency translation of monetary items
|
—
|
|
—
|
|
—
|
|
12,834
|
|
3,878
|
|
—
|
|
|
Expenses from the currency translation of monetary items
|
—
|
|
—
|
|
—
|
|
—
|
|
—
|
|
(16,553
|
)
|
|
Expenses from the valuation of derivatives
|
(3,683
|
)
|
(11,549
|
)
|
(7,315
|
)
|
—
|
|
—
|
|
—
|
|
|
Interest expenses from loans
|
—
|
|
—
|
|
—
|
|
(24,415
|
)
|
(33,567
|
)
|
(41,174
|
)
|
|
Other interest-like expenses
|
—
|
|
—
|
|
—
|
|
(2,453
|
)
|
(1,847
|
)
|
(1,088
|
)
|
|
Total
|
(3,683
|
)
|
(11,549
|
)
|
(7,315
|
)
|
(14,034
|
)
|
(31,536
|
)
|
(58,815
|
)
|
The carrying amounts of the categories are presented in the measurement categories of IAS 39
Financial Instruments: Recognition and Measurement
and are reconciled to the carrying amounts of the items in the statement of financial position. The table below shows a comparison of the carrying amount to the fair value of each financial asset and financial liability as at
December 31, 2017
and
2016
:
F-49
|
In EUR k
|
||||||||
|
2017
|
2016
|
2017
|
2016
|
|||||
|
Carrying amount
|
Fair value
|
|||||||
|
Loans and receivables
|
||||||||
|
Trade receivables
|
195,341
|
|
190,503
|
|
195,341
|
|
190,503
|
|
|
Loans
|
574
|
|
1,357
|
|
574
|
|
1,357
|
|
|
Miscellaneous financial assets
|
2,678
|
|
3,259
|
|
2,678
|
|
3,259
|
|
|
Cash and cash equivalents
|
60,272
|
|
73,907
|
|
60,272
|
|
73,907
|
|
|
Total
|
258,865
|
|
269,026
|
|
258,865
|
|
269,026
|
|
|
Financial assets held for trading
|
||||||||
|
Receivables from derivatives
|
2,964
|
|
2,826
|
|
2,964
|
|
2,826
|
|
|
Total financial assets
|
261,829
|
|
271,852
|
|
261,829
|
|
271,852
|
|
|
Liabilities measured at amortized cost
|
||||||||
|
Term loan
|
558,569
|
|
618,059
|
|
570,528
|
|
630,581
|
|
|
Local Bank Loan
|
10,433
|
|
—
|
|
10,433
|
|
—
|
|
|
Trade payables
|
141,436
|
|
122,913
|
|
141,436
|
|
122,913
|
|
|
Other financial liabilities
|
97
|
|
202
|
|
97
|
|
202
|
|
|
Total
|
710,535
|
|
741,174
|
|
722,494
|
|
753,696
|
|
|
Liabilities held for trading
|
||||||||
|
Liabilities from derivatives
|
4,330
|
|
863
|
|
4,330
|
|
863
|
|
|
Total financial liabilities
|
714,865
|
|
742,037
|
|
726,824
|
|
754,559
|
|
The table below presents the allocation of the fair values to the fair value hierarchy levels (see note
(2.5)
Significant accounting policies
).
|
In EUR k
|
||||||||||||
|
As at Dec 31,
|
||||||||||||
|
2017
|
2016
|
2017
|
2016
|
2017
|
2016
|
|||||||
|
Level 1
|
Level 2
|
Level 3
|
||||||||||
|
Financial assets measured at fair value
|
||||||||||||
|
Receivables from derivatives
|
—
|
|
—
|
|
2,964
|
|
2,826
|
|
—
|
|
—
|
|
|
Financial liabilities measured at fair value
|
||||||||||||
|
Liabilities from derivatives
|
—
|
|
—
|
|
4,330
|
|
863
|
|
—
|
|
—
|
|
|
Liabilities for which fair values are disclosed
|
||||||||||||
|
Term loan
|
—
|
|
—
|
|
570,528
|
|
630,581
|
|
—
|
|
—
|
|
|
Local Bank Loan
|
—
|
|
—
|
|
10,433
|
|
—
|
|
—
|
|
—
|
|
The Group enters into derivative financial instruments with various counterparties, principally financial institutions with investment grade credit ratings. Derivatives valued using valuation techniques with market observable inputs are mainly foreign exchange forward contracts, commodity forward contracts and interest rate caps and swaps. The most frequently applied valuation techniques include forward pricing and swap models, using present value calculations. The models incorporate various inputs including the credit quality of counterparties, foreign exchange spot and forward rates, interest rate curves and forward
F-50
rate curves of the underlying commodity. As at
December 31, 2017
, the fair value of derivative asset positions is net of a credit valuation adjustment attributable to derivative counterparty default risk.
The fair value of our Term Loans are estimated by discounting future cash flows using rates currently available for debt on similar terms, credit risk and remaining maturities, and compared against institutional quotes.
The following table shows a current and non-current classification for foreign currency derivatives, interest rate derivatives and commodity derivatives:
|
As at Dec 31,
|
||||||||||||
|
2017
|
2016
|
2017
|
2016
|
2017
|
2016
|
|||||||
|
Total
|
Thereof current
|
Thereof non-current
|
||||||||||
|
In EUR k
|
||||||||||||
|
Receivables from foreign currency derivatives
|
559
|
|
271
|
|
559
|
|
271
|
|
—
|
|
—
|
|
|
Receivables from interest rate derivatives
|
2,207
|
|
1,022
|
|
—
|
|
—
|
|
2,207
|
|
1,022
|
|
|
Receivables from combined interest rate and foreign currency derivatives
|
—
|
|
205
|
|
—
|
|
—
|
|
—
|
|
205
|
|
|
Receivables from commodity derivatives
|
198
|
|
1,328
|
|
198
|
|
1,328
|
|
—
|
|
—
|
|
|
Total receivables from derivatives
|
2,964
|
|
2,826
|
|
757
|
|
1,599
|
|
2,207
|
|
1,227
|
|
|
Liabilities from foreign currency derivatives
|
749
|
|
—
|
|
749
|
|
—
|
|
—
|
|
—
|
|
|
Liabilities from interest rate derivatives
|
509
|
|
—
|
|
—
|
|
—
|
|
509
|
|
—
|
|
|
Liabilities from combined interest rate and foreign currency derivatives
|
3,047
|
|
—
|
|
—
|
|
—
|
|
3,047
|
|
—
|
|
|
Liabilities from commodity derivatives
|
25
|
|
863
|
|
25
|
|
863
|
|
—
|
|
—
|
|
|
Total liabilities from derivatives
|
4,330
|
|
863
|
|
774
|
|
863
|
|
3,556
|
|
—
|
|
Receivables from commodity derivatives and liabilities from commodities as at
December 31, 2017
are designated to cash flow hedges in its entirety.
According to financial risk management goals (see note
(9.3)
Financial risk management
) the group enters into derivatives. Depending on the impact on financial statements, the Group decides to account for foreign currency derivatives, interest rate derivatives and commodity derivatives as cash flow hedges if the criteria for hedge accounting are met.
In 2016 the Group has entered into commodity derivative agreements to hedge the price fluctuations of certain carbon black oil purchases and the related indexed sales which are designated as cash flow hedges to hedge the impact of raw material price fluctuations on cost of sales for specific sales. The effective portion of the change in fair value of the derivative is recorded in accumulated other comprehensive income until revenues and hence cost of sales are recorded for the specific sales.
The agreements have a term of
three months
. Specific sales follow with a time delay of up to
two months
in which the cash flows are expected to occur and profit or loss will be affected. The amount recorded in other comprehensive income as of
December 31, 2017
amount to EUR
82k
and as of
December 31, 2016
amount to EUR
752k
net of tax. During the five months both cash flow impacts occur and effects are recycled through profit and loss. The amount recognized in other comprehensive income for the year ended December 31, 2015 was EUR
nil
.
In
2017
,
net expense
of EUR
4,259k
arising from the valuation of derivatives (in
2016
net income
of EUR
218k
and in
2015
net expense
of EUR
3,414k
) was included in the financial result and in 2017
net expenses/income
of EUR
0k
(EUR
14k
and EUR
877k
in
2016
and
2015
) arising from the valuation of derivatives were included in the operating result.
In all periods presented, a total of nil unrealized losses/gains from cash flow hedges that had been recognized in other comprehensive income was reversed into finance result.
(9.3)
Financial risk management
Overview
The Group is exposed to the following risks as part of its normal business activities:
• Market risk, consisting of interest rate risk, foreign currency risk and commodity risk
F-51
• Liquidity risk
• Credit risk
The Company’s corporate policy focuses primarily on limiting these risks for the Group’s business value and the operating performance to mitigate the impact on cash flow and earnings. For this purpose, the Company established a systematic financial and risk management system. All risks are managed centrally by Orion.
Derivative financial instruments are used to reduce risk. They fully relate to the corresponding underlying. In the area of foreign currency risk management, standard market products, such as forward exchange contracts, options and swaps, are used as well as a net investment hedge.
(a)
Market risk
Market risk can generally be divided into interest rate risk, foreign currency risk and commodity risk. Foreign currency risks arise on the procurement side through the purchase of raw materials and on the sales side through the sale of end products in currencies other than the functional currencies of the relevant Group companies and through payments of foreign currency debt.
The objective of foreign currency management is to hedge the operations of these companies against income fluctuations and cash flow fluctuations arising from foreign exchange rate changes in these currencies insofar as this is economically viable and practicable. Identified items are therefore fully hedged directly after initial recognition. Contrary effects from the offsetting of credit and debit items are taken into account in the process. Foreign exchange rate fluctuations and commodity price fluctuations resulting from trade are mostly passed through to customers.
Interest rate risk
Interest rate risk management aims to protect the consolidated profit or loss from negative effects from market interest rate fluctuations.
Both Euro and U.S. Dollar denominated tranches of the Term Loans, as well as the RCF have variable interest rates based on EURIBOR or LIBOR reference rates. The Term Loans include a floor at
0.00%
per annum, i.e. the applicable minimum reference rates are set at
0.00%
per annum. To reduce interest rate risk, the Group has entered into interest rate caps and a swap on August 28, 2014, September 2, 2014, November 10, 2017, and November 14, 2017 as indicated below:
|
In Currency k
|
Nominal Amount at Year End
|
|||||||||||||
|
Currency
|
Type
|
Strike/Rate
|
Start Date
|
Expiry Date
|
2017
|
2018
|
2019
|
2020
|
2021
|
|||||
|
EUR
|
Cap
|
1%
|
12/31/2014
|
3/31/2021
|
200,000
|
|
150,000
|
|
75,000
|
|
25,000
|
|
—
|
|
|
USD
|
Cap
|
2.5%
|
12/31/2014
|
3/31/2021
|
200,000
|
|
125,000
|
|
75,000
|
|
25,000
|
|
—
|
|
|
EUR
|
Cap
|
1%
|
12/29/2017
|
12/29/2021
|
100,000
|
|
150,000
|
|
225,000
|
|
250,000
|
|
—
|
|
|
USD
|
Cap
|
2.5%
|
12/29/2017
|
12/29/2021
|
75,000
|
|
150,000
|
|
170,000
|
|
225,000
|
|
—
|
|
|
EUR
|
Floored Swap
|
0.0%/1.16%
|
12/29/2021
|
7/25/2024
|
—
|
|
—
|
|
—
|
|
—
|
|
275,000
|
|
|
Total1)
|
529,300
|
|
529,300
|
|
504,286
|
|
483,455
|
|
275,000
|
|
||||
1)USD/EUR exchange rate of
1.993
Cash flow hedges
The Group has designated, as of November 28, 2014 the entire interest rate caps entered in 2014 and denominated in EUR with an initial nominal amount of EUR
375m
against the Term Loan tranches denominated in EUR with an initial nominal amount of EUR
399m
, as well as the entire interest rate caps entered in 2014 and denominated in USD with an initial nominal amount of USD
350m
against Term Loan tranches denominated in USD with an initial nominal amount of USD
358m
with respect to quarterly interest payments exceeding a 3-months-EURIBOR rate of
1.0%
and a 3-months-USD-LIBOR rate of
2.5%
respectively. The Group has designated the entire interest rate caps and the interest rate swap at closing in November 2017 in the same manner. The Group has performed a hedge effectiveness test based on the critical terms match method (prospectively) and the dollar offset test (retrospectively), both on designation date and as of
December 31, 2017
, which confirmed hedge effectiveness.
F-52
The table below shows the sensitivity of the interest expense to changes in the interest rate, after the impact of hedge accounting. It shows the change resulting from a hypothetical fluctuation in the three-month EURIBOR and USD-LIBOR of 50 basis points (
0.50%
) as at
December 31, 2017
,
2016
and
2015
assuming that all other variables remain unchanged. Furthermore, changes in USD/EUR exchange rates would have an impact on our interest exposure and vice versa changes in interest rates would also have a related impacted on our foreign currency (USD) exposure, which is discussed below. The sensitivity analysis assumes that the hypothetical interest rate was valid and that the then existing revolving credit facilities were utilized in the full amount over the course of the entire year. The effect of this hypothetical change in the interest rate of the variable rate loan as well as a hypothetical change in interest rate of the revolving credit facilities on Orion’s consolidated profit or loss before taxes for the year ended
December 31, 2017
,
2016
and
2015
is as follows:
|
As at Dec 31,
|
||||||||||||
|
2017
|
2016
|
2015
|
||||||||||
|
Increase by
0.50%
|
Decrease by
0.50%
|
Increase by
0.50%
|
Decrease by
0.50%
|
Increase by
0.50%
|
Decrease by
0.50%
|
|||||||
|
In EUR k
|
||||||||||||
|
Increase (decrease) in the interest expense
|
651
|
|
(94
|
)
|
1,013
|
|
(622
|
)
|
(633
|
)
|
525
|
|
|
Increase (decrease) in income before taxes
|
(651
|
)
|
94
|
|
(1,013
|
)
|
622
|
|
633
|
|
(525
|
)
|
|
Increase (decrease) in equity (Cash flow hedge reserve)
|
4,429
|
|
(2,821
|
)
|
181
|
|
—
|
|
281
|
|
—
|
|
|
Increase (decrease) in total comprehensive income before taxes
|
3,778
|
|
(2,727
|
)
|
(832
|
)
|
622
|
|
914
|
|
(525
|
)
|
As of December 31, 2017 no amounts have been drawn under the current RCF.
Foreign Currency risk
Foreign currency risks stem from future cash flows related to the capital service of the U.S. Dollar denominated Term Loan, from operating activities, and from net investments in foreign subsidiaries in connection with foreign exchange rate fluctuations.
To reduce the Group’s foreign currency exposure a portion of the U.S. Dollar denominated Term Loan is designated as hedge of the net investment in a foreign operation. Effective from January 1, 2015, U.S. Dollar
180 million
was designated to cover foreign currency risks related to our U.S. business. The hedging amount is equal to the net equity amount as of December 31, 2014 of our affiliated U.S. companies. The net investment hedge accounted for an unrealized foreign exchange loss of EUR
1,238k
, net of tax, in other comprehensive income. Furthermore a Cross Currency Swap with a nominal volume of USD
30,000k
and a maturity in July 2021 was closed in January 2016. The swap reduces the foreign currency exposure of the U.S. Dollar denominated Term Loan. Notwithstanding a voluntary repayment of EUR
20 million
and a scheduled repayment of
1%
in 2017, the Euro-equivalent of the U.S. Dollar Term Loan decreased from EUR
285,558k
to EUR
240,495k
as a result of repayments and U.S. Dollar exchange rate fluctuation.
The table below shows the sensitivity with regard to the effect of a change in the USD/EUR exchange rate using the outstanding USD equivalent amount as of December 31, 2017 of EUR
240,495k
less the designated net investment hedge of U.S. Dollar
180 million
for the U.S. Dollar-denominated term loan. Furthermore, changes in interest rates would have an impact on our USD exposure and vice versa changes in USD/EUR currency rate would also have a related impact on our interest exposure which is discussed above.
F-53
A fluctuation of the USD/EUR exchange rate of
10%
with other conditions remaining unchanged would have had the following effect on Orion’s consolidated profit or loss before taxes as at
December 31, 2017
,
2016
and
2015
:
|
In EUR k
|
Value of the Euro in relation to the U.S. Dollar
|
|||||||||||
|
Increase by
10%
|
Decrease by
10%
|
Increase by
10%
|
Decrease by
10%
|
Increase by
10%
|
Decrease by
10%
|
|||||||
|
2017
|
2016
|
2015
|
||||||||||
|
FX gain / (FX loss) in finance result
|
8,219
|
|
(10,045
|
)
|
10,436
|
|
(12,755
|
)
|
12,240
|
|
(14,960
|
)
|
|
Increase (decrease) in income before taxes
|
8,219
|
|
(10,045
|
)
|
10,436
|
|
(12,755
|
)
|
12,240
|
|
(14,960
|
)
|
|
Increase (decrease) in equity (Reserve for hedges of a net investment in foreign operation)
|
13,644
|
|
(16,676
|
)
|
15,524
|
|
(18,974
|
)
|
15,030
|
|
(18,371
|
)
|
|
Increase (decrease) in total comprehensive income before taxes
|
21,863
|
|
(26,721
|
)
|
25,960
|
|
(31,729
|
)
|
27,270
|
|
(33,331
|
)
|
Commodity risk
Commodity risks arise from changes in the market prices of raw material purchases and the sale of end products and electricity.
Raw materials are purchased exclusively to cover own requirements.
The Group manages commodity risk centrally for all business units. It records procurement risks and defines effective measures to minimize risk.
As an example, price volatility is offset by means of price adjustment clauses in supply agreements with customers. The price risk mainly relates to the oil price, which significantly influences the purchase prices of the Group’s raw materials. If possible, this oil price effect is passed through on the sales side by way of appropriate price adjustment clauses. However, a time delay remains since the Group only makes price adjustments on certain deferred cut-off dates. The residual risk arising from this time delay is monitored continuously. Currently, there are derivative financial instruments utilized to minimize the risk from the time delay in the Korean business while risks in other regions were minimized significantly by reducing the time needed for price adjustments.
In addition to the change in the market prices of relevant raw materials and primary and intermediate products, their availability is an important factor. The Group endeavors to reduce purchasing risks on the procurement markets through worldwide purchasing activities and optimized processes for the purchase of additional raw materials.
(b)
Liquidity risk
Liquidity risk is managed centrally on the basis of the business plan that ensures that the funds required for financing the business operations and current and future investments in all group entities are available in a timely manner and in the currency required at optimal costs.
As part of the liquidity risk management process, the liquidity requirements for business operations, investing activities and other financing measures are analyzed and a liquidity plan is formulated.
Orion held the following liquid funds as at
December 31, 2017
and
2016
:
Cash and cash equivalents: EUR
60,272k
and EUR
73,907k
, respectively
Revolving credit facility, undrawn: EUR
175,000k
The following tables show the residual terms of our Term Loan and its impact on our cash flows based on the agreed maturity date, the repayment schedule, and the total interest amounts. Implied three months EUR forward interest rates and implied USD forward interest rates starting on
December 31, 2017
were used to calculate the repayment amounts.
F-54
As at
December 31, 2017
:
|
In EUR mill
|
2018
|
2019
|
2020
|
2021
|
Thereafter
|
Total
|
||||||
|
Debt:
1
|
||||||||||||
|
to third parties
|
7.0
|
|
7.0
|
|
7.0
|
|
7.0
|
|
542.6
|
|
570.5
|
|
|
Borrowing cost:
2
|
||||||||||||
|
to third parties
|
19.0
|
|
19.6
|
|
20.4
|
|
21.0
|
|
56.4
|
|
136.4
|
|
|
Total
|
26.0
|
|
26.5
|
|
27.3
|
|
28.0
|
|
599.0
|
|
707.0
|
|
1)
USD/EUR of
1.1993
exchange rate assumed at the date of repayment
2)
Interest denominated in U.S. Dollar is translated at a rate of USD/EUR of
1.1993
The following table shows the residual terms of our Term Loan and his impact on our cash flows based on their agreed maturity dates and the total interest and repayment amounts in the prior year:
As at
December 31, 2016
:
|
In EUR mill
|
2017
|
2018
|
2019
|
2020
|
Thereafter
|
Total
|
||||||
|
Debt:
1
|
||||||||||||
|
to third parties
2
|
26.9
|
|
7.4
|
|
7.4
|
|
7.4
|
|
581.5
|
|
630.6
|
|
|
Borrowing cost:
3
|
||||||||||||
|
to third parties
|
24.3
|
|
25.5
|
|
26.1
|
|
26.4
|
|
21.5
|
|
123.9
|
|
|
Total
|
51.2
|
|
32.9
|
|
33.5
|
|
33.8
|
|
603.0
|
|
754.5
|
|
1)
USD/EUR of
1.0541
exchange rate is assumed at the date of repayment
2)
Includes EUR
20m
voluntary debt repayment voluntarily in January 2017
3)
Interest denominated in U.S. Dollar is translated at a rate of USD/EUR of
1.0541
(c)
Credit risk
Our maximum credit risk equals to the total carrying amount of our financial assets.
For the purpose of credit risk management, credit risks are divided into
three
categories and treated according to their specific features:
•
Credit risks for debtors,
•
country risks and
•
credit risks at financing partners.
The Group manages credit risks centrally for all business units.
A comprehensive internal limit system is used to analyze and monitor debtor credit risk on an ongoing basis.
Export orders are subjected to an additional political risk (country risk) analysis, producing an overall risk made up of political and economic risks. Deliveries to customers based in countries with high risk are generally covered by letters of credit or a credit insurance. As at
December 31, 2017
,
44
customers owed Orion more than EUR
1m
each, which accounted for
53%
(prior year:
37
customers accounting for
56%
) of outstanding receivables.
Three
customers had outstanding accounts of more than EUR
5m
, representing
11%
(prior year:
three
customers representing
17%
) of total receivables.
Due to the variety of transactions and the large number of customers, there are no significant risk concentrations.
For financing partners, a specific limit for each risk type (money market, capital market and derivatives) is utilized.
As part of the credit analysis, maximum limits are set for each contracting partner. To this end, the Company uses ratings of international rating agencies and its own internal credit checks.
F-55
The following table shows the reconciliation and evaluation of changes in liabilities arising from financing activities, for both periods 2017 and 2016.
|
In EUR k
|
As at Jan 1, 2016
|
Cash flows (w/o interest payments)
|
Transfer
|
FX movement P&L
|
FX movement OCI
|
Other
|
As at Dec 31, 2016
|
|||||||
|
Term loan
|
650,564
|
|
(41,976
|
)
|
(4,526
|
)
|
3,538
|
|
5,427
|
|
505
|
|
613,533
|
|
|
Liabilities under finance leases
|
218
|
|
(102
|
)
|
—
|
|
—
|
|
—
|
|
10
|
|
126
|
|
|
Non-current liabilities from financing activities
|
650,782
|
|
(42,078
|
)
|
(4,526
|
)
|
3,538
|
|
5,427
|
|
516
|
|
613,659
|
|
|
Current interest-bearing liabilities
|
4,525
|
|
(7,259
|
)
|
4,526
|
|
(20
|
)
|
—
|
|
2,754
|
|
4,526
|
|
|
Current liabilities under finance leases
|
62
|
|
—
|
|
—
|
|
—
|
|
—
|
|
4
|
|
67
|
|
|
Current liabilities from financing activities
|
4,587
|
|
(7,259
|
)
|
4,526
|
|
(20
|
)
|
—
|
|
2,758
|
|
4,593
|
|
|
Total
|
655,369
|
|
(49,337
|
)
|
—
|
|
3,518
|
|
5,427
|
|
3,274
|
|
618,252
|
|
|
In EUR k
|
As at Jan 1, 2017
|
Cash flows (w/o interest payments)
|
Transfer
|
FX movment P&L
|
FX movement OCI
|
Other
|
As at Dec 31, 2017
|
|||||||
|
Term loan
|
613,533
|
|
(22,402
|
)
|
(5,007
|
)
|
(12,533
|
)
|
(20,674
|
)
|
644
|
|
553,562
|
|
|
Local bank loans
|
—
|
|
9,995
|
|
—
|
|
—
|
|
423
|
|
—
|
|
10,418
|
|
|
Liabilities under finance leases
|
126
|
|
(88
|
)
|
—
|
|
—
|
|
—
|
|
8
|
|
45
|
|
|
Non-current liabilities from financing activities
|
613,659
|
|
(12,495
|
)
|
(5,007
|
)
|
(12,533
|
)
|
(20,251
|
)
|
651
|
|
564,025
|
|
|
Current interest-bearing liabilities
|
4,526
|
|
(7,112
|
)
|
5,007
|
|
(275
|
)
|
—
|
|
2,876
|
|
5,022
|
|
|
Current liabilities under finance leases
|
67
|
|
(21
|
)
|
—
|
|
—
|
|
—
|
|
—
|
|
46
|
|
|
Financing related derivatives
|
—
|
|
—
|
|
—
|
|
—
|
|
—
|
|
3,555
|
|
3,555
|
|
|
Current liabilities from financing activities
|
4,593
|
|
(7,133
|
)
|
5,007
|
|
(275
|
)
|
—
|
|
6,431
|
|
8,622
|
|
|
Total
|
618,252
|
|
(19,628
|
)
|
—
|
|
(12,807
|
)
|
(20,251
|
)
|
7,083
|
|
572,648
|
|
Financing related derivatives contain a floored cross-currency swap as well as of a floored forward interest rate swap in 2017. Other changes mainly consist of the release of transaction costs in the reporting period and fair value changes with regard to the financing related derivatives.
F-56
|
(9.4)
|
Related parties
|
Related parties include
one
joint venture of Orion that is accounted for using the equity method. Until December 8, 2017 Kinove Holdings and a co-investor as former majority shareholders of Orion Engineered Carbons S.A. and the shareholders of Kinove Holdings were related parties. In a series of secondary public offerings in 2017 Kinove Holdings and the co-investor sold their entire shareholdings in Orion Engineered Carbons S.A. to public shareholders. Therefore Kinove Holdings, the co-investor and the shareholders of Kinove Holdings are unrelated to Orion as of December 9, 2017.
Related parties include key management personnel having authority and responsibility for planning, directing and monitoring the activities of the Group directly or indirectly and their close family members.
Since the beginning of 2012, certain members of the administrative board, corporate management and senior management (the co-invested managers) have acquired shares on the basis of a co-investment program (CIP) of Kinove Luxembourg Coinvest S.C.A. which held
10%
of the shares in Orion Engineered Carbons S.A which were fully sold in connection with the series of secondary public offerings in 2017 to public shareholders. The CIP qualified as an equity settled share-based payment plan because the terms and conditions under which the participating managers acquired the shares include defined lock-up periods and neither Orion Engineered Carbons S.A. nor any other group entity had an obligation to settle the share-based payment. No expenses were recognized in profit or loss as consideration for the services received by the co-invested managers.
Expenses for remuneration to key management personnel amounted to EUR
13,454k
, EUR
9,525k
and EUR
6,052k
respectively, for the years ended
December 31, 2017
,
2016
and
2015
and comprised - except for the pension benefits and the share-based payments - exclusively short-term benefits. The following table presents compensation, including social security costs, pension expenses and other personnel expenses for the years
2015
through
2017
:
|
In EUR k
|
||||
|
Years ended Dec 31,
|
||||
|
2017
|
2016
|
2015
|
||
|
Wages & salaries
|
5,886
|
5,458
|
4,253
|
|
|
Social security costs
|
140
|
128
|
114
|
|
|
Pension expenses
|
498
|
443
|
357
|
|
|
Other personnel expenses
|
757
|
782
|
421
|
|
|
Share based payments
|
6,173
|
2,714
|
907
|
|
|
Total
|
13,454
|
9,525
|
6,052
|
|
In the normal course of business Orion from time to time receives services from, or sells products to, other related unconsolidated parties, in transactions that are either not material or approved in accordance with our Related Party Transaction Approval Policy. In addition, Orion purchased carbon black products for retail from the DGW KG joint venture for an aggregate amount of EUR
70,169k
(
2016
and
2015
EUR
52,194k
and EUR
58,368k
). Payables to DGW KG amount to EUR
16,352k
at year end (Prior year: EUR
10,353k
). Sales and service provided to DGW KG in year ended
December 31, 2017
,
2016
and
2015
amounted to EUR
2,325k
, EUR
2,428k
and EUR
2,453k
. Receivables from DGW KG at
December 31, 2017
and
2016
were EUR
448k
and EUR
214k
.
F-57
|
(9.5)
|
Contingent liabilities and other financial obligations
|
As at
December 31, 2017
and
2016
contingent liabilities and other financial obligations break down as follows:
The nominal amounts of obligations from future minimum lease payments for assets leased under operating lease agreements have the following maturity:
|
Maturity
|
In EUR k
|
|||
|
As at Dec 31,
|
||||
|
2017
|
2016
|
|||
|
Less than one year
|
4,404
|
|
4,058
|
|
|
1 to 2 years
|
5,927
|
|
2,853
|
|
|
2 to 3 years
|
5,476
|
|
2,752
|
|
|
3 to 4 years
|
1,241
|
|
2,339
|
|
|
4 to 5 years
|
1,088
|
|
2,402
|
|
|
More than 5 years
|
9,635
|
|
6,181
|
|
|
Total
|
27,771
|
|
20,585
|
|
To safeguard the supply of raw materials, contractual purchase commitments under long-term supply agreements for raw materials, especially oil and gas, are in place with the following maturities:
|
Maturity
|
In EUR k
|
|||
|
As at Dec 31,
|
||||
|
2017
|
2016
|
|||
|
Less than one year
|
91,059
|
|
147,857
|
|
|
1 to 5 years
|
197,314
|
|
227,074
|
|
|
More than 5 years
|
0
|
|
38,435
|
|
|
Total
|
288,373
|
|
413,366
|
|
EPA Action
During 2008 and 2009, the U.S. Environmental Protection Agency (“EPA”) contacted all U.S. carbon black producers as part of an industry-wide EPA initiative, requesting extensive and comprehensive information under Section 114 of the U.S. Clean Air Act, to determine, for each facility, that either: (i) the facility has been in compliance with the Clean Air Act; (ii) violations have occurred and enforcement litigation may be undertaken; or (iii) violations have occurred and a settlement of an enforcement case is appropriate. In response to information requests received by the Company’s U.S. facilities, the Company furnished information to the EPA on each of its U.S. facilities. The Company’s Belpre (Ohio) facility was an initial subject of these investigations and received notices under Section 113(a) of the Clean Air Act from the EPA in 2010 alleging violations of Prevention of Significant Deterioration (“PSD”) and Title V permitting requirements under the Clean Air Act. In October 2012, the Company received a corresponding notice and finding of violation (an “NOV”) alleging the failure to obtain PSD and Title V permits reflecting Best Available Control Technology (“BACT”) at several units of the Company’s Ivanhoe (Louisiana) facility. In January 2013 the Company also received an NOV issued by the EPA for its facility in Borger (Texas) alleging the failure to obtain PSD and Title V permits reflecting BACT during the years 1996 to 2008. The Company received a comparable NOV from the EPA for the Company’s U.S. facility in Orange (Texas) in February 2013; and an NOV in March 2016 alleging more recent non-PSD air emissions violations primarily at the dryers and the incinerator of the Orange facility.
In November 2013, Orion began discussions with the EPA and the U.S. Department of Justice (“DOJ”) about a potential settlement to resolve the NOVs. On December 22, 2017, a consent decree between Orion Engineered Carbons LLC (“Orion”) and the United States (on behalf of EPA), as well as the Louisiana Department of Environmental Quality, was lodged in the U.S. District Court for the Western District of Louisiana. Once the consent decree is entered by the court, it will resolve and settle the EPA’s claims of noncompliance set forth in the NOVs and in a respective complaint filed in court by the United States that same day. All
five
U.S. carbon black producers have settled with the U.S. government. Orion was
one
of the
two
last carbon black companies to sign a consent decree.
F-58
Under its consent decree, Orion will install certain pollution control technology in order to further reduce SO2, NOx and particulate matter (PM) emissions at its four U.S. manufacturing facilities in Ivanhoe (Louisiana), Belpre (Ohio), Borger (Texas), and Orange (Texas). Orion estimates that the capital expenditures for these installments, to be incurred over approximately
six
years, are U.S. Dollar
110
to
140
million. Orion also agreed to pay a civil penalty of $
800,000
and to perform environmental mitigation projects totaling $
550,000
. The penalty and mitigation project costs are in line with the respective reserves already established by the Company for this purpose. The consent decree also requires the continuous monitoring of emissions reductions by the ÈPA that Orion will need to comply with over a number of years. Noncompliance with applicable emissions limits would lead to further penalty payments to EPA.
We caution, however, that the actual capital expenditures we might need to incur in order to fulfill the requirements of the consent decree remain uncertain. In particular, the consent decree allows some flexibility in both locations and technology solutions. The solutions we choose to implement may differ in scope and operation from those we currently anticipate and factors, such as timing, locations, target levels and local regulations, could also make capital expenditures different from what we currently estimate.
Orion’s agreement with Evonik in connection with the Acquisition provides for a partial indemnity from Evonik against various exposures, including, but not limited to, capital investments, fines and costs arising in connection with Clean Air Act violations that occurred prior to July 29, 2011. Except for certain relatively less relevant allegations contained in the second NOV received for the Company’s facility in Orange (Texas) in March 2016, all of the other allegations made by the EPA with regard to all
four
of the Company’s U.S. facilities - as discussed above - relate to alleged violations before July 29, 2011. The indemnity provides for a recovery from Evonik of a share of the costs (including fines), expenses (including reasonable attorney’s fees, but excluding costs for maintenance and control in the ordinary course of business and any internal cost of monitoring the remedy), liabilities, damages and losses suffered and is subject to various contractual provisions including provisions set forth in the Share Purchase Agreement with Evonik, such as a de minimis clause, a basket, overall caps (which apply to all covered exposures and all covered environmental exposures, in the aggregate), damage mitigation and cooperating requirements, as well as a statute of limitations provision. Due to the cost-sharing and cap provisions in Evonik’s indemnity, the Company expects that substantial costs it will incur in this EPA enforcement initiative and its respective settlement could exceed the scope of the indemnity, perhaps in the tens of millions of Euros. In addition, Evonik has signaled that it may likely defend itself against claims under the indemnity; while the Company intends to enforce its rights vigorously, there is no assurance that the Company will be able to recover costs or expenditures incurred under the indemnity as it expects or at all.
Pledges and guarantees
The following group companies jointly and severally declared a first ranking pledge over the collection of assets in separate agreements for the lenders of the Term Loans and the RCF on July 25, 2014:
|
•
|
Orion Engineered Carbons Holdco S. A. S.
|
|
•
|
Orion Engineered Carbons S. A. S.
|
|
•
|
Orion Engineered Carbons Holdings GmbH
|
|
•
|
Orion Engineered Carbons Bondco GmbH
|
|
•
|
Orion Engineered Carbons GmbH
|
|
•
|
Orion Engineered Carbons International GmbH
|
|
•
|
Orion Engineered Carbons Holdco S. r. l.
|
|
•
|
Orion Engineered Carbons S. r. l.
|
|
•
|
Orion Engineered Carbons Korea Co.,Ltd.
|
|
•
|
Orion Engineered Carbons Co.,Ltd.
|
|
•
|
Orion Engineered Carbons S.A.
|
|
•
|
Orion Engineered Carbons sp. z o.o.
|
|
•
|
Orion Engineered Carbons Holdco AB
|
|
•
|
Norcarb Engineered Carbons AB
|
F-59
|
•
|
Orion Engineered Carbons USA Holdco LLC
|
|
•
|
Orion Engineered Carbons LLC
|
The pledge serves as collateral for claims arising under the finance documents, including the credit agreement dated July 25, 2014 as amended from time to time. The current principal amounts of the outstanding term loans under the Credit Agreement are USD
288 million
(U.S. Dollar Term Loan), and EUR
320 million
(Euro Term Loan).
As at
December 31, 2017
Orion Engineered Carbons GmbH has
four
guarantees issued by Euler Hermes S.A. with a total volume of EUR
17,588k
(in prior year
three
guarantees by Euler Hermes S.A. of EUR
14,598k
);
one
guarantee insurance issued by Deutsche Bank AG with a volume of EUR
2,000k
(in prior year
one
guarantee issued by HSBC AG with a volume of EUR
2,000k
). In addition there is cash collateral provided by Norcarb Engineered Carbons AB of EUR
30k
.
No
ne of these guarantees reduce the possible utilization limit of the current RCF.
|
(10)
|
Events after the reporting date
|
On February 14, 2018, the Company signed a contract to sell its real estate in Bupyeong (South Korea).Title transfer will occur after both sides meet certain agreed conditions; the transaction will be complete after related site demolition and remediation are performed which is expected to be completed by end of 2018. The agreed sales price is expected to at least cover the carrying value of land and buildings as well as the expected cost to be incurred to fulfill our remediation obligation.
Luxembourg, February 22, 2018
Orion Engineered Carbons S.A.
The Management
|
Jack Clem
|
Charles Herlinger
|
|
F-60
|
Exhibit No.
|
Description
|
|
|
1.1
|
||
|
2.1
|
||
|
4.1
|
||
|
4.2
|
||
|
4.3
|
||
|
4.4
|
||
|
8.1
|
||
|
12.1
|
||
|
12.2
|
||
|
13.1
|
||
|
13.2
|
||
|
15.1
|
||
|
101.INS
|
XBRL Instance Document
|
|
|
101.SCH
|
XBRL Taxonomy Extension Schema Document
|
|
|
101.CAL
|
XBRL Taxonomy Extension Calculation Linkbase Document
|
|
|
101.DEF
|
XBRL Taxonomy Extension Definition Linkbase Document
|
|
|
101.LAB
|
XBRL Taxonomy Extension Label Linkbase Document
|
|
|
101.PRE
|
XBRL Taxonomy Extension Presentation Linkbase Document
|
|
F-61
SIGNATURES
The registrant hereby certifies that it meets all the requirements for filing on Form 20-F and that it has duly caused and authorized the undersigned to sign this annual report on its behalf.
|
February 22, 2018
|
ORION ENGINEERED CARBONS S.A.
|
|
|
By
|
/s/ Charles Herlinger
|
|
|
Name: Charles Herlinger
|
||
|
Title: Chief Financial Officer
|
||
F-62
TABLE OF CONTENTS
Part IItem 1. Identity Of Directors, Senior Management and AdvisersItem 2. Offer Statistics and Expected TimetableItem 3. Key InformationItem 4. Information on The CompanyItem 18. Financial StatementsItem 4. Information on The Company B. Business Overview Environmental, Health and Safety MattersItem 5. Operating and Financial Review and ProspectsItem 4A. Unresolved Staff CommentsItem 4. Information on The Company B. Business Overview InnovationItem 6. Directors, Senior Management and EmployeesItem 7. Major Shareholders and Related Party TransactionsItem 8. Financial InformationItem 9. The Offer and ListingItem 10. Additional InformationItem 11. Quantitative and Qualitative Disclosures About Market RiskItem 12. Description Of Securities Other Than Equity SecuritiesItem 13. Defaults, Dividend Arrearages and DelinquenciesItem 14. Material Modifications To The Rights Of Security Holders and Use Of ProceedsItem 15. Controls and ProceduresItem 16A. Audit Committee Financial ExpertItem 16B. Code Of EthicsItem 16C. Principal Accountant Fees and ServicesItem 16D. Exemptions From The Listing Standards For Audit CommitteesItem 16E. Purchases Of Equity Securities By The Issuer and Affiliated PurchasersItem 16F. Change in Registrant S Certifying AccountantItem 16G. Corporate GovernanceItem 16H. Mine Safety DisclosurePart IIItem 17. Financial StatementsItem 19. Exhibits