ORION ENERGY SYSTEMS, INC.
10-Ks and 10-Qs
|
|
|
|
|
|
|
|
|
|
|
|
|
|
|
|
|
|
|
|
|
|
|
|
|
|
|
|
|
|
|
|
|
|
|
|
|
|
|
|
|
|
|
|
|
|
|
|
|
|
|
|
|
|
|
|
|
|
|
UNITED STATES
SECURITIES AND EXCHANGE COMMISSION
Washington, D.C. 20549
______________________________
Form 10-K
|
ý
|
ANNUAL REPORT PURSUANT TO SECTION 13 OR 15(d) OF THE SECURITIES EXCHANGE ACT OF 1934
|
|
For the fiscal year ended March 31, 2014
|
|
or
|
¨
|
TRANSITION REPORT PURSUANT TO SECTION 13 OR 15(d) OF THE SECURITIES EXCHANGE ACT OF 1934
|
|
For the transition period from to
|
|
Commission File Number: 001-33887
______________________________
Orion Energy Systems, Inc.
(Exact name of Registrant as specified in its charter)
|
Wisconsin
|
|
39-1847269
|
|
(State or other jurisdiction of
incorporation or organization)
|
|
(I.R.S. Employer
Identification No.)
|
|
2210 Woodland Drive, Manitowoc, WI
|
|
54220
|
|
(Address of principal executive offices)
|
|
(Zip Code)
|
(920) 892-9340
(Registrant’s telephone number, including area code)
Securities registered pursuant to Section 12(b) of the act:
|
Title of Each Class
|
Name of Each Exchange on Which Registered
|
|
Common stock, no par value
|
NYSE MKT LLC
|
|
Common stock purchase rights
|
NYSE MKT LLC
|
Securities registered pursuant to Section 12(g) of the act:
None
______________________________
Indicate by check mark if the Registrant is a well-known seasoned issuer as defined in Rule 405 of the Securities Act. Yes
¨
No
ý
Indicate by check mark if the Registrant is not required to file reports pursuant to Section 13 or 15(d) of the Act. Yes
¨
No
ý
Indicate by check mark whether the Registrant (1) has filed all reports required to be filed by Section 13 or 15(d) of the Securities Exchange Act of 1934 during the preceding 12 months (or for such shorter period that the registrant was required to file such reports), and (2) has been subject to such filing requirements for the past 90 days. Yes
ý
No
¨
Indicate by check mark whether the registrant has submitted electronically and posted on its corporate Web site, if any, every Interactive Data File required to be submitted and posted pursuant to Rule 405 of Regulation S-T (§232.405 of this chapter) during the preceding 12 months (or for such shorter period that the registrant was required to submit and post such files. Yes
ý
No
¨
Indicate by check mark if disclosure of delinquent filers pursuant to Item 405 of Regulation S-K (§ 229.405 of this chapter) is not contained herein, and will not be contained, to the best of registrant’s knowledge, in definitive proxy or information statements incorporated by reference in Part III of this Form 10-K or any amendment to this Form 10-K.
¨
Indicate by check mark whether the registrant is a large accelerated filer, an accelerated filer, a non-accelerated filer, or a smaller reporting company. See the definitions of “large accelerated filer,” “accelerated filer” and “smaller reporting company” in Rule 12b-2 of the Exchange Act. (Check one):
|
Large accelerated filer
|
¨
|
Accelerated filer
|
o
|
|
Non-accelerated filer
|
o
(Do not check if a smaller reporting company)
|
Smaller reporting company
|
ý
|
Indicate by check mark whether the Registrant is a shell company (as defined in Rule 12b-2 of the Exchange Act). Yes
¨
No
ý
The aggregate market value of shares of the Registrant’s common stock held by non-affiliates as of September 30,
2013
, the last business day of the Registrant’s most recently completed second fiscal quarter, was approximately
$63,021,360,000
.
A
s of
June 6, 2014
, there were
21,737,724
share
s of the Registrant’s common stock outstanding.
______________________________
DOCUMENTS INCORPORATED BY REFERENCE
Portions of the Registrant's Proxy Statement for the 2014 Annual Meeting of Shareholders to be held on August 6, 2014 are incorporated herein by reference in Part III of this Annual Report on Form 10-K.
FORWARD-LOOKING STATEMENTS
This Form 10-K includes forward-looking statements that are based on our beliefs and assumptions and on information currently available to us. When used in this Form 10-K, the words “anticipate,” “believe,” “could,” “estimate,” “expect,” “intend,” “may,” “plan,” “potential,” “predict,” “project,” “should,” “will,” “would” and similar expressions identify forward-looking statements. Although we believe that our plans, intentions, and expectations reflected in any forward-looking statements are reasonable, these plans, intentions or expectations are based on assumptions, are subject to risks and uncertainties, and may not be achieved. These statements are based on assumptions made by us based on our experience and perception of historical trends, current conditions, expected future developments and other factors that we believe are appropriate under the current circumstances. Such statements are subject to a number of risks and uncertainties, many of which are beyond our control. Our actual results, performance or achievements could differ materially from those contemplated, expressed or implied by the forward-looking statements contained in this Form 10-K. Important factors could cause actual results to differ materially from our forward-looking statements. Given these uncertainties, you should not place undue reliance on these forward-looking statements. Also, forward-looking statements represent our beliefs and assumptions only as of the date of this Form 10-K, including particularly the Risk Factors described under Part I. Item 1A of this Form 10-K. All forward-looking statements attributable to us or persons acting on our behalf are expressly qualified in their entirety by the cautionary statements set forth in this Form 10-K. Actual events, results and outcomes may differ materially from our expectations due to a variety of factors. Although it is not possible to identify all of these factors, they include, among others, the following:
|
•
|
our development of, and participation in, new product and technology offerings or applications, including customer acceptance of our new LED product line;
|
|
•
|
deterioration of market conditions, including our dependence on customers' capital budgets for sales of products and services;
|
|
•
|
our ability to compete and execute our strategy in a highly competitive market and our ability to respond successfully to market competition;
|
|
•
|
our ability to effectively manage the acquisition of Harris Manufacturing, Inc. and Harris LED, LLC and our ability to successfully complete and fund potential future acquisitions.
|
|
•
|
adverse developments with respect to litigation and other legal matters that we are subject to;
|
|
•
|
increasing duration of customer sales cycles;
|
|
•
|
the market acceptance of our products and services;
|
|
•
|
our ability to recruit and hire sales talent to increase our in-market sales;
|
|
•
|
price fluctuations, shortages or interruptions of component supplies and raw materials used to manufacture our products;
|
|
•
|
loss of one or more key customers or suppliers, including key contacts at such customers;
|
|
•
|
our ability to effectively manage our product inventory to provide our products to customers on a timely basis;
|
|
•
|
our ability to effectively manage the credit risk associated with our debt funded Orion Throughput Agreement contracts;
|
|
•
|
a reduction in the price of electricity;
|
|
•
|
the cost to comply with, and the effects of, any current and future government regulations, laws and policies;
|
|
•
|
increased competition from government subsidies and utility incentive programs;
|
|
•
|
the availability of additional debt financing and/or equity capital; and
|
|
•
|
potential warranty claims.
|
You are urged to carefully consider these factors and the other factors described under Part I. Item 1A. “Risk Factors” when evaluating any forward-looking statements, and you should not place undue reliance on these forward-looking statements.
Except as required by applicable law, we assume no obligation to update any forward-looking statements publicly or to update the reasons why actual results could differ materially from those anticipated in any forward-looking statements, even if new information becomes available in the future.
2
ORION ENERGY SYSTEMS, INC.
ANNUAL REPORT ON FORM 10-K
FOR THE YEAR ENDED
MARCH 31, 2014
Table of Contents
|
|
Page
|
3
|
ITEM 1.
|
BUSINESS
|
As used herein, unless otherwise expressly stated or the context otherwise requires, all references to “Orion,” “we,” “us,” “our,” “Company” and similar references are to Orion Energy Systems, Inc. and its consolidated subsidiaries.
Overview
We are a leading provider of energy efficient lighting retrofit products and services. We research, develop, design, manufacture, market, sell and implement energy management systems consisting primarily of high-performance, energy efficient commercial and industrial interior and exterior lighting systems, controls, power data management and cloud-based data storage and related services. Our products are targeted for applications in three primary market segments: commercial office and retail, area lighting and industrial high bay, although we do sell and install products into other markets. Virtually all of our sales occur within North America.
Our lighting products consist primarily of light emitting diode, or LED, and high intensity fluorescent, or HIF, lighting fixtures. Our principal customers include national accounts, energy service companies, electrical contractors and electrical distributors. Substantially all of our products are manufactured at our production facility located in Wisconsin.
We previously marketed and implemented renewable energy systems consisting primarily of solar generating photovoltaic, or PV, systems and wind turbines. During fiscal 2013 and fiscal 2014, we experienced a significant reduction in new solar PV orders. We attribute this to reduced cash incentives and declining pricing in the renewable energy credit markets. During fiscal 2014, we deemphasized our efforts to obtain new PV construction contracts and focused on the completion of previously received orders within our solar backlog, which has decreased from $36.1 million at the beginning of our fiscal 2013 to $1.1 million as of March 31, 2014. We expect this trend to continue through fiscal 2015. In response to this solar order decline and our decision not to pursue new PV orders, we redeployed personnel to focus on the opportunities within the LED retrofit market.
We believe the market for lighting products may be entering a significant technology shift to LED lighting systems. LED lighting technology allows for better optical performance, significantly reduced maintenance costs due to performance longevity, reduced energy consumption and flexibility in application. We continue to research and develop LED technologies and expect that, as LED performance continues to increase and product costs decrease, LED lighting technologies will become an increasingly larger component of our future revenue. According to a May 2013 United States Department of Energy report, we estimate the potential North American LED retrofit market within our key product categories to be approximately 1.1 billion lighting fixtures. In fiscal 2014, our LED lighting sales totaled $4.8 million or 7.2% of our total lighting revenue, compared to $1.9 million, or 2.8% of our total lighting revenue for fiscal 2013.
Fiscal 2014 Developments
In July 2013, we completed the acquisition of the equity interests of Harris Manufacturing, Inc. and Harris LED, LLC, or collectively, Harris. Harris engineers, designs, sources and manufactures energy efficient lighting systems, including fluorescent and LED lighting solutions, and day-lighting products. The Harris acquisition has expanded our product lines, increased our sales force and provided growth opportunities into markets where we did not have a strong presence, specifically, new construction, retail store fronts, commercial office and government. The preliminary purchase price for the transaction was $10.8 million, after an adjustment of $0.2 million for excess net working capital over a targeted amount. Harris had revenue of approximately $14.7 million and net income of approximately $0.9 million during the year ended December 31, 2012. During the nine months following the acquisition from July 1, 2013 to March 31, 2014, Harris had revenue of $9.4 million and an operating loss of $(0.5) million. Included in the $(0.5) million loss was $0.6 million of expense for intangible amortization and $0.3 million of expense for compensation related to deferred consideration. We expect the transaction to continue to be accretive to our earnings during fiscal 2015 after adjusting for non-cash amortization of intangible assets acquired and purchase accounting expenses for deferred compensation.
We acquired certain LED technologies through the acquisition of Harris which complement our existing portfolio of LED lighting products. In particular, Harris' LED door retrofit, or LDR, product is designed to retrofit commercial office and retail space, a market in which we have historically recognized little revenue contribution. Since the acquisition of Harris, our engineering and design teams have worked to expand the LDR product line to include architectural, industrial and contractor product categories.
During fiscal 2014, we sold our leased corporate jet which resulted in a $1.4 million loss, including employee severance expenses, but will result in approximately $1.5 million in annualized cost savings. Additionally, during fiscal 2014, we recorded a $2.3 million benefit against our valuation allowance to offset deferred tax liabilities acquired from Harris.
During fiscal 2014, we actively expanded our in-market sales force. Our in-market sales force is responsible for the development of indirect resellers within their territory, along with a continued focus on selling directly to end customers within their territory. We expect to continue to increase our sales headcount during fiscal 2015. We expect that these additional costs will
4
increase our overall sales and marketing expense in fiscal 2015 by approximately $2.3 million and that the net benefit of these additions and our implemented cost containment initiatives will result in reduced annual expense of approximately $4.0 million.
Prospective Change in Reportable Segments
As of March 31, 2014, we operated in two business segments, which we refer to as our energy management division and our engineered systems division. Reportable segments are components of an entity that have separate financial data that the entity's chief operating decision maker, or CODM, regularly reviews when allocating resources and assessing performance. Our CODM is our chief executive officer.
Beginning in fiscal 2015, we intend to reorganize our business into the following business segments: U.S. markets, Orion engineered systems and Orion distribution services. Our U.S. markets division will focus on selling our lighting solutions into the wholesale markets. Its customers include domestic energy service companies and electrical contractors. Our Orion engineered systems division will focus on selling lighting products and construction and engineering services direct to end users. Additionally, Orion engineered systems will complete the construction management services related to existing contracted solar PV projects. Its customers include national accounts, government, municipal and schools. Our Orion distribution services division will focus on selling our lighting products internationally and began to develop a network of broad line distributors. Historically, sales of all our lighting products and the related costs were combined through our energy management division. For this reason, we are able to recast prior period revenue totals with respect to each of our three new business segments, but are not able to practically recast the prior period operating income or loss of these new segments. We expect to begin reporting under these new segments during our first quarter of fiscal 2015.
For financial results by reportable segment, please refer to Note J, "Segment Data" in our consolidated financial statements included in Item 8 of this Annual Report.
Energy Management Division
Our energy management division develops, manufactures, sells and provides technical services for the sale of our commercial HIF and LED lighting systems and energy management systems. Our energy management systems deliver energy savings and efficiency gains to our commercial and industrial customers without compromising their quantity or quality of light. We estimate that our LED and HIF energy management systems reduce our customers’ lighting-related electricity costs by approximately 50%, while increasing their quantity of light by approximately 50% and improving lighting quality when replacing traditional high intensity discharge, or HID, fixtures. Our customers typically realize a two-to-three-year payback period from electricity cost savings generated by our HIF and LED lighting systems without considering utility incentives or government subsidies. We have sold and installed our HIF and LED fixtures in over
10,400
facilities across North America, representing approximately
1.5 billion
square feet of commercial and industrial building space, including for 165 Fortune 500 companies.
Our core energy management system is comprised of: our HIF and LED lighting systems; our InteLite wireless lighting controls; our Apollo Solar Light Pipe, which collects and redistributes renewable sunlight and consumes no electricity; and our integrated energy management services. Our technology is designed around managing thermal and optical performance and we are agnostic as it relates to the actual light source. We believe that the implementation of our complete energy management system enables our customers to reduce electricity costs, while permanently reducing base and peak load demand from the electrical grid. From December 1, 2001 through
March 31, 2014
, we installed more than
2.7 million
HIF and LED lighting systems for our commercial and industrial customers. We are focused on leveraging this installed base to expand our customer relationships from single-site implementations of our HIF and LED lighting systems to enterprise-wide roll-outs of our complete energy management system.
We generally have focused on selling retrofit projects whereby we replace inefficient HID, fluorescent or incandescent systems. In fiscal
2014
, we generated approximately
37%
of our revenue in this segment through direct sales relationships with end users, compared to
41%
in fiscal
2013
and
36%
in fiscal
2012
. In the future, we intend to increase the number of our in-market sales people to focus on developing indirect customers which have represented a larger portion of our lighting revenue. We believe the effective expansion of our indirect customer base will help to increase our total revenue and operating profit due to the extent we are successful in increasing our overall market coverage and awareness in regional and local markets. In fiscal
2014
, we generated approximately
63%
of our revenues from such indirect sales, compared to
59%
in fiscal
2013
and
64%
in fiscal
2012
.
We estimate that the use of our HIF and LED fixtures and controls has resulted in cumulative electricity cost savings for our customers of approximately
$2.5 billion
and has reduced base and peak load electricity demand by approximately
888
megawatts, or MW, through
March 31, 2014
. We estimate that this reduced electricity consumption has reduced associated indirect carbon dioxide emissions by approximately
20.0 million
tons over the same period.
5
Engineered Systems Division
Our engineered systems division sells and integrates alternative renewable energy systems, such as solar and wind. Our engineered systems division offers solar PV systems to allow our customers to convert sunlight into electricity. We are a distributor, not a manufacturer, of solar PV systems; however, we do manufacture certain wiring assemblies used to connect the individual solar modules to the electrical panel. Our fully integrated solar power services include (i) project development; (ii) engineering, procurement, and construction, or EPC, services; (iii) operating and maintenance, or O&M services; and (iv) project finance expertise. We provide EPC services for projects developed directly to our end customers and to projects developed by independent solar power project developers. EPC services include engineering design and related services, advanced development of grid integration solutions, and construction contracting and management. The procurement component of our EPC services includes recommendation and deployment of solar modules and components that we procure from third parties. We provide O&M services which can include all or a combination of the following scopes of work: warranty, preventative and scheduled maintenance, spare parts inventory, monitoring and reporting of plant performance and diagnosing performance to assist customers in maximizing energy production. We began to report the results of our engineered systems division as a separate operating segment in the third quarter of fiscal 2011. During fiscal 2013 and fiscal 2014, we experienced a significant reduction in new solar PV orders within this division. We attribute this to reduced cash incentives and declining pricing in the renewable energy credit markets.
During fiscal 2014, we deemphasized our efforts to obtain new PV construction contracts and focused on the completion of previously received orders within our solar backlog. We expect this trend to continue through fiscal 2015. In response to this solar order decline and our de-emphasis on pursuing new PV orders, we redeployed personnel to focus on the opportunities within our energy management division.
Our Market Opportunity
We believe that energy efficient lighting systems are cost-effective and environmentally responsible solutions allowing end users to reduce operating expenses. According to a May 2013 report published by the United States Department of Energy, or DOE, we estimate the potential North American HIF and LED retrofit market within our primary markets to be approximately 1.1 billion lighting fixtures. Our primary markets are: (i) commercial office and retail, (ii) area lighting and (iii) industrial high bay.
Commercial office and retail.
Our commercial office and retail market includes commercial office buildings, retail store fronts, government offices, schools and other buildings with traditional ten to 12 foot ceiling heights. The DOE estimates that there are approximately 957 million office troffer fixtures within the United States, which is a rectangular light fixture that fits into a modular dropped ceiling grid. Additionally, the DOE estimates that less than 1% of LED adoptions during 2012 occurred within the commercial office market. Based upon the number of fixtures available to retrofit within the marketplace and a range for our average selling price of fixtures, we estimate the size of this market between approximately $96 and $120 billion in potential revenue. We believe we have the opportunity to increase our revenue by serving this market with our introduction of our LDR lighting solutions.
Area lighting.
Our market for area lighting includes parking garages, surface lots, automobile dealerships and gas service stations. The DOE estimates that there are approximately 54 million area lighting fixtures within the United States. Additionally, the DOE estimates that approximately 7% of LED adoptions during 2012 occurred within the area lighting market. Based upon the number of fixtures available to retrofit within the marketplace and a range for our average selling price of fixtures, we estimate the size of this market at approximately $27 billion in potential revenue.
Industrial high bay.
Our market for industrial high bay includes manufacturing facilities, distribution and warehouse facilities, government buildings and agricultural buildings. We generated substantially all of our fiscal 2014 revenue from this market through sales of HIF lighting fixtures. We estimate that approximately 50% of this market still utilizes inefficient HID lighting technologies. The DOE, in its May 2013 report, estimates that there are approximately 67 million high bay fixtures within the United States. Additionally, the DOE estimates that approximately 2% of LED adoptions during 2012 occurred within the industrial high bay lighting market. Based upon the number of fixtures available to retrofit within the marketplace and a range for our average selling price of fixtures, we estimate the size of this market at approximately $12 billion in potential revenue and potentially greater dependent upon the adoption rate of LED lighting products.
Commercial and industrial facilities in the United States employ a variety of lighting technologies, including HID, traditional fluorescents, LED and incandescent lighting fixtures. Our HIF and LED lighting systems typically replace HID fixtures, which operate inefficiently because, according to the Electric Power Research Institute, or EPRI, HID fixtures only convert approximately 36% of the energy they consume into visible light. We estimate our HIF and LED lighting systems generally reduce lighting-related electricity costs by approximately 50% compared to HID fixtures, while increasing the quantity of light by approximately 50% and improving lighting quality.
We believe that utilities within the United States recognize the importance of energy efficiency as an economical means to manage capacity constraints and as a low-cost alternative when compared to the construction costs of building new power plants. Accordingly, many of these utilities are continually focused on demand reduction through energy efficiency. According to our research of individual state and utility programs, 48 states, through legislation, regulation or voluntary action, have seen their
6
utilities design and fund programs that promote or deliver energy efficiency. In fact, as of May 31, 2014, only Alaska and Virginia do not have some form of utility or state energy efficiency programs for any of their commercial or industrial customers. Our energy management products are not solely dependent upon these incentive programs, but we do believe that these incentive programs provide an important benefit as our customers evaluate their out-of-pocket cash investments.
Our Solution
50/50 Value Proposition.
We estimate our HIF and LED lighting systems generally reduce lighting-related electricity costs by approximately 50% compared to HID fixtures, while increasing the quantity of light by approximately 50% and improving lighting quality. Additionally, if our motion controls with advances in full-range dimming technology are installed, we estimate that savings can reach up to 80%. From December 1, 2001 through
March 31, 2014
, we believe that the use of our HIF and LED fixtures has saved our customers
$2.5 billion
in electricity costs and reduced their energy consumption by
32.7 billion
kWh.
Multi-Facility Roll-Out Capability.
We offer our customers a single source, turn-key solution for project implementation in which we manage and maintain responsibility for entire multi-facility roll-outs of our energy management solutions across North American real estate portfolios. This capability allows us to offer our customers an orderly, timely and scheduled process for recognizing energy reductions and cost savings.
Rapid Payback Period.
In most retrofit projects where we replace HID fixtures, our customers typically realize a two- to three-year payback period on our HIF and LED lighting systems. These returns are achieved without considering utility incentives or government subsidies (although subsidies and incentives are continually being made available to our customers and us in connection with the installation of our systems that further shorten payback periods).
Comprehensive Energy Management System.
Our comprehensive energy management system enables us to reduce our customers’ base and peak load electricity consumption. By replacing existing fixtures with our HIF and LED lighting systems, our customers permanently reduce base load electricity consumption while significantly increasing their quantity and quality of light. We can also add intelligence to the customer’s lighting system through the implementation of our InteLite wireless dynamic control devices. These devices allow our customers the ability to control and adjust their lighting and energy use levels based upon occupancy and type of occupancy (transient or sustained) for additional cost savings. Finally, we offer a further reduction in electricity consumption through the installation and integration of our Apollo Solar Light Pipe, which is a lens-based device that collects and redistributes renewable sunlight without consuming electricity. By integrating our Apollo Solar Light Pipe and lighting system with the intelligence of our InteLite product line, the output and electricity consumption of our lighting systems can be automatically adjusted based on the level of natural light being provided by our Apollo Light Pipe and, in certain circumstances, our customers can illuminate their facilities and remain “off the grid” during peak hours of the day.
Easy Installation, Implementation and Maintenance.
Our HIF and LED fixtures are designed with a lightweight construction and modular plug-and-play architecture that allows for fast and easy installation, facilitates maintenance and allows for easy integration of other components of our energy management system. Our office LED LDR products are designed to allow for a fast and easy installation without disrupting the ceiling space or the office work space. We believe our system’s design reduces installation time and expense compared to other lighting solutions, which further improves our customers’ return on investment. We also believe that our use of standard components reduces our customers’ ongoing maintenance costs.
Expanded Product Offerings.
We have expanded our product offerings by acquiring and developing LED products for commercial office and retail, traditional interior high bay and exterior lighting applications. We have also introduced exterior lighting products for parking lot, parking garage and convenience store canopies illumination, an LED product offering for freezer and cold storage applications, and a hybrid fixture combining the performance benefits of both LED and fluorescent bulb technologies.
Environmental Benefits.
By allowing for the permanent reduction of electricity consumption, our energy management systems reduce indirect CO2 emissions that are a negative by-product of energy generation. We estimate that one of our HIF or LED lighting systems, when replacing a standard HID fixture, displaces 0.245 kW of electricity, which, based on information provided by the EPA, reduces a customer’s indirect CO2 emissions by approximately 1.2 tons per year. Based on these figures, we estimate that the use of our HIF and LED fixtures has reduced indirect CO2 emissions by approximately
20.0 million
tons through
March 31, 2014
.
Our Competitive Strengths
Compelling Value Proposition.
By permanently reducing lighting-related electricity usage, our systems enable our customers to achieve significant cost savings, without compromising the quantity or quality of light in their facilities. As a result, our energy management systems offer our customers a rapid return on their investment, without relying on government subsidies or utility incentives. We also offer our customers a single source solution whereby we manage and are responsible for the entire project, including installation, across the entire North American real estate portfolio. Our ability to offer such a turn-key, national solution allows us to deliver energy reductions and cost savings to our customers in timely, orderly and planned multi-facility roll-outs.
7
Large and Growing Customer Base.
We have developed a large and growing national customer base, and have installed our products in more than
10,400
commercial and industrial facilities across North America. As of
March 31, 2014
, we have completed or are in the process of completing retrofits in approximately
2,058
facilities for our Fortune 500 customers. We believe that the willingness of our blue-chip customers to install our products across multiple facilities represents a significant endorsement of our value proposition, which in turn helps us sell our energy management systems to new customers. We intend to leverage our expertise in managing projects across multiple facilities within our new LED product markets, which now include new customer opportunities with banks, insurance companies, fast food chains, retail storefronts, grocery and pharmacies.
Systematized Sales Process.
We have invested substantial resources in the development of our sales process. We sell to our end user customers using a systematic multi-step sales process that focuses on our value proposition and provides our sales force with specific, identified tasks that govern their interactions with our customers from the point of lead generation through delivery of our products and services. Management of this process seeks to continually improve salesforce effectiveness while simultaneously improving salesforce efficiency. We also train select resellers to follow our systematic sales process, thereby extending our sales reach while making their businesses more effective.
Innovative Technology.
We have developed a portfolio of
52
United States patents primarily covering various elements of our HIF and LED fixtures. We believe these innovations allow our HIF and LED fixtures to produce more light output per unit of input energy compared to competitive HIF and LED product offerings. We also have
22
patents pending that primarily cover various elements of our newly developed LED products and certain business methods. To complement our innovative energy management products, we have introduced integrated energy management services to provide our customers with a turnkey solution either at a single facility or across North American facility footprints. We believe that our demonstrated ability to innovate provides us with significant competitive advantages. We believe that our HIF and LED solutions offer significantly more light output as measured in foot-candles of light delivered per watt of electricity consumed when compared to HID or traditional fluorescent fixtures.
Expanded Reseller Network.
In addition to selling directly to commercial and industrial customers, we sell our lighting products and services indirectly to end users through wholesale sales to electrical contractors and energy service companies. We now have relationships with more than 100 resellers, some of whom are exclusive agents for our product lines. We intend to continue to selectively build out our reseller network in the future with a focus on geographic regions where we do not currently have a strong reseller or retail sales presence.
Strong, Experienced Leadership Team.
We have a strong and experienced senior management team led by our chief executive officer, John Scribante. Our senior leadership team of
six
individuals has a combined
56
years of experience with our company and a combined
71
years of experience in the lighting and energy management industries.
Efficient, Scalable Manufacturing Process.
We have made significant investments in our manufacturing facility, including investments in production efficiencies, automated processes and modern production equipment. Additionally, we have implemented lean manufacturing concepts which have improved production efficiencies and further reduced manufacturing costs. These investments have substantially increased our production capacity, which we believe will enable us to support substantially increased demand. In addition, these investments, combined with our modular product design and use of standard components, enable us to reduce our cost of revenue, while better controlling production quality, and allow us to be responsive to customer needs on a timely basis. We generally are able to deliver standard products within one week of receipt of order which leads to greater energy savings to customers through shorter implementation time frames. We believe the sales to implementation cycles for our competitors are substantially longer.
Innovative Financing Solutions.
We have developed a financing program called the Orion Throughput Agreement, or OTA. Our OTA is structured similarly to a supply contract under which we commit to deliver a set amount of energy savings to the customer at a fixed monthly rate. Our OTA program allows customers to deploy our energy management systems without having to make upfront investments or capital outlays. After the pre-determined amount of energy savings are delivered, our customers assume full ownership of the energy management system and benefit from the entire amount of energy savings over the remaining useful life of the technology. We believe the OTA allows us to capture customer sales opportunities that otherwise may not have occurred due to capital constraints.
Our Growth Strategies
Leverage Existing Customer Base.
Over the last several years, we have focused on expanding our relationships with our existing customers by transitioning from single-site facility implementations to comprehensive enterprise-wide roll-outs of our HIF and LED lighting systems. We also intend to leverage our large installed base of HIF lighting systems to implement all aspects of our energy management system, particularly new LED lighting products, wireless controls, cloud-based power data analysis and storage capabilities for our existing customers.
Pursue Additional Acquisitions.
We acquired Harris in July 2013. Harris engineers, designs, sources and manufactures energy efficient lighting systems, including fluorescent and LED lighting solutions, and day-lighting products. In the future, we intend
8
to pursue additional acquisition opportunities that will increase the breadth of our energy technologies, expand our customer base, or provide us entry into new markets.
Develop New Sources of Revenue Through Expanded Product Offerings.
We have expanded our role in the LED marketplace, and plan to increase sales of LED fixtures for commercial office and retail applications, schools and government buildings, freezer and cold-storage applications, as well as high-bay interior applications.
Expanded Salesforce.
During fiscal 2013 and throughout fiscal 2014, we increased the number of our sales force and intend to continue to increase our sales force in the future. We intend to increase our in-market sales force which generates revenue through our reseller channels. Historically, our reseller channels have generated approximately 60% of our total lighting revenue. In the future, we intend to increase the contribution of our reseller channels. Our telemarketing group generates sales leads and schedules appointments for our internal salespeople and our resellers.
Expanded Reseller Network.
In addition to selling directly to national account customers, we sell our lighting products and services indirectly to end users through wholesale sales to electrical contractors and energy service companies. We intend to continue to build out our reseller network in the future, including the addition of new energy service companies. Our key resellers often sell our products exclusively, maintain product demonstration areas within their facilities, are offered our lowest pricing level and follow our standard operating procedures related to their sales, project management and operational activities.
Continue to Improve Operational Efficiencies.
We are focused on continually improving the efficiency of our operations to increase the profitability of our business. In our manufacturing operations, we pursue opportunities to reduce our materials, component and manufacturing costs through product engineering, lean manufacturing process improvements, research and development on alternative materials and components, volume purchasing and investments in manufacturing equipment and automation. We also seek to reduce our installation costs by training our authorized installers to perform retrofits more efficiently and cost effectively. We believe that realizing these efficiencies will enhance our profitability potential and allow us to continue to deliver our compelling value proposition.
Products and Services
We provide a variety of products and services that together comprise our energy management system. While the core of our energy management system is our HIF lighting platform, which we primarily sell under the Compact Modular brand name, we have recently expanded our LED lighting products and anticipate that, in the future, revenue from our LED products will increase our overall lighting revenue. We offer our customers the option to build on our core HIF and LED lighting platforms by adding our InteLite wireless dynamic control devices and Apollo Solar Light Pipes. Together with these products, we offer our customers a variety of integrated energy management services, such as system design, project management and installation. We refer to the combination of these products and services as our energy management system.
Products
The following is a description of our primary products:
The Compact Modular.
Our primary product has been our line of high-performance HIF lighting systems, the Compact Modular, which includes a variety of fixture configurations to meet customer specifications. The Compact Modular generally operates at 224 watts per six-lamp fixture, compared to approximately 465 watts for the HID fixtures that it typically replaces. This wattage difference is the primary reason our HIF lighting systems are able to reduce electricity consumption by approximately 50% compared to HID fixtures. Our Compact Modular has a thermally efficient design that allows it to operate at significantly lower temperatures than HID fixtures and most other legacy lighting fixtures typically found in commercial and industrial facilities. Because of the lower operating temperatures of our fixtures, our ballasts and lamps operate more efficiently, allowing more electricity to be converted to light rather than to heat or vibration, while allowing these components to last longer before needing replacement. In addition, the heat reduction provided by installing our HIF lighting systems reduces the electricity consumption required to cool our customers’ facilities, which further reduces their electricity costs. The EPRI estimates that commercial buildings use 5% to 10% of their electricity consumption for cooling required to offset the heat generated by lighting fixtures.
In addition, our patented optically-efficient reflector increases light quantity by efficiently harvesting and focusing emitted light. We and some of our customers have conducted tests that generally show that our Compact Modular product line can increase light quantity in footcandles by approximately 50% when replacing HID fixtures. Further, we believe, based on customer reactions obtained during product demonstrations, that our Compact Modular products provide a greater quantity of light per watt than competing HIF fixtures.
The Compact Modular product line also includes our modular power pack, which enables us to customize our customers’ lighting systems to help achieve their specified lighting and energy savings goals. Our modular power pack integrates easily into a wide variety of electrical configurations at our customers’ facilities, allowing for faster and less expensive installation compared to lighting systems that require customized electrical connections. In addition, our HIF lighting systems are lightweight and, we believe, easy to handle, which further reduces installation and maintenance costs and helps to build brand loyalty with electrical contractors and installers.
9
The LED Door Retrofit:
Our LED door retrofit, or LDR, product was obtained through our acquisition of Harris and was recently made available to the marketplace in January 2014. The LDR was recently expanded to include designs for architectural, industrial and contractor product lines. The LDR is designed to replace existing 4 foot by 2 foot and 2 foot by 2 foot fluorescent troffers that are frequently found in office or retail grid ceilings. Our LDR product is unique in that the LED optics and electronics are housed within the door frame which allows for installation of the product in approximately one minute. The product provides reduced maintenance expenses based upon LED chip lives ranging from 187,000 to 375,000 hours, which we equate to a performance life of the fixture's light source of between 60 and 100 years.
LED technology.
We believe we have taken a responsible approach to developing and introducing our LED products. We focused our research and development efforts on our core competencies: optical and thermal management and control. This resulted in our introducing LED systems primarily for use in cold storage applications. In addition to our LED products for the cold-storage industry, during fiscal 2013 and fiscal 2014, we expanded our LED product offering to include recessed downlights, wallpacks, task lighting, food service, ambient temperature high bay and exterior canopy fixtures. Due to improvements in LED technology, drastic reduction of chip prices, availability of name-brand drivers and seamless integration with our InteLite controls, we believe that LED will become a larger part of our overall interior lighting strategy moving forward.
InteLite Dynamic Control Device.
Our InteLite wireless dynamic control products allow customers to remotely communicate with and give commands to individual light fixtures and other peripheral devices through web-based software, and allow the customer to configure and easily change the control parameters of each fixture based on a number of inputs and conditions, including time-of-day, motion and ambient light levels. Our InteLite products can be added to our HIF and LED lighting systems during or after installation on a “plug and play” basis by coupling the wireless transceivers directly with the modular power pack. Because of their modular design, our InteLite wireless products can be added to our energy management system easily and at lower cost when compared to lighting systems that require similar controls to be included at original installation or retrofitted. Our InteLite products allow us to provide reporting and metering capabilities at the individual control unit level. These capabilities allow for our customers to measure and evaluate energy consumption at the process level. Data can be collected and exported, allowing our customers to perform energy analysis across their facilities to identify operational practices and behaviors that better manage energy costs.
Apollo Solar Light Pipe.
Our Apollo Solar Light Pipe is a lens-based device that collects and focuses renewable daylight, bringing natural light indoors without consuming electricity. Our Apollo Solar Light Pipe is designed and manufactured to maximize light collection during times of low sun angles, such as those that occur during early morning and late afternoon. The Apollo Solar Light Pipe produces maximum lighting “power” in peak summer months and during peak daylight hours, when electricity is most expensive. By integrating our Apollo Solar Light Pipe with our HIF lighting systems and InteLite wireless controls, the output and associated electricity consumption of our HIF lighting systems can be automatically adjusted based on the level of natural light being provided by our Apollo Solar Light Pipe to offer further energy savings for our customers. In certain circumstances, our customers can illuminate their facilities “off the grid” during peak hours of the day through the use of our integrated energy management system.
Renewable Energy Products.
Our engineered systems division offers solar PV systems to allow our customers to convert sunlight into electricity. We are a distributor, not a manufacturer, of solar PV systems; however, we do manufacture certain wiring assemblies used to connect the individual solar modules to the electrical panel. Our fully integrated solar power services include (i) project development; (ii) EPC services; (iii) O&M services; and (iv) project finance expertise. We provide EPC services for projects developed directly to our end customers, to projects developed by independent solar power project developers. EPC services include engineering design and related services, advanced development of grid integration solutions, and construction contracting and management. The procurement component of our EPC services includes recommendation and deployment of solar modules and components that we procure from third parties. We provide O&M services which can include all or a combination of the following scopes of work: warranty, preventative and scheduled maintenance, spare parts inventory, monitoring and reporting of plant performance and diagnosing performance to assist customers in maximizing energy production. We have developed a network of finance partners with experience in structuring non-recourse project debt finance, operating and capital leases, power purchase agreements (PPA) and project equity from tax oriented and strategic industry equity investors. We can provide support in arranging and/or facilitating financing for projects on behalf of our customers.
Cloud-based data computing, storage.
During fiscal 2014, we achieved Microsoft Partner status with a Gold Application Development competency. We offer Microsoft’s Windows Azure cloud computing and SQL Azure data storage, which allows for real-time energy use analysis and maximum energy savings.
Other Products.
We also offer our customers a variety of other HIF, LED, and induction fixtures to address their lighting and energy management needs, including fixtures designed for agribusinesses, parking lots, roadways, outdoor applications and private label resale.
Our warranty policy generally provides for a limited one-year warranty on our HIF products and a limited five-year warranty on our LED products. Ballasts, lamps, drivers, LED chips and other electrical components are excluded from our standard warranty since they are covered by separate warranties offered by the original equipment manufacturers. We coordinate and process customer
10
warranty inquiries and claims, including inquiries and claims relating to ballast and lamp components, through our customer service department.
Services
We provide a range of fee-based lighting-related energy management services to our customers, including:
|
•
|
comprehensive site assessment, which includes a review of the current lighting requirements and energy usage at the customer’s facility;
|
|
•
|
site field verification, or SFV, during which we perform a test implementation of our energy management system at a customer’s facility;
|
|
•
|
utility incentive and government subsidy management, where we assist our customers in identifying, applying for and obtaining available utility incentives or government subsidies;
|
|
•
|
engineering design, which involves designing a customized system to suit our customers' facility lighting and energy management needs, and providing the customer with a written analysis of the potential energy savings and lighting and environmental benefits associated with the designed system;
|
|
•
|
project management, which involves our working with the electrical contractor in overseeing and managing all phases of implementation from delivery through installation for a single facility or through multi-facility roll-outs tied to a defined project schedule;
|
|
•
|
installation services, for our products, which we provide through our national network of qualified third-party installers; and
|
|
•
|
recycling in connection with our retrofit installations, where we remove, dispose of and recycle our customer’s legacy lighting fixtures.
|
We also provide other services which comprise a small amount of our revenue. These services primarily include management and control of power quality and remote monitoring and control of our installed systems. We also sell and distribute replacement lamps and fixture components into the after-market.
Our Customers
We primarily target commercial and industrial customers who have warehousing, manufacturing, and office facilities. As of
March 31, 2014
, we have installed our products in
10,461
commercial and industrial facilities across North America. Our diversified customer base includes:
|
American Standard International Inc.
Anheuser-Busch Companies, Inc.
Avery Dennison Corp.
Big Lots Inc.
The Coca-Cola Co.
|
Dollar General Corporation
Gap, Inc.
General Electric Co.
Kraft Foods Inc.
Miller Coors LLC
|
Newell Rubbermaid Inc.
OfficeMax, Inc.
PepsiCo Inc.
Sealed Air Corp.
Sherwin-Williams Co.
|
SYSCO Corp.
Textron, Inc.
Toyota Motor Corp.
United Stationers Inc.
U.S. Foodservice
|
One single solar customer, Standard Alternative LLC,
accounted for 23% of our total revenue during fiscal 2014. No single customer accounted for 10% or more of our total revenue during fiscal 2013 or fiscal 2012.
Sales and Marketing
We sell our products directly to commercial and industrial customers using a systematic multi-step process that focuses on our value proposition and provides our sales force with a specific protocol for working with our customers from the point of lead generation through delivery of our products and services. In fiscal 2012, we created a telemarketing function for the purpose of lead generation and customer appointment scheduling, established a sales and technology office in Houston, Texas, and increased our sales and marketing headcount through the addition of direct in-market salespeople. In fiscal 2013, we streamlined our telemarketing function with an emphasis on improving the quality of leads generated, developed a strategy to expand our direct sales force, implemented product version control for our wireless products and transitioned the compensation plans of our sales force to an increasingly performance based model. In fiscal 2014, we continued to increase our in-market sales force and transitioned this sales force to focus on indirect customer growth. We believe that an in-market sales force focused on providing technical product and sales support to our resellers provides us with a greater potential for revenue growth. During fiscal 2015, we intend to continue to increase our in-market sales force.
We also sell our products on a wholesale basis to value-added resellers. We often train our value-added resellers to implement our systematic sales process to more effectively resell our products to their customers. We attempt to leverage the customer relationships of these value-added resellers to further extend the geographic scope of our selling efforts. We work cooperatively with our value-added reseller channels through participation in national trade organizations, by providing training on our sales
11
methodologies, including the development and distribution of standard sales reseller operating procedures and by providing training to our resellers to enable them to conduct their own energy workshops with their customer and prospect bases. We intend to continue to expand our reseller network.
We also sell our products and services indirectly to our customers through their electrical contractors or distributors, or to electrical contractors and distributors who buy our products and resell them to end users as part of an installed project. We believe these relationships allow us to increase penetration into the lighting retrofit market because electrical contractors often have significant influence over their customers’ lighting product selections. Even in cases where we sell through these indirect channels, we strive to have our own relationship with the end user customer.
We have historically focused our marketing efforts on traditional direct advertising, as well as developing brand awareness through customer education and active participation in trade shows and energy management seminars. In the past, these efforts have included participating in national, regional and local trade organizations, exhibiting at trade shows, executing targeted direct mail campaigns, advertising in select publications, public relations campaigns, social media and other lead generation and brand building initiatives. We are also actively training contractors and resellers on how to effectively represent our product offering and have designed an intensive classroom training program, which we refer to as Orion University, to complement the energy management workshops we conduct in the field. During the first half of fiscal 2015, we intend to invest in a branding campaign to better position us as an LED company to our direct customers and our resellers. We expect our branding campaign to result in generating additional sales pipelines, increasing the number of our resellers and increasing our market share in newer markets, like schools and commercial office space. We believe this branding investment is vital in strengthening our position as an LED lighting solutions provider and improving our ability to compete against existing LED lighting companies.
Competition
The market for energy efficiency lighting products and services is fragmented. We face strong competition primarily from manufacturers and distributors of energy management products and services as well as electrical contractors. We compete primarily on the basis of technology, price, quality, customer relationships, energy efficiency, customer service and marketing support.
There are a number of lighting fixture manufacturers that sell HIF and LED products that compete with our lighting product lines. Lighting companies such as Acuity Brands, Inc., Cooper Lighting division of Eaton Corporation plc, Cree, Inc., and Hubbell Incorporated are some of our main competitors within the commercial and industrial markets. Recently, electronics companies, like Samsung and LG Electronics, have begun to develop and commercialize lighting fixtures. These companies generally have large and diverse product lines. Many of these competitors are better capitalized than we are, have strong existing customer relationships, greater name recognition, and more extensive engineering and marketing capabilities. We also compete for sales of our HIF and LED lighting systems with manufacturers and suppliers of older fluorescent technology in the retrofit market. Some of the manufacturers of HIF and HID products that compete with our HIF and LED lighting systems sell their systems at a lower initial capital cost than the cost at which we sell our systems, although we believe based on our industry experience that these systems generally do not deliver the light quality and the cost savings that our HIF and LED lighting systems deliver over the long-term.
Many of our competitors market their manufactured lighting and other products primarily to distributors who resell their products for use in new commercial, residential, and industrial construction. These distributors, such as Graybar Electric Company, Gexpro (GE Supply) and W.W. Grainger, Inc., generally have large customer bases and wide distribution networks and supply to electrical contractors.
We also face competition from companies who provide energy management services. Some of these competitors, such as Johnson Controls, Inc. and Honeywell International, provide basic systems and controls designed to further energy efficiency.
Intellectual Property
As of
March 31, 2014
, we had been issued
52
United States patents, and had applied for
22
additional United States patents. The patented and patent pending technologies cover various innovative elements of our products, including our HIF and LED fixtures, InteLite wireless controls and Apollo Solar Light Pipes. Among other things, we believe that our innovations allow our HIF fixtures to produce more light output per unit of input energy compared to competitive HIF product offerings. Our patent pending LED door retrofit product allows for a significantly quicker installation when compared to competitor's commercial office lighting products. Our smart lighting controls allow our lighting fixtures to selectively provide a targeted amount of light where and when it is needed most.
We believe that our patent portfolio as a whole is material to our business. We also believe that our patents covering our ability to manage the thermal and optical performance of our LED and HIF lighting products are material to our business, and that the loss of these patents could significantly and adversely affect our business, operating results and prospects.
Manufacturing and Distribution
12
We own an approximately 266,000 square foot manufacturing and distribution facility located in Manitowoc, Wisconsin. We have made significant investments in new equipment and in the development of our workforce to expand our internal production capabilities and increase production capacity. As a result of these investments, we are generally able to manufacture and assemble our products internally. We supplement our in-house production with outsourcing contracts as required to meet short-term production needs. We believe we have sufficient production capacity to support a substantial expansion of our business.
We generally maintain a significant supply of raw material and purchased and manufactured component inventory. We manufacture products to order and are typically able to ship most orders within 14 days of our receipt of a purchase order. We contract with transportation companies to ship our products and manage all aspects of distribution logistics. We generally ship our products directly to the end user.
Research and Development
Our research and development efforts are centered on developing new products and technologies, enhancing existing products, and improving operational and manufacturing efficiencies. The products, technologies and services we are developing are focused on increasing end user energy efficiency. We are also developing lighting products based on LED technology and comprehensive lighting management software. During fiscal 2013, as part of our strategic refocus, we streamlined our product development initiatives with a focus on disciplined control releases versus a process of continuous development. During fiscal 2014, we developed and commercialized the LDR product obtained through the acquisition of Harris. Our research and development expenditures were
$2.5 million
,
$2.3 million
and
$2.0 million
for fiscal years
2012
,
2013
and
2014
, respectively.
Regulation
Our operations are subject to federal, state, and local laws and regulations governing, among other things, emissions to air, discharge to water, the remediation of contaminated properties and the generation, handling, storage, transportation, treatment, and disposal of, and exposure to, waste and other materials, as well as laws and regulations relating to occupational health and safety. We believe that our business, operations, and facilities are being operated in compliance in all material respects with applicable environmental and health and safety laws and regulations.
State, county or municipal statutes often require that a licensed electrician be present and supervise each retrofit project. Further, all installations of electrical fixtures are subject to compliance with electrical codes in virtually all jurisdictions in the United States. In cases where we engage independent contractors to perform our retrofit projects, we believe that compliance with these laws and regulations is the responsibility of the applicable contractor.
Our Corporate and Other Available Information
We were incorporated as a Wisconsin corporation in April 1996 and our corporate headquarters are located at 2210 Woodland Drive, Manitowoc, Wisconsin 54220. Our Internet website address is www.oesx.com. Our Annual Reports on Form 10-K, Quarterly Reports on Form 10-Q, Current Reports on Form 8-K and amendments to those reports filed or furnished pursuant to Section 13(a) or 15(d) of the Securities Exchange Act of 1934, as amended, or the Exchange Act, are available through the investor relations page of our internet website free of charge as soon as reasonably practicable after we electronically file such material with, or furnish it to, the Securities and Exchange Commission, or the SEC.
Employees
As of
March 31, 2014
, we had
229
full-time and
8
part-time employees. Our employees are not represented by any labor union, and we have never experienced a work stoppage or strike. We consider our relations with our employees to be good.
|
ITEM 1A.
|
RISK FACTORS
|
You should carefully consider the risk factors set forth below and in other reports that we file from time to time with the Securities and Exchange Commission and the other information in this Annual Report on Form 10-K. The matters discussed in the following risk factors, and additional risks and uncertainties not currently known to us or that we currently deem immaterial, could have a material adverse effect on our business, financial condition, results of operation and future growth prospects and could cause the trading price of our common stock to decline.
We face significant challenges as the market adopts LED technologies for general lighting.
Our potential for growth depends significantly upon the adoption rate of LED products within our primary markets and our ability to participate in this anticipated market trend. To be an effective participant in this expected growing LED market opportunity, we must keep up with the evolution of LED technology, which has been moving at a fast pace. Although LED lighting has grown rapidly in recent years, most of this growth has occurred within the replacement lamp market through mass market and home improvement retailers, which are targeted towards residential consumers. The adoption of LED technology in commercial and industrial markets is relatively new and still faces challenges before widespread adoption. These challenges include the expectation that LED fixture pricing will continue to decline in the future and the necessity that LED fixture prices must decline to meet
13
minimum customer payback requirements, new competitors entering our primary markets and misinformation and confusion within these markets regarding the benefits that LED technology can and will provide. In fiscal 2014, these challenges impacted our results of operations as a result of delayed purchase decisions by our customers as they evaluate emerging LED technologies against traditional HIF lighting technologies. If LEDs achieve widespread adoption and our products do not also achieve acceptance or are rendered obsolete by competing products, our revenues will decline. Moreover, if new sources of lighting are developed, our current products and technologies could become less competitive or obsolete. If we are unable to navigate these changes, meet customer pricing expectations and effectively compete against existing and new competitors, our results of operations will continue to be adversely affected.
Adverse conditions in the global economy have negatively impacted, and could continue to negatively impact, our customers, suppliers and business.
Continued weak economic conditions have adversely affected our customers’ capital budgets, purchasing decisions and facilities managers and, therefore, have adversely affected our results of operations. The return to a recessionary state of the global economy could potentially have negative effects on our near-term liquidity and capital resources, including slower collections of receivables, delays of existing order deliveries and postponements of incoming orders.Our business and results of operations will continue to be adversely affected to the extent these adverse economic conditions continue to adversely affect our customers’ purchasing decisions.
Adverse market conditions have led to increasing duration of customer sales cycles, limitations on customer capital budgets, project delays, closure of facilities and the loss of key contacts due to workforce reductions at existing and prospective customers.
The volatility and uncertainty in the financial and credit markets has led many customers to adopt strategies for conserving cash, including limits on capital spending. Our lighting systems are often purchased as capital assets and therefore are subject to capital availability. Uncertainty around such availability has led customers to delay purchase decisions, which has elongated the duration of our sales cycles. Along with limiting capital spending, some customers have reduced expenses by closing facilities and reducing workforces. As a result, facilities that were or may be considering installing our lighting systems have closed or may close. Due to downsizings, key contacts and decision-makers at some of our customers have lost or may lose their jobs, which requires us to re-initiate the sales cycle with other personnel, further elongating the sales cycle. Additionally, the federal government shutdown during our fiscal 2014 resulted in project delays for certain government projects. We have experienced, and may in the future experience, variability in our operating results, on both an annual and a quarterly basis, as a result of these factors.
Our financial performance is dependent on our ability to execute on our strategy and increase our profitability.
Our ability to achieve our desired growth and profitability depends on our ability to expand our reseller network, and improve our marketing, new product development, project management, margin enhancement and operating expense management, as well as other factors. If we are unable to successfully execute in any of these areas or on our growth and profitability strategy as a whole, our business and financial performance will likely be adversely affected.
We operate in a highly competitive industry and if we are unable to compete successfully our revenue and profitability will be adversely affected.
We face strong competition primarily from manufacturers and distributors of energy management products and services, as well as from electrical contractors. We compete primarily on the basis of customer relationships, price, quality, energy efficiency, customer service and marketing support. Our products are in direct competition with HID technology, as well as other HIF and LED products and older fluorescent technology in the lighting systems retrofit market.
Many of our competitors are better capitalized than we are, have strong customer relationships, greater name recognition, and more extensive engineering, manufacturing, sales and marketing capabilities. Competitors could focus their substantial resources on developing a competing business model or energy management products or services that may be potentially more attractive to customers than our products or services. In addition, we may face competition from other products or technologies that reduce demand for electricity. Our competitors may also offer energy management products and services at reduced prices in order to improve their competitive positions. Any of these competitive factors could make it more difficult for us to attract and retain customers, require us to lower our prices in order to remain competitive, and reduce our revenue and profitability, any of which could have a material adverse effect on our results of operations and financial condition.
We may not realize the benefits from our acquisition of Harris Manufacturing, Inc. and Harris LED, LLC.
In July 2013, we completed the acquisition of all of the outstanding equity interests of Harris Manufacturing, Inc. and Harris LED, LLC. To complete the acquisition, we paid a significant amount of cash, increased our debt and issued additional shares of our Common Stock. There is no guarantee that the acquisition will provide us with our expected return on our investment. Additionally, our ability to realize the anticipated synergies from the acquisition is dependent upon our ability to effectively integrate Harris. We may encounter substantial difficulties and costs following the acquisition, including:
14
•
Exposure to unknown liabilities;
•
Potential conflicts between business cultures;
•
Adverse changes in business focus perceived by third-party constituencies;
•
Disruption of our ongoing business;
•
Potential conflicts in distribution, marketing or other important relationships;
•
Failure to maximize our financial and strategic position;
•
Failure to implement internal controls over financial reporting;
•
Failure to achieve planned synergies or expected financial results benefits;
|
•
|
Failure to realize the potential of the acquired businesses' technologies, complete product development, or properly obtain or secure appropriate protection of intellectual property rights; and
|
•
Loss of key employees and/or the diversion of management's attention from other ongoing business concerns.
We are subject to litigation and other legal matters that could result in charges against our income, strain our resources and distract our management, which could have a material adverse effect on our business, financial condition, results of operations, cash flows or reputation.
We are involved in a variety of claims, lawsuits and other disputes. These suits concern a variety of issues, including employee-related matters and contract disputes. In addition, as previously disclosed, in August 2012, we received a subpoena issued by the staff of the Securities and Exchange Commission, or SEC, requesting certain documents and information generally related to our financial reporting of sales of solar PV systems, among other matters. We continue to cooperate with the SEC regarding this non-public, fact-finding inquiry. The SEC has informed us that this inquiry should not be construed as an indication that any violations of law have occurred or that the SEC has any negative opinion of any person, entity or security. In March 2014, we were named as a defendant in a civil lawsuit filed by Neal R. Verfuerth, our former chief executive officer who was terminated for cause in November 2012. The plaintiff alleges, among other things, that we breached certain agreements entered into with the plaintiff, including the plaintiff’s employment agreement, and violated certain laws. The complaint seeks, among other relief, unspecified pecuniary and compensatory damages, fees and such other relief as the court may deem just and proper. It is not feasible to predict the outcome of the SEC inquiry, all pending suits and other matters, and the ultimate resolution of these matters, as well as future potential lawsuits, could result in liabilities, fines, significant expenses, distraction of management and other issues that could have a material adverse effect on our business, financial condition, results of operations, cash flows or reputation.
Our inability to attract and retain key employees or our reseller network could adversely affect our operations and our ability to execute on our operating plan and growth strategy.
We rely upon the knowledge, experience and skills of key employees throughout our organization, particularly our senior management team and our sales group that require technical knowledge or contacts in, and knowledge of, the industry. In addition, our ability to attract talented new employees, particularly in our sales group, is also critical to our success. We also depend on our value-added reseller channels. If we are unable to attract and retain key employees or our reseller network because of competition or, in the case of employees, inadequate compensation or other factors, our operations and our ability to execute our operating plan could be adversely affected.
Our products use components and raw materials that may be subject to price fluctuations, shortages or interruptions of supply.
We may be vulnerable to price increases for components or raw materials that we require for our products, including aluminum, copper, certain rare earth minerals, ballasts, power supplies and lamps. In particular, our cost of aluminum can be subject to commodity price fluctuation. Further, suppliers' inventories of certain components that our products require may be limited and are subject to acquisition by others. In the past, we have had to purchase quantities of certain components that are critical to our product manufacturing and were in excess of our estimated near-term requirements as a result of supplier delivery constraints and concerns over component availability, and we may need to do so in the future. As a result, we have had, and may need to continue, to devote additional working capital to support a large amount of component and raw material inventory that may not be used over a reasonable period to produce saleable products, and we may be required to increase our excess and obsolete inventory reserves to provide for these excess quantities, particularly if demand for our products does not meet our expectations. Also, any shortages or interruptions in supply of our components or raw materials could disrupt our operations. If any of these events occurs, our results of operations and financial condition could be materially adversely affected.
We may pursue additional acquisitions and investments in new product lines, businesses or technologies that involve numerous risks, which could disrupt our business or adversely affect our financial condition and results of operations.
15
We may pursue additional acquisitions of, or investments in, new product lines, businesses or technologies to expand our current capabilities. We have limited experience in making such acquisitions or investments. Acquisitions present a number of potential risks and challenges that could disrupt our business operations, increase our operating costs or capital expenditure requirements and reduce the value of the acquired product line, business or technology. For example, if we identify an acquisition candidate, we may not be able to successfully negotiate or finance the acquisition on favorable terms. The process of negotiating acquisitions and integrating acquired products, services, technologies, personnel, or businesses might result in significant transaction costs, operating difficulties or unexpected expenditures, and might require significant management attention that would otherwise be available for ongoing development of our business. If we are successful in completing an acquisition, we may not be able to integrate the acquired product line, business or technology into our existing business and products, and we may not achieve the anticipated benefits of any acquisition. Furthermore, potential acquisitions and investments may divert our management's attention, require considerable cash outlays and require substantial additional expenses that could harm our existing operations and adversely affect our results of operations and financial condition. To complete future acquisitions, we may issue equity securities, incur debt, assume contingent liabilities or incur amortization expenses and write-downs of acquired assets, which could dilute the interests of our shareholders or adversely affect our profitability.
We may not be able to obtain equity capital or debt financing necessary to effectively pursue strategic acquisition opportunities or otherwise pursue our growth initiatives.
Our existing capital resources may not be sufficient to effectively pursue strategic acquisition opportunities or to pursue other growth initiatives. We may not be able to obtain sufficient equity capital and/or debt financing required to do so or we may not be able to obtain such equity capital or debt financing on acceptable terms or conditions. Factors affecting the availability to us of equity capital or debt financing on acceptable terms and conditions include:
|
•
|
The price, volatility and trading volume and history of our common stock.
|
|
•
|
Our current and future financial results and position.
|
|
•
|
The market’s view of our industry and products.
|
|
•
|
The perception in the equity and debt markets of our ability to execute our business plan or achieve our operating results expectations.
|
Our inability to obtain the capital necessary to pursue strategic acquisition opportunities or to otherwise pursue our growth opportunities could have an adverse effect on our growth strategy and business operations.
We have made a significant investment in our wireless controls inventories, which was costly and, if not properly managed, may result in valuation adjustments.
Our wireless control inventories comprised approximately 53% of our total
March 31, 2014
inventory balance of $22.4 million. The components for our wireless inventories are manufactured and assembled overseas and require longer delivery lead times. Suppliers require deposit payments at time of purchase order and suppliers also require volume commitments to secure production capacity. There can be no guarantees that our customers will purchase our wireless technologies or that unforeseen evolutions in technologies may render our inventories unsalable. Additionally, price changes or other circumstances could result in valuation adjustments to such inventories, which could have a negative effect on our results of operations and financial condition.
We depend upon a limited number of customers in any given period to generate a substantial portion of our revenue and the loss of significant customers could have an adverse effect on our operations.
We do not have long-term contracts with our customers, and our dependence on individual key customers can vary from period to period as a result of the significant size of some of our retrofit and multi-facility roll-out projects. Our top 10 customers accounted for approximately
35%
and
45%
, respectively, of our total revenue for fiscal
2013
and
2014
. In fiscal
2013
and fiscal
2014
, our top customer accounted for
8%
and
23%
of our total revenues, respectively. We expect large retrofit and roll-out projects to continue to be a significant component of our total revenue. Additionally, commercial office lighting retrofits provide for single large project opportunities. As a result, we may experience more customer concentration in any given future period. The loss of, or substantial reduction in sales to, any of our significant customers could have a material adverse effect on our results of operations in any given future period.
The success of our business depends on the market acceptance of our energy management products and services.
Our future success depends on continued commercial acceptance of our energy management products and services. If we are unable to convince current and potential customers of the advantages of our lighting systems and energy management products and services, then our ability to sell our lighting systems and energy management products and services will be limited. In addition, because the market for energy management products and services is rapidly evolving, we may not be able to accurately assess the size of the market, and we may have limited insight into trends that may emerge and affect our business. If the market for our lighting systems and energy management products and services does not continue to develop, or if the market does not accept our
16
products, then our ability to grow our business could be limited and we may not be able to increase our revenue or achieve profitability.
We depend on our ability to develop new products and services.
The market for our products and services is characterized by rapid market and technological changes, uncertain product life cycles, changes in customer demands and evolving government, industry and utility standards and regulations. As a result, our future success will depend, in part, on our ability to continue to design and manufacture new products and services. We may be unable to successfully develop and market new products or services that keep pace with technological or industry changes, satisfy changes in customer demands or comply with present or emerging government and industry regulations and technology standards.
Product liability claims could adversely affect our business, results of operations and financial condition.
We face exposure to product liability claims in the event that our energy management products fail to perform as expected or cause bodily injury or property damage. Since virtually all of our products use electricity, it is possible that our products could result in injury, whether by product malfunctions, defects, improper installation or other causes. Particularly because our products often incorporate new technologies or designs, we cannot predict whether or not product liability claims will be brought against us in the future or result in negative publicity about our business or adversely affect our customer relations. Moreover, we may not have adequate resources in the event of a successful claim against us. A successful product liability claim against us that is not covered by insurance or is in excess of our available insurance limits could require us to make significant payments of damages and could materially adversely affect our results of operations and financial condition.
Our inability to protect our intellectual property, or our involvement in damaging and disruptive intellectual property litigation, could adversely affect our business, results of operations and financial condition or result in the loss of use of the product or service.
We attempt to protect our intellectual property rights through a combination of patent, trademark, copyright and trade secret laws, as well as employee and third-party nondisclosure and assignment agreements. Our failure to obtain or maintain adequate protection of our intellectual property rights for any reason could have a material adverse effect on our business, results of operations and financial condition.
We own United States patents and patent applications for some of our products, systems, business methods and technologies. We offer no assurance about the degree of protection which existing or future patents may afford us. Likewise, we offer no assurance that our patent applications will result in issued patents, that our patents will be upheld if challenged, that competitors will not develop similar or superior business methods or products outside the protection of our patents, that competitors will not infringe upon our patents, or that we will have adequate resources to enforce our patents. Effective protection of our United States patents may be unavailable or limited in jurisdictions outside the United States, as the intellectual property laws of foreign countries sometimes offer less protection or have onerous filing requirements. In addition, because some patent applications are maintained in secrecy for a period of time, we could adopt a technology without knowledge of a pending patent application, and such technology could infringe a third party’s patent.
We also rely on unpatented proprietary technology. It is possible that others will independently develop the same or similar technology or otherwise learn of our unpatented technology. To protect our trade secrets and other proprietary information, we generally require employees, consultants, advisors and collaborators to enter into confidentiality agreements. We cannot assure you that these agreements will provide meaningful protection for our trade secrets, know-how or other proprietary information in the event of any unauthorized use, misappropriation or disclosure of such trade secrets, know-how or other proprietary information. If we are unable to maintain the proprietary nature of our technologies, our business could be materially adversely affected.
We rely on our trademarks, trade names, and brand names to distinguish our company and our products and services from our competitors. Some of our trademarks may conflict with trademarks of other companies. Failure to obtain trademark registrations could limit our ability to protect our trademarks and impede our sales and marketing efforts. Further, we cannot assure you that competitors will not infringe our trademarks, or that we will have adequate resources to enforce our trademarks.
In addition, third parties may bring infringement and other claims that could be time-consuming and expensive to defend. Also, parties making infringement and other claims may be able to obtain injunctive or other equitable relief that could effectively block our ability to provide our products, services or business methods and could cause us to pay substantial damages. In the event of a successful claim of infringement, we may need to obtain one or more licenses from third parties, which may not be available at a reasonable cost, or at all. It is possible that our intellectual property rights may not be valid or that we may infringe upon existing or future proprietary rights of others. Any successful infringement claims could subject us to significant liabilities, require us to seek licenses on unfavorable terms, prevent us from manufacturing or selling products, services and business methods and require us to redesign or, in the case of trademark claims, re-brand our company or products, any of which could have a material adverse effect on our business, results of operations or financial condition.
17
We are subject to financial and operating covenants in our credit agreement and any failure to comply with such covenants, or obtain waivers in the event of non-compliance, could result in our being unable to borrow under the agreement and other negative consequences.
Our credit agreement with JP Morgan Chase Bank, N.A., contains certain financial covenants, including minimum net income requirements, requirements that we maintain net worth ratios at prescribed levels, minimum debt service coverage ratio and minimum funded debt to EBITDA ratios. As of March 31, 2
014, we were not compliant with the debt service coverage and funded debt to EBITDA covenant requirements but received a waiver related to the covenant defaults. The credit agreement also contains certain restrictions on our ability to make capital or lease expe
nditures over prescribed limits, incur additional indebtedness, consolidate or merge, guarantee obligations of third parties, make loans or advances, declare or pay any dividend or distribution on our stock, rede
em or repurchase shares of our stock, or pledge assets. The credit agreement also contains other customary covenants.
There can be no assurance that we will be able to comply with the financial and other covenants in the credit agreement. Our failure to comply with these covenants could cause us to be unable to borrow under the agreement and may constitute an event of default which, if not cured or waived, could result in the acceleration of the maturity of any indebtedness then outstanding under the agreement, which would require us to pay all amounts outstanding. Due to our cash and cash equivalent position and the fact that we have no borrowings currently outstanding, we do not currently anticipate that our failure to comply with the covenants under the credit agreement would have a significant impact on our ability to meet our financial obligations in the near term; however, such events of non-compliance could impact the terms of any additional borrowings and/or any credit renewal terms. Our failure to comply with such covenants is a disclosable event and may be perceived negatively. Such perception could adversely affect the market price for our common stock and our ability to obtain financing in the future.
If our information tech
nology systems fail, or if we experience an interruption in their operation, then our business, results of operations and financial condition could be materially adversely affected.
The efficient operation of our business is dependent on our information technology systems. We rely on those systems generally to manage the day-to-day operation of our business, manage relationships with our customers, maintain our research and development data and maintain our financial and accounting records. The failure of our information technology systems, our inability to successfully maintain, enhance and/or replace our information technology systems, or any compromise of the integrity or security of the data we generate from our information technology systems, could adversely affect our results of operations, disrupt our business and product development and make us unable, or severely limit our ability, to respond to customer demands. In addition, our information technology systems are vulnerable to damage or interruption from:
•
earthquake, fire, flood and other natural disasters;
•
employee or other theft;
•
attacks by computer viruses or hackers;
•
power outages; and
•
computer systems, internet, telecommunications or data network failure.
Any interruption of our information technology systems could result in decreased revenue, increased expenses, increased capital expenditures, customer dissatisfaction and potential lawsuits, any of which could have a material adverse effect on our results of operations or financial condition.
Our retrofitting process frequently involves responsibility for the removal and disposal of components containing hazardous materials.
When we retrofit a customer’s facility, we typically assume responsibility for removing and disposing of its existing lighting fixtures. Certain components of these fixtures typically contain trace amounts of mercury and other hazardous materials. Older components may also contain trace amounts of polychlorinated biphenyls, or PCBs. We currently rely on contractors to remove the components containing such hazardous materials at the customer job site. The contractors then arrange for the disposal of such components at a licensed disposal facility. Failure by such contractors to remove or dispose of the components containing these hazardous materials in a safe, effective and lawful manner could give rise to liability for us, or could expose our workers or other persons to these hazardous materials, which could result in claims against us.
The cost of compliance with environmental laws and regulations and any related environmental liabilities could adversely affect our results of operations or financial condition.
Our operations are subject to federal, state and local laws and regulations governing, among other things, emissions to air, discharge to water, the remediation of contaminated properties and the generation, handling, storage, transportation, treatment and disposal of, and exposure to, waste and other materials, as well as laws and regulations relating to occupational health and safety.
18
These laws and regulations frequently change, and the violation of these laws or regulations can lead to substantial fines, penalties and other liabilities. The operation of our manufacturing facility entails risks in these areas and there can be no assurance that we will not incur material costs or liabilities in the future which could adversely affect our results of operations or financial condition.
We expect our quarterly revenue and operating results to fluctuate. If we fail to meet the expectations of market analysts or investors, the market price of our common stock could decline substantially, and we could become subject to securities litigation.
Our quarterly revenue and operating results have fluctuated in the past and will likely vary from quarter to quarter in the future. For example, our first fiscal quarter typically reflects operating results that do not compare favorably with our other fiscal quarters. You should not rely upon the results of one quarter as an indication of our future performance. Our revenue and operating results may fall below the expectations of market analysts or investors in some future quarter or quarters. Our failure to meet these expectations could cause the market price of our common stock to decline substantially. If the price of our common stock is volatile or falls significantly below our current price, we may be the target of securities litigation. If we become involved in this type of litigation, regardless of the outcome, we could incur substantial legal costs, management’s attention could be diverted from the operation of our business, and our reputation could be damaged, which could adversely affect our business, results of operations or financial condition.
Our net operating loss carryforwards provide a future benefit only if we are profitable and may be subject to limitation based upon ownership changes.
As of
March 31, 2014
, we had aggregate federal net operating loss carryforwards of approximately $
19.6 million
and state net operating loss carryforwards of approximately $
15.8 million
. While our federal and state net operating loss carryforwards are fully reserved for, if we are unable to return to and maintain profitability, we may not be able to fully utilize these tax benefits. Furthermore, generally a change of more than 50% in the ownership of a company’s stock, by value, over a three-year period constitutes an ownership change for federal income tax purposes. An ownership change may limit a company’s ability to use its net operating loss carryforwards attributable to the period prior to such change. We believe that past issuances and transfers of our stock caused an ownership change in fiscal 2007 that may affect the timing of the use of our net operating loss carryforwards, but we do not believe the ownership change affects the use of the full amount of our net operating loss carryforwards. As a result, our ability to use our net operating loss carryforwards attributable to the period prior to such ownership change to offset taxable income will be subject to limitations in a particular year, which could potentially result in increased future tax liability for us. In fiscal 2008, utilization of our net operating loss carryforwards was limited to $3.0 million. For fiscal 2012, 2013, and 2014, utilization of our net operating loss carryforwards was not limited.
The failure to establish and maintain internal controls over financial reporting could harm our business and financial results.
Our management is responsible for establishing and maintaining effective internal control over financial reporting. Internal control over financial reporting is a process to provide reasonable assurance regarding the reliability of financial reporting for external purposes in accordance with accounting principles generally accepted in the United States. Because of its inherent limitations, internal control over financial reporting is not intended to provide absolute assurance that we would prevent or detect a misstatement of our financial statements or fraud. In fiscal 2012, our Chief Executive Officer and Chief Financial Officer concluded that our internal controls were not effective due to certain identified material weaknesses, which were remediated during fiscal 2013. As of March 31, 2013 and 2014, our internal controls were determined to be effective . However, the failure to maintain an effective system of internal control over financial reporting could limit our ability to report our financial results accurately and in a timely manner or to detect and prevent fraud and could also cause a loss of investor confidence and decline in the market price of our common stock.
If securities or industry analysts do not continue to publish research or publish inaccurate or unfavorable research about our business, our stock price and trading volume could decline.
The trading market for our common stock will continue to depend in part on the research and reports that securities or industry analysts publish about us or our business. If these analysts do not continue to provide adequate research coverage or if one or more of the analysts who covers us downgrades our stock or publishes inaccurate or unfavorable research about our business, our stock price would likely decline. If one or more of these analysts ceases coverage of our company or fails to publish reports on us regularly, demand for our stock could decrease, which could cause our stock price and trading volume to decline.
The market price of our common stock could be adversely affected by future sales of our common stock in the public market by us or our executive officers and directors.
We and executive officers and directors may from time to time sell shares of our common stock in the public market or otherwise. We cannot predict the size or the effect, if any, that future sales of shares of our common stock by us or our executive officers and directors, or the perception of such sales, would have on the market price of our common stock.
19
Anti-takeover provisions included in the Wisconsin Business Corporation Law, provisions in our amended and restated articles of incorporation or bylaws and the common share purchase rights that accompany shares of our common stock could delay or prevent a change of control of our company, which could adversely impact the value of our common stock and may prevent or frustrate attempts by our shareholders to replace or remove our current board of directors or management.
A change of control of our company may be discouraged, delayed or prevented by certain provisions of the Wisconsin Business Corporation Law. These provisions generally restrict a broad range of business combinations between a Wisconsin corporation and a shareholder owning 15% or more of our outstanding common stock. These and other provisions in our amended and restated articles of incorporation, including our staggered board of directors and our ability to issue “blank check” preferred stock, as well as the provisions of our amended and restated bylaws and Wisconsin law, could make it more difficult for shareholders or potential acquirers to obtain control of our board of directors or initiate actions that are opposed by the then-current board of directors, including to delay or impede a merger, tender offer or proxy contest involving our company.
Each currently outstanding share of our common stock includes, and each newly issued share of our common stock will include, a common share purchase right. The rights are attached to, and trade with, the shares of common stock and generally are not exercisable. The rights will become exercisable if a person or group acquires, or announces an intention to acquire, 20% or more of our outstanding common stock. The rights have some anti-takeover effects and generally will cause substantial dilution to a person or group that attempts to acquire control of us without conditioning the offer on either redemption of the rights or amendment of the rights to prevent this dilution. The rights could have the effect of delaying, deferring or preventing a change of control.
In addition, our employment arrangements with senior management provide for severance payments and accelerated vesting of benefits, including accelerated vesting of stock options, upon a change of control. These provisions could limit the price that investors might be willing to pay in the future for shares of our common stock, thereby adversely affecting the market price of our common stock. These provisions may also discourage or prevent a change of control or result in a lower price per share paid to our shareholders.
|
ITEM 1B.
|
UNRESOLVED STAFF COMMENTS
|
None.
|
ITEM 2.
|
PROPERTIES
|
We own our approximately 266,000 square foot manufacturing and distribution facility in Manitowoc, Wisconsin used by the energy management segment. We own our approximately 70,000 square foot technology center and corporate headquarters adjacent to our Manitowoc manufacturing and distribution facility used by all of the segments. We also lease a 5,600 square foot sales and technology office in Houston, Texas, a 10,500 square foot office space in Jacksonville, Florida, and a 43,000 square foot office and manufacturing space in Green Cove Springs, Florida, which are all used by the energy management segment. The Green Cove Springs lease expires in July 2014 and will not be renewed.
In May 2014, we sold our 23,000 square foot sales and operations support facility in Plymouth, Wisconsin. See Note K to the Financial Statements.
|
ITEM 3.
|
LEGAL PROCEEDINGS
|
We are subject to various claims and legal proceedings arising in the ordinary course of business. As of the date hereof, we are unable to currently assess whether the final resolution of any of such claims or legal proceedings may have a material adverse affect on us. In addition to ordinary-course litigation, we are a party to the proceedings described below.
In August 2012, we received a subpoena issued by the SEC requesting certain documents and information generally related to the financial reporting of our sales of solar photovoltaic systems, among other matters. We continue to cooperate with the SEC regarding this non-public, fact-finding inquiry. The SEC has informed us that this inquiry should not be construed as an indication that an
y violations of law have occurred or that the SEC has any negative opinion of any person, entity or security.
On March 27, 2014, we were named as a defendant in a civil lawsuit filed by Neal R. Verfuerth, our former chief executive officer who was terminated for cause in November 2012, in the United States District Court for the Eastern District of Wisconsin (Green Bay Division). The plaintiff alleges, among other things, that we breached certain agreements entered into with the plaintiff, including the plaintiff’s employment agreement, and violated certain laws. The complaint seeks, among other relief, unspecified pecuniary and compensatory damages, fees and such other relief as the court may deem just and proper. We believe that the claims are meritless and that we have substantial legal and factual defenses to the claims and allegations contained in the complaint. We intend to defend against these claims vigorously.
20
|
ITEM 4.
|
MINE SAFETY DISCLOSURES
|
None.
|
ITEM 5.
|
MARKET FOR REGISTRANT’S COMMON EQUITY, RELATED SHAREHOLDER MATTERS AND ISSUER PURCHASES OF EQUITY SECURITIES
|
Price Range of our Common Stock
Our common stock is listed on the NYSE MKT under the symbol “OESX”. The following table sets forth the range of high and low sales prices per share as reported on the NYSE MKT for the periods indicated.
|
High
|
Low
|
||||||
|
Fiscal 2013
|
|||||||
|
First Quarter
|
$
|
2.51
|
|
$
|
1.90
|
|
|
|
Second Quarter
|
$
|
2.41
|
|
$
|
1.40
|
|
|
|
Third Quarter
|
$
|
1.98
|
|
$
|
1.12
|
|
|
|
Fourth Quarter
|
$
|
3.09
|
|
$
|
1.60
|
|
|
|
Fiscal 2014
|
|||||||
|
First Quarter
|
$
|
2.51
|
|
$
|
2.00
|
|
|
|
Second Quarter
|
$
|
4.44
|
|
$
|
2.30
|
|
|
|
Third Quarter
|
$
|
7.22
|
|
$
|
3.50
|
|
|
|
Fourth Quarter
|
$
|
8.11
|
|
$
|
4.71
|
|
|
Shareholders
As of
June 6, 2014
, there were approximately
214
record holders of the
21,737,724
outstanding shares of our common stock. The number of record holders does not include shareholders for whom shares are held in a “nominee” or “street” name.
Dividend Policy
We have never paid or declared any cash dividends on our common stock. We currently intend to retain all available funds and any future earnings to fund the development and expansion of our business, and we do not anticipate paying any cash dividends in the foreseeable future. In addition, the terms of our existing credit agreement restrict the payment of cash dividends on our common stock. Any future determination to pay dividends will be at the discretion of our board of directors and will depend on our financial condition, results of operations, capital requirements, contractual restrictions (including those under our loan agreements) and other factors that our board of directors deems relevant.
Securities Authorized for Issuance under Equity Compensation Plans
The following table represents shares outstanding under our 2003 Stock Option Plan and our 2004 Equity Incentive Plan as of
March 31, 2014
.
|
Equity Compensation Plan Information
|
||||||||||
|
Plan Category
|
Number of Securities to be Issued Upon Exercise of Outstanding Options and Vesting of Restricted Shares
|
Weighted Average Exercise Price of Outstanding Options and Restricted Shares
|
Number of Securities Remaining Available for
Future Issuances Under the Equity Compensation Plans (1) |
|||||||
|
Equity Compensation plans approved by security holders
|
3,255,521
|
|
$
|
3.39
|
|
1,291,996
|
|
|||
|
Equity Compensation plans not approved by security holders
|
—
|
|
—
|
|
—
|
|
||||
|
Total
|
3,255,521
|
|
$
|
3.39
|
|
1,291,996
|
|
|||
______________________________
|
(1)
|
Excludes shares reflected in the column titled “Number of Securities to be Issued Upon Exercise of Outstanding Options”.
|
21
Issuer Purchase of Equity Securities
We did not purchase shares of our common stock during the year ended
March 31, 2014
, and we do not intend to repurchase shares of our common stock in the near term.
Unregistered Sales of Securities
Not applicable.
Stock Price Performance Graph
The following graph shows the total shareholder return of an investment of $100 in cash on March 31, 2009, through
March 31, 2014
, for (1) our common stock, (2) the Russell 2000 Index and (3) The NASDAQ Clean Edge Green Energy Index. Data for the Russell 2000 Index and the NASDAQ Clean Edge Green Energy Index assume reinvestment of dividends. The stock price performance graph should not be deemed filed or incorporated by reference into any other filing made by us under the Securities Act of 1933 or the Securities Exchange Act of 1934, except to the extent that we specifically incorporate the stock performance graph by reference in another filing.
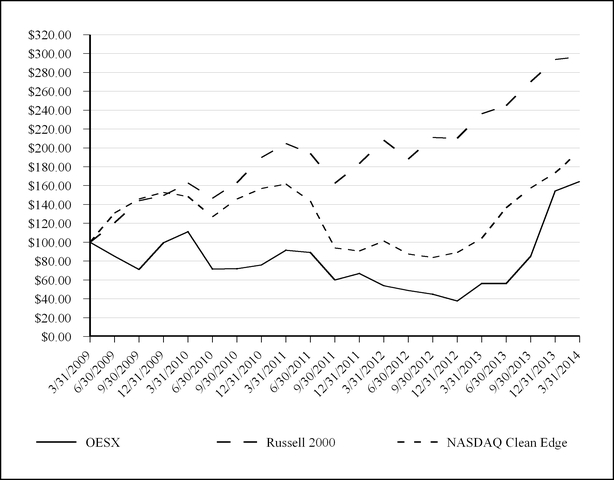
|
March 31, 2009
|
March 31, 2010
|
March 31, 2011
|
March 31, 2012
|
March 31, 2013
|
March 31, 2014
|
|||||||||||||||||||
|
Orion Energy Systems, Inc.
|
$
|
100
|
|
$
|
111
|
|
$
|
92
|
|
$
|
54
|
|
$
|
56
|
|
$
|
164
|
|
||||||
|
Russell 2000 Index
|
$
|
100
|
|
$
|
163
|
|
$
|
205
|
|
$
|
208
|
|
$
|
236
|
|
$
|
297
|
|
||||||
|
NASDAQ Clean Edge Green Energy Index
|
$
|
100
|
|
$
|
149
|
|
$
|
162
|
|
$
|
101
|
|
$
|
104
|
|
$
|
197
|
|
||||||
22
|
ITEM 6.
|
SELECTED FINANCIAL DATA
|
You should read the following selected consolidated financial data in conjunction with “Management’s Discussion and Analysis of Financial Condition and Results of Operations” and our consolidated financial statements and the related notes included elsewhere in this Form 10-K. The consolidated statements of operations data for the fiscal years ended
March 31, 2012
,
2013
and
2014
and the consolidated balance sheet data as of
March 31, 2013
and
2014
are derived from our audited consolidated financial statements included elsewhere in this Form 10-K, which have been prepared in accordance with generally accepted accounting principles in the United States. The consolidated statements of operations data for the years ended
March 31, 2010
and
2011
, and the consolidated balance sheet data as of
March 31, 2010
,
2011
and
2012
have been derived from our audited consolidated financial statements which are not included in this Form 10-K. The selected historical consolidated financial data are not necessarily indicative of future results.
|
|
Fiscal Year Ended March 31,
|
||||||||||||||||||
|
|
2010
|
2011
|
2012
|
2013
|
2014
|
||||||||||||||
|
|
(in thousands, except per share amounts)
|
||||||||||||||||||
|
Consolidated statements of operations data:
|
|||||||||||||||||||
|
Product revenue
|
$
|
60,882
|
|
$
|
75,870
|
|
$
|
90,782
|
|
$
|
72,604
|
|
$
|
71,954
|
|
||||
|
Service revenue
|
7,191
|
|
6,167
|
|
9,780
|
|
13,482
|
|
16,669
|
|
|||||||||
|
Total revenue
|
68,073
|
|
82,037
|
|
100,562
|
|
86,086
|
|
88,623
|
|
|||||||||
|
Cost of product revenue(1)
|
40,063
|
|
49,809
|
|
62,842
|
|
49,551
|
|
54,423
|
|
|||||||||
|
Cost of service revenue
|
5,266
|
|
4,589
|
|
7,682
|
|
9,805
|
|
11,220
|
|
|||||||||
|
Total cost of revenue
|
45,329
|
|
54,398
|
|
70,524
|
|
59,356
|
|
65,643
|
|
|||||||||
|
Gross profit
|
22,744
|
|
27,639
|
|
30,038
|
|
26,730
|
|
22,980
|
|
|||||||||
|
General and administrative expenses(1)(2)(3)
|
12,836
|
|
11,686
|
|
11,399
|
|
13,946
|
|
14,951
|
|
|||||||||
|
Acquisition and integration related expenses (4)
|
—
|
|
—
|
|
—
|
|
—
|
|
819
|
|
|||||||||
|
Sales and marketing expenses(1)(2)
|
12,596
|
|
13,674
|
|
15,599
|
|
17,129
|
|
13,527
|
|
|||||||||
|
Research and development expenses(1)
|
1,891
|
|
2,333
|
|
2,518
|
|
2,259
|
|
2,026
|
|
|||||||||
|
(Loss) Income from operations
|
(4,579
|
)
|
(54
|
)
|
522
|
|
(6,604
|
)
|
(8,343
|
)
|
|||||||||
|
Interest expense
|
(256
|
)
|
(406
|
)
|
(551
|
)
|
(567
|
)
|
(481
|
)
|
|||||||||
|
Gain on sale of OTA contract receivables
|
(561
|
)
|
(1,012
|
)
|
32
|
|
—
|
|
—
|
|
|||||||||
|
Extinguishment of debt
|
250
|
|
—
|
|
—
|
|
—
|
|
—
|
|
|||||||||
|
Dividend and interest income
|
670
|
|
571
|
|
850
|
|
845
|
|
567
|
|
|||||||||
|
Income (loss) before income tax
|
(4,476
|
)
|
(901
|
)
|
853
|
|
(6,326
|
)
|
(8,257
|
)
|
|||||||||
|
Income tax expense (benefit)(2)(3)
|
(1,003
|
)
|
(1,242
|
)
|
370
|
|
4,073
|
|
(2,058
|
)
|
|||||||||
|
Net income (loss) and comprehensive income (loss)
|
$
|
(3,473
|
)
|
$
|
341
|
|
$
|
483
|
|
$
|
(10,399
|
)
|
$
|
(6,199
|
)
|
||||
|
Net income (loss) per share attributable to common shareholders:
|
|||||||||||||||||||
|
Basic
|
$
|
(0.16
|
)
|
$
|
0.02
|
|
$
|
0.02
|
|
$
|
(0.50
|
)
|
$
|
(0.30
|
)
|
||||
|
Diluted
|
$
|
(0.16
|
)
|
$
|
0.01
|
|
$
|
0.02
|
|
$
|
(0.50
|
)
|
$
|
(0.30
|
)
|
||||
|
Weighted-average shares outstanding:
|
|||||||||||||||||||
|
Basic
|
21,844
|
|
22,678
|
|
22,953
|
|
20,997
|
|
20,988
|
|
|||||||||
|
Diluted
|
21,844
|
|
23,198
|
|
23,387
|
|
20,997
|
|
20,988
|
|
|||||||||
23
______________________________
|
(1)
|
Includes stock-based compensation expense recognized under Financial Accounting Standards Board Accounting Standards Codification Topic 718, or ASC Topic 718, as follows:
|
|
|
Fiscal Year Ended March 31,
|
||||||||||
|
|
2012
|
2013
|
2014
|
||||||||
|
|
(in thousands)
|
||||||||||
|
Cost of product revenue
|
$
|
189
|
|
$
|
114
|
|
$
|
70
|
|
||
|
General and administrative expenses
|
548
|
|
578
|
|
1,025
|
|
|||||
|
Sales and marketing expenses
|
501
|
|
451
|
|
485
|
|
|||||
|
Research and development expenses
|
29
|
|
21
|
|
13
|
|
|||||
|
Total stock-based compensation expense
|
$
|
1,267
|
|
$
|
1,164
|
|
$
|
1,593
|
|
||
|
(2)
|
Includes fiscal 2013 reorganization expenses of $1.9 million in general and administrative expenses, $0.2 million in sales and marketing expenses and a $4.1 million valuation reserve for deferred tax assets in income tax expense.
|
|
(3)
|
Includes fiscal 2014 loss on sale of a leased corporate jet of $1.5 million in general and administrative expenses and a $2.3 million benefit for deferred tax liabilities created by the acquisition of Harris in income tax benefit.
|
(4) Includes fiscal 2014 expenses of $0.5 million related to the acquisition and integration of Harris.
______________________________
|
|
As of March 31,
|
||||||||||||||||||
|
|
2010
|
2011
|
2012
|
2013
|
2014
|
||||||||||||||
|
|
(in thousands)
|
||||||||||||||||||
|
Consolidated balance sheet data:
|
|||||||||||||||||||
|
Cash and cash equivalents
|
$
|
23,364
|
|
$
|
11,560
|
|
$
|
23,011
|
|
$
|
14,376
|
|
$
|
17,568
|
|
||||
|
Short-term investments
|
1,000
|
|
1,011
|
|
1,016
|
|
1,021
|
|
470
|
|
|||||||||
|
Total assets
|
104,578
|
|
121,087
|
|
125,650
|
|
102,097
|
|
98,940
|
|
|||||||||
|
Long-term debt, less current maturities
|
3,156
|
|
4,225
|
|
6,704
|
|
4,109
|
|
3,151
|
|
|||||||||
|
Shareholder notes receivable
|
—
|
|
(193
|
)
|
(221
|
)
|
(265
|
)
|
(50
|
)
|
|||||||||
|
Total shareholders’ equity
|
$
|
88,387
|
|
$
|
90,455
|
|
$
|
92,769
|
|
$
|
77,769
|
|
$
|
77,012
|
|
||||
|
ITEM 7.
|
MANAGEMENT’S DISCUSSION AND ANALYSIS OF FINANCIAL CONDITION AND RESULTS OF OPERATIONS
|
The following discussion and analysis should be read in conjunction with our consolidated financial statements and related notes included elsewhere in this Annual Report on Form 10-K. See also “Forward-Looking Statements” and Item 1A. “Risk Factors”.
Fiscal 2014 Developments
On July 1, 2013, we completed the acquisition of the equity interests of Harris Manufacturing, Inc. and Harris LED, LLC, or collectively, Harris. Harris engineers, designs, sources and manufactures energy efficient lighting systems, including fluorescent and LED lighting solutions, and day-lighting products. The Harris acquisition has expanded our product lines, increased our sales force and provided growth opportunities into markets where we did not have a strong presence, specifically, new construction, retail store fronts, commercial office and government. The preliminary purchase price for the transaction was $10.8 million, after an adjustment of $0.2 million for excess net working capital over a targeted amount. The purchase price was paid in a combination of $5.0 million of cash, $3.1 million in a three-year unsecured subordinated note bearing interest at the rate of 4% per annum, and the issuance of 856,997 shares of unregistered common stock, representing a fair value on the date of issuance of $2.1 million. We also agreed to issue up to $1.0 million in shares of our unregistered common stock if Harris met certain revenue targets through calendar year 2014, and, in the case of certain Harris shareholders who became our employees, their continued employment by us. In October 2013, we amended the earn-out provisions of the Harris purchase agreement to fix the future consideration for the earn-out at $1.4 million and eliminate the future revenue targets, although the employee retention provisions still apply to Harris
24
shareholders who became our employees. On January 2, 2014, we issued $0.6 million, or an aggregate of 83,943, unregistered shares of common stock to the Harris shareholders. We will also settle $0.8 million on January 2, 2015 in cash. Harris had revenue of approximately $14.7 million and net income of approximately $0.9 million during the year ended December 31, 2012. During the nine months following the July 2013 acquisition, Harris had revenue of $9.4 million and an operating loss of $(0.5) million. Included in the $(0.5) million loss is $0.6 million of expense for intangible amortization and $0.3 million of expense for compensation related to deferred consideration. We expect the transaction to continue to be accretive to our future earnings during fiscal 2015 after adjusting for non-cash amortization of intangible assets acquired and purchase accounting expenses for deferred compensation.
We acquired certain LED technologies through the acquisition of Harris which complement our existing portfolio of LED lighting products. In particular, Harris' LED door retrofit, or LDR, product is designed to retrofit commercial office space, a market in which we have historically recognized little revenue contribution. Since the acquisition of Harris, our engineering and design teams have worked to expand the LDR product line to include architectural, industrial and contractor product categories. According to a May 2013 United States Department of Energy report, we estimate the potential North American LED retrofit market within our key product categories to be approximately 1.1 billion lighting fixtures. We continue to research LED technologies and expect that, as LED performance increases and product costs decrease, LED technologies will become an increasingly larger component of our future revenue.
During the fourth quarter of fiscal 2014, we experienced a reduction in the amount of new customer orders received for our energy efficient HIF lighting systems within our industrial and exterior markets. We attribute this to an increasing awareness within the marketplace of emerging LED product offerings. We believe that customers have deferred purchase decisions as they evaluate the cost and performance of these LED product offerings. It is our expectation that this deferral of purchasing decisions will continue into the back half of our fiscal 2015 when we expect that improvements in performance and expected decreases in LED product costs will make the products even more economically viable.
During fiscal 2014, we actively expanded our in-market sales force. Our in-market sales force is responsible for the development of indirect resellers within their territory. We expect to continue to increase our sales headcount during our fiscal 2015 year.
During fiscal 2013 and fiscal 2014, we experienced a significant reduction in new solar PV orders within our engineered systems segment. We attribute this to reduced cash incentives and declining pricing in the renewable energy credit markets. During this period, we have deemphasized our efforts to obtain new PV construction contracts and have focused on the completion of previously received orders within our solar backlog, which has decreased from $36.1 million at the beginning of our fiscal 2013 to $1.1 million as of March 31, 2014. We expect this trend to continue into fiscal 2015. In response to this solar order decline and our de-emphasis on pursuing new PV orders, we have been redeploying personnel to focus on the opportunities within the LED retrofit market. We continue to provide energy to a single customer through a power purchase agreement, or PPA. A PPA is a supply side agreement for the generation of electricity and subsequent sale to the end user. With the exception of our PPA long-term asset, we do not have significant capital investments or long-term assets affiliated with our non-core solar business.
During the fourth quarter of fiscal 2014, we sold our corporate leased jet which provided an additional $1.5 million in annualized savings. During fiscal 2015, we intend to reinvest a portion of the annualized savings from our aircraft sale into LED marketing and branding initiatives to increase our customers' awareness of our LED product offerings. We also sold our Plymouth, WI facility during early fiscal 2015, which is expected to result in an additional $0.1 million in annualized reduced operating expenses.
Beginning in fiscal 2015, we intend to reorganize our business into the following business segments: U.S. markets, Orion engineered systems and Orion distribution services. Our U.S. markets division will focus on selling our lighting solutions into the wholesale markets. Its customers include domestic energy service companies and electrical contractors. Our Orion engineered systems division will focus on selling lighting products and construction and engineering services direct to end users. Additionally, Orion engineered systems will complete the construction management services related to existing contracted solar PV projects. Its customers include national accounts, government, municipal and schools. Our Orion distribution services division will focus on selling our lighting products internationally and began to develop a network of broad line distributors. Historically, sales of all our lighting products and the related costs were combined through our energy management division. For this reason, we are able to recast prior period revenue totals with respect to each of our three new business segments, but are not able to practically recast the prior period operating income or loss of these new segments. We expect to begin reporting under these new segments during our first quarter of fiscal 2015.
25
Fiscal 2013 Developments
During fiscal 2013, we recorded operating expenses related to reorganization costs of $2.1 million, which included $1.9 million to general and administrative expenses and $0.2 million to sales and marketing expenses. Additionally, we recorded a $4.1 million non-cash income tax expense to establish a valuation allowance against our deferred tax assets. During fiscal 2014, we recorded a $2.3 million benefit against this valuation allowance to offset deferred tax liabilities acquired from Harris.
During the fiscal 2013 second half, we implemented $5.2 million in annualized cost reduction initiatives, including a reduction in headcount of approximately 18%, the termination of consulting agreements, material and component cost savings in our high intensity fluorescent, or HIF, lighting products, and discretionary spending reductions.
Overview
We research, develop, design, manufacture, market, sell and implement energy management systems consisting primarily of high-performance, energy efficient commercial and industrial interior and exterior lighting systems, controls, power data management and cloud-based data storage and related services. We have historically implemented renewable energy systems consisting primarily of solar generating PV systems and wind turbines, but have de-emphasized these products as disclosed in the paragraph above. We currently operate in two business segments, which we refer to as our energy management division and our engineered systems division.
We typically generate virtually all of our revenue from sales of HIF lighting systems and related services to commercial and industrial customers. We typically sell our HIF lighting systems in replacement of our customers’ existing HID fixtures. We call this replacement process a “retrofit.” We frequently engage our customer’s existing electrical contractor to provide installation and project management services. We also sell our HIF lighting systems on a wholesale basis, principally to electrical contractors and energy service companies to sell to their own customer bases.
We have more recently introduced new products of our LED lighting and energy management systems. We believe that we have taken a responsible approach to this emerging technology. Based upon recent improvements, including drastic reduction of chip prices, availability of name-brand drivers and the integration with our InteLite controls offerings, we believe that LED will become a larger part of our overall interior and exterior lighting strategy in the future. We believe that our new LED product offerings also present new opportunities in the hospitality, health care, education, office and general retail markets, in addition to strengthening our position as an energy management leader in the commercial, industrial and food service markets.
We have sold and installed approximately
4.0 million
of our HIF and LED lighting systems in more than
10,461
facilities from December 1, 2001 through
March 31, 2014
. Our top direct customers by revenue in fiscal
2014
included
Coca-Cola Enterprises Inc., Dollar General Corporation, Ford Motor Co,, SYSCO Corp., and MillerCoors.
Our fiscal year ends on March 31. We call our fiscal years which ended on
March 31, 2012
,
2013
and
2014
, “fiscal
2012
,” “fiscal
2013
” and “fiscal
2014
,” respectively. Our fiscal first quarter ends on June 30, our fiscal second quarter ends on September 30, our fiscal third quarter ends on December 31 and our fiscal fourth quarter ends on March 31.
Due to a difficult economic environment, especially as it has impacted capital equipment manufacturers, our results for fiscal 2013 and fiscal 2014 continued to be adversely affected by lengthened customer sales cycles, the government shutdown, which delayed in process projects, and sluggish customer capital spending. To address these difficult economic conditions, we implemented several cost reduction initiatives during the fiscal 2013 second half as described above. During fiscal 2014, we aggressively focused on additional cost containment initiatives related to material product costs, service margin expansion and implementing lean manufacturing methodologies to reduce production costs in our manufacturing facility. We currently anticipate approximately $1.0 million in annualized synergies from our Harris acquisition related to headcount reductions and facility operating cost decreases. We do not expect full synergies to be achieved until the middle of calendar year 2015, when the Florida manufacturing facility lease expires.
In response to the constraints on our customers’ capital spending budgets, we promote the advantages to our customers of purchasing our energy management systems through our Orion Throughput Agreement, or OTA, financing program. Our OTA financing program provides for our customer’s purchase of our energy management systems without an up-front capital outlay. We have an arrangement with a national equipment finance company to provide immediate non-recourse and recourse funding of pre-credit approved OTA finance contracts upon project completion and customer acceptance. Virtually all of these sales occur on a non-recourse basis. During fiscal 2013 and fiscal 2014, approximately 73.3% and 94.3% respectively, of our total completed OTA contracts were financed directly through third party equipment finance companies. In the future, we intend to continue to utilize third party finance companies to fund virtually all of our OTA contracts. Additionally, during fiscal 2012 we completed a $5.0 million OTA line-of-credit for the purpose of funding OTA projects upon the project completion and customer acceptance, for which we chose to hold the contracts internally. In the future, we do not intend to fund OTA contracts through debt borrowings. In future periods, the number of customers who choose to purchase our systems by using our OTA financing program will be
26
dependent upon our relationships with third party equipment finance companies, the extent to which customers' choose to use their own capital budgets and the extent to which customers' choose to enter into finance contracts. Additionally, we have provided a financing program to our alternative renewable energy system customers called a PPA as an alternative to purchasing our systems for cash. The PPA is a supply side agreement for the generation of electricity and subsequent sale to the end user. We do not intend to use our own cash balances to fund future PPA opportunities and have been able to secure several external sources of funding for PPA’s on behalf of our customers.
Our engineered systems division has been offering our customers additional alternative renewable energy systems. During fiscal 2013 and fiscal 2014, we did not sign any significant new solar contracts. We attribute this to the December 2011 expiration of federal cash grants available for solar projects, declining solar prices for panels, an unstable supply environment, including bankruptcy filings from several solar panel suppliers, and a decline in the value of state and utility incentives. Due to the reduction in new solar contracts, during fiscal 2014, we redeployed substantially all of our engineered systems personnel to focus on the sales and project management support of our HIF and LED lighting systems.
Despite these recent economic challenges, we remain optimistic about our near-term and long-term financial performance. Our near-term optimism is based upon our improved cash flow generation during fiscal 2014, our investments into our in-market sales force, our intentions to continue to expand our sales force during fiscal 2015, our cost containment initiatives and opportunities, the increasing volume of unit sales of our new products, specifically our LED lighting fixtures, the completion of our acquisition of Harris and the increased sales market opportunities and cost synergies that Harris provides. Our long-term optimism is based upon the considerable size of the existing market opportunity for lighting retrofits, including the new market opportunities in commercial office, government and retail that Harris provides, the continued development of our new products and product enhancements, including our new LED product offerings, our cost reduction initiatives, and the opportunity to increase gross margins through the leverage of our under-utilized manufacturing capacity.
Revenue and Expense Components
Revenue
. We sell our energy management products and services directly to commercial and industrial customers, and indirectly to end users through wholesale sales to electrical contractors and value-added resellers. We currently generate virtually all of our revenue from sales of HIF and LED lighting systems and related services to commercial and industrial customers. While our services include comprehensive site assessment, site field verification, utility incentive and government subsidy management, engineering design, project management, installation and recycling in connection with our retrofit installations, we separately recognize service revenue only for our installation and recycling services. Our installation and recycling service revenues are recognized when services are complete and customer acceptance has been received. In fiscal 2012, we increased our efforts to expand our value-added reseller channels, including through developing a reseller standard operating procedural kit, providing our resellers with product marketing materials and providing training to resellers on our sales methodologies. In the back half of fiscal 2014, we transitioned our in-market sales force to focus our efforts on expanding and developing our reseller channels along with selling directly to customers within their markets. These wholesale channels accounted for approximately
64%
,
59%
and
63%
of our total revenue volume in fiscal
2012
, fiscal
2013
and fiscal
2014
, respectively, not taking into consideration our renewable technologies revenue generated through our engineered systems division. In fiscal 2012, we focused our expansion efforts on our direct retail sales channel through the creation of a telemarketing call center for the purpose of customer lead generation, the establishment of a sales office and personnel in Houston, Texas and headcount additions to our retail sales force and our engineered systems division. During the fiscal 2013 second half, we re-engineered our telemarketing call center for the purpose of improving the quality of leads and increasing sales closing ratios. During fiscal 2014, our call center began to provide leads to our reseller channel on a fee basis. During fiscal 2014, we expanded our in-market sales force and intend to continue increasing the number of in-market sales personnel during fiscal 2015.
Additionally, we offer our OTA sales-type financing program under which we finance the customer’s purchase of our energy management systems. The OTA program was established to assist customers who are interested in purchasing our energy management systems but who have capital expenditure budget limitations. Our OTA contracts are capital leases under GAAP and we record revenue at the present value of the future payments at the time customer acceptance of the installed and operating system is complete. Our OTA contracts under this sales-type financing are either structured with a fixed term, typically 60 months, and a bargain purchase option at the end of term, or are one year in duration and, at the completion of the initial one-year term, provide for (i) one to four automatic one-year renewals at agreed upon pricing; (ii) an early buyout for cash; or (iii) the return of the equipment at the customer’s expense. The revenue that we are entitled to receive from the sale of our lighting fixtures under our OTA financing program is fixed and is based on the cost of the lighting fixtures and applicable profit margin. Our revenue from agreements entered into under this program is not dependent upon our customers’ actual energy savings. We recognize revenue from OTA contracts at the net present value of the future cash flows at the completion date of the installation of the energy management systems and the customers acknowledgment that the system is operating as specified. Upon completion of the installation, we may choose to sell the future cash flows and residual rights to the equipment on a non-recourse basis to an unrelated third party finance company in exchange for cash and future payments.
27
In fiscal
2012
, we recognized
$10.2 million
of revenue from
139
completed OTA contracts. In fiscal
2013
, we recognized
$6.7 million
of revenue from
128
completed OTA contracts. In fiscal
2014
, we recognized
$4.0 million
of revenue from
67
completed OTA contracts.
Our PPA financing program provides for our customer’s purchase of electricity from our renewable energy generating assets without an upfront capital outlay. Our PPA is a longer-term contract, typically in excess of 10 years, in which we receive monthly payments over the life of the contract. This program creates an ongoing recurring revenue stream, but reduces near-term revenue as the payments are recognized as revenue on a monthly basis over the life of the contract versus upfront upon product shipment or project completion. In fiscal
2012
, we recognized
$0.6 million
of revenue from completed PPAs. In fiscal
2013
, we recognized
$0.7 million
of revenue from completed PPAs. In fiscal
2014
, we recognized
$0.5 million
of revenue from completed PPAs. As of
March 31, 2014
, we had signed
1
customer to
2
separate PPAs representing future potential discounted revenue streams of
$1.9 million
. In the future, we do not expect to complete any additional new PPA agreements. We discount the future revenue from PPAs due to the long-term nature of the contracts, typically in excess of 10 years. The timing of expected future discounted GAAP revenue recognition and the resulting operating cash inflows from PPAs, assuming the systems perform as designed, was as follows as of
March 31, 2014
(in thousands):
|
Fiscal 2015
|
$
|
247
|
|
|
Fiscal 2016
|
247
|
|
|
|
Fiscal 2017
|
247
|
|
|
|
Fiscal 2018
|
246
|
|
|
|
Fiscal 2019
|
246
|
|
|
|
Beyond
|
676
|
|
|
|
Total expected future discounted revenue from PPA's
|
$
|
1,909
|
|
For sales of our solar PV systems, which are governed by customer contracts that require us to deliver functioning solar power systems and are generally completed within three to 15 months from the start of project construction, we recognize revenue from fixed price construction contracts using the percentage-of-completion method. Under this method, revenue arising from fixed price construction contracts is recognized as work is performed based upon the percentage of incurred costs to estimated total forecasted costs. We have determined that the appropriate method of measuring progress on these sales is measured by the percentage of costs incurred to date of the total estimated costs for each contract as materials are installed. The percentage-of-completion method requires revenue recognition from the delivery of products to be deferred and the cost of such products to be capitalized as a deferred cost and current asset on the balance sheet. We perform periodic evaluations of the progress of the installation of the solar PV systems using actual costs incurred over total estimated costs to complete a project. Provisions for estimated losses on uncompleted contracts, if any, are recognized in the period in which the loss first becomes probable and reasonably estimable.
We recognize revenue on product only sales of our lighting and energy management systems at the time of shipment. For lighting and energy management systems projects consisting of multiple elements of revenue, such as a combination of product sales and services, we recognize revenue by allocating the total contract revenue to each element based on their relative selling prices. We determine the selling price of each element based upon management’s best estimate giving consideration to pricing practices, margin objectives, competition, scope and size of individual projects, geographies in which we offer our products and services and internal costs. We recognize revenue at the time of product shipment on product sales and on services completed prior to product shipment. We recognize revenue associated with services provided after product shipment, based on their relative selling price, when the services are completed and customer acceptance has been received. When other significant obligations or acceptance terms remain after products are delivered, revenue is recognized only after such obligations are fulfilled or acceptance by the customer has occurred.
Our dependence on individual key customers can vary from period to period as a result of the significant size of some of our retrofit and multi-facility roll-out projects. Our top 10 customers accounted for approximately
44%
,
35%
and
45%
of our total revenue for fiscal
2012
, fiscal
2013
and fiscal
2014
, respectively. No customer accounted for more than 10% of our total revenue in fiscal
2012
or
2013
. One solar customer, Standard Alternative LLC, accounted for 23% of our fiscal
2014
revenue. To the extent that large retrofit and roll-out projects become a greater component of our total revenue, we may experience more customer concentration in given periods. The loss of, or substantial reduction in sales volume to, any of our significant customers could have a material adverse effect on our total revenue in any given period and may result in significant annual and quarterly revenue variations.
Our level of total revenue for any given period is dependent upon a number of factors, including (i) the demand for our new LED products and services; (ii) the customer acceptance and adoption rate of our new LED products; (iii) the demand for our products and systems, including our OTA programs; (iv) the number and timing of large retrofit and multi-facility retrofit, or “roll-
28
out,” projects; (v) the rate at which we expand our direct salesforce and the amount of time that it takes for them to become productive; (vi) our ability to realize revenue from our services; (vii) market conditions; (viii) the level of our wholesale sales; (ix) our execution of our sales process; (x) our ability to compete in a highly competitive market and our ability to respond successfully to market competition; (xi) the selling price of our products and services; (xii) changes in capital investment levels by our customers and prospects; (xiii) government delays; and (xiv) customer sales and budget cycles. As a result, our total revenue may be subject to quarterly variations and our total revenue for any particular fiscal quarter may not be indicative of future results.
Backlog
. We define backlog as the total contractual value of all firm orders and OTA contracts received for our lighting products and services where delivery of product or completion of services has not yet occurred as of the end of any particular reporting period. Such orders must be evidenced by a signed proposal acceptance or purchase order from the customer. Our backlog does not include PPAs or national contracts that have been negotiated, but under which we have not yet received a purchase order for the specific location. As of
March 31, 2012
, we had a backlog of firm purchase orders of approximately $
41 million
, which included $
36.1 million
of solar PV orders. As of
March 31, 2013
, we had a backlog of firm purchase orders of approximately $
21.9 million
, which included $
20.2 million
of solar PV orders. As of
March 31, 2014
, we had a backlog of firm purchase orders of approximately $
2.7 million
, which included $
1.1 million
of solar PV orders. We expect $
1.0 million
of our $
1.1 million
solar backlog as of
March 31, 2014
to be converted into revenue during fiscal
2015
. We generally expect this level of firm purchase order backlog related to HIF and LED lighting systems to be converted into revenue within the following quarter. We generally expect our firm purchase order backlog related to solar PV systems to be recognized within the following three to 15 months from the time construction of the system begins, although during fiscal 2012, we received an $18.3 million single order for which the solar PV system construction did not begin until our fiscal 2014. As a result of the decreased volume of our solar PV orders, the continued lengthening of our customer’s purchasing decisions because of uncertainty over the timing of adoption of LED products, current recessed economic conditions and related factors, the continued shortening of our installation cycles and the declining number of projects sold through OTAs, a comparison of backlog from period to period is not necessarily meaningful and may not be indicative of actual revenue recognized in future periods.
Cost of Revenue.
Our total cost of revenue consists of costs for: (i) raw materials, including sheet, coiled and specialty reflective aluminum; (ii) electrical components, including ballasts, power supplies, lamps and LED chips and components; (iii) materials for sales of solar PV systems through our engineered systems division, including solar panels, inverters and wiring; (iv) wages and related personnel expenses, including stock-based compensation charges, for our fabricating, coating, assembly, logistics and project installation service organizations; (v) manufacturing facilities, including depreciation on our manufacturing facilities and equipment, taxes, insurance and utilities; (vi) warranty expenses; (vii) installation and integration; and (viii) shipping and handling. Our cost of aluminum can be subject to commodity price fluctuations, which we attempt to mitigate through the recycling of old scrap fixtures through our facility which contain similar content of aluminum when compared to our new fixtures. We also purchase many of our electrical components through forward purchase contracts. We buy most of our specialty reflective aluminum from a single supplier. We buy most of our LED chips from a single supplier, although we believe we could obtain sufficient quantities of these raw materials on a price and quality competitive basis from other suppliers if necessary. We use multiple suppliers for our electronic component purchases, including ballasts. drivers and lamps. Purchases from our previous primary supplier of ballast and lamp components constituted
14%
,
4%
, and
7%
of our total cost of revenue in fiscal
2012
, fiscal
2013
and fiscal
2014
, respectively. Our cost of revenue from OTA projects is recorded upon customer acceptance and acknowledgement that the system is operating as specified. Our production labor force is non-union and, as a result, our production labor costs have been relatively stable. We have been expanding our network of qualified third-party installers to realize efficiencies in the installation process. During fiscal 2012, we reduced headcount and improved production product flow through re-engineering of our assembly stations. During fiscal 2013, we reduced indirect headcount as part of our cost containment initiative. During fiscal 2014, we aggressively focused on cost containment initiatives related to material product costs, service margin expansion and the implementation of lean manufacturing methodologies to reduce production costs in our manufacturing facility. Additionally, we consolidated Harris' Florida manufacturing operations into our Wisconsin facility.
Gross Margin.
Our gross profit has been, and will continue to be, affected by the relative levels of our total revenue and our total cost of revenue, and as a result, our gross profit may be subject to quarterly variation. Our gross profit as a percentage of total revenue, or gross margin, is affected by a number of factors, including: (i) our level of utilization of our manufacturing facilities and production equipment and related absorption of our manufacturing overhead costs; (ii) our mix of large retrofit and multi-facility roll-out projects with national accounts; (iii) our realization rate on our billable services; (iv) our project pricing; (v) our level of warranty claims; (vi) our level of solar PV sales which have greater margin volatility due to recent decreases in product costs versus our traditional energy management systems; and (vii) our level of efficiencies from our subcontracted installation service providers.
Operating Expenses.
Our operating expenses consist of: (i) general and administrative expenses; (ii) acquisition related expenses; (iii) sales and marketing expenses; and (iv) research and development expenses. Personnel related costs are our largest operating expense. In fiscal 2013, we decreased headcount as part of our cost containment initiatives. In fiscal 2014, we increased headcount in our sales areas for in-market sales employees. In fiscal 2015, we expect to continue to increase headcount in our sales areas for in-market sales employees.
29
Our general and administrative expenses consist primarily of costs for: (i) salaries and related personnel expenses, including stock-based compensation charges related to our executive, finance, human resource, information technology and operations organizations; (ii) public company costs, including investor relations, external audit and internal audit; (iii) occupancy expenses; (iv) professional services fees; (v) technology related costs and amortization; (vi) asset impairment charges; and (vii) corporate-related travel.
Our acquisition and integration related expenses consist primarily of costs for: (i) variable purchase accounting expenses for contingent consideration; (ii) legal and accounting costs; and (iii) integration expenses.
Our sales and marketing expenses consist primarily of costs for: (i) salaries and related personnel expenses, including stock-based compensation charges related to our sales and marketing organization; (ii) internal and external sales commissions and bonuses; (iii) travel, lodging and other out-of-pocket expenses associated with our selling efforts; (iv) marketing programs; (v) pre-sales costs; (vi) bad debt; and (vii) other related overhead.
Our research and development expenses consist primarily of costs for: (i) salaries and related personnel expenses, including stock-based compensation charges, related to our engineering organization; (ii) payments to consultants; (iii) the design and development of new energy management products and enhancements to our existing energy management system; (iv) quality assurance and testing; and (v) other related overhead. We expense research and development costs as incurred.
In fiscal 2012, we invested in sales expansion initiatives, including the creation of a telemarketing call center for the purpose of customer lead generation, the establishment of a sales office and hiring of personnel in Houston, Texas and headcount additions to our retail sales force and our engineered systems division. During the back half of fiscal 2013, we initiated cost containment efforts that reduced expenses related to compensation, consulting and other discretionary spending. We expense all pre-sale costs incurred in connection with our sales process prior to obtaining a purchase order. These pre-sale costs may reduce our net income in a given period prior to recognizing any corresponding revenue. During fiscal 2014, we sold our leased corporate jet and consolidated our Plymouth location into our Manitowoc headquarters. We have been and intend to continue to invest in the expansion of our in-market sales force during fiscal 2015. We also intend to continue investing in our research and development of new and enhanced energy management products and services.
We recognize compensation expense for the fair value of our stock option awards and restricted stock awards granted over their related vesting period. We recognized $
1.3 million
, $
1.2 million
, and $
1.6 million
of stock-based compensation expense in fiscal
2012
, fiscal
2013
and fiscal
2014
, respectively. As a result of prior option and restricted stock grants, including awards in fiscal
2014
, we expect to recognize an additional $
1.5 million
of stock-based compensation over a weighted average period of approximately five years. These charges have been, and will continue to be, allocated to cost of product revenue, general and administrative expenses, sales and marketing expenses and research and development expenses based on the departments in which the personnel receiving such awards have primary responsibility. A substantial majority of these charges have been, and likely will continue to be, allocated to general and administrative expenses and sales and marketing expenses.
Interest Expense.
Our interest expense is comprised primarily of interest expense on outstanding borrowings under long-term debt obligations, including the amortization of previously incurred financing costs. We amortize deferred financing costs to interest expense over the life of the related debt instrument, ranging from one to ten years.
Loss or Gain on Sale of Receivable.
Our loss or gain on sale of receivables consists of losses or gains associated with sales of receivables from OTA contracts to a third party and the discounted value of the long-term payments associated with such sale.
Interest Income.
We report interest income earned from our financed OTA contracts and on our cash and cash equivalents and short term investments. For fiscal
2012
, our interest income increased as a result of the increasing OTA finance contracts completed that we retained ownership of the contracts and the related interest charged to customers. For fiscal
2013
and fiscal
2014
, our interest income declined as we began to decrease the number of OTA finance contracts where we retained the ownership of the contract. Instead, we elected to utilize our third party equipment finance providers directly and we recorded no interest income on those transactions.
Income Taxes.
As of March 31, 2014, we had net operating loss carryforwards of approximately $
19.6 million
for federal tax purposes and $
15.8 million
for state tax purposes. Included in these loss carryforwards were $3.5 million for federal and $4.5 million for state tax purposes of compensation expenses that were associated with the exercise of nonqualified stock options. The benefit from our net operating losses created from these compensation expenses has not yet been recognized in our financial statements and will be accounted for in our shareholders’ equity as a credit to additional paid-in capital as the deduction reduces our income taxes payable. We also had federal tax credit carryforwards of approximately $1.5 million and state tax credits of $0.8 million as of
March 31, 2014
. A valuation allowance has been set up to reserve for our net operating losses and our tax credits. It is possible that we may not be able to utilize the full benefit of our state tax credits due to our state apportioned income and the potential expiration of the state tax credits due to the carry forward period. These federal and state net operating losses and credit carryforwards are available, subject to the discussion in the following paragraph, to offset future taxable income and, if not utilized,
30
will begin to expire in varying amounts between 2020 and 2033. Our valuation allowance for deferred tax assets is based upon our cumulative three year operating losses.
Generally, a change of more than 50% in the ownership of a company’s stock, by value, over a three year period constitutes an ownership change for federal income tax purposes. An ownership change may limit a company’s ability to use its net operating loss carryforwards attributable to the period prior to such change. In fiscal 2007 and prior to our IPO, past issuances and transfers of stock caused an ownership change for certain tax purposes. When certain ownership changes occur, tax laws require that a calculation be made to establish a limitation on the use of net operating loss carryforwards created in periods prior to such ownership change. There was no limitation that occurred for fiscal
2012
, fiscal
2013
and fiscal
2014
. We do not believe that this change will impact our overall ability to use our full remaining net operating loss carryforwards during the time period that they are available to us.
Results of Operations
The following table sets forth the line items of our consolidated statements of operations on an absolute dollar basis and as a relative percentage of our total revenue for each applicable period, together with the relative percentage change in such line item between applicable comparable periods set forth below:
|
|
Fiscal Year Ended March 31,
|
|||||||||||||||||||||||||
|
|
2012
|
2013
|
|
2014
|
|
|||||||||||||||||||||
|
|
(Dollars in thousands)
|
|||||||||||||||||||||||||
|
|
Amount
|
% of
Revenue |
Amount
|
% of
Revenue |
%
Change |
Amount
|
% of
Revenue |
%
Change |
||||||||||||||||||
|
Product revenue
|
$
|
90,782
|
|
90.3
|
%
|
$
|
72,604
|
|
84.3
|
%
|
(20.0
|
)%
|
$
|
71,954
|
|
81.2
|
%
|
(0.9
|
)%
|
|||||||
|
Service revenue
|
9,780
|
|
9.7
|
%
|
13,482
|
|
15.7
|
%
|
37.9
|
%
|
16,669
|
|
18.8
|
%
|
23.6
|
%
|
||||||||||
|
Total revenue
|
100,562
|
|
100.0
|
%
|
86,086
|
|
100.0
|
%
|
(14.4
|
)%
|
88,623
|
|
100.0
|
%
|
2.9
|
%
|
||||||||||
|
Cost of product revenue
|
62,842
|
|
62.5
|
%
|
49,551
|
|
57.5
|
%
|
(21.1
|
)%
|
54,423
|
|
61.4
|
%
|
9.8
|
%
|
||||||||||
|
Cost of service revenue
|
7,682
|
|
7.6
|
%
|
9,805
|
|
11.4
|
%
|
27.6
|
%
|
11,220
|
|
12.7
|
%
|
14.4
|
%
|
||||||||||
|
Total cost of revenue
|
70,524
|
|
70.1
|
%
|
59,356
|
|
68.9
|
%
|
(15.8
|
)%
|
65,643
|
|
74.1
|
%
|
10.6
|
%
|
||||||||||
|
Gross profit
|
30,038
|
|
29.9
|
%
|
26,730
|
|
31.1
|
%
|
(11.0
|
)%
|
22,980
|
|
25.9
|
%
|
(14.0
|
)%
|
||||||||||
|
General and administrative expenses
|
11,399
|
|
11.3
|
%
|
13,946
|
|
16.2
|
%
|
22.3
|
%
|
14,951
|
|
16.9
|
%
|
7.2
|
%
|
||||||||||
|
Acquisition and integration related expenses
|
—
|
|
—
|
%
|
—
|
|
—
|
%
|
—
|
%
|
819
|
|
0.9
|
%
|
—
|
%
|
||||||||||
|
Sales and marketing expenses
|
15,599
|
|
15.5
|
%
|
17,129
|
|
19.9
|
%
|
9.8
|
%
|
13,527
|
|
15.3
|
%
|
(21.0
|
)%
|
||||||||||
|
Research and development expenses
|
2,518
|
|
2.6
|
%
|
2,259
|
|
2.7
|
%
|
(10.3
|
)%
|
2,026
|
|
2.2
|
%
|
(10.3
|
)%
|
||||||||||
|
Income (loss) from operations
|
522
|
|
0.5
|
%
|
(6,604
|
)
|
(7.7
|
)%
|
(1,365.1
|
)%
|
(8,343
|
)
|
(9.4
|
)%
|
26.3
|
%
|
||||||||||
|
Interest expense
|
(551
|
)
|
(0.5
|
)%
|
(567
|
)
|
(0.6
|
)%
|
2.9
|
%
|
(481
|
)
|
(0.5
|
)%
|
(15.2
|
)%
|
||||||||||
|
Gain on sale of OTA contract receivables
|
32
|
|
—
|
%
|
—
|
|
—
|
%
|
(100.0
|
)%
|
—
|
|
—
|
%
|
—
|
%
|
||||||||||
|
Interest income
|
850
|
|
0.9
|
%
|
845
|
|
1.0
|
%
|
(0.6
|
)%
|
567
|
|
0.6
|
%
|
(32.9
|
)%
|
||||||||||
|
Income (loss) before income tax
|
853
|
|
0.9
|
%
|
(6,326
|
)
|
(7.3
|
)%
|
(841.6
|
)%
|
(8,257
|
)
|
(9.3
|
)%
|
30.5
|
%
|
||||||||||
|
Income tax expense (benefit)
|
370
|
|
0.4
|
%
|
4,073
|
|
4.8
|
%
|
1,000.8
|
%
|
(2,058
|
)
|
(2.3
|
)%
|
(150.5
|
)%
|
||||||||||
|
Net income (loss) and comprehensive income (loss)
|
$
|
483
|
|
0.5
|
%
|
$
|
(10,399
|
)
|
(12.1
|
)%
|
(2,253.0
|
)%
|
$
|
(6,199
|
)
|
(7.0
|
)%
|
(40.4
|
)%
|
|||||||
Consolidated Results
Fiscal 2014 Compared to Fiscal 2013
Revenue.
Product revenue decreased from $72.6 million for fiscal 2013 to $72.0 million for fiscal 2014, a decrease of $0.6 million, or 0.9%. Product revenue from energy efficiency lighting systems decreased from $62.5 million for fiscal 2013 to $59.8 million for fiscal 2014, a decrease of $2.7 million, predominantly occurring during our fiscal 2014 back half. We attribute the overall decline in product revenue during the back half of fiscal 2014 to delayed customer purchase decisions as a result of the continuing emergence of LED lighting solutions. Within our industrial customer base, LED product costs have been declining while performance, and the related energy reduction, has been improving. However, while return on investment for our customers
31
using LED technology is improving, these products do not currently meet existing customer payback expectations of two years. We believe customers are delaying decisions as they continue to monitor and evaluate technology alternatives. We believe that these products will become more economically viable during the back half of calendar year 2014. Additionally, delays to project installations resulting from the government shutdown in October 2013 resulted in revenue reductions of approximately $2.0 million as installation crews were not allowed to access the project sites until late February 2014. Partially offsetting the decline in energy efficient lighting product revenue, product revenue from sales of solar PV systems increased from $10.1 million for fiscal 2013 to $12.2 million for fiscal 2014, an increase of $2.1 million. The increase in solar PV product revenue was due to the construction of a $20.0 million single landfill solar project during fiscal 2014. Service revenue increased from $13.5 million for fiscal 2013 to $16.7 million for fiscal 2014, an increase of $3.2 million, or 23.6%. The increase in service revenue was due to an increase in the number of installations resulting from the acquisition of Harris and $1.1 million from the related installation services resulting from our single landfill solar project installed during fiscal 2014. During fiscal 2014, we de-emphasized our solar sales efforts due to a decline in new solar project orders so that we can focus our efforts on the large LED retrofit market.
Cost of Revenue and Gross Margin.
Cost of product revenue increased from $49.6 million for fiscal 2013 to $54.4 million for fiscal 2014, an increase of $4.8 million, or 9.8%. Cost of service revenue increased from $9.8 million for fiscal 2013 to $11.2 million for fiscal 2014, an increase of $1.4 million, or 14.4%. Total gross margin decreased from 31.1% for fiscal 2013 to 25.9% for fiscal 2014. Gross margin from our HIF and LED integrated systems revenue for fiscal 2013 was 31.2% compared to 26.0% for fiscal 2014. For fiscal 2014, our gross margin declined due to reduced sales volumes of manufactured lighting products and the related impact of fixed expenses within our manufacturing facility, an increased mix of lower margin solar projects compared to the prior year and severance expenses of $0.1 million related to the acquisition of Harris. Additionally, during fiscal 2014, we recorded $2.0 million in expenses related to inventory reserves compared to $0.9 million in fiscal 2013. The increase in inventory reserve expense was due to the decline in HIF product revenue that occurred during the fourth quarter of fiscal 2014 and our expectations that LED products will become a larger portion of our future revenue. The reserve was based upon our evaluation of existing fluorescent component inventory levels, our historical usage trends and our expectations on future requirements. Our gross margin on solar PV revenues was 30.5% during fiscal 2013 compared to 25.6% during fiscal 2014. The decrease in solar PV gross margin percentage was due to the lower margin on our single landfill solar project in fiscal 2014 and some unusually high margin solar projects completed during fiscal 2013.
Operating Expenses
General and Administrative.
Our general and administrative expenses increased from $13.9 million for fiscal 2013 to $15.0 million for fiscal 2014, an increase of $1.1 million, or 7.2%. The increase was due to a loss of $1.4 million from the sale of our corporate leased aircraft and including related aviation employee severance expenses, increased insurance expenses of $0.2 million, $0.6 million for the amortization of intangible assets resulting from the acquisition of Harris, $0.9 million for incremental operating expenses from the acquisition of Harris and $0.3 million in asset impairment expenses and contract terminations related to facility consolidations. These increases were partially offset by decreases due to prior year expenses of $1.2 million resulting from our reorganization, $0.6 million in reduced compensation and benefit expenses resulting from headcount reductions, $0.2 million in reduced legal expenses and $0.4 million in other reductions in discretionary spending.
Acquisition and Integration Related Expenses.
Our acquisition related expenses increased from none for fiscal 2013 to $0.8 million for fiscal 2014. The increase was due to $0.5 million of expenses incurred related to the acquisition of Harris which included $0.3 million for variable mark-to-market purchase accounting expenses related to the contingent consideration earn-out and $0.2 million for legal, accounting and integration related costs. We incurred $0.3 million in other acquisition related activities for legal and consulting activities.
Sales and Marketing.
Our sales and marketing expenses decreased from $17.1 million for fiscal 2013 to $13.5 million for fiscal 2014, a decrease of $3.6 million, or 21.0%. The decrease was due to reduced compensation and benefit expense of $1.7 million resulting from headcount reductions, reduced bad debt expense of $0.6 million, reorganization expenses incurred in fiscal 2013 of $0.3 million, $0.2 million in reduced depreciation expense and discretionary spending reductions of $2.2 million, offset by an increase in our sales commission expense of $0.1 million resulting from the revenue increase and incremental expenses of $1.3 million resulting from the acquisition of Harris.
Research and Development.
Our research and development expenses decreased from $2.3 million for fiscal 2013 to $2.0 million for fiscal 2014, a decrease of $0.3 million, or 10.3%. The decrease was due to a reduction in compensation expenses, consulting expenses and product testing costs related to our energy management controls initiatives.
Interest Expense.
Our interest expense decreased from $567,000 for fiscal 2013 to $481,000 for fiscal 2014, a decrease of $86,000, or 15.2%. The decrease in interest expense was due to the reduction in financed contract debt for our OTA projects compared to the prior year first half.
Interest Income.
Our interest income decreased from $845,000 for fiscal 2013 to $567,000 for fiscal 2014, a decrease of $278,000, or 32.9%. Our interest income decreased as we increased the utilization of third party finance providers for virtually
32
all of our financed projects. We expect our interest income to continue to decrease as we continue to utilize third party finance providers for our OTA projects.
Income Taxes.
Our income tax expense decreased from $4.1 million for fiscal 2013 to an income tax benefit of $2.1 million for fiscal 2014, a decrease of $6.2 million, or 151%. During fiscal 2013, we recorded a valuation reserve against our deferred tax assets in the amount of $4.1 million due to uncertainty over the realization value of these assets in the future. During fiscal 2014, we reversed $2.3 million of our valuation reserve to offset deferred tax liabilities created by the acquisition of Harris. Our effective income tax rate for fiscal 2014 was 24.9%, compared to (64.4)% for fiscal 2013. The change in effective rate was due primarily to the changes in the valuation reserve and expected minimum state tax liabilities.
Fiscal 2013 Compared to Fiscal 2012
Revenue.
Product revenue decreased from $90.8 million for fiscal 2012 to $72.6 million for fiscal 2013, a decrease of $18.2 million, or 20.0%. The decrease in product revenue was due to a decrease of $12.9 million from our sales of solar PV systems. During fiscal 2012, we constructed several large solar PV systems and completed fewer projects of similar size during fiscal 2013. Additionally, material prices related to solar panels and materials decreased during fiscal 2013. Product revenue from energy efficiency projects decreased by $5.3 million, predominantly occurring during our fiscal 2013 first half on reduced direct market sales. Service revenue increased from $9.8 million for fiscal 2012 to $13.5 million for fiscal 2013, an increase of $3.7 million, or 37.9%. The increase in service revenue was due to an increase of $3.1 million from the related installation services resulting from solar PV systems installed during fiscal 2013. As mentioned above, as solar panel prices have declined, service revenue has become a higher percentage of the total revenue contracted from a solar PV project. Our service revenue from sales of our HIF energy efficiency systems increased $0.6 million as a result of the decrease in wholesale revenue from efficiency project sales. We believe that our HIF energy efficiency business continues to be challenged by a difficult capital spending environment.
Cost of Revenue and Gross Margin.
Cost of product revenue decreased from $62.8 million for fiscal 2012 to $49.6 million for fiscal 2013, a decrease of $13.2 million, or 21.1%. Cost of service revenue increased from $7.7 million for fiscal 2012 to $9.8 million for fiscal 2013, an increase of $2.1 million, or 27.6%. Total gross margin increased from 29.9% for fiscal 2012 to 31.1% for fiscal 2013. For fiscal 2013, our gross margin percentage increased due to improved project margins from sales of solar PV systems and to cost containment initiatives in our manufacturing operations during the back half of fiscal 2013. Our gross margin on renewable revenues was 18.2% during fiscal 2012 compared to 30.5% during fiscal 2013. The increase in gross margin percentage was due to negotiated contract cost reductions and efficiencies in our project management and contracted expenses. Gross margin from our HIF integrated systems revenue for fiscal 2012 was 34.5% compared to 31.2% for fiscal 2013. The decrease in HIF gross margin percentage was due to the decrease in HIF revenue occurring during the fiscal 2013 first half and the impact of our fixed manufacturing costs.
Operating Expenses
General and Administrative.
Our general and administrative expenses increased from $11.4 million for fiscal 2012 to $13.9 million for fiscal 2013, an increase of $2.5 million, or 22.3%. The increase for fiscal 2013 was due to expenses of $1.9 million resulting from our reorganization initiatives, increased legal expenses related to unusual items of $1.1 million, increased compensation expenses of $0.4 million related to our second half of fiscal 2013 bonus plan and increased audit expenses of $0.2 million related to the re-audit of our fiscal 2011 financial statements. These increases in expenses were partially offset by headcount reductions and discretionary spending reductions that occurred during the second half of fiscal 2013.
Sales and Marketing.
Our sales and marketing expenses increased from $15.6 million for fiscal 2012 to $17.1 million for fiscal 2013, an increase of $1.5 million, or 9.8%. The increase was due to the full year impact incurred during the first half of fiscal 2013 of headcount additions from our prior year investment into the formation and staffing of our telemarketing function, the establishment and staffing of our Houston technology center, headcount additions for sales and project management to support the increase in our solar PV backlog and headcount additions for in-market efficiency sales. We reduced headcount in the back half of fiscal 2013 as part of our cost reduction initiatives. Additional increases were due to commission expense from solar projects of $0.4 million, increased depreciation of $0.3 million due to investments in information systems, increased severance expense of $0.2 million due to headcount reductions and a $0.2 million increase in bad debt versus the prior year.
Research and Development.
Our research and development expenses decreased from $2.5 million for fiscal 2012 to $2.3 million for fiscal 2013, a decrease of $0.2 million, or 10.3%. The decrease was due to decreased consulting expenses and reduced development and product testing costs related to our energy management controls initiatives.
Interest Expense.
Our interest expense increased from $551,000 for fiscal 2012 to $567,000 for fiscal 2013, an increase of $16,000, or 2.9%. The increase in our interest expense was due to the full year impact of additional debt funding completed during fiscal 2012 for the purpose of financing our OTA projects.
Gain on sale of receivables.
Our gain from the sale of receivables from our OTA contracts decreased from $32,000 for fiscal 2012 to $0 for fiscal 2013. Due to the establishment of multiple financing arrangements for OTAs during fiscal 2012 and 2013, in future periods, we do not expect to sell OTA contracts at levels similar to fiscal 2011 or fiscal 2012.
33
Interest Income.
Our interest income was relatively unchanged from fiscal 2012 to fiscal 2013. In the future, we expect our interest income to decrease as we continue to utilize third party finance providers for our OTA projects.
Income Taxes.
Our income tax expense increased from $0.4 million for fiscal 2012 to income tax expense of $4.1 million for fiscal 2013, an increase of $3.7 million, or 1,000.8%. During fiscal 2013, we recorded a valuation reserve against our deferred tax assets in the amount of $4.1 million due to uncertainty over the realization value of these assets in the future. Our effective income tax rate for fiscal 2012 was 43.3%, compared to (64.4)% for fiscal 2013. The change in effective rate was due primarily to the impact of the valuation reserve.
Energy Management Segment
The following table summarizes the energy management segment operating results:
|
For the year ended March 31,
|
|||||||||||
|
(dollars in thousands)
|
2012
|
2013
|
2014
|
||||||||
|
Revenues
|
$
|
72,097
|
|
$
|
67,437
|
|
$
|
66,793
|
|
||
|
Operating income
|
$
|
4,974
|
|
$
|
245
|
|
$
|
(1,743
|
)
|
||
|
Operating margin
|
6.9
|
%
|
0.4
|
%
|
(2.6
|
)%
|
|||||
Fiscal
2014
Compared to Fiscal
2013
Energy management segment revenue decreased from $67.4 million for fiscal 2013 to $66.8 million for fiscal 2014, a decrease of $0.6 million, or 0.9%. The decrease was due to decreased sales of our HIF lighting systems due to delayed customer purchase decisions, which we attribute to the emergence of LED lighting solutions. We believe customers are delaying decisions as they continue to monitor and evaluate technology alternatives.
Energy management segment operating income decreased from $0.2 million for fiscal 2013 to an operating loss of $1.7 million for fiscal 2014, a decrease of $1.9 million, or 811.4%. The decrease in operating income for fiscal 2014 was a result of the decreased revenue from manufactured lighting products and the related impact of fixed manufacturing facility expenses, expense for inventory reserves in the amount of $2.0 million resulting from lower fluorescent product sales and an increase in amortization expense of intangible assets which resulted from the acquisition of Harris.
Fiscal
2013
Compared to Fiscal
2012
Energy management segment revenue decreased from $72.1 million for fiscal 2012 to $67.4 million for fiscal 2013, a decrease of $4.7 million, or 6.5%. The decrease was due to decreased sales of our HIF lighting systems due to capital spending constraints resulting from a challenging economic environment.
Energy management segment operating income decreased from $5.0 million for fiscal 2012 to $0.2 million for fiscal 2013, a decrease of $4.8 million, or 95.1%. The decrease in operating income for fiscal 2013 was a result of the decreased revenue and the increase in selling and marketing expense resulting from the headcount additions for our telemarketing and retail sales initiatives that occurred during the first half of fiscal 2013.
Engineered Systems Segment
The following table summarizes the engineered systems segment operating results:
|
For the year ended March 31,
|
|||||||||||
|
(dollars in thousands)
|
2012
|
2013
|
2014
|
||||||||
|
Revenues
|
$
|
28,465
|
|
$
|
18,649
|
|
$
|
21,830
|
|
||
|
Operating income
|
$
|
569
|
|
$
|
671
|
|
$
|
1,991
|
|
||
|
Operating margin
|
2.0
|
%
|
3.6
|
%
|
9.1
|
%
|
|||||
Fiscal
2014
Compared to Fiscal
2013
Engineered systems segment revenue increased from $18.6 million for fiscal 2013 to $21.8 million for fiscal 2014, an increase of $3.2 million, or 17.1%. The increase was due to the construction of a single large landfill solar project during fiscal 2014. Additionally, we did not sign any new significant contracts during fiscal 2014 as a result of expired federal cash grants, uncertainty over supply and costs of solar panels and reductions in state and utility incentives.
Engineered systems segment operating income increased from $0.7 million for fiscal 2013 to $2.0 million of operating income for fiscal 2014, an increase of $1.3 million, or 196.7%. The increase in operating income for fiscal 2014 was a result of the increase in revenue and the related gross margin contribution and a reduction in operating expenses as we began to de-emphasize
34
our solar business and redeploy personnel to our energy management division to address the LED lighting retrofit market opportunity.
Fiscal
2013
Compared to Fiscal
2012
Engineered systems segment revenue decreased from $28.5 million for fiscal 2012 to $18.6 million for fiscal 2013, a decrease of $9.9 million, or 34.5%. The decrease was due to a decrease in the number of and the relative size of the renewable PV systems under construction during fiscal 2013 versus the prior year. Additionally, we did not sign any new significant contracts during fiscal 2013 as a result of expired federal cash grants, uncertainty over supply and costs of solar panels and reductions in state and utility incentives.
Engineered systems segment operating income increased from $0.6 million for fiscal 2012 to $0.7 million of operating income for fiscal 2013, an increase of $0.1 million, or 17.9%. The increase in operating income for fiscal 2013 was a result of an improvement in managing contract costs related to our project and construction management activities.
Quarterly Results of Operations
The following tables present our unaudited quarterly results of operations for the last eight fiscal quarters in the period ended
March 31, 2014
(i) on an absolute dollar basis (in thousands) and (ii) as a percentage of total revenue for the applicable fiscal quarter. You should read the following tables in conjunction with our consolidated financial statements and related notes contained elsewhere in this Form 10-K. In our opinion, the unaudited financial information presented below has been prepared on the same basis as our audited consolidated financial statements, and includes all adjustments, consisting only of normal recurring adjustments, that we consider necessary for a fair presentation of our operating results for the fiscal quarters presented. Operating results for any fiscal quarter are not necessarily indicative of the results for any future fiscal quarters or for a full fiscal year.
|
|
For the Three Months Ended
|
||||||||||||||||||||||||||||||
|
Jun 30, 2012
|
Sep 30, 2012
|
Dec 31, 2012
|
Mar 31, 2013
|
Jun 30, 2013
|
Sep 30, 2013
|
Dec 31, 2013
|
Mar 31, 2014
|
||||||||||||||||||||||||
|
|
(in thousands, unaudited)
|
||||||||||||||||||||||||||||||
|
Product revenue
|
$
|
13,580
|
|
$
|
16,931
|
|
$
|
22,660
|
|
$
|
19,433
|
|
$
|
17,523
|
|
$
|
21,181
|
|
$
|
22,380
|
|
$
|
10,870
|
|
|||||||
|
Service revenue
|
1,730
|
|
2,477
|
|
6,427
|
|
2,848
|
|
3,329
|
|
6,314
|
|
5,312
|
|
1,714
|
|
|||||||||||||||
|
Total revenue
|
15,310
|
|
19,408
|
|
29,087
|
|
22,281
|
|
20,852
|
|
27,495
|
|
27,692
|
|
12,584
|
|
|||||||||||||||
|
Cost of product revenue
|
9,597
|
|
11,867
|
|
15,708
|
|
12,379
|
|
12,884
|
|
15,638
|
|
15,742
|
|
10,159
|
|
|||||||||||||||
|
Cost of service revenue
|
1,340
|
|
1,736
|
|
4,798
|
|
1,931
|
|
2,245
|
|
4,028
|
|
3,800
|
|
1,147
|
|
|||||||||||||||
|
Total cost of revenue
|
10,937
|
|
13,603
|
|
20,506
|
|
14,310
|
|
15,129
|
|
19,666
|
|
19,542
|
|
11,306
|
|
|||||||||||||||
|
Gross profit
|
4,373
|
|
5,805
|
|
8,581
|
|
7,971
|
|
5,723
|
|
7,829
|
|
8,150
|
|
1,278
|
|
|||||||||||||||
|
General and administrative expenses
|
3,302
|
|
4,638
|
|
2,848
|
|
3,158
|
|
2,759
|
|
3,173
|
|
3,277
|
|
5,817
|
|
|||||||||||||||
|
Acquisition and integration related
|
—
|
|
—
|
|
—
|
|
—
|
|
—
|
|
356
|
|
88
|
|
300
|
|
|||||||||||||||
|
Sales and marketing expenses
|
3,952
|
|
4,561
|
|
4,730
|
|
3,886
|
|
3,303
|
|
3,644
|
|
3,397
|
|
3,183
|
|
|||||||||||||||
|
Research and development expenses
|
697
|
|
710
|
|
427
|
|
425
|
|
490
|
|
448
|
|
478
|
|
610
|
|
|||||||||||||||
|
Income (loss) from operations
|
(3,578
|
)
|
(4,104
|
)
|
576
|
|
502
|
|
(829
|
)
|
208
|
|
910
|
|
(8,632
|
)
|
|||||||||||||||
|
Interest expense
|
(161
|
)
|
(142
|
)
|
(138
|
)
|
(126
|
)
|
(113
|
)
|
(142
|
)
|
(123
|
)
|
(103
|
)
|
|||||||||||||||
|
Interest income
|
225
|
|
218
|
|
213
|
|
189
|
|
174
|
|
153
|
|
132
|
|
108
|
|
|||||||||||||||
|
Income (loss) before income tax
|
(3,514
|
)
|
(4,028
|
)
|
651
|
|
565
|
|
(768
|
)
|
219
|
|
919
|
|
(8,627
|
)
|
|||||||||||||||
|
Income tax expense (benefit)
|
(1,574
|
)
|
5,631
|
|
—
|
|
16
|
|
13
|
|
(2,184
|
)
|
(99
|
)
|
212
|
|
|||||||||||||||
|
Net income (loss) and comprehensive income (loss)
|
$
|
(1,940
|
)
|
$
|
(9,659
|
)
|
$
|
651
|
|
$
|
549
|
|
$
|
(781
|
)
|
$
|
2,403
|
|
$
|
1,018
|
|
$
|
(8,839
|
)
|
|||||||
35
|
|
Jun 30, 2012
|
Sep 30, 2012
|
Dec 31, 2012
|
Mar 31, 2013
|
Jun 30, 2013
|
Sep 30, 2013
|
Dec 31, 2013
|
Mar 31, 2014
|
|||||||||||||||
|
|
(in thousands, unaudited)
|
||||||||||||||||||||||
|
Product revenue
|
88.7
|
%
|
87.2
|
%
|
77.9
|
%
|
87.2
|
%
|
84.0
|
%
|
77.0
|
%
|
80.8
|
%
|
86.4
|
%
|
|||||||
|
Service revenue
|
11.3
|
%
|
12.8
|
%
|
22.1
|
%
|
12.8
|
%
|
16.0
|
%
|
23.0
|
%
|
19.2
|
%
|
13.6
|
%
|
|||||||
|
Total revenue
|
100.0
|
%
|
100.0
|
%
|
100.0
|
%
|
100.0
|
%
|
100.0
|
%
|
100.0
|
%
|
100.0
|
%
|
100.0
|
%
|
|||||||
|
Cost of product revenue
|
62.7
|
%
|
61.1
|
%
|
54.0
|
%
|
55.6
|
%
|
61.8
|
%
|
56.9
|
%
|
56.9
|
%
|
80.7
|
%
|
|||||||
|
Cost of service revenue
|
8.7
|
%
|
9.0
|
%
|
16.5
|
%
|
8.6
|
%
|
10.8
|
%
|
14.6
|
%
|
13.7
|
%
|
9.1
|
%
|
|||||||
|
Total cost of revenue
|
71.4
|
%
|
70.1
|
%
|
70.5
|
%
|
64.2
|
%
|
72.6
|
%
|
71.5
|
%
|
70.6
|
%
|
89.8
|
%
|
|||||||
|
Gross margin
|
28.6
|
%
|
29.9
|
%
|
29.5
|
%
|
35.8
|
%
|
27.4
|
%
|
28.5
|
%
|
29.4
|
%
|
10.2
|
%
|
|||||||
|
General and administrative expenses
|
21.6
|
%
|
23.9
|
%
|
9.8
|
%
|
14.2
|
%
|
13.2
|
%
|
11.5
|
%
|
11.8
|
%
|
46.2
|
%
|
|||||||
|
Acquisition and integration related expenses
|
0.0
|
%
|
0.0
|
%
|
0.0
|
%
|
0.0
|
%
|
0.0
|
%
|
1.3
|
%
|
0.3
|
%
|
2.4
|
%
|
|||||||
|
Sales and marketing expenses
|
25.8
|
%
|
23.5
|
%
|
16.3
|
%
|
17.4
|
%
|
15.9
|
%
|
13.3
|
%
|
12.3
|
%
|
25.3
|
%
|
|||||||
|
Research and development expenses
|
4.6
|
%
|
3.6
|
%
|
1.4
|
%
|
1.9
|
%
|
2.3
|
%
|
1.6
|
%
|
1.7
|
%
|
4.9
|
%
|
|||||||
|
Income (loss) from operations
|
(23.4
|
)%
|
(21.1
|
)%
|
2.0
|
%
|
2.3
|
%
|
(4.0
|
)%
|
0.8
|
%
|
3.3
|
%
|
(68.6
|
)%
|
|||||||
|
Interest expense
|
(1.1
|
)%
|
(0.8
|
)%
|
(0.5
|
)%
|
(0.6
|
)%
|
(0.5
|
)%
|
(0.6
|
)%
|
(0.5
|
)%
|
(0.9
|
)%
|
|||||||
|
Interest income
|
1.5
|
%
|
1.1
|
%
|
0.7
|
%
|
0.8
|
%
|
0.8
|
%
|
0.6
|
%
|
0.5
|
%
|
0.9
|
%
|
|||||||
|
Income (loss) before income tax
|
(23.0
|
)%
|
(20.8
|
)%
|
2.2
|
%
|
2.5
|
%
|
(3.7
|
)%
|
0.8
|
%
|
3.3
|
%
|
(68.6
|
)%
|
|||||||
|
Income tax expense (benefit)
|
(10.3
|
)%
|
29.0
|
%
|
0.0
|
%
|
0.0
|
%
|
0.0
|
%
|
(7.9
|
)%
|
(0.4
|
)%
|
1.6
|
%
|
|||||||
|
Net income (loss) and comprehensive income (loss)
|
(12.7
|
)%
|
(49.8
|
)%
|
2.2
|
%
|
2.5
|
%
|
(3.7
|
)%
|
8.7
|
%
|
3.7
|
%
|
(70.2
|
)%
|
|||||||
Our total revenue can fluctuate from quarter to quarter depending on the purchasing decisions of our customers and our overall level of sales activity. Historically, our energy management customers have tended to increase their purchases near the beginning or end of their capital budget cycles, which tend to correspond to the beginning or end of the calendar year. As a result, we have in the past experienced lower relative total revenue in our fiscal first and second quarters and higher relative total revenue in our fiscal third quarter. Our more recent engineered systems solar revenues have resulted in higher total revenue during our fiscal second and third quarters due to construction seasons and system installation progress occurring during those periods. We expect that there may be future variations in our quarterly total revenue depending on our level of national account roll-out projects, acquisitions, wholesale sales and our de-emphasis of PV solar systems projects. Our results for any particular fiscal quarter may not be indicative of results for other fiscal quarters or an entire fiscal year.
Liquidity and Capital Resources
Overview
We had approximately $17.6 million in cash and cash equivalents and $0.5 million in short-term investments as of
March 31, 2014
compared to $14.4 million in cash and cash equivalents and $1.0 million in short-term investments as of March 31, 2013. Our cash equivalents are invested in money market accounts and bank certificates of deposits with maturities of less than 90 days and an average yield of 0.24%. Our short-term investment account consists of a bank certificate of deposit in the amount of $0.5 million with an expiration date of June 2014 and a yield of 0.5%. Our increase in cash during fiscal 2014 was primarily due to effective working capital management through decreased inventories and increased cash collections. Our decrease in cash during fiscal 2013 was primarily due to our repurchase of common stock in the amount of $6.0 million and our capital spending of $2.2 million. In October 2012, we halted our common share repurchase program and our capital spending has declined significantly. We believe these activities stabilized our previously declining cash balance.
In July 2013, we acquired Harris. The preliminary purchase price for the acquisition was approximately $10.8 million. The purchase price was paid through a combination of $5.0 million in cash, $3.1 million of a seller-financed three-year unsecured subordinated note and 856,997 shares of our unregistered common stock , representing a fair value on the date of issuance of $2.1 million. We also agreed to issue up to $1.0 million of our unregistered common stock if Harris met certain financial targets through December 31, 2014. In October 2013, we completed an amendment to modify the Harris purchase agreement to fix the value of future earn-out consideration at $1.4 million. In January 2014, we issued an aggregate of 83,943 shares of our common stock, representing a fair value on the date of issuance of $0.6 million. Additionally, we will pay $0.8 million in cash on January 1, 2015 as final payment for the acquisition of Harris. We believe our existing cash balances are sufficient to meet our remaining payment obligations and to fund Harris' expected near-term working capital requirements.
In May 2014, we sold our building and equipment located in Plymouth, Wisconsin as we consolidated our Wisconsin operations into our corporate headquarters located in Manitowoc, Wisconsin. The sale resulted in net proceeds, after commissions and expenses, of approximately $1.0 million. The Plymouth building was classified as an asset held for sale beginning in March 2014. The effect of suspending depreciation was immaterial due to the short duration of time that the building was for sale.
36
During fiscal 2012, we entered into an arrangement with a national equipment finance company to provide immediate non-recourse funding of pre-credit approved OTA finance contracts upon project completion and customer acceptance. Additionally, we completed a $5.0 million OTA line-of-credit with immediate availability for the purpose of funding OTA projects upon the project completion and customer acceptance, for which we choose to hold the contracts internally. Our OTA credit agreement expired September 30, 2012 for new borrowings, but not for amounts previously drawn. We have multiple funding sources for our OTA projects. During fiscal 2013, 73.3% of our total completed OTAs were financed by the purchase directly with third party equipment finance companies. During fiscal 2014, 94.3% of our total completed OTAs were financed by the purchase directly with third party equipment finance companies. In the future, we do not intend to fund OTA contracts through debt borrowings. We believe that having external sources to purchase the OTA contracts out-right, has greatly reduced the cash strain created by funding these contracts ourselves and is no longer an impediment to our ability to increase the number of OTA contracts we complete in the future.
In January 2014, we filed a universal shelf registration statement with the Securities and Exchange Commission. Under our shelf registration statement, we have the flexibility to publicly offer and sell from time to time up to $75 million of debt and/or equity securities. The filing of the shelf registration statement will help facilitate our ability to raise public equity or debt capital to expand existing businesses, fund potential acquisitions, invest in other growth opportunities, or repay existing debt.
The return to a recessionary state of the global economy could potentially have negative effects on our near-term liquidity and capital resources, including slower collections of receivables, delays of existing order deliveries and postponements of incoming orders. However, we believe that our existing cash and cash equivalents, our anticipated cash flows from operating activities and our borrowing capacity under our revolving credit facility with J.P. Morgan Chase Bank, N.A. will be sufficient to meet our anticipated cash needs for the next 12 months. As a result of the $17.6 million in cash and cash equivalents as of March 31, 2014, we do not anticipate drawing on our revolving line of credit nor do we expect to use significant amounts of our cash balances for operating activities during fiscal 2015. Our future working capital requirements thereafter will depend on many factors, including our rate of revenue, our rate of OTA growth and our ability to maintain external funding for our OTA contracts, our introduction of new products and services and enhancements to our existing energy management system, the timing and extent of expansions of our sales force and other administrative and production personnel, the timing and extent of advertising, branding and promotional campaigns, legal expenses and our research and development activities.
Cash Flows
The following table summarizes our cash flows for our fiscal 2012, fiscal 2013 and fiscal 2014:
|
|
Fiscal Year Ended March 31,
|
||||||||||
|
|
2012
|
2013
|
2014
|
||||||||
|
|
(in thousands)
|
||||||||||
|
Operating activities
|
$
|
11,495
|
|
$
|
2,261
|
|
$
|
9,901
|
|
||
|
Investing activities
|
(4,532
|
)
|
(2,271
|
)
|
(4,814
|
)
|
|||||
|
Financing activities
|
4,488
|
|
(8,625
|
)
|
(1,895
|
)
|
|||||
|
(Decrease) increase in cash and cash equivalents
|
$
|
11,451
|
|
$
|
(8,635
|
)
|
$
|
3,192
|
|
||
Cash Flows Related to Operating Activities.
Cash used in operating activities primarily consist of net income (loss) adjusted for certain non-cash items including depreciation and amortization, stock-based compensation expenses, income taxes and the effect of changes in working capital and other activities.
Cash provided from operating activities for fiscal 2014 was $9.9 million and consisted of net cash provided by changes in operating assets and liabilities of $8.0 million and net income adjusted for non-cash expense items of $1.9 million. Cash provided by changes in operating assets and liabilities consisted of a decrease of $4.0 million in inventory on decreased purchases of lighting components, predominantly fluorescent ballasts, lamps, wireless controls and motion sensors, a decrease in deferred contract costs of $1.4 million due to the timing of project completions and a decrease in accounts receivable of $8.4 million related to customer collections. Cash used from changes in operating assets and liabilities included a $1.1 million increase in prepaid expenses and other for unbilled revenue related to solar projects, a decrease in accounts payable of $0.8 million on reduced inventory purchases, a $2.3 million decrease in deferred revenue due to the decline in solar project activity and a decrease in accrued expenses due to a decrease in accrued reorganization expenses.
Cash provided from operating activities for fiscal 2013 was $2.3 million and consisted of net cash provided by changes in operating assets and liabilities of $1.1 million and a net loss adjusted for non-cash expense items of $1.2 million. Cash provided by changes in operating assets and liabilities consisted of a decrease of $2.9 million in inventory on decreased purchases of lighting components, predominantly fluorescent lamps and ballasts, a decrease in accounts receivable of $2.5 million on increased collections, an increase in accrued expenses of $2.2 million due to the timing of reorganization expenses, accrued bonus expenses and increased accrued legal expenses, and a decrease in prepaid and other assets of $1.3 million for unbilled revenue related to
37
solar projects where construction progress is billed to the customer at the beginning of the month following the month in which the work was performed. Cash used from changes in operating assets and liabilities included a $6.5 million decrease in accounts payable due to payments during the second half of fiscal 2013 resulting from the settlement of vendor disputes and a decrease in deferred revenue of $1.5 million due to the timing of advanced billings and the achievement of performance criteria for revenue recognition.
Cash provided by operating activities for fiscal 2012 was $11.5 million and consisted of net cash of $5.9 million provided from changes in working capital and net income adjusted non-cash expenses of $5.6 million. Cash provided by working capital improvements was primarily due to the completion of contracts and a reduction in deferred project costs, improved collections of our accounts receivable and an increase in accounts payable related to payment terms on inventory purchases during the fiscal 2012 fourth quarter. These benefits were partially offset by a decrease in deferred revenue related to project completions and an increase in inventory for purchases of fluorescent lamps as described in the section below.
Cash Flows Related to Investing Activities.
Cash used in investing activities was $4.5 million, $2.3 million and $4.8 million for fiscal 2012, 2013 and 2014, respectively. In fiscal 2014, we invested $5.0 million for the acquisition of Harris and $0.4 million for capital improvements related to product development tooling and information technology systems. Cash provided from investing activities included $0.5 million for the sales of short-term investments and $0.1 million in proceeds from the sale of assets. In fiscal 2013, we invested $2.2 million for capital improvements related to our product development, information technology systems, manufacturing improvements and facility investments and $0.2 million for investment in patent activities. In fiscal 2012, we invested $4.3 million for capital improvements related to our information systems, facilities, renewables and manufacturing improvements and $0.2 million for patent investments.
Cash Flows Related to Financing Activities.
Cash used in financing activities was $1.9 million for fiscal 2014. This included $3.2 million for repayment of long-term debt. Cash flows provided by financing activities included $1.1 million received from stock option exercises and $0.2 million from shareholder note repayments.
Cash used in financing activities was $8.6 million for fiscal 2013. This included $6.0 million used for repurchases of shares of our common stock and $3.2 million for repayment of long-term debt. In October 2012, we halted our common stock repurchase program. Cash flows provided by financing activities included $0.4 million in new short-term debt borrowings to fund equipment lease buyouts, $0.1 million received from stock option exercises and shareholder note repayments and $0.1 million for excess tax benefits from stock based compensation.
Cash provided by financing activities was $4.5 million for fiscal 2012. This included $6.0 million in new debt borrowings to fund OTA projects, $0.2 million received from stock option and warrant exercises, $1.0 million for excess tax benefits from stock based compensation and $0.1 million from the collection of shareholder notes. Cash flows used in financing activities included $1.9 million for repayment of long-term debt, $0.7 million used for common share repurchases and $0.1 million for costs related to our new OTA credit agreement.
Working Capital
Our net working capital as of March 31, 2014 was $33.1 million, consisting of $50.3 million in current assets and $17.2 million in current liabilities. Our net working capital as of March 31, 2013 was $33.9 million, consisting of $52.7 million in current assets and $18.8 million in current liabilities. Our current accounts receivables decreased from our prior fiscal year end by $3.3 million as a result of lower revenue during the fiscal 2014 fourth quarter. Our current inventory decreased by $2.5 million on reduced inventory spending and increased inventory reserves, which was net of $1.0 million of incremental Harris inventory. Our prepaid and other expenses increased by $2.2 million due to an increase of $1.0 million related to a reclassification from property, plant and equipment of our Plymouth building which was a held for sale asset and an increase of $1.2 million in unbilled revenue related to the timing of billing on solar projects. Our accounts payable increased from our fiscal 2013 year end by $0.8 million due primarily to the acquisition of Harris and related payables. Our accrued expenses decreased from our fiscal 2013 year end by $0.9 million due to the payment of $1.0 million in accrued settlement expenses and an increase of $0.2 million in accrued legal and other expenses. Our deferred revenue decreased from our fiscal 2013 year end by $2.3 million as we neared completion of the construction of our solar landfill project.
During our fiscal 2014 fourth quarter, we experienced a decline in revenue from sales of our HIF lighting systems. Due to this decline in HIF product revenue and our expectations that LED products will become a larger portion of our future revenue, we recorded expense of $1.4 million to our inventory obsolescence reserve during the fiscal 2014 fourth quarter and a total of $2.0 million in expense for inventory obsolescence reserves during fiscal 2014. This reserve was based upon our evaluation of existing fluorescent component inventory levels, our historical usage trends and our expectations on future requirements.
During fiscal 2013, we decreased our inventories by $2.9 million as we reduced our safety stock levels of electronic components and fluorescent lamps after assessing that previous concerns over shortages of rare earth minerals were no longer negatively impacting the production of fluorescent lamps.
38
During fiscal 2012, we had increased our inventories of fluorescent lamps by $2.2 million due to concerns over shortages of rare earth minerals used in the production of fluorescent lamps.
We are continually monitoring supply side concerns within the electronic components market and believe that our current inventory levels are sufficient to protect us against the risk of being unable to deliver product as specified by our customers’ requirements. We are continually monitoring supply side concerns through conversations with our key vendors and currently believe that supply availability concerns appear to have subsided. In the future, we intend to continue to reduce inventories, specifically our wireless controls product inventories.
We generally attempt to maintain at least a three-month supply of on-hand inventory of purchased components and raw materials to meet anticipated demand, as well as to reduce our risk of unexpected raw material or component shortages or supply interruptions. Our accounts receivables, inventory and payables may increase to the extent our revenue and order levels increase.
Indebtedness
On June 30, 2010, we entered into a credit agreement, which we refer to herein as the Credit Agreement, with JP Morgan Chase Bank, N.A., whom we refer to herein as JP Morgan.
The Credit Agreement provides for a revolving credit facility, which we refer to herein as the Credit Facility, that matures on August 30, 2014. Borrowings under the Credit Facility are limited to (i) $15.0 million or (ii) during periods in which the outstanding principal balance of outstanding loans under the Credit Facility is greater than $5.0 million, the lesser of (A) $15.0 million or (B) the sum of 75% of the outstanding principal balance of certain accounts receivable and 45% of certain inventory.
We also may cause JP Morgan to issue letters of credit for our account in the aggregate principal amount of up to $2.0 million, with the dollar amount of each issued letter of credit counting against the overall limit on borrowings under the Credit Facility. As of March 31, 2014, we had no outstanding letters of credit issued.
The Credit Agreement, as amended, requires us to maintain (i) a ratio of total liabilities to tangible net worth not to exceed 0.50 to 1.00 as of the last day of any fiscal quarter, (ii) average daily unencumbered liquidity of at least $20.0 million during each period of three consecutive business days, (iii) a debt service coverage ratio of greater than 1.25 to 1.00 as of the last day of any fiscal quarter and (iv) a funded debt to EBITDA ratio of less than 2.5 to 1.0 as of the last day of any fiscal quarter. The Credit Agreement also contains certain restrictions on our ability to make capital or lease expenditures over prescribed limits, incur additional indebtedness, consolidate or merge, guarantee obligations of third parties, make loans or advances, declare or pay any dividend or distribution on our stock, and redeem or repurchase shares of our stock or pledge assets. We had no outstanding borrowings
under the Credit Facility as of March 31, 2014. We were not in compliance with our line of credit covenant requirements related to debt service coverage ratio and funded debt to EBITDA ratio as of March 31, 2014 but have received a waiver for the covenant defaults.
The Credit Agreement is secured by a first lien security interest in our accounts receivable, inventory and general intangibles, and a second lien priority in our equipment and fixtures. All OTAs, PPAs, leases, supply agreements and/or similar agreements relating to solar photovoltaic and wind turbine systems or facilities, as well as all of our accounts receivable and assets related to the foregoing, are excluded from these liens.
Borrowings under the Credit Agreement bear interest based on LIBOR plus an applicable margin (the Applicable Margin), which ranges from 2.0% to 3.0% per annum based on our debt service coverage ratio from time to time. We must pay a fee ranging between 0.25% and 0.50% per annum on the average daily unused amount of the Credit Facility (with the amount of such fee based on our debt service coverage ratio from time to time) and a fee in the amount of the Applicable Margin on the daily average face amount of undrawn issued letters of credit. The fee on unused amounts is waived if we or our affiliates maintain funds on deposit with JP Morgan or its affiliates above a specified amount. The deposit threshold requirement was met as of March 31, 2014.
In July 2013, we issued an unsecured and subordinated promissory note in the principal amount of $3.1 million to help fund our acquisition of Harris. The note bears interest at the rate of 4% per annum, is payable in quarterly installments of principal and interest and matures in July 2016. In addition to our Credit Facility, we also have other existing long-term indebtedness and obligations under various debt instruments, including pursuant to a bank first mortgage, a debenture to a community development organization, a federal block grant loan, two city industrial revolving loans, three notes for funding OTA contracts and a credit facility for the sole purpose of funding OTA contracts. As of March 31, 2014, the total amount of principal outstanding on these various obligations, including the Harris sellers note, was $6.6 million. These obligations have varying maturity dates between 2014 and 2024 and bear interest at annual rates of between 2.0% and 7.85%. The weighted average annual interest rate of such obligations as of March 31, 2014 was 5.0%. Based on interest rates in effect as of March 31, 2014, we expect that our total debt service payments on such obligations for fiscal 2015, including scheduled principal, lease and interest payments, but excluding any repayment of borrowings on the Credit Facility, will approximate $4.0 million. Except for the Harris sellers' note, all of these obligations are subject to security interests on our assets. Several of these obligations have covenants, such as customary financial and restrictive covenants, including maintenance of a minimum debt service coverage ratio; a minimum current ratio; quarterly rolling net income requirement; limitations on executive compensation and advances; limits on capital expenditures per year; limits
39
on distributions; and restrictions on our ability to make loans, advances, extensions of credit, investments, capital contributions, incur additional indebtedness, create liens, guaranty obligations, merge or consolidate or undergo a change in control. As of March 31, 2014, we were in compliance with all such covenants.
Capital Spending
Over the past three fiscal years, we have made capital expenditures primarily for general corporate purposes for our corporate headquarters and technology center, production equipment and tooling and for information technology systems. Our capital expenditures totaled $4.3 million, $2.2 million and $0.4 million in fiscal 2012, 2013 and 2014, respectively. We plan to incur approximately $0.8 million to $1.0 million in capital expenditures in fiscal 2015. Our capital spending plans predominantly consist of investments related to our manufacturing operations to improve efficiencies and reduce costs and for investments in information technology systems. We expect to finance these capital expenditures primarily through our existing cash, equipment secured loans and leases, to the extent needed, long-term debt financing, or by using our available capacity under our Credit Facility.
Contractual Obligations
Information regarding our known contractual obligations of the types described below as of March 31, 2014 is set forth in the following table:
|
|
Payments Due By Period
|
||||||||||||||||||
|
Total
|
Less than
1 Year
|
1-3 Years
|
3-5 Years
|
More than
5 Years
|
|||||||||||||||
|
|
(in thousands)
|
||||||||||||||||||
|
Bank debt obligations
|
$
|
6,602
|
|
$
|
3,450
|
|
$
|
2,617
|
|
$
|
130
|
|
$
|
405
|
|
||||
|
Cash interest payments on debt
|
546
|
|
251
|
|
144
|
|
62
|
|
89
|
|
|||||||||
|
Operating lease obligations
|
651
|
|
289
|
|
291
|
|
71
|
|
—
|
|
|||||||||
|
Purchase order and capital expenditure commitments(1)
|
4,431
|
|
4,431
|
|
—
|
|
—
|
|
—
|
|
|||||||||
|
Total
|
$
|
12,230
|
|
$
|
8,421
|
|
$
|
3,052
|
|
$
|
263
|
|
$
|
494
|
|
||||
|
(1)
|
Reflects non-cancellable purchase commitments in the amount of $4.4 million for certain inventory items entered into in order to secure better pricing and ensure materials on hand.
|
The table of contractual obligations and commitments does not include our unrecognized tax benefits which were $0.2 million at March 31, 2014. We have a high degree of uncertainty regarding the timing of any adjustments to these unrecognized benefits.
Off-Balance Sheet Arrangements
We have no off-balance sheet arrangements.
Inflation
Our results from operations have not been, and we do not expect them to be, materially affected by inflation.
Critical Accounting Policies and Estimates
The discussion and analysis of our financial condition and results of operations is based upon our consolidated financial statements, which have been prepared in accordance with accounting principles generally accepted in the United States. The preparation of our consolidated financial statements requires us to make certain estimates and judgments that affect our reported assets, liabilities, revenue and expenses, and our related disclosure of contingent assets and liabilities. We re-evaluate our estimates on an ongoing basis, including those related to revenue recognition, inventory valuation, the collectability of receivables, stock-based compensation, warranty reserves and income taxes. We base our estimates on historical experience and on various assumptions that we believe to be reasonable under the circumstances. Actual results may differ from these estimates. A summary of our critical accounting policies is set forth below.
Revenue Recognition.
We recognize revenue when the following criteria have been met: there is persuasive evidence of an arrangement; delivery has occurred and title has passed to the customer; the sales price is fixed and determinable and no further obligation exists; and collectability is reasonably assured. Virtually all of our revenue is recognized when products are shipped to a customer or when services are completed and acceptance provisions, if any, have been met. In certain of our contracts, we provide multiple deliverables. We record the revenue associated with each element of these arrangements by allocating the total contract revenue to each element based on their relative selling prices. In such circumstances, we use a hierarchy to determine the selling price to be used for allocating revenue to deliverables: (1) vendor-specific objective evidence, or “VSOE” of selling price, if
40
available, (2) third-party evidence, or “TPE” of selling price if VSOE is not available, and (3) best estimate of the selling price if neither VSOE nor TPE is available. We determine the selling price for our HIF lighting and energy management system products, installation and recycling services and for solar renewable product and services using management’s best estimate of selling price as VSOE or TPE evidence does not exist. We consider external and internal factors including, but not limited to, pricing practices, margin objectives, competition, geographies in which we offer our products and services, internal costs, and the scope and size of projects. Our PPA contracts are supply side agreements for the generation of electricity for which we recognize revenue on a monthly basis over the life of the PPA contract, typically in excess of 10 years. For sales of our solar PV systems, we recognize revenue using the percentage-of-completion method by measuring project progress by the percentage of costs incurred to date of the total estimated costs for each contract as materials are installed. Revenue from sales of our solar PV systems is generally recognized over a period of three to 15 months. Additionally, we offer our OTA sales-type financing program under which we finance the customer’s purchase of our energy management systems. Our OTA contracts are sales-type capital leases under GAAP and we record revenue at the net present value of the future payments at the time customer acceptance of the installed and operating system is complete. Our OTA contracts under this sales-type financing are either structured with a fixed term, typically 60 months, and a bargain purchase option at the end of term, or are one year in duration and, at the completion of the initial one-year term, provide for (i) one to four automatic one-year renewals at agreed upon pricing; (ii) an early buyout for cash; or (iii) the return of the equipment at the customer’s expense. The revenue that we are entitled to receive from the sale of our lighting fixtures under our OTA financing program is fixed and is based on the cost of the lighting fixtures and applicable profit margin. Our revenue from agreements entered into under this program is not dependent upon our customers’ actual energy savings. Upon completion of the installation, we may choose to sell the future cash flows and residual rights to the equipment on a non-recourse basis to an unrelated third party finance company in exchange for cash and future payments.
Deferred revenue or deferred costs are recorded for project sales consisting of multiple elements or performance milestones, where the criteria for revenue recognition has not been met. Substantially all of our deferred revenue relates to advance customer billings for solar PV projects or to prepaid services to be provided at determined future dates. As of March 31, 2013 and 2014, our deferred revenue was $4.2 million and $1.9 million, respectively. Deferred costs on product are recorded as a current or long-term asset dependent upon when the project completion is expected to occur. As of March 31, 2013 and 2014, our deferred costs were $2.1 million and $0.7 million, respectively.
Inventories.
Inventories are stated at the lower of cost or market value and include raw materials, work in process and finished goods. Items are removed from inventory using the first-in, first-out method. Work in process inventories are comprised of raw materials that have been converted into components for final assembly. Inventory amounts include the cost to manufacture the item, such as the cost of raw materials and related freight, labor and other applied overhead costs. We review our inventory for obsolescence and marketability. If the estimated market value, which is based upon assumptions about future demand and market conditions, falls below cost, then the inventory value is reduced to its market value. Our inventory obsolescence reserves at March 31, 2013 and 2014 were $2.3 million and $2.5 million, respectively.
Allowance for Doubtful Accounts.
We perform ongoing evaluations of our customers and continuously monitor collections and payments and estimate an allowance for doubtful accounts based upon the aging of the underlying receivables, our historical experience with write-offs and specific customer collection issues that we have identified. While such credit losses have historically been within our expectations, and we believe appropriate reserves have been established, we may not adequately predict future credit losses. If the financial condition of our customers were to deteriorate and result in an impairment of their ability to make payments, additional allowances might be required which would result in additional general and administrative expense in the period such determination is made. Our allowance for doubtful accounts was $0.9 million and $0.4 million at March 31, 2013 and March 31, 2014, respectively.
Recoverability of Long-Lived Assets.
We evaluate long-lived assets such as property, equipment and definite lived intangible assets, such as patents, customer relationships, developed technology, and non-competition agreements, for impairment whenever events or circumstances indicate that the carrying value of the assets recognized in our financial statements may not be recoverable. Factors that we consider include whether there has been a significant decrease in the market value of an asset, a significant change in the way an asset is being utilized, or a significant change, delay or departure in our strategy for that asset, such as the loss of a customer in the case of customer relationships. Our assessment of the recoverability of long-lived assets involves significant judgment and estimation. These assessments reflect our assumption, which, we believe, are consistent with the assumptions hypothetical marketplace participants use. Factors that we must estimate when performing recoverability and impairment tests include, among others, the economic life of the asset. If impairment is indicated, we first determine if the total estimated future cash flows on an undiscounted basis are less than the carrying amounts of the asset or assets. If so, an impairment loss is measured and recognized.
After an impairment loss is recognized, a new, lower cost basis for that long-lived asset is established. Subsequent changes in facts and circumstances do not result in the reversal of a previously recognized impairment loss.
41
Our impairment loss calculations require that we apply judgment in estimating future cash flows and asset fair values, including estimating useful lives of the assets. To make these judgments, we may use internal discounted cash flow estimates, quoted market prices when available and independent appraisals as appropriate to determine fair value.
If actual results are not consistent with our assumptions and judgments used in estimating future cash flows and asset fair values, we may be required to recognize additional impairment losses which could be material to our results of operations.
Goodwill.
We test goodwill for impairment at least annually as of the first day of the fiscal fourth quarter, or when indications of potential impairment exist. We monitor for the existence of potential impairment indicators throughout the fiscal year. We conduct impairment testing for goodwill at the reporting unit level. Reporting units, as defined by ASC 350,
Intangibles - Goodwill and Other
, may be operating segments as a whole or an operation one level below an operating segment, referred to as a component. For fiscal 2014, our goodwill impairment testing was conducted at the Harris component level since we currently manage Harris as a separate unit with our energy management segment. In the future, we expect that Harris will be fully integrated into our engineered systems segment and separate impairment testing at the component level may not be possible; therefore, we expect impairment testing will be conducted at the segment level in the future.
We may initiate goodwill impairment testing by considering qualitative factors to determine whether it is more likely than not that a reporting unit's carrying value is greater than its fair value. Such factors may include the following, among others: a significant adverse change in macroeconomic conditions or legal factors; deterioration in our industry and market environment, including unanticipated or increased competition, a change in the market for our products or services, or a regulatory development; cost factors such as increases in raw materials, labor, or other costs that have a negative effect on earnings and cash flows; overall financial performance such as a significant decline in the reporting unit's expected future cash flows or a decline in actual or planned revenue or earnings compared with actual and projected results of relevant prior periods; a sustained, significant decline in our stock price and market capitalization; and changes in management, key personnel, strategy, or customers. If our qualitative assessment reveals that goodwill impairment is more likely than not, we perform the two-step impairment test. Alternatively, we may bypass the qualitative test and initiate goodwill impairment testing with the first step of the two-step goodwill impairment test.
During the first step of the goodwill impairment test, we compare the fair value of the reporting unit to its carrying value, including goodwill. We derive a reporting unit's fair value through a combination of the market approach (a guideline transaction method) and the income approach (a discounted cash flow analysis). The income approach utilizes a discount rate from the capital asset pricing model. If all reporting units are analyzed during the first step of the goodwill impairment test, their respective fair values are reconciled back to the Company's consolidated market capitalization.
If the fair value of a reporting unit exceeds its carrying value, then we conclude that no goodwill impairment has occurred. If the carrying value of the reporting unit exceeds its fair value, we perform the second step of the goodwill impairment test to measure possible goodwill impairment loss. During the second step, we hypothetically value the reporting unit's tangible and intangible assets and liabilities as if the reporting unit had been acquired in a business combination. Then, the implied fair value of the reporting unit's goodwill is compared to the carrying value of its goodwill. If the carrying value of the reporting unit's goodwill exceeds the implied fair value of the goodwill, we recognize an impairment loss in an amount equal to the excess, not to exceed the carrying value of the reporting unit's goodwill. Once an impairment loss is recognized, the adjusted carrying value of the goodwill becomes the new accounting basis of the goodwill for the reporting unit.
Indefinite Lived Intangible Assets.
On the first day of our fiscal fourth quarter we test indefinite lived intangible assets for impairment at least annually on the first day of our fiscal fourth quarter, or when indications of potential impairment exist. We monitor for the existence of potential impairment indicators throughout the fiscal year. Our impairment test may begin with a qualitative test to determine whether it is more likely than not that an indefinite lived intangible asset's carrying value is greater than its fair value. If our qualitative assessment reveals that asset impairment is more likely than not, we perform a quantitative impairment test by comparing the fair value of the indefinite lived intangible asset to its carrying value. Alternatively, we may bypass the qualitative test and initiate impairment testing with the quantitative impairment test.
Determining the fair value of indefinite-lived intangible assets entails significant estimates and assumptions including, but not limited to, estimating future cash flows from product sales, perpetuation of employment agreements containing non-competition clauses, continuation of customer relationships and renewal of customer contracts, and approximating the useful lives of the intangible assets acquired.
If the fair value of the indefinite lived intangible asset exceeds its carrying value, we conclude that no indefinite lived intangible asset impairment has occurred. If the carrying value of the indefinite lived intangible asset exceeds its fair value, we recognize an impairment loss in an amount equal to the excess, not to exceed the carrying value. Once an impairment loss is recognized, the adjusted carrying value becomes the new accounting basis of the indefinite lived intangible asset.
Investments.
Our accounting and disclosures for short-term investments are in accordance with the requirements of the Fair Value Measurements and Disclosure, Financial Instrument, and Investments: Debt and Security Topics of the FASB Accounting Standards Codification. The Fair Value Measurements and Disclosure Topic defines fair value, establishes a framework for
42
measuring fair value under GAAP and requires certain disclosures about fair value measurements. Fair value is defined as the price that would be received to sell an asset or paid to transfer a liability (an exit price) in the principal or most advantageous market for the asset or liability in an orderly transaction between market participants on the measurement date. Valuation techniques used to measure fair value must maximize the use of observable inputs and minimize the use of unobservable inputs. GAAP describes a fair value hierarchy based on the following three levels of inputs, of which the first two are considered observable and the last unobservable, that may be used to measure fair value:
|
Level 1 —
|
Quoted prices in active markets for identical assets or liabilities.
|
|
|
Level 2 —
|
Inputs other than Level 1 that are observable, either directly or indirectly, such as quoted prices for similar assets or liabilities; quoted prices in markets that are not active; or other inputs that are observable or can be corroborated by observable market data for substantially the full term of the assets or liabilities.
|
|
|
Level 3 —
|
Unobservable inputs that are supported by little or no market activity and that are significant to the fair value of the assets or liabilities.
|
|
As of March 31, 2013 and 2014, our financial assets were measured at fair value employing level 1 inputs.
Stock-Based Compensation.
We have historically issued stock options and restricted stock awards to our employees, executive officers and directors. During fiscal 2014, we changed our long-term equity incentive grant policy so that only restricted shares are currently issued to employees. We adopted the provisions of ASC 718,
Compensation – Stock Compensation
, which requires us to expense the estimated fair value of employee stock options and similar awards based on the fair value of the award on the date of grant. Compensation costs for options granted are recognized in earnings, net of estimated forfeitures, on a straight-line basis over the requisite service period.
The fair value of each option for financial reporting purposes was estimated on the date of grant using the Black-Scholes option-pricing model with the following assumptions used for grants:
|
|
Fiscal Year Ended March 31,
|
||||
|
|
2012
|
2013
|
2014
|
||
|
Weighted average expected term
|
5.7 years
|
5.5 years
|
4.1 years
|
||
|
Risk-free interest rate
|
1.5%
|
0.8%
|
0.8%
|
||
|
Expected volatility
|
70.0%
|
72.5% – 74.4%
|
73.3%
|
||
|
Expected forfeiture rate
|
15.1%
|
21.4%
|
20.3%
|
||
The Black-Scholes option-pricing model requires the use of certain assumptions, including fair value, expected term, risk-free interest rate, expected volatility, expected dividends, and expected forfeiture rate to calculate the fair value of stock-based payment awards.
We estimated the expected term of our stock options based on the vesting term of our options and expected exercise behavior.
Our risk-free interest rate was based on the implied yield available on United States treasury zero-coupon issues as of the option grant date with a remaining term approximately equal to the expected life of the option.
We determined volatility based upon the historical market price of our common share price.
Since the closing of our IPO in December 2007, we have solely used the closing sale price of our common shares as reported by the national securities exchange on which we were listed on the date of grant to establish the exercise price of our stock options.
We recognized stock-based compensation expense under ASC 718 of $1.3 million for fiscal 2012, $1.2 million for fiscal 2013 and $1.6 million for fiscal 2014. As of March 31, 2014, $3.0 million of total total stock-based compensation cost was expected to be recognized by us over a weighted average period of 5.1 years. We expect to recognize $1.1 million of stock-based compensation expense in fiscal 2015 based on our stock options and restricted stock awards outstanding as of March 31, 2014. This expense will increase further to the extent we have granted, or will grant, additional stock options in the future.
Common Stock Warrants.
As of March 31, 2014, warrants were outstanding to purchase a total of 38,980 shares of our common stock at weighted average exercise prices of $2.25 per share. These warrants were valued using a Black-Scholes option pricing model with the following assumptions: (i) contractual terms of five years; (ii) weighted average risk-free interest rates of 4.35% to 4.62%; (iii) expected volatility ranging between 50% and 60%; and (iv) dividend yields of 0%.
43
Accounting for Income Taxes.
As part of the process of preparing our consolidated financial statements, we are required to determine our income taxes in each of the jurisdictions in which we operate. This process involves estimating our actual current tax expenses, together with assessing temporary differences resulting from recognition of items for income tax and accounting purposes. These differences result in deferred tax assets and liabilities, which are included within our consolidated balance sheet. We must then assess the likelihood that our deferred tax assets will be recovered from future taxable income and, to the extent we believe that recovery is not likely, establish a valuation allowance. To the extent we establish a valuation allowance or increase this allowance in a period, we must reflect this increase as an expense within the tax provision in our statements of operations.
Our judgment is required in determining our provision for income taxes, our deferred tax assets and liabilities, and any valuation allowance recorded against our net deferred tax assets. We continue to monitor the realizability of our deferred tax assets and adjust the valuation allowance accordingly. For fiscal 2012, we determined that a valuation allowance against our net state deferred tax assets was necessary in the amount of $428,000 due to our state apportioned income and the potential expiration of state tax credits due to the carryforward periods. For fiscal 2013, we determined that a full valuation allowance against our net federal and our net state deferred tax assets was necessary in the amount of $4.1 million due to our cumulative three year taxable losses. For fiscal 2014, we reversed $2.3 million of our valuation reserve to offset deferred tax liabilities created by the acquisition of Harris. In making these determinations, we considered all available positive and negative evidence, including projected future taxable income, tax planning strategies, recent financial performance and ownership changes.
We believe that past issuances and transfers of our stock caused an ownership change in fiscal 2007 that affected the timing of the use of our net operating loss carryforwards, but we do not believe the ownership change affects the use of the full amount of the net operating loss carryforwards. As a result, our ability to use our net operating loss carryforwards attributable to the period prior to such ownership change to offset taxable income will be subject to limitations in a particular year, which could potentially result in increased future tax liability for us.
As of March 31, 2014, we had net operating loss carryforwards of approximately $19.6 million for federal tax purposes and $15.8 million for state tax purposes. Included in these loss carryforwards were $3.5 million for federal and $4.5 million for state tax expenses that were associated with the exercise of non-qualified stock options. The benefit from our net operating losses created from these compensation expenses has not yet been recognized in our financial statements and will be accounted for in our shareholders’ equity as a credit to additional paid-in-capital as the deduction reduces our income taxes payable. We first recognize tax benefits from current period stock option expenses against current period income. The remaining current period income is offset by net operating losses under the tax law ordering approach. Under this approach, we will utilize the net operating losses from stock option expenses last.
We also had federal tax credit carryforwards of $1.5 and state tax credit carryforwards of $0.8, which are fully reserved for as part of our valuation allowance. Both the net operating losses and tax credit carryforwards will begin to expire in varying amounts between 2020 and 2034. We recognize penalties and interest related to uncertain tax liabilities in income tax expense. Penalties and interest were immaterial as of the date of adoption and are included in unrecognized tax benefits. Due to the existence of net operating loss and credit carryforwards, all years since 2002 are open to examination by tax authorities.
By their nature, tax laws are often subject to interpretation. Further complicating matters is that in those cases where a tax position is open to interpretation, differences of opinion can result in differing conclusions as to the amount of tax benefits to be recognized under Financial Accounting Standards Board (FASB) Accounting Standards Codification (ASC) 740,
Income Taxes
. ASC 740 utilizes a two-step approach for evaluating tax positions. Recognition (Step 1) occurs when an enterprise concludes that a tax position, based solely on its technical merits, is more likely than not to be sustained upon examination. Measurement (Step 2) is only addressed if Step 1 has been satisfied. Under Step 2, the tax benefit is measured as the largest amount of benefit, determined on a cumulative probability basis that is more likely than not to be realized upon ultimate settlement. Consequently, the level of evidence and documentation necessary to support a position prior to being given recognition and measurement within the financial statements is a matter of judgment that depends on all available evidence. As of March 31, 2014, the balance of gross unrecognized tax benefits was approximately $0.2 million, all of which would reduce our effective tax rate if recognized. We believe that our estimates and judgments discussed herein are reasonable, however, actual results could differ, which could result in gains or losses that could be material.
Recent Accounting Pronouncements
See Note B —Summary of Significant Accounting Policies to our accompanying audited consolidated financial statements for a full description of recent accounting pronouncements including the respective expected dates of adoption and expected effects on results of operations and financial condition.
|
Item 7A
|
Quantitative and Qualitative Disclosure About Market Risk
|
Market risk is the risk of loss related to changes in market prices, including interest rates, foreign exchange rates and commodity pricing that may adversely impact our consolidated financial position, results of operations or cash flows.
44
Inflation.
Our results from operations have not historically been, and we do not expect them to be, materially affected by inflation.
Foreign Exchange Risk.
We face minimal exposure to adverse movements in foreign currency exchange rates. Our foreign currency losses for all reporting periods have been nominal.
Interest Rate Risk.
Our investments consist primarily of investments in money market funds and certificate of deposits. While the instruments we hold are subject to changes in the financial standing of the issuer of such securities, we do not believe that we are subject to any material risks arising from changes in interest rates, foreign currency exchange rates, commodity prices, equity prices or other market changes that affect market risk sensitive instruments. It is our policy not to enter into interest rate derivative financial instruments. As a result, we do not currently have any significant interest rate exposure.
As of
March 31, 2014
, $1.5 million of our $6.6 million of outstanding debt was at floating interest rates. An increase of 1.0% in the prime rate would result in an increase in our interest expense of approximately $15,000 per year.
Commodity Price Risk.
We are exposed to certain commodity price risks associated with our purchases of raw materials, most significantly our aluminum purchases. We have currently locked pricing for our specialty reflective aluminum requirements through the end of calendar year 2014 and for our non-specialty aluminum requirements through November 2014. A hypothetical 10% fluctuation in aluminum prices would have an impact of $0.4 million on earnings in fiscal 2014. Additionally, we recycle legacy HID fixtures and recover the salvaged scrap value which we believe provides a raw materials cost hedge as commodity prices change.
Credit Risk
. Credit risk refers to the potential for economic loss arising from the failure of our customers to meet their contractual agreements. Our financing program, the Orion Throughput Agreement, or OTA, is an installment based payment plan for our customers. This financing program subjects us to credit risk as poor credit decisions or customer defaults could result in increases to our allowances for doubtful accounts and/or write-offs of accounts receivable and could have material adverse effects on our results of operations and financial condition. In fiscal 2012, we entered into debt agreements for the purpose of funding certain OTA contracts where we maintain ownership of the contracts. We did not enter into any debt agreements during fiscal 2013 and 2014 for the purpose of financing OTA contracts. We currently utilize third party equipment finance companies for the purpose of funding virtually all of our OTA projects and expect to continue to do so in the future.
45
|
ITEM 8.
|
INDEX TO CONSOLIDATED FINANCIAL STATEMENTS
|
46
REPORT OF INDEPENDENT REGISTERED PUBLIC ACCOUNTING FIRM
Board of Directors and Stockholders
Orion Energy Systems, Inc.
Manitowoc, Wisconsin
We have audited the accompanying consolidated balance sheets of Orion Energy Systems, Inc. as of March 31, 2014 and 2013 and the related consolidated statements of operations and comprehensive income, shareholders’ equity, and cash flows for each of the three years in the period ended March 31, 2014. In connection with our audits of the financial statements, we have also audited financial statement schedule II, Valuation and Qualifying Accounts for each of the three years in the period ended March 31, 2014. These financial statements and schedule are the responsibility of the Company’s management. Our responsibility is to express an opinion on these financial statements and schedule based on our audits.
We conducted our audits in accordance with the standards of the Public Company Accounting Oversight Board (United States). Those standards require that we plan and perform the audit to obtain reasonable assurance about whether the financial statements are free of material misstatement. An audit also includes examining, on a test basis, evidence supporting the amounts and disclosures in the financial statements, assessing the accounting principles used and significant estimates made by management, as well as evaluating the overall presentation of the financial statements and schedules. We believe that our audits provide a reasonable basis for our opinion.
In our opinion, the consolidated financial statements referred to above present fairly, in all material respects, the financial position of Orion Energy Systems, Inc. at March 31, 2014 and 2013, and the results of its operations and its cash flows for each of the three years in the period ended March 31, 2014
,
in conformity with accounting principles generally accepted in the United States of America.
Also, in our opinion, the financial statement schedules, when considered in relation to the basic consolidated financial statements taken as a whole, present fairly, in all material respects, the information set forth therein.
We also have audited, in accordance with the standards of the Public Company Accounting Oversight Board (United States), Orion Energy Systems, Inc.'s internal control over financial reporting as of March 31, 2014, based on criteria established in
Internal Control - Integrated Framework (1992)
issued by the Committee of Sponsoring Organizations of the Treadway Commission (COSO) and our report dated June 13, 2014 expressed an unqualified opinion thereon.
/s/ BDO USA, LLP
Milwaukee, Wisconsin
June 13, 2014
47
REPORT OF INDEPENDENT REGISTERED PUBLIC ACCOUNTING FIRM
Board of Directors and Stockholders
Orion Energy Systems, Inc.
Manitowoc, Wisconsin
We have audited Orion Energy Systems, Inc.’s internal control over financial reporting as of March 31, 2014, based on criteria established in
Internal Control - Integrated Framework
(1992)
issued by the Committee of Sponsoring Organizations of the Treadway Commission (the COSO criteria). Orion Energy Systems, Inc.’s management is responsible for maintaining effective internal control over financial reporting and for its assessment of the effectiveness of internal control over financial reporting, included in the accompanying “Item 9A, Management’s Report on Internal Control Over Financial Reporting”. Our responsibility is to express an opinion on the company’s internal control over financial reporting based on our audit.
We conducted our audit in accordance with the standards of the Public Company Accounting Oversight Board (United States). Those standards require that we plan and perform the audit to obtain reasonable assurance about whether effective internal control over financial reporting was maintained in all material respects. Our audit included obtaining an understanding of internal control over financial reporting, assessing the risk that a material weakness exists, and testing and evaluating the design and operating effectiveness of internal control based on the assessed risk. Our audit also included performing such other procedures as we considered necessary in the circumstances. We believe that our audit provides a reasonable basis for our opinion.
A company’s internal control over financial reporting is a process designed to provide reasonable assurance regarding the reliability of financial reporting and the preparation of financial statements for external purposes in accordance with generally accepted accounting principles. A company’s internal control over financial reporting includes those policies and procedures that (1) pertain to the maintenance of records that, in reasonable detail, accurately and fairly reflect the transactions and dispositions of the assets of the company; (2) provide reasonable assurance that transactions are recorded as necessary to permit preparation of financial statements in accordance with generally accepted accounting principles, and that receipts and expenditures of the company are being made only in accordance with authorizations of management and directors of the company; and (3) provide reasonable assurance regarding prevention or timely detection of unauthorized acquisition, use, or disposition of the company’s assets that could have a material effect on the financial statements.
Because of its inherent limitations, internal control over financial reporting may not prevent or detect misstatements. Also, projections of any evaluation of effectiveness to future periods are subject to the risk that controls may become inadequate because of changes in conditions, or that the degree of compliance with the policies or procedures may deteriorate.
As indicated in the accompanying Item 9A, Management’s Report on Internal Control over Financial Reporting, management’s assessment of and conclusion on the effectiveness of internal control over financial reporting did not include the internal controls of Harris Manufacturing, Inc. and Harris LED, LLC (“the acquired subsidiaries”), which were acquired on July 1, 2013 and which are included in the consolidated balance sheet of Orion Energy Systems, Inc. as of March 31, 2014, and the related consolidated statements of operations, shareholders’ equity and cash flows for the year then ended. The acquired subsidiaries constituted 11% and 1% of total assets and net assets, respectively, as of March 31, 2014, and 11% of revenues for the year then ended. Management did not assess the effectiveness of internal control over financial reporting of the acquired subsidiaries because of the timing of the acquisitions which were completed on July 1, 2013. Our audit of internal control over financial reporting of Orion Energy Systems, Inc. also did not include an evaluation of the internal control over financial reporting of the acquired subsidiaries.
In our opinion, Orion Energy Systems, Inc. maintained, in all material respects, effective internal control over financial reporting as of March 31, 2014, based on the COSO criteria
.
We also have audited, in accordance with the standards of the Public Company Accounting Oversight Board (United States), the consolidated balance sheets of Orion Energy Systems, Inc. as of March 31, 2014 and 2013, and the related consolidated statements of operations and comprehensive income, shareholders’ equity, and cash flows for each of the three years in the period ended March 31, 2014 and our report dated June 13, 2014 expressed an unqualified opinion thereon.
/s/ BDO USA, LLP
Milwaukee, Wisconsin
June 13, 2014
48
ORION ENERGY SYSTEMS, INC. AND SUBSIDIARIES
(in thousands, except share and per share amounts)
|
|
March 31,
|
||||||
|
|
2013
|
2014
|
|||||
|
Assets
|
|||||||
|
Cash and cash equivalents
|
$
|
14,376
|
|
$
|
17,568
|
|
|
|
Short-term investments
|
1,021
|
|
470
|
|
|||
|
Accounts receivable, net of allowances of $900 and $384
|
18,397
|
|
15,098
|
|
|||
|
Inventories, net
|
14,313
|
|
11,790
|
|
|||
|
Deferred contract costs
|
2,118
|
|
742
|
|
|||
|
Prepaid expenses and other current assets
|
2,465
|
|
4,673
|
|
|||
|
Total current assets
|
52,690
|
|
50,341
|
|
|||
|
Property and equipment, net
|
27,947
|
|
23,135
|
|
|||
|
Long-term inventory
|
12,408
|
|
10,607
|
|
|||
|
Goodwill
|
—
|
|
4,409
|
|
|||
|
Other intangible assets, net
|
1,709
|
|
7,551
|
|
|||
|
Long-term accounts receivable
|
5,069
|
|
1,966
|
|
|||
|
Other long-term assets
|
2,274
|
|
931
|
|
|||
|
Total assets
|
$
|
102,097
|
|
$
|
98,940
|
|
|
|
Liabilities and Shareholders’ Equity
|
|||||||
|
Accounts payable
|
$
|
7,773
|
|
$
|
8,530
|
|
|
|
Accrued expenses and other
|
5,457
|
|
4,597
|
|
|||
|
Deferred revenue, current
|
2,946
|
|
614
|
|
|||
|
Current maturities of long-term debt
|
2,597
|
|
3,450
|
|
|||
|
Total current liabilities
|
18,773
|
|
17,191
|
|
|||
|
Long-term debt, less current maturities
|
4,109
|
|
3,151
|
|
|||
|
Deferred revenue, long-term
|
1,258
|
|
1,316
|
|
|||
|
Other long-term liabilities
|
188
|
|
270
|
|
|||
|
Total liabilities
|
24,328
|
|
21,928
|
|
|||
|
Commitments and contingencies (See Note G)
|
—
|
|
—
|
|
|||
|
Shareholders’ equity:
|
|||||||
|
Preferred stock, $0.01 par value: Shares authorized: 30,000,000 shares at March 31, 2013 and 2014; no shares issued and outstanding at March 31, 2013 and 2014
|
—
|
|
—
|
|
|||
|
Common stock, no par value: Shares authorized: 200,000,000 at March 31, 2013 and 2014; shares issued: 30,498,900 and 31,001,683 at March 31, 2013 and 2014; shares outstanding: 20,162,397 and 21,588,326 at March 31, 2013 and 2014
|
—
|
|
—
|
|
|||
|
Additional paid-in capital
|
128,104
|
|
130,766
|
|
|||
|
Treasury stock: 10,336,503 and 9,413,357 common shares at March 31, 2013 and 2014
|
(38,378
|
)
|
(35,813
|
)
|
|||
|
Shareholder notes receivable
|
(265
|
)
|
(50
|
)
|
|||
|
Retained deficit
|
(11,692
|
)
|
(17,891
|
)
|
|||
|
Total shareholders’ equity
|
77,769
|
|
77,012
|
|
|||
|
Total liabilities and shareholders’ equity
|
$
|
102,097
|
|
98,940
|
|
||
49
ORION ENERGY SYSTEMS, INC. AND SUBSIDIARIES
(in thousands, except share and per share amounts)
|
|
Fiscal Year Ended March 31,
|
||||||||||
|
|
2012
|
2013
|
2014
|
||||||||
|
Product revenue
|
$
|
90,782
|
|
$
|
72,604
|
|
$
|
71,954
|
|
||
|
Service revenue
|
9,780
|
|
13,482
|
|
16,669
|
|
|||||
|
Total revenue
|
100,562
|
|
86,086
|
|
88,623
|
|
|||||
|
Cost of product revenue
|
62,842
|
|
49,551
|
|
54,423
|
|
|||||
|
Cost of service revenue
|
7,682
|
|
9,805
|
|
11,220
|
|
|||||
|
Total cost of revenue
|
70,524
|
|
59,356
|
|
65,643
|
|
|||||
|
Gross profit
|
30,038
|
|
26,730
|
|
22,980
|
|
|||||
|
Operating expenses:
|
|||||||||||
|
General and administrative
|
11,399
|
|
13,946
|
|
14,951
|
|
|||||
|
Acquisition and integration related expenses
|
—
|
|
—
|
|
819
|
|
|||||
|
Sales and marketing
|
15,599
|
|
17,129
|
|
13,527
|
|
|||||
|
Research and development
|
2,518
|
|
2,259
|
|
2,026
|
|
|||||
|
Total operating expenses
|
29,516
|
|
33,334
|
|
31,323
|
|
|||||
|
Income (loss) from operations
|
522
|
|
(6,604
|
)
|
(8,343
|
)
|
|||||
|
Other income (expense):
|
|||||||||||
|
Interest expense
|
(551
|
)
|
(567
|
)
|
(481
|
)
|
|||||
|
Gain on sale of OTA contract receivables
|
32
|
|
—
|
|
—
|
|
|||||
|
Interest income
|
850
|
|
845
|
|
567
|
|
|||||
|
Total other income
|
331
|
|
278
|
|
86
|
|
|||||
|
Income (loss) before income tax
|
853
|
|
(6,326
|
)
|
(8,257
|
)
|
|||||
|
Income tax expense (benefit)
|
370
|
|
4,073
|
|
(2,058
|
)
|
|||||
|
Net income (loss) and comprehensive income (loss)
|
$
|
483
|
|
$
|
(10,399
|
)
|
$
|
(6,199
|
)
|
||
|
Basic net income (loss) per share attributable to common shareholders
|
$
|
0.02
|
|
$
|
(0.50
|
)
|
$
|
(0.30
|
)
|
||
|
Weighted-average common shares outstanding
|
22,953,037
|
|
20,996,625
|
|
20,987,964
|
|
|||||
|
Diluted net income (loss) per share
|
$
|
0.02
|
|
$
|
(0.50
|
)
|
$
|
(0.30
|
)
|
||
|
Weighted-average common shares and share equivalents outstanding
|
23,386,525
|
|
20,996,625
|
|
20,987,964
|
|
|||||
50
ORION ENERGY SYSTEMS, INC. AND SUBSIDIARIES
STATEMENT OF SHAREHOLDERS’ EQUITY
(in thousands, except share amounts)
|
|
Shareholders’ Equity
|
|||||||||||||||||||||
|
|
Common Stock
|
|
|
|
|
|||||||||||||||||
|
|
Shares
|
Additional
Paid-in Capital |
Treasury
Stock |
Shareholder
Notes Receivable |
Retained
Earnings (Deficit) |
Total
Shareholders’ Equity |
||||||||||||||||
|
Balance, March 31, 2011
|
22,893,803
|
|
$
|
124,132
|
|
$
|
(31,708
|
)
|
$
|
(193
|
)
|
$
|
(1,776
|
)
|
$
|
90,455
|
|
|||||
|
Issuance of stock and warrants for services
|
29,308
|
|
85
|
|
—
|
|
—
|
|
—
|
|
85
|
|
||||||||||
|
Exercise of stock options and warrants for cash
|
103,413
|
|
147
|
|
—
|
|
—
|
|
—
|
|
147
|
|
||||||||||
|
Shares issued under Employee Stock Purchase Plan
|
37,034
|
|
133
|
|
(22
|
)
|
(84
|
)
|
—
|
|
27
|
|
||||||||||
|
Tax expense from exercise of stock options
|
—
|
|
989
|
|
—
|
|
—
|
|
—
|
|
989
|
|
||||||||||
|
Collection of shareholder notes receivable
|
—
|
|
—
|
|
—
|
|
56
|
|
—
|
|
56
|
|
||||||||||
|
Stock-based compensation
|
—
|
|
1,267
|
|
—
|
|
—
|
|
—
|
|
1,267
|
|
||||||||||
|
Treasury stock purchase
|
(278,300
|
)
|
—
|
|
(740
|
)
|
—
|
|
—
|
|
(740
|
)
|
||||||||||
|
Net income
|
—
|
|
—
|
|
—
|
|
—
|
|
483
|
|
483
|
|
||||||||||
|
Balance, March 31, 2012
|
22,785,258
|
|
$
|
126,753
|
|
$
|
(32,470
|
)
|
$
|
(221
|
)
|
$
|
(1,293
|
)
|
$
|
92,769
|
|
|||||
|
Issuance of stock and warrants for services
|
33,422
|
|
71
|
|
—
|
|
—
|
|
—
|
|
71
|
|
||||||||||
|
Exercise of stock options and warrants for cash
|
20,000
|
|
45
|
|
—
|
|
—
|
|
—
|
|
45
|
|
||||||||||
|
Shares issued under Employee Stock Purchase Plan
|
47,598
|
|
1
|
|
94
|
|
(82
|
)
|
—
|
|
13
|
|
||||||||||
|
Tax benefit from exercise of stock options
|
—
|
|
70
|
|
—
|
|
—
|
|
—
|
|
70
|
|
||||||||||
|
Collection of shareholder notes receivable
|
—
|
|
—
|
|
—
|
|
38
|
|
—
|
|
38
|
|
||||||||||
|
Stock-based compensation
|
—
|
|
1,164
|
|
—
|
|
—
|
|
—
|
|
1,164
|
|
||||||||||
|
Treasury stock purchase
|
(2,723,881
|
)
|
—
|
|
(6,002
|
)
|
—
|
|
—
|
|
(6,002
|
)
|
||||||||||
|
Net loss
|
—
|
|
—
|
|
—
|
|
—
|
|
(10,399
|
)
|
(10,399
|
)
|
||||||||||
|
Balance, March 31, 2013
|
20,162,397
|
|
$
|
128,104
|
|
$
|
(38,378
|
)
|
$
|
(265
|
)
|
$
|
(11,692
|
)
|
$
|
77,769
|
|
|||||
|
Issuance of stock and warrants for services
|
33,641
|
|
129
|
|
—
|
|
—
|
|
—
|
|
129
|
|
||||||||||
|
Stock activity for acquisition
|
940,940
|
|
—
|
|
2,382
|
|
—
|
|
—
|
|
2,382
|
|
||||||||||
|
Exercise of stock options and warrants for cash
|
446,059
|
|
1,152
|
|
—
|
|
—
|
|
—
|
|
1,152
|
|
||||||||||
|
Shares issued under Employee Stock Purchase Plan
|
2,373
|
|
(4
|
)
|
10
|
|
—
|
|
—
|
|
6
|
|
||||||||||
|
Tax benefit from exercise of stock options
|
—
|
|
13
|
|
—
|
|
—
|
|
—
|
|
13
|
|
||||||||||
|
Collection of shareholder notes receivable
|
—
|
|
—
|
|
—
|
|
215
|
|
—
|
|
215
|
|
||||||||||
|
Stock-based compensation
|
23,084
|
|
1,593
|
|
—
|
|
—
|
|
—
|
|
1,593
|
|
||||||||||
|
Treasury stock purchase
|
(20,168
|
)
|
—
|
|
(48
|
)
|
—
|
|
—
|
|
(48
|
)
|
||||||||||
|
Net loss
|
—
|
|
—
|
|
—
|
|
—
|
|
(6,199
|
)
|
(6,199
|
)
|
||||||||||
|
Balance, March 31, 2014
|
21,588,326
|
|
$
|
130,987
|
|
$
|
(36,034
|
)
|
$
|
(50
|
)
|
$
|
(17,891
|
)
|
$
|
77,012
|
|
|||||
51
ORION ENERGY SYSTEMS, INC. AND SUBSIDIARIES
(in thousands)
|
|
Fiscal Year Ended March 31,
|
||||||||||
|
|
2012
|
2013
|
2014
|
||||||||
|
Operating activities
|
|||||||||||
|
Net income (loss)
|
$
|
483
|
|
$
|
(10,399
|
)
|
$
|
(6,199
|
)
|
||
|
Adjustments to reconcile net income (loss) to net cash provided by
|
|||||||||||
|
operating activities:
|
|||||||||||
|
Depreciation
|
3,981
|
|
4,322
|
|
3,798
|
|
|||||
|
Amortization
|
255
|
|
255
|
|
740
|
|
|||||
|
Stock-based compensation expense
|
1,267
|
|
1,164
|
|
1,593
|
|
|||||
|
Accretion of fair value on contingent consideration
|
—
|
|
—
|
|
11
|
|
|||||
|
Deferred income tax (benefit) expense
|
(755
|
)
|
4,158
|
|
(2,123
|
)
|
|||||
|
Loss on sale of property and equipment
|
133
|
|
69
|
|
1,733
|
|
|||||
|
Provision for inventory reserves
|
167
|
|
859
|
|
1,995
|
|
|||||
|
Provision for bad debts
|
566
|
|
757
|
|
174
|
|
|||||
|
Other
|
85
|
|
71
|
|
129
|
|
|||||
|
Changes in operating assets and liabilities, net of changes from acquisitions:
|
|||||||||||
|
Accounts receivable, current and long-term
|
3,364
|
|
2,499
|
|
8,395
|
|
|||||
|
Inventories, current and long-term
|
(1,538
|
)
|
2,880
|
|
3,962
|
|
|||||
|
Deferred contract costs
|
7,396
|
|
75
|
|
1,376
|
|
|||||
|
Prepaid expenses and other current assets
|
(2,025
|
)
|
1,315
|
|
(1,072
|
)
|
|||||
|
Accounts payable
|
1,817
|
|
(6,527
|
)
|
(762
|
)
|
|||||
|
Accrued expenses and other
|
841
|
|
2,221
|
|
(1,575
|
)
|
|||||
|
Deferred revenue, current and long-term
|
(4,542
|
)
|
(1,458
|
)
|
(2,274
|
)
|
|||||
|
Net cash provided by operating activities
|
11,495
|
|
2,261
|
|
9,901
|
|
|||||
|
Investing activities
|
|||||||||||
|
Cash paid for acquisition, net of cash acquired
|
—
|
|
—
|
|
(4,992
|
)
|
|||||
|
Purchase of property and equipment
|
(4,324
|
)
|
(2,159
|
)
|
(410
|
)
|
|||||
|
Purchase of property and equipment leased to customers under PPAs
|
(3
|
)
|
—
|
|
—
|
|
|||||
|
Purchase of short-term investments
|
(5
|
)
|
(5
|
)
|
(4
|
)
|
|||||
|
Sale of short-term investments
|
—
|
|
—
|
|
555
|
|
|||||
|
Additions to patents and licenses
|
(224
|
)
|
(153
|
)
|
(43
|
)
|
|||||
|
Proceeds from sales of property, plant and equipment
|
24
|
|
46
|
|
80
|
|
|||||
|
Net cash used in investing activities
|
(4,532
|
)
|
(2,271
|
)
|
(4,814
|
)
|
|||||
|
Financing activities
|
|||||||||||
|
Payment of long-term debt
|
(1,856
|
)
|
(3,169
|
)
|
(3,229
|
)
|
|||||
|
Proceeds from long-term debt
|
5,989
|
|
380
|
|
—
|
|
|||||
|
Proceeds from repayment of shareholder notes
|
56
|
|
38
|
|
215
|
|
|||||
|
Repurchase of common stock into treasury
|
(740
|
)
|
(6,007
|
)
|
—
|
|
|||||
|
Excess tax benefits from stock-based compensation
|
989
|
|
70
|
|
13
|
|
|||||
|
Deferred financing costs
|
(124
|
)
|
—
|
|
(19
|
)
|
|||||
|
Proceeds from issuance of common stock
|
174
|
|
63
|
|
1,125
|
|
|||||
|
Net cash provided by (used in) financing activities
|
4,488
|
|
(8,625
|
)
|
(1,895
|
)
|
|||||
|
Net increase (decrease) in cash and cash equivalents
|
11,451
|
|
(8,635
|
)
|
3,192
|
|
|||||
|
Cash and cash equivalents at beginning of period
|
11,560
|
|
23,011
|
|
14,376
|
|
|||||
|
Cash and cash equivalents at end of period
|
$
|
23,011
|
|
$
|
14,376
|
|
$
|
17,568
|
|
||
|
Supplemental cash flow information:
|
|||||||||||
|
Cash paid for interest
|
$
|
488
|
|
$
|
535
|
|
$
|
423
|
|
||
52
|
Cash paid for income taxes
|
$
|
104
|
|
$
|
102
|
|
$
|
22
|
|
||
|
Supplemental disclosure of non-cash investing and financing activities:
|
|||||||||||
|
Shares issued from treasury for shareholder note receivable
|
$
|
84
|
|
$
|
82
|
|
$
|
—
|
|
||
|
Shares returned to treasury in satisfaction of receivable
|
$
|
—
|
|
$
|
—
|
|
$
|
48
|
|
||
|
Acquisition related contingent consideration liability
|
$
|
—
|
|
$
|
—
|
|
$
|
612
|
|
||
|
Acquisition financed through debt
|
$
|
—
|
|
$
|
—
|
|
$
|
3,123
|
|
||
|
Common stock issued for acquisition
|
$
|
—
|
|
$
|
—
|
|
$
|
2,416
|
|
||
53
ORION ENERGY SYSTEMS, INC. AND SUBSIDIARIES
NOTES TO CONSOLIDATED FINANCIAL STATEMENTS
NOTE A — DESCRIPTION OF BUSINESS
Organization
The Company includes Orion Energy Systems, Inc., a Wisconsin corporation, and all consolidated subsidiaries. The Company is a developer, manufacturer and seller of lighting and energy management systems and a seller and integrator of renewable energy technologies to commercial and industrial businesses, predominantly in North America.
See Note I “Segment Reporting” of these financial statements for further discussion of the Company's reportable segments.
The Company's corporate offices and primary manufacturing operations are located in Manitowoc, Wisconsin. The operations facility in Plymouth, Wisconsin was classified as an asset held for sale and was sold in May 2014. See Note K "Subsequent Events" of these financial statements for further discussion. The Company leases office space in Green Cove Springs, Florida and Jacksonville, Florida. The Company leases office space for a sales office located in Texas.
NOTE B — SUMMARY OF SIGNIFICANT ACCOUNTING POLICIES
Principles of Consolidation
The consolidated financial statements include the accounts of Orion Energy Systems, Inc. and its wholly-owned subsidiaries. All significant intercompany transactions and balances have been eliminated in consolidation.
Reclassifications
Where appropriate, certain reclassifications were made to prior years' financial statements to conform to the current year presentation.
Use of Estimates
The preparation of financial statements in conformity with Generally Accepted Accounting Principles, or GAAP, requires management to make estimates and assumptions that affect the reported amounts of assets and liabilities and disclosures of contingent assets and liabilities at the date of the financial statements and reported amounts of revenues and expenses during that reporting period. Areas that require the use of significant management estimates include revenue recognition, inventory obsolescence and bad debt reserves, accruals for warranty expenses, income taxes and certain equity transactions. Accordingly, actual results could differ from those estimates.
Cash and Cash Equivalents
The Company considers all highly liquid, short-term investments with original maturities of three months or less to be cash equivalents.
Short-Term Investments
The amortized cost and fair value of short-term investments, with gross unrealized gains and losses, as of
March 31, 2013
and
2014
were as follows (in thousands):
|
March 31, 2013
|
|||||||||||||||||||||||
|
Amortized
Cost |
Unrealized
Gains |
Unrealized
Losses |
Fair Value
|
Cash and Cash
Equivalents |
Short-Term
Investments |
||||||||||||||||||
|
Money market funds
|
$
|
487
|
|
$
|
—
|
|
$
|
—
|
|
$
|
487
|
|
$
|
487
|
|
$
|
—
|
|
|||||
|
Bank certificate of deposit
|
1,021
|
|
—
|
|
—
|
|
1,021
|
|
—
|
|
1,021
|
|
|||||||||||
|
Total
|
$
|
1,508
|
|
$
|
—
|
|
$
|
—
|
|
$
|
1,508
|
|
$
|
487
|
|
$
|
1,021
|
|
|||||
|
March 31, 2014
|
|||||||||||||||||||||||
|
Amortized
Cost |
Unrealized
Gains |
Unrealized
Losses |
Fair Value
|
Cash and Cash
Equivalents |
Short-Term
Investments |
||||||||||||||||||
|
Money market funds
|
$
|
488
|
|
$
|
—
|
|
$
|
—
|
|
$
|
488
|
|
$
|
488
|
|
$
|
—
|
|
|||||
|
Bank certificate of deposit
|
470
|
|
—
|
|
—
|
|
470
|
|
—
|
|
470
|
|
|||||||||||
|
Total
|
$
|
958
|
|
$
|
—
|
|
$
|
—
|
|
$
|
958
|
|
$
|
488
|
|
$
|
470
|
|
|||||
54
As of
March 31, 2013
and
2014
, the Company’s financial assets described in the table above were measured at cost which approximates fair value due to the short-term nature of the investment (level 1 inputs).
Fair Value of Financial Instruments
The Company’s financial instruments consist of cash, short-term investments, accounts receivable, accounts payable, accrued expenses and other and long-term debt. The carrying amounts of the Company’s financial instruments approximate their respective fair values due to the relatively short-term nature of these instruments, or in the case of long-term, because of the interest rates currently available to the Company for similar obligations. Valuation techniques used to measure fair value must maximize the use of observable inputs and minimize the use of unobservable inputs. GAAP describes a fair value hierarchy based on the following three levels of inputs, of which the first two are considered observable and the last unobservable, that may be used to measure fair value:
Level 1 — Valuations are based on unadjusted quoted prices in active markets for identical assets or liabilities.
Level 2 — Valuations are based on quoted prices for similar assets or liabilities in active markets, or quoted prices in markets that are not active for which significant inputs are observable, either directly or indirectly.
Level 3 — Valuations are based on prices or valuation techniques that require inputs that are both unobservable and significant to the overall fair value measurement. Inputs reflect management’s best estimate of what market participants would use in valuing the asset or liability at the measurement date.
Accounts Receivable
Substantially all of the Company’s accounts receivable are due from companies in the commercial, industrial and agricultural industries, as well as wholesalers. Credit is extended based on an evaluation of a customer’s financial condition. Generally, collateral is not required for end users; however, the payment of certain trade accounts receivable from wholesalers is secured by irrevocable standby letters of credit and/or guarantees. Accounts receivable are generally due within
30
-
60
days. Accounts receivable are stated at the amount the Company expects to collect from outstanding balances. The Company provides for probable uncollectible amounts through a charge to earnings and a credit to an allowance for doubtful accounts based on its assessment of the current status of individual accounts. Balances that are still outstanding after the Company has used reasonable collection efforts are written off through a charge to the allowance for doubtful accounts and a credit to accounts receivable.
Financing Receivables
The Company considers its lease balances included in consolidated current and long-term accounts receivable from its Orion Throughput Agreement, or OTA, sales-type leases to be financing receivables. Additional disclosures on the credit quality of the Company’s financing receivables are as follows:
Age Analysis as of
March 31, 2013
(in thousands):
|
Not Past Due
|
1-90 days
past due |
Greater than 90
days past due |
Total past due
|
Total sales-type
leases |
|||||||||||||||
|
Lease balances included in consolidated accounts receivable—current
|
$
|
2,817
|
|
$
|
97
|
|
$
|
151
|
|
$
|
248
|
|
$
|
3,065
|
|
||||
|
Lease balances included in consolidated accounts receivable—long-term
|
4,009
|
|
—
|
|
—
|
|
—
|
|
4,009
|
|
|||||||||
|
Total gross sales-type leases
|
6,826
|
|
97
|
|
151
|
|
248
|
|
7,074
|
|
|||||||||
|
Allowance
|
—
|
|
—
|
|
(74
|
)
|
(74
|
)
|
(74
|
)
|
|||||||||
|
Total net sales-type leases
|
$
|
6,826
|
|
$
|
97
|
|
$
|
77
|
|
$
|
174
|
|
$
|
7,000
|
|
||||
Age Analysis as of
March 31, 2014
(in thousands):
|
Not Past Due
|
1-90 days
past due |
Greater than 90
days past due |
Total past due
|
Total sales-type
leases |
|||||||||||||||
|
Lease balances included in consolidated accounts receivable—current
|
$
|
2,067
|
|
$
|
137
|
|
$
|
149
|
|
$
|
286
|
|
$
|
2,353
|
|
||||
|
Lease balances included in consolidated accounts receivable—long-term
|
1,662
|
|
—
|
|
—
|
|
—
|
|
1,662
|
|
|||||||||
|
Total gross sales-type leases
|
3,729
|
|
137
|
|
149
|
|
286
|
|
4,015
|
|
|||||||||
|
Allowance
|
(3
|
)
|
(3
|
)
|
(88
|
)
|
(91
|
)
|
(94
|
)
|
|||||||||
|
Total net sales-type leases
|
$
|
3,726
|
|
$
|
134
|
|
$
|
61
|
|
$
|
195
|
|
$
|
3,921
|
|
||||
55
Allowance for Credit Losses on Financing Receivables
The Company’s allowance for credit losses is based on management’s assessment of the collectability of customer accounts. A considerable amount of judgment is required in order to make this assessment including a detailed analysis of the aging of the lease receivables and the current credit worthiness of the Company's customers and an analysis of historical bad debts and other adjustments. If there is a deterioration of a major customer’s credit worthiness or actual defaults are higher than historical experience, the estimate of the recoverability of amounts due could be adversely affected. The Company reviews in detail the allowance for doubtful accounts on a quarterly basis and adjusts the allowance estimate to reflect actual portfolio performance and any changes in future portfolio performance expectations. The Company believes that there is no impairment of the receivables for the sales-type leases. The Company’s provision for write-offs and credit losses against the OTA sales-type lease receivable balances in fiscal
2013
and fiscal
2014
, respectively, was as follows:
|
|
Balance at
beginning of period |
Provisions
charged to expense |
Write offs
and other |
Balance at
end of period |
||||||||||||
|
March 31,
|
(in Thousands)
|
|||||||||||||||
|
2013
|
Allowance for Doubtful Accounts on financing receivables
|
$
|
24
|
|
$
|
50
|
|
$
|
—
|
|
$
|
74
|
|
|||
|
2014
|
Allowance for Doubtful Accounts on financing receivables
|
$
|
74
|
|
$
|
96
|
|
$
|
76
|
|
$
|
94
|
|
|||
Inventories
Inventories consist of raw materials and components, such as ballasts, metal sheet and coil stock and molded parts; work in process inventories, such as frames and reflectors; and finished goods, including completed fixtures and systems, and wireless energy management systems and accessories, such as lamps, meters and power supplies. All inventories are stated at the lower of cost or market value with cost determined using the first-in, first-out (FIFO) method. The Company reduces the carrying value of its inventories for differences between the cost and estimated net realizable value, taking into consideration usage in the preceding
9
to
24
months, expected demand, and other information indicating obsolescence. The Company records as a charge to cost of product revenue the amount required to reduce the carrying value of inventory to net realizable value. As of
March 31, 2013
and
2014
, the Company had inventory obsolescence reserves of
$2.3 million
and
$2.5 million
, respectively.
Costs associated with the procurement and warehousing of inventories, such as inbound freight charges and purchasing and receiving costs, are also included in cost of product revenue.
Inventories were comprised of the following (in thousands):
|
March 31, 2013
|
March 31, 2014
|
||||||
|
Raw materials and components
|
$
|
7,290
|
|
$
|
6,894
|
|
|
|
Work in process
|
846
|
|
880
|
|
|||
|
Finished goods
|
6,177
|
|
4,016
|
|
|||
|
$
|
14,313
|
|
$
|
11,790
|
|
||
Deferred Contract Costs
Deferred contract costs consist primarily of the costs of products delivered, and services performed, that are subject to additional performance obligations or customer acceptance. These deferred contract costs are expensed at the time the related revenue is recognized. Deferred costs amounted to
$2.1 million
and
$0.7 million
as of
March 31, 2013
and
March 31, 2014
, respectively.
Prepaid Expenses and Other Current Assets
Prepaid expenses and other current assets consist primarily of prepaid insurance premiums, prepaid license fees, purchase deposits, advance payments to contractors, unbilled revenue, prepaid taxes and miscellaneous receivables. Prepaid expenses and other current assets includes
$1.6 million
and
$2.8 million
of unbilled accounts receivable as of
March 31, 2013
and
March 31, 2014
, respectively. Prepaid expenses and other current assets also includes
$1.0 million
of assets held for sale as of
March 31, 2014
. See Note K "Subsequent Events" for further discussion.
Property and Equipment
Property and equipment are stated at cost. Expenditures for additions and improvements are capitalized, while replacements, maintenance and repairs which do not improve or extend the lives of the respective assets are expensed as incurred. Properties sold, or otherwise disposed of, are removed from the property accounts, with gains or losses on disposal credited or charged to income from operations.
56
The Company periodically reviews the carrying values of property and equipment for impairment in accordance with ASC 360,
Property, Plant and Equipment
, if events or changes in circumstances indicate that the assets may be impaired. The estimated future undiscounted cash flows expected to result from the use of the assets and their eventual disposition are compared to the assets’ carrying amount to determine if a write down to market value is required. No write downs were recorded in fiscal
2012
or
2013
. In fiscal
2014
, an impairment charge of
$0.2 million
was recorded.
Property and equipment were comprised of the following (in thousands):
|
March 31, 2013
|
March 31, 2014
|
||||||
|
Land and land improvements
|
$
|
1,562
|
|
$
|
1,480
|
|
|
|
Buildings
|
15,918
|
|
14,405
|
|
|||
|
Furniture, fixtures and office equipment
|
11,995
|
|
10,713
|
|
|||
|
Leasehold improvements
|
58
|
|
46
|
|
|||
|
Equipment leased to customers under Power Purchase Agreements
|
4,997
|
|
4,997
|
|
|||
|
Plant equipment
|
10,620
|
|
10,103
|
|
|||
|
Construction in progress
|
91
|
|
60
|
|
|||
|
45,241
|
|
41,804
|
|
||||
|
Less: accumulated depreciation and amortization
|
(17,294
|
)
|
(18,669
|
)
|
|||
|
Net property and equipment
|
$
|
27,947
|
|
$
|
23,135
|
|
|
The Company has no equipment under capital leases.
Depreciation is provided over the estimated useful lives of the respective assets, using the straight-line method. The Company recorded depreciation expense of
$4.0 million
,
$4.3 million
and
$3.8 million
for the years ended
March 31, 2012
,
2013
and
2014
, respectively. Depreciable lives by asset category are as follows:
|
Land improvements
|
10-15 years
|
|
Buildings and building improvements
|
3-39 years
|
|
Leasehold improvements
|
Shorter of asset life or life of lease
|
|
Furniture, fixtures and office equipment
|
2-10 years
|
|
Equipment leased to customers under Power Purchase Agreements
|
20 years
|
|
Plant equipment
|
3-10 years
|
No
interest was capitalized for construction in progress during fiscal
2013
or fiscal
2014
.
Goodwill and Other Intangible Assets
The costs of specifically identifiable intangible assets that do not have an indefinite life are amortized over their estimated useful lives. Goodwill and intangible assets with indefinite lives are not amortized. Goodwill and intangible assets with indefinite lives are reviewed for impairment annually, as of January 1, or more frequently if impairment indicators arise. Amortizable intangible assets are amortized over their estimated economic useful life to reflect the pattern of economic benefits consumed based upon the following lives and methods:
|
Patents
|
10-17 years
|
Straight-line
|
|
Licenses
|
7-13 years
|
Straight-line
|
|
Customer relationships
|
5-8 years
|
Accelerated based upon the pattern of economic benefits consumed
|
|
Developed technology
|
8 years
|
Accelerated based upon the pattern of economic benefits consumed
|
|
Non-competition agreements
|
5 years
|
Straight-line
|
Indefinite lived intangible assets are evaluated for potential impairment whenever events or circumstances indicate that the carrying value may not be recoverable based primarily upon whether expected future undiscounted cash flows are sufficient to support the asset recovery. If the actual useful life of the asset is shorter than the estimated life estimated by us, the asset may be deemed to be impaired and accordingly a write-down of the value of the asset determined by a discounted cash flow analysis or shorter amortization period may be required.
57
The change in the carrying value of goodwill during fiscal
2014
was as follows (in thousands):
|
Balance at March 31, 2013
|
$
|
—
|
|
|
Acquisition of Harris
|
4,409
|
|
|
|
Balance at March 31, 2014
|
$
|
4,409
|
|
The components of, and changes in, the carrying amount of other intangible assets were as follows (in thousands):
|
March 31, 2013
|
March 31, 2014
|
||||||||||||||
|
Gross Carrying Amount
|
Accumulated Amortization
|
Gross Carrying Amount
|
Accumulated Amortization
|
||||||||||||
|
Patents
|
$
|
2,358
|
|
$
|
(649
|
)
|
$
|
2,362
|
|
$
|
(784
|
)
|
|||
|
Licenses
|
58
|
|
(58
|
)
|
58
|
|
(58
|
)
|
|||||||
|
Trade name and trademarks
|
—
|
|
—
|
|
1,942
|
|
—
|
|
|||||||
|
Customer relationships
|
—
|
|
—
|
|
3,600
|
|
(535
|
)
|
|||||||
|
Developed technology
|
—
|
|
—
|
|
900
|
|
(19
|
)
|
|||||||
|
Non-competition agreements
|
—
|
|
—
|
|
100
|
|
(15
|
)
|
|||||||
|
Total
|
$
|
2,416
|
|
$
|
(707
|
)
|
$
|
8,962
|
|
$
|
(1,411
|
)
|
|||
As of
March 31, 2014
, the weighted average useful life of intangible assets was
7.3 years
. The estimated amortization expense for each of the next five years is shown below (in thousands):
|
Fiscal 2015
|
$
|
1,350
|
|
|
Fiscal 2016
|
1,220
|
|
|
|
Fiscal 2017
|
877
|
|
|
|
Fiscal 2018
|
602
|
|
|
|
Fiscal 2019
|
426
|
|
|
|
Thereafter
|
1,134
|
|
|
|
$
|
5,609
|
|
|
Amortization expense is set forth in the following table:
|
Fiscal Year Ended March 31,
|
|||||||||||
|
2012
|
2013
|
2014
|
|||||||||
|
Amortization included in cost of sales:
|
|||||||||||
|
Patents
|
$
|
136
|
|
$
|
133
|
|
$
|
135
|
|
||
|
Total
|
$
|
136
|
|
$
|
133
|
|
$
|
135
|
|
||
|
Amortization included in operating expenses:
|
|||||||||||
|
Customer relationships
|
$
|
—
|
|
$
|
—
|
|
$
|
535
|
|
||
|
Developed technology
|
—
|
|
—
|
|
19
|
|
|||||
|
Non-competition agreements
|
—
|
|
—
|
|
15
|
|
|||||
|
Total
|
—
|
|
—
|
|
569
|
|
|||||
|
Total amortization
|
$
|
136
|
|
$
|
133
|
|
$
|
704
|
|
||
The Company’s management periodically reviews the carrying value of intangible assets for impairment. Write-offs recorded in fiscal
2012
,
2013
and
2014
were
$19,000
,
$0
and
$45,000
, respectively.
58
Long-Term Receivables
The Company records a long-term receivable for the non-current portion of its sales-type capital lease OTA contracts. The receivable is recorded at the net present value of the future cash flows from scheduled customer payments. The Company uses the implied cost of capital from each individual contract as the discount rate.
Also included in other long-term receivables are amounts due from a third party finance company to which the Company has sold, without recourse, the future cash flows from OTAs entered into with customers. Such receivables are recorded at the present value of the future cash flows discounted between
8.8%
and
11.0%
. As of
March 31, 2014
, the following amounts were due from the third party finance company in future periods (in thousands):
|
Fiscal 2015
|
$
|
955
|
|
|
Fiscal 2016
|
309
|
|
|
|
Fiscal 2017
|
9
|
|
|
|
Total gross financed receivable
|
1,273
|
|
|
|
Less: amount above to be collected during the next 12 months
|
(955
|
)
|
|
|
Less: amount representing interest
|
(107
|
)
|
|
|
Total net long-term receivable
|
$
|
211
|
|
Long-Term Inventories
The Company records long-term inventory for the non-current portion of its wireless controls inventory. The inventories are stated at the lower of cost or market value with cost determined using the FIFO method.
Other Long-Term Assets
Other long-term assets include long-term security deposits, prepaid licensing costs, deferred costs for a long-term contract, and deferred financing costs. Other long-term assets include
$58,000
and
$33,000
of deferred financing costs as of
March 31, 2013
and
March 31, 2014
, respectively. Deferred financing costs related to debt issuances are amortized to interest expense over the life of the related debt issue (
1
to
10
years). For the years ended
March 31, 2012
,
2013
and
2014
, the amortization was
$52,000
,
$42,000
and
$40,000
, respectively.
Accrued Expenses and Other
Accrued expenses include warranty accruals, accrued wages and benefits, accrued vacation, accrued legal costs, accrued commissions, customer deposits, accrued acquisition liabilities, accrued project costs, sales tax payable and other various unpaid expenses. Accrued expenses include
$1.3 million
and
$0.0 million
of accrued reorganization and settlement costs as of
March 31, 2013
and
March 31, 2014
, respectively; and
$0.7 million
and
$1.0 million
of accrued project costs as of
March 31, 2013
and
March 31, 2014
, respectively.
The Company generally offers a limited warranty of one year on its lighting products in addition to those standard warranties offered by major original equipment component manufacturers. The manufacturers’ warranties cover lamps and ballasts, which are significant components in the Company’s lighting products. Included in other long-term liabilities is
$0.1 million
for warranty reserves related to solar operating systems.
Changes in the Company’s warranty accrual were as follows (in thousands):
|
|
March 31,
|
||||||
|
|
2013
|
2014
|
|||||
|
Beginning of year
|
$
|
84
|
|
$
|
284
|
|
|
|
Provision to product cost of revenue
|
402
|
|
300
|
|
|||
|
Charges
|
(202
|
)
|
(321
|
)
|
|||
|
End of year
|
$
|
284
|
|
$
|
263
|
|
|
Incentive Compensation
The Company’s compensation committee approved an Executive Fiscal Year 2012 Annual Cash Incentive Program under its 2004 Stock and Incentive Awards Plan which became effective as of May 21, 2011. The plan provided for performance based stock option awards ranging in fair value from 13-15% of the fiscal 2012 base salaries of the Company’s named executive officers. The range of fiscal 2012 financial performance-based bonus guidelines under the approved plan began if the Company achieved all of the following: a minimum of
$115.0 million
in revenue, a minimum of
$4.9 million
in net income and a minimum of
$4.9
59
million
in free cash flow. Free cash flow was defined as cash flow from operations less cash flow used for the purchase of property, plant and equipment. Additionally, if the Company’s performance was greater than
120%
of the targets, a cash performance bonus payment was earned that would range from 12-14% of the fiscal 2012 base salaries. Based upon the results for the year ended March 31, 2012, the Company did not accrue any expense related to this plan.
The Company’s compensation committee approved an Executive Fiscal Year 2013 Annual Cash Incentive Program under its 2004 Stock and Incentive Awards Plan which became effective as of June 14, 2012. The plan provided for performance and discretionary cash bonus payments ranging from 25-100% of the fiscal 2013 base salaries of the Company’s named executive officers and other key employees. The plan provided for bonuses to be paid out on the basis of the achievement in fiscal 2013 of (i) target revenue of
$119 million
and/or (ii) target net income of
$3.7 million
. Revenue and net income were selected as the performance measures for the cash bonus program because they were viewed as the most critical elements to increasing the value of the Company's common stock and, therefore, to the Company's enterprise value. The compensation committee established a target bonus as a percentage of base salary for each of the named executive officers. If the Company achieved
90%
of either or both the revenue and net income targets (
$107 million
in revenue or
$3.33 million
in net income), then the named executive officers would have received
50%
of their target bonus for that element. If either or both of the target revenue or net income were exceeded, the named executive officers would be eligible to earn up to two times their target bonus for that element based on a sliding scale of up to
150%
of the target revenue or net income. As described below, this plan was superseded by a new plan in November 2012, and, therefore, the Company did not accrue any expense related to this plan.
Effective November 9, 2012, the Company’s Compensation Committee approved a new incentive cash bonus program for the second half of fiscal 2013 in replacement of the then existing fiscal 2013 incentive bonus program described above. The new incentive cash bonus program provided a cash bonus opportunity to named executive officers and other key employees based on the Company’s relative achievement, in the second half of fiscal 2013, of target operating income (before bonuses and other extraordinary or unusual items) and target cost containment initiatives. Under the new program,
50%
of the target bonus payments were based on the Company’s relative achievement of its cost containment target of
$1.48 million
for the second half of fiscal 2013. For every $1.00 of cost containment achieved, a bonus pool of
$0.167
would be earned, up to a maximum total bonus pool of
$247,000
for all employees. The other
50%
of the target bonus payments would be based on the Company achieving operating income (before bonuses and other extraordinary or unusual items) of
$500,000
for the second half of fiscal 2013. For every $1.00 of operating profit achieved, a bonus pool of
$0.50
would be earned, up to a maximum total bonus pool of
$247,000
for all employees. Based upon the results for the year ended March 31, 2013, the Company accrued the maximum expense related to this plan.
The Company’s compensation committee approved an Executive Fiscal Year 2014 Annual Cash Incentive Program under its 2004 Stock and Incentive Awards Plan which became effective as of May 13, 2013. The plan provided for performance cash bonus payments ranging from 35-100% of the fiscal 2014 base salaries of the Company’s named executive officers and other key employees. The plan provided for bonuses to be paid out on the basis of the achievement in fiscal 2014 of at least (i)
$2.0 million
of profit before taxes and (ii) revenue of at least
$88.0 million
. Based upon the results for the year ended March 31, 2014, the Company did not accrue any expense related to this plan.
Revenue Recognition
Revenue is recognized on the sales of our lighting and related energy efficiency systems and products when the following four criteria are met:
|
1.
|
persuasive evidence of an arrangement exists;
|
|
2.
|
delivery has occurred and title has passed to the customer;
|
|
3.
|
the sales price is fixed and determinable and no further obligation exists; and
|
|
4.
|
collectability is reasonably assured.
|
These four criteria are met for the Company’s product-only revenue upon delivery of the product and title passing to the customer. At that time, the Company provides for estimated costs that may be incurred for product warranties and sales returns. Revenues are presented net of sales tax and other sales related taxes.
For sales of the Company’s lighting and energy management technologies, consisting of multiple elements of revenue, such as a combination of product sales and services, the Company determines revenue by allocating the total contract revenue to each element based on their relative selling prices in accordance with ASC 605-25,
Revenue Recognition - Multiple Element Arrangements
. In such circumstances, the Company uses a hierarchy to determine the selling price to be used for allocating revenue to deliverables: (1) vendor-specific objective evidence (VSOE) of fair value, if available, (2) third-party evidence (TPE) of selling price if VSOE is not available, and (3) best estimate of the selling price if neither VSOE nor TPE is available (a description as to how the Company determined estimated selling price is provided below).
60
The nature of the Company’s multiple element arrangements for the sale of its lighting and energy management technologies is similar to a construction project, with materials being delivered and contracting and project management activities occurring according to an installation schedule. The significant deliverables include the shipment of products and related transfer of title and the installation.
To determine the selling price in multiple-element arrangements, the Company establishes the selling price for its HIF lighting and energy management system products using management's best estimate of the selling price, as VSOE or TPE does not exist. Product revenue is recognized when products are shipped. For product revenue, management's best estimate of selling price is determined using a cost plus gross profit margin method. In addition, the Company records in service revenue the selling price for its installation and recycling services using management’s best estimate of selling price, as VSOE or TPE does not exist. Service revenue is recognized when services are completed and customer acceptance has been received. Recycling services provided in connection with installation entail the disposal of the customer’s legacy lighting fixtures. The Company’s service revenues, other than for installation and recycling that are completed prior to delivery of the product, are included in product revenue using management’s best estimate of selling price, as VSOE or TPE does not exist. These services include comprehensive site assessment, site field verification, utility incentive and government subsidy management, engineering design, and project management. For these services, along with the Company's installation and recycling services, under a multiple-element arrangement, management’s best estimate of selling price is determined by considering several external and internal factors including, but not limited to, economic conditions and trends, customer demand, pricing practices, margin objectives, competition, geographies in which the Company offers its products and services and internal costs. The determination of estimated selling price is made through consultation with and approval by management, taking into account all of the preceding factors.
For sales of solar photovoltaic systems, which are governed by customer contracts that require the Company to deliver functioning solar power systems and are generally completed within
three
to
15
months from the start of construction, the Company recognizes revenue from fixed price construction contracts using the percentage-of-completion method in accordance with ASC 605-35,
Construction-Type and Production-Type Contracts
. Under this method, revenue arising from fixed price construction contracts is recognized as work is performed based upon the percentage of incurred costs to estimated total forecasted costs. The Company has determined that the appropriate method of measuring progress on these sales is measured by the percentage of costs incurred to date of the total estimated costs for each contract as materials are installed. The percentage-of-completion method requires revenue recognition from the delivery of products to be deferred and the cost of such products to be capitalized as a deferred cost and current asset on the balance sheet. The Company performs periodic evaluations of the progress of the installation of the solar photovoltaic systems using actual costs incurred over total estimated costs to complete a project. Provisions for estimated losses on uncompleted contracts, if any, are recognized in the period in which the loss first becomes probable and reasonably estimable.
The Company offers a financing program, called an Orion Throughput Agreement, or OTA, for a customer’s lease of the Company’s energy management systems. The OTA is structured as a sales-type lease and upon successful installation of the system and customer acknowledgment that the system is operating as specified, revenue is recognized at the Company’s net investment in the lease, which typically is the net present value of the future cash flows.
The Company offers a financing program, called a power purchase agreement, or PPA, for the Company’s renewable energy product offerings. A PPA is a supply side agreement for the generation of electricity and subsequent sale to the end user. Upon the customer’s acknowledgment that the system is operating as specified, product revenue is recognized on a monthly basis over the life of the PPA contract, which is typically in excess of
10
years.
Deferred revenue relates to advance customer billings, investment tax grants received related to PPAs and a separate obligation to provide maintenance on OTAs and is classified as a liability on the Consolidated Balance Sheet. The fair value of the maintenance is readily determinable based upon pricing from third-party vendors. Deferred revenue related to maintenance services is recognized when the services are delivered, which occurs in excess of a year after the original OTA contract is executed.
Shipping and Handling Costs
The Company records costs incurred in connection with shipping and handling of products as cost of product revenue. Amounts billed to customers in connection with these costs are included in product revenue.
Advertising
Advertising costs of
$117,000
,
$111,000
and
$28,000
for fiscal
2012
,
2013
and
2014
, respectively, were charged to operations as incurred.
Research and Development
The Company expenses research and development costs as incurred.
61
Income Taxes
The Company recognizes deferred tax assets and liabilities for the future tax consequences of temporary differences between financial reporting and income tax basis of assets and liabilities, measured using the enacted tax rates and laws expected to be in effect when the temporary differences reverse. Deferred income taxes also arise from the future tax benefits of operating loss and tax credit carryforwards. A valuation allowance is established when management determines that it is more likely than not that all or a portion of a deferred tax asset will not be realized. For the fiscal year ended
March 31, 2014
, the Company recorded a valuation allowance of
$0.8 million
against its deferred tax assets.
ASC 740,
Income Taxes
, also prescribes a recognition threshold and measurement attribute for the financial statement recognition and measurement of tax positions taken or expected to be taken in a tax return. For those benefits to be recognized, a tax position must be more-likely-than-not to be sustained upon examination. The Company has classified the amounts recorded for uncertain tax benefits in the balance sheet as other liabilities (non-current) to the extent that payment is not anticipated within one year. The Company recognizes penalties and interest related to uncertain tax liabilities in income tax expense. Penalties and interest are immaterial and are included in the unrecognized tax benefits.
Deferred tax benefits have not been recognized for income tax effects resulting from the exercise of non-qualified stock options. These benefits will be recognized in the period in which the benefits are realized as a reduction in taxes payable and an increase in additional paid-in capital. Realized tax benefits (expense) from the exercise of stock options were
$989,000
,
$70,000
and
$13,000
for the fiscal years
2012
,
2013
and
2014
, respectively.
Stock Option Plans
The Company’s share-based payments to employees are measured at fair value and are recognized in earnings, net of estimated forfeitures, on a straight-line basis over the requisite service period.
Cash flows from the exercise of stock options resulting from tax benefits in excess of recognized cumulative compensation costs (excess tax benefits) are classified as financing cash flows. For the years ended March 31,
2012
,
2013
and
2014
,
$989,000
,
$70,000
and
$13,000
, respectively, of such excess tax benefits were classified as financing cash flows.
The Company uses the Black-Scholes option-pricing model. The Company calculates volatility based upon the historical market price of its common stock. The risk-free interest rate is the rate available as of the option date on zero-coupon U.S. Government issues with a remaining term equal to the expected term of the option. The expected term is based upon the vesting term of the Company’s options and expected exercise behavior. The Company has not paid dividends in the past and does not plan to pay any dividends in the foreseeable future. The Company estimates its forfeiture rate of unvested stock awards based on historical experience.
The fair value of each option grant in fiscal
2012
,
2013
and
2014
was determined using the assumptions in the following table:
|
|
Fiscal Year Ended March 31,
|
|||||||
|
|
2012
|
2013
|
2014
|
|||||
|
Weighted average expected term
|
5.7 years
|
|
5.5 years
|
|
4.1 years
|
|
||
|
Risk-free interest rate
|
1.5
|
%
|
0.8
|
%
|
0.8
|
%
|
||
|
Expected volatility
|
70.0
|
%
|
72.5 - 74.4%
|
|
73.3
|
%
|
||
|
Expected forfeiture rate
|
15.1
|
%
|
21.4
|
%
|
20.3
|
%
|
||
Net Income (Loss) per Common Share
Basic net income (loss) per common share is computed by dividing net income (loss) attributable to common shareholders by the weighted-average number of common shares outstanding for the period and does not consider common stock equivalents.
62
Diluted net income (loss) per common share reflects the dilution that would occur if warrants and stock options were exercised and restricted shares vested. In the computation of diluted net income (loss) per common share, the Company uses the “treasury stock” method for outstanding options, warrants and restricted shares. Diluted net loss per common share is the same as basic net loss per common share for the years ended March 31, 2013 and
March 31, 2014
, because the effects of potentially dilutive securities are anti-dilutive. The effect of net income (loss) per common share is calculated based upon the following shares (in thousands except share amounts):
|
|
Fiscal Year Ended March 31,
|
||||||||||
|
|
2012
|
2013
|
2014
|
||||||||
|
Numerator:
|
|||||||||||
|
Net income (loss) (in thousands)
|
$
|
483
|
|
$
|
(10,399
|
)
|
$
|
(6,199
|
)
|
||
|
Denominator:
|
|||||||||||
|
Weighted-average common shares outstanding
|
22,953,037
|
|
20,996,625
|
|
20,987,964
|
|
|||||
|
Weighted-average effect of assumed conversion of stock options and warrants
|
433,488
|
|
—
|
|
—
|
|
|||||
|
Weighted-average common shares and share equivalents outstanding
|
23,386,525
|
|
20,996,625
|
|
20,987,964
|
|
|||||
|
Net income (loss) per common share:
|
|||||||||||
|
Basic
|
$
|
0.02
|
|
$
|
(0.50
|
)
|
$
|
(0.30
|
)
|
||
|
Diluted
|
$
|
0.02
|
|
$
|
(0.50
|
)
|
$
|
(0.30
|
)
|
||
The following table indicates the number of potentially dilutive securities as of the end of each period:
|
|
March 31,
|
|||||||
|
|
2012
|
2013
|
2014
|
|||||
|
Common stock options
|
3,697,633
|
|
3,312,523
|
|
2,716,317
|
|
||
|
Restricted shares
|
—
|
|
105,000
|
|
539,204
|
|
||
|
Common stock warrants
|
38,980
|
|
38,980
|
|
38,980
|
|
||
|
Total
|
3,736,613
|
|
3,456,503
|
|
3,294,501
|
|
||
Concentration of Credit Risk and Other Risks and Uncertainties
The Company’s cash is deposited with five financial institutions. At times, deposits in these institutions exceed the amount of insurance provided on such deposits. The Company has not experienced any losses in such accounts and believes that it is not exposed to any significant risk on these balances.
The Company previously depended on one supplier for a number of components necessary for its products, including ballasts and lamps. Purchases from this supplier accounted for
14%
of total cost of revenue in fiscal
2012
. Currently, the Company has been able to obtain these components from multiple suppliers. For fiscal
2013
and
2014
, no supplier accounted for more than 10% of total cost of revenue.
In fiscal
2012
and
2013
, there were no customers who individually accounted for greater than 10% of revenue. In fiscal
2014
,
one
customer
accounted for
23%
of revenue.
As of
March 31, 2013
and
March 31, 2014
, no customers accounted for more than 10% of accounts receivable.
Recent Accounting Pronouncements
In July 2013, the Financial Accounting Standards Board ("FASB") issued Accounting Standards Update No. 2013-11 ("ASU 2013-11"), “Presentation of an Unrecognized Tax Benefit When a Net Operating Loss Carryforward, a Similar Tax
Loss, or a Tax Credit Carryforward Exists
." ASU 2013-11 requires an entity to present an unrecognized tax benefit, or a portion of an unrecognized tax benefit, in the financial statements as a reduction to the deferred tax asset for a net operating loss carryforward, a similar tax loss, or a tax credit carryforward. The provisions of ASU 2013-11 are effective for fiscal years, and interim periods within those years, beginning after December 15, 2013. The Company is currently evaluating the impact of ASU 2013-11.
In May 2014, FASB issued ASU 2014-09, "Revenue from Contracts with Customers." This ASU is a comprehensive new revenue recognition model that requires a company to recognize revenue to depict the transfer of good or services to a customer at an amount that reflects the consideration it expects to receive in exchange for those goods or services. This ASU is effective for annual reporting periods beginning after December 15, 2016 and early adoption is not permitted. Accordingly, the Company will adopt this ASU on April 1, 2017. Companies may use either a full retrospective or modified retrospective approach to adopt
63
this ASU and management is currently evaluating which transition approach to use. The Company is currently evaluating the impact of ASU 2014-09.
NOTE C — ACQUISITION
On July 1, 2013, the Company acquired all of the equity interests of Harris Manufacturing, Inc. and Harris LED, LLC(collectively, "Harris"). Harris was a Florida-based lighting company which engineered, designed, sourced and manufactured energy efficient lighting systems, including fluorescent and LED lighting solutions, and day-lighting products.
The acquisition of Harris expanded the Company's product lines, including a patent pending LED lighting product designed for commercial office buildings, increased its sales force and provided growth opportunities into markets where the Company had previously not had a strong presence, specifically, new construction, retail store fronts, commercial office and government.
The acquisition was consummated pursuant to a Stock and Unit Purchase Agreement, dated as of May 22, 2013 ("Purchase Agreement"), by and among Harris, the shareholders and members of Harris ("Harris Shareholders"), and the Company. The acquisition consideration paid to the Harris Shareholders was valued under the Purchase Agreement at an aggregate of
$10.0 million
, plus an adjustment of approximately
$0.2 million
to reflect the Company's acquisition of net working capital in excess of a targeted amount, plus an additional
$0.6 million
for the contingent consideration earn-out value assigned to non-employee Harris shareholders. The aggregate acquisition consideration was paid through a combination of
$5.0 million
in cash,
$3.1 million
in a three-year unsecured subordinated promissory note and the issuance of
856,997
shares of unregistered Company common stock. For purposes of the acquisition and the acquisition consideration, the shares of common stock issued in the acquisition of Harris were valued at
$2.33
per share, which was the average closing share price as reported on the NYSE MKT for the
45
trading days preceding and the
22
trading days following the execution of the Purchase Agreement. For purposes of applying the purchase accounting provisions of ASC 805,
Business Combinations
, the shares of common stock issued in the acquisition were valued at
$2.41
per share, which was the closing sale price of the Company's common stock as reported on the NYSE MKT on the July 1, 2013, date of acquisition.
On October 21, 2013, the Company executed a letter agreement amending the Purchase Agreement. The letter agreement established a fixed future consideration of
$1.4 million
for the previously existing earn-out component of the Purchase Agreement and eliminated the requirement that certain revenue targets must be achieved. Under the letter agreement, on January 2, 2014, the Company issued
$0.6 million
, or
83,943
shares, of the Company's unregistered common stock. The fixed consideration was determined based upon the existing share calculation at a fair value of
$3.80
per common share. On January 2, 2015, the Company will pay
$0.8 million
in cash to settle all outstanding obligations related to the earn-out component of the Purchase Agreement.
Total revenues and pre-tax loss from Harris since the date of acquisition included in the accompanying consolidated statements of income for the year ended March 31, 2014 were
$9.4 million
and
$(0.5) million
, respectively. Included in the
$0.5 million
loss is
$0.6 million
of expense for intangible amortization and
$0.3 million
of expense for compensation related to deferred consideration. The Company incurred
$0.5 million
in acquisition and integration related costs for Harris during the year ended March 31, 2014, which included contingent consideration, legal, accounting and other integration related expenses.
The Purchase Agreement contained customary representations and warranties, as well as indemnification obligations, and limitations thereon, by the Company and the Harris Shareholders.
64
The following table summarizes the consideration paid to the Harris Shareholders and the preliminary fair value allocation of the purchase price (in thousands):
|
Consideration paid to Harris Shareholders:
|
|||
|
Cash
|
$
|
5,000
|
|
|
Seller provided debt
|
3,124
|
|
|
|
Shares of Company common stock
|
2,065
|
|
|
|
Contingent consideration arrangement
|
612
|
|
|
|
Total consideration paid
|
$
|
10,801
|
|
|
Cash and cash equivalents
|
$
|
8
|
|
|
Accounts receivable, net
|
2,215
|
|
|
|
Inventories
|
1,633
|
|
|
|
Other current assets
|
86
|
|
|
|
Property, plant and equipment
|
117
|
|
|
|
Deferred tax asset
|
141
|
|
|
|
Identifiable intangible assets:
|
|||
|
Customer relationships
|
3,600
|
|
|
|
Non-competition agreement
|
100
|
|
|
|
Developed technology
|
900
|
|
|
|
Trade name and trademarks
|
1,900
|
|
|
|
Accounts payable
|
(1,519
|
)
|
|
|
Deferred tax liabilities
|
(2,263
|
)
|
|
|
Accrued and other liabilities
|
(526
|
)
|
|
|
Total identifiable net assets
|
6,392
|
|
|
|
Goodwill
|
4,409
|
|
|
|
$
|
10,801
|
|
|
Prior to the amendment discussed above, the contingent consideration arrangement required the Company to pay the Harris Shareholders up to
$1.0 million
in unregistered shares of the Company's common stock upon Harris' achievement of certain revenue milestones in calendar year 2013 and/or 2014, and, in the case of certain Harris Shareholders who became employees of the Company, their continued employment by the Company. The potential undiscounted amount of all future payments that the Company could have been required to make under the contingent consideration arrangement was between
$0
and
$1.0 million
. The Company recorded
$0.6 million
for the non-employee Harris Shareholder portion of the contingent consideration liability on the acquisition date. Total contingent consideration of
$0.5 million
for employee Harris Shareholders will be recorded as compensation expense through the end of calendar 2014. During the year ended March 31, 2014, the Company expensed
$0.3 million
in compensation expense.
As part of the preliminary purchase price allocation, the Company determined that the separately identifiable intangible assets acquired consisted of customer relationships, developed technology, trademarks and trade names, and non-competition agreements. The fair value of the acquired identifiable intangible assets and the goodwill in the table above are provisional pending completion of the final valuations for those assets. All of the intangible asset value was assigned to the Company's Energy Management segment.
The separately identifiable intangible assets acquired that do not have an indefinite life are amortized over their estimated economic useful life to reflect the pattern of economic benefits consumed based upon the following lives and methods:
|
Customer relationships
|
5-8 years
|
Accelerated based upon the pattern of economic benefits consumed
|
|
Developed technology
|
8 years
|
Accelerated based upon the pattern of economic benefits consumed
|
|
Non-competition agreements
|
5 years
|
Straight-line
|
|
Trade name and trademarks
|
N/A
|
Indefinite life
|
The Company used the income approach to value the customer relationships, developed technology and non-competition agreements. This approach calculates the fair value by discounting the forecasted after-tax cash flows for each intangible asset back to a present value at an appropriate risk-adjusted rate of return. The data for these analyses was the cash flow estimates used
65
to price the transaction. Fair value estimates are based on a complex series of judgments about future events and uncertainties and rely heavily on estimates and assumptions.
In estimating the useful lives of the acquired assets, the Company considered ASC 350-30-35,
General Intangibles
Other Than Goodwill
, and reviewed the following factors: the expected use by the combined company of the assets acquired, the expected useful life of another asset (or group of assets) related to the acquired assets, legal, regulatory or other contractual provisions that may limit the useful life of an acquired asset, the effects of obsolescence, demand, competition and other economic factors, and the level of maintenance expenditures required to obtain the expected future cash flows from the assets. The Company will amortize these intangible assets over their estimated economic useful lives.
The goodwill of
$4.4 million
arising from the Harris acquisition consists largely of the synergies and economies of scale expected from combining operations, and, to a lesser extent, the assembled workforce of Harris. All of the goodwill was assigned to the Company's Energy Management segment. None of the acquired goodwill is expected to be deductible for tax purposes.
The following unaudited pro forma condensed combined results of operations for the years ended March 31, 2013 and 2014, respectively, are based on the historical financial statements of the Company and Harris giving effect to the business combination as if it had occurred at the beginning of the period presented. Therefore, this pro forma data has been adjusted to include amortization of purchased intangible assets and interest on the promissory note delivered as part of the purchase price during the entire applicable periods. Additionally, the tax benefit of
$2.3 million
recorded during the year ended March 31, 2014 was eliminated and the tax benefit was recorded during the year ended March 31, 2013. This data is not necessarily indicative of the results of operations that would have been generated if the transaction had occurred at the beginning of the respective periods. Moreover, this data is not intended to be indicative of future results of operations (in thousands, other than per share data).
|
Acquisition of Harris Pro Forma Results of Operations
|
|||||
|
Fiscal Year Ended March 31,
|
|||||
|
2013
|
2014
|
||||
|
Revenue
|
102,198
|
|
92,868
|
|
|
|
Net loss available to common shareholders
|
(7,489
|
)
|
(9,111
|
)
|
|
|
Loss per share:
|
|||||
|
Basic
|
(0.36
|
)
|
(0.43
|
)
|
|
|
Diluted
|
(0.36
|
)
|
(0.43
|
)
|
|
The supplemental pro forma results above exclude any benefits that may result from the acquisition due to synergies that are expected to be derived from the elimination of any duplicative costs. In addition, the pro forma results for the year ended March 31, 2014 was adjusted to exclude non-recurring aggregate acquisition-related costs of
$0.2 million
that were incurred in 2013.
NOTE D — RELATED PARTY TRANSACTIONS
During fiscal
2012
and
2013
, the Company purchased goods and services from an entity in the amounts of
$46,000
and
$40,000
, respectively, for which a director of the Company serves as a member of the board of directors. During fiscal
2014
, the Company purchased goods and services from an entity in the amount of
$20,000
, for which a director of the Company serves as a minority owner and chairman of the board of directors.
Long-term debt as of
March 31, 2013
and
2014
consisted of the following (in thousands):
|
|
March 31,
|
||||||
|
|
2013
|
2014
|
|||||
|
Term note
|
$
|
263
|
|
$
|
—
|
|
|
|
Harris seller's note
|
—
|
|
2,624
|
|
|||
|
Customer equipment finance notes payable
|
4,408
|
|
2,331
|
|
|||
|
First mortgage note payable
|
694
|
|
607
|
|
|||
|
Debenture payable
|
721
|
|
675
|
|
|||
|
Other long-term debt
|
620
|
|
364
|
|
|||
|
Total long-term debt
|
6,706
|
|
6,601
|
|
|||
|
Less current maturities
|
(2,597
|
)
|
(3,450
|
)
|
|||
|
Long-term debt, less current maturities
|
$
|
4,109
|
|
$
|
3,151
|
|
|
66
Revolving Credit Agreement
The Company has an amended credit agreement (Credit Agreement) with JP Morgan Chase Bank, N.A. (JP Morgan). The Credit Agreement provides for a revolving credit facility (Credit Facility) that matures on August 30, 2014. Borrowings under the Credit Facility are limited to
$15.0 million
, subject to a borrowing base requirement when the outstanding principal balance of loans under the Credit Facility is greater than
$5.0 million
. Such commitment includes a
$2.0 million
sublimit for the issuance of letters of credit. As of
March 31, 2014
, the Company had
no
outstanding letters of credit. There were
no
loans outstanding under the Credit Agreement as of
March 31, 2013
or
March 31, 2014
. In August 2013, the Company completed an additional amendment to extend the maturity date of the Credit Agreement to August 30, 2014, and made certain changes to the financial covenants, which are described below.
The Credit Agreement requires the Company to maintain (i) a ratio of total liabilities to tangible net worth not to exceed
0.50
to 1.00 as of the last day of any fiscal quarter, (ii) average daily unencumbered liquidity of at least
$20.0 million
during each period of three consecutive business days, (iii) a debt service coverage ratio of greater than
1.25
to 1.00 as of the last day of any fiscal quarter and (iv) a funded debt to EBITDA ratio of less than
2.5
to 1.0 as of the last day of any fiscal quarter. The Credit Agreement also contains certain restrictions on the ability of the Company to make capital or lease expenditures over prescribed limits, incur additional indebtedness, consolidate or merge, guarantee obligations of third parties, make loans or advances, declare or pay any dividend or distribution on its stock, redeem or repurchase shares of its stock or pledge assets. The Company was not in compliance with its debt service coverage ratio and its funded debt to earnings before interest, taxes, depreciation and amortization, or EBITDA, covenants in the Credit Agreement as of
March 31, 2014
. T
he Company received a waiver from JP Morgan for the covenant defaults.
The Credit Agreement is secured by a first priority security interest in the Company’s accounts receivable, inventory and general intangibles, and a second priority security interest in the Company’s equipment and fixtures. All OTAs, PPAs, leases, supply agreements and/or similar agreements relating to solar PV and wind turbine systems or facilities, as well as all accounts receivable and assets of the Company related to the foregoing, are excluded from these liens, except to the extent the Company elects to finance any such assets with JP Morgan.
Borrowings under the Credit Agreement bear interest based on LIBOR plus an applicable margin (Applicable Margin), which ranges from
2.0%
to
3.0%
per annum based on the Company's debt service coverage ratio from time to time. The Company must pay a fee ranging between
0.25%
and
0.50%
per annum on the average daily unused amount of the Credit Facility (with the amount of such fee based on the Company's debt service coverage ratio from time to time) and a fee in the amount of the Applicable Margin on the daily average face amount of undrawn issued letters of credit. The fee on unused amounts is waived if the Company or its affiliates maintain funds on deposit with JP Morgan or its affiliates above a specified amount. The deposit threshold requirement was met as of
March 31, 2014
.
Harris Seller's Note
On July 1, 2013, the Company issued an unsecured and subordinated promissory note in the principal amount of
$3.1 million
to partially fund the acquisition of Harris. The note is included in the table above as Harris seller's note. The note bears interest at the rate of
4%
per annum. Principal and interest are payable quarterly and the note matures in July 2016.
Customer Equipment Finance Notes Payable
In September 2010, the Company entered into a note agreement with a financial institution that provided the Company with
$2.4 million
to fund completed customer contracts under the Company’s OTA finance program. In February 2011, the Company sold a portion of the OTA contracts collateralizing the note to a third party equipment finance company. Accordingly, the Company repaid
$1.3 million
of the outstanding note balance and recorded a prepayment penalty of
$33,000
. This note is included in the table above as customer equipment finance notes payable. The note is collateralized by the OTA-related equipment and the expected future monthly payments under the supporting
12
individual OTA customer contracts. The note bears interest at
7%
and matures in September 2015. The note agreement includes certain prepayment penalties and a covenant that the Company maintain at least
$5 million
in cash liquidity. The Company was in compliance with all covenants in the note agreement as of
March 31, 2014
.
In March 2011, the Company entered into a note agreement with a financial institution that provided the Company with
$0.9 million
to fund completed customer contracts under the Company’s OTA finance program. This note is included in the table above as customer equipment finance notes payable. The note is collateralized by the OTA-related equipment and the expected future monthly payments under the supporting
three
individual OTA customer contracts. The note bears interest at
7%
and requires monthly payments of
$20,900
through April 2015. The note agreement includes certain prepayment penalties and a covenant that the Company maintain at least
$5 million
in cash liquidity. The Company was in compliance with all covenants in the note agreement as of
March 31, 2014
.
In June 2011, the Company entered into a note agreement with a financial institution that provided the Company with
$2.8 million
to fund completed customer contracts under the Company’s OTA finance program. This note is included in the table above
67
as customer equipment finance notes payable. The note is collateralized by the OTA-related equipment and the expected future monthly payments under the supporting
40
individual OTA contracts. The note bears interest at
7.85%
and matures in April 2016. The note agreement includes a debt service covenant with respect to the supporting OTA contracts that the aggregate amount of all remaining scheduled payments due with respect to the individual OTA contracts be not less than
1.25
to 1.0 of the remaining principal and interest payments due under the loan. As of
March 31, 2014
the Company was in compliance with the debt service covenant.
In September 2011, the Company entered into a credit agreement with JP Morgan that provided the Company with up to
$5.0 million
that was immediately available to fund completed customer contracts under its OTA finance program. This credit agreement is included in the table above as customer equipment finance notes payable. The Company had one year from the date of the commitment to borrow under the credit agreement, which expired on September 30, 2012 for new borrowings. As of
March 31, 2014
, the Company had
$0.9 million
outstanding under the credit agreement. The loan amount is collateralized by the OTA-related equipment and the expected future monthly payments under the supporting
34
individual OTA customer contracts. The current loan amount under the credit agreement bears interest at LIBOR plus
4%
and matures in December 2016. In August 2013, the Company completed an amendment to the credit agreement making certain changes to the financial covenants requiring the Company to maintain (i) average daily unencumbered liquidity of at least
$20.0 million
during each period of three consecutive business days and (ii) a debt service coverage ratio of greater than
1.25
to 1.00 as of the last day of any fiscal quarter and (iii) a funded debt to EBITDA ratio of less than
2.5
to 1.0 as of the last day of any fiscal quarter. The Company was not in compliance with its debt service coverage ratio an
d its funded debt to earnings before interest, taxes, depreciation and amortization, or EBITDA, covenants as of
March 31, 2014
. The Company received a waiver from JP Morgan for the covenant defaults.
Term Note
The Company’s term note was satisfied in full in February 2014. Amounts outstanding under the note were secured by a first security interest and first mortgage in certain long-term assets and a secondary interest in inventory and accounts receivable and a secondary general business security agreement on all assets.
First Mortgage Note Payable
The Company’s first mortgage note payable has an interest rate of prime plus
2.25%
(effective rate of
5.50%
at
March 31, 2014
), and requires monthly payments of principal and interest of
$10,000
through December 2014. This note is included in the table above as first mortgage note payable. The mortgage is secured by a first mortgage on the Company’s manufacturing facility. The mortgage includes certain prepayment penalties and various restrictive covenants, with which the Company was in compliance as of
March 31, 2014
.
Debenture Payable
The Company’s debenture payable was issued by Certified Development Company at an effective interest rate of
4.94%
. The balance is payable in monthly principal and interest payments of
$8,000
through December 2024 and is guaranteed by United States Small Business Administration 504 program. This payable is included in the table above as debenture payable. The amount due was collateralized by a second mortgage on the manufacturing facility.
Other Long-Term Debt
In November 2007, the Company completed a Wisconsin Community Development Block Grant with the local city government to provide financing in the amount of
$750,000
for the purpose of acquiring additional production equipment. This loan is included in the table above as other long-term debt. The loan has an interest rate of
4.9%
and is collateralized by the related equipment. The loan requires monthly payments of
$11,000
through December 2014.
In September 2010, the Company entered into a note agreement with the Wisconsin Department of Commerce that provided the Company with
$0.3 million
to fund the Company’s rooftop solar project at its Manitowoc manufacturing facility. This note is included in the table above as other long-term debt. The note is collateralized by the related solar equipment. The note allowed for
two years
without interest accruing or principal payments due. Beginning in July 2012, the note bears interest at
2%
and requires monthly payments of
$4,600
. The note matures in June 2017. The note agreement requires the Company to maintain a certain number of jobs at its Manitowoc facilities during the note’s duration. The Company was in compliance with all covenants in the note agreement as of
March 31, 2014
.
In January 2011, the Company amended its November 2007 Wisconsin Community Development Block Grant with the local city government to provide the Company with
$0.2 million
to fund equipment at its Manitowoc facility. This loan is included in the table above as other long-term debt. The amendment to the loan agreement is collateralized by the related equipment. The loan bears interest at
2.1125%
and requires monthly payments of
$3,600
through December 2014. The amendment to the loan agreement requires the Company to create and maintain a certain number of jobs at its Manitowoc facilities during the note’s duration. The Company was in compliance with all covenants in the loan agreement as of
March 31, 2014
.
68
Other long-term debt consists of a promissory note from the state government to provide working capital and equipment for the development of daylighting technologies. The note is secured by the related equipment. The loan bears interest at
2.0%
and requires monthly payments of
$3,400
through November 2015.
Aggregate Maturities
As of
March 31, 2014
, aggregate maturities of long-term debt were as follows (in thousands):
|
Fiscal 2015
|
$
|
3,450
|
|
|
Fiscal 2016
|
1,884
|
|
|
|
Fiscal 2017
|
733
|
|
|
|
Fiscal 2018
|
70
|
|
|
|
Fiscal 2019
|
59
|
|
|
|
Thereafter
|
405
|
|
|
|
$
|
6,601
|
|
|
NOTE F — INCOME TAXES
The total provision (benefit) for income taxes consists of the following for the fiscal years ending (in thousands):
|
|
Fiscal Year Ended March 31,
|
||||||||||
|
|
2012
|
2013
|
2014
|
||||||||
|
Current
|
$
|
520
|
|
$
|
(180
|
)
|
$
|
19
|
|
||
|
Deferred
|
(150
|
)
|
4,253
|
|
(2,077
|
)
|
|||||
|
$
|
370
|
|
$
|
4,073
|
|
$
|
(2,058
|
)
|
|||
|
|
2012
|
2013
|
2014
|
||||||||
|
Federal
|
$
|
292
|
|
$
|
3,803
|
|
$
|
(1,830
|
)
|
||
|
State
|
78
|
|
270
|
|
(228
|
)
|
|||||
|
$
|
370
|
|
$
|
4,073
|
|
$
|
(2,058
|
)
|
|||
A reconciliation of the statutory federal income tax rate and effective income tax rate is as follows:
|
Fiscal Year Ended March 31,
|
||||||||
|
|
2012
|
2013
|
2014
|
|||||
|
Statutory federal tax rate
|
34.0
|
%
|
34.0
|
%
|
34.0
|
%
|
||
|
State taxes, net
|
9.2
|
%
|
2.3
|
%
|
2.8
|
%
|
||
|
Federal tax credit
|
(11.6
|
)%
|
3.9
|
%
|
0.9
|
%
|
||
|
State tax credit
|
(5.9
|
)%
|
(0.5
|
)%
|
0.4
|
%
|
||
|
Change in valuation reserve
|
5.9
|
%
|
(111.7
|
)%
|
(10.2
|
)%
|
||
|
Permanent items
|
10.0
|
%
|
2.3
|
%
|
(2.9
|
)%
|
||
|
Change in tax contingency reserve
|
0.8
|
%
|
3.4
|
%
|
(0.3
|
)%
|
||
|
Other, net
|
0.9
|
%
|
1.9
|
%
|
0.2
|
%
|
||
|
Effective income tax rate
|
43.3
|
%
|
(64.4
|
)%
|
24.9
|
%
|
||
69
The net deferred tax assets and liabilities reported in the accompanying consolidated financial statements include the following components (in thousands):
|
|
March 31,
|
||||||
|
|
2013
|
2014
|
|||||
|
Inventory, accruals and reserves
|
$
|
2,090
|
|
$
|
1,445
|
|
|
|
Other
|
136
|
|
139
|
|
|||
|
Deferred revenue
|
338
|
|
44
|
|
|||
|
Valuation allowance
|
(2,564
|
)
|
(1,628
|
)
|
|||
|
Total net current deferred tax assets and liabilities
|
$
|
—
|
|
$
|
—
|
|
|
|
Federal and state operating loss carryforwards
|
2,691
|
|
6,233
|
|
|||
|
Tax credit carryforwards
|
1,426
|
|
1,498
|
|
|||
|
Non-qualified stock options
|
2,298
|
|
2,541
|
|
|||
|
Deferred revenue
|
27
|
|
23
|
|
|||
|
Fixed assets
|
(1,909
|
)
|
(1,889
|
)
|
|||
|
Intangible assets
|
—
|
|
(2,125
|
)
|
|||
|
Valuation allowance
|
(4,533
|
)
|
(6,281
|
)
|
|||
|
Total net long-term deferred tax assets and liabilities
|
$
|
—
|
|
$
|
—
|
|
|
|
Total net deferred tax assets
|
$
|
—
|
|
$
|
—
|
|
|
The Company is eligible for tax benefits associated with the excess of the tax deduction available for exercises of non-qualified stock options, or NQSOs, over the amount recorded at grant. The amount of the benefit is based upon the ultimate deduction reflected in the applicable income tax return. Benefits of
$1.0 million
,
$70,000
and
$13,000
were recorded in fiscal
2012
, fiscal
2013
and fiscal
2014
, respectively, as a reduction in taxes payable and a credit to additional paid in capital based on the amount that was utilized in the current year.
As of
March 31, 2014
, the Company has federal net operating loss carryforwards of approximately
$19.6 million
, of which
$3.5 million
are associated with the exercise of NQSOs that have not yet been recognized by the Company in its financial statements. The Company also has state net operating loss carryforwards of approximately
$15.8 million
, of which
$4.5 million
are associated with the exercise of NQSOs. The Company also has federal tax credit carryforwards of approximately
$1.5 million
and state tax credits of
$0.8 million
. For the fiscal year ended
March 31, 2014
, the Company has recorded a valuation allowance of
$7.9 million
, equaling the net deferred tax asset due to the uncertainty of its realization value in the future. The Company considers future taxable income and ongoing prudent and feasible tax planning strategies in assessing the need for the valuation allowance. In the event that the Company determines that the deferred tax assets are able to be realized, an adjustment to the deferred tax asset would increase income in the period such determination is made.
Generally, a change of more than 50% in the ownership of the Company's stock, by value, over a three year period constitutes an ownership change for federal income tax purposes as defined under Section 382 of the Internal Revenue Code. As a result, the Company's ability to use its net operating loss carryforwards, attributable to the period prior to such ownership change, to offset taxable income can be subject to limitations in a particular year, which could potentially result in increased future tax liability for the Company. The Company does not believe an ownership change affects the use of the full amount of the net operating loss carryforwards. There was no limitation that occurred for fiscal
2012
, fiscal
2013
, or fiscal
2014
.
The Company records its tax provision based on the respective tax rules and regulations for the jurisdictions in which it operates. Where the Company believes that a tax position is supportable for income tax purposes, the item is included in their income tax returns. Where treatment of a position is uncertain, a liability is recorded based upon the expected most likely outcome taking into consideration the technical merits of the position based on specific tax regulations and facts of each matter. These liabilities may be affected by changing interpretations of laws, rulings by tax authorities, or the expiration of the statute of limitations.
As of December 31, 2011, an examination of the Company’s U.S. federal income tax returns for tax years 2009 to 2011 was complete. The resolution of this examination did not have a material effect on its business, financial condition, results of operations or liquidity.
State income tax returns are generally subject to examination for a period of
3
to
5
years after filing of the respective return. The state effect of any federal changes remains subject to examination by various states for a period of up to two years after formal notification to the states. The Company currently has no state income tax return positions in the process of examination, administrative appeals or litigation.
70
Uncertain tax positions
As of
March 31, 2014
, the balance of gross unrecognized tax benefits was approximately
$0.2 million
, all of which would reduce the Company’s effective tax rate if recognized. The Company does not expect this amounts to change in the next twelve months as none of the issues are currently under examination, the statutes of limitations do not expire within the period, and the Company is not aware of any pending litigation.
The Company has classified the amounts recorded for uncertain tax benefits in the balance sheet as other liabilities (non-current) to the extent that payment is not anticipated within one year. The Company recognizes penalties and interest related to uncertain tax liabilities in income tax expense. Penalties and interest are immaterial as of the date of adoption and are included in the unrecognized tax benefits. The Company had the following unrecognized tax benefit activity (in thousands):
|
|
Fiscal Year Ended March 31,
|
||||||||||
|
|
2012
|
2013
|
2014
|
||||||||
|
Unrecognized tax benefits as of beginning of fiscal year
|
$
|
399
|
|
$
|
406
|
|
$
|
188
|
|
||
|
Additions based on tax positions related to the current period positions
|
7
|
|
16
|
|
22
|
|
|||||
|
Reduction for tax positions of prior years
|
—
|
|
(1
|
)
|
—
|
|
|||||
|
Reduction due to lapse of statute of limitations
|
—
|
|
(233
|
)
|
—
|
|
|||||
|
Unrecognized tax benefits as of end of fiscal year
|
$
|
406
|
|
$
|
188
|
|
$
|
210
|
|
||
NOTE G —COMMITMENTS AND CONTINGENCIES
Operating Leases
The Company leases vehicles and equipment under operating leases expiring at various dates through 2021. Rent expense under operating leases was
$2,111,000
,
$1,613,000
and
$1,238,000
for fiscal
2012
,
2013
and
2014
, respectively. Total annual commitments under non-cancelable operating leases with terms in excess of one year at
March 31, 2014
are as follows (in thousands):
|
Fiscal 2015
|
$
|
289
|
|
|
Fiscal 2016
|
206
|
|
|
|
Fiscal 2017
|
85
|
|
|
|
Fiscal 2018
|
71
|
|
|
|
Fiscal 2019
|
—
|
|
|
|
Thereafter
|
—
|
|
|
|
$
|
651
|
|
|
Purchase Commitments
The Company enters into non-cancellable purchase commitments for certain inventory items in order to secure better pricing and ensure materials on hand and capital expenditures. As of
March 31, 2014
, the Company had entered into
$4.4 million
of purchase commitments related to fiscal
2015
for inventory purchases.
Retirement Savings Plan
The Company sponsors a tax deferred retirement savings plan that permits eligible employees to contribute varying percentages of their compensation up to the limit allowed by the Internal Revenue Service. This plan also provides for discretionary Company contributions. In fiscal
2012
,
2013
and
2014
, the Company made matching contributions of approximately
$15,000
,
$8,000
and
$26,000
, respectively.
Litigation
The Company is subject to various claims and legal proceedings arising in the ordinary course of business. As of the date hereof, the Company is unable to currently assess whether the final resolution of any of such claims or legal proceedings may have a material adverse effect on the Company. In addition to ordinary-course litigation, the Company is a party to the proceedings described below.
In August 2012, the Company received a subpoena issued by the SEC requesting certain documents and information generally related to the financial reporting of its sales of solar photovoltaic systems, among other matters. The Company continues to cooperate with the SEC regarding this non-public, fact-finding inquiry. The SEC has informed the Company that this inquiry
71
should not be construed as an indication that any violations of law have occurred or that the SEC has any negative opinion of any person, entity or security.
On March 27, 2014, the Company was named as a defendant in a civil lawsuit filed by Neal R. Verfuerth, the Company's former chief executive officer who was terminated for cause in November 2012, in the United States District Court for the Eastern District of Wisconsin (Green Bay Division). The plaintiff alleges, among other things, that the Company breached certain agreements entered into with the plaintiff, including the plaintiff’s employment agreement, and violated certain laws. The complaint seeks, among other relief, unspecified pecuniary and compensatory damages, fees and such other relief as the court may deem just and proper. The Company believes that the claims are meritless and that it has substantial legal and factual defenses to the claims and allegations contained in the complaint. The Company intends to defend against these claims vigorously.
NOTE H —SHAREHOLDERS’ EQUITY
Share Repurchase Program and Treasury Stock
In October 2011, the Company’s Board of Directors approved a share repurchase program authorizing the Company to repurchase in aggregate up to a maximum of
$1.0 million
of the Company’s outstanding common stock. In November 2011, the Company’s Board of Directors approved an increase to the share repurchase program authorizing the Company to repurchase in aggregate up to a maximum of
$2.5 million
of the Company’s outstanding common stock. In April 2012, the Company's Board approved another increase to the share repurchase program authorizing the Company to repurchase in aggregate up to a maximum of
$7.5 million
of the Company's outstanding common stock. As of
March 31, 2014
, the Company had repurchased
3.0 million
shares of common stock at a cost of
$6.8 million
under the program. The Company did not repurchase any shares in fiscal 2014 and does not intend to repurchase any additional common stock under this program in the near-term.
Shareholder Rights Plan
On January 7, 2009, the Company’s Board of Directors adopted a shareholder rights plan and declared a dividend distribution of one common share purchase right (Right) for each outstanding share of the Company’s common stock. The issuance date for the distribution of the Rights was February 15, 2009 to shareholders of record on February 1, 2009. Each Right entitles the registered holder to purchase from the Company one share of the Company’s common stock at a price of
$30.00
per share, subject to adjustment (Purchase Price).
The Rights will not be exercisable (and will be transferable only with the Company’s common stock) until a “Distribution Date” occurs (or the Rights are earlier redeemed or expire). A Distribution Date generally will occur on the earlier of a public announcement that a person or group of affiliated or associated persons (Acquiring Person) has acquired beneficial ownership of
20%
or more of the Company’s outstanding common stock (Shares Acquisition Date) or
10
business days after the commencement of, or the announcement of an intention to make, a tender offer or exchange offer that would result in any such person or group of persons acquiring such beneficial ownership.
If a person becomes an Acquiring Person, holders of Rights (except as otherwise provided in the shareholder rights plan) will have the right to receive that number of shares of the Company’s common stock having a market value of two times the then-current Purchase Price, and all Rights beneficially owned by an Acquiring Person, or by certain related parties or transferees, will be null and void. If, after a Shares Acquisition Date, the Company is acquired in a merger or other business combination transaction or
50%
or more of its consolidated assets or earning power are sold, proper provision will be made so that each holder of a Right (except as otherwise provided in the shareholder rights plan) will thereafter have the right to receive that number of shares of the acquiring company’s common stock which at the time of such transaction will have a market value of two times the then-current Purchase Price.
Until a Right is exercised, the holder thereof, as such, will have no rights as a shareholder of the Company. At any time prior to a person becoming an Acquiring Person, the Board of Directors of the Company may redeem the Rights in whole, but not in part, at a price of
$0.001
per Right. Unless they are extended or earlier redeemed or exchanged, the Rights will expire on January 7, 2019.
Employee Stock Purchase Plan
In August 2010, the Company’s board of directors approved a non-compensatory employee stock purchase plan, or ESPP. The ESPP authorizes
2,500,000
million shares to be issued from treasury or authorized shares to satisfy employee share purchases under the ESPP. All full-time employees of the Company are eligible to be granted a non-transferable purchase right each calendar quarter to purchase directly from the Company up to
$20,000
of the Company’s common stock at a purchase price equal to
100%
of the closing sale price of the Company’s common stock on the NYSE MKT exchange on the last trading day of each quarter. The ESPP allows for employee loans from the Company, except for Section 16 officers, limited to
20%
of an individual’s annual income and no more than
$250,000
outstanding at any one time. Interest on the loans is charged at the
10
-year loan IRS rate and is payable at the end of each calendar year or upon loan maturity. The loans are secured by a pledge of any and all the Company’s shares purchased by the participant under the ESPP and the Company has full recourse against the employee, including offset
72
against compensation payable. As of March 31, 2013, the Company had halted the loan program. The Company had the following shares issued from treasury during fiscal
2013
and fiscal
2014
:
|
As of March 31, 2013
|
|||||||||||||||
|
Shares Issued Under ESPP
Plan |
Closing Market
Price |
Shares Issued Under Loan
Program |
Dollar Value of
Loans Issued |
Repayment of
Loans |
|||||||||||
|
Quarter Ended June 30, 2012
|
9,232
|
|
$2.20
|
7,955
|
|
$
|
17,500
|
|
$
|
1,600
|
|
||||
|
Quarter Ended September 30, 2012
|
27,467
|
|
$1.98
|
25,606
|
|
50,700
|
|
4,060
|
|
||||||
|
Quarter Ended December 31, 2012
|
9,846
|
|
$1.66
|
8,434
|
|
14,000
|
|
1,075
|
|
||||||
|
Quarter Ended March 31, 2013
|
1,053
|
|
$2.48
|
—
|
|
—
|
|
30,830
|
|
||||||
|
Total
|
47,598
|
|
$1.66 - 2.48
|
41,995
|
|
$
|
82,200
|
|
$
|
37,565
|
|
||||
|
As of March 31, 2014
|
|||||||||||||||
|
Shares Issued Under ESPP
Plan |
Closing Market
Price |
Shares Issued Under Loan
Program |
Dollar Value of
Loans Issued |
Repayment of
Loans |
|||||||||||
|
Quarter Ended June 30, 2013
|
990
|
|
$2.48
|
—
|
|
$
|
—
|
|
$
|
823
|
|
||||
|
Quarter Ended September 30, 2013
|
702
|
|
$3.76
|
—
|
|
—
|
|
118,309
|
|
||||||
|
Quarter Ended December 31, 2013
|
319
|
|
$6.80
|
—
|
|
—
|
|
94,300
|
|
||||||
|
Quarter Ended March 31, 2014
|
362
|
|
$7.25
|
—
|
|
—
|
|
1,677
|
|
||||||
|
Total
|
2,373
|
|
$2.48 - 7.25
|
—
|
|
$
|
—
|
|
$
|
215,109
|
|
||||
Loans issued to employees are reflected on the Company’s balance sheet as a contra-equity account.
NOTE I — STOCK OPTIONS, RESTRICTED SHARES AND WARRANTS
The Company grants stock options and restricted stock under its 2003 Stock Option and 2004 Stock and Incentive Awards Plans (Plans). Under the terms of the Plans, the Company has reserved
13,500,000
shares for issuance to key employees, consultants and directors. The options generally vest and become exercisable ratably between
one month
and
five years
although longer and shorter vesting periods have been used in certain circumstances. Exercisability of the options granted to employees are generally contingent on the employees’ continued employment and non-vested options are subject to forfeiture if employment terminates for any reason. Options under the Plans have a maximum life of
10
years. In the past, the Company has granted both ISOs and NQSOs, although in July 2008, the Company adopted a policy of thereafter only granting NQSOs. Certain non-employee directors have elected to receive stock awards in lieu of cash compensation pursuant to elections made under the Company’s non-employee director compensation program. The Plans also provide to certain employees accelerated vesting in the event of certain changes of control of the Company as well as under other special circumstances.
In fiscal 2011, the Company converted all of its existing ISO awards to NQSO awards. No consideration was given to the employees for their voluntary conversion of ISO awards.
In June 2012, the Company's compensation committee approved the issuance of restricted shares under the Plans to key employees to provide an opportunity for such employees to earn long-term equity incentive awards. In May 2013, the Compensation Committee of the Board of Directors changed the Company's long-term equity incentive grant policy so that only restricted shares are issued to all employees under the Plans. The restricted shares are settled in Company stock when the restriction period ends. Compensation cost for restricted shares granted to employees is recognized ratably over the vesting term, which is between
three
to
five
years. Settlement of the shares is contingent on the employees’ continued employment and non-vested shares are subject to forfeiture if employment terminates for any reason. In fiscal
2013
, an aggregate of
163,750
restricted shares were granted valued at a price per share between
$1.80
and
$2.00
, which was the closing market price as of each grant date. In fiscal
2014
, an aggregate of
526,663
restricted shares were granted valued at a price per share between
$2.41
and
$6.97
, which was the closing market price as of each grant date.
In fiscal
2012
, the Company granted
29,308
shares from the 2004 Stock and Incentive Awards Plan to certain non-employee directors who elected to receive stock awards in lieu of cash compensation. The shares were valued ranging from
$2.43
to
$4.19
per share, the closing market price as of the issuance dates. In fiscal
2013
, the Company granted
30,422
shares from the 2004 Stock and Incentive Awards Plan to certain non-employee directors who elected to receive stock awards in lieu of cash compensation. The shares were valued ranging from
$1.62
to
$2.57
per share, the closing market price as of the issuance dates. In fiscal
2014
, the Company granted
33,641
shares from the 2004 Stock and Incentive Awards Plan to certain non-employee directors who elected to receive stock awards in lieu of cash compensation. The shares were valued ranging from
$2.41
to
$5.73
per share, the closing
73
market price as of the issuance dates. Additionally, during fiscal
2013
, the Company issued
3,000
shares to a consultant as part of a consulting compensation agreement. The shares were valued at
$2.03
per share, the closing market price as of the issuance date.
In fiscal
2014
, the Company recorded
$0.2 million
of stock-based compensation related to the deferred consideration for employee Harris Shareholders resulting from the Harris acquisition. The following amounts of stock-based compensation were recorded (in thousands):
|
|
Fiscal Year Ended March 31,
|
||||||||||
|
|
2012
|
2013
|
2014
|
||||||||
|
Cost of product revenue
|
$
|
189
|
|
$
|
114
|
|
$
|
70
|
|
||
|
General and administrative
|
548
|
|
578
|
|
1,025
|
|
|||||
|
Sales and marketing
|
501
|
|
451
|
|
485
|
|
|||||
|
Research and development
|
29
|
|
21
|
|
13
|
|
|||||
|
$
|
1,267
|
|
$
|
1,164
|
|
$
|
1,593
|
|
|||
The number of shares available for grant under the plans were as follows:
|
Available at March 31, 2011
|
1,577,676
|
|
|
Granted stock options
|
(1,481,356
|
)
|
|
Granted shares
|
(29,308
|
)
|
|
Forfeited
|
1,339,078
|
|
|
Available at March 31, 2012
|
1,406,090
|
|
|
Granted stock options
|
(1,054,876
|
)
|
|
Granted shares
|
(33,422
|
)
|
|
Restricted Shares
|
(163,750
|
)
|
|
Forfeited restricted shares
|
58,750
|
|
|
Forfeited stock options
|
1,419,986
|
|
|
Available at March 31, 2013
|
1,632,778
|
|
|
Granted stock options
|
(305,544
|
)
|
|
Granted shares
|
(33,641
|
)
|
|
Restricted shares
|
(526,663
|
)
|
|
Forfeited restricted shares
|
69,375
|
|
|
Forfeited stock options
|
455,691
|
|
|
Available at March 31, 2014
|
1,291,996
|
|
74
The following table summarizes information with respect to outstanding stock options:
|
Number of
Shares |
Weighted
Average Exercise Price |
Weighted
Average Fair Value of Options Granted |
Aggregate Intrinsic
Value |
|||||||||
|
Outstanding at March 31, 2011
|
3,658,768
|
|
$
|
3.83
|
|
2.04
|
||||||
|
Granted
|
1,481,356
|
|
$
|
3.56
|
|
|||||||
|
Exercised
|
(103,413
|
)
|
$
|
1.45
|
|
|||||||
|
Forfeited
|
(1,339,078
|
)
|
$
|
4.18
|
|
|||||||
|
Outstanding at March 31, 2012
|
3,697,633
|
|
$
|
3.76
|
|
1.95
|
||||||
|
Granted
|
1,054,876
|
|
$
|
1.98
|
|
|||||||
|
Exercised
|
(20,000
|
)
|
$
|
2.25
|
|
|||||||
|
Forfeited
|
(1,419,986
|
)
|
$
|
3.26
|
|
|||||||
|
Outstanding at March 31, 2013
|
3,312,523
|
|
$
|
3.42
|
|
1.23
|
||||||
|
Granted
|
305,544
|
|
$
|
2.41
|
|
|||||||
|
Exercised
|
(446,059
|
)
|
$
|
2.58
|
|
|||||||
|
Forfeited
|
(455,691
|
)
|
$
|
3.52
|
|
|||||||
|
Outstanding at March 31, 2014
|
2,716,317
|
|
$
|
3.43
|
|
1.32
|
$
|
10,978,432
|
|
|||
|
Exercisable at March 31, 2014
|
1,586,940
|
|
$
|
5,614,065
|
|
|||||||
The following table summarizes the range of exercise prices on outstanding stock options at
March 31, 2014
:
|
March 31, 2014
|
|||||||||||
|
Outstanding
|
Weighted Average Remaining Contractual Life (Years)
|
Weighted Average Exercise Price
|
Vested
|
Weighted Average Exercise Price
|
|||||||
|
$0.75
|
10,000
|
|
1.00
|
$0.75
|
10,000
|
|
$0.75
|
||||
|
1.62 - 2.25
|
882,709
|
|
6.58
|
2.01
|
350,959
|
|
2.09
|
||||
|
2.41 - 2.75
|
546,944
|
|
8.08
|
2.48
|
192,920
|
|
2.49
|
||||
|
2.86 - 4.28
|
821,207
|
|
5.91
|
3.42
|
607,904
|
|
3.40
|
||||
|
4.49 - 4.76
|
54,400
|
|
3.75
|
4.65
|
52,800
|
|
4.65
|
||||
|
5.35 - 6.05
|
220,706
|
|
5.33
|
5.47
|
192,006
|
|
5.47
|
||||
|
9.00
|
43,000
|
|
3.87
|
9.00
|
43,000
|
|
9.00
|
||||
|
10.14 - 11.61
|
137,351
|
|
3.83
|
11.02
|
137,351
|
|
11.02
|
||||
|
2,716,317
|
|
6.32
|
$3.43
|
1,586,940
|
|
$4.09
|
|||||
The aggregate intrinsic value represents the total pre-tax intrinsic value, which is calculated as the difference between the exercise price of the underlying stock options and the fair value of the Company’s closing common stock price of
$7.25
as of
March 31, 2014
.
75
Unrecognized compensation cost related to non-vested common stock-based compensation as of
March 31, 2014
is as follows (in thousands):
|
Fiscal 2015
|
$
|
1,098
|
|
|
Fiscal 2016
|
868
|
|
|
|
Fiscal 2017
|
519
|
|
|
|
Fiscal 2018
|
361
|
|
|
|
Fiscal 2019
|
134
|
|
|
|
Thereafter
|
7
|
|
|
|
$
|
2,987
|
|
|
|
Remaining weighted average expected term
|
5.1 years
|
|
|
During fiscal
2014
, the Company granted restricted shares as follows (which are included in the above stock plan activity tables):
|
Balance at March 31, 2013
|
105,000
|
|
|
|
Shares issued
|
526,663
|
|
|
|
Shares vested
|
(23,084
|
)
|
|
|
Shares forfeited
|
(69,375
|
)
|
|
|
Shares outstanding at March 31, 2014
|
539,204
|
|
|
|
Per share price on grant date
|
$1.80-6.97
|
|
|
|
Compensation expense
|
$
|
261,351
|
|
As of
March 31, 2014
, the weighted average grant-date fair value of restricted shares granted was
$3.32
.
The Company has previously issued warrants in connection with various stock offerings and services rendered. The warrants grant the holder the option to purchase common stock at specified prices for a specified period of time. No warrants were issued in fiscal
2012
,
2013
or
2014
.
Outstanding warrants are comprised of the following:
|
Number of
Shares |
Weighted
Average Exercise Price |
|||||
|
Outstanding at March 31, 2011
|
38,980
|
|
$
|
2.25
|
|
|
|
Issued
|
—
|
|
—
|
|
||
|
Exercised
|
—
|
|
$
|
—
|
|
|
|
Cancelled
|
—
|
|
$
|
—
|
|
|
|
Outstanding at March 31, 2012
|
38,980
|
|
$
|
2.25
|
|
|
|
Issued
|
—
|
|
—
|
|
||
|
Exercised
|
—
|
|
—
|
|
||
|
Cancelled
|
—
|
|
—
|
|
||
|
Outstanding at March 31, 2013
|
38,980
|
|
$
|
2.25
|
|
|
|
Issued
|
—
|
|
—
|
|
||
|
Exercised
|
—
|
|
—
|
|
||
|
Cancelled
|
—
|
|
—
|
|
||
|
Outstanding at March 31, 2014
|
38,980
|
|
$
|
2.25
|
|
|
A summary of outstanding warrants as of
March 31, 2014
follows:
|
Exercise Price
|
Number of Shares
|
Expiration
|
|
|
$2.25
|
38,980
|
Fiscal 2015
|
|
76
NOTE J— SEGMENT DATA
The descriptions of the Company’s segments and their summary financial information are presented below.
Energy Management
The Energy Management Division develops, manufactures, integrates and sells commercial HIF and other lighting systems and energy management systems.
Engineered Systems
The Engineered Systems Division sells and integrates alternative renewable energy systems, such as solar and wind systems.
Corporate and Other
Corporate and Other is comprised of operating expenses not directly allocated to the Company’s segments and adjustments to reconcile to consolidated results, which primarily include intercompany eliminations.
|
Revenues
|
Operating (Loss) Profit
|
||||||||||||||||||||||
|
For the year ended March 31,
|
For the year ended March 31,
|
||||||||||||||||||||||
|
(dollars in thousands)
|
2012
|
2013
|
2014
|
2012
|
2013
|
2014
|
|||||||||||||||||
|
Segments:
|
|||||||||||||||||||||||
|
Energy Management
|
$
|
72,097
|
|
$
|
67,437
|
|
$
|
66,793
|
|
$
|
4,974
|
|
$
|
245
|
|
$
|
(1,743
|
)
|
|||||
|
Engineered Systems
|
28,465
|
|
18,649
|
|
21,830
|
|
569
|
|
671
|
|
1,991
|
|
|||||||||||
|
Corporate and Other
|
—
|
|
—
|
|
—
|
|
(5,021
|
)
|
(7,520
|
)
|
(8,591
|
)
|
|||||||||||
|
$
|
100,562
|
|
$
|
86,086
|
|
$
|
88,623
|
|
$
|
522
|
|
$
|
(6,604
|
)
|
$
|
(8,343
|
)
|
||||||
|
|
Depreciation and Amortization
|
Capital Expenditures
|
|||||||||||||||||||||
|
|
For the year ended March 31,
|
For the year ended March 31,
|
|||||||||||||||||||||
|
(dollars in thousands)
|
2012
|
2013
|
2014
|
2012
|
2013
|
2014
|
|||||||||||||||||
|
Segments:
|
|||||||||||||||||||||||
|
Energy Management
|
$
|
1,703
|
|
$
|
1,774
|
|
$
|
2,667
|
|
$
|
1,179
|
|
$
|
993
|
|
$
|
276
|
|
|||||
|
Engineered Systems
|
287
|
|
249
|
|
302
|
|
34
|
|
50
|
|
—
|
|
|||||||||||
|
Corporate and Other
|
2,246
|
|
2,554
|
|
1,569
|
|
3,114
|
|
1,116
|
|
134
|
|
|||||||||||
|
$
|
4,236
|
|
$
|
4,577
|
|
$
|
4,538
|
|
$
|
4,327
|
|
$
|
2,159
|
|
$
|
410
|
|
||||||
|
|
Total Assets
|
Deferred Revenue
|
|||||||||||||
|
(dollars in thousands)
|
March 31, 2013
|
March 31, 2014
|
March 31, 2013
|
March 31, 2014
|
|||||||||||
|
Segments:
|
|||||||||||||||
|
Energy Management
|
$
|
58,627
|
|
$
|
57,118
|
|
$
|
564
|
|
$
|
276
|
|
|||
|
Engineered Systems
|
9,339
|
|
7,742
|
|
3,640
|
|
1,654
|
|
|||||||
|
Corporate and Other
|
34,131
|
|
34,080
|
|
—
|
|
—
|
|
|||||||
|
$
|
102,097
|
|
$
|
98,940
|
|
$
|
4,204
|
|
$
|
1,930
|
|
||||
The Company’s revenue and long-lived assets outside the United States are insignificant.
Beginning in fiscal 2015, the Company intends to reorganize its business into the following business segments: U.S. markets, Orion engineered systems and Orion distribution services. The U.S. markets division will focus on selling lighting solutions into the wholesale markets. Its customers will include domestic energy service companies and electrical contractors. The Orion engineered systems division will focus on selling lighting products and construction and engineering services direct to end users. Additionally, Orion engineered systems will complete the construction management services related to existing contracted solar PV projects. Its customers will include national accounts, government, municipal and schools. The Orion distribution services division will focus on selling lighting products internationally and will begin to develop a network of broad line distributors. Historically, sales of all of the Company's lighting products and the related costs were combined through its energy management division. For this reason, the Company believes that it will be able to recast prior period revenue totals for the new segments, but does not believe that it will be able to practically recast the prior period operating income or loss for these new segments.
77
NOTE K — SUBSEQUENT EVENTS
On May 23, 2014, the Company sold its operating facility in Plymouth, Wisconsin. Net proceeds from the sale were
$1.0 million
, after the payment of agent commissions. The facility was classified as an asset held for sale with a value of
$1.0 million
and was included in the Company's financial statements as prepaid expenses and other current assets.
NOTE L — QUARTERLY FINANCIAL DATA (UNAUDITED)
Summary quarterly results for the years ended
March 31, 2013
and
March 31, 2014
are as follows:
|
|
Three Months Ended
|
|
|||||||||||||||||
|
Jun 30, 2012
|
Sep 30, 2012
|
Dec 31, 2012
|
Mar 31, 2013
|
Total
|
|||||||||||||||
|
|
(in thousands, except per share amounts)
|
||||||||||||||||||
|
Total revenue
|
$
|
15,310
|
|
$
|
19,408
|
|
$
|
29,087
|
|
$
|
22,281
|
|
$
|
86,086
|
|
||||
|
Gross profit
|
$
|
4,373
|
|
$
|
5,805
|
|
$
|
8,581
|
|
$
|
7,971
|
|
$
|
26,730
|
|
||||
|
Net income (loss)
|
$
|
(1,940
|
)
|
$
|
(9,659
|
)
|
$
|
651
|
|
$
|
549
|
|
$
|
(10,399
|
)
|
||||
|
Basic net income per share
|
$
|
(0.09
|
)
|
$
|
(0.46
|
)
|
$
|
0.03
|
|
$
|
0.03
|
|
$
|
(0.50
|
)
|
||||
|
Shares used in basic per share calculation
|
22,561
|
|
21,076
|
|
20,192
|
|
20,157
|
|
20,997
|
|
|||||||||
|
Diluted net income per share
|
$
|
(0.09
|
)
|
$
|
(0.46
|
)
|
$
|
0.03
|
|
$
|
0.03
|
|
$
|
(0.50
|
)
|
||||
|
Shares used in diluted per share calculation
|
22,561
|
|
21,076
|
|
20,245
|
|
20,308
|
|
20,997
|
|
|||||||||
|
|
Three Months Ended
|
|
|||||||||||||||||
|
Jun 30, 2013
|
Sep 30, 2013
|
Dec 31, 2013
|
Mar 31, 2014
|
Total
|
|||||||||||||||
|
|
(in thousands, except per share amounts)
|
||||||||||||||||||
|
Total revenue
|
$
|
20,852
|
|
$
|
27,495
|
|
$
|
27,692
|
|
$
|
12,584
|
|
$
|
88,623
|
|
||||
|
Gross profit
|
$
|
5,723
|
|
$
|
7,829
|
|
$
|
8,150
|
|
$
|
1,278
|
|
$
|
22,980
|
|
||||
|
Net income (loss)
|
$
|
(781
|
)
|
$
|
2,403
|
|
$
|
1,018
|
|
$
|
(8,839
|
)
|
$
|
(6,199
|
)
|
||||
|
Basic net income per share
|
$
|
(0.04
|
)
|
$
|
0.11
|
|
$
|
0.05
|
|
$
|
(0.41
|
)
|
$
|
(0.30
|
)
|
||||
|
Shares used in basic per share calculation
|
20,174
|
|
21,090
|
|
21,220
|
|
21,469
|
|
20,988
|
|
|||||||||
|
Diluted net income per share
|
$
|
(0.04
|
)
|
$
|
0.11
|
|
$
|
0.05
|
|
$
|
(0.41
|
)
|
$
|
(0.30
|
)
|
||||
|
Shares used in diluted per share calculation
|
20,174
|
|
21,542
|
|
22,329
|
|
21,469
|
|
20,988
|
|
|||||||||
The four quarters for net earnings per share may not add to the total year because of differences in the weighted average number of shares outstanding during the quarters and the year.
|
ITEM 9.
|
CHANGES IN AND DISAGREEMENTS WITH ACCOUNTANTS ON ACCOUNTING AND FINANCIAL DISCLOSURE
|
None.
78
|
ITEM 9A.
|
CONTROLS AND PROCEDURES
|
Evaluation of Disclosure Controls and Procedures
We maintain disclosure controls and procedures that are designed to ensure that information required to be disclosed in the reports that we file or submit under the Securities Exchange Act of 1934, or Exchange Act, is recorded, processed, summarized and reported within the time periods specified in the SEC’s rules and forms, and that such information is accumulated and communicated to our management, including our principal executive and principal financial officers, as appropriate, to allow timely decisions regarding required disclosure.
Our management evaluated, with the participation of our Chief Executive Officer and our Chief Financial Officer, the effectiveness of our disclosure controls and procedures and our internal control over financial reporting as of
March 31, 2014
, pursuant to Exchange Act Rule 13a-15 and 15d-15. Based upon such evaluation, our Chief Executive Officer along with our Chief Financial Officer concluded that our disclosure controls and procedures were effective as of
March 31, 2014
.
This evaluation did not include an assessment of the controls related to Harris, which was acquired on July 1, 2013. Harris represented 11% of our consolidated total assets as of March 31, 2014, and 11% of our consolidated net sales for the year ended March 31, 2014.
Management’s Report on Internal Control Over Financial Reporting
Our management is responsible for establishing and maintaining adequate internal control over financial reporting. Internal control over financial reporting is defined in Rule 13a-15(f) and 15d-15(f) under the Exchange Act as a process designed by, or under the supervision of, our principal executive and principal financial officers and effected by our board of directors, management and other personnel, to provide reasonable assurance regarding the reliability of financial reporting and the preparation of financial statements for external purposes in accordance with generally accepted accounting principles, and includes those policies and procedures that:
• pertain to the maintenance of records that in reasonable detail accurately and fairly reflect the transactions and dispositions of our assets;
• provide reasonable assurance that transactions are recorded as necessary to permit preparation of financial statements in accordance with generally accepted accounting principles, and that our receipts and expenditures are being made only in accordance with authorization of our management and directors: and
• provide reasonable assurance regarding prevention or timely detection of unauthorized acquisition, use or disposition of our assets that could have a material effect on the financial statements.
Because of its inherent limitations, internal control over financial reporting may not prevent or detect misstatements. Projections of any evaluation of effectiveness to future periods are subject to the risk that controls may become inadequate because of changes in conditions, or that the degree of compliance with the policies and procedures may deteriorate.
Our management assessed the effectiveness of our internal control over financial reporting as of
March 31, 2014
. In making this assessment, management used the criteria set forth in 1992 by the Internal Control—Integrated Framework issued by the Committee of Sponsoring Organizations of the Treadway Commission (the COSO criteria).
Based on this assessment using the COSO criteria, management believes that, as of
March 31, 2014
, our internal control over financial reporting was effective.
BDO USA, LLP, independent registered public accounting firm has audited our consolidated financial statements for the fiscal years ended March 31,
2012
,
2013
and
2014
, and our internal control over financial reporting as of
March 31, 2014
. Their reports appear in Item 8 under the heading “Reports of Independent Registered Public Accounting Firm” of this Annual Report on Form 10-K.
Changes in Internal Controls Over Financial Reporting
There were no changes in our internal control over financial reporting (as defined in Rules 13a-15(f) and 15d-15(f) under the Exchange Act) that occurred during the quarter ended
March 31, 2014
, that have materially affected or are reasonably likely to materially affect, our internal control over financial reporting.
|
ITEM 9B.
|
OTHER INFORMATION
|
None.
79
|
ITEM 10.
|
DIRECTORS, EXECUTIVE OFFICERS AND CORPORATE GOVERNANCE
|
The information required by this item with respect to directors, executive officers and corporate governance is incorporated by reference to the Company's Proxy Statement for its
2014
Annual Meeting of Shareholders to be filed with the SEC within 120 days after the end of the fiscal year ended
March 31, 2014
.
Code of Conduct
We have adopted a Code of Conduct that applies to all of our directors, employees and officers, including our principal executive officer, our principal financial officer, our controller and persons performing similar functions. Our Code of Conduct is available on our web site at www.oesx.com. Future material amendments or waivers relating to the Code of Conduct will be disclosed on our web site referenced in this paragraph within four business days following the date of such amendment or waiver.
|
ITEM 11.
|
EXECUTIVE COMPENSATION
|
The information required by this item is incorporated by reference to the Company's Proxy Statement for its
2014
Annual Meeting of Shareholders to be filed with the SEC within 120 days after the end of the fiscal year ended
March 31, 2014
.
|
ITEM 12.
|
SECURITY OWNERSHIP OF CERTAIN BENEFICIAL OWNERS AND MANAGEMENT AND RELATED SHAREHOLDER MATTERS
|
The information required by this item is incorporated by reference to the Company's Proxy Statement for its
2014
Annual Meeting of Shareholders to be filed with the SEC within 120 days after the end of the fiscal year ended
March 31, 2014
.
The information required by this item is incorporated by reference to the Company's Proxy Statement for its
2014
Annual Meeting of Shareholders to be filed with the SEC within 120 days after the end of the fiscal year ended
March 31, 2014
.
The information required by this item is incorporated by reference to the Company's Proxy Statement for its
2014
Annual Meeting of Shareholders to be filed with the SEC within 120 days after the end of the fiscal year ended
March 31, 2014
.
|
(a)
|
Financial Statements
|
Our financial statements are set forth in Item 8 of this Form 10-K.
|
(b)
|
Financial Statement Schedule
|
|
SCHEDULE II
VALUATION and QUALIFYING ACCOUNTS
|
||||||||||||||||
|
|
|
Balance at
beginning of
period
|
Provisions
charged to
expense
|
Write offs
and other
|
Balance at
end of
period
|
|||||||||||
|
March 31,
|
|
(in Thousands)
|
||||||||||||||
|
2012
|
Allowance for Doubtful Accounts
|
$
|
757
|
|
$
|
566
|
|
$
|
376
|
|
$
|
947
|
|
|||
|
2013
|
Allowance for Doubtful Accounts
|
947
|
|
757
|
|
804
|
|
900
|
|
|||||||
|
2014
|
Allowance for Doubtful Accounts
|
$
|
900
|
|
$
|
174
|
|
$
|
690
|
|
$
|
384
|
|
|||
|
2012
|
Inventory Obsolescence Reserve
|
$
|
1,338
|
|
$
|
167
|
|
$
|
5
|
|
$
|
1,500
|
|
|||
|
2013
|
Inventory Obsolescence Reserve
|
1,500
|
|
859
|
|
58
|
|
2,301
|
|
|||||||
|
2014
|
Inventory Obsolescence Reserve
|
$
|
2,301
|
|
$
|
1,995
|
|
$
|
1,769
|
|
$
|
2,527
|
|
|||
80
EXHIBIT INDEX
|
Number
|
Exhibit Title
|
||
|
2.1
|
|
Stock and Unit Purchase Agreement dated May 22, 2013 between Orion Energy Systems, Inc., Harris Manufacturing, Inc., Harris LED, LLC, and their respective shareholders and members filed as Exhibit 2.1 to the Registrant’s Form 8-K filed on July 2, 2013, is hereby incorporated by reference.
|
|
|
2.1(a)
|
|
Letter Agreement with respect to Stock and Unit Purchase Agreement dated May 22, 2013 between Orion Energy Systems, Inc., Harris Manufacturing, Inc., Harris LED, LLC their respective shareholders and members filed as Exhibit 2.1 to the Registrant’s Form 10-Q filed on November 8, 2013, is hereby incorporated by reference.
|
|
|
3.1
|
|
Amended and Restated Articles of Incorporation of Orion Energy Systems, Inc., filed as Exhibit 3.3 to the Registrant’s Form S-1 filed August 20, 2007, is hereby incorporated by reference.
|
|
|
3.2
|
|
Amended and Restated Bylaws of Orion Energy Systems, Inc., filed as Exhibit 3.2 to the Registrant’s Form 10-Q filed November 8, 2013, is hereby incorporated by reference.
|
|
|
4.1
|
|
Rights Agreement, dated as of January 7, 2009, between Orion Energy Systems, Inc. and Wells Fargo Bank, N.A., which includes as Exhibit A thereto the Form of Right Certificate and as Exhibit B thereto the Summary of Common Share Purchase Rights, filed as Exhibit 4.1 to the Registrant’s Form 8-A filed January 8, 2009, is hereby incorporated by reference.
|
|
|
10.1
|
|
Credit Agreement, dated June 30, 2010, by and among Orion Energy Systems, Inc., Orion Asset Management LLC, Clean Energy Solutions, LLC and JP Morgan Chase Bank, N.A., filed as Exhibit 10.1 to the Registrant’s Current Report on Form 8-K filed July 2, 2010, is hereby incorporated by reference.
|
|
|
10.1(a)
|
|
First Amendment to Credit Agreement dated September 30, 2011 by and among Orion Energy Systems, Inc., Orion Asset Management LLC, Clean Energy Solutions, LLC and JP Morgan Chase Bank, N.A., filed as Exhibit 10.2 to the Registrant’s Current Report on Form 8-K filed October 5, 2011, is hereby incorporated by reference.
|
|
|
10.1(b)
|
|
Second Amendment to Credit Agreement, dated June 25, 2012, by and among Orion Energy Systems, Inc., Orion Asset Management, LLC, Clean Energy Solutions, LLC, Great Lakes Energy Technologies, LLC and JPMorgan Chase Bank, N.A., filed as Exhibit 10.1 to the Registrant's Current Report on Form 8-K filed June 26, 2012, is hereby incorporated by reference.
|
|
|
10.1(c)
|
|
Third Amendment to Credit Agreement, dated February 5, 2013, by and among Orion Energy Systems, Inc., Orion Asset Management, LLC, Clean Energy Solutions, LLC, Great Lakes Energy Technologies, LLC and JPMorgan Chase Bank, N.A., filed as Exhibit 10.1 to the Registrant's Current Report on Form 10-Q filed February 8, 2013, is hereby incorporated by reference.
|
|
|
10.1(d)
|
|
Fourth Amendment to Credit Agreement, dated June 28, 2013, by and among Orion Energy Systems, Inc., Orion Asset Management, LLC, Clean Energy Solutions, LLC, Great Lakes Energy Technologies, LLC and JPMorgan Chase Bank, N.A. filed as Exhibit 10.1 to the Registrant’s Form 8-K filed on July 2, 2013, is hereby incorporated by reference.
|
|
|
10.1(e)
|
|
Joinder and Fifth Amendment to Credit Agreement, dated August 30, 2013, by and among Orion Energy Systems, Inc., Orion Asset Management, LLC, Clean Energy Solutions, LLC, Great Lakes Energy Technologies, LLC, Harris Manufacturing, Inc., Harris LED, LLC, and JPMorgan Chase Bank, N.A. filed as Exhibit 10.1 to the Registrant’s Form 8-K filed on September 9, 2013, is hereby incorporated by reference.
|
|
|
10.2
|
|
Credit Agreement, dated September 30, 2011, by and among Orion Energy Systems, Inc., Orion Asset Management LLC, Clean Energy Solutions, LLC and JP Morgan Chase Bank, N.A., filed as Exhibit 10.1 to the Registrant’s Current Report on Form 8-K filed October 5, 2011, is hereby incorporated by reference.
|
|
|
10.2(a)
|
|
First Amendment to Credit Agreement, dated February 5, 2013, by and among Orion Asset Management, LLC, Orion Energy Systems, Inc., Clean Energy Solutions, LLC, Great Lakes Energy Technologies, LLC and JP Morgan Chase Bank, N.A., filed as Exhibit 10.2 to the Registrant's Current Report on Form 10-Q filed February 8, 2013, is hereby incorporated by reference.
|
|
|
10.2(b)
|
|
Joinder and Second Amendment to Credit Agreement, dated August 30, 2013, by and among Orion Energy Systems, Inc., Orion Asset Management, LLC, Clean Energy Solutions, LLC, Great Lakes Energy Technologies, LLC, Harris Manufacturing, Inc., Harris LED, LLC, and JPMorgan Chase Bank, N.A. filed as Exhibit 10.2 to the Registrant’s Form 8-K filed on September 9, 2013, is hereby incorporated by reference.
|
|
|
10.3
|
|
Orion Energy Systems, Inc. 2003 Stock Option Plan, as amended, filed as Exhibit 10.6 to the Registrant’s Form S-1 filed August 20, 2007, is hereby incorporated by reference.*
|
|
|
10.4
|
|
Form of Stock Option Agreement under the Orion Energy Systems, Inc. 2003 Stock Option Plan, filed as Exhibit 10.7 to the Registrant’s Form S-1 filed August 20, 2007, is hereby incorporated by reference.*
|
|
81
|
10.5
|
|
Orion Energy Systems, Inc. 2004 Stock and Incentive Awards Plan, filed as Exhibit 10.9 to the Registrant’s Form S-1 filed August 20, 2007, is hereby incorporated by reference.*
|
|
|
10.5(a)
|
|
Amendment to Orion Energy Systems, Inc. 2004 Stock and Incentive Awards Plan, filed September 9, 2011 as Appendix A to the Registrant’s definitive proxy statement is hereby incorporated by reference.*
|
|
|
10.6
|
|
Form of Stock Option Agreement under the Orion Energy Systems, Inc. 2004 Equity Incentive Plan, filed as Exhibit 10.10 to the Registrant’s Form S-1 filed August 20, 2007, is hereby incorporated by reference.*
|
|
|
10.7
|
|
Form of Stock Option Agreement as of May 14, 2013 under the Orion Energy Systems, Inc. 2004 Stock and Incentive Awards Plan, filed as Exhibit 10.7 to the Registrant’s Form 10-K filed on June 14, 2014, is hereby incorporated by reference.*
|
|
|
10.8
|
|
Form of Restricted Stock Award Agreement as of May 14, 2013 under the Orion Energy Systems, Inc. 2004 Stock and Incentive Awards Plan, filed as Exhibit 10.8 to the Registrant’s Form 10-K filed on June 14, 2014, is hereby incorporated by reference.*
|
|
|
10.9
|
|
Summary of Non-Employee Director Compensation for fiscal 2015.*
+
|
|
|
10.10
|
|
Executive Employment and Severance Agreement, dated February 21, 2008, by and between Orion Energy Systems, Inc. and Michael J. Potts, filed as Exhibit 10.2 to the Registrant’s Form 8-K filed February 22, 2008, is hereby incorporated by reference.*
|
|
|
10.11
|
|
Executive Employment and Severance Agreement, dated as of September 27, 2012, by and between Orion Energy Systems, Inc. and John H. Scribante, filed as Exhibit 10.10 to the Registrant's Form 8-K filed September 28, 2012, is hereby incorporated by reference.*
|
|
|
10.12
|
|
Executive Employment and Severance Agreement, effective November 9, 2012 between the Company and Scott R. Jensen, filed as Exhibit 10.13 to the Registrant's Form 10-Q filed November 9, 2012, is hereby incorporated by reference.*
|
|
|
10.13
|
|
Letter Agreement effective December 1, 2012 between the Company and John H. Scribante, filed as Exhibit 10.15 to the Company's Form 8-K filed on December 6, 2012, is hereby incorporated by reference.*
|
|
|
10.14
|
|
Letter Agreement effective December 1, 2012 between the Company and Michael J. Potts, filed as Exhibit 10.16 to the Company's Form 8-K filed on December 6, 2012, is hereby incorporated by reference.*
|
|
|
10.15
|
|
Letter Agreement effective December 1, 2012 between the Company and Scott R. Jensen, filed as Exhibit 10.17 to the Company's Form 8-K filed on December 6, 2012, is hereby incorporated by reference.*
|
|
|
10.16
|
|
Executive Employment and Severance Agreement, dated as of January 1, 2014, by and between Orion Energy Systems, Inc. and Marc Meade filed as Exhibit 10.1 to the Registrant’s Form 8-K filed on January 6, 2014, is hereby incorporated by reference.*
|
|
|
10.17
|
|
Form of Executive Restricted Stock Award Agreement as of May 14, 2014 under the Orion Energy Systems, Inc. 2004 Stock and Inventive Awards Plan.*+
|
|
|
10.18
|
|
Form of Non-Employee Director Restricted Stock Award Agreement as of May 14, 2014 under the Orion Energy Systems, Inc. 2004 Stock and Inventive Awards Plan.*+
|
|
|
21.1
|
|
Subsidiaries of Orion Energy Systems, Inc.+
|
|
|
23.1
|
|
Consent of Independent Registered Public Accounting Firm. +
|
|
|
31.1
|
|
Certification of Chief Executive Officer of Orion Energy Systems, Inc. pursuant to Rule 13a-14(a) or Rule 15d-14(a) promulgated under the Securities Exchange Act of 1934, as amended. +
|
|
|
31.2
|
|
Certification of Chief Financial Officer of Orion Energy Systems, Inc. pursuant to Rule 13a-14(a) or Rule 15d-14(a) promulgated under the Securities Exchange Act of 1934, as amended. +
|
|
|
32.1
|
|
Certification of Chief Executive Officer and Chief Financial Officer of Orion Energy Systems, Inc. pursuant to Rule 13a-14(b) promulgated under the Securities Exchange Act of 1934, as amended, and 18 U.S.C. Section 1350, as adopted pursuant to Section 906 of the Sarbanes-Oxley Act of 2002. +
|
|
|
101
|
|
101.INS XBRL Instance Document+
|
|
|
101.SCH Taxonomy extension schema document
|
|||
|
101.CAL Taxonomy extension calculation linkbase document
|
|||
|
101.LAB Taxonomy extension label linkbase document
|
|||
|
101.PRE Taxonomy extension presentation linkbase document
|
|||
82
|
Documents incorporated by reference by Orion Energy Systems, Inc. are filed with the Securities and Exchange Commission under File No. 001-33887.
|
||||
|
*
|
Management contract or compensatory plan or arrangement required to be filed (and/or incorporated by reference) as an exhibit to this Annual Report on Form 10-K pursuant to Item 15(a)(3) of Form 10-K.
|
|
+
|
Filed herewith
|
83
SIGNATURES
Pursuant to the requirements of Section 13 or 15(d) of the Securities Exchange Act of 1934, the Registrant has duly caused this Annual Report on Form 10-K to be signed on its behalf by the undersigned, thereunto duly authorized, on June 13, 2014.
|
ORION ENERGY SYSTEMS, INC.
|
||
|
By:
|
/s/ JOHN H. SCRIBANTE
|
|
|
John H. Scribante
Chief Executive Officer
|
||
Pursuant to the requirements of the Securities Exchange Act of 1934, this Annual Report on Form 10-K has been signed by the following persons on behalf of the Registrant in the capacities indicated on June 13, 2014.
|
Signature
|
|
Title
|
|
/s/ John H. Scribante
|
|
Chief Executive Officer and Director (Principal
|
|
John H. Scribante
|
|
Executive Officer)
|
|
/s/ Scott R. Jensen
|
|
Chief Financial Officer, Chief Accounting Officer and
|
|
Scott R. Jensen
|
|
Treasurer (Principal Financial Officer)
|
|
/s/ James R. Kackley
|
|
Chairman of the Board
|
|
James R. Kackley
|
|
|
|
/s/ Michael W. Altschaefl
|
|
Director
|
|
Michael W. Altschaefl
|
|
|
|
/s/ Kenneth L. Goodson, Jr.
|
Director
|
|
|
Kenneth L. Goodson, Jr.
|
||
|
/s/ James D. Leslie
|
Director
|
|
|
James D. Leslie
|
||
|
/s/ Elizabeth Gamsky Rich
|
|
Director
|
|
Elizabeth Gamsky Rich
|
|
|
|
/s/ Thomas N. Schueller
|
|
Director
|
|
Thomas N. Schueller
|
|
|
|
/s/ Mark C. Williamson
|
|
Director
|
|
Mark C. Williamson
|
|
|
84
TABLE OF CONTENTS
Item 1. BusinessItem 1A. Risk FactorsItem 1B. Unresolved Staff CommentsItem 2. PropertiesItem 3. Legal ProceedingsItem 4. Mine Safety DisclosuresItem 5. Market For Registrant S Common Equity, Related Shareholder Matters and Issuer Purchases Of Equity SecuritiesItem 6. Selected Financial DataItem 7. Management S Discussion and Analysis Of Financial Condition and Results Of OperationsItem 7A Quantitative and Qualitative Disclosure About Market RiskItem 8. Index To Consolidated Financial StatementsItem 9. Changes in and Disagreements with Accountants on Accounting and Financial DisclosureItem 9A. Controls and ProceduresItem 9B. Other InformationPart IIIItem 10. Directors, Executive Officers and Corporate GovernanceItem 11. Executive CompensationItem 12. Security Ownership Of Certain Beneficial Owners and Management and Related Shareholder MattersItem 13. Certain Relationships and Related Transactions and Director IndependenceItem 14. Principal Accountant Fees and ServicesPart IVItem 15. Exhibits and Financial Statement Schedules