OIL STATES INTERNATIONAL, INC
10-Ks and 10-Qs
|
|
|
|
|
|
|
|
|
|
|
|
|
|
|
|
|
|
|
|
|
|
|
|
|
|
|
|
|
|
|
|
|
|
|
|
|
|
|
|
|
|
|
|
|
|
|
|
|
|
|
|
|
|
|
|
UNITED STATES
SECURITIES AND EXCHANGE COMMISSION
Washington, D.C. 20549
Form 10-K
/x/ ANNUAL REPORT PURSUANT TO SECTION 13 OR 15(d) OF
THE SECURITIES EXCHANGE ACT OF 1934
For the fiscal year ended December 31, 2012
or
/ / TRANSITION REPORT PURSUANT TO SECTION 13 OR 15(d) OF
THE SECURITIES EXCHANGE ACT OF 1934
For the transition period from ______ to ________
Commission file no. 001-16337
Oil States International, Inc.
(Exact name of registrant as specified in its charter)
|
Delaware
|
76-0476605
|
|
(State or other jurisdiction of
|
(I.R.S. Employer
|
|
incorporation or organization)
|
Identification No.)
|
Three Allen Center, 333 Clay Street, Suite 4620, Houston, Texas 77002
(Address of principal executive offices) (Zip Code)
Registrant's telephone number, including area code:
(713) 652-0582
Securities registered pursuant to Section 12(b) of the Act:
|
Title of Each Class
|
Name of Exchange on Which Registered
|
|
Common Stock, par value $.01 per share
|
New York Stock Exchange
|
Securities registered pursuant to Section 12(g) of the Act:
None
Indicate by check mark if the registrant is a well-known seasoned issuer, as defined in Rule 405 of the Securities Act. Yes [X] No [ ]
Indicate by check mark if the registrant is not required to file reports pursuant to Section 13 or Section 15(d) of the Act. Yes [ ] No [X]
Indicate by check mark whether the registrant (1) has filed all reports required to be filed by Section 13 or 15(d) of the Securities Exchange Act of 1934 during the preceding 12 months (or for such shorter period that the registrant was required to file such reports), and (2) has been subject to such filing requirements for the past 90 days. Yes [X] No [ ]
- 1 -
Indicate by check mark whether the registrant has submitted electronically and posted on its corporate Website, if any, every Interactive Data File required to be submitted and posted pursuant to Rule 405 of Regulation S-T (§232.405 of this chapter) during the preceding 12 months (or for such shorter period that the registrant was required to submit and post such files.) YES [X ] NO [ ]
Indicate by check mark if disclosure of delinquent filers pursuant to Item 405 of Regulation S-K (§229.405 of this chapter) is not contained herein, and will not be contained, to the best of registrant's knowledge, in definitive proxy or information statements incorporated by reference in Part III of this Form 10-K or any amendment to this form 10-K. [X]
Indicate by check mark whether the registrant is a large accelerated filer, an accelerated filer, a non-accelerated filer, or a smaller reporting company. See the definitions of "large accelerated filer," "accelerated filer" and "smaller reporting company" in Rule 12b-2 of the Exchange Act.
| Large accelerated filer [X] | Accelerated filer [ ] |
| Non-accelerated filer [ ] (Do not check if a smaller reporting company) | Smaller reporting company [ ] |
Indicate by check mark whether the Registrant is a shell company (as defined in Rule 12b-2 of the Act). Yes [ ] No [X]
The aggregate market value of common stock held by non-affiliates computed by reference to the price at which the common equity was last sold, or the average bid and asked price of such common equity, as of the last business day of the registrant’s most recently completed second fiscal quarter, June 29, 2012, was $3,341,802,313.
The number of shares of the registrant’s common stock, par value $0.01 per share, outstanding as of February 19, 2013 was 54,873,460 shares.
DOCUMENTS INCORPORATED BY REFERENCE
Portions of the registrant's Definitive Proxy Statement for the 2013 Annual Meeting of Stockholders, which the registrant intends to file with the Securities and Exchange Commission not later than 120 days after the end of the fiscal year covered by this Annual Report on Form 10-K, are incorporated by reference into Part III of this Annual Report on Form 10-K.
- 2 -
TABLE OF CONTENTS
|
PART I
|
Page
|
||
|
Cautionary Statement Regarding Forward-Looking Statements
|
4
|
||
|
Item 1.
|
Business
|
5 – 22
|
|
|
Item 1A.
|
Risk Factors
|
22 – 37
|
|
|
Item 1B.
|
Unresolved Staff Comments
|
37
|
|
|
Item 2.
|
Properties
|
38 – 39
|
|
|
Item 3.
|
Legal Proceedings
|
39
|
|
|
Item 4.
|
Mine Safety Disclosures
|
39
|
|
|
PART II
|
|||
|
Item 5.
|
Market for Registrant's Common Equity, Related Stockholder Matters and Issuer Purchases of Equity Securities
|
39 – 42
|
|
|
Item 6.
|
Selected Financial Data
|
43 – 44
|
|
|
Item 7.
|
Management's Discussion and Analysis of Financial Condition and Results of Operations
|
44 – 62
|
|
|
Item 7A.
|
Quantitative and Qualitative Disclosures About Market Risk
|
63
|
|
|
Item 8.
|
Financial Statements and Supplementary Data
|
63
|
|
|
Item 9.
|
Changes in and Disagreements With Accountants on Accounting and Financial Disclosure
|
63
|
|
|
Item 9A.
|
Controls and Procedures
|
63 – 64
|
|
|
Item 9B.
|
Other Information
|
65
|
|
|
PART III
|
|||
|
Item 10.
|
Directors, Executive Officers and Corporate Governance
|
65
|
|
|
Item 11.
|
Executive Compensation
|
65
|
|
|
Item 12.
|
Security Ownership of Certain Beneficial Owners and Management and Related Stockholder Matters
|
65
|
|
|
Item 13.
|
Certain Relationships and Related Transactions, and Director Independence
|
65
|
|
|
Item 14.
|
Principal Accounting Fees and Services
|
65
|
|
|
PART IV
|
|||
|
Item 15.
|
Exhibits, Financial Statement Schedules
|
65 – 70
|
|
|
SIGNATURES
|
71
|
||
|
INDEX TO CONSOLIDATED FINANCIAL STATEMENTS
|
72
|
||
- 3 -
This Annual Report on Form 10-K contains certain “forward-looking statements” within the meaning of Section 27A of the Securities Act of 1933(the Securities Act) and Section 21E of the Securities Exchange Act of 1934 (the Exchange Act). Actual results could differ materially from those projected in the forward-looking statements as a result of a number of important factors. For a discussion of known material factors that could affect our results, please refer to “Part I, Item 1. Business,” “Part I, Item 1A. Risk Factors,” “Part II, Item 7. Management's Discussion and Analysis of Financial Condition and Results of Operations” and “Part II, Item 7A. Quantitative and Qualitative Disclosures about Market Risk” below.
Cautionary Statement Regarding Forward-Looking Statements
We include the following cautionary statement to take advantage of the "safe harbor" provisions of the Private Securities Litigation Reform Act of 1995 for any "forward-looking statement" made by us, or on our behalf. The factors identified in this cautionary statement are important factors (but not necessarily all of the important factors) that could cause actual results to differ materially from those expressed in any forward-looking statement made by us, or on our behalf. You can typically identify "forward-looking statements" by the use of forward-looking words such as "may," "will," "could," "project," "believe," "anticipate," "expect," "estimate," "potential," "plan," "forecast," “proposed,” “should,” “seek,” and other similar words. All statements other than statements of historical facts contained in this Annual Report on Form 10-K, including statements regarding our future financial position, budgets, capital expenditures, projected costs, plans and objectives of management for future operations and possible future strategic transactions, are forward-looking statements. Where any such forward-looking statement includes a statement of the assumptions or bases underlying such forward-looking statement, we caution that, while we believe such assumptions or bases to be reasonable and make them in good faith, assumed facts or bases almost always vary from actual results. The differences between assumed facts or bases and actual results can be material, depending upon the circumstances.
In any forward-looking statement where we or our management express an expectation or belief as to the future results, such expectation or belief is expressed in good faith and believed to have a reasonable basis. However, there can be no assurance that the statement of expectation or belief will result or be achieved or accomplished. Taking this into account, the following are identified as important factors that could cause actual results to differ materially from those expressed in any forward-looking statement made by, or on behalf of, our company;
|
|
·
|
the level of demand for and supply of oil and natural gas;
|
|
|
·
|
fluctuations in the current and future prices of oil and natural gas;
|
|
|
·
|
the level of activity and developments in the Canadian oil sands;
|
|
|
·
|
the level of drilling and completion activity;
|
|
|
·
|
the level of mining activity in Australia and demand for coal from Australian exports;
|
|
|
·
|
the level of offshore oil and natural gas developmental activities;
|
|
|
·
|
general economic conditions and the pace of recovery from the recent recession;
|
|
|
·
|
our ability to find and retain skilled personnel;
|
|
|
·
|
the availability and cost of capital; and
|
|
|
·
|
the other factors identified in “Part I, 1A. "Risks Factors."
|
These factors are not necessarily all of the important factors that could cause actual results to differ materially from those expressed in any of our forward-looking statements. Readers are cautioned not to place undue reliance on forward-looking statements, which speak only as of the date hereof. We undertake no responsibility to publicly release the result of any revision of our forward-looking statements after the date they are made.
- 4 -
Our Company
Oil States International, Inc. (the Company or Oil States), through its subsidiaries, is a leading provider of specialty products and services to natural resources companies throughout the world. We operate in a substantial number of the world's active oil, natural gas and coal producing regions, including Canada, onshore and offshore U.S., Australia, West Africa, the North Sea, South America and Southeast and Central Asia. Our customers include many national oil companies, major and independent oil and natural gas companies, onshore and offshore drilling companies, other oilfield service companies and mining companies. We operate in four principal business segments – accommodations, offshore products, well site services and tubular services – and have established a leadership position in certain of our product or service offerings in each segment. In this Annual Report on Form 10-K, references to the "Company" or “Oil States” or to "we," "us," "our," and similar terms are to Oil States International, Inc. and its subsidiaries.
Available Information
The Company maintains a website with the address www.oilstatesintl.com. The Company is not including the information contained on the Company's website as a part of, or incorporating it by reference into, this Annual Report on Form 10-K. The Company makes available free of charge through its website its Annual Report on Form 10-K, quarterly reports on Form 10-Q and current reports on Form 8-K, and amendments to these reports, as soon as reasonably practicable after the Company electronically files such material with, or furnishes such material to, the Securities and Exchange Commission (the Commission). The filings are also available through the Commission at the Commission's Public Reference Room at 100 F Street, N.E., Washington, D.C. 20549 or by calling 1-800-SEC-0330. Also, these filings are available on the internet at http://www.sec.gov. The Board of Directors of the Company (the Board) documented its governance practices by adopting several corporate governance policies. These governance policies, including the Company's Corporate Governance Guidelines, Code of Business Conduct and Ethics and Financial Code of Ethics for Senior Officers, as well as the charters for the committees of the Board (Audit Committee, Compensation Committee and Nominating and Corporate Governance Committee) may also be viewed at the Company's website. The financial code of ethics applies to our principal executive officer, principal financial officer, principal accounting officer and other senior officers. Copies of such documents will be sent to shareholders free of charge upon written request to the corporate secretary at the address shown on the cover page of this Annual Report on Form 10-K.
Our Business Strategy
We have in past years grown our business lines both organically through capital spending and through strategic acquisitions. Our investments are focused in growth areas and on areas where we expect we can expand market share and where we believe we can achieve an attractive return on our investment. Currently, we see investment opportunities in the oil sands developments in Canada, in shale play regions in North America, in the natural resources market in Australia and in the expansion of our capabilities to manufacture and assemble deepwater capital equipment on a global basis. As part of our long-term growth strategy, we continue to review complementary acquisitions as well as make organic capital expenditures to enhance our cash flows and increase our shareholders’ returns. For additional discussion of our business strategy, please read Part II, Item 7, “Management’s Discussion and Analysis of Financial Condition and Results of Operations.”
Capital Spending and Acquisitions
Capital spending over the last five years totaled approximately $1.5 billion and has included both growth and maintenance capital expenditures in each of our businesses. Capital spending totaled $1.2 billion over the period 2010 to 2012, 67% of which was spent in our accommodations segment.
- 5 -
In addition to capital spending, we have spent $810 million over the period 2010 to 2012 for acquisitions of businesses. Acquisitions of other oilfield service and accommodations businesses have been an important aspect of our growth strategy and plan to increase shareholder value. Our acquisition strategy has allowed us to leverage our existing and acquired products and services into new geographic locations, and has expanded our technology and product offerings. We have made strategic acquisitions in each of our business segments.
On December 14, 2012, we acquired all of the equity of Tempress Technologies, Inc. (Tempress) for purchase price consideration of $48.3 million consisting of $32.5 million in cash and contingent consideration with a fair value of $15.8 million. The Company funded escrow accounts totaling $25.3 million related to the contingent consideration and seller transaction indemnities which are classified as “Other noncurrent assets” in our December 31, 2012 Consolidated Balance Sheet. Liabilities for contingent consideration and escrowed amounts potentially due to the seller total $21.1 million at December 31, 2012 and are classified as “Other noncurrent liabilities” in our Consolidated Balance Sheet. Headquartered in Kent, Washington, Tempress designs, develops and markets a suite of highly specialized, hydraulically-activated tools utilized during downhole completion activities. The operations of Tempress have been included in our well site services segment since the acquisition date.
On July 2, 2012, we acquired all of the operating assets of Piper Valve Systems, Ltd (Piper) for total cash consideration of $48.0 million. Headquartered in Oklahoma City, Oklahoma, Piper designs and manufactures high pressure valves and manifold components for oil and gas industry projects offshore (surface and subsea) and onshore. The operations of Piper have been included in our offshore products segment since the acquisition date.
On November 1, 2011, we purchased an open camp accommodations facility located in Carrizo Springs, Texas for total consideration of $2.2 million. This facility provides accommodations support to customers working in the Eagle Ford Shale basin. The operations of the Carrizo Springs facility have been included in our accommodations segment since the acquisition date.
On December 30, 2010, we acquired all of the ordinary shares of The MAC Services Group Limited (The MAC), through a Scheme of Arrangement (the Scheme) under the Corporations Act of Australia. The MAC is headquartered in Sydney, Australia and supplies accommodations services to the Australian natural resources market. Under the terms of the Scheme, each shareholder of The MAC received $3.95 (A$3.90) per share in cash. The total purchase price was $638 million, net of cash acquired plus debt assumed of $87 million. The MAC’s operations have been included in our accommodations segment beginning in 2011.
On December 20, 2010, we acquired all of the operating assets of Mountain West Oilfield Service and Supplies, Inc. and Ufford Leasing LLC (Mountain West) for total consideration of $47.1 million including estimated contingent consideration of $4.0 million. Headquartered in Vernal, Utah, with operations in the Rockies and the Bakken Shale region, Mountain West provides remote site workforce accommodations to the oil and gas industry. Mountain West has been included in our accommodations segment since the acquisition date.
On October 5, 2010, we purchased all of the equity of Acute Technological Services, Inc. (Acute) for total consideration of $30.2 million. Headquartered in Houston, Texas with additional operations in Brazil, Acute provides metallurgical and welding engineering, consulting and services to the oil and gas industry in support of critical, complex subsea component manufacturing and deepwater riser fabrication on a global basis. Acute has been included in our offshore products segment since the acquisition date
The Company funded all of its acquisitions with cash on hand and/or amounts available under our senior secured credit facilities. See Note 8 to the Consolidated Financial Statements included in this Annual Report on Form 10-K for additional information on our senior secured bank facilities.
Our Industry
We principally operate in the oilfield services industry and provide a broad range of products and services to our customers through each of our business segments. In our accommodations segment, we also support the mining industry in Australia. See Note 15 to the Consolidated Financial Statements included in “Part II, Item 8., Financial Statements” for financial information by segment and a geographical breakout of revenues and long-lived assets for each of the three years ended December 31, 2012, 2011 and 2010. Demand for our products and services is cyclical and substantially dependent upon activity levels in the oil and gas and mining industries, particularly our customers' willingness to spend capital on the exploration for and development of oil, natural gas, coal and mineral reserves. Our customers’ spending plans are generally based on their outlook for near-term and long-term commodity prices. As a result, the demand for our products and services is highly sensitive to current and expected commodity prices.
- 6 -
Our historical financial results reflect the cyclical nature of the oilfield services business. Since 2001, there have been periods of increasing and decreasing activity in each of our operating segments. Due to the acquisition of The MAC, beginning in 2011, our results are also influenced by the level of activity in the natural resource market in Australia. For additional information about activities in each of our segments, please see “Part II, Item 7., Management’s Discussion and Analysis of Financial Condition and Results of Operations.”
Our accommodations business segment is significantly influenced by the level of development of oil sands deposits in Alberta, Canada, activity levels in support of oil and gas development in Canada and the United States and in natural resource markets, primarily in Australia. Despite the general economic downturn in 2009 and early 2010 resulting from the global financial crisis, activity in our accommodations business has grown significantly in the last six years.
The positive outlook for long-term oil demand, along with improvements in oil prices over the last two years have resulted in increased bidding and quoting activity for our offshore products since the latter part of 2010. As a result of this increased activity, backlog in our offshore products segment increased from $354 million at December 31, 2010 to $535 million as of December 31, 2011, and to a year-end record of $561 million as of December 31, 2012. We anticipate global deepwater spending to continue at robust levels due to new award opportunities coming from Brazil, West Africa, the U.S. Gulf of Mexico, Southeast Asia and Australia over the next twelve months.
Our well site services business segment is affected by drilling and completion activity primarily in the U.S. and, to a lesser extent, Canada and the rest of the world. Until recently, overall industry activity has been primarily driven by spending for natural gas exploration and production, particularly in the shale play regions of the U.S. using horizontal drilling and completion techniques. However, considering higher oil prices, lower natural gas prices and the advancement of horizontal drilling and completion techniques, activity in North America has shifted to a greater proportion of oil and liquids-rich drilling. According to rig count data published by Baker Hughes Incorporated, the oil rig count in the U.S. now totals approximately 1,340 rigs, the highest oil-related rig count in over 20 years, comprising approximately 76% of total U.S. drilling activity.
Through our tubular services segment, we distribute a broad range of casing and tubing used in the drilling and completion of oil and natural gas wells primarily in North America. Accordingly, sales and gross margins in our tubular services segment depend upon the overall level of drilling activity, the types of wells being drilled, movements in global steel input prices and the overall industry level of oil country tubular goods (OCTG) manufacturing capacity, inventory and pricing. Historically, tubular services’ gross margins generally expand during periods of rising OCTG prices and contract during periods of decreasing OCTG prices. Our tubular services business segment has historically been our most cyclical business segment. Nonetheless, the strong U.S. land drilling activity in 2011 and 2012, along with the return of drilling in the U.S. Gulf of Mexico following the Macondo well blowout, has led to increased tubular services volumes and revenues. OCTG prices fell throughout 2012 and pricing pressures are expected to continue into 2013 due to strong import levels and increasing domestic capacity and production.
Accommodations
Overview
During the year ended December 31, 2012, we generated approximately 25% of our revenue and 50% of our operating income, before corporate charges, from our accommodations segment. We are one of North America's and, as a result of our acquisition of The MAC in December 2010, Australia’s largest integrated providers of accommodations services for people working in remote locations. Our scalable modular facilities provide temporary and permanent work force accommodations where traditional infrastructure is not accessible or cost effective. Once facilities are deployed in the field, we also provide catering and food services, housekeeping, laundry, facility management, water and wastewater treatment, power generation, communications and redeployment logistics. Our accommodations support workforces in the Canadian oil sands and in a variety of oil and natural gas drilling, mining and related natural resource applications as well as disaster relief efforts, primarily in Canada, Australia and the United States.
- 7 -
Accommodations Market
Our accommodations business has grown in recent years in large part due to the increasing demand for accommodations to support workers in the oil sands region of Canada. Demand for oil sands accommodations is influenced to a great extent by the longer-term outlook for crude oil prices rather than current energy prices, given the multi-year time frame to complete oil sands projects and the costs associated with development of such large scale projects. Utilization of our existing Canadian accommodations capacity and our future expansions will largely depend on continued oil sands development spending.
Beginning in 2011, as a result of our acquisition of The MAC, our accommodations business entered into the Australian natural resources market. The Australian natural resources sector plays a vital role in the Australian economy. The growth of Australian natural resource commodity exports over the last decade has been largely driven by strong Asian demand for iron ore, coal and liquefied natural gas (LNG). The Australian natural resources sector is Australia’s largest contributor to exports and a major contributor to gross domestic product, employment and government revenue. The current activities of our Australian accommodations business are primarily related to supplying accommodations in support of metallurgical (met) coal mining in the Bowen Basin region of Queensland.
Volumes and prices of commodities have historically varied significantly and are difficult to predict. Mineral and commodity prices have fluctuated in recent years and may continue to fluctuate significantly in the future. Economic growth in emerging economies, such as China and India, with associated demand for mineral and natural resources such as coal, iron ore and LNG, has more than offset more muted growth in the more developed economies including those of the United States, Japan and Europe. This commodity demand is expected to underpin continued investment and growth in the Australian natural resources market.
Products and Services
We believe our “Develop, Own, Operate” business model provides consistent service delivery to our customers and provides us a competitive advantage in our accommodations segment. Our integrated model includes site identification, permitting and development, facility design, construction, installation and full site maintenance. We provide a turnkey solution for our customers’ accommodation needs.
Since mid-year 2006, we have installed over 11,000 rooms in our lodge properties supporting oil sands activities in northern Alberta. Our growth plan for this part of our business includes the expansion of these properties where we believe there is durable long-term demand. Our oil sands lodges support construction and operating personnel for maintenance and expansionary projects as well as ongoing operations associated with surface mining and in-situ oil sands projects generally under medium-term contracts (two to three years). During 2012, we added 1,125 rooms (net of retirements) to our major oil sands lodges by expanding our Athabasca, Beaver River, Henday and Conklin Lodges. Our Wapasu Creek Lodge is equivalent in size to the largest hotels in North America.
Our Australian accommodations business operates eight villages with over 8,600 rooms currently and has a significant development portfolio in Australia. The MAC provides accommodation services to mining and related service companies (including construction contractors) under medium-term contracts (three to five years). Our Australian accommodations villages are strategically located in proximity to long-lived, low-cost mines operated by large mining companies. During 2012, the Company added 1,305 rooms (net of retirements) to its Australian accommodations business by expanding existing villages and by constructing one new village, Karratha Village, our first village serving the northwest region of Australia.
- 8 -
More than two-thirds of our accommodations revenue is generated by our large-scale lodge and village facilities. Total rooms deployed at our major Canadian oil sands lodges and Australian villages were as follows:
|
December 31,
|
||||||||||||
|
2012
|
2011
|
2010
|
||||||||||
|
Canadian Oil Sands Lodges
|
||||||||||||
|
Wapasu
|
5,174 | 5,174 | 4,013 | |||||||||
|
Athabasca
|
1,877 | 1,776 | 1,537 | |||||||||
|
Henday
|
1,698 | 1,120 | - | |||||||||
|
Conklin
|
948 | 584 | 608 | |||||||||
|
Beaver River
|
876 | 732 | 732 | |||||||||
|
Lakeside
|
510 | 510 | 510 | |||||||||
|
Other
|
10 | 72 | 83 | |||||||||
|
Total Canadian Oil Sands Lodges
|
11,093 | 9,968 | 7,483 | |||||||||
|
Australian Villages
|
||||||||||||
|
Coppabella
|
2,912 | 2,556 | 1,654 | |||||||||
|
Dysart
|
1,912 | 1,491 | 1,249 | |||||||||
|
Moranbah
|
1,240 | 1,180 | 889 | |||||||||
|
Middlemount
|
816 | 816 | 690 | |||||||||
|
Narrabri
|
502 | 242 | - | |||||||||
|
Nebo
|
490 | 490 | 490 | |||||||||
|
Calliope
|
300 | 300 | - | |||||||||
|
Kambalda
|
238 | 238 | 238 | |||||||||
|
Karratha
|
208 | - | - | |||||||||
|
Total Australian Villages
|
8,618 | 7,313 | 5,210 | |||||||||
In addition to our large-scale lodge and village facilities, we offer a broad range of semi-permanent and mobile options to house workers in remote regions. Our fleet of temporary camps is designed to be deployed on short notice and can be relocated as a project site moves. Our camps range in size from a 25-person drilling camp to an 800-person camp supporting varied operations, including pipeline construction, Steam Assisted Gravity Drainage drilling operations and large shale oil projects.
With our integrated business model, our internal manufacturing capabilities allow us to respond quickly to changing customer needs and timing. We own two accommodations manufacturing plants near Edmonton, Alberta, Canada, two manufacturing locations in Ormeau and Yatala, Queensland, Australia, one in Belle Chasse, Louisiana and one in Johnstown, Colorado. Each of our facilities specializes in the design, engineering, production, transportation and installation of a variety of portable modular buildings, predominately for our own use. We manufacture accommodations facilities to suit the climate, terrain and population of a specific project site.
To a significant extent, the Company's recent capital expenditures have focused on opportunities in the oil sands region in northern Alberta and, beginning in 2011, in our Australian accommodations business. Since the beginning of 2005, we have spent $1.1 billion, or 54%, of our total consolidated capital expenditures on our Canadian and Australian accommodations businesses.
Regions of Operations
Our accommodations business is focused primarily in northern Canada and Queensland, Australia, but also operates in Western Australia, New South Wales, the U.S. Rocky Mountain corridor, the Bakken Shale region (Montana, North Dakota and Saskatchewan, Canada), the Fayetteville Shale region of Arkansas, the Eagle Ford Shale region of Texas and offshore locations in the Gulf of Mexico. In the past, we have also served companies operating in international markets including the Middle East, Europe, Asia and South America.
Customers and Competitors
Our customers operate in a diverse mix of industries including primarily oil sands mining and development, drilling, exploration and extraction of oil and natural gas and coal and other extractive industries. To a lesser extent, we also support other activities, including pipeline construction, forestry, humanitarian aid and disaster relief, and support for military operations. Our largest customers in 2012 were Imperial Oil and Fluor Canada Ltd. in Canada and BHP Billiton Mitsubishi Alliance in Australia. Our primary competitors in North America include Aramark Corporation, Compass Group PLC, ATCO Structures and Logistics Ltd., Black Diamond Group Limited, Horizon North Logistics, Inc. and Clean Harbors, Inc. Our primary competitors in Australia include Cleary Norman JV, Ausco Modular Pty Limited, Fleetwood Corporation Limited, the Tribute Group and Auzcorp Pty Ltd. Accommodations are also sometimes owned and/or operated by our existing and potential customers. Management estimates that our existing and potential customers own approximately 50% of the rooms available in the Canadian oil sands
and 60%
of the rooms in the Australian coal mining regions.
- 9 -
Offshore Products
Overview
During the year ended December 31, 2012, we generated approximately 18% of our revenue and 18% of our operating income, before corporate charges, from our offshore products segment. Through this segment, we design and manufacture a number of cost-effective, technologically advanced products for the offshore energy industry. In addition, we supply other lower margin products and services such as fabrication and inspection services. Our products and services are used primarily in deepwater producing regions and include flex-element technology, advanced connector systems, high-pressure compact valves, deepwater mooring systems, cranes, subsea pipeline products, blow-out preventer stack integration, specialty welding services, offshore installation services and repair services. We have facilities that support our offshore products segment in Arlington, Houston and Lampasas, Texas; Houma, Louisiana; Oklahoma City and Tulsa, Oklahoma; Scotland; Brazil; England; Singapore, Thailand, Vietnam and India.
Offshore Products Market
The market for our offshore products and services depends primarily upon development of infrastructure for offshore production activities, drilling rig refurbishments and upgrades as well as new rig and vessel construction. Demand for oil and natural gas and related drilling and production in offshore areas throughout the world, particularly in deeper water, will drive spending for these activities.
Products and Services
Celebrating 70 years of operations in 2012, our offshore products segment provides a broad range of products and services for use in offshore drilling and development activities. To a lesser extent, this segment provides onshore oil and natural gas, defense and general industrial products and services. Our offshore products segment is dependent in part on the industry's continuing innovation and creative applications of existing technologies.
Offshore Development and Drilling Activities.
We design, manufacture, fabricate, inspect, assemble, repair, test and market subsea equipment and offshore vessel and rig equipment. Our products are components of equipment used for the drilling and production of oil and natural gas wells on offshore fixed platforms and mobile production units, including floating platforms, such as tension leg platforms, floating production, storage and offloading (FPSO) vessels, Spars, and on other marine vessels, floating rigs, vessels and jack-up rigs. Our products and services include:
|
|
·
|
flexible bearings and connector products;
|
|
|
·
|
casing and conductor connections and pipe;
|
|
|
·
|
subsea pipeline products;
|
|
|
·
|
high-pressure compact ball valves, manifold system components and diverter valves;
|
|
|
·
|
marine winches, mooring systems, cranes and rig equipment;
|
|
|
·
|
drilling riser and related repair services;
|
|
|
·
|
blowout preventer stack assembly, integration, testing and repair services; and
|
|
|
·
|
other products and services.
|
- 10 -
Flexible Bearings and Advanced Connection Systems.
We are a significant supplier of flexible bearings, or FlexJoint
®
, to the offshore oil and gas industry as well as weld-on connectors and fittings that join lengths of large diameter conductor or casing used in offshore drilling and production operations. A FlexJoint
®
is a flexible bearing that permits the controlled movement of riser pipes or tension leg platform tethers under high tension and pressure. A FlexJoint
®
or our flex element at the top, bottom and, in some cases, middle of a deepwater riser reduces the stress and tension on the riser compensating for the pitch and rotational forces on the riser as the production facility or drilling rig moves with ocean forces. They are used on drilling, production and export risers and are used increasingly as offshore production moves to deeper water areas. Drilling riser systems provide the vertical conduit between the floating drilling vessel and the subsea wellhead. Through the drilling riser, equipment is guided into the well and drilling fluids are returned to the surface. Production riser systems provide the vertical conduit for the hydrocarbons from the subsea wellhead to the floating production platform. Oil and natural gas flows to the surface for processing through the production riser. Export risers provide the vertical conduit from the floating production platform to the subsea export pipelines. Our FlexJoint
®
bearings are a critical element in the construction and operation of production and export risers on floating production systems in deepwater.
Floating production systems, including tension leg platforms, Spars and FPSO facilities, are a significant means of producing oil and natural gas, particularly in deepwater environments. We provide many important products for the construction of these facilities. A tension leg platform (TLP) is a floating platform that is moored by vertical pipes, or tethers, attached to both the platform and the sea floor. Our FlexJoint
®
tether bearings are used at the top and bottom connections of each of the tethers, and our Merlin™ connectors are used to efficiently assemble the tethers during offshore installation. An FPSO is a floating vessel, typically ship shaped, used to produce, and process oil and natural gas from subsea wells. A Spar is a floating vertical cylindrical structure which is approximately six to seven times longer than its diameter and is anchored in place. Our FlexJoint
®
bearings are also used to attach the steel catenary risers to an FPSO, tension leg platform or Spar, and for use on import or export risers.
Our advanced connection systems provide connectors used in various drilling and production applications offshore. These connectors are welded onto pipe to provide more efficient joint to joint connections with enhanced tensile and burst capabilities that exceed those of connections that are cut into plain end pipe. Our connectors are reusable and pliable and in some cases provide metal-to-metal seals. We offer a suite of connectors offering differing specifications depending on the application. Our Merlin™ connectors are our premier connectors combining superior static strength and fatigue life with fast, non-rotational make-up and a slim profile. Merlin™ connectors have been used in sizes up to 60 inches (outside diameter) for applications including open-hole and tie-back casing, offshore conductor casing, pipeline risers and TLP tendons (which moor the TLP to the sea floor).
These flexible bearings and advanced connector systems are primarily manufactured through our Arlington, Texas, U.K. and Singapore locations.
Subsea Pipeline Products.
We design and manufacture a variety of equipment used in the construction, maintenance, expansion and repair of offshore oil and natural gas pipelines. New construction equipment includes:
|
|
·
|
pipeline end manifolds and pipeline end terminals;
|
|
|
·
|
midline tie-in sleds;
|
|
|
·
|
forged steel Y-shaped connectors for joining two pipelines into one;
|
|
|
·
|
pressure-balanced safety joints for protecting pipelines and related equipment from anchor snags or a shifting sea-bottom;
|
|
|
·
|
electrical isolation joints; and
|
|
|
·
|
hot tap clamps that allow new pipelines to be joined into existing lines without interrupting the flow of petroleum product.
|
- 11 -
We provide diverless connection systems for subsea flowlines and pipelines. Our HydroTech
®
collet connectors provide a high-integrity, proprietary metal-to-metal sealing system for the final hook-up of deep offshore pipelines and production systems. They also are used in diverless pipeline repair systems and in future pipeline tie-in systems. Our lateral tie-in sled, which is installed with the original pipeline, allows a subsea tie-in to be made quickly and efficiently using proven HydroTech
®
connectors without costly offshore equipment mobilization and without shutting off product flow.
We provide pipeline repair hardware, including deepwater applications beyond the depth of diver intervention. Our products include:
|
|
·
|
repair clamps used to seal leaks and restore the structural integrity of a pipeline;
|
|
|
·
|
mechanical connectors used in repairing subsea pipelines without having to weld;
|
|
|
·
|
misalignment and swivel ring flanges; and
|
|
|
·
|
pipe recovery tools for recovering dropped or damaged pipelines.
|
Our subsea pipeline products are primarily designed and manufactured at our two Houston, Texas manufacturing locations.
Marine Winches, Mooring Systems, Cranes and Rig Equipment.
We design, engineer and manufacture marine winches, mooring systems, cranes and certain rig equipment. Our Skagit
®
winches are specifically designed for mooring floating and semi-submersible drilling rigs and positioning pipelay and derrick barges, anchor handling boats and jack-ups, while our Nautilus
®
marine cranes are used on production platforms throughout the world. We also design and fabricate rig equipment such as automatic pipe racking and blow-out preventer handling equipment. Our engineering teams, manufacturing capability and service technicians who install and service our products provide our customers with a broad range of equipment and services to support their operations. Aftermarket service and support of our installed base of equipment to our customers is also an important source of revenue to us. These products are primarily designed and manufactured at our Houma, Louisiana location.
BOP Stack Assembly, Integration, Testing and Repair Services.
While we do not manufacture BOP stack assemblies, we design and fabricate lifting and protection frames and offer system integration of blow-out preventer stacks and subsea production trees. We can provide complete turnkey and design fabrication services. We also design and manufacture a variety of custom subsea equipment, such as riser flotation tank systems, guide bases, running tools and manifolds. In addition, we also offer blow-out preventer and drilling riser testing and repair services.
These assembly and testing services are offered through our Houston, Texas, U.K., Singapore and Brazil locations.
Our offshore products segment also produces a variety of products for use in applications other than in the offshore oil and gas industry. For example, we provide:
|
|
·
|
elastomer consumable downhole products for onshore drilling and production;
|
|
|
·
|
sound and vibration isolation equipment for the U.S. Navy submarine fleet;
|
|
|
·
|
metal-elastomeric FlexJoint
®
bearings used in a variety of naval and marine applications; and
|
|
|
·
|
drum-clutches and brakes for heavy-duty power transmission in the mining, paper, logging and marine industries.
|
- 12 -
Backlog.
Backlog in our offshore products segment was $561 million at December 31, 2012, compared to $535 million at December 31, 2011 and $354 million at December 31, 2010. We expect in excess of 90% of our backlog at December 31, 2012 to be recognized as revenue during 2013. Our offshore products backlog consists of firm customer purchase orders for which contractual commitments exist and delivery is scheduled. In some instances, these purchase orders are cancelable by the customer, subject to the payment of termination fees and/or the reimbursement of our costs incurred. Our backlog is an important indicator of future offshore products shipments and revenues; however, backlog as of any particular date may not be indicative of our actual operating results for any future period. We believe that the offshore construction and development business is characterized by lengthy projects and a long "lead-time" order cycle. The change in backlog levels from one period to the next does not necessarily evidence a long-term trend.
Regions of Operations
Our offshore products segment provides products and services to customers in the major offshore oil and natural gas producing regions of the world, including the Gulf of Mexico, West Africa, Azerbaijan, the North Sea, Brazil, Southeast Asia, India and Australia.
Customers and Competitors
We market our products and services to a broad customer base, including direct end users, engineering and design companies, prime contractors, and at times, our competitors through outsourcing arrangements. Our largest customers in 2012 were Chevron Corporation, Halliburton Company, and Royal Dutch Shell plc. Our main competitors include Cameron International Corporation, National Oilwell Varco, Inc., GE Oil & Gas, Liebherr Cranes, Inc., FMC Technologies, Inc. and Dril-Quip, Inc.
Well Site Services
Overview
During the year ended December 31, 2012, we generated approximately 16% of our revenue and 22% of our operating income, before corporate charges, from our well site services segment. Our well site services segment includes a broad range of products and services that are used to drill for, establish and maintain the flow of oil and natural gas from a well throughout its lifecycle. In this segment, our operations include completion-focused equipment and services as well as land drilling services. We use our fleet of completion tools and drilling rigs to serve our customers at well sites and project development locations. Our products and services are used primarily in onshore applications throughout the drilling, completion and production phases of a well's life.
Well Site Services Market
Demand for our completion services and drilling services has historically been tied to the level of oil and natural gas exploration and production activity. The primary driver for this activity is the price of oil and natural gas. Activity levels have been, and we expect will continue to be, highly correlated with hydrocarbon commodity prices.
Services
Completion Services.
Our completion services business provides a wide range of services for use in the onshore and offshore oil and gas industry, including:
|
|
·
|
wireline and coiled tubing services;
|
|
|
·
|
wellhead isolation services;
|
|
|
·
|
well testing and flowback services, including separators and line heaters;
|
|
|
·
|
pipe recovery systems;
|
- 13 -
|
|
·
|
thru-tubing milling and fishing services;
|
|
|
·
|
hydraulic chokes and manifolds;
|
|
|
·
|
blow out preventers;
|
|
|
·
|
downhole extended-reach technology;
|
|
|
·
|
gravel pack operations on well bores; and
|
|
|
·
|
surface control equipment and down-hole tools utilized by coiled tubing operators.
|
Our completion services employees typically rig up and operate our equipment on the well site for our customers. Our well site equipment is primarily used during the completion and production stages of a well. As of December 31, 2012, we provided completion services at approximately 55 distribution points throughout the United States, Canada, Mexico and Argentina. We continue to consolidate operations in areas where our product lines previously had separate facilities and close facilities in areas where operations are marginal in order to streamline operations, enhance our facilities and improve marketing efficiency. We typically provide our services and equipment based on daily rates varying depending on the type of equipment and the length of time. Billings to our customers typically separate charges for our equipment from charges for our field technicians. We own patents or have patents pending covering some of our technology, particularly in our wellhead isolation equipment and downhole extended-reach technology product lines. Our customers in the completion services business include major, independent and private oil and gas companies and other large oilfield service companies. Our largest customers in 2012 were Anadarko Petroleum Corporation, Chesapeake Energy Corporation and Devon Energy Corporation. Competition in the completion services business is widespread and includes many smaller companies, although we also compete with the larger oilfield service companies for certain products and services.
Drilling Services.
Our drilling services business, which is marketed through the brand of Capstar Drilling, our wholly-owned subsidiary, is located in the United States and provides land drilling services for shallow to medium depth wells ranging from 1,500 to 15,000 feet. We serve two primary markets with our drilling services business: the Permian Basin in West Texas and the Rocky Mountain region. Drilling services are typically used during the exploration and development stages of a field. As of December 31, 2012, after losing one of our rigs in the Rockies to fire in February 2012, we had a total of thirty-three semi-automatic drilling rigs with hydraulic pipe handling booms and lift capacities ranging from 150,000 to 500,000 pounds, fourteen of which were fabricated and/or assembled in our Odessa, Texas facility with components purchased from specialty vendors during the last nine years. Twenty-five of these drilling rigs are based in Odessa, Texas and eight are based in the Rocky Mountain region. Utilization of our drilling rigs increased from an average of 82% in 2011 to an average of 88% in 2012. On December 31, 2012, twenty-seven of our rigs, or 82%, were working or under contract.
We market our drilling services directly to a diverse customer base, consisting of major, independent and private oil and gas companies. We contract on both a footage and a dayrate basis. Under a footage drilling contract, we assume responsibility for certain costs (such as bits and fuel) and assume more risk (such as time necessary to drill) than we would on a daywork contract. Depending on market conditions and availability of drilling rigs, we see changes in pricing, utilization and contract terms. Our largest customers in 2012 were Energen Resources Corporation, Apache Corporation and SandRidge Energy, Inc. The land drilling business is highly fragmented, and our competition consists of a small number of larger companies and many smaller companies. Our Permian Basin drilling activities target primarily oil reservoirs while our Rocky Mountain drilling activities target oil, liquids-rich and natural gas reservoirs.
- 14 -
Tubular Services
Overview
During the year ended December 31, 2012, we generated approximately 41% of our revenue and 10% of our operating income, before corporate charges, from our tubular services segment. Through our Sooner, Inc. subsidiary, we distribute OCTG and provide associated OCTG finishing and logistics services to the oil and gas industry. OCTG consist of downhole casing and production tubing. Through our tubular services segment, we:
|
|
·
|
distribute a broad range of casing and tubing; and
|
|
|
·
|
provide threading, third-party inspection and logistical and inventory management services.
|
We serve a customer base ranging from major oil and gas companies to small independents. Through our key relationships with more than 20 domestic and foreign manufacturers and related service providers and suppliers of OCTG, we deliver tubular products and ancillary services to oil and gas companies, drilling contractors and consultants predominantly in the United States. The OCTG distribution market is highly fragmented and competitive, and is focused in the United States. We purchase tubular goods from a variety of sources; however, during 2012, 81% of our total OCTG purchases were from three suppliers.
OCTG Market
Our tubular services segment primarily distributes casing and tubing. Casing forms the structural wall in oil and natural gas wells to provide support, control pressure and prevent collapse during drilling operations. Casing is also used to protect water-bearing formations during the drilling of a well. Casing is generally not removed after it has been installed in a well. Production tubing, which is used to bring oil and natural gas to the surface, may be replaced during the life of a producing well.
A key indicator of domestic demand for OCTG is the aggregate footage of wells drilled onshore and offshore in the United States. The OCTG market is also affected by the level of inventories maintained by manufacturers, distributors and end users. Inventory on the ground, when at high levels, can cause tubular sales to lag a rig count increase due to inventory destocking and can put downward pressure on OCTG pricing. The OCTG Situation Report suggests that industry OCTG inventory levels have increased throughout 2012 and currently stand at five to six months' supply. Demand for tubular products is positively impacted by increased drilling of deeper, horizontal and offshore wells. Deeper wells require incremental tubular footage and enhanced mechanical capabilities to ensure the integrity of the well. Premium tubulars are generally used in deeper wells and in horizontal drilling to withstand the increased bending and compression loading associated with a horizontal well. Operators typically specify premium tubulars for the completion of offshore wells.
Products and Services
Tubular Products and Services.
We distribute various types of OCTG produced by both domestic and foreign manufacturers to major and independent oil and gas exploration and production companies and other OCTG distributors. We have distribution relationships with most major domestic and certain international steel mills. We do not manufacture any of the tubular goods that we distribute and, as a result, gross margins in this segment are generally lower than those reported by our other business segments. We operate our tubular services segment from a total of ten offices and facilities located near areas of oil and natural gas exploration and development activity.
In our tubular services segment, inventory management is critical to our success. We maintain on-the-ground inventory in five company-owned yards and approximately 90 third-party yards located in the United States, giving us the flexibility to fill customer orders from our own stock or directly from the manufacturer.
- 15 -
Yard Operations.
Our pipe maintenance and storage facility in Crosby, Texas is equipped to provide a full range of tubular services, giving us strong customer service capabilities. Our Crosby yard is on 109 acres, is an ISO 9001-certified facility, and has a rail spur, more than 1,400 pipe racks and two double-ended thread lines. We have exclusive use of a permanent third-party inspection center within the facility. The facility also includes indoor chrome pipe storage capability and patented pipe cleaning machines. We offer services at our Crosby facility typically outsourced by other distributors, including the following: threading, inspection, cleaning, cutting, logistics, rig returns, installation of float equipment and non-destructive testing. We also offer tubular services at our facilities in Midland and Godley, Texas, Searcy, Arkansas and Montoursville, Pennsylvania. Our Midland, Texas facility, which services the Permian Basin area, covers approximately 389 acres and has more than 860 pipe racks. Our Godley, Texas facility, which services the Barnett shale area, has approximately 330 pipe racks on approximately 31 acres and is serviced by a rail spur. Our Searcy location, which services the Fayetteville shale area, has approximately 110 pipe racks on 14 acres. Our Montoursville, Pennsylvania location, which services the Marcellus shale area, has more than 220 pipe racks on 24 acres. Independent third-party inspection companies operate within each of these facilities either with mobile or permanent inspection equipment.
Tubular Products and Services Sales Arrangements.
We provide our tubular products and logistics services through a variety of arrangements, including alliances and spot market sales. We provide a large portion of our tubular products and services to independent and major oil and gas companies under alliance or program arrangements. Alliance or program arrangements refer to agreements whereby a customer bids the tubular requirements for a number of wells at one time. Although alliance arrangements can generally be cancelled by the customer, they provide us with more stable and predictable revenues and an improved ability to forecast required inventory levels, which allows us to manage our inventory more efficiently and, therefore, generate reliable returns on investment. At December 31, 2012, approximately 87% of our OCTG inventory was supported by customer orders.
Regions of Operations
Our tubular services segment provides tubular products and services principally to customers in the United States both for land and offshore applications. However, we also sell a small percentage for export worldwide.
Suppliers, Customers and Competitors
We source the OCTG we sell from domestic and international manufacturers. Our largest supplier is U.S. Steel Group. Although we have a leading market share position in tubular services distribution, the market is highly fragmented. Our largest customers in 2012 were Chesapeake Energy Corporation, Occidental Petroleum Corporation and Chevron Corporation. Our main competitors in tubular distribution are Edgen Group Inc., MRC Global, Inc., Pipeco Services Inc. and Premier Pipe L.P.
* * * * *
Seasonality of Operations
Our operations are directly affected by seasonal differences in weather in the areas in which we operate, most notably in Canada, Australia, the Rocky Mountain region and the Gulf of Mexico. A portion of our Canadian accommodations operations is conducted during the winter months when the winter freeze in remote regions is required for exploration and production activity to occur. The spring thaw in these frontier regions restricts operations in the second quarter and adversely affects our operations and our ability to provide services. During the Australian rainy season, generally between the months of November and April, our accommodations operations in Queensland and the northern parts of Western Australia can be affected by cyclones, monsoons and resultant flooding. Severe winter weather conditions in the Rocky Mountain region can restrict access to work areas for our well site services and accommodations segment operations. Our operations in the Gulf of Mexico are also affected by weather patterns. Weather conditions in the Gulf Coast region generally result in higher drilling activity in the spring, summer and fall months with the lowest activity in the winter months. As a result of these seasonal differences, full year results are not likely to be a direct multiple of any particular quarter or combination of quarters. In addition, summer and fall drilling activity can be restricted due to hurricanes and other storms prevalent in the Gulf of Mexico and along the Gulf Coast. For example, during 2005, a significant disruption occurred in oil and natural gas drilling and production operations in the U.S. Gulf of Mexico due to damage inflicted by Hurricanes Katrina and Rita and, during 2008, by Hurricane Ike.
- 16 -
Employees
As of December 31, 2012, the Company had 8,716 full-time employees on a consolidated basis, 43% of whom are in our accommodations segment, 28% of whom are in our well site services segment, 26% of whom are in our offshore products segment, 2% of whom are in our tubular services segment and 1% of whom are in our corporate headquarters. We were party to collective bargaining agreements covering 2,299 employees located in Canada, Australia, the United Kingdom and Argentina as of December 31, 2012. We believe we have healthy labor relations with our employees.
Government Regulation
Our business is significantly affected by foreign and domestic laws and regulations at the federal, provincial, state and local levels relating to the oil, natural gas and mining industries, worker safety and environmental protection. Changes in these laws, including more stringent regulations and increased levels of enforcement of these laws and regulations, could significantly affect our business. We cannot predict changes in the level of enforcement of existing laws and regulations or how these laws and regulations may be interpreted or the effect changes in these laws and regulations may have on us or our future operations or earnings. We also are not able to predict the extent to which new laws and regulations will be adopted or whether such new laws and regulations may impose more stringent or costly restrictions on our operations.
We depend on the demand for our products and services from oil and natural gas exploration and production companies. This demand is affected by changing taxes, price controls and laws and regulations relating to the oil and natural gas industry generally, including those specifically directed to oilfield and offshore operations. The adoption of laws and regulations curtailing exploration and development drilling for oil and natural gas in areas where we operate could also adversely affect our operations by limiting demand for our products and services. We cannot determine the extent to which our future operations and earnings may be affected by new legislation, new regulations or changes in existing regulations or enforcement.
Some of our employees who perform services on offshore platforms and vessels are covered by the provisions of the Jones Act, the Death on the High Seas Act and general maritime law. These laws operate to make the liability limits established under states' workers' compensation laws inapplicable to these employees and permit them or their representatives generally to pursue actions against us for damages or job-related injuries with no limitations on our potential liability.
Our operations are subject to numerous stringent and comprehensive foreign, federal, provincial, state and local environmental laws and regulations governing the release or discharge of materials into the environment or otherwise relating to environmental protection. Numerous governmental agencies issue regulations to implement and enforce these laws, for which compliance is often costly yet critical. The violation of these laws and regulations may result in the denial or revocation of permits, issuance of corrective action orders, modification or cessation of operations, assessment of administrative and civil penalties, and even criminal prosecution. We believe that we are in substantial compliance with existing environmental laws and regulations and we do not anticipate that future compliance with existing environmental laws and regulations will have a material effect on our Consolidated Financial Statements. However, there can be no assurance that substantial costs for compliance or penalties for non-compliance with these existing requirements will not be incurred in the future. Moreover, it is possible that other developments, such as the adoption of stricter environmental laws, regulations and enforcement policies or more stringent enforcement of existing environmental laws and regulations, could result in additional costs or liabilities that we cannot currently quantify.
For example, in Canada, the Federal Government in September 2010 appointed an Oil Sands Advisory Panel to review and comment upon existing scientific studies and literature regarding water monitoring in the Lower Athabasca region and provide recommendations for improving such monitoring. The Oil Sands Advisory Panel presented its final report to the Minister of the Environment in December 2010. In response to this report, Environment Canada, with input from the government of Alberta through Alberta Environment, developed an environmental monitoring plan specific to the oil sands with respect to water, air quality and biodiversity. Further, in January 2011, the Province of Alberta established a Provincial Environmental Monitoring Panel with a mandate to recommend a world class environmental evaluation, monitoring and reporting system, generally for the Province and specifically for the lower Athabasca Region where oil sands are produced. This panel issued its recommendations to the Alberta Minister of the Environment in July 2011. In 2012, the governments of Canada and Alberta released the Joint Canada-Alberta Implementation Plan for Oil Sands Monitoring that will be phased in between 2012 and 2015. The costs of implementing this plan are to be funded by industry.
- 17 -
As this new monitoring regime is implemented, the increased levels of monitoring and enforcement may increase costs for us and our customers and reduce activity and demand for our services.
Further, the Province of Alberta released its new Clean Air Strategy in October 2012 which it proposes to implement beginning in 2013. The implementation of this strategy along with Alberta’s continued implementation of its regulatory changes to oil and oil sands regulation may result in additional costs or liabilities for our customers’ operations.
With regard to our U.S. operations, we generate wastes, including hazardous wastes, which are subject to the federal Resource Conservation and Recovery Act, as amended, or RCRA, and comparable state statutes. The United States Environmental Protection Agency, or EPA, and comparable state agencies have limited the approved methods of disposal for some types of hazardous wastes and nonhazardous solid wastes. Drilling fluids, produced waters and other wastes associated with the exploration, development or exploration of oil or natural gas are currently regulated under RCRA’s non-hazardous waste provisions. It is possible that certain of these oil and natural gas exploration and production wastes now classified as non-hazardous could be re-classified as hazardous in the future. Any such re-classification of these currently exempt wastes to hazardous could subject us to more rigorous and costly operating and disposal requirements, which could have a material adverse effect on our results of operations and financial position. In the course of our operations, we also generate some amounts of ordinary industrial wastes, such as paint wastes, waste solvents, and waste oils that may be regulated as hazardous wastes.
Also in connection with our U.S. operations, the federal Comprehensive Environmental Response, Compensation, and Liability Act, as amended, or CERCLA, also known as the "Superfund" law, and comparable state statutes impose liability, without regard to fault or legality of the original conduct, on classes of persons that are considered to have contributed to the release of a hazardous substance into the environment. These persons include the owner or operator of the disposal site where the release occurred and companies that transported, disposed of, or arranged for the transport or disposal of the hazardous substances at the site where the release occurred. Under CERCLA, these persons may be subject to joint and several, strict liability for the costs of cleaning up the hazardous substances that have been released into the environment and for damages to natural resources, and it is not uncommon for neighboring landowners and other third-parties to file claims for personal injury and property damage allegedly caused by the hazardous substances released into the environment. We currently have operations in the United States on properties where activities involving the handling of hazardous substances or wastes have been conducted by previous owners or operators whose operations were not under our control. These properties may be subject to CERCLA, RCRA and analogous state laws. Under these laws and related regulations, we could be required to remove or remediate previously discarded hazardous substances and wastes or property contamination that was caused by these third parties.
In the course of our domestic operations, some of our equipment may be exposed to naturally occurring radiation associated with oil and natural gas deposits, and this exposure may result in the generation of wastes containing naturally occurring radioactive materials or "NORM." NORM wastes exhibiting trace levels of naturally occurring radiation in excess of established state standards are subject to special handling and disposal requirements, and any storage vessels, piping, and work area affected by NORM may be subject to remediation or restoration requirements. Because many of the properties presently or previously owned or operated by us have been used for oil and natural gas production operations for many years, it is possible that we may incur costs or liabilities associated with elevated levels of NORM.
The Federal Water Pollution Control Act, as amended, and analogous state laws impose restrictions and strict controls regarding the discharge of pollutants into state waters or waters of the United States. The discharge of pollutants into jurisdictional waters is prohibited unless the discharge is permitted by the EPA or applicable state agencies. Many of our domestic properties and operations require permits for discharges of wastewater and/or storm water, and we have developed a system for securing and maintaining these permits. In addition, the Oil Pollution Act of 1990, as amended, or OPA, imposes a variety of requirements on responsible parties related to the prevention of oil spills and liability for damages, including natural resource damages, resulting from such spills in waters of the United States. A responsible party under OPA includes the owner or operator of an onshore facility or vessel, or the lessee or permittee of the area in which an offshore facility is located. The Federal Water Pollution Control Act and analogous state laws provide for administrative, civil and criminal penalties for unauthorized discharges and, together with the OPA, require the development and implementation of spill prevention and response plans and impose potential liability for the remedial costs and associated damages arising out of any unauthorized discharges.
- 18 -
A certain portion of our completion services business supports other contractors actually performing hydraulic fracturing to enhance the production of natural gas from formations with low permeability, such as shales. Due to concerns raised concerning potential impacts of hydraulic fracturing and fracturing fluids disposal on drinking water and groundwater quality, legislative and regulatory efforts at the federal level and in some states have been initiated in the United States to render permitting, public disclosure and construction and operational compliance requirements for our oil and gas industry customers more stringent for hydraulic fracturing. While hydraulic fracturing typically is regulated in the United States by state oil and natural gas commissions, there have been developments indicating that more federal regulatory involvement may occur. The EPA has asserted federal regulatory authority pursuant to the federal Safe Drinking Water Act, or SDWA, over certain hydraulic fracturing activities involving the use of diesel fuels and published draft permitting guidance in May 2012 addressing the performance of such activities using diesel fuels. In November 2011, the EPA announced its intent to develop and issue regulations under the Toxic Substances Control Act to require companies to disclose information regarding the chemicals used in hydraulic fracturing and the agency currently plans to issue a Notice of Proposed Rulemaking that would seek public input on the design and scope of such disclosure regulations. In addition, from time to time, Congress has considered legislation to provide for federal regulation of hydraulic fracturing in the United States under the SDWA and to require disclosure of the chemicals used in the hydraulic fracturing process. At the state level, some states have adopted and other states are considering adopting legal requirements that could impose new or more stringent permitting, public disclosure or well construction requirements on hydraulic fracturing activities. Local government also may seek to adopt ordinances within their jurisdictions regulating the time, place or manner of drilling activities in general or hydraulic fracturing activities in particular. In the event that new or more stringent federal, state or local legal restrictions relating to use of the hydraulic fracturing process in the United States are adopted in areas where our oil and natural gas exploration and production customers operate, those customers could incur potentially significant added costs to comply with requirements relating to permitting, construction, financial assurance, monitoring, recordkeeping, and/or plugging and abandonment, as well as could experience delays or curtailment in the pursuit of production or development activities, which could reduce demand for our completion services and tubular services businesses.
In addition, certain domestic governmental reviews have been conducted or are underway that focus on environmental aspects of hydraulic fracturing practices. The White House Council on Environmental Quality is coordinating an administration-wide review of hydraulic fracturing practices, and the EPA has commenced a study of the potential environmental effects of hydraulic fracturing on drinking water and groundwater, with a first progress report outlining work currently underway by the agency released on December 21, 2012 and a final report drawing conclusions about the potential impacts of hydraulic fracturing on drinking water resources expected to be available for public comment and peer review by 2014. Moreover, the EPA is planning to develop effluent limitations for the treatment and discharge of wastewater resulting from hydraulic fracturing activities by 2014. Other governmental agencies, including
the U.S. Department of Energy (DOE) and the U.S. Department of the Interior (DOI), have evaluated or are evaluating various other aspects of hydraulic fracturing. These ongoing or proposed studies, depending on the results obtained, could spur initiatives to further regulate hydraulic fracturing under the SDWA or other regulatory mechanisms, which events could delay or curtail production of oil and natural gas by exploration and production operations, some of which are our customers, and thus reduce demand for our North American completion products and services, tubular services and accommodations services
.
- 19 -
Following an April 30, 2010 fire and explosion aboard the Deepwater Horizon drilling rig and resulting oil spill from the Macondo well operated by a third-party in ultra-deep water in the U.S. Gulf of Mexico, there have been a series of regulatory initiatives developed and implemented at the federal level to address the direct impact of the incident and to prevent similar incidents in the future. Beginning in 2010 and continuing through 2012, the U.S. Department of the Interior, or DOI, through a series of inter-agencies that have since evolved into the present day Bureau of Ocean Energy Management, or BOEM, and Bureau of Safety and Environmental Enforcement, or BSEE, have issued a variety of regulations and Notices to Lessees and Operators, or NTLs, intended to impose additional safety, permitting and certification requirements applicable to exploration, development and production activities in the U.S. Gulf of Mexico. These regulatory initiatives effectively slowed down the pace of drilling and production operations in the U.S. Gulf of Mexico as adjustments were being made in operating procedures, certification requirements and lead times for inspections, drilling
applications and permits, and exploration and production plan reviews, and as the federal agencies evolved into their present day bureaus. Under the DOI’s current inter-agency format, the BOEM administers offshore leasing, resource evaluation, oil and natural gas exploration and production plan reviews, renewable energy development, National Environmental Policy Act analyses, and environmental studies whereas the BSEE manages responsibility for the safety and enforcement functions imposed on offshore oil and natural gas operations, including the development and enforcement of safety and environmental regulations, permitting of offshore exploration, development and production activities, inspections, offshore regulatory programs, oil spill response and compliance programing and training. Offshore oil and natural gas exploration and production operators, including some that are our customers, are required to comply with this more stringent and comprehensive array of legal requirements as conditions to initiating and/or continuing offshore activities in the U.S. Gulf of Mexico, compliance with which has made it more difficult and costly for these operators in proceeding with those activities and more prone to potential delays, whether due to permit delays, the aggregate effect of more regulation, the need for new or retrofitted equipment or processes or qualified personnel, or otherwise. In addition to the array of new or revised safety, permitting and certification requirements developed and implemented by the DOI in the past few years, there have been a variety of proposals to change existing laws and regulations that could affect offshore development and production, including proposals to significantly increase the minimum financial responsibility demonstration required under the OPA. If the regulatory initiatives implemented and pursued over the past few years or the threat of added restrictions, whether through legislative or regulatory means or increased or broadened enforcement programs, foster uncertainties or delays in offshore oil and natural gas development or exploration activities, then such conditions would be viewed by us as having an overall negative effect on those offshore activities and, to a certain extent, our financial results.
Some of our operations as well as those of our oil and natural gas customers in the U.S. also result in emissions of regulated air pollutants. The federal Clean Air Act, as amended, or CAA, and analogous state laws require permits for facilities in the United States that have the potential to emit substances into the atmosphere that could adversely affect environmental quality. Failure to obtain a permit or to comply with permit requirements could result in the imposition of substantial administrative, civil and even criminal penalties. In addition, amendment of the CAA or comparable state laws may cause our oil and natural gas exploration and production customers to incur capital expenditures for installation of air pollution control equipment and to encounter construction delays while applying for and receiving new or amended permits, which could have an adverse effect on demand for our products and services. For example, on August 16, 2012, the EPA published final rules under the CAA that subject oil and natural gas production, processing, transmission and storage operations to regulation under the New Source Performance Standards, or NSPS, and National Emission Standards for Hazardous Air Pollutants, or NESHAP, programs. With regards to production activities, these final rules require, among other things, the reduction of volatile organic compound emissions from three subcategories of fractured and refractured gas wells for which well completion operations are conducted: wildcat (exploratory) and delineation gas wells; low reservoir pressure non-wildcat and non-delineation gas wells; and all “other” fractured and refractured gas wells. All three subcategories of wells must route flow back emissions to a gathering line or be captured and combusted using a combustion device such as a flare after October 15, 2012. However, the “other” wells must use reduced emission completions, also known as “green completions,” with or without combustion devices, after January 1, 2015. These regulations also establish specific new requirements regarding emissions from production-related wet seal and reciprocating compressors, effective October 15, 2012 and from pneumatic controllers and storage vessels, effective October 15, 2013.
Past scientific studies have suggested that emissions of certain gases, commonly referred to as greenhouse gases, or GHG, and including carbon dioxide and methane, may be contributing to warming of the Earth's atmosphere and other climatic changes. On January 29, 2010, Canada affirmed its desire to be associated with the Copenhagen Accord that was negotiated in December 2009 as part of the international meetings on climate change regulation in Copenhagen. The Copenhagen Accord, which is not legally binding, allows countries to commit to specific efforts to reduce GHG emissions, although how and when the commitments may be converted into binding emission reduction obligations is currently uncertain. Pursuant to the Copenhagen Accord process, Canada has indicated an economy-wide GHG emissions target that equates to a 17 per cent reduction from 2005 levels by 2020, and the Canadian federal government has also indicated an objective of reducing overall Canadian GHG emissions by 60% to 70% by 2050. Additionally, in 2009, the Canadian federal government announced its commitment to work with the provincial governments to implement a North America-wide cap and trade system for GHG emissions, in cooperation with the United States. Under the system, Canada would have a cap-and-trade market for Canadian-specific industrial sectors that could be integrated into a North American market for carbon permits. It is uncertain whether either federal GHG regulations or an integrated North American cap-and-trade system will be implemented, or what obligations might be imposed under any such systems.
- 20 -
Additionally, GHG regulation can take place at the provincial and municipal level. For example, Alberta introduced the Climate Change and Emissions Management Act, which provides a framework for managing GHG emissions by reducing specified gas emissions, relative to gross domestic product, to an amount that is equal to or less than 50% of 1990 levels by December 31, 2020. The accompanying regulation, the Specified Gas Emitters Regulation, effective July 1, 2007, requires mandatory emissions reductions through the use of emissions intensity targets, and a company can meet the applicable emissions limits by making emissions intensity improvements at facilities, offsetting GHG emissions by purchasing offset credits or emission performance credits in the open market, or acquiring “fund credits” by making payments of $15 per ton of GHG emissions to the Alberta Climate Change and Management Fund. The Specified Gas Reporting Regulation imposes GHG emissions reporting requirements if a company has GHG emissions of 100,000 tons or more from a facility in a year. In addition, Alberta facilities must currently report emissions of industrial air pollutants and comply with obligations in permits and under other environmental regulations. The Canadian federal government currently proposes to enter into equivalency agreements with provinces to establish a consistent regulatory regime for GHGs, but the success of any such plan is uncertain, possibly leaving overlapping levels of regulation. The direct and indirect costs of these regulations may adversely affect our operations and financial results as well as those of our customers.
Our Australian accommodations business is regulated by general statutory environmental controls at both the state and federal level which may result in land use approval and compliance risk. These controls include: land use and urban design controls;
the regulation of hard and liquid waste, including the requirement for tradewaste and/or wastewater permits or licenses; the regulation of water, noise, heat, and atmospheric gases emissions; the regulation of the production, transport and storage of dangerous and hazardous materials (including asbestos); and the regulation of pollution and site contamination. Some specified activities, for example, sewage treatment works, may require regulation at a state level by way of environmental protection licenses which also impose monitoring and reporting obligations on the holder. There is an increasing emphasis from state and federal regulators on sustainability and energy efficiency in business operations. Federal requirements are now in place for the mandatory disclosure of energy performance under building rating schemes. These schemes require the tracking of specific environmental performance factors. Carbon reporting requirements currently exist for corporations which meet a reporting threshold for greenhouse gases or energy use or production for a reporting (financial) year under national legislation. In addition, the Australian Commonwealth Government’s carbon pricing mechanism (“CPM”) commenced on 1 July 2012. Under the CPM, entities that are responsible for facilities that meet specified emissions thresholds will be required to purchase and surrender permits representing their carbon emissions. The CPM is intended to operate as a carbon trading scheme, commencing with a three year fixed price period, followed by a flexible price cap-and-trade emissions trading scheme. Although our Australian accommodations facilities are currently below the emissions thresholds specified by the CPM and are, thus, not affected by the CPM, this could change in the future and the resultant change could have an adverse effect on our Australian operations and financial results.
The EPA determined in December 2009 that emissions of GHGs present an endangerment to public health and the environment and, based on those findings, adopted regulations to restrict emissions of greenhouse gases under existing provisions of the CAA, including one that requires a reduction in emissions of greenhouse gases from motor vehicles and another that regulates emissions of greenhouse gases from certain large stationary sources. The EPA has also adopted rules requiring the monitoring and reporting of greenhouse gas emissions from specified large greenhouse gas emission sources in the United States, including, among others, offshore and onshore oil and natural gas production facilities, on an annual basis.
- 21 -
While the U.S. Congress has from time to time considered legislation to reduce emissions of GHGs, there has not been significant activity in the form of adopted legislation to reduce GHG emissions at the federal level in recent years. In the absence of federal climate legislation in the U.S., a number of state and regional efforts have emerged that are aimed at tracking and/or reducing GHG emissions by means of cap and trade programs that typically require major sources of GHG emissions, such as electric power plants, to acquire and surrender emission allowances in return for emitting those GHGs. If Congress undertakes comprehensive tax reform in the coming year, it is possible that such reform may include a carbon tax, which could impose additional direct costs on operations and reduce demand for refined products. Although it is not possible at this time to predict how legislation or new regulations that may be adopted to address GHG emissions would impact our business, any such future laws and regulations could require us to incur increased operating costs, such as costs to purchase and operate emissions control systems, to acquire emission allowances or comply with new regulatory or reporting requirements including the imposition of a carbon tax. Any such legislation or regulatory programs could also increase the cost of consuming, and thereby reduce demand for oil and natural gas, which could reduce the demand for the oil and natural gas that we help produce. The adoption of legislation or regulatory programs to reduce emissions of greenhouse gases could require us or our customers to incur increased operating costs, such as costs to purchase and operate emissions control systems, to acquire emissions allowances or comply with new regulatory or reporting requirements. Any such legislation or regulatory programs could also increase the cost of consuming, and thereby reduce demand for, the oil and natural gas, which could reduce the demand for our products and services. Consequently, legislation and regulatory programs to reduce emissions of greenhouse gases could have an adverse effect on our business, financial condition and results of operations. Finally, it should be noted that some scientists have concluded that increasing concentrations of greenhouse gases in the Earth’s atmosphere may produce climate changes that have significant physical effects, such as increased frequency and severity of storms, droughts, floods and other climatic events. If any such effects were to occur, they could have an adverse effect on our financial condition and results of operations.
Our operations outside of the United States are potentially subject to similar foreign governmental controls relating to protection of the environment. We believe that, to date, our operations outside of the United States have been in substantial compliance with existing requirements of these foreign governmental bodies and that such compliance has not had a material adverse effect on our operations. However, this trend of compliance with existing requirements may not continue in the future or the cost of such compliance may become material. For instance, any future restrictions on emissions of greenhouse gases that are imposed in foreign countries in which we operate, could adversely affect demand for our services.
The federal Endangered Species Act, as amended, or the ESA, restricts activities in the United States that may affect endangered or threatened species or their habitats. If endangered species are located in areas of the United States where our oil and natural gas exploration and production customers operate, such operations could be prohibited or delayed or expensive mitigation may be required. Moreover, as a result of a settlement approved by the U.S. District Court for the District of Columbia in 2011, the U.S. Fish and Wildlife Service is required to make a determination on listing of more than 250 species as endangered or threatened under the ESA before the end of the agency’s 2017 fiscal year. The designation of previously unprotected species as threatened or endangered in areas of the United States where our customers’ oil and natural gas exploration and production operations are conducted could cause them to incur increased costs arising from species protection measures or could result in limitations on their exploration and production activities, which could have an adverse impact on demand for our products and services.
The risks described in this Annual Report on Form 10-K are not the only risks we face. Additional risks and uncertainties not currently known to us or that we currently deem to be immaterial also may materially adversely affect our business, financial condition or future results.
- 22 -
Our business is subject to a number of economic risks.
Financial markets worldwide experienced extreme disruption in the past five years, including, among other things, extreme volatility in securities prices, severely diminished liquidity and credit availability, rating downgrades of certain investments and declining valuations of others. Governments took unprecedented actions intended to address extreme market conditions such as severely restricted credit and declines in real estate values. Such economic events can recur and can potentially affect businesses such as ours in a number of ways. Tightening of credit in financial markets and a slowing economy adversely affects the ability of our customers and suppliers to obtain financing for significant operations, can result in lower demand for our products and services, and could result in a decrease in or cancellation of orders included in our backlog and adversely affect the collectability of our receivables. Additionally, tightening of credit in financial markets coupled with a slowing economy could negatively impact our cost of capital and ability to grow. Our business is also adversely affected when energy demand declines as a result of lower overall economic activity. Typically, lower energy demand negatively affects commodity prices, which reduces the earnings and cash flow of our E&P and mining customers, reducing their spending and demand for our products and services. These conditions could have an adverse effect on our operating results and our ability to recover our assets at their stated values. Likewise, our suppliers may be unable to sustain their current level of operations, fulfill their commitments and/or fund future operations and obligations, each of which could adversely affect our operations. Strengthening of the rate of exchange for the U.S. Dollar against certain major currencies, such as the Euro, the British Pound and the Canadian and Australian Dollar, could also adversely affect our results.
Decreased customer expenditure levels will adversely affect our results of operations.
Demand for our products and services is sensitive to the level of exploration, development and production activity of, and the corresponding capital spending by, oil and gas and mining companies, including national oil companies. If our customers' expenditures decline, our business will suffer. The oil and gas and mining industries’ willingness to explore, develop and produce depends largely upon the availability of attractive drilling prospects and the prevailing view of future commodity prices. Prices for oil, coal, natural gas, and other minerals are subject to large fluctuations in response to changes in the supply of and demand for oil and natural gas, market uncertainty, and a variety of other factors that are beyond our control. A sudden or long-term decline in commodity pricing would have material adverse effects on our results of operations. Any prolonged reduction in oil and natural gas prices will depress levels of exploration, development, and production activity, often reflected as reductions in rig counts or coal production. Additionally, significant new regulatory requirements, including climate change legislation, could have an impact on the demand for and the cost of producing oil, coal and gas. Many factors affect the supply and demand for oil, coal, natural gas and other minerals and, therefore, influence product prices, including:
|
|
·
|
the level of drilling activity;
|
|
|
·
|
the level of production;
|
|
|
·
|
the levels of oil and natural gas inventories;
|
|
|
·
|
depletion rates;
|
|
|
·
|
worldwide demand for oil and natural gas;
|
|
|
·
|
the expected cost of finding, developing and producing new reserves;
|
|
|
·
|
delays in major offshore and onshore oil and natural gas field development timetables;
|
|
|
·
|
the level of activity and developments in the Canadian oil sands;
|
|
|
·
|
the level of demand for coal and other natural resources from Australia;
|
|
|
·
|
the availability of attractive oil and natural gas field prospects, which may be affected by governmental actions or environmental activists which may restrict drilling;
|
|
|
·
|
the availability of transportation infrastructure for both oil and natural gas, refining capacity and shifts in end-customer preferences toward fuel efficiency and the use of natural gas;
|
|
|
·
|
global weather conditions and natural disasters;
|
|
|
·
|
worldwide economic activity including growth in underdeveloped countries, such as China and India;
|
- 23 -
|
|
·
|
national government political requirements, including the ability of the Organization of Petroleum Exporting Companies (OPEC) to set and maintain production levels and prices for oil and government policies which could nationalize or expropriate oil and natural gas exploration, production, refining or transportation assets;
|
|
|
·
|
the level of oil and gas production by non-OPEC countries;
|
|
|
·
|
the impact of armed hostilities involving one or more oil producing nations;
|
|
|
·
|
rapid technological change and the timing and extent of alternative energy sources, including LNG or other alternative fuels;
|
|
|
·
|
environmental regulation; and
|
|
|
·
|
domestic and foreign tax policies.
|
Our business may be adversely affected by extended periods of low oil or natural gas prices or unsuccessful exploration results may decrease deepwater exploration and production activity or oil sands development and production in Canada.
Two of our businesses, where we manufacture offshore products for deepwater exploration and production and where we supply accommodations for oil sands developments, typically support our customers' projects that are more capital intensive and take longer to generate first production than traditional oil and natural gas exploration and development activities. The economic analyses conducted by exploration and production companies in deepwater, oil sands, Australian mining and LNG investment areas have historically assumed a relatively conservative longer-term price outlook for production from such projects to determine economic viability. Perceptions of lower longer-term oil prices by these companies can cause our customers to reduce or defer major expenditures given the long-term nature of many large scale development projects, which could adversely affect our revenues and profitability in our offshore products segment and our accommodations segment.
Federal legislation and state legislative and regulatory initiatives relating to hydraulic fracturing could result in increased costs and additional operating restrictions or delays as well as adversely affect our services.
Hydraulic fracturing is an important and commonly used process for the completion of oil and natural gas wells in formations with low permeabilities, such as shale formations, and involves the pressurized injection of water, sand and chemicals into rock formations to stimulate production. Due to concerns raised regarding potential impacts of hydraulic fracturing and fracturing fluids disposal on drinking water and groundwater quality, legislative and regulatory efforts at the federal level and in some states have been initiated in the United States to render permitting, public disclosure and construction and operational compliance requirements for our oil and gas industry customers more stringent for hydraulic fracturing. While hydraulic fracturing typically is regulated in the United States by state oil and natural gas commissions, there have been developments indicating that more federal regulatory involvement may occur. The EPA has asserted federal regulatory authority pursuant to the federal Safe Drinking Water Act, or SDWA, over certain hydraulic fracturing activities involving the use of diesel fuels and published draft permitting guidance in May 2012 addressing the performance of such activities using diesel fuels. In November 2011, the EPA announced its intent to develop and issue regulations under the Toxic Substances Control Act to require companies to disclose information regarding the chemicals used in hydraulic fracturing and the agency currently plans to issue a Notice of Proposed Rulemaking that would seek public input on the design and scope of such disclosure regulations. In addition, from time to time, Congress has considered legislation to provide for federal regulation of hydraulic fracturing in the United States under the SDWA and to require disclosure of the chemicals used in the hydraulic fracturing process. At the state level, some states have adopted and other states are considering adopting legal requirements that could impose new or more stringent permitting, public disclosure or well construction requirements on hydraulic fracturing activities. Local governments also may seek to adopt ordinances within their jurisdictions regulating the time, place or manner of drilling activities in general or hydraulic fracturing activities in particular.
- 24 -
In addition, certain domestic governmental reviews have been conducted or are underway that focus on environmental aspects of hydraulic fracturing practices. The White House Council on Environmental Quality is coordinating an administration-wide review of hydraulic fracturing practices, and the EPA has commenced a study of the potential environmental effects of hydraulic fracturing on drinking water and groundwater, with a first progress report outlining work currently underway by the agency released on December 21, 2012 and a final report drawing conclusions about the potential impacts of hydraulic fracturing on drinking water resources expected to be available for public comment and peer review by 2014. Moreover, the EPA is planning to develop effluent limitations for the treatment and discharge of wastewater resulting from hydraulic fracturing activities by 2014. Other governmental agencies, including the DOE and the DOI, have evaluated or are evaluating various other aspects of hydraulic fracturing. These ongoing or proposed studies, depending on their degree of pursuit and any meaningful results obtained, could spur initiatives to further regulate hydraulic fracturing under the SDWA or other regulatory mechanisms, which events could delay or curtail production of oil and natural gas by exploration and production operators, some of which are our customers, and thus reduce demand for our North American completion products and services. In the event that new or more stringent federal, state or local legal restrictions relating to use of the hydraulic fracturing process in the United States are adopted in areas where our oil and natural gas exploration and production customers operate, those customers could incur potentially significant added costs to comply with requirements relating to permitting, construction, financial assurance, monitoring, recordkeeping, and/or plugging and abandonment, as well as could experience delays or curtailment in the pursuit of production or development activities, which could reduce demand for the products and services of each of our business segments.
In our accommodations business supporting mining, our clients’ production or price issues may adversely affect us.
The volumes and prices of the products of our clients, including coal and gold, have historically varied significantly and are difficult to predict. The demand for, and price of, these minerals and commodities is highly dependent on a variety of factors, including international supply and demand, the price and availability of alternative fuels, actions taken by governments and global economic and political developments. Mineral and commodity prices have fluctuated in recent years and may continue to fluctuate significantly in the future. We expect that a material decline in mineral and commodity prices could result in a decrease in the activity of our clients with the possibility that this would materially adversely affect us. No assurance can be given regarding future volumes and/or prices relating to the activities of our clients.
Our clients in the accommodations business are exposed to a number of unique operating risks which could also adversely affect us.
We could be materially adversely affected by disruptions to the operation of our accommodations clients caused by any one of or all of the following singularly or in combination:
|
|
·
|
domestic and international pricing and demand for the natural resource being produced at a given project (or proposed project);
|
|
|
·
|
unexpected problems and delays during the development, construction and project start-up which may delay the commencement of production;
|
|
|
·
|
unforeseen and adverse climatic, geological, geotechnical, seismic and mining conditions;
|
|
|
·
|
lack of availability of sufficient water or power to maintain their or our operations;
|
|
|
·
|
water or food quality or safety issues;
|
|
|
·
|
lack of availability or failure of the required infrastructure necessary to maintain or to expand their operations;
|
|
|
·
|
the breakdown or shortage of equipment and labor necessary to maintain their or our operations;
|
- 25 -
|
|
·
|
risks associated with the natural resources industry being subject to various regulatory approvals. Such risks may include a Government Agency failing to grant an approval or failing to renew an existing approval, or the approval or renewal not being provided by the Government Agency in a timely manner or the Government Agency granting or renewing an approval subject to materially onerous conditions;
|
|
|
·
|
risks to land titles, mining titles and use thereof as a result of native title claims;
|
|
|
·
|
claims by persons living in close proximity to mining projects, which may have an impact on the consents granted;
|
|
|
·
|
interruptions to the operations of our clients caused by industrial accidents or disputes; and
|
|
|
·
|
delays in or failure to commission new infrastructure in timeframes so as not to disrupt client operations.
|
Our accommodations business is exposed to a number of general risks that could materially adversely affect our assets and liabilities, financial position, profits, prospects and share price
.
Examples of these general risks which may impact our performance include:
|
|
·
|
abnormal stoppages in the production or delivery of the products of our clients due to factors such as industrial disruption, infrastructure failure, war, political or civil unrest;
|
|
|
·
|
cost overruns in the provision of new rooms or in other associated or related capital expenditure;
|
|
|
·
|
higher than budgeted costs associated with the provision of accommodations services;
|
|
|
·
|
our clients not renewing their contracts, renewing them on less favorable terms, or other loss of clients;
|
|
|
·
|
our inability to properly treat and dispose of wastewater at our facilities;
|
|
|
·
|
failure of our clients to meet their obligations under their contracts;
|
|
|
·
|
extreme weather conditions adversely affecting our operations or the operations of our clients; and
|
|
|
·
|
a major disaster at one or more of our large accommodations facilities involving fire, communicable diseases, criminal acts or other events causing significant reputational damage.
|
Development of permanent infrastructure in the Canadian oil sands region, regions of Australia or various U.S. locations where we locate our accommodations assets could negatively impact our accommodations business.
Our accommodations business specializes in providing housing and personnel logistics for work forces in remote areas which lack the infrastructure typically available in nearby towns and cities. If permanent towns, cities and municipal infrastructure develop in the oil sands region of northern Alberta, Canada, or regions of Australia where we locate accommodations villages, then demand for our accommodations could decrease as customer employees move to the region and choose to utilize permanent housing and food services.
Construction risks exist in our accommodations business which may adversely affect our results of operations.
There are a number of general risks that might impinge on companies involved in the development, construction, manufacture and installation of facilities as a prerequisite to the management of those assets in an operational sense. We might be exposed to these risks from time to time by relying on these corporations and/or other third parties which could include any and/or all of the following:
|
|
·
|
the construction activities of our accommodations business are partially dependent on the supply of appropriate construction and development opportunities;
|
- 26 -
|
|
·
|
development approvals, slow decision making by counterparties, complex construction specifications, changes to design briefs, legal issues and other documentation changes may give rise to delays in completion, loss of revenue and cost over-runs which may, in turn, result in termination of accommodation supply contracts;
|
|
|
·
|
other time delays that may arise in relation to construction and development include supply of labor, scarcity of construction materials, lower than expected productivity levels, inclement weather conditions, land contamination, cultural heritage claims, difficult site access or industrial relations issues;
|
|
|
·
|
objections aired by community interest, environment and/or neighborhood groups which may cause delays in the granting or approvals and/or the overall progress of a project;
|
|
|
·
|
where we assume design responsibility, there is a risk that design problems or defects may result in rectification and/or costs or liabilities which we cannot readily recover; and
|
|
|
·
|
there is a risk that we may fail to fulfill our statutory and contractual obligations in relation to the quality of our materials and workmanship, including warranties and defect liability obligations.
|
Our financial results could be adversely impacted by changes in the regulation of offshore oil and natural gas exploration and development activity in the U.S. Gulf of Mexico.
In the aftermath of the Macondo well incident in April 2010, there have been a series of regulatory initiatives developed and implemented at the federal level to address the direct impact of the incident and to prevent similar incidents in the future. Beginning in 2010 and continuing through 2012, the DOI, through a series of inter-agencies that have since evolved into the present day Bureau of Ocean Energy Management, or BOEM, and Bureau of Safety and Environmental Enforcement, or BSEE, issued a variety of regulations and Notices to Lessees and Operators, or NTLs, intended to impose additional safety, permitting and certification requirements applicable to exploration, development and production activities in the U.S. Gulf of Mexico. These regulatory initiatives effectively slowed down the pace of drilling and production operations in the U.S. Gulf of Mexico as adjustments were being made in operating procedures, certification requirements and lead times for inspections, drilling applications and permits, and exploration and production plan reviews, and as the federal agencies evolved into their present day bureaus. Offshore oil and natural gas exploration and production operators, including some that are our customers, are required to comply with this more stringent and comprehensive array of legal requirements as conditions to initiating and/or continuing offshore activities in the U.S. Gulf of Mexico, compliance with which has made it more difficult and costly for these operators in proceeding with those activities and more prone to potential delays, whether due to permit delays, the aggregate effect of more regulation, the need for new or retrofitted equipment or processes or qualified personnel, or otherwise. In addition, governmental officials responsible for one or more of the aforementioned regulatory bodies have publically stated that their authority extends beyond oil and gas operators to include service and equipment contractors as well. This governmental assertion of broad legal authority to govern contractors’ activity is a new development, may be subject to future clarification and may result in the development and implementation of various regulatory compliance programs governing contractor activities. We are uncertain about the potential breadth of future regulatory initiatives, if implemented, or the specific responsibilities that may arise from these initiatives, but expect that the implementation of new or more stringent initiatives may subject us and other contractors to increased costs and liabilities to comply, which could have a significant adverse effect on our operations. We believe that offshore contractors and service providers, including ourselves, will closely monitor rulemaking in this area to ensure ongoing compliance.
In addition to the array of new or revised safety, permitting and certification requirements developed and implemented by the DOI in the past few years, there have been a variety of proposals to change existing laws and regulations that could affect offshore development and production, including proposals to significantly increase the minimum financial responsibility demonstration required under the OPA. If the regulatory initiatives implemented and pursued over the past few years or the threat of added restrictions, whether through legislative or regulatory means or increased or broadened enforcement programs, foster uncertainties or delays in offshore oil and natural gas development or exploration activities, then such conditions would be viewed by us as having an overall negative effect on those offshore activities and, to a certain extent, our financial results.
- 27 -
We have a significant concentration of our accommodations business located in the oil sands region of Alberta, Canada and in the Bowen Basin of Queensland, Australia.
Because of the concentration of our accommodations business in the oil sands region of Alberta, Canada and in the coal producing region of Queensland, Australia, two relatively small geographic areas, we have increased exposure to political, regulatory, environmental, labor, climate or natural disaster events or developments that could negatively impact our operations and financial results.
Because the oil and gas industry is cyclical, our operating results may fluctuate.
Oil and natural gas prices have been and are expected to remain volatile. This volatility causes oil and gas companies and drilling contractors to change their strategies and expenditure levels. Supplies of oil and natural gas can be influenced by many factors, including improved technology such as the hydraulic fracturing of horizontally drilled wells in shale discoveries, access to potential productive regions and availability of required infrastructure to deliver production to the marketplace. We have experienced in the past, and expect to experience in the future, significant fluctuations in operating results based on these changes.
The cyclical nature of our business and a severe prolonged downturn could negatively affect the value of our goodwill.
As of December 31, 2012, goodwill represented approximately 12% of our total assets. We have recorded goodwill because we paid more for some of our businesses that we acquired than the fair market value of the tangible and separately measurable intangible net assets of those businesses. Current accounting standards require a periodic review of goodwill for impairment in value and a non-cash charge against earnings with a corresponding decrease in stockholders' equity if circumstances, some of which are beyond our control, indicate that the carrying amount will not be recoverable. In the fourth quarter of 2008 during the global financial crisis, we recognized an impairment of a portion of our goodwill totaling $85.6 million as a result of several factors affecting our tubular services and drilling reporting units. Similarly, in the second quarter of 2009, we recognized an impairment of $94.5 million representing a portion of our remaining goodwill as a result of several factors affecting our completion services reporting unit. It is possible that we could recognize additional goodwill impairment losses in the future if, among other factors:
|
|
·
|
global economic conditions deteriorate;
|
|
|
·
|
the outlook for future profits and cash flow for any of our reporting units deteriorate as the result of many possible factors, including, but not limited to, increased or unanticipated competition, technology becoming obsolete, further reductions in customer capital spending plans, loss of key personnel, adverse legal or regulatory judgment(s), future operating losses at a reporting unit, downward forecast revisions, or restructuring plans;
|
|
|
·
|
costs of equity or debt capital increase; or
|
|
|
·
|
valuations for comparable public companies or comparable acquisition valuations deteriorate.
|
The level and pricing of tubular goods imported into the United States could decrease demand for our tubular goods inventory and adversely impact our results of operations. Also, if steel mills were to sell a substantial amount of goods directly to end users in the United States, our results of operations could be adversely impacted.
Although imports of OCTG from China are currently restricted by trade sanctions imposed by the U.S. government, lower-priced tubular goods from a number of foreign countries are still imported into the U.S. tubular goods market. If the level of imported, lower-priced tubular goods were to otherwise increase from current levels, our tubular services segment could be adversely affected to the extent that we would then have higher-cost tubular goods in inventory or if prices and margins are driven down by increased supplies of tubular goods. If prices were to decrease significantly, we might not be able to profitably sell our inventory of tubular goods. In addition, significant price decreases could result in a longer holding period for some of our inventory, which could also have an adverse effect on our tubular services segment.
- 28 -
We do not manufacture any of the tubular goods that we distribute. Historically, users of tubular goods in the United States, in contrast to those outside the United States, have purchased tubular goods through distributors. If customers were to purchase tubular goods directly from steel mills, our results of operations could be adversely impacted.
We do business in international jurisdictions whose political and regulatory environments and compliance regimes differ from those in the United States.
A portion of our revenue is attributable to operations in foreign countries. These activities accounted for approximately 31% (15% excluding Canada; 9% excluding Canada and Australia) of our consolidated revenue in the year ended December 31, 2012. Risks associated with our operations in foreign areas include, but are not limited to:
|
•
|
expropriation, confiscation or nationalization of assets;
|
|
•
|
renegotiation or nullification of existing contracts;
|
|
•
|
foreign exchange restrictions;
|
|
•
|
foreign currency fluctuations;
|
|
•
|
foreign taxation;
|
|
•
|
the inability to repatriate earnings or capital;
|
|
•
|
changing political conditions;
|
|
•
|
changing foreign and domestic monetary policies;
|
|
•
|
social, political, military and economic situations in foreign areas where we do business and the possibilities of war, other armed conflict or terrorist attacks; and
|
|
•
|
regional economic downturns.
|
Additionally, in some jurisdictions we are subject to foreign governmental regulations favoring or requiring the awarding of contracts to local contractors or requiring foreign contractors to employ citizens of, or purchase supplies from, a particular jurisdiction. These regulations may adversely affect our ability to compete in such jurisdictions.
Our international business operations also include projects in countries where governmental corruption has been known to exist and where our competitors who are not subject to the same ethics-related laws and regulations such as the Foreign Corrupt Practices Act in the U.S. and the Bribery Act in the U.K., can gain competitive advantages over us by securing business awards, licenses or other preferential treatment in those jurisdictions using methods that certain ethics-related laws and regulations prohibit us from using. For example, our non-U.S. competitors may not be subject to the anti-bribery restrictions of the Foreign Corrupt Practices Act, which make it illegal to give anything of value to foreign officials or employees or agents of nationally-owned oil companies in order to obtain or retain any business or other advantage. While many countries, like the U.S. and the U.K., have adopted anti-bribery statutes, there has not been universal adoption and enforcement of such statutes. Therefore, we may be subject to competitive disadvantages to the extent that our competitors are able to secure business, licenses or other preferential treatment by making payments to government officials and others in positions of influence.
Violations of these laws could result in monetary and criminal penalties against us or our subsidiaries and could damage our reputation and, therefore, our ability to do business.
- 29 -
Exchange rate fluctuations could adversely affect our results of operations and financial position.
In the ordinary course of our business, we enter into purchase and sales commitments that are denominated in currencies that differ from the functional currency used by our operating subsidiaries. Currency exchange rate fluctuations can create volatility in our consolidated financial position, results of operations and/or cash flows. Although we may enter into foreign exchange agreements with financial institutions in order to reduce our exposure to fluctuations in currency exchange rates, these transactions, if entered into, will not eliminate that risk entirely. To the extent that we are unable to match sales received in foreign currencies with expenses paid in the same currency, exchange rate fluctuations could have a negative impact on our consolidated financial position, results of operations and/or cash flows. Additionally, because our consolidated financial results are reported in U.S. dollars, if we generate net sales or earnings within entities whose functional currency is not the U.S. dollar, the translation of such amounts into U.S. dollars can result in an increase or decrease in the amount of our net sales and earnings depending upon exchange rate movements. With respect to our potential exposure to foreign currency fluctuations and devaluations, for the year ended December 31, 2012, approximately 31% of our sales originated from subsidiaries outside of the U.S. in currencies including, among others, the Canadian dollar, the Australian dollar and the pound sterling. As a result, a material decrease in the value of these currencies relative to the U.S. dollar may have a negative impact on our reported sales, net income and cash flows. Any currency controls implemented by local monetary authorities in countries where we currently operate could also adversely affect our business, financial condition and results of operations.
We are subject to extensive and costly environmental laws and regulations that may require us to take actions that will adversely affect our results of operations.
All of our operations are significantly affected by stringent and complex foreign, federal, provincial, state and local laws and regulations governing the discharge of substances into the environment or otherwise relating to environmental protection. We could be exposed to liabilities for cleanup costs, natural resource damages and other damages as a result of our conduct that was lawful at the time it occurred or the conduct of, or conditions caused by, prior operators or other third-parties. Environmental laws and regulations are subject to change in the future, possibly resulting in more stringent requirements. If existing regulatory requirements or enforcement policies change, we may be required to make significant unanticipated capital and operating expenditures.
Any failure by us to comply with applicable environmental laws and regulations may result in governmental authorities taking actions against our business that could adversely impact our operations and financial condition, including the:
|
|
·
|
issuance of administrative, civil and criminal penalties;
|
|
|
·
|
denial or revocation of permits or other authorizations;
|
|
|
·
|
reduction or cessation in operations; and
|
|
|
·
|
performance of site investigatory, remedial or other corrective actions.
|
An accidental release of pollutants into the environment may cause us to incur significant costs and liabilities.
There is inherent risk of environmental costs and liabilities in our business as a result of our handling of petroleum hydrocarbons, because of air emissions and waste water discharges related to our operations, and due to historical industry operations and waste disposal practices. Certain environmental statutes impose joint and several, strict liability for these costs. For example, an accidental release by us in the performance of well site services at one of our customers’ sites could subject us to substantial liabilities arising from environmental cleanup, restoration costs and natural resource damages, claims made by neighboring landowners and other third parties for personal injury and property damage and fines or penalties for related violations of environmental laws or regulations. We may not be able to recover some or any of these costs from insurance.
- 30 -
We may be exposed to certain regulatory and financial risks related to climate change.
Climate change is receiving increasing attention from scientists and legislators alike. The debate is ongoing as to the extent to which our climate is changing, the potential causes of any change and its potential impacts. Some attribute global warming to increased levels of greenhouse gases, including carbon dioxide, which has led to significant legislative and regulatory efforts to limit greenhouse gas emissions. Significant focus is being made on companies that are active producers of depleting natural resources.
There are a number of legislative and regulatory proposals to address greenhouse gas emissions, which are in various phases of discussion or implementation. The outcome of foreign, U.S. federal, regional, provincial and state actions to address global climate change could result in a variety of regulatory programs including potential new regulations, additional charges to fund energy efficiency activities, or other regulatory actions. These actions could:
|
|
·
|
result in increased costs associated with our operations and our customers' operations;
|
|
|
·
|
increase other costs to our business;
|
|
|
·
|
adversely impact overall drilling activity in the areas in which we operate;
|
|
|
·
|
reduce the demand for carbon-based fuels; and
|
|
|
·
|
reduce the demand for our services.
|
Any adoption of these or similar proposals by foreign, U.S. federal, regional or state governments mandating a substantial reduction in greenhouse gas emissions could have far-reaching and significant impacts on the energy industry. Although it is not possible at this time to predict how legislation or new regulations that may be adopted to address greenhouse gas emissions would impact our business, any such future laws and regulations could result in increased compliance costs or additional operating restrictions, and could have a material adverse effect on our business or demand for our services. See "Part I, Item 1. “Business - Government Regulation" for a more detailed description of our climate-change related risks.
Currently proposed legislative changes, including changes to tax laws and regulations, could materially, negatively impact the Company by increasing the costs of doing business and decreasing the demand for our products.
The current U.S. administration and Congress have proposed several new articles of legislation or legislative and administrative changes, including changes to tax laws and regulations, which could have a material negative effect on our Company. Some of the proposed changes that could negatively impact us are:
|
|
·
|
cap and trade system for emissions;
|
|
|
·
|
increased environmental limits on exploration and production activities;
|
|
|
·
|
repeal of expensing of intangible drilling costs;
|
|
|
·
|
increase of the amortization period for geological and geophysical costs to seven years;
|
|
|
·
|
repeal of percentage depletion;
|
|
|
·
|
limits on hydraulic fracturing or disposal of hydraulic fracturing fluids;
|
|
|
·
|
repeal of the domestic manufacturing deduction for oil and natural gas production;
|
|
|
·
|
repeal of the passive loss exception for working interests in oil and natural gas properties;
|
|
|
·
|
repeal of the credits for enhanced oil recovery projects and production from marginal wells;
|
|
|
·
|
repeal of the deduction for tertiary injectants;
|
|
|
·
|
changes to the foreign tax credit limitation calculation; and
|
|
|
·
|
changes to healthcare rules and regulations.
|
- 31 -
We are susceptible to seasonal earnings volatility due to adverse weather conditions in our regions of operations.
Our operations are directly affected by seasonal differences in weather in the areas in which we operate, most notably in Canada, Australia, the Rocky Mountain region and the Gulf of Mexico. A portion of our Canadian accommodations operations is conducted during the winter months when the winter freeze in remote regions is required for exploration and production activity to occur. The spring thaw in these frontier regions restricts operations in the spring months and, as a result, adversely affects our operations and our ability to provide services in the second and, to a lesser extent, third quarters. During the Australian rainy season, generally between the months of November and April, our accommodations operations in Queensland and the northern parts of Western Australia can be affected by cyclones, monsoons and resultant flooding. Severe winter weather conditions in the Rocky Mountain region can restrict access to work areas for our well site services and accommodations segment operations. Our operations in the Gulf of Mexico are also affected by weather patterns. Weather conditions in the Gulf Coast region generally result in higher drilling activity in the spring, summer and fall months with the lowest activity in the winter months. As a result of these seasonal differences, full year results are not likely to be a direct multiple of any particular quarter or combination of quarters. In addition, summer and fall drilling activity can be restricted due to hurricanes and other storms prevalent in the Gulf of Mexico and along the Gulf Coast. For example, during 2005, a significant disruption occurred in oil and natural gas drilling and production operations in the U.S. Gulf of Mexico due to damage inflicted by Hurricanes Katrina and Rita and, during 2008, by Hurricane Ike.
We are exposed to risks relating to subcontractors’ performance in some of our projects.
In many cases, we subcontract the performance of parts of our operations to subcontractors. While we seek to obtain appropriate indemnities and guarantees from these subcontractors, we remain ultimately responsible for the performance of our subcontractors. Industrial disputes, natural disasters, financial failure or default or inadequate performance in the provision of services, or the inability to provide services by such subcontractors has the potential to materially adversely affect us.
Our inability to control the inherent risks of identifying, acquiring and integrating businesses that we may acquire, including any related increases in debt or issuances of equity securities, could adversely affect our operations.
Acquisitions have been, and our management believes acquisitions will continue to be, a key element of our growth strategy. We may not be able to identify and acquire acceptable acquisition candidates on favorable terms in the future. We may be required to incur substantial indebtedness to finance future acquisitions and also may issue equity securities in connection with such acquisitions. Such additional debt service requirements could impose a significant burden on our results of operations and financial condition. The issuance of additional equity securities could result in significant dilution to stockholders.
We expect to gain certain business, financial and strategic advantages as a result of business combinations we undertake, including synergies and operating efficiencies. Our forward-looking statements assume that we will successfully integrate our business acquisitions and realize these intended benefits. An inability to realize expected strategic advantages as a result of the acquisition would negatively affect the anticipated benefits of the acquisition.
Additional risks we could face in connection with acquisitions include:
|
•
|
retaining key employees of acquired businesses;
|
|
•
|
retaining and attracting new customers of acquired businesses;
|
- 32 -
|
•
|
retaining supply and distribution relationships key to the supply chain;
|
|
•
|
increased administrative burden;
|
|
•
|
developing our sales and marketing capabilities;
|
|
•
|
managing our growth effectively;
|
|
•
|
potential impairment resulting from the overpayment for an acquisition;
|
|
•
|
integrating operations;
|
|
•
|
managing tax and foreign exchange exposure;
|
|
•
|
operating a new line of business;
|
|
•
|
increased logistical problems common to large, expansive operations; and
|
|
•
|
inability to pursue and protect patents covering acquired technology.
|
Additionally, an acquisition may bring us into businesses we have not previously conducted and expose us to additional business risks that are different from those we have previously experienced. If we fail to manage any of these risks successfully, our business could be harmed. Our capitalization and results of operations may change significantly following an acquisition, and shareholders of the Company may not have the opportunity to evaluate the economic, financial and other relevant information that we will consider in evaluating future acquisitions.
We may not have adequate insurance for potential liabilities.
Our operations are subject to many hazards. We face the following risks under our insurance coverage:
|
|
·
|
we may not be able to continue to obtain insurance on commercially reasonable terms;
|
|
|
·
|
we may be faced with types of liabilities that will not be covered by our insurance, such as damages from environmental contamination or terrorist attacks;
|
|
|
·
|
the dollar amounts of any liabilities may exceed our policy limits;
|
|
|
·
|
the counterparties to our insurance contracts may pose credit risks; and
|
|
|
·
|
we may incur losses from interruption of our business that exceed our insurance coverage.
|
Even a partially uninsured or underinsured claim, if successful and of significant size, could have a material adverse effect on our results of operations or consolidated financial position.
We are subject to litigation risks that may not be covered by insurance.
In the ordinary course of business, we become the subject of various claims, lawsuits and administrative proceedings seeking damages or other remedies concerning our commercial operations, products, employees and other matters, including occasional claims by individuals alleging exposure to hazardous materials as a result of our products or operations. Some of these claims relate to the activities of businesses that we have sold, and some relate to the activities of businesses that we have acquired, even though these activities may have occurred prior to our acquisition of such businesses. We maintain insurance to cover many of our potential losses, and we are subject to various self-retentions and deductibles under our insurance policies. It is possible, however, that a judgment could be rendered against us in cases in which we could be uninsured and beyond the amounts that we currently have reserved or anticipate incurring for such matters.
- 33 -
We depend on several significant customers in each of our business segments, and the loss of one or more such customers or the inability of one or more such customers to meet their obligations to us could adversely affect our results of operations.
We depend on several significant customers in each of our business segments. The majority of our customers operate in the energy or mining industry. For a more detailed explanation of our customers for each of our business segments, see “Item 1. Business.” The loss of any one of our largest customers in any of our business segments or a sustained decrease in demand by any of such customers could result in a substantial loss of revenues and could have a material adverse effect on our results of operations. In addition, the concentration of customers in two industries may impact our overall exposure to credit risk, either positively or negatively, in that customers may be similarly affected by changes in economic and industry conditions. While we perform ongoing credit evaluations of our customers, we do not generally require collateral in support of our trade receivables. The inability or failure of our significant customers to meet their obligations to us or their insolvency or liquidation may adversely affect our financial results.
Our common stock price has been volatile, and we expect it to continue to remain volatile in the future
.
The market price of common stock of companies engaged in the oil and gas services industry has been highly volatile. Likewise, the market price of our common stock has varied significantly (2012 low of $61.28 per share; 2012 high of $86.65 per share) in the past, and we expect it to continue to remain highly volatile given the cyclical nature of our industry.
We may assume contractual risks in developing, manufacturing and delivering products in our offshore products business segment.
Many of our products from our offshore products segment are ordered by customers under frame agreements or project specific contracts. In some cases these contracts stipulate a fixed price for the delivery of our products and impose liquidated damages or late delivery fees if we do not meet specific customer deadlines. In addition, some customer contracts stipulate consequential damages payable, generally as a result of our gross negligence or willful misconduct. The final delivered products may also include customer and third-party supplied equipment, the delay of which can negatively impact our ability to deliver our products on time at our anticipated profitability.
In certain cases these orders include new technology or unspecified design elements. In some cases we may not be fully or properly compensated for the cost to develop and design the final products, negatively impacting our profitability on the projects. In addition, our customers, in many cases, request changes to the original design or bid specifications for which we may not be fully or properly compensated.
As is customary for our offshore products segment, we agree to provide products under fixed-price contracts, typically assuming responsibility for cost overruns. Our actual costs and any gross profit realized on these fixed-price contracts may vary from the initially expected contract economics. There is inherent risk in the estimation process including significant unforeseen technical and logistical challenges or longer than expected lead times. A fixed-price contract may prohibit our ability to mitigate the impact of unanticipated increases in raw material prices (including the price of steel) through increased pricing. In fulfilling some contracts, we provide limited warranties for our products. Although we estimate and record a provision for potential warranty claims, repair or replacement costs under warranty provisions in our contracts could exceed the estimated cost to cure the claim which could be material to our financial results. We utilize percentage-of-completion accounting, depending on the size and length of a project, and variations from estimated contract performance could have a significant impact on our reported operating results as we progress toward completion of major jobs.
- 34 -
Backlog in our offshore products segment is subject to unexpected adjustments and cancellations and is, therefore, an imperfect indicator of our future revenues and earnings.
The revenues projected in our offshore products segment backlog may not be realized or, if realized, may not result in profits. Because of potential changes in the scope or schedule of our customers’ projects, we cannot predict with certainty when or if backlog will be realized. In addition, even where a project proceeds as scheduled, it is possible that contracted parties may default and fail to pay amounts owed to us. Material delays, cancellations or payment defaults could materially affect our financial condition, results of operations and cash flows.
Reductions in our backlog due to cancellations by customers or for other reasons would adversely affect, potentially to a material extent, the revenues and earnings we actually receive from contracts included in our backlog. Some of the contracts in our backlog are cancelable by the customer, subject to the payment of termination fees and/or the reimbursement of our costs incurred. We typically have no contractual right to the total revenues reflected in our backlog once a project is cancelled. If we experience significant project terminations, suspensions or scope adjustments to contracts included in our backlog, our financial condition, results of operations and cash flows may be adversely impacted.
We might be unable to employ a sufficient number of technical personnel.
Many of the products that we sell, especially in our offshore products segment, are complex and highly engineered and often must perform in harsh conditions. We believe that our success depends upon our ability to employ and retain technical personnel with the ability to design, utilize and enhance these products. In addition, our ability to expand our operations depends in part on our ability to increase our skilled labor force. During periods of increased activity, the demand for skilled workers is high, and the supply is limited. We have already experienced high demand and increased wages for labor forces serving our accommodations businesses in Canada and Australia. When these events occur, our cost structure increases and our growth potential could be impaired.
We might be unable to compete successfully with other companies in our industry.
The markets in which we operate are highly competitive and certain of them have relatively few barriers to entry. The principal competitive factors in our markets are product, equipment and service quality, availability, responsiveness, experience, technology, safety performance and price. In some of our business segments, we compete with the oil and gas industry’s largest oilfield service providers. These large national and multi-national companies have longer operating histories, greater financial, technical and other resources and greater name recognition than we do. Several of our competitors provide a broader array of services and have a stronger presence in more geographic markets. In addition, we compete with several smaller companies capable of competing effectively on a regional or local basis. Our competitors may be able to respond more quickly to new or emerging technologies and services and changes in customer requirements. Some contracts are awarded on a bid basis, which further increases competition based on price. As a result of competition, we may lose market share or be unable to maintain or increase prices for our present services or to acquire additional business opportunities, which could have a material adverse effect on our business, financial condition and results of operations.
If we do not develop new competitive technologies and products, our business and revenues may be adversely affected.
The market for our offshore products is characterized by continual technological developments to provide better performance in increasingly greater water depths, higher pressure levels and harsher conditions. If we are unable to design, develop and produce commercially competitive products in a timely manner in response to changes in technology, our business and revenues will be adversely affected. In addition, competitors or customers may develop new technologies, which address similar or improved solutions to our existing technology. Should our technologies, particularly in offshore products or in our completion services business, become the less attractive solution, our operations and profitability would be negatively impacted.
- 35 -
During periods of strong demand, we may be unable to obtain critical project materials on a timely basis.
Our operations depend on our ability to procure, on a timely basis, certain project materials, such as forgings, to complete projects in an efficient manner. Our inability to procure critical materials during times of strong demand could have a material adverse effect on our business and operations.
Our oilfield operations involve a variety of operating hazards and risks that could cause losses.
Our operations are subject to the hazards inherent in the oilfield business. These include, but are not limited to, equipment defects, blowouts, explosions, fires, collisions, capsizing and severe weather conditions. These hazards could result in personal injury and loss of life, severe damage to or destruction of property and equipment, pollution or environmental damage and suspension of operations. We may incur substantial liabilities or losses as a result of these hazards as part of our ongoing business operations. We may agree to indemnify our customers against specific risks and liabilities. While we maintain insurance protection against some of these risks, and seek to obtain indemnity agreements from our customers requiring the customers to hold us harmless from some of these risks, our insurance and contractual indemnity protection may not be sufficient or effective enough to protect us under all circumstances or against all risks. The occurrence of a significant event not fully insured or indemnified against or the failure of a customer to meet its indemnification obligations to us could materially and adversely affect our results of operations and financial condition.
If we were to lose a significant supplier of our tubular goods, we could be adversely affected.
During 2012, 81% of our total OCTG purchases were from three suppliers. If we were to lose any of these suppliers or if production at one or more of these suppliers was interrupted, our tubular services segment’s business, financial condition and results of operations could be adversely affected. If the extent of the loss or interruption were sufficiently large, the impact on us could be material.
Our operations may suffer due to increased industry-wide capacity of certain types of equipment or assets.
The demand for and pricing of certain types of our assets and equipment, particularly our accommodations assets, drilling rigs and completion services assets, is subject to the overall availability of such assets in the marketplace. If demand for our assets were to decrease, or to the extent that we and our competitors increase our fleets in excess of current demand, we may encounter decreased pricing for or utilization of our assets and services, which could adversely impact our operations and profits.
In addition, we have significantly increased our accommodations capacity in the oil sands region over the past seven years and in Australia over the past two years based on our expectation for current and future customer demand for accommodations in these areas. Should our customers build their own facilities to meet their accommodations needs or our competitors likewise increase their available accommodations, or activity in the oil sands or Australia declines significantly, demand and/or pricing for our accommodations could decrease, negatively impacting the profitability of our accommodations segment.
We might be unable to protect our intellectual property rights.
We rely on a variety of intellectual property rights that we use in our offshore products and completion services businesses, particularly our patents relating to our FlexJoint
®
and Merlin™ technology and intervention and downhole extended-reach tools utilized in the completion or workover of oil and natural gas wells. The market success of our technologies will depend, in part, on our ability to obtain and enforce our proprietary rights in these technologies, to preserve rights in our trade secret and non-public information, and to operate without infringing the proprietary rights of others. We may not be able to successfully preserve these intellectual property rights in the future and these rights could be invalidated, circumvented or challenged. If any of our patents or other intellectual property rights are determined to be invalid or unenforceable, or if a court limits the scope of claims in a patent or fails to recognize our trade secret rights, our competitive advantages could be significantly reduced in the relevant technology, allowing competition for our customer base to increase. In addition, the laws of some foreign countries in which our products and services may be sold do not protect intellectual property rights to the same extent as the laws of the United States. The failure of our company to protect our proprietary information and any successful intellectual property challenges or infringement proceedings against us could adversely affect our competitive position.
- 36 -
Loss of key members of our management could adversely affect our business.
We depend on the continued employment and performance of key members of our management. If any of our key managers resign or become unable to continue in their present roles and are not adequately replaced, our business operations could be materially adversely affected. We do not maintain "key man" life insurance for any of our officers.
We are exposed to the credit risks of our customers and other counterparties, and a general increase in the nonpayment and nonperformance by counterparties could have an adverse impact on our cash flows, results of operations and financial condition.
Risks of nonpayment and nonperformance by our counterparties are a concern in our business. We are subject to risks of loss resulting from nonpayment or nonperformance by our customers and other counterparties, such as our lenders and insurers. Many of our customers finance their activities through cash flow from operations, the incurrence of debt or the issuance of equity. In an economic downturn, commodity prices typically decline, and the credit markets and availability of credit can be expected to be constrained. Additionally, many of our customers’ equity values could decline. The combination of lower cash flow due to commodity prices, a reduction in borrowing bases under reserve-based credit facilities and the lack of available debt or equity financing may result in a significant reduction in our customers’ liquidity and ability to pay or otherwise perform on their obligations to us. Furthermore, some of our customers may be highly leveraged and subject to their own operating and regulatory risks, which increases the risk that they may default on their obligations to us. Any increase in the nonpayment and nonperformance by our counterparties could have an adverse impact on our operating results and could adversely affect our liquidity.
Employee and customer labor problems could adversely affect us.
As of December 31, 2012, we are party to collective bargaining agreements covering 1,692 employees in Canada, 574 employees in Australia, 17 employees in Argentina and 16 employees in the United Kingdom. In addition, our accommodations facilities serving oil sands development work in Northern Alberta, Canada and mining operations in Australia house both union and non-union customer employees. We have not experienced strikes, work stoppages or other slowdowns in the recent past, but we cannot guarantee that we will not experience such events in the future. A prolonged strike, work stoppage or other slowdown by our employees or by the employees of our customers could cause us to experience a disruption of our operations, which could adversely affect our business, financial condition and results of operations.
Provisions contained in our certificate of incorporation and bylaws could discourage a takeover attempt, which may reduce or eliminate the likelihood of a change of control transaction and, therefore, the ability of our stockholders to sell their shares for a premium.
Provisions contained in our certificate of incorporation and bylaws, such as a classified board, limitations on the removal of directors, on stockholder proposals at meetings of stockholders and on stockholder action by written consent and the inability of stockholders to call special meetings, could make it more difficult for a third-party to acquire control of our company. Our certificate of incorporation also authorizes our board of directors to issue preferred stock without stockholder approval. If our board of directors elects to issue preferred stock, it could increase the difficulty for a third-party to acquire us, which may reduce or eliminate our stockholders' ability to sell their shares of our common stock at a premium.
None.
- 37 -
The following table presents information about our principal properties and facilities. For a discussion about how each of our business segments utilizes its respective properties, please see “Part I, Item 1. Business.” Except as indicated below, we own all of these properties or facilities.
|
Location
|
Approximate
Square
|
Description
|
||
|
United States:
|
||||
|
Houston, Texas (lease)
|
21,420
|
Principal executive offices
|
||
|
Arlington, Texas (own and lease)
|
41 acres
|
Various contiguous offices, manufacturing and warehouse facilities located in thirteen buildings
|
||
|
Houston, Texas
|
25 acres
|
Offshore products office, manufacturing facility and yard
|
||
|
Houston, Texas
|
22 acres
|
Offshore products manufacturing facility and yard
|
||
|
Houston, Texas (lease)
|
50,750
|
Offshore products service facility and office
|
||
|
Houma, Louisiana
|
40 acres
|
Offshore products manufacturing facility and yard
|
||
|
Tulsa, Oklahoma
|
74,600
|
Molding facility for offshore products
|
||
|
Tulsa, Oklahoma (lease)
|
14,000
|
Molding facility for offshore products
|
||
|
Oklahoma City, Oklahoma
|
70,000
|
Offshore products service facility and office
|
||
|
Lampasas, Texas
|
48,500
|
Molding facility for offshore products
|
||
|
Lampasas, Texas (lease)
|
20,000
|
Warehouse for offshore products
|
||
|
Crosby, Texas
|
109 acres
|
Tubular yard
|
||
|
Midland, Texas
|
389 acres
|
Tubular yard
|
||
|
Godley, Texas
|
31 acres
|
Tubular yard
|
||
|
Montoursville, Pennsylvania
|
24 acres
|
Tubular yard
|
||
|
Searcy, Arkansas
|
14 acres
|
Tubular yard
|
||
|
Tulsa, Oklahoma (lease)
|
11,955
|
Tubular services business office
|
||
|
Houston, Texas (lease)
|
9,945
|
Tubular services business office
|
||
|
Dickinson, North Dakota (lease)
|
26 acres
|
Accommodations facility and yard
|
||
|
Vernal, Utah (lease)
|
21 acres
|
Accommodations facility and yard
|
||
|
Carrizo Springs, Texas (lease)
|
20 acres
|
Accommodations facility
|
||
|
Johnstown, Colorado
|
13 acres
|
Accommodations manufacturing facility and yard
|
||
|
Belle Chasse, Louisiana (own and lease)
|
10 acres
|
Accommodations manufacturing facility and yard
|
||
|
Three Rivers, Texas (lease)
|
9 acres
|
Accommodations facility
|
||
|
Big Piney, Wyoming (lease)
|
7 acres
|
Accommodations facility and yard
|
||
|
Stanley, North Dakota (lease)
|
7 acres
|
Accommodations facility
|
||
|
Englewood, Colorado (lease)
|
5,480
|
Accommodations office
|
||
|
Houston, Texas
|
23,441
|
Completion services office
|
||
|
Midland, Texas
|
11 acres |
Completion services shop
|
||
|
Houma, Louisiana
|
10 acres |
Completion services shop
|
||
|
Rock Springs, Wyoming
|
10 acres |
Completion services shop
|
||
|
Conway, Arkansas
|
7 acres |
Completion services shop
|
||
|
Oklahoma City, Oklahoma
|
3 acres
|
Completion services shop
|
||
|
Odessa, Texas
|
22 acres
|
Office, shop, warehouse and yard in support of drilling operations for well site services
|
||
|
Casper, Wyoming
|
7 acres
|
Office,
shop and yard in support of drilling operations for well site services
|
||
|
Canada:
|
||||
|
Fort McMurray, Alberta (Wapasu Creek and Henday Lodges) (lease)
|
240 acres
|
Accommodations facility
|
||
|
Fort McMurray, Alberta (Pebble Beach) (lease)
|
140 acres
|
Accommodations facility
|
||
|
Fort McMurray, Alberta (Conklin Lodge)(lease)
|
135 acres
|
Accommodations facility
|
||
|
Fort McMurray, Alberta (Beaver River and Athabasca Lodges) (lease)
|
128 acres
|
Accommodations facility
|
||
|
Fort McMurray, Alberta (Christina Lake Lodge)
|
45 acres
|
Accommodations facility
|
||
|
Edmonton, Alberta
|
33 acres
|
Accommodations manufacturing facility
|
||
|
Grimshaw, Alberta (lease)
|
20 acres
|
Accommodations equipment yard
|
||
|
Nisku, Alberta
|
9 acres
|
Accommodations manufacturing facility
|
||
|
Edmonton, Alberta (lease)
|
86,376
|
Accommodations office and warehouse
|
||
|
Edmonton, Alberta (lease)
|
28,253
|
Accommodations office
|
||
|
Edmonton, Alberta (lease)
|
16,130
|
Accommodations office
|
||
|
Spruce Grove, Alberta
|
15,000
|
Accommodations facility and equipment yard
|
- 38 -
|
Location
|
Approximate
Square
|
Description
|
|
Australia:
|
||||
|
Coppabella, Queensland, Australia
|
198 acres
|
Accommodations facility
|
||
|
Calliope, Queensland, Australia
|
124 acres
|
Accommodations facility
|
||
|
Narrabri, New South Wales, Australia
|
82 acres
|
Accommodations facility
|
||
|
Dysart, Queensland, Australia
|
50 acres
|
Accommodations facility
|
||
|
Middlemount, Queensland, Australia
|
37 acres
|
Accommodations facility
|
||
|
Karratha, Western Australia, Australia (lease)
|
34 acres
|
Accommodations facility
|
||
|
Kambalda, Western Australia, Australia
|
27 acres
|
Accommodations facility
|
||
|
Nebo, Queensland, Australia
|
26 acres
|
Accommodations facility
|
||
|
Moranbah, Queensland, Australia
|
17 acres
|
Accommodations facility
|
||
|
Ormeau, Queensland, Australia (lease)
|
3 acres
|
Accommodations manufacturing facility
|
||
|
Yatala, Queensland, Australia (lease)
|
2 acres
|
Accommodations manufacturing facility
|
||
|
Sydney, New South Wales, Australia (lease)
|
17,276
|
Accommodations office
|
||
|
Brisbane, Queensland, Australia (lease)
|
7,115
|
Accommodations office
|
||
|
Other International:
|
||||
|
Aberdeen, Scotland (lease)
|
15 acres
|
Offshore products manufacturing facility and yard
|
||
|
Rio de Janeiro, Brazil
|
31 acres
|
Offshore products manufacturing facility and yard
|
||
|
Macaé, Brazil
|
17 acres
|
Offshore products manufacturing facility and yard
|
||
|
Macaé, Brazil (lease)
|
6 acres
|
Offshore products manufacturing facility and yard
|
||
|
Singapore (lease)
|
155,398
|
Offshore products manufacturing facility
|
||
|
Bathgate, Scotland
|
3 acres
|
Offshore products manufacturing facility and yard
|
||
|
Barrow-in-Furness, England (own and lease)
|
63,300
|
Offshore products service facility and yard
|
||
|
Rayong Province, Thailand (lease)
|
28,000
|
Offshore products service and manufacturing facility
|
We have eight tubular sales offices and a total of 55 completion services locations throughout the United States and in Canada, Mexico and Argentina. Most of these office locations are leased and provide sales, technical support and personnel services to our customers. We also have various offices supporting our business segments which are both owned and leased. We believe that our leases are at competitive or market rates and do not anticipate any difficulty in leasing additional suitable space upon expiration of our current lease terms.
We are a party to various pending or threatened claims, lawsuits and administrative proceedings seeking damages or other remedies concerning our commercial operations, products, employees and other matters, including occasional claims by individuals alleging exposure to hazardous materials as a result of our products or operations. Some of these claims relate to matters occurring prior to our acquisition of businesses, and some relate to businesses we have sold. In certain cases, we are entitled to indemnification from the sellers of businesses, and in other cases, we have indemnified the buyers of businesses from us. Although we can give no assurance about the outcome of pending legal and administrative proceedings and the effect such outcomes may have on us, we believe that any ultimate liability resulting from the outcome of such proceedings, to the extent not otherwise provided for or covered by indemnity or insurance, will not have a material adverse effect on our consolidated financial position, results of operations or liquidity.
Not applicable.
Common Stock Information
Our authorized common stock consists of 200,000,000 shares of common stock. There were 54,873,460 shares of common stock outstanding as of February 19, 2013. The approximate number of record holders of our common stock as of February 19, 2012 was 27. Our common stock is traded on the New York Stock Exchange under the ticker symbol OIS. The closing price of our common stock on February 19, 2013 was $80.25 per share.
- 39 -
The following table sets forth the range of high and low quarterly sales prices of our common stock:
|
Sales Price
|
||||||||
|
|
High
|
Low
|
||||||
|
2011
|
||||||||
|
First Quarter
|
$ | 78.43 | $ | 60.76 | ||||
|
Second Quarter
|
83.13 | 68.49 | ||||||
|
Third Quarter
|
87.00 | 49.40 | ||||||
|
Fourth Quarter
|
78.53 | 44.77 | ||||||
|
2012
|
||||||||
|
First Quarter
|
$ | 87.65 | $ | 75.17 | ||||
|
Second Quarter
|
82.83 | 60.03 | ||||||
|
Third Quarter
|
87.63 | 65.17 | ||||||
|
Fourth Quarter
|
80.46 | 63.42 | ||||||
We have not declared or paid any cash dividends on our common stock since our IPO and do not intend to declare or pay any cash dividends on our common stock in the foreseeable future. Furthermore, our existing credit facilities restrict the payment of dividends. For additional discussion of such restrictions, please see “Part II, Item 7. Management’s Discussion and Analysis of Financial Condition and Results of Operation.” Any future determination as to the declaration and payment of dividends will be at the discretion of our Board of Directors and will depend on then existing conditions, including our financial condition, results of operations, contractual restrictions, capital requirements, business prospects and other factors that our Board of Directors considers relevant.
- 40 -
PERFORMANCE GRAPH
The following performance graph and chart compare the cumulative total stockholder return on the Company's common stock to the cumulative total return on the Standard & Poor's 500 Stock Index and Philadelphia OSX Index, an index of oil and gas related companies that represent an industry composite of the Company's peer group, for the period from December 31, 2007 to December 31, 2012. The graph and chart show the value at the dates indicated of $100 invested at December 31, 2007 and assume the reinvestment of all dividends.
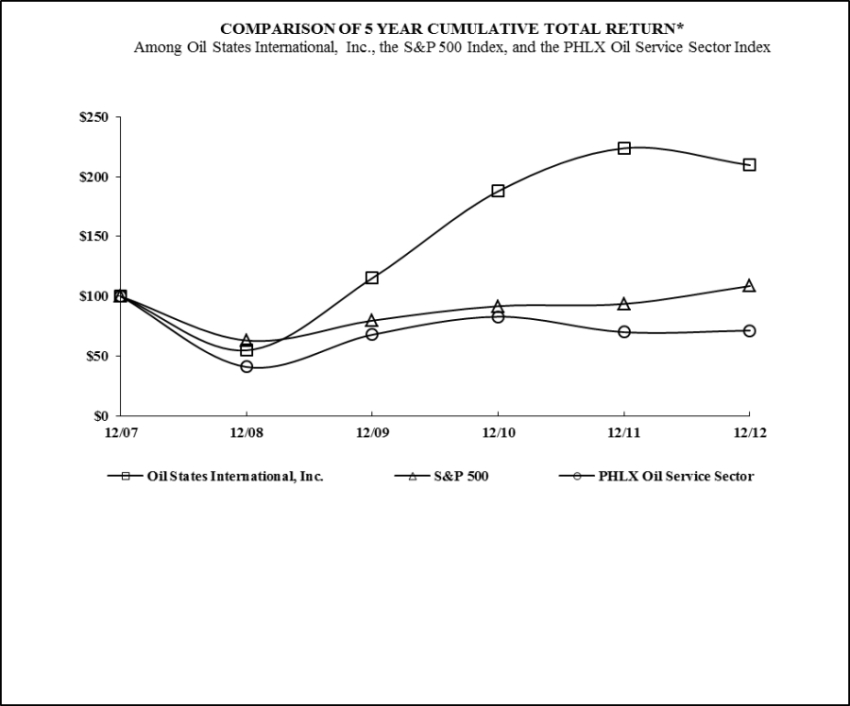
Oil States International – NYSE
|
Cumulative Total Return
|
||||||||||||||||||||||||
| 12/07 | 12/08 | 12/09 | 12/10 | 12/11 | 12/12 | |||||||||||||||||||
|
OIL STATES INTERNATIONAL, INC.
|
$ | 100.00 | $ | 54.78 | $ | 115.15 | $ | 187.84 | $ | 223.83 | $ | 209.67 | ||||||||||||
|
S & P 500
|
100.00 | 63.00 | 79.67 | 91.67 | 93.61 | 108.59 | ||||||||||||||||||
|
PHLX OIL SERVICE SECTOR (OSX)
|
100.00 | 40.95 | 67.83 | 82.91 | 70.00 | 71.39 | ||||||||||||||||||
*$100 invested on December 31, 2007 in stock or index-including reinvestment of dividends. Fiscal year ending December 31st.
|
(1)
|
This graph is not "soliciting material," is not deemed filed with the Commission and is not to be incorporated by reference in any filing by us under the Securities Act, or the Exchange Act, whether made before or after the date hereof and irrespective of any general incorporation language in any such filing.
|
|
(2)
|
The stock price performance shown on the graph is not necessarily indicative of future price performance. Information used in the graph was obtained from Research Data Group, Inc., a source believed to be reliable, but we are not responsible for any errors or omissions in such information.
|
Prepared by Research Data Group, Inc. Used with permission. Copyright© 2013. All rights reserved. (www.researchdatagroup.com/S&P.htm).
- 41 -
Unregistered Sales of Equity Securities and Use of Proceeds
None.
Purchases of Equity Securities by the Issuer and Affiliated Purchases
|
Period
|
Total Number of Shares Purchased
|
Average Price Paid per Share
|
Total Number of Shares Purchased
as Part of Publicly Announced Program
|
Approximate
Dollar Value of Shares That May Yet Be Purchased Under the Program
(1)
|
||||||||||||
|
October 1, 2012 –
October 31, 2012
|
583 | (2) | $ | 76.52 | (3) | -- | $ | 200,000,000 | ||||||||
|
November 1, 2012 –
November 30, 2012
|
146,494 | (4) | $ | 66.53 | (5) | 146,396 | $ | 190,260,656 | ||||||||
|
December 1, 2012 -
December 31, 2012
|
79,400 | $ | 69.34 | (6) | 79,400 | $ | 184,754,796 | |||||||||
|
Total
|
226,477 | $ | 67.54 | 225,796 | $ | 184,754,796 | ||||||||||
|
(1)
|
On August 23, 2012, we announced a share repurchase program of up to $200,000,000 to replace the prior share repurchase authorization, which was set to expire on September 1, 2012. The current share repurchase program expires on September 1, 2014.
|
|
(2)
|
Shares surrendered to us by participants in our 2001 Equity Participation Plan to settle the participants’ personal tax liabilities that resulted from the lapsing of restrictions on shares awarded to the participants under the plan.
|
|
(3)
|
The price paid per share was based on the weighted average closing price of our Company’s common stock on October 4, 2012 and October 5, 2012, which represent the dates the restrictions lapsed on such shares.
|
|
(4)
|
Included in these shares are 98 shares surrendered to us by participants in our 2001 Equity Participation Plan to settle the participants’ personal tax liabilities that resulted from the lapsing of restrictions on shares awarded to the participants under the plan.
|
|
(5)
|
The price paid per share was based (a) on the dates in which we repurchased shares under our common stock repurchase program, and (b) on the weighted average closing price of our Company’s common stock on November 3, 2012, which represents the date the restrictions lapsed on such shares.
|
|
(6)
|
The price paid per share was based on the weighted average closing price of our Company’s common stock on the date in which we repurchased shares under our common stock repurchase program.
|
- 42 -
The selected financial data on the following pages include selected historical financial information of our company as of and for each of the five years ended December 31, 2012. The following data should be read in conjunction with “Part II, Item 7. Management's Discussion and Analysis of Financial Condition and Results of Operations” and the Company's Consolidated Financial Statements and related notes included in “Part II, Item 8. Financial Statements” of this Annual Report on Form 10-K.
Selected Financial Data
(In thousands, except per share amounts)
|
Year Ended December 31,
|
||||||||||||||||||||
|
2012
|
2011
|
2010
|
2009
|
2008
|
||||||||||||||||
|
Statement of Income Data:
|
||||||||||||||||||||
|
Revenues
|
$ | 4,413,088 | $ | 3,479,180 | $ | 2,411,984 | $ | 2,108,250 | $ | 2,948,457 | ||||||||||
|
Costs and Expenses:
|
||||||||||||||||||||
|
Product costs, service and other costs
|
3,292,969 | 2,599,267 | 1,874,294 | 1,640,198 | 2,234,974 | |||||||||||||||
|
Selling, general and administrative expenses
|
203,651 | 182,434 | 150,865 | 139,293 | 143,080 | |||||||||||||||
|
Depreciation and amortization expense
|
230,098 | 188,147 | 124,202 | 118,108 | 102,604 | |||||||||||||||
|
Impairment of goodwill
|
-- | -- | -- | 94,528 | 85,630 | |||||||||||||||
|
Other operating (income) expense
|
2,590 | 1,809 | 7,041 | (2,606 | ) | (1,586 | ) | |||||||||||||
|
Operating income
|
683,780 | 507,523 | 255,582 | 118,729 | 383,755 | |||||||||||||||
|
Interest expense, net of capitalized interest
|
(68,922 | ) | (57,506 | ) | (16,274 | ) | (15,266 | ) | (23,585 | ) | ||||||||||
|
Interest income
|
1,583 | 1,700 | 751 | 380 | 3,561 | |||||||||||||||
|
Equity in earnings (loss) of unconsolidated affiliates
|
243 | (163 | ) | 239 | 1,452 | 4,035 | ||||||||||||||
|
Other income
|
10,211 | 3,515 | 330 | 414 | 5,684 | |||||||||||||||
|
Income before income taxes
|
626,895 | 455,069 | 240,628 | 105,709 | 373,450 | |||||||||||||||
|
Income tax provision
(1)
|
(177,047 | ) | (131,647 | ) | (72,023 | ) | (46,097 | ) | (154,151 | ) | ||||||||||
|
Net income
|
$ | 449,848 | $ | 323,422 | $ | 168,605 | $ | 59,612 | $ | 219,299 | ||||||||||
|
Less: Net income attributable to noncontrolling interest
|
1,239 | 969 | 587 | 498 | 446 | |||||||||||||||
|
Net income attributable to Oil States International, Inc.
|
$ | 448,609 | $ | 322,453 | $ | 168,018 | $ | 59,114 | $ | 218,853 | ||||||||||
|
Net income per share attributable to Oil States International, Inc:
|
||||||||||||||||||||
|
Basic
|
$ | 8.47 | $ | 6.30 | $ | 3.34 | $ | 1.19 | $ | 4.41 | ||||||||||
|
Diluted
|
$ | 8.10 | $ | 5.86 | $ | 3.19 | $ | 1.18 | $ | 4.26 | ||||||||||
|
Average common shares outstanding
|
||||||||||||||||||||
|
Basic
|
52,959 | 51,163 | 50,238 | 49,625 | 49,622 | |||||||||||||||
|
Diluted
|
55,384 | 55,007 | 52,700 | 50,219 | 51,414 | |||||||||||||||
|
Year Ended December 31,
|
||||||||||||||||||||
|
2012
|
2011
|
2010
|
2009
|
2008
|
||||||||||||||||
|
Other Data:
|
||||||||||||||||||||
|
EBITDA, as defined
(2)
|
$ | 923,093 | $ | 698,053 | $ | 379,766 | $ | 238,205 | $ | 495,632 | ||||||||||
|
Capital expenditures, including capitalized interest
|
487,937 | 487,482 | 182,207 | 124,488 | 247,384 | |||||||||||||||
|
Acquisitions of businesses, net of cash acquired
(3)
|
80,449 | 2,412 | 709,575 | (18 | ) | 29,835 | ||||||||||||||
|
Net cash provided by operating activities
|
637,483 | 215,913 | 230,922 | 453,362 | 257,464 | |||||||||||||||
|
Net cash used in investing activities, including capital expenditures
(3)
|
(576,977 | ) | (488,955 | ) | (889,680 | ) | (102,608 | ) | (246,094 | ) | ||||||||||
|
Net cash provided by (used in) financing activities
|
120,558 | 257,888 | 649,032 | (296,773 | ) | (1,666 | ) | |||||||||||||
|
At December 31,
|
||||||||||||||||||||
|
2012
|
2011
|
2010
|
2009
|
2008
|
||||||||||||||||
|
Balance Sheet Data:
|
||||||||||||||||||||
|
Cash and cash equivalents
|
$ | 253,172 | $ | 71,721 | $ | 96,350 | $ | 89,742 | $ | 30,199 | ||||||||||
|
Total current assets
|
1,826,092 | 1,489,659 | 1,100,004 | 925,568 | 1,237,484 | |||||||||||||||
|
Property, plant and equipment, net
|
1,852,126 | 1,557,088 | 1,252,657 | 749,601 | 695,338 | |||||||||||||||
|
Total assets
|
4,439,962 | 3,703,641 | 3,015,999 | 1,932,386 | 2,298,518 | |||||||||||||||
|
Long-term debt and capital leases, excluding current portion and 2 3/8% Notes
|
1,279,805 | 971,621 | 731,732 | 8,215 | 299,948 | |||||||||||||||
|
2 3/8% contingent convertible senior subordinated notes
|
-- | 170,884 | 163,108 | 155,859 | 149,110 | |||||||||||||||
|
Total stockholders' equity
|
2,465,800 | 1,963,272 | 1,628,933 | 1,382,066 | 1,235,541 | |||||||||||||||
|
(1)
|
Our effective tax rate increased in 2008 and 2009 due to the impairment of non-deductible goodwill.
|
- 43 -
|
(2)
|
The term EBITDA as defined consists of net income plus interest expense, net, income taxes, depreciation and amortization. EBITDA as defined is not a measure of financial performance under generally accepted accounting principles. You should not consider it in isolation from or as a substitute for net income or cash flow measures prepared in accordance with generally accepted accounting principles or as a measure of profitability or liquidity. Additionally, EBITDA as defined may not be comparable to other similarly titled measures of other companies. The Company has included EBITDA as defined as a supplemental disclosure because its management believes that EBITDA as defined provides useful information regarding its ability to service debt and to fund capital expenditures and provides investors a helpful measure for comparing its operating performance with the performance of other companies that have different financing and capital structures or tax rates. The Company uses EBITDA as defined to compare and to monitor the performance of its business segments to other comparable public companies and as one of the primary measures to benchmark for the award of incentive compensation under its annual incentive compensation plan.
|
|
(3)
|
On December 30, 2010, we acquired all of the ordinary shares of The MAC for a total purchase price of $638.0 million, net of cash acquired.
|
We believe that net income is the financial measure calculated and presented in accordance with generally accepted accounting principles that is most directly comparable to EBITDA as defined. The following table reconciles EBITDA as defined with our net income, as derived from our financial information (in thousands):
|
Year Ended December 31,
|
||||||||||||||||||||
|
2012
|
2011
|
2010
|
2009
|
2008
|
||||||||||||||||
|
Net income attributable to Oil States International, Inc.
|
$ | 448,609 | $ | 322,453 | $ | 168,018 | $ | 59,114 | $ | 218,853 | ||||||||||
|
Depreciation and amortization expense
|
230,098 | 188,147 | 124,202 | 118,108 | 102,604 | |||||||||||||||
|
Interest expense, net
|
67,339 | 55,806 | 15,523 | 14,886 | 20,024 | |||||||||||||||
|
Income tax provision
|
177,047 | 131,647 | 72,023 | 46,097 | 154,151 | |||||||||||||||
|
EBITDA, as defined
|
$ | 923,093 | $ | 698,053 | $ | 379,766 | $ | 238,205 | $ | 495,632 | ||||||||||
This Item 7 contains “forward-looking statements” - within the meaning of Section 27A of the Securities Act and Section 21E of the Exchange Act that are based on management’s current expectations, estimates and projections about our business operations. Our actual results may differ materially from those currently anticipated and expressed in such forward-looking statements as a result of numerous factors, including the known material factors set forth in “Part I, Item 1A. Risk Factors.” You should read the following discussion and analysis together with our Consolidated Financial Statements and the notes to those statements included elsewhere in this Annual Report on Form 10-K.
Macroeconomic Environment
We provide a broad range of products and services to the oil and gas industry through our accommodations, offshore products, well site services and tubular services business segments. In our accommodations segment, we support both the oil and gas and mining industries. Demand for our products and services is cyclical and substantially dependent upon activity levels in the oil and gas and mining industries, particularly our customers’ willingness to spend capital on the exploration for and development of oil, natural gas, met coal and other mineral reserves. Our customers’ spending plans are generally based on their outlook for near-term and long-term commodity prices, economic growth, commodity demand and estimates of resource production. As a result, demand for our products and services is highly sensitive to current and expected commodity prices, principally that of crude oil, met coal and, to a lesser extent, natural gas.
- 44 -
In the past few years, crude oil prices have been volatile due to global economic movements and uncertainties including regional take-away capacity. In the first quarter of 2012, the price of West Texas Intermediates (WTI) crude oil increased from a monthly average price of $100 per barrel in January to $106 per barrel in March as positive economic news related to growth rates projected in China and other emerging markets, consumer spending and U.S. consumer confidence indicating that an economic recovery was underway. In addition, prices increased in response to tensions in the Middle East region which caused fears of supply disruption. However, crude oil prices came under pressure during the second quarter of 2012 due to increased crude oil inventories, insufficient take-away capacity in Cushing, Oklahoma, higher output expectations amid new technology and lower economic growth forecasts. In addition, certain regional markets such as the Bakken, Permian Basin and Eagle Ford were negatively impacted by significant discounts to WTI due to insufficient pipeline and rail take-away capacity. The spot price of WTI crude oil decreased to as low as $78 per barrel in the second quarter of 2012. Since the end of the second quarter of 2012, the spot price of crude oil has substantially recovered and, as of February 19, 2013, is trading at approximately $97 per barrel for WTI crude and approximately $118 per barrel for Intercontinental Exchange (ICE) Brent crude. If the global supply of oil and global inventory levels continue to decrease due to government instability in many oil-producing nations and energy demand continues to increase in countries such as China, India and the U.S., we could see continued and/or additional increases in WTI oil prices which could positively affect future U.S. drilling activity. In Canada, Western Canadian Select (WCS), which is the crude price that many of our oil sands accommodations customers receive, traded at a discount to WTI that ranged from $7.25 to $42.50 per barrel during 2012. The WCS discount was primarily due to increasing crude production from the Canadian oil sands region coupled with limited pipeline and rail capacity to transport the oil sands crude to heavy oil refineries either in the U.S. or Canada. This WCS discount had and is likely to continue to have a negative impact on our oil sands customers’ desire to invest in increased oil sands production. As of February 19, 2013, WCS is trading at a discount to WTI of $25.00.
In spite of WTI’s recovery to over $90 per barrel late in 2012 and in the first quarter of 2013, there remains a risk that crude prices deteriorate going forward due to potentially slowing growth rates in China, fiscal and financial uncertainty in various European countries, a prolonged level of relatively high unemployment in the U.S. and other advanced economies and inflation risks in certain emerging markets. Recent WTI and Brent crude pricing trends are as follows:
|
Average Price (per bbl)
(1)
|
||||||||||||
|
Quarter ended
|
WTI
|
Brent Crude
|
Western Canadian Select
|
|||||||||
|
12/31/2012
|
$ | 88.01 | $ | 110.15 | $ | 61.34 | ||||||
|
9/30/2012
|
92.17 | 109.63 | 76.75 | |||||||||
|
6/30/2012
|
93.38 | 108.90 | 73.53 | |||||||||
|
3/31/2012
|
102.85 | 118.54 | 75.82 | |||||||||
|
12/31/2011
|
94.03 | 109.31 | 81.56 | |||||||||
|
9/30/2011
|
89.71 | 112.47 | 75.05 | |||||||||
|
6/30/2011
|
102.51 | 117.12 | 84.72 | |||||||||
|
3/31/2011
|
93.93 | 104.90 | 72.43 | |||||||||
|
12/31/2010
|
85.10 | 86.80 | 69.07 | |||||||||
|
9/30/2010
|
76.01 | 76.41 | 57.08 | |||||||||
(1) Source: WTI and Brent prices from U.S. Energy Information Administration (EIA) and WCS prices from Bloomberg.
- 45 -
Due to significant over-supply of natural gas stemming from increased production from shale plays, natural gas prices fell precipitously in the fourth quarter of 2011 and the first half of 2012, reaching a low of $1.82 in April 2012. Since these lows, prices for natural gas in the United States improved subsequent to April 2012, largely due to increased demand for natural gas for electrical power generation and switching from coal to gas, but continue to be weak due to the rise in production from unconventional natural gas resources in North America, specifically onshore shale production, resulting from the broad application of horizontal drilling and hydraulic fracturing techniques. Natural gas prices are trading at approximately $3.30 per Mcf as of February 19, 2013. In addition, a considerable amount of natural gas is being derived as a by-product of drilling crude oil and natural gas liquids-oriented wells in liquids rich onshore basins. As a result, the U.S. gas-related working rig count has declined from more than 800 rigs at the beginning of 2012 to less than 430 rigs as of February 19, 2013. Although still overstocked, natural gas inventories in the U.S. have declined from 60% above the 5-year average as of the end of the first quarter of 2012 to only 12% above the 5-year average as of the end of 2012. Any increases in the supply of natural gas, whether the supply comes from conventional or unconventional production or associated gas production from oil wells, could constrain prices for natural gas for an extended period and result in fewer rigs drilling for gas in the near-term. Recent natural gas pricing trends are as follows:
|
Quarter ended
|
Natural Gas Average Price
(1)
(per mcf)
|
|||
|
12/31/2012
|
$ | 3.40 | ||
|
9/30/2012
|
2.88 | |||
|
6/30/2012
|
2.29 | |||
|
3/31/2012
|
2.44 | |||
|
12/31/2011
|
3.32 | |||
|
9/30/2011
|
4.12 | |||
|
6/30/2011
|
4.37 | |||
|
3/31/2011
|
4.18 | |||
|
12/31/2010
|
3.81 | |||
|
9/30/2010
|
4.28 | |||
(1)
Source: natural gas prices from EIA.
Chinese steel production growth has fallen this year as European economies have contracted and U.S. economic growth has been anemic, lowering demand for steel and steel inputs such as met coal and iron ore. As a result, prices for met coal and iron ore fell throughout 2012, but appear to have stabilized at current levels. Met coal prices have decreased from over $200/metric ton at the beginning of 2012 to approximately $160/metric ton at the end of 2012. Depressed met coal prices have led to some coal mine closures as well as delays in the start-up of some coal mining projects in Australia.
Various oil and gas industry analysts have projected increased 2013 global exploration and production expenditures compared to 2012. North American capital spending plans are likely to be lower year-over-year and are expected to be focused in oil-related onshore shale areas while international exploration and production budgets are expected to increase and primarily be spent on offshore projects.
Overview
Demand for our accommodations and offshore products segments is primarily tied to the long-term outlook for commodity prices. In contrast, demand for our well site services and tubular services segments responds to shorter-term movements in oil and natural gas prices and, specifically, changes in North American drilling and completion activity. Other factors that can affect our business and financial results include the general global economic environment and regulatory changes in the U.S. and internationally.
Generally, our oil sands and mining accommodations’ customers are making multi-billion dollar investments to develop their prospects, which have estimated reserve lives of ten years to in excess of thirty years and, consequently, these investments are dependent on those customers' longer-term view of commodity demand and prices. Oil sands development activity has increased over the past several years and has had a positive impact on our accommodations segment. Recent announcements of new and expanded oil sands projects will create the opportunity for extensions of existing accommodations contracts and incremental accommodations contracts for us in Canada. For example, in the third quarter of 2012, we were awarded a ten-year contract in support of future operations personnel working on the Kearl Project, one of the Canadian oil sands potentially largest mining operations. In addition, several major and national oil companies have announced acquisitions and joint ventures to develop oil sands leases or other acquisitions of oil sands exposure that should bode well for future oil sands investment and, as a result, demand for oil sands accommodations. With the WCS discount to WTI, several oil sands customers have announced the deferral of new oil sands projects, which could negatively affect our ability to expand our oil sands room count or our occupancy levels.
We are expanding our Australian accommodations capacity to meet increasing demand, notably in the Bowen Basin in Queensland and in the Gunnedah and Hunter basins in New South Wales to support coal production, and in Western Australia to support LNG and other energy-related projects. Accommodations deployed to support onshore U.S. drilling activity in several of the active shale play regions have also favorably contributed to our results.
- 46 -
Our offshore products segment provides highly engineered products for offshore oil and natural gas drilling and production systems and facilities. Sales of our offshore products and services depend primarily upon development of infrastructure for offshore production systems and subsea pipelines, repairs and upgrades of existing offshore drilling rigs and construction of new offshore drilling rigs and vessels. In this segment, we are particularly influenced by global deepwater drilling and production spending, which are driven largely by our customers’ longer-term outlook for oil and natural gas prices.
In our well site services business segment, we predominantly provide completion services and, to a lesser extent, land drilling services. Our completion services business provides equipment and service personnel utilized in the completion and initial production of new and recompleted wells. Activity for the completion services business is dependent primarily upon the level and complexity of drilling, completion and workover activity throughout North America. Well complexity has increased as the number of productive zones completed in connection with horizontal drilling has increased. Demand for our drilling services is driven by land drilling activity in our primary drilling markets of West Texas, where we primarily drill oil wells, and the Rocky Mountain area in the U.S., where we drill both liquids-rich and natural gas wells.
Through our tubular services segment, we distribute a broad range of casing and tubing used in the drilling and completion of oil and natural gas wells primarily in the United States. Accordingly, sales and gross margins in our tubular services segment depend upon the overall level of drilling activity, the types of wells being drilled, movements in global steel input prices and the overall industry level of OCTG inventory and pricing. Historically, tubular services' gross margin generally expands during periods of rising OCTG prices and contracts during periods of decreasing OCTG prices.
We have a diversified product and service offering, which has led to exposure to activities conducted throughout the oil and gas cycle. Demand for our tubular services, land drilling and completion services businesses is highly correlated to changes in the drilling rig count in the United States and, to a much lesser extent, Canada. The table below sets forth a summary of North American rig activity, as measured by Baker Hughes Incorporated, for the periods indicated.
|
Average Rig Count for
Year Ended December 31,
|
||||||||||||||||||||
|
2012
|
2011
|
2010
|
2009
|
2008
|
||||||||||||||||
|
U.S. Land – Oil
|
1,335 | 966 | 573 | 270 | 377 | |||||||||||||||
|
U.S. Land - Natural gas and other
|
537 | 877 | 937 | 772 | 1,436 | |||||||||||||||
|
U.S. Offshore
|
47 | 32 | 31 | 44 | 65 | |||||||||||||||
|
Total U.S.
|
1,919 | 1,875 | 1,541 | 1,086 | 1,878 | |||||||||||||||
|
Canada
|
365 | 423 | 351 | 221 | 379 | |||||||||||||||
|
Total North America
|
2,284 | 2,298 | 1,892 | 1,307 | 2,257 | |||||||||||||||
The rig count fell precipitously in the first half of 2009 in response to the impact of the global economic downturn which negatively impacted energy prices but has substantially recovered from its June 2009 low. The average North American rig count for the year ended December 31, 2012 decreased by fourteen rigs, or less than 1%, compared to the average for the year ended December 31, 2011 largely due to a decline in natural gas drilling partially offset by growth in the U.S. land oil rig count.
A factor that influences the financial results for our accommodations segment is the exchange rate between the U.S. dollar and the Canadian dollar and, to a lesser extent, the exchange rate between the U.S. dollar and the Australian dollar. Our accommodations segment has derived a majority of its revenues and operating income in Canada and, since 2011, Australia. These revenues and profits are translated into U.S. dollars for U.S. GAAP financial reporting purposes. For the year ended December 31, 2012, average U.S. dollar and Canadian and Australian dollar exchange rates were comparable with a less than 1% change over average exchange rates in 2011.
Steel and steel input prices influence the pricing decisions of our OCTG suppliers, thereby impacting the pricing and margins of our tubular services segment. Steel prices on a global basis declined precipitously during the recession in 2009. Industry inventories increased materially as the rig count declined, and OCTG imports remained at high levels. These developments in the OCTG marketplace had a material detrimental impact on OCTG pricing and, accordingly, on our revenues and margins realized during the last half of 2009 in our tubular services segment. These negative trends moderated in 2010 because of a reduction in imports, largely due to the imposition of trade sanctions on Chinese OCTG imports, coupled with increases in the U.S. rig count.
- 47 -
During 2011 and 2012, OCTG marketplace supply and demand became more balanced compared to the previous two years. Increased supplies of OCTG have met the increased demand created by expanded drilling activity. Throughout 2011 and 2012, imports of OCTG have increased, particularly goods imported from Canada and Korea followed by India, Mexico and Japan. Additionally, domestic OCTG mill capacity increased in 2012. These increases in supply have been in response to increased well complexity coupled with the 2% year-over-year increase in the drilling rig count in the U.S. The OCTG Situation Report suggests that industry OCTG inventory levels have increased throughout 2012 and currently stand at five to six months' supply. Ample industry inventory on the ground along with increasing imports and domestic production coupled with modestly declining drilling activity put downward pressure on OCTG prices throughout 2012. Average OCTG prices declined 9% during 2012.
We remain focused on working capital management and generating returns on invested capital in our tubular services segment and will continue to monitor industry inventory levels, forecasted drilling and completion activity and OCTG prices.
While global demand for oil and natural gas are significant factors influencing our business generally, certain other factors also influence our business, such as the pace of worldwide economic growth and the recovery in U.S. Gulf of Mexico drilling following the lifting of the government imposed drilling moratorium.
Although higher than 2011, the drilling rig count in 2012 in the U.S. Gulf of Mexico remains below historical levels following the April 2010 Macondo well incident and resultant oil spill in the U.S. Gulf of Mexico. Beginning in the third quarter of 2011, however, U.S. Gulf of Mexico drilling activity has shown signs of a slow but steady, recovery as permitting levels have improved. New well permitting has increased from 109 permits issued in 2011 to 179 permits issued in 2012.
We continue to monitor the global economy, the demand for crude oil, met coal and natural gas and the resultant impact on the capital spending plans and operations of our customers in order to plan our business. Our capital expenditures in 2012 totaled $488 million compared to 2011 capital expenditures of $487 million. Our 2012 capital expenditures included funding to expand our Canadian oil sands and Australian mining related accommodations facilities, to fund our other product and service offerings, and to upgrade our equipment and facilities. Approximately two-thirds of our total 2012 capital expenditures were spent in our accommodations segment. In our well site services segment, we continue to monitor industry capacity additions and will make future capital expenditure decisions based on an evaluation of both the market outlook and industry fundamentals. We currently expect to spend a total of approximately $600 million to $650 million for capital expenditures during 2013.
Recent Acquisitions
On December 14, 2012, we acquired all of the equity of Tempress for purchase price consideration of $48.3 million consisting of $32.5 million of cash and contingent consideration with a fair value of $15.8 million. The Company funded escrow accounts totaling $25.3 million related to the contingent consideration and seller transaction indemnities which are classified as “Other noncurrent assets” in our December 31, 2012 Consolidated Balance Sheet. Liabilities for contingent consideration and escrowed amounts potentially due to the seller total $21.1 million at December 31, 2012 and are classified as “Other noncurrent liabilities” in our Consolidated Balance Sheet. Headquartered in Kent, Washington, Tempress designs, develops and markets a suite of highly specialized, hydraulically-activated tools utilized during downhole completion activities. The operations of Tempress have been included in our well site services segment since the acquisition date.
On July 2, 2012, we acquired all of the operating assets of Piper for total cash consideration of $48.0 million. Headquartered in Oklahoma City, Oklahoma, Piper designs and manufactures high pressure valves and manifold components for oil and gas industry projects located offshore (both surface and subsea) and onshore. The operations of Piper have been included in our offshore products segment since the acquisition date.
On November 1, 2011, we purchased an open camp accommodations facility located in Carrizo Springs, Texas for total consideration of $2.2 million. This facility provides accommodations support to customers working in the Eagle Ford Shale basin. The operations of the Carrizo Springs facility have been included in our accommodations segment since the acquisition date.
- 48 -
On December 30, 2010, we acquired all of the ordinary shares of The MAC, through a Scheme of Arrangement (the Scheme) under the Corporations Act of Australia. The MAC is headquartered in Sydney, Australia and supplies accommodations services to the Australian natural resources market. Under the terms of the Scheme, each shareholder of The MAC received $3.95 (A$3.90) per share in cash. The total purchase price was $638 million, net of cash acquired plus debt assumed of $87 million. The MAC’s operations have been included in our accommodations segment beginning in 2011.
On December 20, 2010, we also acquired all of the operating assets of Mountain West for total consideration of $47.1 million including estimated contingent consideration of $4.0 million. Headquartered in Vernal, Utah, with operations in the Rockies and the Bakken Shale region, Mountain West provides remote site workforce accommodations to the oil and gas industry. Mountain West has been included in our accommodations segment since the acquisition date.
On October 5, 2010, we purchased all of the equity of Acute for total consideration of $30.2 million. Headquartered in Houston, Texas with additional operations in Brazil, Acute provides metallurgical and welding engineering, consulting and services to the oil and gas industry in support of critical, complex subsea component manufacturing and deepwater riser fabrication on a global basis. Acute has been included in our offshore products segment since its date of acquisition.
The Company funded all of its acquisitions with cash on hand and/or amounts available under our senior secured credit facilities. See Note 8 to the Consolidated Financial Statements included in this Annual Report on Form 10-K for additional information on our senior secured bank facilities.
- 49 -
Consolidated Results of Operations (in millions)
|
YEARS ENDED
December 31,
|
||||||||||||||||||||||||||||
|
Variance
2012 vs. 2011
|
Variance
2011 vs. 2010
|
|||||||||||||||||||||||||||
|
2012
|
2011
|
$
|
%
|
2010 |
$
|
%
|
||||||||||||||||||||||
|
Revenues
|
||||||||||||||||||||||||||||
|
Well site services -
|
||||||||||||||||||||||||||||
|
Completion services
|
$ | 522.6 | $ | 488.0 | $ | 34.6 | 7 | % | $ | 343.0 | $ | 145.0 | 42 | % | ||||||||||||||
|
Drilling services
|
191.0 | 165.9 | 25.1 | 15 | % | 133.2 | 32.7 | 25 | % | |||||||||||||||||||
|
Total well site services
|
713.6 | 653.9 | 59.7 | 9 | % | 476.2 | 177.7 | 37 | % | |||||||||||||||||||
|
Accommodations
|
1,113.5 | 864.7 | 248.8 | 29 | % | 537.7 | 327.0 | 61 | % | |||||||||||||||||||
|
Offshore products
|
804.1 | 585.8 | 218.3 | 37 | % | 428.9 | 156.9 | 37 | % | |||||||||||||||||||
|
Tubular services
|
1,781.9 | 1,374.8 | 407.1 | 30 | % | 969.2 | 405.6 | 42 | % | |||||||||||||||||||
|
Total
|
$ | 4,413.1 | $ | 3,479.2 | $ | 933.9 | 27 | % | $ | 2,412.0 | $ | 1,067.2 | 44 | % | ||||||||||||||
|
Product costs; service and other costs (“Cost of sales and service”)
|
||||||||||||||||||||||||||||
|
Well site services -
|
||||||||||||||||||||||||||||
|
Completion services
|
$ | 324.6 | $ | 298.4 | $ | 26.2 | 9 | % | $ | 220.1 | $ | 78.3 | 36 | % | ||||||||||||||
|
Drilling services
|
133.2 | 122.7 | 10.5 | 9 | % | 105.5 | 17.2 | 16 | % | |||||||||||||||||||
|
Total well site services
|
457.8 | 421.1 | 36.7 | 9 | % | 325.6 | 95.5 | 29 | % | |||||||||||||||||||
|
Accommodations
|
552.3 | 456.4 | 95.9 | 21 | % | 314.4 | 142.0 | 45 | % | |||||||||||||||||||
|
Offshore products
|
595.9 | 430.0 | 165.9 | 39 | % | 316.5 | 113.5 | 36 | % | |||||||||||||||||||
|
Tubular services
|
1,687.0 | 1,291.8 | 395.2 | 31 | % | 917.8 | 374.0 | 41 | % | |||||||||||||||||||
|
Total
|
$ | 3,293.0 | $ | 2,599.3 | $ | 693.7 | 27 | % | $ | 1,874.3 | $ | 725.0 | 39 | % | ||||||||||||||
|
Gross margin
|
||||||||||||||||||||||||||||
|
Well site services -
|
||||||||||||||||||||||||||||
|
Completion services
|
$ | 198.0 | $ | 189.6 | $ | 8.4 | 4 | % | $ | 122.9 | $ | 66.7 | 54 | % | ||||||||||||||
|
Drilling services
|
57.8 | 43.2 | 14.6 | 34 | % | 27.7 | 15.5 | 56 | % | |||||||||||||||||||
|
Total well site services
|
255.8 | 232.8 | 23.0 | 10 | % | 150.6 | 82.2 | 55 | % | |||||||||||||||||||
|
Accommodations
|
561.2 | 408.3 | 152.9 | 37 | % | 223.3 | 185.0 | 83 | % | |||||||||||||||||||
|
Offshore products
|
208.2 | 155.8 | 52.4 | 34 | % | 112.4 | 43.4 | 39 | % | |||||||||||||||||||
|
Tubular services
|
94.9 | 83.0 | 11.9 | 14 | % | 51.4 | 31.6 | 61 | % | |||||||||||||||||||
|
Total
|
$ | 1,120.1 | $ | 879.9 | $ | 240.2 | 27 | % | $ | 537.7 | $ | 342.2 | 64 | % | ||||||||||||||
|
Gross margin as a percentage of revenues
|
||||||||||||||||||||||||||||
|
Well site services -
|
||||||||||||||||||||||||||||
|
Completion services
|
38 | % | 39 | % | 36 | % | ||||||||||||||||||||||
|
Drilling services
|
30 | % | 26 | % | 21 | % | ||||||||||||||||||||||
|
Total well site services
|
36 | % | 36 | % | 32 | % | ||||||||||||||||||||||
|
Accommodations
|
50 | % | 47 | % | 42 | % | ||||||||||||||||||||||
|
Offshore products
|
26 | % | 27 | % | 26 | % | ||||||||||||||||||||||
|
Tubular services
|
5 | % | 6 | % | 5 | % | ||||||||||||||||||||||
|
Total
|
25 | % | 25 | % | 22 | % | ||||||||||||||||||||||
YEAR ENDED DECEMBER 31, 2012 COMPARED TO YEAR ENDED DECEMBER 31, 2011
We reported net income attributable to the Company for the year ended December 31, 2012 of $448.6 million, or $8.10 per diluted share, including a gain of $17.9 million, or $0.23 per diluted share after-tax, from a favorable contract settlement reported in our U.S. accommodations business and a pre-tax gain of $2.5 million, or $0.03 per diluted share after-tax, related to insurance proceeds received in excess of net book value from the constructive total loss of a drilling rig lost in a fire that occurred in the first quarter of 2012. These results compare to net income attributable to the Company of $322.5 million, or $5.86 per diluted share, reported for the year ended December 31, 2011.
Revenues.
Consolidated revenues increased $933.9 million, or 27%, in 2012 compared to 2011.
Our well site services segment revenues increased $59.7 million, or 9%, in 2012 compared to 2011 primarily due to increases in both completion services revenues and drilling services revenues. Our completion services revenues increased $34.6 million, or 7%, in 2012 compared to 2011 primarily due to increased demand for our completion services supporting the 2% increase in the U.S. rig count, a more favorable mix of higher value rentals and services and greater service intensity. Our drilling services revenues increased $25.1 million, or 15%, in 2012 compared to 2011 primarily as a result of increases in pricing, with average day rates rising to $18,000 per day in 2012, up from $16,400 per day in 2011, and increased utilization of our rigs from an average of approximately 82% in 2011 to an average of approximately 88% in 2012.
- 50 -
Our accommodations segment reported revenues in 2012 that were $248.8 million, or 29%, above 2011. The increase in accommodations revenue primarily resulted from increased revenues from expanded room capacity in Canada and Australia along with $18.3 million in revenue from a favorable contract settlement reported in our U.S. accommodations business during the first quarter of 2012. Revenues, average available rooms and revenue per available room (RevPAR) for our lodges and villages increased 36%, 23% and 11%, respectively, in 2012 compared to 2011.
Our offshore products segment revenues increased $218.3 million, or 37%, in 2012 compared to 2011. This increase was primarily the result of higher levels of manufacturing and service activity, an improved revenue mix favoring our production equipment and connector products along with contributions from the acquisition of Piper which closed in July 2012.
Our tubular services segment revenues increased $407.1 million, or 30%, in 2012 compared to 2011. This increase was primarily a result of an increase in tons shipped from 699,000 in 2011 to 862,700 in 2012, an increase of 163,700 tons, or 23%. Higher volume resulted from the 2% increase in U.S. drilling and completion activity, market share gains in the U.S. and incremental customer programs in the U.S. Gulf of Mexico and certain U.S. shale basins. We also reported a 5% increase in realized revenues per ton shipped in 2012 compared to 2011 due to a more favorable mix of OCTG grades sold.
Cost of Sales and Service.
Our consolidated cost of sales increased $693.7 million, or 27%, in 2012 compared to 2011. This cost of sales increase was directly related to the increase in revenue. Our consolidated gross margin as a percentage of revenues remained constant at 25% in 2012 and 2011.
Our well site services segment cost of sales increased $36.7 million, or 9%, in 2012 compared to 2011 as a result of a $26.2 million, or 9%, increase in completion services cost of sales and a $10.5 million, or 9%, increase in drilling services cost of sales. Our well site services segment gross margin as a percentage of revenues remained constant at 36% in both 2012 and 2011. Our completion services gross margin as a percentage of revenues declined modestly to 38% in 2012 compared to 39% in 2011. Our drilling services gross margin as a percentage of revenues increased from 26% in 2011 to 30% in 2012 primarily due to increased day rates, rig utilization and cost absorption.
Our accommodations segment cost of sales increased $95.9 million, or 21%, in 2012 compared to 2011 primarily due to increased revenues and room capacity in both Canada and Australia. Our accommodations segment gross margin as a percentage of revenues increased from 47% in 2011 to 50% in 2012 primarily due to an 11% increase in RevPAR for lodges and villages in 2012 compared to 2011. The increase in the RevPAR in 2012 compared to 2011 was primarily due to increased occupancy levels.
Our offshore products segment cost of sales increased $165.9 million, or 39%, in 2012 compared to 2011 primarily due to increased revenues. Our offshore products segment gross margin as a percentage of revenues decreased modestly to 26% in 2012 compared to 27% in 2011.
Our tubular services segment cost of sales increased by $395.2 million, or 31%, in 2012 compared to 2011 primarily as a result of an increase in tons shipped. Our tubular services segment gross margin as a percentage of revenues decreased from 6.0% in 2011 to 5.3% in 2012 primarily due to lower margin sales into certain onshore markets as a result of declining OCTG prices throughout 2012.
Selling, General and Administrative Expenses.
Selling, general and administrative (SG&A) expense increased $21.2 million, or 12%, in 2012 compared to 2011 primarily due to increased employee-related costs related to an 8% increase in total headcount, commissions and office expenses along with SG&A expense associated with the inclusion of Piper, which was acquired in July 2012.
Depreciation and Amortization.
Depreciation and amortization expense increased $42.0 million, or 22%, in 2012 compared to 2011 primarily due to capital expenditures made during 2011 and 2012 largely related to investments in our Canadian and Australian accommodations and completion services businesses.
- 51 -
Operating Income.
Consolidated operating income increased $176.3 million, or 35%, in 2012 compared to 2011 primarily as a result of an increase in operating income from our accommodations segment of $115.7 million, or 46%, due to expanded room capacity in Canada and Australia, along with the favorable contract settlement reported in our U.S. accommodations business and an increase in operating income from our offshore products segment of $39.4 million, or 42%. In addition, operating income from our well site services segment increased $15.5 million, or 11%, largely due to increased dayrates and rig utilization in our drilling services business and a more favorable mix of services and increased activity in our completion services business. Operating income from our tubular services segment increased $10.6 million, or 16%, in 2012 compared to 2011 primarily as a result of the increase in tons shipped.
Interest Expense and Interest Income.
Net interest expense increased by $11.5 million, or 21%, in 2012 compared to 2011 primarily due to interest expense on the 6 1/2% Senior Notes due 2019 (6 1/2% Notes), issued on June 1, 2011, partially offset by decreased interest expense on our 2 3/8% Notes due 2025 (2 3/8% Notes) due to their conversion in July 2012. The weighted average interest rate on borrowings outstanding under the Company’s credit facilities was 3.0% in 2012 compared to 3.1% in 2011. Interest income decreased as a result of decreased cash balances in interest bearing accounts.
Income Tax Expense.
Our income tax provision for 2012 totaled $177.0 million, or 28.2% of pretax income, compared to income tax expense of $131.6 million, or 28.9% of pretax income, for 2011. The effective tax rates of 28.2% and 28.9% for the years ended December 31, 2012 and 2011, respectively, are comparable and are lower than U.S. statutory rates because of lower foreign tax rates.
YEAR ENDED DECEMBER 31, 2011 COMPARED TO YEAR ENDED DECEMBER 31, 2010
We reported net income attributable to the Company for the year ended December 31, 2011 of $322.5 million, or $5.86 per diluted share. These results compare to net income attributable to the Company of $168.0 million, or $3.19 per diluted share, reported for the year ended December 31, 2010.
Revenues.
Consolidated revenues increased $1.1 billion, or 44%, in 2011 compared to 2010.
Our well site services segment revenues increased $177.7 million, or 37%, in 2011 compared to 2010. This increase was primarily due to significantly increased completion services revenues. Our completion services revenues increased $145.0 million, or 42%, primarily due to increased demand for completion services supporting the increase in the U.S. rig count, a more favorable mix of higher value rentals and services, increased equipment utilization, additional capital investment in rental equipment and better pricing. Our drilling services revenues increased $32.7 million, or 25%, in 2011 compared to 2010 primarily as a result of increases in pricing, with average day rates rising to $16.4 thousand per day in 2011 from $14.2 thousand per day in 2010, and increased utilization of our rigs from an average of approximately 72% in 2010 to an average of approximately 82% in 2011.
Our accommodations segment reported revenues in 2011 that were $327.0 million, or 61%, above 2010. The increase in accommodations revenue resulted from the contribution from the fourth quarter 2010 acquisitions of The MAC and Mountain West along with increased revenues generated from expanded room capacity in Canada and Australia. Revenues and average available rooms for our oil sands lodges increased 40% and 30%, respectively, in 2011 compared to 2010.
Our offshore products segment revenues increased $156.9 million, or 37%, in 2011 compared to 2010. This increase was primarily the result of higher demand for production equipment and elastomer products along with contributions from the acquisition of Acute.
Tubular services segment revenues increased $405.6 million, or 42%, in 2011 compared to 2010. This increase was a result of an increase in tons shipped from 502,800 tons in 2010 to 699,000 tons in 2011, an increase of 196,200 tons, or 39%, driven by increased U.S. drilling and completion activity.
Cost of Sales and Service.
Our consolidated cost of sales increased $725.0 million, or 39%, in 2011 compared to 2010. This cost of sales increase was directly related to the increase in revenue. Our consolidated gross margin as a percentage of revenues increased from 22% in 2010 to 25% in 2011 primarily due to the increased proportion of relatively higher margin accommodations and well site services segment revenues in 2011 compared to 2010 and higher margins realized in our accommodations and well site services segments, partially offset by an increased proportion of relatively lower margin tubular services segment revenues in 2011 compared to 2010.
- 52 -
Our well site services segment cost of sales increased $95.5 million, or 29%, in 2011 compared to 2010 primarily as a result of a $78.3 million, or 36%, increase in completion services cost of sales. Our well site services segment gross margin as a percentage of revenues increased from 32% in 2010 to 36% in 2011. Our completion services gross margin as a percentage of revenues increased from 36% in 2010 to 39% in 2011 primarily due to a more favorable mix of higher value rentals and services and improved pricing along with higher fixed cost absorption as a result of increased rental tool utilization. Our drilling services cost of sales increased $17.2 million, or 16%, in 2011 compared to 2010. Our drilling services gross margin as a percentage of revenues increased from 21% in 2010 to 26% in 2011 primarily due to an increase in day rates, rig utilization and improved cost absorption.
Our accommodations segment cost of sales increased $142.0 million, or 45%, in 2011 compared to 2010 primarily as a result of operating costs associated with the acquisitions of The MAC and Mountain West and a $36.2 million, or 12%, increase in the cost of sales of our Canadian accommodations business primarily due to increased revenues and room capacity. Our accommodations segment gross margin as a percentage of revenues increased from 42% in 2010 to 47% in 2011 primarily due to higher margins realized on our lodges and villages.
Our offshore products cost of sales increased $113.5 million, or 36%, in 2011 compared to 2010 primarily due to increased revenues. Our offshore products segment gross margin as a percentage of revenues increased modestly, 26% in 2010 compared to 27% in 2011.
Tubular services segment cost of sales increased by $374.0 million, or 41%, in 2011 compared to 2010 primarily as a result of an increase in tons shipped. Our tubular services segment gross margin as a percentage of revenues increased from 5% in 2010 to 6% in 2011 due primarily to a 2% increase in revenue per ton.
Selling, General and Administrative Expenses.
SG&A expense increased $31.6 million, or 21%, in 2011 compared to 2010 due primarily to the acquisition of The MAC, increased employee-related costs, higher SG&A costs in our Canadian accommodations business due to the strengthening of the Canadian dollar, increased third-party professional fees and increased commissions expense. SG&A was 5.2% of revenues in 2011 compared to 6.3% of revenues in 2010.
Depreciation and Amortization.
Depreciation and amortization expense increased $63.9 million, or 51%, in 2011 compared to 2010 due primarily to $50.6 million in depreciation and amortization expense associated with acquisitions made in the fourth quarter of 2010 and capital expenditures made in 2010 and 2011, largely related to investments made in our Canadian accommodations business.
Operating Income.
Consolidated operating income doubled to $251.9 million in 2011 compared to 2010 primarily as a result of an increase in operating income from our well site services segment of $93.3 million, or 195%, largely due to a more favorable mix, improved pricing and increased activity in our completion services business coupled with an increase in operating income as a result of the addition of The MAC. In addition, operating income from our offshore products segment increased $34.0 million, or 56%, in 2011 compared to 2010 and operating income from our tubular services segment increased $28.5 million, or 79%, primarily as a result of the increase in tons shipped. Operating income in 2011 and 2010 included $2.2 million and $7.0 million, respectively, in acquisition related expenses.
Interest Expense and Interest Income.
Net interest expense increased by $40.3 million, or 260%, in 2011 compared to 2010 due to increased debt levels, interest expense on the 6 1/2% Notes issued on June 1, 2011, and an increase in non-cash interest expense as a result of the amortization of debt issuance costs on our revolving credit, term loan facilities and the 6 1/2% Notes. The weighted average interest rate on borrowings outstanding under the Company's revolving credit and term loan facilities was 3.1% in 2011 compared to 3.6% in 2010. Interest income increased as a result of increased cash balances in interest bearing accounts.
Income Tax Expense
.
Our income tax provision for 2011 totaled $131.6 million, or 28.9% of pretax income, compared to $72.0 million, or 29.9% of pretax income, for 2010. The decrease in the effective tax rate from the prior year was largely the result of foreign sourced income in 2011 being taxed at lower statutory rates compared to 2010, partially offset by an increase in state taxes.
- 53 -
Liquidity and Capital Resources
Our primary liquidity needs are to fund capital expenditures, which in the past have included expanding our accommodations facilities, expanding and upgrading our offshore products manufacturing facilities and equipment, replacing and increasing completion services assets, funding new product development and general working capital needs. In addition, capital has been used to repay debt and fund strategic business acquisitions. Our primary sources of funds have been cash flow from operations, proceeds from borrowings under our credit facilities and capital market transactions. See Note 8 to the Consolidated Financial Statements included in this Annual Report on Form 10-K.
Cash totaling $637.5 million was provided by operations during the year ended December 31, 2012 compared to cash totaling $215.9 million provided by operations during the year ended December 31, 2011. During 2012, $74.9 million was used to fund working capital, primarily due to increased investments in receivables and inventory in our offshore products segment coupled with higher OCTG inventory at our tubular services segment due to increased order activity. During 2011, $340.3 million was used to fund working capital, primarily due to increased investments in receivables and inventory in our tubular services and offshore products segments due to higher activity levels.
Cash was used in investing activities during the years ended December 31, 2012 and 2011 in the amounts of $577.0 million and $489.0 million, respectively. Capital expenditures totaled $487.9 million and $487.5 million during the years ended December 31, 2012 and 2011, respectively. Capital expenditures in both years consisted principally of purchases and installation of assets for our accommodations and well site services segments, and in particular for accommodations investments made in support of Canadian oil sands developments and Australian mining developments.
During the year ended December 31, 2012, we spent cash of $80.4 million to acquire all of the operating assets of Piper and all of the equity of Tempress. In addition, the Company funded escrow accounts totaling $25.3 million related to contingent consideration and seller transaction indemnities for the Tempress acquisition. This compares to $2.2 million spent during the year ended December 31, 2011 to acquire an open camp accommodations facility in Carrizo Springs, Texas to provide accommodations support to customers working in the Eagle Ford shale basin. The Company funded the acquisitions of Piper and Tempress from amounts available under the Company’s U.S. revolving credit facility. See Note 8 to the Consolidated Financial Statements included in this Annual Report on Form 10-K.
We currently expect to spend a total of approximately $600 million to $650 million for capital expenditures during 2013 to expand our Canadian oil sands and Australian mining related accommodations facilities, to fund our other product and service offerings, and to upgrade our equipment and facilities. Approximately two-thirds of our total estimated 2013 capital expenditures are expected to be spent in our accommodations segment. We expect to fund these capital expenditures with cash available, internally generated funds and borrowings under our U.S., Canadian and Australian credit facilities. The foregoing capital expenditure forecast does not include any funds for strategic acquisitions, which the Company could pursue depending on the economic environment in our industry and the availability of transactions at prices deemed to be attractive to the Company. At December 31, 2012, we had cash totaling $191.7 million held by foreign subsidiaries, primarily in Canada and the United Kingdom, where, in the case of Canada, we have assumed indefinite reinvestment of earnings and where we have not recorded a U.S. tax liability upon the assumed repatriation of foreign earnings. We believe these cash balances will be utilized for future investment outside the United States.
Net cash of $120.6 million was provided by financing activities during the year ended December 31, 2012, primarily as a result of proceeds from the issuance in the fourth quarter of 2012 of $400 million aggregate principal amount of 5 1/8% Senior Notes due 2023 (5 1/8% Notes), offset by net repayments of outstanding amounts under our revolving credit facilities, payments of principal amounts on the conversion of our 2 3/8% Notes and repayments on our U.S. and Canadian term loans. See Note 8 to the Consolidated Financial Statements included in this Annual Report on Form 10-K for additional information on our credit facilities. Net cash of $257.9 million was provided by financing activities during the year ended December 31, 2011, primarily as a result of proceeds from the issuance in the second quarter of 2011 of $600 million aggregate principal amount of the 6 1/2% Notes due in 2019, offset by net repayments of outstanding amounts under our revolving credit facilities. We incurred $7.9 million of costs to secure financings in 2012 compared to $13.5 million in 2011. See Note 8 to the Consolidated Financial Statements included in this Annual Report for additional information on our debt offerings.
- 54 -
On May 17, 2012, the Company gave notice of the redemption of all of its outstanding 2 3/8% Notes due 2025, totaling $175 million in aggregate principal amount, on July 6, 2012 at a redemption price equal to 100% of the principal amount thereof plus accrued interest. The 2 3/8% Notes were convertible by the holders thereof into shares of the Company’s common stock at the conversion rate of 31.496 shares of common stock for each $1,000 principal amount of 2 3/8% Notes converted. In July 2012, rather than having their 2 3/8% Notes redeemed, on or prior to July 5, 2012, holders of $175 million aggregate principal amount of the 2 3/8% Notes converted their 2 3/8% Notes and received cash up to the principal amount and 3,012,380 shares of the Company’s common stock valued at $220.6 million. See Note 8 to the Consolidated Financial Statements included in this Annual Report on Form 10-K.
We believe that cash on hand, cash flow from operations and available borrowings under our credit facilities will be sufficient to meet our liquidity needs in the coming twelve months. If our plans or assumptions change, or are inaccurate, or if we make further acquisitions, we may need to raise additional capital. Acquisitions have been, and our management believes acquisitions will continue to be, a key element of our business strategy. The timing, size or success of any acquisition effort and the associated potential capital commitments are unpredictable and uncertain. We may seek to fund all or part of any such efforts with proceeds from debt and/or equity issuances. Our ability to obtain capital for additional projects to implement our growth strategy over the longer term will depend upon our future operating performance, financial condition and, more broadly, on the availability of equity and debt financing. Capital availability will be affected by prevailing conditions in our industry, the global economy, the global financial markets and other factors, many of which are beyond our control. In addition, such additional debt service requirements could be based on higher interest rates and shorter maturities and could impose a significant burden on our results of operations and financial condition, and the issuance of additional equity securities could result in significant dilution to stockholders.
Stock Repurchase Program.
On August 23, 2012, the Company announced that its Board of Directors authorized $200 million for the repurchase of the Company’s common stock, par value $.01 per share. The authorization replaced the prior share repurchase authorization, which was set to expire on September 1, 2012. As of December 31, 2012, the Company had approximately 54.7 million shares of common stock outstanding. The Board of Directors’ authorization is limited in duration and expires on September 1, 2014. Subject to applicable securities laws, such purchases will be at such times and in such amounts as the Company deems appropriate. As of
December 31, 2012, a total of $15.2 million of our stock (225,796 shares) had been repurchased under this program, leaving a total authorization of up to approximately $184.8 million remaining available under the program.
Credit Facilities.
Our current bank credit facilities include a U.S. revolving credit facility, a U.S. term loan, a Canadian revolving facility, and a Canadian term loan. The credit facilities are governed by an Amended and Restated Credit Agreement dated of December 10, 2010 (Credit Agreement) by and among the Company, PTI Group Inc., PTI Premium Camp Services, Ltd., the Lenders party thereto, Wells Fargo Bank, N.A., as administrative agent and U.S. collateral agent and Royal Bank of Canada, as Canadian administrative agent and Canadian collateral agent. The U.S. and Canadian revolving credit facilities contain total commitments available of $1.05 billion, including Total U.S. Commitments (as defined in the Credit Agreement) of U.S. $700 million (including $200 million in U.S. term loans), and Total Canadian Commitments (as defined in the Credit Agreement) of U.S. $350 million (including $100 million in Canadian term loans). The maturity date of the Credit Agreement is December 10, 2015. The current principal balance of the term loans is repayable at a rate of 2.5% per quarter of the aggregate principal amount until maturity on December 10, 2015 when the remaining principal is due. We currently have 19 lenders in our Credit Agreement with commitments ranging from $25.3 million to $150 million. While we have not experienced, nor do we anticipate, any difficulties in obtaining funding from any of these lenders at this time, the lack of or delay in funding by a significant member of our banking group could negatively affect our liquidity position.
- 55 -
The Credit Agreement contains customary financial covenants and restrictions, including restrictions on our ability to declare and pay dividends. Specifically, we must maintain an interest coverage ratio, defined as the ratio of consolidated EBITDA, to consolidated interest expense of at least 3.0 to 1.0 and our maximum leverage ratio, defined as the ratio of total debt to consolidated EBITDA, of no greater than 3.25 to 1.0 in 2012 and 3.0 to 1.0 thereafter. Each of the factors considered in the calculations of these ratios are defined in the Credit Agreement. EBITDA and consolidated interest as defined, exclude goodwill impairments, debt discount amortization and other non-cash charges. As of December 31, 2012, we were in compliance with our debt covenants and expect to continue to be in compliance during 2013. Borrowings under the Credit Agreement are secured by a pledge of substantially all of our assets and the assets of our subsidiaries. Our obligations under the Credit Agreement are guaranteed by our significant subsidiaries. Borrowings under the Credit Agreement accrue interest at a rate equal to either LIBOR or another benchmark interest rate (at our election) plus an applicable margin based on our leverage ratio (as defined in the Credit Agreement). We must pay a quarterly commitment fee, based on our leverage ratio, on the unused commitments under the Credit Agreement. During the year 2012, our applicable margin over LIBOR ranged from 2.00% to 2.25% and it was 2.00% as of December 31, 2012. Our weighted average interest rate paid under the Credit Agreement was 2.7% during the year ended December 31, 2012 and 3.0% for the year ended December 31, 2011.
As of December 31, 2012, we had $255.8 million outstanding under the Credit Agreement and an additional $41.1 million of outstanding letters of credit, leaving $708.9 million available to be drawn under the U.S. and Canadian facilities.
On September 18, 2012, the Company’s Australian accommodations subsidiary, The MAC Services Group Pty Limited (The MAC), entered into a AUD$300 million revolving loan facility governed by a Syndicated Facility Agreement (The MAC Group Facility Agreement), between The MAC, J.P. Morgan Australia Limited, as Australian agent and security trustee, JPMorgan Chase Bank, N.A., as U.S. agent, and the lenders party thereto, which is guaranteed by the Company and The MAC’s subsidiaries. The maturity date of The MAC Group Facility Agreement is December 10, 2015. The MAC Group Facility Agreement replaced The MAC’s previous AUD$150 million revolving loan facility. As of December 31, 2012, we had AUD$46
million outstanding under the Australian credit facility, leaving AUD$254 million available to be drawn under this facility. Our weighted average interest rate paid under the MAC Group Facility Agreement was 5.4% during the period beginning September 18, 2012 and ending December 31, 2012.
5 1/8% Notes.
On December 21, 2012, the Company sold $400 million aggregate principal amount of 5 1/8% Notes through a private placement to qualified institutional buyers.
The 5 1/8% Notes are senior unsecured obligations of the Company, are guaranteed by our material U.S. subsidiaries (the Guarantors), bear interest at a rate of 5 1/8% per annum and mature on January 1, 2023. At any time prior to January 15, 2016, the Company may redeem up to 35% of the 5 1/8% Notes at a redemption price of 105.125% of the principal amount, plus accrued and unpaid interest to the redemption date, with the proceeds of certain equity offerings. Prior to January 15, 2018, the Company may redeem some or all of the 5 1/8% Notes for cash at a redemption price equal to 100% of their principal amount plus an applicable make-whole premium and accrued and unpaid interest to the redemption date. On and after January 15, 2018, the Company may redeem some or all of the 5 1/8% Notes at redemption prices (expressed as percentages of principal amount), plus accrued and unpaid interest to the redemption date. The optional redemption prices as a percentage of principal amount are as follows:
|
Twelve Month Period Beginning January 15,
|
% of Principal Amount
|
||
|
2018
|
102.563 | % | |
|
2019
|
101.708 | % | |
|
2020
|
100.854 | % | |
|
2021 and thereafter
|
100.000 | % | |
The Company utilized approximately $334 million of the net proceeds of the 5 1/8% Notes to repay borrowings under its U.S. credit facility. The remaining net proceeds of approximately $61 million were utilized for general corporate purposes.
- 56 -
On December 21, 2012, in connection with the issuance of the 5 1/8% Notes, the Company entered into an Indenture (the 5 1/8% Notes Indenture) with the Guarantors and Wells Fargo Bank, N.A., as trustee. The 5 1/8% Notes Indenture restricts the Company's ability and the ability of the Guarantors to: (i) incur additional debt; (ii) pay distributions on, redeem or repurchase equity interests; (iii) make certain investments; (iv) incur liens; (v) enter into transactions with affiliates; (vi) merge or consolidate with another company; and (vii) transfer and sell assets. These covenants are subject to a number of important exceptions and qualifications. If at any time when the 5 1/8% Notes are rated investment grade by either Moody's Investors Service, Inc. or Standard & Poor's Ratings Services and no Default (as defined in the 5 1/8% Notes Indenture) has occurred and is continuing, many of such covenants will terminate and the Company and its subsidiaries will cease to be subject to such covenants. The 5 1/8% Notes Indenture contains customary events of default. As of December 31, 2012, the Company was in compliance with all covenants of the 5 1/8% Notes Indenture.
6 1/2% Notes.
On June 1, 2011, the Company sold $600 million aggregate principal amount of 6 1/2% Notes through a private placement to qualified institutional buyers.
The 6 1/2% Notes are senior unsecured obligations of the Company, are guaranteed by our Guarantors, bear interest at a rate of 6 1/2% per annum and mature on June 1, 2019. At any time prior to June 1, 2014, the Company may redeem up to 35% of the 6 1/2% Notes at a redemption price of 106.5% of the principal amount, plus accrued and unpaid interest to the redemption date, with the proceeds of certain equity offerings. Prior to June 1, 2014, the Company may redeem some or all of the 6 1/2% Notes for cash at a redemption price equal to 100% of their principal amount plus an applicable make-whole premium and accrued and unpaid interest to the redemption date. On and after June 1, 2014, the Company may redeem some or all of the 6 1/2% Notes at redemption prices (expressed as percentages of principal amount), plus accrued and unpaid interest to the redemption date. The optional redemption prices as a percentage of principal amount are as follows:
|
Twelve Month Period Beginning June 1,
|
% of Principal Amount
|
||
|
2014
|
104.875 | % | |
|
2015
|
103.250 | % | |
|
2016
|
101.625 | % | |
|
2017 and thereafter
|
100.000 | % | |
The Company utilized approximately $515 million of the net proceeds of the 6 1/2% Note offering in June 2011 to repay borrowings under its U.S. and Canadian credit facilities. The remaining net proceeds of approximately $75 million were utilized for general corporate purposes.
On June 1, 2011, in connection with the issuance of the 6 1/2% Notes, the Company entered into an Indenture (the 6 1/2% Notes Indenture) with the Guarantors and Wells Fargo Bank, N.A., as trustee. The Indenture restricts the Company's ability and the ability of the Guarantors to: (i) incur additional debt; (ii) pay distributions on, redeem or repurchase equity interests; (iii) make certain investments; (iv) incur liens; (v) enter into transactions with affiliates; (vi) merge or consolidate with another company; and (vii) transfer and sell assets. These covenants are subject to a number of important exceptions and qualifications. If at any time when the 6 1/2% Notes are rated investment grade by either Moody's Investors Service, Inc. or Standard & Poor's Ratings Services and no Default (as defined in the 6 1/2% Notes Indenture) has occurred and is continuing, many of such covenants will terminate and the Company and its subsidiaries will cease to be subject to such covenants. The 6 1/2% Notes Indenture contains customary events of default. As of December 31, 2012, the Company was in compliance with all covenants of the 6 1/2% Notes Indenture.
Our total debt represented 34.7% of our combined total debt and shareholders’ equity at December 31, 2012 compared to 37.5% at December 31, 2011.
- 57 -
Contractual Obligations.
The following summarizes our contractual obligations at December 31, 2012, and the effect such obligations are expected to have on our liquidity and cash flow over the next five years (in thousands):
|
Payments due by period
|
||||||||||||||||||||
|
Total
|
Less than 1 year
|
1 - 3 years
|
3 - 5 years
|
More than 5 years
|
||||||||||||||||
|
Contractual obligations
|
||||||||||||||||||||
|
Total debt, including capital leases
(1)
|
$ | 1,765,475 | $ | 89,980 | $ | 393,193 | $ | 119,612 | $ | 1,162,690 | ||||||||||
|
Purchase obligations
|
451,848 | 416,254 | 35,594 | - | - | |||||||||||||||
|
Non-cancelable operating lease obligations
(2)
|
77,363 | 15,069 | 23,531 | 14,671 | 24,092 | |||||||||||||||
|
Asset retirement obligations - expected cash payments
|
16,350 | 344 | 271 | 904 | 14,831 | |||||||||||||||
|
Other non-current liabilities
|
25,089 | - | 25,089 | - | - | |||||||||||||||
|
Total contractual cash obligations
|
$ | 2,336,125 | $ | 521,647 | $ | 477,678 | $ | 135,187 | $ | 1,201,613 | ||||||||||
|
|
(1)
|
Includes interest on fixed-rate debt. Excludes interest on variable-rate debt. We cannot predict with any certainty the amount of interest due on our revolving debt due to the expected variability of interest rates and principal amounts outstanding. If we assume interest payment amounts are calculated using the outstanding principal balances, interest rates and foreign currency exchange rates as of December 31, 2012 and include applicable commitment fees, estimated interest payments on our credit facilities would be $20.0 million “due in less than one year” and $36.9 million “due in one to three years.” In the case of our outstanding term loans, applicable principal pay down amounts have been reflected in the interest payment calculations. See Note 8 to the Consolidated Financial Statements included in this Annual Report on Form 10-K for additional for additional information on our credit facilities.
|
|
|
(2)
|
See Note 13 to the Consolidated Financial Statements included in this Annual Report on Form 10-K for additional information.
|
Our debt obligations at December 31, 2012 are included in our consolidated balance sheet, which is a part of our Consolidated Financial Statements included in this Annual Report on Form 10-K. We have not entered into any material leases subsequent to December 31, 2012.
Due to the uncertainty with respect to the timing of future cash flows associated with our uncertain tax positions at December 31, 2012, we are unable to make reasonably reliable estimates of the period of cash settlement with the respective taxing authorities. Therefore, $1.0 million in uncertain tax positions, including interest and penalties, have been excluded from the contractual obligations table above.
Effects of Inflation
Our revenues and results of operations have not been materially impacted by inflation in the past three fiscal years.
Off-Balance Sheet Arrangements
As of December 31, 2012, we had no off-balance sheet arrangements as defined in Item 303(a)(4)(ii) of Regulation S-K.
Tax Matters
Our primary deferred tax assets at December 31, 2012, are related to employee benefit costs for our Equity Participation Plan, deductible goodwill and other intangibles, inventory allowance for obsolescence, and foreign tax credit carryforwards. The foreign tax credits will expire in varying amounts after 2019.
Our income tax provision for the year ended December 31, 2012 totaled $177.0 million, or 28.2% of pretax income, compared to $131.6 million, or 28.9% of pretax income, for the year ended December 31, 2011. The effective tax rates of 28.2% and 28.9% for the years ended December 31, 2012 and 2011, respectively, are comparable and are lower than U.S. statutory rates because of lower foreign tax rates.
- 58 -
There are a number of legislative proposals to change the United States tax laws related to multinational corporations. These proposals are in various stages of discussion. It is not possible at this time to predict how these proposals would impact our business or whether they could result in increased tax costs.
Critical Accounting Policies
Our Consolidated Financial Statements included in this Annual Report on Form 10-K have been prepared in accordance with accounting principles generally accepted in the United States (GAAP), which require that management make numerous estimates and assumptions. Actual results could differ from those estimates and assumptions, thus impacting our reported results of operations and financial position. The critical accounting policies and estimates described in this section are those that are most important to the depiction of our financial condition and results of operations and the application of which requires management’s most subjective judgments in making estimates about the effect of matters that are inherently uncertain. We describe our significant accounting policies more fully in Note 2 to Consolidated Financial Statements included in this Annual Report on Form 10-K.
Accounting for Contingencies
We have contingent liabilities and future claims for which we have made estimates of the amount of the eventual cost to liquidate these liabilities or claims. These liabilities and claims sometimes involve threatened or actual litigation where damages have been quantified and we have made an assessment of our exposure and recorded a provision in our accounts to cover an expected loss. Other claims or liabilities have been estimated based on their fair value or our experience in these matters and, when appropriate, the advice of outside counsel or other outside experts. Upon the ultimate resolution of these uncertainties, our future reported financial results will be impacted by the difference between our estimates and the actual amounts paid to settle a liability. Examples of areas where we have made important estimates of future liabilities include future consideration due sellers as a result of the terms of a business combination, litigation, taxes, interest, insurance claims, warranty claims, contract claims and obligations and discontinued operations.
Asset Retirement Obligations
We recognize initial estimated asset retirement obligations (ARO) related to properties as liabilities, with an associated increase in property and equipment for the asset’s estimated retirement cost. Accretion expense is recognized over the estimated productive life of the related assets. If the fair value of the estimated ARO changes, an adjustment is recorded to both the ARO and the capitalized asset retirement cost. Revisions in estimated liabilities can result from changes in estimated inflation rates, changes in service and equipment costs and changes in the estimated timing of settling the ARO. The Company derecognizes ARO liabilities when the related obligations are settled. At December 31, 2012, $5.5 million of ARO was included in the Consolidated Balance Sheet in “Other noncurrent liabilities.” The ARO liability reflects the estimated present value of the amount of asset removal and site reclamation costs related to the retirement of assets in the Company’s accommodations business. Total accretion expense related to the ARO was $0.3 million in 2012. The Company utilizes current retirement costs to estimate the expected cash outflows for retirement obligations. The Company estimates the ultimate productive life of the properties and a risk-adjusted discount rate in order to determine the current present value of the obligation.
Tangible and Intangible Assets, including Goodwill
Our goodwill totaled $520.8 million, or 11.7%, of our total assets, as of December 31, 2012. Our other intangible assets totaled $146.1 million, or 3.3%, of our total assets, as of December 31, 2012. The assessment of impairment on long-lived assets, including intangibles, is conducted whenever changes in the facts and circumstances indicate a loss in value has occurred. Indicators of impairment might include persistent negative economic trends affecting the markets we serve, recurring losses or lowered expectations of future cash flows expected to be generated by our assets. The determination of the amount of impairment would be based on quoted market prices, if available, or upon our judgments as to the future operating cash flows to be generated from these assets throughout their estimated useful lives. Our industry is highly cyclical and our estimates of the period over which future cash flows will be generated, as well as the predictability of these cash flows and our determination of whether a decline in value of our investment has occurred, can have a significant impact on the carrying value of these assets and, in periods of prolonged down cycles, may result in impairment losses.
- 59 -
We review each reporting unit at least annually or on an interim basis if an indicator of impairment was determined to occur, as defined in current accounting standards regarding goodwill to assess goodwill for potential impairment. Our reporting units include completion services, drilling, accommodations, offshore products and tubular services. There is no remaining goodwill in our drilling or tubular services reporting units subsequent to the full impairment of goodwill at those reporting units as of December 31, 2008. As part of the goodwill impairment analysis, current accounting standards give us the option to first perform a qualitative assessment to determine whether it is more likely than not (that is, a likelihood of more than 50 percent) that the fair value of a reporting unit is less than its carrying amount, including goodwill. If it is determined that it is more likely than not that the fair value of a reporting unit is greater than its carrying amount, then performing the currently prescribed two-step impairment test is unnecessary. In developing a qualitative assessment to meet the “more-likely-than-not” threshold, each reporting unit with goodwill on its balance sheet is assessed separately and different relevant events and circumstances are evaluated for each unit. If it is determined that it is more likely than not that the fair value of a reporting unit is less than its carrying amount, then the prescribed two-step impairment test is performed. Current accounting standards also give us the option to bypass the qualitative assessment for any reporting unit in any period and proceed directly to performing the first step of the two-step goodwill impairment test. In 2012, the Company chose to bypass the qualitative assessment for all of its reporting units with goodwill remaining and perform the two-step impairment test. In performing the two-step impairment test, we estimate the implied fair value (IFV) of each reporting unit and compare the IFV to the carrying value of such unit (the Carrying Value). Because none of our reporting units has a publically quoted market price, we must determine the value that willing buyers and sellers would place on the reporting unit through a routine sale process (a Level 3 fair value measurement). In our analysis, we target an IFV that represents the value that would be placed on the reporting unit by market participants, and value the reporting unit based on historical and projected results throughout a cycle, not the value of the reporting unit based on trough or peak earnings. We utilize, depending on circumstances, trading multiples analyses, discounted projected cash flow calculations with estimated terminal values and acquisition comparables to estimate the IFV. The IFV of our reporting units is affected by future oil and natural gas prices, anticipated spending by our customers, and the cost of capital. As part of our process to assess goodwill for impairment, we also compare the total market capitalization of the Company to the sum of the IFV's of all of our reporting units to assess the reasonableness of the IFV's in the aggregate. If the carrying amount of a reporting unit exceeds its IFV, goodwill is considered to be potentially impaired and additional analysis in accordance with current accounting standards is conducted to determine the amount of impairment, if any. In 2012, our quantitative assessment of potential goodwill impairment based on an analysis and comparison of trading multiples indicated that it is more likely than not that the fair value of each of our reporting units is greater than its carrying amount. At the date of our goodwill impairment test in 2012, the IFV of our offshore products, accommodations and completion services reporting units exceeded their
carrying values by 172%, 50% and 101%, respectively.
As part of our process to assess goodwill for impairment in 2012 we also compared the total market capitalization of the Company to the sum of the IFV’s of all of our reporting units to assess the reasonableness of the IFV’s in the aggregate.
Revenue and Cost Recognition
Revenue from the sale of products, not accounted for utilizing the percentage-of-completion method, is recognized when delivery to and acceptance by the customer has occurred, when title and all significant risks of ownership have passed to the customer, collectability is probable and pricing is fixed and determinable. Our product sales terms do not include significant post-delivery obligations. For significant projects, revenues are recognized under the percentage-of-completion method, measured by the percentage of costs incurred to date compared to estimated total costs for each contract (cost-to-cost method). Billings on such contracts in excess of costs incurred and estimated profits are classified as deferred revenue. Costs incurred and estimated profits in excess of billings on percentage-of-completion contracts are recognized as unbilled receivables. Management believes this method is the most appropriate measure of progress on large contracts. Provisions for estimated losses on uncompleted contracts are made in the period in which such losses are determined. Factors that may affect future project costs and margins include shipyard access, weather, production efficiencies, availability and costs of labor, materials and subcomponents. These factors can significantly impact the accuracy of the Company’s estimates and materially impact the Company’s future reported earnings. In our accommodations and well site services segments, revenues are recognized based on a periodic (usually daily), or room rate or when the services are rendered. Proceeds from customers for the cost of oilfield rental equipment that is damaged or lost downhole are reflected as gains or losses on the disposition of assets after considering the write-off of the remaining net book value of the equipment. For drilling services contracts based on footage drilled, we recognize revenues as footage is drilled. Revenues exclude taxes assessed based on revenues such as sales or value added taxes.
- 60 -
Cost of goods sold includes all direct material and labor costs and those costs related to contract performance, such as indirect labor, supplies, tools and repairs. Selling, general, and administrative costs are charged to expense as incurred.
Valuation Allowances
Our valuation allowances, especially related to potential bad debts in accounts receivable and to obsolescence or market value declines of inventory, involve reviews of underlying details of these assets, known trends in the marketplace and the application of historical factors that provide us with a basis for recording these allowances. If market conditions are less favorable than those projected by management, or if our historical experience is materially different from future experience, additional allowances may be required. We have, in past years, recorded a valuation allowance to reduce our deferred tax assets to the amount that is more likely than not to be realized.
Estimation of Useful Lives
The selection of the useful lives of many of our assets requires the judgments of our operating personnel as to the length of these useful lives. Our judgment in this area is influenced by our historical experience in operating our assets, technological developments and expectations of future demand for the assets. Should our estimates be too long or short, we might eventually report a disproportionate number of losses or gains upon disposition or retirement of our long-lived assets. We believe our estimates of useful lives are appropriate.
Stock Based Compensation
Since the adoption of the accounting standards regarding share-based payments, we are required to estimate the fair value of stock compensation made pursuant to awards under our 2001 Equity Participation Plan (Plan). An initial estimate of the fair value of each stock option or restricted stock award determines the amount of stock compensation expense we will recognize in the future. To estimate the value of stock option awards under the Plan, we have selected a fair value calculation model. We have chosen the Black Scholes Merton “closed form” model to value stock options awarded under the Plan. We have chosen this model because our option awards have been made under straightforward vesting terms, option prices and option lives. Utilizing the Black Scholes Merton model requires us to estimate the length of time options will remain outstanding, a risk free interest rate for the estimated period options are assumed to be outstanding, forfeiture rates, future dividends and the volatility of our common stock. All of these assumptions affect the amount and timing of future stock compensation expense recognition. We will continually monitor our actual experience and change assumptions for future awards as we consider appropriate.
Income Taxes
The Company follows the liability method of accounting for income taxes in accordance with current accounting standards regarding the accounting for income taxes. Under this method, deferred income taxes are recorded based upon the differences between the financial reporting and tax bases of assets and liabilities and are measured using the enacted tax rates and laws in effect at the time the underlying assets or liabilities are recovered or settled.
When the Company's earnings from foreign subsidiaries are considered to be indefinitely reinvested, no provision for U.S. income taxes is made for these earnings. If any of the subsidiaries have a distribution of earnings in the form of dividends or otherwise, the Company would be subject to both U.S. income taxes (subject to an adjustment for foreign tax credits) and withholding taxes payable to the various foreign countries.
- 61 -
In accordance with current accounting standards, the Company records a valuation allowance in each reporting period when management believes that it is more likely than not that any deferred tax asset created will not be realized. Management will continue to evaluate the appropriateness of the valuation allowance in the future based upon the operating results of the Company.
In accounting for income taxes, we are required by the provisions of current accounting standards regarding the accounting for uncertainty in income taxes, to estimate a liability for future income taxes. The calculation of our tax liabilities involves dealing with uncertainties in the application of complex tax regulations. We recognize liabilities for anticipated tax audit issues in the U.S. and other tax jurisdictions based on our estimate of whether, and the extent to which, additional taxes will be due. If we ultimately determine that payment of these amounts is unnecessary, we reverse the liability and recognize a tax benefit during the period in which we determine that the liability is no longer necessary. We record an additional charge in our provision for taxes in the period in which we determine that the recorded tax liability is less than we expect the ultimate assessment to be.
Recent Accounting Pronouncements
From time to time, new accounting pronouncements are issued by the Financial Accounting Standards Board (the FASB), which are adopted by the Company as of the specified effective date. Unless otherwise discussed, management believes that the impact of recently issued standards, which are not yet effective, will not have a material impact on the Company’s consolidated financial statements upon adoption.
In June 2011, the FASB issued amendments to disclosure requirements for the presentation of comprehensive income. This guidance eliminates the option to present components of other comprehensive income as part of the statement of changes in stockholders’ equity. The amendments require that all non-owner changes in stockholders’ equity be presented either in a single continuous statement of comprehensive income or in two separate but consecutive statements. In the two-statement approach, the first statement should present total net income and its components followed consecutively by a second statement that should present total other comprehensive income, the components of other comprehensive income, and the total of comprehensive income. The amendments were applied retrospectively. For public entities, the amendments were effective for fiscal years, and interim periods within those years, beginning after December 15, 2011. The amendments do not require any transition disclosures. In December 2011, the FASB issued an amendment deferring the effective date of the requirement to present reclassification adjustments out of accumulated other comprehensive income on the face of the consolidated statement of income. The Company adopted this standard in the Quarterly Report on Form 10-Q for the three month period ended March 31, 2012.
In September 2011, the FASB issued an accounting standards update which is intended to simplify goodwill impairment testing by giving an entity the option to first assess qualitative factors to determine whether it is more likely than not that the fair value of a reporting unit is less than its carrying amount. If an entity determines it is more likely than not that the fair value of a reporting unit is greater than its carrying amount, then performing the currently prescribed two-step impairment test is unnecessary. An entity has the option to bypass such qualitative assessment for any reporting unit in any period and proceed directly to performing the first step of the two-step goodwill impairment test. An entity may resume performing the qualitative assessment in any subsequent period. The amendments were effective for annual and interim goodwill impairment tests performed for fiscal years beginning after December 15, 2011. The Company adopted this standard for its annual goodwill impairment tests in 2011. The adoption of this standard did not have a material effect on our consolidated financial statements.
In July 2012, the FASB issued an accounting standards update which is intended to reduce the cost and complexity of performing an impairment test for indefinite-lived intangible assets by simplifying how an entity tests those assets for impairment. The update is also intended to improve the consistency in impairment testing guidance among long-lived asset categories. Previous guidance required an entity to test indefinite-lived intangible assets for impairment by comparing the fair value of the asset with its carrying amount at least on an annual basis. If the carrying amount exceeded its fair value, an entity needed to recognize an impairment loss in the amount of the excess. The amendment to this update allows an entity to first assess the qualitative factors to determine whether it is more likely than not that an indefinite-lived intangible asset is impaired. This assessment will determine whether it is necessary to perform quantitative impairment tests. This type of testing results in guidance that is similar to the September 2011 accounting standards update issued for goodwill impairment testing described above. The amendments are effective for annual and interim impairment tests performed for fiscal years beginning after September 15, 2012 with early adoption permitted. As permitted, we adopted these provisions in 2012. The adoption of this standard did not have a material effect on our consolidated financial statements.
- 62 -
Our principal market risks are our exposure to changes in interest rates and foreign currency exchange rates.
Interest Rate Risk.
We have credit facilities that are subject to the risk of higher interest charges associated with increases in interest rates. As of December 31, 2012, we had floating-rate obligations totaling approximately $303.6 million drawn under our credit facilities. These floating-rate obligations expose us to the risk of increased interest expense in the event of increases in short-term interest rates. If floating interest rates increase by 1%, our consolidated interest expense would increase by a total of approximately $3.0 million annually based on our floating debt obligations as of December 31, 2012.
Foreign Currency Exchange Rate Risk.
Our operations are conducted in various countries around the world and we receive revenue from these operations in a number of different currencies. As such, our earnings are subject to movements in foreign currency exchange rates when transactions are denominated in (i) currencies other than the U.S. dollar, which is our functional currency, or (ii) the functional currency of our subsidiaries, which is not necessarily the U.S. dollar. In order to mitigate the effects of exchange rate risks in areas outside the U.S. (primarily in our offshore products segment), we generally pay a portion of our expenses in local currencies and a substantial portion of our contracts provide for collections from customers in U.S. dollars. During 2012, our reported foreign exchange losses were $2.1 million and are included in “Other operating (income)/expense” in the Consolidated Statements of Income. In order to reduce our exposure to fluctuations in currency exchange rates, we may enter into foreign exchange agreements with financial institutions. As of December 31, 2012, we had outstanding foreign currency forward purchase contracts with a notional amount of $12.4 million, hedging expected cash flows denominated in Euros. We have recorded other comprehensive loss of $1.0 million in 2012 as a result of this contract. As of December 31, 2011, we had no active hedge contracts outstanding.
Our Consolidated Financial Statements and supplementary data of the Company appear on pages 72 through 114 of this Annual Report on Form 10-K and are incorporated by reference into this Item 8. Selected quarterly financial data is set forth in Note 16 to our Consolidated Financial Statements, which is incorporated herein by reference.
There were no changes in or disagreements on any matters of accounting principles or financial statement disclosure between us and our independent auditors during our two most recent fiscal years or any subsequent interim period.
(i) Evaluation of Disclosure Controls and Procedures
Evaluation of Disclosure Controls and Procedures.
As of the end of the period covered by this Annual Report on Form 10-K, we carried out an evaluation, under the supervision and with the participation of our management, including our Chief Executive Officer and Chief Financial Officer, of the effectiveness of the design and operation of our disclosure controls and procedures (as defined in Rules 13a-15(e) and 15d-15(e)) of the Exchange Act. Our disclosure controls and procedures are designed to provide reasonable assurance that the information required to be disclosed by us in reports that we file under the Exchange Act is accumulated and communicated to our management, including our Chief Executive Officer and Chief Financial Officer, as appropriate, to allow timely decisions regarding required disclosure and is recorded, processed, summarized and reported within the time periods specified in the rules and forms of the Commission. Based upon that evaluation, our Chief Executive Officer and Chief Financial Officer concluded that our disclosure controls and procedures were effective as of December 31, 2012 at the reasonable assurance level.
- 63 -
Pursuant to section 906 of The Sarbanes-Oxley Act of 2002, our Chief Executive Officer and Chief Financial Officer have provided certain certifications to the Commission. These certifications accompanied this report when filed with the Commission, but are not set forth herein.
(ii) Internal Control Over Financial Reporting
(a) Management's annual report on internal control over financial reporting.
Our management is responsible for establishing and maintaining adequate internal control over financial reporting as defined in Rules 13a-15(f) and 15d-15(f) under the Exchange Act. Our internal control over financial reporting is a process designed to provide reasonable assurance regarding the reliability of financial reporting and the preparation of consolidated financial statements for external purposes in accordance with GAAP. Our internal control over financial reporting includes those policies and procedures that (i) pertain to the maintenance of records that, in reasonable detail, accurately and fairly reflect the transactions and dispositions of our assets; (ii) provide reasonable assurance that transactions are recorded as necessary to permit preparation of financial statements in accordance with GAAP, and that our receipts and expenditures are being made only in accordance with authorizations of management and our directors, and (iii) provide reasonable assurance regarding prevention or timely detection of unauthorized acquisition, use or disposition of our assets that could have a material effect on the consolidated financial statements.
Because of its inherent limitations, internal control over financial reporting may not prevent or detect misstatements. Also, projections of any evaluation of effectiveness to future periods are subject to the risk that controls may become inadequate because of changes in conditions, or that the degree of compliance with the policies or procedures may deteriorate. Accordingly, even effective internal control over financial reporting can only provide reasonable assurance of achieving their control objectives.
Under the supervision and with the participation of our management, including our Chief Executive Officer and Chief Financial Officer, an assessment of the effectiveness of our internal control over financial reporting as of December 31, 2012 was conducted. In making this assessment, management used the criteria set forth by the Committee of Sponsoring Organizations of the Treadway Commission (COSO) in Internal Control–Integrated Framework. Based on our assessment we believe that, as of December 31, 2012, the Company's internal control over financial reporting is effective based on those criteria.
In July and December 2012, the Company acquired all of the assets of Piper and all of the equity of Tempress, respectively. The Company will begin the process of evaluating Piper’s and Tempress' internal controls during 2013. As permitted by the related Securities and Exchange Commission (SEC) staff’s interpretative guidance for newly acquired businesses, the Company excluded Piper and Tempress from management's assessment of the effectiveness of the Company's internal control over financial reporting as of December 31, 2012. In the aggregate, Piper and Tempress represented 2.6% of the total assets and less than 1% of total revenues of the Company as of and for the fiscal year ended December 31, 2012.
(b) Attestation report of the registered public accounting firm.
The attestation report of Ernst & Young LLP, the Company's independent registered public accounting firm, on the Company's internal control over financial reporting is set forth in this Annual Report on Form 10-K on Page 74 and is incorporated herein by reference.
(c) Changes in internal control over financial reporting.
During the Company's fourth fiscal quarter ended December 31, 2012, there were no changes in our internal control over financial reporting (as defined in Rules 13a-15(f) and 15d-15(f) of the Exchange Act) or in other factors which have materially affected our internal control over financial reporting, or are reasonably likely to materially affect our internal control over financial reporting.
- 64 -
There was no information required to be disclosed in a report on Form 8-K during the fourth quarter of 2012 that was not reported on a Form 8-K during such time.
|
|
(1)
|
Information concerning directors, including the Company's audit committee financial expert, appears in the Company's Definitive Proxy Statement for the 2013 Annual Meeting of Stockholders, under "Election of Directors." This portion of the Definitive Proxy Statement is incorporated herein by reference.
|
|
|
(2)
|
Information with respect to executive officers appears in the Company's Definitive Proxy Statement for the 2013 Annual Meeting of Stockholders, under "Executive Officers of the Registrant." This portion of the Definitive Proxy Statement is incorporated herein by reference.
|
|
|
(3)
|
Information concerning Section 16(a) beneficial ownership reporting compliance appears in the Company's Definitive Proxy Statement for the 2013 Annual Meeting of Stockholders, under "Section 16(a) Beneficial Ownership Reporting Compliance." This portion of the Definitive Proxy Statement is incorporated herein by reference.
|
The information required by Item 11 hereby is incorporated by reference to such information as set forth in the Company's Definitive Proxy Statement for the 2013 Annual Meeting of Stockholders.
The information required by Item 12 hereby is incorporated by reference to such information as set forth in the Company's Definitive Proxy Statement for the 2013 Annual Meeting of Stockholders.
The information required by Item 13 hereby is incorporated by reference to such information as set forth in the Company's Definitive Proxy Statement for the 2013 Annual Meeting of Stockholders.
Information concerning principal accounting fees and services and the audit committee's preapproval policies and procedures appear in the Company's Definitive Proxy Statement for the 2013 Annual Meeting of Stockholders under the heading "Fees Paid to Ernst & Young LLP" and is incorporated herein by reference.
(a) Index to Financial Statements, Financial Statement Schedules and Exhibits
(1)
Financial Statements:
Reference is made to the index set forth on page 72 of this Annual Report on Form 10-K.
(2)
Financial Statement Schedules:
No schedules have been included herein because the information required to be submitted has been included in the Consolidated Financial Statements or the Notes thereto, or the required information is inapplicable.
- 65 -
(3)
Index of Exhibits:
See Index of Exhibits, below, for a list of those exhibits filed herewith, which index also includes and identifies management contracts or compensatory plans or arrangements required to be filed as exhibits to this Annual Report on Form 10-K by Item 601 of Regulation S-K.
|
|
(b)
|
Index of Exhibits
|
Exhibit Index
|
Exhibit No.
|
|
Description
|
|
|
2.1
|
—
|
Scheme Implementation Deed, dated October 15, 2010, by and between Oil States International, Inc. and The MAC Services Group Limited (incorporated by reference to Exhibit 2.1 to Oil States’ Current Report on Form 8-K, as filed with the Commission on October 15, 2010 (File No. 001-16337)).
|
|
|
3.1
|
—
|
Amended and Restated Certificate of Incorporation (incorporated by reference to Exhibit 3.1 to the Company's Annual Report on Form 10-K for the year ended December 31, 2000, as filed with the Commission on March 30, 2001 (File No. 001-16337)).
|
|
|
3.2
|
—
|
Third Amended and Restated Bylaws (incorporated by reference to Exhibit 3.1 to the Company's Current Report on Form 8-K, as filed with the Commission on March 13, 2009 (File No. 001-16337)).
|
|
|
3.3
|
—
|
Certificate of Designations of Special Preferred Voting Stock of Oil States International, Inc. (incorporated by reference to Exhibit 3.3 to the Company's Annual Report on Form 10-K for the year ended December 31, 2000, as filed with the Commission on March 30, 2001 (File No. 001-16337)).
|
|
|
4.1
|
—
|
Form of common stock certificate (incorporated by reference to Exhibit 4.1 to the Company's Registration Statement on Form S-1, as filed with the Commission on November 7, 2000 (File No. 333-43400)).
|
|
|
4.2
|
—
|
Amended and Restated Registration Rights Agreement (incorporated by reference to Exhibit 4.2 to the Company's Annual Report on Form 10-K for the year ended December 31, 2000, as filed with the Commission on March 30, 2001 (File No. 001-16337)).
|
|
|
4.3
|
—
|
First Amendment to the Amended and Restated Registration Rights Agreement dated May 17, 2002 (incorporated by reference to Exhibit 4.3 to the Company's Annual Report on Form 10-K for the year ended December 31, 2002, as filed with the Commission on March 13, 2003 (File No. 001-16337)).
|
|
|
4.4
|
—
|
Registration Rights Agreement dated as of June 21, 2005 by and between Oil States International, Inc. and RBC Capital Markets Corporation (incorporated by reference to Exhibit 4.4 to Oil States' Current Report on Form 8-K as filed with the Commission on June 23, 2005 (File No. 001-16337)).
|
|
|
4.5
|
—
|
Indenture dated as of June 21, 2005 by and between Oil States International, Inc. and Wells Fargo Bank, National Association, as trustee (incorporated by reference to Exhibit 4.5 to Oil States' Current Report on Form 8-K as filed with the Commission on June 23, 2005 (File No. 001-16337)).
|
|
|
4.6
|
—
|
Global Notes representing $175,000,000 aggregate principal amount of 2 3/8% Contingent Convertible Senior Notes due 2025 (incorporated by reference to Section 2.2 of Exhibit 4.5 to Oil States' Current Reports on Form 8-K as filed with the Commission on June 23, 2005 and July 13, 2005 (File No. 001-16337)).
|
|
|
4.7
|
—
|
Indenture dated as of June 1, 2011 among the Company, the Guarantors and Wells Fargo Bank, N.A., as trustee (incorporated by reference to Exhibit 4.1 to the Company’s Current Report on Form 8-K, as filed with the Commission on June 1, 2011 (File No. 001-16337)).
|
|
|
4.8
|
—
|
Supplemental Indenture dated as of June 1, 2011 among the Company, the Guarantors and Wells Fargo Bank, N.A., as trustee (incorporated by reference to Exhibit 4.2 to the Company’s Current Report on Form 8-K, as filed with the Commission on June 1, 2011 (File No. 001-16337)).
|
|
4.9
|
—
|
First Supplemental Indenture, dated as of September 10, 2012, among Oil States Energy Services, L.L.C., Oil States International, Inc. (together with its successors and assigns), each other then-existing Guarantor under the Indenture, and Wells Fargo Bank, N.A., as Trustee, paying agent and registrar under such Indenture (incorporated by reference to Exhibit 4.1 to the Company’s Current Report on Form 8-K, as filed with the Commission on September 18, 2012 (File No. 001-16337)).
|
|
|
4.10
|
—
|
Indenture dated as of December 21, 2012 among Oil States International, Inc., the Guarantors named therein, and Wells Fargo Bank, N.A., as trustee, paying agent and registrar (incorporated by reference to Exhibit 4.1 to the Company’s Current Report on Form 8-K, as filed with the Commission on December 21, 2012 (File No. 001-16337)).
|
|
|
4.11*
|
—
|
First Supplemental Indenture, dated as of February 15, 2013, among Tempress Technologies, Inc., Oil States International, Inc. (together with its successors and assigns), each other then-existing Guarantor under the Indenture, and Wells Fargo Bank, N.A., as Trustee, paying agent and registrar under such Indenture.
|
|
|
4.12*
|
—
|
Second Supplemental Indenture, dated as of February 15, 2013, among Tempress Technologies, Inc., Oil States International, Inc. (together with its successors and assigns), each other then-existing Guarantor under the Indenture, and Wells Fargo Bank, N.A., as Trustee, paying agent and registrar under such Indenture.
|
|
|
10.1
|
—
|
Combination Agreement dated as of July 31, 2000 by and among Oil States International, Inc., HWC Energy Services, Inc., Merger Sub-HWC, Inc., Sooner Inc., Merger Sub-Sooner, Inc. and PTI Group Inc. (incorporated by reference to Exhibit 10.1 to the Company's Registration Statement on Form S-1, as filed with the Commission on August 10, 2000 (File No. 333-43400)).
|
|
|
10.2
|
—
|
Plan of Arrangement of PTI Group Inc. (incorporated by reference to Exhibit 10.2 to the Company's Annual Report on Form 10-K for the year ended December 31, 2000, as filed with the Commission on March 30, 2001 (File No. 001-16337)).
|
|
|
10.3
|
—
|
Support Agreement between Oil States International, Inc. and PTI Holdco (incorporated by reference to Exhibit 10.3 to the Company's Annual Report on Form 10-K for the year ended December 31, 2000, as filed with the Commission on March 30, 2001 (File No. 001-16337)).
|
|
|
10.4
|
—
|
Voting and Exchange Trust Agreement by and among Oil States International, Inc., PTI Holdco and Montreal Trust Company of Canada (incorporated by reference to Exhibit 10.4 to the Company's Annual Report on Form 10-K for the year ended December 31, 2000, as filed with the Commission on March 30, 2001 (File No. 001-16337)).
|
|
|
10.5**
|
—
|
Second Amended and Restated 2001 Equity Participation Plan effective March 30, 2009 (incorporated by reference to Exhibit 10.5 to Oil States' Current Report on Form 8-K, as filed with the Commission on April 2, 2009 (File No. 001-16337)).
|
|
|
10.6**
|
—
|
Deferred Compensation Plan effective November 1, 2003 (incorporated by reference to Exhibit 10.6 to the Company's Annual Report on Form 10-K for the year ended December 31, 2003, as filed with the Commission on March 5, 2004 (File No. 001-16337)).
|
|
|
10.7**
|
—
|
Annual Incentive Compensation Plan (incorporated by reference to Exhibit 10.7 to the Company's Annual Report on Form 10-K for the year ended December 31, 2000, as filed with the Commission on March 30, 2001 (File No. 001-16337)).
|
|
|
10.8**
|
—
|
Executive Agreement between Oil States International, Inc. and Cindy B. Taylor (incorporated by Reference to Exhibit 10.9 to the Company's Annual Report on Form 10-K for the year ended December 31, 2000, as filed with the Commission on March 30, 2001 (File No. 001-16337)).
|
|
|
10.9**
|
—
|
Form of Change of Control Severance Plan for Selected Members of Management (incorporated by reference to Exhibit 10.11 of the Company's Registration Statement on Form S-1, as filed with the Commission on December 12, 2000 (File No. 333-43400)).
|
|
|
10.10
|
—
|
Credit Agreement, dated as of October 30, 2003, among Oil States International, Inc., the Lenders named therein and Wells Fargo Bank Texas, National Association, as Administrative Agent and U.S. Collateral Agent; and Bank of Nova Scotia, as Canadian Administrative Agent and Canadian Collateral Agent; Hibernia National Bank and Royal Bank of Canada, as Co-Syndication Agents and Bank One, NA and Credit Lyonnais New York Branch, as Co-Documentation Agents (incorporated by reference to Exhibit 10.12 to the Company's Quarterly Report on Form 10-Q for the three months ended September 30, 2003, as filed with the Commission on November 12, 2003 (File No. 001-16337)).
|
|
|
10.10A
|
—
|
Incremental Assumption Agreement, dated as of May 10, 2004, among Oil States International, Inc., Wells Fargo, National Association and each of the other lenders listed as an Increasing Lender (incorporated by reference to Exhibit 10.12A to the Company's Quarterly Report on Form 10-Q for the three months ended June 30, 2004, as filed with the Commission on August 4, 2004 (File No. 001-16337)).
|
|
|
10.10B
|
—
|
Amendment No. 1, dated as of January 31, 2005, to the Credit Agreement among Oil States International, Inc., the lenders named therein and Wells Fargo Bank, Texas, National Association, as Administrative Agent and U.S. Collateral Agent; and Bank of Nova Scotia, as Canadian Administrative Agent and Canadian Collateral Agent; Hibernia National Bank and Royal Bank of Canada, as Co-Syndication Agents and Bank One, NA and Credit Lyonnais New York Branch, as Co-Documentation Agents (incorporated by reference to Exhibit 10.12B to the Company's Annual Report on Form 10-K for the year ended December 31, 2004, as filed with the Commission on March 2, 2005 (File No. 001-16337)).
|
|
|
10.10C
|
—
|
Amendment No. 2, dated as of December 5, 2006, to the Credit Agreement among Oil States International, Inc., the lenders named therein and Wells Fargo Bank, N.A., as Lead Arranger, U.S. Administrative Agent and U.S. Collateral Agent; and The Bank of Nova Scotia, as Canadian Administrative Agent and Canadian Collateral Agent; Capital One N.A. and Royal Bank of Canada, as Co-Syndication Agents and JP Morgan Chase Bank, N.A. and Calyon New York Branch, as Co-Documentation Agents (incorporated by reference to Exhibit 10.12C to the Company's Current Report on Form 8-K, as filed with the Commission on December 8, 2006 (File No. 001-16337)).
|
|
|
10.10D
|
—
|
Incremental Assumption Agreement, dated as of December 13, 2007, among Oil States International, Inc., Wells Fargo, National Association and each of the other lenders listed as an Increasing Lender (incorporated by reference to Exhibit 10.12D to the Company's Current Report on Form 8-K, as filed with the Commission on December 18, 2007 (File No. 001-16337)).
|
|
|
10.10E
|
—
|
Amendment No. 3, dated as of October 1, 2009, to the Credit Agreement among Oil States International, Inc., the lenders named therein and Wells Fargo Bank, N.A., as Lead Arranger, U.S. Administrative Agent and U.S. Collateral Agent; and The Bank of Nova Scotia, as Canadian Administrative Agent and Canadian Collateral Agent; Capital One N.A. and Royal Bank of Canada, as Co-Syndication Agents and JP Morgan Chase Bank, N.A. and Calyon New York Branch, as Co-Documentation Agents (incorporated by reference to Exhibit 10.11E to the Company's Current Report on Form 8-K, as filed with the Commission on October 2, 2009 (File No. 001-16337)).
|
|
|
10.10F
|
—
|
Amended and Restated Credit Agreement, dated as of December 10, 2010, among Oil States International, Inc., PTI Group Inc., PTI Premium Camp Services Ltd., as borrowers, the lenders named therein and Wells Fargo Bank, N.A., as Administrative Agent, U.S. Collateral Agent, the U.S. Swing Line Lender and an Issuing Bank; and Royal Bank of Canada, as Canadian Administrative Agent, Canadian Collateral Agent and the Canadian Swing Line Lender; JP Morgan Chase Bank, N.A., as Syndication Agent and Wells Fargo Securities, LLC, RBC Capital Markets and JP Morgan Securities, LLC, as Co-Lead Arrangers and Joint Bookrunners (incorporated by reference to Exhibit 10.1 to the Company's Current Report on Form 8-K, as filed with the Commission on December 20, 2010 (File No. 001-16337)).
|
|
|
10.10G
|
—
|
Facility Agreement dated July 13, 2011, between The MAC Services Group Pty Limited and National Australia Bank Limited (incorporated by reference to Exhibit 10.1 to the Company’s Current Report on Form 8-K, as filed with the Commission on July 15, 2011 (File No. 001-16337)).
|
|
10.10H
|
—
|
Syndicated Facility Agreement, dated as of September 18, 2012, among The MAC Services Group Pty Limited, as Borrower, the Lenders named therein, J.P. Morgan Australia Limited, as Australian Agent and Security Trustee, JPMorgan Chase Bank, N.A., as U.S. Agent, Issuing Bank and Swing Line Lender (incorporated by reference to Exhibit 10.1 to the Company’s Current Report on Form 8-K, as filed with the Commission on September 18, 2012 (File No. 001-16337)).
|
|
|
10.10I
|
—
|
Amendment No. 1 to the Amended and Restated Credit Agreement, dated as of September 18, 2012, among Oil States International, Inc., PTI Group Inc., PTI Premium Camp Services Ltd., each of the Guarantors named therein, the Lenders party thereto and Wells Fargo Bank, N.A., as administrative agent for the Lenders (incorporated by reference to Exhibit 10.2 to the Company’s Current Report on Form 8-K, as filed with the Commission on September 18, 2012 (File No. 001-16337)).
|
|
|
10.11**
|
—
|
Form of Indemnification Agreement (incorporated by reference to Exhibit 10.14 to the Company's Quarterly Report on Form 10-Q for the quarter ended September 30, 2004, as filed with the Commission on November 5, 2004 (File No. 001-16337)).
|
|
|
10.12**
|
—
|
Form of Director Stock Option Agreement under the Company's 2001 Equity Participation Plan (incorporated by reference to Exhibit 10.18 to the Company's Annual Report on Form 10-K for the year ended December 31, 2004, as filed with the Commission on March 2, 2005 (File No. 001-16337)).
|
|
|
10.13**
|
—
|
Form of Employee Non Qualified Stock Option Agreement under the Company's 2001 Equity Participation Plan (incorporated by reference to Exhibit 10.19 to the Company's Annual Report on Form 10-K for the year ended December 31, 2004, as filed with the Commission on March 2, 2005 (File No. 001-16337)).
|
|
|
|
|||
|
10.14**
|
—
|
Form of Restricted Stock Agreement under the Company's 2001 Equity Participation Plan (incorporated by reference to Exhibit 10.20 to the Company's Annual Report on Form 10-K for the year ended December 31, 2004, as filed with the Commission on March 2, 2005 (File No. 001-16337)).
|
|
|
10.15**
|
—
|
Non-Employee Director Compensation Summary (incorporated by reference to Exhibit 10.21 to the Company's Report on Form 8-K as filed with the Commission on November 15, 2006 (File No. 001-16337)).
|
|
|
10.16**
|
—
|
Executive Agreement between Oil States International, Inc. and named executive officer (Mr. Cragg) (incorporated by reference to Exhibit 10.22 to the Company's Quarterly Report on Form 10-Q for the quarter ended March 31, 2005, as filed with the Commission on April 29, 2005 (File No. 001-16337)).
|
|
|
10.17**
|
—
|
Form of Non-Employee Director Restricted Stock Agreement under the Company's 2001 Equity Participation Plan (incorporated by reference to Exhibit 10.22 to the Company's Report of Form 8-K, as filed with the Commission on May 24, 2005 (File No. 001-16337)).
|
|
|
10.18**
|
—
|
Executive Agreement between Oil States International, Inc. and named executive officer (Bradley Dodson) effective October 10, 2006 (incorporated by reference to Exhibit 10.24 to the Company's Quarterly Report on Form 10-Q for the quarter ended September 30, 2006, as filed with the Commission on November 3, 2006 (File No. 001-16337)).
|
|
|
10.19**
|
—
|
Executive Agreement between Oil States International, Inc. and named executive officer (Ron R. Green) effective May 17, 2007 (incorporated by reference to Exhibit 10.25 to the Company's Quarterly Report on Form 10-Q for the quarter ended June 30, 2007, as filed with the Commission on August 2, 2007 (File No. 001-16337)).
|
|
|
10.20**
|
—
|
Amendment to the Executive Agreement of Cindy Taylor, effective January 1, 2009 (incorporated by reference to Exhibit 10.21 to the Company's Annual Report on Form 10-K for the year ended December 31, 2008, as filed with the Commission on February 20, 2009 (File No. 001-16337)).
|
|
|
10.21**
|
—
|
Amendment to the Executive Agreement of Bradley Dodson, effective January 1, 2009 (incorporated by reference to Exhibit 10.22 to the Company's Annual Report on Form 10-K for the year ended December 31, 2008, as filed with the Commission on February 20, 2009 (File No. 001-16337)).
|
|
|
10.22**
|
—
|
Amendment to the Executive Agreement of Christopher Cragg, effective January 1, 2009 (incorporated by reference to Exhibit 10.24 to the Company's Annual Report on Form 10-K for the year ended December 31, 2008, as filed with the Commission on February 20, 2009 (File No. 001-16337)).
|
|
|
10.23**
|
—
|
Amendment to the Executive Agreement of Ron Green, effective January 1, 2009 (incorporated by reference to Exhibit 10.25 to the Company's Annual Report on Form 10-K for the year ended December 31, 2008, as filed with the Commission on February 20, 2009 (File No. 001-16337)).
|
|
|
10.24**
|
—
|
Amendment to the Executive Agreement of Robert Hampton, effective January 1, 2009 (incorporated by reference to Exhibit 10.26 to the Company's Annual Report on Form 10-K for the year ended December 31, 2008, as filed with the Commission on February 20, 2009 (File No. 001-16337)).
|
|
|
10.25**
|
—
|
Executive Agreement between Oil States International, Inc. and named executive officer (Charles Moses), effective March 4, 2010 (incorporated by reference to Exhibit 10.26 to the Company's Quarterly Report on Form 10-Q for the quarter ended March 31, 2010, as filed with the Commission on April 30, 2010 (File No. 001-16337)).
|
|
|
10.26**
|
—
|
Call Option Agreement, dated October 15, 2010, by and between Marley Holdings Pty Limited and PTI Holding Company 2 Pty Limited (incorporated by reference to Exhibit 10.1 to Oil States’ Current Report on Form 8-K, as filed with the Commission on October 5, 2010 (File No. 001-16337)).
|
|
|
10.27**
|
—
|
Assignment Letter between the Company and Ron Green effective May 3, 2011 (incorporated by reference to Exhibit 10.1 to the Company’s Current Report on Form 8-K, as filed with the Commission on May 6, 2011 (File No. 001-16337)).
|
|
|
10.28**
|
—
|
Deferred Stock Performance Award Agreement (incorporated by reference to Exhibit 10.1 to the Company’s Current Report on Form 8-K, as filed with the Commission on February 23, 2012 (File No. 001-16337)).
|
|
|
21.1*
|
—
|
List of subsidiaries of the Company.
|
|
|
23.1*
|
—
|
Consent of Independent Registered Public Accounting Firm.
|
|
|
24.1*
|
—
|
Powers of Attorney for Directors.
|
|
|
31.1***
|
—
|
Certification of Chief Executive Officer of Oil States International, Inc. pursuant to Rules 13a-14(a) or 15d-14(a) under the Securities Exchange Act of 1934.
|
|
|
31.2***
|
—
|
Certification of Chief Financial Officer of Oil States International, Inc. pursuant to Rules 13a-14(a) or 15d-14(a) under the Securities Exchange Act of 1934.
|
|
|
32.1***
|
—
|
Certification of Chief Executive Officer of Oil States International, Inc. pursuant to Rules 13a-14(b) or 15d-14(b) under the Securities Exchange Act of 1934.
|
|
|
32.2***
|
—
|
Certification of Chief Financial Officer of Oil States International, Inc. pursuant to Rules 13a-14(b) or 15d-14(b) under the Securities Exchange Act of 1934.
|
|
|
101.INS*
|
—
|
XBRL Instance Document
|
|
|
101.SCH*
|
—
|
XBRL Taxonomy Extension Schema Document
|
|
|
101.CAL*
|
—
|
XBRL Taxonomy Extension Calculation Linkbase Document
|
|
|
101.DEF*
|
—
|
XBRL Taxonomy Extension Definition Linkbase Document.
|
|
|
101.LAB*
|
—
|
XBRL Taxonomy Extension Label Linkbase Document
|
|
|
101.PRE*
|
—
|
XBRL Taxonomy Extension Presentation Linkbase Document
|
|
|
---------
|
* Filed herewith
** Management contracts or compensatory plans or arrangements
*** Furnished herewith.
- 70 -
SIGNATURES
Pursuant to the requirements of Section 13 or 15(d) of the Securities Exchange Act of 1934, the registrant has duly caused this report to be signed on its behalf by the undersigned, thereunto duly authorized on February 20, 2013.
|
OIL STATES INTERNATIONAL, INC.
|
|||
|
By
|
/s/ CINDY B. TAYLOR | ||
| Cindy B. Taylor | |||
| President and Chief Executive Officer | |||
Pursuant to the requirements of the Securities Exchange Act of 1934, this report has been signed by the following persons on behalf of the registrant in the capacities indicated on February 20, 2013.
|
Signature
|
Title
|
||
|
/s/ STEPHEN A. WELLS*
|
Chairman of the Board
|
||
|
Stephen A. Wells
|
|||
|
/s/ CINDY B. TAYLOR
|
Director, President & Chief Executive Officer
|
||
|
Cindy B. Taylor
|
(Principal Executive Officer)
|
||
|
/s/ BRADLEY J. DODSON
|
Senior Vice President, Chief Financial Officer
|
||
|
Bradley J. Dodson
|
and Treasurer
|
||
|
(Principal Financial Officer)
|
|||
|
/s/ ROBERT W. HAMPTON
|
Senior Vice President —Accounting and Corporate Secretary
|
||
|
Robert W. Hampton
|
(Principal Accounting Officer)
|
||
|
/s/ MARTIN A. LAMBERT*
|
Director
|
||
|
Martin A. Lambert
|
|||
|
/s/ S. JAMES NELSON, JR.*
|
Director
|
||
|
S. James Nelson, Jr.
|
|||
|
/s/ MARK G. PAPA*
|
Director
|
||
|
Mark G. Papa
|
|||
|
/s/ GARY L. ROSENTHAL*
|
Director
|
||
|
Gary L. Rosenthal
|
|||
|
/s/ CHRISTOPHER T. SEAVER*
|
Director
|
||
|
Christopher T. Seaver
|
|||
|
/s/ DOUGLAS E. SWANSON*
|
Director
|
||
|
Douglas E. Swanson
|
|||
|
/s/ WILLIAM T. VAN KLEEF*
|
Director
|
||
|
William T. Van Kleef
|
|||
| *By: |
/s/ BRADLEY J. DODSON
|
||
|
Bradley J. Dodson, pursuant to a power of
|
|||
|
attorney filed as Exhibit 24.1 to this
|
|||
|
Annual Report on Form 10-K
|
|||
- 71 -
OIL STATES INTERNATIONAL, INC. AND SUBSIDIARIES
INDEX TO
CONSOLIDATED FINANCIAL STATEMENTS
|
Report of Independent Registered Public Accounting Firm on Consolidated Financial Statements
|
73
|
|
Report of Independent Registered Public Accounting Firm on the Company's Internal
Control Over Financial Reporting
|
74 |
|
Consolidated Statements of Income for the Years Ended December 31, 2012, 2011, and 2010
|
75
|
|
Consolidated Statements of Comprehensive Income for the Years Ended December 31, 2012, 2011, and 2010
|
76
|
|
Consolidated Balance Sheets at December 31, 2012 and 2011
|
77
|
|
Consolidated Statements of Stockholders' Equity for the Years Ended December 31, 2012, 2011 and 2010
|
78
|
|
Consolidated Statements of Cash Flows for the Years Ended December 31, 2012, 2011, and 2010
|
79
|
|
Notes to Consolidated Financial Statements
|
80 – 114
|
- 72 -
OIL STATES INTERNATIONAL, INC. AND SUBSIDIARIES
REPORT OF INDEPENDENT REGISTERED PUBLIC ACCOUNTING FIRM
To the Board of Directors and Stockholders of Oil States International, Inc.:
We have audited the accompanying consolidated balance sheets of Oil States International, Inc. and subsidiaries as of December 31, 2012 and 2011, and the related consolidated statements of income and comprehensive income, stockholders’ equity, and cash flows for each of the three years in the period ended December 31, 2012. These financial statements are the responsibility of the Company’s management. Our responsibility is to express an opinion on these financial statements based on our audits.
We conducted our audits in accordance with the standards of the Public Company Accounting Oversight Board (United States). Those standards require that we plan and perform the audit to obtain reasonable assurance about whether the financial statements are free of material misstatement. An audit includes examining, on a test basis, evidence supporting the amounts and disclosures in the financial statements. An audit also includes assessing the accounting principles used and significant estimates made by management, as well as evaluating the overall financial statement presentation. We believe that our audits provide a reasonable basis for our opinion.
In our opinion, the financial statements referred to above present fairly, in all material respects, the consolidated financial position of Oil States International, Inc. and subsidiaries at December 31, 2012 and 2011, and the consolidated results of its operations and its cash flows for each of the three years in the period ended December 31, 2012, in conformity with U.S. generally accepted accounting principles.
We also have audited, in accordance with the standards of the Public Company Accounting Oversight Board (United States), Oil States International, Inc. and subsidiaries’ internal control over financial reporting as of December 31, 2012, based on criteria established in Internal Control — Integrated Framework issued by the Committee of Sponsoring Organizations of the Treadway Commission and our report dated February 20, 2013 expressed an unqualified opinion thereon.
|
/s/ Ernst & Young LLP
|
Houston, Texas
February 20, 2013
- 73 -
OIL STATES INTERNATIONAL, INC. AND SUBSIDIARIES
REPORT OF INDEPENDENT REGISTERED PUBLIC ACCOUNTING FIRM
To the Board of Directors and Stockholders of Oil States International, Inc.:
We have audited Oil States International, Inc. and subsidiaries’ internal control over financial reporting as of December 31, 2012, based on criteria established in Internal Control—Integrated Framework issued by the Committee of Sponsoring Organizations of the Treadway Commission (the COSO criteria). Oil States International, Inc. and subsidiaries’ management is responsible for maintaining effective internal control over financial reporting, and for its assessment of the effectiveness of internal control over financial reporting included in the accompanying Management’s annual report on internal control over financial reporting. Our responsibility is to express an opinion on the company’s internal control over financial reporting based on our audit.
We conducted our audit in accordance with the standards of the Public Company Accounting Oversight Board (United States). Those standards require that we plan and perform the audit to obtain reasonable assurance about whether effective internal control over financial reporting was maintained in all material respects. Our audit included obtaining an understanding of internal control over financial reporting, assessing the risk that a material weakness exists, testing and evaluating the design and operating effectiveness of internal control based on the assessed risk, and performing such other procedures as we considered necessary in the circumstances. We believe that our audit provides a reasonable basis for our opinion.
A company’s internal control over financial reporting is a process designed to provide reasonable assurance regarding the reliability of financial reporting and the preparation of financial statements for external purposes in accordance with generally accepted accounting principles. A company’s internal control over financial reporting includes those policies and procedures that (1) pertain to the maintenance of records that, in reasonable detail, accurately and fairly reflect the transactions and dispositions of the assets of the company; (2) provide reasonable assurance that transactions are recorded as necessary to permit preparation of financial statements in accordance with generally accepted accounting principles, and that receipts and expenditures of the company are being made only in accordance with authorizations of management and directors of the company; and (3) provide reasonable assurance regarding prevention or timely detection of unauthorized acquisition, use or disposition of the company’s assets that could have a material effect on the financial statements.
Because of its inherent limitations, internal control over financial reporting may not prevent or detect misstatements. Also, projections of any evaluation of effectiveness to future periods are subject to the risk that controls may become inadequate because of changes in conditions, or that the degree of compliance with the policies or procedures may deteriorate.
As indicated in the accompanying Management's annual report on internal control over financial reporting, management’s assessment of and conclusion on the effectiveness of internal control over financial reporting did not include the internal controls of the business acquired from Piper Valve Systems, Ltd. and Tempress Technologies, Inc. which is included in the 2012 consolidated financial statements of Oil States International, Inc. and subsidiaries and constituted 2.6 percent of total assets as of December 31, 2012 and less than 1 percent of revenues for the year then ended. Our audit of internal control over financial reporting of Oil States International, Inc. and subsidiaries’ also did not include an evaluation of the internal control over financial reporting of the business acquired from Piper Valve Systems, Ltd. and Tempress Technologies, Inc.
In our opinion, Oil States International, Inc. and subsidiaries maintained, in all material respects, effective internal control over financial reporting as of December 31, 2012, based on the COSO criteria.
We also have audited, in accordance with the standards of the Public Company Accounting Oversight Board (United States), the consolidated balance sheets of Oil States International, Inc. and subsidiaries as of December 31, 2012 and 2011, and the related consolidated statements of income and comprehensive income, stockholders’ equity, and cash flows for each of the three years in the period ended December 31, 2012 and our report dated February 20, 2013 expressed an unqualified opinion thereon.
|
/s/ Ernst & Young LLP
|
Houston, Texas
February 20, 2013
- 74 -
OIL STATES INTERNATIONAL, INC. AND SUBSIDIARIES
CONSOLIDATED STATEMENTS OF INCOME
(In Thousands, Except Per Share Amounts)
|
|
Year Ended December 31,
|
|||||||||||
|
|
2012
|
2011
|
2010
|
|||||||||
|
Revenues:
|
||||||||||||
|
Product
|
$ | 2,429,139 | $ | 1,815,526 | $ | 1,282,212 | ||||||
|
Service and other
|
1,983,949 | 1,663,654 | 1,129,772 | |||||||||
| 4,413,088 | 3,479,180 | 2,411,984 | ||||||||||
|
Costs and expenses:
|
||||||||||||
|
Product costs
|
2,174,000 | 1,617,399 | 1,147,427 | |||||||||
|
Service and other costs
|
1,118,969 | 981,868 | 726,867 | |||||||||
|
Selling, general and administrative expenses
|
203,651 | 182,434 | 150,865 | |||||||||
|
Depreciation and amortization expense
|
230,098 | 188,147 | 124,202 | |||||||||
|
Other operating expense
|
2,590 | 1,809 | 7,041 | |||||||||
| 3,729,308 | 2,971,657 | 2,156,402 | ||||||||||
|
Operating income
|
683,780 | 507,523 | 255,582 | |||||||||
|
Interest expense, net of capitalized interest
|
(68,922 | ) | (57,506 | ) | (16,274 | ) | ||||||
|
Interest income
|
1,583 | 1,700 | 751 | |||||||||
|
Equity in earnings (loss) of unconsolidated affiliates
|
243 | (163 | ) | 239 | ||||||||
|
Other income
|
10,211 | 3,515 | 330 | |||||||||
|
Income before income taxes
|
626,895 | 455,069 | 240,628 | |||||||||
|
Income tax provision
|
(177,047 | ) | (131,647 | ) | (72,023 | ) | ||||||
|
Net income
|
$ | 449,848 | $ | 323,422 | $ | 168,605 | ||||||
|
Less: Net income attributable to noncontrolling interests
|
1,239 | 969 | 587 | |||||||||
|
Net income attributable to Oil States International, Inc.
|
$ | 448,609 | $ | 322,453 | $ | 168,018 | ||||||
|
Net income per share attributable to Oil States International, Inc. common stockholders
|
||||||||||||
|
Basic
|
$ | 8.47 | $ | 6.30 | $ | 3.34 | ||||||
|
Diluted
|
$ | 8.10 | $ | 5.86 | $ | 3.19 | ||||||
|
Weighted average number of common shares outstanding (in thousands):
|
||||||||||||
|
Basic
|
52,959 | 51,163 | 50,238 | |||||||||
|
Diluted
|
55,384 | 55,007 | 52,700 | |||||||||
The accompanying notes are an integral part of these financial statements.
- 75 -
OIL STATES INTERNATIONAL, INC. AND SUBSIDIARIES
CONSOLIDATED STATEMENTS OF COMPREHENSIVE INCOME
(In Thousands)
|
Year Ended December 31,
|
||||||||||||
|
2012
|
2011
|
2010
|
||||||||||
|
Net income
|
$ | 449,848 | $ | 323,422 | $ | 168,605 | ||||||
|
Other comprehensive income (loss):
|
||||||||||||
|
Foreign currency translation adjustment
|
33,450 | (10,079 | ) | 40,274 | ||||||||
|
Unrealized loss on forward contracts, net of tax
|
(724 | ) | -- | -- | ||||||||
|
Other
|
-- | (99 | ) | 160 | ||||||||
|
Total other comprehensive income (loss)
|
32,726 | (10,178 | ) | 40,434 | ||||||||
|
Comprehensive income
|
482,574 | 313,244 | 209,039 | |||||||||
|
Comprehensive income attributable to noncontrolling interest
|
(1,256 | ) | (948 | ) | (612 | ) | ||||||
|
Comprehensive income attributable to Oil States International, Inc.
|
$ | 481,318 | $ | 312,296 | $ | 208,427 | ||||||
The accompanying notes are an integral part of these financial statements.
- 76 -
OIL STATES INTERNATIONAL, INC. AND SUBSIDIARIES
CONSOLIDATED BALANCE SHEETS
(In Thousands, Except Share Amounts)
|
|
December 31,
|
|||||||
|
|
2012
|
2011
|
||||||
|
ASSETS
|
||||||||
|
Current assets:
|
||||||||
|
Cash and cash equivalents
|
$ | 253,172 | $ | 71,721 | ||||
|
Accounts receivable, net
|
832,785 | 732,240 | ||||||
|
Inventories, net
|
701,496 | 653,698 | ||||||
|
Prepaid expenses and other current assets
|
38,639 | 32,000 | ||||||
|
Total current assets
|
1,826,092 | 1,489,659 | ||||||
|
Property, plant and equipment, net
|
1,852,126 | 1,557,088 | ||||||
|
Goodwill, net
|
520,818 | 467,450 | ||||||
|
Other intangible assets, net
|
146,103 | 127,602 | ||||||
|
Other noncurrent assets
|
94,823 | 61,842 | ||||||
|
Total assets
|
$ | 4,439,962 | $ | 3,703,641 | ||||
|
LIABILITIES AND STOCKHOLDERS' EQUITY
|
||||||||
|
Current liabilities:
|
||||||||
|
Accounts payable
|
$ | 279,933 | $ | 252,209 | ||||
|
Accrued liabilities
|
107,906 | 96,748 | ||||||
|
Income taxes
|
29,588 | 10,395 | ||||||
|
Current portion of long-term debt and capitalized leases
|
30,480 | 34,435 | ||||||
|
Deferred revenue
|
66,311 | 75,497 | ||||||
|
Other current liabilities
|
4,314 | 5,665 | ||||||
|
Total current liabilities
|
518,532 | 474,949 | ||||||
|
Long-term debt and capitalized leases
|
1,279,805 | 1,142,505 | ||||||
|
Deferred income taxes
|
129,235 | 97,377 | ||||||
|
Other noncurrent liabilities
|
46,590 | 25,538 | ||||||
|
Total liabilities
|
1,974,162 | 1,740,369 | ||||||
|
Stockholders' equity:
|
||||||||
|
Oil States International, Inc. stockholders' equity:
|
||||||||
|
Common stock, $.01 par value, 200,000,000 shares authorized,
58,488,299 shares and 54,803,539 shares issued, respectively, and
54,695,473 shares and 51,288,750 shares outstanding, respectively
|
585 | 548 | ||||||
|
Additional paid-in capital
|
586,070 | 545,730 | ||||||
|
Retained earnings
|
1,899,195 | 1,450,586 | ||||||
|
Accumulated other comprehensive income
|
107,097 | 74,371 | ||||||
|
Common stock held in treasury at cost, 3,792,826 and 3,514,789
shares, respectively
|
(128,542 | ) | (109,079 | ) | ||||
|
Total Oil States International, Inc. stockholders' equity
|
2,464,405 | 1,962,156 | ||||||
|
Noncontrolling interest
|
1,395 | 1,116 | ||||||
|
Total stockholders' equity
|
2,465,800 | 1,963,272 | ||||||
|
Total liabilities and stockholders' equity
|
$ | 4,439,962 | $ | 3,703,641 | ||||
The accompanying notes are an integral part of these financial statements.
- 77 -
OIL STATES INTERNATIONAL, INC. AND SUBSIDIARIES
CONSOLIDATED STATEMENTS OF STOCKHOLDERS' EQUITY
(In thousands)
|
Common Stock
|
Additional Paid-In Capital
|
Retained Earnings
|
Accumulated Other Comprehensive Income (Loss)
|
Treasury Stock
|
Noncontrolling Interest
|
Total Stockholders' Equity
|
||||||||||||||||||||||
|
Balance, December 31, 2009
|
$ | 531 | $ | 468,428 | $ | 960,115 | $ | 44,115 | $ | (92,341 | ) | $ | 1,218 | $ | 1,382,066 | |||||||||||||
|
Net income
|
168,018 | 587 | 168,605 | |||||||||||||||||||||||||
|
Currency translation adjustment
|
40,274 | 25 | 40,299 | |||||||||||||||||||||||||
|
Other comprehensive loss
|
160 | 160 | ||||||||||||||||||||||||||
|
Dividends paid
|
(803 | ) | (803 | ) | ||||||||||||||||||||||||
|
Exercise of stock options, including tax benefit
|
9 | 27,380 | 27,389 | |||||||||||||||||||||||||
|
Amortization of restricted stock compensation
|
6,592 | 6,592 | ||||||||||||||||||||||||||
|
Stock option expense
|
6,028 | 6,028 | ||||||||||||||||||||||||||
|
Surrender of stock to pay taxes on restricted stock awards
|
2 | (2 | ) | (1,406 | ) | (1,406 | ) | |||||||||||||||||||||
|
Other
|
(1 | ) | 3 | 1 | 3 | |||||||||||||||||||||||
|
Balance, December 31, 2010
|
$ | 541 | $ | 508,429 | $ | 1,128,133 | $ | 84,549 | $ | (93,746 | ) | $ | 1,027 | $ | 1,628,933 | |||||||||||||
|
Net income
|
322,453 | 969 | 323,422 | |||||||||||||||||||||||||
|
Currency translation adjustment
|
(10,079 | ) | (21 | ) | (10,100 | ) | ||||||||||||||||||||||
|
Other comprehensive income
|
(99 | ) | (99 | ) | ||||||||||||||||||||||||
|
Dividends paid
|
(859 | ) | (859 | ) | ||||||||||||||||||||||||
|
Exercise of stock options, including tax benefit
|
5 | 22,732 | 22,737 | |||||||||||||||||||||||||
|
Amortization of restricted stock compensation
|
8,412 | 8,412 | ||||||||||||||||||||||||||
|
Stock option expense
|
6,153 | 6,153 | ||||||||||||||||||||||||||
|
Surrender of stock to pay taxes on restricted stock awards
|
2 | (2 | ) | (2,702 | ) | (2,702 | ) | |||||||||||||||||||||
|
Stock acquired for cash
|
(12,632 | ) | (12,632 | ) | ||||||||||||||||||||||||
|
Other
|
6 | 1 | 7 | |||||||||||||||||||||||||
|
Balance, December 31, 2011
|
$ | 548 | $ | 545,730 | $ | 1,450,586 | $ | 74,371 | $ | (109,079 | ) | $ | 1,116 | $ | 1,963,272 | |||||||||||||
|
Net income
|
448,609 | 1,239 | 449,848 | |||||||||||||||||||||||||
|
Currency translation adjustment
|
33,450 | 17 | 33,467 | |||||||||||||||||||||||||
|
Unrealized loss on forward contracts, net of tax
|
(724 | ) | (724 | ) | ||||||||||||||||||||||||
|
Dividends paid
|
(977 | ) | (977 | ) | ||||||||||||||||||||||||
|
Exercise of stock options, including tax benefit
|
5 | 21,465 | 21,470 | |||||||||||||||||||||||||
|
Amortization of restricted stock compensation
|
13,390 | 13,390 | ||||||||||||||||||||||||||
|
Stock option expense
|
5,514 | 5,514 | ||||||||||||||||||||||||||
|
Surrender of stock to pay taxes on restricted stock awards
|
2 | (2 | ) | (4,218 | ) | (4,218 | ) | |||||||||||||||||||||
|
Stock acquired for cash
|
(15,245 | ) | (15,245 | ) | ||||||||||||||||||||||||
|
Conversion of 2 3/8% Notes - reacquisition of equity component
|
(220,597 | ) | (220,597 | ) | ||||||||||||||||||||||||
|
Shares issued upon conversion of 2 3/8% Notes
|
30 | 220,566 | 220,596 | |||||||||||||||||||||||||
|
Other
|
4 | 4 | ||||||||||||||||||||||||||
|
Balance, December 31, 2012
|
$ | 585 | $ | 586,070 | $ | 1,899,195 | $ | 107,097 | $ | (128,542 | ) | $ | 1,395 | $ | 2,465,800 | |||||||||||||
The accompanying notes are an integral part of these financial statements.
- 78 -
OIL STATES INTERNATIONAL, INC. AND SUBSIDIARIES
CONSOLIDATED STATEMENTS OF CASH FLOWS
(In Thousands)
|
Year Ended December 31,
|
||||||||||||
|
2012
|
2011
|
2010
|
||||||||||
|
Cash flows from operating activities:
|
||||||||||||
|
Net income
|
$ | 449,848 | $ | 323,422 | $ | 168,605 | ||||||
|
Adjustments to reconcile net income to net cash provided by
operating activities:
|
||||||||||||
|
Depreciation and amortization
|
230,098 | 188,147 | 124,202 | |||||||||
|
Deferred income tax provision
|
17,370 | 27,075 | 20,590 | |||||||||
|
Excess tax benefits from share-based payment arrangements
|
(8,164 | ) | (8,583 | ) | (4,029 | ) | ||||||
|
Non-cash compensation charge
|
18,904 | 14,565 | 12,620 | |||||||||
|
Losses (gains) on disposals of assets
|
(8,600 | ) | (3,614 | ) | 211 | |||||||
|
Accretion of debt discount
|
4,106 | 7,786 | 7,249 | |||||||||
|
Amortization of deferred financing costs
|
7,301 | 6,497 | 1,703 | |||||||||
|
Other, net
|
1,535 | 960 | (263 | ) | ||||||||
|
Changes in operating assets and liabilities, net of effect from acquired businesses:
|
||||||||||||
|
Accounts receivable
|
(83,379 | ) | (260,186 | ) | (61,835 | ) | ||||||
|
Inventories
|
(34,182 | ) | (154,290 | ) | (75,416 | ) | ||||||
|
Accounts payable and accrued liabilities
|
30,697 | 47,610 | 82,032 | |||||||||
|
Taxes payable
|
17,960 | 24,789 | (22,468 | ) | ||||||||
|
Other current assets and liabilities, net
|
(6,011 | ) | 1,735 | (22,279 | ) | |||||||
|
Net cash flows provided by operating activities
|
637,483 | 215,913 | 230,922 | |||||||||
|
Cash flows from investing activities:
|
||||||||||||
|
Capital expenditures, including capitalized interest
|
(487,937 | ) | (487,482 | ) | (182,207 | ) | ||||||
|
Acquisitions of businesses, net of cash acquired
|
(80,449 | ) | (2,412 | ) | (709,575 | ) | ||||||
|
Proceeds from disposition of property, plant and equipment
|
14,653 | 5,949 | 2,734 | |||||||||
|
Deposits held in escrow related to acquisitions of businesses
|
(20,000 | ) | -- | -- | ||||||||
|
Other, net
|
(3,244 | ) | (5,010 | ) | (632 | ) | ||||||
|
Net cash flows used in investing activities
|
(576,977 | ) | (488,955 | ) | (889,680 | ) | ||||||
|
Cash flows from financing activities:
|
||||||||||||
|
Revolving credit borrowings and (repayments), net
|
(64,251 | ) | (316,736 | ) | 347,129 | |||||||
|
6 1/2 % senior notes issued
|
-- | 600,000 | -- | |||||||||
|
Payment of principal on 2 3/8% Notes conversion
|
(174,990 | ) | (10 | ) | -- | |||||||
|
5 1/8 % senior notes issued
|
400,000 | -- | -- | |||||||||
|
Term loan borrowings (repayments)
|
(30,047 | ) | (14,972 | ) | 300,955 | |||||||
|
Debt and capital lease repayments
|
(4,569 | ) | (2,529 | ) | (487 | ) | ||||||
|
Issuance of common stock from share based payment arrangements
|
13,628 | 14,154 | 23,361 | |||||||||
|
Purchase of treasury stock
|
(15,245 | ) | (12,632 | ) | -- | |||||||
|
Excess tax benefits from share based payment arrangements
|
8,164 | 8,583 | 4,029 | |||||||||
|
Payment of financing costs
|
(7,914 | ) | (13,464 | ) | (24,548 | ) | ||||||
|
Tax withholdings related to net share settlements of restricted stock
|
(4,218 | ) | (2,702 | ) | (1,406 | ) | ||||||
|
Other, net
|
-- | (1,804 | ) | (1 | ) | |||||||
|
Net cash flows provided by financing activities
|
120,558 | 257,888 | 649,032 | |||||||||
|
Effect of exchange rate changes on cash
|
680 | (9,332 | ) | 16,477 | ||||||||
|
Net increase (decrease) in cash and cash equivalents from continuing operationscontinuing operations
|
181,744 | (24,486 | ) | 6,751 | ||||||||
|
Net cash used in discontinued operations – operating activities
|
(293 | ) | (143 | ) | (143 | ) | ||||||
|
Cash and cash equivalents, beginning of year
|
71,721 | 96,350 | 89,742 | |||||||||
|
Cash and cash equivalents, end of year
|
$ | 253,172 | $ | 71,721 | $ | 96,350 | ||||||
The accompanying notes are an integral part of these financial statements.
- 79 -
OIL STATES INTERNATIONAL, INC. AND SUBSIDIARIES
NOTES TO CONSOLIDATED FINANCIAL STATEMENTS
1. Organization and Basis of Presentation
The Consolidated Financial Statements include the accounts of Oil States International, Inc. (Oil States or the Company) and its consolidated subsidiaries. Investments in unconsolidated affiliates, in which the Company is able to exercise significant influence, are accounted for using the equity method. All significant intercompany accounts and transactions between the Company and its consolidated subsidiaries have been eliminated in the accompanying Consolidated Financial Statements.
The Company, through its subsidiaries, is a leading provider of specialty products and services to natural resources companies throughout the world. We operate in a substantial number of the world's active oil, natural gas and coal producing regions, including Canada, onshore and offshore U.S., Australia, West Africa, the North Sea, South America and Southeast and Central Asia. The Company operates in four principal reportable business segments – accommodations, offshore products, well site services and tubular services.
2. Summary of Significant Accounting Policies
Cash and Cash Equivalents
The Company considers all highly liquid investments purchased with an original maturity of three months or less to be cash equivalents.
Fair Value of Financial Instruments
The Company’s financial instruments consist of cash and cash equivalents, investments, receivables, payables, debt instruments and foreign currency forward contracts. The Company believes that the carrying values of these instruments, other than our 6 1/2%, 5 1/8% and 2 3/8% Notes (before their redemption in July 2012), on the accompanying consolidated balance sheets approximate their fair values.
The fair values of our 6 1/2%, 5 1/8% and 2 3/8% Notes (before their redemption in July 2012) are estimated based on quoted prices and analysis of similar instruments (Level 2 fair value measurements). The Company changed from a Level 1 fair value measurement standard to a Level 2 fair value measurement standard in the second quarter of 2012 in consideration of the relatively low daily trading volume of our debt instruments. The carrying values and fair values of these notes are as follows for the periods indicated (in thousands):
|
December 31, 2012
|
December 31, 2011
|
||||||||||||||||||
|
Interest
Rate
|
Carrying
Value
|
Fair
Value
|
Carrying
Value
|
Fair
Value
|
|||||||||||||||
|
6 1/2% Notes
|
|||||||||||||||||||
|
Principal amount due 2019
|
6 1/2 | % | $ | 600,000 | $ | 641,628 | $ | 600,000 | $ | 625,128 | |||||||||
|
5 1/8% Notes
|
|||||||||||||||||||
|
Principal amount due 2023
|
5 1/8 | % | $ | 400,000 | $ | 405,752 | $ | - | $ | - | |||||||||
|
2 3/8% Notes
|
|||||||||||||||||||
|
Principal amount
|
2 3/8 | % | $ | - | $ | - | $ | 174,990 | $ | 411,396 | |||||||||
|
Less: unamortized discount
|
- | - | 4,106 | - | |||||||||||||||
|
Net value
|
$ | - | $ | - | $ | 170,884 | $ | 411,396 | |||||||||||
- 80 -
OIL STATES INTERNATIONAL, INC. AND SUBSIDIARIES
NOTES TO CONSOLIDATED FINANCIAL STATEMENTS
(Continued)
See Note 9 – “Derivative Instruments and Hedging Activities” for a discussion of the fair values
of
the Company’s foreign currency forward contracts.
As of December 31, 2012 and 2011, the carrying value of the Company's debt outstanding under its credit facilities was estimated to be at fair value.
Restricted Cash
At December 31, 2012, cash of $25.3 million held in escrow accounts and subject to terms of acquisition agreements providing for contingent consideration and seller representation and warranty provisions and are included in “Other noncurrent assets” in our Consolidated Balance Sheets.
Inventories
Inventories consist of tubular and other oilfield products, manufactured equipment, spare parts for manufactured equipment, work-in-process, raw materials and supplies and materials for the construction of remote accommodation facilities. Inventories include raw materials, labor, subcontractor charges and manufacturing overhead and are carried at the lower of cost or market. The cost of inventories is determined on an average cost or specific-identification method. A reserve for excess, damaged, remnants and/or obsolete inventory is maintained based on the age, turnover or condition of the inventory.
Property, Plant, and Equipment
Property, plant, and equipment are stated at cost or at estimated fair market value at acquisition date if acquired in a business combination, and depreciation is computed, for assets owned or recorded under capital lease, using the straight-line method, after allowing for
salvage
value where applicable, over the estimated useful lives of the assets. We use the component depreciation method for our drilling services and Australian accommodations assets. Leasehold improvements are capitalized and amortized over the lesser of the life of the lease or the estimated useful life of the asset.
Expenditures for repairs and maintenance are charged to expense when incurred. Expenditures for major renewals and betterments, which extend the useful lives of existing equipment, are capitalized and depreciated. Upon retirement or disposition of property and equipment, the cost and related accumulated depreciation are removed from the accounts and any resulting gain or loss is recognized in the statements of income.
Asset Retirement Obligations
We recognize initial estimated asset retirement obligations (ARO) related to properties as liabilities, with an associated increase in property and equipment for the asset’s estimated retirement cost. Accretion expense is recognized over the estimated productive life of the related assets. If the fair value of the estimated ARO changes, an adjustment is recorded to both the ARO and the capitalized asset retirement cost. Revisions in estimated liabilities can result from changes in estimated inflation rates, changes in service and equipment costs and changes in the estimated timing of settling the ARO. The Company relieves ARO liabilities when the related obligations are settled. At December 31, 2012, $5.5 million of ARO was included in the Consolidated Balance Sheet in “Other noncurrent liabilities.” The ARO liability reflects the estimated present value of the amount of asset removal and site reclamation costs related to the retirement of assets in the Company’s accommodations business. Total accretion expense related to the ARO was $0.3 million in 2012. The Company utilizes current retirement costs to estimate the expected cash outflows for retirement obligations. The Company estimates the ultimate productive life of the properties and a risk-adjusted discount rate in order to determine the current present value of the obligation.
- 81 -
OIL STATES INTERNATIONAL, INC. AND SUBSIDIARIES
NOTES TO CONSOLIDATED FINANCIAL STATEMENTS
(Continued)
Goodwill and Intangible Assets
Goodwill represents the excess of the purchase price paid for acquired businesses over the allocated fair value of the related net assets after impairments, if applicable. Goodwill is stated net of accumulated amortization of $11 million as of December 31, 2012 and 2011.
We evaluate goodwill for impairment annually and when an event occurs or circumstances change to suggest that the carrying amount may not be recoverable. Our reporting units with goodwill include accommodations, offshore products and completion services. In accordance with current accounting standards, we are given the option to test for impairment of our goodwill by first performing a qualitative assessment to determine whether it is more likely than not (that is, likelihood of more than 50 percent) that the fair value of a reporting unit is less than its carrying amount, including goodwill. If it is determined that it is more likely than not that the fair value of a reporting unit is greater than its carrying amount, then performing the currently prescribed two-step impairment test is unnecessary. In developing a qualitative assessment to meet the “more-likely-than-not” threshold, each reporting unit with goodwill on its balance sheet is assessed separately and different relevant events and circumstances are evaluated for each unit. If it is determined that it is more likely than not that the fair value of a reporting unit is less than its carrying amount, then the prescribed two-step impairment test is performed. Current accounting standards also give us the option to bypass the qualitative assessment for any reporting unit in any period and proceed directly to performing the first step of the two-step goodwill impairment test. In 2012, the Company chose to bypass the qualitative assessment for all of its reporting units with goodwill remaining and perform the two-step impairment test. In performing the two-step impairment test, we compare the reporting unit's carrying amount, including goodwill, to the implied fair value (IFV) of the reporting unit. The IFV of the reporting units are estimated using an analysis of trading multiples of comparable companies to our reporting units. We also utilize discounted projected cash flows and acquisition multiples analyses in certain circumstances. We discount our projected cash flows using a long-term weighted average cost of capital for each reporting unit based on our estimate of investment returns that would be required by a market participant. If the carrying amount of the reporting unit exceeds its fair value, goodwill is considered impaired, and a second step is performed to determine the amount of impairment, if any. We conduct our annual impairment test in December of each year. In 2012, our quantitative assessment of potential goodwill impairment based on an analysis and comparison of trading multiples indicated that it is more likely than not that the fair value of each of our reporting units is greater than its carrying amount.
For intangible assets that we amortize, we review the useful life of the intangible asset and evaluate each reporting period whether events and circumstances warrant a revision to the remaining useful life. We evaluate the remaining useful life of an intangible asset that is not being amortized each reporting period to determine whether events and circumstances continue to support an indefinite useful life.
See Note 7 – Goodwill and Other Intangible Assets.
Impairment of Long-Lived Assets
In compliance with current accounting standards regarding the accounting for the impairment or disposal of long-lived assets at the asset group level, the recoverability of the carrying values of long-lived assets, including finite-lived intangible assets, is assessed at a minimum annually, or whenever, in management's judgment, events or changes in circumstances indicate that the carrying value of such asset groups may not be recoverable based on estimated future cash flows. If this assessment indicates that the carrying values will not be recoverable, as determined based on undiscounted cash flows over the remaining useful lives, an impairment loss is recognized. The impairment loss equals the excess of the carrying value over the fair value of the asset group. The fair value of the asset group is based on prices of similar assets, if available, or discounted cash flows. Based on the Company's review, the carrying values of its asset groups are recoverable, and no impairment losses have been recorded for the periods presented.
- 82 -
OIL STATES INTERNATIONAL, INC. AND SUBSIDIARIES
NOTES TO CONSOLIDATED FINANCIAL STATEMENTS
(Continued)
Foreign Currency and Other Comprehensive Income
Gains and losses resulting from balance sheet translation of foreign operations where a foreign currency is the functional currency are included as a separate component of accumulated other comprehensive income within stockholders' equity representing substantially all of the balances within accumulated other comprehensive income. Remeasurements of intercompany loans denominated in a different currency than the functional currency of the entity that are of a long-term investment nature are recognized as other comprehensive income within stockholders’ equity. Gains and losses resulting from balance sheet remeasurements of assets and liabilities denominated in a different currency than the functional currency, other than intercompany loans that are of a long-term investment nature, are included in the consolidated statements of income as incurred.
Foreign Exchange Risk
A portion of revenues, earnings and net investments in foreign affiliates are exposed to changes in foreign exchange rates. We seek to manage our foreign exchange risk in part through operational means, including managing expected local currency revenues in relation to local currency costs and local currency assets in relation to local currency liabilities. In order to reduce our exposure to fluctuations in currency exchange rates, we may also enter into foreign exchange agreements with financial institutions. As of December 31, 2012, we had outstanding foreign currency forward purchase contracts with a notional amount of $12.4 million, hedging expected cash flows denominated in Euros. We have recorded other comprehensive loss of $1.0 million in 2012 as a result of this contract. As of December 31, 2011, we had no active hedge contracts outstanding. Foreign exchange losses associated with our operations have totaled $2.1 million in 2012, $1.4 million in 2011 and $1.1 million in 2010 and were included in “Other operating expense.”
Interest Capitalization
Interest costs for the construction of certain long-term assets are capitalized and amortized over the related assets' estimated useful lives. For the years ended December 31, 2012, 2011, and 2010, $3.5 million, $5.3 million and $0.2 million were capitalized, respectively.
Revenue and Cost Recognition
Revenue from the sale of products, not accounted for utilizing the percentage-of-completion method, is recognized when delivery to and acceptance by the customer has occurred, when title and all significant risks of ownership have passed to the customer, collectability is probable and pricing is fixed and determinable. Our product sales terms do not include significant post-delivery obligations. For significant projects, revenues are recognized under the percentage-of-completion method, measured by the percentage of costs incurred to date compared to estimated total costs for each contract (cost-to-cost method). Billings on such contracts in excess of costs incurred and estimated profits are classified as deferred revenue. Costs incurred and estimated profits in excess of billings on percentage-of-completion contracts are recognized as unbilled receivables. Management believes this method is the most appropriate measure of progress on large contracts. Provisions for estimated losses on uncompleted contracts are made in the period in which such losses are determined. Factors that may affect future project costs and margins include shipyard access, weather, production efficiencies, availability and costs of labor, materials and subcomponents. These factors can significantly impact the accuracy of the Company’s estimates and materially impact the Company’s future reported earnings. In our accommodations and well site services segments, revenues are recognized based on a periodic (usually daily), or room rate or when the services are rendered. Proceeds from customers for the cost of oilfield rental equipment that is damaged or lost downhole are reflected as gains or losses on the disposition of assets after considering the write-off of the remaining net book value of the equipment. For drilling services contracts based on footage drilled, we recognize revenues as footage is drilled. Revenues exclude taxes assessed based on revenues such as sales or value added taxes.
Cost of goods sold includes all direct material and labor costs and those costs related to contract performance, such as indirect labor, supplies, tools and repairs. Selling, general, and administrative costs are charged to expense as incurred.
- 83 -
OIL STATES INTERNATIONAL, INC. AND SUBSIDIARIES
NOTES TO CONSOLIDATED FINANCIAL STATEMENTS
(Continued)
Income Taxes
The Company follows the liability method of accounting for income taxes in accordance with current accounting standards regarding the accounting for income taxes. Under this method, deferred income taxes are recorded based upon the differences between the financial reporting and tax bases of assets and liabilities and are measured using the enacted tax rates and laws that will be in effect when the underlying assets or liabilities are recovered or settled.
When the Company's earnings from foreign subsidiaries are considered to be indefinitely reinvested, no provision for U.S. income taxes is made for these earnings. If any of the subsidiaries have a distribution of earnings in the form of dividends or otherwise, the Company would be subject to both U.S. income taxes (subject to an adjustment for foreign tax credits) and withholding taxes payable to the various foreign countries.
In accordance with current accounting standards, the Company records a valuation allowance in each reporting period when management believes that it is more likely than not that any deferred tax asset created will not be realized. Management will continue to evaluate the appropriateness of the valuation allowance in the future based upon the operating results of the Company.
In accounting for income taxes, we are required by the provisions of current accounting standards regarding the accounting for uncertainty in income taxes to estimate a liability for future income taxes. The calculation of our tax liabilities involves dealing with uncertainties in the application of complex tax regulations. We recognize liabilities for anticipated tax audit issues in the U.S. and other tax jurisdictions based on our estimate of whether, and the extent to which, additional taxes will be due. If we ultimately determine that payment of these amounts is unnecessary, we reverse the liability and recognize a tax benefit during the period in which we determine that the liability is no longer necessary. We record an additional charge in our provision for taxes in the period in which we determine that the recorded tax liability is less than we expect the ultimate assessment to be.
Receivables and Concentration of Credit Risk, Concentration of Suppliers
Based on the nature of its customer base, the Company does not believe that it has any significant concentrations of credit risk other than its concentration in the worldwide oil and gas and Australian mining industries. The Company evaluates the credit-worthiness of its significant, new and existing customers' financial condition and, generally, the Company does not require significant collateral from its customers.
The Company purchased 81% of its oilfield tubular goods from three suppliers in 2012. The loss of any significant supplier in the tubular services segment could materially adversely affect it.
Allowances for Doubtful Accounts
The Company maintains allowances for doubtful accounts for estimated losses resulting from the inability of the Company's customers to make required payments. If a trade receivable is deemed to be uncollectible, such receivable is charged-off against the allowance for doubtful accounts. The Company considers the following factors when determining if collection of revenue is reasonably assured: customer credit-worthiness, past transaction history with the customer, current economic industry trends, customer solvency and changes in customer payment terms. If the Company has no previous experience with the customer, the Company typically obtains reports from various credit organizations to ensure that the customer has a history of paying its creditors. The Company may also request financial information, including financial statements or other documents to ensure that the customer has the means of making payment. If these factors do not indicate collection is reasonably assured, the Company would require a prepayment or other arrangement to support revenue recognition and recording of a trade receivable. If the financial condition of the Company's customers were to deteriorate, adversely affecting their ability to make payments, additional allowances would be required.
- 84 -
OIL STATES INTERNATIONAL, INC. AND SUBSIDIARIES
NOTES TO CONSOLIDATED FINANCIAL STATEMENTS
(Continued)
Earnings per Share
Diluted EPS amounts include the effect of the Company's outstanding stock options and restricted stock shares under the treasury stock method. In addition, before their conversion in July 2012, shares of our 2 3/8% Contingent Convertible Senior Subordinated Notes (2 3/8% Notes) assumed to be issued upon conversion were included in the calculation of fully diluted shares outstanding and fully diluted earnings per share. The weighted average number of these shares totaled 1,793,244, 3,023,420 and 1,647,321 during the years ended December 31, 2012, December 31, 2011 and December 31, 2010, respectively.
Stock-Based Compensation
Current accounting standards regarding share-based payments require companies to measure the cost of employee services received in exchange for an award of equity instruments (typically stock options) based on the grant-date fair value of the award. The fair value is estimated using option-pricing models. The resulting cost is recognized over the period during which an employee is required to provide service in exchange for the awards, usually the vesting period. In addition to service based awards, in 2012 the Company also issued performance based awards which may vest in an amount that will depend on the Company’s achievement of specified performance objectives. The performance based awards have a performance criteria that will be measured based upon the Company’s achievement levels of average after-tax annual return on invested capital. During 2012, the Company also granted phantom shares under the newly created Canadian Long-Term Incentive Plan, which provides for the granting of units of phantom shares to key Canadian employees. These awards vest in equal annual installments and are accounted for as a liability. Participants granted units of phantom shares are entitled to a lump sum cash payment equal to the fair market value of a share of the Company’s common stock on the vesting date. During the years ended December 31, 2012, 2011 and 2010, the Company recognized non-cash general and administrative expenses for stock options and restricted stock awards totaling $18.9 million, $14.6 million and $12.6 million, respectively. The Company accounts for assets held in a Rabbi Trust for certain participants under the Company's deferred compensation plan in accordance with current accounting standards. See Note 14.
Guarantees
The Company applies current accounting standards regarding guarantor's accounting and disclosure requirements for guarantees, including indirect indebtedness of others, for the Company's obligations under certain guarantees.
Some of our products in our offshore products and accommodations businesses are sold with a warranty, generally ranging from 12 to 18 months. Parts and labor are covered under the terms of the warranty agreement. Warranty provisions are estimated based upon historical experience by product, configuration and geographic region. Our total liability related to warranties was $1.8 million at December 31, 2012 and 2011.
During the ordinary course of business, the Company also provides standby letters of credit or other guarantee instruments to certain parties as required for certain transactions initiated by either the Company or its subsidiaries. As of December 31, 2012, the maximum potential amount of future payments that the Company could be required to make under these guarantee agreements (letters of credit) was approximately $49.4 million. The Company has not recorded any liability in connection with these guarantee arrangements. The Company does not believe, based on historical experience and information currently available, that it is likely that any amounts will be required to be paid under these guarantee arrangements.
Use of Estimates
The preparation of consolidated financial statements in conformity with accounting principles generally accepted in the United States requires the use of estimates and assumptions by management in determining the reported amounts of assets and liabilities and disclosures of contingent assets and liabilities at the date of the consolidated financial statements and the reported amounts of revenues and expenses during the reporting period. Examples of a few such estimates include potential future adjustments as a result of contingent consideration arrangements pursuant to business combinations and other contractual agreements, revenue and income recognized on the percentage-of-completion method, estimates of the amount and timing of costs to be incurred for asset retirement obligations, the valuation allowance recorded on net deferred tax assets, warranty, reserves on inventory and allowance for doubtful accounts. Actual results could materially differ from those estimates.
- 85 -
OIL STATES INTERNATIONAL, INC. AND SUBSIDIARIES
NOTES TO CONSOLIDATED FINANCIAL STATEMENTS
(Continued)
Accounting for Contingencies
We have contingent liabilities and future claims for which we have made estimates of the amount of the eventual cost to liquidate these liabilities or claims. These liabilities and claims sometimes involve threatened or actual litigation where damages have been quantified and we have made an assessment of our exposure and recorded a provision in our accounts to cover an expected loss. Other claims or liabilities have been estimated based on their fair value or our experience in these matters and, when appropriate, the advice of outside counsel or other outside experts. Upon the ultimate resolution of these uncertainties, our future reported financial results will be impacted by the difference between our estimates and the actual amounts paid to settle a liability. Examples of areas where we have made important estimates of future liabilities include future consideration due sellers as a result of the terms of a business combination, litigation, taxes, interest, insurance claims, warranty claims, contract claims and obligations and discontinued operations.
Subsequent Events
In accordance with authoritative guidance, the Company evaluates all events and transactions that occur after the balance sheet date, but before financial statements are issued for possible recognition or disclosure.
3. Details of Selected Balance Sheet Accounts
Additional information regarding selected balance sheet accounts at December 31, 2012 and 2011 is presented below (in thousands):
|
2012
|
2011
|
|||||||
|
Inventories, net:
|
||||||||
|
Tubular goods
|
$ | 450,244 | $ | 420,519 | ||||
|
Other finished goods and purchased products
|
90,974 | 80,184 | ||||||
|
Work in process
|
64,267 | 76,353 | ||||||
|
Raw materials
|
107,356 | 86,672 | ||||||
|
Total inventories
|
712,841 | 663,728 | ||||||
|
Allowance for excess, damaged, remnant or obsolete inventory
|
(11,345 | ) | (10,030 | ) | ||||
| $ | 701,496 | $ | 653,698 | |||||
|
|
2012 | 2011 | ||||||
|
Accounts receivable, net:
|
||||||||
|
Trade
|
$ | 616,680 | $ | 553,481 | ||||
|
Unbilled revenue
|
218,229 | 180,273 | ||||||
|
Other
|
3,691 | 2,449 | ||||||
|
Total accounts receivable
|
838,600 | 736,203 | ||||||
|
Allowance for doubtful accounts
|
(5,815 | ) | (3,963 | ) | ||||
| $ | 832,785 | $ | 732,240 |
- 86 -
OIL STATES INTERNATIONAL, INC. AND SUBSIDIARIES
NOTES TO CONSOLIDATED FINANCIAL STATEMENTS
(Continued)
|
|
Estimated
Useful Life
(years)
|
2012
|
2011
|
||||||||||
|
Property, plant and equipment, net:
|
|||||||||||||
|
Land
|
$ | 58,888 | $ | 48,989 | |||||||||
|
Accommodations assets
(1)
|
3 | - | 15 | 1,481,830 | 1,160,661 | ||||||||
|
Buildings and leasehold improvements
(1)
|
3 | - | 40 | 194,676 | 154,233 | ||||||||
|
Machinery and equipment
|
2 | - | 29 | 402,342 | 355,798 | ||||||||
|
Completion services equipment
|
4 | - | 10 | 264,225 | 199,084 | ||||||||
|
Office furniture and equipment
|
1 | - | 10 | 54,337 | 48,081 | ||||||||
|
Vehicles
|
2 | - | 10 | 123,474 | 100,554 | ||||||||
|
Construction in progress
|
149,665 | 166,371 | |||||||||||
|
Total property, plant and equipment
|
2,729,437 | 2,233,771 | |||||||||||
|
Accumulated depreciation
|
(877,311 | ) | (676,683 | ) | |||||||||
| $ | 1,852,126 | $ | 1,557,088 | ||||||||||
|
|
(1)
|
As of December 31, 2011, we have reclassified $54.7 million in buildings and leasehold improvements to accommodations assets for comparability purposes.
|
|
2012
|
2011
|
|||||||
|
Accrued liabilities:
|
||||||||
|
Accrued compensation
|
$ | 69,206 | $ | 61,394 | ||||
|
Insurance liabilities
|
11,411 | 12,396 | ||||||
|
Accrued taxes, other than income taxes
|
7,204 | 5,889 | ||||||
|
Accrued interest
|
4,042 | 6,035 | ||||||
|
Accrued commissions
|
3,763 | 2,228 | ||||||
|
Other
|
12,280 | 8,806 | ||||||
| $ | 107,906 | $ | 96,748 | |||||
Depreciation expense was $216.5 million, $174.9 million and $121.6 million for the years ended December 31, 2012, 2011 and 2010, respectively.
4.
Recent Accounting Pronouncements
From time to time, new accounting pronouncements are issued by the Financial Accounting Standards Board (the FASB), which are adopted by the Company as of the specified effective date. Unless otherwise discussed, management believes that the impact of recently issued standards, which are not yet effective, will not have a material impact on the Company’s consolidated financial statements upon adoption.
In June 2011, the FASB issued amendments to disclosure requirements for the presentation of comprehensive income. This guidance eliminates the option to present components of other comprehensive income as part of the statement of changes in stockholders’ equity. The amendments require that all non-owner changes in stockholders’ equity be presented either in a single continuous statement of comprehensive income or in two separate but consecutive statements. In the two-statement approach, the first statement should present total net income and its components followed consecutively by a second statement that should present total other comprehensive income, the components of other comprehensive income, and the total of comprehensive income. The amendments were applied retrospectively. For public entities, the amendments were effective for fiscal years, and interim periods within those years, beginning after December 15, 2011. The amendments do not require any transition disclosures. In December 2011, the FASB issued an amendment deferring the effective date of the requirement to present reclassification adjustments out of accumulated other comprehensive income on the face of the consolidated statement of income. The Company adopted this standard in its Quarterly Report on Form 10-Q for the three month period ended March 31, 2012.
In September 2011, the FASB issued an accounting standards update which is intended to simplify goodwill impairment testing by giving an entity the option to first assess qualitative factors to determine whether it is more likely than not that the fair value of a reporting unit is less than its carrying amount. If an entity determines it is more likely than not that the fair value of a reporting unit is greater than its carrying amount, then performing the currently prescribed two-step impairment test is unnecessary. An entity has the option to bypass such qualitative assessment for any reporting unit in any period and proceed directly to performing the first step of the two-step goodwill impairment test. An entity may resume performing the qualitative assessment in any subsequent period. The amendments were effective for annual and interim goodwill impairment tests performed for fiscal years beginning after December 15, 2011. The Company adopted this standard for its annual goodwill impairment tests in 2011. In 2012, the Company chose the option to bypass the qualitative assessment and performed a quantitative assessment of goodwill impairment. The adoption of this standard did not have a material effect on our consolidated financial statements.
- 87 -
OIL STATES INTERNATIONAL, INC. AND SUBSIDIARIES
NOTES TO CONSOLIDATED FINANCIAL STATEMENTS
(Continued)
In July 2012, the FASB issued an accounting standards update which is intended to reduce the cost and complexity of performing an impairment test for indefinite-lived intangible assets by simplifying how an entity tests those assets for impairment. The update is also intended to improve the consistency in impairment testing guidance among long-lived asset categories. Previous guidance required an entity to test indefinite-lived intangible assets for impairment by comparing the fair value of the asset with its carrying amount at least on an annual basis. If the carrying amount exceeded its fair value, an entity needed to recognize an impairment loss in the amount of the excess. The amendment to this update allows an entity to first assess the qualitative factors to determine whether it is more likely than not that an indefinite-lived intangible asset is impaired. This assessment will determine whether it is necessary to perform quantitative impairment tests. This type of testing results in guidance that is similar to the September 2011 accounting standards update issued for goodwill impairment testing described above. The amendments are effective for annual and interim impairment tests performed for fiscal years beginning after September 15, 2012 with early adoption permitted. As permitted, we adopted these provisions in 2012. The adoption of this standard did not have a material effect on our consolidated financial statements.
5. Acquisitions and Supplemental Cash Flow Information
Components of cash used for acquisitions as reflected in the consolidated statements of cash flows for the years ended December 31, 2012, 2011 and 2010 are summarized as follows (in thousands):
|
2012
|
2011
|
2010
|
||||||||||
|
Fair value of assets acquired including intangibles and goodwill
|
$ | 108,833 | $ | 2,412 | $ | 850,557 | ||||||
|
Liabilities assumed
|
(12,508 | ) | -- | (119,386 | ) | |||||||
|
Noncash consideration
|
(15,825 | ) | -- | (7,966 | ) | |||||||
|
Cash acquired
|
(51 | ) | -- | (13,630 | ) | |||||||
|
Cash used in acquisition of businesses
|
$ | 80,449 | $ | 2,412 | $ | 709,575 | ||||||
2012
On December 14, 2012, we acquired all of the equity of Tempress Technologies, Inc. (Tempress) for purchase price consideration of $48.3 million consisting of $32.5 million in cash and contingent consideration with a fair value of $15.8 million. The Company funded escrow accounts totaling $25.3 million related to the contingent consideration and seller transaction indemnities which are classified as “Other noncurrent assets” in our December 31, 2012 Consolidated Balance Sheet. Liabilities for contingent consideration and escrowed amounts potentially due to the seller total $21.1 million at December 31, 2012 and are classified as “Other noncurrent liabilities” in our Consolidated Balance Sheet. Headquartered in Kent, Washington, Tempress designs, develops and markets a suite of highly specialized, hydraulically-activated tools utilized during downhole completion activities. The operations of Tempress have been included in our well site services segment since the acquisition date.
On July 2, 2012, we acquired Piper Valve Systems, Ltd (Piper). Headquartered in Oklahoma City, Oklahoma, Piper designs and manufactures high pressure valves and manifold components for oil and gas industry projects offshore (surface and subsea) and onshore. Piper's valve technology complements our offshore products segment, allowing us to integrate their valve products and services into our existing subsea products such as pipeline end manifolds and terminals, increasing our suite of global deepwater product and service offerings. Subject to customary post-closing adjustments, total cash consideration was $48.0 million. The operations of Piper have been included in our offshore products segment since the acquisition date.
- 88 -
OIL STATES INTERNATIONAL, INC. AND SUBSIDIARIES
NOTES TO CONSOLIDATED FINANCIAL STATEMENTS
(Continued)
2011
On November 1, 2011, we purchased an open camp accommodations facility located in Carrizo Springs, Texas for total consideration of $2.2 million. This facility provides accommodations support to customers working in the Eagle Ford Shale oil and gas basin in Texas. The operations of the Carrizo Springs facility have been included in our accommodations segment since the acquisition date.
2010
On December 30, 2010, we acquired all of the ordinary shares of The MAC Services Group Limited (The MAC), through a Scheme of Arrangement (the Scheme) under the Corporations Act of Australia. The MAC is headquartered in Sydney, Australia and supplies accommodations services to the Australian natural resources market. Under the terms of the Scheme, each shareholder of The MAC received $3.95 (A$3.90) per share in cash. The total purchase price was $638 million, net of cash acquired plus debt assumed of $87 million. The MAC’s operations have been included as part of our accommodations segment beginning in 2011.
The following unaudited pro forma supplemental financial information presents the consolidated results of operations of the Company and The MAC as if the acquisition of The MAC had occurred on January 1, 2010. The Company has adjusted historical financial information to give effect to pro forma items that are directly attributable to the acquisition and expected to have a continuing impact on the consolidated results. These items include adjustments to record the incremental amortization and depreciation expense related to the increase in fair values of the acquired assets, interest expense related to borrowings under the Company’s senior credit facilities to fund the acquisition and to reclassify certain items to conform to the Company’s financial reporting presentation. The unaudited pro forma does not purport to be indicative of the results of operations had the transaction occurred on the date indicated or of future results for the combined entities (in thousands, except per share data):
|
|
Year Ended
December 31, 2010
|
|||
|
(Unaudited)
|
||||
|
Revenues
|
$ | 2,526,677 | ||
|
Net income attributable to Oil States International, Inc.
|
163,529 | |||
|
Net income per share attributable to Oil States International, Inc. common stockholders
|
||||
|
Basic
|
$ | 3.26 | ||
|
Diluted
|
$ | 3.10 | ||
Included in the pro forma results above for the year ended December 31, 2010 are (1) depreciation of the increased fair value of property, plant and equipment acquired as part of The MAC, totaling $8.6 million, net of tax, or $0.16 per diluted share, (2) amortization expense for intangibles acquired as part of the purchase of The MAC, totaling $6.0 million, net of tax, or $0.11 per diluted share and, (3) interest expense of $10.8 million, net of tax, or $0.20 per diluted share. The year ended December 31, 2010 pro forma results also include The MAC acquisition costs of approximately $12.5 million ($4.6 million recorded on the Company’s books and $7.9 million recorded on The MAC’s books), net of tax, or $0.24 per diluted share.
On December 20, 2010, we also acquired all of the operating assets of Mountain West Oilfield Service and Supplies, Inc. and Ufford Leasing LLC (Mountain West) for total consideration of $47.1 million including estimated contingent consideration of $4.0 million. Headquartered in Vernal, Utah, with operations in the Rockies and the Bakken Shale region, Mountain West provides remote site workforce accommodations to the oil and gas industry. Mountain West has been included in the accommodations segment since the acquisition date.
On October 5, 2010, we purchased all of the equity of Acute Technological Services, Inc. (Acute) for total consideration of $30.2 million. Headquartered in Houston, Texas with additional operations in Brazil, Acute provides metallurgical and welding engineering, consulting and services to the oil and gas industry in support of critical, complex subsea component manufacturing and deepwater riser fabrication on a global basis. Acute has been included in the offshore products segment since the acquisition date.
- 89 -
OIL STATES INTERNATIONAL, INC. AND SUBSIDIARIES
NOTES TO CONSOLIDATED FINANCIAL STATEMENTS
(Continued)
The acquisitions of Tempress, Piper, Carrizo Springs, Acute and Mountain West were not material to the Company’s Consolidated Financial Statements, and, therefore, the Company does not present pro forma information for these acquisitions.
The Company funded all of its acquisitions with cash on hand and/or draws under our senior secured credit facilities. See Note 8 – Long Term Debt for additional information on our senior secured credit facilities.
Supplemental Cash Flow Information
Cash paid during the years ended December 31, 2012, 2011 and 2010 for interest and income taxes was as follows (in thousands):
|
2012
|
2011
|
2010
|
||||||||||
|
Interest (net of amounts capitalized)
|
$ | 62,863 | $ | 44,332 | $ | 7,303 | ||||||
|
Income taxes, net of refunds
|
$ | 141,760 | $ | 79,190 | $ | 75,303 | ||||||
|
Non-cash investing activities:
|
||||||||||||
|
Assets acquired through lease incentives
|
$ | -- | $ | 1,897 | $ | -- | ||||||
|
Non-cash financing activities:
|
||||||||||||
|
Value of common stock issued in payment of 2 3/8% Notes conversion
|
$ | 220,597 | $ | -- | $ | -- | ||||||
|
Borrowings and contingent consideration for business and asset acquisition and related intangibles
|
$ | 15,825 | $ | -- | $ | 7,966 | ||||||
6. Earnings Per Share (EPS)
|
2012
|
2011
|
2010
|
||||||||||
|
(in thousands, except per share data)
|
||||||||||||
|
Basic earnings per share:
|
||||||||||||
|
Net income attributable to Oil States International, Inc.
|
$ | 448,609 | $ | 322,453 | $ | 168,018 | ||||||
|
Weighted average number of shares outstanding
|
52,959 | 51,163 | 50,238 | |||||||||
|
Basic earnings per share
|
$ | 8.47 | $ | 6.30 | $ | 3.34 | ||||||
|
Diluted earnings per share:
|
||||||||||||
|
Net income attributable to Oil States International, Inc.
|
$ | 448,609 | $ | 322,453 | $ | 168,018 | ||||||
|
Weighted average number of shares outstanding (basic)
|
52,959 | 51,163 | 50,238 | |||||||||
|
Effect of dilutive securities:
|
||||||||||||
|
Options on common stock
|
488 | 644 | 630 | |||||||||
|
2 3/8% Convertible Senior Subordinated Notes
|
1,793 | 3,023 | 1,647 | |||||||||
|
Restricted stock awards and other
|
144 | 177 | 185 | |||||||||
|
Total shares and dilutive securities
|
55,384 | 55,007 | 52,700 | |||||||||
|
Diluted earnings per share
|
$ | 8.10 | $ | 5.86 | $ | 3.19 | ||||||
Our calculations of diluted earnings per share for the years ended December 31, 2012, 2011 and 2010 exclude 399,134 shares, 179,804 shares and 364,345 shares, respectively, issuable pursuant to outstanding stock options and restricted stock awards, due to their antidilutive effect.
See Note 8 – Long Term Debt for a discussion of the conversion of our 2 3/8% Notes.
- 90 -
OIL STATES INTERNATIONAL, INC. AND SUBSIDIARIES
NOTES TO CONSOLIDATED FINANCIAL STATEMENTS
(Continued)
7. Goodwill and Other Intangible Assets
The Company does not amortize goodwill but tests for impairment using a fair value approach, at the "reporting unit" level. A reporting unit is the operating segment, or a business one level below that operating segment (the "component" level) if discrete financial information is prepared and regularly reviewed by management at the component level. The Company had three reporting units with goodwill as of December 31, 2012. Goodwill is allocated to each of the reporting units based on actual acquisitions made by the Company and its subsidiaries. The Company recognizes an impairment loss for any amount by which the carrying amount of a reporting unit's goodwill exceeds the reporting unit's IFV of goodwill. If our initial qualitative assessment of potential goodwill impairment indicates that it is more likely than not that the fair value of a reporting unit is less than its carrying amount, including goodwill, the Company uses, as appropriate in the current circumstance, comparative market multiples, discounted cash flow calculations and acquisition comparables to establish the reporting unit's fair value (a Level 3 fair value measurement).
The Company amortizes the cost of other intangibles over their estimated useful lives unless such lives are deemed indefinite. Amortizable intangible assets are reviewed for impairment if there are indicators of impairment based on undiscounted cash flows and, if impaired, written down to fair value based on either discounted cash flows or appraised values. Intangible assets with indefinite lives are tested for impairment annually, and written down to fair value as required. As of December 31, 2012, no provision for impairment of other intangible assets was required.
Changes in the carrying amount of goodwill for the years ended December 31, 2012 and 2011 are as follows (in thousands):
|
Well Site Services
|
||||||||||||||||||||||||||||
|
Completion
Services
|
Drilling
Services
|
Subtotal
|
Accommodations
|
Offshore
Products
|
Tubular
Services
|
Total
|
||||||||||||||||||||||
|
Balance as of December 31, 2010
|
||||||||||||||||||||||||||||
|
Goodwill
|
$ | 170,034 | $ | 22,767 | $ | 192,801 | $ | 299,062 | $ | 100,654 | $ | 62,863 | $ | 655,380 | ||||||||||||||
|
Accumulated Impairment Losses
|
(94,528 | ) | (22,767 | ) | (117,295 | ) | -- | -- | (62,863 | ) | (180,158 | ) | ||||||||||||||||
| 75,506 | -- | 75,506 | 299,062 | 100,654 | -- | 475,222 | ||||||||||||||||||||||
|
Goodwill acquired and purchase price adjustments
|
-- | -- | -- | (9,826 | ) | 315 | -- | (9,511 | ) | |||||||||||||||||||
|
Foreign currency translation and other changes
|
(323 | ) | -- | (323 | ) | 2,087 | (25 | ) | -- | 1,739 | ||||||||||||||||||
| 75,183 | -- | 75,183 | 291,323 | 100,944 | -- | 467,450 | ||||||||||||||||||||||
|
Balance as of December 31, 2011
|
||||||||||||||||||||||||||||
|
Goodwill
|
169,711 | 22,767 | 192,478 | 291,323 | 100,944 | 62,863 | 647,608 | |||||||||||||||||||||
|
Accumulated Impairment Losses
|
(94,528 | ) | (22,767 | ) | (117,295 | ) | -- | -- | (62,863 | ) | (180,158 | ) | ||||||||||||||||
|
|
75,183 | -- | 75,183 | 291,323 | 100,944 | -- | 467,450 | |||||||||||||||||||||
|
Goodwill acquired and purchase price adjustments
|
31,254 | -- | 31,254 | -- | 17,757 | -- | 49,011 | |||||||||||||||||||||
|
Foreign currency translation and other changes
|
316 | -- | 316 | 3,809 | 232 | -- | 4,357 | |||||||||||||||||||||
| 106,753 | -- | 106,753 | 295,132 | 118,933 | -- | 520,818 | ||||||||||||||||||||||
|
Balance as of December 31, 2012
|
||||||||||||||||||||||||||||
|
Goodwill
|
201,281 | 22,767 | 224,048 | 295,132 | 118,933 | 62,863 | 700,976 | |||||||||||||||||||||
|
Accumulated Impairment Losses
|
(94,528 | ) | (22,767 | ) | (117,295 | ) | -- | -- | (62,863 | ) | (180,158 | ) | ||||||||||||||||
| $ | 106,753 | $ | -- | $ | 106,753 | $ | 295,132 | $ | 118,933 | $ | -- | $ | 520,818 | |||||||||||||||
- 91 -
OIL STATES INTERNATIONAL, INC. AND SUBSIDIARIES
NOTES TO CONSOLIDATED FINANCIAL STATEMENTS
(Continued)
The following table presents the total a
mount of intangibles assigned and the total accumulated amortization for major intangible asset classes as of December 31, 2012 and 2011 (in thousands):
|
As of December 31,
|
||||||||||||||||
|
2012
|
2011
|
|||||||||||||||
|
Other Intangible Assets
|
Gross
Carrying
Amount
|
Accumulated Amortization
|
Gross
Carrying
Amount
|
Accumulated Amortization
|
||||||||||||
|
Amortizable intangible assets:
|
||||||||||||||||
|
Customer relationships
|
$ | 88,616 | $ | 18,206 | $ | 77,878 | $ | 10,789 | ||||||||
|
Contracts/Agreements
|
52,071 | 11,250 | 51,373 | 6,009 | ||||||||||||
|
Patents
|
10,801 | 3,377 | 7,199 | 2,811 | ||||||||||||
|
Technology
|
10,304 | -- | -- | -- | ||||||||||||
|
Noncompete agreements
|
7,433 | 4,214 | 5,164 | 4,310 | ||||||||||||
|
Trademarks and other
|
3,990 | 83 | 25 | -- | ||||||||||||
|
Total amortizable intangible assets
|
$ | 173,215 | $ | 37,130 | $ | 141,639 | $ | 23,919 | ||||||||
|
Indefinite-lived intangible assets not subject to amortization:
|
||||||||||||||||
|
Brand names
|
9,976 | -- | 9,840 | -- | ||||||||||||
|
Licenses
|
42 | -- | 42 | -- | ||||||||||||
|
Total indefinite-lived intangible assets
|
10,018 | -- | 9,882 | -- | ||||||||||||
|
Total other intangible assets
|
$ | 183,233 | $ | 37,130 | $ | 151,521 | $ | 23,919 | ||||||||
The weighted average remaining amortization period for all intangible assets, other than goodwill and indefinite- lived intangibles, was 8.6 years as of December 31, 2012 and December 31, 2011. Total amortization expense is expected to be $15.5 million in each of 2013 and 2014, $15.4 million in 2015, $15.3 million in 2016 and $15.0 million in 2017. Amortization expense was $13.6 million, $13.3 million and $2.6 million in the years ended December 31, 2012, 2011 and 2010, respectively.
- 92 -
OIL STATES INTERNATIONAL, INC. AND SUBSIDIARIES
NOTES TO CONSOLIDATED FINANCIAL STATEMENTS
(Continued)
8. Long-term Debt
As of December 31, 2012 and 2011, long-term debt consisted of the following (in thousands):
|
|
2012
|
2011
|
||||||
|
US revolving credit facility, which matures December 10, 2015, with available commitments up to $500 million; secured by substantially all of our U.S. assets; commitment fee on unused portion was 0.375% per annum in 2012 and ranged from 0.375% to 0.500% in 2011; variable interest rate payable monthly based on prime or LIBOR plus applicable percentage; weighted average rate was 2.6% for 2012 and 2.8% for 2011
|
$ | -- | $ | 68,065 | ||||
|
US term loan, which matures December 10, 2015, original principal of $200 million; 2.5% of aggregate principal repayable per quarter in 2012 and thereafter; secured by substantially all of our U.S. assets; variable interest rate payable monthly based on prime or LIBOR plus applicable percentage; weighted average rate was 2.4% for 2012 and 2.6% for 2011
|
170,000 | 190,000 | ||||||
|
Canadian revolving credit facility, which matures on December 10, 2015, with available commitments up to $250 million; secured by substantially all of our U.S. and Canadian assets; commitment fee on unused portion was 0.375% per annum in 2012 and ranged from 0.375% per annum to 0.500% in 2011; variable interest rate payable monthly based on the Canadian prime rate or Bankers Acceptance discount rate plus applicable percentage; weighted average rate was 4.3% for 2012 and 3.9% for 2011
|
-- | -- | ||||||
|
Canadian term loan, which matures December 10, 2015, original principal of $100 million; 2.5% of aggregate principal repayable per quarter in 2012 and thereafter; secured by substantially all of our U.S. and Canadian assets; variable interest rate payable monthly based on prime or LIBOR plus applicable percentage; weighted average rate was 3.4% for 2012 and 3.6% for 2011
|
85,786 | 93,795 | ||||||
|
Australian revolving credit facility, which was replaced September 18, 2012, with available commitments up to AUD$150 million; secured by substantially all of our Australian assets; commitment fee on unused portion was 1.050% per annum in 2012 and 2011; variable interest rate payable monthly based on the Australian prime rate plus applicable percentage; weighted average rate was 6.2% for 2012 and 6.9% for 2011
|
-- | 43,050 | ||||||
|
Australian revolving credit facility, which matures December 10, 2015, with available commitments up to AUD$300 million; secured by substantially all of our Australian assets; commitment fee on unused portion was 0.375% per annum in 2012; variable interest rate payable monthly based on the Australian prime rate plus applicable percentage; weighted average rate was 5.4% for 2012
|
47,803 | -- | ||||||
|
6 1/2% senior unsecured notes - due June 2019
|
600,000 | 600,000 | ||||||
|
5 1/8% senior unsecured notes - due January 2023
|
400,000 | -- | ||||||
|
2 3/8% contingent convertible senior subordinated notes, net
|
-- | 170,884 | ||||||
|
Subordinated unsecured notes payable to sellers of businesses, fixed interest rate of 6%, matured in December 2012
|
-- | 4,000 | ||||||
|
Capital lease obligations and other debt
|
6,696 | 7,146 | ||||||
|
Total debt
|
1,310,285 | 1,176,940 | ||||||
|
Less: Current portion
|
30,480 | 34,435 | ||||||
|
Total long-term debt and capitalized leases
|
$ | 1,279,805 | $ | 1,142,505 | ||||
Scheduled maturities of combined long-term debt as of December 31, 2012, are as follows (in thousands):
|
2013
|
$ | 30,480 | ||
|
2014
|
30,438 | |||
|
2015
|
243,755 | |||
|
2016
|
308 | |||
|
2017
|
304 | |||
|
Thereafter
|
1,005,000 | |||
| $ | 1,310,285 |
- 93 -
OIL STATES INTERNATIONAL, INC. AND SUBSIDIARIES
NOTES TO CONSOLIDATED FINANCIAL STATEMENTS
(Continued)
The Company's capital leases consist primarily of plant facilities and equipment. The value of capitalized leases and the related accumulated depreciation totaled $1.4 million and $1.0 million, respectively, at December 31, 2012. The value of capitalized leases and the related accumulated depreciation totaled $2.1 million and $1.4 million, respectively, at December 31, 2011. In 2011, the Company’s purchased an office building previously held under a capital lease.
5 1/8% Senior Unsecured Notes
On December 21, 2012, the Company sold $400 million aggregate principal amount of 5 1/8% Senior Notes due 2023 (5 1/8% Notes) through a private placement to qualified institutional buyers. The 5 1/8% Notes are senior unsecured obligations of the Company, are guaranteed by our material U.S. subsidiaries (the Guarantors), bear interest at a rate of 5 1/8% per annum and mature on January 1, 2023. At any time prior to January 15, 2016, the Company may redeem up to 35% of the 5 1/8% Notes at a redemption price of 105.125% of the principal amount, plus accrued and unpaid interest to the redemption date, with the proceeds of certain equity offerings. Prior to January 15, 2018, the Company may redeem some or all of the 5 1/8% Notes for cash at a redemption price equal to 100% of their principal amount plus an applicable make-whole premium and accrued and unpaid interest to the redemption date. On and after January 15, 2018, the Company may redeem some or all of the 5 1/8% Notes at redemption prices (expressed as percentages of principal amount), plus accrued and unpaid interest to the redemption date. The optional redemption prices as a percentage of principal amount are as follows:
|
Twelve Month Period Beginning January 15,
|
% of Principal Amount
|
||
|
2018
|
102.563 | % | |
|
2019
|
101.708 | % | |
|
2020
|
100.854 | % | |
|
2021
|
100.000 | % | |
The Company utilized approximately $334 million of the net proceeds of the 5 1/8% Notes to repay borrowings under its U.S. revolving credit facility. The remaining net proceeds of approximately $61 million were utilized for general corporate purposes.
On December 21, 2012, in connection with the issuance of the 5 1/8% Notes, the Company entered into an Indenture (the 5 1/8% Notes Indenture) with the Guarantors and Wells Fargo Bank, N.A., as trustee. The 5 1/8% Notes Indenture restricts the Company's ability and the ability of the Guarantors to: (i) incur additional debt; (ii) pay distributions on, redeem or repurchase equity interests; (iii) make certain investments; (iv) incur liens; (v) enter into transactions with affiliates; (vi) merge or consolidate with another company; and (vii) transfer and sell assets. These covenants are subject to a number of important exceptions and qualifications. If at any time when the 5 1/8% Notes are rated investment grade by either Moody's Investors Service, Inc. or Standard & Poor's Ratings Services and no Default (as defined in the 5 1/8% Notes Indenture) has occurred and is continuing, many of such covenants will terminate and the Company and its subsidiaries will cease to be subject to such covenants. The Indenture contains customary events of default. As of December 31, 2012, the Company was in compliance with all covenants of the 5 1/8% Notes Indenture.
- 94 -
OIL STATES INTERNATIONAL, INC. AND SUBSIDIARIES
NOTES TO CONSOLIDATED FINANCIAL STATEMENTS
(Continued)
6 1/2% Senior Unsecured Notes
On June 1, 2011, the Company sold $600 million aggregate principal amount of 6 1/2% Senior Notes due 2019 (6 1/2% Notes) through a private placement to qualified institutional buyers. The 6 1/2% Notes are senior unsecured obligations of the Company, are guaranteed by our material U.S. subsidiaries (the Guarantors), bear interest at a rate of 6 1/2% per annum and mature on June 1, 2019. At any time prior to June 1, 2014, the Company may redeem up to 35% of the 6 1/2% Notes at a redemption price of 106.500% of the principal amount, plus accrued and unpaid interest to the redemption date, with the proceeds of certain equity offerings. Prior to June 1, 2014, the Company may redeem some or all of the 6 1/2% Notes for cash at a redemption price equal to 100% of their principal amount plus an applicable make-whole premium and accrued and unpaid interest to the redemption date. On and after June 1, 2014, the Company may redeem some or all of the 6 1/2% Notes at redemption prices (expressed as percentages of principal amount), plus accrued and unpaid interest to the redemption date. The optional redemption prices as a percentage of principal amount are as follows:
|
Twelve Month Period Beginning June 1,
|
% of Principal Amount
|
||
|
2014
|
104.875 | % | |
|
2015
|
103.250 | % | |
|
2016
|
101.625 | % | |
|
2017
|
100.000 | % | |
The Company utilized approximately $515 million of the net proceeds of the 6 1/2% Note offering in June 2011 to repay borrowings outstanding under its senior secured credit facilities. The remaining net proceeds of approximately $75 million were utilized for general corporate purposes.
On June 1, 2011, in connection with the issuance of the 6 1/2% Notes, the Company entered into an Indenture (the 6 1/2% Notes Indenture) with the Guarantors and Wells Fargo Bank, N.A., as trustee. The Indenture restricts the Company's ability and the ability of the Guarantors to: (i) incur additional debt; (ii) pay distributions on, redeem or repurchase equity interests; (iii) make certain investments; (iv) incur liens; (v) enter into transactions with affiliates; (vi) merge or consolidate with another company; and (vii) transfer and sell assets. These covenants are subject to a number of important exceptions and qualifications. If at any time when the 6 1/2% Notes are rated investment grade by either Moody's Investors Service, Inc. or Standard & Poor's Ratings Services and no Default (as defined in the 6 1/2% Notes Indenture) has occurred and is continuing, many of such covenants will terminate and the Company and its subsidiaries will cease to be subject to such covenants. The 6 1/2% Notes Indenture contains customary events of default. As of December 31, 2012, the Company was in compliance with all covenants of the 6 1/2% Notes Indenture.
2 3/8% Contingent Convertible Senior Notes
On May 17, 2012, the Company gave notice of the redemption of all of its outstanding 2 3/8% Notes due 2025 (the 2 3/8% Notes), totaling $175 million at a redemption price equal to 100% of the principal amount thereof plus accrued interest. In July 2012, rather than having their 2 3/8% Notes redeemed, on or prior to July 5, 2012, holders of $175 million aggregate principal amount of the 2 3/8% Notes converted their 2 3/8% Notes and received cash up to the principal amount and 3,012,380 shares of the Company’s common stock valued at $220.6 million.
The carrying amount of our 2 3/8% Notes as of December 31, 2011 in our consolidated balance sheet was (in thousands):
|
December 31, 2011
|
||||
|
Carrying amount of the equity component in additional paid-in capital
|
$ | 28,434 | ||
|
Principal amount of the liability component
|
$ | 174,990 | ||
|
Less: Unamortized discount
|
4,106 | |||
|
Net carrying amount of the liability
|
$ | 170,884 | ||
The effective interest rate of 7.17% was applied as of the issuance date for our 2 3/8% Notes in accordance with ASC 470-20 – Debt with Conversion and Other Options. Interest expense on the 2 3/8% Notes, excluding amortization of debt issue costs, was as follows (in thousands):
|
Year ended December 31,
|
||||||||||||
|
2012
|
2011
|
2010
|
||||||||||
|
Interest expense
|
$ | 6,185 | $ | 11,942 | $ | 11,405 | ||||||
- 95 -
OIL STATES INTERNATIONAL, INC. AND SUBSIDIARIES
NOTES TO CONSOLIDATED FINANCIAL STATEMENTS
(Continued)
Credit Facilities
On December 10, 2010, we replaced our existing $500 million bank credit facility with $1.05 billion in senior credit facilities governed by the Amended and Restated Credit Agreement. The new credit facilities totaled $1.05 billion of available commitments consisting of revolving borrowings, up to $750 million, and term borrowings, of $300 million. The Company borrowed all of the term commitment in connection with the acquisition of The MAC. Under these senior secured revolving credit facilities with a group of banks, up to $350 million is available in the form of loans denominated in Canadian dollars and may be made to the Company's principal Canadian operating subsidiaries. The facilities mature on December 10, 2015. The current principal balance of the term loans is repayable at a rate of 2.5% per quarter of the aggregate principal amount until maturity on December 10, 2015 when the remaining principal is due. Amounts borrowed under these facilities bear interest, at the Company's election, at either:
|
|
•
|
a variable rate equal to LIBOR (or, in the case of Canadian dollar denominated loans, the Bankers' Acceptance discount rate) plus a margin ranging from 2.0% to 3.0%; or
|
|
|
•
|
an alternate base rate equal to the higher of the bank's prime rate and the federal funds effective rate (or, in the case of Canadian dollar denominated loans, the Canadian Prime Rate).
|
Commitment fees ranging from 0.375% to 0.50% per year are paid on the undrawn portion of the facilities, depending upon our leverage ratio.
The credit facilities are guaranteed by all of the Company's active domestic subsidiaries and, in some cases, the Company's Canadian and other foreign subsidiaries. The credit facilities are secured by a first priority lien on all the Company's inventory, accounts receivable and other material tangible and intangible assets, as well as those of the Company's active subsidiaries. However, no more than 65% of the voting stock of any foreign subsidiary is required to be pledged if the pledge of any greater percentage would result in adverse tax consequences.
The Credit Agreement contains customary financial covenants and restrictions, including restrictions on our ability to declare and pay dividends. Specifically, we must maintain an interest coverage ratio, defined as the ratio of consolidated EBITDA, to consolidated interest expense of at least 3.0 to 1.0 and our maximum leverage ratio, defined as the ratio of total debt to consolidated EBITDA of no greater than 3.25 to 1.0 in 2012 and 3.0 to 1.0 thereafter. Each of the factors considered in the calculations of these ratios are defined in the Credit Agreement. EBITDA and consolidated interest as defined, exclude goodwill impairments, debt discount amortization and other non-cash charges. As of December 31, 2012, we were in compliance with our debt covenants. The credit facilities also contain negative covenants that limit the Company's ability to borrow additional funds, encumber assets, pay dividends, sell assets and enter into other significant transactions.
Under the Company's credit facilities, the occurrence of specified change of control events involving our company would constitute an event of default that would permit the banks to, among other things, accelerate the maturity of the facilities and cause them to become immediately due and payable in full.
As of December 31, 2012, we had $255.8 million outstanding under these facilities and an additional $41.1 million of outstanding letters of credit, leaving $708.9 million available to be drawn under the facilities.
- 96 -
OIL STATES INTERNATIONAL, INC. AND SUBSIDIARIES
NOTES TO CONSOLIDATED FINANCIAL STATEMENTS
(Continued)
On September 18, 2012, the Company’s Australian accommodations subsidiary, The MAC Services Group Pty Limited (The MAC), entered into a AUD$300 million revolving loan facility governed by a Syndicated Facility Agreement (The MAC Group Facility Agreement), between The MAC, J.P. Morgan Australia Limited, as Australian agent and security trustee, JPMorgan Chase Bank, N.A., as U.S. agent, and the lenders party thereto, which is guaranteed by the Company and The MAC’s subsidiaries. The maturity date of The MAC Group Facility Agreement is December 10, 2015. Under the terms of the MAC Group Facility Agreement, loans bear interest for a particular interest period at a rate per annum equal to the sum of the average interest rate paid by banks for loans of the equivalent period and an applicable percentage ranging from 2.00% to 3.00% based upon the Australian Borrower’s leverage ratio. The MAC Group Facility Agreement contains representations, warranties and covenants that are customary for similar credit arrangements, including, among other things, covenants relating to financial reporting and notification, payment of obligations, and notification of certain events. Financial covenants in the MAC Group Facility Agreement also require The MAC not to permit: (i) the interest coverage ratio (the ratio of consolidated EBITDA to consolidated interest expense) to be less than 4.0 to 1.0 for any period of four consecutive fiscal quarters of The MAC; and (ii) the leverage ratio (the ratio of total debt to consolidated EBITDA) to be greater than 3.0 to 1.0 for any period of four consecutive fiscal quarters of The MAC. Each of the factors considered in the calculations of ratios are defined in The MAC Group Facility Agreement. The MAC Group Facility Agreement contains various customary restrictive covenants, subject to certain exceptions, that limit The MAC and its subsidiaries from, among other things, incurring additional indebtedness or guarantees, creating liens or other encumbrances on property, entering into a merger or similar transaction, selling or transferring certain property, making certain restricted payments and entering into transactions with affiliates. As of December 31, 2012, we were in compliance with our Australian debt covenants. The MAC Group Facility Agreement replaced The MAC’s previous AUD$150 million revolving loan facility. As of December 31, 2012, we had AUD$46
million outstanding under the Australian credit facility leaving AUD$254 million available to be drawn under this facility.
Interest expense on the consolidated statements of income is net of capitalized interest of $3.5 million, $5.3 million and $0.2 million, respectively, for the years ended December 31, 2012, 2011 and 2010.
9. Derivative Instruments and Hedging Activities
The Company conducts business in various foreign countries and, therefore, settles transactions in foreign currencies. The Company, from time to time, will utilize foreign currency forward contracts to offset the risk associated with the effects of certain foreign currency exposure. These derivative contracts are consistent with the Company’s strategy for managing financial risks. In July 2012, the Company entered into foreign currency forward contracts, which have been designated and qualify as cash flow hedges, to reduce the Company’s exposure to foreign currency fluctuations on a revenue contract denominated in a foreign currency. The Company initially reports any gain or loss on the effective portion of a cash flow hedge as a component of other comprehensive income and subsequently reclassifies any gain or loss to product revenues when the hedged revenues are recorded. The portion of these instruments that do not qualify for cash flow hedge treatment are re-measured at fair value on each balance sheet date and resulting gains or losses are recognized in net income. As of December 31, 2012, the total notional amount of the derivative contracts was $12.4 million (€10.0 million). As of December 31, 2012, all of the Company’s derivative contracts were designated as hedges. The Company had no derivative contracts outstanding as of December 31, 2011.
For each derivative contract entered into in which the Company seeks to obtain cash flow hedge accounting treatment, the Company formally documents all relationships between hedging instruments and hedged items, as well as its risk management objective and strategy for undertaking the hedge transaction, the nature of the risk being hedged, how the hedging instrument’s effectiveness in offsetting the hedged risk will be assessed prospectively and retrospectively, and a description of the method of measuring ineffectiveness. This process includes linking all derivatives to specific firm commitments or forecasted transactions and designating the derivatives as cash flow hedges. The Company also formally assesses, both at the hedge’s inception and on an ongoing basis, whether the derivative contracts that are used in hedging transactions are highly effective in offsetting changes in cash flows of hedged items. The effective portion of these hedged items is reflected in other comprehensive income. If it is determined that a derivative contract is not highly effective, or that it has ceased to be a highly effective hedge, the Company will be required to discontinue hedge accounting with respect to that derivative contract prospectively.
At December 31, 2012, the Company’s foreign currency forward contracts had remaining maturities ranging from less than one month to twenty-one months.
The balance sheet location and the fair values of derivative instruments are (in thousands):
|
Foreign Currency Contracts
|
December 31,
2012
|
|||
|
Assets
|
||||
|
Derivatives designated as hedging instruments
|
||||
|
Other current assets
|
$ | -- | ||
|
Derivatives not designated as hedging instruments
|
||||
|
Other current assets
|
-- | |||
|
Total assets
|
$ | -- | ||
|
Liabilities
|
||||
|
Derivatives designated as hedging instruments
|
||||
|
Other current liabilities
|
$ | 937 | ||
|
Derivatives not designated as hedging instruments
|
||||
|
Other current liabilities
|
-- | |||
|
Total liabilities
|
$ | 937 | ||
The amount of the gains and losses related to the Company’s derivative contracts designated as hedging instruments for the year ended December 31, 2012 were (in thousands):
|
Pretax Gain (Loss)
Recognized in
Other
Comprehensive
Income on
Effective Portion of
Derivative
|
||||
|
Year ended
December 31, 2012
|
||||
|
Derivatives in Cash Flow Hedging Relationships:
Foreign currency forward contracts
|
$ | (1,032 | ) | |
|
Pretax Gain (Loss)
Recognized in
Income on Effective
Portion of
Derivative as a
Result of
Reclassification
from Accumulated
Other
Comprehensive
Income
|
|||||
|
Location
|
Year ended
December 31, 2012
|
||||
|
Derivatives in Cash Flow Hedging Relationships:
Foreign currency forward contracts
|
Product
revenues
|
$ | (11 | ) | |
|
Gain (Loss) on
Ineffective Portion
of Derivative
Recognized in
Income
|
|||||
|
Location
|
Year ended
December 31, 2012
|
||||
|
Derivatives in Cash Flow Hedging Relationships:
Foreign currency forward contracts
|
Product
revenues
|
$ | (11 | ) | |
At December 31, 2012, there was $1.0 million of unrealized pretax loss on outstanding derivatives accumulated in other comprehensive loss, a majority of which is expected to be reclassified to net sales within the next twenty-one months as a result of underlying hedged transactions also being recorded in net sales.
- 97 -
OIL STATES INTERNATIONAL, INC. AND SUBSIDIARIES
NOTES TO CONSOLIDATED FINANCIAL STATEMENTS
(Continued)
For the year ended December 31, 2012, the gains and losses from our derivative contracts not designated as hedging instruments recognized in net sales were zero.
10. Stock Repurchase Program
On August 23, 2012, the Company announced that its Board of Directors authorized $200 million for the repurchase of the Company’s common stock, par value $.01 per share. The authorization replaced the prior share repurchase authorization, which was set to expire on September 1, 2012. As of December 31, 2012, the Company had approximately 54.7 million shares of common stock outstanding. The Board of Directors’ authorization is limited in duration and expires on September 1, 2014. Subject to applicable securities laws, such purchases will be at such times and in such amounts as the Board of Directors deems appropriate. As of December 31, 2012, a total of $15.2 million of our stock (225,796 shares) had been repurchased under this program, leaving a total authorization of up to approximately $184.8 million remaining available under the repurchase program.
11. Retirement Plans
The Company sponsors defined contribution plans. Participation in these plans is available to substantially all employees. The Company recognized expense of $13.7 million, $11.1 million and $7.7 million, respectively, related to matching contributions under its various defined contribution plans during the years ended December 31, 2012, 2011 and 2010, respectively.
12. Income Taxes
Consolidated pre-tax income (loss) for the years ended December 31, 2012, 2011 and 2010 consisted of the following (in thousands):
|
2012
|
2011
|
2010
|
||||||||||
|
US operations
|
$ | 250,870 | $ | 193,091 | $ | 68,921 | ||||||
|
Foreign operations
|
376,025 | 261,978 | 171,707 | |||||||||
|
Total
|
$ | 626,895 | $ | 455,069 | $ | 240,628 | ||||||
The components of the income tax provision for the years ended December 31, 2012, 2011 and 2010 consisted of the following (in thousands):
|
2012
|
2011
|
2010
|
||||||||||
|
Current:
|
||||||||||||
|
Federal
|
$ | 79,958 | $ | 48,253 | $ | 25,237 | ||||||
|
State
|
5,423 | 1,769 | 1,122 | |||||||||
|
Foreign
|
74,295 | 48,921 | 44,249 | |||||||||
| 159,676 | 98,943 | 70,608 | ||||||||||
|
Deferred:
|
||||||||||||
|
Federal
|
7,483 | 15,862 | (1,572 | ) | ||||||||
|
State
|
(1,082 | ) | 2,206 | (58 | ) | |||||||
|
Foreign
|
10,970 | 14,636 | 3,045 | |||||||||
| 17,371 | 32,704 | 1,415 | ||||||||||
|
Total Provision
|
$ | 177,047 | $ | 131,647 | $ | 72,023 | ||||||
- 98 -
OIL STATES INTERNATIONAL, INC. AND SUBSIDIARIES
NOTES TO CONSOLIDATED FINANCIAL STATEMENTS
(Continued)
The provision for taxes differs from an amount computed at U.S. statutory rates as follows for the years ended December 31, 2012, 2011 and 2010 consisted (in thousands):
|
2012
|
2011
|
2010
|
||||||||||
|
Federal tax expense at statutory rates
|
$ | 219,413 | $ | 159,274 | $ | 84,220 | ||||||
|
Effect of foreign income tax, net
|
(46,715 | ) | (33,818 | ) | (12,796 | ) | ||||||
|
Nondeductible acquisition costs
|
156 | 183 | 2,315 | |||||||||
|
Other nondeductible expenses
|
2,603 | 3,194 | 1,454 | |||||||||
|
State tax expense, net of federal benefits
|
4,341 | 3,975 | 1,017 | |||||||||
|
Domestic manufacturing deduction
|
(3,300 | ) | (1,839 | ) | (978 | ) | ||||||
|
Uncertain tax positions adjustments, net
|
(3,209 | ) | (1,585 | ) | (1,036 | ) | ||||||
|
Other, net
|
3,758 | 2,263 | (2,173 | ) | ||||||||
|
Net income tax provision
|
$ | 177,047 | $ | 131,647 | $ | 72,023 | ||||||
The significant items giving rise to the deferred tax assets and liabilities as of December 31, 2012 and 2011 are as follows (in thousands):
|
2012
|
2011
|
|||||||
|
Deferred tax assets:
|
||||||||
|
Allowance for doubtful accounts
|
$ | 1,991 | $ | 1,232 | ||||
|
Allowance for inventory reserves
|
7,486 | 6,466 | ||||||
|
Employee benefits
|
17,535 | 14,655 | ||||||
|
Deductible goodwill and other intangibles
|
8,185 | 11,586 | ||||||
|
Other reserves
|
5,332 | 5,432 | ||||||
|
Depreciation
|
1,244 | 1,045 | ||||||
|
Foreign tax credit carryover
|
11,326 | 8,538 | ||||||
|
Other
|
3,388 | 3,373 | ||||||
|
Gross deferred tax asset
|
56,487 | 52,327 | ||||||
|
Less: valuation allowance
|
-- | -- | ||||||
|
Net deferred tax asset
|
56,487 | 52,327 | ||||||
|
Deferred tax liabilities:
|
||||||||
|
Depreciation
|
(158,739 | ) | (130,793 | ) | ||||
|
Deferred revenue
|
(1,777 | ) | (1,705 | ) | ||||
|
Intangibles
|
(10,692 | ) | (5,082 | ) | ||||
|
Accrued liabilities
|
(4,117 | ) | (4,330 | ) | ||||
|
Lower of cost or market
|
(3,373 | ) | (2,141 | ) | ||||
|
Convertible notes
|
-- | (1,514 | ) | |||||
|
Other
|
(4,171 | ) | (3,674 | ) | ||||
|
Deferred tax liability
|
(182,869 | ) | (149,239 | ) | ||||
|
Net deferred tax liability
|
$ | (126,382 | ) | $ | (96,912 | ) | ||
Reclassifications of the Company's deferred tax balance based on net current items and net non-current items as of December 31, 2012 and 2011 are as follows (in thousands):
|
2012
|
2011
|
|||||||
|
Current deferred tax liability
|
$ | (3,951 | ) | $ | (5,298 | ) | ||
|
Long-term deferred tax liability
|
(122,431 | ) | (91,614 | ) | ||||
|
Net deferred tax liability
|
$ | (126,382 | ) | $ | (96,912 | ) | ||
Our primary deferred tax assets at December 31, 2012, were related to employee benefit costs for our Equity Participation Plan, deductible goodwill and other intangibles, allowance for inventory obsolescence and foreign tax credit carryforwards. The foreign tax credits will expire in varying amounts after 2019.
Our income tax provision for the year ended December 31, 2012 totaled $177.0 million, or 28.2% of pretax income, compared to $131.6 million, or 28.9% of pretax income, for the year ended December 31, 2011.
Appropriate U.S. and foreign income taxes have been provided for earnings of foreign subsidiary companies that are expected to be remitted in the near future. The cumulative amount of undistributed earnings of foreign subsidiaries that the Company intends to indefinitely reinvest, and upon which foreign taxes have been accrued or paid but no deferred US income taxes have been provided is $1.1 billion at December 31, 2012, the majority of which has been generated in Canada and Australia. Upon distribution of these earnings in the form of dividends or otherwise, the Company may be subject to U.S. income taxes (subject to adjustment for foreign tax credits) and foreign withholding taxes. It is not practical, however, to estimate the amount of taxes that may be payable on the eventual remittance of these earnings after consideration of available foreign tax credits.
- 99 -
OIL STATES INTERNATIONAL, INC. AND SUBSIDIARIES
NOTES TO CONSOLIDATED FINANCIAL STATEMENTS
(Continued)
The American Jobs Creation Act of 2004 that was signed into law in October 2004 introduced a requirement for companies to disclose any penalties imposed on them or any of their consolidated subsidiaries by the IRS for failing to satisfy tax disclosure requirements relating to "reportable transactions." During the year ended December 31, 2012, no penalties were imposed on the Company or its consolidated subsidiaries for failure to disclose reportable transactions to the IRS.
The Company files tax returns in the jurisdictions in which they are required. All of these returns are subject to examination or audit and possible adjustment as a result of assessments by taxing authorities. The Company believes that it has recorded sufficient tax liabilities and does not expect the resolution of any examination or audit of its tax returns would have a material adverse effect on its operating results, financial condition or liquidity.
Tax years subsequent to 2009 remain open to U.S. federal tax audit and, because of Net Operating Losses (NOL's) utilized by the Company, years from 1994 to 2002 remain subject to federal tax audit with respect to NOL's available for tax carryforward. Our Canadian subsidiaries' federal tax returns subsequent to 2008 are subject to audit by the Canada Revenue Agency. Our Australian subsidiary’s federal tax returns subsequent to 2007 are subject to audit by the Australian Taxation Office.
We account for uncertain tax positions using a recognition threshold and a measurement attribute for the financial statement recognition and measurement of tax positions taken or expected to be taken in a tax return. For those benefits to be recognized, a tax position must be more-likely-than-not to be sustained upon examination by taxing authorities. The amount recognized is measured as the largest amount of benefit that is greater than 50 percent likely of being realized upon ultimate settlement.
The total amount of unrecognized tax benefits as of December 31, 2012 was $0.7 million. The unrecognized tax benefits, if recognized, would affect the effective tax rate. The Company accrues interest and penalties related to unrecognized tax benefits as a component of the Company's provision for income taxes. As of December 31, 2012 and 2011, the Company had accrued $0.2 million and $2.3 million, respectively, of interest expense and penalties.
A reconciliation of the beginning and ending amount of unrecognized tax benefits is as follows (in thousands):
|
2012
|
2011
|
2010
|
||||||||||
|
Balance as of January 1
st
|
$ | 1,847 | $ | 3,044 | $ | 4,031 | ||||||
|
Additions for tax positions of prior years
|
-- | -- | 128 | |||||||||
|
Reductions for tax positions of prior years
|
(1,119 | ) | (798 | ) | -- | |||||||
|
Lapse of the applicable statute of limitations
|
-- | (399 | ) | (1,115 | ) | |||||||
|
Balance as of December 31
st
|
$ | 728 | $ | 1,847 | $ | 3,044 | ||||||
It is reasonably possible that the amount of unrecognized tax benefits will change during the next twelve months due to the closing of the statute of limitations and that change, if it were to occur, could have a favorable or unfavorable impact on our results of operation.
13. Commitments and Contingencies
The Company leases a portion of its equipment, office space, computer equipment, automobiles and trucks under leases which expire at various dates.
- 100 -
OIL STATES INTERNATIONAL, INC. AND SUBSIDIARIES
NOTES TO CONSOLIDATED FINANCIAL STATEMENTS
(Continued)
Minimum future operating lease obligations in effect at December 31, 2012, were as follows (in thousands):
|
|
Operating
Leases
|
|||
|
2013
|
$ | 15,069 | ||
|
2014
|
13,077 | |||
|
2015
|
10,454 | |||
|
2016
|
8,002 | |||
|
2017
|
6,669 | |||
|
Thereafter
|
24,092 | |||
|
Total
|
$ | 77,363 | ||
Rental expense under operating leases was $17.0 million, $14.5 million and $12.9 million for the years ended December 31, 2012, 2011 and 2010, respectively.
The Company is a party to various pending or threatened claims, lawsuits and administrative proceedings seeking damages or other remedies concerning its commercial operations, products, employees and other matters, including warranty and product liability claims and occasional claims by individuals alleging exposure to hazardous materials as a result of its products or operations. Some of these claims relate to matters occurring prior to its acquisition of businesses, and some relate to businesses it has sold. In certain cases, the Company is entitled to indemnification from the sellers of businesses, and in other cases, it has indemnified the buyers of businesses from it. Although the Company can give no assurance about the outcome of pending legal and administrative proceedings and the effect such outcomes may have on it, management believes that any ultimate liability resulting from the outcome of such proceedings, to the extent not otherwise provided for or covered by insurance, will not have a material adverse effect on its consolidated financial position, results of operations or liquidity.
14. Stock-Based Compensation
Current accounting standards require companies to measure the cost of employee services received in exchange for an award of equity instruments (typically stock options) based on the grant-date fair value of the award. The fair value is estimated using option-pricing models. The resulting cost is recognized over the period during which an employee is required to provide service in exchange for the awards, usually the vesting period.
The fair value of each option grant is estimated on the date of grant using a Black-Scholes option pricing model that uses the assumptions noted in the following table. The risk-free interest rate is based on the U.S. Treasury yield curve in effect for the expected term of the option at the time of grant. The dividend yield on our common stock is assumed to be zero since we do not pay dividends and have no current plans to do so in the future. The expected market price volatility of our common stock is based on an estimate made by us that considers the historical and implied volatility of our common stock as well as a peer group of companies over a time period equal to the expected term of the option. The expected life of the options awarded in 2012, 2011 and 2010 was based on a formula considering the vesting period, term of the options awarded and past experience.
|
2012
|
2011
|
2010
|
|||||||
|
Risk-free weighted interest rate
|
0.6 | % | 1.7 | % | 2.1 | % | |||
|
Expected life (in years)
|
4.1 | 4.1 | 4.3 | ||||||
|
Expected volatility
|
57 | % | 55 | % | 55 | % | |||
- 101 -
OIL STATES INTERNATIONAL, INC. AND SUBSIDIARIES
NOTES TO CONSOLIDATED FINANCIAL STATEMENTS
(Continued)
The following table summarizes stock option activity for each of the three years ended December 31, 2012, 2011 and 2010:
|
Options
|
Weighted Average Exercise Price
|
Weighted Average Contractual Life (Years)
|
Aggregate Intrinsic Value (Thousands)
|
||||||||||||
|
Outstanding Options at December 31, 2009
|
2,481,951 | $ | 25.55 | 3.6 | $ | 34,618 | |||||||||
|
Granted
|
417,250 | 37.67 | |||||||||||||
|
Exercised
|
(866,436 | ) | 26.96 | ||||||||||||
|
Forfeited
|
(65,375 | ) | 27.75 | ||||||||||||
|
Outstanding Options at December 31, 2010
|
1,967,390 | 27.42 | 3.5 | 72,138 | |||||||||||
|
Granted
|
186,200 | 75.34 | |||||||||||||
|
Exercised
|
(517,202 | ) | 27.37 | ||||||||||||
|
Forfeited
|
(53,125 | ) | 41.85 | ||||||||||||
|
Outstanding Options at December 31, 2011
|
1,583,263 | 32.59 | 3.4 | 69,311 | |||||||||||
|
Granted
|
155,250 | 84.52 | |||||||||||||
|
Exercised
|
(471,780 | ) | 28.89 | ||||||||||||
|
Forfeited
|
(17,486 | ) | 51.65 | ||||||||||||
|
Outstanding Options at December 31, 2012
|
1,249,247 | 40.18 | 3.7 | 41,730 | |||||||||||
The weighted average fair values of options granted during 2012, 2011 and 2010 were $37.38, $33.23, and $17.13 per share, respectively. All options awarded in 2012 had a term of ten years and were granted with exercise prices at the grant date closing market price. The total intrinsic value of options exercised during 2012, 2011 and 2010 were $38.3 million, $24.9 million and $19.9 million, respectively. Cash received by the Company from option exercises during 2012, 2011 and 2010 totaled $13.6 million, $14.2 million and $23.4 million, respectively. The tax benefit realized for the tax deduction from stock options exercised during 2012, 2011 and 2010 totaled $6.9 million, $7.8 million and $6.1 million, respectively.
The following table summarizes information for stock options outstanding at December 31, 2012:
|
Options Outstanding
|
Options Exercisable
|
|||||||||||||||||||||
|
Range of Exercise Prices
|
Number
Outstanding
as of
12/31/2012
|
Weighted
Average
Remaining
Contractual
Life
|
Weighted
Average
Exercise
Price
|
Number
Exercisable
as of
12/31/2012
|
Weighted
Average
Exercise
Price
|
|||||||||||||||||
| $11.49 | - | $ 16.65 | 414,712 | 1.87 | $ | 15.97 | 270,475 | $ | 15.60 | |||||||||||||
| $24.52 | - | $ 37.67 | 517,588 | 2.30 | $ | 35.79 | 342,090 | $ | 34.83 | |||||||||||||
| $58.05 | - | $ 84.63 | 316,947 | 8.33 | $ | 79.02 | 42,503 | $ | 69.87 | |||||||||||||
| $11.49 | - | $ 84.63 | 1,249,247 | 3.69 | $ | 40.18 | 655,068 | $ | 29.17 | |||||||||||||
At December 31, 2012, a total of 1,018,285 shares were available for future grant under the Equity Participation Plan.
During 2012, we granted restricted stock awards totaling 357
,544
shares valued at a total of $29.2 million. Of the restricted stock awards granted in 2012, 218,000 awards vest in four equal annual installments beginning in February 2013, 55,250 awards vest 40% in October 2013 and 60% in October 2014, 47,625 awards are performance based awards that may vest in February 2015 in an amount that will depend on the Company’s achievement of specified performance objectives, 23,625 awards vest 100% in February 2016 and 12,464 awards vest 100% in May 2013. The performance based awards have a performance criteria that will be measured based upon the Company’s achievement levels of average after-tax annual return on invested capital for the three year period commencing January 1, 2012. During 2012, the Company also granted 54,950 units of phantom shares under the newly created Canadian Long-Term Incentive Plan, which provides for the granting of units of phantom shares to key Canadian employees. These awards vest in three equal annual installments beginning in February 2013 and are accounted for as a liability. Participants granted units of phantom shares are entitled to a lump sum cash payment equal to the fair market value of a share of the Company’s common stock on the vesting date. A total of 217,415 and 233,493 shares of restricted stock were awarded in 2011 and 2010, respectively, with aggregate values of $16.3 million and $9.1 million, respectively.
- 102 -
OIL STATES INTERNATIONAL, INC. AND SUBSIDIARIES
NOTES TO CONSOLIDATED FINANCIAL STATEMENTS
(Continued)
Stock based compensation pre-tax expense recognized in the years ended December 31, 2012, 2011 and 2010 totaled $18.9 million, $14.6 million and $12.6 million, or $0.25, $0.20 and $0.18 per diluted share after tax, respectively. At December 31, 2012, $39.4 million of compensation cost related to unvested stock options and restricted stock awards attributable to future performance had not yet been recognized.
Deferred Compensation Plan
The Company maintains a deferred compensation plan (Deferred Compensation Plan). This plan is available to directors and certain officers and managers of the Company. The plan allows participants to defer the receipt of all or a portion of their directors’ fees and/or salary and annual bonuses. Employee contributions to the Deferred Compensation Plan are matched by the Company at the same percentage as if the employee was a participant in the Company's 401(k) Retirement Plan and was not subject to the IRS limitations on match-eligible compensation. The Deferred Compensation Plan also permits the Company to make discretionary contributions to any employee's account, although none have been made to date. Director's contributions are not matched by the Company. Since inception of the plan, this discretionary contribution provision has been limited to a matching of the participants' contributions on a basis equivalent to matching permitted under the Company's 401(k) Retirement Savings Plan. The vesting of contributions to the participants’ accounts is also equivalent to the vesting requirements of the Company's 401(k) Retirement Savings Plan. The Deferred Compensation Plan does not have dollar limits on tax-deferred contributions. The assets of the Deferred Compensation Plan are held in a Rabbi Trust (Trust) and, therefore, are available to satisfy the claims of the Company's creditors in the event of bankruptcy or insolvency of the Company. Participants have the ability to direct the Plan Administrator to invest the assets in their individual accounts, including any discretionary contributions by the Company, in ten pre-approved mutual funds held by the Trust which cover a variety of securities and mutual funds. In addition, participants currently have the right to request that the Plan Administrator to re-allocate the portfolio of investments (i.e. cash or mutual funds) in the participants' individual accounts within the Trust. Company contributions are in the form of cash. Distributions from the plan are generally made upon the participants' termination as a director and/or employee, as applicable, of the Company. Participants receive payments from the Deferred Compensation Plan in cash. At December 31, 2012, Trust assets totaled $11.6 million, the majority of which is classified as “Other noncurrent assets” in the Company’s Consolidated Balance Sheet. The fair value of the investments was based on quoted market prices in active markets (a Level 1 fair value measurement). Amounts payable to the plan participants at December 31, 2012, including the fair value of the shares of the Company's common stock that are reflected as treasury stock, was $12.7 million and is classified as "Other noncurrent liabilities" in the consolidated balance sheet. The Company accounts for the Deferred Compensation Plan in accordance with current accounting standards regarding the accounting for deferred compensation arrangements where amounts earned are held in a Rabbi Trust and invested.
In accordance with current accounting standards, all fair value fluctuations of the Trust assets have been reflected in the consolidated statements of income. Increases or decreases in the value of the plan assets, exclusive of the shares of common stock of the Company, have been included as compensation adjustments in the respective statements of income. Increases or decreases in the fair value of the deferred compensation liability, including the shares of common stock of the Company held by the Trust, while recorded as treasury stock, are also included as compensation adjustments in the consolidated statements of income. In response to the changes in total fair value of the Company's common stock held by the Trust, the Company recorded net compensation expense adjustments to the liability of ($0.1) million in 2012, $0.2 million in 2011 and $0.4 million in 2010.
15. Segment and Related Information
In accordance with current accounting standards regarding disclosures about segments of an enterprise and related information, the Company has identified the following reportable segments: well site services, accommodations, offshore products and tubular services. The Company's reportable segments represent strategic business units that offer different products and services. They are managed separately because each business requires different technology and marketing strategies. Most of the businesses were initially acquired as a unit, and the management at the time of the acquisition was retained. Subsequent acquisitions have been direct extensions to our business segments. The separate business lines within the well site services segment have been disclosed to provide additional detail for that segment.
- 103 -
OIL STATES INTERNATIONAL, INC. AND SUBSIDIARIES
NOTES TO CONSOLIDATED FINANCIAL STATEMENTS
(Continued)
Financial information by industry segment for each of the three years ended December 31, 2012, 2011 and 2010, is summarized in the following table in thousands. The accounting policies of the segments are the same as those described in the summary of significant accounting policies.
|
Revenues
from
unaffiliated
customers
|
Depreciation
and
amortization
|
Operating
income
(loss)
|
Equity in
earnings (loss)
of
unconsolidated affiliates
|
Capital
expenditures
|
Total
assets
|
|||||||||||||||||||
|
2012
|
||||||||||||||||||||||||
|
Well site services -
|
||||||||||||||||||||||||
|
Completion services
|
$ | 522,618 | $ | 50,611 | $ | 124,620 | $ | -- | $ | 86,567 | $ | 574,203 | ||||||||||||
|
Drilling services
|
191,034 | 22,411 | 32,160 | -- | 32,136 | 157,658 | ||||||||||||||||||
|
Total well site services
|
713,652 | 73,022 | 156,780 | -- | 118,703 | 731,861 | ||||||||||||||||||
|
Accommodations
|
1,113,470 | 139,047 | 364,629 | (2 | ) | 314,047 | 2,123,412 | |||||||||||||||||
|
Offshore products
|
804,067 | 14,720 | 134,051 | (417 | ) | 48,792 | 804,980 | |||||||||||||||||
|
Tubular services
|
1,781,899 | 2,306 | 75,042 | 662 | 5,027 | 714,199 | ||||||||||||||||||
|
Corporate and eliminations
|
-- | 1,003 | (46,722 | ) | -- | 1,368 | 65,510 | |||||||||||||||||
|
Total
|
$ | 4,413,088 | $ | 230,098 | $ | 683,780 | $ | 243 | $ | 487,937 | $ | 4,439,962 | ||||||||||||
|
2011
|
||||||||||||||||||||||||
|
Well site services -
|
||||||||||||||||||||||||
|
Completion services
|
$ | 487,941 | $ | 41,612 | $ | 120,849 | $ | -- | $ | 81,024 | $ | 462,189 | ||||||||||||
|
Drilling services
|
165,903 | 19,818 | 20,394 | -- | 29,477 | 128,721 | ||||||||||||||||||
|
Total well site services
|
653,844 | 61,430 | 141,243 | -- | 110,501 | 590,910 | ||||||||||||||||||
|
Accommodations
|
864,701 | 110,705 | 248,977 | 1 | 348,504 | 1,789,868 | ||||||||||||||||||
|
Offshore products
|
585,818 | 13,454 | 94,666 | (847 | ) | 19,987 | 622,466 | |||||||||||||||||
|
Tubular services
|
1,374,817 | 1,758 | 64,422 | 683 | 8,129 | 645,422 | ||||||||||||||||||
|
Corporate and eliminations
|
-- | 800 | (41,785 | ) | -- | 361 | 54,975 | |||||||||||||||||
|
Total
|
$ | 3,479,180 | $ | 188,147 | $ | 507,523 | $ | (163 | ) | $ | 487,482 | $ | 3,703,641 | |||||||||||
|
2010
|
||||||||||||||||||||||||
|
Well site services -
|
||||||||||||||||||||||||
|
Completion services
|
$ | 342,953 | $ | 40,859 | $ | 47,326 | $ | -- | $ | 42,884 | $ | 383,778 | ||||||||||||
|
Drilling services
|
133,214 | 24,149 | 576 | -- | 10,300 | 108,163 | ||||||||||||||||||
|
Total well site services
|
476,167 | 65,008 | 47,902 | -- | 53,184 | 491,941 | ||||||||||||||||||
|
Accommodations
|
537,690 | 45,694 | 151,417 | (25 | ) | 107,347 | 1,491,682 | |||||||||||||||||
|
Offshore products
|
428,963 | 11,496 | 60,664 | -- | 13,299 | 520,944 | ||||||||||||||||||
|
Tubular services
|
969,164 | 1,301 | 35,941 | 264 | 7,889 | 458,808 | ||||||||||||||||||
|
Corporate and eliminations
|
-- | 703 | (40,342 | ) | -- | 488 | 52,624 | |||||||||||||||||
|
Total
|
$ | 2,411,984 | $ | 124,202 | $ | 255,582 | $ | 239 | $ | 182,207 | $ | 3,015,999 | ||||||||||||
Financial information by geographic segment for each of the three years ended December 31, 2012, 2011 and 2010, is summarized below in thousands. Revenues in the United States include export sales. Revenues are attributable to countries based on the location of the entity selling the products or performing the services. Total assets are attributable to countries based on the physical location of the entity and its operating assets and do not include intercompany balances.
|
United States
|
Canada
|
Australia
|
United Kingdom
|
Other Non U.S.
|
Total
|
|||||||||||||||||||
|
2012
|
||||||||||||||||||||||||
|
Revenues from unaffiliated customers
|
$ | 3,024,837 | $ | 734,197 | $ | 276,433 | $ | 205,618 | $ | 172,003 | $ | 4,413,088 | ||||||||||||
|
Long-lived assets
|
936,482 | 655,714 | 932,246 | 23,626 | 59,004 | 2,607,072 | ||||||||||||||||||
|
2011
|
||||||||||||||||||||||||
|
Revenues from unaffiliated customers
|
$ | 2,424,669 | $ | 590,242 | $ | 197,095 | $ | 130,407 | $ | 136,767 | $ | 3,479,180 | ||||||||||||
|
Long-lived assets
|
714,541 | 608,054 | 827,271 | 18,357 | 39,996 | 2,208,219 | ||||||||||||||||||
|
2010
|
||||||||||||||||||||||||
|
Revenues from unaffiliated customers
|
$ | 1,708,709 | $ | 512,288 | $ | - | $ | 77,180 | $ | 113,807 | $ | 2,411,984 | ||||||||||||
|
Long-lived assets
|
639,120 | 502,322 | 724,522 | 17,275 | 28,088 | 1,911,327 | ||||||||||||||||||
No customers accounted for more than 10% of the Company's revenues in any of the years ended December 31, 2012, 2011 and 2010. Equity in net income of unconsolidated affiliates is not included in operating income.
- 104 -
OIL STATES INTERNATIONAL, INC. AND SUBSIDIARIES
NOTES TO CONSOLIDATED FINANCIAL STATEMENTS
(Continued)
16. Valuation Allowances
Activity in the valuation accounts was as follows (in thousands):
|
Balance at
Beginning
of Period
|
Charged to
Costs and
Expenses
|
Deductions
(net of
recoveries)
|
Translation
and Other,
Net
|
Balance at
End of
Period
|
||||||||||||||||
|
Year Ended December 31, 2012:
|
||||||||||||||||||||
|
Allowance for doubtful accounts receivable
|
$ | 3,963 | $ | 2,565 | $ | (731 | ) | $ | 18 | $ | 5,815 | |||||||||
|
Allowance for excess, damaged, remnant or obsolete inventory
|
10,030 | 5,792 | (4,551 | ) | 74 | 11,345 | ||||||||||||||
|
Year Ended December 31, 2011:
|
||||||||||||||||||||
|
Allowance for doubtful accounts receivable
|
$ | 4,100 | $ | 2,239 | $ | (2,310 | ) | $ | (66 | ) | $ | 3,963 | ||||||||
|
Allowance for excess, damaged, remnant or obsolete inventory
|
8,454 | 2,366 | (783 | ) | (7 | ) | 10,030 | |||||||||||||
|
Year Ended December 31, 2010:
|
||||||||||||||||||||
|
Allowance for doubtful accounts receivable
|
$ | 4,946 | $ | 869 | $ | (1,915 | ) | $ | 200 | $ | 4,100 | |||||||||
|
Allowance for excess, damaged, remnant or obsolete inventory
|
8,279 | 1,288 | (510 | ) | (603 | ) | 8,454 | |||||||||||||
17. Quarterly Financial Information (Unaudited)
The following table summarizes quarterly financial information for 2012 and 2011 (in thousands, except per share amounts):
|
First Quarter
(2)
|
Second Quarter
(3)
|
Third Quarter
(4)
|
Fourth Quarter
|
|||||||||||||
|
2012
|
||||||||||||||||
|
Revenues
|
$ | 1,098,992 | $ | 1,091,088 | $ | 1,080,673 | $ | 1,142,336 | ||||||||
|
Gross profit
(1)
|
303,195 | 271,924 | 266,639 | 278,361 | ||||||||||||
|
Net income
|
135,065 | 111,234 | 103,792 | 98,519 | ||||||||||||
|
Basic earnings per share
|
2.63 | 2.15 | 1.92 | 1.80 | ||||||||||||
|
Diluted earnings per share
|
2.43 | 2.01 | 1.87 | 1.78 | ||||||||||||
|
2011
|
||||||||||||||||
|
Revenues
|
$ | 760,441 | $ | 820,317 | $ | 902,621 | $ | 995,801 | ||||||||
|
Gross profit
(1)
|
186,043 | 203,539 | 236,766 | 253,565 | ||||||||||||
|
Net income
|
62,077 | 74,243 | 91,851 | 94,282 | ||||||||||||
|
Basic earnings per share
|
1.22 | 1.45 | 1.79 | 1.84 | ||||||||||||
|
Diluted earnings per share
|
1.13 | 1.34 | 1.67 | 1.72 |
|
(1)
|
Represents "revenues" less "product costs" and "service and other costs" included in the Company's consolidated statements of income.
|
|
(2)
|
In the first quarter of 2012, we recorded a gain of $17.9 million, or $0.23 per diluted share after-tax, from a favorable contract settlement reported in our U.S. accommodations business.
|
|
(3)
|
In the second quarter of 2012, we recorded a pre-tax gain of $2.5 million, or $0.03 per diluted share after-tax, related to insurance proceeds received in excess of net book value from the constructive total loss of a drilling rig lost in a fire.
|
|
(4)
|
In the third quarter of 2012, we recorded out-of-period adjustments, which decreased revenues by $3.1 million and increased cost of sales by $4.4 million. The total adjustment of $7.5 million, or $0.10 per diluted share after tax, related to corrections of accruals for customer credits and related returned inventory due to accounting and reporting system design and implementation issues, along with other adjustments of cost accruals in our tubular services segment. After evaluating the quantitative and qualitative aspects of these corrections, management has determined that our previously issued quarterly and annual consolidated financial statements were not materially misstated and that the out-of-period adjustments are immaterial to our full year 2012 results and to our earnings’ trends.
|
Amounts are calculated independently for each of the quarters presented. Therefore, the sum of the quarterly amounts may not equal the total calculated for the year.
- 105 -
OIL STATES INTERNATIONAL, INC. AND SUBSIDIARIES
NOTES TO CONSOLIDATED FINANCIAL STATEMENTS
(Continued)
18. Condensed Consolidating Financial Information
Certain wholly-owned subsidiaries, as detailed below (the Guarantor Subsidiaries), have guaranteed all of the 6 1/2% Notes issued by Oil States International, Inc. in 2011 and all of the 5 1/8% Notes issued in 2012. These guarantees are full and unconditional, subject to the following release provisions:
|
·
|
in connection with any sale, exchange or transfer (by merger, consolidation or otherwise) of the capital stock of that guarantor after which that guarantor is no longer a restricted subsidiary;
|
|
·
|
upon proper designation of a guarantor by the Company as an unrestricted subsidiary;
|
|
·
|
upon the release or discharge of all outstanding guarantees by a guarantor of indebtedness of the Company and its restricted subsidiaries under any credit facility;
|
|
·
|
upon legal or covenant defeasance or satisfaction and discharge of the indenture; or
|
|
·
|
upon the dissolution of a guarantor, provided no event of default has occurred under the indentures and is continuing.
|
The following condensed consolidating financial information is included so that separate financial statements of the Guarantor Subsidiaries are not required to be filed with the Commission. The condensed consolidating financial information presents investments in both consolidated and unconsolidated affiliates using the equity method of accounting.
The following consolidating financial information presents: condensed consolidating statements of income for each of the years ended December 31, 2012, 2011 and 2010, condensed consolidating balance sheets as December 31, 2012 and December 31, 2011 and the statements of cash flows for each of the years ended December 31, 2012, 2011 and 2010 of (a) the Company, parent/guarantor,
(b) Acute Technological Services, Inc., Capstar Holding, L.L.C., Capstar Drilling, Inc., General Marine Leasing, L.L.C., Oil States Energy Services L.L.C., Oil States Energy Services Holding, Inc., Oil States Energy Services International Holding, L.L.C., Oil States Management, Inc., Oil States Industries, Inc., Oil States Skagit SMATCO, L.L.C., PTI Group USA L.L.C., PTI Mars Holdco 1, L.L.C., Sooner Inc., Sooner Pipe, L.L.C., Sooner Holding Company, Specialty Rental Tools & Supply, L.L.C., Stinger Wellhead Protection, Incorporated, Tempress Technologies, Inc. and Well Testing, Inc., (the Guarantor Subsidiaries), (c) the non-guarantor subsidiaries, (d) consolidating adjustments necessary to consolidate the Company and its subsidiaries and (e) the Company on a consolidated basis. As of January 1, 2012, Specialty Rental Tools & Supply, L.L.C., Stinger Wellhead Protection, Incorporated and Well Testing, Inc. were combined to form Oil States Energy Services L.L.C.
We have corrected the presentation of our condensed consolidating statements of income for the years ended December 31, 2011 and 2010, our condensed consolidating balance sheet as of December 31, 2011 and our statement of cash flows for years ended December 31, 2011 and 2010 to properly reflect the investment in and equity earnings of certain non-guarantor subsidiaries by certain guarantor subsidiaries in accordance with SEC Regulation S-X, which were previously only presented in the Parent/Guarantor column. We have also corrected other immaterial amounts previously disclosed to properly present (i) the activity and balances of a certain guarantor subsidiary in the Guarantor Subsidiaries column which was previously presented in the Parent/Guarantor column and (ii) the activity and balances of a certain non-guarantor subsidiary in the Non-Guarantors column which was previously presented in the Guarantor Subsidiaries column. The effect of these corrections increased net income for the Guarantor Subsidiaries and Non-Guarantor Subsidiaries by $158.6 million and $4.8 million, respectively, for year ended December 31, 2011 and increased the net income for the Guarantor Subsidiaries and Non-Guarantor Subsidiaries by $1.7 million and $1.0 million, respectively, for the year ended December 31, 2010. The effect of the correction to the Guarantor Subsidiaries’ investments in unconsolidated affiliates balance at December 31, 2011 was an increase of $1,034 million. These changes had no impact on consolidated results, as previously reported.
- 106 -
OIL STATES INTERNATIONAL, INC. AND SUBSIDIARIES
NOTES TO CONSOLIDATED FINANCIAL STATEMENTS
(Continued)
Condensed Consolidating Statements of Income and Comprehensive Income
|
Year Ended December 31, 2012
|
||||||||||||||||||||
|
Oil States
International,
|
Guarantor
Subsidiaries
|
Other
Subsidiaries
|
Consolidating
Adjustments
|
Consolidated Oil
States
|
||||||||||||||||
|
(In thousands)
|
||||||||||||||||||||
|
REVENUES
|
||||||||||||||||||||
|
Operating revenues
|
$
|
—
|
$
|
3,025,484
|
$
|
1,387,604
|
$
|
—
|
$
|
4,413,088
|
||||||||||
|
Intercompany revenues
|
—
|
27,567
|
16,846
|
(44,413)
|
—
|
|||||||||||||||
|
Total revenues
|
—
|
3,053,051
|
1,404,450
|
(44,413)
|
4,413,088
|
|||||||||||||||
|
OPERATING EXPENSES
|
||||||||||||||||||||
|
Cost of sales and services
|
—
|
2,523,929
|
776,386
|
(7,346)
|
3,292,969
|
|||||||||||||||
|
Intercompany cost of sales and services
|
—
|
20,148
|
15,326
|
(35,474)
|
—
|
|||||||||||||||
|
Selling, general and administrative expenses
|
1,772
|
131,828
|
70,051
|
—
|
203,651
|
|||||||||||||||
|
Depreciation and amortization expense
|
1,003
|
93,341
|
135,774
|
(20)
|
230,098
|
|||||||||||||||
|
Other operating (income)/expense
|
(289)
|
347
|
2,533
|
(1)
|
2,590
|
|||||||||||||||
|
Operating income (loss)
|
(2,486)
|
283,458
|
404,380
|
(1,572)
|
683,780
|
|||||||||||||||
|
Interest expense, net of capitalized interest
|
(62,712)
|
(884)
|
(72,818)
|
67,492
|
(68,922)
|
|||||||||||||||
|
Interest income
|
20,456
|
140
|
48,478
|
(67,491)
|
1,583
|
|||||||||||||||
|
Equity in earnings (loss) of unconsolidated affiliates
|
479,800
|
289,414
|
(419)
|
(768,552)
|
243
|
|||||||||||||||
|
Other income
|
—
|
9,902
|
309
|
—
|
10,211
|
|||||||||||||||
|
Income before income taxes
|
435,058
|
582,030
|
379,930
|
(770,123)
|
626,895
|
|||||||||||||||
|
Income tax provision
|
13,551
|
(100,845)
|
(89,753)
|
—
|
(177,047)
|
|||||||||||||||
|
Net income
|
448,609
|
481,185
|
290,177
|
(770,123)
|
449,848
|
|||||||||||||||
|
Other comprehensive income:
|
||||||||||||||||||||
|
Foreign currency translation adjustment
|
33,450
|
25,285
|
25,157
|
(50,442)
|
33,450
|
|||||||||||||||
|
Unrealized loss on forward contracts
|
—
|
(724)
|
—
|
—
|
(724)
|
|||||||||||||||
|
Total other comprehensive income
|
33,450
|
24,561
|
25,157
|
(50,442)
|
32,726
|
|||||||||||||||
|
Comprehensive income
|
482,059
|
505,746
|
315,334
|
(820,565)
|
482,574
|
|||||||||||||||
|
Comprehensive income attributable to noncontrolling interest
|
—
|
—
|
(1,318)
|
62
|
(1,256)
|
|||||||||||||||
|
Comprehensive income attributable to Oil States International, Inc.
|
$
|
482,059
|
$
|
505,746
|
$
|
314,016
|
$
|
(820,503)
|
$
|
481,318
|
||||||||||
- 107 -
OIL STATES INTERNATIONAL, INC. AND SUBSIDIARIES
NOTES TO CONSOLIDATED FINANCIAL STATEMENTS
(Continued)
Condensed Consolidating Statements of Income and Comprehensive Income
|
Year Ended December 31, 2011
|
||||||||||||||||||||
|
Oil States
International,
|
Guarantor
Subsidiaries
|
Other
Subsidiaries
|
Consolidating
Adjustments
|
Consolidated Oil
States
|
||||||||||||||||
|
(In thousands)
|
||||||||||||||||||||
|
REVENUES
|
||||||||||||||||||||
|
Operating revenues
|
$
|
—
|
$
|
2,428,651
|
$
|
1,050,529
|
$
|
—
|
$
|
3,479,180
|
||||||||||
|
Intercompany revenues
|
—
|
19,857
|
966
|
(20,823)
|
—
|
|||||||||||||||
|
Total revenues
|
—
|
2,448,508
|
1,051,495
|
(20,823)
|
3,479,180
|
|||||||||||||||
|
OPERATING EXPENSES
|
||||||||||||||||||||
|
Cost of sales and services
|
—
|
1,998,213
|
605,304
|
(4,250)
|
2,599,267
|
|||||||||||||||
|
Intercompany cost of sales and services
|
—
|
15,462
|
771
|
(16,233)
|
—
|
|||||||||||||||
|
Selling, general and administrative expenses
|
1,519
|
122,326
|
58,589
|
—
|
182,434
|
|||||||||||||||
|
Depreciation and amortization expense
|
800
|
81,479
|
105,881
|
(13)
|
188,147
|
|||||||||||||||
|
Other operating (income)/expense
|
742
|
134
|
931
|
2
|
1,809
|
|||||||||||||||
|
Operating income (loss)
|
(3,061)
|
230,894
|
280,019
|
(329)
|
507,523
|
|||||||||||||||
|
Interest expense, net of capitalized interest
|
(52,363)
|
(1,237)
|
(76,694)
|
72,788
|
(57,506)
|
|||||||||||||||
|
Interest income
|
15,252
|
38
|
59,197
|
(72,787)
|
1,700
|
|||||||||||||||
|
Equity in earnings (loss) of unconsolidated affiliates
|
357,135
|
198,704
|
(845)
|
(555,157)
|
(163)
|
|||||||||||||||
|
Other income
|
—
|
3,409
|
106
|
—
|
3,515
|
|||||||||||||||
|
Income before income taxes
|
316,963
|
431,808
|
261,783
|
(555,485)
|
455,069
|
|||||||||||||||
|
Income tax provision
|
5,490
|
(74,251)
|
(62,886)
|
—
|
(131,647)
|
|||||||||||||||
|
Net income
|
322,453
|
357,557
|
198,897
|
(555,485)
|
323,422
|
|||||||||||||||
|
Other comprehensive income:
|
||||||||||||||||||||
|
Foreign currency translation adjustment
|
(10,079)
|
7,049
|
(12,201)
|
5,152
|
(10,079)
|
|||||||||||||||
|
Other comprehensive loss
|
—
|
(99)
|
—
|
—
|
(99)
|
|||||||||||||||
|
Total other comprehensive income
|
(10,079)
|
6,950
|
(12,201)
|
5,152
|
(10,178)
|
|||||||||||||||
|
Comprehensive income
|
312,374
|
364,507
|
186,696
|
(550,333)
|
313,244
|
|||||||||||||||
|
Comprehensive income attributable to noncontrolling interest
|
—
|
—
|
(905)
|
(43)
|
(948)
|
|||||||||||||||
|
Comprehensive income attributable to Oil States International, Inc.
|
$
|
312,374
|
$
|
364,507
|
$
|
185,791
|
$
|
(550,376)
|
$
|
312,296
|
||||||||||
- 108 -
OIL STATES INTERNATIONAL, INC. AND SUBSIDIARIES
NOTES TO CONSOLIDATED FINANCIAL STATEMENTS
(Continued)
Condensed Consolidating Statements of Income and Comprehensive Income
|
Year Ended December 31, 2010
|
||||||||||||||||||||
|
Oil States
International,
|
Guarantor
Subsidiaries
|
Other
Subsidiaries
|
Consolidating
Adjustments
|
Consolidated Oil
States
|
||||||||||||||||
|
(In thousands)
|
||||||||||||||||||||
|
REVENUES
|
||||||||||||||||||||
|
Operating revenues
|
$
|
—
|
$
|
1,698,363
|
$
|
713,621
|
$
|
—
|
$
|
2,411,984
|
||||||||||
|
Intercompany revenues
|
—
|
28,359
|
930
|
(29,289)
|
—
|
|||||||||||||||
|
Total revenues
|
—
|
1,726,722
|
714,551
|
(29,289)
|
2,411,984
|
|||||||||||||||
|
OPERATING EXPENSES
|
||||||||||||||||||||
|
Cost of sales and services
|
—
|
1,433,931
|
447,885
|
(7,522)
|
1,874,294
|
|||||||||||||||
|
Intercompany cost of sales and services
|
—
|
21,294
|
473
|
(21,767)
|
—
|
|||||||||||||||
|
Selling, general and administrative expenses
|
1,142
|
113,355
|
36,368
|
—
|
150,865
|
|||||||||||||||
|
Depreciation and amortization expense
|
703
|
74,151
|
49,355
|
(7)
|
124,202
|
|||||||||||||||
|
Other operating (income)/expense
|
|
(102)
|
6,036
|
1,107
|
—
|
7,041
|
||||||||||||||
|
Operating income (loss)
|
(1,743)
|
77,955
|
179,363
|
7
|
255,582
|
|||||||||||||||
|
Interest expense, net of capitalized interest
|
(14,906)
|
(680)
|
(4,746)
|
4,058
|
(16,274)
|
|||||||||||||||
|
Interest income
|
471
|
57
|
4,282
|
(4,059)
|
751
|
|||||||||||||||
|
Equity in earnings (loss) of unconsolidated affiliates
|
167,114
|
31,054
|
(25)
|
(197,904)
|
239
|
|||||||||||||||
|
Other income
|
—
|
2,182
|
(1,852)
|
—
|
330
|
|||||||||||||||
|
Income before income taxes
|
150,936
|
110,568
|
177,022
|
(197,898)
|
240,628
|
|||||||||||||||
|
Income tax provision
|
17,082
|
(40,431)
|
(48,675)
|
1
|
(72,023)
|
|||||||||||||||
|
Net income
|
168,018
|
70,137
|
128,347
|
(197,897)
|
168,605
|
|||||||||||||||
|
Other comprehensive income:
|
||||||||||||||||||||
|
Foreign currency translation adjustment
|
40,274
|
30,112
|
30,126
|
(60,238)
|
40,274
|
|||||||||||||||
|
Other comprehensive loss
|
—
|
160
|
—
|
—
|
160
|
|||||||||||||||
|
Total other comprehensive income
|
40,274
|
30,272
|
30,126
|
(60,238)
|
40,434
|
|||||||||||||||
|
Comprehensive income
|
208,292
|
100,409
|
158,473
|
(258,135)
|
209,039
|
|||||||||||||||
|
Comprehensive income attributable to noncontrolling interest
|
—
|
—
|
(601)
|
(11)
|
(612)
|
|||||||||||||||
|
Comprehensive income attributable to Oil States International, Inc.
|
$
|
208,292
|
$
|
100,409
|
$
|
157,872
|
$
|
(258,146)
|
208,427
|
|||||||||||
- 109 -
OIL STATES INTERNATIONAL, INC. AND SUBSIDIARIES
NOTES TO CONSOLIDATED FINANCIAL STATEMENTS
(Continued)
Condensed Consolidating Balance Sheets
|
December 31, 2012
|
||||||||||||||||||||
|
Oil States
International,
|
Guarantor
Subsidiaries
|
Other
Subsidiaries
|
Consolidating
Adjustments
|
Consolidated Oil
States
|
||||||||||||||||
|
(In thousands)
|
||||||||||||||||||||
|
ASSETS
|
||||||||||||||||||||
|
Current assets:
|
||||||||||||||||||||
|
Cash and cash equivalents
|
$
|
3,222
|
$
|
57,205
|
$
|
192,745
|
$
|
—
|
$
|
253,172
|
||||||||||
|
Accounts receivable, net
|
431
|
486,975
|
345,379
|
—
|
832,785
|
|||||||||||||||
|
Inventories, net
|
—
|
583,002
|
118,494
|
—
|
701,496
|
|||||||||||||||
|
Prepaid expenses and other current assets
|
4,592
|
20,770
|
13,277
|
—
|
38,639
|
|||||||||||||||
|
Total current assets
|
8,245
|
1,147,952
|
669,895
|
—
|
1,826,092
|
|||||||||||||||
|
Property, plant and equipment, net
|
1,922
|
578,029
|
1,274,106
|
(1,931)
|
1,852,126
|
|||||||||||||||
|
Goodwill, net
|
—
|
221,610
|
299,208
|
—
|
520,818
|
|||||||||||||||
|
Other intangible assets, net
|
—
|
58,269
|
87,834
|
—
|
146,103
|
|||||||||||||||
|
Investments in unconsolidated affiliates
|
2,658,946
|
1,621,536
|
3,000
|
(4,273,768)
|
9,714
|
|||||||||||||||
|
Long-term intercompany receivables (payables)
|
855,354
|
(495,655)
|
(359,697)
|
(2)
|
—
|
|||||||||||||||
|
Other noncurrent assets
|
40,989
|
25,984
|
18,136
|
—
|
85,109
|
|||||||||||||||
|
Total assets
|
$
|
3,565,456
|
$
|
3,157,725
|
$
|
1,992,482
|
$
|
(4,275,701)
|
$
|
4,439,962
|
||||||||||
|
LIABILITIES AND EQUITY
|
||||||||||||||||||||
|
Current liabilities:
|
||||||||||||||||||||
|
Accounts payable
|
$
|
1,847
|
$
|
180,849
|
$
|
97,237
|
$
|
—
|
$
|
279,933
|
||||||||||
|
Accrued liabilities
|
17,147
|
53,494
|
37,267
|
(2)
|
107,906
|
|||||||||||||||
|
Income taxes
|
(95,930)
|
94,996
|
30,522
|
—
|
29,588
|
|||||||||||||||
|
Current portion of long-term debt and capitalized leases
|
20,022
|
314
|
10,144
|
—
|
30,480
|
|||||||||||||||
|
Deferred revenue
|
—
|
49,584
|
16,727
|
—
|
66,311
|
|||||||||||||||
|
Other current liabilities
|
—
|
4,027
|
287
|
—
|
4,314
|
|||||||||||||||
|
Total current liabilities
|
(56,914)
|
383,264
|
192,184
|
(2)
|
518,532
|
|||||||||||||||
|
Long-term debt and capitalized leases
|
1,150,024
|
6,203
|
123,578
|
—
|
1,279,805
|
|||||||||||||||
|
Deferred income taxes
|
(4,772)
|
80,481
|
53,526
|
—
|
129,235
|
|||||||||||||||
|
Other noncurrent liabilities
|
12,713
|
26,906
|
7,420
|
(449)
|
46,590
|
|||||||||||||||
|
Total liabilities
|
1,101,051
|
496,854
|
376,708
|
(451)
|
1,974,162
|
|||||||||||||||
|
Stockholders’ equity
|
2,464,405
|
2,660,871
|
1,614,526
|
(4,275,397)
|
2,464,405
|
|||||||||||||||
|
Non-controlling interest
|
—
|
—
|
1,248
|
147
|
1,395
|
|||||||||||||||
|
Total stockholders’ equity
|
2,464,405
|
2,660,871
|
1,615,774
|
(4,275,250)
|
2,465,800
|
|||||||||||||||
|
Total liabilities and stockholders’ equity
|
$
|
3,565,456
|
$
|
3,157,725
|
$
|
1,992,482
|
$
|
(4,275,701)
|
$
|
4,439,962
|
||||||||||
- 110 -
OIL STATES INTERNATIONAL, INC. AND SUBSIDIARIES
NOTES TO CONSOLIDATED FINANCIAL STATEMENTS
(Continued)
Condensed Consolidating Balance Sheets
|
December 31, 2011
|
||||||||||||||||||||
|
Oil States
International,
|
Guarantor
Subsidiaries
|
Other
Subsidiaries
|
Consolidating
Adjustments
|
Consolidated
Oil States
|
||||||||||||||||
|
(In thousands)
|
||||||||||||||||||||
|
ASSETS
|
||||||||||||||||||||
|
Current assets:
|
||||||||||||||||||||
|
Cash and cash equivalents
|
$
|
(295)
|
$
|
1,736
|
$
|
70,280
|
$
|
—
|
$
|
71,721
|
||||||||||
|
Accounts receivable, net
|
974
|
461,097
|
270,170
|
(1)
|
732,240
|
|||||||||||||||
|
Inventories, net
|
—
|
539,067
|
114,823
|
(192)
|
653,698
|
|||||||||||||||
|
Prepaid expenses and other current assets
|
10,143
|
8,538
|
13,319
|
—
|
32,000
|
|||||||||||||||
|
Total current assets
|
10,822
|
1,010,438
|
468,592
|
(193)
|
1,489,659
|
|||||||||||||||
|
Property, plant and equipment, net
|
1,530
|
459,414
|
1,096,310
|
(166)
|
1,557,088
|
|||||||||||||||
|
Goodwill, net
|
—
|
172,598
|
294,852
|
—
|
467,450
|
|||||||||||||||
|
Other intangible assets, net
|
—
|
31,372
|
96,230
|
—
|
127,602
|
|||||||||||||||
|
Investments in unconsolidated affiliates
|
2,088,062
|
1,269,457
|
1,710
|
(3,351,468)
|
7,761
|
|||||||||||||||
|
Long-term intercompany receivables (payables)
|
836,853
|
(453,156)
|
(383,697)
|
—
|
—
|
|||||||||||||||
|
Other noncurrent assets
|
41,235
|
457
|
12,389
|
—
|
54,081
|
|||||||||||||||
|
Total assets
|
$
|
2,978,502
|
$
|
2,490,580
|
$
|
1,586,386
|
$
|
(3,351,827)
|
$
|
3,703,641
|
||||||||||
|
LIABILITIES AND EQUITY
|
||||||||||||||||||||
|
Current liabilities:
|
||||||||||||||||||||
|
Accounts payable
|
$
|
19,418
|
$
|
162,762
|
$
|
70,029
|
$
|
—
|
$
|
252,209
|
||||||||||
|
Accrued liabilities
|
17,804
|
48,819
|
30,125
|
—
|
96,748
|
|||||||||||||||
|
Income taxes
|
(59,396)
|
61,060
|
8,731
|
—
|
10,395
|
|||||||||||||||
|
Current portion of long-term debt and capitalized leases
|
20,018
|
4,404
|
10,013
|
—
|
34,435
|
|||||||||||||||
|
Deferred revenue
|
—
|
47,227
|
28,270
|
—
|
75,497
|
|||||||||||||||
|
Other current liabilities
|
—
|
5,382
|
283
|
—
|
5,665
|
|||||||||||||||
|
Total current liabilities
|
(2,156)
|
329,654
|
147,451
|
—
|
474,949
|
|||||||||||||||
|
Long-term debt and capitalized leases
|
1,008,969
|
6,437
|
127,099
|
—
|
1,142,505
|
|||||||||||||||
|
Deferred income taxes
|
(1,072)
|
57,677
|
40,772
|
—
|
97,377
|
|||||||||||||||
|
Other noncurrent liabilities
|
10,605
|
8,635
|
6,747
|
(449)
|
25,538
|
|||||||||||||||
|
Total liabilities
|
1,016,346
|
402,403
|
322,069
|
(449)
|
1,740,369
|
|||||||||||||||
|
Stockholders’ equity
|
1,962,156
|
2,088,177
|
1,263,410
|
(3,351,587)
|
1,962,156
|
|||||||||||||||
|
Non-controlling interest
|
—
|
—
|
907
|
209
|
1,116
|
|||||||||||||||
|
Total stockholders’ equity
|
1,962,156
|
2,088,177
|
1,264,317
|
(3,351,378)
|
1,963,272
|
|||||||||||||||
|
Total liabilities and stockholders’ equity
|
$
|
2,978,502
|
$
|
2,490,580
|
$
|
1,586,386
|
$
|
(3,351,827)
|
$
|
3,703,641
|
||||||||||
- 111 -
OIL STATES INTERNATIONAL, INC. AND SUBSIDIARIES
NOTES TO CONSOLIDATED FINANCIAL STATEMENTS
(Continued)
Condensed Consolidating Statements of Cash Flows
|
Year Ended December 31, 2012
|
||||||||||||||||||||
|
Oil States
International,
|
Guarantor
Subsidiaries
|
Other
Subsidiaries
|
Consolidating
Adjustments
|
Consolidated Oil
States
|
||||||||||||||||
|
(In thousands)
|
||||||||||||||||||||
|
NET CASH PROVIDED BY (USED IN) OPERATING ACTIVITIES:
|
$
|
(185,138) |
$
|
397,711 |
$
|
437,316 |
$
|
(12,406)
|
$
|
637,483
|
||||||||||
|
CASH FLOWS FROM INVESTING ACTIVITIES:
|
||||||||||||||||||||
|
Capital expenditures, including capitalized interest
|
(1,367) | (202,336) | (286,017) |
1,783
|
(487,937)
|
|||||||||||||||
|
Acquisitions of businesses, net of cash acquired
|
—
|
(80,449) |
—
|
—
|
(80,449)
|
|||||||||||||||
|
Proceeds from dispositions of property, plant and equipment
|
—
|
8,887 | 5,766 |
—
|
14,653
|
|||||||||||||||
|
Deposits held in escrow related to acquisitions of businesses
|
—
|
(20,000) | — |
—
|
(20,000)
|
|||||||||||||||
|
Payments for equity contributions
|
(66,512) | (10,006) | — | 76,518 |
—
|
|||||||||||||||
|
Other, net
|
1
|
272 | (3,398) |
(119)
|
(3,244)
|
|||||||||||||||
|
Net cash provided by (used in) investing activities
|
(67,878) | (303,632) | (283,469) |
78,182
|
(576,977)
|
|||||||||||||||
|
CASH FLOWS FROM FINANCING ACTIVITIES:
|
||||||||||||||||||||
|
Revolving credit borrowings (repayments), net
|
(68,065) |
—
|
3,814 |
—
|
(64,251)
|
|||||||||||||||
|
Payment of principal on 2 3/8% Notes conversion
|
(174,990) |
—
|
—
|
—
|
(174,990)
|
|||||||||||||||
|
5 1/8 % senior notes issued
|
400,000 |
—
|
—
|
—
|
400,000
|
|||||||||||||||
|
Term loan borrowings (repayments)
|
(20,000) |
—
|
(10,047) |
—
|
(30,047)
|
|||||||||||||||
|
Debt and capital lease repayments
|
(19) | (4,407) | (143) |
—
|
(4,569)
|
|||||||||||||||
|
Issuance of common stock from share-based payment arrangements
|
13,628 |
—
|
—
|
—
|
13,628
|
|||||||||||||||
|
Purchase of treasury stock
|
(15,245) |
—
|
—
|
—
|
(15,245)
|
|||||||||||||||
|
Excess tax benefits from share-based payment arrangements
|
8,164 |
—
|
—
|
—
|
8,164
|
|||||||||||||||
|
Payment of financing costs
|
(4,472) |
—
|
(3,442) |
—
|
(7,914)
|
|||||||||||||||
|
Proceeds from (funding of) accounts and notes with affiliates, net
|
121,749 | (100,560) | (18,580) |
(2,609)
|
—
|
|||||||||||||||
|
Proceeds from equity contributions
|
— | 66,512 | 7,397 | (73,909) | — | |||||||||||||||
|
Payment of dividends
|
— | — | (10,741) | 10,741 | — | |||||||||||||||
|
Tax withholdings related to net share settlements of restricted stock
|
(4,218) |
—
|
—
|
—
|
(4,218)
|
|||||||||||||||
|
Other, net
|
1 |
—
|
(2) | 1 | — | |||||||||||||||
|
Net cash provided by (used in) financing activities
|
256,533 | (38,455) | (31,744) | (65,776) |
120,558
|
|||||||||||||||
|
Effect of exchange rate changes on cash
|
—
|
138 | 542 |
—
|
680
|
|||||||||||||||
|
Net change in cash and cash equivalents from continuing operations
|
3,517 | 55,762 | 122,465 |
—
|
181,744
|
|||||||||||||||
|
Net cash used in discontinued operations operating activities
|
—
|
(293) |
—
|
—
|
(293)
|
|||||||||||||||
|
Cash and cash equivalents, beginning of period
|
(295) | 1,736 | 70,280 |
—
|
71,721
|
|||||||||||||||
|
Cash and cash equivalents, end of period
|
$
|
3,222 |
$
|
57,205 |
$
|
192,745 |
$
|
—
|
$
|
253,172
|
||||||||||
- 112 -
OIL STATES INTERNATIONAL, INC. AND SUBSIDIARIES
NOTES TO CONSOLIDATED FINANCIAL STATEMENTS
(Continued)
Condensed Consolidating Statements of Cash Flows
|
Year Ended December 31, 2011
|
||||||||||||||||||||
|
Oil States
International,
|
Guarantor
Subsidiaries
|
Other
Subsidiaries
|
Consolidating
Adjustments
|
Consolidated Oil
States
|
||||||||||||||||
|
(In thousands)
|
||||||||||||||||||||
|
NET CASH PROVIDED BY (USED IN) OPERATING ACTIVITIES:
|
$
|
(78,624)
|
$
|
107,412
|
$
|
210,114
|
(22,989)
|
$
|
215,913
|
|||||||||||
|
CASH FLOWS FROM INVESTING ACTIVITIES:
|
||||||||||||||||||||
|
Capital expenditures, including capitalized interest
|
(361)
|
(138,923)
|
(348,308)
|
110
|
(487,482)
|
|||||||||||||||
|
Acquisitions of businesses, net of cash acquired
|
—
|
(2,412)
|
—
|
—
|
(2,412)
|
|||||||||||||||
|
Proceeds from dispositions of property, plant and equipment
|
—
|
2,339
|
3,610
|
—
|
5,949
|
|||||||||||||||
|
Payments for equity contributions
|
—
|
(6,787) |
—
|
6,787 |
—
|
|||||||||||||||
|
Other, net
|
—
|
(202)
|
(4,808)
|
—
|
(5,010)
|
|||||||||||||||
|
Net cash provided by (used in) investing activities
|
(361)
|
(145,985)
|
(349,506)
|
6,897
|
(488,955)
|
|||||||||||||||
|
CASH FLOWS FROM FINANCING ACTIVITIES:
|
||||||||||||||||||||
|
Revolving credit borrowings (repayments), net
|
(278,676)
|
—
|
(38,060)
|
—
|
(316,736)
|
|||||||||||||||
|
6 1/2 % senior notes issued
|
600,000
|
—
|
—
|
—
|
600,000
|
|||||||||||||||
|
Term loan borrowings (repayments)
|
(10,000)
|
—
|
(4,972)
|
—
|
(14,972)
|
|||||||||||||||
|
Debt and capital lease repayments
|
(19)
|
(455)
|
(2,055)
|
—
|
(2,529)
|
|||||||||||||||
|
Issuance of common stock from share-based payment arrangements
|
14,154
|
—
|
—
|
—
|
14,154
|
|||||||||||||||
|
Purchase of treasury stock
|
(12,632)
|
—
|
—
|
—
|
(12,632)
|
|||||||||||||||
|
Excess tax benefits from share-based payment arrangements
|
8,583
|
—
|
—
|
—
|
8,583
|
|||||||||||||||
|
Payment of financing costs
|
(13,205)
|
—
|
(259)
|
—
|
(13,464)
|
|||||||||||||||
|
Proceeds from (funding of) accounts and notes with affiliates, net
|
(226,576)
|
41,487
|
185,089
|
—
|
—
|
|||||||||||||||
|
Proceeds from equity contributions
|
—
|
—
|
6,787 | (6,787 | ) |
—
|
||||||||||||||
|
Payment of dividends
|
—
|
—
|
(22,879 | ) | 22,879 |
—
|
||||||||||||||
|
Tax withholdings related to net share settlements of restricted stock
|
(2,702)
|
—
|
—
|
—
|
(2,702)
|
|||||||||||||||
|
Other, net
|
(10)
|
(1,805)
|
1
|
—
|
(1,814)
|
|||||||||||||||
|
Net cash provided by (used in) financing activities
|
78,917
|
39,227
|
123,652
|
16,092
|
257,888
|
|||||||||||||||
|
Effect of exchange rate changes on cash
|
—
|
9
|
(9,341)
|
—
|
(9,332)
|
|||||||||||||||
|
Net change in cash and cash equivalents from continuing operations
|
(68)
|
663
|
(25,081)
|
—
|
(24,486)
|
|||||||||||||||
|
Net cash used in discontinued operations operating activities
|
—
|
(143)
|
—
|
—
|
(143)
|
|||||||||||||||
|
Cash and cash equivalents, beginning of period
|
(227)
|
1,216
|
95,361
|
—
|
96,350
|
|||||||||||||||
|
Cash and cash equivalents, end of period
|
$
|
(295)
|
$
|
1,736
|
$
|
70,280
|
|
—
|
$
|
71,721
|
||||||||||
- 113 -
OIL STATES INTERNATIONAL, INC. AND SUBSIDIARIES
NOTES TO CONSOLIDATED FINANCIAL STATEMENTS
(Continued)
Condensed Consolidating Statements of Cash Flows
|
Year Ended December 31, 2010
|
||||||||||||||||||||
|
Oil States
International,
|
Guarantor
Subsidiaries
|
Other
Subsidiaries
|
Consolidating
Adjustments
|
Consolidated Oil
States
|
||||||||||||||||
|
(In thousands)
|
||||||||||||||||||||
|
NET CASH PROVIDED BY (USED IN) OPERATING ACTIVITIES:
|
$
|
(38,152)
|
$
|
92,422
|
$
|
176,652
|
—
|
$
|
230,922
|
|||||||||||
|
CASH FLOWS FROM INVESTING ACTIVITIES:
|
||||||||||||||||||||
|
Capital expenditures, including capitalized interest
|
(490)
|
(68,249)
|
(113,468)
|
—
|
(182,207)
|
|||||||||||||||
|
Acquisition of businesses, net of cash acquired
|
—
|
(71,992)
|
(637,583)
|
—
|
(709,575)
|
|||||||||||||||
|
Proceeds from dispositions of property, plant and equipment
|
—
|
2,260
|
474
|
—
|
2,734
|
|||||||||||||||
|
Payments for equity contributions
|
(283,749) | (280,911) |
—
|
564,660 |
—
|
|||||||||||||||
|
Other, net
|
—
|
(28)
|
(604)
|
—
|
(632)
|
|||||||||||||||
|
Net cash provided by (used in) investing activities
|
(284,239)
|
(418,920)
|
(751,181)
|
564,660
|
(889,680)
|
|||||||||||||||
|
CASH FLOWS FROM FINANCING ACTIVITIES:
|
||||||||||||||||||||
|
Revolving credit borrowings (repayments), net
|
346,742
|
—
|
387
|
—
|
347,129
|
|||||||||||||||
|
Term loan borrowings
|
200,000
|
—
|
100,955
|
—
|
300,955
|
|||||||||||||||
|
Debt and capital lease payments
|
(30)
|
(403)
|
(54)
|
—
|
(487)
|
|||||||||||||||
|
Issuance of common stock from share-based payment arrangements
|
23,361
|
—
|
—
|
—
|
23,361
|
|||||||||||||||
|
Excess tax benefits from share-based payment arrangements
|
4,029
|
—
|
—
|
—
|
4,029
|
|||||||||||||||
|
Payment of financings costs
|
(24,548)
|
—
|
—
|
—
|
(24,548)
|
|||||||||||||||
|
Proceeds from (funding of) accounts and notes with affiliates, net
|
(233,044)
|
47,116
|
185,928
|
—
|
—
|
|||||||||||||||
|
Proceeds from equity contributions
|
—
|
280,911 | 283,749 |
(564,660)
|
—
|
|||||||||||||||
|
Tax withholdings related to net share settlements of restricted stock
|
(1,406)
|
—
|
—
|
—
|
(1,406)
|
|||||||||||||||
|
Other, net
|
(1)
|
—
|
—
|
—
|
(1)
|
|||||||||||||||
|
Net cash provided by (used in) financing activities
|
315,103
|
327,624
|
570,965
|
(564,660)
|
649,032
|
|||||||||||||||
|
Effect of exchange rate changes on cash
|
—
|
(2)
|
16,479
|
—
|
16,477
|
|||||||||||||||
|
Net change in cash and cash equivalents from continuing operations
|
(7,288)
|
1,124
|
12,915
|
—
|
6,751
|
|||||||||||||||
|
Net cash used in discontinued operations operating activities
|
—
|
(143)
|
—
|
—
|
(143)
|
|||||||||||||||
|
Cash and cash equivalents, beginning of period
|
7,061
|
235
|
82,446
|
—
|
89,742
|
|||||||||||||||
|
Cash and cash equivalents, end of period
|
$
|
(227)
|
$
|
1,216
|
$
|
95,361
|
—
|
$
|
96,350
|
|||||||||||
- 114 -
TABLE OF CONTENTS
Part IItem 1. BusinessItem 1A. Risk FactorsItem 1B. Unresolved Staff CommentsItem 2. PropertiesItem 3. Legal ProceedingsItem 4. Mine Safety DisclosuresPart IIItem 5. Market For Registrant's Common Equity, Related Stockholder Matters and Issuer Purchases Of Equity SecuritiesItem 6. Selected Financial DataItem 7. Management S Discussion and Analysis Of Financial Condition and Results Of OperationsItem 7A. Quantitative and Qualitative Disclosures About Market RiskItem 8. Financial Statements and Supplementary DataItem 9. Changes in and Disagreements with Accountants on Accounting and Financial DisclosureItem 9A. Controls and ProceduresItem 9B. Other InformationPart IIIItem 10. Directors, Executive Officers and Corporate GovernanceItem 11. Executive CompensationItem 12. Security Ownership Of Certain Beneficial Owners and Management and Related Stockholder MattersItem 13. Certain Relationships and Related Transactions, and Director IndependenceItem 14. Principal Accounting Fees and ServicesPart IVItem 15. Exhibits, Financial Statement Schedules