OIL STATES INTERNATIONAL, INC
10-Ks and 10-Qs
|
|
|
|
|
|
|
|
|
|
|
|
|
|
|
|
|
|
|
|
|
|
|
|
|
|
|
|
|
|
|
|
|
|
|
|
|
|
|
|
|
|
|
|
|
|
|
|
|
|
|
|
|
|
|
|
UNITED STATES
SECURITIES AND EXCHANGE COMMISSION
Washington, D.C. 20549
____________________
Form 10-K
____________________
|
[X]
|
ANNUAL REPORT PURSUANT TO SECTION 13 OR 15(d) OF THE SECURITIES EXCHANGE ACT OF 1934
|
For the fiscal year ended
December 31, 2018
or
|
[ ]
|
TRANSITION REPORT PURSUANT TO SECTION 13 OR 15(d) OF
THE SECURITIES EXCHANGE ACT OF 1934
|
For the transition period from _____ to _____
Commission file no. 001-16337
Oil States International, Inc.
(Exact name of registrant as specified in its charter)
|
Delaware
|
76-0476605
|
|
(State or other jurisdiction of
|
(I.R.S. Employer
|
|
incorporation or organization)
|
Identification No.)
|
Three Allen Center, 333 Clay Street, Suite 4620, Houston, Texas 77002
(Address of principal executive offices
and zip code)
Registrant's telephone number, including area code is (713) 652-0582
Securities registered pursuant to Section 12(b) of the Act:
|
Title of Each Class
|
Name of Exchange on Which Registered
|
|
Common Stock, par value $.01 per share
|
New York Stock Exchange
|
Securities registered pursuant to Section 12(g) of the Act: None
Indicate by check mark if the registrant is a well-known seasoned issuer, as defined in Rule 405 of the Securities Act. Yes [X] No [ ]
Indicate by check mark if the registrant is not required to file reports pursuant to Section 13 or Section 15(d) of the Act. Yes [ ] No [X]
Indicate by check mark whether the registrant (1) has filed all reports required to be filed by Section 13 or 15(d) of the Securities Exchange Act of 1934 during the preceding 12 months (or for such shorter period that the registrant was required to file such reports), and (2) has been subject to such filing requirements for the past 90 days. Yes [X] No [ ]
Indicate by check mark whether the registrant has submitted electronically every Interactive Data File required to be submitted pursuant to Rule 405 of Regulation S-T (§232.405 of this chapter) during the preceding 12 months (or for such shorter period that the registrant was required to submit such files.) Yes [X] No [ ]
Indicate by check mark if disclosure of delinquent filers pursuant to Item 405 of Regulation S-K (§229.405 of this chapter) is not contained herein, and will not be contained, to the best of registrant's knowledge, in definitive proxy or information statements incorporated by reference in Part III of this Form 10‑K or any amendment to this Form 10‑K. [ ]
Indicate by check mark whether the registrant is a large accelerated filer, an accelerated filer, a non-accelerated filer, or a smaller reporting company. See the definitions of "large accelerated filer," "accelerated filer" and "smaller reporting company" in Rule 12b-2 of the Exchange Act.
|
Large accelerated filer
|
[X]
|
Accelerated filer
|
[ ]
|
|
|
|
|
|
|
|
|
Non-accelerated filer
|
[ ]
|
|
Smaller reporting company
|
[ ]
|
|
Emerging growth company
|
[ ]
|
|||
If an emerging growth company, indicate by check mark if the registrant has elected not to use the extended transition period for complying with any new or revised financial accounting standards provided pursuant to Section 13(a) of the Exchange Act. [ ]
Indicate by check mark whether the Registrant is a shell company (as defined in Rule 12b-2 of the Act). Yes [ ] No [X]
As of June 30, 2018, the aggregate market value of the voting and non-voting common stock of the registrant held by non-affiliates of the registrant was
$1,899,035,183
.
As of
February 18, 2019
, the number of shares of common stock outstanding was
60,498,465
.
DOCUMENTS INCORPORATED BY REFERENCE
Portions of the registrant's Definitive Proxy Statement for the
2019
Annual Meeting of Stockholders, which the registrant intends to file with the Securities and Exchange Commission not later than 120 days after the end of the fiscal year covered by this Annual Report on Form 10‑K, are incorporated by reference into Part III of this Annual Report on Form 10‑K.
-
1
-
TABLE OF CONTENTS
|
Page
|
|||
|
PART I
|
|||
|
Cautionary Statement Regarding Forward-Looking Statements
|
|||
|
Item 1.
|
Business
|
||
|
Item 1A.
|
Risk Factors
|
||
|
Item 1B.
|
Unresolved Staff Comments
|
||
|
Item 2.
|
Properties
|
||
|
Item 3.
|
Legal Proceedings
|
||
|
Item 4.
|
Mine Safety Disclosures
|
||
|
|
|
|
|
|
PART II
|
|
||
|
Item 5.
|
Market for Registrant's Common Equity, Related Stockholder Matters and Issuer Purchases of Equity Securities
|
||
|
Item 6.
|
Selected Financial Data
|
||
|
Item 7.
|
Management's Discussion and Analysis of Financial Condition and Results of Operations
|
||
|
Item 7A.
|
Quantitative and Qualitative Disclosures About Market Risk
|
||
|
Item 8.
|
Financial Statements and Supplementary Data
|
||
|
Item 9.
|
Changes in and Disagreements With Accountants on Accounting and Financial Disclosure
|
||
|
Item 9A.
|
Controls and Procedures
|
||
|
Item 9B.
|
Other Information
|
||
|
|
|
||
|
PART III
|
|
||
|
Item 10.
|
Directors, Executive Officers and Corporate Governance
|
||
|
Item 11.
|
Executive Compensation
|
||
|
Item 12.
|
Security Ownership of Certain Beneficial Owners and Management and Related Stockholder Matters
|
||
|
Item 13.
|
Certain Relationships and Related Transactions, and Director Independence
|
||
|
Item 14.
|
Principal Accounting Fees and Services
|
||
|
|
|
||
|
PART IV
|
|
||
|
Item 15.
|
Exhibits, Financial Statement Schedules
|
||
|
SIGNATURES
|
|||
|
INDEX TO CONSOLIDATED FINANCIAL STATEMENTS
|
|||
-
2
-
PART I
Cautionary Statement Regarding Forward-Looking Statements
This Annual Report on Form 10-K
and other statements we make
contain certain “forward-looking statements” within the meaning of Section 27A of the Securities Act of 1933
(the
“Securities Act”) and Section 21E of the Securities Exchange Act of 1934 (the
“Exchange Act”). Actual results could differ materially from those projected in the forward-looking statements as a result of a number of important factors, including incorrect or changed assumptions. For a discussion of known material factors that could affect our results, please refer to “Part I, Item 1. Business,” “Part I, Item 1A. Risk Factors,” “Part II, Item 7. Management's Discussion and Analysis of Financial Condition and Results of Operations” and “Part II, Item 7A. Quantitative and Qualitative Disclosures about Market Risk” below.
You can typically identify "forward-looking statements" by the use of forward-looking words such as "may," "will," "could," "project," "believe," "anticipate," "expect," "estimate," "potential," "plan," "forecast," "proposed," "should," "seek," and other similar words. Such statements may relate to our future financial position, budgets, capital expenditures, projected costs, plans and objectives of management for future operations and possible future strategic transactions. Actual results frequently differ from assumed facts and such differences can be material, depending upon the circumstances.
While we believe we are providing forward-looking statements expressed in good faith and on a reasonable basis, there can be no assurance that actual results will not differ from such forward looking statements. The following are important factors that could cause actual results to differ materially from those expressed in any forward-looking statement made by, or on behalf of, our Company:
|
•
|
the level of supply of and demand for oil and natural gas;
|
|
•
|
fluctuations in the current and future prices of oil and natural gas;
|
|
•
|
the cyclical nature of the oil and natural gas industry;
|
|
•
|
the level of exploration, drilling and completion activity;
|
|
•
|
the financial health of our customers;
|
|
•
|
the impact on certain major U.S. areas in which we operate of pipeline take away capacity constraints;
|
|
•
|
the availability of and access to attractive oil and natural gas field prospects, which may be affected by governmental actions or actions of other parties which may restrict drilling and completion activities;
|
|
•
|
the level of offshore oil and natural gas developmental activities;
|
|
•
|
general global economic conditions;
|
|
•
|
the ability of the Organization of Petroleum Exporting Countries ("OPEC") to set and maintain production levels and pricing;
|
|
•
|
global weather conditions and natural disasters;
|
|
•
|
changes in tax laws and regulations;
|
|
•
|
the impact of tariffs and duties on imported raw materials and exported finished goods;
|
|
•
|
impact of environmental matters, including future environmental or climate change regulations which may result in increased operating costs or reduced commodity demand globally;
|
|
•
|
our ability to find and retain skilled personnel;
|
|
•
|
negative outcome of litigation, threatened litigation or government proceedings;
|
|
•
|
fluctuations in currency exchange rates;
|
|
•
|
physical, digital, cyber, internal and external security breaches;
|
|
•
|
the availability and cost of capital;
|
|
•
|
our ability to complete the integration of acquired businesses and achieve the expected accretion in earnings; and
|
|
•
|
the other factors identified in "Part I, Item 1A. Risk Factors."
|
Should one or more of these risks or uncertainties materialize, or should the assumptions on which our forward-looking statements are based prove incorrect or change, actual results may differ materially from those expected, estimated or projected. In addition, the factors identified above may not necessarily be all of the important factors that could cause actual results to differ materially from those expressed in any forward-looking statement made by us, or on our behalf. Readers are cautioned not to place undue reliance on forward-looking statements, which speak only as of the date hereof. We undertake no responsibility to publicly release the result of any revision of our forward-looking statements after the date they are made.
In addition, in certain places in this Annual Report on Form 10-K, we refer to information and reports published by third parties that purport to describe trends or developments in the energy industry. The Company does so for the convenience of our stockholders and in an effort to provide information available in the market that will assist the Company’s investors in better understanding the market environment in which the Company operates. However, the Company specifically disclaims any responsibility for the accuracy and completeness of such information and undertakes no obligation to update such information.
-
3
-
Item 1.
Business
Our Company
Oil States International, Inc., through its subsidiaries, is a global oilfield products and services company serving the drilling, completion, subsea, production and infrastructure sectors of the oil and gas industry. Our manufactured products include highly engineered capital equipment as well as products consumed in the drilling, well construction and production of oil and gas. Through our acquisition of GEODynamics, Inc. ("GEODynamics"), we are a leading researcher, developer and manufacturer of engineered solutions to connect the wellbore with the formation in oil and gas well completions. Oil States is headquartered in Houston, Texas with manufacturing and service facilities strategically located across the globe. Our customers include many national oil and natural gas companies, major and independent oil and natural gas companies, onshore and offshore drilling companies and other oilfield service companies. We operate through three business segments – Well Site Services, Downhole Technologies and Offshore/Manufactured Products – and maintain a leadership position with certain of our product and service offerings in each segment. In this Annual Report on Form 10‑K, references to the "Company" or "Oil States" or to "we," "us," "our," and similar terms are to Oil States International, Inc. and its consolidated subsidiaries.
Available Information
The Company’s Internet website is
www.oilstatesintl.com
. The Company makes available, free of charge through its website, its Annual Report on Form 10‑K, Quarterly Reports on Form 10‑Q, Current Reports on Form 8‑K, its proxy statement, Forms 3, 4 and 5 filed on behalf of directors and executive officers, and amendments to these reports, as soon as reasonably practicable after the Company electronically files such material with, or furnishes such material to, the Securities and Exchange Commission (the "SEC"). The Company is not including the information contained on the Company's website or any other website as a part of, or incorporating it by reference into, this Annual Report on Form 10‑K or any other filing the Company makes with the SEC. The filings are also available through the SEC at the SEC's Public Reference Room at 100 F Street, N.E., Washington, D.C. 20549 or by calling 1-800-SEC-0330. Additionally, these filings are available on the Internet at
www.sec.gov
. The Board of Directors of the Company (the "Board") has documented its governance practices by adopting several corporate governance policies. These governance policies, including the Company's Corporate Governance Guidelines, Corporate Code of Business Conduct and Ethics and Financial Code of Ethics for Senior Officers, as well as the charters for the committees of the Board (Audit Committee, Compensation Committee and Nominating & Corporate Governance Committee) may also be viewed at the Company's website. The financial code of ethics applies to our principal executive officer, principal financial officer, principal accounting officer and other senior officers. Copies of such documents will be provided to stockholders without charge upon written request to the corporate secretary at the address shown on the cover page of this Annual Report on Form 10‑K.
Our Business Strategy
We have historically grown our product and service offerings organically, through capital spending, and also through strategic acquisitions. Our investments are focused in growth areas and on areas where we expect to be able to expand market share through technology and where we believe we can achieve an attractive return on our investment. As part of our long-term strategy, we continue to review complementary acquisitions, invest in research and development and make organic capital expenditures to enhance our cash flows, leverage our cost structure and increase our stockholders’ returns. For additional discussion of our business strategy, please read "Part II, Item 7. Management’s Discussion and Analysis of Financial Condition and Results of Operations."
Recent Developments
In addition to capital spending, we have invested in acquisitions of businesses complementary to our growth strategy. Our acquisition strategy has allowed us to leverage our existing and acquired products and services into new geographic locations and has expanded the breadth of our technology and product offerings while allowing us to leverage our cost structure. We have made strategic and complementary acquisitions in each of our business segments in recent years.
On December 12, 2017 we entered into an agreement to acquire GEODynamics, which provides oil and gas perforation systems and downhole tools in support of completion, intervention, wireline and well abandonment operations. On January 12, 2018, we closed the acquisition of GEODynamics for total consideration of approximately $615 million (the "GEODynamics Acquisition"), consisting of (i) $295 million in cash (net of cash acquired), (ii) approximately 8.66 million shares of our common stock and (iii) an unsecured $25 million promissory note.
In connection with the GEODynamics Acquisition, we completed several financing transactions to extend the maturity of our debt, while also providing us with the flexibility to repay outstanding borrowings under our revolving credit facility with anticipated future cash flows from operations.
-
4
-
On January 30, 2018, we sold $200 million aggregate principal amount of our 1.50% convertible senior notes due 2023 (the "Notes") through a private placement to qualified institutional buyers. We received net proceeds from the offering of the Notes of approximately $194 million, after deducting issuance costs. We used the net proceeds to repay a portion of the borrowings outstanding under our revolving credit facility (the "Revolving Credit Facility"), substantially all of which were drawn to fund the cash portion of the purchase price paid for GEODynamics.
Concurrently with the Notes offering, we amended our Revolving Credit Facility (the "Amended Revolving Credit Facility") to extend the maturity date to January 2022, permit the issuance of the Notes and provide for up to $350 million in borrowing capacity.
On February 28, 2018, we acquired Falcon Flowback Services, LLC ("Falcon"), a full service provider of flowback and well testing services for the separation and recovery of fluids, solid debris and proppant used during hydraulic fracturing operations. Falcon provides additional scale and diversity to our Completion Services operations in key shale plays in the United States. The acquisition price was $84.2 million in cash. The Falcon acquisition was funded with borrowings under our Amended Revolving Credit Facility.
See Note
5
, "Business Acquisitions" and Note
7
, "Long-term Debt" to the Consolidated Financial Statements included in this Annual Report on Form 10‑K for further discussion of these acquisitions and financing transactions.
Our Industry
We principally operate in the oilfield services industry and provide a broad range of products and services to our customers through each of our business segments. See Note
14
, "Segments and Related Information," to the Consolidated Financial Statements included in “Part II, Item 8. Financial Statements and Supplementary Data” for financial information by segment along with a geographical breakout of revenues and long-lived assets for each of the three years in the period ended
December 31, 2018
. Demand for our products and services is cyclical and substantially dependent upon activity levels in the oil and natural gas industry, particularly our customers' willingness to invest capital on the exploration for and development of crude oil and natural gas reserves. Our customers’ capital spending programs are generally based on their outlook for near-term and long-term commodity prices, economic growth, commodity demand and estimates of resource production. As a result, demand for our products and services is largely sensitive to expectations with respect to future crude oil and natural gas prices.
Our consolidated results of operations in 2018 include contributions from the GEODynamics and Falcon acquisitions completed in the first quarter of 2018 and reflect the impact of industry trends and customer spending activities, which were directed toward growth in the U.S. shale play regions with a general slowing of investments in deepwater markets globally since the start of a prolonged industry downturn in 2014.
Our historical financial results reflect the cyclical nature of the oilfield services industry – witnessed by periods of increasing and decreasing activity in each of our operating segments. The severe industry downturn that started in the second half of 2014 continued into 2017. This prolonged industry downturn has been characterized by materially reduced capital investments made by our customers, lower rig counts, lower completion activity, lower crude oil prices and other negative industry events. The industry decline was very rapid in the U.S. shale plays given the general lack of long-term contracts or backlog in these regions of operations. The U.S. rig count declined 79% from the peak in 2014 before bottoming in May of 2016. While the average U.S. rig count increased by
18%
in 2018 from the 2017 average, activity levels in 2017 and 2018 were still well below 2014 levels. This significant activity decline had a material negative effect on the results of our Well Site Services segment before activities began to recover in the second half of 2017 and 2018. Our Offshore/Manufactured Products segment was also negatively impacted by the industry downturn but our results of operations declined at a slower pace given higher levels of backlog that existed at the beginning of 2014. Despite an initially slower decline in revenues and operating income when compared to our Well Site Services segment, our Offshore/Manufactured Products backlog declined materially from 2014 to 2018. This negatively impacted our results, particularly those tied to major deepwater projects. During the fourth quarter of 2018, the price of crude oil fell approximately 40% – with West Texas Intermediate crude oil closing at $45 per barrel on December 28, 2018. This precipitous decline in crude oil prices had a moderately negative impact on our fourth quarter 2018 consolidated results of operations, particularly those tied to activity in the U.S. shale play regions. We expect further customer-driven activity declines in early 2019 as customers reassess their budgets and plans in light of lower commodity prices. If the current pricing environment for crude oil does not improve or declines further, our customers may be required to further reduce their capital expenditures. This may cause additional declines in the demand for, and prices of, our products and services, which would adversely affect our future results of operations, cash flows and financial position. For additional information about activities in each of our segments, see "Part II, Item 7. Management’s Discussion and Analysis of Financial Condition and Results of Operations."
-
5
-
Our Well Site Services segment is primarily affected by drilling and completion activity in the United States, including the Gulf of Mexico, and, to a lesser extent, Canada and the rest of the world. U.S. drilling and completion activity and, in turn, our Well Site Services results, are particularly sensitive to near-term fluctuations in commodity prices given the call-out nature of our operations in the segment. While there have been notable improvements in recent quarters, our Well Site Services segment continues to be negatively affected by the material decline in crude oil prices from the levels seen in 2014.
Similar to our Well Site Services segment, demand for our Downhole Technologies segment products is predominantly tied to the level of oil and natural gas exploration and production activity on land in the United States. The primary driver for this activity is the price of crude oil and, to a lesser extent, natural gas. Activity levels have been, and we expect will continue to be, highly correlated with hydrocarbon commodity prices. Over recent years, our industry experienced increased customer spending in crude oil and liquids-rich exploration and development in the North American shale plays utilizing horizontal drilling and completion techniques. According to rig count data published by Baker Hughes, a GE company ("Baker Hughes"), the U.S. oil rig count peaked in October 2014 at 1,609 rigs but has declined materially since late 2014 due to much lower crude oil prices, totaling
885
rigs as of
December 31, 2018
(with the U.S. oil rig count having troughed at 316 rigs in May 2016, which was the lowest oil rig count during this current cyclical downturn). As of December 31, 2018, oil-directed drilling accounted for
82%
of the total U.S. rig count – with the balance being natural gas related. The total U.S. rig count has increased
679
rigs, or
168%
, since troughing in May of 2016, largely due to improved crude oil prices, decreased service costs and enhanced technologies applied in the shale play regions of the United States.
Demand for the products and services supplied by our Offshore/Manufactured Products segment is generally driven by both the longer-term outlook for commodity prices and changes in land-based drilling and completion activity. During 2013 and 2014, we benefited from high crude oil prices resulting in very active bidding and quoting activity for our Offshore/Manufactured Products segment. However, the decline in crude oil prices that began in 2014 and continued into 2017, coupled with the relatively uncertain outlook around shorter-term and possibly longer-term commodity price improvements, have caused exploration and production companies to reevaluate their future capital expenditures in regards to deepwater projects since they are expensive to drill and complete, have long lead times to first production and may be considered uneconomical relative to the risk involved. Bidding and quoting activity for our Offshore/Manufactured Products segment continued after 2014, albeit at a substantially slower pace in the years following 2014. However, deepwater project award potential appears to be improving despite the current commodity price environment.
See "Part II, Item 7. Management’s Discussion and Analysis of Financial Condition and Results of Operations – Macroeconomic Environment" for further discussion on our industry.
Well Site Services
Overview
For the years ended December 31, 2018, 2017 and 2016, our Well Site Services segment generated approximately
44%
, 43% and 27%, respectively, of our consolidated revenue. Our Well Site Services segment includes a broad range of equipment and services that are used to drill for, establish and maintain the flow of oil and natural gas from a well throughout its life cycle. In this segment, our operations primarily include completion-focused equipment and services as well as land drilling services. We use our fleet of completion tools and drilling rigs to serve our customers at well sites and project development locations. Our equipment and services are used in both onshore and offshore applications throughout the drilling, completion and production phases of a well's life cycle.
Well Site Services Market
Demand for our completion and drilling services is predominantly tied to the level of oil and natural gas exploration and production activity on land in the United States. The primary driver for this activity is the price of crude oil and, to a lesser extent, natural gas. Activity levels have been, and we expect will continue to be, highly correlated with hydrocarbon commodity prices.
Completion Services
Our Completion Services operations includes the complementary Falcon business we acquired on February 28, 2018. The combined business, which is primarily marketed through the brand names Oil States Energy Services, Falcon and Tempress, provides a wide range of services used in the onshore and offshore oil and gas industry, including:
|
•
|
wellhead isolation services;
|
|
•
|
flowback and frac valve services;
|
|
•
|
wireline and coiled tubing support services;
|
-
6
-
|
•
|
well testing, including separators and line heaters;
|
|
•
|
downhole extended-reach technology;
|
|
•
|
pipe recovery systems;
|
|
•
|
thru-tubing milling and fishing services;
|
|
•
|
hydraulic chokes and manifolds;
|
|
•
|
blowout preventers;
|
|
•
|
gravel pack and sand control operations on well bores; and
|
|
•
|
ball launching services.
|
Employees in our Completion Services business typically rig up and operate our equipment on the well site for our customers. Our Completion Services equipment is primarily used during the completion and production stages of a well. As of
December 31, 2018
, we provided completion services through approximately 45 distribution locations serving our customers in the United States, including the Gulf of Mexico, Canada and other international markets. We typically provide our services and equipment based on daily rates which vary depending on the type of equipment and the length of the job. Billings to our customers typically separate charges for our equipment from charges for our field technicians. We own patents or have patents pending covering some of our technology, particularly in our wellhead isolation equipment and downhole extended-reach technology product lines. Our customers in the Completion Services business include major, independent and private oil and gas companies and other large oilfield service companies. No customer in this segment represented more than 10% of our total consolidated revenue in any period presented. Competition in the Completion Services business is widespread and includes many smaller companies, although we also compete with the larger oilfield service companies for certain equipment and services.
Drilling Services
Our Drilling Services business, which is marketed under the brand name Capstar Drilling, provides land drilling services in the United States for shallow to medium depth wells generally of less than 15,000 feet. We serve two primary markets with our Drilling Services business: the Permian Basin in West Texas and the Rocky Mountain region. Drilling services are typically used during the exploration and development stages of a field. As of
December 31, 2018
, we had thirty-four drilling rigs with hydraulic pipe handling booms and lift capacities ranging from 150,000 to 500,000 pounds. Twenty-four are based in the Permian Basin and ten are based in the Rocky Mountain region, although a majority of these rigs are currently stacked. Utilization of our drilling rigs averaged
30%
, 29% and 12% in 2018, 2017 and 2016, respectively. Utilization improvement over this period was largely due to higher crude oil prices but has been tempered due to a shift by our customers towards newer, larger and higher horsepower rigs needed to drill extended depths and horizontal wells. We believe commodity prices should improve over the longer-term but there will be fewer wells in our depth range which could influence overall utilization of our drilling rigs.
We market our Drilling Services directly to a diverse customer base, consisting primarily of independent and private oil and gas companies. We contract on both a footage and a dayrate basis. Under a footage drilling contract, we assume responsibility for certain costs (such as bits and fuel) and assume more risk (such as the time necessary to drill) than we would on a daywork contract. Depending on market conditions and availability of drilling rigs, we see changes in pricing, utilization and contract terms. The land drilling service business is highly fragmented, and our competition consists of a small number of larger companies and many smaller companies. Our Permian Basin drilling activities primarily target oil reservoirs while our Rocky Mountain drilling activities target oil, liquids-rich and natural gas reservoirs.
Downhole Technologies
Overview
Our Downhole Technologies segment is comprised of the GEODynamics business we acquired in January 2018. GEODynamics was founded in 2004 as a researcher, developer and manufacturer of consumable engineered products used in completion applications. For the year ended December 31, 2018, our Downhole Technologies segment contributed approximately
20%
of our consolidated revenue. This segment provides oil and gas perforation systems, downhole tools and services in support of completion, intervention, wireline and well abandonment operations. This segment designs, manufactures and markets its consumable engineered products to oilfield service as well as exploration and production companies.
-
7
-
Downhole Technologies Market
Similar to our Well Site Services segment, demand for our Downhole Technologies segment products is predominantly tied to the level of oil and natural gas exploration and production activity on land in the United States. The primary driver for this activity is the price of crude oil and, to a lesser extent, natural gas. Activity levels have been, and we expect will continue to be, highly correlated with hydrocarbon commodity prices. Demand for this segment's products is also influenced by continued trends toward longer lateral lengths, increased frac stages and more perforation clusters to target increased unconventional well productivity.
Products
Product and service offerings for this segment include advanced perforation technology achieved through patented and proprietary systems combined with advanced modeling and analysis tools. This expertise has led to the optimization of perforation hole size, depth, and quality of tunnels, which are key factors for maximizing the effectiveness of hydraulic fracturing. Additional offerings include proprietary toe valve and frac plug products, which are focused on zonal isolation for hydraulic fracturing of horizontal wells, and a broad range of consumable products, such as setting tools and bridge plugs, that are used in completion, intervention and decommissioning applications.
Customers and Competitors
Our customers in the Downhole Technologies segment include other oilfield services companies as well as major, independent and private oil and gas companies. No customer in this segment represented more than 10% of our total consolidated revenue in any period presented. Competition in the Downhole Technologies business is widespread and includes many smaller companies, although we also compete with the larger oilfield service companies for certain products and services.
Offshore/Manufactured Products
Overview
For the years ended December 31, 2018, 2017 and 2016, our Offshore/Manufactured Products segment generated approximately
36%
, 57% and 73%, respectively, of our consolidated revenue. Through this segment, we provide technology driven highly-engineered products and services for offshore oil and natural gas production systems and facilities, as well as certain products and services to the offshore and land-based drilling and completion markets. Our products and services used primarily in deepwater producing regions include our FlexJoint
®
technology, advanced connector systems, high-pressure riser systems, compact valves, deepwater mooring systems, cranes, subsea pipeline products, specialty welding, fabrication, cladding and machining services, offshore installation services and inspection and repair services. In addition, we design, manufacture and market numerous other products and services used in both land and offshore drilling and completion activities and by non-oil and gas customers, including consumable downhole elastomer products that are utilized in onshore completion activities, valves and sound and vibration dampening products. We have facilities that support our Offshore/Manufactured Products segment in Arlington, Houston and Lampasas, Texas; Houma, Louisiana; Oklahoma City and Tulsa, Oklahoma; the United Kingdom; Brazil; Singapore; Thailand; Vietnam; China; the United Arab Emirates; and India.
Offshore/Manufactured Products
Market
The market for products and services offered by our Offshore/Manufactured Products segment centers primarily on the development of infrastructure for offshore production facilities and their subsequent operations, exploration and drilling activities, and to a lesser extent, new rig and vessel construction, refurbishments or upgrades. Demand for oil and natural gas, and the related drilling and production in offshore areas throughout the world, particularly in deeper water, drive spending for these activities. Sales of our shorter-cycle products to land-based drilling and completion markets is driven by the level and complexity of drilling, completion and workover activity, particularly in North America.
Products and Services
In operation for more than 75 years, our Offshore/Manufactured Products segment provides a broad range of products and services for use in offshore development and drilling activities. This segment also provides products for onshore oil and natural gas, defense and general industries. Our Offshore/Manufactured Products segment is dependent in part on the industry's continuing innovation and creative applications of existing technologies. We own various patents covering some of our technology, particularly in our connector and valve product lines.
-
8
-
Offshore Development and Drilling Activities.
We design, manufacture, inspect, assemble, repair, test and market OEM equipment for mooring, pipeline, production and drilling risers, and subsea applications along with equipment for offshore vessel and rig construction. Our products are components of equipment used for the drilling and production of oil and natural gas wells on offshore fixed platforms and mobile production units, including floating platforms, such as tension leg platforms, floating production, storage and offloading ("FPSO") vessels, Spars, and other marine vessels, floating rigs and jack-up rigs. Our products and services include:
|
•
|
flexible bearings and advanced connection systems;
|
|
•
|
casing and conductor connections and joints;
|
|
•
|
subsea pipeline products;
|
|
•
|
compact ball valves, manifold system components and diverter valves;
|
|
•
|
marine winches, mooring systems, cranes and other heavy-lift rig equipment;
|
|
•
|
production, workover, completion and drilling riser systems and their related repair services;
|
|
•
|
blowout preventer ("BOP") stack assembly, integration, testing and repair services;
|
|
•
|
consumable downhole products; and
|
|
•
|
other products and services, including welding, cladding and other metallurgical technologies.
|
Flexible Bearings and Advanced Connection Systems.
We are the key supplier of flexible bearings, or FlexJoint
®
connectors, to the offshore oil and natural gas industry as well as weld-on connectors and fittings that join lengths of large diameter conductors or casing used in offshore drilling and production operations. A FlexJoint
®
is a flexible bearing that allows for rotational movement of a riser or tension leg platform tether while under high tension and/or pressure. When positioned at the top, bottom, or, in some cases, middle of a deepwater riser, it reduces the stress and loads on the riser while compensating for the pitch and rotational forces on the riser as the production facility or drilling rig moves with ocean forces. FlexJoint
®
connectors are used on drilling, production and export risers and are used increasingly as offshore production moves to deeper water. Drilling riser systems provide the vertical conduit between the floating drilling vessel and the subsea wellhead. Through the drilling riser, the drill string is guided into the well and drilling fluids are returned to the surface. Production riser systems provide the vertical conduit for the hydrocarbons from the subsea wellhead to the floating production facility. Oil and natural gas flows to the surface for processing through the production riser. Export risers provide the vertical conduit from the floating production facility to the subsea export pipelines. Our FlexJoint
®
connectors are a critical element in the construction and operation of production and export risers on floating production systems in deepwater.
Floating production systems, including tension leg platforms, FPSO facilities and Spars (defined below), are a significant means of producing oil and natural gas, particularly in deepwater environments. We provide many important products for the construction of these facilities. A tension leg platform ("TLP") is a floating platform that is moored by vertical pipes, or tethers, attached to both the platform and the sea floor. Our FlexJoint
®
tether bearings are used at the top and bottom connections of each of the tethers, and our Merlin™ connectors are used to efficiently assemble the tether joints during offshore installation. An FPSO is a floating vessel, typically ship shaped, used to produce and process oil and natural gas from subsea wells. A Spar is a floating vertical cylindrical structure which is approximately six to seven times longer than its diameter and is anchored in place. Our FlexJoint
®
connectors are used to attach the various production, injection, import or export risers to all of these floating production systems.
Casing and Conductor Connections and
Joints
. Our advanced connection systems provide connectors used in various drilling and production applications offshore. These connectors are welded onto pipe to provide more efficient joint to joint connections with enhanced tensile and burst capabilities that exceed those of connections machined onto plain-end-pipe. Our connectors are reusable and pliable and, depending on the application, are equipped with metal-to-metal seals. We offer a suite of connectors offering differing specifications depending on the application. Our Merlin™ connectors are our premier connectors combining superior static strength and fatigue life with fast, non-rotational make-up and a slim profile. Merlin™ connectors have been used in sizes up to 60 inches (outside diameter) for applications including open-hole and tie-back casing, offshore conductor casing, pipeline risers and TLP tendons which moor the TLP to the sea floor.
These flexible bearings and advanced connector systems are primarily manufactured through our Arlington, Texas, United Kingdom and Singapore locations.
Subsea Pipeline Products.
We design and manufacture a variety of equipment used in the construction, maintenance, expansion and repair of offshore oil and natural gas pipelines. New construction equipment includes:
|
•
|
pipeline end manifolds and pipeline end terminals;
|
|
•
|
deep and shallow water pipeline connectors;
|
|
•
|
midline tie-in sleds;
|
-
9
-
|
•
|
forged steel Y-shaped connectors for joining two pipelines into one;
|
|
•
|
pressure-balanced safety joints for protecting pipelines and related equipment from anchor snags or a shifting sea-bottom;
|
|
•
|
electrical isolation joints; and
|
|
•
|
hot-tap clamps that allow new pipelines to be joined into existing lines without interrupting the flow of petroleum product.
|
We provide diverless connection systems for subsea flowlines and pipelines. Our HydroTech
®
collet connectors provide a high-integrity, proprietary metal-to-metal sealing system for the final hook-up of deep offshore pipelines and production systems. They also are used in diverless pipeline repair systems and in future pipeline tie-in systems. Our lateral tie-in sled, which is installed with the original pipeline, allows a subsea tie-in to be made quickly and efficiently using proven HydroTech
®
connectors without costly offshore equipment mobilization and without shutting off product flow.
We provide pipeline repair hardware, including deepwater applications beyond the depth of diver intervention. Our products include:
|
•
|
repair clamps used to seal leaks and restore the structural integrity of a pipeline;
|
|
•
|
mechanical connectors used in repairing subsea pipelines without having to weld;
|
|
•
|
misalignment and swivel ring flanges; and
|
|
•
|
pipe recovery tools for recovering dropped or damaged pipelines.
|
Our subsea pipeline products are primarily designed and manufactured at three of our Houston, Texas manufacturing locations.
Compact Ball Valves, Manifold System Components and Diverter Valves.
Our Piper Valve division designs and manufactures compact high pressure valves and manifold system components for all environments of the oil and gas industry including onshore, offshore, drilling and subsea applications. Our valve and manifold bores are designed to closely match the inside diameter of the required pipe schedule for the system working pressure. The result is elimination of piping transition areas that minimize erosion and system friction pressure loss, resulting in a more efficient flow path. Our floating ball valve design with its large ball/seat interface has over 30 years of field service experience in upstream unprocessed produced liquids and gasses, assuring reliable service. Oil States Piper Valve Optimum Flow Technology is our way of helping end users maximize space, minimize weight and increase production. These products are designed and manufactured at our Oklahoma City, Oklahoma location.
Marine Winches, Mooring Systems, Cranes and other Heavy-Lift Rig Equipment.
We design, engineer and manufacture marine winches, mooring systems, cranes and certain rig equipment. Our Skagit
®
winches are specifically designed for mooring floating and semi-submersible drilling rigs as well as positioning pipelay and derrick barges, anchor handling boats and jack-ups. Our Nautilus
®
marine cranes are used on production platforms throughout the world. We also design and fabricate rig equipment such as automatic pipe racking, blowout preventer handling equipment, as well as handling equipment used in the installation of offshore wind turbine platforms. Our engineering teams, manufacturing capability and service technicians, who install and service our products, provide our customers with a broad range of equipment and services to support their operations. Aftermarket service and support of our installed base of equipment to our customers is also an important source of revenue to us. These products are provided through our Houma, Louisiana; Navi Mumbai, India; and Rayong, Thailand locations.
Production, Workover, Completion and Drilling Riser Systems and their related repair services.
Utilizing the expertise of our welding technology group, we have extended the boundaries of our Merlin
™
connector technology with the design and manufacture of multiple riser systems. The unique Merlin
™
connection has proven to be a robust solution for even the most demanding high-pressure (up to 20,000 psi) riser systems used in high-fatigue, deepwater applications. Our riser systems are designed to meet a range of static and fatigue stresses on par with those of our Tension Leg Element connectors. The connector can be welded or machined directly onto upset riser pipe and provide sufficient material to perform "re-cuts" after extended service. We believe that our marine riser offers superior tension capabilities together with one of the fastest run times in the industry. Auxiliary riser system components and running tools can be provided along with full service inspection and repair of these riser systems by our facilities worldwide.
BOP Stack Assembly, Integration, Testing and Repair Services.
While not typically a manufacturer of BOP components, we design and fabricate lifting and protection frames for BOP stacks and offer the complete system integration of BOP stacks and subsea production trees. We can provide complete turnkey and design fabrication services. We also design and manufacture a variety of custom subsea equipment, such as riser flotation tank systems, guide bases, running tools and manifolds. In addition, we also offer blowout preventer and drilling riser testing and repair services. These assembly and testing services are offered through our Houston, Texas, United Kingdom, Singapore and Brazil locations.
-
10
-
Consumable Downhole Products
. North American shale play development has expanded the need for more advanced completion tools. In order to reduce well completion costs, minimizing the time to drill out tools is very important. Our Offshore/Manufactured Products segment has leveraged its knowledge of molded thermoset composites and elastomers to help meet this demand. For example, we have had success in developing and producing composite drillable zonal isolation tools (i.e., bridge/frac plugs) utilizing design and production techniques that reduce cost while still delivering high quality performance. Time to drill out has been reduced significantly in comparison to other filament wound products in the market. Our products also include:
|
•
|
Swab Cups
- used primarily in well servicing work;
|
|
•
|
Rod Guides/Centralizers
- used in both drilling and production for pipe protection;
|
|
•
|
Gate Valve and Butterfly Valve Seats
– we service many markets in the valve industry including well completion, refining, and distribution;
|
|
•
|
Casing and Cementing
Products –
we are a custom manufacturer of cementing plugs, well bore wipers, valve assemblies, combination plugs, specialty seals and gaskets; and
|
|
•
|
Service Tools –
our products include frac balls, packer elements, zonal isolation tools, as well as many custom molded products used in the well servicing industry.
|
Other Products & Services.
Our Offshore/Manufactured Products segment also produces a variety of products for use in industrial, military and other applications outside the oil and gas industry. For example, we provide:
|
•
|
sound and vibration isolation equipment for marine vessels;
|
|
•
|
metal-elastomeric FlexJoint
®
bearings used in a variety of naval and marine applications; and
|
|
•
|
drum-clutches and brakes for heavy-duty power transmission in the mining, paper, logging and marine industries.
|
Backlog
Offshore/Manufactured Products’ backlog consists of firm customer purchase orders for which contractual commitments exist and delivery is scheduled. Backlog in our Offshore/Manufactured Products segment was
$179 million
at
December 31, 2018
, compared to
$168 million
at
December 31, 2017
and $199 million at
December 31, 2016
. We expect approximately 78% of our backlog at
December 31, 2018
to be recognized as revenue during
2019
. In some instances, these purchase orders are cancelable by the customer, subject to the payment of termination fees and/or the reimbursement of our costs incurred. While backlog cancellations have historically been insignificant, we incurred cancellations totaling $6.5 million during
2018
and $3.5 million during
2017
, which we believe is attributable to lower commodity prices, the resultant decrease in capital spending by our customers and, in some cases, the financial condition of our customers. Additional cancellations may occur in the future, further reducing our backlog. Our backlog is an important indicator of future Offshore/Manufactured Products’ shipments and major project revenues; however, backlog as of any particular date may not be indicative of our actual operating results for any future period. We believe that the offshore construction and development business is characterized by lengthy projects and a long "lead-time" order cycle. The change in backlog levels from one period to the next does not necessarily evidence a long-term trend.
Regions of Operations
Our Offshore/Manufactured Products segment provides products and services to customers in the major offshore crude oil and natural gas producing regions of the world, including the U.S. Gulf of Mexico, Brazil, West Africa, the North Sea, Azerbaijan, Russia, India, Southeast Asia, China, the United Arab Emirates and Australia. In addition, we provide shorter-cycle products to customers in the land-based drilling and completion markets in the United States and, to a lesser extent, outside the United States.
Customers and Competitors
We market our products and services to a broad customer base, including direct end-users, engineering and design companies, prime contractors, and at times, our competitors through outsourcing arrangements. While no customer accounted for more than 10% of our consolidated revenues in 2016, Halliburton Company individually accounted for
10%
and
16%
of our total consolidated revenues in the years ended
December 31, 2018
and
2017
, respectively. Our main competitors in this segment include Cameron (a division of Schlumberger Limited), Dril-Quip, Inc., National Oilwell Varco, Inc., Baker Hughes (a GE Company), Hutchinson Group (a subsidiary of Total S.A.), Sparrows Offshore Group LTD, Oceaneering International, Inc. and Raina Engineers.
-
11
-
Seasonality of Operations
Our operations are directly affected by seasonal differences in weather in the areas in which we operate, most notably in the Rocky Mountain region, and the Gulf of Mexico. Severe winter weather conditions in the Rocky Mountain region can restrict access to work areas for our Well Site Services and Downhole Technologies segment operations. Our operations in the Gulf of Mexico are also affected by weather patterns. Weather conditions in the Gulf Coast region generally result in higher drilling activity in the spring, summer and fall months with the lowest levels of activity in the winter months. In addition, summer and fall drilling activity can be interrupted by hurricanes and other storms prevalent in the Gulf of Mexico and along the Gulf Coast. As a result of these seasonal differences, full year results are not likely to be a direct multiple of any particular quarter or combination of quarters.
Employees
As of
December 31, 2018
, the Company employed
3,926
full-time employees on a consolidated basis,
49%
of whom are in our Well Site Services segment,
13%
of whom are in our Downhole Technologies segment,
36%
of whom are in our Offshore/Manufactured Products segment, and
2%
of whom are in our corporate headquarters. This compares to a total of
3,077
full-time employees as of
December 31, 2017
. We were party to collective bargaining agreements covering a small number of employees located in Argentina and the United Kingdom as of
December 31, 2018
. We believe we have good labor relations with our employees.
Environmental and Occupational Health and Safety Matters
Our business operations are subject to numerous environmental and occupational health and safety laws and regulations that may be imposed domestically at the federal, regional, state, tribal and local levels or by foreign governments. Numerous governmental entities, including domestically the U.S. Environmental Protection Agency ("EPA"), the federal Bureau of Alcohol, Tobacco, Firearms and Explosives ("ATF"), the U.S. Occupational Safety and Health Administration and analogous state agencies, have the power to enforce compliance with these laws and regulations and the permits issued under them, often requiring difficult and costly actions. These laws and regulations may, among other things, (i) require the acquisition of permits to conduct drilling and other regulated activities; (ii) restrict the types, quantities and concentration of various substances that can be released into the environment or injected into subsurface formations in connection with oil and natural gas drilling and production activities; (iii) limit or prohibit drilling activities on certain lands lying within wilderness, wetlands and other protected areas; (iv) impose stringent regulations on the licensing or storage and use of explosives; (v) require remedial measures to mitigate pollution from former and ongoing operations, such as requirements to close pits and plug abandoned wells; (vi) impose specific safety and health criteria addressing worker protection; and (vii) impose substantial liabilities for pollution resulting from drilling operations and well site support services.
The more significant of these existing environmental and occupational health and safety laws and regulations include the following U.S. legal standards, as amended from time to time:
|
•
|
the Clean Air Act ("CAA"), which restricts the emission of air pollutants from many sources and imposes various pre-construction, operational, monitoring and reporting requirements, and that the EPA has relied upon as authority for adopting climate change regulatory initiatives relating to greenhouse gas ("GHG") emissions;
|
|
•
|
the Federal Water Pollution Control Act, also known as the Clean Water Act, which regulates discharges of pollutants from facilities to state and federal waters and establishes the extent to which waterways are subject to federal jurisdiction and rulemaking as protected waters of the United States;
|
|
•
|
the Oil Pollution Act of 1990, which subjects owners and operators of vessels, onshore facilities, and pipelines, as well as lessees or permittees of areas in which offshore facilities are located, to liability for removal costs and damages arising from an oil spill in waters of the United States;
|
|
•
|
U.S. Department of the Interior regulations, which govern oil and natural gas operations on federal lands and waters and impose obligations for establishing financial assurances for decommissioning activities, liabilities for pollution cleanup costs resulting from operations, and potential liabilities for pollution damages;
|
|
•
|
the Comprehensive Environmental Response, Compensation and Liability Act of 1980, which imposes liability on generators, transporters, and arrangers of hazardous substances at sites where hazardous substance releases have occurred or are threatening to occur;
|
|
•
|
the Resource Conservation and Recovery Act ("RCRA"), which governs the generation, treatment, storage, transport, and disposal of solid wastes, including hazardous wastes;
|
|
•
|
the Safe Drinking Water Act ("SDWA"), which ensures the quality of the nation’s public drinking water through adoption of drinking water standards and controlling the injection of waste fluids into below-ground formations that may adversely affect drinking water sources;
|
-
12
-
|
•
|
the Emergency Planning and Community Right-to-Know Act, which requires facilities to implement a safety hazard communication program and disseminate information to employees, local emergency planning committees, and response departments on toxic chemical uses and inventories;
|
|
•
|
the Occupational Safety and Health Act, which establishes workplace standards for the protection of the health and safety of employees, including the implementation of hazard communications programs designed to inform employees about hazardous substances in the workplace, potential harmful effects of these substances, and appropriate control measures;
|
|
•
|
the Endangered Species Act, which restricts activities that may affect federally identified endangered and threatened species or their habitats through the implementation of operating restrictions or a temporary, seasonal, or permanent ban in affected areas;
|
|
•
|
the National Environmental Policy Act, which requires federal agencies, including the Department of the Interior, to evaluate major agency actions having the potential to impact the environment and that may require the preparation of environmental assessments and more detailed environmental impact statements that may be made available for public review and comment;
|
|
•
|
the Department of Transportation regulations, which relate to advancing the safe transportation of energy and hazardous materials, including explosives, and emergency response preparedness; and
|
|
•
|
regulations adopted by the ATF, a law enforcement agency under the U.S. Department of Justice, that impose stringent licensing conditions with respect to the acquisition, storage and use of explosives for well site support services in the oil and natural gas sector.
|
These environmental and occupational health and safety laws and regulations generally restrict the level of pollutants emitted to ambient air, discharges to surface water, and disposals or other releases to surface and below-ground soils and ground water. Failure to comply with these laws and regulations may result in the assessment of sanctions, including administrative, civil, and criminal penalties; the imposition of investigatory, remedial, and corrective action obligations or the incurrence of capital expenditures; the occurrence of restrictions, delays or cancellations in the permitting, development or expansion of projects; and the issuance of injunctions restricting or prohibiting some or all of our activities in a particular area. Additionally, multiple environmental laws provide for citizen suits, which allow environmental organizations to act in place of the government and sue operators for alleged violations of environmental laws. See Risk Factors under Part I, Item 1A of this Form 10‑K for further discussion on environmental laws and regulations, including with respect to hydraulic fracturing; ozone standards, induced seismicity regulatory developments; climate change, including methane or other GHG emissions; storage and use of explosives; offshore drilling and related regulatory developments, including with respect to decommissioning obligations; and other regulations relating to environmental protection. The ultimate financial impact arising from environmental laws and regulations is neither clearly known nor determinable as existing standards are subject to change and new standards continue to evolve.
Additionally, there exist regional, state, tribal and local jurisdictions in the United States where we operate that also have, or are developing or considering developing, similar environmental and occupational health and safety laws and regulations governing many of these same types of activities. Outside of the United States, there are foreign countries and provincial, regional, tribal or local jurisdictions therein where we are conducting business that also have, or may be developing, regulatory initiatives or analogous controls that regulate our environmental-related activities. While the legal requirements imposed in foreign countries or jurisdictions therein may be similar in form to U.S. laws and regulations, in some cases the actual implementation of these requirements may impose additional, or more stringent, conditions or controls that can significantly restrict, delay or cancel the permitting, development or expansion of a project or substantially increase the cost of doing business. Moreover, both in the United States and in foreign countries, environmental and occupational health and safety laws and regulations, including new or amended legal requirements that may arise in the future to address potential environmental concerns such as air and water impacts or to address perceived health or safety-related concerns such as oil and natural gas development in close proximity to specific occupied structures and/or certain environmentally-sensitive or recreational areas, are expected to continue to have a considerable impact on our operations.
We have acquired certain properties supportive of oil and natural gas activities from third parties whose actions with respect to the management and disposal or release of hydrocarbons, hazardous substances or wastes at or from such properties were not under our control prior to acquiring them. Under environmental laws and regulations, we could incur strict joint and several liability for remediating hydrocarbons, hazardous substances or wastes disposed of or released by prior owners or operators. We also could incur costs related to the clean-up of third-party sites to which we sent regulated substances for disposal or to which we sent equipment for cleaning, and for damages to natural resources or other claims related to releases of regulated substances at or from such third-party sites.
We have incurred and will continue to incur operating and capital expenditures, some of which may be material, to comply with environmental and occupational health and safety laws and regulations. Historically, our environmental compliance costs have not had a material adverse effect on our results of operations; however, there can be no assurance that such costs will not be material in the future or that such future compliance will not have a material adverse effect on our business and operational results. The ultimate
-
13
-
financial impact arising from environmental laws and regulations is neither clearly known nor determinable as existing standards are subject to change and new standards continue to evolve. Although we are not fully insured against all environmental and occupational health and safety risks, and our insurance does not cover any penalties or fines that may be issued by a governmental authority, we maintain insurance coverage that we believe is sufficient based on our assessment of insurable risks and consistent with insurance coverage held by other similarly situated industry participants. Nevertheless, it is possible that other developments, such as stricter and more comprehensive environmental and occupational health and safety laws and regulations, claims for damages to property or persons or disruption of our customers' operations resulting from our actions or omissions, and imposition of penalties due to our operations could have a material adverse effect on us and our results of operations.
Item 1A.
Risk Factors
The risks described in this Annual Report on Form 10‑K are not the only risks we face. Additional risks and uncertainties not currently known to us or that we currently deem to be immaterial also may materially adversely affect our business, financial condition or future results.
Demand for the majority of our products and services is substantially dependent on the levels of expenditures by companies in the oil and natural gas industry. Lower oil and natural gas prices since 2014 have significantly reduced the demand for our products and services and the prices we are able to charge. This has had and may continue to have a material adverse effect on our financial condition and results of operations.
Demand for most of our products and services depends substantially on the level of expenditures by companies in the oil and natural gas industry. The significant decline in oil and natural gas prices during 2014 that continued in 2016 and 2017, before improving through the first nine months of 2018 caused a reduction in most of our customers’ drilling, completion and other production activities and related spending on our products and services. The reduction in demand from our customers has resulted in an oversupply of many of the services and products we provide, and such oversupply has substantially reduced the prices we can charge our customers for many of our products and services. Although oil prices improved since the trough in 2016, these price improvements have not resulted in significant global improvements in the demand for our products and services or the prices we are able to charge. If oil prices remain persistently low or decline further, our customers’ activity levels and spending, along with the prices we charge, could worsen. In addition, a continuation or worsening of these conditions may result in a material adverse impact on certain of our customers’ liquidity and financial position, resulting in further spending reductions, delays in the collection of amounts owing to us and similar impacts. These conditions have, had and may continue to have, an adverse impact on our financial condition, results of operations and cash flows, and it is difficult to predict how long the current depressed commodity price environment will continue.
Although conditions in our industry improved in 2018, particularly in the shale resource plays in the United States, crude prices again declined significantly beginning in the fourth quarter of 2018. Given the historical volatility of crude oil prices, there remains a degree of risk that prices could remain at current levels or deteriorate further due to increases in global inventory levels, increasing domestic crude oil production, U.S. and China trade tensions, sanctions or waivers on Iranian production, civil unrest in Libya, increasing price differentials between markets, slowing growth rates in China and other global regions, use of alternative fuels, improved vehicle fuel efficiency, a more sustained movement to electric vehicles and/or the potential for ongoing supply/demand imbalances. If oil prices remain low or decline further, we could encounter difficulties such as an inability to access needed capital on attractive terms or at all, the incurrence of asset impairment charges, the inability to meet financial ratios contained in our debt agreements, the need to reduce our capital spending and other similar impacts. For example, our reduced EBITDA during recent periods resulted in our inability to access the full borrowing capacity available under our Revolving Credit Facility as a result of the maximum leverage ratio covenant, which under our Amended Revolving Credit Facility, requires that our ratio of total net debt to consolidated EBITDA be no greater than 4.00 to 1.0 for fiscal quarters ending prior to December 31, 2018 and no greater than 3.75 to 1.0 thereafter. As more fully disclosed in Item 7, Management’s Discussion and Analysis of Financial Condition and Results of Operations under the heading "Liquidity, Capital Resources and Other Matters," we discuss our expectations regarding liquidity and covenant compliance for 2019.
Many factors affect the supply of and demand for oil and natural gas and, therefore, influence product prices, including:
|
•
|
the level of drilling and completion activity;
|
|
•
|
the level of oil and natural gas production;
|
|
•
|
the levels of oil and natural gas inventories;
|
|
•
|
depletion rates;
|
|
•
|
worldwide demand for oil and natural gas;
|
|
•
|
the expected cost of finding, developing and producing new reserves;
|
-
14
-
|
•
|
delays in major offshore and onshore oil and natural gas field development timetables;
|
|
•
|
the availability of attractive oil and natural gas field prospects that may be affected by governmental actions or environmental activists that may restrict development;
|
|
•
|
the availability of transportation infrastructure for oil and natural gas, refining capacity and shifts in end-customer preferences toward fuel efficiency and the use of natural gas;
|
|
•
|
global weather conditions and natural disasters;
|
|
•
|
worldwide economic activity including growth in developing countries;
|
|
•
|
national government political requirements, including the ability and willingness of OPEC to set and maintain production levels and prices for oil and government policies which could nationalize or expropriate oil and natural gas exploration, production, refining or transportation assets;
|
|
•
|
shareholder activism or activities by non-governmental organizations to limit certain sources of funding for the energy sector or restrict the exploration, development and production of oil and natural gas;
|
|
•
|
the impact of armed hostilities involving one or more oil producing nations;
|
|
•
|
rapid technological change and the timing and extent of development of energy sources, including liquefied natural gas or alternative fuels;
|
|
•
|
environmental and other governmental laws and regulations; and
|
|
•
|
domestic and foreign tax policies, including those regarding tariffs and duties.
|
In response to lower oil prices, many of our customers have reduced or delayed their capital spending, which reduced the demand for our products and services and exerted downward pressure on the prices paid for our products and services. Although some of our customers increased their 2018 capital expenditure budgets, these customers are still spending significantly less than their pre-2015 levels. Additionally, if oil prices remain at current levels or decline further, these customers may further reduce their spending levels. We expect that we will continue to encounter weakness in the demand for, and prices of, our products and services until commodity prices stabilize at higher levels and our customers’ capital spending increases. Any prolonged reduction in the overall level of exploration and production activities, whether resulting from changes in oil and natural gas prices or otherwise, could materially adversely affect our financial condition, results of operations and cash flows in many ways including by negatively affecting:
|
•
|
our equipment utilization, revenues, cash flows and profitability;
|
|
•
|
our ability to obtain additional capital to finance our business and the cost of that capital; and
|
|
•
|
our ability to attract and retain skilled personnel.
|
Given the cyclical nature of our business,
a severe prolonged downturn could negatively affect the value of our goodwill and other intangible assets.
As of
December 31, 2018
, goodwill and other intangible assets represented
32%
and
13%
, respectively, of our total assets. We record goodwill when the consideration we pay in acquiring a business exceeds the fair market value of the tangible and separately measurable intangible net assets of that business. We are required to periodically review the goodwill and other intangible assets of our applicable reporting units (Completion Services, Downhole Technologies and Offshore/Manufactured Products) for impairment in value and to recognize a non-cash charge against earnings causing a corresponding decrease in stockholders’ equity if circumstances, some of which are beyond our control, indicate that the carrying amounts will not be recoverable. It is possible that we could recognize goodwill and other intangible assets impairment losses in the future if, among other factors:
|
•
|
global economic and industry conditions deteriorate;
|
|
•
|
the outlook for future profits and cash flow for any of our reporting units deteriorate further as the result of many possible factors, including, but not limited to, increased or unanticipated competition, technology becoming obsolete, further reductions in customer capital spending plans, loss of key personnel, adverse legal or regulatory judgment(s), future operating losses at a reporting unit, downward forecast revisions, or restructuring plans;
|
|
•
|
domestic and/or foreign income tax rates increase, or regulations change;
|
|
•
|
costs of equity or debt capital increase;
|
|
•
|
valuations for comparable public companies or comparable acquisition valuations deteriorate; or
|
|
•
|
our stock price experiences a sustained decline.
|
-
15
-
Laws and regulations regarding hydraulic fracturing could increase our costs of doing business and result in additional operating restrictions, delays or cancellations in the completion of oil and natural gas wells that may reduce demand for our products and services and could have a material adverse effect on our business, results of operations and financial condition.
Although we do not directly engage in hydraulic fracturing, a material portion of our Completion Services, Downhole Technologies and Offshore/Manufactured Products operations support many of our oil and natural gas exploration and production customers in such activities. Hydraulic fracturing is an important and commonly used process for the completion of oil and natural gas wells in targeted subsurface formations with low permeability, such as shale formations, and involves the pressurized injection of water, sand or other proppants and chemical additives into rock formations to stimulate oil and natural gas production.
Hydraulic fracturing onshore in the United States is typically regulated by state oil and natural gas commissions and similar agencies. However, the practice has become increasingly controversial in certain parts of the country, resulting in increased scrutiny and regulation, including by federal agencies.
For example, the EPA has asserted regulatory authority over certain hydraulic fracturing activities under the SDWA involving the use of diesel fuels and published guidance covering such activities as well as published an Advance Notice of Proposed Rulemaking to collect data on chemicals used in hydraulic fracturing under the Toxic Substances Control Act. Also, in 2016, the EPA published an efficient limit guideline final rule under the Clean Water Act prohibiting the discharge of wastewater from onshore unconventional oil and natural gas extraction facilities to publicly owned wastewater treatment plants. Additionally, in 2015, the federal Bureau of Land Management ("BLM") published a final rule establishing new or more stringent standards for performing hydraulic fracturing on federal and American Indian lands but the BLM rescinded the rule in December 2017; however, litigation was filed in federal court in January 2018 challenging the BLM’s rescission of the 2015 rule and legal challenges remain pending. Also, from time to time, Congress has considered legislation to provide for federal regulation of hydraulic fracturing in the United States and to require disclosure of the chemicals used in the hydraulic fracturing process. In addition to asserting regulatory authority, a number of federal entities have reviewed various environmental issues associated with hydraulic fracturing. For example, in 2016, the EPA released its final report on the potential impacts of hydraulic fracturing on drinking water resources, concluding that "water cycle" activities associated with hydraulic fracturing may impact drinking water resources under certain circumstances.
At the state level, some states have adopted and other states are considering adopting legal requirements that could impose new or more stringent permitting, public disclosure or well construction requirements on hydraulic fracturing activities, including states where we or our customers operate. States could elect to prohibit high volume hydraulic fracturing altogether, following the approach taken by the State of New York. Local governments may also seek to adopt ordinances within their jurisdictions regulating the time, place or manner of drilling activities in general or hydraulic fracturing activities in particular.
In the event that new or more stringent federal, state or local legal restrictions relating to use of the hydraulic fracturing process in the United States are adopted in areas where our oil and natural gas exploration and production customers operate, those customers could incur potentially significant added costs to comply with requirements relating to permitting, construction, financial assurance, monitoring, recordkeeping, and/or plugging and abandonment, as well as could experience delays or curtailment in the pursuit of production or development activities, any of which could reduce demand for the products and services of each of our business segments and have a material adverse effect on our business, financial condition, and results of operations.
Moreover, non-governmental organizations may seek to restrict hydraulic fracturing. For example, certain interest groups in Colorado opposed to oil and natural gas development generally, and hydraulic fracturing in particular, have from time to time advanced various options for ballot initiatives that, if approved, would allow revisions to state statutes or the constitution in a manner that would make such exploration and production activities in the state more difficult or expensive in the future. In each of the November 2014, 2016 and 2018 general election cycles in Colorado, ballot initiatives have been pursued, with the 2018 initiative making the November 2018 ballot, seeking to increase setback distances between new oil and natural-gas development and specific occupied structures and/or certain environmentally sensitive or recreational areas that, if adopted, may have had significant adverse impacts on new oil and natural-gas development in the state. However, in each election cycle, the ballot initiative either did not secure a place on the general ballot or, as was the case in November 2018, was defeated. Similar initiatives may be pursed in Colorado and other states in the future.
In foreign countries outside of the United States, including provincial, regional, tribal or local jurisdictions therein where we conduct operations, there may exist similar governmental restrictions or controls on our customers’ hydraulic fracturing activities, which, if such restrictions or controls exist or are adopted in the future, our customers may incur significant costs to comply with such requirements or may experience delays or curtailment in the permitting or pursuit of their operations, which could have a material adverse effect on our business, results of operations and financial condition.
-
16
-
The explosion of dangerous materials used in our business could disrupt our operations and adversely affect our business, results of operations and financial conditions.
Our Downhole Technologies business operations include the licensing, storage and handling of explosive materials. Despite our use of specialized facilities to store and handle dangerous materials and our employee training programs, the storage and handling of explosive materials could result in explosive incidents that temporarily shut down or otherwise disrupt our or our customers’ operations or could cause restrictions, delays or cancellations in the delivery of our services. It is possible that such an explosion could result in death or significant injuries to employees and other persons. Material property damage to us, our customers and third parties arising from an explosion or resulting fire could also occur. Any explosion could expose us to adverse publicity and liability for damages or cause production restrictions, delays or cancellations, any of which could have a material adverse effect on our operating results, financial condition and cash flows. Moreover, failure to comply with applicable requirements or the occurrence of an explosive incident may also result in the loss of our license to store and handle explosives, which would have a material adverse effect on our business, results of operations and financial conditions.
Federal or state legislative and regulatory initiatives related to induced seismicity could result in operating restrictions or delays in the drilling and completion of oil and natural gas wells that may reduce demand for our products and services and could have a material adverse effect on our business, results of operations and financial condition.
Our oil and natural gas producing customers dispose of flowback water or certain other oilfield fluids gathered from oil and natural gas producing operations in accordance with permits issued by government authorities overseeing such disposal activities. While these permits are issued pursuant to existing laws and regulations, these legal requirements are subject to change based on concerns of the public or governmental authorities regarding such disposal activities. One such concern relates to seismic events near underground disposal wells used for the disposal by injection of flowback water or certain other oilfield fluids resulting from oil and natural gas activities. When caused by human activity, such events are called induced seismicity. Developing research suggests that the link between seismic activity and wastewater disposal may vary by region and local geology. For example, in 2016, the United States Geological Survey identified six states with the most significant hazards from induced seismicity, including Oklahoma, Kansas, Texas, Colorado, New Mexico, and Arkansas. In response to concerns regarding induced seismicity, regulators in some states have imposed, or are considering imposing, additional requirements in the permitting of produced water disposal wells or otherwise to assess any relationship between seismicity and the use of such wells. For example, Oklahoma has issued rules for wastewater disposal wells that imposed certain permitting and operating restrictions and reporting requirements on disposal wells in proximity to faults and also, from time to time, is developing and implementing plans directing certain wells where seismic incidents have occurred to restrict or suspend disposal well operations. The Texas Railroad Commission has adopted similar rules. In addition, another consequence of seismic events may be lawsuits alleging that disposal well operations have caused damage to neighboring properties or otherwise violated state and federal rules regulating waste disposal. One or more of these developments could result in additional regulation and restrictions on the use of injection wells by our customers to dispose of flowback water and certain other oilfield fluids. Increased regulation and attention given to induced seismicity also could lead to greater opposition, including litigation, to oil and natural gas activities utilizing injection wells for waste disposal. As a result, our customers may have to limit disposal well volumes, disposal rates or locations, or require our customers or third party disposal well operators that are used to dispose of customers’ wastewater to shut down disposal wells, which developments could adversely affect our customers’ business and result in a corresponding decrease in the need for our products and services, which could have a material adverse effect on our business, financial condition, and results of operations.
We do business in international jurisdictions which exposes us to unique risks.
A portion of our revenue and net assets are attributable to operations in foreign countries. Risks associated with our operations in foreign areas include, but are not limited to:
|
•
|
expropriation, confiscation or nationalization of assets;
|
|
•
|
renegotiation or nullification of existing contracts;
|
|
•
|
foreign exchange limitations;
|
|
•
|
foreign currency fluctuations;
|
|
•
|
foreign taxation;
|
|
•
|
the inability to repatriate earnings or capital in a tax efficient manner;
|
|
•
|
changing political conditions;
|
|
•
|
economic or trade sanctions;
|
|
•
|
changing foreign and domestic monetary and trade policies;
|
-
17
-
|
•
|
changes in trade activity;
|
|
•
|
social, political, military, and economic situations in foreign areas where we do business, and the possibilities of war, other armed conflict or terrorist attacks; and
|
|
•
|
regional economic downturns.
|
Additionally, in some jurisdictions we are subject to foreign governmental regulations favoring or requiring the awarding of contracts to local contractors, or requiring foreign contractors to employ citizens of, or purchase supplies from, a particular jurisdiction. These regulations may adversely affect our ability to compete in such jurisdictions.
The U.S. Foreign Corrupt Practices Act (the "FCPA"), and similar anti-bribery laws in other jurisdictions, including the United Kingdom Bribery Act 2010, generally prohibit companies and their intermediaries from making improper payments to foreign officials for the purpose of obtaining or retaining business. We operate in many parts of the world that have experienced governmental corruption to some degree and, in certain circumstances, strict compliance with anti-bribery laws may conflict with local customs and practices and impact our business. Any failure to comply with the FCPA or other anti-bribery legislation could subject us to civil and criminal penalties or other sanctions, which could have a material adverse impact on our business, financial condition and results of operations. We could also face fines, sanctions, and other penalties from authorities in the relevant foreign jurisdictions, including prohibition of our participating in, or curtailment of, business operations in those jurisdictions and the seizure of assets. Additionally, we may have competitors who are not subject to the same ethics-related laws and regulations which provides them with a competitive advantage over us by securing business awards, licenses, or other preferential treatment, in those jurisdictions using methods that certain ethics-related laws and regulations prohibit us from using.
The regulatory regimes in some foreign countries may be substantially different than those in the United States, and may be unfamiliar to U.S. investors. Violations of foreign laws could result in monetary and criminal penalties against us or our subsidiaries and could damage our reputation and, therefore, our ability to do business.
The ultimate impact of recent changes to tariffs and duties imposed by the United States and other countries is uncertain. We use a variety of domestically produced and imported raw materials and component products, including steel, in the manufacture of our products. In 2018, the United States imposed tariffs on a variety of imported products, including steel and aluminum. In response to the U.S. tariffs on steel and aluminum, the European Union and several other countries, including Canada and China, have threatened and/or imposed retaliatory tariffs. The effect of these new tariffs and the application and interpretation of existing trade agreements and customs, anti-dumping and countervailing duty regulations continues to evolve, and we continue to monitor these matters. If we encounter difficulty in procuring these raw materials and component products, or if the prices we have to pay for these products increase as a result of customs, anti-dumping and countervailing duty regulations or otherwise and we are unable to pass corresponding cost increases on to our customers, our financial position and results of operations could be adversely affected. Furthermore, uncertainty with respect to potential costs in the drilling and completion of oil and gas wells could cause our customers to delay or cancel planned projects which, if this occurred, would adversely affect our financial position and results of operations. See Note
13
, "Commitments and Contingencies."
Additional domestic and international deepwater drilling laws, regulations and other restrictions, delays in the processing and approval of drilling permits and exploration, development, oil spill-response and decommissioning plans and other offshore-related developments may have a material adverse effect on our business, financial condition, or results of operations.
The Bureau of Ocean Energy Management ("BOEM") and the Bureau of Safety and Environmental Enforcement ("BSEE"), each an agency of the U.S. Department of the Interior, have, over time, imposed more stringent permitting procedures and regulatory safety and performance requirements for new wells to be drilled in federal waters. Compliance with these more stringent regulatory requirements and with existing environmental and oil spill regulations, together with any uncertainties or inconsistencies in decisions and rulings by governmental agencies, delays in the processing and approval of drilling permits or exploration, development, oil spill-response and decommissioning plans and possible additional regulatory initiatives could result in difficult and more costly actions and adversely affect, delay or curtail new drilling and ongoing development efforts.
Additionally, these governmental agencies are continuing to evaluate and, as necessary, develop and implement new, more restrictive requirements that could result in additional costs, delays, restrictions or obligations with respect to oil and natural gas exploration and production operations conducted offshore. For example, in 2016, the BSEE published a final rule on well control that, among other things, imposes rigorous standards relating to the design, operation and maintenance of blowout preventers, real-time monitoring of deepwater and high temperature, high pressure drilling activities, and enhanced reporting requirements. Pursuant to President Trump’s Executive Orders of March 2017 and April 2017 ("Executive Orders"), however, the BSEE initiated a review of the well control regulations to determine whether the rules are consistent with the stated policy of encouraging energy exploration and production, while ensuring that any such activity is safe and environmentally responsible. One consequence of this review is that in September 2018, the BSEE published final revisions to its regulations regarding offshore drilling safety equipment, which
-
18
-
includes the removal of the requirement for offshore operators to certify through an independent third party that their critical safety and pollution prevention equipment (e.g., subsea safety equipment, including blowout preventers) is operational and functioning as designed in the most extreme conditions. Another consequence of this BSEE review is that, in May 2018, the BSEE issued a proposed rule to revise its existing regulations for well control and blowout preventer systems that was bolstered under its 2016 final rule, but the May 2018 proposed rule has not been finalized.
Moreover, in 2016, the BOEM issued a Notice to Lessees and Operators ("NTL") that would bolster supplemental bonding procedures for the decommissioning of offshore wells, platforms, pipelines, and other facilities by oil and natural gas exploration and production operators, some of whom are our customers, on the Outer Continental Shelf ("OCS"). However, since the BOEM’s issuance of the NTL, the agency has delayed indefinitely beyond June 30, 2017, the implementation timeline of the NTL for most of those facilities so that BOEM could further assess this financial assurance program. This delay is expected to be temporary and following completion of its review, the BOEM may elect to retain the 2016 NTL in its current form or may make revisions thereto. Consequently, until the review is completed and the BOEM determines what additional financial assurance may be required of operators on the OCS, which additional assurance amounts could be significant, we are unable to assess the extent to which our customers on the OCS will be able to comply with any such assurance obligations. Significant increases in financial assurance could adversely affect the ability of our customers to operate on the OCS, which could reduce demand for our products and services to those customers. Also, in 2016, the BOEM published a proposed rule that would update existing air emissions requirements relating to offshore oil and natural gas activity on the OCS which would include a requirement to report and track pollutant emissions affecting human health and public welfare. However, pursuant to the Executive Orders, the BOEM has ceased rulemaking activities and is reviewing the continuing need for the proposed air quality rule.
These regulatory actions, or any new rules, regulations, or legal initiatives could delay or disrupt our customers’ operations, increase the risk of expired leases due to the time required to develop new technology, result in increased supplemental bonding and costs and limit activities in certain areas, or cause our customers to incur penalties, fines, or shut-in production at one or more of their facilities or result in the suspension or cancellation of leases, any or all of which could reduce demand for our products and services. While the Trump Administration has generally indicated an interest in scaling back or rescinding regulations that inhibit the development of the U.S. oil and natural gas industry, it is difficult to predict the extent to which such policies will be implemented or the outcome of any litigation challenging such implementation.
Also, if material spill events were to occur in the future, the United States or other countries where such an event were to occur could elect to issue directives to temporarily cease drilling activities and, in any event, may from time to time issue further safety and environmental laws and regulations regarding offshore oil and natural gas exploration and development, any of which developments could have a material adverse effect on our business. We cannot predict with any certainty the full impact of any new laws, regulations or legal initiatives on our customers’ drilling operations or on the cost or availability of insurance to cover the risks associated with such operations. The matters described above, individually or in the aggregate, could have a material adverse effect on our business, financial condition and results of operations.
Consolidation of our customers and competitors may impact our results of operations.
The oil and gas industry has experienced periods of consolidation in the past. Industry consolidation may result in reduced capital spending by some of our customers, the acquisition of one or more of our primary customers or competitors or consolidated entities using size and purchasing power to seek pricing or other concessions, which may lead to decreased demand for our products and services. In addition, recent, ongoing and future mergers, combinations and consolidations in our industry could result in existing competitors increasing their market share and may result in stronger competitors. As a result, industry consolidation may have a significant negative impact on our results of operations, financial position or cash flows.
Exchange rate fluctuations could adversely affect our U.S. reported results of operations and financial position.
In the ordinary course of our business, we enter into purchase and sales commitments that are denominated in currencies that differ from the functional currency used by our operating subsidiaries. Currency exchange rate fluctuations can create volatility in our consolidated financial position, results of operations, and/or cash flows. Although we may enter into foreign exchange agreements with financial institutions in order to reduce our exposure to fluctuations in currency exchange rates, these transactions, if entered into, will not eliminate that risk entirely. To the extent that we are unable to match revenues received in foreign currencies with expenses paid in the same currency, exchange rate fluctuations could have a negative impact on our consolidated financial position, results of operations, and/or cash flows. Additionally, because our consolidated financial results are reported in U.S. dollars, if we generate net revenues or earnings in countries whose currency is not the U.S. dollar, the translation of such amounts into U.S. dollars can result in an increase or decrease in the amount of our net revenues and earnings depending upon exchange rate movements. As a result, a material decrease in the value of these currencies relative to the U.S. dollar may have a negative impact on our reported
-
19
-
revenues, net income, and cash flows. Any currency controls implemented by local monetary authorities in countries where we currently operate could also adversely affect our business, financial condition, and results of operations.
The results of the United Kingdom’s referendum on withdrawal from the European Union including the subsequent exchange rate fluctuations and political and economic uncertainties may have a negative effect on global economic conditions, financial markets and our business.
We are a multinational company and are subject to the risks inherent in doing business in other countries, including the United Kingdom (the "U.K."). In June 2016, a majority of voters in the U.K. elected to withdraw from the European Union in a national referendum ("Brexit"). The referendum was advisory, and the terms of any withdrawal are subject to a negotiation period that could last at least two years after the government of the U.K. formally initiates a withdrawal process. Nevertheless, Brexit has created significant uncertainty about the future relationship between the U.K. and the European Union and other countries, including with respect to the laws and regulations that will apply as the U.K. determines which European Union derived laws to replace or replicate in the event of a withdrawal. The referendum has also given rise to calls for the governments of other European Union member states to consider withdrawal. These developments, or the perception that any of these developments may occur, could potentially disrupt the markets we serve and the jurisdictions in which we operate and may cause us to lose customers, suppliers and employees.
The impact from Brexit on our business and operations will depend on the outcome of tariff, tax treaty, trade, regulatory and other negotiations, as well as the impact of the withdrawal on macroeconomic growth and currency volatility, which are uncertain at this time. Any of these effects of Brexit could have a material adverse effect on our business, financial condition and results of operations.
We are subject to numerous environmental laws and regulations that may expose us to significant costs and liabilities.
Our operations are significantly affected by numerous laws and regulations domestically at the federal, regional, state, tribal and local levels or by foreign governments regarding the discharge of substances into the environment or otherwise relating to environmental protection. We could be exposed to liabilities for cleanup costs, natural resource damages, and other damages under these laws and regulations, with certain of these legal requirements imposing strict liability for such damages and costs, even though our conduct was lawful at the time it occurred or the conduct resulting in such damage and costs were caused by prior operators or other third-parties.
Environmental laws and regulations in the United States and in foreign countries are subject to change in the future, possibly resulting in more stringent legal requirements. If existing regulatory requirements or enforcement policies change or new regulatory or enforcement initiatives are developed and implemented in the future, we or our oil and natural gas exploration and production customers may be required to make significant, unanticipated capital and operating expenditures. Examples of recent regulations or other regulatory initiatives include the following:
|
•
|
Ground-Level Ozone Standards.
In 2015, the EPA issued a final rule under the CAA, lowering the National Ambient Air Quality Standard ("NAAQS") for ground-level ozone from 75 parts per billion to 70 parts per billion under both the primary and secondary standards to provide requisite protection of public health and welfare, respectively. In 2017 and 2018, the EPA issued area designations with respect to ground-level ozone as either "attainment/unclassifiable," "unclassifiable" or "non-attainment." Additionally, in November 2018, the EPA issued final requirements that apply to state, local, and tribal air agencies for implementing the 2015 NAAQS for ground-level ozone. State implementation of the revised NAAQS could, among other things, require installation of new emission controls on some of our or our customers’ equipment, result in longer permitting timelines, and significantly increase our or our customers’ capital expenditures and operating costs.
|
|
•
|
EPA Review of Drilling Waste Classification.
Drilling, fluids, produced water and most of the other wastes associated with the exploration, development and production of oil or natural gas, if properly handled, are currently exempt from regulation as hazardous waste under the RCRA and instead, are regulated under RCRA’s less stringent non-hazardous waste provisions. However, following the filing of a lawsuit in the U.S. District Court for the District of Columbia by several non-governmental environmental groups against the EPA for the agency’s failure to timely assess its RCRA Subtitle D criteria regulations for oil and natural gas wastes, the EPA and the environmental groups entered into an agreement that was finalized in a consent decree issued by the District Court in December 2016. Under the decree, the EPA is required to propose no later than March 15, 2019, a rulemaking for revision of certain Subtitle D criteria regulations pertaining to oil and natural gas wastes or sign a determination that revision of the regulations is not necessary. If the EPA proposes a rulemaking for revised oil and natural gas waste regulations, the consent decree requires that the EPA take final action following notice and comment rulemaking no later than July 15, 2021.
|
-
20
-
|
•
|
Waters of the United States.
In 2015, the EPA and U.S. Army Corps of Engineers ("Corps") released a final rule outlining federal jurisdictional reach under the Clean Water Act over waters of the United States, including wetlands. Beginning in the first quarter of 2017, the EPA and the Corps agreed to reconsider the 2015 rule and, thereafter, the agencies have (i) published a proposed rule in July 2017 to rescind the 2015 rule and recodify the regulatory text that governed waters of the United States prior to promulgation of the 2015 rule, (ii) published a final rule in February 2018 adding a February 6, 2020 applicable date to the 2015 rule, and (iii) published a proposed rule in December 2018 re-defining the Clean Water Act's jurisdiction over waters of the United States for which the agencies will seek public comment. The 2015 and February 2018 final rules are being challenged by various factions in federal district court and implementation of the 2015 rule has been enjoined in twenty-eight states pending resolution of the various federal district court challenges. As a result of these legal developments, future implementation of the 2015 rule or a revised rule is uncertain at this time. To the extent that the 2015 rule or a revised rule expands the scope of the Clean Water Act’s jurisdiction in areas where we or our customers conduct operations, we or our customers could incur increased costs and restrictions, delays or cancellations, which could reduce demand for our products and services.
|
Compliance with these regulations and other regulatory initiatives, or any other new environmental laws and regulations could, among other things, require us or our customers to install new or modified emission controls on equipment or processes, incur longer permitting timelines, and incur significantly increased capital or operating expenditures, which costs may be significant. Additionally, one or more of these developments could reduce demand for our products and services. Moreover, any failure by us to comply with applicable environmental laws and regulations may result in governmental authorities taking actions against our business that could adversely impact our operations and financial condition, including the:
|
•
|
issuance of administrative, civil, and/or criminal penalties;
|
|
•
|
denial or revocation of permits or other authorizations;
|
|
•
|
reduction, delay or cessation in operations, including any development or expansion of projects; and
|
|
•
|
performance of site investigatory, remedial, or other corrective actions or the incurrence of capital expenditures.
|
An accidental release of pollutants into the environment may cause us to incur significant costs and liabilities.
Our business activities present risks of incurring significant environmental costs and liabilities in our business as a result of our handling of petroleum hydrocarbons, because of air emissions and waste water discharges related to our operations, and due to historical industry operations and waste disposal practices. Additionally, private parties, including the owners of properties upon which we perform services and facilities where our wastes are taken for reclamation or disposal, also may have the right to pursue legal actions to enforce compliance as well as to seek damages for non-compliance with environmental laws and regulations or for personal injury or property or natural resource damages. Some environmental laws and regulations may impose strict liability, which means that in some situations we could be exposed to liability as a result of our conduct that was lawful at the time it occurred or the conduct of, or conditions caused by prior operators or other third parties. Remedial costs and other damages arising as a result of environmental laws and costs associated with changes in environmental laws and regulations could be substantial and could have a material adverse effect on our liquidity, results of operations and financial condition. We may not be able to recover some or any of these costs from insurance.
Climate change laws and regulations restricting or regulating emissions of GHGs could result in increased operating and capital costs and reduced demand for our products and services.
Climate change continues to attract considerable public and scientific attention in the United States and in foreign countries. As a result, numerous proposals have been made and are likely to continue to be made internationally, domestically at the federal, regional and state levels, and by foreign governments to monitor and limit GHGs. These efforts have included consideration of cap-and-trade programs, carbon taxes, GHG reporting and tracking programs and regulations that directly limit GHG emissions from certain sources.
In the United States, no comprehensive climate change legislation has been implemented at the federal level, to date. In the absence of federal GHG-limiting legislation, the EPA has determined that GHG emissions present a danger to public health and the environment and has adopted rules under authority of the CAA that, among other things, establish Potential for Significant Deterioration construction and Title V operating permit reviews for GHG emissions from certain large stationary sources that are also potential major sources of certain principal, or criteria, pollutant emissions, which reviews could require securing permits at covered facilities emitting GHGs and meeting “best available control technology” standards for those GHG emissions. Additionally, the EPA has adopted rules requiring the monitoring and annual reporting of GHG emissions from certain petroleum and natural gas system sources in the United States, including, among others, onshore and offshore production facilities, which include certain of our producing customers’ operations.
-
21
-
Federal agencies also have begun directly regulating emissions of methane, a GHG, from oil and natural gas operations, and states, such as New Mexico, are considering additional local regulations. In 2016, the EPA published a final rule establishing new emissions standards for methane and additional standards for volatile organic compounds from certain new, modified or reconstructed facilities in the oil and natural gas source category that will require the use of certain equipment specific emissions control practices. However, in 2017, the EPA published a proposed rule to stay certain portions of the 2016 standards for two years but the rule has not been finalized. Rather, in February 2018, the EPA finalized amendments to certain requirements of the 2016 final rule and, in September 2018, the agency proposed additional amendments that included rescission or revision of certain requirements such as fugitive emission monitoring frequency. Furthermore, in 2016, the BLM published a final rule to reduce methane emissions by regulating venting, flaring, and leaking from oil and natural gas operations on federal and Indian lands. However, in September 2018, the BLM published a final rule that rescinds most of the requirements in the 2016 final rule and codifies the BLM's prior approach to venting and flaring. The rescission of the requirements in the 2016 final rule is being challenged in federal court. These rules, should they remain in effect, and any other new methane emission standards imposed on the oil and gas sector could result in increased costs to our and our customers’ operations as well as result in delays or curtailment in such operations, which costs, delays or curtailment could adversely affect our business.
Additionally, in April 2016, the United States joined other countries in entering into a United Nations-sponsored non-binding agreement negotiated in Paris, France (the "Paris Agreement") for nations to limit their GHG emissions through individually-determined reduction goals every five years beginning in 2020. However, in August 2017, the U.S. State Department informed the United Nations of the intent of the United States to withdraw from the Paris Agreement, which provides for a four-year exit process beginning when the agreement took effect in November 2016. Notwithstanding any withdrawal from the Paris Agreement, the adoption and implementation of any international, federal or state legislation or regulations that require reporting of GHGs or otherwise restrict emissions of GHGs could result in increased compliance costs or additional operating restrictions imposed on us or our customers operations, adversely impact overall drilling activity in the areas in which we operate, reduce the demand for carbon-based fuels, and reduce the demand for our products and services. Any one or more of these developments could have a material adverse effect on our business, financial condition, demand for our services, results of operations, and cash flows. Notwithstanding potential risks related to climate change, the International Energy Agency estimates that oil and gas will continue to represent a major share of global energy use through 2040 and other studies by the private sector project continued growth in demand for the next two decades. However, recent activism directed at shifting funding away from companies with energy-related assets could result in limitations or restrictions on certain sources of funding. Ultimately, this could make it more difficult to secure funding for exploration and production activities.
The Endangered Species Act, the Migratory Bird Treaty Act and other laws intended to protect certain species of wildlife govern our and our oil and natural gas exploration and production customers’ operations, which constraints could have an adverse impact on our ability to expand some of our existing operations or limit our customers’ ability to develop new oil and natural gas wells.
The federal Endangered Species Act and comparable state laws were established to protect endangered and threatened species. Under the Endangered Species Act, if a species is listed as threatened or endangered, restrictions may be imposed on activities adversely affecting that species' habitat. Similar protections are offered to migratory birds under the Migratory Bird Treaty Act. Oil and natural gas operations in our operating areas may be adversely affected by seasonal or permanent restrictions on drilling activities designed to protect various wildlife, which may limit our ability to operate in protected areas. Permanent restrictions imposed to protect endangered and threatened species could prohibit drilling in certain areas or require the implementation of expensive mitigation measures.
Moreover, as a result of one or more settlements approved by the United States federal government, the U.S. Fish and Wildlife Service must make determinations on the listing of numerous species as endangered or threatened under the Endangered Species Act. The designation of previously unidentified endangered or threatened species could indirectly cause us to incur additional costs, cause our or our oil and natural gas exploration and production customers’ operations to become subject to operating restrictions or bans, and limit future development activity in affected areas, which could reduce demand for our products and services to those customers.
Our inability to control the inherent risks of identifying and integrating businesses that we may acquire, including any related increases in debt or issuances of equity securities, could adversely affect our operations.
Acquisitions have been, and our management believes will continue to be, a key element of our growth strategy. We continually review complementary acquisition opportunities and we expect to seek to consummate acquisitions of such businesses in the future. However, we may not be able to identify and acquire acceptable acquisition candidates on favorable terms in the future or at all. In addition, we may be required to incur substantial indebtedness to finance future acquisitions and also may issue equity securities in
-
22
-
connection with such acquisitions. Such additional debt service requirements could impose a significant burden on our results of operations and financial condition, and the issuance of additional equity securities could result in significant dilution to stockholders.
We expect to gain certain business, financial, and strategic advantages as a result of business combinations we undertake, including synergies and operating efficiencies. Our forward-looking statements assume that we will successfully integrate our business acquisitions and realize these intended benefits. However, our inability to realize expected financial performance and strategic advantages as a result of an acquisition, including the GEODynamics and Falcon Acquisitions, could negatively affect the anticipated benefits of the acquisition. Additional risks we could face in connection with acquisitions, including the GEODynamics and Falcon Acquisitions, include:
|
•
|
retaining key employees and customers of acquired businesses;
|
|
•
|
retaining supply and distribution relationships key to the supply chain;
|
|
•
|
increased administrative burden, including additional costs associated with regulatory compliance;
|
|
•
|
diversion of management time and attention;
|
|
•
|
developing our sales and marketing capabilities;
|
|
•
|
managing our growth effectively;
|
|
•
|
potential goodwill impairment resulting from the overpayment for an acquisition;
|
|
•
|
integrating operations, workforce, product lines and technology;
|
|
•
|
managing tax and foreign exchange exposure;
|
|
•
|
operating a new line of business;
|
|
•
|
increased logistical problems common to large, expansive operations;
|
|
•
|
inability to pursue and protect patents covering acquired technology;
|
|
•
|
addition of acquisition-related debt and increased expenses and working capital requirements;
|
|
•
|
substantial accounting charges for restructuring and related expenses, write-off of in-process research and development, impairment of goodwill, amortization of intangible assets, and stock-based compensation expense;
|
|
•
|
becoming subject to unanticipated liabilities of the acquired business, including litigation related to the acquired business; and
|
|
•
|
achieving the expected benefits from the acquisition, including certain cost savings and operational efficiencies or synergies.
|
Additionally, an acquisition may bring us into businesses we have not previously conducted and expose us to additional business risks that are different from those we have previously experienced. If we fail to manage any of these risks successfully, our business could be harmed. Our capitalization and results of operations may change significantly following an acquisition, and stockholders of the Company may not have the opportunity to evaluate the economic, financial, and other relevant information that we will consider in evaluating future acquisitions.
Following our acquisition of GEODynamics
in January 2018, we determined that certain steel products historically imported by GEODynamics from China for use in its manufacturing process may potentially be subject to anti-dumping and countervailing duties based on recent clarifications/decisions rendered by the U.S. Department of Commerce and the U.S. Court of International Trade. Following these findings, we commenced an internal review of this matter and ceased further purchases of these potentially affected Chinese products. As part of our internal review, we engaged trade counsel and decided to voluntarily disclose this matter to U.S. Customs and Border Protection in September 2018. In connection with the GEODynamics acquisition, the seller agreed to indemnify and hold us harmless against certain claims related to matters such as this. Additionally, we are able to set off payments due under the $25.0 million promissory note (see Note
7
, "Long-term Debt") issued to the seller of GEODynamics in respect of indemnification claims which could affect both the timing of payment and the amount due under the promissory note.
We might be unable to compete successfully with other companies in our industry.
The markets in which we operate are highly competitive and certain of them have relatively few barriers to entry. The principal competitive factors in our markets are product, equipment and service quality, availability, responsiveness, experience, technology, safety performance, and price. In some of our product and service offerings, we compete with the oil and natural gas industry’s largest oilfield service providers. These large national and multi-national companies have longer operating histories, greater financial, technical, and other resources, and greater name recognition than we do. Several of our competitors provide a broader array of services and have a stronger presence in more geographic markets. In addition, we compete with many smaller companies capable
-
23
-
of competing effectively on a regional or local basis. Our competitors may be able to respond more quickly to new or emerging technologies and services, and changes in customer requirements. Many contracts are awarded on a bid basis, which further increases competition based on price. As a result of competition, we may lose market share or be unable to maintain or increase prices for our present services, or to acquire additional business opportunities, which could have a material adverse effect on our business, financial condition, and results of operations.
Our business and results of operations could be negatively impacted by security threats, including cybersecurity threats, and other disruptions.
We rely heavily on information systems to conduct our business. Although we devote significant resources to protect our systems and data, we may experience various security threats, including cybersecurity threats to gain unauthorized access to sensitive information or to render data or systems unusable; threats to the safety of our employees; threats to the security of our facilities and infrastructure, or third-party facilities and infrastructure; and threats from terrorist acts. Cybersecurity attacks in particular are evolving and include, but are not limited to, malicious software, attempts to gain unauthorized access to data, and other electronic security breaches that could lead to disruptions in critical systems, unauthorized release of confidential or otherwise protected information, and corruption of data. Although we utilize various procedures and controls to monitor these threats and mitigate our exposure to such threats, there can be no assurance that these procedures and controls will be sufficient in preventing security threats from materializing. If any of these events were to materialize, they could lead to losses of sensitive information (including our intellectual property and customer data), critical infrastructure, personnel or capabilities, essential to our operations, and could have a material adverse effect on our reputation, financial position, results of operations, or cash flows.
We may not have adequate insurance for potential liabilities and our insurance may not cover certain liabilities, including litigation risks.
The products that we manufacture and the services that we provide are complex, and the failure of our equipment to operate properly or to meet specifications may greatly increase our customers’ costs. In addition, many of these products are used in inherently hazardous applications where an accident or product failure can cause personal injury or loss of life, damages to property, equipment, or the environment, regulatory investigations and penalties, and the suspension or cancellation of the end-user’s operations. If our products or services fail to meet specifications, or are involved in accidents or failures, we could face warranty, contract, or other litigation claims for which we may be held responsible and our reputation for providing quality products may suffer. In the ordinary course of business, we become the subject of various claims, lawsuits, and administrative proceedings, seeking damages or other remedies concerning our commercial operations, products, employees, and other matters, including occasional claims by individuals alleging exposure to hazardous materials as a result of our products or operations. Some of these claims relate to the activities of businesses that we have sold, and some relate to the activities of businesses that we have acquired, even though these activities may have occurred prior to our acquisition of such businesses.
We maintain insurance to cover many of our potential losses, and we are subject to various self-retentions and deductibles under our insurance policies. It is possible, however, that a judgment could be rendered against us in cases in which we could be uninsured and beyond the amounts that we currently have reserved or anticipate incurring for such matters. Even a partially uninsured or underinsured claim, if successful and of significant size, could have a material adverse effect on our results of operations or consolidated financial position. We also face the following other risks related to our insurance coverage:
|
•
|
we may not be able to continue to obtain insurance on commercially reasonable terms;
|
|
•
|
we may be faced with types of liabilities that will not be covered by our insurance, such as damages from environmental contamination or terrorist attacks;
|
|
•
|
the counterparties to our insurance contracts may pose credit risks; and
|
|
•
|
we may incur losses from interruption of our business that exceed our insurance coverage.
|
We are susceptible to seasonal earnings volatility due to adverse weather conditions in our regions of operations.
Our operations are directly affected by seasonal differences in weather in the areas in which we operate, most notably in the Rocky Mountain region of the United States and the Gulf of Mexico. Severe winter weather conditions in the Rocky Mountain region of the United States can restrict access to work areas for our Well Site Services and Downhole Technologies segment customers. Our operations in and near the Gulf of Mexico are also affected by weather patterns. Weather conditions in the Gulf Coast region generally result in higher drilling activity in the spring, summer and fall months, with the lowest levels of activity in the winter months. In addition, summer and fall drilling activity can be restricted due to hurricanes and other storms prevalent in the Gulf of Mexico and along the Gulf Coast. As a result of these seasonal differences, full year results are not likely to be a direct multiple of any particular quarter or combination of quarters.
-
24
-
We are exposed to risks relating to subcontractors’ performance in some of our projects.
In many cases, we subcontract the performance of portions of our operations to subcontractors. While we seek to obtain appropriate indemnities and guarantees from these subcontractors, we remain ultimately responsible for the performance of our subcontractors. Industrial disputes, natural disasters, financial failure or default, or inadequate performance in the provision of services, or the inability to provide services by such subcontractors, has the potential to materially adversely affect us.
We depend on several significant customers in each of our business segments, and the loss of one or more such customers or the inability of one or more such customers to meet their obligations to us, could adversely affect our results of operations.
We depend on several significant customers in each of our business segments. While no customer accounted for more than 10% of our consolidated revenues in 2016, Halliburton Company individually accounted for
10%
and
16%
of our total consolidated revenues in
2018
and
2017
, respectively.
The loss of a significant portion of customers in any of our business segments, or a sustained decrease in demand by any of such customers, could result in a substantial loss of revenues and could have a material adverse effect on our results of operations. In addition, the concentration of customers in one industry impacts our overall exposure to credit risk, in that customers may be similarly affected by changes in economic and industry conditions. While we perform ongoing credit evaluations of our customers, we do not generally require collateral in support of our trade receivables.
As a result of our customer concentration, risks of nonpayment and nonperformance by our counterparties are a concern in our business. Many of our customers finance their activities through cash flow from operations, the incurrence of debt, or the issuance of equity. Many of our customers have experienced substantial reductions in their cash flows from operations, and some are experiencing liquidity shortages, lack of access to capital and credit markets, a reduction in borrowing bases under reserve-based credit facilities, and other adverse impacts to their financial condition. These conditions may result in a significant reduction in our customers’ liquidity and ability to pay or otherwise perform on their obligations to us. The inability, or failure of, our significant customers to meet their obligations to us, or their insolvency or liquidation, may adversely affect our financial results.
We may assume contractual risks in developing, manufacturing and delivering products in our Offshore/Manufactured Products business segment.
Many of our products from our Offshore/Manufactured Products segment are ordered by customers under frame agreements or project-specific contracts. In some cases these contracts stipulate a fixed price for the delivery of our products and impose liquidated damages or late delivery fees if we do not meet specific customer deadlines. Our actual costs, and any gross profit realized on these fixed-price contracts, may vary from the initially expected contract economics. This may occur for various reasons, including but not limited to:
|
•
|
errors in estimates or bidding;
|
|
•
|
changes in availability and cost of materials and labor;
|
|
•
|
failures of our suppliers to deliver raw materials and other goods that comply with our specifications;
|
|
•
|
variations in productivity from our original estimates;
|
|
•
|
changes in tariffs or tax regimes; and
|
|
•
|
material changes in foreign currency exchange rates.
|
These variations and the risks inherent in our projects may result in reduced profitability or losses on projects. Depending on the size of a project, variations from estimated contract performance could have a material adverse impact on our operating results.
In addition, some customer contracts stipulate consequential damages payable, generally as a result of our gross negligence or willful misconduct. The final delivered products may also include customer and third-party supplied equipment, the delay of which can negatively impact our ability to deliver our products on time at our anticipated profitability.
In certain cases these orders include new technology or unspecified design elements. There is inherent risk in the estimation process including significant unforeseen technical and logistical challenges, or longer than expected lead times. In some cases we may not be fully, or, properly compensated for the cost to develop and design the final products, negatively impacting our profitability on the projects. In addition, our customers, in many cases, request changes to the original design or bid specifications for which we may not be fully or properly compensated.
-
25
-
In fulfilling some contracts, we provide limited warranties for our products. Although we estimate and record a provision for potential warranty claims, repair or replacement costs under warranty provisions in our contracts could exceed the estimated cost to cure the claim, which could be material to our financial results. We utilize percentage-of-completion accounting, depending on the size and length of a project, and variations from estimated contract performance could have a significant impact on our reported operating results as we progress toward completion of major jobs.
Backlog in our Offshore/Manufactured Products segment is subject to unexpected adjustments and cancellations and, therefore, has limitations as an indicator of our future revenues and earnings.
The revenues projected in our Offshore/Manufactured Products segment backlog may not be realized or, if realized, may not result in profits. Because of potential changes in the scope or schedule of our customers’ projects, we cannot predict with certainty when or if backlog will be realized. Material delays, cancellations or payment defaults could materially affect our financial condition, results of operations, and cash flows.
Reductions in our backlog due to cancellations or deferrals by customers, or for other reasons, would adversely affect, potentially to a material extent, the revenues and earnings we actually receive from contracts included in our backlog. Some of the contracts in our backlog are cancellable by the customer, subject to the payment of termination fees and/or the reimbursement of our costs incurred. We typically have no contractual right to the total revenues reflected in our backlog once a project is canceled. While backlog cancellations have not been significant in the past, we incurred cancellations totaling
$6.5 million
, $3.5 million and $3.7 million during 2018, 2017 and 2016, respectively. If commodity prices do not improve, or decline further, we may incur additional cancellations or experience continued declines in our backlog. If we experience significant project terminations, suspensions, or scope adjustments to contracts included in our backlog, our financial condition, results of operations, and cash flows may be adversely impacted.
We might be unable to employ a sufficient number of technical and service personnel.
Many of the products that we sell, especially in our Offshore/Manufactured Products segment, are complex and highly engineered, and often must perform in harsh conditions. We believe that our success depends upon our ability to employ and retain technical personnel with the ability to design, utilize, and enhance these products. In addition, our ability to expand our operations in each of our businesses depends in part on our ability to increase our skilled labor force. As observed in the U.S. shale play regions such as the Permian Basin in recent years, during periods of increased activity, the demand for skilled workers is high, and the supply is limited. When these events occur, our cost structure increases and our growth potential could be impaired. Conversely, during periods of reduced activity, we are forced to reduce headcount, freeze or reduce wages, and implement other cost-saving measures which could lead to job abandonment by our technical and service personnel.
If we do not develop new competitive technologies and products, our business and revenues may be adversely affected.
The market for our products and services is characterized by continual technological developments to provide better performance in increasingly greater water depths, higher pressure levels and harsher conditions. If we are unable to design, develop, and produce commercially competitive products in a timely manner in response to changes in technology, our business and revenues will be adversely affected. Many of our competitors are large multinational companies that may have significantly greater financial resources than we have, and they may be able to devote greater resources to research and development of new systems, services and technologies than we are able to do. In addition, competitors or customers may develop new technologies, which address similar or improved solutions to our existing technology. Additionally, the development and commercialization of new products and services requires substantial capital expenditures and we may not have access to needed capital at attractive rates or at all due to our financial condition, disruptions of the bank or capital markets, or other reasons beyond our control to continue these activities. Should our technologies become the less attractive solution, our operations and profitability would be negatively impacted.
We may be subject to litigation if another party claims that we have infringed upon its intellectual property rights.
The tools, techniques, methodologies, programs, and components we use to provide our products and services may infringe, or be alleged to infringe, upon the intellectual property rights of others. Infringement claims generally result in significant legal and other costs, and may distract management from running our core business. Royalty payments under a license from third parties, if available, would increase our costs. If a license was not available, we might not be able to continue providing a particular service or product. Any of these developments could have a material adverse effect on our business, financial condition, and results of operations.
-
26
-
During periods of strong demand or limited supply, we may be unable to obtain critical materials on a timely basis.
Our operations depend on our ability to procure, on a timely basis, certain project materials, such as forgings, to complete projects and produce products in an efficient and timely manner. Our inability to procure critical materials during times of strong demand/limited supply or at reasonable costs due to supply issues, import taxes or the like, could have a material adverse effect on our business and operations.
Our oilfield operations involve a variety of operating hazards and risks that could cause losses.
Our operations are subject to the hazards inherent in the oilfield business. These include, but are not limited to, equipment defects, blowouts, explosions, spills, fires, collisions, capsizing, and severe weather conditions. These hazards could result in personal injury and loss of life, severe damage to, or destruction of, property and equipment, pollution or environmental damage, and suspension of operations. We may incur substantial liabilities or losses as a result of these hazards as part of our ongoing business operations. We may agree to indemnify our customers against specific risks and liabilities. While we maintain insurance protection against some of these risks, and seek to obtain indemnity agreements from our customers requiring the customers to hold us harmless from some of these risks, our insurance and contractual indemnity protection may not be sufficient or effective enough to protect us under all circumstances or against all risks. The occurrence of a significant event not fully insured or indemnified against or the failure of a customer to meet its indemnification obligations to us could materially and adversely affect our results of operations and financial condition.
Our common stock price has been and is likely to continue to be highly volatile.
The trading price of our common stock is subject to wide fluctuations in response to the highly cyclical nature of our industry and a variety of other factors, including quarterly variations in operating results, conditions in the oil and gas industry, perceptions of our industry, analyst reports, estimates and commentary, general economic conditions and numerous other events or factors that are beyond our control.
In addition, the U.S. stock markets in general and the market for oil field service companies, in particular, have experienced large price and volume fluctuations that have often been unrelated or disproportionate to the operating results or asset values of those companies. These broad market and industry factors may materially impact the market price and trading volume of our common stock regardless of our actual operating performance.
We might be unable to protect our intellectual property rights and we may be subject to litigation if another party claims that we have infringed upon its intellectual property rights.
We rely on a variety of intellectual property rights that we use in our businesses, particularly our patents relating to our FlexJoint® and Merlin™ technology and intervention and downhole extended-reach tools (including our HydroPull® tool) utilized in the completion or workover of oil and natural gas wells. The market success of our technologies will depend, in part, on our ability to obtain and enforce our proprietary rights in these technologies, to preserve rights in our trade secret and non-public information, and to operate without infringing the proprietary rights of others. We may not be able to successfully preserve these intellectual property rights and these rights could be invalidated, circumvented or challenged. In addition, we may be required to expend significant amounts of capital pursuing and defending our intellectual property rights, and these proceedings may not ultimately be successful. For example, during 2018 we incurred expenses in excess of
$8 million
in connection with patent defense. If any of our patents or other intellectual property rights are determined to be invalid or unenforceable, or if a court or other tribunal limits the scope of claims in a patent or fails to recognize our trade secret rights, our competitive advantages could be significantly reduced in the relevant technology, allowing competition for our customer base to increase.
In addition, the laws of some foreign countries in which our products and services may be sold do not protect intellectual property rights to the same extent as the laws of the United States. The failure of our Company to protect our proprietary information and any successful intellectual property challenges or infringement proceedings against us could adversely affect our competitive position.
The Spin-Off of Civeo may subject us to future liabilities.
We spun off (the "Spin-Off") our accommodations business to Civeo Corporation ("Civeo"), a stand-alone, publicly traded corporation, through a tax-free distribution to our stockholders on May 30, 2014.
Pursuant to agreements we entered into with Civeo in connection with the Spin-Off, we and Civeo are each generally responsible for the obligations and liabilities related to our respective businesses. Pursuant to those agreements, we and Civeo each agreed to cross-indemnities principally designed to allocate financial responsibility for the obligations and liabilities of our business to us and those of Civeo’s business to it. However, third parties, including governmental agencies, could seek to hold us responsible for
-
27
-
obligations and liabilities that Civeo agreed to retain or assume, and there can be no assurance that the indemnification from Civeo will be sufficient to protect us against the full amount of such obligations and liabilities, or that Civeo will be able to fully satisfy its indemnification obligations. Additionally, if a court were to determine that the Spin-Off or related transactions, including the payment of the dividend we received from Civeo, were consummated with the actual intent to hinder, delay or defraud current or future creditors or resulted in Civeo receiving less than reasonably equivalent value when it was insolvent, or that it was rendered insolvent, inadequately capitalized or unable to pay its debts as they become due, then it is possible that the court could disregard the allocation of obligations and liabilities agreed to between us and Civeo and impose substantial obligations and liabilities on us, void some or all of the Spin-Off transactions or require us to repay some or all of the dividend we received in connection with the Spin-Off. Any of the foregoing could adversely affect our financial condition and our results of operations.
In connection with the Spin-Off, we received a private letter ruling from the Internal Revenue Service ("IRS") regarding certain aspects of the Spin-Off. The private letter ruling, and an opinion we received from our tax advisor, each rely on certain facts, assumptions, representations and undertakings from us and Civeo regarding the past and future conduct of the companies’ respective businesses and other matters. If any of these facts, assumptions, representations, or undertakings are, or become, incorrect or not otherwise satisfied, we may not be able to rely on the private letter ruling or the opinion of our tax advisor and could be subject to significant tax liabilities. In addition, an opinion of counsel is not binding upon the IRS, so, notwithstanding the opinion of our tax advisor, the IRS could conclude upon audit that the Spin-Off is taxable in full or in part if it disagrees with the conclusions in the opinion, or for other reasons, including as a result of certain significant changes in our or Civeo’s stock ownership. If the Spin-Off is determined to be taxable for U.S. federal income tax purposes for any reason, we and/or our stockholders could incur significant income tax liabilities.
Item 1B.
Unresolved Staff Comments
None.
Item 2.
Properties
The Company owns or leases numerous manufacturing facilities, service centers, sales and administrative offices, storage yards and data processing centers in support of its worldwide operations. The following presents the location of the Company’s principal owned or leased facilities, by segment.
Well Site Services
– Neuquén and Cutral Co, Argentina, Grand Prairie and Red Deer, Canada; and in the United States: Alice, Houston, and Midland, Texas; New Iberia and Houma, Louisiana; Oklahoma City, Oklahoma; Casper and Rock Springs, Wyoming; Williston, North Dakota and Renton, Washington.
Downhole Technologies
– Millsap, Fort Worth, Weatherford, Pleasanton and Midland, Texas; Clearfield, Pennsylvania; Dickinson, North Dakota and Oklahoma City and Piedmont, Oklahoma in the United States; and Aberdeen, Scotland.
Offshore/Manufactured Products
– Rio de Janeiro and Macae, Brazil; Aberdeen, Bathgate and West Lothian, Scotland; Barrow-in-Furness, England; Rayong, Thailand; Singapore; Navi Mumbai, India; Shenzhen, China; Abu Dhabi, UAE; and in the United States: Arlington, Houston and Lampasas, Texas; Oklahoma City and Tulsa, Oklahoma and Houma, Louisiana.
Our principal corporate offices are located in Houston, Texas.
We believe that our leases are at competitive or market rates and do not anticipate any difficulty in leasing additional suitable space upon expiration of our current lease terms.
Item 3.
Legal Proceedings
Information regarding legal proceedings is set forth in Note
13
, "Commitments and Contingencies," of the Consolidated Financial Statements and is incorporated herein by reference.
Item 4.
Mine Safety Disclosures
Not applicable.
-
28
-
PART II
Item 5.
Market for Registrant's Common Equity, Related Stockholder Matters and Issuer Purchases of Equity Securities
Common Stock Information
Our authorized common stock consists of
200,000,000
shares of common stock. There were
60,498,465
shares of common stock outstanding as of
February 18, 2019
. The approximate number of record holders of our common stock as of
February 18, 2019
was
14
. Our common stock is traded on the New York Stock Exchange (“NYSE”) under the ticker symbol OIS.
We have not declared or paid any cash dividends on our common stock since our initial public offering in 2001 and our Amended Revolving Credit Facility limits the payment of dividends. For additional discussion of such restrictions, please see "Part II, Item 7. Management’s Discussion and Analysis of Financial Condition and Results of Operations." Any future determination as to the declaration and payment of dividends will be at the discretion of our Board of Directors and will depend on then existing conditions, including our financial condition, results of operations, contractual restrictions, capital requirements, business prospects and other factors that our Board of Directors considers relevant.
Performance Graph
The following graph and chart compare the cumulative five-year total stockholder return on the Company's common stock relative to the cumulative total returns of the Standard & Poor's 500 Stock Index, the PHLX Oil Service Sector index, an index of oil and gas related companies that represent an industry composite of the Company's peer group, and a customized peer group of sixteen companies, with the individual companies listed in footnote (2) below for the period from December 31, 2013 to
December 31, 2018
. The graph and chart show the value at the dates indicated of $100 invested at December 31, 2013 and assume the reinvestment of all dividends. The stockholder return set forth below is not necessarily indicative of future performance. The following graph and related information shall not be deemed “soliciting material” or to be “filed” with the SEC, nor shall such information be incorporated by reference into any future filing under the Securities Act of 1933 or the Securities Exchange Act of 1934, except to the extent that Oil States specifically incorporates it by reference into such filing.
COMPARISON OF 5 YEAR CUMULATIVE TOTAL RETURN
(1)
Among Oil States International, Inc., the S&P 500 Index,
the PHLX Oil Service Sector Index, and a Peer Group
(2)
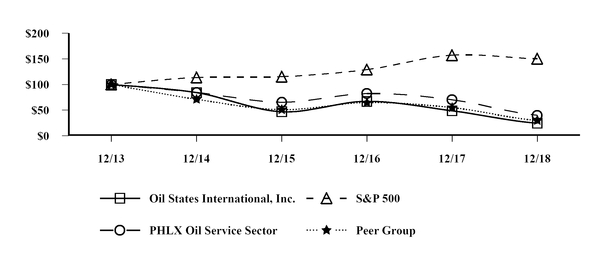
|
As of December 31,
|
2013
|
2014
|
2015
|
2016
|
2017
|
2018
|
||||||||||||||||||
|
Oil States International, Inc.
|
$
|
100.00
|
|
$
|
84.15
|
|
$
|
46.89
|
|
$
|
67.11
|
|
$
|
48.70
|
|
$
|
24.57
|
|
||||||
|
Peer Group
(2)
|
100.00
|
|
71.02
|
|
50.77
|
|
64.63
|
|
54.87
|
|
29.81
|
|
||||||||||||
|
PHLX Oil Service Sector
|
100.00
|
|
84.52
|
|
65.46
|
|
82.39
|
|
70.36
|
|
39.79
|
|
||||||||||||
|
S&P 500
|
100.00
|
|
113.69
|
|
115.26
|
|
129.05
|
|
157.22
|
|
150.33
|
|
||||||||||||
____________________
|
(1)
|
$100 invested on December 31, 2013 in stock or index, including reinvestment of dividends. Fiscal year ended December 31.
|
|
(2)
|
The sixteen companies included in the Company's customized peer group are: Archrock, Inc., Bristow Group Inc., Carbo Ceramics Inc., Core Laboratories N.V., Dril-Quip, Inc., Forum Energy Technologies, Inc., Franks International N.V., Helix Energy Solutions Group, Inc., Helmerich & Payne, Inc., Key Energy Services, Inc., McDermott International Inc., Oceaneering International, Inc., Patterson-UTI Energy, Inc., RPC, Inc., Superior Energy Services, Inc. and Tidewater Inc.
|
Information used in the graph and table was obtained from Research Data Group, Inc., a source believed to be reliable, but we are not responsible for any errors or omissions in such information. Used with permission.
-
29
-
Unregistered Sales of Equity Securities and Use of Proceeds
None.
Purchases of Equity Securities by the Issuer and Affiliated Purchases
|
Period
|
Total Number of Shares Purchased
(1)
|
Average Price Paid per Share
(1)
|
Total Number of Shares Purchased as Part of Publicly Announced Plans or Programs
|
Approximate Dollar Value of Shares That May Yet Be Purchased Under the Plans or
Programs
(2)
|
||||||||||
|
October 1 through October 31, 2018
|
—
|
|
$
|
—
|
|
—
|
|
$
|
120,544,560
|
|
||||
|
November 1 through November 30, 2018
|
—
|
|
—
|
|
—
|
|
120,544,560
|
|
||||||
|
December 1 through December 31, 2018
|
—
|
|
—
|
|
—
|
|
120,544,560
|
|
||||||
|
Total
|
—
|
|
$
|
—
|
|
—
|
|
|
|
|||||
____________________
|
(1)
|
No
shares were purchased during the three-month period ended
December 31, 2018
.
|
|
(2)
|
We maintain a share repurchase program providing for the repurchase of up to $150 million of our common stock, which, following extension, was scheduled to expire on July 29, 2018. On July 25, 2018, our Board of Directors extended the share repurchase program for one year to July 29, 2019.
|
-
30
-
Item 6.
Selected Financial Data
The selected financial data on the following pages include selected historical financial information of our company as of and for each of the five years ended
December 31, 2018
. The following data should be read in conjunction with "Part II, Item 7. Management's Discussion and Analysis of Financial Condition and Results of Operations" and the Company's Consolidated Financial Statements and related notes included in "Part II, Item 8. Financial Statements and Supplementary Data" of this Annual Report on Form 10‑K in order to understand factors, such as business combinations, charges and credits, which may impact the comparability of the selected financial data. Additionally, we completed the spin-off of our accommodations segment in May 2014. Accordingly, information presented below for 2014 reflects our accommodations segment as discontinued operations.
Selected Financial Data
(In thousands, except per share amounts)
|
|
Year Ended December 31,
|
||||||||||||||||||
|
|
2018
|
2017
|
2016
|
2015
|
2014
|
||||||||||||||
|
Statement of Operations Data:
|
|
|
|
|
|||||||||||||||
|
Revenues
|
$
|
1,088,133
|
|
$
|
670,627
|
|
$
|
694,444
|
|
$
|
1,099,977
|
|
$
|
1,819,609
|
|
||||
|
Costs and expenses:
|
|||||||||||||||||||
|
Product and service costs (exclusive of depreciation and amortization expense presented below)
|
834,513
|
|
520,755
|
|
526,770
|
|
785,698
|
|
1,205,884
|
|
|||||||||
|
Selling, general and administrative expenses
|
138,070
|
|
114,816
|
|
124,033
|
|
132,664
|
|
169,432
|
|
|||||||||
|
Depreciation and amortization expense
|
123,530
|
|
107,667
|
|
118,720
|
|
131,257
|
|
124,776
|
|
|||||||||
|
Other operating (income) expense, net
|
(2,104
|
)
|
1,261
|
|
(5,796
|
)
|
(4,648
|
)
|
9,262
|
|
|||||||||
|
|
1,094,009
|
|
744,499
|
|
763,727
|
|
1,044,971
|
|
1,509,354
|
|
|||||||||
|
Operating income (loss)
|
(5,876
|
)
|
(73,872
|
)
|
(69,283
|
)
|
55,006
|
|
310,255
|
|
|||||||||
|
Interest expense
|
(19,314
|
)
|
(4,674
|
)
|
(5,343
|
)
|
(6,427
|
)
|
(17,173
|
)
|
|||||||||
|
Interest income
|
319
|
|
359
|
|
399
|
|
543
|
|
560
|
|
|||||||||
|
Loss on extinguishment of debt
(1)
|
—
|
|
—
|
|
—
|
|
—
|
|
(100,380
|
)
|
|||||||||
|
Other income
|
3,139
|
|
775
|
|
902
|
|
1,446
|
|
3,082
|
|
|||||||||
|
Income (loss) from continuing operations before income taxes
|
(21,732
|
)
|
(77,412
|
)
|
(73,325
|
)
|
50,568
|
|
196,344
|
|
|||||||||
|
Income tax benefit (provision)
(2)
|
2,627
|
|
(7,438
|
)
|
26,939
|
|
(22,197
|
)
|
(69,117
|
)
|
|||||||||
|
Net income (loss) from continuing operations
|
(19,105
|
)
|
(84,850
|
)
|
(46,386
|
)
|
28,371
|
|
127,227
|
|
|||||||||
|
Net income (loss) from discontinued operations, net of tax
|
—
|
|
—
|
|
(4
|
)
|
226
|
|
51,776
|
|
|||||||||
|
Net income (loss)
|
$
|
(19,105
|
)
|
$
|
(84,850
|
)
|
$
|
(46,390
|
)
|
$
|
28,597
|
|
$
|
179,003
|
|
||||
|
Basic net income (loss) per share from:
|
|||||||||||||||||||
|
Continuing operations
|
$
|
(0.33
|
)
|
$
|
(1.69
|
)
|
$
|
(0.92
|
)
|
$
|
0.55
|
|
$
|
2.37
|
|
||||
|
Discontinued operations
|
—
|
|
—
|
|
—
|
|
0.01
|
|
0.96
|
|
|||||||||
|
Net income (loss)
|
$
|
(0.33
|
)
|
$
|
(1.69
|
)
|
$
|
(0.92
|
)
|
$
|
0.56
|
|
$
|
3.33
|
|
||||
|
Diluted net income (loss) per share from:
|
|||||||||||||||||||
|
Continuing operations
|
$
|
(0.33
|
)
|
$
|
(1.69
|
)
|
$
|
(0.92
|
)
|
$
|
0.55
|
|
$
|
2.35
|
|
||||
|
Discontinued operations
|
—
|
|
—
|
|
—
|
|
0.01
|
|
0.96
|
|
|||||||||
|
Net income (loss)
|
$
|
(0.33
|
)
|
$
|
(1.69
|
)
|
$
|
(0.92
|
)
|
$
|
0.56
|
|
$
|
3.31
|
|
||||
|
Weighted average number of common shares outstanding:
|
|||||||||||||||||||
|
Basic
|
58,712
|
|
50,139
|
|
50,174
|
|
50,269
|
|
52,862
|
|
|||||||||
|
Diluted
|
58,712
|
|
50,139
|
|
50,174
|
|
50,335
|
|
53,151
|
|
|||||||||
-
31
-
|
|
Year Ended December 31,
|
||||||||||||||||||
|
|
2018
|
2017
|
2016
|
2015
|
2014
|
||||||||||||||
|
Other Data:
|
|
|
|
|
|||||||||||||||
|
Net cash provided by continuing operating activities
|
$
|
103,170
|
|
$
|
95,382
|
|
$
|
149,257
|
|
$
|
255,768
|
|
$
|
302,644
|
|
||||
|
Net cash used in continuing investing activities, including acquisition of businesses and capital expenditures
|
(461,375
|
)
|
(47,615
|
)
|
(29,292
|
)
|
(147,196
|
)
|
(198,504
|
)
|
|||||||||
|
Net cash provided by (used in) continuing financing activities
|
324,058
|
|
(65,060
|
)
|
(84,875
|
)
|
(124,722
|
)
|
(378,912
|
)
|
|||||||||
|
EBITDA, as defined
(3)
|
120,793
|
|
34,570
|
|
50,339
|
|
187,709
|
|
438,113
|
|
|||||||||
|
Capital expenditures
|
88,024
|
|
35,171
|
|
29,689
|
|
114,738
|
|
199,256
|
|
|||||||||
|
Acquisitions of businesses, net of cash acquired
|
379,676
|
|
12,859
|
|
—
|
|
33,427
|
|
157
|
|
|||||||||
|
Cash used for treasury stock purchases
|
—
|
|
16,283
|
|
—
|
|
105,916
|
|
226,303
|
|
|||||||||
|
|
As of
December 31,
|
||||||||||||||||||
|
|
2018
|
2017
|
2016
|
2015
|
2014
|
||||||||||||||
|
Balance Sheet Data:
|
|
|
|
|
|||||||||||||||
|
Cash and cash equivalents
|
$
|
19,316
|
|
$
|
53,459
|
|
$
|
68,800
|
|
$
|
35,973
|
|
$
|
53,263
|
|
||||
|
Total current assets
|
534,031
|
|
455,937
|
|
489,977
|
|
611,473
|
|
826,666
|
|
|||||||||
|
Property, plant and equipment, net
|
540,427
|
|
498,890
|
|
553,402
|
|
638,725
|
|
649,846
|
|
|||||||||
|
Intangible assets, including goodwill
|
902,319
|
|
318,274
|
|
316,115
|
|
323,172
|
|
306,085
|
|
|||||||||
|
Total assets
|
2,003,821
|
|
1,301,511
|
|
1,383,898
|
|
1,596,471
|
|
1,806,167
|
|
|||||||||
|
Long-term debt, excluding current portion
|
306,177
|
|
4,870
|
|
45,388
|
|
125,887
|
|
143,390
|
|
|||||||||
|
Total stockholders' equity
|
1,439,768
|
|
1,132,713
|
|
1,204,307
|
|
1,255,672
|
|
1,340,657
|
|
|||||||||
We believe that net income (loss) attributable to continuing operations is the financial measure calculated and presented in accordance with generally accepted accounting principles that is most directly comparable to EBITDA as defined. The following table reconciles EBITDA as defined with our net income (loss) attributable to continuing operations, as derived from our financial information (in thousands):
|
|
Year Ended December 31,
|
||||||||||||||||||
|
|
2018
|
2017
|
2016
|
2015
|
2014
|
||||||||||||||
|
Net income (loss) from continuing operations
|
$
|
(19,105
|
)
|
$
|
(84,850
|
)
|
$
|
(46,386
|
)
|
$
|
28,371
|
|
$
|
127,227
|
|
||||
|
Depreciation and amortization expense
|
123,530
|
|
107,667
|
|
118,720
|
|
131,257
|
|
124,776
|
|
|||||||||
|
Interest expense, net
|
18,995
|
|
4,315
|
|
4,944
|
|
5,884
|
|
16,613
|
|
|||||||||
|
Loss on extinguishment of debt
(1)
|
—
|
|
—
|
|
—
|
|
—
|
|
100,380
|
|
|||||||||
|
Income tax provision (benefit)
(2)
|
(2,627
|
)
|
7,438
|
|
(26,939
|
)
|
22,197
|
|
69,117
|
|
|||||||||
|
EBITDA, as defined
(3)
|
$
|
120,793
|
|
$
|
34,570
|
|
$
|
50,339
|
|
$
|
187,709
|
|
$
|
438,113
|
|
||||
____________________
|
(1)
|
During 2014, we recognized losses on the extinguishment of debt totaling $100.4 million, primarily due to the repurchase of all of our then-outstanding 6.50% and 5.125% senior notes at a premium.
|
|
(2)
|
During 2017, we recorded a provisional non-cash charge of $28.2 million associated with U.S. income tax legislation enacted on December 22, 2017. During 2018, we adjusted our 2017 provisional estimate and recorded a tax benefit of
$5.8 million
following the issuance of updated guidance with respect to this U.S. income tax legislation. See Note
8
, "Income Taxes."
|
|
(3)
|
The term EBITDA as defined consists of net income (loss) attributable to continuing operations plus interest expense, net, loss on extinguishment of debt, income tax provision (benefit), depreciation and amortization expense. EBITDA as defined is not a measure of financial performance under generally accepted accounting principles. You should not consider it in isolation from or as a substitute for net income (loss) or cash flow measures prepared in accordance with generally accepted accounting principles or as a measure of profitability or liquidity. Additionally, EBITDA as defined may not be comparable to other similarly titled measures of other companies. We have included EBITDA as defined as a supplemental disclosure because our management believes that EBITDA as defined provides useful information regarding our ability to service debt and to fund capital expenditures and provides investors a helpful measure for comparing our operating performance with the performance of other companies that have different financing and capital structures or tax rates. We use EBITDA as defined to compare and to monitor the performance of our business segments to other comparable public companies and as a benchmark for the award of incentive compensation under our annual incentive compensation plan.
|
-
32
-
ITEM 7.
Management’s Discussion and Analysis of Financial Condition and Results of Operations
Management’s Discussion and Analysis of Financial Condition and Results of Operations contains “forward-looking statements” within the meaning of Section 27A of the Securities Act and Section 21E of the Exchange Act that are based on management’s current expectations, estimates and projections about our business operations. Our actual results may differ materially from those currently anticipated and expressed in such forward-looking statements as a result of numerous factors, including the known material factors set forth in “Part I, Item 1A. Risk Factors.” You should read the following discussion and analysis together with our Consolidated Financial Statements and the notes to those statements included elsewhere in this Annual Report on Form 10‑K.
We provide a broad range of products and services to the oil and gas industry through our Well Site Services, Downhole Technologies and Offshore/Manufactured Products business segments. Demand for our products and services is cyclical and substantially dependent upon activity levels in the oil and gas industry, particularly our customers’ willingness to invest capital in the exploration for and development of crude oil and natural gas reserves. Our customers’ capital spending programs are generally based on their cash flows and their outlook for near-term and long-term commodity prices, economic growth, commodity demand and estimates of resource production. As a result, demand for our products and services is largely sensitive to future expectations with respect to crude oil and natural gas prices.
Our consolidated results of operations for 2018 include contributions from the GEODynamics and Falcon acquisitions completed in the first quarter of 2018 and reflect the impact of current industry trends and customer spending activities which are directed toward growth in the U.S. shale play regions with a general slowing of investments in deepwater markets globally since the start of a prolonged industry downturn in 2014.
Recent Developments
In addition to capital spending, we have invested in acquisitions of businesses complementary to our growth strategy. Our acquisition strategy has allowed us to leverage our existing and acquired products and services into new geographic locations and has expanded the breadth of our technology and product offerings while allowing us to leverage our cost structure. We have made strategic and complementary acquisitions in each of our business segments in recent years.
On December 12, 2017 we entered into an agreement to acquire GEODynamics, Inc. ("GEODynamics"), which provides oil and gas perforation systems and downhole tools in support of completion, intervention, wireline and well abandonment operations. On January 12, 2018, we closed the acquisition of GEODynamics for total consideration of approximately $615 million (the "GEODynamics Acquisition"), consisting of (i) $295 million in cash (net of cash acquired), (ii) approximately 8.66 million shares of our common stock and (iii) an unsecured $25 million promissory note.
In connection with the GEODynamics Acquisition, we completed several financing transactions to extend the maturity of our debt while providing us with the flexibility to repay outstanding borrowings under our revolving credit facility with anticipated future cash flows from operations. On January 30, 2018, we sold $200.0 million aggregate principal amount of our 1.50% convertible senior notes due February 2023 (the "Notes") through a private placement to qualified institutional buyers. We received net proceeds from the offering of the Notes of approximately $194 million, after deducting issuance costs. We used the net proceeds from the sale of the Notes to repay a portion of the borrowings outstanding under our revolving credit facility (the "Revolving Credit Facility"), substantially all of which were drawn to fund the cash portion of the purchase price paid for GEODynamics.
Concurrently with the Notes offering, we amended our Revolving Credit Facility (the "Amended Revolving Credit Facility"), to extend the maturity date to January 30, 2022, permit the issuance of the Notes and provide for up to $350 million in borrowing capacity.
On February 28, 2018, we acquired Falcon Flowback Services, LLC ("Falcon"), a full service provider of flowback and well testing services for the separation and recovery of fluids, solid debris and proppant used during hydraulic fracturing operations. Falcon provides additional scale and diversity to our Completion Services business in key shale plays in the United States. The acquisition price was $84.2 million (net of cash acquired), subject to customary post-closing purchase price adjustments. The Falcon acquisition was funded with borrowings under our Amended Revolving Credit Facility.
See Note
5
, "Business Acquisitions" and Note
7
, "Long-term Debt" to the Consolidated Financial Statements included in this Annual Report on Form 10-K for further discussion of these recent developments.
-
33
-
Macroeconomic Environment
The macroeconomic environment for the energy sector has been volatile in recent years. Significant downward crude oil price volatility began early in the fourth quarter of 2014 and continued on a downward trend into 2016. In response to weak crude oil prices, the Organization of Petroleum Exporting Countries ("OPEC"), along with Russia, agreed to reduce crude oil production in late 2016 in an effort to re-balance crude oil supply and demand in the market. Crude oil prices began to improve in the second half of 2017, which carried into 2018. During 2018, crude oil prices rose to their highest levels since the downturn began in late 2014, improving our customers' cash flow and potentially driving them to invest additional capital to increase their production. Additionally, advancements in technologies and improved operating efficiencies have allowed the U.S. exploration and production industry to lower the breakeven price of oil and gas production. The U.S. Energy Information Administration ("EIA") estimates that U.S. crude oil production averaged 10.9 million barrels per day in 2018, up approximately 17% from the 2017 average, reaching its highest level and experiencing the largest volume growth on record. However, during the fourth quarter of 2018, crude oil prices declined approximately 40%, due in part to higher than expected supply growth from the United States, Russia and Saudi Arabia, as well as concerns over the possible slowing of global demand growth. In response to the precipitous decline in crude oil prices, OPEC and Russia agreed to reduce production and the Canadian government mandated a production shut-in in December of 2018. While these and other events should provide support for a more balanced supply and demand environment later in 2019, the EIA currently forecasts that the average price per barrel of crude oil in 2019 will be approximately 15% below the 2018 average.
As shown in the table that follows, West Texas Intermediate ("WTI") and Brent crude oil prices averaged
$65
per barrel and
$71
per barrel, respectively, in 2018, up
28%
and
32%
, respectively, compared to 2017 average prices. Rising crude oil prices rapidly translated into increased U.S. land oriented drilling and completion activity during 2017 and 2018 in areas of concentrated activity such as the Permian Basin, which led to record high domestic production. Spending in the U.S. shale play regions positively influenced overall drilling and completion activity, with the average U.S. rig count for 2018 improving
18%
compared to 2017. This drove improvements in activity for our Well Site Services segment as well as demand for our Downhole Technologies' products and short-cycle products offered by our Offshore/Manufactured Products segment. Production in the Permian Basin grew at such a rapid rate that it tested the limits of pipeline take away capacity out of the basin in 2018, leading to a significant differential between crude oil prices realized locally (e.g. WTI-Midland) compared to Brent crude oil prices, which limited the revenue and cash flow growth for many of our customers. As discussed above, crude oil prices declined materially in the fourth quarter of 2018 – with WTI closing at $45 per barrel on December 28, 2018. This decline in crude oil prices had a moderating impact on our fourth quarter 2018 consolidated results of operations, particularly in U.S. shale play regions, and will likely negatively impact customers' 2019 budgets. As a result, we expect certain customer-driven activity declines in early 2019, as operators reassess their budgets and plans in light of lower commodity prices. Current and expected future pricing for WTI crude will continue to influence our customers’ spending in U.S. shale play developments as they look to spend within their generated cash flow ranges. Expectations for the longer-term price for Brent crude oil will continue to influence our customers’ spending related to global offshore drilling and development and, thus, a significant portion of the activity of our Offshore/Manufactured Products segment.
Given the historical volatility of crude oil prices, there remains a degree of risk that prices could remain at current levels or deteriorate further due to increases in global inventory levels, increasing domestic crude oil production, U.S. and China trade tensions, sanctions or waivers on Iranian production, civil unrest in Libya, increasing price differentials between markets, slowing growth rates in China and other global regions, use of alternative fuels, improved vehicle fuel efficiency, a more sustained movement to electric vehicles and/or the potential for ongoing supply/demand imbalances. Conversely, if the global supply of crude oil were to decrease due to a prolonged reduction in capital investment by our customers or if government instability in a major oil-producing nation develops, and energy demand were to continue to increase, a sustained recovery in WTI and Brent crude oil prices could occur. In any event, crude oil price improvements will depend upon the balance of global supply and demand, with a corresponding continued reduction in global inventories.
Natural gas prices have remained relatively constant during 2017 and 2018 – averaging approximately $3 per mmBtu. Customer spending in the natural gas shale plays has been limited due to natural gas production from prolific basins in the Northeastern United States and from associated gas produced from the drilling and completion of unconventional oil wells in North America.
-
34
-
Recent WTI crude oil, Brent crude oil and natural gas pricing trends are as follows:
|
|
Average price
(1)
for quarter ended
|
Average price
(1)
for year ended December 31
|
||||||||||||||||||
|
Year
|
March 31
|
June 30
|
September 30
|
December 31
|
||||||||||||||||
|
WTI Crude (per bbl)
|
||||||||||||||||||||
|
2018
(2)
|
$
|
62.91
|
|
$
|
68.07
|
|
$
|
69.70
|
|
$
|
59.97
|
|
$
|
65.25
|
|
|||||
|
2017
|
51.62
|
|
48.14
|
|
48.18
|
|
55.27
|
|
50.80
|
|
||||||||||
|
2016
|
33.35
|
|
45.46
|
|
44.85
|
|
49.14
|
|
43.29
|
|
||||||||||
|
2015
|
48.49
|
|
57.85
|
|
46.49
|
|
41.94
|
|
48.66
|
|
||||||||||
|
Brent Crude (per bbl)
|
||||||||||||||||||||
|
2018
(2)
|
$
|
66.86
|
|
$
|
74.53
|
|
$
|
75.08
|
|
$
|
68.76
|
|
$
|
71.32
|
|
|||||
|
2017
|
53.59
|
|
49.59
|
|
52.10
|
|
61.40
|
|
54.12
|
|
||||||||||
|
2016
|
33.84
|
|
45.57
|
|
45.80
|
|
49.11
|
|
43.67
|
|
||||||||||
|
2015
|
53.98
|
|
61.65
|
|
50.44
|
|
43.56
|
|
52.32
|
|
||||||||||
|
Henry Hub Natural Gas (per mmBtu)
|
||||||||||||||||||||
|
2018
|
$
|
3.08
|
|
$
|
2.85
|
|
$
|
2.93
|
|
$
|
3.77
|
|
$
|
3.15
|
|
|||||
|
2017
|
3.02
|
|
3.08
|
|
2.95
|
|
2.90
|
|
2.99
|
|
||||||||||
|
2016
|
1.99
|
|
2.15
|
|
2.88
|
|
3.04
|
|
2.52
|
|
||||||||||
|
2015
|
2.90
|
|
2.75
|
|
2.76
|
|
2.12
|
|
2.62
|
|
||||||||||
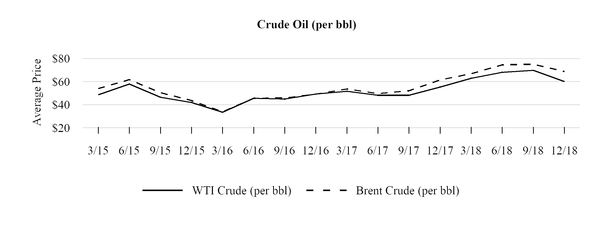
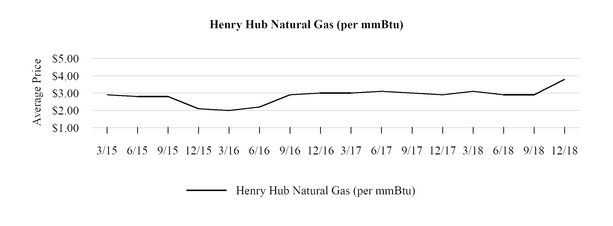
____________________
|
(1)
|
Source: U.S. Energy Information Administration. As of February 15, 2019, WTI crude oil, Brent crude oil and natural gas traded at approximately $55.58 per barrel, $66.41 per barrel and $2.59 per mmBtu, respectively.
|
|
(2)
|
Reflecting the impact of pipeline take away capacity constraints from the Permian Basin in 2018, the average price per barrel for WTI (Midland, Texas) crude oil for the first, second, third and fourth quarters of 2018 was approximately 1%, 12%, 21% and 11%, respectively, below the average WTI crude oil quarterly benchmark prices referenced, which are based on the spot price of WTI at Cushing, Oklahoma. Average Brent crude oil prices for the first, second, third and fourth quarters of 2018 were 7%, 24%, 36% and 28%, respectively, above the corresponding average WTI (Midland, Texas) crude oil prices. As of February 15, 2019, WTI crude oil price was comparable to WTI (Midland, Texas) crude oil price due to reductions in pipeline take away capacity constraints from the Permian Basin.
|
-
35
-
Overview
Our Well Site Services segment provides completion services and, to a lesser extent, land drilling services in the United States (including the Gulf of Mexico), Canada and the rest of the world. U.S. drilling and completion activity and, in turn, our Well Site Services results, are sensitive to near-term fluctuations in commodity prices, particularly WTI crude oil prices, given the short-term, call-out nature of its operations.
Within this segment, our Completion Services business (which includes the Falcon operations we acquired in February 2018) supplies equipment and service personnel utilized in the completion and initial production of new and recompleted wells. Activity for the Completion Services business is dependent primarily upon the level and complexity of drilling, completion, and workover activity in the areas of operations mentioned above. Well intensity and complexity has increased with the continuing transition to multi-well pads, the drilling of longer lateral wells and increased downhole pressures, along with the increased number of frac stages completed in horizontal wells. Similarly, demand for our Drilling Services operations is driven by activity in our primary land drilling markets of the Permian Basin in West Texas, where we drill oil wells, and the U.S. Rocky Mountain area, where we drill both liquids-rich and natural gas wells.
Our Downhole Technologies segment is comprised of the GEODynamics business we acquired in January 2018. GEODynamics was founded in 2004 as a researcher, developer and manufacturer of consumable engineered products used in completion applications. This segment provides oil and gas perforation systems, downhole tools and services in support of completion, intervention, wireline and well abandonment operations. This segment designs, manufactures and markets its consumable engineered products to oilfield service as well as exploration and production companies. Product and service offerings for this segment include innovations in perforation technology through patented and proprietary systems combined with advanced modeling and analysis tools. This expertise has led to the optimization of perforation hole size, depth, and quality of tunnels, which are key factors for maximizing the effectiveness of hydraulic fracturing. Additional offerings include proprietary toe valve and frac plug products, which are focused on zonal isolation for hydraulic fracturing of horizontal wells, and a broad range of consumable products, such as setting tools and bridge plugs, that are used in completion, intervention and decommissioning applications. Demand drivers for the Downhole Technologies segment include continued trends toward longer lateral lengths, increased frac stages and more perforation clusters to target increased unconventional well productivity.
Demand for our Well Site Services and Downhole Technologies segments' businesses is correlated to changes in the total number of wells drilled in North America, total footage drilled, the number of drilled wells that are completed and, to a lesser degree, changes in the drilling rig count. The following table sets forth a summary of the average North American drilling rig count, as measured by Baker Hughes, for the periods indicated.
|
|
As of February 15, 2019
|
Average Rig Count for Year Ended December 31,
|
|||||||||||||||
|
|
2018
|
2017
|
2016
|
2015
|
2014
|
||||||||||||
|
U.S. Land – Oil
|
840
|
|
826
|
|
684
|
|
390
|
|
723
|
|
1,486
|
|
|||||
|
U.S. Land – Natural gas and other
|
188
|
|
185
|
|
169
|
|
97
|
|
219
|
|
319
|
|
|||||
|
U.S. Offshore
|
23
|
|
21
|
|
23
|
|
25
|
|
35
|
|
57
|
|
|||||
|
Total U.S.
|
1,051
|
|
1,032
|
|
876
|
|
512
|
|
977
|
|
1,862
|
|
|||||
|
Canada
|
224
|
|
191
|
|
206
|
|
129
|
|
193
|
|
380
|
|
|||||
|
Total North America
|
1,275
|
|
1,223
|
|
1,082
|
|
641
|
|
1,170
|
|
2,242
|
|
|||||
Over recent years, our industry experienced increased customer spending in crude oil and liquids-rich exploration and development in the North American shale plays utilizing horizontal drilling and completion techniques. As of
December 31, 2018
, oil-directed drilling accounted for
82%
of the total U.S. rig count – with the balance largely natural gas related. The average North American rig count in
2018
increased
141
rigs, or
13%
, from the level reported in
2017
, in response to the increase in crude oil prices during the first nine months of 2018.
Exacerbating the steep declines in drilling activity experienced in 2015 and 2016, many of our exploration and production customers deferred well completions. These deferred completions are referred to in the industry as drilled but uncompleted wells (or "DUCs"). Given our Well Site Services and Downhole Technologies segments' exposure to the level of completion activity, an increase in the number of DUCs will have a short-term negative impact on our results of operations relative to the rig count trends but over the longer-term should have a positive impact on the segments' results as the wells are completed.
Our Offshore/Manufactured Products segment provides technology-driven, highly-engineered products and services for offshore oil and natural gas production systems and facilities, as well as certain products and services to the offshore and land-based drilling and completion markets. Approximately 60% of Offshore/Manufactured Products sales in 2016 were driven by our customers’ capital spending for offshore production systems and subsea pipelines, repairs and, to a lesser extent, upgrades of existing offshore drilling
-
36
-
rigs and construction of new offshore drilling rigs and vessels (referred to herein as "project-driven products"). During
2018
, these activities only represent approximately
31%
of the segment's revenue. This segment is particularly influenced by global deepwater drilling and production spending, which are driven largely by our customers’ longer-term commodity demand forecasts and outlook for crude oil and natural gas prices. Deepwater oil and gas development projects typically involve significant capital investments and multi-year development plans. Such projects are generally undertaken by larger exploration, field development and production companies (primarily international oil companies ("IOCs") and state-run national oil companies ("NOCs")) using relatively conservative crude oil and natural gas pricing assumptions. Given the longer lead times associated with field development, we believe some of these deepwater projects, once approved for development, are therefore less susceptible to short-term fluctuations in the price of crude oil and natural gas. However, the decline in crude oil prices that began in 2014 and continued into 2017, coupled with the relatively uncertain outlook around shorter-term and possibly longer-term pricing improvements, caused exploration and production companies to reduce their capital expenditures in regards to these deepwater projects since they are expensive to drill and complete, have long lead times to first production and may be considered uneconomical relative to the risk involved. Customers have focused on improving the economics of major deepwater projects at lower commodity breakeven prices by re-bidding projects, identifying advancements in technology, and reducing overall project costs through equipment standardization. As a result, our bookings declined, leading to substantially reduced backlog and project-driven revenue in
2018
relative to prior years.
Our Offshore/Manufactured Products segment revenues and operating income declined at a slower pace during 2015 and 2016 than our Well Site Services segment given the high levels of backlog that existed at the beginning of 2015. Bidding and quoting activity, along with orders from customers, for our Offshore/Manufactured Products segment continued after 2014, albeit at a substantially slower pace in the years following 2014. However, deepwater project award potential appears to be improving despite the current commodity price environment. Reflecting the impact of customer (both IOCs and NOCs) delays and deferrals in approving major, capital intensive projects in light of the prolonged low commodity price environment, backlog in our Offshore/Manufactured Products segment decreased from $599 million at June 30, 2014 to
$179 million
at
December 31, 2018
. The following table sets forth backlog for our Offshore/Manufactured Products segment as of the dates indicated (in millions).
|
|
Backlog as of
|
|||||||||||||||
|
Year
|
March 31
|
June 30
|
September 30
|
December 31
|
||||||||||||
|
2018
|
$
|
157
|
|
$
|
165
|
|
$
|
175
|
|
$
|
179
|
|
||||
|
2017
|
204
|
|
202
|
|
198
|
|
168
|
|
||||||||
|
2016
|
306
|
|
268
|
|
203
|
|
199
|
|
||||||||
|
2015
|
474
|
|
409
|
|
394
|
|
340
|
|
||||||||
Reduced demand for our products and services, coupled with a reduction in the prices we charge our customers for our services, has adversely affected our results of operations, cash flows and financial position since the second half of 2014. If the current pricing environment for crude oil does not improve, or declines further, our customers may be required to further reduce their capital expenditures, causing additional declines in the demand for, and prices of, our products and services, which would adversely affect our results of operations, cash flows and financial position. Our customers have experienced a significant decline in their revenues and cash flows relative to the commodity price declines in 2015, 2016 and into 2017, and again late in 2018, with many experiencing a significant reduction in liquidity. Several exploration and production companies declared bankruptcy during 2015 and 2016, or had to exchange equity for the forgiveness of debt, and others were forced to sell assets in an effort to preserve liquidity. However, in 2017, access to capital and the debt markets improved for certain of these customers. As we moved in to the latter half of 2018, access to these same markets once again became very challenging for certain customers.
We use a variety of domestically produced and imported raw materials and component products, including steel, in manufacturing our products. The United States recently imposed tariffs on a variety of imported products, including steel and aluminum. In response to the U.S. tariffs on steel and aluminum, the European Union and several other countries, including Canada and China, have threatened and/or imposed retaliatory tariffs. The effect of these new tariffs and the application and interpretation of existing trade agreements and customs, anti-dumping and countervailing duty regulations continue to evolve, and we continue to monitor these matters. If we encounter difficulty in procuring these raw materials and component products, or if the prices we have to pay for these products increase as a result of customs, anti-dumping and countervailing duty regulations or otherwise, and we are unable to pass corresponding cost increases on to our customers, our financial position and results of operations could be adversely affected. Furthermore, uncertainty with respect to potential costs in the drilling and completion of oil and gas wells could cause our customers to delay or cancel planned projects which, if this occurred, would adversely affect our financial position and results of operations.
Other factors that can affect our business and financial results include but are not limited to the general global economic environment, competitive pricing pressures, regulatory changes and changes in tax laws in the United States and international markets. We continue to monitor the global economy, the prices of and demand for crude oil and natural gas, and the resultant impact on the capital spending plans and operations of our customers in order to plan and manage our business.
-
37
-
Consolidated Results of Operations
We manage and measure our business performance in three operating segments: Well Site Services, Downhole Technologies and Offshore/Manufactured Products. Selected financial information by business segment for the years ended
December 31, 2018
,
2017
and
2016
is summarized as follows (dollars in thousands):
|
|
Year Ended December 31,
|
||||||||||||||||||||||||
|
|
|
|
Variance 2018 vs. 2017
|
|
Variance 2017 vs. 2016
|
||||||||||||||||||||
|
|
2018
|
2017
|
$
|
%
|
2016
|
$
|
%
|
||||||||||||||||||
|
Revenues
|
|
|
|
|
|
|
|
|
|
||||||||||||||||
|
Well Site Services -
|
|
|
|
|
|
|
|
|
|
||||||||||||||||
|
Completion Services
|
$
|
411,019
|
|
$
|
234,252
|
|
$
|
176,767
|
|
75
|
%
|
$
|
163,060
|
|
$
|
71,192
|
|
44
|
%
|
||||||
|
Drilling Services
|
69,235
|
|
54,462
|
|
14,773
|
|
27
|
%
|
22,594
|
|
31,868
|
|
141
|
%
|
|||||||||||
|
Total Well Site Services
|
480,254
|
|
288,714
|
|
191,540
|
|
66
|
%
|
185,654
|
|
103,060
|
|
56
|
%
|
|||||||||||
|
Downhole Technologies
|
213,813
|
|
—
|
|
213,813
|
|
n.m.
|
|
—
|
|
—
|
|
n.m.
|
|
|||||||||||
|
Offshore/Manufactured Products -
|
|||||||||||||||||||||||||
|
Project-driven products
|
120,894
|
|
126,960
|
|
(6,066
|
)
|
(5
|
)%
|
296,368
|
|
(169,408
|
)
|
(57
|
)%
|
|||||||||||
|
Short-cycle products
|
144,367
|
|
147,463
|
|
(3,096
|
)
|
(2
|
)%
|
88,291
|
|
59,172
|
|
67
|
%
|
|||||||||||
|
Other products and services
|
128,805
|
|
107,490
|
|
21,315
|
|
20
|
%
|
124,131
|
|
(16,641
|
)
|
(13
|
)%
|
|||||||||||
|
Total Offshore/Manufactured Products
|
394,066
|
|
381,913
|
|
12,153
|
|
3
|
%
|
508,790
|
|
(126,877
|
)
|
(25
|
)%
|
|||||||||||
|
Total
|
$
|
1,088,133
|
|
$
|
670,627
|
|
$
|
417,506
|
|
62
|
%
|
$
|
694,444
|
|
$
|
(23,817
|
)
|
(3
|
)%
|
||||||
|
Operating income loss
(1)
|
|||||||||||||||||||||||||
|
Well Site Services -
|
|||||||||||||||||||||||||
|
Completion Services
|
$
|
(7,647
|
)
|
$
|
(45,169
|
)
|
$
|
37,522
|
|
(83
|
)%
|
$
|
(83,636
|
)
|
$
|
38,467
|
|
(46
|
)%
|
||||||
|
Drilling Services
|
(9,363
|
)
|
(13,909
|
)
|
4,546
|
|
(33
|
)%
|
(24,239
|
)
|
10,330
|
|
(43
|
)%
|
|||||||||||
|
Total Well Site Services
|
(17,010
|
)
|
(59,078
|
)
|
42,068
|
|
(71
|
)%
|
(107,875
|
)
|
48,797
|
|
(45
|
)%
|
|||||||||||
|
Downhole Technologies
|
26,705
|
|
—
|
|
26,705
|
|
n.m.
|
|
—
|
|
—
|
|
n.m.
|
|
|||||||||||
|
Offshore/Manufactured Products
|
38,914
|
|
38,155
|
|
759
|
|
2
|
%
|
87,084
|
|
(48,929
|
)
|
(56
|
)%
|
|||||||||||
|
Corporate
|
(54,485
|
)
|
(52,949
|
)
|
(1,536
|
)
|
3
|
%
|
(48,492
|
)
|
(4,457
|
)
|
9
|
%
|
|||||||||||
|
Total
|
$
|
(5,876
|
)
|
$
|
(73,872
|
)
|
$
|
67,996
|
|
(92
|
)%
|
$
|
(69,283
|
)
|
$
|
(4,589
|
)
|
7
|
%
|
||||||
|
Operating income (loss) as a percentage of revenues
(1)
|
|
|
|
|
|
|||||||||||
|
Well Site Services -
|
|
|
|
|
|
|
|
|
|
|
||||||
|
Completion Services
|
(2
|
)%
|
(19
|
)%
|
|
|
(51
|
)%
|
|
|
||||||
|
Drilling Services
|
(14
|
)%
|
(26
|
)%
|
|
|
(107
|
)%
|
|
|
||||||
|
Total Well Site Services
|
(4
|
)%
|
(20
|
)%
|
|
|
(58
|
)%
|
|
|
||||||
|
Downhole Technologies
|
12
|
%
|
—
|
%
|
—
|
%
|
||||||||||
|
Offshore/Manufactured Products
|
10
|
%
|
10
|
%
|
|
|
17
|
%
|
|
|
||||||
|
Total
|
(1
|
)%
|
(11
|
)%
|
|
|
(10
|
)%
|
|
|
||||||
____________________
|
(1)
|
Operating margin is defined as operating income (loss) divided by revenues.
|
-
38
-
YEAR ENDED DECEMBER 31,
2018
COMPARED TO YEAR ENDED DECEMBER 31,
2017
Net loss for the year ended
December 31, 2018
was
$19.1 million
, or
$(0.33)
per diluted share, which included
$8.4 million
(
$6.6 million
after-tax, or
$0.11
per diluted share) of charges related to legal fees incurred for patent defense and
$3.0 million
in reserves (
$2.4 million
after-tax, or
$0.04
per diluted share) for prior years' Fair Labor Standards Act ("FLSA") claim settlements,
$3.3 million
(
$2.6 million
after-tax, or
$0.04
per diluted share) of transaction-related expenses and
$1.6 million
(
$1.3 million
after-tax, or
$0.02
per diluted share) of severance and other downsizing changes. Additionally, during the year ended
December 31, 2018
the Company recognized a
$5.8 million
(
$0.10
per diluted share) income tax benefit related to a change in its December 2017 provisional estimates with respect to U.S. tax reform legislation. These results compare to a net loss for the year ended December 31, 2017 of $84.9 million, or $(1.69) per diluted share, which included $3.4 million ($2.4 million after-tax, or $0.05 per diluted share) of severance and other downsizing charges and $29.2 million ($0.58 per diluted share) of additional non-cash income tax expense primarily related to U.S. tax law changes.
Our consolidated results of operations for 2018 include contributions from the GEODynamics and Falcon acquisitions completed in the first quarter of 2018 and reflect the impact of industry trends and customer spending activities which are directed toward growth in the U.S. shale play regions with a general slowing of global investments in deepwater markets since the start of a prolonged industry downturn in 2014.
During the fourth quarter of 2018, the price of crude oil fell approximately 40% – with WTI closing at $45 per barrel on December 28, 2018. This precipitous decline in crude oil prices had a moderate negative impact on our fourth quarter 2018 consolidated results of operations, particularly in the U.S. shale play regions. We expect further customer-driven activity declines in early 2019 as operators reassess their budgets and plans in light of lower commodity prices. If the current pricing environment for crude oil does not improve, or declines further, our customers may be required to further reduce their capital expenditures, causing additional declines in the demand for, and prices of, our products and services, which would adversely affect our results of operations, cash flows and financial position.
Revenues.
Consolidated total revenues increased
$417.5 million
, or
62%
in 2018 compared to 2017. Consolidated product revenues in 2018 increased
$198.0 million
, or
65%
, from 2017, reflecting contributions from the acquired GEODynamics operations. Consolidated service revenues for 2018 increased
$219.5 million
, or
60%
, from 2017 due principally to contributions from the acquired Falcon operations and higher customer-driven activity within the Well Site Services and Offshore/Manufactured Products segments. As can be derived from the following table,
77%
of our consolidated revenues in 2018 were related to our short-cycle product and service offerings, which compared to
65%
in 2017, due principally to contributions from our first quarter 2018 acquisitions and higher customer spending in the U.S. shale play regions.
The following table provides disaggregated revenue information by operating segment for the years ended December 31, 2018 and 2017 (in thousands):
|
Well Site Services
|
Downhole Technologies
|
Offshore/ Manufactured Products
|
Total
|
||||||||||||||||||||||||||||
|
2018
|
2017
|
2018
|
2017
|
2018
|
2017
|
2018
|
2017
|
||||||||||||||||||||||||
|
Major revenue categories -
|
|||||||||||||||||||||||||||||||
|
Project-driven products
|
$
|
—
|
|
$
|
—
|
|
$
|
—
|
|
$
|
—
|
|
$
|
120,894
|
|
$
|
126,960
|
|
$
|
120,894
|
|
$
|
126,960
|
|
|||||||
|
Short-cycle:
|
|||||||||||||||||||||||||||||||
|
Completion products and services
|
411,019
|
|
234,252
|
|
213,813
|
|
—
|
|
116,383
|
|
117,914
|
|
741,215
|
|
352,166
|
|
|||||||||||||||
|
Drilling services
|
69,235
|
|
54,462
|
|
—
|
|
—
|
|
—
|
|
—
|
|
69,235
|
|
54,462
|
|
|||||||||||||||
|
Other products
|
—
|
|
—
|
|
—
|
|
—
|
|
27,984
|
|
29,549
|
|
27,984
|
|
29,549
|
|
|||||||||||||||
|
Total short-cycle
|
480,254
|
|
288,714
|
|
213,813
|
|
—
|
|
144,367
|
|
147,463
|
|
838,434
|
|
436,177
|
|
|||||||||||||||
|
Other products and services
|
—
|
|
—
|
|
—
|
|
—
|
|
128,805
|
|
107,490
|
|
128,805
|
|
107,490
|
|
|||||||||||||||
|
$
|
480,254
|
|
$
|
288,714
|
|
$
|
213,813
|
|
$
|
—
|
|
$
|
394,066
|
|
$
|
381,913
|
|
$
|
1,088,133
|
|
$
|
670,627
|
|
||||||||
|
Percentage of total revenue by type -
|
|||||||||||||||||||||||
|
Products
|
—
|
%
|
—
|
%
|
97
|
%
|
—
|
%
|
75
|
%
|
80
|
%
|
46
|
%
|
45
|
%
|
|||||||
|
Services
|
100
|
%
|
100
|
%
|
3
|
%
|
—
|
%
|
25
|
%
|
20
|
%
|
54
|
%
|
55
|
%
|
|||||||
Cost of Revenues (exclusive of Depreciation and Amortization Expense).
Our consolidated cost of revenues (exclusive of depreciation and amortization expense) increased
$313.8 million
, or
60%
, in 2018 compared to 2017, due to costs associated with the acquisitions completed in the first quarter of 2018 as well as activity-driven costs associated with revenue growth within the Well Site Services and Offshore/Manufactured Products segments.
-
39
-
Consolidated product costs in 2018 increased
$147.0 million
, or
67%
, from 2017 due primarily to the GEODynamics acquisition completed in first quarter 2018. Consolidated service costs for 2018 increased
$166.8 million
, or
55%
, from 2017 driven by the significant increase in service activity coupled with the acquired Falcon operations.
Selling, General and Administrative Expense.
Selling, general and administrative expense increased
$23.3 million
, or
20%
, in 2018 from the prior-year period primarily due to incremental expenses associated with the acquired GEODynamics operations (including
$8.4 million
of patent defense costs), higher activity levels and $1.0 million of transaction-related costs.
Depreciation and Amortization Expense.
Depreciation and amortization expense increased
$15.9 million
, or
15%
, in 2018 compared to 2017 reflecting the impact of the acquired GEODynamics and Falcon operations, which was partially offset by certain assets becoming fully depreciated. Note
14
, "Segments and Related Information," presents depreciation and amortization expense by segment.
Other Operating (Income) Expense, Net.
Other operating (income) expense moved from an expense of
$1.3 million
in 2017 to income of
$2.1 million
in 2018. During 2018, our Offshore/Manufactured Products segment recognized a gain of
$3.9 million
in settlement of a Hurricane Harvey flood insurance claim, which was partially offset by $2.3 million in transaction-related expenses. Other operating expense in the prior-year was primarily related to foreign currency exchange losses.
Operating Loss.
Our consolidated operating loss was
$5.9 million
in 2018, which included
$11.4 million
of costs associated with patent defense and settlement of FLSA claims,
$3.3 million
of transaction-related expense and
$1.6 million
of severance and other downsizing charges partially offset by a
$3.9 million
gain related to the insurance settlement discussed previously. This compares to a consolidated operating loss of
$73.9 million
in 2017, which included $3.4 million of transaction-related, severance and facility closure charges. The majority of the year-over-year improvement in operating results reflects contributions from the GEODynamics and Falcon acquisitions completed in the first quarter of 2018 as well as the impact of growth in customer spending activities which was primarily focused in the U.S. shale play regions.
Interest Expense and Interest Income.
Net interest expense was
$19.0 million
in 2018, an increase of
$14.7 million
from 2017. This increase reflects our funding during the first quarter of 2018 of $379.7 million in net acquisition consideration through borrowings under our revolving credit facility and issuance of the Notes. Interest expense as a percentage of total average debt outstanding decreased from
17.3%
in 2017 to
5.6%
in 2018. Interest expense as a percentage of total average debt outstanding in 2017 reflects lower average borrowings outstanding under our revolving credit facility and an increased proportion of interest expense associated with unused commitment fees and non-cash amortization of debt issuance costs.
Income Tax.
Our income tax
benefit
for 2018 was
$2.6 million
on a pre-tax loss of
$21.7 million
, which includes a $5.8 million discrete tax benefit related to recent U.S. tax reform guidance allowing the carry back of U.S. net operating losses incurred in 2017 as well as other discrete tax attributes. This compares to an income tax benefit for 2017 of
$7.4 million
on a pre-tax loss of $77.4 million (an income tax benefit of $21.8 million after excluding the discrete charges discussed below).
On December 22, 2017, the United States enacted Tax Reform Legislation which resulted in significant changes to U.S. tax and related law, including certain key federal income tax provisions applicable to multinational companies such as ours. As a result of the tax law changes, we recorded $28.2 million of incremental non-cash income tax expense related to the U.S. transition tax on our unremitted foreign subsidiary earnings and to provide valuation allowances against our foreign tax credit carryforwards (which were recorded as assets prior to U.S. tax reform). Additionally, we re-measured our other U.S. deferred tax assets and liabilities to reflect the lower U.S. corporate income tax rate which was reduced from 35% to 21%. We also recorded a discrete tax charge of $1.0 million during 2017 related to the decision to carryback 2016 U.S. net operating losses against 2014 taxable income.
Other Comprehensive
Income
(Loss).
Reported comprehensive loss is the sum of the reported net income (loss) and other comprehensive income (loss). Other comprehensive loss was
$12.9 million
in 2018 compared to other comprehensive income of
$11.8 million
in 2017 due to fluctuations in foreign currency exchange rates compared to the U.S. dollar for certain of the international operations of our reportable segments. For 2018 and 2017, currency translation adjustments recognized as a component of other comprehensive income (loss) were primarily attributable to the United Kingdom and Brazil. During 2018, the exchange rates for the British pound and the Brazilian real weakened compared to the U.S. dollar. This compares to 2017, when the exchange rates for the British pound strengthened and the Brazilian real weakened compared to the U.S. dollar.
-
40
-
Segment Operating Results
Well Site Services
Revenues.
Our Well Site Services segment revenues increased
$191.5 million
, or
66%
, in 2018 compared to 2017. This growth was concentrated in Completion Services, where revenues increased
$176.8 million
, or
75%
, reflecting revenue generated by the acquired Falcon operations and increased completion-related activity in the United States. The number of Completion Services jobs performed in 2018 increased
58%
over 2017 and revenue per Completion Services job increased
11%
year-over-year. Our Drilling Services revenues increased
$14.8 million
, or
27%
, to
$69.2 million
in 2018 from 2017 primarily as a result of improved dayrates for our land drilling rigs and a higher level of third-party costs reimbursed by our customers.
Operating Loss.
With higher revenues, our Well Site Services segment operating loss declined
$42.1 million
, or
71%
, in 2018 from 2017. Well Site Services segment revenues and cost of services for 2018 increased
66%
and
59%
, respectively, from the prior year, with other costs and expenses remaining relatively consistent. Our Completion Services operating loss improved
$37.5 million
, or
83%
, in 2018 compared to 2017, due to increased completion-related activity levels in the United States coupled with ten months of contributions from the acquired Falcon operations. Current year results include
$3.0 million
in charges (presented within cost of services) associated with additional reserves established for the final settlement of historical FLSA claims. During 2017, reported results included $1.1 million of severance and other downsizing costs. Our Drilling Services operating loss declined
$4.5 million
, or
33%
, in 2018 from 2017 primarily as a result of the reported revenue growth.
Downhole Technologies
Revenues.
Our Downhole Technologies segment revenues were
$213.8 million
in 2018 reflecting the activity of the GEODynamics operations acquired in January 2018.
Operating Income.
Our Downhole Technologies segment operating income was
$26.7 million
in 2018. Reported results were negatively impacted by
$8.4 million
of patent defense costs. The legal actions were settled in the fourth quarter of 2018 and the Company does not, therefore, expect these patent defense costs to recur in 2019.
Offshore/Manufactured Products
Revenues.
Our Offshore/Manufactured Products segment revenues increased
$12.2 million
, or
3%
, in 2018 compared 2017 as a result of higher sales of other products and service offerings. Service revenue increased 28% from the prior year's level driven by higher customer demand while project-driven products revenues decreased
5%
year-over-year due to lower sales of production and subsea equipment, which was partially offset by higher sales of our standard connector products.
Operating Income.
Our Offshore/Manufactured Products segment operating income increased
$0.8 million
, or
2%
, in 2018 compared to 2017 as a result of a gain of
$3.9 million
recognized upon the settlement of a Hurricane Harvey flood insurance claim during 2018. The impact of the shift in sales mix from 2017 to 2018 offset the impact of the reported revenue growth and the insurance gains discussed above. To a lesser extent, reported segment results for 2018 and 2017 were reduced by severance and downsizing-related expenses of
$1.5 million
and
$0.9 million
, respectively.
Backlog.
Bidding and quoting activity, along with orders from customers, for our Offshore/Manufactured Products segment continued, albeit at a substantially slower pace than in recent year
s. However, deepwater project award potential appears to be improving despite the current commodity price environment. Backlog in ou
r Offshore/Manufactured Products increased
6%
during 2018 to total
$179 million
as of
December 31, 2018
, representing a book to bill ratio of
1.1
x for the year.
Corporate
Expenses increased
$1.5 million
, or
3%
, in 2018 from 2017 due to
$3.0 million
in transaction-related expenses incurred in connection with the first quarter 2018 acquisitions of GEODynamics and Falcon.
-
41
-
YEAR ENDED DECEMBER 31, 2017
COMPARED TO YEAR ENDED DECEMBER 31, 2016
Net loss for the year ended December 31, 2017 was $84.9 million, or $(1.69) per diluted share, which included $3.4 million ($2.4 million after-tax, or $0.05 per diluted share) of severance, downsizing and other charges and $29.2 million ($0.58 per diluted share) of additional non-cash income tax expense related to U.S. tax law changes and a decision to carryback net operating losses incurred in 2016 against taxable income reported in 2014. These results compare to a net loss of $46.4 million, or $(0.92) per diluted share, reported for the year ended December 31, 2016. Results for 2016 included $5.2 million ($3.3 million after-tax, or $0.06 per diluted share) of severance and other downsizing charges.
Our consolidated results of operations in 2017 reflect industry trends and customer spending activities which focused on growth in the U.S. shale play regions with weaker U.S. Gulf of Mexico and international activity. In addition, investments in deepwater markets globally slowed significantly since the start of the recent industry downturn in 2014.
Revenues
. Consolidated total revenues decreased $23.8 million, or 3%, in 2017 compared to 2016 due to declines in our Offshore/Manufactured Products segment, substantially offset by improvements in our Well Site Services segment. Total consolidated product revenues in 2017 decreased $112.4 million, or 27%, due primarily to lower project-driven activity within our Offshore/Manufactured Products segment. Consolidated service revenues for 2017 increased $88.6 million, or 32%, due to higher customer-driven activity within the Well Site Services segment. As can be derived from the following table,
65%
of our consolidated revenues in 2017 were related to our short-cycle product and service offerings, which compared to
39%
in 2016, due principally to higher customer spending in the U.S. shale play regions and the significant decline in deepwater project-driven revenues.
The following table provides disaggregated revenue information by operating segment for the years ended December 31, 2017 and 2016 (in thousands):
|
Well Site Services
|
Offshore/ Manufactured Products
|
Total
|
|||||||||||||||||||||
|
2017
|
2016
|
2017
|
2016
|
2017
|
2016
|
||||||||||||||||||
|
Major revenue categories -
|
|||||||||||||||||||||||
|
Project-driven products
|
$
|
—
|
|
$
|
—
|
|
$
|
126,960
|
|
$
|
296,368
|
|
$
|
126,960
|
|
$
|
296,368
|
|
|||||
|
Short-cycle:
|
|||||||||||||||||||||||
|
Completion products and services
|
234,252
|
|
163,060
|
|
117,914
|
|
70,866
|
|
352,166
|
|
233,926
|
|
|||||||||||
|
Drilling services
|
54,462
|
|
22,594
|
|
—
|
|
—
|
|
54,462
|
|
22,594
|
|
|||||||||||
|
Other products
|
—
|
|
—
|
|
29,549
|
|
17,425
|
|
29,549
|
|
17,425
|
|
|||||||||||
|
Total short-cycle
|
288,714
|
|
185,654
|
|
147,463
|
|
88,291
|
|
436,177
|
|
273,945
|
|
|||||||||||
|
Other products and services
|
—
|
|
—
|
|
107,490
|
|
124,131
|
|
107,490
|
|
124,131
|
|
|||||||||||
|
$
|
288,714
|
|
$
|
185,654
|
|
$
|
381,913
|
|
$
|
508,790
|
|
$
|
670,627
|
|
$
|
694,444
|
|
||||||
|
Percentage of total revenue by type -
|
|||||||||||||||||
|
Products
|
—
|
%
|
—
|
%
|
80
|
%
|
82
|
%
|
45
|
%
|
60
|
%
|
|||||
|
Services
|
100
|
%
|
100
|
%
|
20
|
%
|
18
|
%
|
55
|
%
|
40
|
%
|
|||||
Cost of Revenues (exclusive of Depreciation and Amortization Expense).
Our consolidated cost of revenues (exclusive of depreciation and amortization expense) decreased $6.0 million, or 1%, in 2017 compared to 2016. Total consolidated product costs in 2017 decreased $68.8 million, or 24%, from 2016 driven by declines in our Offshore/Manufactured Products segment. Consolidated service costs for 2017 increased $62.8 million, or 26%, from 2016 due primarily to growth within our Well Site Services segment.
Selling, General and Administrative Expenses
. Selling, general and administrative expenses decreased $9.2 million, or 7%, in 2017 from the prior-year primarily due to the impact of cost reduction initiatives and lower employee severance-related charges in 2017, partially offset by higher incentive compensation accruals.
Depreciation and Amortization Expense
. Depreciation and amortization expense decreased $11.1 million, or 9%, in 2017 compared to 2016 primarily due to certain assets becoming fully depreciated coupled with overall lower levels of capital expenditures.
Other Operating (Income) Expense, Net
. Other operating (income) expense, net moved from other operating income of $5.8 million in 2016 to other operating expense of $1.3 million in 2017, reflecting primarily the impact of foreign currency exchange gains or losses recognized in the respective periods.
-
42
-
Operating Loss
. Our consolidated operating loss was $73.9 million in 2017, which included $3.4 million of transaction-related, severance and facility closure charges. This compares to a consolidated operating loss of $69.3 million in 2016, which includes $5.2 million in severance and facility closure charges. In addition to the specific charges previously discussed, significant activity driven improvements in operating results in Well Site Services were offset by a decline in operating results in Offshore/Manufactured Products driven by the 57% decline in project-driven revenue.
Interest Expense and Interest Income.
Net interest expense decreased $0.6 million, or 13%, in 2017 compared to 2016 primarily due to a reduction in average amounts outstanding under the Revolving Credit Facility partially offset by higher unused commitment fees paid to our lenders. Interest expense as a percentage of total average debt outstanding increased from 6.5% in 2016 to 17.3% in 2017 due to an increased proportion of interest expense associated with unused commitment fees, lower average borrowings outstanding under the Revolving Credit Facility and non-cash amortization of debt issuance costs.
Income Tax.
Our income tax provision for 2017 was $7.4 million (an income tax benefit of $21.8 million, or 28.1% of pre-tax losses, after excluding the discrete charges discussed previously) compared to an income tax benefit of $26.9 million, or 36.7% of pre-tax losses for 2016. The lower effective tax rate benefit in 2017 after excluding discrete charges was attributable to a shift in the mix between domestic pre-tax losses and foreign pre-tax income compared to the prior-year period and additional valuation allowances provided against net operating losses in certain domestic and foreign jurisdictions.
Other Comprehensive
Income
(Loss).
Reported comprehensive income (loss) is the sum of the reported net income (loss) and other comprehensive income (loss). Other comprehensive income was $11.8 million in 2017 compared to a loss of $19.6 million in 2016 due to fluctuations in foreign currency exchange rates compared to the U.S. dollar for certain of the international operations of our reportable segments. For 2017 and 2016, currency translation adjustments recognized as a component of other comprehensive income (loss) were primarily attributable to the United Kingdom and Brazil. During 2017, exchange rates for the British pound strengthened compared to the U.S. dollar, while the Brazilian real weakened compared to the U.S. dollar. This compares to 2016, when exchange rates for the British pound weakened compared to the U.S. dollar, while the Brazilian real strengthened compared to the U.S. dollar.
Segment Operating Results
Well Site Services
Revenues.
Our Well Site Services segment revenues increased $103.1 million, or 56%, in 2017 compared to 2016 due to growth of both Completion Services and Drilling Services revenues. Our Completion Services revenues increased $71.2 million, or 44%, in 2017 compared to 2016, with the impact of a higher commodity price environment and lower service costs driving increased U.S. land-based activity, partially offset by reduced activity in certain international markets. The number of Completion Services jobs performed in 2017 increased 26% over the prior-year and revenue per Completion Services job increased 13% year-over-year as a result of higher completions activity, increased well completion complexity, a more favorable job mix and improved pricing. Our Drilling Services revenues increased $31.9 million, or 141%, to $54.5 million in 2017 from 2016 due to higher utilization of our land drilling rigs, which increased from an average of 12% during 2016 to an average of 29% in 2017, while earning increased dayrates.
Operating Loss.
With higher revenues, our Well Site Services segment operating loss declined $48.8 million, or 45%, in 2017 from 2016. Well Site Services segment revenues and cost of services for 2017 increased 56% and 42%, respectively, from the prior year, with other costs and expenses remaining relatively consistent. Our Completion Services operating loss declined $38.5 million, or 46%, in 2017 compared to 2016, due to increased completion-related activity levels in the United States. 2017 and 2016 reported results included $1.1 million and $2.2 million, respectively, of severance and other downsizing costs. Our Drilling Services operating loss declined $10.3 million, or 43%, in 2017 from 2016 primarily as a result of the reported revenue growth.
Offshore/Manufactured Products
Revenues.
Our Offshore/Manufactured Products segment revenues decreased $126.9 million, or 25%, in 2017 compared to 2016 primarily as a result of a decline in demand for deepwater project-driven products (primarily subsea pipeline infrastructure, offshore production and drilling products), lower levels of service activities and a backlog position that has trended significantly lower since mid-2014. These deepwater project-driven revenue declines were partially offset by a 67% increase in sales of our short-cycle products. Shorter-cycle products, such as elastomers and valves, have benefited from increased land-based drilling and completion activity in the United States.
Operating Income.
Our Offshore/Manufactured Products segment operating income decreased $48.9 million, or 56%, in 2017 compared to 2016 as a result of a decrease in project-driven revenues and other products and services revenues. Reported segment results for 2017 and 2016 include severance-related expenses of $0.9 million and $3.0 million, respectively.
-
43
-
Backlog.
Bidding and quoting activity, along with orders from customers, for our Offshore/Manufactured Products segment continued, albeit at a much slower pace than in recent years. Reflecting the impact of customer delays and deferrals in approving major, capital intensive projects in light of the prolonged low commodity price environment, backlog in our Offshore/Manufactured Products totaled $168 million as of December 31, 2017, with a book to bill ratio of 0.9x in 2017.
Corporate
Expenses increased $4.5 million, or 9%, in 2017 from 2016 primarily due to higher incentive compensation accruals, increased stock-based compensation expense and expenses of $1.2 million incurred in connection with the first quarter 2018 acquisitions of GEODynamics and Falcon.
Liquidity, Capital Resources and Other Matters
Our primary liquidity needs are to fund operating and capital expenditures, which in the past have included expanding and upgrading our Offshore/Manufactured Products manufacturing facilities and equipment, replacing and increasing Completion Services assets, funding new product development and general working capital needs. In addition, capital has been used to repay debt, fund strategic business acquisitions and fund our stock repurchase program. Our primary sources of funds have been cash flow from operations, proceeds from borrowings under our credit facilities and capital market transactions.
As discussed under "Recent Developments" and below, during the first quarter of 2018 we completed a number of strategic transactions in the furtherance of our growth strategy, which we believe should favorably impact our future results of operations and cash flows.
Operating Activities
Cash flows totaling
$103.2 million
were provided by operations during the year ended
December 31, 2018
compared to
$95.4 million
provided by operations during the year ended
December 31, 2017
.
During
2018
,
$22.9 million
was used to fund working capital increases primarily associated with activity-driven growth in accounts receivable and inventories. During
2017
,
$32.4 million
was provided from net working capital reductions, with decreases in accounts receivable and inventories partially offset by an increase in income taxes receivable.
Investing Activities
A total of
$461.4 million
in cash was used in investing activities during the year ended
December 31, 2018
, compared to
$47.6 million
used during
2017
.
On January 12, 2018, we acquired GEODynamics for a purchase price consisting of (i)
$295.4 million
in cash (net of cash acquired), which we funded through borrowings under our Revolving Credit Facility, (ii) approximately
8.66 million
shares of our common stock (having a market value of approximately
$294.9 million
as of the closing date) and (iii) an unsecured
$25.0 million
promissory note.
On February 28, 2018, we acquired Falcon for cash consideration of $84.2 million (net of cash acquired), which we funded from borrowings under our Amended Revolving Credit Facility.
During 2017, we invested $12.9 million within our Offshore/Manufactured Products segment to acquire complementary intellectual property and assets to expand our global crane manufacturing and service operations as well as expand our riser testing, inspection and repair service offerings.
Capital expenditures totaled
$88.0 million
and
$35.2 million
during the years ended
December 31, 2018
and
2017
, respectively. Capital expenditures in both years consisted principally of purchases of Completion Services equipment, expansion and upgrading of our Offshore/Manufactured Products segment facilities and various other capital spending initiatives. Capital expenditures in 2018 also included additional investments in equipment and facilities for our GEODynamics and Falcon operations acquired in the first quarter of 2018.
We expect to spend between
$65 million
and
$70 million
in total capital expenditures during
2019
to replace and upgrade our Completion Services equipment, to expand and maintain Downhole Technologies facilities and equipment, to upgrade and maintain our Offshore/Manufactured Products facilities and equipment, and to fund various other capital spending projects. Whether planned expenditures will actually be spent in
2019
depends on industry conditions, project approvals and schedules, vendor delivery timing, free cash flow generation and careful monitoring of our levels of liquidity. We plan to fund these capital expenditures with available cash, internally generated funds and borrowings under our Amended Revolving Credit Facility. The foregoing capital expenditure
-
44
-
expectations do not include any funds that might be spent on future strategic acquisitions, which the Company could pursue depending on the economic environment in our industry and the availability of transactions at prices deemed to be attractive to the Company.
At
December 31, 2018
, we had cash totaling
$19.3 million
. With the enactment of the Tax Cuts and Jobs Act in December 2017, we repatriated
$45.0 million
of cash held by our international subsidiaries to reduce borrowings outstanding under our Amended Revolving Credit Facility during 2018 without triggering any incremental tax expense.
Financing Activities
Net cash of
$324.1 million
was provided by financing activities during the year ended
December 31, 2018
, primarily as a result of our issuance of $200.0 million of 1.50% convertible senior notes and the net borrowing of
$136.1 million
under the Amended Revolving Credit Facility. Net cash of
$65.1 million
was used in financing activities during the year ended
December 31, 2017
, primarily associated with the net repayment of
$42.2 million
in borrowings under the Revolving Credit Facility in addition to repurchases of our common stock totaling
$16.3 million
.
On January 12, 2018, we partially funded the GEODynamics Acquisition through borrowings available under our Revolving Credit Facility. On January 30, 2018, we issued $200.0 million in principal amount of our Notes due February 2023 and entered into our Amended Revolving Credit Facility, to extend the maturity of the facility to January 30, 2022 and provide for total lender commitments of $350 million. Net proceeds from the Notes offering of approximately $194.0 million, after deducting discounts and estimated expenses, were used to repay a portion of amounts outstanding under the Revolving Credit Facility.
We believe that cash on hand, cash flow from operations and available borrowings under our Amended Revolving Credit Facility will be sufficient to meet our liquidity needs in the coming twelve months. If our plans or assumptions change, or are inaccurate, or if we make further acquisitions, we may need to raise additional capital. Acquisitions have been, and our management believes acquisitions will continue to be, a key element of our business strategy. The timing, size or success of any acquisition effort and the associated potential capital commitments are unpredictable and uncertain. We may seek to fund all or part of any such efforts with proceeds from debt and/or equity issuances. Our ability to obtain capital for additional projects to implement our growth strategy over the longer term will depend upon our future operating performance, financial condition and, more broadly, on the availability of equity and debt financing. Capital availability will be affected by prevailing conditions in our industry, the global economy, the global financial markets and other factors, many of which are beyond our control. In addition, debt service requirements could be based on higher interest rates and shorter maturities and could impose a significant burden on our results of operations and financial condition, and any issuance of additional equity securities could result in significant dilution to stockholders.
Revolving Credit Facility.
Our Revolving Credit Facility was governed by the Credit Agreement dated as of May 28, 2014, as amended, (the "Credit Agreement") by and among the Company, the Lenders party thereto, Wells Fargo Bank, N.A., as administrative agent for the lenders party thereto and collateral agent for the secured parties thereunder, and the lenders and other financial institutions from time to time party thereto, the Swing Line Lender and an Issuing Bank, Royal Bank of Canada, as syndication agent, and Compass Bank, as documentation agent. As of December 31, 2017, our Revolving Credit Facility was scheduled to mature on May 28, 2019.
We amended and restated our Credit Agreement on January 30, 2018 with Wells Fargo Bank, N.A., as administrative agent for the lenders party thereto and collateral agent for the secured parties thereunder, and the lenders and other financial institutions from time to time party thereto (the "Amended Credit Agreement"). The Amended Credit Agreement governs our Amended Revolving Credit Facility. The Amended Revolving Credit Facility provides for up to
$350 million
in lender commitments and matures on January 30, 2022. Under our Amended Revolving Credit Facility,
$50 million
is available for the issuance of letters of credit.
As of
December 31, 2018
, we had
$136.1 million
of borrowings outstanding under the Amended Credit Agreement and
$22.6 million
of outstanding letters of credit, leaving
$156.2 million
available to be drawn. The total amount available to be drawn was less than the lender commitments as of
December 31, 2018
, due to limits imposed by maintenance covenants in the Amended Credit Agreement.
Amounts outstanding under our Revolving Credit Facility bear interest at LIBOR plus a margin of
1.75%
to
3.00%
, or at a base rate plus a margin of
0.75%
to
2.00%
, in each case based on a ratio of our total net funded debt to consolidated EBITDA (as defined in the Amended Credit Agreement). We must also pay a quarterly commitment fee of
0.25%
to
0.50%
, based on our ratio of total net funded debt to consolidated EBITDA, on the unused commitments under the Amended Credit Agreement.
The Amended Credit Agreement contains customary financial covenants and restrictions. Specifically, we must maintain an interest coverage ratio, defined as the ratio of consolidated EBITDA to consolidated interest expense, of at least
3.0
to 1.0, a maximum senior secured leverage ratio, defined as the ratio of senior secured debt to consolidated EBITDA, of no greater than
2.25
to 1.0 and a total net leverage ratio, defined as the ratio of total net funded debt to consolidated EBITDA, of no greater than
4.0
to 1.0 through
-
45
-
the fiscal quarter ending December 31, 2018 and no greater than
3.75
to 1.0 thereafter. Our financial covenants give pro forma effect to the issuance of the Notes, acquired businesses and the annualization of EBITDA for acquired businesses.
Each of the factors considered in the calculations of these ratios are defined in the Amended Credit Agreement. Consolidated EBITDA and consolidated interest, as defined, exclude goodwill impairments, losses on extinguishment of debt, debt discount amortization, and other non-cash charges. As of
December 31, 2018
, we were in compliance with our debt covenants and expect to continue to be in compliance throughout
2019
.
Borrowings under the Amended Credit Agreement are secured by a pledge of substantially all of our assets and the assets of our domestic subsidiaries. Our obligations under the Amended Credit Agreement are guaranteed by our significant domestic subsidiaries.
Under the Amended Credit Agreement, the occurrence of specified change of control events involving our Company would constitute an event of default that would permit the banks to, among other things, accelerate the maturity of the facility and cause it to become immediately due and payable in full.
1.50% Convertible Senior Notes.
On January 30, 2018, we issued
$200.0 million
aggregate principal amount of the Notes pursuant to an indenture, dated as of January 30, 2018 (the "Indenture"), between us and Wells Fargo Bank, N.A., as trustee. Net proceeds, after deducting discounts and expenses, were approximately
$194.0 million
. We used the net proceeds to repay a portion of the borrowings outstanding under the Revolving Credit Facility.
The initial carrying amount of the Notes recorded in the consolidated balance sheet as of January 30, 2018 was less than the
$200.0 million
in principal amount of the Notes, in accordance with applicable accounting principles, reflective of the estimated fair value of a similar debt instrument that does not have a conversion feature. We recorded the value of the conversion feature of $34.4 million as a debt discount, which is amortized as interest expense over the term of the Notes, with a similar amount allocated to additional paid-in capital. As a result of this amortization, the interest expense we recognize related to the Notes for accounting purposes is based on an effective interest rate of approximately
6%
, which is greater than the cash interest payments we are obligated to pay on the Notes. Interest expense associated with the Notes for 2018 was
$9.0 million
, while the related cash interest expense was
$2.8 million
. See Note
7
, "Long-term Debt," for further information with respect to the carrying amount of the Notes.
The Notes bear interest at a rate of
1.50%
per year until maturity. Interest is payable semi-annually in arrears on February 15 and August 15 of each year, beginning on August 15, 2018. In addition, additional interest and special interest may accrue on the Notes under certain circumstances as described in the Indenture. The Notes will mature on February 15, 2023, unless earlier repurchased, redeemed or converted. The initial conversion rate is
22.2748
shares of our common stock per $1,000 principal amount of Notes (equivalent to an initial conversion price of approximately
$44.89
per share of common stock). The conversion rate, and thus the conversion price, may be adjusted under certain circumstances as described in the Indenture.
Noteholders may convert their Notes, at their option only in the following circumstances: (1) if the last reported sale price per share of our common stock exceeds 130% of the conversion price for each of at least 20 trading days during the 30 consecutive trading days ending on, and including, the last trading day of the immediately preceding calendar quarter; (2) during the five consecutive business days immediately after any five consecutive trading day period (such five consecutive trading day period, the "measurement period") in which the trading price per $1,000 principal amount of the Notes for each trading day of the measurement period was less than 98% of the product of the last reported sale price per share of our common stock on such trading day and the conversion rate on such trading day; (3) upon the occurrence of certain corporate events or distributions on our common stock, as described in the Indenture; or (4) if the Company calls the Notes for redemption, or at any time from, and including, November 15, 2022 until the close of business on the second scheduled trading day immediately before the maturity date. We will settle conversions by paying or delivering, as applicable, cash, shares of common stock or a combination of cash and shares of common stock, at the Company's election, based on the applicable conversion rate(s). If we elect to deliver cash or a combination of cash and shares of common stock, then the consideration due upon conversion will be based on a defined observation period.
The Notes will be redeemable, in whole or in part, at our option at any time, and from time to time, on or after February 15, 2021, at a cash redemption price equal to the principal amount of the Notes to be redeemed, plus accrued and unpaid interest, if any, to, but excluding, the redemption date, but only if the last reported sale price per share of our common stock exceeds
130%
of the conversion price on each of at least 20 trading days during the 30 consecutive trading days ending on, and including, the trading day immediately before the date we send the related redemption notice.
If specified change in control events involving the Company as defined in the Indenture occur, then noteholders may require us to repurchase their Notes at a cash repurchase price equal to the principal amount of the Notes to be repurchased, plus accrued and unpaid interest. Additionally, the Notes contain certain events of default as set forth in the indenture. As of
December 31, 2018
, none of the conditions allowing holders of the Notes to convert, or requiring us to repurchase the Notes, had been met.
-
46
-
Because it is our intent to settle the principal portion of the Notes in cash, we use the treasury stock method when calculating the diluted earnings per share effect for the variable number of shares that would be issued upon conversion to settle the conversion feature. The Notes were not convertible during the year ended
December 31, 2018
.
Promissory Note.
In connection with the GEODynamics Acquisition, we issued a $25.0 million promissory note that bears interest at 2.5% per annum and is scheduled to mature on July 12, 2019. Payments due under the promissory note may be set-off, in full or in part, against certain claims related to matters occurring prior to our acquisition of GEODynamics, which is expected to delay and/or reduce amounts paid under the promissory note. See Note
13
, "Commitments and Contingencies" for additional discussion.
Our total debt represented
18.7%
of our combined total debt and stockholders’ equity at
December 31, 2018
compared to
0.5%
at
December 31, 2017
.
Stock Repurchase Program.
We maintain a share repurchase program which was extended to July 29, 2019 by our Board of Directors. During the year ended
December 31, 2018
, there were
no
repurchases of our common stock under the program. During
2017
, we repurchased
562 thousand
shares of common stock under the program at a total cost of
$16.2 million
. No shares of our common stock were repurchased under the program in 2016. The amount remaining under our current share repurchase authorization as of
December 31, 2018
was
$120.5 million
. Subject to applicable securities laws, any purchases will be at such times and in such amounts as the Company deems appropriate.
Contractual Obligations.
The following summarizes our contractual obligations at
December 31, 2018
, and the effect such obligations are expected to have on our liquidity and cash flow over the next five years (in thousands):
|
|
Payments due by period
|
||||||||||||||||||
|
|
Total
|
Less than 1 year
|
1 - 3 years
|
3 - 5 years
|
More than 5 years
|
||||||||||||||
|
Contractual obligations
|
|
|
|
|
|||||||||||||||
|
Amended Revolving Credit Facility
(1)
|
$
|
136,144
|
|
$
|
—
|
|
$
|
—
|
|
$
|
136,144
|
|
$
|
—
|
|
||||
|
1.50% Convertible Senior Notes
(2)
|
219,500
|
|
3,000
|
|
9,000
|
|
207,500
|
|
—
|
|
|||||||||
|
Promissory note
(3)
|
25,938
|
|
25,938
|
|
—
|
|
—
|
|
—
|
|
|||||||||
|
Other debt and capital leases
|
5,540
|
|
561
|
|
1,163
|
|
1,002
|
|
2,814
|
|
|||||||||
|
Purchase obligations
(4)
|
58,924
|
|
58,310
|
|
614
|
|
—
|
|
—
|
|
|||||||||
|
Non-cancelable operating lease obligations
|
58,039
|
|
12,312
|
|
16,004
|
|
9,883
|
|
19,840
|
|
|||||||||
|
Total contractual cash obligations
|
$
|
504,085
|
|
$
|
100,121
|
|
$
|
26,781
|
|
$
|
354,529
|
|
$
|
22,654
|
|
||||
____________________
|
(1)
|
Excludes interest on variable-rate debt which matures in January 2022. Since we cannot predict with any certainty the amount of interest due on our revolving debt due to the expected variability of interest rates and principal amounts outstanding, we do not include this in our obligations. If we assume interest payment amounts are calculated using the outstanding principal balances and interest rates as of
December 31, 2018
and include applicable commitment fees, estimated interest payments on our variable-rate debt would be
$6.7 million
"due in less than one year" and
$13.9 million
"due in one to three years". See Note
7
, "Long-term Debt," to the Consolidated Financial Statements included in this Annual Report on Form 10‑K for additional information on our Amended Revolving Credit Facility.
|
|
(2)
|
Amount represents the full principal amount of the Notes together with cash interest payments due semi-annually.
|
|
(3)
|
The $25 million promissory note (together with accrued and unpaid interest) issued in connection with the GEODynamics Acquisition is scheduled to mature in July 2019. Payments under the promissory note may be set-off, in full or in part, against certain claims related to matters occurring prior our acquisition of GEODynamics, which is expected to delay and/or reduce amounts paid under the promissory note.
|
|
(4)
|
The purchase obligations of the Company primarily relate to open purchase orders in our Offshore/Manufactured Products and Completion Services operations.
|
Registration Rights Agreement
In connection with the GEODynamics Acquisition, we issued approximately
8.66 million
shares of our common stock to the entity from whom we acquired that business, and we granted that entity and certain other parties' registration rights pursuant to a registration rights agreement. We filed a shelf registration statement for the resale of shares in accordance with the agreement on January 19, 2018 and the selling stockholder sold approximately 5.93 million shares of the Company's common stock through an underwritten offering in late February 2018. As of December 31, 2018, the Company does not expect to have any further material obligations under the registration rights agreement.
Effects of Inflation
Our revenues and results of operations have not been materially impacted by inflation in the past three fiscal years.
-
47
-
Off-Balance Sheet Arrangements
As of
December 31, 2018
, we had no off-balance sheet arrangements as defined in Item 303(a)(4)(ii) of Regulation S‑K.
Tariffs
We use a variety of domestically produced and imported raw materials and component products, including steel, in the manufacture of our products. In 2018, the United States imposed tariffs on a variety of imported products, including steel and aluminum. In response to the U.S. tariffs on steel and aluminum, the European Union and several other countries, including Canada and China, have threatened and/or imposed retaliatory tariffs. The effect of these new tariffs and the application and interpretation of existing trade agreements and customs, anti-dumping and countervailing duty regulations continues to evolve, and we continue to monitor these matters. If we encounter difficulty in procuring these raw materials and component products, or if the prices we have to pay for these products increase as a result of customs, anti-dumping and countervailing duty regulations or otherwise and we are unable to pass corresponding cost increases on to our customers, our financial position and results of operations could be adversely affected. Furthermore, uncertainty with respect to potential costs in the drilling and completion of oil and gas wells could cause customers to delay or cancel planned projects which, if this occurred, would adversely affect our financial position and results of operations. See Note
13
, "Commitments and Contingencies" for additional discussion.
Tax Matters
See Note
2
, "Summary of Significant Accounting Policies," and Note
8
, "Income Taxes," to the Consolidated Financial Statements included in this Annual Report on Form 10‑K for additional information with respect to tax matters.
Critical Accounting Policies
Our Consolidated Financial Statements included in this Annual Report on Form 10‑K have been prepared in accordance with accounting principles generally accepted in the United States ("GAAP"), which require that management make numerous estimates and assumptions. Actual results could differ from those estimates and assumptions, thus impacting our reported results of operations and financial position. The critical accounting policies and estimates described in this section are those that are most important to the depiction of our financial condition and results of operations and the application of which requires management’s most subjective judgments in making estimates about the effect of matters that are inherently uncertain. We describe our significant accounting policies more fully in Note
2
, "Summary of Significant Accounting Policies," to the Consolidated Financial Statements included in this Annual Report on Form 10‑K.
Tangible and Intangible Assets, including Goodwill
Our tangible long-lived assets totaled
$540.4 million
as of
December 31, 2018
. Our goodwill totaled
$647.0 million
, representing
32%
of our total assets as of
December 31, 2018
, and our other intangible assets totaled
$255.3 million
, representing
13%
of our total assets. The remainder of our assets largely consisted of cash, accounts receivable and inventory.
The assessment of impairment of long-lived assets, including intangibles, is conducted at least annually, as well as whenever changes in the facts and circumstances indicate a loss in value may have occurred. Indicators of impairment might include persistent negative economic trends affecting the markets we serve, recurring losses or lowered expectations of future cash flows to be generated by our assets. The determination of the amount of impairment would be based on quoted market prices, if available, or upon our judgments as to the future operating cash flows to be generated from these assets throughout their estimated useful lives.
Based on our December
2018
impairment review, the carrying values of our asset groups are recoverable, and no impairment losses were recorded. However, industry cyclicality and downturns may result in changes in our estimates of projected operating cash flows, or their timing, and could potentially cause us to impair the values of our long-lived assets, including finite-lived intangible assets.
If the carrying amount of a reporting unit exceeds its fair value, goodwill is considered to be impaired and an impairment loss is recorded. We evaluate each reporting unit annually on December 1 and when an event occurs or circumstances change to suggest that the carrying amount may not be recoverable. Our reporting units with goodwill as of
December 31, 2018
include Completion Services, Downhole Technologies and Offshore/Manufactured Products. There is no remaining goodwill in our Drilling Services reporting unit.
Given the significant decline observed in crude oil prices and our market capitalization during the fourth quarter of 2018, we performed our annual quantitative impairment test of our goodwill on December 1, 2018. This quantitative assessment incorporated our projected cash flows for each reporting unit as revised to reflect the deterioration in the market outlook observed through
-
48
-
December 31, 2018 due to crude oil price volatility. For this test, we estimated the fair value of each reporting unit and compared that fair value to its recorded carrying value. As none of our reporting units have publicly quoted market prices, we determined the value that willing buyers and sellers would place on each reporting unit in a routine sale process (a Level 3 fair value measurement). In our analysis, we targeted a valuation that would be placed on the reporting unit by market participants based on historical and projected operating results throughout a full market cycle, not the value of the reporting unit based on trough or peak operating results. We utilized, based on circumstances, a combination of trading multiples analyses, projected discounted cash flow calculations with estimated terminal values and acquisition comparables. We discounted our projected cash flows using a long-term weighted average cost of capital for each reporting unit based on our estimate of investment returns that would be required by a market participant. The fair value of our reporting units is primarily affected by expectations regarding future crude oil and natural gas prices, anticipated spending by our customers, income tax rates and the cost of capital. We also compared the total market capitalization of the Company to the sum of the fair values of all of our reporting units to assess the reasonableness of the aggregated fair value.
Our testing led us to conclude that the fair value of our Completion Services, Downhole Technologies and Offshore/Manufactured Products reporting units exceeded their carrying values by 8%, 8% and 26%, respectively, as of December 1, 2018.
As of December 1, 2018, our market capitalization, which excluded any control premium, was $1.3 billion, as compared to the carrying value of our equity of
$1.4 billion
. Our stock price and our overall industry market capitalization were further negatively impacted in December 2018 due to numerous factors, including broad-based year-end stock market trading volatility, tax loss harvesting by investors, lower crude oil prices and foreign trade agreement negotiation uncertainties. Excluding a control premium, our market capitalization was $856 million as of
December 31, 2018
, and averaged $1.04 billion over the period from January 1 through February 15, 2019. In comparison, our average market capitalization over the first nine months of 2018 was approximately $1.7 billion. As of September 30, 2018, our market capitalization was $2.0 billion, or $541 million above our equity carrying value.
As discussed above, our annual assessment has appropriately considered the impact of the current market environment and industry outlook by using projected discounted cash flows reflecting expected market conditions at
December 31, 2018
in estimating the fair value of our reporting units. The underlying fundamentals supporting the crude oil and natural gas markets continue to support long-term crude oil demand growth and the need for additional crude oil production. After giving consideration to various macro-economic factors, we concluded that our market capitalization as of
December 31, 2018
was temporarily impacted by various market forces which did not indicate that it was more likely than not that the carrying amounts of our reporting units exceeded their fair values. This qualitative assessment is further supported by the subsequent recovery in crude oil prices in early 2019 to a level above the prices in effect at year end. In addition, our stock price also recovered a portion of its value since
December 31, 2018
. Our stock price in 2019 averaged $17.30 per share through February 15 (a 21% increase from our closing stock price of $14.28 on
December 31, 2018
). We continue to monitor commodity prices and other significant assumptions used in our forecasts. If we experience a prolonged decline in long-term demand for crude oil and natural gas or significant and sustained increases in commodity supplies, which serve to depress commodity prices over the long term, we will be required to update our discounted cash flow analysis and potentially be required to record a goodwill impairment in the future. Furthermore, if our market capitalization remains below our book value for a sustained period of time and the implied fair value of our equity is not reasonably supported by equity control premiums, we will need to consider updating our assessment.
Purchase Price Allocation of Acquisitions
We allocate the fair value of the purchase price consideration of an acquired business to its identifiable assets and liabilities based on estimated fair values. The excess of the purchase price over the fair value of the acquired assets and liabilities, if any, is recorded as goodwill. We use available information to estimate fair values including quoted market prices, the carrying value of acquired assets, and widely accepted valuation techniques such as discounted cash flows. Determining the fair value of assets and liabilities acquired, as well as intangible assets that relate to such items as customer relationships, technology and know-how, trade names and non-compete agreements involves professional judgment and is ultimately based on acquisition models and management’s assessment of the value of the assets acquired, and to the extent available, third-party assessments. The judgments made in determining the estimated fair value assigned to each class of assets acquired and liabilities assumed, as well as asset lives, could materially impact our results of operations.
Revenue and Cost Recognition
As further discussed in Note
3
, "Recent Accounting Pronouncements," we account for revenue in accordance with Financial and Accounting Standards Board guidance on revenue from contracts with customers ("ASC 606"), which we adopted on January 1, 2018. The new guidance did not have a material impact on our recognition of revenues. Contractual terms may vary by contract and customer, which may impact the timing of revenue recognition under the standard in future periods.
-
49
-
Our revenue contracts may include one or more promises to transfer a distinct good or service to the customer, which is referred to under ASC 606 as a "performance obligation," and to which revenue is allocated. We recognize revenue and the related cost when, or as, the performance obligations are satisfied. The majority of our significant contracts for custom engineered products have a single performance obligation as no individual good or service is separately identifiable from other performance obligations in the contracts. For contracts with multiple distinct performance obligations, we allocate revenue to the identified performance obligations in the contract. Our product sales terms do not include significant post-performance obligations.
Our performance obligations may be satisfied at a point in time or over time as work progresses. Revenues from goods and services transferred to customers at a point in time accounted for approximately
29%
,
22%
and
25%
of consolidated revenues for the years ended
December 31, 2018
,
2017
and
2016
, respectively. The majority of our revenue recognized at a point in time is derived from short-term contracts for standard products offered by us. Revenue on these contracts is recognized when control over the product has transferred to the customer. Indicators we consider in determining when transfer of control to the customer occurs include: right to payment for the product, transfer of legal title to the customer, transfer of physical possession of the product, transfer of risk and customer acceptance of the product.
Revenues from products and services transferred to customers over time accounted for approximately
71%
,
78%
and
75%
of consolidated revenues for the years ended
December 31, 2018
,
2017
and
2016
, respectively. The majority of our revenue recognized over time is for services provided under short-term contracts with revenue recognized as the customer receives and consumes the services provided by our segments. In addition, we manufacture certain products to individual customer specifications under short-term contracts for which control passes to the customer as the performance obligations are fulfilled and for which revenue is recognized over time.
For significant project-related contracts involving custom engineered products within the Offshore/Manufactured Products segment (also referred to as "projected-driven products"), revenues are typically recognized over time using an input measure such as the percentage of costs incurred to date relative to total estimated costs at completion for each contract (cost-to-cost method). Contract costs include labor, material and overhead. Management believes this method is the most appropriate measure of progress on large contracts. Billings on such contracts in excess of costs incurred and estimated profits are classified as a contract liability (deferred revenue). Costs incurred and estimated profits in excess of billings on these contracts are recognized as a contract asset (a component of accounts receivable).
Contract estimates for project-related contracts involving custom engineered products are based on various assumptions to project the outcome of future events that may span several years. Changes in assumptions that may affect future project costs and margins include production efficiencies, the complexity of the work to be performed and the availability and costs of labor, materials and subcomponents.
As a significant change in one or more of these estimates could affect the profitability of our contracts, contract-related estimates are reviewed regularly. We recognize adjustments in estimated profit on contracts under the cumulative catch-up method. Under this method, the impact of the adjustment on profit recorded to date is recognized in the period the adjustment is identified. Revenue and profit in future periods of contract performance are recognized using the adjusted estimate. If at any time the estimate of contract profitability indicates an anticipated loss will be incurred on the contract, the loss is recognized in the period it is identified.
Taxes assessed by a governmental authority that are both imposed on and concurrent with a specific revenue-producing transaction, that we collect from a customer, are excluded from revenue. Shipping and handling costs associated with outbound freight after control over a product has transferred to a customer are accounted for as a fulfillment cost and are included in cost of products.
Proceeds from customers for the cost of oilfield rental equipment that is damaged or lost downhole are reflected as gains or losses on the disposition of assets after considering the write-off of the remaining net book value of the equipment.
Cost of goods sold includes all direct material and labor costs and those costs related to contract performance, such as indirect labor, supplies, tools and repairs. As presented on our consolidated statements of operations, costs of goods sold excludes depreciation and amortization expense. Selling, general and administrative costs are charged to expense as incurred.
Accounting for Contingencies
We have contingent liabilities and future claims for which we have made estimates of the amount of the eventual cost to liquidate such liabilities or claims. These liabilities and claims sometimes involve threatened or actual litigation where damages have been quantified and we have made an assessment of our exposure and recorded in an amount estimated to cover an expected loss. Other claims or liabilities have been estimated based on their fair value or our experience in these matters and, when appropriate, the advice of outside counsel or other outside experts. Upon the ultimate resolution of these uncertainties, our future reported financial results
-
50
-
will be impacted by the difference between our estimates and the actual amounts paid to settle a liability. Examples of areas where we have made important estimates of future liabilities include duties, income taxes, litigation, insurance claims, warranty claims, contractual claims and obligations and discontinued operations.
Allowance for Doubtful Accounts
The determination of the collectability of amounts due from customers requires us to make judgments regarding future events and trends. Allowances for doubtful accounts are determined based on a continuous process of assessing our portfolio on an individual customer basis taking into account current market conditions and trends. This process consists of a thorough review of historical collection experience, current aging status of the customer accounts, and financial condition of our customers. Based on a review of these factors, we will establish or adjust allowances for specific customers. A substantial portion of our revenues come from international oil companies, international oilfield service companies, and government-owned or government-controlled oil companies. If worldwide oil and gas exploration and production activity were to decline further, the creditworthiness of our customers could deteriorate and they may be unable to pay their receivables, requiring additional allowances to be recorded. At
December 31, 2018
and
2017
, our allowance for bad debts totaled
$6.7 million
and
$7.3 million
, or
2.3%
and
3.3%
of gross accounts receivable, respectively.
Inventory Reserves
Inventory is carried at the lower of cost or estimated net realizable value. We determine reserves for inventory based on historical usage of inventory on-hand, assumptions about future demand and market conditions, and estimates about potential alternative uses, which are usually limited. Our inventory consists of consumable oilfield products, manufactured equipment, spare parts for manufactured equipment, work in process, and raw materials to support customer demand, our manufacturing operations and our large installed base of specialized equipment used throughout the oilfield. Customers rely on us to stock certain specialized items to ensure that their equipment can be repaired and serviced in a timely manner. The estimated carrying value of inventory is determined on an average cost or specific-identification method and depends upon demand driven by oil and gas drilling and well completion activity, which depends in turn upon oil and gas prices, the general outlook for economic growth worldwide, available financing for our customers, political stability in major oil and gas producing areas, and the potential obsolescence of various types of equipment we sell, among other factors. A reserve for excess and/or obsolete inventory is maintained based on the age, turnover or condition of the inventory. At
December 31, 2018
and
2017
, inventory reserves totaled
$18.6 million
and
$15.6 million
, or
8.1%
and
8.5%
of gross inventory, respectively.
Estimation of Useful Lives
The selection of the useful lives of many of our assets requires the judgments of our operating personnel. Our judgment in this area is influenced by our historical experience in operating our assets, technological developments and expectations of future demand for the assets. Should our estimates be too long or short, we might eventually report a disproportionate number of losses or gains upon disposition or retirement of our long-lived assets. We believe our estimates of useful lives are appropriate.
Stock-Based Compensation
We estimate the fair value of stock compensation made pursuant to awards under our 2018 Equity Participation Plan (the "Plan") on their respective dates of grant. An estimate of the fair value of each restricted stock award or stock option determines the amount of stock compensation expense, net of estimated forfeitures, that we will recognize in the future. We use the Black-Scholes-Merton "closed form" model to value stock options awarded under the Plan. The fair value of service-based restricted stock awarded under the Plan is determined by the quoted market price of the Company’s common stock on the date of grant. The fair value of performance-based restricted stock awards issued with performance metrics based solely on the performance of our Company's common stock are valued using a Monte Carlo simulation model.
Income Taxes
We follow the liability method of accounting for income taxes in accordance with current accounting standards regarding the accounting for income taxes. Under this method, deferred income taxes are recorded based upon the differences between the financial reporting and tax bases of assets and liabilities and are measured using the enacted tax rates and laws in effect at the time the underlying assets or liabilities are recovered or settled.
On December 22, 2017, Tax Reform Legislation was signed into law which enacts significant changes to U.S. tax and related laws, including certain key U.S. federal income tax provisions applicable to oilfield service and manufacturing companies such as the Company. U.S. state or other regulatory bodies have not finalized potential changes to existing laws and regulations which may result from the new U.S. tax and related laws. In accordance with the SEC's Staff Accounting Bulletin No. 118, we recorded provisional
-
51
-
estimates to reflect the effect of the Tax Reform Legislation on our income tax assets and liabilities as of December 31, 2017. During 2018, we adjusted these provisional estimates based on additional guidance issued by the Internal Revenue Service.
Prior to December 22, 2017, the majority of our earnings from international subsidiaries were considered to be indefinitely reinvested outside of the United States and no provision for U.S. income taxes was made for these earnings. However, certain historical foreign earnings were not considered to be indefinitely reinvested outside of the United States and were subject to U.S income tax as earned. If any of our subsidiaries distributed earnings in the form of dividends or otherwise, we generally were subject to both U.S. income taxes (subject to an adjustment for foreign tax credits) and withholding taxes payable to various foreign countries.
As of
December 31, 2018
, our total investment, including earnings and profits, in foreign subsidiaries is considered to be permanently reinvested.
We record a valuation allowance in the reporting period when management believes that it is more likely than not that any deferred tax asset will not be realized. This assessment requires analysis of changes in tax laws, available positive and negative evidence, including consideration of losses in recent years, reversals of temporary differences, forecasts of future income, assessment of future business and tax planning strategies. During
2018
and
2017
, we recorded valuation allowances primarily with respect to net operating loss carryforwards of certain of our operations outside the United States. As a result of changes in U.S. tax laws in 2017, we recorded a valuation allowance on our foreign tax credit carryforwards during the fourth quarter of 2017.
The calculation of our tax liabilities involves assessing uncertainties regarding the application of complex tax regulations. We recognize liabilities for tax expenses based on our estimate of whether, and the extent to which, additional taxes will be due. If we ultimately determine that payment of these amounts is unnecessary, we reverse the liability and recognize a tax benefit during the period in which we determine that the liability is no longer necessary. We record an additional charge in our provision for taxes in the period in which we determine that the recorded tax liability is less than we expect the ultimate assessment to be.
Recent Accounting Pronouncements
From time to time, new accounting pronouncements are issued by the Financial Accounting Standards Board (the "FASB"), which are adopted by us as of the specified effective date. Unless otherwise discussed, management believes that the impact of recently issued standards, which are not yet effective, will not have a material impact on our consolidated financial statements upon adoption.
In May 2014, the FASB issued guidance on revenue from contracts with customers that superseded most then-current revenue recognition guidance, including industry-specific guidance (often referred to as "ASC 606"). The underlying principle is that an entity recognizes revenue to depict the transfer of goods or services to customers at an amount that the entity expects to be entitled to receive in exchange for those goods or services. The Company adopted this guidance on January 1, 2018, using the modified retrospective transition method applied to those contracts which were not completed as of that date. On January 1, 2018, we were required to recognize any cumulative effect of adopting this guidance as an adjustment to our opening balance of retained earnings. Prior periods were not retrospectively adjusted. Based on our analysis of existing contracts with customers, we concluded that the cumulative impact of the new standard was not material to our consolidated financial statements through January 1, 2018. In accordance with the guidance, we have expanded our revenue recognition disclosures to address the new qualitative and quantitative requirements.
In February 2016, the FASB issued guidance on leases which, as amended, introduces the recognition of lease assets and lease liabilities by lessees for all leases which are not short-term in nature. In connection with the required adoption of this guidance on January 1, 2019, we will use the optional transition method of recognizing any cumulative effect of adopting this guidance as an adjustment to the opening balance of retained earnings. Prior periods will not be retrospectively adjusted. Based on our analysis of existing long-term leases as of
December 31, 2018
, we estimate the adoption of the standard will result in approximately
$45 million
of additional assets and liabilities being reflected in our consolidated balance sheet, with no material cumulative impact expected to be recorded to our opening balance of retained earnings.
ITEM 7A.
Quantitative and Qualitative Disclosures about Market Risk
Market risk refers to the potential for losses arising from changes in interest rates, foreign currency fluctuations and exchange rates, equity prices and commodity prices including the correlation among these factors and their volatility.
Our principal market risks are our exposure to changes in interest rates and foreign currency exchange rates. We enter into derivative instruments only to the extent considered necessary to meet risk management objectives and do not use derivative contracts for speculative purposes.
-
52
-
Interest Rate Risk.
We have a revolving credit facility that is subject to the risk of higher interest charges associated with increases in interest rates. As of
December 31, 2018
, we had
$136.1 million
in floating-rate obligations drawn under the Amended Revolving Credit Facility. Use of floating-rate obligations exposes us to the risk of increased interest expense in the event of increases in short-term interest rates. If the floating interest rates increased by 1% from December 31, 2018 levels, our consolidated interest expense would increase by a total of approximately $1.4 million annually.
Foreign Currency Exchange Rate Risk.
Our operations are conducted in various countries around the world and we receive revenue from these operations in a number of different currencies. As such, our earnings are subject to movements in foreign currency exchange rates when transactions are denominated in (i) currencies other than the U.S. dollar, which is our functional currency, or (ii) the functional currency of our subsidiaries, which is not necessarily the U.S. dollar. In order to mitigate the effects of foreign currency exchange rate risks in areas outside of the United States (primarily in our Offshore/Manufactured Products segment), we generally pay a portion of our expenses in local currencies and a substantial portion of our contracts provide for collections from customers in U.S. dollars. During
2018
, our reported foreign currency exchange losses were
$0.1 million
and are included in “Other operating (income) expense, net” in the Consolidated Statements of Operations. In order to reduce our exposure to fluctuations in foreign currency exchange rates, we may enter into foreign currency exchange agreements with financial institutions. As of
December 31, 2017
, we had outstanding foreign currency forward purchase contracts with notional amounts of $2.4 million related to expected cash flows denominated in Euros. No foreign currency contracts were outstanding as of
December 31, 2018
.
Our accumulated other comprehensive loss, reported as a component of stockholders’ equity, increased from
$58.5 million
at
December 31, 2017
to
$71.4 million
at
December 31, 2018
, primarily as a result of foreign currency exchange rate differences in the current year of
$13.1 million
. This other comprehensive income is primarily related to fluctuations in the currency exchange rates compared to the U.S. dollar for certain of the international operations of our reportable segments. As of
December 31, 2018
, the exchange rate of the British pound and the Brazilian real compared to the U.S. dollar weakened by
6%
and
14%
, respectively, compared to the exchange rate at
December 31, 2017
. As of
December 31, 2017
, the exchange rate of the British pound compared to the U.S. dollar strengthened by 9% compared to the exchange rate at
December 31, 2016
, while the exchange rate of the Brazilian real compared to the U.S. dollar weakened by 2% during the same period.
Item 8.
Financial Statements and Supplementary Data
Our Consolidated Financial Statements and supplementary data of the Company begin on page 60 of this Annual Report on Form 10‑K and are incorporated by reference into this Item 8. Selected quarterly financial data is set forth in Note
17
to our Consolidated Financial Statements, which is incorporated herein by reference.
Item 9.
Changes in and Disagreements with Accountants on Accounting and Financial Disclosure
There were no changes in or disagreements on any matters of accounting principles or financial statement disclosure between us and our independent registered public accounting firm during our two most recent fiscal years or any subsequent interim period.
Item 9A.
Controls and Procedures
(i) Evaluation of Disclosure Controls and Procedures
As of the end of the period covered by this Annual Report on Form 10‑K, we carried out an evaluation, under the supervision and with the participation of our management, including our Chief Executive Officer and Chief Financial Officer, of the effectiveness of the design and operation of our disclosure controls and procedures (as defined in Rules 13a-15(e) and 15d-15(e)) of the Exchange Act. Our disclosure controls and procedures are designed to provide reasonable assurance that the information required to be disclosed by us in reports that we file under the Exchange Act is accumulated and communicated to our management, including our Chief Executive Officer and Chief Financial Officer, as appropriate, to allow timely decisions regarding required disclosure and is recorded, processed, summarized and reported within the time periods specified in the rules and forms of the SEC. Based upon that evaluation, our Chief Executive Officer and Chief Financial Officer concluded that our disclosure controls and procedures were effective as of
December 31, 2018
at the reasonable assurance level. The Company closed the GEODynamics Acquisition on January 12, 2018. The acquired GEODynamics’ business is included in our 2018 consolidated financial statements and constitutes
7%
and
6%
of consolidated total and net assets (excluding goodwill and intangibles acquired), respectively, as of
December 31, 2018
and
20%
of consolidated revenues and
$26.7 million
of operating income for the year then ended. As the GEODynamics Acquisition occurred in the first quarter of 2018, the Company excluded the GEODynamics internal control over financial reporting from the scope of our assessment of the effectiveness of our disclosure controls and procedures. This exclusion is in accordance with the general guidance issued by the Staff of the Securities and Exchange Commission that an assessment of a recently acquired business may be omitted from our scope in the year of acquisition, if specified conditions are satisfied.
-
53
-
Pursuant to section 906 of The Sarbanes-Oxley Act of 2002, our Chief Executive Officer and Chief Financial Officer have provided certain certifications to the SEC. These certifications accompanied this report when filed with the SEC, but are not set forth herein.
(ii) Internal Control over Financial Reporting
(a) Management's annual report on internal control over financial reporting.
Our management is responsible for establishing and maintaining adequate internal control over financial reporting as defined in Rules 13a-15(f) and 15d-15(f) under the Exchange Act. Our internal control over financial reporting is a process designed to provide reasonable assurance regarding the reliability of financial reporting and the preparation of consolidated financial statements for external purposes in accordance with GAAP. Our internal control over financial reporting includes those policies and procedures that (i) pertain to the maintenance of records that, in reasonable detail, accurately and fairly reflect the transactions and dispositions of our assets; (ii) provide reasonable assurance that transactions are recorded as necessary to permit preparation of financial statements in accordance with GAAP, and that our receipts and expenditures are being made only in accordance with authorizations of management and our directors; and (iii) provide reasonable assurance regarding prevention or timely detection of unauthorized acquisition, use or disposition of our assets that could have a material effect on the consolidated financial statements.
Because of its inherent limitations, internal control over financial reporting may not prevent or detect misstatements. Also, projections of any evaluation of effectiveness to future periods are subject to the risk that controls may become inadequate because of changes in conditions, or that the degree of compliance with the policies or procedures may deteriorate. Accordingly, even effective internal control over financial reporting can only provide reasonable assurance of achieving their control objectives.
Under the supervision and with the participation of our management, including our Chief Executive Officer and Chief Financial Officer, an assessment of the effectiveness of our internal control over financial reporting as of
December 31, 2018
was conducted. In making this assessment, management used the criteria set forth by the Committee of Sponsoring Organizations of the Treadway Commission ("COSO") in Internal Control–Integrated Framework (2013 Framework). Based on our assessment we believe that, as of
December 31, 2018
, the Company's internal control over financial reporting is effective based on those criteria. The Company closed the GEODynamics Acquisition on January 12, 2018. The acquired GEODynamics’ business is included in our 2018 consolidated financial statements and constitutes
7%
and
6%
of consolidated total and net assets (excluding goodwill and intangibles acquired), respectively, as of
December 31, 2018
and
20%
of consolidated revenues and
$26.7 million
of operating income for the year then ended. As the GEODynamics Acquisition occurred in the first quarter of 2018, the Company excluded the GEODynamics internal control over financial reporting from the scope of our assessment of the effectiveness of our disclosure controls and procedures. This exclusion is in accordance with the general guidance issued by the Staff of the Securities and Exchange Commission that an assessment of a recently acquired business may be omitted from our scope in the year of acquisition, if specified conditions are satisfied.
(b) Attestation report of the registered public accounting firm.
The attestation report of Ernst & Young LLP, the Company's independent registered public accounting firm, on the Company's internal control over financial reporting is set forth in this Annual Report on Form 10‑K on page 62 and is incorporated herein by reference.
(c) Changes in internal control over financial reporting.
Except as described above, there have been no changes in our internal control over financial reporting (as that term is defined in Rules 13a-15(f) and 15d-15(f) under the Exchange Act) that occurred during our fourth fiscal quarter ended
December 31, 2018
, that has materially affected, or is reasonably likely to materially affect, our internal control over financial reporting. The GEODynamics Acquisition had a material impact on internal control over financial reporting. Due to the timing of the GEODynamics Acquisition, the Company has excluded the internal control over financial reporting of GEODynamics from our evaluation of internal control over financial reporting of the Company for the year ended
December 31, 2018
.
Item 9B.
Other Information
There was no information required to be disclosed in a report on Form 8‑K during the fourth quarter of
2018
that was not reported on a Form 8‑K during such time.
-
54
-
PART III
Item 10.
Directors, Executive Officers and Corporate Governance
|
(1)
|
Information concerning directors, including the Company's audit committee financial experts, appears in the Company's Definitive Proxy Statement for the
2019
Annual Meeting of Stockholders, under "Election of Directors." This portion of the Definitive Proxy Statement is incorporated herein by reference.
|
|
(2)
|
Information with respect to executive officers appears in the Company's Definitive Proxy Statement for the
2019
Annual Meeting of Stockholders, under "Executive Officers of the Registrant." This portion of the Definitive Proxy Statement is incorporated herein by reference.
|
|
(3)
|
Information concerning Section 16(a) beneficial ownership reporting compliance appears in the Company's Definitive Proxy Statement for the
2019
Annual Meeting of Stockholders, under "Section 16(a) Beneficial Ownership Reporting Compliance." This portion of the Definitive Proxy Statement is incorporated herein by reference.
|
Item 11.
Executive Compensation
The information required by Item 11 hereby is incorporated by reference to such information as set forth in the Company's Definitive Proxy Statement for the
2019
Annual Meeting of Stockholders.
Item 12.
Security Ownership of Certain Beneficial Owners and Management and Related Stockholder Matters
The information required by Item 12 hereby is incorporated by reference to such information as set forth in the Company's Definitive Proxy Statement for the
2019
Annual Meeting of Stockholders.
Item 13.
Certain Relationships and Related Transactions, and Director Independence
The information required by Item 13 hereby is incorporated by reference to such information as set forth in the Company's Definitive Proxy Statement for the
2019
Annual Meeting of Stockholders.
Item 14.
Principal Accounting Fees and Services
Information concerning principal accounting fees and services and the audit committee's preapproval policies and procedures appear in the Company's Definitive Proxy Statement for the
2019
Annual Meeting of Stockholders under the heading "Fees Paid to Ernst & Young LLP" and is incorporated herein by reference.
-
55
-
PART IV
Item 15.
Exhibits, Financial Statement Schedules
|
(a)
|
Index to Financial Statements, Financial Statement Schedules and Exhibits
|
|
(1)
|
Financial Statements:
Reference is made to the index set forth on page 60 of this Annual Report on Form 10‑K.
|
|
(2)
|
Financial Statement Schedules:
No schedules have been included herein because the information required to be submitted has been included in the Consolidated Financial Statements or the Notes thereto, or the required information is inapplicable.
|
|
(3)
|
Index of Exhibits:
See Index of Exhibits, below, for a list of those exhibits filed herewith, which index also includes and identifies management contracts or compensatory plans or arrangements required to be filed as exhibits to this Annual Report on Form 10‑K by Item 601 of Regulation S‑K.
|
|
(b)
|
Index of Exhibits
|
|
Exhibit No.
|
|
Description
|
|
|
|
|
|
—
|
||
|
|
|
|
|
—
|
||
|
|
|
|
|
—
|
||
|
|
|
|
|
—
|
||
|
|
|
|
|
—
|
||
|
|
|
|
|
—
|
||
|
|
|
|
|
—
|
||
|
|
|
|
|
—
|
||
|
|
|
|
|
—
|
||
|
|
|
|
|
—
|
||
|
—
|
||
|
|
|
|
|
—
|
||
|
|
|
|
-
56
-
|
—
|
||
|
|
|
|
|
—
|
||
|
|
|
|
|
—
|
||
|
—
|
||
|
|
|
|
|
—
|
||
|
|
|
|
|
—
|
||
|
|
|
|
|
—
|
||
|
|
|
|
|
—
|
||
|
|
|
|
|
—
|
||
|
—
|
||
|
|
|
|
|
—
|
||
|
|
|
|
|
—
|
||
|
|
|
|
|
—
|
||
|
|
|
|
|
—
|
||
|
|
|
|
|
—
|
||
|
|
|
|
|
—
|
||
|
|
|
|
|
—
|
||
|
|
|
|
-
57
-
|
—
|
||
|
|
|
|
|
—
|
||
|
|
|
|
|
—
|
||
|
|
|
|
|
—
|
||
|
|
|
|
|
—
|
||
|
|
|
|
|
—
|
||
|
—
|
||
|
|
|
|
|
—
|
||
|
|
|
|
|
—
|
||
|
|
|
|
|
—
|
||
|
|
|
|
|
—
|
||
|
|
|
|
|
—
|
||
|
|
|
|
|
—
|
||
|
|
|
|
|
101.INS*
|
—
|
XBRL Instance Document
|
|
|
|
|
|
101.SCH*
|
—
|
XBRL Taxonomy Extension Schema Document
|
|
|
|
|
|
101.CAL*
|
—
|
XBRL Taxonomy Extension Calculation Linkbase Document
|
|
|
|
|
|
101.DEF*
|
—
|
XBRL Taxonomy Extension Definition Linkbase Document
|
|
|
|
|
|
101.LAB*
|
—
|
XBRL Taxonomy Extension Label Linkbase Document
|
|
|
|
|
|
101.PRE*
|
—
|
XBRL Taxonomy Extension Presentation Linkbase Document
|
---------
|
*
|
Filed herewith.
|
|
**
|
Furnished herewith.
|
|
+
|
Management contracts or compensatory plans or arrangements.
|
-
58
-
SIGNATURES
Pursuant to the requirements of Section 13 or 15(d) of the Securities Exchange Act of 1934, the registrant has duly caused this report to be signed on its behalf by the undersigned, thereunto duly authorized on
February 19, 2019
.
OIL STATES INTERNATIONAL, INC.
|
|
|
|
|
|
By
|
/s/ Cindy B. Taylor
|
|
|
|
Cindy B. Taylor
|
|
|
|
President and Chief Executive Officer
|
Pursuant to the requirements of the Securities Exchange Act of 1934, this report has been signed by the following persons on behalf of the registrant in the capacities indicated on
February 19, 2019
.
|
Signature
|
|
Title
|
|
|
|
|
|
|
|
*
|
|
Chairman of the Board
|
|
|
Robert L. Potter
|
|
|
|
|
|
|
|
|
|
/s/ Cindy B. Taylor
|
|
Director, President & Chief Executive Officer
|
|
|
Cindy B. Taylor
|
|
(Principal Executive Officer)
|
|
|
|
|
|
|
|
/s/ Lloyd A. Hajdik
|
|
Executive Vice President, Chief Financial Officer
|
|
|
Lloyd A. Hajdik
|
|
and Treasurer
|
|
|
|
|
(Principal Financial Officer)
|
|
|
|
|
|
|
|
/s/ Brian E. Taylor
|
|
Vice President, Controller and Chief Accounting Officer
|
|
|
Brian E. Taylor
|
|
(Principal Accounting Officer)
|
|
|
|
|
|
|
|
*
|
|
Director
|
|
|
Lawrence R. Dickerson
|
|
|
|
|
|
|
|
|
|
*
|
Director
|
||
|
Darrell Hollek
|
|||
|
*
|
|
Director
|
|
|
S. James Nelson, Jr.
|
|
|
|
|
*
|
|
Director
|
|
|
Christopher T. Seaver
|
|
|
|
|
|
|
|
|
|
*
|
|
Director
|
|
|
William T. Van Kleef
|
|
|
|
|
|
|
|
|
|
*
|
|
Director
|
|
|
Stephen A. Wells
|
|
|
|
|
*
|
Director
|
||
|
Edwin J. Wright
|
|||
|
*By:
|
/s/ Lloyd A. Hajdik
|
|
|
|
Lloyd A. Hajdik, pursuant to a power of
|
|
|
|
|
attorney filed as Exhibit 24.1 to this
|
|
|
|
|
Annual Report on Form 10-K
|
|
|
|
-
59
-
OIL STATES INTERNATIONAL, INC. AND SUBSIDIARIES
INDEX TO
CONSOLIDATED FINANCIAL STATEMENTS
-
60
-
REPORT OF
INDEPENDENT
REGISTERED PUBLIC ACCOUNTING FIRM
To the Stockholders and Board of Directors of Oil States International, Inc.
Opinion on the Financial Statements
We have audited the accompanying consolidated balance sheets of Oil States International, Inc. and subsidiaries (the Company) as of
December 31, 2018
and
2017
, the related consolidated statements of operations, comprehensive loss, stockholders’ equity and cash flows for each of the three years in the period ended
December 31, 2018
, and the related notes (collectively referred to as the "consolidated financial statements"). In our opinion, the consolidated financial statements present fairly, in all material respects, the financial position of the Company at
December 31, 2018
and
2017
, and the results of its operations and its cash flows for each of the three years in the period ended
December 31, 2018
, in conformity with U.S. generally accepted accounting principles.
We also have audited, in accordance with the standards of the Public Company Accounting Oversight Board (United States) (PCAOB), the Company’s internal control over financial reporting as of
December 31, 2018
, based on criteria established in Internal Control - Integrated Framework issued by the Committee of Sponsoring Organizations of the Treadway Commission (2013 framework) and our report dated
February 19, 2019
expressed an unqualified opinion thereon.
Basis for Opinion
These financial statements are the responsibility of the Company’s management. Our responsibility is to express an opinion on the Company’s financial statements based on our audits. We are a public accounting firm registered with the PCAOB and are required to be independent with respect to the Company in accordance with the U.S. federal securities laws and the applicable rules and regulations of the Securities and Exchange Commission and the PCAOB.
We conducted our audits in accordance with the standards of the PCAOB. Those standards require that we plan and perform the audit to obtain reasonable assurance about whether the financial statements are free of material misstatement, whether due to error or fraud. Our audits included performing procedures to assess the risks of material misstatement of the financial statements, whether due to error or fraud, and performing procedures that respond to those risks. Such procedures included examining, on a test basis, evidence regarding the amounts and disclosures in the financial statements. Our audits also included evaluating the accounting principles used and significant estimates made by management, as well as evaluating the overall presentation of the financial statements. We believe that our audits provide a reasonable basis for our opinion.
/s/
Ernst & Young LLP
We have served as the Company‘s auditor since 2000.
Houston, Texas
February 19, 2019
-
61
-
REPORT OF INDEPENDENT REGISTERED PUBLIC ACCOUNTING FIRM
To the Stockholders and Board of Directors of Oil States International, Inc.
Opinion on Internal Control Over Financial Reporting
We have audited Oil States International, Inc. and subsidiaries’ internal control over financial reporting as of
December 31, 2018
, based on criteria established in Internal Control-Integrated Framework issued by the Committee of Sponsoring Organizations of the Treadway Commission (2013 framework) (the COSO criteria). In our opinion, Oil States International, Inc. and subsidiaries (the Company) maintained, in all material respects, effective internal control over financial reporting as of
December 31, 2018
, based on the COSO criteria.
As indicated in the accompanying Management's annual report on internal control over financial reporting, management’s assessment of and conclusion on the effectiveness of internal control over financial reporting did not include the internal controls of GEODynamics, which is included in the 2018 consolidated financial statements of the Company and constituted
7%
and
6%
of total and net assets (excluding goodwill and intangibles acquired), respectively, as of
December 31, 2018
and
20%
of revenues and
$26.7 million
of operating income for the year then ended. Our audit of internal control over financial reporting of the Company also did not include an evaluation of the internal control over financial reporting of GEODynamics.
We also have audited, in accordance with the standards of the Public Company Accounting Oversight Board (United States) (PCAOB), the consolidated balance sheets of the Company as of
December 31, 2018
and
2017
, the related consolidated statements of operations, comprehensive loss, stockholders’ equity and cash flows for each of the three years in the period ended
December 31, 2018
and related notes, and our report dated
February 19, 2019
expressed an unqualified opinion thereon.
Basis for Opinion
The Company’s management is responsible for maintaining effective internal control over financial reporting and for its assessment of the effectiveness of internal control over financial reporting included in the accompanying Management’s annual report on internal control over financial reporting. Our responsibility is to express an opinion on the Company’s internal control over financial reporting based on our audit. We are a public accounting firm registered with the PCAOB and are required to be independent with respect to the Company in accordance with the U.S. federal securities laws and the applicable rules and regulations of the Securities and Exchange Commission and the PCAOB.
We conducted our audit in accordance with the standards of the PCAOB. Those standards require that we plan and perform the audit to obtain reasonable assurance about whether effective internal control over financial reporting was maintained in all material respects.
Our audit included obtaining an understanding of internal control over financial reporting, assessing the risk that a material weakness exists, testing and evaluating the design and operating effectiveness of internal control based on the assessed risk, and performing such other procedures as we considered necessary in the circumstances. We believe that our audit provides a reasonable basis for our opinion.
Definition and Limitations of Internal Control Over Financial Reporting
A company’s internal control over financial reporting is a process designed to provide reasonable assurance regarding the reliability of financial reporting and the preparation of financial statements for external purposes in accordance with generally accepted accounting principles. A company’s internal control over financial reporting includes those policies and procedures that (1) pertain to the maintenance of records that, in reasonable detail, accurately and fairly reflect the transactions and dispositions of the assets of the company; (2) provide reasonable assurance that transactions are recorded as necessary to permit preparation of financial statements in accordance with generally accepted accounting principles, and that receipts and expenditures of the company are being made only in accordance with authorizations of management and directors of the company; and (3) provide reasonable assurance regarding prevention or timely detection of unauthorized acquisition, use, or disposition of the company’s assets that could have a material effect on the financial statements.
Because of its inherent limitations, internal control over financial reporting may not prevent or detect misstatements. Also, projections of any evaluation of effectiveness to future periods are subject to the risk that controls may become inadequate because of changes in conditions, or that the degree of compliance with the policies or procedures may deteriorate.
/s/
Ernst & Young LLP
Houston, Texas
February 19, 2019
-
62
-
OIL STATES INTERNATIONAL, INC. AND SUBSIDIARIES
CONSOLIDATED STATEMENTS OF
OPERATIONS
(In Thousands, Except Per Share Amounts)
|
|
Year Ended December 31,
|
||||||||||
|
|
2018
|
2017
|
2016
|
||||||||
|
Revenues:
|
|
|
|
||||||||
|
Products
|
$
|
501,822
|
|
$
|
303,802
|
|
$
|
416,174
|
|
||
|
Service
|
586,311
|
|
366,825
|
|
278,270
|
|
|||||
|
|
1,088,133
|
|
670,627
|
|
694,444
|
|
|||||
|
Costs and expenses:
|
|
|
|
||||||||
|
Product costs
|
366,453
|
|
219,466
|
|
288,270
|
|
|||||
|
Service costs
|
468,060
|
|
301,289
|
|
238,500
|
|
|||||
|
Cost of revenues (exclusive of depreciation and amortization expense presented below)
|
834,513
|
|
520,755
|
|
526,770
|
|
|||||
|
Selling, general and administrative expenses
|
138,070
|
|
114,816
|
|
124,033
|
|
|||||
|
Depreciation and amortization expense
|
123,530
|
|
107,667
|
|
118,720
|
|
|||||
|
Other operating (income) expense, net
|
(2,104
|
)
|
1,261
|
|
(5,796
|
)
|
|||||
|
|
1,094,009
|
|
744,499
|
|
763,727
|
|
|||||
|
Operating loss
|
(5,876
|
)
|
(73,872
|
)
|
(69,283
|
)
|
|||||
|
Interest expense
|
(19,314
|
)
|
(4,674
|
)
|
(5,343
|
)
|
|||||
|
Interest income
|
319
|
|
359
|
|
399
|
|
|||||
|
Other income
|
3,139
|
|
775
|
|
902
|
|
|||||
|
Loss from continuing operations before income taxes
|
(21,732
|
)
|
(77,412
|
)
|
(73,325
|
)
|
|||||
|
Income tax (provision) benefit
|
2,627
|
|
(7,438
|
)
|
26,939
|
|
|||||
|
Net loss from continuing operations
|
(19,105
|
)
|
(84,850
|
)
|
(46,386
|
)
|
|||||
|
Net loss from discontinued operations, net of tax
|
—
|
|
—
|
|
(4
|
)
|
|||||
|
Net loss
|
$
|
(19,105
|
)
|
$
|
(84,850
|
)
|
$
|
(46,390
|
)
|
||
|
Basic net loss per share from:
|
|
|
|
||||||||
|
Continuing operations
|
$
|
(0.33
|
)
|
$
|
(1.69
|
)
|
$
|
(0.92
|
)
|
||
|
Discontinued operations
|
—
|
|
—
|
|
—
|
|
|||||
|
Net loss
|
$
|
(0.33
|
)
|
$
|
(1.69
|
)
|
$
|
(0.92
|
)
|
||
|
Diluted net loss per share from:
|
|
|
|
||||||||
|
Continuing operations
|
$
|
(0.33
|
)
|
$
|
(1.69
|
)
|
$
|
(0.92
|
)
|
||
|
Discontinued operations
|
—
|
|
—
|
|
—
|
|
|||||
|
Net loss
|
$
|
(0.33
|
)
|
$
|
(1.69
|
)
|
$
|
(0.92
|
)
|
||
|
Weighted average number of common shares outstanding:
|
|
|
|
||||||||
|
Basic
|
58,712
|
|
50,139
|
|
50,174
|
|
|||||
|
Diluted
|
58,712
|
|
50,139
|
|
50,174
|
|
|||||
The accompanying notes are an integral part of these financial statements.
-
63
-
OIL STATES INTERNATIONAL, INC. AND SUBSIDIARIES
CONSOLIDATED STATEMENTS OF COMPREHENSIVE
LOSS
(In Thousands)
|
|
Year Ended December 31,
|
||||||||||
|
|
2018
|
2017
|
2016
|
||||||||
|
Net loss
|
$
|
(19,105
|
)
|
$
|
(84,850
|
)
|
$
|
(46,390
|
)
|
||
|
Other comprehensive income (loss):
|
|
|
|
||||||||
|
Currency translation adjustments, net of tax
|
(13,088
|
)
|
11,766
|
|
(19,778
|
)
|
|||||
|
Other
|
184
|
|
41
|
|
176
|
|
|||||
|
Total other comprehensive income (loss)
|
(12,904
|
)
|
11,807
|
|
(19,602
|
)
|
|||||
|
Comprehensive loss
|
$
|
(32,009
|
)
|
$
|
(73,043
|
)
|
$
|
(65,992
|
)
|
||
The accompanying notes are an integral part of these financial statements.
-
64
-
OIL STATES INTERNATIONAL, INC. AND SUBSIDIARIES
CONSOLIDATED BALANCE SHEETS
(In Thousands, Except Share Amounts)
|
|
December 31,
|
||||||
|
|
2018
|
2017
|
|||||
|
ASSETS
|
|||||||
|
Current assets:
|
|
|
|||||
|
Cash and cash equivalents
|
$
|
19,316
|
|
$
|
53,459
|
|
|
|
Accounts receivable, net
|
283,607
|
|
216,139
|
|
|||
|
Inventories, net
|
209,393
|
|
168,285
|
|
|||
|
Prepaid expenses and other current assets
|
21,715
|
|
18,054
|
|
|||
|
Total current assets
|
534,031
|
|
455,937
|
|
|||
|
Property, plant and equipment, net
|
540,427
|
|
498,890
|
|
|||
|
Goodwill, net
|
647,018
|
|
268,009
|
|
|||
|
Other intangible assets, net
|
255,301
|
|
50,265
|
|
|||
|
Other noncurrent assets
|
27,044
|
|
28,410
|
|
|||
|
Total assets
|
$
|
2,003,821
|
|
$
|
1,301,511
|
|
|
|
LIABILITIES AND STOCKHOLDERS' EQUITY
|
|||||||
|
Current liabilities:
|
|
|
|||||
|
Current portion of long-term debt
|
$
|
25,561
|
|
$
|
411
|
|
|
|
Accounts payable
|
77,511
|
|
49,089
|
|
|||
|
Accrued liabilities
|
60,730
|
|
45,889
|
|
|||
|
Income taxes payable
|
3,072
|
|
1,647
|
|
|||
|
Deferred revenue
|
14,160
|
|
18,234
|
|
|||
|
Total current liabilities
|
181,034
|
|
115,270
|
|
|||
|
Long-term debt
|
306,177
|
|
4,870
|
|
|||
|
Deferred income taxes
|
53,831
|
|
24,718
|
|
|||
|
Other noncurrent liabilities
|
23,011
|
|
23,940
|
|
|||
|
Total liabilities
|
564,053
|
|
168,798
|
|
|||
|
Stockholders' equity:
|
|
|
|||||
|
Common stock, $.01 par value, 200,000,000 shares authorized, 71,753,937 shares and 62,721,698 shares issued, respectively
|
718
|
|
627
|
|
|||
|
Additional paid-in capital
|
1,097,758
|
|
754,607
|
|
|||
|
Retained earnings
|
1,029,518
|
|
1,048,623
|
|
|||
|
Accumulated other comprehensive loss
|
(71,397
|
)
|
(58,493
|
)
|
|||
|
Treasury stock, at cost, 11,784,242 and 11,632,276 shares, respectively
|
(616,829
|
)
|
(612,651
|
)
|
|||
|
Total stockholders' equity
|
1,439,768
|
|
1,132,713
|
|
|||
|
Total liabilities and stockholders' equity
|
$
|
2,003,821
|
|
$
|
1,301,511
|
|
|
The accompanying notes are an integral part of these financial statements
-
65
-
OIL STATES INTERNATIONAL, INC. AND SUBSIDIARIES
CONSOLIDATED STATEMENTS OF STOCKHOLDERS' EQUITY
(In Thousands)
|
|
Common
Stock
|
Additional Paid‑In Capital
|
Retained Earnings
|
Accumulated Other
Comprehensive Loss
|
Treasury
Stock
|
Total Stockholders' Equity
|
|||||||||||||||||
|
Balance, December 31, 2015
|
$
|
617
|
|
$
|
712,980
|
|
$
|
1,179,863
|
|
$
|
(50,698
|
)
|
$
|
(587,090
|
)
|
$
|
1,255,672
|
|
|||||
|
Net loss
|
—
|
|
—
|
|
(46,390
|
)
|
—
|
|
—
|
|
(46,390
|
)
|
|||||||||||
|
Currency translation adjustment (excluding intercompany advances)
|
—
|
|
—
|
|
—
|
|
(23,802
|
)
|
—
|
|
(23,802
|
)
|
|||||||||||
|
Currency translation adjustment on intercompany advances
|
—
|
|
—
|
|
—
|
|
4,024
|
|
—
|
|
4,024
|
|
|||||||||||
|
Other comprehensive income
|
—
|
|
—
|
|
—
|
|
176
|
|
—
|
|
176
|
|
|||||||||||
|
Stock-based compensation expense:
|
|
|
|
|
|
|
|||||||||||||||||
|
Restricted stock
|
6
|
|
18,899
|
|
—
|
|
—
|
|
—
|
|
18,905
|
|
|||||||||||
|
Stock options
|
—
|
|
2,245
|
|
—
|
|
—
|
|
—
|
|
2,245
|
|
|||||||||||
|
Exercise/vesting of stock-based awards, including tax impact
|
—
|
|
(2,609
|
)
|
—
|
|
—
|
|
—
|
|
(2,609
|
)
|
|||||||||||
|
Surrender of stock to settle taxes on restricted stock awards
|
|
|
—
|
|
—
|
|
—
|
|
(3,980
|
)
|
(3,980
|
)
|
|||||||||||
|
OIS common stock withdrawn from deferred compensation plan
|
—
|
|
47
|
|
—
|
|
—
|
|
19
|
|
66
|
|
|||||||||||
|
Balance, December 31, 2016
|
623
|
|
731,562
|
|
1,133,473
|
|
(70,300
|
)
|
(591,051
|
)
|
1,204,307
|
|
|||||||||||
|
Net loss
|
—
|
|
—
|
|
(84,850
|
)
|
—
|
|
—
|
|
(84,850
|
)
|
|||||||||||
|
Currency translation adjustment (excluding intercompany advances)
|
—
|
|
—
|
|
—
|
|
11,316
|
|
—
|
|
11,316
|
|
|||||||||||
|
Currency translation adjustment on intercompany advances
|
—
|
|
—
|
|
—
|
|
450
|
|
—
|
|
450
|
|
|||||||||||
|
Other comprehensive income
|
—
|
|
—
|
|
—
|
|
41
|
|
—
|
|
41
|
|
|||||||||||
|
Stock-based compensation expense:
|
|||||||||||||||||||||||
|
Restricted stock
|
4
|
|
21,801
|
|
—
|
|
—
|
|
—
|
|
21,805
|
|
|||||||||||
|
Stock options
|
—
|
|
1,244
|
|
—
|
|
—
|
|
—
|
|
1,244
|
|
|||||||||||
|
Stock repurchases
|
—
|
|
—
|
|
—
|
|
—
|
|
(16,283
|
)
|
(16,283
|
)
|
|||||||||||
|
Surrender of stock to settle taxes on restricted stock awards
|
—
|
|
—
|
|
—
|
|
—
|
|
(5,317
|
)
|
(5,317
|
)
|
|||||||||||
|
Balance, December 31, 2017
|
627
|
|
754,607
|
|
1,048,623
|
|
(58,493
|
)
|
(612,651
|
)
|
1,132,713
|
|
|||||||||||
|
Net loss
|
—
|
|
—
|
|
(19,105
|
)
|
—
|
|
—
|
|
(19,105
|
)
|
|||||||||||
|
Currency translation adjustment (excluding intercompany advances)
|
—
|
|
—
|
|
—
|
|
(10,984
|
)
|
—
|
|
(10,984
|
)
|
|||||||||||
|
Currency translation adjustment on intercompany advances
|
—
|
|
—
|
|
—
|
|
(2,104
|
)
|
—
|
|
(2,104
|
)
|
|||||||||||
|
Other comprehensive income
|
—
|
|
—
|
|
—
|
|
184
|
|
—
|
|
184
|
|
|||||||||||
|
Stock-based compensation expense:
|
|||||||||||||||||||||||
|
Restricted stock
|
4
|
|
22,153
|
|
—
|
|
—
|
|
—
|
|
22,157
|
|
|||||||||||
|
Stock options
|
—
|
|
492
|
|
—
|
|
—
|
|
—
|
|
492
|
|
|||||||||||
|
Issuance of common stock in connection with GEODynamics Acquisition
|
87
|
|
294,823
|
|
—
|
|
—
|
|
—
|
|
294,910
|
|
|||||||||||
|
Issuance of 1.50% convertible senior notes, net of income taxes of $7,744
|
—
|
|
25,683
|
|
—
|
|
—
|
|
—
|
|
25,683
|
|
|||||||||||
|
Surrender of stock to settle taxes on restricted stock awards
|
—
|
|
—
|
|
—
|
|
—
|
|
(4,178
|
)
|
(4,178
|
)
|
|||||||||||
|
Balance, December 31, 2018
|
$
|
718
|
|
$
|
1,097,758
|
|
$
|
1,029,518
|
|
$
|
(71,397
|
)
|
$
|
(616,829
|
)
|
$
|
1,439,768
|
|
|||||
The accompanying notes are an integral part of these financial statements.
-
66
-
OIL STATES INTERNATIONAL, INC. AND SUBSIDIARIES
CONSOLIDATED STATEMENTS OF CASH FLOWS
(In Thousands)
|
|
Year Ended December 31,
|
||||||||||
|
|
2018
|
2017
|
2016
|
||||||||
|
Cash flows from operating activities:
|
|
|
|
||||||||
|
Net loss
|
$
|
(19,105
|
)
|
$
|
(84,850
|
)
|
$
|
(46,390
|
)
|
||
|
Adjustments to reconcile net loss to net cash provided by operating activities:
|
|
|
|
||||||||
|
Loss from discontinued operations
|
—
|
|
—
|
|
4
|
|
|||||
|
Depreciation and amortization expense
|
123,530
|
|
107,667
|
|
118,720
|
|
|||||
|
Stock-based compensation expense
|
22,649
|
|
23,049
|
|
21,322
|
|
|||||
|
Deferred income tax expense (benefit)
|
(3,489
|
)
|
16,342
|
|
(37,606
|
)
|
|||||
|
Amortization of debt discount and deferred financing costs
|
7,408
|
|
1,158
|
|
785
|
|
|||||
|
Gain on disposals of assets
|
(6,288
|
)
|
(700
|
)
|
(802
|
)
|
|||||
|
Other, net
|
1,411
|
|
288
|
|
2,923
|
|
|||||
|
Changes in operating assets and liabilities, net of effect from acquired businesses:
|
|
|
|
||||||||
|
Accounts receivable
|
(16,792
|
)
|
21,128
|
|
85,503
|
|
|||||
|
Inventories
|
(7,283
|
)
|
11,339
|
|
32,158
|
|
|||||
|
Accounts payable and accrued liabilities
|
5,796
|
|
14,048
|
|
(27,716
|
)
|
|||||
|
Income taxes payable
|
802
|
|
(4,126
|
)
|
(1,930
|
)
|
|||||
|
Other operating assets and liabilities, net
|
(5,469
|
)
|
(9,961
|
)
|
2,286
|
|
|||||
|
Net cash flows provided by operating activities
|
103,170
|
|
95,382
|
|
149,257
|
|
|||||
|
Cash flows from investing activities:
|
|
|
|
||||||||
|
Capital expenditures
|
(88,024
|
)
|
(35,171
|
)
|
(29,689
|
)
|
|||||
|
Acquisitions of businesses, net of cash acquired
|
(379,676
|
)
|
(12,859
|
)
|
—
|
|
|||||
|
Proceeds from disposition of property, plant and equipment
|
3,659
|
|
2,134
|
|
1,532
|
|
|||||
|
Proceeds from flood insurance claims
|
3,850
|
|
—
|
|
—
|
|
|||||
|
Other, net
|
(1,184
|
)
|
(1,719
|
)
|
(1,135
|
)
|
|||||
|
Net cash flows used in investing activities
|
(461,375
|
)
|
(47,615
|
)
|
(29,292
|
)
|
|||||
|
Cash flows from financing activities:
|
|
|
|
||||||||
|
Issuance of 1.50% convertible senior notes
|
200,000
|
|
—
|
|
—
|
|
|||||
|
Revolving credit facility borrowings
|
835,467
|
|
206,015
|
|
211,878
|
|
|||||
|
Revolving credit facility repayments
|
(699,322
|
)
|
(248,199
|
)
|
(292,552
|
)
|
|||||
|
Other debt and capital lease repayments, net
|
(537
|
)
|
(517
|
)
|
(534
|
)
|
|||||
|
Payment of financing costs
|
(7,372
|
)
|
(759
|
)
|
(72
|
)
|
|||||
|
Purchase of treasury stock
|
—
|
|
(16,283
|
)
|
—
|
|
|||||
|
Shares added to treasury stock as a result of net share settlements
due to vesting of restricted stock
|
(4,178
|
)
|
(5,317
|
)
|
(3,962
|
)
|
|||||
|
Issuance of common stock from stock-based payment arrangements
|
—
|
|
—
|
|
367
|
|
|||||
|
Net cash flows provided by (used in) financing activities
|
324,058
|
|
(65,060
|
)
|
(84,875
|
)
|
|||||
|
Effect of exchange rate changes on cash and cash equivalents
|
4
|
|
1,952
|
|
(2,263
|
)
|
|||||
|
Net change in cash and cash equivalents
|
(34,143
|
)
|
(15,341
|
)
|
32,827
|
|
|||||
|
Cash and cash equivalents, beginning of year
|
53,459
|
|
68,800
|
|
35,973
|
|
|||||
|
Cash and cash equivalents, end of year
|
$
|
19,316
|
|
$
|
53,459
|
|
$
|
68,800
|
|
||
|
Cash paid for:
|
|||||||||||
|
Interest
|
$
|
9,864
|
|
$
|
4,206
|
|
$
|
3,942
|
|
||
|
Income taxes, net of refunds
|
2,993
|
|
(174
|
)
|
2,330
|
|
|||||
The accompanying notes are an integral part of these financial statements.
-
67
-
OIL STATES INTERNATIONAL, INC. AND SUBSIDIARIES
NOTES TO CONSOLIDATED FINANCIAL STATEMENTS
1
.
Organization and Basis of Presentation
The Consolidated Financial Statements include the accounts of Oil States International, Inc. (“Oil States” or the “Company”) and its consolidated subsidiaries. Investments in unconsolidated affiliates, in which the Company is able to exercise significant influence, are accounted for using the equity method. All significant intercompany accounts and transactions between the Company and its consolidated subsidiaries have been eliminated in the accompanying consolidated financial statements. Certain prior-year amounts in the Company's consolidated financial statements have been reclassified to conform to the current year presentation.
The Company, through its subsidiaries, is a leading provider of specialty products and services to oil and gas companies throughout the world. We operate in a substantial number of the world's active crude oil and natural gas producing regions, including: onshore and offshore United States, Canada, West Africa, the North Sea, the Middle East, South America and Southeast and Central Asia.
The Company currently operates through
three
business segments – Well Site Services, Downhole Technologies and Offshore/Manufactured Products. On January 12, 2018, the Company acquired GEODynamics, Inc., (“GEODynamics” and the “GEODynamics Acquisition”). These acquired operations are reported as the Downhole Technologies segment. On February 28, 2018, the Company acquired Falcon Flowback Services, LLC (“Falcon”), which was integrated into the Completion Services business unit. There have been no other changes in reporting structure.
2
. Summary of Significant Accounting Policies
Use of Estimates
The preparation of consolidated financial statements in conformity with accounting principles generally accepted in the United States requires the use of estimates and assumptions by management in determining the reported amounts of assets and liabilities and disclosures of contingent assets and liabilities at the date of the consolidated financial statements and the reported amounts of revenues and expenses during the reporting period. Examples of a few such estimates include goodwill and long-lived asset impairment, revenue and income recognized over time, valuation allowances recorded on deferred tax assets, the fair value of assets and liabilities acquired and identification of associated goodwill and intangible assets, reserves on inventory, allowances for doubtful accounts, warranty obligations and potential future adjustments related to contractual indemnification and other agreements. Actual results could materially differ from those estimates.
Cash and Cash Equivalents
All highly liquid investments purchased with an original maturity of three months or less are considered to be cash equivalents.
Fair Value of Financial Instruments
Financial instruments consist of cash and cash equivalents, investments, receivables, payables, debt instruments and foreign currency forward contracts. The Company believes that the carrying values of these instruments, other than its
1.50%
convertible senior notes due 2023 (the "Notes") described in Note
7
, "Long-term Debt," on the accompanying consolidated balance sheets approximate their fair values. The estimated fair value of the Notes as of
December 31, 2018
was
$166 million
, based on quoted market prices (a Level 1 fair value measurement), which compares to
$200 million
in principal amount of the Notes.
Inventories
Inventories consist of consumable oilfield products, manufactured equipment, spare parts for manufactured equipment, and work-in-process. Inventories also include raw materials, labor, subcontractor charges, manufacturing overhead and other supplies and are carried at the lower of cost or market, or estimated fair market value at acquisition date if acquired in a business combination. The cost of inventories is determined on an average cost or specific-identification method. A reserve for excess and/or obsolete inventory is maintained based on the age, turnover or condition of the inventory.
Property, Plant, and Equipment
Property, plant, and equipment are stated at cost or at estimated fair market value at acquisition date if acquired in a business combination, and depreciation is computed, for assets owned or recorded under capital lease, using the straight-line method, after allowing for salvage value where applicable, over the estimated useful lives of the assets. The Company uses the component
-
68
-
OIL STATES INTERNATIONAL, INC. AND SUBSIDIARIES
NOTES TO CONSOLIDATED FINANCIAL STATEMENTS
(continued)
depreciation method for its Drilling Services assets. Leasehold improvements are capitalized and amortized over the lesser of the life of the lease or the estimated useful life of the asset.
Expenditures for repairs and maintenance are charged to expense when incurred. Expenditures for major renewals and betterments, which extend the useful lives of existing equipment, are capitalized and depreciated. Upon retirement or disposition of property and equipment, the cost and related accumulated depreciation are removed from the accounts and any resulting gain or loss is recognized in the statements of operations.
Goodwill and Intangible Assets
Goodwill represents the excess of the purchase price paid for acquired businesses over the allocated fair value of the related net assets after impairments, if applicable. Goodwill is evaluated for impairment annually on December 1 and when an event occurs or circumstances change to suggest that the carrying amount may not be recoverable. Reporting units with goodwill as of
December 31, 2018
include Completion Services, Downhole Technologies and Offshore/Manufactured Products. In the evaluation of goodwill, each reporting unit with goodwill on its balance sheet is assessed separately and different relevant events and circumstances are evaluated for each unit. Management estimates the fair value of each reporting unit and compares that fair value to its recorded carrying value. Management utilizes, depending on circumstances, a combination of trading multiples analyses, discounted projected cash flow calculations with estimated terminal values and acquisition comparables. Projected cash flows are discounted using a long-term weighted average cost of capital for each reporting unit based on estimates of investment returns that would be required by a market participant. As part of the process of assessing goodwill for potential impairment, the total market capitalization of the Company is compared to the sum of the fair values of all reporting units to assess the reasonableness of aggregated fair values. If the carrying amount of a reporting unit exceeds its fair value, goodwill is considered impaired and an impairment loss is recorded. In the past three years, goodwill impairment tests indicated that the fair value of each reporting unit is greater than its carrying amount.
For other amortized intangible assets, the useful life of the intangible asset is reviewed and evaluated each reporting period for events and circumstances that may warrant a revision of the remaining useful life. Based on the Company’s review, the carrying values of its other intangible assets are recoverable, and no impairment losses have been recorded for the periods presented.
See Note
6
, "Goodwill and Other Intangible Assets."
Impairment of Long-Lived Assets
The recoverability of the carrying values of long-lived assets at the asset group level, including finite-lived intangible assets, is assessed whenever, in management's judgment, events or changes in circumstances indicate that the carrying value of such asset groups may not be recoverable based on estimated future cash flows. If this assessment indicates that the carrying values will not be recoverable, as determined based on undiscounted cash flows over the remaining useful lives, an impairment loss is recognized. The impairment loss, if any, equals the excess of the carrying value over the fair value of the asset group. The fair value of the asset group is based on appraised values, prices of similar assets (if available), or discounted cash flows. Based on the Company's review, the carrying values of its asset groups are recoverable, and no impairment losses have been recorded for the periods presented.
Foreign
Currency and Other Comprehensive Loss
Gains and losses resulting from balance sheet translation of international operations where the local currency is the functional currency are included as a component of accumulated other comprehensive loss within stockholders' equity and represent substantially all of the accumulated other comprehensive loss balance. Remeasurements of intercompany advances denominated in a currency other than the functional currency of the entity that are of a long-term investment nature are recognized as a separate component of other comprehensive loss within stockholders’ equity. Gains and losses resulting from balance sheet remeasurements of assets and liabilities denominated in a different currency than the functional currency, other than intercompany advances that are of a long-term investment nature, are included in the consolidated statements of operations within "other operating
(income) expense
, net" as incurred.
Currency Exchange Rate Risk
A portion of revenues, earnings and net investments in operations outside the United States are exposed to changes in currency exchange rates. The Company seeks to manage its currency exchange risk in part through operational means, including managing expected local currency revenues in relation to local currency costs and local currency assets in relation to local currency liabilities.
-
69
-
OIL STATES INTERNATIONAL, INC. AND SUBSIDIARIES
NOTES TO CONSOLIDATED FINANCIAL STATEMENTS
(continued)
In order to reduce exposure to fluctuations in currency exchange rates, the Company may enter into currency exchange agreements with financial institutions. As of
December 31, 2018
, the Company had
no
outstanding foreign currency forward purchase contracts. As of
December 31, 2017
, the Company had outstanding foreign currency forward purchase contracts with notional amounts of
$2.4 million
related to expected cash flows denominated in Euros which were not designated as accounting hedges. Currency exchange losses were
$0.1 million
in
2018
, and
$0.5 million
in
2017
, with exchange gains totaling
$4.7 million
in
2016
. These were included in “other operating
(income) expense
, net.”
Revenue and Cost Recognition
The Company accounts for revenue in accordance with Financial and Accounting Standards Board ("FASB") guidance on revenue from contracts with customers (“ASC 606”), which the Company adopted as of January 1, 2018. While the new guidance did not have a material impact on the Company’s recognition of revenues, the Company has expanded revenue recognition disclosures to address the new qualitative and quantitative disclosure requirements. Contractual terms may vary by contract and customer, which may impact the timing of revenue recognition under the standard in future periods.
The Company's revenue contracts may include one or more promises to transfer a distinct good or service to the customer, which is referred to under ASC 606 as a "performance obligation," and to which revenue is allocated. The Company recognizes revenue and the related cost when, or as, the performance obligations are satisfied. The majority of significant contracts for custom engineered products have a single performance obligation as no individual good or service is separately identifiable from other performance obligations in the contracts. For contracts with multiple distinct performance obligations, the Company allocates revenue to the identified performance obligations in the contract. The Company’s product sales terms do not include significant post-performance obligations.
The Company’s performance obligations may be satisfied at a point in time or over time as work progresses. Revenues from products and services transferred to customers at a point in time accounted for approximately
29%
,
22%
and
25%
of consolidated revenues for the years ended
December 31, 2018
,
2017
and
2016
, respectively. The majority of the Company's revenue recognized at a point in time is derived from short-term contracts for standard products. Revenue on these contracts is recognized when control over the product has transferred to the customer. Indicators the Company considers in determining when transfer of control to the customer occurs include: right to payment for the product, transfer of legal title to the customer, transfer of physical possession of the product, transfer of risk and customer acceptance of the product.
Revenues from products and services transferred to customers over time accounted for approximately
71%
,
78%
and
75%
of consolidated revenues for the years ended
December 31, 2018
,
2017
and
2016
, respectively. The majority of the Company’s revenue recognized over time is for services provided under short-term contracts with revenue recognized as the customer receives and consumes the services. In addition, the Company manufactures certain products to individual customer specifications under short-term contracts for which control passes to the customer as the performance obligations are fulfilled and for which, under the new standard, revenue is recognized over time.
For significant project-related contracts involving custom engineered products within the Offshore/Manufactured Products segment (also referred to as "projected-driven products"), revenues are typically recognized over time using an input measure such as the percentage of costs incurred to date relative to total estimated costs at completion for each contract (cost-to-cost method). Contract costs include labor, material and overhead. Management believes this method is the most appropriate measure of progress on large contracts. Billings on such contracts in excess of costs incurred and estimated profits are classified as a contract liability (deferred revenue). Costs incurred and estimated profits in excess of billings on these contracts are recognized as a contract asset (a component of accounts receivable).
Contract estimates for project-related contracts involving custom engineered products are based on various assumptions to project the outcome of future events that may span several years. Changes in assumptions that may affect future project costs and margins include production efficiencies, the complexity of the work to be performed and the availability and costs of labor, materials and subcomponents. As a significant change in one or more of these estimates could affect the profitability of the Company’s contracts, contract-related estimates are reviewed regularly. The Company recognizes adjustments in estimated profit on contracts under the cumulative catch-up method. Under this method, the impact of the adjustment on profit recorded to date is recognized in the period the adjustment is identified. Revenue and profit in future periods of contract performance are recognized using the adjusted estimate. If at any time the estimate of contract profitability indicates an anticipated loss will be incurred on the contract, the loss is recognized in the period it is identified.
-
70
-
OIL STATES INTERNATIONAL, INC. AND SUBSIDIARIES
NOTES TO CONSOLIDATED FINANCIAL STATEMENTS
(continued)
Taxes assessed by a governmental authority that are both imposed on and concurrent with a specific revenue-producing transaction, and that are collected by the Company from a customer, are excluded from revenue. Shipping and handling costs associated with outbound freight after control over a product has transferred to a customer are accounted for as a fulfillment cost and are included in cost of products.
Proceeds from customers for the cost of oilfield rental equipment that is damaged or lost downhole are reflected as gains or losses on the disposition of assets after considering the write-off of the remaining net book value of the equipment.
Product costs and service costs include all direct material and labor costs and those costs related to contract performance, such as indirect labor, supplies, tools and repairs. As disclosed on our consolidated statements of operations, product costs and service costs exclude depreciation and amortization expense, which is separately presented. Selling, general and administrative costs are charged to expense as incurred.
The Company has applied the practical expedient in ASC 606 and does not disclose information about remaining performance obligations (or "backlog") that have original expected durations of
one
year or less. As of
December 31, 2018
, the Company had
$41.6 million
of remaining backlog related to contracts with an original expected duration of greater than
one
year. Approximately
53%
of this remaining backlog is expected to be recognized as revenue in
2019
and the balance thereafter.
Income Taxes
The Company follows the liability method of accounting for income taxes. Under this method, deferred income taxes are recorded based upon the differences between the financial reporting and tax bases of assets and liabilities and are measured using the enacted tax rates and laws in effect at the time the underlying assets or liabilities are recovered or settled.
As further discussed in Note
8
, "Income Taxes," on December 22, 2017, legislation commonly known as the Tax Cuts and Jobs Act ("Tax Reform Legislation") was signed into law which enacts significant changes to U.S. tax and related laws, including certain key U.S. federal income tax provisions applicable to oilfield service and manufacturing companies such as the Company. U.S. state or other regulatory bodies have not finalized potential changes to existing laws and regulations which may result from the new U.S. tax and related laws. In accordance with the Securities and Exchange Commission’s Staff Accounting Bulletin No. 118, the Company recorded provisional estimates to reflect the effect of the Tax Reform Legislation on the Company’s income tax assets and liabilities as of December 31, 2017. During 2018, the Company adjusted these provisional estimates based upon additional guidance issued by the Internal Revenue Service.
Prior to December 22, 2017, the majority of the Company's earnings from international subsidiaries were considered to be indefinitely reinvested outside of the United States and no provision for U.S. income taxes was made for these earnings. However, certain historical foreign earnings were not considered to be indefinitely reinvested outside of the United States and were subject to U.S income tax as earned. If any of the Company's subsidiaries distributed earnings in the form of dividends or otherwise, the Company generally was subject to both U.S. income taxes (subject to an adjustment for foreign tax credits) and withholding taxes payable to various foreign countries.
As of
December 31, 2018
, the Company’s total investment in foreign subsidiaries is considered to be indefinitely reinvested outside of the United States.
The Company records a valuation allowance in the reporting period when management believes that it is more likely than not that any deferred tax asset will not be realized. This assessment requires analysis of changes in tax laws, available positive and negative evidence, including consideration of losses in recent years, reversals of temporary differences, forecasts of future income, assessment of future business and tax planning strategies. During
2018
,
2017
and 2016, the Company recorded valuation allowances primarily with respect to net operating loss carryforwards of certain operations outside the United States. As a result of the changes in U.S. tax laws in 2017 discussed above, the Company also recorded a valuation allowance on its foreign tax credit carryforwards during the fourth quarter of 2017.
The calculation of tax liabilities involves assessing uncertainties regarding the application of complex tax regulations. The Company recognizes liabilities for tax expenses based on estimates of whether, and the extent to which, additional taxes will be due. If management ultimately determines that payment of these amounts is unnecessary, the liability is reversed and a tax benefit is recognized during the period in which management determines that the liability is no longer necessary. An additional charge is recorded as a provision for taxes in the period in which management determines that the recorded tax liability is less than the expected ultimate assessment.
-
71
-
OIL STATES INTERNATIONAL, INC. AND SUBSIDIARIES
NOTES TO CONSOLIDATED FINANCIAL STATEMENTS
(continued)
Receivables and Concentration of Credit Risk
Based on the nature of its customer base, the Company does not believe that it has any significant concentrations of credit risk other than its concentration in the worldwide oil and gas industry. Note
14
, "Segments and Related Information," provides further information with respect to the Company's geographic revenues and significant customers. The Company evaluates the credit-worthiness of its significant, new and existing customers' financial condition and, generally, the Company does not require significant collateral from its customers.
Allowances for Doubtful Accounts
The Company maintains allowances for doubtful accounts for estimated losses resulting from the inability of the Company's customers to make required payments. If a trade receivable is deemed to be uncollectible, the receivable is charged-off against allowance for doubtful accounts. The Company considers the following factors when determining if collection of revenue is reasonably assured: customer credit-worthiness, past transaction history with the customer, customer solvency and changes in customer payment terms. If the Company has no previous experience with the customer, the Company typically obtains reports from various credit organizations to ensure that the customer has a history of paying its creditors. The Company may also request financial information, including financial statements or other documents to ensure that the customer has the means of making payment. If these factors do not indicate collection is reasonably assured, the Company may require a prepayment or other arrangement to support revenue recognition and recording of a trade receivable. If the financial condition of the Company's customers were to deteriorate, adversely affecting their ability to make payments, additional allowances would be required.
Earnings per Share
Diluted earnings per share (“EPS”) amounts include the effect, if dilutive, of the Company's outstanding stock options, restricted stock and convertible securities under the treasury stock method. Currently issued and outstanding shares of restricted stock remain subject to vesting requirements. Holders of shares of unvested restricted stock are entitled to the same liquidation and dividend rights as holders of outstanding common stock and are thus considered participating securities. Under applicable accounting guidance, undistributed earnings, if any, for each period are allocated based on the participation rights of both the common stockholders and holders of any participating securities as if earnings for the respective periods had been distributed. Because both the liquidation and dividend rights are identical, undistributed earnings are allocated on a proportionate basis. The Company is required to compute earnings per share amounts under the two class method in periods with earnings.
The presentation of basic EPS amounts on the face of the accompanying consolidated statements of operations is computed by dividing the net income or loss applicable to the Company’s common stockholders by the weighted average shares of outstanding common stock. The calculation of diluted EPS is similar to basic EPS, except that the denominator includes dilutive common stock equivalents and the income or loss included in the numerator excludes the impact, if any, of dilutive common stock equivalents.
Stock-Based Compensation
The fair value of share-based payments is estimated using the quoted market price of the Company’s common stock and pricing models as of the date of grant as further discussed in Note
11
, "Long-Term Incentive and Deferred Compensation Plans." The resulting cost, net of estimated forfeitures, is recognized over the period during which an employee is required to provide service in exchange for the awards, usually the vesting period. In addition to service-based awards, the Company issues performance-based awards, which are conditional based upon Company performance and may vest in an amount that will depend on the Company’s achievement of specified performance objectives.
Guarantees
Some product sales in the Offshore/Manufactured Products segment are sold with an assurance warranty, generally ranging from
12
to
18
months. Parts and labor are covered under the terms of the warranty agreement. Warranty provisions are estimated based upon historical experience by product, configuration and geographic region.
During the ordinary course of business, the Company also provides standby letters of credit or other guarantee instruments to certain parties as required for certain transactions initiated by either the Company or its subsidiaries. As of
December 31, 2018
, the maximum potential amount of future payments that the Company could be required to make under these guarantee agreements (letters of credit) was
$22.6 million
. The Company has not recorded any liability in connection with these guarantee arrangements. The Company does not believe, based on historical experience and information currently available, that it is likely that any material amounts will be required to be paid under these guarantee arrangements.
-
72
-
OIL STATES INTERNATIONAL, INC. AND SUBSIDIARIES
NOTES TO CONSOLIDATED FINANCIAL STATEMENTS
(continued)
Accounting for Contingencies
The Company has contingent liabilities and future claims for which estimates of the amount of the eventual cost to liquidate such liabilities are accrued. These liabilities and claims sometimes involve threatened or actual litigation where damages have been quantified and an assessment of exposure has been made and recorded in an amount estimated to cover the expected loss. Other claims or liabilities have been estimated based on their fair value or management's experience in such matters and, when appropriate, the advice of outside counsel or other outside experts. Upon the ultimate resolution of these uncertainties, future reported financial results will be impacted by the difference between the accruals and actual amounts paid in settlement. Examples of areas with important estimates of future liabilities include duties, income taxes, litigation, insurance claims, warranty claims, contractual claims and obligations and discontinued operations.
Discontinued Operations
Net loss from discontinued operations includes immaterial amounts in 2016 related to the Company’s former accommodations business which was spun-off into a stand-alone, publicly-traded corporation in 2014.
3
.
Recent Accounting Pronouncements
From time to time, new accounting pronouncements are issued by the FASB, which are adopted by the Company as of the specified effective date. Unless otherwise discussed, management believes that the impact of recently issued standards, which are not yet effective, will not have a material impact on the Company’s consolidated financial statements upon adoption.
In
May 2014
, the FASB issued guidance on revenue from contracts with customers that superseded most then-current revenue recognition guidance, including industry-specific guidance (often referred to as "ASC 606"). The underlying principle is that an entity recognizes revenue to depict the transfer of goods or services to customers at an amount that the entity expects to be entitled to receive in exchange for those goods or services. The Company adopted this guidance on January 1, 2018, using the modified retrospective transition method applied to those contracts which were not completed as of that date. On January 1, 2018, the Company was required to recognize any cumulative effect of adopting this guidance as an adjustment to the opening balance of retained earnings. Prior periods were not retrospectively adjusted. Based on analysis of existing contracts with customers, the Company concluded that the cumulative impact of the new standard was not material to its consolidated financial statements through January 1, 2018.
In
February 2016
, the FASB issued guidance on leases which, as amended, introduces the recognition of lease assets and lease liabilities by lessees for all leases that are not short-term in nature. In connection with the required adoption of this guidance on
January 1, 2019
, the Company elected the optional transition method of recognizing any cumulative effect of adopting this guidance as an adjustment to the opening balance of retained earnings. Prior periods were not retrospectively adjusted. Based on analysis of existing long-term leases as of
December 31, 2018
, the Company estimates the adoption of the standard will result in approximately
$45 million
of additional assets and liabilities being reflected in its consolidated balance sheet, with no material cumulative impact expected to be recorded to the opening balance of retained earnings.
4
. Details of Selected Balance Sheet Accounts
Additional information regarding selected balance sheet accounts as of
December 31, 2018
and
2017
is presented below (in thousands). See Note
5
, "Business Acquisitions" for the contributory impact of the GEODynamics and Falcon acquisitions.
|
|
2018
|
2017
|
|||||
|
Accounts receivable, net:
|
|
|
|||||
|
Trade
|
$
|
227,052
|
|
$
|
153,912
|
|
|
|
Unbilled revenue
|
35,674
|
|
21,638
|
|
|||
|
Contract assets
|
21,201
|
|
41,195
|
|
|||
|
Other
|
6,381
|
|
6,710
|
|
|||
|
Total accounts receivable
|
290,308
|
|
223,455
|
|
|||
|
Allowance for doubtful accounts
|
(6,701
|
)
|
(7,316
|
)
|
|||
|
|
$
|
283,607
|
|
$
|
216,139
|
|
|
|
2018
|
2017
|
||||||
|
Deferred revenue (contract liabilities)
|
$
|
14,160
|
|
$
|
18,234
|
|
|
-
73
-
OIL STATES INTERNATIONAL, INC. AND SUBSIDIARIES
NOTES TO CONSOLIDATED FINANCIAL STATEMENTS
(continued)
For the majority of contracts with customers, the Company receives payments based upon established contractual terms as products are delivered and services are performed. The Company’s larger project-driven contracts within the Offshore/Manufactured Products segment often provide for customer payments as milestones are achieved.
Contract assets relate to the Company's right to consideration for work completed but not billed as of
December 31, 2018
and
2017
on certain project-driven contracts within the Offshore/Manufactured Products segment. Contract assets are transferred to unbilled or trade receivables when the right to consideration becomes unconditional. Contract liabilities primarily relate to advance consideration received from customers (i.e. milestone payments) for contracts for project-driven products as well as others which require significant advance investment in materials. Consistent with industry practice, the Company classifies assets and liabilities related to long-term contracts as current, even though some of these amounts may not be realized within one year. All contracts are reported on the consolidated balance sheets in a net asset (contract asset) or liability (deferred revenue) position on a contract-by-contract basis at the end of each reporting period. In the normal course of business, the Company also receives advance consideration from customers on many other short-term, smaller product and service contracts which is deferred and recognized as revenue once the related performance obligation is satisfied.
For the year ended
December 31, 2018
, the
$20.0 million
net
decrease
in contract assets was primarily attributable to
$17.7 million
in revenue recognized during the year, which was more than offset by
$38.0 million
transferred to accounts receivable. Deferred revenue
decreased
by
$4.1 million
in
2018
, reflecting the recognition of
$11.1 million
of revenue that was deferred at the beginning of the period partially offset by
$7.4 million
in new customer billings which were not recognized as revenue during the year.
|
|
2018
|
2017
|
|||||
|
Inventories, net:
|
|
|
|||||
|
Finished goods and purchased products
|
$
|
96,195
|
|
$
|
82,990
|
|
|
|
Work in process
|
20,552
|
|
30,689
|
|
|||
|
Raw materials
|
111,197
|
|
70,255
|
|
|||
|
Total inventories
|
227,944
|
|
183,934
|
|
|||
|
Allowance for excess or obsolete inventory
|
(18,551
|
)
|
(15,649
|
)
|
|||
|
|
$
|
209,393
|
|
$
|
168,285
|
|
|
|
|
2018
|
2017
|
|||||
|
Prepaid expenses and other current assets:
|
|
|
|||||
|
Income taxes receivable
|
$
|
9,529
|
|
$
|
5,927
|
|
|
|
Prepayments to vendors
|
2,153
|
|
2,962
|
|
|||
|
Prepaid insurance
|
3,849
|
|
5,007
|
|
|||
|
Other
|
6,184
|
|
4,158
|
|
|||
|
|
$
|
21,715
|
|
$
|
18,054
|
|
|
|
|
Estimated
Useful Life (in years)
|
2018
|
2017
|
||||||||||
|
Property, plant and equipment, net:
|
|
|
|||||||||||
|
Land
|
$
|
37,545
|
|
$
|
35,808
|
|
|||||||
|
Buildings and leasehold improvements
|
2
|
–
|
40
|
259,834
|
|
235,330
|
|
||||||
|
Machinery and equipment
|
1
|
–
|
28
|
483,629
|
|
458,458
|
|
||||||
|
Completion Services equipment
|
2
|
–
|
10
|
492,183
|
|
431,714
|
|
||||||
|
Office furniture and equipment
|
3
|
–
|
10
|
43,654
|
|
43,664
|
|
||||||
|
Vehicles
|
2
|
–
|
10
|
122,982
|
|
118,198
|
|
||||||
|
Construction in progress
|
29,451
|
|
34,557
|
|
|||||||||
|
Total property, plant and equipment
|
1,469,278
|
|
1,357,729
|
|
|||||||||
|
Accumulated depreciation
|
(928,851
|
)
|
(858,839
|
)
|
|||||||||
|
|
$
|
540,427
|
|
$
|
498,890
|
|
|||||||
During 2018, the Company and its insurance carriers reached a final settlement on flood insurance claims resulting from Hurricane Harvey in 2017. In connection with this settlement, the Company's Offshore/Manufactured Products segment recognized a gain of
$3.8 million
following the remediation and repair of buildings and equipment and, to a lesser extent, the disposal of
-
74
-
OIL STATES INTERNATIONAL, INC. AND SUBSIDIARIES
NOTES TO CONSOLIDATED FINANCIAL STATEMENTS
(continued)
equipment damaged beyond repair. This gain is reported as other
income
in the accompanying consolidated statement of operations for the year ended December 31, 2018.
Depreciation expense was
$97.2 million
,
$99.0 million
and
$110.5 million
for the years ended
December 31, 2018
,
2017
and
2016
, respectively.
|
|
2018
|
2017
|
|||||
|
Other noncurrent assets:
|
|
|
|||||
|
Deferred compensation plan
|
$
|
20,468
|
|
$
|
20,988
|
|
|
|
Deferred income taxes
|
761
|
|
519
|
|
|||
|
Other
|
5,815
|
|
6,903
|
|
|||
|
|
$
|
27,044
|
|
$
|
28,410
|
|
|
|
|
2018
|
2017
|
|||||
|
Accrued liabilities:
|
|
|
|||||
|
Accrued compensation
|
$
|
29,867
|
|
$
|
25,794
|
|
|
|
Insurance liabilities
|
9,177
|
|
6,831
|
|
|||
|
Accrued taxes, other than income taxes
|
4,530
|
|
3,591
|
|
|||
|
Accrued commissions
|
1,484
|
|
1,335
|
|
|||
|
Accrued claims
|
2,983
|
|
1,320
|
|
|||
|
Other
|
12,689
|
|
7,018
|
|
|||
|
|
$
|
60,730
|
|
$
|
45,889
|
|
|
5
. Business Acquisitions
GEODynamics Acquisition
On January 12, 2018, the Company acquired GEODynamics for a purchase price consisting of (i)
$295.4 million
in cash (net of cash acquired), which was funded through borrowings under the Company's Revolving Credit Facility (as defined in Note
7
, "Long-term Debt"), (ii) approximately
8.66 million
shares of the Company's common stock (having a market value of approximately
$295 million
as of the closing date of the acquisition) and (iii) an unsecured
$25 million
promissory note that bears interest at
2.5%
per annum and is scheduled to mature on July 12, 2019. Under the terms of the purchase agreement, the Company may be entitled to indemnification in respect of certain matters occurring prior to acquisition and payments due under the promissory note may be subject to set-off, in part or in full, regarding such indemnified matters. See Note
13
, "Commitments and Contingencies."
GEODynamics’ results of operations have been included in the Company’s consolidated financial statements subsequent to the closing of the acquisition on January 12, 2018. The acquired GEODynamics operations, reported as the Downhole Technologies segment, contributed revenues of
$213.8 million
and operating income of
$26.7 million
for the period from January 12, 2018 through December 31, 2018. See Note
14
, "Segments and Related Information" for further information with respect to the Downhole Technologies segment operations.
In connection with the GEODynamics Acquisition, the Company entered into a registration rights agreement covering the stock issued. The Company filed a shelf registration statement for the resale of shares in accordance with the agreement on January 19, 2018 and the selling stockholder sold approximately
5.93 million
shares of the Company's common stock through an underwritten offering in late February 2018. As of
December 31, 2018
, the Company does not expect to have any further material obligations under the registration rights agreement.
Falcon Acquisition
On February 28, 2018, the Company acquired Falcon, a full service provider of flowback and well testing services for the separation and recovery of fluids, solid debris and proppant used during hydraulic fracturing operations. Falcon provides additional scale and diversity to our Completion Services well testing operations in key shale plays in the United States. The purchase price was
$84.2 million
(net of cash acquired). The Falcon acquisition was funded by borrowings under the Company's Amended Revolving Credit Facility (as defined in Note
7
, "Long-term Debt"). Under the terms of the purchase agreement, the Company may be entitled to indemnification for certain matters occurring prior to the acquisition. Falcon’s results of operations have been
-
75
-
OIL STATES INTERNATIONAL, INC. AND SUBSIDIARIES
NOTES TO CONSOLIDATED FINANCIAL STATEMENTS
(continued)
included in the Company’s consolidated financial statements and has been reported within the Completion Services business subsequent to the closing of the acquisition on February 28, 2018.
The GEODynamics and Falcon acquisitions have been accounted for using the acquisition method of accounting. The following table summarizes the Company's estimates of the fair value of assets acquired and liabilities assumed in the acquisitions, as of their respective dates of acquisitions (in thousands):
|
GEODynamics
|
Falcon
|
|||||||
|
Accounts receivable, net
|
$
|
36,193
|
|
$
|
21,029
|
|
||
|
Inventories
|
35,701
|
|
242
|
|
||||
|
Property, plant and equipment
|
25,769
|
|
26,979
|
|
||||
|
Intangible assets
|
||||||||
|
Customer relationships
|
105,000
|
|
18,254
|
|
||||
|
Patents/Technology/Know-how
|
48,000
|
|
—
|
|
||||
|
Tradenames
|
40,000
|
|
4,771
|
|
||||
|
Noncompete agreements
|
13,000
|
|
1,226
|
|
||||
|
Other assets
|
1,627
|
|
491
|
|
||||
|
Accounts payable and accrued liabilities
|
(21,550
|
)
|
(10,532
|
)
|
||||
|
Deferred income taxes
|
(24,035
|
)
|
(a)
|
—
|
|
|||
|
Other liabilities
|
(1,867
|
)
|
(167
|
)
|
||||
|
Total identifiable net assets
|
257,838
|
|
62,293
|
|
||||
|
Goodwill
|
357,502
|
|
(b)
|
21,953
|
|
(c)
|
||
|
Total net assets
|
$
|
615,340
|
|
$
|
84,246
|
|
||
|
Consideration consists of:
|
||||||||
|
Cash, net of cash acquired
|
$
|
295,430
|
|
$
|
84,246
|
|
||
|
Oil States common stock
|
294,910
|
|
—
|
|
||||
|
Promissory note
|
25,000
|
|
—
|
|
||||
|
Total consideration
|
$
|
615,340
|
|
$
|
84,246
|
|
||
|
Intangible asset weighted-average useful lives (years):
|
||||
|
Customer relationships
|
17
|
13
|
||
|
Patents/Technology/Know-how
|
13
|
n.a.
|
||
|
Tradenames
|
20
|
10
|
||
|
Noncompete agreements
|
3
|
2
|
||
____________________
|
a.
|
In connection with the acquisition accounting for GEODynamics, the Company provided deferred taxes related to, among other items, fair value adjustments for acquired property, plant and equipment, intangible assets and U.S. tax net operating loss carryforwards.
|
|
b.
|
Goodwill recognized is primarily attributable to expected synergies that will result from combining the operations of the Company and GEODynamics, as well as intangible assets which do not qualify for separate recognition. The amount of goodwill that is deductible for income tax purposes is not significant.
|
|
c.
|
Goodwill recognized is primarily attributable to expected synergies that will result from combining the operations of the Company and Falcon, as well as intangible assets which do not qualify for separate recognition. All goodwill is deductible for income tax purposes.
|
During the years ended
December 31, 2018
and
2017
, the Company expensed
$3.6 million
and
$0.9 million
, respectively, in transaction-related costs incurred in connection with the acquisitions of GEODynamics and Falcon, which are included within selling, general and administrative expense and within other operating
(income) expense
.
-
76
-
OIL STATES INTERNATIONAL, INC. AND SUBSIDIARIES
NOTES TO CONSOLIDATED FINANCIAL STATEMENTS
(continued)
Supplemental Unaudited Pro Forma Financial Information
The following supplemental unaudited pro forma results of operations data for the Company gives pro forma effect to the consummation of the GEODynamics and Falcon acquisitions as if they had occurred on January 1, 2017. The supplemental unaudited pro forma financial information for the Company was prepared based on historical financial information, adjusted to give pro forma effect to fair value adjustments on depreciation and amortization expense, interest expense, and related tax effects, among others. The pro forma results for the year ended December 31, 2018 and 2017 reflect adjustments to exclude the after-tax impact of transaction costs of
$2.8 million
and
$0.6 million
, respectively. The supplemental pro forma financial information is unaudited and may not reflect what the results of the combined operations would have been were the acquisitions to have occurred on January 1, 2017. As such, it is presented for informational purposes only (in thousands, except per share amounts).
|
Unaudited Pro Forma Information
|
|||||||
|
Year Ended December 31,
|
|||||||
|
2018
|
2017
|
||||||
|
Revenue
|
$
|
1,114,757
|
|
$
|
924,100
|
|
|
|
Net loss
|
$
|
(16,605
|
)
|
$
|
(81,143
|
)
|
|
|
Diluted net loss per share
|
$
|
(0.28
|
)
|
$
|
(1.38
|
)
|
|
|
Diluted weighted average common shares outstanding
|
58,973
|
|
58,800
|
|
|||
This supplemental unaudited pro forma results of operations data reflects adjustments required for business combinations and is based upon, among other things, estimates of the fair value of assets acquired and liabilities assumed and certain assumptions that the Company believes are reasonable.
Other Acquisitions
During 2017, the Company invested a total of
$12.9 million
in cash in connection with the acquisitions discussed below.
In January 2017, the Company's Offshore/Manufactured Products segment acquired the intellectual property and assets of complementary product lines to its global crane manufacturing and service operations. The acquisition included adding active heave compensation technology and knuckle-boom crane designs to its existing portfolio.
In April 2017, the Company's Offshore/Manufactured Products segment acquired assets and intellectual property that are complementary to its riser testing, inspection and repair service offerings. This complementary technology allows the segment to provide automated inspection techniques either on board an offshore vessel or on the quayside, without the requirements to transport to a facility to remove the buoyancy materials.
6
. Goodwill and Other Intangible Assets
The Company tests for impairment at the "reporting unit" level using a fair value approach. A reporting unit is the operating segment, or a business one level below that operating segment (the "component" level) if discrete financial information is prepared and regularly reviewed by management at the component level. The Company had
three
reporting units – Completion Services, Downhole Technologies and Offshore/Manufactured Products – with goodwill as of
December 31, 2018
. Goodwill is allocated to each reporting unit based on acquisitions made by the Company and its subsidiaries. The Company recognizes an impairment loss for any amount by which the carrying amount of a reporting unit's goodwill exceeds that reporting unit's fair value of goodwill. Assessment of potential goodwill impairment at each reporting unit uses comparative market multiples, discounted cash flow calculations and acquisition comparables to establish the reporting unit's fair value (a Level 3 fair value measurement).
The Company amortizes the cost of other intangibles over their estimated useful lives unless such lives are deemed indefinite. Amortizable intangible assets are reviewed for impairment if there are indicators of impairment based on undiscounted cash flows and, if impaired, are written down to fair value based on either appraised values or discounted cash flows.
As of
December 31, 2018
and
2017
, no provision for impairment of goodwill or other intangible assets was required.
-
77
-
OIL STATES INTERNATIONAL, INC. AND SUBSIDIARIES
NOTES TO CONSOLIDATED FINANCIAL STATEMENTS
(continued)
Changes in the carrying amount of goodwill for the years ended
December 31, 2018
and
2017
are as follows (in thousands):
|
|
Well Site Services
|
Downhole Technologies
|
Offshore / Manufactured
Products
|
Total
|
|||||||||||||||||||
|
|
Completion
Services
|
Drilling
Services
|
Subtotal
|
||||||||||||||||||||
|
Balance as of December 31, 2016
|
|
|
|
|
|
||||||||||||||||||
|
Goodwill
|
$
|
199,278
|
|
$
|
22,767
|
|
$
|
222,045
|
|
$
|
—
|
|
$
|
158,619
|
|
$
|
380,664
|
|
|||||
|
Accumulated impairment losses
|
(94,528
|
)
|
(22,767
|
)
|
(117,295
|
)
|
—
|
|
—
|
|
(117,295
|
)
|
|||||||||||
|
|
104,750
|
|
—
|
|
104,750
|
|
—
|
|
158,619
|
|
263,369
|
|
|||||||||||
|
Goodwill acquired
|
—
|
|
—
|
|
—
|
|
—
|
|
3,724
|
|
3,724
|
|
|||||||||||
|
Foreign currency translation
|
353
|
|
—
|
|
353
|
|
—
|
|
563
|
|
916
|
|
|||||||||||
|
Balance as of December 31, 2017
|
$
|
105,103
|
|
$
|
—
|
|
$
|
105,103
|
|
$
|
—
|
|
$
|
162,906
|
|
$
|
268,009
|
|
|||||
|
Balance as of December 31, 2017
|
|
|
|
|
|
||||||||||||||||||
|
Goodwill
|
$
|
199,631
|
|
$
|
22,767
|
|
$
|
222,398
|
|
$
|
—
|
|
$
|
162,906
|
|
$
|
385,304
|
|
|||||
|
Accumulated impairment losses
|
(94,528
|
)
|
(22,767
|
)
|
(117,295
|
)
|
—
|
|
—
|
|
(117,295
|
)
|
|||||||||||
|
|
105,103
|
|
—
|
|
105,103
|
|
—
|
|
162,906
|
|
268,009
|
|
|||||||||||
|
Goodwill acquired
|
21,953
|
|
—
|
|
21,953
|
|
357,502
|
|
—
|
|
379,455
|
|
|||||||||||
|
Foreign currency translation
|
(2
|
)
|
—
|
|
(2
|
)
|
—
|
|
(444
|
)
|
(446
|
)
|
|||||||||||
|
Balance as of December 31, 2018
|
$
|
127,054
|
|
$
|
—
|
|
$
|
127,054
|
|
$
|
357,502
|
|
$
|
162,462
|
|
$
|
647,018
|
|
|||||
|
Balance as of December 31, 2018
|
|||||||||||||||||||||||
|
Goodwill
|
$
|
221,582
|
|
$
|
22,767
|
|
$
|
244,349
|
|
$
|
357,502
|
|
$
|
162,462
|
|
$
|
764,313
|
|
|||||
|
Accumulated impairment losses
|
(94,528
|
)
|
(22,767
|
)
|
(117,295
|
)
|
—
|
|
—
|
|
(117,295
|
)
|
|||||||||||
|
$
|
127,054
|
|
$
|
—
|
|
$
|
127,054
|
|
$
|
357,502
|
|
$
|
162,462
|
|
$
|
647,018
|
|
||||||
The following table presents the total gross carrying amount of intangibles and the total accumulated amortization for major intangible asset classes as of
December 31, 2018
and
2017
(in thousands):
|
|
As of December 31,
|
||||||||||||||
|
|
2018
|
2017
|
|||||||||||||
|
Other Intangible Assets
|
Gross
Carrying
Amount
|
Accumulated
Amortization
|
Gross
Carrying
Amount
|
Accumulated
Amortization
|
|||||||||||
|
Customer relationships
|
$
|
167,811
|
|
$
|
33,247
|
|
$
|
44,557
|
|
$
|
22,661
|
|
|||
|
Patents/Technology/Know-how
|
84,903
|
|
23,418
|
|
35,762
|
|
15,844
|
|
|||||||
|
Noncompete agreements
|
18,705
|
|
7,544
|
|
4,899
|
|
2,799
|
|
|||||||
|
Tradenames and other
|
53,708
|
|
5,617
|
|
10,801
|
|
4,450
|
|
|||||||
|
Total other intangible assets
|
$
|
325,127
|
|
$
|
69,826
|
|
$
|
96,019
|
|
$
|
45,754
|
|
|||
Amortization expense was
$26.3 million
,
$8.7 million
and
$8.2 million
in the years ended
December 31, 2018
,
2017
and
2016
, respectively. The weighted average remaining amortization period for all intangible assets, other than goodwill, was
13.5 years
as of
December 31, 2018
and
7.8 years
as of
December 31, 2017
. Amortization expense is expected to total
$26.8 million
in
2019
,
$24.9 million
in
2020
,
$20.4 million
in
2021
,
$19.6 million
in
2022
and
$16.6 million
in
2023
.
-
78
-
OIL STATES INTERNATIONAL, INC. AND SUBSIDIARIES
NOTES TO CONSOLIDATED FINANCIAL STATEMENTS
(continued)
7
.
Long-term Debt
As of
December 31, 2018
and
2017
, long-term debt consisted of the following (in thousands):
|
|
2018
|
2017
|
|||||
|
Amended Revolving Credit Facility
(1)
|
$
|
134,096
|
|
$
|
—
|
|
|
|
1.50% convertible senior notes
(2)
|
167,102
|
|
—
|
|
|||
|
Promissory note
|
25,000
|
|
—
|
|
|||
|
Other debt and capital lease obligations
|
5,540
|
|
5,281
|
|
|||
|
Total debt
|
331,738
|
|
5,281
|
|
|||
|
Less: Current portion
|
(25,561
|
)
|
(411
|
)
|
|||
|
Total long-term debt
|
$
|
306,177
|
|
$
|
4,870
|
|
|
____________________
|
(1)
|
Presented net of
$2.0 million
of unamortized debt issuance costs as of
December 31, 2018
. Unamortized debt issuance costs of
$1.6 million
as of December 31, 2017 are classified in other noncurrent assets.
|
|
(2)
|
The principal amount of the
1.50%
convertible senior notes is
$200 million
. See "Issuance of
1.50%
Convertible Senior Notes" below.
|
Scheduled maturities of total debt as of
December 31, 2018
, are as follows (in thousands):
|
2019
|
$
|
25,561
|
|
|
2020
|
611
|
|
|
|
2021
|
552
|
|
|
|
2022
|
134,675
|
|
|
|
2023
|
167,525
|
|
|
|
Thereafter
|
2,814
|
|
|
|
|
$
|
331,738
|
|
Revolving
Credit Facility
Prior to January 30, 2018, the Company's senior secured revolving credit facility (the "Revolving Credit Facility") was governed by a credit agreement with Wells Fargo Bank, N.A., as administrative agent for the lenders party thereto and collateral agent for the secured parties thereunder, and the lenders and other financial institutions from time to time party thereto, dated as of May 28, 2014, as amended (the "Credit Agreement"), that was scheduled to mature on May 28, 2019. On January 30, 2018, and subsequently on May 14, 2018, the Company amended the Revolving Credit Facility and amended and restated the Credit Agreement (the "Amended Revolving Credit Facility" and "Amended Credit Agreement," respectively), to extend the maturity to January 30, 2022 and permit the issuance of convertible senior notes as discussed below. The Amended Credit Agreement governs our Amended Revolving Credit Facility. The Amended Revolving Credit Facility provides for
$350.0 million
in lender commitments with an option to increase the maximum borrowings to
$500.0 million
subject to additional lender commitments prior to its maturity on January 30, 2022. Under the Amended Revolving Credit Facility,
$50 million
is available for the issuance of letters of credit.
As of
December 31, 2018
, the Company had
$136.1 million
of borrowings outstanding under the Amended Credit Agreement and
$22.6 million
of outstanding letters of credit, leaving
$156.2 million
available to be drawn. The total amount available to be drawn under the Amended Revolving Credit Facility was less than the lender commitments as of
December 31, 2018
, due to limits imposed by maintenance covenants in the Amended Credit Agreement.
Amounts outstanding under the Amended Revolving Credit Facility bear interest at LIBOR plus a margin of
1.75%
to
3.00%
, or at a base rate plus a margin of
0.75%
to
2.00%
, in each case based on a ratio of the Company's total net funded debt to consolidated EBITDA (as defined in the Amended Credit Agreement). The Company must also pay a quarterly commitment fee of
0.25%
to
0.50%
, based on the Company's ratio of total net funded debt to consolidated EBITDA, on the unused commitments under the Amended Credit Agreement. In connection with the amendment and restatement of the Credit Agreement, the Company expensed
$0.4 million
of previously deferred financing costs in 2018 and
$0.3 million
of previously deferred financing costs in 2017, which are included in interest expense.
The Amended Credit Agreement contains customary financial covenants and restrictions. Specifically, the Company must maintain an interest coverage ratio, defined as the ratio of consolidated EBITDA to consolidated interest expense, of at least
3.0
to 1.0, a maximum senior secured leverage ratio, defined as the ratio of senior secured debt to consolidated EBITDA, of no greater
-
79
-
OIL STATES INTERNATIONAL, INC. AND SUBSIDIARIES
NOTES TO CONSOLIDATED FINANCIAL STATEMENTS
(continued)
than
2.25
to 1.0 and a total net leverage ratio, defined as the ratio of total net funded debt to consolidated EBITDA, of no greater than
4.0
to 1.0 through the fiscal quarter ending December 31, 2018 and no greater than
3.75
to 1.0 thereafter. The amended financial covenants give pro forma effect to the issuance of the convertible senior notes discussed below, acquired businesses and the annualization of EBITDA for acquired businesses.
Each of the factors considered in the calculation of these ratios are defined in the Amended Credit Agreement. Consolidated EBITDA and consolidated interest, as defined, exclude goodwill impairments, losses on extinguishment of debt, debt discount amortization, stock-based compensation expense and other non-cash charges.
Borrowings under the Amended Credit Agreement are secured by a pledge of substantially all of the Company's assets and the assets of its domestic subsidiaries. The Company's obligations under the Amended Credit Agreement are guaranteed by its significant domestic subsidiaries. The Amended Credit Agreement also contains negative covenants that limit the Company's ability to borrow additional funds, encumber assets, pay dividends, sell assets and enter into other significant transactions.
Under the Amended Credit Agreement, the occurrence of specified change of control events involving the Company would constitute an event of default that would permit the banks to, among other things, accelerate the maturity of the facility and cause it to become immediately due and payable in full.
As of
December 31, 2018
, the Company was in compliance with its debt covenants.
1.50% Convertible Senior Notes
On January 30, 2018, the Company issued
$200 million
aggregate principal amount of its
1.50%
convertible senior notes due 2023 pursuant to an indenture, dated as of January 30, 2018 (the “Indenture”), between the Company and Wells Fargo Bank, National Association, as trustee. Net proceeds from the Notes, after deducting issuance costs, were approximately
$194 million
, which was used by the Company to repay a portion of the borrowings outstanding under the Revolving Credit Facility.
The initial carrying amount of the Notes recorded in the consolidated balance sheet as of January 30, 2018 was less than the
$200 million
in principal amount of the Notes, in accordance with applicable accounting principles, reflective of the estimated fair value of a similar debt instrument that does not have a conversion feature. The Company recorded the value of the conversion feature of
$34.4 million
as a debt discount, which is amortized as interest expense over the term of the Notes, with a similar amount allocated to additional paid-in capital (
$25.7 million
, net of issuance costs and deferred taxes). As a result of this amortization, the interest expense the Company recognizes related to the Notes for accounting purposes is based on an effective interest rate of approximately
6.0%
which is greater than the cash interest payments the Company is obligated to pay on the Notes. Interest expense associated with the Notes for the year ended
December 31, 2018
was
$9.0 million
, which includes a cash interest component of
$2.8 million
.
The following table presents the carrying amount of the Notes in the consolidated balance sheet as of
December 31, 2018
(in thousands):
|
|
December 31,
2018 |
||
|
Principal amount of the liability component
|
$
|
200,000
|
|
|
Less: Unamortized discount
|
28,825
|
|
|
|
Less: Unamortized issuance costs
|
4,073
|
|
|
|
Net carrying amount of the liability
|
$
|
167,102
|
|
The Notes bear interest at a rate of
1.50%
per year until maturity. Interest is payable semi-annually in arrears on February 15 and August 15 of each year, beginning on August 15, 2018. In addition, additional interest and special interest may accrue on the Notes under certain circumstances as described in the Indenture. The Notes will mature on February 15, 2023, unless earlier repurchased, redeemed or converted. The initial conversion rate is
22.2748
shares of the Company's common stock per $1,000 principal amount of Notes (equivalent to an initial conversion price of approximately
$44.89
per share of common stock). The conversion rate, and thus the conversion price, may be adjusted under certain circumstances as described in the Indenture. The Company’s intent is to repay the principal amount of the Notes in cash and the conversion feature in shares of the Company’s common stock.
-
80
-
OIL STATES INTERNATIONAL, INC. AND SUBSIDIARIES
NOTES TO CONSOLIDATED FINANCIAL STATEMENTS
(continued)
Noteholders may convert their Notes, at their option only in the following circumstances: (1) if the last reported sale price per share of the Company’s common stock exceeds
130%
of the conversion price for each of at least
20
trading days during the
30
consecutive trading days ending on, and including, the last trading day of the immediately preceding calendar quarter; (2) during the
five
consecutive business days immediately after any
five
consecutive trading day period (such
five
consecutive trading day period, the “measurement period”) in which the trading price per
$1,000
principal amount of the Notes for each trading day of the measurement period was less than
98%
of the product of the last reported sale price per share of the Company’s common stock on such trading day and the conversion rate on such trading day; (3) upon the occurrence of certain corporate events or distributions on the Company’s common stock, as described in the Indenture; or (4) if the Company calls the Notes for redemption, or at any time from, and including, November 15, 2022 until the close of business on the second scheduled trading day immediately before the maturity date. The Company will settle conversions by paying or delivering, as applicable, cash, shares of common stock or a combination of cash and shares of common stock, at the Company's election, based on the applicable conversion rate(s). If the Company elects to deliver cash or a combination of cash and shares of common stock, then the consideration due upon conversion will be based on a defined observation period.
The Notes will be redeemable, in whole or in part, at the Company's option at any time, and from time to time, on or after February 15, 2021, at a cash redemption price equal to the principal amount of the Notes to be redeemed, plus accrued and unpaid interest, if any, to, but excluding, the redemption date, but only if the last reported sale price per share of common stock exceeds
130%
of the conversion price on each of at least
20
trading days during the
30
consecutive trading days ending on, and including, the trading day immediately before the date the Company sends the related redemption notice.
If specified change in control events involving the Company as defined in the Indenture occur, then noteholders may require the Company to repurchase their Notes at a cash repurchase price equal to the principal amount of the Notes to be repurchased, plus accrued and unpaid interest. Additionally, the Notes contain certain events of default as set forth in the Indenture. As of
December 31, 2018
, none of the conditions allowing holders of the Notes to convert, or requiring the Company to repurchase the Notes, had been met.
Because it is the Company's intent to settle the principal portion of the Notes in cash, the Company uses the treasury stock method when calculating the diluted earnings per share effect for the variable number of shares that would be issued upon conversion to settle the conversion feature.
Promissory Note
In connection with the GEODynamics Acquisition, the Company issued a
$25.0 million
promissory note that bears interest at
2.50%
per annum and is scheduled to mature on July 12, 2019. Payments due under the promissory note may be subject to set-off, in part or in full, against certain claims related to matters occurring prior to the Company's acquisition of GEODynamics, which is expected to delay and/or reduce amounts paid under the promissory note. See Note
13
, "Commitments and Contingencies."
-
81
-
OIL STATES INTERNATIONAL, INC. AND SUBSIDIARIES
NOTES TO CONSOLIDATED FINANCIAL STATEMENTS
(continued)
8
.
Income Taxes
Consolidated
loss
before income taxes for the years ended
December 31, 2018
,
2017
and
2016
consisted of the following (in thousands):
|
|
2018
|
2017
|
2016
|
||||||||
|
United States
|
$
|
(29,424
|
)
|
$
|
(77,138
|
)
|
$
|
(113,512
|
)
|
||
|
Foreign
|
7,692
|
|
(274
|
)
|
40,187
|
|
|||||
|
Total
|
$
|
(21,732
|
)
|
$
|
(77,412
|
)
|
$
|
(73,325
|
)
|
||
Components of income tax
provision (benefit)
for the years ended
December 31, 2018
,
2017
and
2016
consisted of the following (in thousands):
|
|
2018
|
2017
|
2016
|
||||||||
|
Current:
|
|
|
|
||||||||
|
United States
|
$
|
(5,549
|
)
|
$
|
(11,288
|
)
|
$
|
(534
|
)
|
||
|
U.S. state
|
1,534
|
|
1,079
|
|
1,053
|
|
|||||
|
Foreign
|
4,877
|
|
1,305
|
|
10,148
|
|
|||||
|
|
862
|
|
(8,904
|
)
|
10,667
|
|
|||||
|
Deferred:
|
|
|
|
||||||||
|
United States
|
(2,592
|
)
|
15,888
|
|
(34,816
|
)
|
|||||
|
U.S. state
|
(95
|
)
|
(729
|
)
|
(2,807
|
)
|
|||||
|
Foreign
|
(802
|
)
|
1,183
|
|
17
|
|
|||||
|
|
(3,489
|
)
|
16,342
|
|
(37,606
|
)
|
|||||
|
Total income tax provision (benefit)
|
$
|
(2,627
|
)
|
$
|
7,438
|
|
$
|
(26,939
|
)
|
||
A reconciliation of the U.S. statutory tax
benefit
rate to the effective tax
provision (benefit)
rate for the years ended
December 31, 2018
,
2017
and
2016
is as follows:
|
|
2018
|
2017
|
2016
|
|||||
|
U.S. statutory tax provision (benefit) rate
|
(21.0
|
)%
|
(35.0
|
)%
|
(35.0
|
)%
|
||
|
Effect of Tax Reform Legislation
|
(26.1
|
)
|
36.4
|
|
—
|
|
||
|
Valuation allowance against tax assets
|
14.0
|
|
4.0
|
|
3.1
|
|
||
|
Non-deductible compensation
|
5.7
|
|
1.0
|
|
1.1
|
|
||
|
Other non-deductible expenses
|
12.6
|
|
2.7
|
|
2.0
|
|
||
|
Effect of foreign income taxed at different rates
|
0.5
|
|
(0.3
|
)
|
(4.3
|
)
|
||
|
State income taxes, net of federal benefits
|
(0.3
|
)
|
(1.4
|
)
|
(2.1
|
)
|
||
|
Other, net
|
2.5
|
|
2.2
|
|
(1.5
|
)
|
||
|
Effective tax provision (benefit) rate
|
(12.1
|
)%
|
9.6
|
%
|
(36.7
|
)%
|
||
-
82
-
OIL STATES INTERNATIONAL, INC. AND SUBSIDIARIES
NOTES TO CONSOLIDATED FINANCIAL STATEMENTS
(continued)
The significant items giving rise to the deferred tax assets and liabilities as of
December 31, 2018
and
2017
are as follows (in thousands):
|
|
2018
|
2017
|
|||||
|
Deferred tax assets:
|
|
|
|||||
|
Foreign tax credit carryforwards
|
$
|
19,836
|
|
$
|
27,009
|
|
|
|
Net operating loss carryforwards
|
50,737
|
|
12,692
|
|
|||
|
Employee benefits
|
12,583
|
|
12,013
|
|
|||
|
Inventory reserves
|
6,065
|
|
5,546
|
|
|||
|
Other reserves
|
3,219
|
|
1,653
|
|
|||
|
Allowance for doubtful accounts
|
1,072
|
|
1,332
|
|
|||
|
Other
|
197
|
|
299
|
|
|||
|
Gross deferred tax asset
|
93,709
|
|
60,544
|
|
|||
|
Valuation allowance
|
(33,762
|
)
|
(37,904
|
)
|
|||
|
Net deferred tax asset
|
59,947
|
|
22,640
|
|
|||
|
Deferred tax liabilities:
|
|
|
|||||
|
Tax over book depreciation
|
(46,942
|
)
|
(31,535
|
)
|
|||
|
Intangible assets
|
(57,867
|
)
|
(14,153
|
)
|
|||
|
Convertible senior notes discount
|
(6,569
|
)
|
—
|
|
|||
|
Accrued liabilities
|
(1,085
|
)
|
(856
|
)
|
|||
|
Other
|
(554
|
)
|
(295
|
)
|
|||
|
Deferred tax liability
|
(113,017
|
)
|
(46,839
|
)
|
|||
|
Net deferred tax liability
(1)
|
$
|
(53,070
|
)
|
$
|
(24,199
|
)
|
|
|
|
2018
|
2017
|
|||||
|
Balance sheet classification:
|
|
|
|||||
|
Other non-current assets
|
$
|
761
|
|
$
|
519
|
|
|
|
Deferred tax liability
|
(53,831
|
)
|
(24,718
|
)
|
|||
|
Net deferred tax liability
(1)
|
$
|
(53,070
|
)
|
$
|
(24,199
|
)
|
|
____________________
|
(1)
|
The
$28.9 million
increase in net deferred tax liability between December 31, 2018 and 2017 includes the impact of the GEODynamics Acquisition and the issuance of the Notes, both completed in January 2018.
|
On December 22, 2017, the United States enacted Tax Reform Legislation which resulted in significant changes to U.S. tax and related laws, including certain key federal income tax provisions applicable to multinational companies such as the Company. These changes included, among others, the implementation of a territorial tax system with a one-time mandatory tax on undistributed foreign earnings of subsidiaries and a reduction in the U.S. corporate income tax rate to 21% from 35% beginning in 2018.
As a result of these U.S. tax law changes, during 2017 the Company recorded a net provisional charge of
$28.2 million
within income tax provision, consisting primarily of incremental income tax expense of
$41.4 million
related to the one-time, mandatory transition tax on the Company’s unremitted foreign subsidiary earnings (the "Transition Tax") and a valuation allowance established against the Company’s foreign tax credit carryforwards which were recorded as assets prior to Tax Reform Legislation, offset by a tax benefit of
$13.2 million
related the remeasurement of the Company’s U.S. net deferred tax liabilities based on the new 21% U.S. corporate income tax rate. The Company did not incur a material cash tax payable with respect to the Transition Tax.
During 2018, the Company adjusted its December 2017 provisional estimates with respect to Tax Reform Legislation resulting in an income tax benefit of
$5.8 million
. This adjustment is primarily attributable to guidance issued by the U.S. Internal Revenue Service (the "IRS") in 2018 allowing taxpayers, including the Company, to elect to carry back or carry forward 2017 U.S. net operating losses rather than requiring that such tax losses be used to offset the Transition Tax. Based on this guidance, the Company elected to utilize available foreign tax credits to fully satisfy the Transition Tax and to file a carryback claim against its 2015 U.S. federal income tax return, for which it expects to receive approximately
$5.5 million
in cash.
-
83
-
OIL STATES INTERNATIONAL, INC. AND SUBSIDIARIES
NOTES TO CONSOLIDATED FINANCIAL STATEMENTS
(continued)
The Tax Reform Legislation also included many new provisions including changes to bonus depreciation, the deduction for executive compensation and interest expense, and potential incremental taxes related to certain foreign earnings. Many of these provisions did not apply to the Company until January 1, 2018. The Company continued to assess the impact of these and other provisions of the Tax Reform Legislation in 2018. The net deferred tax liability as of December 31, 2018 and 2017 excludes the impact, if any, of potential future U.S. income taxes related to certain foreign activities and transactions described in the Tax Reform Legislation.
During 2017, the Company decided to carry back its 2016 U.S. federal net operating loss ("NOL") to 2014 and received the related refund prior to December 31, 2017. The effect of the carryback resulted in the loss of certain previously claimed deductions. As a result, the Company recorded a discrete tax charge of
$1.0 million
in the period.
The Company had
$157.7 million
of U.S. federal NOL carryforwards as of
December 31, 2018
, which can be carried forward indefinitely. Approximately
$106.0 million
of the U.S. federal NOL carryforwards are attributable to the acquired GEODynamics operations and are subject to certain limitation provisions. The Company’s state NOL carryforwards as of
December 31, 2018
totaled
$117.3 million
, of which
$18.8 million
are attributable to the acquired GEODynamics operations and are subject to certain limitation provisions. As of
December 31, 2018
, the Company had NOL carryforwards related to certain of its international operations totaling
$33.7 million
, of which
$16.4 million
can be carried forward indefinitely. As of
December 31, 2018
and
2017
, the Company had recorded valuation allowances of
$13.9 million
and
$10.9 million
, respectively, with respect to state and foreign NOL carryforwards.
As of
December 31, 2018
, the Company’s foreign tax credit carryforwards totaled
$19.8 million
. These foreign tax credits will expire in varying amounts from 2021 to 2026. As discussed above, as a result of the enactment of Tax Reform Legislation, the Company provided a full valuation allowance on these foreign tax credits in 2017 due to uncertainties with respect to its ability to utilize such credits in future periods.
Prior to December 22, 2017, appropriate U.S. and foreign income taxes were provided for earnings of foreign subsidiary companies that were expected to be remitted in the future. The cumulative amount of undistributed earnings of foreign subsidiaries that the Company intended to indefinitely reinvest, and upon which foreign taxes were accrued or paid but no deferred U.S. income taxes had been provided, was approximately
$240 million
at December 31, 2016. During
2018
, the Company repatriated
$45.0 million
from foreign subsidiaries which was not subject to additional U.S. income taxes and was used to reduce outstanding borrowings under the Amended Revolving Credit Facility.
The Company files tax returns in the jurisdictions in which they are required. These returns are subject to examination or audit and possible adjustment as a result of assessments by taxing authorities. The Company believes that it has recorded sufficient tax liabilities and does not expect that the resolution of any examination or audit of its tax returns will have a material adverse effect on its consolidated operating results, financial condition or liquidity.
Tax years subsequent to 2013 remain open to U.S. federal tax audit. Foreign subsidiary federal tax returns subsequent to 2012 are subject to audit by various foreign tax authorities.
Uncertain tax positions are accounted for using a recognition threshold and a measurement attribute for the financial statement recognition and measurement of tax positions taken or expected to be taken in a tax return. For those benefits to be recognized, a tax position must be more-likely-than-not to be sustained upon examination by taxing authorities. The amount recognized is measured as the largest amount of benefit that has a greater than fifty percent likelihood of being realized upon ultimate settlement.
The total amount of unrecognized tax benefits as of
December 31, 2018
and
2017
was
nil
. The Company accrues interest and penalties related to unrecognized tax benefits as a component of the Company's provision for income taxes. As of
December 31, 2018
and
2017
, the Company had
no
accrued interest expense or penalties.
-
84
-
OIL STATES INTERNATIONAL, INC. AND SUBSIDIARIES
NOTES TO CONSOLIDATED FINANCIAL STATEMENTS
(continued)
9
.
Stockholders' Equity
Common and Preferred Stock
The following table provides details with respect to changes in the number of shares of common stock,
$0.01
par value, issued, held in treasury and outstanding during
2018
.
|
Issued
|
Treasury Stock
|
Outstanding
|
|||||||
|
Shares of common stock - December 31, 2017
|
62,721,698
|
|
11,632,276
|
|
51,089,422
|
|
|||
|
Acquisition of GEODynamics
|
8,661,083
|
|
—
|
|
8,661,083
|
|
|||
|
Restricted stock awards, net of forfeitures
|
371,156
|
|
—
|
|
371,156
|
|
|||
|
Shares withheld for taxes on vesting of restricted stock awards
|
—
|
|
151,966
|
|
(151,966
|
)
|
|||
|
Shares of common stock - December 31, 2018
|
71,753,937
|
|
11,784,242
|
|
59,969,695
|
|
|||
As of
December 31, 2018
and
2017
, the Company had
25,000,000
shares of preferred stock,
$0.01
par value, authorized, with
no
shares issued or outstanding.
The Company maintains a share repurchase program which was extended to
July 29, 2019
by the Company's Board of Directors. During the year ended
December 31, 2018
, there were
no
repurchases of common stock under the program. During
2017
, the company repurchased
561,765
shares of common stock at a total cost of
$16.2 million
. There were
no
shares repurchased during
2016
. The amount remaining under the current share repurchase authorization as of
December 31, 2018
was
$120.5 million
. Subject to applicable securities laws, any purchases will be at such times and in such amounts as the Company deems appropriate.
Accumulated Other Comprehensive Loss
Accumulated other comprehensive loss increased from
$58.5 million
at
December 31, 2017
to
$71.4 million
at
December 31, 2018
, due primarily to changes in currency exchange rates. Accumulated other comprehensive loss is primarily related to fluctuations in currency exchange rates against the U.S. dollar as used to translate certain international operations. For
2018
and
2017
, currency translation adjustments recognized as a component of other comprehensive loss were primarily attributable to the United Kingdom and Brazil. During the year ended
December 31, 2018
, the exchange rate of the British pound and the Brazilian real compared to the U.S. dollar weakened by
6%
and
14%
, respectively, contributing to other comprehensive
loss
of
$12.9 million
.
During the year ended
December 31, 2017
, the exchange rate of the British pound weakened by
9%
compared to the U.S. dollar, while the Brazilian real strengthened by
2%
compared to the U.S. dollar during the same period, contributing to other comprehensive loss of
$11.8 million
.
-
85
-
OIL STATES INTERNATIONAL, INC. AND SUBSIDIARIES
NOTES TO CONSOLIDATED FINANCIAL STATEMENTS
(continued)
10
.
Net
Loss
Per Share
The table below provides a reconciliation of the numerators and denominators of basic and diluted net
loss
per share for the years ended
December 31, 2018
and
2017
(in thousands, except per share amounts):
|
|
2018
|
2017
|
2016
|
||||||||
|
Numerators:
|
|
|
|
||||||||
|
Net loss from continuing operations
|
$
|
(19,105
|
)
|
$
|
(84,850
|
)
|
$
|
(46,386
|
)
|
||
|
Less: Income attributable to unvested restricted stock awards
|
—
|
|
—
|
|
—
|
|
|||||
|
Numerator for basic net loss per share from continuing operations
|
(19,105
|
)
|
(84,850
|
)
|
(46,386
|
)
|
|||||
|
Net loss from discontinued operations, net of tax
|
—
|
|
—
|
|
(4
|
)
|
|||||
|
Less: Income attributable to unvested restricted stock awards
|
—
|
|
—
|
|
—
|
|
|||||
|
Numerator for basic net loss per share
|
(19,105
|
)
|
(84,850
|
)
|
(46,390
|
)
|
|||||
|
Effect of dilutive securities:
|
|
|
|
||||||||
|
Unvested restricted stock awards
|
—
|
|
—
|
|
—
|
|
|||||
|
Numerator for diluted net loss per share
|
$
|
(19,105
|
)
|
$
|
(84,850
|
)
|
$
|
(46,390
|
)
|
||
|
Denominators:
|
|
|
|
||||||||
|
Weighted average number of common shares outstanding
|
59,680
|
|
51,253
|
|
51,307
|
|
|||||
|
Less: Weighted average number of unvested restricted stock awards outstanding
|
(968
|
)
|
(1,114
|
)
|
(1,133
|
)
|
|||||
|
Denominator for basic net loss per share
|
58,712
|
|
50,139
|
|
50,174
|
|
|||||
|
Effect of dilutive securities:
|
|
|
|
||||||||
|
Unvested restricted stock awards
|
—
|
|
—
|
|
—
|
|
|||||
|
Assumed exercise of stock options
|
—
|
|
—
|
|
—
|
|
|||||
|
1.50% convertible senior notes
|
—
|
|
—
|
|
—
|
|
|||||
|
—
|
|
—
|
|
—
|
|
||||||
|
Denominator for diluted net loss per share
|
58,712
|
|
50,139
|
|
50,174
|
|
|||||
|
Basic net loss per share from:
|
|
|
|
||||||||
|
Continuing operations
|
$
|
(0.33
|
)
|
$
|
(1.69
|
)
|
$
|
(0.92
|
)
|
||
|
Discontinued operations
|
—
|
|
—
|
|
—
|
|
|||||
|
Net loss
|
$
|
(0.33
|
)
|
$
|
(1.69
|
)
|
$
|
(0.92
|
)
|
||
|
Diluted net loss per share from:
|
|
|
|
||||||||
|
Continuing operations
|
$
|
(0.33
|
)
|
$
|
(1.69
|
)
|
$
|
(0.92
|
)
|
||
|
Discontinued operations
|
—
|
|
—
|
|
—
|
|
|||||
|
Net loss
|
$
|
(0.33
|
)
|
$
|
(1.69
|
)
|
$
|
(0.92
|
)
|
||
The calculation of diluted net
loss
per share for the years ended
December 31, 2018
,
2017
and
2016
excluded
695,572 shares
,
709,292 shares
and
748,552 shares
, respectively, issuable pursuant to outstanding stock options and restricted stock awards, due to their antidilutive effect. Additionally, shares issuable upon conversion of the
1.50%
convertible senior notes were not convertible and were, therefore, excluded for the year ended
December 31, 2018
, due to their antidilutive effect.
11
.
Long-Term Incentive and Deferred Compensation Plans
The Company measures the cost of employee services received in exchange for an award of equity instruments based on the grant-date fair value of the award. The fair value of service-based restricted stock awards is determined by the quoted market price of the Company’s common stock on the date of grant. The fair value of performance-based restricted awards in 2018 was also determined using the quoted market price of the Company's common stock at the date of grant. The fair value of performance-based restricted awarded in 2017 and 2016 was valued using a Monte Carlo simulation model due to the inclusion of performance metrics that are not based solely on the performance of the Company’s common stock. The fair value of stock option awards is estimated using option-pricing models. The resulting cost, net of estimated forfeitures, is recognized over the period during which an employee is required to provide service in exchange for the awards, usually the vesting period.
-
86
-
OIL STATES INTERNATIONAL, INC. AND SUBSIDIARIES
NOTES TO CONSOLIDATED FINANCIAL STATEMENTS
(continued)
Stock-based compensation pre-tax expense recognized in the years ended
December 31, 2018
,
2017
and
2016
totaled
$22.6 million
,
$23.0 million
and
$21.3 million
, respectively.
Restricted Stock Awards
The restricted stock program consists of a combination of service-based restricted stock and performance-based restricted stock. The number of performance-based restricted shares ultimately issued under the program is dependent upon achievement of predefined specific performance objectives generally measured over a
three
-year period. The performance objective for performance-based stock units granted during 2018 is based on the Company's EBITDA growth rate over a
three
-year period. The performance objective for the 2017 and 2016 awards are relative total stockholder return compared to a peer group of companies.
In the event the predefined targets are exceeded for any performance-based award, additional shares up to a maximum of
200%
of the target award may be granted. Conversely, if actual performance falls below the predefined target, the number of shares vested is reduced. If the actual performance falls below the threshold performance level, no restricted shares will vest. The time-based restricted stock generally vest on a straight-line basis over their term, which is generally
three
to
four years
.
The following table presents changes in restricted stock awards and related information for the year ended
December 31, 2018
:
|
|
Service-based Restricted Stock
|
Performance-based Restricted Stock
|
|
|||||||||||||
|
|
Number of Shares
|
Weighted Average
Grant Date Fair Value
|
Number of Shares
|
Weighted Average
Grant Date Fair Value
|
Total Number of Restricted Shares
|
|||||||||||
|
Unvested, December 31, 2017
|
1,088,519
|
|
$
|
36.22
|
|
159,553
|
|
$
|
49.52
|
|
1,248,072
|
|
||||
|
Granted
|
410,387
|
|
29.40
|
|
46,378
|
|
28.75
|
|
456,765
|
|
||||||
|
Performance adjustment
(1)
|
—
|
|
—
|
|
21,192
|
|
—
|
|
21,192
|
|
||||||
|
Vested
|
(530,121
|
)
|
36.55
|
|
—
|
|
—
|
|
(530,121
|
)
|
||||||
|
Forfeited
|
(39,231
|
)
|
35.54
|
|
—
|
|
—
|
|
(39,231
|
)
|
||||||
|
Unvested, December 31, 2018
|
929,554
|
|
33.05
|
|
227,123
|
|
44.84
|
|
1,156,677
|
|
||||||
____________________
|
(1)
|
Reflects adjustment to the number of shares to be issued upon vesting of the 2016 performance-based awards, resulting from a
125%
achievement level compared to target.
|
The total fair value of restricted stock awards that vested in
2018
,
2017
and
2016
was
$19.4 million
,
$17.5 million
, and
$11.8 million
, respectively. As of
December 31, 2018
, there was
$18.5 million
of total compensation costs related to nonvested restricted stock awards not yet recognized, which is expected to be recognized over a weighted average vesting period of
1.1 years
.
On May 8, 2018 (the "Effective Date"), the Company’s stockholders approved the Oil States International, Inc. 2018 Equity Participation Plan (the “Plan”). The maximum number of shares of common stock reserved and available for issuance under the Plan is the sum of
2,000,000
shares, plus (i) any shares of common stock that, as of the Effective Date, were available for issuance under the Oil States International, Inc. 2001 Equity Participation Plan (as amended from time to time, the “Prior Plan”) (and that were not subject to outstanding awards under the Prior Plan as of the Effective Date), and (ii) any shares of common stock subject to outstanding awards under the Prior Plan as of the Effective Date that are not vested and/or subsequently expired or forfeited and canceled, for any reason, subject to certain adjustment as provided under the Plan. To the extent any additional shares of common stock remain subject to outstanding awards under the Prior Plan that otherwise would have been returned to the Prior Plan after May 8, 2018 on account of the expiration, forfeiture or cancellation without a delivery of shares of such outstanding awards, those shares of common stock instead will be included in the reserve of shares of common stock for issuance under the Plan. The Company filed a registration statement on Form S-8, which became effective on May 17, 2018, with respect to shares of common stock reserved for issuance under the Plan. At
December 31, 2018
, approximately
2.5 million
shares were available for future grant under the Plan.
-
87
-
OIL STATES INTERNATIONAL, INC. AND SUBSIDIARIES
NOTES TO CONSOLIDATED FINANCIAL STATEMENTS
(continued)
Stock Options
The Company has not awarded stock options since 2015. The fair value of historical option grants were estimated on the date of grant using a Black Scholes Merton option pricing model. The following table presents the changes in stock options outstanding and related information for the year ended
December 31, 2018
:
|
|
Options
|
Weighted Average Exercise Price
|
Weighted Average Contractual Life (years)
|
Aggregate Intrinsic Value (thousands)
|
||||||||
|
Outstanding Options, December 31, 2017
|
693,277
|
|
$
|
49.04
|
|
5.2
|
$
|
—
|
|
|||
|
Forfeited/Expired
|
(11,383
|
)
|
51.16
|
|
|
|
|
|||||
|
Outstanding Options, December 31, 2018
|
681,894
|
|
49.00
|
|
4.1
|
—
|
|
|||||
|
Exercisable Options, December 31, 2018
|
653,146
|
|
$
|
49.30
|
|
4.0
|
$
|
—
|
|
|||
No
options were exercised in 2018 or 2017. For options exercised in 2016, the total intrinsic value was
$0.4 million
, cash received by the Company was
$0.4 million
and the tax benefit realized for the tax deduction was
$0.1 million
.
The following table summarizes information for stock options outstanding as of
December 31, 2018
:
|
|
|
|
Options Outstanding
|
Options Exercisable
|
|||||||||||||||
|
Range of
Exercise Prices
|
Options
Outstanding
|
Weighted Average Contractual Life (years)
|
Weighted Average Exercise Price
|
Options Exercisable
|
Weighted Average Exercise Price
|
||||||||||||||
|
$41.49
|
–
|
$46.78
|
371,299
|
|
4.2
|
$
|
44.68
|
|
342,551
|
|
$
|
44.88
|
|
||||||
|
$49.33
|
–
|
$49.33
|
147,378
|
|
3.1
|
49.33
|
|
147,378
|
|
49.33
|
|
||||||||
|
$58.54
|
–
|
$58.54
|
163,217
|
|
4.9
|
58.54
|
|
163,217
|
|
58.54
|
|
||||||||
|
|
|
|
681,894
|
|
4.1
|
49.00
|
|
653,146
|
|
49.30
|
|
||||||||
Long-Term Cash Incentive Awards
During 2018, the Company issued conditional long-term cash incentive awards ("Cash Awards") of approximately
$1.3 million
, with the ultimate dollar amount to be awarded ranging from
zero
to a maximum of
$2.7 million
. The performance measure for these Cash Awards is relative total stockholder return compared to a peer group of companies measured over a
three
-year period. The obligation related to the Cash Awards is classified as a liability and recognized over the vesting period.
Deferred Compensation Plan
The Company maintains a nonqualified deferred compensation plan (the "Deferred Compensation Plan") that permits eligible employees and directors to elect to defer the receipt of all or a portion of their directors’ fees and/or salary and annual bonuses. Employee contributions to the Deferred Compensation Plan are matched by the Company at the same percentage as if the employee was a participant in the Company's 401(k) Retirement Plan and was not subject to the IRS limitations on match-eligible compensation. The Deferred Compensation Plan also permits the Company to make discretionary contributions to any employee's account, although none have been made to date. Directors' contributions are not matched by the Company. Since inception of the plan, this discretionary contribution provision has been limited to a matching of the participants' contributions on a basis equivalent to matching permitted under the Company's 401(k) Retirement Savings Plan. The vesting of contributions to the participants’ accounts is also equivalent to the vesting requirements of the Company's 401(k) Retirement Savings Plan. The Deferred Compensation Plan does not have dollar limits on tax-deferred contributions. The assets of the Deferred Compensation Plan are held in a Rabbi Trust (the “Trust”) and, therefore, are available to satisfy the claims of the Company's creditors in the event of bankruptcy or insolvency of the Company. Participants have the ability to direct the Plan Administrator to invest the assets in their individual accounts, including any discretionary contributions by the Company, in over 30 preapproved mutual funds held by the Trust which cover a variety of securities and mutual funds. In addition, participants currently have the right to request that the Plan Administrator re-allocate the portfolio of investments (i.e. cash or mutual funds) in the participants' individual accounts within the Trust. Company contributions are in the form of cash. Distributions from the plan are generally made upon the participants' termination as a director and/or employee, as applicable, of the Company. Participants receive payments from the Deferred Compensation Plan in cash. As of
December 31, 2018
, Trust assets totaled
$20.5 million
, the majority of which is classified as “Other noncurrent assets” in the Company’s consolidated balance sheet. The fair value of the investments was based on quoted market prices in active markets (a Level 1 fair value measurement). Amounts payable to the plan participants at
December 31,
-
88
-
OIL STATES INTERNATIONAL, INC. AND SUBSIDIARIES
NOTES TO CONSOLIDATED FINANCIAL STATEMENTS
(continued)
2018
, including the fair value of the shares of the Company's common stock that are reflected as treasury stock, was
$20.6 million
and is classified as "Other noncurrent liabilities" in the consolidated balance sheet. The Company accounts for the Deferred Compensation Plan in accordance with current accounting standards regarding the accounting for deferred compensation arrangements where amounts earned are held in a Rabbi Trust and invested.
Increases or decreases in the value of the Trust assets, exclusive of the shares of common stock of the Company held by the Trust, have been included as compensation adjustments in the consolidated statements of operations. Increases or decreases in the fair value of the deferred compensation liability, including the shares of common stock of the Company held by the Trust, while recorded as treasury stock, are also included as compensation adjustments in the consolidated statements of operations.
12
.
Retirement Plans
The Company sponsors defined contribution plans. Participation in these plans is available to substantially all employees. The Company recognized expenses of
$8.6 million
,
$6.8 million
and
$6.8 million
, respectively, related to matching contributions under its various defined contribution plans during the years ended
December 31, 2018
,
2017
and
2016
, respectively.
13
.
Commitments and Contingencies
The Company leases a portion of its facilities, office space, equipment and vehicles under leases which expire at various dates. Minimum future operating lease obligations as of
December 31, 2018
, were as follows (in thousands):
|
|
Operating Leases
|
||
|
2019
|
$
|
12,312
|
|
|
2020
|
8,914
|
|
|
|
2021
|
7,090
|
|
|
|
2022
|
5,391
|
|
|
|
2023
|
4,492
|
|
|
|
Thereafter
|
19,840
|
|
|
|
$
|
58,039
|
|
|
Rental expense under operating leases was
$14.9 million
,
$9.1 million
and
$10.2 million
for the years ended
December 31, 2018
,
2017
and
2016
, respectively.
Following the Company's acquisition of GEODynamics in January 2018, the Company determined that certain steel products historically imported by GEODynamics from China for use in its manufacturing process may potentially be subject to anti-dumping and countervailing duties based on recent clarifications/decisions rendered by the U.S. Department of Commerce and the U.S. Court of International Trade. Following these findings, the Company commenced an internal review of this matter and ceased further purchases of these potentially affected Chinese products. As part of the Company's internal review, the Company engaged trade counsel and decided to voluntarily disclose this matter to U.S. Customs and Border Protection in September 2018. In connection with the GEODynamics acquisition, the seller agreed to indemnify and hold the Company harmless against certain claims related to matters such as this. Additionally, the Company is able to set off payments due under the
$25.0 million
promissory note (see Note
7
, "Long-term Debt") issued to the seller of GEODynamics in respect of indemnification claims which could affect both the timing of payment and the amount due under the promissory note.
Additionally, in the ordinary course of conducting its business, the Company becomes involved in litigation and other claims from private party actions, as well as judicial and administrative proceedings involving governmental authorities at the federal, state and local levels. In past years, a number of lawsuits were filed in Federal Court, against the Company and/or one of its subsidiaries, by current and former employees alleging violations of the Fair Labor Standards Act (the "FLSA"). The Company reached a final settlement for the remaining individual plaintiffs’ claims in 2018.
The Company is a party to various pending or threatened claims, lawsuits and administrative proceedings seeking damages or other remedies concerning its commercial operations, products, employees and other matters, including occasional claims by individuals alleging exposure to hazardous materials as a result of the Company's products or operations. Some of these claims relate to matters occurring prior to the acquisition of businesses (including GEODynamics and Falcon), and some relate to businesses the Company has sold. In certain cases, the Company is entitled to indemnification from the sellers of businesses and, in other cases, the Company has indemnified the buyers of businesses. Although the Company can give no assurance about the outcome of pending legal and administrative proceedings and the effect such outcomes may have on the Company, management believes
-
89
-
OIL STATES INTERNATIONAL, INC. AND SUBSIDIARIES
NOTES TO CONSOLIDATED FINANCIAL STATEMENTS
(continued)
that any ultimate liability resulting from the outcome of such proceedings, to the extent not otherwise provided for or covered by indemnity or insurance, will not have a material adverse effect on the Company's consolidated financial position, results of operations or liquidity.
14
.
Segments and Related Information
As further discussed in Note
5
, “Business Acquisitions,” on January 12, 2018 the Company completed the GEODynamics Acquisition, which, beginning in the first quarter of 2018, is reported as a separate business segment under the name "Downhole Technologies." Following this acquisition, the Company operates through
three
reportable segments: Well Site Services, Downhole Technologies and Offshore/Manufactured Products. The Company's reportable segments represent strategic business units that offer different products and services. They are managed separately as each business requires different technologies and marketing strategies. Recent acquisitions, except for the GEODynamics Acquisition, have been direct extensions to existing business segments. Accounting policies of the segments are the same as those described in the summary of significant accounting policies.
The Well Site Services segment provides a broad range of equipment and services that are used to drill for, establish and maintain the flow of oil and natural gas from a well throughout its life cycle. In this segment, operations primarily include completion-focused equipment and services as well as land drilling services. The Completion Services operations provide solutions to its customers using its completion tools and highly-trained personnel throughout its service offerings which include wireline support, frac stacks, isolations tools, extended reach tools, ball launchers, well testing and flowback operations, thru tubing activity and sand control. Drilling Services provides land drilling services for shallow to medium depth wells in West Texas and the Rocky Mountain region of the United States. Separate business lines within the Well Site Services segment have been disclosed to provide additional detail with respect to its operations. Substantially all of the revenue generated by the Well Site Services segment are classified as service revenue in the consolidated statement of operations.
Following the closing of the GEODynamics Acquisition on January 12, 2018, the Downhole Technologies segment provides oil and gas perforation systems and downhole tools in support of completion, intervention, wireline and well abandonment operations. This segment designs, manufactures and markets its consumable engineered products to oilfield service as well as exploration and production companies, which are completing complex wells with longer lateral lengths, increased frac stages and more perforation clusters to increase unconventional well productivity. Substantially all of the revenue generated by the Downhole Technologies segment are classified as product revenue in the consolidated statements of operations.
The Offshore/Manufactured Products segment designs, manufactures and markets capital equipment utilized on floating production systems, subsea pipeline infrastructure, and offshore drilling rigs and vessels, along with short-cycle and other products. Driven principally by longer-term customer investments for offshore oil and natural gas projects, project-driven product revenues include flexible bearings, advanced connector systems, high-pressure riser systems, deepwater mooring systems, cranes, subsea pipeline products and blow-out preventer stack integration. Short-cycle products manufactured by the segment include valves, elastomers and other specialty products generally used in the land-based drilling and completion markets. Other products manufactured and offered by the segment include a variety of products for use in industrial, military and other applications outside the oil and gas industry. The segment also offers a broad line of complementary, value-added services including specialty welding, fabrication, cladding and machining services, offshore installation services, and inspection and repair services.
Corporate information includes corporate expenses, such as those related to corporate governance, stock-based compensation and other infrastructure support, as well as impacts from corporate-wide decisions for which individual operating units are not evaluated.
-
90
-
OIL STATES INTERNATIONAL, INC. AND SUBSIDIARIES
NOTES TO CONSOLIDATED FINANCIAL STATEMENTS
(continued)
Financial information by business segment for each of the three years ended
December 31, 2018
,
2017
and
2016
, is summarized in the following table (in thousands).
|
|
Revenues
|
Depreciation and amortization
|
Operating income (loss)
|
Capital expenditures
|
Total
assets
|
||||||||||||||
|
2018
|
|
|
|
|
|
||||||||||||||
|
Well Site Services -
|
|
|
|
|
|
||||||||||||||
|
Completion Services
|
$
|
411,019
|
|
$
|
66,415
|
|
$
|
(7,647
|
)
|
$
|
50,423
|
|
$
|
523,235
|
|
||||
|
Drilling Services
|
69,235
|
|
14,354
|
|
(9,363
|
)
|
6,591
|
|
64,661
|
|
|||||||||
|
Total Well Site Services
|
480,254
|
|
80,769
|
|
(17,010
|
)
|
57,014
|
|
587,896
|
|
|||||||||
|
Downhole Technologies
|
213,813
|
|
18,649
|
|
26,705
|
|
16,167
|
|
691,874
|
|
|||||||||
|
Offshore/Manufactured Products
|
394,066
|
|
23,207
|
|
38,914
|
|
13,797
|
|
683,285
|
|
|||||||||
|
Corporate
|
—
|
|
905
|
|
(54,485
|
)
|
1,046
|
|
40,766
|
|
|||||||||
|
Total
|
$
|
1,088,133
|
|
$
|
123,530
|
|
$
|
(5,876
|
)
|
$
|
88,024
|
|
$
|
2,003,821
|
|
||||
|
2017
|
|
|
|
|
|
||||||||||||||
|
Well Site Services -
|
|
|
|
|
|
||||||||||||||
|
Completion Services
|
$
|
234,252
|
|
$
|
63,528
|
|
$
|
(45,169
|
)
|
$
|
17,303
|
|
$
|
424,309
|
|
||||
|
Drilling Services
|
54,462
|
|
18,513
|
|
(13,909
|
)
|
3,529
|
|
72,876
|
|
|||||||||
|
Total Well Site Services
|
288,714
|
|
82,041
|
|
(59,078
|
)
|
20,832
|
|
497,185
|
|
|||||||||
|
Downhole Technologies
|
—
|
|
—
|
|
—
|
|
—
|
|
—
|
|
|||||||||
|
Offshore/Manufactured Products
|
381,913
|
|
24,596
|
|
38,155
|
|
13,484
|
|
760,079
|
|
|||||||||
|
Corporate
|
—
|
|
1,030
|
|
(52,949
|
)
|
855
|
|
44,247
|
|
|||||||||
|
Total
|
$
|
670,627
|
|
$
|
107,667
|
|
$
|
(73,872
|
)
|
$
|
35,171
|
|
$
|
1,301,511
|
|
||||
|
2016
|
|
|
|
|
|
||||||||||||||
|
Well Site Services -
|
|
|
|
|
|
||||||||||||||
|
Completion Services
|
$
|
163,060
|
|
$
|
70,031
|
|
$
|
(83,636
|
)
|
$
|
10,418
|
|
$
|
467,387
|
|
||||
|
Drilling Services
|
22,594
|
|
23,366
|
|
(24,239
|
)
|
962
|
|
78,081
|
|
|||||||||
|
Total Well Site Services
|
185,654
|
|
93,397
|
|
(107,875
|
)
|
11,380
|
|
545,468
|
|
|||||||||
|
Downhole Technologies
|
—
|
|
—
|
|
—
|
|
—
|
|
—
|
|
|||||||||
|
Offshore/Manufactured Products
|
508,790
|
|
24,205
|
|
87,084
|
|
17,515
|
|
810,464
|
|
|||||||||
|
Corporate
|
—
|
|
1,118
|
|
(48,492
|
)
|
794
|
|
27,966
|
|
|||||||||
|
Total
|
$
|
694,444
|
|
$
|
118,720
|
|
$
|
(69,283
|
)
|
$
|
29,689
|
|
$
|
1,383,898
|
|
||||
One
customer individually accounted for
10%
of the Company's
2018
consolidated revenues and whose receivables individually accounted for
11%
of the Company's consolidated accounts receivable at
December 31, 2018
.
One
customer accounted for
16%
of the Company's
2017
consolidated revenues and whose receivables individually accounted for
13%
of the Company's consolidated accounts receivable at
December 31, 2017
.
No
customer accounted for more than 10% of the Company's revenues or accounts receivable in
2016
.
For the Company’s Well Site Services segment, substantially all depreciation and amortization expense relates to cost of services while substantially all depreciation and amortization expense for the Downhole Technologies segment relates to cost of products. The Offshore/Manufactured Products segment has numerous facilities around the world that generate both product and service revenues, and it is common for the segment to provide both installation and other services for products manufactured by this segment. While substantially all depreciation and amortization expense for the Offshore/Manufactured Products segment relates to cost of revenues, it does not segregate or capture depreciation or amortization expense of intangible assets between product and service cost. Operating income (loss) excludes equity in net income of unconsolidated affiliates, which is immaterial and not reported separately herein.
-
91
-
OIL STATES INTERNATIONAL, INC. AND SUBSIDIARIES
NOTES TO CONSOLIDATED FINANCIAL STATEMENTS
(continued)
The following table provides supplemental disaggregated revenue from contracts with customers by business segment for the three years ended
December 31, 2018
,
2017
and
2016
(in thousands):
|
Well Site Services
|
Downhole Technologies
|
Offshore/Manufactured Products
|
|||||||||||||||||||||||||||||||||
|
2018
|
2017
|
2016
|
2018
|
2017
|
2016
|
2018
|
2017
|
2016
|
|||||||||||||||||||||||||||
|
Major revenue categories -
|
|||||||||||||||||||||||||||||||||||
|
Project-driven products
|
$
|
—
|
|
$
|
—
|
|
$
|
—
|
|
$
|
—
|
|
$
|
—
|
|
$
|
—
|
|
$
|
120,894
|
|
$
|
126,960
|
|
$
|
296,368
|
|
||||||||
|
Short-cycle:
|
|||||||||||||||||||||||||||||||||||
|
Completion products and services
|
411,019
|
|
234,252
|
|
163,060
|
|
213,813
|
|
—
|
|
—
|
|
116,383
|
|
117,914
|
|
70,866
|
|
|||||||||||||||||
|
Drilling services
|
69,235
|
|
54,462
|
|
22,594
|
|
—
|
|
—
|
|
—
|
|
—
|
|
—
|
|
—
|
|
|||||||||||||||||
|
Other products
|
—
|
|
—
|
|
—
|
|
—
|
|
—
|
|
—
|
|
27,984
|
|
29,549
|
|
17,425
|
|
|||||||||||||||||
|
Total short-cycle
|
480,254
|
|
288,714
|
|
185,654
|
|
213,813
|
|
—
|
|
—
|
|
144,367
|
|
147,463
|
|
88,291
|
|
|||||||||||||||||
|
Other products and services
|
—
|
|
—
|
|
—
|
|
—
|
|
—
|
|
—
|
|
128,805
|
|
107,490
|
|
124,131
|
|
|||||||||||||||||
|
$
|
480,254
|
|
$
|
288,714
|
|
$
|
185,654
|
|
$
|
213,813
|
|
$
|
—
|
|
$
|
—
|
|
$
|
394,066
|
|
$
|
381,913
|
|
$
|
508,790
|
|
|||||||||
|
Percentage of total revenue by type -
|
||||||||||||||||||||||||||
|
Products
|
—
|
%
|
—
|
%
|
—
|
%
|
97
|
%
|
—
|
%
|
—
|
%
|
75
|
%
|
80
|
%
|
82
|
%
|
||||||||
|
Services
|
100
|
%
|
100
|
%
|
100
|
%
|
3
|
%
|
—
|
%
|
—
|
%
|
25
|
%
|
20
|
%
|
18
|
%
|
||||||||
Financial information by geographic location for each of the three years ended
December 31, 2018
,
2017
and
2016
, is summarized below (in thousands). Revenues are attributable to countries based on the location of the entity selling the products or performing the services and include export sales. Long-lived assets are attributable to countries based on the physical location of the operations and its operating assets and do not include intercompany receivable balances.
|
|
United States
|
United
Kingdom
|
Singapore
|
Other
|
Total
|
||||||||||||||
|
2018
|
|
|
|
|
|
||||||||||||||
|
Revenues from unaffiliated customers
|
$
|
930,151
|
|
$
|
64,564
|
|
$
|
37,938
|
|
$
|
55,480
|
|
$
|
1,088,133
|
|
||||
|
Long-lived assets
|
1,304,494
|
|
74,472
|
|
24,118
|
|
70,473
|
|
1,473,557
|
|
|||||||||
|
2017
|
|
|
|
|
|
||||||||||||||
|
Revenues from unaffiliated customers
|
$
|
548,854
|
|
$
|
59,909
|
|
$
|
23,398
|
|
$
|
38,466
|
|
$
|
670,627
|
|
||||
|
Long-lived assets
|
660,271
|
|
80,189
|
|
25,930
|
|
77,109
|
|
843,499
|
|
|||||||||
|
2016
|
|
|
|
|
|
||||||||||||||
|
Revenues from unaffiliated customers
|
$
|
493,615
|
|
$
|
111,565
|
|
$
|
34,577
|
|
$
|
54,687
|
|
$
|
694,444
|
|
||||
|
Long-lived assets
|
729,699
|
|
65,675
|
|
23,972
|
|
74,454
|
|
893,800
|
|
|||||||||
-
92
-
OIL STATES INTERNATIONAL, INC. AND SUBSIDIARIES
NOTES TO CONSOLIDATED FINANCIAL STATEMENTS
(continued)
15
. Related Party Transactions
GEODynamics historically leased certain land and facilities from an indirect equity holder and employee of GEODynamics. In connection with the acquisition of GEODynamics, the Company assumed these leases. Rent expense related to these leases for the year ended
December 31, 2018
totaled
$330 thousand
. The Company exercised its option to purchase the most significant leased facility and associated land for approximately
$5.4 million
in September 2018.
16
.
Valuation Allowances
Activity in the valuation accounts was as follows (in thousands):
|
|
Balance at Beginning of Period
|
Charged to Costs and Expenses
|
Deductions (net of recoveries)
|
Translation and Other, Net
(1)
|
Balance at End of Period
|
||||||||||||||
|
Year Ended December 31, 2018:
|
|
|
|
|
|
||||||||||||||
|
Allowance for doubtful accounts receivable
|
$
|
7,316
|
|
$
|
1,520
|
|
$
|
(887
|
)
|
$
|
(1,248
|
)
|
$
|
6,701
|
|
||||
|
Allowance for excess or obsolete inventory
|
15,649
|
|
2,683
|
|
(2,917
|
)
|
3,136
|
|
18,551
|
|
|||||||||
|
Valuation allowance on deferred tax assets
|
37,904
|
|
(4,124
|
)
|
—
|
|
(18
|
)
|
33,762
|
|
|||||||||
|
Year Ended December 31, 2017:
|
|
|
|
|
|
||||||||||||||
|
Allowance for doubtful accounts receivable
|
$
|
8,510
|
|
$
|
339
|
|
$
|
(1,669
|
)
|
$
|
136
|
|
$
|
7,316
|
|
||||
|
Allowance for excess or obsolete inventory
|
14,849
|
|
2,494
|
|
(1,844
|
)
|
150
|
|
15,649
|
|
|||||||||
|
Valuation allowance on deferred tax assets
|
7,033
|
|
30,772
|
|
—
|
|
99
|
|
37,904
|
|
|||||||||
|
Year Ended December 31, 2016:
|
|
|
|
|
|
||||||||||||||
|
Allowance for doubtful accounts receivable
|
$
|
6,888
|
|
$
|
2,275
|
|
$
|
(400
|
)
|
$
|
(253
|
)
|
$
|
8,510
|
|
||||
|
Allowance for excess or obsolete inventory
|
12,898
|
|
4,916
|
|
(2,756
|
)
|
(209
|
)
|
14,849
|
|
|||||||||
|
Valuation allowance on deferred tax assets
|
3,970
|
|
2,279
|
|
—
|
|
784
|
|
7,033
|
|
|||||||||
____________________
|
(1)
|
For the year ended December 31, 2018, amount presented within allowance for doubtful accounts receivables and excess or obsolete inventory includes
$0.6 million
and
$3.3 million
, respectively, related to the acquired GEODynamics operations.
|
-
93
-
OIL STATES INTERNATIONAL, INC. AND SUBSIDIARIES
NOTES TO CONSOLIDATED FINANCIAL STATEMENTS
(continued)
17
.
Quarterly Financial Information (Unaudited)
The following table summarizes quarterly financial information for
2018
and
2017
(in thousands, except per share amounts):
|
|
First
Quarter
(1)
|
Second
Quarter
(2)
|
Third
Quarter
(3)
|
Fourth
Quarter
(4)
|
|||||||||||
|
2018
|
|
|
|
|
|||||||||||
|
Revenues
|
$
|
253,576
|
|
$
|
285,845
|
|
$
|
274,594
|
|
$
|
274,118
|
|
|||
|
Gross profit
(5)
|
34,738
|
|
41,757
|
|
28,565
|
|
25,934
|
|
|||||||
|
Net income (loss) from continuing operations
|
(3,492
|
)
|
2,742
|
|
(4,019
|
)
|
(14,336
|
)
|
|||||||
|
Basic and diluted net income (loss) per share
|
(0.06
|
)
|
0.05
|
|
(0.07
|
)
|
(0.24
|
)
|
|||||||
|
2017
|
|
|
|
|
|||||||||||
|
Revenues
|
$
|
151,467
|
|
$
|
171,402
|
|
$
|
164,048
|
|
$
|
183,710
|
|
|||
|
Gross profit
(5)
|
4,839
|
|
12,032
|
|
8,323
|
|
18,041
|
|
|||||||
|
Net loss from continuing operations
|
(17,678
|
)
|
(14,246
|
)
|
(15,031
|
)
|
(37,895
|
)
|
|||||||
|
Basic and diluted net loss per share
|
(0.35
|
)
|
(0.28
|
)
|
(0.30
|
)
|
(0.76
|
)
|
|||||||
____________________
|
(1)
|
During the first quarter of
2018
, the Company recognized
$0.8 million
(pre-tax) of severance and other downsizing charges,
$2.6 million
(pre-tax) of acquisition-related expenses,
$0.9 million
(pre-tax) in legal fees incurred for patent defense and
$0.7 million
(pre-tax) of provision for FLSA claims settlements. In the first quarter of
2017
, the Company recognized
$0.8 million
(pre-tax) of severance and other downsizing charges.
|
|
(2)
|
During the second quarter of
2017
, the Company recognized
$0.8 million
(pre-tax) of severance and other downsizing charges and
$1.5 million
(pre-tax) in legal fees incurred for patent defense.
|
|
(3)
|
During the third quarter of
2018
, the Company recognized
$3.5 million
(pre-tax) in legal fees incurred for patent defense and recorded
$2.6 million
(pre-tax) of provision for FLSA claims settlements. Additionally, during the third quarter of
2018
, the Company recognized a
$5.8 million
discrete net tax benefit resulting from the Tax Reform Legislation discussed in Note
8
, "Income Taxes." In the third quarter of
2017
, the Company’s results of operations were adversely affected by Hurricane Harvey with lower revenues and under-absorption of manufacturing facility costs, primarily in its Offshore/Manufactured Products segment, and some field-level downtime due to employee dislocations resulting from the storm. Additionally, during the third quarter of
2017
, the Company also recognized
$0.4 million
(pre-tax) of severance and other downsizing charges and
$1.0 million
of discrete tax charges resulting from the decision to carryback 2016 U.S. net operating losses to 2014.
|
|
(4)
|
During the fourth quarter of
2018
, the Company recognized
$2.4 million
(pre-tax) in legal fees incurred for patent defense,
$0.8 million
(pre-tax) of severance and other downsizing charges and
$0.7 million
(pre-tax) of acquisition-related expenses. In the fourth quarter of
2017
, the Company recorded
$28.2 million
of discrete tax charges resulting from the Tax Reform Legislation discussed in Note
8
, "Income Taxes," and
$1.4 million
(pre-tax) of acquisition related expenses.
|
|
(5)
|
Gross profit is calculated as revenues less costs of products and services and segment level depreciation and amortization.
|
Amounts are calculated independently for each of the quarters presented. Therefore, the sum of the quarterly amounts may not equal the total calculated for the year.
-
94
-
TABLE OF CONTENTS
Part IItem 1. BusinessItem 1A. Risk FactorsItem 1B. Unresolved Staff CommentsItem 2. PropertiesItem 3. Legal ProceedingsItem 4. Mine Safety DisclosuresPart IIItem 5. Market For Registrant's Common Equity, Related Stockholder Matters and Issuer Purchases Of Equity SecuritiesItem 6. Selected Financial DataItem 7. Management S Discussion and Analysis Of Financial Condition and Results Of OperationsItem 7A. Quantitative and Qualitative Disclosures About Market RiskItem 8. Financial Statements and Supplementary DataItem 9. Changes in and Disagreements with Accountants on Accounting and Financial DisclosureItem 9A. Controls and ProceduresItem 9B. Other InformationPart IIIItem 10. Directors, Executive Officers and Corporate GovernanceItem 11. Executive CompensationItem 12. Security Ownership Of Certain Beneficial Owners and Management and Related Stockholder MattersItem 13. Certain Relationships and Related Transactions, and Director IndependenceItem 14. Principal Accounting Fees and ServicesPart IVItem 15. Exhibits, Financial Statement Schedules