OLIN CORP
10-Ks and 10-Qs
|
|
|
|
|
|
|
|
|
|
|
|
|
|
|
|
|
|
|
|
|
|
|
|
|
|
|
|
|
|
|
|
|
|
|
|
|
|
|
|
|
|
|
|
|
|
|
|
|
|
|
|
|
|
|
|
UNITED STATES
SECURITIES AND EXCHANGE COMMISSION
Washington, D.C. 20549
Form 10-K
|
|
(Mark One)
|
|
x
|
ANNUAL REPORT PURSUANT TO SECTION 13 OR 15(d) OF THE SECURITIES EXCHANGE ACT OF 1934
|
|
|
For the fiscal year ended December 31, 2014
|
OR
|
¨
|
TRANSITION REPORT PURSUANT TO SECTION 13 OR 15(d) OF THE SECURITIES EXCHANGE ACT OF 1934
|
|
|
For the transition period from
to
|
Commission file number 1-1070
OLIN CORPORATION
(Exact name of registrant as specified in its charter)
|
Virginia
|
13-1872319
|
|
(State or other jurisdiction of
incorporation or organization)
|
(I.R.S. Employer Identification No.)
|
|
190 Carondelet Plaza, Suite 1530, Clayton, MO
(Address of principal executive offices)
|
63105-3443
(Zip code)
|
Registrant’s telephone number, including area code: (314) 480-1400
Securities registered pursuant to Section 12(b) of the Act:
|
Title of each class
|
Name of each exchange on which registered
|
|
Common Stock,
par value $1 per share
|
New York Stock Exchange
|
Securities registered pursuant to Section 12(g) of the Act: None
Indicate by check mark if the registrant is a well-known seasoned issuer, as defined in Rule 405 of the Securities Act. Yes
x
No
¨
Indicate by check mark if the registrant is not required to file reports pursuant to Section 13 or Section 15(d) of the Exchange Act. Yes
¨
No
x
Indicate by check mark whether the registrant: (1) has filed all reports required to be filed by Section 13 or 15(d) of the Securities Exchange Act of 1934 during the preceding 12 months (or for such shorter period that the registrant was required to file such reports), and (2) has been subject to such filing requirements for the past 90 days. Yes
x
No
¨
Indicate by check mark whether the registrant has submitted electronically and posted on its corporate Web site, if any, every Interactive Data File required to be submitted and posted pursuant to Rule 405 of Regulation S-T during the preceding 12 months (or for such shorter period that the registrant was required to submit and post such files). Yes
x
No
¨
Indicate by check mark if disclosure of delinquent filers pursuant to Item 405 of Regulation S-K is not contained herein, and will not be contained, to the best of registrant’s knowledge, in definitive proxy or information statements incorporated by reference in Part III of this Form 10-K or any amendment to this Form 10-K.
x
Indicate by check mark whether the registrant is a large accelerated filer, an accelerated filer, a non-accelerated filer, or a smaller reporting company. See definitions of “large accelerated filer,” “accelerated filer,” and “smaller reporting company” in Rule 12b-2 of the Exchange Act. Large Accelerated Filer
x
Accelerated Filer
¨
Non-accelerated Filer
¨
Smaller Reporting Company
¨
Indicate by check mark whether the registrant is a shell company (as defined in Rule 12b-2 of the Exchange Act.) Yes
¨
No
x
As of June 30,
2014
, the aggregate market value of registrant’s common stock, par value $1 per share, held by non-affiliates of registrant was approximately
$2,091,879,897
based on the closing sale price as reported on the New York Stock Exchange.
As of January 30,
2015
,
77,385,015
shares of the registrant’s common stock were outstanding.
DOCUMENTS INCORPORATED BY REFERENCE
Portions of the following document are incorporated by reference in this Form 10-K
as indicated herein:
|
Document
|
Part of 10-K into which incorporated
|
|
Proxy Statement relating to Olin’s Annual Meeting of Shareholders
to be held in 2015
|
Part III
|
1
GENERAL
Olin Corporation is a Virginia corporation, incorporated in 1892, having its principal executive offices in Clayton, MO. We are a manufacturer concentrated in three business segments: Chlor Alkali Products, Chemical Distribution and Winchester. Chlor Alkali Products manufactures and sells chlorine and caustic soda, hydrochloric acid, hydrogen, bleach products and potassium hydroxide, which represent 56% of
2014
sales. Chemical Distribution manufactures bleach products and distributes caustic soda, bleach products, potassium hydroxide and hydrochloric acid, which represent 12% of
2014
sales. Winchester products, which represent 32% of
2014
sales, include sporting ammunition, reloading components, small caliber military ammunition and components, and industrial cartridges. See our discussion of our segment disclosures contained in Item 7—“Management’s Discussion and Analysis of Financial Condition and Results of Operations.”
On August 22, 2012, we acquired 100% of privately-held K. A. Steel Chemicals Inc. (KA Steel), whose operating results are included in the accompanying financial statements since the date of the acquisition. For segment reporting purposes, KA Steel comprises the Chemical Distribution segment. KA Steel is one of the largest distributors of caustic soda in North America and manufactures and sells bleach in the Midwest.
GOVERNANCE
We maintain an Internet website at
www.olin.com
. Our reports on Form 10-K, Form 10-Q, and Form 8-K, as well as amendments to those reports, are available free of charge on our website, as soon as reasonably practicable after we file the reports with the Securities and Exchange Commission (SEC). Additionally, a copy of our SEC filings can be accessed from the SEC at their Public Reference Room at 100 F Street, N.E., Washington, D.C. 20549 or by calling that office of the SEC at 1-800-SEC-0330. Also, a copy of our electronically filed materials can be obtained at
www.sec.gov
. Our Principles of Corporate Governance, Committee Charters and Code of Conduct are available on our website at
www.olin.com
in the Governance Section under Governance Documents and Committees.
In May
2014
, our Chief Executive Officer executed the annual Section 303A.12(a) CEO Certification required by the New York Stock Exchange (NYSE), certifying that he was not aware of any violation of the NYSE’s corporate governance listing standards by us. Additionally, our Chief Executive Officer and Chief Financial Officer executed the required Sarbanes-Oxley Act of 2002 (SOX) Sections 302 and 906 certifications relating to this Annual Report on Form 10-K, which are filed with the SEC as exhibits to this Annual Report on Form 10-K.
PRODUCTS, SERVICES AND STRATEGIES
Chlor Alkali Products
Products and Services
We have been involved in the U.S. chlor alkali industry for more than 100 years and are a major participant in the North American chlor alkali market. Chlorine, caustic soda and hydrogen are co-produced commercially by the electrolysis of salt. These co-produced products are produced simultaneously, and in a fixed ratio of 1.0 ton of chlorine to 1.1 tons of caustic soda and 0.03 tons of hydrogen. The industry refers to this as an Electrochemical Unit or ECU. With a demonstrated capacity as of the end of
2014
of 1.9 million ECUs per year, we are the fourth largest chlor alkali producer, measured by production capacity of chlorine and caustic soda, in North America, according to data from IHS, Inc. (IHS). IHS is a global information consulting company established in 1959 that provides information to a variety of industries. Approximately 60% of our caustic soda production is high purity membrane grade, which, according to IHS data, normally commands a premium selling price in the market. According to data from CEH Marketing Research (a division of IHS), we are the largest North American producer of industrial bleach, which is manufactured using both chlorine and caustic soda.
Our manufacturing facilities in Augusta, GA; McIntosh, AL; Charleston, TN; St. Gabriel, LA; Henderson, NV; Becancour, Canada; Santa Fe Springs, CA; Tracy, CA; and a portion of our facility in Niagara Falls, NY are ISO 9001 certified. In addition, Augusta, GA; McIntosh, AL; Charleston, TN; St. Gabriel, LA; Henderson, NV; Santa Fe Springs, CA; Tracy, CA and Niagara Falls, NY are ISO 14001 certified. ISO 9000 (which includes ISO 9001 and ISO 9002) and ISO 14000 (which includes ISO 14001) are sets of related international standards on quality assurance and environmental management developed by the International Organization for Standardization to help companies effectively document the quality and
2
environmental management system elements to be implemented to maintain effective quality and environmental management systems. Our facilities in Augusta, GA; McIntosh, AL; Charleston, TN; Niagara Falls, NY; and St. Gabriel, LA have also achieved Star status in the Voluntary Protection Program (VPP) of the Occupational Safety and Health Administration (OSHA). OSHA’s VPP is a program in which companies voluntarily participate that recognizes facilities for their exemplary safety and health programs. Our Augusta, GA; McIntosh, AL; Charleston, TN; St. Gabriel, LA; Henderson, NV; Santa Fe Springs, CA; Tracy, CA and Niagara Falls, NY manufacturing sites and the division headquarters are accredited under the RC 14001 Responsible Care
®
(RC 14001) standard. Supported by the chemical industry and recognized by government and regulatory agencies, RC 14001 establishes requirements for the management of safety, health, environmental, security, transportation, product stewardship and stakeholder engagement activities for the business.
Chlorine is used as a raw material in the production of thousands of products for end-uses including vinyls, chlorinated intermediates, isocyanates and water treatment. A significant portion of U.S. chlorine production is consumed in the manufacture of ethylene dichloride, or EDC, a precursor for polyvinyl chloride, or PVC. PVC is a plastic used in applications such as vinyl siding, plumbing and automotive parts. We estimate that approximately 16% of our chlorine produced is consumed in the manufacture of EDC. While much of the chlorine produced in the U.S. is consumed by the producing company to make downstream products, we sell most of the chlorine we produce to third parties in the merchant market.
Caustic soda has a wide variety of end-use applications, the largest of which in North America is in the pulp and paper industry. Caustic soda is used in the delignification and bleaching portions of the pulping process. Caustic soda is also used in the production of detergents and soaps, alumina and a variety of other inorganic and organic chemicals.
The chlor alkali industry is cyclical, both as a result of changes in demand for each of the co-produced products and as a result of the large increments in which new capacity is added and removed. Because chlorine and caustic soda are produced in a fixed ratio, the supply of one product can be constrained both by the physical capacity of the production facilities and/or by the ability to sell the co-produced product. Prices for both products respond rapidly to changes in supply and demand. Our ECU netbacks (defined as gross selling price less freight and discounts) averaged approximately $505, $560 and $575 per ECU in
2014
,
2013
and
2012
, respectively. See our discussion of chlor alkali product pricing contained in Item 7—“Management’s Discussion and Analysis of Financial Condition and Results of Operations.”
Electricity and salt are the major purchased raw materials for our Chlor Alkali Products segment. Raw materials represent approximately 49% of the total cost of producing an ECU. Electricity is the single largest raw material component in the production of chlor alkali products. We are supplied by utilities that primarily utilize coal, hydroelectric, natural gas and nuclear power. The commodity nature of this industry places an emphasis on cost management and we believe that we have managed our manufacturing costs in a manner that makes us one of the low cost producers in the industry.
We also manufacture and sell other chlor alkali-related products. These products include chemically processed salt, hydrochloric acid, sodium hypochlorite (bleach), hydrogen and potassium hydroxide. We refer to these other chlor alkali-related products as co-products. Sales of co-products represented approximately 32% of Chlor Alkali Products’ sales in
2014
. We have recently invested in capacity and product upgrades in bleach and hydrochloric acid. In 2013, we completed a capital project to expand hydrochloric acid production at our Henderson, NV chlor alkali site. Hydrochloric acid is a key value-added co-product, and we continue to evaluate hydrochloric acid expansion opportunities at our chlor alkali manufacturing sites. During 2010 to 2013, we initiated and completed low salt, high strength bleach facilities at McIntosh, AL, Niagara Falls, NY and Henderson, NV. These three new facilities increased total bleach manufacturing capacity by approximately 50% over the 2011 capacity. These low salt, high strength bleach facilities nearly double the concentration of the bleach we manufacture, which significantly reduces transportation costs.
3
The following table lists products of our Chlor Alkali Products business, with principal products on the basis of annual sales highlighted in bold face.
|
Products & Services
|
|
Major End Uses
|
|
Plants & Facilities
|
|
Major Raw Materials & Components for Products/Services
|
|
Chlorine/caustic soda
|
|
Pulp & paper processing, chemical manufacturing, water purification, manufacture of vinyl chloride, bleach, swimming pool chemicals and urethane chemicals
|
|
Becancour, Canada
Charleston, TN
Henderson, NV
McIntosh, AL
Niagara Falls, NY
St. Gabriel, LA
|
|
salt, electricity
|
|
|
|
|
|
|
|
|
|
Sodium hypochlorite
(bleach)
|
|
Household cleaners, laundry bleaching, swimming pool sanitizers, semiconductors, water treatment, textiles, pulp & paper and food processing
|
|
Augusta, GA
Becancour, Canada
Charleston, TN
Henderson, NV*
McIntosh, AL*
Niagara Falls, NY*
Santa Fe Springs, CA
Tracy, CA
|
|
chlorine, caustic soda
|
|
|
|
|
|
|
|
|
|
Hydrochloric acid
|
|
Steel, oil & gas, plastics, organic chemical synthesis, water & wastewater treatment, brine treatment, artificial sweeteners, pharmaceuticals, food processing and ore & mineral processing
|
|
Becancour, Canada
Charleston, TN
Henderson, NV
McIntosh, AL
Niagara Falls, NY
|
|
chlorine, hydrogen
|
|
|
|
|
|
|
|
|
|
Potassium hydroxide
|
|
Fertilizer manufacturing, soaps, detergents & cleaners, battery manufacturing, food processing chemicals and deicers
|
|
Charleston, TN
|
|
potassium chloride, electricity
|
|
|
|
|
|
|
|
|
|
Hydrogen
|
|
Fuel source, hydrogen peroxide and hydrochloric acid
|
|
Becancour, Canada
Charleston, TN
Henderson, NV
McIntosh, AL
Niagara Falls, NY
St. Gabriel, LA
|
|
salt, electricity
|
|
* Includes low salt, high strength bleach manufacturing.
|
||||||
Strategies
Continued Role as a Preferred Supplier to Merchant Market Customers.
Based on our market research, we believe our Chlor Alkali Products business is viewed as a preferred supplier by our merchant market customers. We will continue to focus on providing quality customer service support and developing relationships with our valued customers.
Pursue Incremental Expansion Opportunities
. We have invested in capacity and product upgrades in our chemically processed salt, hydrochloric acid, bleach, potassium hydroxide and hydrogen businesses. These expansions increase our captive use of chlorine while increasing the sales of these co-products. These businesses provide opportunities to upgrade chlorine and caustic soda to higher value-added applications. We also have the opportunity, when business conditions permit, to pursue incremental cost effective chlorine and caustic soda expansions at our McIntosh, AL and St. Gabriel, LA facilities.
Chemical Distribution
Products and Services
We acquired KA Steel, a privately-held distributor of caustic soda and bleach, on August 22, 2012. KA Steel was founded in 1957 and had been managed by the two shareholders, Robert and Kenneth Steel, since 1980. For segment reporting purposes, KA Steel comprises the Chemical Distribution segment. KA Steel is one of the largest distributors of caustic soda in North America and manufactures and sells bleach in the Midwest. The Chemical Distribution segment gives us the expanded capability to market and sell caustic soda, bleach, potassium hydroxide and hydrochloric acid, as well as, gives us the geographic diversification the KA Steel locations provide us, and strengthens our position in the industrial bleach segment.
4
KA Steel is a chemical distributor historically focused in caustic soda and bleach. The addition of KA Steel substantially increased our bleach capacity. KA Steel’s geographic profile expanded our reach and provides a strong platform to increase our caustic soda, bleach, potassium hydroxide and hydrochloric acid sales through Chemical Distribution.
Chemical Distribution sources its chemicals from both international and domestic suppliers, including several of the major chemical producers in the U.S. Chemical Distribution typically has written distributorship agreements or supply contracts with our suppliers that are periodically renewed. The Chemical Distribution supply agreements with producers generally include specific volume commitments and performance criteria, with pricing negotiated based on market dynamics and competitive supply alternatives.
The prices at which Chemical Distribution resells the products that it distributes, such as caustic soda, fluctuate in accordance with the prices that they pay for these products, which in turn are driven by the underlying commodity prices, such as caustic soda, in accordance with supply and demand economics. As a result, movements in the product prices tend to result in largely corresponding changes to sales and cost of goods sold.
Transportation of products to and from customers and suppliers is a fundamental component of the Chemical Distribution business. The Chemical Distribution business relies on their private fleet of trucks, tankers and trailers to ship the majority of their annual volume and on common carriers and direct supply sales for the remainder. Direct supply sales occur by shipping products directly from a supplier to a customer when direct shipment is optimal for our route management. Although the products move directly from supplier to customer, Chemical Distribution remains the only point of contact for both customers and suppliers, and we take ownership of the products during the direct supply process.
5
The Chemical Distribution facilities are strategically placed to optimize route density in an effort to balance high quality customer service with execution costs. The following table lists each of the distribution facilities, if the facility is owned or leased, and the products currently shipped from the location. The table does not include supplier controlled direct-ship facilities.
|
Products & Services
|
Plants & Facilities
|
Owned/Leased
|
||
|
Caustic, Bleach, Potassium Hydroxide, Hydrochloric Acid
|
Lemont, IL
|
Own
|
||
|
Caustic, Bleach
|
Muscatine, IA
|
Own
|
||
|
Bleach
|
Romulus, MI
|
Own
|
||
|
Caustic
|
Baltimore, MD
|
Lease
|
||
|
Caustic
|
Bayonne, NJ
|
Lease
|
||
|
Caustic
|
Charleston, SC
|
Lease
|
||
|
Caustic
|
Cincinnati, OH
|
Lease
|
||
|
Caustic
|
Cozad, NE
|
Lease
|
||
|
Caustic, Bleach
|
Dallas, TX
|
Lease
|
||
|
Caustic
|
E Sauget, IL
|
Lease
|
||
|
Bleach
|
Fairborn, OH
|
Lease
|
||
|
Caustic
|
Houston, TX
|
Lease
|
||
|
Caustic
|
Kansas City, KS
|
Lease
|
||
|
Caustic
|
Lubbock, TX
|
Lease
|
||
|
Caustic
|
Manly, IA
|
Lease
|
||
|
Caustic
|
McKees Rocks, PA
|
Lease
|
||
|
Caustic
|
Pt. Allen, LA
|
Lease
|
||
|
Caustic
|
Savannah, GA
|
Lease
|
||
|
Caustic
|
Searsport, ME
|
Lease
|
||
|
Caustic
|
Sioux City, IA
|
Lease
|
||
|
Caustic
|
Spokane, WA
|
Lease
|
||
|
Caustic
|
St. Louis, MO
|
Lease
|
||
|
Caustic
|
St. Paul, MN
|
Lease
|
||
|
Caustic
|
Vancouver, WA
|
Lease
|
||
|
Caustic
|
Warren, MI
|
Lease
|
||
Strategies
Pursue Incremental Expansion Options.
The acquisition of KA Steel enhanced our commodity chemical business by increasing the amount of our core chlor alkali capacity that can be sold as value-added products.
Winchester
Products and Services
In
2014
, Winchester was in its 148
th
year of operation and its 84
th
year as part of Olin. Winchester is a premier developer and manufacturer of small caliber ammunition for sale to domestic and international retailers (commercial customers), law enforcement agencies and domestic and international militaries. We believe we are a leading U.S. producer of ammunition for recreational shooters, hunters, law enforcement agencies and the U.S. Armed Forces.
In September 2014, Winchester was awarded a five-year contract to produce training ammunition for the U.S. Department of Homeland Security. The contract has the potential to generate $50 million of sales over the next five years.
In June 2014, Winchester was awarded a five-year contract to provide 9mm frangible ammunition to be used by the U.S. Air Force, Coast Guard and Navy for close quarter training, which has the potential to generate approximately $28 million of sales over the next five years.
6
In September 2012, Winchester, along with another ammunition manufacturer, was awarded a contract from the Department of Justice (DOJ) and the Federal Bureau of Investigation (FBI). The contract is to provide .40 caliber duty and training ammunition for one year with four option years; the contract has the potential to generate approximately $5 million of annual sales over the life of the contract.
In October 2014 and 2013, Winchester was recognized by the National Association of Sporting Goods Wholesalers (NASGW) with the group’s Excellence in Ammunition Manufacturing award. The NASGW presents the award to manufacturers who best demonstrate outstanding value and service to NASGW distributor members.
In April 2014, Winchester was recognized with the exclusive Overall Vendor of the Year award by Cabela’s Incorporated (Cabela’s), one of the country’s largest retailers of hunting, fishing and outdoor gear. The Overall Vendor of the Year is Cabela’s highest merchandising vendor award across all categories and departments. Winchester was chosen from more than 3,500 merchandise suppliers for superior performance, partnership and overall contribution to the retailer.
In May 2012, the National Defense Industrial Association (NDIA) presented Winchester with the prestigious Ambrose Award for exemplary commitment and contribution to the U.S. Armed Forces. The NDIA presents the award periodically when a manufacturer delivers superior materials that meet required operational capabilities and support a high level of force readiness in conduct of warfighting activities and homeland defense.
Our legendary Winchester
®
product line includes all major gauges and calibers of shotgun shells, rimfire and centerfire ammunition for pistols and rifles, reloading components and industrial cartridges. We believe we are the leading U.S. supplier of small caliber commercial ammunition. In support of our continuous improvement initiatives, our manufacturing facilities in East Alton, IL achieved ISO recertification to the ISO 9001:2008 standard in November 2012. Additionally, our facilities in Oxford, MS and Australia achieved ISO 9001:2008 recertification in 2011.
Winchester has strong relationships throughout the sales and distribution chain and strong ties to traditional dealers and distributors. Winchester has also built its business with key high-volume mass merchants and specialty sporting goods retailers. Winchester has consistently developed industry-leading ammunition, which is recognized in the industry for manufacturing excellence, design innovation and consumer value. Winchester’s new ammunition products continue to receive awards from major industry publications, with recent awards including:
Field & Stream
magazine’s “Best of the Best” award in 2014 and 2013;
Petersen's Hunting
magazine’s 2014 “Editor’s Choice” award;
Guns & Ammo
magazine’s “2014 Ammunition of the Year” award;
American Rifleman
magazine’s Golden Bullseye Award as “Ammunition Product of the Year” in 2014 and 2012; and
Shooting Illustrated
magazine’s “Ammunition Product of the Year” in 2014.
Winchester purchases raw materials such as copper-based strip and ammunition cartridge case cups and lead from vendors based on a conversion charge or premium. These conversion charges or premiums are in addition to the market prices for metal as posted on exchanges such as the Commodity Exchange, or COMEX, and London Metals Exchange, or LME. Winchester’s other main raw material is propellant, which is purchased predominantly from one of the United States’ largest propellant suppliers.
7
The following table lists products and services of our Winchester business, with principal products on the basis of annual sales highlighted in bold face.
|
Products & Services
|
|
Major End Uses
|
|
Plants & Facilities
|
|
Major Raw Materials & Components for Products/Services
|
|
Winchester® sporting ammunition (shot-shells, small caliber centerfire & rimfire ammunition)
|
|
Hunters & recreational shooters, law enforcement agencies
|
|
East Alton, IL
Oxford, MS
Geelong, Australia
|
|
brass, lead, steel, plastic, propellant, explosives
|
|
|
|
|
|
|
|
|
|
Small caliber military ammunition
|
|
Infantry and mounted weapons
|
|
East Alton, IL
Oxford, MS
|
|
brass, lead, propellant, explosives
|
|
|
|
|
|
|
|
|
|
Industrial products (8 gauge loads & powder-actuated tool loads)
|
|
Maintenance applications in power &
concrete industries, powder-actuated tools in construction industry
|
|
East Alton, IL
Oxford, MS
Geelong, Australia
|
|
brass, lead, plastic, propellant, explosives
|
On November 3, 2010, we announced that we had made the decision to relocate the Winchester centerfire pistol and rifle ammunition manufacturing operations from East Alton, IL to Oxford, MS. In October 2011, we opened the new centerfire pistol and rifle production facility in Oxford, MS and, during 2013, the relocation of the centerfire pistol manufacturing equipment was completed. During 2014, the centerfire rifle manufacturing equipment was in the process of being relocated, and by December 1, 2014, all commercial centerfire rifle ammunition was manufactured in Oxford, MS. During
2014
, all of Winchester’s centerfire pistol ammunition and approximately 55% of Winchester’s centerfire rifle ammunition was manufactured in Oxford, MS. This relocation, when completed, is forecast to reduce Winchester’s annual operating costs by approximately $35 million to $40 million. We currently expect to complete this relocation by the end of 2016. Once completed, Winchester expects to have the most modern centerfire ammunition production facility in North America.
Strategies
Leverage Existing Strengths.
Winchester plans to seek new opportunities to leverage the legendary Winchester brand name and will continue to offer a full line of ammunition products to the markets we serve, with specific focus on investments that make Winchester ammunition the retail brand of choice.
Focus on Product Line Growth.
With a long record of pioneering new product offerings, Winchester has built a strong reputation as an industry innovator. This includes the introduction of reduced-lead and non-lead products, which are growing in popularity for use in indoor shooting ranges and for outdoor hunting.
Cost Reduction Strategy.
Winchester plans to continue to focus on strategies that will lower our costs, including the ongoing relocation of our centerfire pistol and rifle ammunition manufacturing operations from East Alton, IL to Oxford, MS.
INTERNATIONAL OPERATIONS
Our subsidiary, Olin Canada ULC, operates one chlor alkali facility in Becancour, Canada, which sells chlor alkali-related products within Canada and to the United States and also sells and distributes ammunition within Canada. Our subsidiary, Winchester Australia Limited, loads and packs sporting and industrial ammunition in Australia. See the Note “Segment Information” of the notes to consolidated financial statements contained in Item 8, for geographic segment data. We are incorporating our segment information from that Note into this section of our Form 10-K.
CUSTOMERS AND DISTRIBUTION
During
2014
, no single customer accounted for more than 8% of sales. Sales to all U.S. Government agencies and sales under U.S. Government contracting activities in total accounted for approximately 4% of sales in
2014
. Products we sell to industrial or commercial users or distributors for use in the production of other products constitute a major part of our total sales. We sell some of our products, such as caustic soda and sporting ammunition, to a large number of users or distributors, while we sell others, such as chlorine, in substantial quantities to a relatively small number of industrial users. We discuss the customers for each of our three businesses in more detail above under “Products and Services.”
8
We market most of our products and services primarily through our sales force and sell directly to various industrial customers, mass merchants, retailers, wholesalers, other distributors and the U.S. Government and its prime contractors.
Because we engage in some government contracting activities and make sales to the U.S. Government, we are subject to extensive and complex U.S. Government procurement laws and regulations. These laws and regulations provide for ongoing government audits and reviews of contract procurement, performance and administration. Failure to comply, even inadvertently, with these laws and regulations and with laws governing the export of munitions and other controlled products and commodities could subject us or one or more of our businesses to civil and criminal penalties, and under certain circumstances, suspension and debarment from future government contracts and the exporting of products for a specified period of time.
BACKLOG
The total amount of contracted backlog was approximately $289.0 million and $532.4 million as of January 31,
2015
and
2014
, respectively. The backlog orders are in our Winchester business. Beginning in November 2012, consumer purchases of ammunition surged significantly above historical demand levels. The surge in demand was across all of Winchester’s commercial product offerings. Beginning in the third quarter of 2014, Winchester began to experience a decline in commercial demand from the 2013 level. However, the second half of 2014 commercial demand remained stronger than 2011 levels. The increase above historical levels of commercial demand can be illustrated by the increase in Winchester’s commercial backlog, which was $192.4 million and $423.0 million at January 31,
2015
and
2014
, respectively, compared to $29.4 million at December 31, 2011 and $37.6 million at January 31, 2012. The orders included in the commercial backlog may be canceled by the customer. Backlog is comprised of all open customer orders not yet shipped. Approximately 82% of contracted backlog as of January 31,
2015
is expected to be filled during
2015
.
COMPETITION
We are in active competition with businesses producing or distributing the same or similar products, as well as, in some instances, with businesses producing or distributing different products designed for the same uses.
Chlor alkali manufacturers in North America, with approximately 17 million tons of chlorine and 18 million tons of caustic soda capacity, account for approximately 17% of worldwide chlor alkali production capacity. According to IHS, the Dow Chemical Company (Dow), the Occidental Petroleum Corporation (Oxy), and Axiall Corporation (Axiall) are the three largest chlor alkali producers in North America. Approximately 75% of the total North American capacity is located in the U.S. Gulf Coast region.
Many of our competitors are integrated producers of chlorine, using some, or all, of their chlorine production in the manufacture of other downstream products. In contrast, we are primarily a merchant producer of chlorine and sell the majority of our chlorine to merchant customers. As a result, we supply a greater share of the merchant chlorine market than our share of overall industry capacity. We do utilize chlorine to manufacture industrial bleach and hydrochloric acid. There is a worldwide market for caustic soda, which attracts imports and allows exports depending on market conditions. All of our competitors and the integrated producers of chlorine sell caustic soda into the North American merchant market.
The chlor alkali industry in North America is highly competitive, and many of our competitors, including Dow and Oxy, are substantially larger and have greater financial resources than we do. While the technologies to manufacture and transport chlorine and caustic soda are widely available, the production facilities require large capital investments, and are subject to significant regulatory and permitting requirements.
We became one of the largest distributors of caustic soda in North America with the acquisition of KA Steel. We operate in a competitive industry and compete with many producers, distributors and sales agents offering chemicals equivalent to the products we handle. The primary competitive factors affecting the distribution business is the availability of product, the price, customer service and delivery capabilities. Our principal distribution competitors in North America include Univar Inc., Brenntag AG and numerous smaller regional distributors.
9
We are among the largest manufacturers in the United States of commercial small caliber ammunition based on independent market research sponsored by the National Shooting Sports Foundation (NSSF). Formed in 1961, NSSF has a membership of more than 8,000 manufacturers, distributors, firearms retailers, shooting ranges, sportsman’s organizations and publishers. According to NSSF, our Winchester business, Vista Outdoor Inc. (Vista), which began publicly trading in February 2015, (formerly a part of Alliant Techsystems Inc. (ATK)) and Remington Outdoor Company, Inc. (Remington) are the three largest commercial ammunition manufacturers in the United States. The ammunition industry is highly competitive with us, Vista, Remington, numerous smaller domestic manufacturers and foreign producers competing for sales to the commercial ammunition customers. Many factors influence our ability to compete successfully, including price, delivery, service, performance, product innovation and product recognition and quality, depending on the product involved.
EMPLOYEES
As of December 31,
2014
, we had approximately 3,900 employees, with 3,700 working in the United States and 200 working in foreign countries, primarily Canada. Various labor unions represent a majority of our hourly-paid employees for collective bargaining purposes.
The following labor contract is scheduled to expire in
2015
:
|
Location
|
Number of Employees
|
Expiration Date
|
||
|
McIntosh (Chlor Alkali)
|
212
|
April 2015
|
||
While we believe our relations with our employees and their various representatives are generally satisfactory, we cannot assure that we can conclude this labor contract or any other labor agreements without work stoppages and cannot assure that any work stoppages will not have a material adverse effect on our business, financial condition or results of operations.
RESEARCH ACTIVITIES; PATENTS
Our research activities are conducted on a product-group basis at a number of facilities. Company-sponsored research expenditures were $4.1 million in
2014
, $2.5 million in
2013
and $2.6 million in
2012
.
We own or license a number of patents, patent applications and trade secrets covering our products and processes. We believe that, in the aggregate, the rights under our patents and licenses are important to our operations, but we do not consider any individual patent or license or group of patents and licenses related to a specific process or product to be of material importance to our total business.
RAW MATERIALS AND ENERGY
We purchase the major portion of our raw material requirements. The principal basic raw materials for our production of chlor alkali products are salt, electricity, potassium chloride, sulfur dioxide and hydrogen. A portion of the salt used in our Chlor Alkali Products segment is produced from internal resources. Lead, brass and propellant are the principal raw materials used in the Winchester business. We typically purchase our electricity, salt, potassium chloride, sulfur dioxide, ammunition cartridge case cups and copper-based strip, and propellants pursuant to multi-year contracts. We provide additional information with respect to specific raw materials in the tables set forth under “Products and Services.”
Electricity is the predominant energy source for our manufacturing facilities. Most of our facilities are served by utilities which generate electricity principally from coal, hydroelectric and nuclear power except at St. Gabriel, LA and Henderson, NV which predominantly use natural gas.
10
ENVIRONMENTAL AND TOXIC SUBSTANCES CONTROLS
In the United States, the establishment and implementation of federal, state and local standards to regulate air, water and land quality affect substantially all of our manufacturing locations. Federal legislation providing for regulation of the manufacture, transportation, use and disposal of hazardous and toxic substances, and remediation of contaminated sites has imposed additional regulatory requirements on industry, particularly the chemicals industry. In addition, implementation of environmental laws, such as the Resource Conservation and Recovery Act and the Clean Air Act, has required and will continue to require new capital expenditures and will increase operating costs. Our Canadian facility is governed by federal environmental laws administered by Environment Canada and by provincial environmental laws enforced by administrative agencies. Many of these laws are comparable to the U.S. laws described above. We employ waste minimization and pollution prevention programs at our manufacturing sites and we are a party to various governmental and private environmental actions associated with former waste disposal sites and past manufacturing facilities. Charges to income for investigatory and remedial efforts were material to operating results in the past three years and may be material to operating results in future years.
See our discussion of our environmental matters contained in Item 3—“Legal Proceedings” below, the Note “Environmental” of the notes to consolidated financial statements contained in Item 8 and Item 7—“Management’s Discussion and Analysis of Financial Condition and Results of Operations.”
In addition to the other information in this Form 10-K, the following factors should be considered in evaluating Olin and our business. All of our forward-looking statements should be considered in light of these factors. Additional risks and uncertainties that we are unaware of or that we currently deem immaterial also may become important factors that affect us.
Sensitivity to Global Economic Conditions and Cyclicality
—Our operating results could be negatively affected during economic downturns.
The business of most of our customers, particularly our vinyl, urethanes and pulp and paper customers are, to varying degrees, cyclical and have historically experienced periodic downturns. These economic and industry downturns have been characterized by diminished product demand, excess manufacturing capacity and, in some cases, lower average selling prices. Therefore, any significant downturn in our customers’ businesses or in global economic conditions could result in a reduction in demand for our products and could adversely affect our results of operations or financial condition.
Although we do not generally sell a large percentage of our products directly to customers abroad, a large part of our financial performance is dependent upon a healthy economy beyond North America. Our customers sell their products abroad. As a result, our business is affected by general economic conditions and other factors in Western Europe, South America and most of East Asia, particularly China and Japan, including fluctuations in interest rates, customer demand, labor and energy costs, currency changes and other factors beyond our control. The demand for our customers’ products, and therefore, our products, is directly affected by such fluctuations. In addition, our customers could decide to move some or all of their production to lower cost, offshore locations, and this could reduce demand in North America for our products. We cannot assure you that events having an adverse effect on the industries in which we operate will not occur or continue, such as a downturn in the Western European, South American, Asian or world economies, increases in interest rates or unfavorable currency fluctuations. Economic conditions in other regions of the world, predominantly Asia and Europe, can increase the amount of caustic soda produced and available for export to North America. The increased caustic soda supply can put downward pressure on our caustic soda prices, negatively impacting our profitability.
Cyclical Pricing Pressure
—Our profitability could be reduced by declines in average selling prices of our products, particularly declines in the ECU netbacks for chlorine and caustic soda.
Our historical operating results reflect the cyclical and sometimes volatile nature of the chemical and ammunition industries. We experience cycles of fluctuating supply and demand in each of our business segments, particularly in Chlor Alkali Products, which result in changes in selling prices. Periods of high demand, tight supply and increasing operating margins tend to result in increases in capacity and production until supply exceeds demand, generally followed by periods of oversupply and declining prices. Another factor influencing demand and pricing for chlorine and caustic soda is the price of natural gas. Higher natural gas prices increase our customers’ and competitors’ manufacturing costs, and depending on the ratio of crude oil to natural gas prices, could make them less competitive in world markets. Continued expansion offshore, particularly in Asia, will continue to have an impact on the ECU values as imported caustic soda replaces some capacity in North America.
11
Price in the chlor alkali industry is the major supplier selection criterion. We have little or no ability to influence prices in this large commodity market. Decreases in the average selling prices of our products could have a material adverse effect on our profitability. For example, in the Chlor Alkali Products segment, assuming all other costs remain constant and internal consumption remains approximately the same, a $10 per ECU selling price change equates to an approximate $14 million annual change in our revenues and pretax profit when we are operating at full capacity. While we strive to maintain or increase our profitability by reducing costs through improving production efficiency, emphasizing higher margin products and by controlling transportation, selling and administration expense, we cannot assure you that these efforts will be sufficient to offset fully the effect of possible decreases in pricing on operating results.
Because of the cyclical nature of our businesses, we cannot assure you that pricing or profitability in the future will be comparable to any particular historical period, including the most recent period shown in our operating results. We cannot assure you that the chlor alkali industry will not experience adverse trends in the future, or that our operating results and/or financial condition will not be adversely affected by them.
Our Chemical Distribution segment is also subject to changes in operating results as a result of cyclical pricing pressures. The prices at which we resell the products that we distribute often fluctuate in accordance with the prices that we pay for these products, which in turn are driven by the underlying commodity prices, such as caustic soda, in accordance with supply and demand economics. We attempt to pass commodity pricing changes to our customers, but we may be unable to or be delayed in doing so. The inability to pass through price increases or any limitation or delays in passing through price increases in our Chemical Distribution segment could adversely affect our profitability.
Our Winchester segment is also subject to changes in operating results as a result of cyclical pricing pressures, but to a lesser extent than the Chlor Alkali Products segment. Selling prices of ammunition are affected by changes in raw material costs and availability and customer demand, and declines in average selling prices of products of our Winchester segment could adversely affect our profitability.
Imbalance in Demand for Our Chlor Alkali Products
—A loss of a substantial customer for our chlorine or caustic soda could cause an imbalance in demand for these products, which could have an adverse effect on our results of operations.
Chlorine and caustic soda are produced simultaneously and in a fixed ratio of 1.0 ton of chlorine to 1.1 tons of caustic soda. The loss of a substantial chlorine or caustic soda customer could cause an imbalance in demand for our chlorine and caustic soda products. An imbalance in demand may require us to reduce production of both chlorine and caustic soda or take other steps to correct the imbalance. Since we cannot store large quantities of chlorine, we may not be able to respond to an imbalance in demand for these products as quickly or efficiently as some of our competitors. If a substantial imbalance occurred, we would need to reduce prices or take other actions that could have a negative impact on our results of operations and financial condition.
Security and Chemicals Transportation—
New regulations on the transportation of hazardous chemicals and/or the security of chemical manufacturing facilities and public policy changes related to transportation safety could result in significantly higher operating costs.
The chemical industry, including the chlor alkali industry, has proactively responded to the issues related to national security and environmental concerns by starting new initiatives relating to the security of chemicals industry facilities and the transportation of hazardous chemicals in the United States. Government at the local, state and federal levels could implement new regulations that would impact the security of chemical plant locations and the transportation of hazardous chemicals. Our Chlor Alkali Products business could be adversely impacted by the cost of complying with any new regulations. Our business also could be adversely affected if an incident were to occur at one of our facilities or while transporting product. The extent of the impact would depend on the requirements of future regulations and the nature of an incident, which are unknown at this time.
Effects of Regulation—
Changes in legislation or government regulations or policies, including tax policies, could have a material adverse effect on our financial position or results of operations.
Legislation that may be passed by Congress or other legislative bodies or new regulations that may be issued by federal and other administrative agencies could significantly affect the sales, costs and profitability of our business. The chemical and ammunition industries are subject to legislative and regulatory actions, which could have a material adverse effect on our financial position or results of operations.
12
Cost Control
—Our profitability could be reduced if we experience increasing raw material, utility, transportation or logistics costs, or if we fail to achieve our targeted cost reductions.
Our operating results and profitability are dependent upon our continued ability to control, and in some cases further reduce, our costs. If we are unable to do so, or if costs outside of our control, particularly our costs of raw materials, utilities, transportation and similar costs, increase beyond anticipated levels, our profitability will decline.
For example, our Chlor Alkali product transportation costs, particularly railroad shipment costs, are a significant portion of our cost of goods sold, and have been increasing over the past several years. If the cost increases continue, and we are unable to control those costs or pass the increased costs on to customers, our profitability in our Chlor Alkali business would be negatively affected. Similarly, costs of commodity metals and other materials used in our Winchester business, such as copper and lead, can vary. If we experience significant increases in these costs and are unable to raise our prices to offset the higher costs, the profitability in our Winchester business would be negatively affected.
Environmental Costs
—We have ongoing environmental costs, which could have a material adverse effect on our financial position or results of operations.
The nature of our operations and products, including the raw materials we handle, exposes us to the risk of liabilities or claims with respect to environmental matters. In addition, we are party to various governmental and private environmental actions associated with past manufacturing facilities and former waste disposal sites. We have incurred, and expect to incur, significant costs and capital expenditures in complying with environmental laws and regulations.
The ultimate costs and timing of environmental liabilities are difficult to predict. Liabilities under environmental laws relating to contaminated sites can be imposed retroactively and on a joint and several basis. One liable party could be held responsible for all costs at a site, regardless of fault, percentage of contribution to the site or the legality of the original disposal. We could incur significant costs, including cleanup costs, natural resource damages, civil or criminal fines and sanctions and third-party lawsuits claiming, for example, personal injury and/or property damage, as a result of past or future violations of, or liabilities under, environmental or other laws.
In addition, future events, such as changes to or more rigorous enforcement of environmental laws, could require us to make additional expenditures, modify or curtail our operations and/or install pollution control equipment.
Accordingly, it is possible that some of the matters in which we are involved or may become involved may be resolved unfavorably to us, which could materially adversely affect our financial position, cash flows or results of operations. See “Environmental Matters” contained in Item 7—“Management’s Discussion and Analysis of Financial Condition and Results of Operations.”
Litigation and Claims—
We are subject to litigation and other claims, which could cause us to incur significant expenses.
We are a defendant in a number of pending legal proceedings relating to our present and former operations. These include product liability claims relating to ammunition and firearms and proceedings alleging injurious exposure of plaintiffs to various chemicals and other substances (including proceedings based on alleged exposures to asbestos). Frequently, the proceedings alleging injurious exposure involve claims made by numerous plaintiffs against many defendants. However, because of the inherent uncertainties of litigation, we are unable to predict the outcome of these proceedings and therefore cannot determine whether the financial impact, if any, will be material to our financial position, cash flows or results of operations.
Information Security—
A failure of our information technology systems, or an interruption in their operation, could have a material adverse effect on our business, financial condition or results of operations.
Our operations are dependent on our ability to protect our information systems, computer equipment and information databases from systems failures. We rely on our information technology systems generally to manage the day-to-day operation of our business, operate elements of our chlor alkali and ammunition manufacturing facilities, manage relationships with our customers, fulfill customer orders and maintain our financial and accounting records. Failures of our information technology systems could be caused by internal or external events, such as incursions by intruders or hackers, computer viruses, cyber-attacks, failures in hardware or software, or power or telecommunication fluctuations or failures. The failure of our information technology systems to perform as anticipated for any reason or any significant breach of security could disrupt our business and result in numerous adverse consequences, including reduced effectiveness and efficiency of operations, increased
13
costs or loss of important information, any of which could have a material adverse effect on our business, financial condition or results of operations. We have technology and information security processes and disaster recovery plans in place to mitigate our risk to these vulnerabilities. However, these measures may not be adequate to ensure that our operations will not be disrupted, should such an event occur.
Production Hazards
—Our facilities are subject to operating hazards, which may disrupt our business.
We are dependent upon the continued safe operation of our production facilities. Our production facilities are subject to hazards associated with the manufacture, handling, storage and transportation of chemical materials and products and ammunition, including leaks and ruptures, explosions, fires, inclement weather and natural disasters, unexpected utility disruptions or outages, unscheduled downtime and environmental hazards. From time to time in the past, we have had incidents that have temporarily shut down or otherwise disrupted our manufacturing, causing production delays and resulting in liability for workplace injuries and fatalities. Some of our products involve the manufacture and/or handling of a variety of explosive and flammable materials. Use of these products by our customers could also result in liability if an explosion, fire, spill or other accident were to occur. We cannot assure you that we will not experience these types of incidents in the future or that these incidents will not result in production delays or otherwise have a material adverse effect on our business, financial condition or results of operations.
Credit Facilities—
Weak industry conditions could affect our ability to comply with the financial maintenance covenants in our senior credit facility and certain tax-exempt bonds.
Our senior credit facility and our Gulf Opportunity Zone Act of 2005 (Go Zone) and American Recovery and Reinvestment Act of 2009 (Recovery Zone) tax-exempt bonds include certain financial maintenance covenants requiring us to not exceed a maximum leverage ratio and to maintain a minimum coverage ratio.
Depending on the magnitude and duration of chlor alkali cyclical downturns, including deterioration in prices and volumes, there can be no assurance that we will continue to be in compliance with these ratios. If we failed to comply with either of these covenants in a future period and were not able to obtain waivers from the lenders thereunder, we would need to refinance our current senior credit facility and the Go Zone and Recovery Zone bonds. However, there can be no assurance that such refinancing would be available to us on terms that would be acceptable to us or at all.
Credit and Capital Market Conditions
—Adverse conditions in the credit and capital markets may limit or prevent our ability to borrow or raise capital.
While we believe we have facilities in place that should allow us to borrow funds as needed, adverse conditions in the credit and financial markets could prevent us from obtaining financing, if the need arises. Our ability to invest in our businesses and refinance or repay maturing debt obligations could require access to the credit and capital markets and sufficient bank credit lines to support cash requirements. If we are unable to access the credit and capital markets, we could experience a material adverse effect on our financial position or results of operations.
As of December 31,
2014
, we had
$675.1 million
of indebtedness outstanding, including $4.5 million representing the unrecognized gain related to $161.5 million of interest rate swaps at December 31,
2014
. This outstanding indebtedness does not include our $265.0 million senior revolving credit facility of which we had
$257.7 million
available as of December 31,
2014
because we had issued
$7.3 million
of letters of credit. As of December 31,
2014
, our indebtedness represented
40.0%
of our total capitalization. At December 31,
2014
,
$16.4 million
of our indebtedness was due within one year.
Our indebtedness could adversely affect our financial condition and limit our ability to fund working capital, capital expenditures and other general corporate purposes, to accommodate growth by reducing funds otherwise available for other corporate purposes, and to compete, which in turn could prevent us from fulfilling our obligations under our indebtedness. In addition, our indebtedness could make us more vulnerable to any continuing downturn in general economic conditions and reduce our ability to respond to changing business and economic conditions. Despite our level of indebtedness, the terms of our senior credit facility and our existing indentures permit us to borrow additional money. If we borrow more money, the risks related to our indebtedness could increase.
14
Pension Plans
—The impact of declines in global equity and fixed income markets on asset values and any declines in interest rates used to value the liabilities in our pension plans may result in higher pension costs and the need to fund the pension plans in future years in material amounts.
Under Accounting Standard Codification (ASC) 715 “Compensation–Retirement Benefits” (ASC 715), we recorded an after-tax charge of
$86.6 million
(
$142.0 million
pretax) to shareholders’ equity as of December 31,
2014
for our pension and other postretirement plans. This charge reflected a
60
-basis point decrease in the plans’ discount rate and the negative impact of the newly mandated mortality tables, partially offset by favorable performance on plan assets during
2014
. In
2013
, we recorded an after-tax charge of $7.7 million ($12.5 million pretax) to shareholders’ equity as of December 31,
2013
for our pension and other postretirement plans. This charge reflected unfavorable performance on plan assets during
2013
, partially offset by a 60-basis point increase in the plans’ discount rate. In
2012
, we recorded an after-tax charge of $101.9 million ($166.8 million pretax) to shareholders’ equity as of December 31,
2012
for our pension and other postretirement plans. This charge reflected a 100-basis point decrease in the plans’ discount rate, partially offset by the favorable performance on plan assets during
2012
. The non-cash charges to shareholders’ equity do not affect our ability to borrow under our senior credit facility.
The determinations of pension expense and pension funding are based on a variety of rules and regulations. Changes in these rules and regulations could impact the calculation of pension plan liabilities and the valuation of pension plan assets. They may also result in higher pension costs, additional financial statement disclosure, and accelerate the need to fully fund the pension plan. During the fourth quarter of 2014, the Society of Actuaries (SOA) issued the final report of its mortality tables and mortality improvement scales. The updated mortality data reflected increasing life expectancies in the United States. During the third quarter of 2012, the “Moving Ahead for Progress in the 21st Century Act” (MAP-21) became law. The new law changes the mechanism for determining interest rates to be used for calculating minimum defined benefit pension plan funding requirements. Interest rates are determined using an average of rates for a 25-year period, which can have the effect of increasing the annual discount rate, reducing the defined benefit pension plan obligation and potentially reducing or eliminating the minimum annual funding requirement. The new law also increased premiums paid to the Pension Benefit Guaranty Corporation (PBGC). During the third quarter of 2014, the “Highway and Transportation Funding Act” (HATFA 2014) became law, which includes an extension of MAP-21’s defined benefit plan funding stabilization relief. Based on our plan assumptions and estimates, we will not be required to make any cash contributions to the domestic qualified defined benefit pension plan at least through
2015
and under the new law may not be required to make any additional contributions for at least the next five years. We do have a small Canadian qualified defined benefit pension plan to which we made cash contributions of $0.8 million in
2014
, $1.0 million in
2013
and $0.9 million in
2012
, and we anticipate approximately $1 million of cash contributions in
2015
. At December 31,
2014
, the projected benefit obligation of
$2,117.4 million
exceeded the market value of assets in our qualified defined benefit pension plans by
$138.7 million
, as calculated under ASC 715.
In addition, the impact of declines in global equity and fixed income markets on asset values may result in higher pension costs and may increase and accelerate the need to fund the pension plans in future years. For example, holding all other assumptions constant, a 100-basis point decrease or increase in the assumed long-term rate of return on plan assets would have decreased or increased, respectively, the
2014
defined benefit pension plans income by approximately $17.4 million.
Holding all other assumptions constant, a 50-basis point decrease in the discount rate used to calculate pension income for
2014
and the projected benefit obligation as of December 31,
2014
would have decreased pension income by $0.5 million and increased the projected benefit obligation by $118.0 million. A 50-basis point increase in the discount rate used to calculate pension income for
2014
and the projected benefit obligation as of December 31,
2014
would have increased pension income by $0.7 million and decreased the projected benefit obligation by $115.0 million.
Labor Matters—
We cannot assure you that we can conclude future labor contracts or any other labor agreements without work stoppages.
Various labor unions represent a majority of our hourly-paid employees for collective bargaining purposes. The following labor contract is scheduled to expire in 2015:
|
Location
|
Number of Employees
|
Expiration Date
|
||
|
McIntosh (Chlor Alkali)
|
212
|
April 2015
|
||
While we believe our relations with our employees and their various representatives are generally satisfactory, we cannot assure that we can conclude this labor contract or any other labor agreements without work stoppages and cannot assure that any work stoppages will not have a material adverse effect on our business, financial condition or results of operations.
15
Debt Service
—We may not be able to generate sufficient cash to service our debt, which may require us to refinance our indebtedness or default on our scheduled debt payments.
Our ability to generate sufficient cash flow from operations to make scheduled payments on our debt depends on a range of economic, competitive and business factors, many of which are outside our control. We cannot assure you that our business will generate sufficient cash flow from operations. If we are unable to meet our expenses and debt obligations, we may need to refinance all or a portion of our indebtedness on or before maturity, sell assets or raise equity. We cannot assure you that we would be able to refinance any of our indebtedness, sell assets or raise equity on commercially reasonable terms or at all, which could cause us to default on our obligations and impair our liquidity. Our inability to generate sufficient cash flow to satisfy our debt obligations, or to refinance our obligations on commercially reasonable terms, would have an adverse effect on our business, financial condition and results of operations, as well as on our ability to satisfy our debt obligations. See “Liquidity and Other Financing Arrangements” contained in Item 7—“Management’s Discussion and Analysis of Financial Condition and Results of Operations” and Item 7A—“Quantitative and Qualitative Disclosures about Market Risk.”
Not applicable.
We have manufacturing sites at 13 separate locations in nine states, Canada and Australia. Most manufacturing sites are owned although a number of small sites are leased. We also own 4 terminals in 3 states and Canada and lease 26 terminal facilities in 19 states. We listed the principal locations at or from which our products and services are manufactured, distributed or marketed in the tables set forth under the caption “Products and Services” contained in Item 1—“Business.”
We lease warehouses, terminals and distribution offices and space for executive and branch sales offices and service departments.
Saltville
We have completed all work in connection with remediation of mercury contamination at the site of our former mercury cell chlor alkali plant in Saltville, VA required to date. In mid-2003, the Trustees for natural resources in the North Fork Holston River, the Main Stem Holston River and associated floodplains, located in Smyth and Washington Counties in Virginia and in Sullivan and Hawkins Counties in Tennessee notified us of, and invited our participation in, an assessment of alleged damages to natural resources resulting from the release of mercury. The Trustees also notified us that they have made a preliminary determination that we are potentially liable for natural resource damages in said rivers and floodplains. We agreed to participate in the assessment. We and the Trustees have entered into discussions concerning a resolution of this matter. In light of the ongoing discussions and inherent uncertainties of the assessment, we cannot at this time determine whether the financial impact, if any, of this matter will be material to our financial position or results of operations. See “Environmental Matters” contained in Item 7—“Management’s Discussion and Analysis of Financial Condition and Results of Operations.”
Other
As part of the continuing environmental investigation by federal, state and local governments of waste disposal sites, we have entered into a number of settlement agreements requiring us to participate in the investigation and cleanup of a number of sites. Under the terms of such settlements and related agreements, we may be required to manage or perform one or more elements of a site cleanup, or to manage the entire remediation activity for a number of parties, and subsequently seek recovery of some or all of such costs from other Potentially Responsible Parties (PRPs). In many cases, we do not know the ultimate costs of our settlement obligations at the time of entering into particular settlement agreements, and our liability accruals for our obligations under those agreements are often subject to significant management judgment on an ongoing basis. Those cost accruals are provided for in accordance with generally accepted accounting principles and our accounting policies set forth in “Environmental Matters” contained in Item 7—“Management’s Discussion and Analysis of Financial Condition and Results of Operations.”
16
We, and our subsidiaries, are defendants in various other legal actions (including proceedings based on alleged exposures to asbestos) incidental to our past and current business activities. At December 31,
2014
and
2013
, our consolidated balance sheets included liabilities for these legal actions of
$22.1 million
and
$19.3 million
, respectively. These liabilities do not include costs associated with legal representation. Based on our analysis, and considering the inherent uncertainties associated with litigation, we do not believe that it is reasonably possible that these legal actions will materially adversely affect our financial position, cash flows or results of operations.
Not applicable.
Executive Officers of the Registrant as of
February 25, 2015
|
Name and Age
|
|
Office
|
|
Served as an Olin Officer Since
|
|
Joseph D. Rupp (64)
|
|
Chairman and Chief Executive Officer
|
|
1996
|
|
Scott R. Abel (51)
|
|
President, K. A. Steel Chemicals Inc.
|
|
2014
|
|
Frank W. Chirumbole (56)
|
|
Vice President and President, Chlor Alkali Products
|
|
2011
|
|
Stephen C. Curley (63)
|
|
Vice President and Treasurer
|
|
2005
|
|
Dolores J. Ennico (62)
|
|
Vice President, Human Resources
|
|
2009
|
|
John E. Fischer (59)
|
President and Chief Operating Officer
|
2004
|
||
|
G. Bruce Greer, Jr. (54)
|
|
Vice President, Strategic Planning and Information Technology
|
|
2005
|
|
John L. McIntosh (60)
|
|
Senior Vice President, Chemicals
|
|
1999
|
|
Thomas J. O’Keefe (56)
|
|
Vice President and President, Winchester
|
|
2011
|
|
George H. Pain (64)
|
|
Senior Vice President, General Counsel and Secretary
|
|
2002
|
|
Todd A. Slater (51)
|
|
Vice President and Chief Financial Officer
|
|
2005
|
|
Randee N. Sumner (40)
|
Vice President and Controller
|
2014
|
||
No family relationship exists between any of the above named executive officers or between any of them and any of our directors. Such officers were elected to serve, subject to the By-laws, until their respective successors are chosen.
All executive officers, except Messrs. Abel, Chirumbole and O’Keefe, and Ms. Sumner, have served as executive officers for more than five years.
Scott R. Abel joined Olin in April 2014, and became President, K. A. Steel Chemicals Inc. on August 22, 2014. From 2012 to 2014, he served as Commercial Vice President at KOST USA, Inc. and from 2009 to 2012, he served as Business Director – Glycols at Archer Daniels Midland Company. From 2008 to 2009, he served as Global Marketing Director – Acrylic Monomers; from 2003 to 2007, he served as Senior Marketing Manager – Chlor Alkali; and from 1989 through 2007, he served in various sales and marketing positions, all at The Dow Chemical Company.
Frank W. Chirumbole was appointed Vice President and President, Chlor Alkali Products effective April 26, 2012, and assumed his current duties on April 28, 2011. From October 2010 until April 2012, he served as President, Chlor Alkali Products; from 2009 until September 2010, he served as Vice President, General Manager – Bleach; from 2007 to 2009 he served as Vice President, Supply Chain Management; and from 2001 to 2007 he served as Vice President, Manufacturing and Engineering, all in the Chlor Alkali Products Division.
Thomas J. O’Keefe was appointed Vice President and President, Winchester effective April 26, 2012, and assumed his current duties on April 28, 2011. From 2010 to 2011, he served as President, Winchester; from 2008 to 2010, he served as Vice President, Operations and Planning and from 2006 to 2008 he was Vice President, Manufacturing Operations, in each case, in the Winchester Division. From 2001 to 2006, he was Vice President, Manufacturing and Engineering for Olin’s former Brass Division.
Randee N. Sumner was appointed Vice President and Controller effective May 4, 2014. From December 2012 until April 2014, she served as Division Financial Officer for K. A. Steel Chemicals Inc. From 2010 until December 2012, she served as Assistant Controller; from 2008 to 2010, she served as Director, Corporate Accounting and Financial Reporting; and from 2006 to 2008, she served as Manager, Corporate Accounting and Financial Reporting, all for Olin Corporation.
17
As of January 30,
2015
, we had 3,627 record holders of our common stock.
Our common stock is traded on the New York Stock Exchange.
The high and low sales prices of our common stock during each quarterly period in
2014
and
2013
are listed below. A dividend of $0.20 per common share was paid during each of the four quarters in
2014
and
2013
.
|
2014
|
First
Quarter
|
Second
Quarter
|
Third
Quarter
|
Fourth
Quarter
|
||||||||||||
|
Market price of common stock per New York Stock Exchange composite transactions
|
||||||||||||||||
|
High
|
$
|
29.18
|
|
$
|
29.28
|
|
$
|
28.08
|
|
$
|
25.97
|
|
||||
|
Low
|
24.51
|
|
26.42
|
|
25.23
|
|
20.43
|
|
||||||||
|
2013
|
||||||||||||||||
|
Market price of common stock per New York Stock Exchange composite transactions
|
||||||||||||||||
|
High
|
$
|
25.42
|
|
$
|
26.05
|
|
$
|
25.17
|
|
$
|
29.52
|
|
||||
|
Low
|
21.29
|
|
22.74
|
|
22.50
|
|
21.79
|
|
||||||||
Issuer Purchases of Equity Securities
|
Period
|
Total Number of Shares
(or Units) Purchased
|
Average Price
Paid
per Share (or Unit)
|
Total Number of Shares
(or Units) Purchased as
Part of Publicly
Announced Plans or
Programs
|
Maximum Number of
Shares (or Units) that
May Yet Be Purchased
Under the Plans or
Programs
|
||||
|
October 1-31, 2014
|
60,000
|
$23.93
|
60,000
|
|||||
|
November 1-30, 2014
|
414,700
|
25.00
|
414,700
|
|||||
|
December 1-31, 2014
|
356,200
|
23.19
|
356,200
|
|||||
|
Total
|
6,062,657
(1)
|
|||||||
|
(1)
|
On April 24, 2014, we announced a share repurchase program approved by the board of directors for the purchase of up to 8 million shares of common stock that will terminate on April 24, 2017. Through December 31,
2014
,
1,937,343
shares had been repurchased, and
6,062,657
shares remained available for purchase under this program.
|
18
Performance Graph
This graph compares the total shareholder return on our common stock with the cumulative total return of the Standard & Poor’s 1000 Index (the “S&P 1000”), our current peer group (the “Peer Group B”) and our prior peer group (the “Peer Group A”). Peer Group A consists of six companies comprised of: ATK, Axiall, Dow, Oxy, PPG Industries, Inc. and Westlake Chemical Corporation. Peer Group B consists of five companies comprised of: ATK, Axiall, Dow, Oxy and Westlake Chemical Corporation.
Our board adjusted the peer group to better reflect companies that are in our current line of business. PPG Industries, Inc. was removed from Peer Group B as they have divested from their commodity chemicals business. Our board believes that the current peer group provides a better and more accurate basis to compare our performance, as the compensation committee uses our peer group for certain benchmarks in executive compensation.
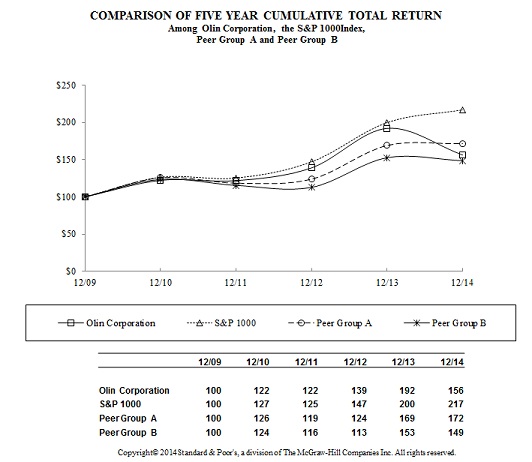
Data is for the five-year period from December 31, 2009 through December 31, 2014. The cumulative return includes reinvestment of dividends. The Peer Groups are weighted in accordance with market capitalization (closing stock price multiplied by the number of shares outstanding) as of the beginning of each of the five years covered by the performance graph. We calculated the weighted return for each year by multiplying (a) the percentage that each corporation’s market capitalization represented of the total market capitalization for all corporations in the Peer Groups for such year by (b) the total shareholder return for that corporation for such year.
19
TEN-YEAR SUMMARY
|
|
2014
|
2013
|
2012
|
2011
|
2010
|
2009
|
2008
|
2007
|
2006
|
2005
|
||||||||||||||||||||||||||||||
|
Operations
|
($ and shares in millions, except per share data)
|
|||||||||||||||||||||||||||||||||||||||
|
Sales
|
$
|
2,241
|
|
$
|
2,515
|
|
$
|
2,185
|
|
$
|
1,961
|
|
$
|
1,586
|
|
$
|
1,532
|
|
$
|
1,765
|
|
$
|
1,277
|
|
$
|
1,040
|
|
$
|
955
|
|
||||||||||
|
Cost of goods sold
|
1,853
|
|
2,034
|
|
1,748
|
|
1,574
|
|
1,350
|
|
1,223
|
|
1,377
|
|
1,035
|
|
792
|
|
682
|
|
||||||||||||||||||||
|
Selling and administration
|
170
|
|
190
|
|
177
|
|
161
|
|
134
|
|
135
|
|
137
|
|
129
|
|
129
|
|
128
|
|
||||||||||||||||||||
|
Restructuring charges
|
(16
|
)
|
(6
|
)
|
(9
|
)
|
(11
|
)
|
(34
|
)
|
—
|
|
—
|
|
—
|
|
—
|
|
—
|
|
||||||||||||||||||||
|
Other operating income
|
2
|
|
1
|
|
8
|
|
9
|
|
2
|
|
9
|
|
1
|
|
2
|
|
7
|
|
9
|
|
||||||||||||||||||||
|
Earnings of non-consolidated affiliates
|
2
|
|
3
|
|
3
|
|
10
|
|
30
|
|
38
|
|
39
|
|
46
|
|
45
|
|
37
|
|
||||||||||||||||||||
|
Interest expense
|
44
|
|
39
|
|
26
|
|
30
|
|
25
|
|
12
|
|
13
|
|
22
|
|
20
|
|
20
|
|
||||||||||||||||||||
|
Interest and other income (expense)
|
1
|
|
—
|
|
(10
|
)
|
176
|
|
2
|
|
1
|
|
(20
|
)
|
12
|
|
12
|
|
20
|
|
||||||||||||||||||||
|
Income before taxes from continuing operations
|
163
|
|
250
|
|
226
|
|
380
|
|
77
|
|
210
|
|
258
|
|
151
|
|
163
|
|
191
|
|
||||||||||||||||||||
|
Income tax provision
|
58
|
|
71
|
|
76
|
|
138
|
|
12
|
|
74
|
|
100
|
|
50
|
|
39
|
|
74
|
|
||||||||||||||||||||
|
Income from continuing operations
|
105
|
|
179
|
|
150
|
|
242
|
|
65
|
|
136
|
|
158
|
|
101
|
|
124
|
|
117
|
|
||||||||||||||||||||
|
Discontinued operations, net
|
1
|
|
—
|
|
—
|
|
—
|
|
—
|
|
—
|
|
—
|
|
(110
|
)
|
26
|
|
21
|
|
||||||||||||||||||||
|
Cumulative effect of accounting changes, net
|
—
|
|
—
|
|
—
|
|
—
|
|
—
|
|
—
|
|
—
|
|
—
|
|
—
|
|
(5
|
)
|
||||||||||||||||||||
|
Net income (loss)
|
$
|
106
|
|
$
|
179
|
|
$
|
150
|
|
$
|
242
|
|
$
|
65
|
|
$
|
136
|
|
$
|
158
|
|
$
|
(9
|
)
|
$
|
150
|
|
$
|
133
|
|
||||||||||
|
Financial position
|
|
|
|
|
|
|
|
|
|
|||||||||||||||||||||||||||||||
|
Cash and cash equivalents, short-term investments and restricted cash
|
$
|
257
|
|
$
|
312
|
|
$
|
177
|
|
$
|
357
|
|
$
|
561
|
|
$
|
459
|
|
$
|
247
|
|
$
|
333
|
|
$
|
276
|
|
$
|
304
|
|
||||||||||
|
Working capital, excluding cash and cash equivalents and short-term investments
|
182
|
|
125
|
|
150
|
|
76
|
|
33
|
|
91
|
|
24
|
|
(14
|
)
|
223
|
|
191
|
|
||||||||||||||||||||
|
Property, plant and equipment, net
|
931
|
|
988
|
|
1,034
|
|
885
|
|
675
|
|
695
|
|
630
|
|
504
|
|
251
|
|
227
|
|
||||||||||||||||||||
|
Total assets
|
2,698
|
|
2,803
|
|
2,778
|
|
2,450
|
|
2,049
|
|
1,932
|
|
1,720
|
|
1,731
|
|
1,642
|
|
1,802
|
|
||||||||||||||||||||
|
Capitalization:
|
|
|
|
|
|
|
|
|
|
|||||||||||||||||||||||||||||||
|
Short-term debt
|
16
|
|
13
|
|
24
|
|
12
|
|
78
|
|
—
|
|
—
|
|
10
|
|
2
|
|
1
|
|
||||||||||||||||||||
|
Long-term debt
|
659
|
|
678
|
|
690
|
|
524
|
|
418
|
|
398
|
|
252
|
|
249
|
|
252
|
|
257
|
|
||||||||||||||||||||
|
Shareholders’ equity
|
1,013
|
|
1,101
|
|
998
|
|
986
|
|
830
|
|
822
|
|
705
|
|
664
|
|
543
|
|
427
|
|
||||||||||||||||||||
|
Total capitalization
|
$
|
1,688
|
|
$
|
1,792
|
|
$
|
1,712
|
|
$
|
1,522
|
|
$
|
1,326
|
|
$
|
1,220
|
|
$
|
957
|
|
$
|
923
|
|
$
|
797
|
|
$
|
685
|
|
||||||||||
|
Per share data
|
|
|
|
|
|
|
|
|
|
|||||||||||||||||||||||||||||||
|
Basic:
|
|
|
|
|
|
|
|
|
|
|||||||||||||||||||||||||||||||
|
Continuing operations
|
$
|
1.33
|
|
$
|
2.24
|
|
$
|
1.87
|
|
$
|
3.02
|
|
$
|
0.82
|
|
$
|
1.74
|
|
$
|
2.08
|
|
$
|
1.36
|
|
$
|
1.70
|
|
$
|
1.65
|
|
||||||||||
|
Discontinued operations, net
|
0.01
|
|
—
|
|
—
|
|
—
|
|
—
|
|
—
|
|
—
|
|
(1.48
|
)
|
0.36
|
|
0.30
|
|
||||||||||||||||||||
|
Accounting changes, net
|
—
|
|
—
|
|
—
|
|
—
|
|
—
|
|
—
|
|
—
|
|
—
|
|
—
|
|
(0.08
|
)
|
||||||||||||||||||||
|
Net income (loss)
|
$
|
1.34
|
|
$
|
2.24
|
|
$
|
1.87
|
|
$
|
3.02
|
|
$
|
0.82
|
|
$
|
1.74
|
|
$
|
2.08
|
|
$
|
(0.12
|
)
|
$
|
2.06
|
|
$
|
1.87
|
|
||||||||||
|
Diluted:
|
|
|
|
|
|
|
|
|
|
|||||||||||||||||||||||||||||||
|
Continuing operations
|
$
|
1.32
|
|
$
|
2.21
|
|
$
|
1.85
|
|
$
|
2.99
|
|
$
|
0.81
|
|
$
|
1.73
|
|
$
|
2.07
|
|
$
|
1.36
|
|
$
|
1.70
|
|
$
|
1.65
|
|
||||||||||
|
Discontinued operations, net
|
0.01
|
|
—
|
|
—
|
|
—
|
|
—
|
|
—
|
|
—
|
|
(1.48
|
)
|
0.36
|
|
0.29
|
|
||||||||||||||||||||
|
Accounting changes, net
|
—
|
|
—
|
|
—
|
|
—
|
|
—
|
|
—
|
|
—
|
|
—
|
|
—
|
|
(0.08
|
)
|
||||||||||||||||||||
|
Net income (loss)
|
$
|
1.33
|
|
$
|
2.21
|
|
$
|
1.85
|
|
$
|
2.99
|
|
$
|
0.81
|
|
$
|
1.73
|
|
$
|
2.07
|
|
$
|
(0.12
|
)
|
$
|
2.06
|
|
$
|
1.86
|
|
||||||||||
|
Common Cash Dividends
|
0.80
|
|
0.80
|
|
0.80
|
|
0.80
|
|
0.80
|
|
0.80
|
|
0.80
|
|
0.80
|
|
0.80
|
|
0.80
|
|
||||||||||||||||||||
|
Market price of common stock:
|
|
|
|
|
|
|
|
|
|
|||||||||||||||||||||||||||||||
|
High
|
29.28
|
|
29.52
|
|
23.48
|
|
27.16
|
|
22.39
|
|
19.79
|
|
30.39
|
|
24.53
|
|
22.65
|
|
25.35
|
|
||||||||||||||||||||
|
Low
|
20.43
|
|
21.29
|
|
18.40
|
|
16.11
|
|
14.35
|
|
8.97
|
|
12.52
|
|
15.97
|
|
14.22
|
|
16.65
|
|
||||||||||||||||||||
|
Year end
|
22.77
|
|
28.85
|
|
21.59
|
|
19.65
|
|
20.52
|
|
17.52
|
|
18.08
|
|
19.33
|
|
16.52
|
|
19.68
|
|
||||||||||||||||||||
|
Other
|
|
|
|
|
|
|
|
|
|
|||||||||||||||||||||||||||||||
|
Capital expenditures
|
$
|
72
|
|
$
|
91
|
|
$
|
256
|
|
$
|
201
|
|
$
|
85
|
|
$
|
138
|
|
$
|
180
|
|
$
|
76
|
|
$
|
62
|
|
$
|
63
|
|
||||||||||
|
Depreciation and amortization
|
139
|
|
135
|
|
111
|
|
99
|
|
87
|
|
72
|
|
70
|
|
48
|
|
38
|
|
36
|
|
||||||||||||||||||||
|
Common dividends paid
|
63
|
|
64
|
|
64
|
|
64
|
|
63
|
|
63
|
|
61
|
|
59
|
|
58
|
|
57
|
|
||||||||||||||||||||
|
Repurchases of common stock
|
65
|
|
36
|
|
3
|
|
4
|
|
—
|
|
—
|
|
—
|
|
—
|
|
—
|
|
—
|
|
||||||||||||||||||||
|
Current ratio
|
2.2
|
|
2.1
|
|
1.7
|
|
2.0
|
|
2.3
|
|
2.8
|
|
1.7
|
|
1.8
|
|
2.2
|
|
2.3
|
|
||||||||||||||||||||
|
Total debt to total capitalization
|
40.0
|
%
|
38.6
|
%
|
41.7
|
%
|
35.2
|
%
|
37.4
|
%
|
32.6
|
%
|
26.4
|
%
|
28.1
|
%
|
31.8
|
%
|
37.7
|
%
|
||||||||||||||||||||
|
Effective tax rate
|
35.5
|
%
|
28.6
|
%
|
33.6
|
%
|
36.3
|
%
|
15.7
|
%
|
35.4
|
%
|
38.8
|
%
|
33.1
|
%
|
24.2
|
%
|
38.4
|
%
|
||||||||||||||||||||
|
Average common shares outstanding - diluted
|
79.7
|
|
80.9
|
|
81.0
|
|
80.8
|
|
79.9
|
|
78.3
|
|
76.1
|
|
74.3
|
|
72.8
|
|
71.6
|
|
||||||||||||||||||||
|
Shareholders
|
3,600
|
|
3,900
|
|
4,100
|
|
4,400
|
|
4,600
|
|
4,900
|
|
5,100
|
|
5,300
|
|
5,700
|
|
6,100
|
|
||||||||||||||||||||
|
Employees
(1)
|
3,900
|
|
4,100
|
|
4,100
|
|
3,800
|
|
3,700
|
|
3,700
|
|
3,600
|
|
3,600
|
|
3,100
|
|
2,900
|
|
||||||||||||||||||||
Our Selected Financial Data reflects the Metals business (sold in 2007) as discontinued operations. Since August 31, 2007, our Selected Financial Data reflects the Pioneer acquisition. Since February 28, 2011, our Selected Financial Data reflects the acquisition of the remaining 50% of the SunBelt Chlor Alkali Partnership, which we refer to as SunBelt. Since August 22, 2012, our Selected Financial Data reflects the acquisition of KA Steel.
|
(1)
|
Employee data exclude employees who worked at government-owned/contractor-operated facilities.
|
20
BUSINESS BACKGROUND
Our operations are concentrated in three business segments: Chlor Alkali Products, Chemical Distribution and Winchester. Chlor Alkali Products and Winchester are both capital intensive manufacturing businesses. Chlor Alkali Products operating rates are closely tied to the general economy. Each segment has a commodity element to it, and therefore, our ability to influence pricing is quite limited on the portion of the segment’s business that is strictly commodity. Our Chlor Alkali Products and Chemical Distribution businesses are commodity businesses where all supplier products are similar and price is the major supplier selection criterion. We have little or no ability to influence prices in this large, global commodity market. Cyclical price swings, driven by changes in supply/demand, can be abrupt and significant and, given capacity in our Chlor Alkali Products business, can lead to very significant changes in our overall profitability. Winchester also has a commodity element to its business, but a majority of Winchester ammunition is sold as a branded consumer product where there are opportunities to differentiate certain offerings through innovative new product development and enhanced product performance. While competitive pricing versus other branded ammunition products is important, it is not the only factor in product selection.
RECENT DEVELOPMENTS AND HIGHLIGHTS
2014 Year
In 2014, Chlor Alkali Products’ segment income was
$130.1 million
compared to
$203.8 million
in 2013. Chlor Alkali Products’ segment income was lower than the prior year as a result of lower product prices, predominantly caustic soda, and decreased chlorine and caustic soda volumes. These decreases were partially offset by decreased operating costs, primarily related to cost reduction efforts that were implemented during 2014 and increased shipments of hydrochloric acid and potassium hydroxide. Operating rates in Chlor Alkali Products were 80% in 2014 and 84% in 2013. The lower operating rate in 2014 was affected by planned and unplanned customer outages in the second half of 2014.
Our 2014 ECU netbacks of approximately $505 were 10% lower than the 2013 ECU netbacks of approximately $560 due to lower caustic soda prices. In the first quarter of 2014, we announced a chlorine price increase of $50 per ton and a caustic soda price increase of $50 per ton, which included the reinstatement of the fourth quarter of 2013 $40 per ton caustic soda price increase. The 2014 chlorine price increase was not successful. In the second quarter of 2014, we announced an additional $60 per ton caustic soda price increase. Neither of these caustic soda price increases were successful. In the third quarter of 2014, an additional caustic soda price increase was announced for $30 per ton. In the fourth quarter of 2014, the caustic soda price indices increased a total of $30 per ton. The benefit of this increase should impact the first quarter of 2015 results. Also in the fourth quarter of 2014, an additional caustic soda price increase was announced for $40 per ton. In January 2015, a chlorine price increase of $75 per ton was announced. While the success of the first quarter 2015 chlorine price increase and the fourth quarter 2014 caustic soda price increase are not yet known, the majority of the benefit, if realized, would impact second quarter 2015 results. ECU netbacks in the first quarter of 2015 are forecast to be higher than the fourth quarter of 2014 ECU netbacks of approximately $490 as a result of higher chlorine and caustic soda prices.
Chemical Distribution segment income was breakeven in 2014 compared to
$9.7 million
in 2013. Chemical Distribution segment income was lower than the prior year primarily due to decreased caustic soda volumes. Depreciation and amortization expense included in segment income for the years ended December 31, 2014 and 2013 of $15.8 million and $15.4 million, respectively, were primarily associated with the acquisition fair value adjustment related to the KA Steel acquisition.
Winchester segment income was
$127.3 million
in 2014, which represented the second highest level of segment income in at least the last two decades, compared to
$143.2 million
in 2013. The decrease in segment income compared to last year primarily reflects a lower level of demand for shotshell and rifle ammunition. The higher than historical commercial demand level that began in November 2012 continued through the second quarter of 2014. Beginning in the third quarter of 2014, Winchester began to experience a decline in commercial demand from the 2013 level. However, the second half of 2014 commercial demand remained stronger than 2011 levels. This decrease in demand was partially offset by improved selling prices and lower costs, including the impact of decreased costs associated with our new centerfire operation in Oxford, MS.
Income from discontinued operations, net for the year ended December 31, 2014 included an after tax gain of $0.7 million ($4.6 million pretax) for the favorable resolution of certain indemnity obligations related to our Metals business sold in 2007.
21
Financing
In August 2014, we redeemed our
$150.0 million
8.875%
senior notes (2019 Notes), which would have matured on August 15, 2019. We recognized interest expense of
$9.5 million
for the call premium and the write-off of unamortized deferred debt issuance costs and unamortized discount related to this action. We anticipate interest expense savings of approximately $10 million during the first year after the redemption of these notes.
On June 24, 2014, we entered into a new five-year $415.0 million senior credit facility consisting of a $265.0 million senior revolving credit facility, which replaced our previous $265.0 million senior revolving credit facility, and a $150.0 million delayed-draw term loan facility. In August 2014, we drew the entire $150.0 million of the term loan and used the proceeds to redeem our 2019 Notes. The new $415.0 million senior credit facility will expire in June 2019.
In December 2014, we repaid $12.2 million due under the annual requirements of the SunBelt Notes and $0.9 million due under the required quarterly installments of the $150.0 million term loan facility.
During 2014, we repurchased and retired 2.5 million shares with a total value of $64.8 million.
Restructurings
On December 12, 2014, we announced that we had made the decision to permanently close the portion of the Becancour, Canada chlor alkali facility that has been shut down since late June 2014. This action reduces the facility’s chlor alkali capacity by
185,000
tons. The plant will now predominantly focus on bleach and hydrochloric acid, which are value-added products, as well as caustic soda. In the fourth quarter of 2014, we recorded pretax restructuring charges of
$10.0 million
for the write-off of equipment and facility costs, employee severance and related benefit costs, lease and other contract termination costs and a non-cash pension curtailment charge related to these actions. We expect to incur additional restructuring charges through 2016 of approximately
$5 million
related to the shut down of this portion of the facility.
On December 9, 2010, our board of directors approved a plan to eliminate our use of mercury in the manufacture of chlor alkali products. Under the plan, the 260,000 tons of mercury cell capacity at our Charleston, TN facility was converted to 200,000 tons of membrane capacity capable of producing both potassium hydroxide and caustic soda. The board of directors also approved plans to reconfigure our Augusta, GA facility to manufacture bleach and distribute caustic soda, while discontinuing chlor alkali manufacturing at this site. The completion of these projects eliminated our chlor alkali production using mercury cell technology. For the years ended December 31,
2014
,
2013
and
2012
, we recorded pretax restructuring charges of
$3.8 million
,
$3.7 million
and
$2.3 million
, respectively, for employee severance and related benefit costs, employee relocation costs, facility exit costs, write-off of equipment and facility costs and lease and other contract termination costs related to these actions.
On November 3, 2010, we announced that we had made the decision to relocate the Winchester centerfire pistol and rifle ammunition manufacturing operations from East Alton, IL to Oxford, MS. This relocation, when completed, is forecast to reduce Winchester’s annual operating costs by approximately
$35 million
to
$40 million
. We expect the centerfire relocation project to generate Winchester operating cost savings of approximately $30 million in 2015. Consistent with this relocation decision in 2010, we initiated an estimated $110 million five-year project, which includes approximately $80 million of capital spending. The capital spending was partially financed by $31 million of grants provided by the State of Mississippi and local governments. In October 2011, we opened the new centerfire pistol and rifle production facility in Oxford, MS and, during 2013, the relocation of the centerfire pistol manufacturing equipment was completed. During 2014, the centerfire rifle manufacturing equipment was in the process of being relocated, and by December 1, 2014, all commercial centerfire rifle ammunition was manufactured in Oxford, MS. During
2014
, all of Winchester’s centerfire pistol ammunition and approximately 55% of Winchester’s centerfire rifle ammunition was manufactured in Oxford, MS. We currently expect to complete this relocation by the end of 2016. Once completed, Winchester expects to have the most modern centerfire ammunition production facility in North America. For the years ended December 31,
2014
,
2013
and
2012
, we recorded pretax restructuring charges of
$1.9 million
,
$1.8 million
and
$6.2 million
, respectively, for employee severance and related benefit costs, employee relocation costs and facility exit costs related to these actions. We expect to incur additional restructuring charges through 2016 of approximately
$3 million
related to the transfer of these operations.
22
2013 Year
In 2013, Chlor Alkali Products’ segment income was $203.8 million compared to $263.2 million in 2012. Chlor Alkali Products’ segment income in 2013 was lower than 2012 as a result of lower product prices, primarily hydrochloric acid and chlorine, and increased operating costs associated with planned maintenance outages, higher electricity costs primarily due to increased natural gas prices and higher depreciation expense. These decreases were partially offset by an $11.0 million favorable contract settlement. Operating rates in Chlor Alkali Products were 84% in 2013, which reflected the capacity reductions that occurred in fourth quarter of 2012, and 80% in 2012.
Our 2013 ECU netbacks of approximately $560 were 3% lower than the 2012 ECU netbacks of approximately $575 due to lower chlorine prices partially offset by higher caustic soda prices. In the first quarter of 2013, a caustic soda price increase of $50 per ton was announced and a chlorine price increase of $60 per ton was announced. The 2013 chlorine price increase was not successful. In the second quarter of 2013, we announced an additional $40 per ton caustic soda price increase. In the third quarter of 2013, an additional caustic soda price increase was announced for $30 per ton. Finally in the fourth quarter of 2013, an additional caustic soda price increase was announced for $40 per ton. During 2013, caustic soda prices increased, but were more than offset by lower chlorine prices.
Chemical Distribution segment income was $9.7 million in 2013 compared to $4.5 million in 2012. Chemical Distribution segment income in 2013 was higher than 2012 as a result of the additional period of our ownership. Depreciation and amortization expense included in segment income for the years ended December 31, 2013 and 2012 of $15.4 million and $5.5 million, respectively, were primarily associated with the acquisition fair value adjustment related to the KA Steel acquisition.
Winchester segment income of $143.2 million in 2013, which represented the highest level of segment income in at least the last two decades, improved 159% compared to 2012 segment income of $55.2 million. The increase in segment income in 2013 compared to 2012 reflects the impact of increased volumes due to the continuation of the stronger than historical demand that began in the fourth quarter of 2012, improved selling prices and decreased costs, including the impact of decreased costs associated with our new centerfire operation in Oxford, MS.
Other income (expense) in 2013 included a gain of $6.5 million on the sale of our equity interest in a limited liability company that owns a bleach related chemical manufacturing facility (bleach joint venture).
Income tax provision for 2013 included $11.4 million of favorable adjustments associated with the expiration of the statutes of limitations in federal and state jurisdictions, $8.3 million of benefit associated with reductions in valuation allowances on our capital loss carryforwards and $1.9 million of benefit associated with the Research Credit under Section 41 of the U.S. Internal Revenue Code (Research Credit), which were partially offset by $1.8 million of expense associated with changes in tax contingencies and $1.3 million of expense associated with increases in valuation allowances on certain state tax credits carryforwards.
During 2013, we entered into sale/leaseback agreements for bleach trailers and chlorine, caustic soda and bleach railcars. We received proceeds from the sales of $35.8 million.
In December 2013, we repaid $12.2 million due under the annual requirements of the SunBelt Notes. In January 2013, we also repaid the $11.4 million 6.5% Senior Notes (2013 Notes), which became due. These were redeemed using cash.
During 2013, we repurchased and retired 1.5 million shares with a total value of $36.2 million under the share repurchase plan approved by our board of directors on July 21, 2011.
2012 Year
KA Steel Acquisition
On August 22, 2012, we acquired 100% of privately-held KA Steel, on a debt free basis, for $336.6 million in cash, after receiving the final working capital adjustment of $1.9 million. As of the date of acquisition, KA Steel had cash and cash equivalents of $26.2 million. KA Steel is one of the largest distributors of caustic soda in North America and manufactures and sells bleach in the Midwest. As part of the acquisition, we expensed $8.3 million of acquisition costs during 2012.
23
For segment reporting purposes, KA Steel comprises the Chemical Distribution segment. Our results for the year ended December 31, 2012 included KA Steel sales of $156.3 million and $4.5 million of segment income, which included depreciation and amortization expense of $5.5 million, primarily associated with the acquisition fair value adjustment related to the KA Steel acquisition.
As a result of acquiring KA Steel, we expect synergies to be realized by the Chemical Distribution and Chlor Alkali Products segments. These synergies include opportunities to sell additional volumes of products we produce such as caustic soda, bleach, hydrochloric acid and potassium hydroxide through KA Steel and to optimize freight cost and logistics assets between our Chlor Alkali Products segment and KA Steel. Also, under the terms of the acquisition, both parties agreed to make an election under Section 338(h)(10) of the U.S. Internal Revenue Code (U.S. IRC) that is expected to result in cash tax benefits to us that have a net present value of approximately $60 million as of August 22, 2012.
Financing
In August 2012, we sold $200.0 million of 5.5% senior notes (2022 Notes) with a maturity of August 15, 2022. The 2022 Notes were issued at par value. Interest is paid semi-annually on February 15 and August 15. The acquisition of KA Steel was partially financed with proceeds of $196.0 million, after expenses of $4.0 million, from the 2022 Notes.
In June 2012, we redeemed $7.7 million of industrial development and environmental improvement tax-exempt bonds (industrial revenue bonds) due in 2017. We paid a premium of $0.2 million to the bond holders, which was included in interest expense. We also recognized a $0.2 million deferred gain in interest expense related to the interest rate swaps, which were terminated in March 2012, on these industrial revenue bonds. In December 2012, we repaid $12.2 million due under the annual requirements of the SunBelt Notes.
Other Highlights
In 2012, Chlor Alkali Products’ segment income was $263.2 million, an increase of 7% compared to 2011. Segment income in 2012 was higher than 2011 as a result of higher product prices and the ownership of SunBelt for the full period. These increases were partially offset by decreased chlorine and caustic soda volumes. Operating rates in Chlor Alkali Products for 2012 and 2011 were 80%.
Our 2012 ECU netbacks of approximately $575 were 1% higher than the 2011 ECU netbacks of approximately $570 due to higher caustic soda prices partially offset by lower chlorine prices. In the first quarter of 2012, a caustic soda price increase was announced of $45 per ton and a chlorine price increase was announced of $40 per ton. The 2012 chlorine price increase was not successful. In the second quarter of 2012, we announced an additional $60 per ton caustic soda price increase. In the third quarter of 2012, an additional caustic soda price increase was announced of $70 per ton. Finally, in the fourth quarter of 2012, an additional caustic soda price increase was announced for $50 per ton. During 2012, caustic soda prices increased, but were partially offset by lower chlorine prices.
Winchester segment income was $55.2 million in 2012 compared to $37.9 million in 2011. The increase in segment income compared to 2011 reflects the impact of higher selling prices and increased volumes, partially offset by higher operating costs and incremental costs associated with the ongoing relocation of our centerfire ammunition manufacturing operations to Oxford, MS.
Other operating income in 2012 included $4.9 million of insurance recoveries for business interruption related to an outage of one of our Chlor Alkali customers in the first half of 2012.
Income tax provision for 2012 included a $6.6 million benefit associated with the Agricultural Chemicals Security Tax Credit under Section 45O of the U.S. IRC (Section 45O), which were partially offset by $3.6 million of tax expense associated with remeasurement of deferred taxes, changes in tax contingencies and tax expense associated with previously undistributed earnings from our Winchester Australia Limited subsidiary.
Capital spending of $255.7 million for 2012 included $108.1 million for the conversion of our Charleston, TN facility from mercury cell technology to membrane technology, $58.6 million for the construction of low salt, high strength bleach facilities at our McIntosh, AL; Henderson, NV; and Niagara Falls, NY chlor alkali sites and $16.1 million for the ongoing relocation of our Winchester centerfire ammunition manufacturing operations. The conversion of our Charleston, TN facility was completed in the second half of 2012 with the successful start-up of two new membrane cell lines and we also completed low salt, high strength bleach facilities at McIntosh, AL and Niagara Falls, NY in the first and third quarters of 2012, respectively.
24
CHLOR ALKALI PRODUCTS PRICING
In accordance with industry practice, we calculate Chlor Alkali Products’ prices on an ECU netbacks basis, reporting and analyzing prices net of the cost of transporting the products to customers to allow for a comparable means of price comparisons between periods and with respect to our competitors. For purposes of determining our ECU netbacks, we use prices that we realize as a result of sales of chlorine and caustic soda to our customers, and we do not include the value of chlorine and caustic soda that is incorporated in other products that we manufacture and sell.
Quarterly and annual average ECU netbacks for
2014
,
2013
and
2012
were as follows:
|
2014
|
2013
|
2012
|
|||||||||
|
First quarter
|
$
|
520
|
|
$
|
565
|
|
$
|
585
|
|
||
|
Second quarter
|
510
|
|
575
|
|
575
|
|
|||||
|
Third quarter
|
505
|
|
570
|
|
560
|
|
|||||
|
Fourth quarter
|
490
|
|
525
|
|
580
|
|
|||||
|
Annual average
|
505
|
|
560
|
|
575
|
|
|||||
Our 2012 ECU netbacks of approximately $575 were 1% higher than the 2011 ECU netbacks of approximately $570 due to higher caustic soda prices partially offset by lower chlorine prices. In the first quarter of 2012, a caustic soda price increase was announced of $45 per ton and a chlorine price increase was announced totaling $40 per ton. The 2012 chlorine price increase was not successful. In the second quarter of 2012, we announced an additional $60 per ton caustic soda price increase. In the third quarter of 2012, an additional caustic soda price increase was announced of $70 per ton. Finally, in the fourth quarter of 2012, an additional caustic soda price increase was announced for $50 per ton. During 2012, caustic soda prices increased, but were partially offset by lower chlorine prices.
Our 2013 ECU netbacks of approximately $560 were 3% lower than the 2012 ECU netbacks of approximately $575 due to lower chlorine prices partially offset by higher caustic soda prices. In the first quarter of 2013, a caustic soda price increase of $50 per ton was announced and a chlorine price increase of $60 per ton was announced. The 2013 chlorine price increase was not successful. In the second quarter of 2013, we announced an additional $40 per ton caustic soda price increase. In the third quarter of 2013, an additional caustic soda price increase was announced for $30 per ton. Finally in the fourth quarter of 2013, an additional caustic soda price increase was announced for $40 per ton. During 2013, caustic soda prices increased, but were more than offset by lower chlorine prices.
Our 2014 ECU netbacks of approximately $505 were 10% lower than the 2013 ECU netbacks of approximately $560 due to lower caustic soda prices. In the first quarter of 2014, we announced a chlorine price increase of $50 per ton and a caustic soda price increase of $50 per ton, which included the reinstatement of the fourth quarter of 2013 $40 per ton caustic soda price increase. The 2014 chlorine price increase was not successful. In the second quarter of 2014, we announced an additional $60 per ton caustic soda price increase. Neither of these caustic soda price increases were successful. In the third quarter of 2014, an additional caustic soda price increase was announced for $30 per ton. In the fourth quarter of 2014, the caustic soda price indices increased a total of $30 per ton. The benefit of this increase should impact the first quarter of 2015 results. Also in the fourth quarter of 2014, an additional caustic soda price increase was announced for $40 per ton. In January 2015, a chlorine price increase of $75 per ton was announced. While the success of the first quarter 2015 chlorine price increase and the fourth quarter 2014 caustic soda price increase are not yet known, the majority of the benefit, if realized, would impact second quarter 2015 results. ECU netbacks in the first quarter of 2015 are forecast to be higher than the fourth quarter of 2014 ECU netbacks of approximately $490 as a result of higher chlorine and caustic soda prices.
25
PENSION AND POSTRETIREMENT BENEFITS
Under ASC 715, we recorded an after-tax charge of
$86.6 million
(
$142.0 million
pretax) to shareholders’ equity as of December 31, 2014 for our pension and other postretirement plans. This charge reflected a
60
-basis point decrease in the plans’ discount rate and the negative impact of the newly mandated mortality tables, partially offset by favorable performance on plan assets during
2014
. Our benefit obligation as of December 31, 2014 increased approximately $90 million pretax as a result of the newly mandated mortality tables. In 2013, we recorded an after-tax charge of $7.7 million ($12.5 million pretax) to shareholders’ equity as of December 31, 2013 for our pension and other postretirement plans. This charge reflected unfavorable performance on plan assets during 2013, partially offset by a 60-basis point increase in the plans’ discount rate. In 2012, we recorded an after-tax charge of $101.9 million ($166.8 million pretax) to shareholders’ equity as of December 31, 2012 for our pension and other postretirement plans. This charge reflected a 100-basis point decrease in the plans’ discount rate, partially offset by the favorable performance on plan assets during 2012. The non-cash charges to shareholders’ equity do not affect our ability to borrow under our senior credit facility.
During the fourth quarter of 2014, the SOA issued the final report of its mortality tables and mortality improvement scales. The updated mortality data reflected increasing life expectancies in the United States. During the third quarter of 2012, the MAP-21 became law. The new law changes the mechanism for determining interest rates to be used for calculating minimum defined benefit pension plan funding requirements. Interest rates are determined using an average of rates for a 25-year period, which can have the effect of increasing the annual discount rate, reducing the defined benefit pension plan obligation, and potentially reducing or eliminating the minimum annual funding requirement. The new law also increased premiums paid to the PBGC. During the third quarter of 2014, HATFA 2014 became law, which includes an extension of MAP-21’s defined benefit plan funding stabilization relief. Based on our plan assumptions and estimates, we will not be required to make any cash contributions to the domestic qualified defined benefit pension plan at least through
2015
and under the new law may not be required to make any additional contributions for at least the next five years. We do have a small Canadian qualified defined benefit pension plan to which we made cash contributions of
$0.8 million
in 2014, $1.0 million in 2013, and
$0.9 million
in 2012, and we anticipate approximately
$1 million
of cash contributions in
2015
. At December 31,
2014
, the projected benefit obligation of
$2,117.4 million
exceeded the market value of assets in our qualified defined benefit pension plans by
$138.7 million
, as calculated under ASC 715.
Components of net periodic benefit (income) costs were:
|
|
Years ended December 31,
|
||||||||||
|
|
2014
|
2013
|
2012
|
||||||||
|
|
($ in millions)
|
||||||||||
|
Pension benefits
|
$
|
(25.0
|
)
|
$
|
(20.5
|
)
|
$
|
(21.1
|
)
|
||
|
Other postretirement benefits
|
6.6
|
|
7.5
|
|
7.4
|
|
|||||
In December 2014, we recorded a curtailment charge of $0.2 million associated with permanently closing a portion of the Becancour, Canada chlor alkali facility that has been shut down since late June 2014. This charge was included in restructuring charges for 2014.
The service cost and the amortization of prior service cost components of pension expense related to employees of the operating segments are allocated to the operating segments based on their respective estimated census data.
26
CONSOLIDATED RESULTS OF OPERATIONS
|
|
Years ended December 31,
|
||||||||||
|
|
2014
|
2013
|
2012
|
||||||||
|
|
($ in millions, except per share data)
|
||||||||||
|
Sales
|
$
|
2,241.2
|
|
$
|
2,515.0
|
|
$
|
2,184.7
|
|
||
|
Cost of goods sold
|
1,853.2
|
|
2,033.7
|
|
1,748.0
|
|
|||||
|
Gross margin
|
388.0
|
|
481.3
|
|
436.7
|
|
|||||
|
Selling and administration
|
170.4
|
|
190.0
|
|
168.6
|
|
|||||
|
Restructuring charges
|
15.7
|
|
5.5
|
|
8.5
|
|
|||||
|
Acquisition costs
|
—
|
|
—
|
|
8.3
|
|
|||||
|
Other operating income
|
1.5
|
|
0.7
|
|
7.6
|
|
|||||
|
Operating income
|
203.4
|
|
286.5
|
|
258.9
|
|
|||||
|
Earnings of non-consolidated affiliates
|
1.7
|
|
2.8
|
|
3.0
|
|
|||||
|
Interest expense
|
43.8
|
|
38.6
|
|
26.4
|
|
|||||
|
Interest income
|
1.3
|
|
0.6
|
|
1.0
|
|
|||||
|
Other income (expense)
|
0.1
|
|
(1.3
|
)
|
(11.3
|
)
|
|||||
|
Income from continuing operations before taxes
|
162.7
|
|
250.0
|
|
225.2
|
|
|||||
|
Income tax provision
|
57.7
|
|
71.4
|
|
75.6
|
|
|||||
|
Income from continuing operations
|
105.0
|
|
178.6
|
|
149.6
|
|
|||||
|
Income from discontinued operations, net
|
0.7
|
|
—
|
|
—
|
|
|||||
|
Net income
|
$
|
105.7
|
|
$
|
178.6
|
|
$
|
149.6
|
|
||
|
Net income per common share:
|
|
|
|
||||||||
|
Basic income per common share:
|
|||||||||||
|
Income from continuing operations
|
$
|
1.33
|
|
$
|
2.24
|
|
$
|
1.87
|
|
||
|
Income from discontinued operations, net
|
0.01
|
|
—
|
|
—
|
|
|||||
|
Net income
|
$
|
1.34
|
|
$
|
2.24
|
|
$
|
1.87
|
|
||
|
Diluted income per common share:
|
|||||||||||
|
Income from continuing operations
|
$
|
1.32
|
|
$
|
2.21
|
|
$
|
1.85
|
|
||
|
Income from discontinued operations, net
|
0.01
|
|
—
|
|
—
|
|
|||||
|
Net income
|
$
|
1.33
|
|
$
|
2.21
|
|
$
|
1.85
|
|
||
2014 Compared 2013
Sales for 2014 were $2,241.2 million compared to $2,515.0 million last year, a decrease of $273.8 million, or 11%. Chemical Distribution segment sales decreased by $112.6 million primarily due to lower caustic soda volumes and decreased caustic soda prices. Chlor Alkali Products sales decreased by $106.7 million primarily due to lower product prices, predominantly caustic soda, and decreased chlorine and caustic soda volumes, partially offset by increased shipments of hydrochloric acid and potassium hydroxide. Winchester sales decreased by $39.2 million primarily due to decreased shipments of shotshell and rifle ammunition, partially offset by increased shipments of pistol ammunition to domestic commercial customers. The decreased commercial volumes were partially offset by higher selling prices and increased shipments to international and other customers. Sales were also impacted by an increase in the elimination of intersegment sales between the Chlor Alkali Products segment and the Chemical Distribution segment of $15.3 million.
Gross margin decreased $93.3 million, or 19%, from 2013. Chlor Alkali Products gross margin decreased by $78.1 million, primarily due to lower product prices, predominantly caustic soda, and decreased chlorine and caustic soda volumes, which were partially offset by decreased operating costs and increased shipments of hydrochloric acid and potassium hydroxide. Winchester gross margin was lower by $14.2 million primarily due to decreased shipments of shotshell and rifle ammunition to domestic commercial customers, which was partially offset by higher selling prices. Chemical Distribution gross margin was lower by $7.9 million primarily due to decreased caustic soda volumes. Gross margin as a percentage of sales was 17% in 2014 and 19% in 2013.
27
Selling and administration expenses in 2014 decreased $19.6 million, or 10%, from 2013, primarily due to decreased management incentive compensation expense of $18.1 million, which includes mark-to-market adjustments on stock-based compensation, decreased legal and legal-related settlement expenses of $15.5 million and decreased non-income tax expense of $3.7 million. These decreases were partially offset by the recovery of legacy legal costs of $13.9 million during 2013 and increased consulting fees of $3.9 million. Selling and administration expenses as a percentage of sales were 8% in both 2014 and 2013.
Restructuring charges in 2014 included $10.0 million associated with permanently closing a portion of the Becancour, Canada chlor alkali facility. Restructuring charges in 2014 and 2013 also included $5.7 million and $5.5 million, respectively, associated with exiting the use of mercury cell technology in the chlor alkali manufacturing process and the ongoing relocation of our Winchester centerfire ammunition manufacturing operations from East Alton, IL to Oxford, MS.
Other operating income in 2014 included a gain of $1.0 million for the resolution of a contract matter. Other operating income in 2013 included a gain of $1.5 million on the sale of two former manufacturing sites.
Interest expense increased by $5.2 million in 2014, primarily due to the call premium and the write-off of unamortized deferred debt issuance costs and unamortized discount of $9.5 million associated with the redemption of the 2019 Notes and a decrease in capitalized interest of $0.9 million primarily due to the completion of the low salt, high strength bleach facility and hydrochloric acid expansion project at our Henderson, NV chlor alkali site in the first quarter of 2013. These increases were partially offset by lower interest rates.
Other income (expense) in 2013 included $7.9 million of expense for our earn out liability from the SunBelt acquisition and a gain of $6.5 million on the sale of our equity interest in a bleach joint venture.
The effective tax rate from continuing operations for 2014 included $1.2 million of benefit associated with the return to provision adjustment for the finalization of our 2013 U.S. federal and state income tax returns and $0.7 million of benefit associated with the expiration of the statutes of limitations in federal and state jurisdictions. These items were partially offset by $0.8 million of expense associated with increases in valuation allowances on certain state tax credit balances primarily associated with a change in state tax law and $0.6 million of expense related to the remeasurement of deferred taxes due to an increase in state effective tax rates. After giving consideration to these four items of $0.5 million, the effective tax rate from continuing operations for 2014 of 35.8% was slightly higher than the 35% U.S. federal statutory rate, primarily due to state income taxes net of utilization of certain state tax credits, partially offset by favorable permanent tax deduction items, such as the domestic manufacturing deduction and tax deductible dividends paid to the Contributing Employee Ownership Plan (CEOP). The effective tax rate from continuing operations for 2013 included $11.4 million of benefit associated with the expiration of the statutes of limitations in federal and state jurisdictions, $8.3 million of benefit associated with reductions in valuation allowances on our capital loss carryforwards and $1.9 million of benefit associated with the Research Credit. These items were partially offset by $1.8 million of expense associated with changes in tax contingencies and $1.3 million of expense associated with increases in valuation allowances on certain state tax credit carryforwards. After giving consideration to these five items of $18.5 million, the effective tax rate from continuing operations for 2013 of 36.0% was slightly higher than the 35% U.S. federal statutory rate, primarily due to state income taxes net of utilization of certain state tax credits, partially offset by favorable permanent tax deduction items, such as the domestic manufacturing deduction and tax deductible dividends paid to the CEOP.
Income from discontinued operations, net for the year ended December 31, 2014 included an after tax gain of $0.7 million ($4.6 million pretax) for the favorable resolution of certain indemnity obligations related to our Metals business sold in 2007.
2013 Compared 2012
Sales for 2013 were $2,515.0 million compared to $2,184.7 million in 2012, an increase of $330.3 million, or 15%. Chemical Distribution segment sales increased by $250.1 million due to the additional period of our ownership. Winchester sales increased by $160.0 million, or 26%, from 2012 primarily due to increased shipments to domestic commercial and law enforcement customers and higher selling prices, partially offset by lower shipments to military and international customers. These increases were partially offset by an increase in the elimination of intersegment sales between the Chlor Alkali Products segment and the Chemical Distribution segment of $63.2 million and a decrease in Chlor Alkali Products’ sales of $16.6 million, or 1%, primarily due to lower product prices, primarily hydrochloric acid and chlorine. Our 2013 ECU netbacks decreased 3% compared to 2012.
28
Gross margin increased $44.6 million, or 10%, from 2012, primarily as a result of increased Winchester gross margin of $91.6 million, primarily due to increased shipments to domestic commercial customers and improved selling prices, and additional gross margin contributed by the Chemical Distribution segment of $12.2 million due to the additional period of our ownership. These increases were partially offset by lower Chlor Alkali gross margin of $61.3 million, primarily due to lower product prices, primarily hydrochloric acid and chlorine, and higher operating costs associated with planned maintenance outages, higher electricity costs primarily due to increased natural gas prices and higher depreciation expense. These decreases were partially offset by a favorable contract settlement. Gross margin as a percentage of sales was 19% in 2013 and 20% in 2012.
Selling and administration expenses in 2013 increased $21.4 million, or 13%, from 2012, primarily due to increased legal and legal-related settlement expenses of $11.4 million, primarily associated with cost recovery actions, increased management incentive compensation expense of $11.1 million, which includes mark-to-market adjustments on stock-based compensation of $5.4 million, increased selling and administration expenses of the acquired KA Steel operations of $7.0 million and increased salary and benefit costs of $4.1 million. These increases were partially offset by the recovery of legacy legal costs of $13.9 million. Selling and administration expenses as a percentage of sales were 8% in 2013 and 2012.
Restructuring charges in 2013 and 2012 of $5.5 million and $8.5 million, respectively, were associated with exiting the use of mercury cell technology in the chlor alkali manufacturing process and the ongoing relocation of our Winchester centerfire ammunition manufacturing operations from East Alton, IL to Oxford, MS.
Acquisition costs in 2012 were related to the acquisition of KA Steel.
Other operating income in 2013 included a gain of $1.5 million on the sale of two former manufacturing sites. Other operating income in 2012 included $4.9 million of insurance recoveries for business interruption related to an outage of one of our Chlor Alkali customers in the first half of 2012.
Interest expense increased by $12.2 million in 2013, primarily due to a higher level of debt outstanding and a decrease in capitalized interest of $6.3 million, primarily due to the completion of the Charleston, TN conversion project in the second half of 2012.
Other income (expense) in 2013 and 2012 included $7.9 million and $11.5 million, respectively, of expense for our earn out liability from the SunBelt acquisition. Other income (expense) in 2013 also included a gain of $6.5 million on the sale of our equity interest in a bleach joint venture.
The effective tax rate from continuing operations for 2013 included $11.4 million of benefit associated with the expiration of the statutes of limitations in federal and state jurisdictions, $8.3 million of benefit associated with reductions in valuation allowances on our capital loss carryforwards and $1.9 million of benefit associated with the Research Credit, which were partially offset by $1.8 million of expense associated with changes in tax contingencies and $1.3 million of expense associated with increases in valuation allowances on certain state tax credit carryforwards. After giving consideration to these five items of $18.5 million, the effective tax rate from continuing operations for 2013 of 36.0% was slightly higher than the 35% U.S. federal statutory rate, primarily due to state income taxes net of utilization of certain state tax credits, partially offset by favorable permanent tax deduction items, such as the domestic manufacturing deduction and tax deductible dividends paid to the CEOP. The effective tax rate from continuing operations for 2012 included a $6.6 million benefit associated with the Section 45O credits, partially offset by a $1.6 million expense associated with the remeasurement of deferred taxes, a $1.3 million expense associated with changes in tax contingencies and a $0.7 million expense associated with previously undistributed earnings from our Winchester Australia Limited subsidiary. After giving consideration to these four items of $3.0 million, the effective tax rate from continuing operations for 2012 of 34.9% was slightly lower than the 35% U.S. federal statutory rate, primarily due to favorable permanent tax deductions, such as the domestic manufacturing deduction and tax deductible dividends paid to the CEOP, which were partially offset by state income taxes net of utilization of certain state tax credits.
29
SEGMENT RESULTS
We define segment results as income (loss) from continuing operations before interest expense, interest income, other operating income, other income (expense) and income taxes, and include the results of non-consolidated affiliates. Consistent with the guidance in ASC 280 “Segment Reporting” (ASC 280), we have determined it is appropriate to include the operating results of non-consolidated affiliates in the relevant segment financial results. Intersegment sales of
$96.6 million
,
$81.3 million
and $18.1 million for the years ended December 31,
2014
,
2013
and 2012, respectively, have been eliminated. These represent the sale of caustic soda, bleach, potassium hydroxide and hydrochloric acid between Chemical Distribution and Chlor Alkali Products, at prices that approximate market.
|
|
Years ended December 31,
|
||||||||||
|
|
2014
|
2013
|
2012
|
||||||||
|
Sales:
|
($ in millions)
|
||||||||||
|
Chlor Alkali Products
|
$
|
1,305.6
|
|
$
|
1,412.3
|
|
$
|
1,428.9
|
|
||
|
Chemical Distribution
|
293.8
|
|
406.4
|
|
156.3
|
|
|||||
|
Winchester
|
738.4
|
|
777.6
|
|
617.6
|
|
|||||
|
Intersegment sales elimination
|
(96.6
|
)
|
(81.3
|
)
|
(18.1
|
)
|
|||||
|
Total sales
|
$
|
2,241.2
|
|
$
|
2,515.0
|
|
$
|
2,184.7
|
|
||
|
Income (loss) from continuing operations before taxes:
|
|
|
|
||||||||
|
Chlor Alkali Products
(1)
|
$
|
130.1
|
|
$
|
203.8
|
|
$
|
263.2
|
|
||
|
Chemical Distribution
|
—
|
|
9.7
|
|
4.5
|
|
|||||
|
Winchester
|
127.3
|
|
143.2
|
|
55.2
|
|
|||||
|
Corporate/Other:
|
|
|
|
||||||||
|
Pension income
(2)
|
32.4
|
|
26.6
|
|
27.2
|
|
|||||
|
Environmental expense
(3)
|
(8.2
|
)
|
(10.2
|
)
|
(8.3
|
)
|
|||||
|
Other corporate and unallocated costs
|
(62.3
|
)
|
(79.0
|
)
|
(70.7
|
)
|
|||||
|
Restructuring charges
(4)
|
(15.7
|
)
|
(5.5
|
)
|
(8.5
|
)
|
|||||
|
Acquisition costs
(5)
|
—
|
|
—
|
|
(8.3
|
)
|
|||||
|
Other operating income
(6)
|
1.5
|
|
0.7
|
|
7.6
|
|
|||||
|
Interest expense
(7)
|
(43.8
|
)
|
(38.6
|
)
|
(26.4
|
)
|
|||||
|
Interest income
|
1.3
|
|
0.6
|
|
1.0
|
|
|||||
|
Other income (expense)
(8)
|
0.1
|
|
(1.3
|
)
|
(11.3
|
)
|
|||||
|
Income from continuing operations before taxes
|
$
|
162.7
|
|
$
|
250.0
|
|
$
|
225.2
|
|
||
|
(1)
|
Earnings of non-consolidated affiliates are included in the Chlor Alkali Products segment results consistent with management’s monitoring of the operating segment. The earnings from non-consolidated affiliates were $1.7 million, $2.8 million and $3.0 million for the years ended 2014, 2013 and 2012, respectively. During October 2013, we sold our equity interest in a bleach joint venture.
|
|
(2)
|
The service cost and the amortization of prior service cost components of pension expense related to the employees of the operating segments are allocated to the operating segments based on their respective estimated census data. All other components of pension costs are included in corporate/other and include items such as the expected return on plan assets, interest cost and recognized actuarial gains and losses.
|
|
(3)
|
Environmental expense for the years ended 2014, 2013 and 2012 included $1.4 million, $1.3 million and $0.1 million, respectively, of recoveries from third parties for costs incurred and expensed in prior periods. Environmental expense is included in cost of goods sold in the consolidated statements of operations.
|
|
(4)
|
Restructuring charges for the year ended 2014 included $10.0 million associated with permanently closing a portion of the Becancour, Canada chlor alkali facility. Restructuring charges for the years ended 2014, 2013 and 2012 were also associated with exiting the use of mercury cell technology in the chlor alkali manufacturing process and the ongoing relocation of our Winchester centerfire ammunition manufacturing operations from East Alton, IL to Oxford, MS.
|
|
(5)
|
Acquisition costs in 2012 were related to the acquisition of KA Steel.
|
30
|
(6)
|
Other operating income for the year ended 2014 included a gain of $1.0 million for the resolution of a contract matter. Other operating income for the year ended 2013 included a gain of $1.5 million on the sale of two former manufacturing sites. Other operating income for the year ended 2012 included $4.9 million of insurance recoveries for business interruption related to an outage at one of our Chlor Alkali customers in the first half of 2012.
|
|
(7)
|
Interest expense for the year ended December 31, 2014 included
$9.5 million
for the call premium and the write-off of unamortized deferred debt issuance costs and unamortized discount associated with the redemption of our 2019 Notes, which would have matured on August 15, 2019. Interest expense was reduced by capitalized interest of $0.2 million, $1.1 million and $7.4 million for the years ended 2014, 2013 and 2012, respectively.
|
|
(8)
|
Other income (expense) for the years ended 2013 and 2012 included $7.9 million and $11.5 million, respectively, of expense for our earn out liability from the SunBelt acquisition. Other income (expense) for the year ended December 31, 2013 also included a gain of $6.5 million on the sale of our equity interest in a bleach joint venture.
|
Chlor Alkali Products
2014 Compared to 2013
Chlor Alkali Products’ sales for 2014 were $1,305.6 million compared to $1,412.3 million for 2013, a decrease of $106.7 million, or 8%. The sales decrease was primarily due to lower product prices ($73.5 million), predominantly caustic soda, and lower shipments of chlorine and caustic soda ($61.4 million). These decreases were partially offset by increased shipments of hydrochloric acid ($22.3 million) and potassium hydroxide ($11.4 million). Our ECU netbacks were approximately $505 for 2014 compared to approximately $560 for 2013. Our operating rates were 80% in 2014 and 84% in 2013. The lower operating rate in 2014 was affected by planned and unplanned customer outages in the second half of 2014. We discuss product prices in more detail above under “Chlor Alkali Products Pricing.”
Chlor Alkali Products generated segment income of $130.1 million for 2014 compared to $203.8 million for 2013, a decrease of $73.7 million. Chlor Alkali Products’ segment income was lower primarily due to lower product prices ($73.5 million), predominantly caustic soda, decreased volumes ($11.6 million), primarily chlorine and caustic soda, which were partially offset by increased shipments of hydrochloric acid and potassium hydroxide, and the recognition of a favorable contract settlement during 2013 ($11.0 million). These decreases were partially offset by lower operating costs ($22.4 million), primarily related to cost reduction efforts that were implemented during 2014.
2013 Compared to 2012
Chlor Alkali Products’ sales for 2013 were $1,412.3 million compared to $1,428.9 million for 2012, a decrease of $16.6 million, or 1%. The sales decrease was primarily due to lower product prices ($37.4 million), primarily hydrochloric acid and chlorine, lower shipments of chlorine and caustic soda ($5.9 million) and decreased shipments of hydrochloric acid ($4.8 million). These decreases were partially offset by increased shipments of potassium hydroxide ($16.6 million) and bleach ($12.7 million). Our ECU netbacks were approximately $560 for 2013 compared to approximately $575 for 2012. Freight costs included in the ECU netbacks increased 2% for 2013 compared to 2012, primarily due to higher railroad freight rates. Our operating rates were 84% in 2013, which reflected the capacity reductions that occurred in the fourth quarter of 2012, and 80% in 2012. We discuss product prices in more detail above under “Chlor Alkali Products Pricing.”
Chlor Alkali Products generated segment income of $203.8 million for 2013 compared to $263.2 million for 2012, a decrease of $59.4 million. Chlor Alkali Products’ segment income was lower primarily due to lower product prices ($49.2 million), primarily hydrochloric acid and chlorine, and increased operating costs ($25.0 million) associated with planned maintenance outages, higher electricity costs primarily due to increased natural gas prices and higher depreciation expense. These decreases were partially offset by a favorable contract settlement ($11.0 million) and increased volumes ($3.8 million).
31
Chemical Distribution
2014 Compared to 2013
Chemical Distribution sales were $293.8 million for 2014 compared to $406.4 million for 2013, a decrease of $112.6 million. The sales decrease was primarily due to lower caustic soda volumes ($80.4 million) and decreased caustic soda prices ($35.1 million). These decreases were partially offset by increased shipments of potassium hydroxide, hydrochloric acid and bleach ($5.5 million).
Chemical Distribution segment income was breakeven and $9.7 million for the years ended December 31, 2014 and 2013, respectively. Chemical Distribution segment income was lower than the prior year primarily as a result of decreased caustic soda volumes ($9.8 million). Depreciation and amortization expense included in segment income for the years ended December 31, 2014 and 2013 of $15.8 million and $15.4 million, respectively, were primarily associated with the acquisition fair value adjustment related to the KA Steel acquisition.
2013 Compared to 2012
Chemical Distribution sales were $406.4 million and $156.3 million for the years ended December 31, 2013 and 2012, respectively. Chemical Distribution segment income was $9.7 million and $4.5 million for the years ended December 31, 2013 and 2012, respectively. Chemical Distribution 2013 sales and segment income were higher than 2012 as a result of the additional period of our ownership. Depreciation and amortization expense included in segment income for the years ended December 31, 2013 and 2012 of $15.4 million and $5.5 million, respectively, were primarily associated with the acquisition fair value adjustment related to the KA Steel acquisition.
Winchester
2014 Compared to 2013
Winchester sales were $738.4 million for 2014 compared to $777.6 million for 2013, a decrease of $39.2 million, or 5%. Sales of ammunition to domestic commercial customers were lower ($61.8 million), primarily due to a lower level of demand for shotshell and rifle ammunition, partially offset by higher pistol ammunition. Beginning with the third quarter of 2014, Winchester began to experience a decline in commercial demand from the 2013 levels. This decrease was partially offset by increased shipments to international customers ($11.8 million), law enforcement agencies ($7.7 million), industrial customers ($2.4 million), who primarily supply the construction sector, and military customers ($0.7 million).
Winchester reported segment income of $127.3 million for 2014 compared to $143.2 million for 2013, a decrease of $15.9 million, or 11%. The decrease in segment income in 2014 compared to 2013 reflected the impact of decreased volumes ($29.6 million), primarily due to a lower level of demand for shotshell and rifle ammunition, and higher commodity and other material costs ($4.9 million). These decreases were partially offset by higher selling prices ($17.0 million) and lower operating costs ($1.6 million), which include the impact of decreased costs associated with the ongoing relocation of our centerfire ammunition manufacturing operations to Oxford, MS ($7.4 million).
2013 Compared to 2012
Winchester sales were $777.6 million for 2013 compared to $617.6 million for 2012, an increase of $160.0 million, or 26%. The increased sales were due to increased shipments to domestic commercial customers ($172.5 million) and law enforcement agencies ($12.1 million). These increases were partially offset by a reduction in shipments to military customers ($21.6 million) and reduced shipments to international customers ($3.7 million).
Winchester reported segment income of $143.2 million for 2013 compared to $55.2 million for 2012, an increase of $88.0 million, or 159%. The increase in segment income in 2013 compared to 2012 reflected the impact of increased volumes ($53.8 million), higher selling prices ($29.5 million), lower operating costs ($3.3 million), which include the impact of decreased costs associated with the ongoing relocation of our centerfire ammunition manufacturing operations to Oxford, MS ($16.7 million), and lower commodity and other material costs ($1.4 million).
32
Corporate/Other
2014 Compared to 2013
For 2014, pension income included in corporate/other was $32.4 million compared to $26.6 million for 2013. On a total company basis, defined benefit pension income for 2014 was $25.0 million compared to $20.5 million for 2013. Pension income for 2014 included a curtailment charge of $0.2 million associated with permanently closing a portion of the Becancour, Canada chlor alkali facility that has been shut down since late June 2014. This charge was included in restructuring charges for 2014.
Charges to income for environmental investigatory and remedial activities were $8.2 million for 2014 compared to $10.2 million for 2013, which included $1.4 million and $1.3 million, respectively, of recoveries from third parties for costs incurred and expensed in prior periods. Without these recoveries, charges to income for environmental investigatory and remedial activities would have been $9.6 million for 2014 compared to $11.5 million for 2013. These charges related primarily to expected future investigatory and remedial activities associated with past manufacturing operations and former waste disposal sites.
For 2014, other corporate and unallocated costs were $62.3 million compared to $79.0 million for 2013, a decrease of $16.7 million, or 21%. The decrease was primarily due to lower stock-based compensation expense of $13.9 million, which includes mark-to-market adjustments, decreased legal and legal-related settlement expenses of $11.2 million, decreased non-income tax expense of $3.7 million and lower insurance costs of $2.1 million. These decreases were partially offset by the recovery of legacy legal costs of $13.9 million during 2013.
2013 Compared to 2012
For 2013, pension income included in corporate/other was $26.6 million compared to $27.2 million for 2012. On a total company basis, defined benefit pension income for 2013 was $20.5 million compared to $21.1 million for 2012.
Charges to income for environmental investigatory and remedial activities were $10.2 million for 2013 compared to $8.3 million for 2012, which included $1.3 million and $0.1 million, respectively, of recoveries from third parties for costs incurred and expensed in prior periods. Without these recoveries, charges to income for environmental investigatory and remedial activities would have been $11.5 million for 2013 compared to $8.4 million for 2012. These charges related primarily to expected future investigatory and remedial activities associated with past manufacturing operations and former waste disposal sites.
For 2013, other corporate and unallocated costs were $79.0 million compared to $70.7 million for 2012, an increase of $8.3 million, or 12%. The increase was primarily due to increased legal and legal-related settlement expenses of $11.4 million, primarily associated with cost recovery actions, increased stock-based compensation of $9.1 million, which include mark-to-market adjustments of $5.4 million, higher consulting fees of $2.1 million and increased salary and benefit costs of $1.5 million. These increases were partially offset by the recovery of legacy legal costs of $13.9 million and lower asset retirement obligation and legacy site charges of $4.0 million.
2015 OUTLOOK
Net income in the first quarter of 2015 is projected to be in the $0.20 to $0.25 per diluted share range compared to $0.37 per diluted share in the first quarter of 2014.
In Chlor Alkali Products, the first quarter of 2015 segment income is expected to decline compared with the first quarter of 2014 income of $34.3 million. The expected decrease in segment income anticipates lower ECU pricing. The Chlor Alkali Products operating rate in the first quarter of 2015 is expected to be in the mid 80% range, which is similar to the fourth quarter of 2014 operating rate of 84%, after giving consideration to the closure of a portion of the Becancour, Canada chlor alkali facility. Chlor Alkali Products full year 2015 segment income is expected to improve compared to full year 2014 segment income of $130.1 million, primarily due to higher ECU pricing and higher hydrochloric acid, bleach and potassium hydroxide volumes.
33
Our 2014 ECU netbacks of approximately $505 were 10% lower than the 2013 ECU netbacks of approximately $560 due to lower caustic soda prices. In the fourth quarter of 2014, the caustic soda price indices increased a total of $30 per ton. The benefit of this increase should impact the first quarter of 2015 results. Also in the fourth quarter of 2014, an additional caustic soda price increase was announced for $40 per ton. In January 2015, a chlorine price increase of $75 per ton was announced. While the success of the first quarter 2015 chlorine price increase and the fourth quarter 2014 caustic soda price increase are not yet known, the majority of the benefit, if realized, would impact second quarter 2015 results. ECU netbacks in the first quarter of 2015 are forecast to be higher than the fourth quarter of 2014 ECU netbacks of approximately $490 as a result of higher chlorine and caustic soda prices.
Chemical Distribution first quarter 2015 segment income is expected to improve compared to the first quarter of 2014 segment loss of $0.8 million due to increased sales of Olin-produced hydrochloric acid and potassium hydroxide. Chemical Distribution full year 2015 segment income is expected to improve compared to full year 2014 breakeven results due to increased caustic soda, hydrochloric acid, bleach and potassium hydroxide volumes. As a result of the growth in co-product sales and the continued focus on improving the returns in caustic soda, we expect Chemical Distribution annual segment income to increase by approximately $15 million in the next two years. In addition to growth in Chemical Distribution segment income, we expect Chlor Alkali Products to realize $10 million to $15 million of additional annual benefits from producing co-products, as well as logistics and infrastructure cost savings.
Winchester first quarter 2015 segment income is expected to be lower than the $38.3 million of segment income achieved during the first quarter of 2014 but only slightly lower than the first quarter of 2013 of $31.3 million. The forecasted decline in segment income is due to an anticipated lower level of commercial demand, partially offset by lower operating costs associated with our new centerfire operation in Oxford, MS. During the fourth quarter, Winchester experienced a decline from the elevated level of commercial demand for pistol, shotshell and rifle ammunition that the Winchester business began to experience in early November 2012, while rimfire ammunition demand continued at record levels. Although the consumer demand for pistol, shotshell and rifle ammunition has declined compared to higher than historical levels, it remains strong. The Winchester commercial backlog on January 31, 2015 was $192.4 million compared to $423.0 million at January 31, 2014 and $37.6 million at January 31, 2012. Winchester full year 2015 segment income is expected to be higher than the full year 2014 segment income of $127.3 million, primarily due to lower operating costs associated with our new centerfire operation in Oxford, MS. Commercial ammunition shipments for the full year 2015 are expected to be similar to full year 2014.
In October 2011, Winchester opened the new centerfire production facility in Oxford, MS. During 2013, the relocation of the centerfire pistol manufacturing equipment was completed. During 2014, the relocation of the centerfire rifle manufacturing equipment continued to be relocated and started up. During the fourth quarter of 2014, all pistol ammunition and approximately 85% of all rifle ammunition was produced in Oxford. By December 1, 2014, all commercial rifle ammunition was being produced in Oxford. This relocation, which is projected to be completed in 2016, is forecast to reduce Winchester's annual operating costs by approximately $35 million to $40 million. We expect the centerfire relocation project to generate operating costs savings of approximately $30 million in 2015 compared to $24.1 million realized in 2014.
We anticipate that full year 2015 Other Corporate and Unallocated costs will increase compared with the full year 2014 Other Corporate and Unallocated costs of $62.3 million.
We anticipate that full year 2015 charges for environmental investigatory and remedial activities will be in the $15 million to $20 million range. We do not believe that there will be recoveries of environmental costs incurred and expensed in prior periods in 2015.
We expect defined benefit pension plan income in 2015 to be lower than the 2014 level due to the impact of the newly mandated mortality tables issued in the fourth quarter of 2014. Based on our plan assumptions and estimates, we will not be required to make any cash contributions to our domestic qualified defined benefit pension plan in 2015 and under the pension funding relief laws passed in 2012 and 2014, we may not be required to make any additional contributions for at least five years. We do have a small Canadian qualified defined benefit pension plan to which we anticipate cash contributions of approximately $1 million in 2015.
During 2015, we are anticipating pretax restructuring charges of approximately $6 million, primarily associated with the ongoing relocation of our Winchester centerfire ammunition manufacturing operations from East Alton, IL to Oxford, MS and the closure of a portion of the Becancour, Canada chlor alkali facility.
In 2015, we expect our capital spending to be in the $120 million to $130 million range, which includes spending for the ongoing relocation of our Winchester centerfire ammunition manufacturing operations. We expect 2015 depreciation and amortization expense to be in the $140 million to $145 million range.
34
We believe the 2015 effective tax rate will be in the 35% to 37% range.
ENVIRONMENTAL MATTERS
|
Years ended December 31,
|
|||||||||||
|
2014
|
2013
|
2012
|
|||||||||
|
Cash outlays (receipts):
|
($ in millions)
|
||||||||||
|
Remedial and investigatory spending (charged to reserve)
|
$
|
14.9
|
|
$
|
12.4
|
|
$
|
25.5
|
|
||
|
Recoveries from third parties
|
(1.4
|
)
|
(1.3
|
)
|
(0.1
|
)
|
|||||
|
Capital spending
|
2.7
|
|
0.9
|
|
1.5
|
|
|||||
|
Plant operations (charged to cost of goods sold)
|
24.2
|
|
25.4
|
|
25.1
|
|
|||||
|
Total cash outlays
|
$
|
40.4
|
|
$
|
37.4
|
|
$
|
52.0
|
|
||
Cash outlays for remedial and investigatory activities associated with former waste sites and past operations were not charged to income but instead were charged to reserves established for such costs identified and expensed to income in prior years. Cash outlays for normal plant operations for the disposal of waste and the operation and maintenance of pollution control equipment and facilities to ensure compliance with mandated and voluntarily imposed environmental quality standards were charged to income.
Total environmental-related cash outlays in 2014 were comparable to 2013. Total environmental-related cash outlays in 2013 decreased compared to 2012, primarily driven by the completion of a remedial action plan at a former waste disposal site in 2012. Total environmental-related cash outlays for
2015
are estimated to be approximately $50 million, of which approximately $20 million is expected to be spent on investigatory and remedial efforts, approximately $5 million on capital projects and approximately $25 million on normal plant operations. Remedial and investigatory spending is anticipated to be higher in
2015
than
2014
due to the timing of continuing remedial action plans and investigations. Historically, we have funded our environmental capital expenditures through cash flow from operations and expect to do so in the future.
Annual environmental-related cash outlays for site investigation and remediation, capital projects and normal plant operations are expected to range between $45 million to $65 million over the next several years,
$15 million
to
$35 million
of which is for investigatory and remedial efforts, which are expected to be charged against reserves recorded on our consolidated balance sheet. While we do not anticipate a material increase in the projected annual level of our environmental-related cash outlays, there is always the possibility that such an increase may occur in the future in view of the uncertainties associated with environmental exposures.
Our liabilities for future environmental expenditures were as follows:
|
December 31,
|
|||||||||||
|
2014
|
2013
|
2012
|
|||||||||
|
($ in millions)
|
|||||||||||
|
Beginning balance
|
$
|
144.6
|
|
$
|
146.5
|
|
$
|
163.3
|
|
||
|
Charges to income
|
9.6
|
|
11.5
|
|
8.4
|
|
|||||
|
Remedial and investigatory spending
|
(14.9
|
)
|
(12.4
|
)
|
(25.5
|
)
|
|||||
|
Currency translation adjustments
|
(1.0
|
)
|
(1.0
|
)
|
0.3
|
|
|||||
|
Ending balance
|
$
|
138.3
|
|
$
|
144.6
|
|
$
|
146.5
|
|
||
In the United States, the establishment and implementation of federal, state and local standards to regulate air, water and land quality affect substantially all of our manufacturing locations. Federal legislation providing for regulation of the manufacture, transportation, use and disposal of hazardous and toxic substances, and remediation of contaminated sites, has imposed additional regulatory requirements on industry, particularly the chemicals industry. In addition, implementation of environmental laws, such as the Resource Conservation and Recovery Act and the Clean Air Act, has required and will continue to require new capital expenditures and will increase plant operating costs. Our Canadian facility is governed by federal environmental laws administered by Environment Canada and by provincial environmental laws enforced by administrative agencies. Many of these laws are comparable to the U.S. laws described above. We employ waste minimization and pollution prevention programs at our manufacturing sites.
35
We are party to various governmental and private environmental actions associated with past manufacturing facilities and former waste disposal sites. Associated costs of investigatory and remedial activities are provided for in accordance with generally accepted accounting principles governing probability and the ability to reasonably estimate future costs. Our ability to estimate future costs depends on whether our investigatory and remedial activities are in preliminary or advanced stages. With respect to unasserted claims, we accrue liabilities for costs that, in our experience, we may incur to protect our interests against those unasserted claims. Our accrued liabilities for unasserted claims amounted to
$1.9 million
at December 31,
2014
. With respect to asserted claims, we accrue liabilities based on remedial investigation, feasibility study, remedial action and operation, maintenance and monitoring (OM&M) expenses that, in our experience, we may incur in connection with the asserted claims. Required site OM&M expenses are estimated and accrued in their entirety for required periods not exceeding 30 years, which reasonably approximates the typical duration of long-term site OM&M. Charges to income for investigatory and remedial efforts were material to operating results in
2014
,
2013
and
2012
and may be material to operating results in future years.
Environmental provisions charged (credited) to income, which are included in cost of goods sold, were as follows:
|
Years ended December 31,
|
|||||||||||
|
2014
|
2013
|
2012
|
|||||||||
|
($ in millions)
|
|||||||||||
|
Charges to income
|
$
|
9.6
|
|
$
|
11.5
|
|
$
|
8.4
|
|
||
|
Recoveries from third parties of costs incurred and expensed in prior periods
|
(1.4
|
)
|
(1.3
|
)
|
(0.1
|
)
|
|||||
|
Total environmental expense
|
$
|
8.2
|
|
$
|
10.2
|
|
$
|
8.3
|
|
||
These charges relate primarily to remedial and investigatory activities associated with past manufacturing operations and former waste disposal sites.
Our total estimated environmental liability at the end of
2014
was attributable to
70
sites,
15
of which were USEPA National Priority List (NPL) sites.
Ten
sites accounted for
79%
of our environmental liability and, of the remaining
60
sites, no one site accounted for more than
3%
of our environmental liability. At
five
of the
ten
sites, part of the site is subject to a remedial investigation and another part is in the long-term OM&M stage. At
two
of these
ten
sites, a remedial investigation is being performed. The
three
remaining sites are in long-term OM&M. All
ten
sites are either associated with past manufacturing operations or former waste disposal sites. None of the
ten
largest sites represents more than
22%
of the liabilities reserved on our consolidated balance sheet at December 31,
2014
for future environmental expenditures.
Our consolidated balance sheets included liabilities for future environmental expenditures to investigate and remediate known sites amounting to
$138.3 million
at December 31,
2014
, and
$144.6 million
at December 31,
2013
, of which
$119.3 million
and
$126.6 million
, respectively, were classified as other noncurrent liabilities. Our environmental liability amounts do not take into account any discounting of future expenditures or any consideration of insurance recoveries or advances in technology. These liabilities are reassessed periodically to determine if environmental circumstances have changed and/or remediation efforts and our estimate of related costs have changed. As a result of these reassessments, future charges to income may be made for additional liabilities. Of the
$138.3 million
included on our consolidated balance sheet at December 31,
2014
for future environmental expenditures, we currently expect to utilize
$80.2 million
of the reserve for future environmental expenditures over the next 5 years,
$17.3 million
for expenditures 6 to 10 years in the future, and
$40.8 million
for expenditures beyond 10 years in the future. These estimates are subject to a number of risks and uncertainties, as described in “Environmental Costs” contained in Item 1A—“Risk Factors.”
Environmental exposures are difficult to assess for numerous reasons, including the identification of new sites, developments at sites resulting from investigatory studies, advances in technology, changes in environmental laws and regulations and their application, changes in regulatory authorities, the scarcity of reliable data pertaining to identified sites, the difficulty in assessing the involvement and financial capability of other PRPs, our ability to obtain contributions from other parties and the lengthy time periods over which site remediation occurs. It is possible that some of these matters (the outcomes of which are subject to various uncertainties) may be resolved unfavorably to us, which could materially adversely affect our financial position or results of operations. At December 31,
2014
, we estimate it is reasonably possible that we may have additional contingent environmental liabilities of
$50 million
in addition to the amounts for which we have already recorded as a reserve.
36
LEGAL MATTERS AND CONTINGENCIES
We, and our subsidiaries, are defendants in various legal actions (including proceedings based on alleged exposures to asbestos) incidental to our past and current business activities. We describe some of these matters in Item 3—“Legal Proceedings.” At December 31,
2014
and
2013
, our consolidated balance sheets included liabilities for these legal actions of
$22.1 million
and
$19.3 million
, respectively. These liabilities do not include costs associated with legal representation. Based on our analysis, and considering the inherent uncertainties associated with litigation, we do not believe that it is reasonably possible that these legal actions will materially adversely affect our financial position, cash flows or results of operations.
During the ordinary course of our business, contingencies arise resulting from an existing condition, situation or set of circumstances involving an uncertainty as to the realization of a possible gain contingency. In certain instances such as environmental projects, we are responsible for managing the cleanup and remediation of an environmental site. There exists the possibility of recovering a portion of these costs from other parties. We account for gain contingencies in accordance with the provisions of ASC 450 “Contingencies” (ASC 450) and therefore do not record gain contingencies and recognize income until it is earned and realizable.
For the year ended December 31, 2013, we recognized $11.0 million as a reduction of cost of goods sold related to a Chlor Alkali Products favorable contract settlement. Also for the year ended December 31, 2013, we recognized $13.9 million as a reduction of selling and administration expense related to the recovery of legacy legal costs.
LIQUIDITY, INVESTMENT ACTIVITY AND OTHER FINANCIAL DATA
Cash Flow Data
|
|
Years ended December 31,
|
||||||||||
|
|
2014
|
2013
|
2012
|
||||||||
|
Provided by (used for)
|
($ in millions)
|
||||||||||
|
Net operating activities
|
$
|
159.2
|
|
$
|
317.0
|
|
$
|
279.2
|
|
||
|
Capital expenditures
|
(71.8
|
)
|
(90.8
|
)
|
(255.7
|
)
|
|||||
|
Business acquired in purchase transaction, net of cash acquired
|
—
|
|
—
|
|
(310.4
|
)
|
|||||
|
Proceeds from sale/leaseback of equipment
|
—
|
|
35.8
|
|
4.4
|
|
|||||
|
Restricted cash activity, net
|
4.2
|
|
7.7
|
|
39.8
|
|
|||||
|
Net investing activities
|
(61.7
|
)
|
(43.8
|
)
|
(512.4
|
)
|
|||||
|
Long-term debt (repayments) borrowings, net
|
(12.4
|
)
|
(23.7
|
)
|
180.1
|
|
|||||
|
Earn out payment - SunBelt
|
(14.8
|
)
|
(17.1
|
)
|
(15.3
|
)
|
|||||
|
Common stock repurchased and retired
|
(64.8
|
)
|
(36.2
|
)
|
(3.1
|
)
|
|||||
|
Net financing activities
|
(148.5
|
)
|
(130.6
|
)
|
93.6
|
|
|||||
Operating Activities
For 2014, cash provided by operating activities decreased by $157.8 million from 2013, primarily due to lower earnings and an increase in working capital in 2014 compared to a decrease in working capital in 2013. For 2014, working capital increased $62.4 million compared to a decrease of $29.6 million in 2013. Inventories increased $23.6 million, primarily due to the return to a more normal level of inventory at Winchester. Accounts payable and accrued liabilities decreased by $38.5 million, primarily due to the final earn out payment related to the SunBelt performance. The 2014 cash from operations was also impacted by a $12.3 million decrease in cash tax payments.
For 2013, cash provided by operating activities increased by $37.8 million from 2012, primarily due to higher earnings and a larger decrease in working capital in 2013. For 2013, working capital decreased $29.6 million compared to a decrease of $18.4 million in 2012. The decrease in 2013 was primarily due to decreased receivables of $18.9 million, primarily at Chemical Distribution, and decreased inventory of $8.6 million, primarily at Chemical Distribution and Winchester. The 2013 cash from operations was also impacted by a $32.9 million increase in cash tax payments.
37
Capital Expenditures
Capital spending was
$71.8 million
,
$90.8 million
and
$255.7 million
in
2014
,
2013
and
2012
, respectively. The decreased capital spending in 2014 was primarily due to the completion of the low salt, high strength bleach facility and the hydrochloric acid expansion project at our Henderson, NV chlor alkali site during the first quarter of 2013. Capital spending in 2012 included spending for the completion of the Charleston, TN conversion project and the completion of the low salt, high strength bleach facilities at our McIntosh, AL and Niagara Falls, NY chlor alkali sites. Capital spending was 58%, 75% and 245% of depreciation in
2014
,
2013
and
2012
, respectively.
In
2015
, we expect our capital spending to be in the $120 million to $130 million range, which includes spending for the ongoing relocation of our Winchester centerfire ammunition manufacturing operations.
Investing Activities
On August 22, 2012, we acquired KA Steel and paid cash of $310.4 million, after receiving the final working capital adjustment of $1.9 million, net of $26.2 million of cash acquired.
During
2013
and
2012
, we entered into sale/leaseback agreements for caustic soda barges, bleach trailers and chlorine, caustic soda and bleach railcars. In
2013
and
2012
, we received proceeds from the sales of $35.8 million and $4.4 million, respectively.
In 2010, we completed financings of Go Zone and Recovery Zone bonds totaling $153.0 million due 2024, 2033 and 2035. The proceeds of these bonds were required to be used to fund capital projects in Alabama, Mississippi and Tennessee and were fully utilized as of December 31,
2014
. In
2014
,
2013
and
2012
, we utilized
$4.2 million
,
$7.7 million
and
$39.8 million
, respectively, of the Go Zone and Recovery Zone proceeds to fund qualifying capital spending.
Financing Activities
In August 2014, we redeemed our $150.0 million 2019 Notes, which would have matured on August 15, 2019. We recognized interest expense of
$9.5 million
for the call premium (
$6.7 million
) and the write-off of unamortized deferred debt issuance costs (
$2.1 million
) and unamortized discount (
$0.7 million
) related to this action.
On June 24, 2014, we entered into a new five-year
$415.0 million
senior credit facility consisting of a
$265.0 million
senior revolving credit facility, which replaced our previous
$265.0 million
senior revolving credit facility, and a
$150.0 million
delayed-draw term loan facility. In August 2014, we drew the entire
$150.0 million
of the term loan and used the proceeds to redeem our 2019 Notes. In December 2014, we repaid $0.9 million under the required quarterly installments of the $150.0 million term loan facility.
In 2014, we paid deferred debt issuance costs of $1.2 million related to the new five-year
$415.0 million
senior credit facility.
In December
2014
,
2013
and
2012
, we repaid $12.2 million due under the annual requirements of the SunBelt Notes. In January 2013, we also repaid $11.4 million of 2013 Notes, which became due.
In August 2012, we sold $200.0 million of 2022 Notes with a maturity date of August 15, 2022. The 2022 Notes were issued at par value. Interest is paid semi-annually on February 15 and August 15. The acquisition of KA Steel was partially financed with proceeds of $196.0 million, after expenses of $4.0 million, from the 2022 Notes.
In June 2012, we redeemed industrial revenue bonds totaling $7.7 million with a maturity date of 2017. We paid a premium of $0.2 million to the bond holders, which was included in interest expense. We also recognized a $0.2 million deferred gain in interest expense related to the interest rate swap, which was terminated in March 2012, on these industrial revenue bonds.
During
2014
,
2013
and
2012
, we paid $26.7 million, $23.2 million and $18.5 million, respectively, for the earn out related to the 2013, 2012 and 2011 SunBelt performance. The earn out payments for the years ended December 31, 2014, 2013 and 2012 included $14.8 million, $17.1 million and $15.3 million, respectively, that were recognized as part of the original purchase price. The $14.8 million, $17.1 million and $15.3 million are included as a financing activity in the statement of cash flows.
38
We repurchased and retired
2.5 million
,
1.5 million
and
0.2 million
shares in
2014
,
2013
and
2012
, respectively, with a total value of
$64.8 million
,
$36.2 million
and
$3.1 million
, respectively.
In
2014
,
2013
and
2012
, we issued
0.5 million
,
0.5 million
and
0.1 million
shares, respectively, with a total value of
$12.1 million
,
$9.7 million
and
$1.4 million
, respectively, representing stock options exercised.
The percent of total debt to total capitalization increased to
40.0%
at December 31,
2014
, from
38.6%
at year-end
2013
. The percent of total debt to total capitalization was
41.7%
at year-end
2012
. The 2014 increase from 2013 was due to lower shareholders’ equity primarily resulting from the
$86.6 million
after-tax charge for our pension and other postretirement plans. This increase was partially offset by a lower level of long-term debt at December 31, 2014 resulting from the repayments of maturing debt. The 2013 decrease from 2012 was due to a lower level of long-term debt at December 31, 2013 resulting from the repayments of maturing debt and higher shareholders’ equity primarily resulting from the net income for the year ended December 31, 2013.
Dividends per common share were $0.80 in
2014
,
2013
and
2012
. Total dividends paid on common stock amounted to
$63.0 million
,
$64.0 million
and
$64.1 million
in
2014
,
2013
and
2012
, respectively. On January 23, 2015, our board of directors declared a dividend of $0.20 per share on our common stock, payable on March 10, 2015 to shareholders of record on February 10, 2015.
The payment of cash dividends is subject to the discretion of our board of directors and will be determined in light of then-current conditions, including our earnings, our operations, our financial condition, our capital requirements and other factors deemed relevant by our board of directors. In the future, our board of directors may change our dividend policy, including the frequency or amount of any dividend, in light of then-existing conditions.
LIQUIDITY AND OTHER FINANCING ARRANGEMENTS
Our principal sources of liquidity are from cash and cash equivalents, cash flow from operations and short-term borrowings under our senior revolving credit facility. Additionally, we believe that we have access to the debt and equity markets.
Cash flow from operations is variable as a result of both the seasonal and the cyclical nature of our operating results, which have been affected by seasonal and economic cycles in many of the industries we serve, such as the vinyls, urethanes, bleach, ammunition and pulp and paper. The seasonality of the ammunition business, which is typically driven by the fall hunting season, and the seasonality of the vinyls and bleach businesses, which are stronger in periods of warmer weather, typically cause working capital to fluctuate between $50 million to $100 million over the course of the year. Cash flow from operations is affected by changes in ECU selling prices caused by the changes in the supply/demand balance of chlorine and caustic soda, resulting in the chlor alkali business having significant leverage on our earnings and cash flow. For example, assuming all other costs remain constant and internal consumption remains approximately the same, a $10 per ECU selling price change equates to an approximate $14 million annual change in our revenues and pretax profit when we are operating at full capacity.
For 2014, cash provided by operating activities decreased by $157.8 million from 2013, primarily due to lower earnings and an increase in working capital in 2014 compared to a decrease in working capital in 2013. For 2014, working capital increased $62.4 million compared to a decrease of $29.6 million in 2013. Inventories increased $23.6 million, primarily due to the return to a more normal level of inventory at Winchester. Accounts payable and accrued liabilities decreased by $38.5 million, primarily due to the final earn out payment related to the SunBelt performance. The 2014 cash from operations was also impacted by a $12.3 million decrease in cash tax payments.
Capital spending was
$71.8 million
,
$90.8 million
and
$255.7 million
in
2014
,
2013
and
2012
, respectively. The decreased capital spending in 2014 was primarily due to the completion of the low salt, high strength bleach facility and the hydrochloric acid expansion project at our Henderson, NV chlor alkali site in the first quarter of 2013. Capital spending in 2012 included spending for the completion of the Charleston, TN conversion project and the completion of the low salt, high strength bleach facilities at our McIntosh, AL and Niagara Falls, NY chlor alkali sites. Capital spending was 58%, 75% and 245% of depreciation in
2014
,
2013
and
2012
, respectively.
In
2015
, we expect our capital spending to be in the $120 million to $130 million range, which includes spending for the ongoing relocation of our Winchester centerfire ammunition manufacturing operations.
39
The overall cash decrease of
$51.0 million
in
2014
primarily reflects common stock repurchased and retired and repayments of maturing debt, partially offset by our operating results. Based on our December 31,
2014
cash balance of
$256.8 million
and the availability of
$257.7 million
of liquidity from our senior revolving credit facility, we believe we have sufficient liquidity to meet our short-term and long-term needs. Additionally, we believe that we have access to the debt and equity markets.
On April 24, 2014, our board of directors authorized a new share repurchase program for up to 8 million shares of common stock that will terminate in three years for any remaining shares not yet repurchased. This authorization replaced the July 2011 program. We repurchased and retired
2.5 million
,
1.5 million
and
0.2 million
shares in
2014
,
2013
and
2012
, respectively, at a cost of
$64.8 million
,
$36.2 million
and
$3.1 million
, respectively. As of December 31,
2014
, we had repurchased a total of
1.9 million
shares under the April 2014 program, and
6.1 million
shares remained authorized to be purchased. The repurchases will be effected from time to time on the open market, or in privately negotiated transactions.
In August 2014, we redeemed our $150.0 million 2019 Notes, which would have matured on August 15, 2019. We recognized interest expense of
$9.5 million
for the call premium (
$6.7 million
) and the write-off of unamortized deferred debt issuance costs (
$2.1 million
) and unamortized discount (
$0.7 million
) related to this action.
On June 24, 2014, we entered into a new five-year
$415.0 million
senior credit facility consisting of a
$265.0 million
senior revolving credit facility, which replaced our previous
$265.0 million
senior revolving credit facility, and a
$150.0 million
delayed-draw term loan facility. In August 2014, we drew the entire
$150.0 million
of the term loan and used the proceeds to redeem our 2019 Notes. The new
$415.0 million
senior credit facility will expire in June 2019. The new
$265.0 million
senior revolving credit facility includes a
$60.0 million
letter of credit subfacility and the option to expand the facility by an additional
$100.0 million
. At December 31,
2014
, we had
$257.7 million
available under our
$265.0 million
senior revolving credit facility because we had issued
$7.3 million
of letters of credit under the
$60.0 million
subfacility. The
$150.0 million
term loan facility includes amortization in equal quarterly installments at a rate of
2.5%
annually for the first two years increasing to
5%
for the remaining three years. In December 2014, we repaid $0.9 million under the required quarterly installments. The terms and conditions of the new senior credit facility are similar to those of our previous
$265.0 million
senior revolving credit facility except the addition of quarterly installments on the term loan facility. Under the new senior credit facility, we may select various floating rate borrowing options. The actual interest rate paid on borrowings under the senior credit facility is based on a pricing grid which is dependent upon the leverage ratio as calculated under the terms of the facility at the end of the prior fiscal quarter. The facility includes various customary restrictive covenants, including restrictions related to the ratio of debt to earnings before interest expense, taxes, depreciation and amortization (leverage ratio) and the ratio of earnings before interest expense, taxes, depreciation and amortization to interest expense (coverage ratio). Compliance with these covenants is determined quarterly based on the operating cash flows for the last four quarters. We were in compliance with all covenants and restrictions under all our outstanding credit agreements as of December 31, 2014 and 2013, and no event of default had occurred that would permit the lenders under our outstanding credit agreements to accelerate the debt if not cured. In the future, our ability to generate sufficient operating cash flows, among other factors, will determine the amounts available to be borrowed under these facilities. As of December 31, 2014, there were no covenants or other restrictions that limited our ability to borrow.
Pursuant to a note purchase agreement dated December 22, 1997, SunBelt sold $97.5 million of Guaranteed Senior Secured Notes due 2017, Series O, and $97.5 million of Guaranteed Senior Secured Notes due 2017, Series G. We refer to these notes as the SunBelt Notes. The SunBelt Notes bear interest at a rate of 7.23% per annum, payable semi-annually in arrears on each June 22 and December 22. Beginning on December 22, 2002 and each year through 2017, SunBelt is required to repay $12.2 million of the SunBelt Notes, of which $6.1 million is attributable to the Series O Notes and of which $6.1 million is attributable to the Series G Notes. In December
2014
,
2013
and
2012
, $12.2 million was repaid on these SunBelt Notes.
We have guaranteed the Series O Notes, and PolyOne Corporation (PolyOne), our former SunBelt partner, has guaranteed the Series G Notes, in both cases pursuant to customary guaranty agreements. We have agreed to indemnify PolyOne for any payments or other costs under the guarantee in favor of the purchasers of the Series G Notes, to the extent any payments or other costs arise from a default or other breach under the SunBelt Notes. If SunBelt does not make timely payments on the SunBelt Notes, whether as a result of a failure to pay on a guarantee or otherwise, the holders of the SunBelt Notes may proceed against the assets of SunBelt for repayment.
In January 2013, we repaid $11.4 million of 2013 Notes, which became due.
40
In August 2012, we sold $200.0 million of 2022 Notes with a maturity date of August 15, 2022. The 2022 Notes were issued at par value. Interest is paid semi-annually on February 15 and August 15. The acquisition of KA Steel was partially financed with proceeds of $196.0 million, after expenses of $4.0 million, from these 2022 Notes.
In June 2012, we redeemed industrial revenue bonds totaling $7.7 million with a maturity date of 2017. We paid a premium of $0.2 million to the bond holders, which was included in interest expense. We also recognized a $0.2 million deferred gain in interest expense related to the interest rate swap, which was terminated in March 2012, on these industrial revenue bonds.
At December 31,
2014
, we had total letters of credit of
$20.9 million
outstanding, of which
$7.3 million
were issued under our
$265.0 million
senior revolving credit facility. The letters of credit were used to support certain long-term debt, certain workers compensation insurance policies, certain plant closure and post-closure obligations and certain Canadian pension funding requirements.
Our current debt structure is used to fund our business operations. As of December 31,
2014
, we had long-term borrowings, including the current installment and capital lease obligations, of
$675.1 million
, of which $305.0 million was at variable rates. Annual maturities of long-term debt, including capital lease obligations, are
$16.4 million
in
2015
,
$146.0 million
in
2016
,
$21.4 million
in
2017
,
$8.0 million
in
2018
,
$126.1 million
in
2019
and a total of
$357.2 million
thereafter. Commitments from banks under our senior revolving credit facility are an additional source of liquidity.
In June 2012, we terminated
$73.1 million
of interest rate swaps with Wells Fargo Bank, N.A. (Wells Fargo) that had been entered into on the SunBelt Notes in May 2011. The result was a gain of
$2.2 million
which will be recognized through 2017. As of December 31,
2014
,
$0.8 million
of this gain was included in long-term debt.
In March 2012, Citibank, N.A. (Citibank) terminated
$7.7 million
of interest rate swaps on our industrial development and environmental improvement tax-exempt bonds due in 2017. The result was a gain of
$0.2 million
, which would have been recognized through 2017. In June 2012, the industrial revenue bonds were redeemed by us, and as a result, the remaining
$0.2 million
deferred gain was recognized in interest expense during 2012.
In March 2010, we entered into interest rate swaps on $125 million of our underlying fixed-rate debt obligations, whereby we agreed to pay variable rates to a counterparty who, in turn, pays us fixed rates. The counterparty to these agreements is Citibank, a major financial institution. In October 2011, we entered into $125 million of interest rate swaps with equal and opposite terms as the $125 million variable interest rate swaps on the 6.75% senior notes due 2016 (2016 Notes). We have agreed to pay a fixed rate to a counterparty who, in turn, pays us variable rates. The counterparty to this agreement is also Citibank. The result was a gain of $11.0 million on the $125 million variable interest rate swaps, which will be recognized through 2016. As of December 31,
2014
,
$3.7 million
of this gain was included in long-term debt. In October 2011, we de-designated our $125 million interest rate swaps that had previously been designated as fair value hedges. The $125 million variable interest rate swaps and the $125 million fixed interest rate swaps do not meet the criteria for hedge accounting. All changes in the fair value of these interest rate swaps are recorded currently in earnings.
We have registered an undetermined amount of securities with the SEC, so that, from time-to-time, we may issue debt securities, preferred stock and/or common stock and associated warrants in the public market under that registration statement.
OFF-BALANCE SHEET ARRANGEMENTS
Our operating lease commitments are primarily for railroad cars but also include distribution, warehousing and office space and data processing and office equipment. Virtually none of our lease agreements contain escalation clauses or step rent provisions.
In conjunction with the St. Gabriel, LA conversion and expansion project, which was completed in the fourth quarter of 2009, we entered into a twenty-year brine and pipeline supply agreement with Boardwalk Louisiana Midstream, LLC (formerly PetroLogistics Olefins, LLC) (Boardwalk). Boardwalk installed, owns and operates, at its own expense, a pipeline supplying brine to the St. Gabriel, LA facility. Since November 2009, we have been obligated to make a fixed annual payment over the life of the contract of $2.0 million for use of the pipeline, regardless of the amount of brine purchased. We also had a minimum usage requirement for brine of $8.4 million over the first five-year period of the contract. We have met or exceeded the minimum brine usage requirements for this five-year period. After the first five-year period, the contract contains a buy out provision exercisable by us for $12.0 million, which decreases by $0.8 million per year.
41
Our long-term contractual commitments, including the on and off-balance sheet arrangements, consisted of the following:
|
|
Payments Due by Period
|
||||||||||||||||||
|
Contractual Obligations
|
Total
|
Less than
1 Year
|
1-3
Years
|
3-5
Years
|
More than
5 Years
|
||||||||||||||
|
|
($ in millions)
|
||||||||||||||||||
|
Debt obligations, including capital lease obligations
|
$
|
675.1
|
|
$
|
16.4
|
|
$
|
167.4
|
|
$
|
134.1
|
|
$
|
357.2
|
|
||||
|
Interest payments under debt obligations and interest rate swap agreements
(a)
|
138.9
|
|
24.2
|
|
36.1
|
|
29.3
|
|
49.3
|
|
|||||||||
|
Contingent tax liability
|
38.4
|
|
7.3
|
|
4.4
|
|
7.3
|
|
19.4
|
|
|||||||||
|
Qualified pension plan contributions
(b)
|
1.0
|
|
1.0
|
|
—
|
|
—
|
|
—
|
|
|||||||||
|
Non-qualified pension plan payments
|
65.4
|
|
22.1
|
|
11.8
|
|
6.3
|
|
25.2
|
|
|||||||||
|
Postretirement benefit payments
|
67.2
|
|
5.5
|
|
10.6
|
|
9.5
|
|
41.6
|
|
|||||||||
|
Off-Balance Sheet Commitments:
|
|||||||||||||||||||
|
Noncancelable operating leases
|
301.5
|
|
60.5
|
|
95.5
|
|
70.2
|
|
75.3
|
|
|||||||||
|
Purchasing commitments:
|
|||||||||||||||||||
|
Raw materials
|
64.5
|
|
28.3
|
|
36.2
|
|
—
|
|
—
|
|
|||||||||
|
Capital expenditures
|
4.6
|
|
4.2
|
|
0.4
|
|
—
|
|
—
|
|
|||||||||
|
Utilities
|
0.5
|
|
0.3
|
|
0.2
|
|
—
|
|
—
|
|
|||||||||
|
Total
|
$
|
1,357.1
|
|
$
|
169.8
|
|
$
|
362.6
|
|
$
|
256.7
|
|
$
|
568.0
|
|
||||
|
(a)
|
For the purposes of this table, we have assumed for all periods presented that there are no changes in the principal amount of any variable rate debt from the amounts outstanding on December 31,
2014
, except for payments made under the required quarterly installments of the $150.0 million term loan facility, and that there are no changes in the rates from those in effect at December 31,
2014
which ranged from 0.20% to 7.23%.
|
|
(b)
|
These amounts are only estimated payments assuming an annual expected rate of return on pension plan assets of 7.75%, and a discount rate on pension plan obligations of 3.9%. These estimated payments are subject to significant variation and the actual payments may be more than the amounts estimated. Given the inherent uncertainty as to actual minimum funding requirements for qualified defined benefit pension plans, no amounts are included in this table for any period beyond one year. Based on the current funding requirements, we will not be required to make any cash contributions to the domestic qualified defined benefit pension plan at least through
2015
. We do have a small Canadian qualified defined benefit pension plan to which we made cash contributions of
$0.8 million
and
$1.0 million
in
2014
and
2013
, respectively, and we anticipate approximately
$1 million
of cash contributions in
2015
. See discussion on MAP-21 and HATFA 2014 in “Pension Plans” in the notes to consolidated financial statements contained in Item 8.
|
Non-cancelable operating leases and purchasing commitments are utilized in our normal course of business for our projected needs. For losses that we believe are probable and which are estimable, we have accrued for such amounts in our consolidated balance sheets. In addition to the table above, we have various commitments and contingencies including: defined benefit and postretirement healthcare plans (as described below), environmental matters (see discussion above under “Environmental Matters”) and litigation claims (see Item 3—“Legal Proceedings”).
We have several defined benefit and defined contribution pension plans, as described in the “Pension Plans” note in the notes to consolidated financial statements contained in Item 8. We fund the defined benefit pension plans based on the minimum amounts required by law plus such amounts we deem appropriate. We have postretirement healthcare plans that provide health and life insurance benefits to certain retired employees and their beneficiaries, as described in the “Postretirement Benefits” note in the notes to consolidated financial statements contained in Item 8. These other postretirement plans are not pre-funded and expenses are paid by us as incurred.
We also have standby letters of credit of
$20.9 million
of which
$7.3 million
have been issued through our senior revolving credit facility. At December 31,
2014
, we had
$257.7 million
available under our senior revolving credit facility.
42
CRITICAL ACCOUNTING POLICIES AND ESTIMATES
Our discussion and analysis of our financial condition and results of operations are based upon our consolidated financial statements, which have been prepared in accordance with accounting principles generally accepted in the United States. The preparation of these financial statements requires us to make estimates and judgments that affect the reported amounts of assets, liabilities, sales and expenses, and related disclosure of contingent assets and liabilities. Significant estimates in our consolidated financial statements include goodwill recoverability, environmental, restructuring and other unusual items, litigation, income tax reserves including deferred tax asset valuation allowances, pension, postretirement and other benefits and allowance for doubtful accounts. We base our estimates on prior experience, facts and circumstances and other assumptions. Actual results may differ from these estimates.
We believe the following critical accounting policies affect the more significant judgments and estimates used in the preparation of the consolidated financial statements.
Goodwill
Goodwill is not amortized, but is reviewed for impairment annually in the fourth quarter and/or when circumstances or other events indicate that impairment may have occurred. On January 1, 2012, we adopted Accounting Standards Update (ASU) 2011-08 “Testing Goodwill for Impairment” (ASU 2011-08), which permits entities to make a qualitative assessment of whether it is more likely than not that a reporting unit’s fair value is less than its carrying amount before applying the two-step goodwill impairment test. Circumstances that are considered as part of the qualitative assessment and could trigger the two-step impairment test include, but are not limited to: a significant adverse change in the business climate; a significant adverse legal judgment; adverse cash flow trends; an adverse action or assessment by a government agency; unanticipated competition; decline in our stock price; and a significant restructuring charge within a reporting unit. It is our practice, at a minimum, to perform a quantitative goodwill impairment test in the fourth quarter every three years. In the fourth quarter of 2014, we performed our triennial quantitative goodwill impairment test for our reporting units. We define reporting units at the business segment level. For purposes of testing goodwill for impairment, goodwill has been allocated to our reporting units, Chlor Alkali Products and Chemical Distribution, to the extent it relates to each reporting unit.
We use a discounted cash flow approach to develop the estimated fair value of a reporting unit when a quantitative review is performed. Management judgment is required in developing the assumptions for the discounted cash flow model. We also corroborate our discounted cash flow analysis by evaluating a market-based approach that considers earnings before interest, taxes, depreciation and amortization (EBITDA) multiples from a representative sample of comparable public companies. As a further indicator that each reporting unit has been valued appropriately using a discounted cash flow model, the aggregate fair value of all reporting units is reconciled to the total market value of Olin. An impairment would be recorded if the carrying amount exceeded the estimated fair value. Based on the aforementioned analysis, the estimated fair value of our Chlor Alkali Products reporting unit substantially exceeded the carrying value of the reporting unit. The estimated fair value of our Chemical Distribution reporting unit also exceeded the carrying value of the reporting unit. No impairment charges were recorded for
2014
,
2013
or
2012
.
The discount rate, profitability assumptions and terminal growth rate of our chlor alkali and chemical distribution businesses and the cyclical nature of our chlor alkali business were the material assumptions utilized in the discounted cash flow model used to estimate the fair value of each reporting unit. The discount rate reflects a weighted-average cost of capital, which is calculated based on observable market data. Some of these data (such as the risk free or treasury rate and the pretax cost of debt) are based on the market data at a point in time. Other data (such as the equity risk premium) are based upon market data over time for a peer group of companies in the chemical manufacturing or distribution industries with a market capitalization premium added, as applicable.
The discounted cash flow analysis requires estimates, assumptions and judgments about future events. Our analysis uses our internally generated long-range plan. Our discounted cash flow analysis uses the assumptions in our long-range plan about terminal growth rates, forecasted capital expenditures and changes in future working capital requirements to determine the implied fair value of each reporting unit. The long-range plan reflects management judgment, supplemented by independent chemical industry analyses which provide multi-year chlor alkali industry operating and pricing forecasts.
We believe the assumptions used in our goodwill impairment analysis are appropriate and result in reasonable estimates of the implied fair value of each reporting unit. However, given the economic environment and the uncertainties regarding the impact on our business, there can be no assurance that our estimates and assumptions, made for purposes of our goodwill impairment testing during the fourth quarter of 2014, will prove to be an accurate prediction of the future. In order to evaluate the sensitivity of the fair value calculation on the goodwill impairment test, we applied a hypothetical 10% decrease to the fair
43
value of each reporting unit. We also applied a hypothetical decrease of 100-basis points in our terminal growth rate or an increase of 100-basis points in our weighted-average cost of capital to test the fair value calculation. In all cases, the estimated fair value of the Chlor Alkali Products reporting unit derived in these sensitivity calculations exceeded the carrying value by a substantial amount. In these sensitivity calculations, the estimated fair value of the Chemical Distribution reporting unit also exceeded the carrying value by approximately 10%. If our assumptions regarding future performance are not achieved, we may be required to record goodwill impairment charges in future periods. It is not possible at this time to determine if any such future impairment charge would result or, if it does, whether such charge would be material.
Environmental
Accruals (charges to income) for environmental matters are recorded when it is probable that a liability has been incurred and the amount of the liability can be reasonably estimated, based upon current law and existing technologies. These amounts, which are not discounted and are exclusive of claims against third parties, are adjusted periodically as assessments and remediation efforts progress or additional technical or legal information becomes available. Environmental costs are capitalized if the costs increase the value of the property and/or mitigate or prevent contamination from future operations. Environmental costs and recoveries are included in costs of goods sold.
Environmental exposures are difficult to assess for numerous reasons, including the identification of new sites, developments at sites resulting from investigatory studies, advances in technology, changes in environmental laws and regulations and their application, changes in regulatory authorities, the scarcity of reliable data pertaining to identified sites, the difficulty in assessing the involvement and financial capability of other PRPs and our ability to obtain contributions from other parties and the lengthy time periods over which site remediation occurs. It is possible that some of these matters (the outcomes of which are subject to various uncertainties) may be resolved unfavorably to us, which could materially adversely affect our financial position, cash flows or results of operations.
Pension and Postretirement Plans
We account for our defined benefit pension plans and non-pension postretirement benefit plans using actuarial models required by ASC 715. These models use an attribution approach that generally spreads the financial impact of changes to the plan and actuarial assumptions over the average remaining service lives of the employees in the plan. Changes in liability due to changes in actuarial assumptions such as discount rate, rate of compensation increases and mortality, as well as annual deviations between what was assumed and what was experienced by the plan are treated as actuarial gains or losses. The principle underlying the required attribution approach is that employees render service over their average remaining service lives on a relatively smooth basis and, therefore, the accounting for benefits earned under the pension or non-pension postretirement benefits plans should follow the same relatively smooth pattern. Substantially all defined benefit pension plan participants are no longer accruing benefits; therefore, actuarial gains and losses are amortized based upon the remaining life expectancy of the inactive plan participants. For the years ended December 31,
2014
and
2013
, the average remaining life expectancy of the inactive participants in the defined benefit pension plan was
18
years.
One of the key assumptions for the net periodic pension calculation is the expected long-term rate of return on plan assets, used to determine the “market-related value of assets.” (The “market-related value of assets” recognizes differences between the plan’s actual return and expected return over a five year period). The required use of an expected long-term rate of return on the market-related value of plan assets may result in recognized pension income that is greater or less than the actual returns of those plan assets in any given year. Over time, however, the expected long-term returns are designed to approximate the actual long-term returns and, therefore, result in a pattern of income and expense recognition that more closely matches the pattern of the services provided by the employees. As differences between actual and expected returns are recognized over five years, they subsequently generate gains and losses that are subject to amortization over the average remaining life expectancy of the inactive plan participants, as described in the preceding paragraph.
We use long-term historical actual return information, the mix of investments that comprise plan assets, and future estimates of long-term investment returns and inflation by reference to external sources to develop the expected long-term rate of return on plan assets as of December 31.
The discount rate assumptions used for pension and non-pension postretirement benefit plan accounting reflect the rates available on high-quality fixed-income debt instruments on December 31 of each year. The rate of compensation increase is based upon our long-term plans for such increases. For retiree medical plan accounting, we review external data and our own historical trends for healthcare costs to determine the healthcare cost trend rates.
44
Changes in pension costs may occur in the future due to changes in these assumptions resulting from economic events. For example, holding all other assumptions constant, a 100-basis point decrease or increase in the assumed long-term rate of return on plan assets would have decreased or increased, respectively, the
2014
defined benefit pension plan income by approximately $17.4 million. Holding all other assumptions constant, a 50-basis point decrease in the discount rate used to calculate pension income for
2014
and the projected benefit obligation as of December 31,
2014
would have decreased pension income by $0.5 million and increased the projected benefit obligation by $118.0 million. A 50-basis point increase in the discount rate used to calculate pension income for
2014
and the projected benefit obligation as of December 31,
2014
would have increased pension income by $0.7 million and decreased the projected benefit obligation by $115.0 million. For additional information on long-term rates of return, discount rates and projected healthcare costs projections, see “Pension Plans” and “Postretirement Benefits” in the notes to the consolidated financial statements contained in Item 8.
NEW ACCOUNTING PRONOUNCEMENTS
In January 2015, the Financial Accounting Standards Board (FASB) issued ASU 2015-01 “Simplifying Income Statement Presentation by Eliminating the Concept of Extraordinary Items” (ASU 2015-01), which amends ASC 225-20 “Income Statement - Extraordinary and Unusual Items” (ASC 225-20). This update eliminates the income statement concept of extraordinary items and also expands the disclosure requirements of items that are unusual in nature or occur infrequently. This update is effective for fiscal years beginning after December 15, 2015. This update will not have a material effect on our consolidated financial statements.
In May 2014, the FASB issued ASU 2014-09 “Revenue from Contracts with Customers” (ASU 2014-09), which amends ASC 605 “Revenue Recognition” (ASC 605) and creates a new topic, ASC 606 “Revenue from Contracts with Customers” (ASC 606). This update provides guidance on how an entity should recognize revenue to depict the transfer of promised goods or services to customers in an amount that reflects the consideration to which the entity expects to be entitled in exchange for those goods or services. Upon initial application, the provision of this update are required to be applied retrospectively to each prior reporting period presented or retrospectively with the cumulative effect of initially applying this update recognized at the date of initial application. This update also expands the disclosure requirements surrounding revenue recorded from contracts with customers. This update is effective for fiscal years, and interim periods within those years, beginning after December 15, 2016. We are currently evaluating the effect of this update on our financial statements and have not yet determined the method of initial application we will use.
In April 2014, the FASB issued ASU 2014-08 “Reporting Discontinued Operations and Disclosures of Disposals of Components of an Entity” (ASU 2014-08), which amends ASC 205 “Presentation of Financial Statements” (ASC 205) and ASC 360 “Property, Plant, and Equipment” (ASC 360). This update changes the criteria for a disposal transaction to qualify as a discontinued operation. This update also expands the disclosure requirements surrounding discontinued operations. This update is effective for fiscal years beginning after December 15, 2014. This update will not have a material effect on our consolidated financial statements.
In July 2013, the FASB issued ASU 2013-11 “Presentation of an Unrecognized Tax Benefit When a Net Operating Loss Carryforward, a Similar Tax Loss, or a Tax Credit Carryfoward Exists” (ASU 2013-11), which amends ASC 740 “Income Taxes” (ASC 740). This update provides guidance on the financial statement presentation of unrecognized tax benefits when net operating loss carryforwards, similar tax losses or tax credit carryforwards exist. We adopted the provisions of ASU 2013-11 on January 1, 2014. This update did not have a material effect on our consolidated financial statements.
In February 2013, the FASB issued ASU 2013-04 “Obligations Resulting from Joint and Several Liability Arrangements for Which the Total Amount of the Obligation Is Fixed at the Reporting Date” (ASU 2013-04), which amends ASC 405 “Liabilities” (ASC 405). This update clarifies how entities measure obligations resulting from joint and several liability arrangements. We adopted the provisions of ASU 2013-04 on January 1, 2014. This update did not have a material effect on our consolidated financial statements.
In February 2013, the FASB issued ASU 2013-02 “Reporting of Amounts Reclassified Out of Accumulated Other Comprehensive Income” (ASU 2013-02), which amends ASC 220 “Comprehensive Income” (ASC 220). This update adds new disclosure requirements about reclassifications out of accumulated other comprehensive income including the effects of these reclassifications on net income. We adopted the provisions of ASU 2013-02 on January 1, 2013. This update did not have a material effect on our consolidated financial statements.
45
In July 2012, the FASB issued ASU 2012-02 “Testing Indefinite-Lived Intangible Assets for Impairment” (ASU 2012-02) which amends ASC 350 “Intangibles – Goodwill and Other” (ASC 350). This update permits entities to make a qualitative assessment of whether it is more likely than not that an indefinite-lived intangible asset’s fair value is less than its carrying amount before performing a quantitative impairment test. If an entity concludes that it is not more likely than not that the fair value of the indefinite-lived intangible asset is less than its carrying amount, it would not be required to perform the quantitative test for that asset. We adopted the provisions of ASU 2012-02 during 2012. This update did not have a material effect on our consolidated financial statements.
In September 2011, the FASB issued ASU 2011-08, which amends ASC 350. This update permits entities to make a qualitative assessment of whether it is more likely than not that a reporting unit’s fair value is less than its carrying amount before applying the two-step goodwill impairment test. If an entity concludes that it is not more likely than not that the fair value of a reporting unit is less than its carrying amount, it would not be required to perform the two-step impairment test for that reporting unit. We adopted the provisions of ASU 2011-08 on January 1, 2012. This update did not have a material effect on our consolidated financial statements.
During 2011, the FASB issued ASU 2011-05 “Presentation of Comprehensive Income” (ASU 2011-05) and ASU 2011-12 “Deferral of the Effective Date for Amendments to the Presentation of Reclassifications of Items Out of Accumulated Other Comprehensive Income in ASU No. 2011-05” (ASU 2011-12). These updates require entities to present items of net income and other comprehensive income either in one continuous statement, referred to as the statement of comprehensive income, or in two separate, but consecutive, statements of net income and other comprehensive income. We retrospectively adopted the provisions of ASU 2011-05 and ASU 2011-12 on January 1, 2012. These updates required modification of our consolidated financial statements presentation. These updates did not have a material effect on our consolidated financial statements.
In May 2011, the FASB issued ASU 2011-04 “Amendments to Achieve Common Fair Value Measurement and Disclosure Requirements in U.S. GAAP and IFRSs,” (ASU 2011-04), which amends ASC 820 “Fair Value Measurements and Disclosures” (ASC 820). This update clarifies the existing guidance and amends the wording used to describe many of the requirements in U.S. GAAP for measuring fair value and for disclosing information about fair value measurements. This update became effective for us on January 1, 2012. This update did not have a material effect on our consolidated financial statements.
DERIVATIVE FINANCIAL INSTRUMENTS
ASC 815 “Derivatives and Hedging” (ASC 815) required an entity to recognize all derivatives as either assets or liabilities in the statement of financial position and measure those instruments at fair value. We use hedge accounting treatment for substantially all of our business transactions whose risks are covered using derivative instruments. The accounting treatment of changes in fair value is dependent upon whether or not a derivative instrument is designated as a hedge and, if so, the type of hedge. For derivatives designated as a fair value hedge, the changes in the fair value of both the derivative and the hedged item are recognized in earnings. For derivatives designated as a cash flow hedge, the change in fair value of the derivative is recognized in other comprehensive income (loss) until the hedged item is recognized in earnings. Ineffective portions are recognized currently in earnings. Unrealized gains and losses on derivatives not qualifying for hedge accounting are recognized currently in earnings. All derivatives recognized in earnings impact the expense line item on our consolidated statement of operations that is consistent with the nature of the underlying hedged item.
We enter into forward sales and purchase contracts to manage currency risk resulting from purchase and sale commitments denominated in foreign currencies (principally Canadian dollar and Australian dollar). At December 31,
2014
and
2013
, we had no forward contracts to buy or sell foreign currencies.
We use cash flow hedges for certain raw material and energy costs such as copper, zinc, lead, electricity and natural gas to provide a measure of stability in managing our exposure to price fluctuations associated with forecasted purchases of raw materials and energy costs used in our manufacturing process. For derivative instruments that are designated and qualify as a cash flow hedge, the change in fair value of the derivative is recognized as a component of other comprehensive income (loss) until the hedged item is recognized into earnings. Gains and losses on the derivatives representing hedge ineffectiveness are recognized currently in earnings. Losses on settled futures contracts were $1.8 million ($1.1 million, net of taxes), $1.4 million ($0.9 million, net of taxes) and $6.5 million ($4.0 million, net of taxes) in
2014
,
2013
and
2012
, respectively, which were included in cost of goods sold. At December 31,
2014
, we had open positions in futures contracts through 2018 totaling
$89.3 million
(
2013
—
$78.1 million
). If all open futures contracts had been settled on December 31,
2014
, we would have recognized a pretax loss of
$7.1 million
.
46
At December 31,
2014
, accumulated other comprehensive loss included a loss, net of taxes, in fair value on commodity forward contracts of $4.2 million. If commodity prices were to remain at the levels they were at December 31,
2014
, approximately
$3.1 million
of deferred losses, net of tax, would be reclassified into earnings during the next twelve months. The actual effect on earnings will be dependent on commodity prices when the forecasted transactions occur. At December 31,
2013
, accumulated other comprehensive loss included a gain, net of taxes, in fair value on commodity forward contracts of $0.9 million.
We use interest rate swaps as a means of managing interest expense and floating interest rate exposure to optimal levels. The accounting for gains and losses associated with changes in fair value of the derivative and the effect on the consolidated financial statements will depend on the hedge designation and whether the hedge is effective in offsetting changes in fair value of cash flows of the asset or liability being hedged. For derivative instruments that are designated and qualify as a fair value hedge, the gain or loss on the derivative as well as the offsetting loss or gain on the hedged item attributable to the hedged risk are recognized in current earnings. We include the gain or loss on the hedged items (fixed-rate borrowings) in the same line item, interest expense, as the offsetting loss or gain on the related interest rate swaps. We had no interest rate swaps designated as fair value hedges as of December 31,
2014
and
2013
.
In March 2010, we entered into interest rate swaps on $125 million of our underlying fixed-rate debt obligations, whereby we agreed to pay variable rates to a counterparty who, in turn, pays us fixed rates. The counterparty to these agreements is Citibank. In October 2011, we entered into $125 million of interest rate swaps with equal and opposite terms as the $125 million variable interest rate swaps on the 2016 Notes. We have agreed to pay a fixed rate to a counterparty who, in turn, pays us variable rates. The counterparty to this agreement is also Citibank. The result was a gain of $11.0 million on the $125 million variable interest rate swaps, which will be recognized through 2016. As of December 31,
2014
,
$3.7 million
of this gain was included in long-term debt. In October 2011, we de-designated our $125 million interest rate swaps that had previously been designated as fair value hedges. The $125 million variable interest rate swaps and the $125 million fixed interest rate swaps do not meet the criteria for hedge accounting. All changes in the fair value of these interest rate swaps are recorded currently in earnings.
The fair value of our derivative asset and liability balances were:
|
December 31,
|
|||||||
|
2014
|
2013
|
||||||
|
($ in millions)
|
|||||||
|
Other current assets
|
$
|
—
|
|
$
|
1.3
|
|
|
|
Other assets
|
3.5
|
|
5.9
|
|
|||
|
Total derivative asset
|
$
|
3.5
|
|
$
|
7.2
|
|
|
|
Accrued liabilities
|
$
|
8.6
|
|
$
|
—
|
|
|
|
Long-term debt
|
4.5
|
|
7.3
|
|
|||
|
Total derivative liability
|
$
|
13.1
|
|
$
|
7.3
|
|
|
The ineffective portion of changes in fair value resulted in zero charged or credited to earnings for the years ended December 31,
2014
,
2013
and
2012
.
Our foreign currency forward contracts, certain commodity derivatives and our $125 million fixed and variable interest rate swaps did not meet the criteria to qualify for hedge accounting. The effect on operating results of items not qualifying for hedge accounting was a charge (benefit) of $1.4 million, ($0.4 million) and $2.0 million in
2014
,
2013
and
2012
, respectively.
We are exposed to market risk in the normal course of our business operations due to our purchases of certain commodities, our ongoing investing and financing activities and our operations that use foreign currencies. The risk of loss can be assessed from the perspective of adverse changes in fair values, cash flows and future earnings. We have established policies and procedures governing our management of market risks and the use of financial instruments to manage exposure to such risks.
47
Energy costs including electricity used in our Chlor Alkali Products segment, and certain raw materials and energy costs, namely copper, lead, zinc, electricity and natural gas used primarily in our Winchester and Chemical Distribution segments are subject to price volatility. Depending on market conditions, we may enter into futures contracts and put and call option contracts in order to reduce the impact of commodity price fluctuations. As of December 31,
2014
, we maintained open positions on futures contracts with a notional value totaling
$89.3 million
(
$78.1 million
at December 31,
2013
). Assuming a hypothetical 10% increase in commodity prices, which are currently hedged, as of December 31,
2014
, we would experience an $8.9 million ($7.8 million at December 31,
2013
) increase in our cost of inventory purchased, which would be substantially offset by a corresponding increase in the value of related hedging instruments.
We are exposed to changes in interest rates primarily as a result of our investing and financing activities. The effect of interest rates on investing activity is not material to our consolidated financial position, results of operations or cash flows. Our current debt structure is used to fund business operations, and commitments from banks under our senior revolving credit facility are a source of liquidity. As of December 31,
2014
, we had long-term borrowings, including capital lease obligations, of
$675.1 million
(
$691.0 million
at December 31,
2013
) of which $305.0 million ($155.9 million at December 31,
2013
) was issued at variable rates.
In June 2012, we terminated
$73.1 million
of interest rate swaps with Wells Fargo that had been entered into on the SunBelt Notes in May 2011. The result was a gain of
$2.2 million
which will be recognized through 2017. As of December 31,
2014
,
$0.8 million
of this gain was included in long-term debt.
In March 2012, Citibank terminated
$7.7 million
of interest rate swaps on our industrial revenue bonds due in 2017. The result was a gain of
$0.2 million
, which would have been recognized through 2017. In June 2012, the industrial revenue bonds were redeemed by us, and as a result, the remaining
$0.2 million
deferred gain was recognized in interest expense during 2012.
In March 2010, we entered into interest rate swaps on $125 million of our underlying fixed-rate debt obligations, whereby we agreed to pay variable rates to a counterparty who, in turn, pays us fixed rates. The counterparty to these agreements is Citibank. In October 2011, we entered into $125 million of interest rate swaps with equal and opposite terms as the $125 million variable interest rate swaps on the 2016 Notes. We have agreed to pay a fixed rate to a counterparty who, in turn, pays us variable rates. The counterparty to this agreement is also Citibank. The result was a gain of $11.0 million on the $125 million variable interest rate swaps, which will be recognized through 2016. As of December 31,
2014
,
$3.7 million
of this gain was included in long-term debt. In October 2011, we de-designated our $125 million interest rate swaps that had previously been designated as fair value hedges. The $125 million variable interest rate swaps and the $125 million fixed interest rate swaps do not meet the criteria for hedge accounting. All changes in the fair value of these interest rate swaps are recorded currently in earnings.
Assuming no changes in the $305.0 million of variable-rate debt levels from December 31,
2014
, we estimate that a hypothetical change of 100-basis points in the LIBOR interest rates from
2014
would impact annual interest expense by $3.1 million.
The following table reflects the swap activity related to certain debt obligations:
|
Underlying Debt Instrument
|
Swap
Amount
|
Date of Swap
|
December 31, 2014
|
||||||
|
($ in millions)
|
|
Olin Pays
Floating Rate:
|
|||||||
|
6.75%, due 2016
|
$
|
65.0
|
|
March 2010
|
3.0 - 4.0%
|
(a)
|
|||
|
6.75%, due 2016
|
$
|
60.0
|
|
March 2010
|
3.0 - 4.0%
|
(a)
|
|||
|
|
Olin Receives
Floating Rate:
|
||||||||
|
6.75%, due 2016
|
$
|
65.0
|
|
October 2011
|
3.0 - 4.0%
|
(a)
|
|||
|
6.75%, due 2016
|
$
|
60.0
|
|
October 2011
|
3.0 - 4.0%
|
(a)
|
|||
|
(a)
|
Actual rate is set in arrears. We project the rate will fall within the range shown.
|
These interest rate swaps reduced interest expense by
$2.9 million
in both
2014
and
2013
and
$3.4 million
in
2012
.
48
If the actual change in interest or commodities pricing is substantially different than expected, the net impact of interest rate risk or commodity risk on our cash flow may be materially different than that disclosed above.
We do not enter into any derivative financial instruments for speculative purposes.
CAUTIONARY STATEMENT ABOUT FORWARD-LOOKING STATEMENTS:
This report includes forward-looking statements. These statements relate to analyses and other information that are based on management’s beliefs, certain assumptions made by management, forecasts of future results and current expectations, estimates and projections about the markets and economy in which we and our various segments operate. The statements contained in this report that are not statements of historical fact may include forward-looking statements that involve a number of risks and uncertainties.
We have used the words “anticipate,” “intend,” “may,” “expect,” “believe,” “should,” “plan,” “estimate,” “project,” “forecast,” “optimistic” and variations of such words and similar expressions in this report to identify such forward-looking statements. These statements are not guarantees of future performance and involve certain risks, uncertainties and assumptions, which are difficult to predict and many of which are beyond our control. Therefore, actual outcomes and results may differ materially from those matters expressed or implied in such forward-looking statements. We undertake no obligation to update publicly any forward-looking statements, whether as a result of future events, new information or otherwise.
The risks, uncertainties, and assumptions involved in our forward-looking statements include those discussed under Item 1A—“Risk Factors.” You should consider all of our forward-looking statements in light of these factors. In addition, other risks and uncertainties not presently known to us or that we consider immaterial could affect the accuracy of our forward-looking statements.
49
MANAGEMENT REPORT ON INTERNAL CONTROL OVER FINANCIAL REPORTING
The management of Olin Corporation is responsible for establishing and maintaining adequate internal control over financial reporting. Olin’s internal control system was designed to provide reasonable assurance to the company’s management and board of directors regarding the preparation and fair presentation of published financial statements.
All internal control systems, no matter how well designed, have inherent limitations. Therefore, even those systems determined to be effective can provide only reasonable assurance with respect to financial statement preparation and presentation, and may not prevent or detect all misstatements.
The management of Olin Corporation has assessed the effectiveness of the company’s internal control over financial reporting as of December 31, 2014. In making this assessment, we used the criteria set forth by the Committee of Sponsoring Organizations of the Treadway Commission (COSO) in
Internal Control—Integrated Framework
(2013)
to guide our analysis and assessment. Based on our assessment as of December 31, 2014, the company’s internal control over financial reporting was effective based on those criteria.
Our independent registered public accountants, KPMG LLP, have audited and issued a report on our internal control over financial reporting, which appears in this Form 10-K.
/s/ Joseph D. Rupp
Chairman and Chief Executive Officer
/s/ Todd A. Slater
Vice President and Chief Financial Officer
50
REPORT OF INDEPENDENT REGISTERED PUBLIC ACCOUNTING FIRM
The Board of Directors and Shareholders of Olin Corporation:
We have audited the accompanying consolidated balance sheets of Olin Corporation and subsidiaries as of December 31, 2014 and 2013, and the related consolidated statements of operations, comprehensive income, shareholders’ equity, and cash flows for each of the years in the three-year period ended December 31, 2014. We also have audited Olin Corporation’s internal control over financial reporting as of December 31, 2014, based on
criteria established in
Internal Control - Integrated Framework (2013),
issued by the Committee of Sponsoring Organizations of the Treadway Commission (COSO). Olin Corporation’s management is responsible for these consolidated financial statements, for maintaining effective internal control over financial reporting, and for its assessment of the effectiveness of internal control over financial reporting, included in the accompanying
Management Report on Internal Control over Financial Reporting
. Our responsibility is to express an opinion on these consolidated financial statements and an opinion on Olin Corporation’s internal control over financial reporting based on our audits.
We conducted our audits in accordance with the standards of the Public Company Accounting Oversight Board (United States). Those standards require that we plan and perform the audits to obtain reasonable assurance about whether the financial statements are free of material misstatement and whether effective internal control over financial reporting was maintained in all material respects. Our audits of the consolidated financial statements included examining, on a test basis, evidence supporting the amounts and disclosures in the financial statements, assessing the accounting principles used and significant estimates made by management, and evaluating the overall financial statement presentation. Our audit of internal control over financial reporting included obtaining an understanding of internal control over financial reporting, assessing the risk that a material weakness exists, and testing and evaluating the design and operating effectiveness of internal control based on the assessed risk. Our audits also included performing such other procedures as we considered necessary in the circumstances. We believe that our audits provide a reasonable basis for our opinions.
A company’s internal control over financial reporting is a process designed to provide reasonable assurance regarding the reliability of financial reporting and the preparation of financial statements for external purposes in accordance with generally accepted accounting principles. A company’s internal control over financial reporting includes those policies and procedures that (1) pertain to the maintenance of records that, in reasonable detail, accurately and fairly reflect the transactions and dispositions of the assets of the company; (2) provide reasonable assurance that transactions are recorded as necessary to permit preparation of financial statements in accordance with generally accepted accounting principles, and that receipts and expenditures of the company are being made only in accordance with authorizations of management and directors of the company; and (3) provide reasonable assurance regarding prevention or timely detection of unauthorized acquisition, use, or disposition of the company’s assets that could have a material effect on the financial statements.
Because of its inherent limitations, internal control over financial reporting may not prevent or detect misstatements. Also, projections of any evaluation of effectiveness to future periods are subject to the risk that controls may become inadequate because of changes in conditions, or that the degree of compliance with the policies or procedures may deteriorate.
In our opinion, the consolidated financial statements referred to above present fairly, in all material respects, the financial position of Olin Corporation and subsidiaries as of December 31, 2014 and 2013, and the results of its operations and its cash flows for each of the years in the three-year period ended December 31, 2014, in conformity with U.S. generally accepted accounting principles. Also in our opinion, Olin Corporation maintained, in all material respects, effective internal control over financial reporting as of December 31, 2014, based on criteria established in
Internal Control - Integrated Framework (2013)
issued by the COSO.
/s/ KPMG LLP
St. Louis, Missouri
February 25, 2015
51
December 31
(In millions, except per share data)
|
Assets
|
2014
|
2013
|
|||||
|
Current assets:
|
|||||||
|
Cash and cash equivalents
|
$
|
256.8
|
|
$
|
307.8
|
|
|
|
Receivables, net:
|
|
||||||
|
Trade
|
241.9
|
|
266.5
|
|
|||
|
Other
|
21.2
|
|
13.6
|
|
|||
|
Income taxes receivable
|
21.6
|
|
1.9
|
|
|||
|
Inventories
|
210.1
|
|
186.5
|
|
|||
|
Current deferred income taxes
|
54.2
|
|
50.4
|
|
|||
|
Other current assets
|
10.3
|
|
13.2
|
|
|||
|
Total current assets
|
816.1
|
|
839.9
|
|
|||
|
Property, plant and equipment, net
|
931.0
|
|
987.8
|
|
|||
|
Prepaid pension costs
|
—
|
|
1.7
|
|
|||
|
Restricted cash
|
—
|
|
4.2
|
|
|||
|
Deferred income taxes
|
12.5
|
|
9.0
|
|
|||
|
Other assets
|
191.4
|
|
213.1
|
|
|||
|
Goodwill
|
747.1
|
|
747.1
|
|
|||
|
Total assets
|
$
|
2,698.1
|
|
$
|
2,802.8
|
|
|
|
Liabilities and Shareholders’ Equity
|
|
||||||
|
Current liabilities:
|
|
||||||
|
Current installments of long-term debt
|
$
|
16.4
|
|
$
|
12.6
|
|
|
|
Accounts payable
|
146.8
|
|
148.7
|
|
|||
|
Income taxes payable
|
0.2
|
|
1.7
|
|
|||
|
Accrued liabilities
|
214.3
|
|
244.5
|
|
|||
|
Total current liabilities
|
377.7
|
|
407.5
|
|
|||
|
Long-term debt
|
658.7
|
|
678.4
|
|
|||
|
Accrued pension liability
|
182.0
|
|
115.4
|
|
|||
|
Deferred income taxes
|
107.1
|
|
117.6
|
|
|||
|
Other liabilities
|
359.3
|
|
382.8
|
|
|||
|
Total liabilities
|
1,684.8
|
|
1,701.7
|
|
|||
|
Commitments and contingencies
|
|
|
|||||
|
Shareholders’ equity:
|
|
||||||
|
Common stock, par value $1 per share:
|
|
||||||
|
Authorized, 120.0 shares;
|
|
||||||
|
Issued and outstanding,
77.4
shares (79.4 in 2013)
|
77.4
|
|
79.4
|
|
|||
|
Additional paid-in capital
|
788.3
|
|
838.8
|
|
|||
|
Accumulated other comprehensive loss
|
(443.1
|
)
|
(365.1
|
)
|
|||
|
Retained earnings
|
590.7
|
|
548.0
|
|
|||
|
Total shareholders’ equity
|
1,013.3
|
|
1,101.1
|
|
|||
|
Total liabilities and shareholders’ equity
|
$
|
2,698.1
|
|
$
|
2,802.8
|
|
|
The accompanying notes to consolidated financial statements are an integral part of the consolidated financial statements.
52
Years ended December 31
(In millions, except per share data)
|
2014
|
2013
|
2012
|
|||||||||
|
Sales
|
$
|
2,241.2
|
|
$
|
2,515.0
|
|
$
|
2,184.7
|
|
||
|
Operating expenses:
|
|||||||||||
|
Cost of goods sold
|
1,853.2
|
|
2,033.7
|
|
1,748.0
|
|
|||||
|
Selling and administration
|
170.4
|
|
190.0
|
|
168.6
|
|
|||||
|
Restructuring charges
|
15.7
|
|
5.5
|
|
8.5
|
|
|||||
|
Acquisition costs
|
—
|
|
—
|
|
8.3
|
|
|||||
|
Other operating income
|
1.5
|
|
0.7
|
|
7.6
|
|
|||||
|
Operating income
|
203.4
|
|
286.5
|
|
258.9
|
|
|||||
|
Earnings of non-consolidated affiliates
|
1.7
|
|
2.8
|
|
3.0
|
|
|||||
|
Interest expense
|
43.8
|
|
38.6
|
|
26.4
|
|
|||||
|
Interest income
|
1.3
|
|
0.6
|
|
1.0
|
|
|||||
|
Other income (expense)
|
0.1
|
|
(1.3
|
)
|
(11.3
|
)
|
|||||
|
Income from continuing operations before taxes
|
162.7
|
|
250.0
|
|
225.2
|
|
|||||
|
Income tax provision
|
57.7
|
|
71.4
|
|
75.6
|
|
|||||
|
Income from continuing operations
|
105.0
|
|
178.6
|
|
149.6
|
|
|||||
|
Income from discontinued operations, net
|
0.7
|
|
—
|
|
—
|
|
|||||
|
Net income
|
$
|
105.7
|
|
$
|
178.6
|
|
$
|
149.6
|
|
||
|
Net income per common share:
|
|||||||||||
|
Basic income per common share:
|
|||||||||||
|
Income from continuing operations
|
$
|
1.33
|
|
$
|
2.24
|
|
$
|
1.87
|
|
||
|
Income from discontinued operations, net
|
0.01
|
|
—
|
|
—
|
|
|||||
|
Net income
|
$
|
1.34
|
|
$
|
2.24
|
|
$
|
1.87
|
|
||
|
Diluted income per common share:
|
|||||||||||
|
Income from continuing operations
|
$
|
1.32
|
|
$
|
2.21
|
|
$
|
1.85
|
|
||
|
Income from discontinued operations, net
|
0.01
|
|
—
|
|
—
|
|
|||||
|
Net income
|
$
|
1.33
|
|
$
|
2.21
|
|
$
|
1.85
|
|
||
|
Average common shares outstanding:
|
|||||||||||
|
Basic
|
78.6
|
|
79.9
|
|
80.1
|
|
|||||
|
Diluted
|
79.7
|
|
80.9
|
|
81.0
|
|
|||||
The accompanying notes to consolidated financial statements are an integral part of the consolidated financial statements.
53
CONSOLIDATED STATEMENTS OF COMPREHENSIVE INCOME
Years ended December 31
(In millions)
|
2014
|
2013
|
2012
|
|||||||||
|
Net income
|
$
|
105.7
|
|
$
|
178.6
|
|
$
|
149.6
|
|
||
|
Other comprehensive (loss) income, net of tax:
|
|||||||||||
|
Foreign currency translation adjustments
|
(1.8
|
)
|
(2.6
|
)
|
0.3
|
|
|||||
|
Unrealized (losses) gains on derivative contracts
|
(5.1
|
)
|
(3.8
|
)
|
10.0
|
|
|||||
|
Pension and postretirement liability adjustments, net
|
(86.6
|
)
|
(7.7
|
)
|
(101.9
|
)
|
|||||
|
Amortization of prior service costs and actuarial losses
|
15.5
|
|
20.3
|
|
14.5
|
|
|||||
|
Total other comprehensive (loss) income, net of tax
|
(78.0
|
)
|
6.2
|
|
(77.1
|
)
|
|||||
|
Comprehensive income
|
$
|
27.7
|
|
$
|
184.8
|
|
$
|
72.5
|
|
||
The accompanying notes to consolidated financial statements are an integral part of the consolidated financial statements.
54
|
CONSOLIDATED STATEMENTS OF SHAREHOLDERS’ EQUITY
(In millions, except per share data)
|
||||||||||||||||||||||
|
Common Stock
|
Additional
Paid-In
Capital
|
Accumulated
Other
Comprehensive
Loss
|
Retained
Earnings
|
Total
Shareholders’
Equity
|
||||||||||||||||||
|
Shares
Issued
|
Par
Value
|
|||||||||||||||||||||
|
Balance at January 1, 2012
|
80.1
|
|
$
|
80.1
|
|
$
|
852.0
|
|
$
|
(294.2
|
)
|
$
|
347.9
|
|
$
|
985.8
|
|
|||||
|
Net income
|
—
|
|
—
|
|
—
|
|
—
|
|
149.6
|
|
149.6
|
|
||||||||||
|
Other comprehensive loss
|
—
|
|
—
|
|
—
|
|
(77.1
|
)
|
—
|
|
(77.1
|
)
|
||||||||||
|
Dividends paid:
|
||||||||||||||||||||||
|
Common stock ($0.80 per share)
|
—
|
|
—
|
|
—
|
|
—
|
|
(64.1
|
)
|
(64.1
|
)
|
||||||||||
|
Common stock repurchased and retired
|
(0.2
|
)
|
(0.2
|
)
|
(2.9
|
)
|
—
|
|
—
|
|
(3.1
|
)
|
||||||||||
|
Common stock issued for:
|
||||||||||||||||||||||
|
Stock options exercised
|
0.1
|
|
0.1
|
|
1.3
|
|
—
|
|
—
|
|
1.4
|
|
||||||||||
|
Other transactions
|
0.2
|
|
0.2
|
|
2.4
|
|
—
|
|
—
|
|
2.6
|
|
||||||||||
|
Stock-based compensation
|
—
|
|
—
|
|
3.3
|
|
—
|
|
—
|
|
3.3
|
|
||||||||||
|
Balance at December 31, 2012
|
80.2
|
|
80.2
|
|
856.1
|
|
(371.3
|
)
|
433.4
|
|
998.4
|
|
||||||||||
|
Net income
|
—
|
|
—
|
|
—
|
|
—
|
|
178.6
|
|
178.6
|
|
||||||||||
|
Other comprehensive income
|
—
|
|
—
|
|
—
|
|
6.2
|
|
—
|
|
6.2
|
|
||||||||||
|
Dividends paid:
|
||||||||||||||||||||||
|
Common stock ($0.80 per share)
|
—
|
|
—
|
|
—
|
|
—
|
|
(64.0
|
)
|
(64.0
|
)
|
||||||||||
|
Common stock repurchased and retired
|
(1.5
|
)
|
(1.5
|
)
|
(34.7
|
)
|
—
|
|
—
|
|
(36.2
|
)
|
||||||||||
|
Common stock issued for:
|
||||||||||||||||||||||
|
Stock options exercised
|
0.5
|
|
0.5
|
|
9.2
|
|
—
|
|
—
|
|
9.7
|
|
||||||||||
|
Other transactions
|
0.2
|
|
0.2
|
|
3.0
|
|
—
|
|
—
|
|
3.2
|
|
||||||||||
|
Stock-based compensation
|
—
|
|
—
|
|
5.2
|
|
—
|
|
—
|
|
5.2
|
|
||||||||||
|
Balance at December 31, 2013
|
79.4
|
|
79.4
|
|
838.8
|
|
(365.1
|
)
|
548.0
|
|
1,101.1
|
|
||||||||||
|
Net income
|
—
|
|
—
|
|
—
|
|
—
|
|
105.7
|
|
105.7
|
|
||||||||||
|
Other comprehensive loss
|
—
|
|
—
|
|
—
|
|
(78.0
|
)
|
—
|
|
(78.0
|
)
|
||||||||||
|
Dividends paid:
|
||||||||||||||||||||||
|
Common stock ($0.80 per share)
|
—
|
|
—
|
|
—
|
|
—
|
|
(63.0
|
)
|
(63.0
|
)
|
||||||||||
|
Common stock repurchased and retired
|
(2.5
|
)
|
(2.5
|
)
|
(62.3
|
)
|
—
|
|
—
|
|
(64.8
|
)
|
||||||||||
|
Common stock issued for:
|
||||||||||||||||||||||
|
Stock options exercised
|
0.5
|
|
0.5
|
|
11.6
|
|
—
|
|
—
|
|
12.1
|
|
||||||||||
|
Other transactions
|
—
|
|
—
|
|
(1.4
|
)
|
—
|
|
—
|
|
(1.4
|
)
|
||||||||||
|
Stock-based compensation
|
—
|
|
—
|
|
1.6
|
|
—
|
|
—
|
|
1.6
|
|
||||||||||
|
Balance at December 31, 2014
|
77.4
|
|
$
|
77.4
|
|
$
|
788.3
|
|
$
|
(443.1
|
)
|
$
|
590.7
|
|
$
|
1,013.3
|
|
|||||
The accompanying notes to consolidated financial statements are an integral part of the consolidated financial statements.
55
|
CONSOLIDATED STATEMENTS OF CASH FLOWS
Years ended December 31
(In millions)
|
|||||||||||
|
2014
|
2013
|
2012
|
|||||||||
|
Operating Activities
|
|||||||||||
|
Net income
|
$
|
105.7
|
|
$
|
178.6
|
|
$
|
149.6
|
|
||
|
Adjustments to reconcile net income to net cash and cash equivalents provided by (used for) operating activities:
|
|||||||||||
|
Earnings of non-consolidated affiliates
|
(1.7
|
)
|
(2.8
|
)
|
(3.0
|
)
|
|||||
|
Gain on disposition of non-consolidated affiliate
|
—
|
|
(6.5
|
)
|
—
|
|
|||||
|
Gains on disposition of property, plant and equipment
|
(1.1
|
)
|
(0.4
|
)
|
(2.1
|
)
|
|||||
|
Stock-based compensation
|
5.1
|
|
8.8
|
|
6.2
|
|
|||||
|
Depreciation and amortization
|
139.1
|
|
135.3
|
|
110.9
|
|
|||||
|
Deferred taxes
|
31.0
|
|
12.4
|
|
42.5
|
|
|||||
|
Write-off of equipment and facility included in restructuring charges
|
3.3
|
|
—
|
|
—
|
|
|||||
|
Qualified pension plan contributions
|
(0.8
|
)
|
(1.0
|
)
|
(0.9
|
)
|
|||||
|
Qualified pension plan income
|
(28.5
|
)
|
(24.1
|
)
|
(24.8
|
)
|
|||||
|
Change in assets and liabilities:
|
|||||||||||
|
Receivables
|
25.8
|
|
18.9
|
|
1.2
|
|
|||||
|
Income taxes receivable/payable
|
(27.8
|
)
|
0.4
|
|
0.1
|
|
|||||
|
Inventories
|
(23.6
|
)
|
8.6
|
|
17.9
|
|
|||||
|
Other current assets
|
1.7
|
|
0.7
|
|
(0.1
|
)
|
|||||
|
Accounts payable and accrued liabilities
|
(38.5
|
)
|
1.0
|
|
(0.7
|
)
|
|||||
|
Other assets
|
5.2
|
|
1.3
|
|
0.3
|
|
|||||
|
Other noncurrent liabilities
|
(33.2
|
)
|
(14.5
|
)
|
(17.9
|
)
|
|||||
|
Other operating activities
|
(2.5
|
)
|
0.3
|
|
—
|
|
|||||
|
Net operating activities
|
159.2
|
|
317.0
|
|
279.2
|
|
|||||
|
Investing Activities
|
|||||||||||
|
Capital expenditures
|
(71.8
|
)
|
(90.8
|
)
|
(255.7
|
)
|
|||||
|
Business acquired in purchase transaction, net of cash acquired
|
—
|
|
—
|
|
(310.4
|
)
|
|||||
|
Proceeds from sale/leaseback of equipment
|
—
|
|
35.8
|
|
4.4
|
|
|||||
|
Proceeds from disposition of property, plant and equipment
|
5.6
|
|
4.6
|
|
8.6
|
|
|||||
|
Distributions from affiliated companies, net
|
—
|
|
1.5
|
|
1.3
|
|
|||||
|
Restricted cash activity, net
|
4.2
|
|
7.7
|
|
39.8
|
|
|||||
|
Other investing activities
|
0.3
|
|
(2.6
|
)
|
(0.4
|
)
|
|||||
|
Net investing activities
|
(61.7
|
)
|
(43.8
|
)
|
(512.4
|
)
|
|||||
|
Financing Activities
|
|||||||||||
|
Long-term debt:
|
|||||||||||
|
Borrowings
|
150.0
|
|
—
|
|
200.0
|
|
|||||
|
Repayments
|
(162.4
|
)
|
(23.7
|
)
|
(19.9
|
)
|
|||||
|
Earn out payment - SunBelt
|
(14.8
|
)
|
(17.1
|
)
|
(15.3
|
)
|
|||||
|
Common stock repurchased and retired
|
(64.8
|
)
|
(36.2
|
)
|
(3.1
|
)
|
|||||
|
Stock options exercised
|
6.6
|
|
8.8
|
|
1.3
|
|
|||||
|
Excess tax benefits from stock-based compensation
|
1.1
|
|
1.6
|
|
0.7
|
|
|||||
|
Dividends paid
|
(63.0
|
)
|
(64.0
|
)
|
(64.1
|
)
|
|||||
|
Deferred debt issuance costs
|
(1.2
|
)
|
—
|
|
(6.0
|
)
|
|||||
|
Net financing activities
|
(148.5
|
)
|
(130.6
|
)
|
93.6
|
|
|||||
|
Net (decrease) increase in cash and cash equivalents
|
(51.0
|
)
|
142.6
|
|
(139.6
|
)
|
|||||
|
Cash and cash equivalents, beginning of year
|
307.8
|
|
165.2
|
|
304.8
|
|
|||||
|
Cash and cash equivalents, end of year
|
$
|
256.8
|
|
$
|
307.8
|
|
$
|
165.2
|
|
||
|
Cash paid for interest and income taxes:
|
|||||||||||
|
Interest
|
$
|
36.8
|
|
$
|
37.2
|
|
$
|
27.5
|
|
||
|
Income taxes, net of refunds
|
$
|
49.0
|
|
$
|
61.3
|
|
$
|
28.4
|
|
||
The accompanying notes to consolidated financial statements are an integral part of the consolidated financial statements.
56
NOTES TO CONSOLIDATED FINANCIAL STATEMENTS
DESCRIPTION OF BUSINESS
Olin Corporation is a Virginia corporation, incorporated in 1892. We are a manufacturer concentrated in three business segments: Chlor Alkali Products, Chemical Distribution and Winchester. Chlor Alkali Products, with eight U.S. manufacturing facilities and one Canadian manufacturing facility, produces chlorine and caustic soda, hydrochloric acid, hydrogen, bleach products and potassium hydroxide. Chemical Distribution, with twenty-five owned and leased terminal facilities, manufactures bleach products and distributes caustic soda, bleach products, potassium hydroxide and hydrochloric acid. Winchester, with its principal manufacturing facilities in East Alton, IL and Oxford, MS, produces and distributes sporting ammunition, law enforcement ammunition, reloading components, small caliber military ammunition and components and industrial cartridges.
On August 22, 2012, we acquired
100%
of privately-held KA Steel, whose operating results are included in the accompanying financial statements since the date of the acquisition. For segment reporting purposes, KA Steel comprises the Chemical Distribution segment. KA Steel is one of the largest distributors of caustic soda in North America and manufactures and sells bleach in the Midwest.
ACCOUNTING POLICIES
The preparation of the consolidated financial statements requires estimates and assumptions that affect amounts reported and disclosed in the financial statements and related notes. Actual results could differ from those estimates.
Basis of Presentation
The consolidated financial statements include the accounts of Olin Corporation and all majority-owned subsidiaries. Investment in our affiliates are accounted for on the equity method. Accordingly, we include only our share of earnings or losses of these affiliates in consolidated net income. Certain reclassifications were made to prior year amounts to conform to the
2014
presentation.
Revenue Recognition
Revenues are recognized on sales of product at the time the goods are shipped and the risks of ownership have passed to the customer. Shipping and handling fees billed to customers are included in sales. Allowances for estimated returns, discounts and rebates are recognized when sales are recorded and are based on various market data, historical trends and information from customers. Actual returns, discounts and rebates have not been materially different from estimates.
Cost of Goods Sold and Selling and Administration Expenses
Cost of goods sold includes the costs of inventory sold, related purchasing, distribution and warehousing costs, costs incurred for shipping and handling, depreciation and amortization expense related to these activities and environmental remediation costs and recoveries. Selling and administration expenses include personnel costs associated with sales, marketing and administration, research and development, legal and legal-related costs, consulting and professional services fees, advertising expenses, depreciation expense related to these activities, foreign currency translation and other similar costs.
Other Operating Income
Other operating income consists of miscellaneous operating income items, which are related to our business activities, and gains (losses) on disposition of property, plant and equipment.
57
Included in other operating income were the following:
|
Years Ended December 31,
|
|||||||||||
|
2014
|
2013
|
2012
|
|||||||||
|
($ in millions)
|
|||||||||||
|
Gains (losses) on disposition of property, plant and equipment, net
|
$
|
0.2
|
|
$
|
(1.1
|
)
|
$
|
2.1
|
|
||
|
Amortization of 2007 gain on intangible asset sale (recognized through 2012)
|
—
|
|
—
|
|
0.3
|
|
|||||
|
Gains on dispositions of former manufacturing facilities
|
—
|
|
1.5
|
|
—
|
|
|||||
|
Gains on insurance recoveries
|
—
|
|
—
|
|
4.9
|
|
|||||
|
Gain on resolution of a contract matter
|
1.0
|
|
—
|
|
—
|
|
|||||
|
Other
|
0.3
|
|
0.3
|
|
0.3
|
|
|||||
|
Other operating income
|
$
|
1.5
|
|
$
|
0.7
|
|
$
|
7.6
|
|
||
The gains on disposition of property, plant and equipment in
2012
were primarily associated with the Charleston, TN conversion project, which was completed in the second half of 2012. The gain on insurance recoveries in 2012 was associated with business interruption related to an outage of one of our Chlor Alkali customers in the first half of 2012.
Other Income (Expense)
Other income (expense) consists of non-operating income items which are not related to our primary business activities. Other income (expense) in
2013
and
2012
included
$7.9 million
and
$11.5 million
, respectively, of expense for our earn out liability from the SunBelt acquisition. Other income (expense) in 2013 also included a gain of
$6.5 million
on the sale of our equity interest in a bleach joint venture.
Foreign Currency Translation
The functional currency for our Canadian subsidiaries is the U.S. dollar; accordingly, gains and losses resulting from balance sheet translations are included in selling and administration. The functional currency of other foreign affiliates is the local currency; therefore the balance sheet amounts are translated at the exchange rates in effect at year-end, and operations statement amounts are translated at the average rates of exchange prevailing during the year. Translation adjustments are included in accumulated other comprehensive loss.
Cash and Cash Equivalents
All highly liquid investments, with a maturity of three months or less at the date of purchase, are considered to be cash equivalents.
Short-Term Investments
We classify our marketable securities as available-for-sale, which are reported at fair market value with unrealized gains and losses included in accumulated other comprehensive loss, net of applicable taxes. The fair value of marketable securities is determined by quoted market prices. Realized gains and losses on sales of investments, as determined on the specific identification method, and declines in value of securities judged to be other-than-temporary are included in other income (expense) in the consolidated statements of operations. Interest and dividends on all securities are included in interest income and other income (expense), respectively.
Allowance for Doubtful Accounts Receivable
We evaluate the collectibility of accounts receivable based on a combination of factors. We estimate an allowance for doubtful accounts as a percentage of net sales based on historical bad debt experience. This estimate is periodically adjusted when we become aware of a specific customer’s inability to meet its financial obligations (e.g., bankruptcy filing) or as a result of changes in the overall aging of accounts receivable. While we have a large number of customers that operate in diverse businesses and are geographically dispersed, a general economic downturn in any of the industry segments in which we operate could result in higher than expected defaults, and, therefore, the need to revise estimates for the provision for doubtful accounts could occur.
58
Inventories
Inventories are valued at the lower of cost or market. The Chlor Alkali Products and Winchester segments inventory costs are determined principally by the dollar value last-in, first-out (LIFO) method of inventory accounting. The Chemical Distribution segment inventory costs are determined principally by the first-in, first-out (FIFO) method of inventory accounting. Cost for other inventories has been determined principally by the average-cost method (primarily operating supplies, spare parts and maintenance parts). Elements of costs in inventories include raw materials, direct labor and manufacturing overhead.
Property, Plant and Equipment
Property, plant and equipment are recorded at cost. Depreciation is computed on a straight-line basis over the estimated useful lives of the related assets. Interest costs incurred to finance expenditures for major long-term construction projects are capitalized as part of the historical cost and included in property, plant and equipment and are depreciated over the useful lives of the related assets. Leasehold improvements are amortized over the term of the lease or the estimated useful life of the improvement, whichever is shorter. Start-up costs are expensed as incurred. Expenditures for maintenance and repairs are charged to expense when incurred while the costs of significant improvements, which extend the useful life of the underlying asset, are capitalized.
Property, plant and equipment are reviewed for impairment when conditions indicate that the carrying values of the assets may not be recoverable. Such impairment conditions include an extended period of idleness or a plan of disposal. If such impairment indicators are present or other factors exist that indicate that the carrying amount of an asset may not be recoverable, we determine whether impairment has occurred through the use of an undiscounted cash flow analysis at the lowest level for which identifiable cash flows exist. For our Chlor Alkali Products and Winchester segments, the lowest level for which identifiable cash flows exist is the operating facility level or an appropriate grouping of operating facilities level. For our Chemical Distribution segment, the lowest level for which identifiable cash flows exist is the segment level. The amount of impairment loss, if any, is measured by the difference between the net book value of the assets and the estimated fair value of the related assets.
Restricted Cash
Restricted cash, which is restricted as to withdrawal or usage, is classified separately from cash and cash equivalents on our consolidated balance sheet. A portion of the proceeds of the bonds issued by Alabama, Mississippi and Tennessee, along with their accrued interest income, were required to remain with a trustee and were classified on our consolidated balance sheet as a noncurrent asset until such time as we request reimbursement of qualifying amounts used to fund capital projects in Alabama, Mississippi and Tennessee. The proceeds were fully utilized as of December 31,
2014
.
Asset Retirement Obligations
We record the fair value of an asset retirement obligation associated with the retirement of a tangible long-lived asset as a liability in the period incurred. The liability is measured at discounted fair value and is adjusted to its present value in subsequent periods as accretion expense is recorded. The corresponding asset retirement costs are capitalized as part of the carrying amount of the related long-lived asset and depreciated over the asset’s useful life. Asset retirement obligations are reviewed annually in the fourth quarter and/or when circumstances or other events indicate that changes underlying retirement assumptions may have occurred.
59
The activity of our asset retirement obligation was as follows:
|
December 31,
|
|||||||
|
2014
|
2013
|
||||||
|
($ in millions)
|
|||||||
|
Beginning balance
|
$
|
60.8
|
|
$
|
67.8
|
|
|
|
Accretion
|
3.5
|
|
3.3
|
|
|||
|
Spending
|
(11.2
|
)
|
(11.3
|
)
|
|||
|
Currency translation adjustments
|
(0.7
|
)
|
(0.6
|
)
|
|||
|
Adjustments
|
2.0
|
|
1.6
|
|
|||
|
Ending balance
|
$
|
54.4
|
|
$
|
60.8
|
|
|
At December 31,
2014
and
2013
, our consolidated balance sheets included an asset retirement obligation of
$44.2 million
and
$47.3 million
, respectively, which were classified as other noncurrent liabilities.
In
2014
, we had net adjustments that increased the asset retirement obligation by
$2.0 million
, which were primarily comprised of increases in estimated costs for certain assets. In
2013
, we had net adjustments that increased the asset retirement obligation by
$1.6 million
, which were primarily due to changes in the estimated timing of payments for certain assets.
Comprehensive Income (Loss)
Accumulated other comprehensive loss consists of foreign currency translation adjustments, pension and postretirement liability adjustments, pension and postretirement amortization of prior service costs and actuarial losses and net unrealized (losses) gains on derivative contracts. We do not provide for U.S. income taxes on foreign currency translation adjustments since we do not provide for such taxes on undistributed earnings for foreign subsidiaries that have been permanently reinvested.
Goodwill
Goodwill is not amortized, but is reviewed for impairment annually in the fourth quarter and/or when circumstances or other events indicate that impairment may have occurred. On January 1, 2012, we adopted ASU 2011-08 which permits entities to make a qualitative assessment of whether it is more likely than not that a reporting unit’s fair value is less than its carrying amount before applying the two-step goodwill impairment test. Circumstances that are considered as part of the qualitative assessment and could trigger the two-step impairment test include, but are not limited to: a significant adverse change in the business climate; a significant adverse legal judgment; adverse cash flow trends; an adverse action or assessment by a government agency; unanticipated competition; decline in our stock price; and a significant restructuring charge within a reporting unit. It is our practice, at a minimum, to perform a quantitative goodwill impairment test in the fourth quarter every three years. In the fourth quarter of 2014, we performed our triennial quantitative goodwill impairment test for our reporting units. We define reporting units at the business segment level. For purposes of testing goodwill for impairment, goodwill has been allocated to our reporting units, Chlor Alkali Products and Chemical Distribution, to the extent it relates to each reporting unit.
We use a discounted cash flow approach to develop the estimated fair value of a reporting unit when a quantitative test is performed. Management judgment is required in developing the assumptions for the discounted cash flow model. We also corroborate our discounted cash flow analysis by evaluating a market-based approach that considers EBITDA multiples from a representative sample of comparable public companies. As a further indicator that each reporting unit has been valued appropriately using a discounted cash flow model, the aggregate fair value of all reporting units is reconciled to the total market value of Olin. An impairment would be recorded if the carrying amount exceeded the estimated fair value. Based on the aforementioned analysis, the estimated fair value of our Chlor Alkali Products reporting unit substantially exceeded the carrying value of the reporting unit. The estimated fair value of our Chemical Distribution reporting unit also exceeded the carrying value of the reporting unit.
No
impairment charges were recorded for
2014
,
2013
or
2012
.
60
The discount rate, profitability assumptions and terminal growth rate of our chlor alkali and chemical distribution businesses and the cyclical nature of our chlor alkali business were the material assumptions utilized in the discounted cash flow model used to estimate the fair value of each reporting unit. The discount rate reflects a weighted-average cost of capital, which is calculated based on observable market data. Some of these data (such as the risk free or treasury rate and the pretax cost of debt) are based on the market data at a point in time. Other data (such as the equity risk premium) are based upon
market data over time for a peer group of companies in the chemical manufacturing or distribution industries with a market capitalization premium added, as applicable.
The discounted cash flow analysis requires estimates, assumptions and judgments about future events. Our analysis uses our internally generated long-range plan. Our discounted cash flow analysis uses the assumptions in our long-range plan about terminal growth rates, forecasted capital expenditures and changes in future working capital requirements to determine the implied fair value of each reporting unit. The long-range plan reflects management judgment, supplemented by independent chemical industry analyses which provide multi-year chlor alkali industry operating and pricing forecasts.
We believe the assumptions used in our goodwill impairment analysis are appropriate and result in reasonable estimates of the implied fair value of each reporting unit. However, given the economic environment and the uncertainties regarding the impact on our business, there can be no assurance that our estimates and assumptions, made for purposes of our goodwill impairment testing during the fourth quarter of 2014, will prove to be an accurate prediction of the future. If our assumptions regarding future performance are not achieved, we may be required to record goodwill impairment charges in future periods. It is not possible at this time to determine if any such future impairment charge would result or, if it does, whether such charge would be material.
There were no changes in the carrying value of goodwill in
2014
or
2013
.
Other Assets
Included in other assets were the following:
|
December 31,
|
|||||||
|
2014
|
2013
|
||||||
|
($ in millions)
|
|||||||
|
Investments in non-consolidated affiliates
|
$
|
23.3
|
|
$
|
21.6
|
|
|
|
Intangible assets (less accumulated amortization of $42.6 million and $28.0 million, respectively)
|
123.5
|
|
138.1
|
|
|||
|
Deferred debt issuance costs
|
10.3
|
|
14.4
|
|
|||
|
Bleach joint venture receivable
|
7.8
|
|
15.6
|
|
|||
|
Income tax receivable
|
6.6
|
|
—
|
|
|||
|
Interest rate swaps
|
3.5
|
|
5.9
|
|
|||
|
Other
|
16.4
|
|
17.5
|
|
|||
|
Other assets
|
$
|
191.4
|
|
$
|
213.1
|
|
|
Intangible assets consisted of the following:
|
December 31,
|
|||||||||||||||||||||||||
|
2014
|
2013
|
||||||||||||||||||||||||
|
Useful Lives
|
Gross Amount
|
Accumulated Amortization
|
Net
|
Gross Amount
|
Accumulated Amortization
|
Net
|
|||||||||||||||||||
|
($ in millions)
|
|||||||||||||||||||||||||
|
Customers, customer contracts and relationships
|
(10-15 years)
|
$
|
152.9
|
|
$
|
(41.0
|
)
|
$
|
111.9
|
|
$
|
152.9
|
|
$
|
(26.6
|
)
|
$
|
126.3
|
|
||||||
|
KA Steel trade name
|
(indefinite)
|
10.9
|
|
—
|
|
10.9
|
|
10.9
|
|
—
|
|
10.9
|
|
||||||||||||
|
Other
|
(4-10 years)
|
2.3
|
|
(1.6
|
)
|
0.7
|
|
2.3
|
|
(1.4
|
)
|
0.9
|
|
||||||||||||
|
Total intangible assets
|
$
|
166.1
|
|
$
|
(42.6
|
)
|
$
|
123.5
|
|
$
|
166.1
|
|
$
|
(28.0
|
)
|
$
|
138.1
|
|
|||||||
61
The August 22, 2012 valuation of identifiable intangible assets that were obtained from the KA Steel acquisition included
$128.0 million
associated with customers, customer contracts and relationships and are being amortized over
ten
years on a straight-line basis,
$10.9 million
associated with the KA Steel trade name, which management estimates to have an indefinite useful life, and
$0.4 million
associated with a favorable lease agreement that will be amortized over the remaining lease term (approximately
four
years) on a straight line basis. The February 28, 2011 valuation of identifiable intangible assets that were obtained from the SunBelt acquisition included
$5.8 million
associated with customers, customer contracts and relationships and are being amortized over
fifteen
years on a straight-line basis. The identifiable intangible assets obtained from the Pioneer acquisition included
$19.0 million
associated with customers, customer contracts and relationships and are being amortized over
fifteen
years on a straight-line basis and
$1.2 million
associated with internally developed and purchased software and was amortized over
five
years on a straight-line basis. Amortization expense was
$14.6 million
in both
2014
and
2013
and
$6.5 million
in
2012
. We estimate that amortization expense will be approximately
$14.6 million
in each of the next two years and approximately
$14.5 million
in 2017, 2018 and 2019. Intangible assets are reviewed for impairment annually in the fourth quarter and/or when circumstances or other events indicate that impairment may have occurred.
During 2012, we adopted ASU 2012-02 which permits entities to make a qualitative assessment of whether it is more likely than not that an indefinite-lived intangible asset’s fair value is less than its carrying amount before performing a quantitative impairment test. Circumstances that are considered as part of the qualitative assessment and could trigger a quantitative impairment test include, but are not limited to: a significant adverse change in the business climate; a significant adverse legal judgment including asset specific factors; adverse cash flow trends; an adverse action or assessment by a government agency; unanticipated competition; decline in our stock price; and a significant restructuring charge within a reporting unit. Based upon our qualitative assessment, it is more likely than not that the fair value of our indefinite-lived intangible asset is greater than its carrying amount as of December 31,
2014
.
No
impairment of our intangible assets were recorded in
2014
,
2013
or
2012
.
Environmental Liabilities and Expenditures
Accruals (charges to income) for environmental matters are recorded when it is probable that a liability has been incurred and the amount of the liability can be reasonably estimated, based upon current law and existing technologies. These amounts, which are not discounted and are exclusive of claims against third parties, are adjusted periodically as assessment and remediation efforts progress or additional technical or legal information becomes available. Environmental costs are capitalized if the costs increase the value of the property and/or mitigate or prevent contamination from future operations.
Discontinued Operations
We present the results of operations, financial position and cash flows that have either been sold or that meet the criteria for “held for sale” accounting as discontinued operations. At the time an operation qualifies for held for sale accounting, the operation is evaluated to determine whether or not the carrying value exceeds its fair value less cost to sell. Any loss as a result of carrying value in excess of fair value less cost to sell is recorded in the period the operation meets held for sale accounting. Management judgment is required to assess the criteria required to meet held for sale accounting, and estimate fair value. Changes to the operation could cause it to no longer qualify for held for sale accounting and changes to fair value or adjustments to amounts previously reported as discontinued operations could result in an increase or decrease to previously recognized losses.
Income Taxes
Deferred taxes are provided for differences between the financial statement and tax bases of assets and liabilities using enacted tax rates in effect for the year in which the differences are expected to reverse. A valuation allowance is provided to offset deferred tax assets if, based on the available evidence, it is more likely than not that some or all of the value of the deferred tax assets will not be realized.
62
Derivative Financial Instruments
We are exposed to market risk in the normal course of our business operations due to our purchases of certain commodities, our ongoing investing and financing activities and our operations that use foreign currencies. The risk of loss can be assessed from the perspective of adverse changes in fair values, cash flows and future earnings. We have established policies and procedures governing our management of market risks and the use of financial instruments to manage exposure to such risks. We use hedge accounting treatment for substantially all of our business transactions whose risks are covered using derivative instruments. The hedge accounting treatment provides for the deferral of gains or losses on derivative instruments until such time as the related transactions occur.
Concentration of Credit Risk
Accounts receivable is the principal financial instrument which subjects us to a concentration of credit risk. Credit is extended based upon the evaluation of a customer’s financial condition and, generally, collateral is not required. Concentrations of credit risk with respect to receivables are somewhat limited due to our large number of customers, the diversity of these customers’ businesses and the geographic dispersion of such customers. The majority of our accounts receivable are derived from sales denominated in U.S. dollars. We maintain an allowance for doubtful accounts based upon the expected collectibility of all trade receivables.
Fair Value
Fair value is defined as the price at which an asset could be exchanged in a current transaction between knowledgeable, willing parties or the amount that would be paid to transfer a liability to a new obligor, not the amount that would be paid to settle the liability with the creditor. Where available, fair value is based on observable market prices or parameters or derived from such prices or parameters. Where observable prices or inputs are not available, valuation models are applied. These valuation techniques involve some level of management estimation and judgment, the degree of which is dependent on the price transparency for the instruments or market and the instruments’ complexity.
Assets and liabilities recorded at fair value in the consolidated balance sheets are categorized based upon the level of judgment associated with the inputs used to measure their fair value. Hierarchical levels, defined by ASC 820, and directly related to the amount of subjectivity associated with the inputs to fair valuation of these assets and liabilities, are as follows:
Level 1 — Inputs were unadjusted, quoted prices in active markets for identical assets or liabilities at the measurement date.
Level 2 — Inputs (other than quoted prices included in Level 1) were either directly or indirectly observable for the asset or liability through correlation with market data at the measurement date and for the duration of the instrument’s anticipated life.
Level 3 — Inputs reflected management’s best estimate of what market participants would use in pricing the asset or liability at the measurement date. Consideration was given to the risk inherent in the valuation technique and the risk inherent in the inputs to the model.
Retirement-Related Benefits
We account for our defined benefit pension plans and non-pension postretirement benefit plans using actuarial models required by ASC 715. These models use an attribution approach that generally spreads the financial impact of changes to the plan and actuarial assumptions over the average remaining service lives of the employees in the plan. Changes in liability due to changes in actuarial assumptions such as discount rate, rate of compensation increases and mortality, as well as annual deviations between what was assumed and what was experienced by the plan are treated as actuarial gains or losses. The principle underlying the required attribution approach is that employees render service over their average remaining service lives on a relatively smooth basis and, therefore, the accounting for benefits earned under the pension or non-pension postretirement benefits plans should follow the same relatively smooth pattern. Substantially all defined benefit pension plan participants are no longer accruing benefits; therefore, actuarial gains and losses are amortized based upon the remaining life expectancy of the inactive plan participants. For the years ended December 31,
2014
and
2013
, the average remaining life expectancy of the inactive participants in the defined benefit pension plan was
18
years.
63
One of the key assumptions for the net periodic pension calculation is the expected long-term rate of return on plan assets, used to determine the “market-related value of assets.” The “market-related value of assets” recognizes differences between the plan’s actual return and expected return over a five year period. The required use of an expected long-term rate of return on the market-related value of plan assets may result in a recognized pension income that is greater or less than the actual returns of those plan assets in any given year. Over time, however, the expected long-term returns are designed to approximate the actual long-term returns and, therefore, result in a pattern of income and expense recognition that more closely matches the pattern of the services provided by the employees. As differences between actual and expected returns are recognized over five years, they subsequently generate gains and losses that are subject to amortization over the average remaining life expectancy of the inactive plan participants, as described in the preceding paragraph.
We use long-term historical actual return information, the mix of investments that comprise plan assets, and future estimates of long-term investment returns and inflation by reference to external sources to develop the expected long-term rate of return on plan assets as of December 31.
The discount rate assumptions used for pension and non-pension postretirement benefit plan accounting reflect the rates available on high-quality fixed-income debt instruments on December 31 of each year. The rate of compensation increase is based upon our long-term plans for such increases. For retiree medical plan accounting, we review external data and our own historical trends for healthcare costs to determine the healthcare cost trend rates.
Stock-Based Compensation
We measure the cost of employee services received in exchange for an award of equity instruments, such as stock options, performance shares and restricted stock, based on the grant-date fair value of the award. This cost is recognized over the period during which an employee is required to provide service in exchange for the award, the requisite service period (usually the vesting period). An initial measurement is made of the cost of employee services received in exchange for an award of liability instruments based on its current fair value and the value of that award is subsequently remeasured at each reporting date through the settlement date. Changes in fair value of liability awards during the requisite service period are recognized as compensation cost over that period.
The fair value of each option granted, which typically vests ratably over
three
years, but not less than
one
year, was estimated on the date of grant, using the Black-Scholes option-pricing model with the following assumptions:
|
2014
|
2013
|
2012
|
|||||||||
|
Dividend yield
|
3.13
|
%
|
3.44
|
%
|
3.65
|
%
|
|||||
|
Risk-free interest rate
|
2.13
|
%
|
1.35
|
%
|
1.36
|
%
|
|||||
|
Expected volatility
|
42
|
%
|
43
|
%
|
43
|
%
|
|||||
|
Expected life (years)
|
7.0
|
|
7.0
|
|
7.0
|
|
|||||
|
Weighted average grant fair value (per option)
|
$
|
8.34
|
|
$
|
7.05
|
|
$
|
6.55
|
|
||
|
Weighted average exercise price
|
$
|
25.69
|
|
$
|
23.28
|
|
$
|
21.92
|
|
||
|
Shares granted
|
624,200
|
|
621,000
|
|
480,250
|
|
|||||
Dividend yield was based on a historical average. Risk-free interest rate was based on zero coupon U.S. Treasury securities rates for the expected life of the options. Expected volatility was based on our historical stock price movements, as we believe that historical experience is the best available indicator of the expected volatility. Expected life of the option grant was based on historical exercise and cancellation patterns, as we believe that historical experience is the best estimate for future exercise patterns.
RECENT ACCOUNTING PRONOUNCEMENTS
In January 2015, the FASB issued ASU 2015-01 which amends ASC 225-20. This update eliminates the income statement concept of extraordinary items and also expands the disclosure requirements of items that are unusual in nature or occur infrequently. This update is effective for fiscal years beginning after December 15, 2015. This update will not have a material effect on our consolidated financial statements.
64
In May 2014, the FASB issued ASU 2014-09, which amends ASC 605 and creates a new topic, ASC 606. This update provides guidance on how an entity should recognize revenue to depict the transfer of promised goods or services to customers in an amount that reflects the consideration to which the entity expects to be entitled in exchange for those goods or services. This update is effective for fiscal years, and interim periods within those years, beginning after December 15, 2016. We are currently evaluating the effect of this update on our financial statements and have not yet determined the method of initial application we will use.
In April 2014, the FASB issued ASU 2014-08, which amends ASC 205 and ASC 360. This update changes the criteria for a disposal transaction to qualify as a discontinued operation. This update also expands the disclosure requirements surrounding discontinued operations. This update is effective for fiscal years beginning after December 15, 2014. This update will not have a material effect on our consolidated financial statements.
In July 2013, the FASB issued ASU 2013-11, which amends ASC 740. This update provides guidance on the financial statement presentation of unrecognized tax benefits when net operating loss carryforwards, similar tax losses or tax credit carryforwards exist. We adopted the provisions of ASU 2013-11 on January 1, 2014. This update did not have a material effect on our consolidated financial statements.
In February 2013, the FASB issued ASU 2013-04, which amends ASC 405. This update clarifies how entities measure obligations resulting from joint and several liability arrangements. We adopted the provisions of ASU 2013-04 on January 1, 2014. This update did not have a material effect on our consolidated financial statements.
In February 2013, the FASB issued ASU 2013-02, which amends ASC 220. This update adds new disclosure requirements about reclassifications out of accumulated other comprehensive income including the effects of these reclassifications on net income. We adopted the provisions of ASU 2013-02 on January 1, 2013. This update did not have a material effect on our consolidated financial statements.
In July 2012, the FASB issued ASU 2012-02 which amends ASC 350. This update permits entities to make a qualitative assessment of whether it is more likely than not that an indefinite-lived intangible asset’s fair value is less than its carrying amount before performing a quantitative impairment test. If an entity concludes that it is not more likely than not that the fair value of the indefinite-lived intangible asset is less than its carrying amount, it would not be required to perform the quantitative test for that asset. We adopted the provisions of ASU 2012-02 during 2012. This update did not have a material effect on our consolidated financial statements.
In September 2011, the FASB issued ASU 2011-08, which amends ASC 350. This update permits entities to make a qualitative assessment of whether it is more likely than not that a reporting unit’s fair value is less than its carrying amount before applying the two-step goodwill impairment test. If an entity concludes that it is not more likely than not that the fair value of a reporting unit is less than its carrying amount, it would not be required to perform the two-step impairment test for that reporting unit. We adopted the provisions of ASU 2011-08 on January 1, 2012. This update did not have a material effect on our consolidated financial statements.
During 2011, the FASB issued ASU 2011-05 and ASU 2011-12. These updates require entities to present items of net income and other comprehensive income either in one continuous statement, referred to as the statement of comprehensive income, or in two separate, but consecutive, statements of net income and other comprehensive income. We retrospectively adopted the provisions of ASU 2011-05 and ASU 2011-12 on January 1, 2012. These updates required modification of our consolidated financial statements presentation. These update did not have a material effect on our consolidated financial statements.
In May 2011, the FASB issued ASU 2011-04, which amends ASC 820. This update clarifies the existing guidance and amends the wording used to describe many of the requirements in U.S. GAAP for measuring fair value and for disclosing information about fair value measurements. This update became effective for us on January 1, 2012. This update did not have a material effect on our consolidated financial statements.
ACQUISITION
On August 22, 2012, we acquired
100%
of privately-held KA Steel, on a debt free basis, for
$336.6 million
in cash, after receiving the final working capital adjustment of
$1.9 million
. As of the date of acquisition, KA Steel had cash and cash equivalents of
$26.2 million
. KA Steel is one of the largest distributors of caustic soda in North America and manufactures and sells bleach in the Midwest.
65
The acquisition was partially financed with proceeds from the
$200.0 million
of 2022 Notes sold on August 22, 2012 with a maturity date of August 15, 2022. Proceeds from the 2022 Notes were
$196.0 million
, after expenses of
$4.0 million
.
For segment reporting purposes, KA Steel comprises the Chemical Distribution segment. The KA Steel results of operations have been included in our consolidated results for the period subsequent to the effective date of the acquisition. Our results for the year ended December 31, 2012 include KA Steel sales of
$156.3 million
and
$4.5 million
of segment income, which includes depreciation and amortization expense of
$5.5 million
, primarily associated with the acquisition fair value adjustment related to the KA Steel acquisition.
The transaction has been accounted for using the acquisition method of accounting which requires, among other things, that assets acquired and liabilities assumed be recognized at their fair values as of the acquisition date. We finalized our purchase price allocation during the fourth quarter of 2012. The following table summarizes the allocation of the purchase price to KA Steel’s assets and liabilities:
|
August 22,
2012
|
|||
|
($ in millions)
|
|||
|
Total current assets
|
$
|
128.1
|
|
|
Property, plant and equipment
|
25.1
|
|
|
|
Deferred taxes
|
1.6
|
|
|
|
Intangible assets
|
139.3
|
|
|
|
Total assets acquired
|
294.1
|
|
|
|
Total current liabilities
|
64.2
|
|
|
|
Other liabilities
|
10.4
|
|
|
|
Total liabilities assumed
|
74.6
|
|
|
|
Net identifiable assets acquired
|
219.5
|
|
|
|
Goodwill
|
119.7
|
|
|
|
Fair value of net assets acquired
|
$
|
339.2
|
|
|
Supplemental Data
|
|||
|
Cash paid
|
$
|
336.6
|
|
|
Olin trade accounts receivable from KA Steel
|
2.6
|
|
|
|
Total fair value of consideration
|
$
|
339.2
|
|
Included in total current assets are cash and cash equivalents of
$26.2 million
and receivables of
$63.1 million
with a contracted value of
$63.5 million
. Included in other liabilities is an accrued contingent liability of
$10.0 million
for the withdrawal from a multi-employer defined benefit pension plan. This accrued contingent liability was paid during 2014.
Based on final valuations, we allocated
$128.0 million
of the purchase price to intangible assets relating to customers, customer contracts and relationships, which management estimates to have a useful life of
ten
years,
$10.9 million
to intangible assets associated with the KA Steel trade name, which management estimates to have an indefinite useful life, and
$0.4 million
associated with a favorable lease agreement that will be amortized over the remaining life of the lease term (approximately
four
years) on a straight line basis. These identifiable intangible assets were included in other assets. Based on final valuations,
$119.7 million
was assigned to goodwill, all of which is deductible for tax purposes. The primary reasons for the acquisition and the principal factors that contributed to a KA Steel purchase price that resulted in the recognition of goodwill are the expanded capability to market and sell caustic soda, bleach, potassium hydroxide and hydrochloric acid, as well as the geographic diversification the KA Steel locations provide us, and the strengthened position in the industrial bleach segment.
Goodwill and the indefinite-lived trade name intangible asset recorded in the acquisition are not amortized but will be reviewed for impairment annually in the fourth quarter and/or when circumstances or other events indicate that impairment may have occurred.
66
The following pro forma summary presents the condensed statement of income as if the acquisition of KA Steel had occurred on January 1, 2012 (unaudited).
|
Year Ended
December 31, 2012
|
|||
|
($ in millions, except per share data)
|
|||
|
Sales
|
$
|
2,462.6
|
|
|
Net income
|
160.1
|
|
|
|
Net income per common share:
|
|||
|
Basic
|
$
|
2.00
|
|
|
Diluted
|
$
|
1.98
|
|
The pro forma statements of income were prepared based on historical financial information and have been adjusted to give effect to pro forma adjustments that are (i) directly attributable to the transaction, (ii) factually supportable and (iii) expected to have a continuing impact on the combined results. The pro forma statements of income use estimates and assumptions based on information available at the time. Management believes the estimates and assumptions to be reasonable; however, actual results may differ significantly from this pro forma financial information. The pro forma information is not intended to reflect the actual results that would have occurred had the companies actually been combined during the periods presented. The pro forma data reflect the application of the following adjustments:
|
•
|
Additional amortization expense related to the fair value of acquired identifiable intangible assets (
$8.0 million
for the year ended December 31, 2012).
|
|
•
|
Additional depreciation expense related to the fair value adjustment to property, plant and equipment and conforming KA Steel’s useful lives to ours (
$0.2 million
for the year ended December 31, 2012).
|
|
•
|
Increase in interest expense related to the 2022 Notes issued in conjunction with this acquisition (
$7.1 million
for the year ended December 31, 2012).
|
|
•
|
Elimination of intersegment sales of caustic soda and bleach between KA Steel and Chlor Alkali Products at prices that approximate market (
$23.2 million
for the year ended December 31, 2012).
|
|
•
|
Elimination of transaction costs incurred in 2012 that are directly related to the transaction, and do not have a continuing impact on our combined operating results (
$8.3 million
for the year ended December 31, 2012).
|
In addition, the pro forma data reflect the tax effect of all of the above adjustments. The pro forma tax provision reflects an increase of
$1.1 million
for the year ended December 31, 2012 associated with the incremental pretax income, the fair value adjustments for acquired intangible assets and property, plant and equipment, and the interest expense of the 2022 Notes issued in conjunction with this acquisition, which reflects the marginal tax of the adjustments in the various jurisdictions where such adjustments occurred.
RESTRUCTURING CHARGES
On
December 12, 2014
, we announced that we had made the decision to permanently close the portion of the Becancour, Canada chlor alkali facility that has been shut down since late June 2014. This action reduces the facility’s chlor alkali capacity by
185,000
tons. The plant will predominantly focus on bleach and hydrochloric acid, which are value-added products, as well as caustic soda. In the fourth quarter of
2014
, we recorded pretax restructuring charges of
$10.0 million
for the write-off of equipment and facility costs, employee severance and related benefit costs, lease and other contract termination costs and a non-cash pension curtailment charge related to these actions. We expect to incur additional restructuring charges through 2016 of approximately
$5 million
related to the shut down of this portion of the facility.
On
December 9, 2010
, our board of directors approved a plan to eliminate our use of mercury in the manufacture of chlor alkali products. Under the plan, the
260,000
tons of mercury cell capacity at our Charleston, TN facility was converted to
200,000
tons of membrane capacity capable of producing both potassium hydroxide and caustic soda. The board of directors also approved plans to reconfigure our Augusta, GA facility to manufacture bleach and distribute caustic soda, while discontinuing chlor alkali manufacturing at this site. The completion of these projects eliminated our chlor alkali production using mercury cell technology. For the years ended December 31,
2014
,
2013
and
2012
, we recorded pretax restructuring charges of
$3.8 million
,
$3.7 million
and
$2.3 million
, respectively, for employee severance and related benefit costs, employee relocation costs, facility exit costs, write-off of equipment and facility costs and lease and other contract termination costs related to these actions.
67
On
November 3, 2010
, we announced that we made the decision to relocate the Winchester centerfire pistol and rifle ammunition manufacturing operations from East Alton, IL to Oxford, MS. This relocation, when completed, is forecast to reduce Winchester’s annual operating costs by approximately
$35 million
to
$40 million
. Consistent with this decision in 2010, we initiated an estimated
$110 million
five-year project, which includes approximately
$80 million
of capital spending. The capital spending was partially financed by
$31 million
of grants provided by the State of Mississippi and local governments. We currently expect to complete this relocation by the end of 2016. For the years ended December 31,
2014
,
2013
and
2012
, we recorded pretax restructuring charges of
$1.9 million
,
$1.8 million
and
$6.2 million
, respectively, for employee severance and related benefit costs, employee relocation costs and facility exit costs related to these actions. We expect to incur additional restructuring charges through 2016 of approximately
$3 million
related to the transfer of these operations.
The following table summarizes the
2014
,
2013
and
2012
activities by major component of these 2014 and 2010 restructuring actions and the remaining balances of accrued restructuring costs as of December 31,
2014
:
|
Employee severance and job related benefits
|
Pension curtailment
|
Lease and other contract termination costs
|
Employee relocation costs
|
Facility exit costs
|
Write-off of equipment and facility
|
Total
|
|||||||||||||||||||||
|
($ in millions)
|
|||||||||||||||||||||||||||
|
Balance January 1, 2012
|
$
|
11.3
|
|
$
|
—
|
|
$
|
0.8
|
|
$
|
—
|
|
$
|
—
|
|
$
|
—
|
|
$
|
12.1
|
|
||||||
|
2012 restructuring charges
|
4.1
|
|
—
|
|
0.1
|
|
2.2
|
|
2.1
|
|
—
|
|
8.5
|
|
|||||||||||||
|
Amounts utilized
|
(1.9
|
)
|
—
|
|
(0.5
|
)
|
(2.2
|
)
|
(2.1
|
)
|
—
|
|
(6.7
|
)
|
|||||||||||||
|
Balance at December 31, 2012
|
13.5
|
|
—
|
|
0.4
|
|
—
|
|
—
|
|
—
|
|
13.9
|
|
|||||||||||||
|
2013 restructuring charges (credits)
|
0.4
|
|
—
|
|
(0.4
|
)
|
0.6
|
|
4.9
|
|
—
|
|
5.5
|
|
|||||||||||||
|
Amounts utilized
|
(3.7
|
)
|
—
|
|
—
|
|
(0.6
|
)
|
(4.9
|
)
|
—
|
|
(9.2
|
)
|
|||||||||||||
|
Balance at December 31, 2013
|
10.2
|
|
—
|
|
—
|
|
—
|
|
—
|
|
—
|
|
10.2
|
|
|||||||||||||
|
2014 restructuring charges
|
4.3
|
|
0.2
|
|
4.5
|
|
0.5
|
|
2.9
|
|
3.3
|
|
15.7
|
|
|||||||||||||
|
Amounts utilized
|
(3.3
|
)
|
(0.2
|
)
|
—
|
|
(0.5
|
)
|
(2.9
|
)
|
(3.3
|
)
|
(10.2
|
)
|
|||||||||||||
|
Balance at December 31, 2014
|
$
|
11.2
|
|
$
|
—
|
|
$
|
4.5
|
|
$
|
—
|
|
$
|
—
|
|
$
|
—
|
|
$
|
15.7
|
|
||||||
The following table summarizes the cumulative restructuring charges of these 2014 and 2010 restructuring actions by major component through December 31,
2014
:
|
Chlor Alkali Products
|
Winchester
|
Total
|
||||||||||||||
|
Becancour
|
Mercury
|
|||||||||||||||
|
($ in millions)
|
||||||||||||||||
|
Write-off of equipment and facility
|
$
|
3.0
|
|
$
|
17.8
|
|
$
|
—
|
|
$
|
20.8
|
|
||||
|
Employee severance and job related benefits
|
2.3
|
|
5.6
|
|
13.3
|
|
21.2
|
|
||||||||
|
Facility exit costs
|
—
|
|
15.6
|
|
1.9
|
|
17.5
|
|
||||||||
|
Pension and other postretirement benefits curtailment
|
0.2
|
|
—
|
|
4.1
|
|
4.3
|
|
||||||||
|
Employee relocation costs
|
—
|
|
0.9
|
|
4.7
|
|
5.6
|
|
||||||||
|
Lease and other contract termination costs
|
4.5
|
|
0.7
|
|
—
|
|
5.2
|
|
||||||||
|
Total cumulative restructuring charges
|
$
|
10.0
|
|
$
|
40.6
|
|
$
|
24.0
|
|
$
|
74.6
|
|
||||
As of December 31,
2014
, we have incurred cash expenditures of
$27.1 million
and non-cash charges of
$31.8 million
related to these restructuring actions. The remaining balance of
$15.7 million
is expected to be paid out through 2016.
68
DISCONTINUED OPERATIONS
In 2007 we sold our Metals business, which was a reportable segment, and accordingly it was reported as a discontinued operation. Metals produced and distributed copper and copper alloy sheet, strip, foil, rod, welded tube, fabricated parts, and stainless steel and aluminum strip. In conjunction with the sale of the Metals business, we retained certain assets and liabilities.
During 2014, we made a payment of
$5.5 million
to resolve certain indemnity obligations related to the sale. As a result of the favorable resolution, we recognized a pretax gain of
$4.6 million
included in income from discontinued operations. The tax provision from discontinued operations included expense of
$2.2 million
for changes in tax contingencies related to the Metals sale. Income from discontinued operations, net consisted of the following:
|
Years Ended December 31,
|
|||||||||||
|
2014
|
2013
|
2012
|
|||||||||
|
($ in millions)
|
|||||||||||
|
Income from discontinued operations
|
$
|
4.6
|
|
$
|
—
|
|
$
|
—
|
|
||
|
Tax provision
|
3.9
|
|
—
|
|
—
|
|
|||||
|
Income from discontinued operations, net
|
$
|
0.7
|
|
$
|
—
|
|
$
|
—
|
|
||
EARNINGS PER SHARE
Basic and diluted income per share are computed by dividing net income by the weighted average number of common shares outstanding. Diluted net income per share reflects the dilutive effect of stock-based compensation.
|
Years ended December 31,
|
|||||||||||
|
Computation of Income per Share
|
2014
|
2013
|
2012
|
||||||||
|
(In millions, except per share data)
|
|||||||||||
|
Income from continuing operations
|
$
|
105.0
|
|
$
|
178.6
|
|
$
|
149.6
|
|
||
|
Income from discontinued operations, net
|
0.7
|
|
—
|
|
—
|
|
|||||
|
Net income
|
$
|
105.7
|
|
$
|
178.6
|
|
$
|
149.6
|
|
||
|
Basic shares
|
78.6
|
|
79.9
|
|
80.1
|
|
|||||
|
Basic income per share:
|
|||||||||||
|
Income from continuing operations
|
$
|
1.33
|
|
$
|
2.24
|
|
$
|
1.87
|
|
||
|
Income from discontinued operations, net
|
0.01
|
|
—
|
|
—
|
|
|||||
|
Net income
|
$
|
1.34
|
|
$
|
2.24
|
|
$
|
1.87
|
|
||
|
Diluted shares:
|
|||||||||||
|
Basic shares
|
78.6
|
|
79.9
|
|
80.1
|
|
|||||
|
Stock-based compensation
|
1.1
|
|
1.0
|
|
0.9
|
|
|||||
|
Diluted shares
|
79.7
|
|
80.9
|
|
81.0
|
|
|||||
|
Diluted income per share:
|
|||||||||||
|
Income from continuing operations
|
$
|
1.32
|
|
$
|
2.21
|
|
$
|
1.85
|
|
||
|
Income from discontinued operations, net
|
0.01
|
|
—
|
|
—
|
|
|||||
|
Net income
|
$
|
1.33
|
|
$
|
2.21
|
|
$
|
1.85
|
|
||
The computation of dilutive shares from stock-based compensation does not include
0.6 million
shares in both 2014 and 2013 and
1.0 million
shares in
2012
as their effect would have been anti-dilutive.
ALLOWANCE FOR DOUBTFUL ACCOUNTS RECEIVABLES
Allowance for doubtful accounts receivable consisted of the following:
|
December 31,
|
|||||||
|
2014
|
2013
|
||||||
|
($ in millions)
|
|||||||
|
Beginning balance
|
$
|
3.4
|
|
$
|
3.6
|
|
|
|
Provisions charged
|
0.2
|
|
—
|
|
|||
|
Write-offs, net of recoveries
|
(0.6
|
)
|
(0.2
|
)
|
|||
|
Ending balance
|
$
|
3.0
|
|
$
|
3.4
|
|
|
69
INVENTORIES
|
December 31,
|
|||||||
|
2014
|
2013
|
||||||
|
($ in millions)
|
|||||||
|
Supplies
|
$
|
39.2
|
|
$
|
40.5
|
|
|
|
Raw materials
|
63.3
|
|
76.5
|
|
|||
|
Work in process
|
31.8
|
|
26.4
|
|
|||
|
Finished goods
|
141.5
|
|
115.9
|
|
|||
|
275.8
|
|
259.3
|
|
||||
|
LIFO reserves
|
(65.7
|
)
|
(72.8
|
)
|
|||
|
Inventories, net
|
$
|
210.1
|
|
$
|
186.5
|
|
|
Inventories valued using the LIFO method comprised
58%
and
56%
of the total inventories at December 31,
2014
and
2013
, respectively. The replacement cost of our inventories would have been approximately
$65.7 million
and
$72.8 million
higher than that reported at December 31,
2014
and
2013
, respectively. During 2014 the reduction in LIFO inventory quantities resulted in LIFO inventory liquidation losses of
$1.5 million
.
PROPERTY, PLANT AND EQUIPMENT
|
December 31,
|
|||||||||
|
Useful Lives
|
2014
|
2013
|
|||||||
|
($ in millions)
|
|||||||||
|
Land and improvements to land
|
10-20 Years
|
$
|
157.3
|
|
$
|
156.2
|
|
||
|
Buildings and building equipment
|
10-30 Years
|
212.1
|
|
205.0
|
|
||||
|
Machinery and equipment
|
3-15 Years
|
1,846.1
|
|
1,835.4
|
|
||||
|
Leasehold improvements
|
2.6
|
|
2.5
|
|
|||||
|
Construction in progress
|
43.6
|
|
47.8
|
|
|||||
|
Property, plant and equipment
|
2,261.7
|
|
2,246.9
|
|
|||||
|
Accumulated depreciation
|
(1,330.7
|
)
|
(1,259.1
|
)
|
|||||
|
Property, plant and equipment, net
|
$
|
931.0
|
|
$
|
987.8
|
|
|||
The weighted average useful life of machinery and equipment at December 31,
2014
was
10
years. Depreciation expense was
$124.5 million
,
$120.7 million
and
$104.4 million
for
2014
,
2013
and
2012
, respectively. Interest capitalized was
$0.2 million
,
$1.1 million
and
$7.4 million
for
2014
,
2013
and
2012
, respectively. Maintenance and repairs charged to operations amounted to
$125.0 million
,
$134.7 million
and
$124.4 million
in
2014
,
2013
and
2012
, respectively.
The consolidated statements of cash flows for the years ended December 31,
2014
,
2013
and
2012
, included a
$(0.5) million
,
$7.9 million
and
$17.4 million
, respectively, (decrease) increase
to capital expenditures, with the corresponding change to accounts payable and accrued liabilities, related to purchases of property, plant and equipment included in accounts payable at December 31,
2014
,
2013
and
2012
.
During 2013 and 2012 we entered into sale/leaseback transactions for caustic soda barges, bleach trailers and chlorine, caustic soda and bleach railcars. In 2013 and 2012 we received proceeds from the sales of
$35.8 million
and
$4.4 million
, respectively, for the years ended December 31,
2013
and
2012
.
During
2014
and
2013
, assets of
zero
and
$4.2 million
, respectively, were acquired under capital leases and are included in machinery and equipment as of December 31,
2014
and
2013
.
70
INVESTMENTS—AFFILIATED COMPANIES
On November 16, 2007, we purchased for cash an
$11.6 million
equity interest in a bleach joint venture. As part of the investment we also entered into several commercial agreements, including agreements by which we would supply raw materials and services, and we would have marketing responsibility for bleach and caustic soda.
During 2013, we sold our equity interest in the bleach joint venture which resulted in a gain of
$6.5 million
.
As a result of the sale, as of December 31,
2014
, we have recorded a receivable of
$16.6 million
, with
$7.8 million
included within other assets on our consolidated balance sheet.
We hold a
9.1%
limited partnership interest in Bay Gas Storage Company, Ltd. (Bay Gas), an Alabama limited partnership, in which EnergySouth, Inc. (EnergySouth) is the general partner with interest of
90.9%
. Bay Gas owns, leases and operates underground gas storage and related pipeline facilities, which are used to provide storage in the McIntosh, AL area and delivery of natural gas to EnergySouth customers.
The following table summarizes our investment in our non-consolidated equity affiliate:
|
December 31,
|
|||||||
|
2014
|
2013
|
||||||
|
($ in millions)
|
|||||||
|
Bay Gas
|
$
|
23.3
|
|
$
|
21.6
|
|
|
The following table summarizes our equity earnings of non-consolidated affiliates:
|
Years Ended December 31,
|
|||||||||||
|
2014
|
2013
|
2012
|
|||||||||
|
($ in millions)
|
|||||||||||
|
Bay Gas
|
$
|
1.7
|
|
$
|
2.1
|
|
$
|
2.4
|
|
||
|
Bleach joint venture
|
—
|
|
0.7
|
|
0.6
|
|
|||||
|
Equity earnings of non-consolidated affiliates
|
$
|
1.7
|
|
$
|
2.8
|
|
$
|
3.0
|
|
||
We received net distributions from our non-consolidated affiliates of
zero
,
$1.5 million
and
$1.3 million
for
2014
,
2013
and
2012
, respectively.
71
DEBT
Credit Facility
On June 24, 2014, we entered into a new five-year
$415.0 million
senior credit facility consisting of a
$265.0 million
senior revolving credit facility, which replaced our previous
$265.0 million
senior revolving credit facility, and a
$150.0 million
delayed-draw term loan facility. In August 2014, we drew the entire
$150.0 million
of the term loan and used the proceeds to redeem our 2019 Notes. The new
$415.0 million
senior credit facility will expire in June 2019. The new
$265.0 million
senior revolving credit facility includes a
$60.0 million
letter of credit subfacility and the option to expand the facility by an additional
$100.0 million
. At December 31,
2014
, we had
$257.7 million
available under our
$265.0 million
senior revolving credit facility because we had issued
$7.3 million
of letters of credit under the
$60.0 million
subfacility. The
$150.0 million
term loan facility includes amortization in equal quarterly installments at a rate of
2.5%
annually for the first two years increasing to
5%
for the remaining three years. In December 2014, we repaid
$0.9 million
under the required quarterly installments. The terms and conditions of the new senior credit facility is similar to those of our previous
$265.0 million
senior revolving credit facility except the addition of quarterly installments on the term loan facility. Under the new senior credit facility, we may select various floating rate borrowing options. The actual interest rate paid on borrowings under the senior credit facility is based on a pricing grid which is dependent upon the leverage ratio as calculated under the terms of the facility at the end of the prior fiscal quarter. The facility includes various customary restrictive covenants, including restrictions related to the ratio of debt to earnings before interest expense, taxes, depreciation and amortization (leverage ratio) and the ratio of earnings before interest expense, taxes, depreciation and amortization to interest expense (coverage ratio). Compliance with these covenants is determined quarterly based on the operating cash flows for the last four quarters. We were in compliance with all covenants and restrictions under all our outstanding credit agreements as of December 31,
2014
and
2013
, and no event of default had occurred that would permit the lenders under our outstanding credit agreements to accelerate the debt if not cured. In the future, our ability to generate sufficient operating cash flows, among other factors, will determine the amounts available to be borrowed under these facilities. As of December 31,
2014
, there were no covenants or other restrictions that limited our ability to borrow.
In 2014, we paid deferred debt issuance costs of
$1.2 million
related to the new five-year
$415.0 million
senior credit facility.
At December 31,
2014
, we had total letters of credit of
$20.9 million
outstanding, of which
$7.3 million
were issued under our
$265.0 million
senior revolving credit facility. The letters of credit are used to support certain long-term debt, certain workers compensation insurance policies, certain plant closure and post-closure obligations and certain Canadian pension funding requirements.
72
Long-Term Debt
|
December 31,
|
|||||||
|
2014
|
2013
|
||||||
|
Notes payable:
|
($ in millions)
|
||||||
|
Variable-rate Senior Term Loan facility, due 2019 (1.66% at December 31, 2014)
|
$
|
149.1
|
|
$
|
—
|
|
|
|
Variable-rate Go Zone bonds, due 2024 (1.31% and 1.42% at December 31, 2014 and 2013, respectively)
|
50.0
|
|
50.0
|
|
|||
|
Variable-rate Recovery Zone bonds, due 2024-2035 (1.31% and 1.42% at December 31, 2014 and 2013, respectively)
|
103.0
|
|
103.0
|
|
|||
|
Variable-rate Industrial development and environmental improvement obligations, due 2025 (0.20% and 0.22% at December 31, 2014 and 2013, respectively)
|
2.9
|
|
2.9
|
|
|||
|
5.5%, due 2022
|
200.0
|
|
200.0
|
|
|||
|
6.75%, due 2016 (includes interest rate swaps of $3.7 million and $6.1 million in 2014 and 2013, respectively)
|
128.7
|
|
131.1
|
|
|||
|
7.23%, SunBelt Notes due 2013-2017 (includes unamortized fair value premium of $0.5 million and $0.8 million and interest rate swaps of $0.8 million and $1.2 million in 2014 and 2013, respectively)
|
37.8
|
|
50.7
|
|
|||
|
8.875%, due 2019 (includes unamortized discount of $0.8 million in 2013)
|
—
|
|
149.2
|
|
|||
|
Capital lease obligations
|
3.6
|
|
4.1
|
|
|||
|
Total debt
|
675.1
|
|
691.0
|
|
|||
|
Amounts due within one year
|
16.4
|
|
12.6
|
|
|||
|
Total long-term debt
|
$
|
658.7
|
|
$
|
678.4
|
|
|
In August 2014, we redeemed our
$150.0 million
2019 Notes, which would have matured on August 15, 2019. We recognized interest expense of
$9.5 million
for the call premium (
$6.7 million
) and the write-off of unamortized deferred debt issuance costs (
$2.1 million
) and unamortized discount (
$0.7 million
) related to this action.
Pursuant to a note purchase agreement dated December 22, 1997, SunBelt sold
$97.5 million
of Guaranteed Senior Secured Notes due 2017, Series O, and
$97.5 million
of Guaranteed Senior Secured Notes due 2017, Series G. The SunBelt Notes bear interest at a rate of
7.23%
per annum, payable semi-annually in arrears on each June 22 and December 22. Beginning on December 22, 2002 and each year through 2017, SunBelt is required to repay
$12.2 million
of the SunBelt Notes, of which
$6.1 million
is attributable to the Series O Notes and of which
$6.1 million
is attributable to the Series G Notes. In December
2014
,
2013
and
2012
,
$12.2 million
was repaid on these SunBelt Notes.
We have guaranteed the Series O Notes, and PolyOne, our former SunBelt partner, has guaranteed the Series G Notes, in both cases pursuant to customary guaranty agreements. We have agreed to indemnify PolyOne for any payments or other costs under the guarantee in favor of the purchasers of the Series G Notes, to the extent any payments or other costs arise from a default or other breach under the SunBelt Notes. If SunBelt does not make timely payments on the SunBelt Notes, whether as a result of a failure to pay on a guarantee or otherwise, the holders of the SunBelt Notes may proceed against the assets of SunBelt for repayment.
In January 2013, we repaid the
$11.4 million
2013 Notes, which became due.
During
2013
, assets of
$4.2 million
were acquired under capital leases with terms of 7 years.
In August 2012, we sold
$200.0 million
of 2022 Notes with a maturity date of August 15, 2022. The 2022 Notes were issued at par value. Interest is paid semi-annually on February 15 and August 15. The acquisition of KA Steel was partially financed with proceeds of
$196.0 million
, after expense of
$4.0 million
, from the 2022 Notes.
In June 2012, we redeemed
$7.7 million
of industrial revenue bonds due in 2017. We paid a premium of
$0.2 million
to the bond holders, which was included in interest expense. We also recognized a
$0.2 million
deferred gain in interest expense related to the interest rate swaps, which were terminated in March 2012, on these industrial revenue bonds.
73
Annual maturities of long-term debt, including capital lease obligations, are
$16.4 million
in
2015
,
$146.0 million
in
2016
,
$21.4 million
in
2017
,
$8.0 million
in
2018
,
$126.1 million
in
2019
and a total of
$357.2 million
thereafter.
We have entered into interest rate swaps, as disclosed below, whereby we agree to pay variable and fixed rates to a counterparty who, in turn, pays us fixed and variable rates. In all cases the underlying index for variable rates is the six-month LIBOR. Accordingly, payments are settled every six months and the terms of the swaps are the same as the underlying debt instruments.
The following table reflects the swap activity related to certain debt obligations:
|
Underlying Debt Instrument
|
Swap Amount
|
Date of Swap
|
December 31, 2014
|
||||||
|
($ in millions)
|
Olin Pays Floating Rate:
|
||||||||
|
6.75%, due 2016
|
$
|
65.0
|
|
March 2010
|
3.0 - 4.0%
|
(a)
|
|||
|
6.75%, due 2016
|
$
|
60.0
|
|
March 2010
|
3.0 - 4.0%
|
(a)
|
|||
|
Olin Receives Floating Rate:
|
|||||||||
|
6.75%, due 2016
|
$
|
65.0
|
|
October 2011
|
3.0 - 4.0%
|
(a)
|
|||
|
6.75%, due 2016
|
$
|
60.0
|
|
October 2011
|
3.0 - 4.0%
|
(a)
|
|||
|
(a)
|
Actual rate is set in arrears. We project the rate will fall within the range shown.
|
In March 2010, we entered into interest rate swaps on
$125 million
of our underlying fixed-rate debt obligations, whereby we agreed to pay variable rates to a counterparty who, in turn, pays us fixed rates. The counterparty to these agreements is Citibank. In October 2011, we entered into
$125 million
of interest rate swaps with equal and opposite terms as the
$125 million
variable interest rate swaps on the 2016 Notes. We have agreed to pay a fixed rate to a counterparty who, in turn, pays us variable rates. The counterparty to this agreement is also Citibank. The result was a gain of
$11.0 million
on the
$125 million
variable interest rate swaps, which will be recognized through 2016. As of December 31,
2014
,
$3.7 million
of this gain was included in long-term debt. In October 2011, we de-designated our
$125 million
interest rate swaps that had previously been designated as fair value hedges. The
$125 million
variable interest rate swaps and the
$125 million
fixed interest rate swaps do not meet the criteria for hedge accounting. All changes in the fair value of these interest rate swaps are recorded currently in earnings.
In June 2012, we terminated
$73.1 million
of interest rate swaps with Wells Fargo that had been entered into on the SunBelt Notes in May 2011. The result was a gain of
$2.2 million
which will be recognized through 2017. As of December 31,
2014
,
$0.8 million
of this gain was included in long-term debt.
Our loss in the event of nonperformance by these counterparties could be significant to our financial position and results of operations. These interest rate swaps reduced interest expense by
$2.9 million
in both 2014 and 2013 and
$3.4 million
in
2012
. The difference between interest paid and interest received is included as an adjustment to interest expense.
PENSION PLANS
Most of our employees participate in defined contribution pension plans. We provide a contribution to an individual retirement contribution account maintained with the CEOP primarily equal to
5%
of the employee’s eligible compensation if such employee is less than age
45
, and
7.5%
of the employee’s eligible compensation if such employee is age
45
or older. The defined contribution pension plans expense was
$16.1 million
,
$15.4 million
and
$15.1 million
for
2014
,
2013
and
2012
, respectively.
74
A portion of our bargaining hourly employees continue to participate in our domestic defined benefit pension plans under a flat-benefit formula. Our funding policy for the defined benefit pension plans is consistent with the requirements of federal laws and regulations. Our foreign subsidiaries maintain pension and other benefit plans, which are consistent with statutory practices. Our defined benefit pension plan provides that if, within three years following a change of control of Olin, any corporate action is taken or filing made in contemplation of, among other things, a plan termination or merger or other transfer of assets or liabilities of the plan, and such termination, merger or transfer thereafter takes place, plan benefits would automatically be increased for affected participants (and retired participants) to absorb any plan surplus (subject to applicable collective bargaining requirements).
During the fourth quarter of 2014, the SOA issued the final report of its mortality tables and mortality improvement scales. The updated mortality data reflected increasing life expectancies in the United States. During the third quarter of 2012, the MAP-21 became law. The new law changes the mechanism for determining interest rates to be used for calculating minimum defined benefit pension plan funding requirements. Interest rates are determined using an average of rates for a 25-year period, which can have the effect of increasing the annual discount rate, reducing the defined benefit pension plan obligation, and potentially reducing or eliminating the minimum annual funding requirement. The new law also increased premiums paid to the PBGC. During the third quarter of 2014, HATFA 2014 became law, which includes an extension of MAP-21’s defined benefit plan funding stabilization relief. Based on our plan assumptions and estimates, we will not be required to make any cash contributions to the domestic qualified defined benefit pension plan at least through
2015
and under the new law may not be required to make any additional contributions for at least the next five years.
75
Pension Obligations and Funded Status
Changes in the benefit obligation and plan assets were as follows:
|
December 31, 2014
|
December 31, 2013
|
||||||||||||||||||||||
|
($ in millions)
|
($ in millions)
|
||||||||||||||||||||||
|
Change in Benefit Obligation
|
U.S.
|
Foreign
|
Total
|
U.S.
|
Foreign
|
Total
|
|||||||||||||||||
|
Benefit obligation at beginning of year
|
$
|
1,916.5
|
|
$
|
62.2
|
|
$
|
1,978.7
|
|
$
|
2,070.8
|
|
$
|
68.4
|
|
$
|
2,139.2
|
|
|||||
|
Service cost
|
2.3
|
|
0.5
|
|
2.8
|
|
2.8
|
|
0.6
|
|
3.4
|
|
|||||||||||
|
Interest cost
|
83.8
|
|
2.7
|
|
86.5
|
|
78.4
|
|
2.7
|
|
81.1
|
|
|||||||||||
|
Actuarial loss (gain)
|
245.8
|
|
9.8
|
|
255.6
|
|
(107.7
|
)
|
(1.7
|
)
|
(109.4
|
)
|
|||||||||||
|
Benefits paid
|
(131.9
|
)
|
(3.6
|
)
|
(135.5
|
)
|
(127.8
|
)
|
(3.5
|
)
|
(131.3
|
)
|
|||||||||||
|
Curtailments
|
—
|
|
0.2
|
|
0.2
|
|
—
|
|
—
|
|
—
|
|
|||||||||||
|
Currency translation adjustments
|
—
|
|
(5.5
|
)
|
(5.5
|
)
|
—
|
|
(4.3
|
)
|
(4.3
|
)
|
|||||||||||
|
Benefit obligation at end of year
|
$
|
2,116.5
|
|
$
|
66.3
|
|
$
|
2,182.8
|
|
$
|
1,916.5
|
|
$
|
62.2
|
|
$
|
1,978.7
|
|
|||||
|
December 31, 2014
|
December 31, 2013
|
||||||||||||||||||||||
|
($ in millions)
|
($ in millions)
|
||||||||||||||||||||||
|
Change in Plan Assets
|
U.S.
|
Foreign
|
Total
|
U.S.
|
Foreign
|
Total
|
|||||||||||||||||
|
Fair value of plans’ assets at beginning of year
|
$
|
1,798.6
|
|
$
|
62.1
|
|
$
|
1,860.7
|
|
$
|
1,912.5
|
|
$
|
68.5
|
|
$
|
1,981.0
|
|
|||||
|
Actual return on plans’ assets
|
244.2
|
|
9.4
|
|
253.6
|
|
10.7
|
|
0.3
|
|
11.0
|
|
|||||||||||
|
Employer contributions
|
4.5
|
|
0.9
|
|
5.4
|
|
3.2
|
|
1.2
|
|
4.4
|
|
|||||||||||
|
Benefits paid
|
(131.9
|
)
|
(3.6
|
)
|
(135.5
|
)
|
(127.8
|
)
|
(3.5
|
)
|
(131.3
|
)
|
|||||||||||
|
Currency translation adjustments
|
—
|
|
(5.5
|
)
|
(5.5
|
)
|
—
|
|
(4.4
|
)
|
(4.4
|
)
|
|||||||||||
|
Fair value of plans’ assets at end of year
|
$
|
1,915.4
|
|
$
|
63.3
|
|
$
|
1,978.7
|
|
$
|
1,798.6
|
|
$
|
62.1
|
|
$
|
1,860.7
|
|
|||||
|
December 31, 2014
|
December 31, 2013
|
||||||||||||||||||||||
|
($ in millions)
|
($ in millions)
|
||||||||||||||||||||||
|
Funded Status
|
U.S.
|
Foreign
|
Total
|
U.S.
|
Foreign
|
Total
|
|||||||||||||||||
|
Qualified plans
|
$
|
(137.5
|
)
|
$
|
(1.2
|
)
|
$
|
(138.7
|
)
|
$
|
(57.6
|
)
|
$
|
1.7
|
|
$
|
(55.9
|
)
|
|||||
|
Non-qualified plans
|
(63.6
|
)
|
(1.8
|
)
|
(65.4
|
)
|
(60.3
|
)
|
(1.8
|
)
|
(62.1
|
)
|
|||||||||||
|
Total funded status
|
$
|
(201.1
|
)
|
$
|
(3.0
|
)
|
$
|
(204.1
|
)
|
$
|
(117.9
|
)
|
$
|
(0.1
|
)
|
$
|
(118.0
|
)
|
|||||
Under ASC 715 we recorded an
$84.8 million
after-tax charge (
$138.9 million
pretax) to shareholders’ equity as of December 31,
2014
for our pension plans. This charge reflected a
60
-basis point decrease in the plans’ discount rate and the negative impact of the newly mandated mortality tables, partially offset by favorable performance on plan assets during
2014
. In
2013
, we recorded an
$8.9 million
after-tax charge (
$14.4 million
pretax) to shareholders’ equity as of
December 31, 2013
for our pension plans. This charge reflected unfavorable performance on plan assets during 2013, partially offset by a
60
-basis point increase in the plans’ discount rate.
The
$255.6 million
actuarial loss for
2014
was primarily due to a
60
-basis point decrease in the plans’ discount rate and the negative impact of the newly mandated mortality tables. Our benefit obligation as of December 31, 2014 increased approximately
$90 million
as a result of the newly mandated mortality tables. The
$109.4 million
actuarial gain for
2013
was primarily due to a
60
-basis point increase in the plans’ discount rate.
76
Amounts recognized in the consolidated balance sheets consisted of:
|
December 31, 2014
|
December 31, 2013
|
||||||||||||||||||||||
|
($ in millions)
|
($ in millions)
|
||||||||||||||||||||||
|
U.S.
|
Foreign
|
Total
|
U.S.
|
Foreign
|
Total
|
||||||||||||||||||
|
Prepaid benefit cost
|
$
|
—
|
|
$
|
—
|
|
$
|
—
|
|
$
|
—
|
|
$
|
1.7
|
|
$
|
1.7
|
|
|||||
|
Accrued benefit in current liabilities
|
(21.8
|
)
|
(0.3
|
)
|
(22.1
|
)
|
(14.2
|
)
|
(0.1
|
)
|
(14.3
|
)
|
|||||||||||
|
Accrued benefit in noncurrent liabilities
|
(179.3
|
)
|
(2.7
|
)
|
(182.0
|
)
|
(103.7
|
)
|
(1.7
|
)
|
(105.4
|
)
|
|||||||||||
|
Accumulated other comprehensive loss
|
654.8
|
|
23.0
|
|
677.8
|
|
540.9
|
|
20.7
|
|
561.6
|
|
|||||||||||
|
Net balance sheet impact
|
$
|
453.7
|
|
$
|
20.0
|
|
$
|
473.7
|
|
$
|
423.0
|
|
$
|
20.6
|
|
$
|
443.6
|
|
|||||
At December 31,
2014
and
2013
, the benefit obligation of non-qualified pension plans was
$65.4 million
and
$62.1 million
, respectively, and was included in the above pension benefit obligation. There were no plan assets for these non-qualified pension plans. Benefit payments for the non-qualified pension plans are expected to be as follows:
2015
—
$22.1 million
;
2016
—
$6.1 million
;
2017
—
$5.7 million
;
2018
—
$3.3 million
; and
2019
—
$3.0 million
. Benefit payments for the qualified plans are projected to be as follows:
2015
—
$126.8 million
;
2016
—
$122.2 million
;
2017
—
$118.1 million
;
2018
—
$114.5 million
; and
2019
—
$111.6 million
.
|
December 31,
|
|||||||
|
2014
|
2013
|
||||||
|
($ in millions)
|
|||||||
|
Projected benefit obligation
|
$
|
2,182.8
|
|
$
|
1,978.7
|
|
|
|
Accumulated benefit obligation
|
2,170.8
|
|
1,968.9
|
|
|||
|
Fair value of plan assets
|
1,978.7
|
|
1,860.7
|
|
|||
|
Years Ended December 31,
|
|||||||||||
|
Components of Net Periodic Benefit Income
|
2014
|
2013
|
2012
|
||||||||
|
($ in millions)
|
|||||||||||
|
Service cost
|
$
|
5.3
|
|
$
|
6.2
|
|
$
|
6.1
|
|
||
|
Interest cost
|
86.5
|
|
81.1
|
|
92.0
|
|
|||||
|
Expected return on plans’ assets
|
(139.5
|
)
|
(137.5
|
)
|
(139.5
|
)
|
|||||
|
Amortization of prior service cost
|
2.2
|
|
1.9
|
|
2.2
|
|
|||||
|
Recognized actuarial loss
|
20.3
|
|
27.8
|
|
18.1
|
|
|||||
|
Curtailments
|
0.2
|
|
—
|
|
—
|
|
|||||
|
Net periodic benefit income
|
$
|
(25.0
|
)
|
$
|
(20.5
|
)
|
$
|
(21.1
|
)
|
||
|
Included in Other Comprehensive Loss (Pretax)
|
|||||||||||
|
Liability adjustment
|
$
|
138.9
|
|
$
|
14.4
|
|
$
|
162.0
|
|
||
|
Amortization of prior service costs and actuarial losses
|
(22.7
|
)
|
(29.7
|
)
|
(20.3
|
)
|
|||||
In December 2014, we recorded a curtailment charge of
$0.2 million
associated with permanently closing a portion of the Becancour, Canada chlor alkali facility that has been shut down since late June 2014. This charge was included in restructuring charges for 2014.
The defined benefit pension plans’ actuarial loss that will be recognized from accumulated other comprehensive loss into net periodic benefit income in
2015
will be approximately
$31 million
.
77
The service cost and the amortization of prior service cost components of pension expense related to the employees of the operating segments are allocated to the operating segments based on their respective estimated census data.
Pension Plan Assumptions
Certain actuarial assumptions, such as discount rate and long-term rate of return on plan assets, have a significant effect on the amounts reported for net periodic benefit cost and accrued benefit obligation amounts. We use a measurement date of December 31 for our pension plans.
|
U.S. Pension Benefits
|
Foreign Pension Benefits
|
||||||||||||||||
|
Weighted Average Assumptions
:
|
2014
|
2013
|
2012
|
2014
|
2013
|
2012
|
|||||||||||
|
Discount rate—periodic benefit cost
|
4.5
|
%
|
3.9
|
%
|
4.9
|
%
|
4.8
|
%
|
4.2
|
%
|
4.4
|
%
|
|||||
|
Expected return on assets
|
7.75
|
%
|
7.75
|
%
|
8.0
|
%
|
7.5
|
%
|
7.75
|
%
|
8.0
|
%
|
|||||
|
Rate of compensation increase
|
3.0
|
%
|
3.0
|
%
|
3.0
|
%
|
3.5
|
%
|
3.5
|
%
|
3.5
|
%
|
|||||
|
Discount rate—benefit obligation
|
3.9
|
%
|
4.5
|
%
|
3.9
|
%
|
3.9
|
%
|
4.8
|
%
|
4.2
|
%
|
|||||
The discount rate is based on a hypothetical yield curve represented by a series of annualized individual zero-coupon bond spot rates for maturities ranging from one-half to thirty years. The bonds used in the yield curve must have a rating of AA or better per Standard & Poor’s, be non-callable, and have at least
$250 million
par outstanding. The yield curve is then applied to the projected benefit payments from the plan. Based on these bonds and the projected benefit payment streams, the single rate that produces the same yield as the matching bond portfolio, rounded to the nearest quarter point, is used as the discount rate.
The long-term expected rate of return on plan assets represents an estimate of the long-term rate of returns on the investment portfolio consisting of equities, fixed income and alternative investments. We use long-term historical actual return information, the allocation mix of investments that comprise plan assets, and forecast estimates of long-term investment returns, including inflation rates, by reference to external sources. The historic rate of return on plan assets has been
10.3%
for the last 5 years,
10.3%
for the last 10 years and
7.9%
for the last 15 years. The following rates of return by asset class were considered in setting the long-term rate of return assumption:
|
U.S. equities
|
9%
|
to
|
13%
|
||
|
Non-U.S. equities
|
10%
|
to
|
14%
|
||
|
Fixed income/cash
|
5%
|
to
|
9%
|
||
|
Alternative investments
|
5%
|
to
|
15%
|
||
|
Absolute return strategies
|
8%
|
to
|
12%
|
||
Plan Assets
Our pension plan asset allocation at December 31,
2014
and
2013
, by asset class was as follows:
|
Percentage of Plan Assets
|
|||||
|
Asset Class
|
2014
|
2013
|
|||
|
U.S. equities
|
4
|
%
|
5
|
%
|
|
|
Non-U.S. equities
|
7
|
%
|
8
|
%
|
|
|
Fixed income/cash
|
52
|
%
|
51
|
%
|
|
|
Alternative investments
|
21
|
%
|
20
|
%
|
|
|
Absolute return strategies
|
16
|
%
|
16
|
%
|
|
|
Total
|
100
|
%
|
100
|
%
|
|
The Alternative Investments asset class includes hedge funds, real estate and private equity investments. The Alternative Investment class is intended to help diversify risk and increase returns by utilizing a broader group of assets.
78
Absolute Return Strategies further diversify the plan’s assets through the use of asset allocations that seek to provide a targeted rate of return over inflation. The investment managers allocate funds within asset classes that they consider to be undervalued in an effort to preserve gains in overvalued asset classes and to find opportunities in undervalued asset classes.
A master trust was established by our pension plan to accumulate funds required to meet benefit payments of our plan and is administered solely in the interest of our plan’s participants and their beneficiaries. The master trust’s investment horizon is long term. Its assets are managed by professional investment managers or invested in professionally managed investment vehicles.
Our pension plan maintains a portfolio of assets designed to achieve an appropriate risk adjusted return. The portfolio of assets is also structured to protect the funding level from the negative impacts of interest rate changes on the asset and liability values. This is accomplished by investing in a portfolio of assets with a maturity duration that approximately matches the duration of the plan liabilities. Risk is managed by diversifying assets across asset classes whose return patterns are not highly correlated, investing in passively and actively managed strategies and in value and growth styles, and by periodic rebalancing of asset classes, strategies and investment styles to objectively set targets.
As of December 31,
2014
, the following target allocation and ranges have been set for each asset class:
|
Asset Class
|
Target Allocation
|
Target Range
|
||
|
U.S. equities
|
6
|
%
|
0-14
|
|
|
Non-U.S. equities
|
6
|
%
|
0-14
|
|
|
Fixed income/cash
|
61
|
%
|
48-80
|
|
|
Alternative investments
|
7
|
%
|
0-28
|
|
|
Absolute return strategies
|
20
|
%
|
10-30
|
|
We do have a small Canadian qualified defined benefit pension plan to which we made cash contributions of
$0.8 million
and
$1.0 million
in
2014
and
2013
, respectively, and we anticipate approximately
$1 million
of cash contributions in
2015
.
Determining which hierarchical level an asset or liability falls within requires significant judgment. The following table summarizes our domestic and foreign defined benefit pension plan assets measured at fair value as of December 31,
2014
:
|
Asset Class
|
Quoted Prices
In Active
Markets for
Identical Assets
(Level 1)
|
Significant
Other
Observable
Inputs
(Level 2)
|
Significant
Unobservable
Inputs
(Level 3)
|
Total
|
|||||||||||
|
($ in millions)
|
|||||||||||||||
|
Equity securities
|
|||||||||||||||
|
U.S. equities
|
$
|
69.8
|
|
$
|
12.4
|
|
$
|
—
|
|
$
|
82.2
|
|
|||
|
Non-U.S. equities
|
35.4
|
|
115.5
|
|
—
|
|
150.9
|
|
|||||||
|
Fixed income / cash
|
|||||||||||||||
|
Cash
|
65.7
|
|
—
|
|
—
|
|
65.7
|
|
|||||||
|
Government treasuries
|
—
|
|
465.6
|
|
4.3
|
|
469.9
|
|
|||||||
|
Corporate debt instruments
|
0.4
|
|
329.7
|
|
9.6
|
|
339.7
|
|
|||||||
|
Asset-backed securities
|
—
|
|
150.5
|
|
—
|
|
150.5
|
|
|||||||
|
Alternative investments
|
|||||||||||||||
|
Hedge fund of funds
|
—
|
|
—
|
|
358.8
|
|
358.8
|
|
|||||||
|
Real estate funds
|
—
|
|
—
|
|
34.0
|
|
34.0
|
|
|||||||
|
Private equity funds
|
—
|
|
—
|
|
17.7
|
|
17.7
|
|
|||||||
|
Absolute return strategies
|
—
|
|
289.0
|
|
20.3
|
|
309.3
|
|
|||||||
|
Total assets
|
$
|
171.3
|
|
$
|
1,362.7
|
|
$
|
444.7
|
|
$
|
1,978.7
|
|
|||
79
The following table summarizes our domestic and foreign defined benefit pension plan assets measured at fair value as of December 31,
2013
:
|
Asset Class
|
Quoted Prices
In Active
Markets for
Identical Assets
(Level 1)
|
Significant
Other
Observable
Inputs
(Level 2)
|
Significant
Unobservable
Inputs
(Level 3)
|
Total
|
|||||||||||
|
($ in millions)
|
|||||||||||||||
|
Equity securities
|
|||||||||||||||
|
U.S. equities
|
$
|
83.2
|
|
$
|
14.8
|
|
$
|
—
|
|
$
|
98.0
|
|
|||
|
Non-U.S. equities
|
41.1
|
|
112.1
|
|
—
|
|
153.2
|
|
|||||||
|
Fixed income / cash
|
|||||||||||||||
|
Cash
|
53.9
|
|
—
|
|
—
|
|
53.9
|
|
|||||||
|
Government treasuries
|
—
|
|
398.8
|
|
4.5
|
|
403.3
|
|
|||||||
|
Corporate debt instruments
|
0.4
|
|
314.4
|
|
21.5
|
|
336.3
|
|
|||||||
|
Asset-backed securities
|
—
|
|
152.3
|
|
—
|
|
152.3
|
|
|||||||
|
Alternative investments
|
|||||||||||||||
|
Hedge fund of funds
|
—
|
|
—
|
|
315.9
|
|
315.9
|
|
|||||||
|
Real estate funds
|
—
|
|
—
|
|
35.7
|
|
35.7
|
|
|||||||
|
Private equity funds
|
—
|
|
—
|
|
17.9
|
|
17.9
|
|
|||||||
|
Absolute return strategies
|
—
|
|
275.5
|
|
18.7
|
|
294.2
|
|
|||||||
|
Total assets
|
$
|
178.6
|
|
$
|
1,267.9
|
|
$
|
414.2
|
|
$
|
1,860.7
|
|
|||
U.S. equities
—This class included actively and passively managed equity investments in common stock and commingled funds comprised primarily of large-capitalization stocks with value, core and growth strategies.
Non-U.S. equities
—This class included actively managed equity investments in commingled funds comprised primarily of international large-capitalization stocks from both developed and emerging markets.
Fixed income and cash—
This class included commingled funds comprised of debt instruments issued by the U.S. and Canadian Treasuries, U.S. Agencies, corporate debt instruments, asset- and mortgage-backed securities and cash.
Hedge fund of funds—
This class included a hedge fund which invests in the following types of hedge funds:
Event driven hedge funds—
This class included hedge funds that invest in securities to capture excess returns that are driven by market or specific company events including activist investment philosophies and the arbitrage of equity and private and public debt securities.
Market neutral hedge funds
—This class included investments in U.S. and international equities and fixed income securities while maintaining a market neutral position in those markets.
Other hedge funds
—This class primarily included long-short equity strategies and a global macro fund which invested in fixed income, equity, currency, commodity and related derivative markets.
At December 31,
2014
and
2013
, the asset allocation included investment in approximately
20%
event driven hedge funds,
35%
market neutral hedge funds and
45%
other hedge funds.
Real estate funds
—This class included several funds that invest primarily in U.S. commercial real estate.
Private equity funds
—This class included several private equity funds that invest primarily in infrastructure and U.S. power generation and transmission assets.
80
Absolute return strategies
—This class included multiple strategies which use asset allocations that seek to provide a targeted rate of return over inflation. The investment managers allocate funds within asset classes that they consider to be undervalued in an effort to preserve gains in overvalued asset classes and to find opportunities in undervalued asset classes. At December 31,
2014
, the asset allocation included investment in approximately
15%
equities,
65%
cash and fixed income and
20%
alternative investments. At December 31,
2013
, the asset allocation included investments in approximately
20%
equities,
60%
cash and fixed income and
20%
alternative investments.
U.S. equities and non-U.S. equities are primarily valued at the net asset value provided by the independent administrator or custodian of the commingled fund. The net asset value is based on the value of the underlying equities, which are traded on an active market. U.S. equities are also valued at the closing price reported in an active market on which the individual securities are traded. Fixed income investments are primarily valued at the net asset value provided by the independent administrator or custodian of the fund. The net asset value is based on the underlying assets, which are valued using inputs such as the closing price reported, if traded on an active market, values derived from comparable securities of issuers with similar credit ratings, or under a discounted cash flow approach that utilizes observable inputs, such as current yields of similar instruments, but includes adjustments for risks that may not be observable such as certain credit and liquidity risks. Alternative investments are primarily valued at the net asset value as determined by the independent administrator or custodian of the fund. The net asset value is based on the underlying investments, which are valued using inputs such as quoted market prices of identical instruments, discounted future cash flows, independent appraisals and market-based comparable data. Absolute return strategies are commingled funds which reflect the fair value of our ownership interest in these funds. The investments in these commingled funds include some or all of the above asset classes and are primarily valued at net asset values based on the underlying investments, which are valued consistent with the methodologies described above for each asset class.
The following table summarizes the activity for our defined benefit pension plans level 3 assets for the year ended December 31,
2014
:
|
December 31,
2013 |
Realized
Gain/(Loss)
|
Unrealized Gain/(Loss) Relating to Assets Held at Period End
|
Purchases, Sales, and Settlements
|
Transfers
In/(Out)
|
December 31, 2014
|
||||||||||||||||||
|
($ in millions)
|
|||||||||||||||||||||||
|
Fixed income / cash
|
|||||||||||||||||||||||
|
Government treasuries
|
$
|
4.5
|
|
$
|
—
|
|
$
|
(0.3
|
)
|
$
|
0.1
|
|
$
|
—
|
|
$
|
4.3
|
|
|||||
|
Corporate debt instruments
|
21.5
|
|
2.0
|
|
(1.3
|
)
|
(12.6
|
)
|
—
|
|
9.6
|
|
|||||||||||
|
Alternative investments
|
|||||||||||||||||||||||
|
Hedge fund of funds
|
315.9
|
|
—
|
|
17.9
|
|
25.0
|
|
—
|
|
358.8
|
|
|||||||||||
|
Real estate funds
|
35.7
|
|
1.6
|
|
2.0
|
|
(5.3
|
)
|
—
|
|
34.0
|
|
|||||||||||
|
Private equity funds
|
17.9
|
|
—
|
|
(0.2
|
)
|
—
|
|
—
|
|
17.7
|
|
|||||||||||
|
Absolute return strategies
|
18.7
|
|
—
|
|
0.8
|
|
0.8
|
|
—
|
|
20.3
|
|
|||||||||||
|
Total level 3 assets
|
$
|
414.2
|
|
$
|
3.6
|
|
$
|
18.9
|
|
$
|
8.0
|
|
$
|
—
|
|
$
|
444.7
|
|
|||||
81
The following table summarizes the activity for our defined benefit pension plans level 3 assets for the year ended December 31,
2013
:
|
December 31, 2012
|
Realized
Gain/(Loss)
|
Unrealized Gain/(Loss) Relating to Assets Held at Period End
|
Purchases, Sales, and Settlements
|
Transfers
In/(Out)
|
December 31, 2013
|
||||||||||||||||||
|
($ in millions)
|
|||||||||||||||||||||||
|
Fixed income / cash
|
|||||||||||||||||||||||
|
Government treasuries
|
$
|
5.6
|
|
$
|
0.1
|
|
$
|
(1.1
|
)
|
$
|
(0.1
|
)
|
$
|
—
|
|
$
|
4.5
|
|
|||||
|
Corporate debt instruments
|
12.2
|
|
—
|
|
1.3
|
|
8.0
|
|
—
|
|
21.5
|
|
|||||||||||
|
Alternative investments
|
|||||||||||||||||||||||
|
Hedge fund of funds
|
286.9
|
|
—
|
|
29.0
|
|
—
|
|
—
|
|
315.9
|
|
|||||||||||
|
Real estate funds
|
38.2
|
|
1.0
|
|
1.9
|
|
(5.4
|
)
|
—
|
|
35.7
|
|
|||||||||||
|
Private equity funds
|
18.5
|
|
0.8
|
|
(0.5
|
)
|
(0.9
|
)
|
—
|
|
17.9
|
|
|||||||||||
|
Absolute return strategies
|
40.8
|
|
9.4
|
|
(7.0
|
)
|
(24.5
|
)
|
—
|
|
18.7
|
|
|||||||||||
|
Total level 3 assets
|
$
|
402.2
|
|
$
|
11.3
|
|
$
|
23.6
|
|
$
|
(22.9
|
)
|
$
|
—
|
|
$
|
414.2
|
|
|||||
POSTRETIREMENT BENEFITS
We provide certain postretirement healthcare (medical) and life insurance benefits for eligible active and retired domestic employees. The healthcare plans are contributory with participants’ contributions adjusted annually based on medical rates of inflation and plan experience. We use a measurement date of December 31 for our postretirement plans.
Other Postretirement Benefits Obligations and Funded Status
Changes in the benefit obligation were as follows:
|
December 31, 2014
|
December 31, 2013
|
||||||||||||||||||||||
|
($ in millions)
|
($ in millions)
|
||||||||||||||||||||||
|
Change in Benefit Obligation
|
U.S.
|
Foreign
|
Total
|
U.S.
|
Foreign
|
Total
|
|||||||||||||||||
|
Benefit obligation at beginning of year
|
$
|
59.0
|
|
$
|
8.6
|
|
$
|
67.6
|
|
$
|
65.5
|
|
$
|
9.5
|
|
$
|
75.0
|
|
|||||
|
Service cost
|
1.0
|
|
0.1
|
|
1.1
|
|
1.2
|
|
0.1
|
|
1.3
|
|
|||||||||||
|
Interest cost
|
2.3
|
|
0.4
|
|
2.7
|
|
2.2
|
|
0.4
|
|
2.6
|
|
|||||||||||
|
Actuarial loss (gain)
|
2.4
|
|
0.7
|
|
3.1
|
|
(1.5
|
)
|
(0.4
|
)
|
(1.9
|
)
|
|||||||||||
|
Benefits paid
|
(6.2
|
)
|
(0.4
|
)
|
(6.6
|
)
|
(8.4
|
)
|
(0.4
|
)
|
(8.8
|
)
|
|||||||||||
|
Currency translation adjustments
|
—
|
|
(0.7
|
)
|
(0.7
|
)
|
—
|
|
(0.6
|
)
|
(0.6
|
)
|
|||||||||||
|
Benefit obligation at end of year
|
$
|
58.5
|
|
$
|
8.7
|
|
$
|
67.2
|
|
$
|
59.0
|
|
$
|
8.6
|
|
$
|
67.6
|
|
|||||
|
December 31, 2014
|
December 31, 2013
|
||||||||||||||||||||||
|
($ in millions)
|
($ in millions)
|
||||||||||||||||||||||
|
U.S.
|
Foreign
|
Total
|
U.S.
|
Foreign
|
Total
|
||||||||||||||||||
|
Funded status
|
$
|
(58.5
|
)
|
$
|
(8.7
|
)
|
$
|
(67.2
|
)
|
$
|
(59.0
|
)
|
$
|
(8.6
|
)
|
$
|
(67.6
|
)
|
|||||
Under ASC 715 we recorded a
$1.8 million
after-tax charge (
$3.1 million
pretax) to shareholders’ equity as of December 31,
2014
for our other postretirement plans. In
2013
, we recorded a
$1.2 million
after-tax benefit (
$1.9 million
pretax) to shareholders’ equity as of December 31,
2013
for our other postretirement plans.
82
Amounts recognized in the consolidated balance sheets consisted of:
|
December 31, 2014
|
December 31, 2013
|
||||||||||||||||||||||
|
($ in millions)
|
($ in millions)
|
||||||||||||||||||||||
|
U.S.
|
Foreign
|
Total
|
U.S.
|
Foreign
|
Total
|
||||||||||||||||||
|
Accrued benefit in current liabilities
|
$
|
(5.2
|
)
|
$
|
(0.3
|
)
|
$
|
(5.5
|
)
|
$
|
(5.4
|
)
|
$
|
(0.3
|
)
|
$
|
(5.7
|
)
|
|||||
|
Accrued benefit in noncurrent liabilities
|
(53.3
|
)
|
(8.4
|
)
|
(61.7
|
)
|
(53.6
|
)
|
(8.3
|
)
|
(61.9
|
)
|
|||||||||||
|
Accumulated other comprehensive loss
|
33.6
|
|
(0.4
|
)
|
33.2
|
|
34.1
|
|
(1.2
|
)
|
32.9
|
|
|||||||||||
|
Net balance sheet impact
|
$
|
(24.9
|
)
|
$
|
(9.1
|
)
|
$
|
(34.0
|
)
|
$
|
(24.9
|
)
|
$
|
(9.8
|
)
|
$
|
(34.7
|
)
|
|||||
|
Years Ended December 31,
|
|||||||||||
|
Components of Net Periodic Benefit Cost
|
2014
|
2013
|
2012
|
||||||||
|
($ in millions)
|
|||||||||||
|
Service cost
|
$
|
1.1
|
|
$
|
1.3
|
|
$
|
1.2
|
|
||
|
Interest cost
|
2.7
|
|
2.6
|
|
3.1
|
|
|||||
|
Amortization of prior service cost
|
(0.1
|
)
|
(0.1
|
)
|
(0.1
|
)
|
|||||
|
Recognized actuarial loss
|
2.9
|
|
3.7
|
|
3.2
|
|
|||||
|
Net periodic benefit cost
|
$
|
6.6
|
|
$
|
7.5
|
|
$
|
7.4
|
|
||
|
Included in Other Comprehensive Loss (Pretax)
|
|||||||||||
|
Liability adjustment
|
$
|
3.1
|
|
$
|
(1.9
|
)
|
$
|
4.8
|
|
||
|
Amortization of prior service costs and actuarial losses
|
(2.8
|
)
|
(3.6
|
)
|
(3.1
|
)
|
|||||
The other postretirement plans’ actuarial loss that will be recognized from accumulated other comprehensive loss into net periodic benefit cost in
2015
will be approximately
$4 million
.
The service cost and amortization of prior service cost components of postretirement benefit expense related to the employees of the operating segments are allocated to the operating segments based on their respective estimated census data.
Other Postretirement Benefits Plan Assumptions
Certain actuarial assumptions, such as discount rate, have a significant effect on the amounts reported for net periodic benefit cost and accrued benefit obligation amounts.
|
December 31,
|
||||||||
|
Weighted Average Assumptions
:
|
2014
|
2013
|
2012
|
|||||
|
Discount rate—periodic benefit cost
|
4.3
|
%
|
3.6
|
%
|
4.6
|
%
|
||
|
Discount rate—benefit obligation
|
3.7
|
%
|
4.3
|
%
|
3.6
|
%
|
||
The discount rate is based on a hypothetical yield curve represented by a series of annualized individual zero-coupon bond spot rates for maturities ranging from one-half to thirty years. The bonds used in the yield curve must have a rating of AA or better per Standard & Poor’s, be non-callable, and have at least
$250 million
par outstanding. The yield curve is then applied to the projected benefit payments from the plan. Based on these bonds and the projected benefit payment streams, the single rate that produces the same yield as the matching bond portfolio, rounded to the nearest quarter point, is used as the discount rate.
83
We review external data and our own internal trends for healthcare costs to determine the healthcare cost for the post retirement benefit obligation. The assumed healthcare cost trend rates for pre-65 retirees were as follows:
|
December 31,
|
|||||
|
2014
|
2013
|
||||
|
Healthcare cost trend rate assumed for next year
|
8.5
|
%
|
9.0
|
%
|
|
|
Rate that the cost trend rate gradually declines to
|
5.0
|
%
|
5.0
|
%
|
|
|
Year that the rate reaches the ultimate rate
|
2021
|
|
2021
|
|
|
For post-65 retirees, we provide a fixed dollar benefit, which is not subject to escalation.
Assumed healthcare cost trend rates have an effect on the amounts reported for the healthcare plans. A one-percentage-point change in assumed healthcare cost trend rates would have the following effects:
|
One-Percentage
Point Increase
|
One-Percentage
Point Decrease
|
||||||
|
($ in millions)
|
|||||||
|
Effect on total of service and interest costs
|
$
|
0.2
|
|
$
|
(0.2
|
)
|
|
|
Effect on postretirement benefit obligation
|
3.8
|
|
(3.2
|
)
|
|||
We expect to make payments of approximately
$5 million
for each of the next five years under the provisions of our other postretirement benefit plans.
INCOME TAXES
|
Years ended December 31,
|
|||||||||||
|
Components of Income from Continuing Operations Before Taxes
|
2014
|
2013
|
2012
|
||||||||
|
($ in millions)
|
|||||||||||
|
Domestic
|
$
|
164.4
|
|
$
|
222.2
|
|
$
|
189.9
|
|
||
|
Foreign
|
(1.7
|
)
|
27.8
|
|
35.3
|
|
|||||
|
Income from continuing operations before taxes
|
$
|
162.7
|
|
$
|
250.0
|
|
$
|
225.2
|
|
||
|
Components of Income Tax Provision
|
|||||||||||
|
Current expense:
|
|||||||||||
|
Federal
|
$
|
25.9
|
|
$
|
42.1
|
|
$
|
16.9
|
|
||
|
State
|
1.3
|
|
9.4
|
|
4.3
|
|
|||||
|
Foreign
|
5.3
|
|
8.5
|
|
10.4
|
|
|||||
|
32.5
|
|
60.0
|
|
31.6
|
|
||||||
|
Deferred
|
25.2
|
|
11.4
|
|
44.0
|
|
|||||
|
Income tax provision
|
$
|
57.7
|
|
$
|
71.4
|
|
$
|
75.6
|
|
||
84
The following table accounts for the difference between the actual tax provision and the amounts obtained by applying the statutory U.S. federal income tax rate of
35%
to the income from continuing operations before taxes.
|
Years ended December 31,
|
||||||||
|
Effective Tax Rate Reconciliation (Percent)
|
2014
|
2013
|
2012
|
|||||
|
Statutory federal tax rate
|
35.0
|
%
|
35.0
|
%
|
35.0
|
%
|
||
|
Foreign rate differential
|
(0.2
|
)
|
(0.1
|
)
|
(0.1
|
)
|
||
|
Domestic manufacturing/export tax incentive
|
(1.8
|
)
|
(1.6
|
)
|
(1.0
|
)
|
||
|
Return to provision
|
(0.7
|
)
|
(0.1
|
)
|
—
|
|
||
|
Dividends paid to CEOP
|
(0.5
|
)
|
(0.3
|
)
|
(0.4
|
)
|
||
|
Change in tax contingencies
|
(0.3
|
)
|
(3.8
|
)
|
0.5
|
|
||
|
State income taxes, net
|
2.4
|
|
2.3
|
|
1.3
|
|
||
|
Change in valuation allowance
|
1.1
|
|
(2.1
|
)
|
0.1
|
|
||
|
Remeasurement of deferred taxes
|
0.4
|
|
0.1
|
|
0.7
|
|
||
|
Research tax credit
|
—
|
|
(0.8
|
)
|
—
|
|
||
|
Section 45O tax credit
|
—
|
|
—
|
|
(3.0
|
)
|
||
|
Australia dividend residual tax expense
|
—
|
|
—
|
|
0.3
|
|
||
|
Other, net
|
0.1
|
|
—
|
|
0.2
|
|
||
|
Effective tax rate
|
35.5
|
%
|
28.6
|
%
|
33.6
|
%
|
||
The effective tax rate from continuing operations for 2014 included
$1.2 million
of benefit associated with return to provision adjustments for the finalization of our 2013 U.S. federal and state income tax returns and
$0.7 million
of benefit associated with the expiration of the statutes of limitations in federal and state jurisdictions. These items were partially offset by
$0.8 million
of expense associated with increases in valuation allowances on certain state tax credit balances, primarily due to a change in state tax law, and
$0.6 million
of expense related to the remeasurement of deferred taxes due to an increase in state effective tax rates. The effective tax rate from continuing operations for 2013 included
$11.4 million
of benefit associated with the expiration of the statutes of limitations in federal and state jurisdictions,
$8.3 million
of benefit associated with reductions in valuation allowances on our capital loss carryforwards and
$1.9 million
of benefit associated with the Research Credit, which were partially offset by
$1.8 million
of expense associated with changes in tax contingencies and
$1.3 million
of expense associated with increases in valuation allowances on certain state tax credits carryforwards. The effective tax rate from continuing operations for 2012 included a benefit of
$6.6 million
associated with Section 45O that was claimed on our 2008 to 2012 U.S. federal income tax returns.
85
|
December 31,
|
|||||||
|
Components of Deferred Tax Assets and Liabilities
|
2014
|
2013
|
|||||
|
($ in millions)
|
|||||||
|
Deferred tax assets:
|
|||||||
|
Pension and postretirement benefits
|
$
|
108.0
|
|
$
|
74.6
|
|
|
|
Environmental reserves
|
56.5
|
|
60.2
|
|
|||
|
Asset retirement obligations
|
22.9
|
|
25.7
|
|
|||
|
Accrued liabilities
|
43.9
|
|
48.2
|
|
|||
|
Tax credits
|
9.2
|
|
13.3
|
|
|||
|
Federal and state net operating losses
|
6.6
|
|
7.2
|
|
|||
|
Capital loss carryforward
|
4.8
|
|
3.0
|
|
|||
|
Other miscellaneous items
|
16.5
|
|
10.7
|
|
|||
|
Total deferred tax assets
|
268.4
|
|
242.9
|
|
|||
|
Valuation allowance
|
(16.6
|
)
|
(13.4
|
)
|
|||
|
Net deferred tax assets
|
251.8
|
|
229.5
|
|
|||
|
Deferred tax liabilities:
|
|||||||
|
Property, plant and equipment
|
177.9
|
|
182.5
|
|
|||
|
Intangible amortization
|
10.5
|
|
8.4
|
|
|||
|
Inventory and prepaids
|
5.6
|
|
3.1
|
|
|||
|
Partnerships
|
98.2
|
|
93.7
|
|
|||
|
Total deferred tax liabilities
|
292.2
|
|
287.7
|
|
|||
|
Net deferred tax liability
|
$
|
(40.4
|
)
|
$
|
(58.2
|
)
|
|
Realization of the net deferred tax assets, irrespective of indefinite-lived deferred tax liabilities, is dependent on future reversals of existing taxable temporary differences and adequate future taxable income, exclusive of reversing temporary differences and carryforwards. Although realization is not assured, we believe that it is more likely than not that the net deferred tax assets will be realized.
We completed the acquisition of KA Steel on August 22, 2012, with both parties agreeing to an election under Section 338(h)(10) of the U.S. IRC, which allows us to treat the transaction as an asset acquisition for U.S. federal income tax purposes. KA Steel did not carry forward any significant tax attributes.
At December 31,
2014
, we had deferred federal tax expense of
$4.7 million
recorded associated with the impact on expected future foreign tax credits generated by the deferred tax assets of our Canadian subsidiary.
At December 31,
2014
, we had a U.S. net operating loss carryforward (NOL) of approximately
$2.4 million
(representing
$0.9 million
of deferred tax assets), that will expire in years 2017 through 2020, if not utilized. The utilization of this NOL is limited under Section 382 of the U.S. IRC to
$0.5 million
in each year through 2020. We believe that it is more likely than not that the NOL will be realized and no valuation allowance is necessary.
At December 31,
2014
, we had deferred state tax benefits of
$2.4 million
relating to state NOLs, which are available to offset future state taxable income through 2033. Due to uncertainties regarding realization of certain tax benefits, a valuation allowance of
$0.7 million
has been applied against the deferred state tax benefits at December 31,
2014
.
At December 31,
2014
, we had deferred state tax benefits of
$13.9 million
relating to state tax credits, which are available to offset future state tax liabilities through 2028. Due to uncertainties regarding the realization of certain state tax credits, a valuation allowance of
$11.1 million
has been applied against the deferred state tax credits at December 31,
2014
.
At December 31,
2014
, we had a capital loss carryforward of
$12.2 million
(representing
$4.8 million
of deferred tax assets) that is available to offset future consolidated capital gains that will expire in years 2015 through 2019 if not utilized. Due to uncertainties regarding the realization of certain capital loss carryforwards, a valuation allowance of
$4.8 million
has been applied against the deferred tax benefit at December 31,
2014
.
86
The activity of our deferred income tax valuation allowance was as follows:
|
December 31,
|
|||||||
|
2014
|
2013
|
||||||
|
($ in millions)
|
|||||||
|
Beginning balance
|
$
|
13.4
|
|
$
|
21.1
|
|
|
|
Charged to income tax provision
|
4.1
|
|
4.9
|
|
|||
|
Deductions from reserves - credited to income tax provision
|
(0.9
|
)
|
(12.6
|
)
|
|||
|
Ending balance
|
$
|
16.6
|
|
$
|
13.4
|
|
|
The total amount of undistributed earnings of foreign subsidiaries was approximately
$11.4 million
at December 31,
2014
. Deferred taxes are provided for earnings of non-U.S. affiliates when we plan to remit those earnings. A portion of the undistributed earnings have been permanently reinvested and for those earnings no deferred taxes have been provided. Deferred taxes have not been provided on the excess book basis in the shares of certain foreign subsidiaries because these basis differences are not expected to reverse in the foreseeable future. The undistributed earnings and excess book basis differences could reverse through a sale, receipt of dividends from the subsidiaries, as well as various other events. It is not practical to calculate the residual income tax that would result if these basis differences reversed due to the complexities of the tax law and the hypothetical nature of the calculations.
As of December 31,
2014
, we had
$36.1 million
of gross unrecognized tax benefits, which would have a net
$35.0 million
impact on the effective tax rate from continuing operations, if recognized. As of December 31,
2013
, we had
$34.5 million
of gross unrecognized tax benefits, which would have a net
$31.1 million
impact on the effective tax rate from continuing operations, if recognized. The change for
2014
primarily relates to additional gross unrecognized benefits for current year and prior year tax positions, as well as the expiration of statute of limitations in domestic jurisdictions and settlement of ongoing audits. The change for 2013 primarily relates to the expiration of statute of limitations in domestic jurisdictions and settlement of ongoing audits, as well as additional gross unrecognized benefits for prior year tax positions. The amounts of unrecognized tax benefits were as follows:
|
December 31,
|
|||||||
|
2014
|
2013
|
||||||
|
($ in millions)
|
|||||||
|
Beginning balance
|
$
|
34.5
|
|
$
|
40.1
|
|
|
|
Increase for current year tax positions
|
2.2
|
|
—
|
|
|||
|
Increase for prior year tax positions
|
0.2
|
|
4.5
|
|
|||
|
Reductions due to statute of limitations
|
(0.4
|
)
|
(10.0
|
)
|
|||
|
Decrease for prior year tax positions
|
(0.3
|
)
|
(0.1
|
)
|
|||
|
Decrease due to tax settlements
|
(0.1
|
)
|
—
|
|
|||
|
Ending balance
|
$
|
36.1
|
|
$
|
34.5
|
|
|
Income from discontinued operations, net for the year ended December 31, 2014 included
$2.2 million
of tax expense related to changes in tax contingencies.
We recognize interest and penalty expense related to unrecognized tax positions as a component of the income tax provision. As of December 31,
2014
and
2013
, interest and penalties accrued were
$3.2 million
and
$2.8 million
, respectively. For
2014
,
2013
and
2012
, we recorded expense (benefit) related to interest and penalties of
$0.4 million
,
$(0.5) million
and
$0.5 million
, respectively.
As of December 31,
2014
, we believe it is reasonably possible that our total amount of unrecognized tax benefits will decrease by approximately
$7.3 million
over the next twelve months. The anticipated reduction primarily relates to settlements with tax authorities and the expiration of federal, state and foreign statutes of limitation.
87
We operate primarily in North America and file income tax returns in numerous jurisdictions. Our tax returns are subject to examination by various federal, state and local tax authorities. Our U.S. federal income tax returns are under examination by the Internal Revenue Service (IRS) for tax years 2008 and 2010 to 2012. Our Canadian federal income tax returns are under examination by Canada Revenue Authority (CRA) for tax years 2010 and 2011. Our Canadian provincial income tax returns are under examination by Quebec Revenue Authority for tax years 2008 to 2011. We believe we have adequately provided for all tax positions; however, amounts asserted by taxing authorities could be greater than our accrued position. For our primary tax jurisdictions, the tax years that remain subject to examination are as follows:
|
Tax Years
|
|
|
U.S. federal income tax
|
2008; 2010 - 2013
|
|
U.S. state income tax
|
2006 - 2013
|
|
Canadian federal income tax
|
2010 - 2013
|
|
Canadian provincial income tax
|
2008 - 2013
|
ACCRUED LIABILITIES
Included in accrued liabilities were the following:
|
December 31,
|
|||||||
|
2014
|
2013
|
||||||
|
($ in millions)
|
|||||||
|
Accrued compensation and payroll taxes
|
$
|
40.4
|
|
$
|
51.1
|
|
|
|
Accrued employee benefits
|
41.5
|
|
35.3
|
|
|||
|
Environmental (current portion only)
|
19.0
|
|
18.0
|
|
|||
|
Legal and professional costs
|
26.3
|
|
23.4
|
|
|||
|
Asset retirement obligation (current portion only)
|
10.2
|
|
13.5
|
|
|||
|
Earn out
|
—
|
|
26.7
|
|
|||
|
Other
|
76.9
|
|
76.5
|
|
|||
|
Accrued liabilities
|
$
|
214.3
|
|
$
|
244.5
|
|
|
CONTRIBUTING EMPLOYEE OWNERSHIP PLAN
The CEOP is a defined contribution plan available to essentially all domestic employees. Company matching contributions are invested in the same investment allocation as the employee’s contribution. Our matching contributions for eligible employees amounted to
$5.7 million
in
2014
and
$5.2 million
in both
2013
and
2012
.
Employees become vested in the value of the contributions we make to the CEOP according to a schedule based on service. After
two
years of service, participants are
25%
vested. They vest in increments of
25%
for each additional year and after
five
years of service, they are
100%
vested in the value of the contributions that we have made to their accounts.
Employees may transfer any or all of the value of the investments, including Olin common stock, to any one or combination of investments available in the CEOP. Employees may transfer balances daily and may elect to transfer any percentage of the balance in the fund from which the transfer is made. However, when transferring out of a fund, employees are prohibited from trading out of the fund to which the transfer was made for
seven
calendar days. This limitation does not apply to trades into the money market fund or the Olin Common Stock Fund.
88
STOCK-BASED COMPENSATION
Stock-based compensation expense was allocated to the operating segments for the portion related to employees whose compensation would be included in cost of goods sold with the remainder recognized in corporate/other. There were no significant capitalized stock-based compensation costs. Stock-based compensation granted includes stock options, performance stock awards, restricted stock awards and deferred directors’ compensation. Stock-based compensation expense was as follows:
|
Years ended December 31,
|
|||||||||||
|
2014
|
2013
|
2012
|
|||||||||
|
($ in millions)
|
|||||||||||
|
Stock-based compensation
|
$
|
9.2
|
|
$
|
13.3
|
|
$
|
8.4
|
|
||
|
Mark-to-market adjustments
|
(3.6
|
)
|
4.2
|
|
0.9
|
|
|||||
|
Total expense
|
$
|
5.6
|
|
$
|
17.5
|
|
$
|
9.3
|
|
||
Stock Plans
Under the stock option and long-term incentive plans, options may be granted to purchase shares of our common stock at an exercise price not less than fair market value at the date of grant, and are exercisable for a period not exceeding
ten
years from that date. Stock options, restricted stock and performance shares typically vest over
three
years. We issue shares to settle stock options, restricted stock and share-based performance awards. In
2014
,
2013
and
2012
long-term incentive awards included stock options, performance share awards and restricted stock. The stock option exercise price was set at the fair market value of common stock on the date of the grant, and the options have a
ten
-year term.
Stock option transactions were as follows:
|
Exercisable
|
|||||||||||||||
|
Shares
|
Option Price
|
Weighted Average
Option Price
|
Options
|
Weighted Average
Exercise Price
|
|||||||||||
|
Outstanding at January 1, 2014
|
4,114,822
|
|
$14.28-23.78
|
$
|
19.33
|
|
3,011,702
|
|
$
|
18.29
|
|
||||
|
Granted
|
624,200
|
|
25.27-27.64
|
25.69
|
|
||||||||||
|
Exercised
|
(572,607
|
)
|
14.28-23.78
|
20.13
|
|
||||||||||
|
Canceled
|
(32,662
|
)
|
18.52-25.57
|
23.81
|
|
||||||||||
|
Outstanding at December 31, 2014
|
4,133,753
|
|
$14.28-27.64
|
$
|
20.14
|
|
2,976,870
|
|
$
|
18.50
|
|
||||
At December 31,
2014
, the average exercise period for all outstanding and exercisable options was
67
months and
54
months, respectively. At December 31,
2014
, the aggregate intrinsic value (the difference between the exercise price and market value) for outstanding options was
$13.8 million
and exercisable options was
$13.6 million
. The total intrinsic value of options exercised during the years ended December 31,
2014
,
2013
and
2012
was
$3.9 million
,
$4.2 million
and
$0.5 million
, respectively.
The total unrecognized compensation cost related to unvested stock options at December 31,
2014
was
$5.0 million
and was expected to be recognized over a weighted average period of
1.5
years.
89
The following table provides certain information with respect to stock options exercisable at December 31,
2014
:
|
Range of
Exercise Prices
|
Options
Exercisable
|
Weighted Average
Exercise Price
|
Options
Outstanding
|
Weighted Average
Exercise Price
|
||||||||||
|
Under $16.00
|
939,928
|
|
$
|
15.03
|
|
939,928
|
|
$
|
15.03
|
|
||||
|
$16.00 – $20.00
|
766,746
|
|
$
|
18.01
|
|
766,746
|
|
$
|
18.01
|
|
||||
|
Over $20.00
|
1,270,196
|
|
$
|
21.37
|
|
2,427,079
|
|
$
|
22.80
|
|
||||
|
2,976,870
|
|
4,133,753
|
|
|||||||||||
At December 31,
2014
, common shares reserved for issuance and available for grant or purchase under the following plans consisted of:
|
Number of Shares
|
|||||
|
Stock Option Plans
|
Reserved for Issuance
|
Available for
Grant or Purchase
(1)
|
|||
|
2000 long term incentive plan
|
346,368
|
|
13,411
|
|
|
|
2003 long term incentive plan
|
426,068
|
|
14,638
|
|
|
|
2006 long term incentive plan
|
1,613,349
|
|
207,783
|
|
|
|
2009 long term incentive plan
|
2,884,827
|
|
432,029
|
|
|
|
2014 long term incentive plan
|
3,000,000
|
|
3,000,000
|
|
|
|
8,270,612
|
|
3,667,861
|
|
||
|
1996 stock option plan (plan expired)
|
31,602
|
|
—
|
|
|
|
Total under stock option plans
|
8,302,214
|
|
3,667,861
|
|
|
|
Number of Shares
|
|||||
|
Stock Purchase Plans
|
Reserved for Issuance
|
Available for
Grant or Purchase
|
|||
|
1997 stock plan for non-employee directors
|
582,962
|
|
130,660
|
|
|
|
Employee deferral plan
|
45,871
|
|
45,623
|
|
|
|
Total under stock purchase plans
|
628,833
|
|
176,283
|
|
|
|
(1)
|
All available to be issued as stock options, but includes a sub-limit for all types of stock awards of
1,667,861
shares.
|
Under the stock purchase plans, our non-employee directors may defer certain elements of their compensation into shares of our common stock based on fair market value of the shares at the time of deferral. Non-employee directors annually receive stock grants as a portion of their director compensation. Of the shares reserved under the stock purchase plans at December 31,
2014
,
452,549
shares were committed.
90
Performance share awards are denominated in shares of our stock and are paid half in cash and half in stock. Payouts are based on Olin’s average annual return on capital over a
three
-year performance cycle in relation to the average annual return on capital over the same period among a portfolio of public companies which are selected in concert with outside compensation consultants. The expense associated with performance shares is recorded based on our estimate of our performance relative to the respective target. If an employee leaves the company before the end of the performance cycle, the performance shares may be prorated based on the number of months of the performance cycle worked and are settled in cash instead of half in cash and half in stock when the three-year performance cycle is completed. Performance share transactions were as follows:
|
To Settle in Cash
|
To Settle in Shares
|
||||||||||||
|
Shares
|
Weighted Average
Fair Value per Share
|
Shares
|
Weighted Average
Fair Value per Share
|
||||||||||
|
Outstanding at January 1, 2014
|
296,222
|
|
$
|
28.90
|
|
289,000
|
|
$
|
21.48
|
|
|||
|
Granted
|
84,500
|
|
25.57
|
|
84,500
|
|
25.57
|
|
|||||
|
Paid/Issued
|
(88,611
|
)
|
28.90
|
|
(84,500
|
)
|
18.78
|
|
|||||
|
Converted from shares to cash
|
3,403
|
|
23.17
|
|
(3,403
|
)
|
23.17
|
|
|||||
|
Canceled
|
(4,597
|
)
|
27.44
|
|
(4,597
|
)
|
24.16
|
|
|||||
|
Outstanding at December 31, 2014
|
290,917
|
|
$
|
23.04
|
|
281,000
|
|
$
|
23.46
|
|
|||
|
Total vested at December 31, 2014
|
203,583
|
|
$
|
23.04
|
|
193,667
|
|
$
|
22.89
|
|
|||
The summary of the status of our unvested performance shares to be settled in cash were as follows:
|
Shares
|
Weighted Average
Fair Value per Share
|
|||||
|
Unvested at January 1, 2014
|
102,166
|
|
$
|
28.90
|
|
|
|
Granted
|
84,500
|
|
25.57
|
|
||
|
Vested
|
(94,735
|
)
|
23.04
|
|
||
|
Canceled
|
(4,597
|
)
|
27.44
|
|
||
|
Unvested at December 31, 2014
|
87,334
|
|
$
|
23.04
|
|
|
At December 31,
2014
, the liability recorded for performance shares to be settled in cash totaled
$4.7 million
. The total unrecognized compensation cost related to unvested performance shares at December 31,
2014
was
$4.2 million
and was expected to be recognized over a weighted average period of
1.2
years.
SHAREHOLDERS’ EQUITY
On April 24, 2014, our board of directors authorized a new share repurchase program for up to
8 million
shares of common stock that will terminate in
three
years for any of the remaining shares not yet repurchased. This authorization replaced the July 2011 share repurchase program. We repurchased and retired
2.5 million
,
1.5 million
and
0.2 million
shares in
2014
,
2013
and
2012
, respectively, at a cost of
$64.8 million
,
$36.2 million
and
$3.1 million
, respectively. As of December 31,
2014
, we had repurchased a total of
1.9 million
shares under the April 2014 program, and
6.1 million
shares remained authorized to be purchased.
During
2014
,
2013
and
2012
, we issued
0.5 million
,
0.5 million
, and
0.1 million
shares, respectively, with a total value of
$12.1 million
,
$9.7 million
and
$1.4 million
, respectively, representing stock options exercised.
We have registered an undetermined amount of securities with the SEC, so that, from time-to-time, we may issue debt securities, preferred stock and/or common stock and associated warrants in the public market under that registration statement.
91
The following table represents the activity included in accumulated other comprehensive loss:
|
Foreign
Currency
Translation
Adjustment
|
Unrealized
Gains (Losses)
on Derivative
Contracts
(net of taxes)
|
Pension and
Postretirement
Benefits
(net of taxes)
|
Accumulated
Other
Comprehensive
Loss
|
||||||||||||
|
($ in millions)
|
|||||||||||||||
|
Balance at January 1, 2012
|
$
|
1.8
|
|
$
|
(5.3
|
)
|
$
|
(290.7
|
)
|
$
|
(294.2
|
)
|
|||
|
Unrealized gains (losses)
|
0.3
|
|
9.9
|
|
(166.8
|
)
|
(156.6
|
)
|
|||||||
|
Reclassification adjustments into income
|
—
|
|
6.5
|
|
23.4
|
|
29.9
|
|
|||||||
|
Tax (provision) benefit
|
—
|
|
(6.4
|
)
|
56.0
|
|
49.6
|
|
|||||||
|
Net change
|
0.3
|
|
10.0
|
|
(87.4
|
)
|
(77.1
|
)
|
|||||||
|
Balance at December 31, 2012
|
2.1
|
|
4.7
|
|
(378.1
|
)
|
(371.3
|
)
|
|||||||
|
Unrealized losses
|
(2.6
|
)
|
(7.7
|
)
|
(12.5
|
)
|
(22.8
|
)
|
|||||||
|
Reclassification adjustments into income
|
—
|
|
1.4
|
|
33.3
|
|
34.7
|
|
|||||||
|
Tax benefit (provision)
|
—
|
|
2.5
|
|
(8.2
|
)
|
(5.7
|
)
|
|||||||
|
Net change
|
(2.6
|
)
|
(3.8
|
)
|
12.6
|
|
6.2
|
|
|||||||
|
Balance at December 31, 2013
|
(0.5
|
)
|
0.9
|
|
(365.5
|
)
|
(365.1
|
)
|
|||||||
|
Unrealized losses
|
(1.8
|
)
|
(10.2
|
)
|
(142.0
|
)
|
(154.0
|
)
|
|||||||
|
Reclassification adjustments into income
|
—
|
|
1.8
|
|
25.5
|
|
27.3
|
|
|||||||
|
Tax benefit
|
—
|
|
3.3
|
|
45.4
|
|
48.7
|
|
|||||||
|
Net change
|
(1.8
|
)
|
(5.1
|
)
|
(71.1
|
)
|
(78.0
|
)
|
|||||||
|
Balance at December 31, 2014
|
$
|
(2.3
|
)
|
$
|
(4.2
|
)
|
$
|
(436.6
|
)
|
$
|
(443.1
|
)
|
|||
Net income and cost of goods sold included reclassification adjustments for realized gains and losses on derivative contracts from accumulated other comprehensive loss.
Net income, cost of goods sold and selling and administrative expenses included the amortization of prior service costs and actuarial losses from accumulated other comprehensive loss. This amortization is recognized equally in cost of goods sold and selling and administrative expenses.
SEGMENT INFORMATION
We define segment results as income (loss) from continuing operations before interest expense, interest income, other operating income, other income (expense) and income taxes, and include the results of non-consolidated affiliates. Consistent with the guidance in ASC 280, we have determined it is appropriate to include the operating results of non-consolidated affiliates in the relevant segment financial results. Intersegment sales of
$96.6 million
,
$81.3 million
and
$18.1 million
for the years ended December 31,
2014
,
2013
and 2012 respectively, have been eliminated. These represent the sale of caustic soda, bleach, potassium hydroxide and hydrochloric acid between Chemical Distribution and Chlor Alkali Products, at prices that approximate market.
92
|
Years ended December 31,
|
|||||||||||
|
2014
|
2013
|
2012
|
|||||||||
|
Sales:
|
($ in millions)
|
||||||||||
|
Chlor Alkali Products
|
$
|
1,305.6
|
|
$
|
1,412.3
|
|
$
|
1,428.9
|
|
||
|
Chemical Distribution
|
293.8
|
|
406.4
|
|
156.3
|
|
|||||
|
Winchester
|
738.4
|
|
777.6
|
|
617.6
|
|
|||||
|
Intersegment sales elimination
|
(96.6
|
)
|
(81.3
|
)
|
(18.1
|
)
|
|||||
|
Total sales
|
$
|
2,241.2
|
|
$
|
2,515.0
|
|
$
|
2,184.7
|
|
||
|
Income (loss) from continuing operations before taxes:
|
|
|
|
||||||||
|
Chlor Alkali Products
|
$
|
130.1
|
|
$
|
203.8
|
|
$
|
263.2
|
|
||
|
Chemical Distribution
|
—
|
|
9.7
|
|
4.5
|
|
|||||
|
Winchester
|
127.3
|
|
143.2
|
|
55.2
|
|
|||||
|
Corporate/Other
|
(38.1
|
)
|
(62.6
|
)
|
(51.8
|
)
|
|||||
|
Restructuring charges
|
(15.7
|
)
|
(5.5
|
)
|
(8.5
|
)
|
|||||
|
Acquisition costs
|
—
|
|
—
|
|
(8.3
|
)
|
|||||
|
Other operating income
|
1.5
|
|
0.7
|
|
7.6
|
|
|||||
|
Interest expense
|
(43.8
|
)
|
(38.6
|
)
|
(26.4
|
)
|
|||||
|
Interest income
|
1.3
|
|
0.6
|
|
1.0
|
|
|||||
|
Other income (expense)
|
0.1
|
|
(1.3
|
)
|
(11.3
|
)
|
|||||
|
Income from continuing operations before taxes
|
$
|
162.7
|
|
$
|
250.0
|
|
$
|
225.2
|
|
||
|
Earnings of non-consolidated affiliates:
|
|
|
|
||||||||
|
Chlor Alkali Products
|
$
|
1.7
|
|
$
|
2.8
|
|
$
|
3.0
|
|
||
|
Depreciation and amortization expense:
|
|
|
|
||||||||
|
Chlor Alkali Products
|
$
|
103.6
|
|
$
|
102.1
|
|
$
|
88.9
|
|
||
|
Chemical Distribution
|
15.8
|
|
15.4
|
|
5.5
|
|
|||||
|
Winchester
|
16.3
|
|
14.9
|
|
13.6
|
|
|||||
|
Corporate/Other
|
3.4
|
|
2.9
|
|
2.9
|
|
|||||
|
Total depreciation and amortization expense
|
$
|
139.1
|
|
$
|
135.3
|
|
$
|
110.9
|
|
||
|
Capital spending:
|
|
|
|
||||||||
|
Chlor Alkali Products
|
$
|
48.0
|
|
$
|
65.5
|
|
$
|
221.3
|
|
||
|
Chemical Distribution
|
1.6
|
|
2.5
|
|
0.8
|
|
|||||
|
Winchester
|
21.4
|
|
21.2
|
|
32.1
|
|
|||||
|
Corporate/Other
|
0.8
|
|
1.6
|
|
1.5
|
|
|||||
|
Total capital spending
|
$
|
71.8
|
|
$
|
90.8
|
|
$
|
255.7
|
|
||
93
|
December 31,
|
|||||||||
|
2014
|
2013
|
||||||||
|
Assets:
|
($ in millions)
|
||||||||
|
Chlor Alkali Products
|
$
|
1,617.7
|
|
$
|
1,695.8
|
|
|||
|
Chemical Distribution
|
321.3
|
|
335.3
|
|
|||||
|
Winchester
|
361.0
|
|
339.2
|
|
|||||
|
Corporate/Other
|
398.1
|
|
432.5
|
|
|||||
|
Total assets
|
$
|
2,698.1
|
|
$
|
2,802.8
|
|
|||
|
Investments—affiliated companies (at equity):
|
|||||||||
|
Chlor Alkali Products
|
$
|
23.3
|
|
$
|
21.6
|
|
|||
|
Goodwill:
|
|||||||||
|
Chlor Alkali Products
|
$
|
627.4
|
|
$
|
627.4
|
|
|||
|
Chemical Distribution
|
119.7
|
|
119.7
|
|
|||||
|
Total Goodwill
|
$
|
747.1
|
|
$
|
747.1
|
|
|||
Segment assets include only those assets which are directly identifiable to an operating segment. Assets of the corporate/other segment include primarily such items as cash and cash equivalents, deferred taxes, restricted cash and other assets.
|
Years ended December 31,
|
|||||||||||
|
Geographic Data
:
|
2014
|
2013
|
2012
|
||||||||
|
Sales:
|
($ in millions)
|
||||||||||
|
United States
|
$
|
2,051.4
|
|
$
|
2,316.2
|
|
$
|
1,970.5
|
|
||
|
Foreign
|
189.8
|
|
198.8
|
|
214.2
|
|
|||||
|
Transfers between areas:
|
|
|
|
||||||||
|
United States
|
57.4
|
|
53.4
|
|
53.5
|
|
|||||
|
Foreign
|
54.7
|
|
109.0
|
|
85.5
|
|
|||||
|
Eliminations
|
(112.1
|
)
|
(162.4
|
)
|
(139.0
|
)
|
|||||
|
Total sales
|
$
|
2,241.2
|
|
$
|
2,515.0
|
|
$
|
2,184.7
|
|
||
|
December 31,
|
|||||||||
|
2014
|
2013
|
||||||||
|
Assets:
|
($ in millions)
|
||||||||
|
United States
|
$
|
2,484.9
|
|
$
|
2,574.9
|
|
|||
|
Foreign
|
213.2
|
|
227.9
|
|
|||||
|
Total assets
|
$
|
2,698.1
|
|
$
|
2,802.8
|
|
|||
Transfers between geographic areas are priced generally at prevailing market prices. Export sales from the United States to unaffiliated customers were
$29.4 million
,
$25.2 million
and
$25.1 million
in
2014
,
2013
and
2012
, respectively.
94
ENVIRONMENTAL
In the United States, the establishment and implementation of federal, state and local standards to regulate air, water and land quality affect substantially all of our manufacturing locations. Federal legislation providing for regulation of the manufacture, transportation, use and disposal of hazardous and toxic substances, and remediation of contaminated sites, has imposed additional regulatory requirements on industry, particularly the chemicals industry. In addition, implementation of environmental laws, such as the Resource Conservation and Recovery Act and the Clean Air Act, has required and will continue to require new capital expenditures and will increase plant operating costs. Our Canadian facility is governed by federal environmental laws administered by Environment Canada and by provincial environmental laws enforced by administrative agencies. Many of these laws are comparable to the U.S. laws described above. We employ waste minimization and pollution prevention programs at our manufacturing sites.
We are party to various governmental and private environmental actions associated with past manufacturing facilities and former waste disposal sites. Associated costs of investigatory and remedial activities are provided for in accordance with generally accepted accounting principles governing probability and the ability to reasonably estimate future costs. Our ability to estimate future costs depends on whether our investigatory and remedial activities are in preliminary or advanced stages. With respect to unasserted claims, we accrue liabilities for costs that, in our experience, we may incur to protect our interests against those unasserted claims. Our accrued liabilities for unasserted claims amounted to
$1.9 million
at December 31,
2014
. With respect to asserted claims, we accrue liabilities based on remedial investigation, feasibility study, remedial action and OM&M expenses that, in our experience, we may incur in connection with the asserted claims. Required site OM&M expenses are estimated and accrued in their entirety for required periods not exceeding
30
years, which reasonably approximates the typical duration of long-term site OM&M.
Our liabilities for future environmental expenditures were as follows:
|
December 31,
|
|||||||
|
2014
|
2013
|
||||||
|
($ in millions)
|
|||||||
|
Beginning balance
|
$
|
144.6
|
|
$
|
146.5
|
|
|
|
Charges to income
|
9.6
|
|
11.5
|
|
|||
|
Remedial and investigatory spending
|
(14.9
|
)
|
(12.4
|
)
|
|||
|
Currency translation adjustments
|
(1.0
|
)
|
(1.0
|
)
|
|||
|
Ending balance
|
$
|
138.3
|
|
$
|
144.6
|
|
|
At December 31,
2014
and
2013
, our consolidated balance sheets included environmental liabilities of
$119.3 million
and
$126.6 million
, respectively, which were classified as other noncurrent liabilities. Our environmental liability amounts do not take into account any discounting of future expenditures or any consideration of insurance recoveries or advances in technology. These liabilities are reassessed periodically to determine if environmental circumstances have changed and/or remediation efforts and our estimate of related costs have changed. As a result of these reassessments, future charges to income may be made for additional liabilities. Of the
$138.3 million
included on our consolidated balance sheet at December 31,
2014
for future environmental expenditures, we currently expect to utilize
$80.2 million
of the reserve for future environmental expenditures over the next 5 years,
$17.3 million
for expenditures 6 to 10 years in the future, and
$40.8 million
for expenditures beyond 10 years in the future.
Our total estimated environmental liability at December 31,
2014
was attributable to
70
sites,
15
of which were USEPA NPL sites.
Ten
sites accounted for
79%
of our environmental liability and, of the remaining
60
sites, no one site accounted for more than
3%
of our environmental liability. At
five
of the
ten
sites, part of the site is subject to a remedial investigation and another part is in the long-term OM&M stage. At
two
of these
ten
sites, a remedial investigation is being performed. The
three
remaining sites are in long-term OM&M. All
ten
sites are either associated with past manufacturing operations or former waste disposal sites. None of the
ten
largest sites represents more than
22%
of the liabilities reserved on our consolidated balance sheet at December 31,
2014
for future environmental expenditures.
Charges to income for investigatory and remedial efforts were material to operating results in
2014
,
2013
and
2012
and may be material to operating results in future years.
95
Environmental provisions charged (credited) to income, which are included in cost of goods sold, were as follows:
|
Years ended December 31,
|
|||||||||||
|
2014
|
2013
|
2012
|
|||||||||
|
($ in millions)
|
|||||||||||
|
Charges to income
|
$
|
9.6
|
|
$
|
11.5
|
|
$
|
8.4
|
|
||
|
Recoveries from third parties of costs incurred and expensed in prior periods
|
(1.4
|
)
|
(1.3
|
)
|
(0.1
|
)
|
|||||
|
Total environmental expense
|
$
|
8.2
|
|
$
|
10.2
|
|
$
|
8.3
|
|
||
These charges relate primarily to remedial and investigatory activities associated with past manufacturing operations and former waste disposal sites.
Annual environmental-related cash outlays for site investigation and remediation are expected to range between approximately
$15 million
to
$35 million
over the next several years, which are expected to be charged against reserves recorded on our consolidated balance sheet. While we do not anticipate a material increase in the projected annual level of our environmental-related cash outlays, there is always the possibility that such an increase may occur in the future in view of the uncertainties associated with environmental exposures. Environmental exposures are difficult to assess for numerous reasons, including the identification of new sites, developments at sites resulting from investigatory studies, advances in technology, changes in environmental laws and regulations and their application, changes in regulatory authorities, the scarcity of reliable data pertaining to identified sites, the difficulty in assessing the involvement and financial capability of other PRPs, our ability to obtain contributions from other parties and the lengthy time periods over which site remediation occurs. It is possible that some of these matters (the outcomes of which are subject to various uncertainties) may be resolved unfavorably to us, which could materially adversely affect our financial position or results of operations. At December 31,
2014
, we estimate that it is reasonably possible that we may have additional contingent environmental liabilities of
$50 million
in addition to the amounts for which we have already recorded as a reserve.
COMMITMENTS AND CONTINGENCIES
The following table summarizes our contractual commitments under non-cancelable operating leases and purchase contracts as of December 31,
2014
:
|
Operating Leases
|
Purchase Commitments
|
||||||
|
($ in millions)
|
|||||||
|
2015
|
$
|
60.5
|
|
$
|
32.8
|
|
|
|
2016
|
50.2
|
|
31.8
|
|
|||
|
2017
|
45.3
|
|
5.0
|
|
|||
|
2018
|
39.1
|
|
—
|
|
|||
|
2019
|
31.1
|
|
—
|
|
|||
|
Thereafter
|
75.3
|
|
—
|
|
|||
|
Total commitments
|
$
|
301.5
|
|
$
|
69.6
|
|
|
Our operating lease commitments are primarily for railroad cars but also include distribution, warehousing and office space and data processing and office equipment. Virtually none of our lease agreements contain escalation clauses or step rent provisions. Total rent expense charged to operations amounted to
$66.8 million
,
$64.2 million
and
$60.5 million
in
2014
,
2013
and
2012
, respectively (sublease income is not significant). The above purchase commitments include raw material, capital expenditure and utility purchasing commitments utilized in our normal course of business for our projected needs.
96
In conjunction with the St. Gabriel, LA conversion and expansion project, which was completed in the fourth quarter of 2009, we entered into a
twenty
-year brine and pipeline supply agreement with Boardwalk. Boardwalk installed, owns and operates, at its own expense, a pipeline supplying brine to the St. Gabriel, LA facility. Since November 2009, we have been obligated to make a fixed annual payment over the life of the contract of
$2.0 million
for use of the pipeline, regardless of the amount of brine purchased. We also had a minimum usage requirement for brine of
$8.4 million
over the first five-year period of the contract. We have met or exceeded the minimum brine usage requirements for this five-year period. After the first five-year period, the contract contains a buy out provision exercisable by us for
$12.0 million
, which decreases by
$0.8 million
per year.
We, and our subsidiaries, are defendants in various legal actions (including proceedings based on alleged exposures to asbestos) incidental to our past and current business activities. At December 31,
2014
and
2013
, our consolidated balance sheets included liabilities for these legal actions of
$22.1 million
and
$19.3 million
, respectively. These liabilities do not include costs associated with legal representation. Based on our analysis, and considering the inherent uncertainties associated with litigation, we do not believe that it is reasonably possible that these legal actions will materially adversely affect our financial position, cash flows or results of operations.
During the ordinary course of our business, contingencies arise resulting from an existing condition, situation or set of circumstances involving an uncertainty as to the realization of a possible gain contingency. In certain instances such as environmental projects, we are responsible for managing the cleanup and remediation of an environmental site. There exists the possibility of recovering a portion of these costs from other parties. We account for gain contingencies in accordance with the provisions of ASC 450 and therefore do not record gain contingencies and recognize income until it is earned and realizable.
For the year ended December 31, 2013, we recognized
$11.0 million
as a reduction of cost of goods sold related to a Chlor Alkali Products favorable contract settlement. Also for the year ended December 31, 2013, we recognized
$13.9 million
as a reduction of selling and administration expense related to the recovery of legacy legal costs.
DERIVATIVE FINANCIAL INSTRUMENTS
We are exposed to market risk in the normal course of our business operations due to our purchases of certain commodities, our ongoing investing and financing activities and our operations that use foreign currencies. The risk of loss can be assessed from the perspective of adverse changes in fair values, cash flows and future earnings. We have established policies and procedures governing our management of market risks and the use of financial instruments to manage exposure to such risks. ASC 815 required an entity to recognize all derivatives as either assets or liabilities in the statement of financial position and measure those instruments at fair value. We use hedge accounting treatment for substantially all of our business transactions whose risks are covered using derivative instruments. In accordance with ASC 815, we designate commodity forward contracts as cash flow hedges of forecasted purchases of commodities and certain interest rate swaps as fair value hedges of fixed-rate borrowings. We do not enter into any derivative instruments for trading or speculative purposes.
Energy costs, including electricity used in our Chlor Alkali Products segment, and certain raw materials and energy costs, namely copper, lead, zinc, electricity and natural gas used primarily in our Winchester and Chemical Distribution segments, are subject to price volatility. Depending on market conditions, we may enter into futures contracts and put and call option contracts in order to reduce the impact of commodity price fluctuations. The majority of our commodity derivatives expire within one year. Those commodity contracts that extend beyond one year correspond with raw material purchases for long-term fixed-price sales contracts.
We enter into forward sales and purchase contracts to manage currency risk resulting from purchase and sale commitments denominated in foreign currencies (principally Canadian dollar and Australian dollar). At December 31,
2014
and
2013
, we had no forward contracts to buy or sell foreign currencies.
In March 2010, we entered into interest rate swaps on
$125 million
of our underlying fixed-rate debt obligations, whereby we agreed to pay variable rates to a counterparty who, in turn, pays us fixed rates. The counterparty to these agreements is Citibank. In October 2011, we entered into
$125 million
of interest rate swaps with equal and opposite terms as the
$125 million
variable interest rate swaps on the 2016 Notes. We have agreed to pay a fixed rate to a counterparty who, in turn, pays us variable rates. The counterparty to this agreement is also Citibank. The result was a gain of
$11.0 million
on the
$125 million
variable interest rate swaps, which will be recognized through 2016. As of December 31,
2014
,
$3.7 million
of this gain was included in long-term debt. In October 2011, we de-designated our
$125 million
interest rate swaps that had previously been designated as fair value hedges. The
$125 million
variable interest rate swaps and the
$125 million
fixed interest rate swaps do not meet the criteria for hedge accounting. All changes in the fair value of these interest rate swaps are recorded currently in earnings.
97
Cash Flow Hedges
ASC 815 requires that all derivative instruments be recorded on the balance sheet at their fair value. For derivative instruments that are designated and qualify as a cash flow hedge, the change in fair value of the derivative is recognized as a component of other comprehensive income (loss) until the hedged item is recognized into earnings. Gains and losses on the derivatives representing hedge ineffectiveness are recognized currently in earnings.
We had the following notional amount of outstanding commodity forward contracts that were entered into to hedge forecasted purchases:
|
December 31,
|
|||||||
|
2014
|
2013
|
||||||
|
|
($ in millions)
|
||||||
|
Copper
|
$
|
62.7
|
|
$
|
45.3
|
|
|
|
Zinc
|
6.8
|
|
4.5
|
|
|||
|
Lead
|
14.1
|
|
22.8
|
|
|||
|
Natural gas
|
5.7
|
|
5.5
|
|
|||
As of December 31,
2014
, the counterparty to
$55.9 million
of these commodity forward contracts was Wells Fargo, a major financial institution, and the counterparty to
$33.4 million
of these commodity forward contracts was Citibank, a major financial institution.
We use cash flow hedges for certain raw material and energy costs such as copper, zinc, lead, electricity and natural gas to provide a measure of stability in managing our exposure to price fluctuations associated with forecasted purchases of raw materials and energy used in our manufacturing process. At December 31,
2014
, we had open positions in futures contracts through 2018. If all open futures contracts had been settled on December 31,
2014
, we would have recognized a pretax loss of
$7.1 million
.
If commodity prices were to remain at December 31,
2014
levels, approximately
$3.1 million
of deferred losses would be reclassified into earnings during the next twelve months. The actual effect on earnings will be dependent on actual commodity prices when the forecasted transactions occur.
Fair Value Hedges
For derivative instruments that are designated and qualify as a fair value hedge, the gain or loss on the derivative as well as the offsetting loss or gain on the hedged item attributable to the hedged risk are recognized in current earnings. We include the gain or loss on the hedged items (fixed-rate borrowings) in the same line item, interest expense, as the offsetting loss or gain on the related interest rate swaps. We had no interest rate swaps designated as fair value hedges as of December 31,
2014
and
2013
.
In June 2012, we terminated
$73.1 million
of interest rate swaps with Wells Fargo that had been entered into on the SunBelt Notes in May 2011. The result was a gain of
$2.2 million
which will be recognized through 2017. As of December 31,
2014
,
$0.8 million
of this gain was included in long-term debt.
In March 2012, Citibank terminated
$7.7 million
of interest rate swaps on our industrial revenue bonds due in 2017. The result was a gain of
$0.2 million
, which would have been recognized through 2017. In June 2012, the industrial revenue bonds were redeemed by us, and as a result, the remaining
$0.2 million
deferred gain was recognized in interest expense during 2012.
We use interest rate swaps as a means of managing interest expense and floating interest rate exposure to optimal levels. These interest rate swaps are treated as fair value hedges. The accounting for gains and losses associated with changes in fair value of the derivative and the effect on the consolidated financial statements will depend on the hedge designation and whether the hedge is effective in offsetting changes in fair value of cash flows of the asset or liability being hedged.
98
Financial Statement Impacts
We present our derivative assets and liabilities in our consolidated balance sheets on a net basis whenever we have a legally enforceable master netting agreement with the counterparty to our derivative contracts. We use these agreements to manage and substantially reduce our potential counterparty credit risk.
The following table summarizes the location and fair value of the derivative instruments on our consolidated balance sheets. The table disaggregates our net derivative assets and liabilities into gross components on a contract-by-contract basis before giving effect to master netting arrangements:
|
Asset Derivatives
|
Liability Derivatives
|
|||||||||||||||||||
|
Fair Value
|
Fair Value
|
|||||||||||||||||||
|
December 31,
|
December 31,
|
|||||||||||||||||||
|
Derivatives Designated
as Hedging Instruments
|
Balance Sheet Location
|
2014
|
2013
|
Balance Sheet Location
|
2014
|
2013
|
||||||||||||||
|
($ in millions)
|
($ in millions)
|
|||||||||||||||||||
|
Interest rate contracts
|
Other assets
|
$
|
—
|
|
$
|
—
|
|
Long-term debt
|
$
|
4.5
|
|
$
|
7.3
|
|
||||||
|
Commodity contracts – losses
|
Other current assets
|
—
|
|
(2.4
|
)
|
Accrued liabilities
|
7.2
|
|
—
|
|
||||||||||
|
Commodity contracts – gains
|
Other current assets
|
—
|
|
3.6
|
|
Accrued liabilities
|
(0.1
|
)
|
—
|
|
||||||||||
|
$
|
—
|
|
$
|
1.2
|
|
$
|
11.6
|
|
$
|
7.3
|
|
|||||||||
|
Derivatives Not Designated
as Hedging Instruments
|
||||||||||||||||||||
|
Interest rate contracts – gains
|
Other assets
|
$
|
4.3
|
|
$
|
7.6
|
|
Other liabilities
|
$
|
—
|
|
$
|
—
|
|
||||||
|
Interest rate contracts – losses
|
Other assets
|
(0.8
|
)
|
(1.7
|
)
|
Other liabilities
|
—
|
|
—
|
|
||||||||||
|
Commodity contracts – losses
|
Other current assets
|
—
|
|
(0.1
|
)
|
Accrued liabilities
|
1.5
|
|
—
|
|
||||||||||
|
Commodity contracts – gains
|
Other current assets
|
—
|
|
0.2
|
|
Accrued liabilities
|
—
|
|
—
|
|
||||||||||
|
$
|
3.5
|
|
$
|
6.0
|
|
$
|
1.5
|
|
$
|
—
|
|
|||||||||
|
Total derivatives
(1)
|
$
|
3.5
|
|
$
|
7.2
|
|
$
|
13.1
|
|
$
|
7.3
|
|
||||||||
|
(1)
|
Does not include the impact of cash collateral received from or provided to counterparties.
|
99
The following table summarizes the effects of derivative instruments on our consolidated statements of operations:
|
Amount of Gain (Loss)
|
|||||||||||||
|
Years Ended December 31,
|
|||||||||||||
|
Location of Gain (Loss)
|
2014
|
2013
|
2012
|
||||||||||
|
Derivatives – Cash Flow Hedges
|
($ in millions)
|
||||||||||||
|
Recognized in other comprehensive loss (effective portion)
|
———
|
$
|
(10.2
|
)
|
$
|
(7.7
|
)
|
$
|
9.9
|
|
|||
|
Reclassified from accumulated other comprehensive loss into income (effective portion)
|
Cost of goods sold
|
$
|
(1.8
|
)
|
$
|
(1.4
|
)
|
$
|
(6.5
|
)
|
|||
|
Derivatives – Fair Value Hedges
|
|
|
|
||||||||||
|
Interest rate contracts
|
Interest expense
|
$
|
2.9
|
|
$
|
2.9
|
|
$
|
3.3
|
|
|||
|
Derivatives Not Designated as Hedging Instruments
|
|
|
|
||||||||||
|
Interest rate contracts
|
Interest expense
|
$
|
—
|
|
$
|
—
|
|
$
|
0.1
|
|
|||
|
Commodity contracts
|
Cost of goods sold
|
1.4
|
|
0.4
|
|
(2.1
|
)
|
||||||
|
$
|
1.4
|
|
$
|
0.4
|
|
$
|
(2.0
|
)
|
|||||
The ineffective portion of changes in fair value resulted in
zero
charged or credited to earnings for the years ended December 31,
2014
,
2013
and
2012
.
Credit Risk and Collateral
By using derivative instruments, we are exposed to credit and market risk. If a counterparty fails to fulfill its performance obligations under a derivative contract, our credit risk will equal the fair-value gain in a derivative. Generally, when the fair value of a derivative contract is positive, this indicates that the counterparty owes us, thus creating a repayment risk for us. When the fair value of a derivative contract is negative, we owe the counterparty and, therefore, assume no repayment risk. We minimize the credit (or repayment) risk in derivative instruments by entering into transactions with high-quality counterparties. We monitor our positions and the credit ratings of our counterparties, and we do not anticipate non-performance by the counterparties.
Based on the agreements with our various counterparties, cash collateral is required to be provided when the net fair value of the derivatives, with the counterparty, exceed a specific threshold. If the threshold is exceeded, cash is either provided by the counterparty to us if the value of the derivatives is our asset, or cash is provided by us to the counterparty if the value of the derivatives is our liability. As of December 31,
2014
and
2013
, this threshold was not exceeded. In all instances where we are party to a master netting agreement, we offset the receivable or payable recognized upon payment of cash collateral against the fair value amounts recognized for derivative instruments that have also been offset under such master netting agreements.
100
FAIR VALUE MEASUREMENTS
Assets and liabilities recorded at fair value in the consolidated balance sheets are categorized based upon the level of judgment associated with the inputs used to measure their fair value. Hierarchical levels are directly related to the amount of subjectivity associated with the inputs to fair valuation of these assets and liabilities. We are required to separately disclose assets and liabilities measured at fair value on a recurring basis, from those measured at fair value on a nonrecurring basis. Nonfinancial assets measured at fair value on a nonrecurring basis are intangible assets and goodwill, which are reviewed for impairment annually in the fourth quarter and/or when circumstances or other events indicate that impairment may have occurred. Determining which hierarchical level an asset or liability falls within requires significant judgment. The following table summarizes the assets and liabilities measured at fair value in the consolidated balance sheets:
|
Balance at December 31, 2014
|
Quoted Prices in
Active Markets
for Identical
Assets
(Level 1)
|
Significant
Other
Observable
Inputs
(Level 2)
|
Significant
Unobservable
Inputs
(Level 3)
|
Total
|
|||||||||||
|
Assets
|
($ in millions)
|
||||||||||||||
|
Interest rate swaps
|
$
|
—
|
|
$
|
3.5
|
|
$
|
—
|
|
$
|
3.5
|
|
|||
|
Liabilities
|
|
|
|
|
|
|
|
|
|||||||
|
Interest rate swaps
|
—
|
|
4.5
|
|
—
|
|
4.5
|
|
|||||||
|
Commodity forward contracts
|
—
|
|
8.6
|
|
—
|
|
8.6
|
|
|||||||
|
Balance at December 31, 2013
|
|||||||||||||||
|
Assets
|
|||||||||||||||
|
Interest rate swaps
|
$
|
—
|
|
$
|
5.9
|
|
$
|
—
|
|
$
|
5.9
|
|
|||
|
Commodity forward contracts
|
—
|
|
1.3
|
|
—
|
|
1.3
|
|
|||||||
|
Liabilities
|
|||||||||||||||
|
Interest rate swaps
|
—
|
|
7.3
|
|
—
|
|
7.3
|
|
|||||||
|
Earn out
|
—
|
|
—
|
|
26.7
|
|
26.7
|
|
|||||||
For the year ended December 31,
2014
, there were no transfers into or out of Level 1 and Level 2.
The following table summarizes the activity for our earn out liability measured at fair value using Level 3 inputs:
|
December 31,
|
|||||||
|
2014
|
2013
|
||||||
|
($ in millions)
|
|||||||
|
Beginning balance
|
$
|
26.7
|
|
$
|
42.0
|
|
|
|
Settlements
|
(26.7
|
)
|
(23.2
|
)
|
|||
|
Unrealized losses included in other income (expense)
|
—
|
|
7.9
|
|
|||
|
Ending balance
|
$
|
—
|
|
$
|
26.7
|
|
|
Interest Rate Swaps
The fair value of the interest rate swaps was included in other assets and long-term debt as of December 31,
2014
and
2013
. These financial instruments were valued using the “income approach” valuation technique. This method used valuation techniques to convert future amounts to a single present amount. The measurement was based on the value indicated by current market expectations about those future amounts. We use interest rate swaps as a means of managing interest expense and floating interest rate exposure to optimal levels.
101
Commodity Forward Contracts
The fair value of the commodity forward contracts was classified in accrued liabilities as of December 31,
2014
and other current assets as of December 31,
2013
, with unrealized gains and losses included in accumulated other comprehensive loss, net of applicable taxes. These financial instruments were valued primarily based on prices and other relevant information observable in market transactions involving identical or comparable assets or liabilities including both forward and spot prices for commodities. We use commodity forward contracts for certain raw materials and energy costs such as copper, zinc, lead and natural gas to provide a measure of stability in managing our exposure to price fluctuations.
Foreign Currency Contracts
We had no fair value of foreign currency contracts as of December 31,
2014
and
2013
. We enter into forward sales and purchase contracts to manage currency risk resulting from purchase and sale commitments denominated in foreign currencies (principally Canadian dollar and Australian dollar).
Financial Instruments
The carrying values of cash and cash equivalents, restricted cash, accounts receivable and accounts payable approximated fair values due to the short-term maturities of these instruments. The fair value of our long-term debt was determined based on current market rates for debt of similar risk and maturities. The following table summarizes the fair value measurements of debt and the actual debt recorded on our balance sheets:
|
Fair Value Measurements
|
|||||||||||||||||||
|
Level 1
|
Level 2
|
Level 3
|
Total
|
Amount recorded
on balance sheets |
|||||||||||||||
|
($ in millions)
|
|||||||||||||||||||
|
Balance at December 31, 2014
|
$
|
—
|
|
$
|
531.9
|
|
$
|
153.0
|
|
$
|
684.9
|
|
$
|
675.1
|
|
||||
|
Balance at December 31, 2013
|
—
|
|
561.4
|
|
153.0
|
|
714.4
|
|
691.0
|
|
|||||||||
Earn Out
On February 11, 2011 we acquired PolyOne’s
50%
interest in SunBelt. With this acquisition, we agreed to a three-year earn out, which had no guaranteed minimum or maximum, based on the performance of SunBelt. The fair value of the earn out was estimated using a probability-weighted discounted cash flow model. This fair value measurement was based on significant inputs not observed in the market. Key assumptions in determining the fair value of the earn out included the discount rate and cash flow projections. The final earn out payment was made in 2014.
For the years ended December 31,
2014
and
2013
, we paid
$26.7 million
and
$23.2 million
, respectively, for the earn out related to the 2013 and 2012 SunBelt performance. The earn out payments for 2014 and 2013 included
$14.8 million
and
$17.1 million
, respectively, that were recognized as part of the original purchase price. The
$14.8 million
and
$17.1 million
are included as a financing activity in the statement of cash flows.
Nonrecurring Fair Value Measurements
In addition to assets and liabilities that are recorded at fair value on a recurring basis, we record assets and liabilities at fair value on a nonrecurring basis as required by ASC 820. There were no assets measured at fair value on a nonrecurring basis as of December 31,
2014
and
2013
.
102
OTHER FINANCIAL DATA
Quarterly Data (Unaudited)
($ in millions, except per share data)
|
2014
|
First
Quarter
|
Second
Quarter
|
Third
Quarter
|
Fourth
Quarter
|
Year
|
|||||||||||||||
|
Sales
|
$
|
577.4
|
|
$
|
570.4
|
|
$
|
593.6
|
|
$
|
499.8
|
|
$
|
2,241.2
|
|
|||||
|
Cost of goods sold
|
475.4
|
|
463.6
|
|
492.3
|
|
421.9
|
|
1,853.2
|
|
||||||||||
|
Income from continuing operations
|
29.5
|
|
36.6
|
|
26.1
|
|
12.8
|
|
105.0
|
|
||||||||||
|
Income from discontinued operations, net
|
—
|
|
0.7
|
|
—
|
|
—
|
|
0.7
|
|
||||||||||
|
Net income
|
29.5
|
|
37.3
|
|
26.1
|
|
12.8
|
|
105.7
|
|
||||||||||
|
Basic income per common share:
|
||||||||||||||||||||
|
Income from continuing operations
|
0.37
|
|
0.46
|
|
0.33
|
|
0.16
|
|
1.33
|
|
||||||||||
|
Income from discontinued operations, net
|
—
|
|
0.01
|
|
—
|
|
—
|
|
0.01
|
|
||||||||||
|
Net income
|
0.37
|
|
0.47
|
|
0.33
|
|
0.16
|
|
1.34
|
|
||||||||||
|
Diluted income per common share:
|
||||||||||||||||||||
|
Income from continuing operations
|
0.37
|
|
0.46
|
|
0.33
|
|
0.16
|
|
1.32
|
|
||||||||||
|
Income from discontinued operations, net
|
—
|
|
0.01
|
|
—
|
|
—
|
|
0.01
|
|
||||||||||
|
Net income
|
0.37
|
|
0.47
|
|
0.33
|
|
0.16
|
|
1.33
|
|
||||||||||
|
Common dividends per share
|
0.20
|
|
0.20
|
|
0.20
|
|
0.20
|
|
0.80
|
|
||||||||||
|
Market price of common stock
(1)
|
||||||||||||||||||||
|
High
|
29.18
|
|
29.28
|
|
28.08
|
|
25.97
|
|
29.28
|
|
||||||||||
|
Low
|
24.51
|
|
26.42
|
|
25.23
|
|
20.43
|
|
20.43
|
|
||||||||||
|
2013
|
First
Quarter |
Second
Quarter
|
Third
Quarter |
Fourth
Quarter |
Year
|
|||||||||||||||
|
Sales
|
$
|
630.0
|
|
$
|
652.2
|
|
$
|
670.7
|
|
$
|
562.1
|
|
$
|
2,515.0
|
|
|||||
|
Cost of goods sold
|
504.4
|
|
531.1
|
|
528.5
|
|
469.7
|
|
2,033.7
|
|
||||||||||
|
Net income
|
40.5
|
|
43.7
|
|
69.7
|
|
24.7
|
|
178.6
|
|
||||||||||
|
Net income per common share:
|
||||||||||||||||||||
|
Basic
|
0.50
|
|
0.54
|
|
0.87
|
|
0.31
|
|
2.24
|
|
||||||||||
|
Diluted
|
0.50
|
|
0.54
|
|
0.86
|
|
0.31
|
|
2.21
|
|
||||||||||
|
Common dividends per share
|
0.20
|
|
0.20
|
|
0.20
|
|
0.20
|
|
0.80
|
|
||||||||||
|
Market price of common stock
(1)
|
||||||||||||||||||||
|
High
|
25.42
|
|
26.05
|
|
25.17
|
|
29.52
|
|
29.52
|
|
||||||||||
|
Low
|
21.29
|
|
22.74
|
|
22.50
|
|
21.79
|
|
21.29
|
|
||||||||||
|
(1)
|
NYSE composite transactions.
|
Not applicable.
Our chief executive officer and our chief financial officer evaluated the effectiveness of our disclosure controls and procedures as of December 31,
2014
. Based on that evaluation, our chief executive officer and chief financial officer have concluded that, as of such date, our disclosure controls and procedures were effective to ensure that information Olin is required to disclose in the reports that it files or submits with the SEC under the Securities Exchange Act of 1934 is recorded, processed, summarized and reported within the time periods specified in the Commission’s rules and forms, and to ensure that information required to be disclosed in such reports is accumulated and communicated to our management, including our chief executive officer and chief financial officer, as appropriate to allow timely decisions regarding required disclosure.
103
There have been no changes in our internal control over financial reporting that occurred during the quarter ended December 31,
2014
that have materially affected, or are reasonably likely to materially affect, our internal control over financial reporting.
Management’s report on internal control over financial reporting and the related report of Olin’s independent registered public accounting firm, KPMG LLP, are included in Item 8—“Consolidated Financial Statements and Supplementary Data.”
Not applicable.
104
We incorporate the biographical information relating to our Directors under the heading ITEM 1—“PROPOSAL FOR THE ELECTION OF DIRECTORS” in our Proxy Statement relating to our 2015 Annual Meeting of Shareholders (the “Proxy Statement”) by reference in this Report. See also the list of executive officers following Item 4 in Part I of this Report. We incorporate the information regarding compliance with Section 16 of the Securities Exchange Act of 1934, as amended, under the heading entitled “SECTION 16(a) BENEFICIAL OWNERSHIP REPORTING COMPLIANCE” under the heading “SECURITY OWNERSHIP OF DIRECTORS AND OFFICERS” in our Proxy Statement by reference in this Report.
The information with respect to our audit committee, including the audit committee financial expert, is incorporated by reference in this Report to the information contained in the paragraph entitled “What Are The Committees Of The Board?” under the heading “CORPORATE GOVERNANCE MATTERS” in our Proxy Statement. We incorporate by reference in this Report information regarding procedures for shareholders to nominate a director for election, in the Proxy Statement under the headings “MISCELLANEOUS—How can I directly nominate a director for election to the board at the 2016 annual meeting?” and “CORPORATE GOVERNANCE MATTERS—What Is Olin’s Director Nomination Process?”.
We have adopted a code of business conduct and ethics for directors, officers and employees, known as the Code of Conduct. The Code of Conduct is available in the About Olin, Ethics section of our website at www.olin.com. Olin intends to satisfy disclosure requirements under Item 5.05 of Form 8-K regarding an amendment to, or waiver from, any provision of the Code of Conduct with respect to its executive officers or directors by posting such amendment or waiver on its website.
The information in the Proxy Statement under the heading “Compensation Committee Interlocks and Insider Participation,” on page 17 and the information on pages 23 through 65, (beginning with the information under the heading “COMPENSATION DISCUSSION AND ANALYISIS” through the information under the heading “COMPENSATION COMMITTEE REPORT,”) are incorporated by reference in this Report.
We incorporate the information concerning holdings of our common stock by certain beneficial owners contained under the heading “CERTAIN BENEFICIAL OWNERS” in our Proxy Statement, and the information concerning beneficial ownership of our common stock by our directors and officers under the heading “SECURITY OWNERSHIP OF DIRECTORS AND OFFICERS” in our Proxy Statement by reference in this Report.
105
Equity Compensation Plan Information
|
(a)
|
(b)
|
(c)
|
||||||||||
|
Plan Category
|
Number of securities
to be issued upon exercise of
outstanding options, warrants
and rights
(1)
|
Weighted-average exercise
price of outstanding
options, warrants
and rights
|
Number of securities remaining
available for future
issuance under equity compensation plans
excluding securities reflected in column (a)
(1)
|
|||||||||
|
Equity compensation plans approved by security holders
(2)
|
5,055,054
|
|
(3)
|
$
|
20.12
|
|
(3)
|
3,798,521
|
|
|||
|
Equity compensation plans not approved by security holders
|
N/A
|
|
N/A
|
|
N/A
|
|
||||||
|
Total
|
5,055,054
|
|
$
|
20.12
|
|
(3)
|
3,798,521
|
|
||||
|
(1)
|
Number of shares is subject to adjustment for changes in capitalization for stock splits and stock dividends and similar events.
|
|
(2)
|
Consists of the 2000 Long Term Incentive Plan, the 2003 Long Term Incentive Plan, the 2006 Long Term Incentive Plan, the 2009 Long Term Incentive Plan, the 2014 Long Term Incentive Plan and the 1997 Stock Plan for Non-employee Directors. Does not include information about the equity compensation plan listed in the table below, which has expired. No additional awards may be granted under this expired plan. As of December 31, 2014:
|
|
Plan Name
|
Expiration date
|
Number of securities
issuable under
outstanding options
|
Weighted
average
exercise price
|
Weighted average
remaining term
|
||||||
|
1996 Stock Option Plan for Key Employees of Olin Corporation and Subsidiaries
|
1/25/2006
|
31,602
|
$
|
23.78
|
|
1.1 years
|
||||
|
(3)
|
Includes:
|
|
•
|
4,102,151 shares issuable upon exercise of options with a weighted average exercise price of $20.12, and a weighted average remaining term of 5.6 years,
|
|
•
|
79,100 shares issuable under restricted stock unit grants, with a weighted average remaining term of 1.3 years,
|
|
•
|
421,500 shares issuable in connection with outstanding performance share awards, with a weighted average term of 1.0 years remaining in the performance measurement period, and
|
|
•
|
452,303 shares under the 1997 Stock Plan for Non-employee Directors which represent stock grants for retainers, other board and committee fees, and dividends on deferred stock under the plan.
|
We incorporate the information under the headings “Review, Approval or Ratification of Transactions with Related Persons,” “Related Person Transactions Since the Beginning of 2014” and “Which Board Members Are Independent?” in our Proxy Statement by reference in this Report.
We incorporate the information concerning the accounting fees and services of our independent registered public accounting firm, KPMG LLP under the heading ITEM 4—“PROPOSAL TO RATIFY APPOINTMENT OF INDEPENDENT REGISTERED PUBLIC ACCOUNT FIRM” in our Proxy Statement by reference in this Report.
106
(a) 1.
Consolidated Financial Statements
Consolidated financial statements of the registrant are included in Item 8 above.
2.
Financial Statement Schedules
Schedules not included herein are omitted because they are inapplicable or not required or because the required information is given in the consolidated financial statements and notes thereto.
Separate consolidated financial statements of our 50% or less owned subsidiaries accounted for by the equity method are not summarized herein and have been omitted because, in the aggregate, they would not constitute a significant subsidiary.
107
3.
Exhibits
See the Exhibit Index immediately prior to the exhibits which is hereby incorporated by reference. The following exhibits, listed on the Exhibit Index, are filed with this Annual Report on Form 10-K:
|
Exhibit No.
|
Description
|
|
10(k)
|
Amended and Restated 1997 Stock Plan for Non-employee Directors codified to reflect amendments adopted through December 2, 2014, effective January 1, 2015
|
|
10(u)
|
Performance Share Program codified to reflect amendments through January 23, 2015
|
|
11
|
Computation of Per Share Earnings (included in the Note–“Earnings Per Share” to Notes to Consolidated Financial Statements in Item 8)
|
|
12
|
Computation of Ratio of Earnings to Fixed Charges (Unaudited)
|
|
21
|
List of Subsidiaries
|
|
23
|
Consent of KPMG LLP
|
|
31.1
|
Section 302 Certification Statement of Chief Executive Officer
|
|
31.2
|
Section 302 Certification Statement of Chief Financial Officer
|
|
32
|
Section 906 Certification Statement of Chief Executive Officer and Chief Financial Officer
|
|
101.INS
|
XBRL Instance Document
|
|
101.SCH
|
XBRL Taxonomy Extension Schema Document
|
|
101.CAL
|
XBRL Taxonomy Extension Calculation Linkbase Document
|
|
101.DEF
|
XBRL Taxonomy Extension Definition Linkbase Document
|
|
101.LAB
|
XBRL Taxonomy Extension Label Linkbase Document
|
|
101.PRE
|
XBRL Taxonomy Extension Presentation Linkbase Document
|
Any exhibit is available from the Company by writing to: Mr. George H. Pain, Senior Vice President, General Counsel and Secretary, Olin Corporation, 190 Carondelet Plaza, Suite 1530, Clayton, MO 63105-3443.
Shareholders may obtain information from Wells Fargo Shareowner Services, our registrar and transfer agent, who also manages our Dividend Reinvestment Plan by writing to: Wells Fargo Shareowner Services, PO Box 64874, St. Paul, MN 55164-0854, by telephone at (800) 468-9716 or via the Internet at
www.shareowneronline.com
, click on “contact us”.
108
SIGNATURES
Pursuant to the requirements of Section 13 or 15(d) of the Securities Exchange Act of 1934, the registrant has duly caused this report to be signed on its behalf by the undersigned, thereunto duly authorized.
Date:
February 25, 2015
|
OLIN CORPORATION
|
|||
|
By:
|
/s/ Joseph D. Rupp
|
||
|
Joseph D. Rupp
|
|||
|
Chairman and Chief Executive Officer
|
|||
Pursuant to the requirements of the Securities Exchange Act of 1934, this report has been signed below by the following persons on behalf of the registrant and in the capacities and on the date indicated.
109
|
Signature
|
Title
|
Date
|
||
|
/s/ JOSEPH D. RUPP
Joseph D. Rupp
|
Chairman and Chief Executive Officer and Director (Principal Executive Officer)
|
February 25, 2015
|
||
|
/s/ GRAY G. BENOIST
Gray G. Benoist
|
Director
|
February 25, 2015
|
||
|
/s/ DONALD W. BOGUS
Donald W. Bogus
|
Director
|
February 25, 2015
|
||
|
/s/ C. ROBERT BUNCH
C. Robert Bunch
|
Director
|
February 25, 2015
|
||
|
/s/ RANDALL W. LARRIMORE
Randall W. Larrimore
|
Director
|
February 25, 2015
|
||
|
/s/ JOHN M. B. O’CONNOR
John M. B. O’Connor
|
Director
|
February 25, 2015
|
||
|
/s/ RICHARD M. ROMPALA
Richard M. Rompala
|
Director
|
February 25, 2015
|
||
|
/s/ PHILIP J. SCHULZ
Philip J. Schulz
|
Director
|
February 25, 2015
|
||
|
/s/ VINCENT J. SMITH
Vincent J. Smith
|
Director
|
February 25, 2015
|
||
|
/s/ TODD A. SLATER
Todd A. Slater
|
Vice President and Chief Financial Officer (Principal Financial Officer)
|
February 25, 2015
|
||
|
/s/ RANDEE N. SUMNER
Randee N. Sumner
|
Vice President and Controller (Principal Accounting Officer)
|
February 25, 2015
|
||
110
EXHIBIT INDEX
Management contracts and compensatory plans and arrangements are listed as Exhibits 10(a) through 10(y) below.
|
3
|
|
(a)
|
Olin’s Amended and Restated Articles of Incorporation as amended effective May 2, 2011—Exhibit 3.1 to Olin’s Form 8-K dated May 3, 2011.*
|
|
(b)
|
Bylaws of Olin as amended effective December 9, 2010—Exhibit 3.1 to Olin’s Form 8-K dated December 10, 2010.*
|
||
|
4
|
|
(a)
|
Indenture between Olin and JPMorgan Chase Bank, N.A. dated as of June 26, 2006—Exhibit 4.1 to Olin’s Form 8-K dated June 26, 2006.*
|
|
(b)
|
6.75% Senior Note Due 2016—Exhibit 4.1 to Olin’s Form 8-K dated July 28, 2006.*
|
||
|
(c)
|
First Supplemental Indenture between Olin and JPMorgan Chase Bank, N.A. dated July 28, 2006—Exhibit 4.2 to Olin’s Form 8-K dated July 28, 2006.*
|
||
|
(d)
|
Registration Rights Agreement among Olin, Banc of America Securities LLC, Citigroup Global Markets Inc. and Wachovia Capital Markets, LLC dated July 28, 2006—Exhibit 4.3 to Olin’s Form 8-K dated July 28, 2006.*
|
||
|
(e)
|
Indenture dated as of August 19, 2009, between Olin Corporation and The Bank of New York Mellon Trust Company—Exhibit 4.1 to Olin’s Form 8-K dated August 19, 2009.*
|
||
|
(f)
|
First Supplemental Indenture dated as of August 19, 2009, between Olin Corporation and The Bank of New York Mellon Trust Company—Exhibit 4.2 to Olin’s Form 8-K dated August 19, 2009.*
|
||
|
(g)
|
Form of 8.875% Senior Note due 2019—Exhibit 4.3 to Olin’s Form 8-K dated August 19, 2009.*
|
||
|
(h)
|
Trust Indenture effective October 1, 2010 between The Industrial Development Authority of Washington County and U. S. Bank, National Association, as trustee—Exhibit 4.1 to Olin’s Form 8-K dated October 20, 2010.*
|
||
|
(i)
|
Loan Agreement effective October 1, 2010 between The Industrial Development Authority of Washington County and Olin Corporation—Exhibit 4.2 to Olin’s Form 8-K dated October 20, 2010.*
|
||
|
(j)
|
Bond Purchase Agreement dated October 14, 2010 between The Industrial Development Authority of Washington County, Olin Corporation and PNC Bank National Association, as administrative agent—Exhibit 4.3 to Olin’s Form 8-K dated October 20, 2010.*
|
||
|
(k)
|
Trust Indenture effective December 1, 2010 between the Mississippi Business Finance Corporation and U. S. Bank, National Association, as trustee—Exhibit 4.1 to Olin’s Form 8-K dated December 10, 2010.*
|
||
|
(l)
|
Loan Agreement effective December 1, 2010 between the Mississippi Business Finance Corporation and Olin Corporation—Exhibit 4.2 to Olin’s Form 8-K dated December 10, 2010.*
|
||
|
(m)
|
Bond Purchase Agreement dated December 9, 2010 between the Mississippi Business Finance Corporation, Olin Corporation and PNC Bank National Association, as administrative agent—Exhibit 4.3 to Olin’s Form 8-K dated December 10, 2010.*
|
||
|
(n)
|
Amended and Restated Credit and Funding Agreement dated December 9, 2010 between Olin Corporation, as borrower; PNC Bank National Association, as administrative agent; PNC Capital Markets, LLC, as lead arranger; and the Lenders party thereto—Exhibit 4.4 to Olin’s Form 8-K dated December 10, 2010.*
|
||
|
(o)
|
First Amendment dated December 27, 2010 to the Amended and Restated Credit and Funding Agreement dated December 9, 2010 between Olin Corporation, as borrower; PNC Bank National Association, as administrative agent; PNC Capital Markets, LLC, as lead arranger; and the Lenders party thereto—Exhibit 4.4 to Olin’s Form 8-K dated December 29, 2010.*
|
||
|
(p)
|
Trust Indenture effective December 27, 2010 between the Industrial Development Board of the County of Bradley and the City of Cleveland, TN and U. S. Bank, National Association, as trustee—Exhibit 4.1 to Olin’s Form 8-K dated December 29, 2010.*
|
||
|
(q)
|
Loan Agreement effective December 27, 2010 between the Industrial Development Board of the County of Bradley and the City of Cleveland, Tennessee and Olin Corporation—Exhibit 4.2 to Olin’s Form 8-K dated December 29, 2010.*
|
||
|
(r)
|
Bond Purchase Agreement dated December 27, 2010 between the Industrial Development Board of the County of Bradley and the City of Cleveland, Tennessee, Olin Corporation and PNC Bank National Association, as administrative agent—Exhibit 4.3 to Olin’s Form 8-K dated December 29, 2010.*
|
||
|
(s)
|
Forward Purchase Agreement dated April 27, 2012 by and among Olin Corporation, the Lenders (as defined therein), and PNC Bank, National Association, as administrative agent for the Lenders under the Funding Agreement—Exhibit 4.1 to Olin’s Form 8-K dated May 3, 2012.*
|
||
111
|
(t)
|
Second Amendment to Amended and Restated Funding and Credit Agreement dated April 27, 2012 among Olin Corporation, the Lenders, and PNC Bank, National Association, as administrative agent for the Lenders—Exhibit 4.2 to Olin’s Form 8-K dated May 3, 2012.*
|
||
|
(u)
|
Second Supplemental Indenture dated as of August 9, 2012 between Olin Corporation, The Bank of New York Mellon Trust Company, N.A. and U. S. Bank National Association—Exhibit 4.1 to Olin’s Form 8-K dated August 9, 2012.*
|
||
|
(v)
|
Third Supplemental Indenture dated as of August 22, 2012 between Olin Corporation and U. S. Bank National Association—Exhibit 4.1 to Olin’s Form 8-K dated August 22, 2012.*
|
||
|
(w)
|
Form of 5.50% Senior Notes due 2022—Exhibit 4.2 to Olin’s Form 8-K dated August 22, 2012.*
|
||
|
(x)
|
Amended and Restated Forward Purchase Agreement dated June 23, 2014 by and among Olin Corporation, the Lenders (as defined therein), and PNC Bank, National Association, as administrative agent for the Lenders under the Funding Agreement—Exhibit 4.1 to Olin’s Form 8-K dated June 25, 2014.*
|
||
|
(y)
|
Third Amendment to Amended and Restated Funding and Credit Agreement dated June 23, 2014 among Olin Corporation, the Lenders, and PNC Bank, National Association, as administrative agent for the Lenders—Exhibit 4.2 to Olin’s Form 8-K dated June 25, 2014.*
|
||
|
We are party to a number of other instruments defining the rights of holders of long-term debt. No such instrument authorizes an amount of securities in excess of 10% of the total assets of Olin and its subsidiaries on a consolidated basis. Olin agrees to furnish a copy of each instrument to the Commission upon request.
|
|||
|
10
|
|
(a)
|
Employee Deferral Plan as amended and restated effective as of January 30, 2003 and as amended effective January 1, 2005—Exhibit 10(b) to Olin’s Form 10-K for 2002 and Exhibit 10(b)(1) to Olin’s Form 10-K for 2005, respectively.*
|
|
(b)
|
Olin Senior Executive Pension Plan amended and restated effective October 24, 2008—Exhibit 10.1 to Olin’s Form 10-Q for the quarter ended September 30, 2008.*
|
||
|
(c)
|
Olin Supplemental Contributing Employee Ownership Plan as amended and restated effective October 24, 2008 and as amended effective February 19, 2009—Exhibit 10.3 to Olin’s Form 10-Q for the quarter ended September 30, 2008 and Exhibit 10.1 to Olin’s Form 10-Q for the quarter ended March 31, 2009, respectively.*
|
||
|
(d)
|
Olin Corporation Key Executive Life Insurance Program—Exhibit 10(e) to Olin’s Form 10-K for 2002.*
|
||
|
(e)
|
Form of amendment to executive agreement between Olin and Messrs. Curley and Fischer dated November 9, 2007—Exhibit 10(g) to Olin’s Form 10-K for 2007.*
|
||
|
(f)
|
Form of amendment to executive agreement between Olin and G. Bruce Greer, Jr. dated November 9, 2007—Exhibit 10(i) to Olin’s Form 10-K for 2007.*
|
||
|
(g)
|
Form of executive agreement between Olin and Messrs. Rupp, McIntosh and Pain dated November 1, 2007—Exhibit 10.1 to Olin’s Form 10-Q for the quarter ended September 30, 2007.*
|
||
|
(h)
|
Form of amendment dated October 25, 2010 to executive agreements with Messrs. Curley, Fischer, Greer, McIntosh, Pain and Rupp—Exhibit 10.1 to Olin’s Form 10-K for 2010.*
|
||
|
(i)
|
Form of executive change in control agreement between Olin and Messrs. Rupp, Curley, Fischer, McIntosh and Pain dated January 29, 2014—Exhibit 10.1 to Olin’s Form 8-K dated January 30, 2014.*
|
||
|
(j)
|
Form of executive change in control agreement between Olin and Ms. Ennico and Messrs. Chirumbole, Greer, O’Keefe and Slater dated January 29, 2014—Exhibit 10(l) to Olin's Form 10-K for 2013.*
|
||
|
(k)
|
Amended and Restated 1997 Stock Plan for Non-employee Directors codified to reflect amendments adopted through December 2, 2014, effective January 1, 2015.
|
||
|
(l)
|
Amended and Restated Olin Senior Management Incentive Compensation Plan, as amended and restated effective April 22, 2010—Appendix B to Olin’s Proxy Statement dated March 10, 2010.*
|
||
|
(m)
|
Description of Restricted Stock Unit Awards granted under the 2000, 2003, 2006 or 2009 Long Term Incentive Plans—Exhibit 10(p) to Olin’s Form 10-K for 2008.*
|
||
|
(n)
|
1996 Stock Option Plan for Key Employees of Olin Corporation and Subsidiaries as amended as of January 30, 2003—Exhibit 10(l) to Olin’s Form 10-K for 2002.*
|
||
|
(o)
|
Olin Supplementary and Deferral Benefit Pension Plan as amended and restated effective October 24, 2008—Exhibit 10.2 to Olin’s Form 10-Q for the quarter ended September 30, 2008.*
|
||
|
(p)
|
Olin Corporation 2000 Long Term Incentive Plan as amended and restated effective January 24, 2014—Exhibit 10(r) to Olin’s Form 10-K for 2013.*
|
||
|
(q)
|
Olin Corporation 2003 Long Term Incentive Plan as amended and restated effective January 24, 2014—Exhibit 10(s) to Olin’s Form 10-K for 2013.*
|
||
|
(r)
|
Olin Corporation 2006 Long Term Incentive Plan as amended and restated effective January 24, 2014—Exhibit 10(t) to Olin’s Form 10-K for 2013.*
|
||
112
|
(s)
|
Olin Corporation 2009 Long Term Incentive Plan as amended and restated effective January 24, 2014—Exhibit 10(u) to Olin’s Form 10-K for 2013.*
|
||
|
(t)
|
Olin Corporation 2014 Long Term Incentive Plan effective January 24, 2014—Exhibit 10.1 to Olin’s Form 8-K filed April 25, 2014.*
|
||
|
(u)
|
Performance Share Program codified to reflect amendments through January 23, 2015.
|
||
|
(v)
|
Form of Non-Qualified Stock Option Award Certificate—Exhibit 10(bb) to Olin’s Form 10-K for 2007.*
|
||
|
(w)
|
Form of Restricted Stock Unit Award Certificate—Exhibit 10(cc) to Form 10-K for 2007.*
|
||
|
(x)
|
Form of Performance Award and Senior Performance Award Certificates—Exhibit 10(dd) to Olin’s Form 10-K for 2007.*
|
||
|
(y)
|
Summary of Stock Option Continuation Policy—Exhibit 10.2 to Olin’s Form 10-Q for the quarter ended March 31, 2009.*
|
||
|
(z)
|
Olin Corporation Contributing Employee Ownership Plan Amended and Restated effective as of December 31, 2009—Exhibit 10(dd) to Olin’s Form 10-K for 2009.*
|
||
|
(aa)
|
Distribution Agreement between Olin Corporation and Arch Chemicals, Inc., dated as of February 1, 1999—Exhibit 2.1 to Olin’s Form 8-K filed February 23, 1999.*
|
||
|
(bb)
|
Purchase Agreement dated as of February 28, 2011, by and among PolyOne Corporation, 1997 Chloralkali Venture, LLC, Olin Corporation and Olin SunBelt II, Inc.—Exhibit 2.1 to Olin’s Form 8-K dated March 3, 2011.*
|
||
|
(cc)
|
Note Purchase Agreement dated December 22, 1997 between the SunBelt Chlor Alkali Partnership and the Purchasers named therein—Exhibit 99.5 to Olin’s Form 8-K dated December 3, 2001.*
|
||
|
(dd)
|
Guarantee Agreement dated December 22, 1997 between Olin and the Purchasers named therein—Exhibit 99.6 to Olin’s Form 8-K dated December 3, 2001.*
|
||
|
(ee)
|
Subordination Agreement dated December 22, 1997 between Olin and the Subordinated Parties named therein—Exhibit 99.7 to Olin’s Form 8-K dated December 3, 2001.*
|
||
|
(ff)
|
Agreement and Plan of Merger dated as of May 20, 2007, among Olin Corporation, Princeton Merger Corp., and Pioneer Companies, Inc.—Exhibit 2.1 to Olin’s Form 8-K dated May 21, 2007.*
|
||
|
(gg)
|
Purchase Agreement dated as of October 15, 2007, among Global Brass and Copper Acquisition Co. and Olin Corporation—Exhibit 2.1 to Olin’s Form 8-K dated October 15, 2007.*
|
||
|
(hh)
|
Credit Agreement dated as of April 27, 2012 among Olin Corporation, Olin Canada ULC and the banks named therein—Exhibit 10.1 to Olin’s Form 8-K dated May 3, 2012.*
|
||
|
(ii)
|
Stock Purchase Agreement dated as of July 17, 2012, by and among K. A. Steel Chemicals Inc., the stockholders of K. A. Steel Chemicals Inc. and Robert F. Steel, as the sellers’ representative—Exhibit 2.1 to Olin’s Form 8-K dated July 18, 2012.*
|
||
|
(jj)
|
Credit Agreement dated as of June 24, 2014 among Olin Corporation, Olin Canada ULC, the Lenders (as defined therein), Wells Fargo Bank, National Association, as administrative agent and Wells Fargo Securities, LLC, Merrill Lynch, Pierce, Fenner & Smith Incorporated and Citigroup Global Markets, Inc., as joint lead arrangers—Exhibit 10.1 to Olin’s Form 8-K dated June 25, 2014.*
|
||
|
11
|
|
Computation of Per Share Earnings (included in the Note—“Earnings Per Share” to Notes to Consolidated Financial Statements in Item 8).
|
|
|
12
|
|
Computation of Ratio of Earnings to Fixed Charges (unaudited).
|
|
|
14
|
|
Code of Conduct—Exhibit 14.1 to Olin’s Form 8-K dated December 19, 2012.*
|
|
|
21
|
|
List of Subsidiaries.
|
|
|
23
|
|
Consent of KPMG LLP.
|
|
|
31.1
|
|
Section 302 Certification Statement of Chief Executive Officer.
|
|
|
31.2
|
|
Section 302 Certification Statement of Chief Financial Officer.
|
|
|
32
|
|
Section 906 Certification Statement of Chief Executive Officer and Chief Financial Officer.
|
|
|
101.INS
|
|
XBRL Instance Document
|
|
|
101.SCH
|
|
XBRL Taxonomy Extension Schema Document
|
|
|
101.CAL
|
|
XBRL Taxonomy Extension Calculation Linkbase Document
|
|
|
101.DEF
|
|
XBRL Taxonomy Extension Definition Linkbase Document
|
|
|
101.LAB
|
|
XBRL Taxonomy Extension Label Linkbase Document
|
|
|
101.PRE
|
|
XBRL Taxonomy Extension Presentation Linkbase Document
|
|
*Previously filed as indicated and incorporated herein by reference. Exhibits incorporated by reference are located in SEC file No. 1-1070 unless otherwise indicated.
113
TABLE OF CONTENTS
Part IItem 1. BusinessItem 1A. Risk FactorsItem 1B. Unresolved Staff CommentsItem 2. PropertiesItem 3. Legal ProceedingsItem 4. Mine Safety DisclosuresPart IIItem 5. Market For Registrant S Common Equity, Related Stockholder Matters and Issuer Purchases Of Equity SecuritiesItem 6. Selected Financial DataItem 7. Management S Discussion and Analysis Of Financial Condition and Results Of OperationsItem 7A. Quantitative and Qualitative Disclosures About Market RiskItem 8. Consolidated Financial Statements and Supplementary DataItem 9. Changes in and Disagreements with Accountants on Accounting and Financial DisclosureItem 9A. Controls and ProceduresItem 9B. Other InformationPart IIIItem 10. Directors, Executive Officers, and Corporate GovernanceItem 11. Executive CompensationItem 12. Security Ownership Of Certain Beneficial Owners and Management and Related Stockholder MattersItem 13. Certain Relationships and Related Transactions and Director IndependenceItem 14. Principal Accounting Fees and ServicesPart IVItem 15. Exhibits; Consolidated Financial Statement Schedules