OMNICELL, INC
10-Ks and 10-Qs
|
|
|
|
|
|
|
|
|
|
|
|
|
|
|
|
|
|
|
|
|
|
|
|
|
|
|
|
|
|
|
|
|
|
|
|
|
|
|
|
|
|
|
|
|
|
|
|
|
|
|
|
|
|
|
|
|
|
|
|
|
|
UNITED STATES
SECURITIES AND EXCHANGE COMMISSION
Washington, D.C. 20549
____________________________________________________________________________
FORM 10-K
|
(Mark One)
|
|
|
ý
|
ANNUAL REPORT PURSUANT TO SECTION 13 OR 15(d) OF THE SECURITIES EXCHANGE ACT OF 1934
|
|
For the fiscal year ended December 31, 2013
|
|
|
OR
|
|
|
o
|
TRANSITION REPORT PURSUANT TO SECTION 13 OR 15(d) OF THE SECURITIES EXCHANGE ACT OF 1934
|
|
For the transition period from to
|
|
Commission File No. 000-33043
OMNICELL, INC.
(Exact name of Registrant as specified in its charter)
|
Delaware
(State or other jurisdiction of
incorporation or organization)
|
94-3166458
(IRS Employer
Identification No.)
|
590 East Middlefield Road
Mountain View, CA 94043
(Address of registrant's principal executive offices, including zip code)
(650) 251-6100
(Registrant's telephone number, including area code)
Securities registered pursuant to Section 12(b) of the Act:
|
Title of each class
|
Name of each exchange on which registered
|
|
|
Common Stock, $0.001 par value
|
The NASDAQ Stock Market LLC
|
|
Securities registered pursuant to Section 12(g) of the Act:
None
Indicate by check mark if the registrant is a well-known seasoned issuer, as defined in Rule 405 of the Securities Act. Yes
o
No
ý
Indicate by check mark if the registrant is not required to file reports pursuant to Section 13 or Section 15(d) of the Act. Yes
o
No
ý
Indicate by check mark whether the registrant (1) has filed all reports required to be filed by Section 13 or 15(d) of the Securities Exchange Act of 1934 during the preceding 12 months (or for such shorter period that the registrant was required to file such reports), and (2) has been subject to such filing requirements for the past 90 days. Yes
ý
No
o
Indicate by check mark whether the registrant has submitted electronically and posted on its corporate Website, if any, every Interactive Data File required to be submitted and posted pursuant to Rule 405 of Regulation S-T (§ 232.405 of this chapter) during the preceding 12 months (or for such shorter period that the registrant was required to submit and post such files). Yes
ý
No
o
Indicate by check mark if disclosure of delinquent filers pursuant to Item 405 of Regulation S-K is not contained herein, and will not be contained, to the best of registrant's knowledge, in definitive proxy or information statements incorporated by reference in Part III of this Form 10-K or any amendment to this Form 10-K.
o
Indicate by check mark whether the registrant is a large accelerated filer, an accelerated filer, a non-accelerated filer, or a smaller reporting company. See the definitions of "large accelerated filer," "accelerated filer" and "smaller reporting company" in Rule 12b-2 of the Exchange Act. (Check one):
|
Large accelerated filer
o
|
Accelerated filer
ý
|
Non-accelerated filer
o
(Do not check if a
smaller reporting company)
|
Smaller reporting company
o
|
|||
Indicate by check mark whether the registrant is a shell company (as defined in Rule 12b-2 of the Exchange Act). Yes
o
No
ý
The aggregate market value of the registrant's common stock, $0.001 par value, held by non-affiliates of the registrant as of June 30, 2013 was
$690.5 million
(based upon the closing sales price of such stock as reported on The NASDAQ Global Select Market on such date) which excludes an aggregate of
1,114,313
shares of the registrant's common stock held by officers, directors and affiliated stockholders. For purposes of determining whether a stockholder was an affiliate of the registrant at June 30, 2013, the registrant has assumed that a stockholder was an affiliate of the registrant at June 30, 2013 if such stockholder (i) beneficially owned 10% or more of the registrant's common stock and/or (ii) was affiliated with an executive officer or director of the registrant at June 30, 2013. Exclusion of such shares should not be construed to indicate that any such person possesses the power, direct or indirect, to direct or cause the direction of the management or policies of the registrant or that such person is controlled by or under common control with the registrant.
As of
March 7, 2014
, there were
36,362,249
shares of the registrant's common stock, $0.001 par value, outstanding.
DOCUMENTS INCORPORATED BY REFERENCE
Portions of the registrant's definitive Proxy Statement for the 2014 Annual Meeting of Stockholders to be filed with the Securities and Exchange Commission pursuant to Regulation 14A not later than 120 days after the end of the fiscal year covered by this Form 10-K are incorporated by reference in Part III, Items 10-14 of this Form 10-K.
OMNICELL, INC.
2013 Form 10-K Annual Report
Table of Contents
|
Page No.
|
||
|
OTHER
|
||
3
This Annual Report on Form 10-K contains forward-looking statements. The forward looking statements are contained principally in the sections entitled “Risk Factors” and “Management's Discussion and Analysis of Financial Condition and Results of Operations.” These statements involve known and unknown risks, uncertainties and other factors which may cause our actual results, performance or achievements to be materially different from any future results, performances or achievements expressed or implied by the forward-looking statements. Forward-looking statements include, but are not limited to, statements about:
|
•
|
our expectations regarding our future product bookings, which consist of all firm orders, as evidenced by a contract and purchase order for equipment and software and, generally, by a purchase order for consumables. Equipment and software bookings are installable within 12 months and consumables are generally recorded as revenue within one month.;
|
|
•
|
the extent and timing of future revenues, including the amounts of our current backlog, which represents firm orders that have not completed installation and therefore have not been recognized as revenue;
|
|
•
|
the size or growth of our market or market share;
|
|
•
|
the opportunity presented by new products, emerging markets and international market;
|
|
•
|
our ability to align our cost structure and headcount with our current business expectations;
|
|
•
|
the operating margins or earnings per share goals we may set;
|
|
•
|
our ability to protect our intellectual property and operate our business without infringing upon the intellectual property rights of others;
|
|
•
|
our ability to generate cash from operations and our estimates regarding the sufficiency of our cash resources; and
|
|
•
|
our ability to acquire companies, businesses, products or technologies on commercially reasonable terms and integrate such acquisitions effectively.
|
In some cases, you can identify forward-looking statements by terms such as "anticipates," "believes," "could," "estimates," "expects," "intends," "may," "plans," "potential," "predicts," "projects," "should," "will," "would" and similar expressions intended to identify forward-looking statements. Forward-looking statements reflect our current views with respect to future events, are based on assumptions and are subject to risks and uncertainties. We discuss many of these risks in this Annual Report on Form 10-K in greater detail in Part II - Section 1A. “Risk Factors” below. Given these uncertainties, you should not place undue reliance on these forward-looking statements. Also, forward-looking statements represent our estimates and assumptions only as of the date of this Annual Report on Form 10-K. You should also read this Annual Report on Form 10-K and the documents that we reference in this Annual Report on Form 10-K and have filed as exhibits, completely and with the understanding that our actual future results may be materially different from what we expect. All references in this report to "Omnicell, Inc.," "Omnicell," "our," "us," "we," or the "Company" collectively refer to Omnicell, Inc., a Delaware corporation, and its subsidiaries.
Except as required by law, we assume no obligation to update any forward-looking statements publicly, or to update the reasons actual results could differ materially from those anticipated in any forward-looking statements, even if new information becomes available in the future.
We own various trademarks, copyrights and trade names used in our business, including the following: Omnicell
®
, the Omnicell logo, OmniRx
®
, OmniCenter
®
, OmniSupplier
®
, OmniBuyer
®
, SafetyStock
®
, WorkflowRx™, OmniLinkRx™, SecureVault™, Optiflex™, SinglePointe™, AnywhereRN™, Anesthesia Workstation™ , Savvy™, MTS Medication Technologies
®
, the MTS Medication Technologies logo, Medlocker
®
, AccuFlex
®
, Autobond ™, AutoGen ™, easyBLIST™, Pandora
®
, OnDemand
®
,
Multi-Med™, RxMap
®
,
MTS-350 ™, MTS-400 ™ and MTS-500 ™. This report also includes other trademarks, service marks and trade names of other companies. All other trademarks used in this report are trademarks of their respective holders.
4
Overview
We are a leading provider of automation and business information solutions enabling healthcare systems to streamline the medication administration process and manage costly medical supplies for increased operational efficiency and enhanced patient safety. Our automation, analytics and medication adherence solutions in hospitals and longer-term care environments are designed to enable healthcare facilities to acquire, manage, dispense and administer medications and medical-surgical supplies and are intended to enhance patient safety, reduce medication errors, reduce operating costs, improve workflow, and increase operational efficiency.
Over 2,800 hospitals in the United States use one or more of our products, of which more than 1,800 hospitals in the United States have installed our automated hardware/software solutions for controlling, dispensing, acquiring, verifying, tracking and analyzing medications and medical and surgical supplies. Approximately 6,000 hospitals, institutional pharmacies, and retail pharmacies use our products worldwide.
The medical industry has become increasingly aware that human factors inevitably create the risk of medication administration errors in the course of patient care.
The Institute of Medicine, a non-profit, non-governmental arm of the National Academies, published a report in 2006 that estimated that 1.5 million medication errors are made each year in the United States. Acute care facilities are required to adhere to medication regulatory controls that we believe cannot be adequately supported by manual tracking systems or partially automated systems. Any nursing shortages would add an additional challenge to acute care facilities to meet regulatory controls and improve patient safety while still providing adequate patient care.Non-acute care facilities face similar safety challenges. According to "Adherence to Long-Term Therapies-Evidence for Action," in 2003, the World Health Organization stated, “Across diseases, adherence is the single most important modifiable factor that compromises treatment outcome.” U.S. health system thought leaders see medication adherence as a key requirement for closing the medication loop and delivering better clinical outcomes and financial results. Medication non-adherence is described as a critical problem creating approximately $290 billion in extra costs per year, according to the New England Healthcare Institute, resulting in approximately 125,000 deaths per year. In addition, the Centers for Medicare & Medicaid Services stated in 2012 that 11% of all hospital admissions were related to medication non-adherence.
We provide solutions to help healthcare systems and caregivers address these aforementioned needs. We believe our solutions align us with the long-term trends of the healthcare market to manage the health of patients across the continuum of care, and that our patient-centric medication and supply management solutions help improve workflow efficiencies and patient outcomes.
Business Segments
Our business is organized into two operating business segments: Acute Care, which primarily includes products and services sold to hospital customers, and Non-Acute Care, which primarily includes products and services sold to customers outside of the hospital setting. For a description of our operating business segments, refer to Note 17, Segments, of the Notes to Consolidated Financial Statements included in this Annual Report on Form 10-K.
Acute Care
In acute care facilities, our solutions use advanced, software‑based medication control and tracking algorithms that interact with hardware security features, resulting in a system that provides both the pharmacist and the nurse real-time safety controls. Our solutions also go a step further by providing medication bar code verification at every step of the medication administration process, from entry to the hospital through the administration of the medication to a patient. Our systems enable our customers to reduce or eliminate inefficiencies such as manual tracking and reconciliations, nursing time spent in obtaining medications and in performing inventory control and extraneous process steps.
Similar to our medication solutions, our medical and surgical supply systems provide hospitals control over consumable supplies critical to providing quality healthcare. Our solutions provide inventory control software that is designed to ensure critical supplies are always stocked in the right locations. At the same time, usage tracking helps hospital administrators to ensure that money is not wasted on excessive stores of supplies and helps optimize reimbursement by improving charge capture. Our systems automate the tracking of activities in perioperative areas such as the operating room and catheter lab, including tracking implantable tissue grafts for additional patient safety and regulatory compliance.
5
Additionally, we offer analytics and reporting software for pharmacists and material managers to more easily manage inventory flow, tracking and optimization. These reports are often used to identify hospital employees who may be improperly diverting pharmaceuticals stored in the automated dispensing cabinets. Such diversion or theft, especially of controlled substances, could result in black market sales or other illicit uses, and can significantly reduce patient safety when medications intended for a patient are misused.
Non-Acute Care
The Non-Acute Care segment represents products sold outside the hospital setting and includes medication adherence products sold under the brand name of MTS, and dispensing systems sold under the Omnicell brand. The MTS products consist of proprietary medication packaging systems and related products for use by institutional pharmacies servicing long-term care, and correctional facilities or retail pharmacies serving patients in their local communities. These systems use consumable medication punch cards and specialized machines that allow the pharmacies to automatically or semi-automatically assemble, fill and seal drugs into medication punch cards representing a weekly or monthly supply of a patient's medication. The use of these cards and machines provides a cost-effective customized package personalized to the patient. The punch card medication dispensing system provides tamper evident packaging and promotes medication compliance. Medication dispensing systems, sold to non-acute care facilities under the Omnicell brand, are also reflected in the Non-Acute Care segment. As healthcare institutions evolve to provide management of a population’s health as part of Healthcare Reform, our products provide these institutions the ability to manage medications across the continuum of care.
MTS blister cards form the backbone of medication control in non-acute care facilities. Our line of equipment provides solutions ranging from low cost, semi-automated packaging systems to fully automated robotic systems that help eliminate human error and increase the efficiency in the packaging of medications for non-acute care facilities. Our OnDemand line of multi-medication packaging equipment can be used by retail pharmacies to provide enhanced packages that we believe increase the probability that patients will adhere to the medication regimen prescribed by their healthcare provider. We also manufacture the consumable packages used by pharmacists to construct medication adherence packages. Medication dispensing systems are utilized by Non-Acute Care facilities to monitor the use of narcotics and medications needed urgently. Our systems provide enhanced ability to meet regulatory control of these medications in the non-acute care facility where a pharmacist is typically not present. Our systems also provide efficiency by minimizing emergency delivery of medications to non-acute care facilities by institutional pharmacies.
We sell our Non-Acute care blister cards, packaging equipment and ancillary products, as well as automated dispensing equipment used in long term care facilities throughout the United States, Canada, Europe and Australia. Non-Acute Care customers are predominantly institutional and independent retail pharmacies that supply nursing homes, assisted living and correctional facilities with prescription medications for their patients. We predominately manufacture our proprietary consumable blister cards and most of our packaging equipment in our own facilities. This manufacturing process uses integrated equipment for manufacturing the consumable medication blister cards. In addition, we utilize the services of contract manufacturers for some of our packaging equipment and consumable. The majority of our products are distributed directly in the United States, Canada, the United Kingdom and Germany. Distributors are also utilized in these and other geographies.
Business Strategy
Our key business strategies include:
|
•
|
Further penetrating existing markets through technological leadership by:
|
•
Consistently innovating our product and service offerings; and
•
Maintaining our customer-oriented product installation process.
|
•
|
Increasing penetration of new markets, such as non-acute care and international markets by:
|
•
Launching new products and technologies that are specific to the needs of those
markets;
•
Building and establishing direct sales, distribution or other capabilities when and where it is appropriate;
•
Partnering with companies that have sales, distribution or other capabilities that we do not possess; and
•
Increasing customer awareness of safety issues in the administration of medications;
|
•
|
Expanding our product offering through acquisitions and partnerships.
|
6
Our solutions are designed to provide everything the customer requires for installation and maintenance of medication and medical and surgical supply control. Our vision of improving healthcare for everyone has led us to take certain steps in the development of our business and our long term approach to our market, such as:
|
•
|
Providing a full service, positive experience for our hospital customers in the solution sales process, the timing and implementation of our product installations and the responsiveness of our support services;
|
|
•
|
Delivering solutions that are designed to provide our customers with the best experience in the healthcare industry, as measured by customer input and third party surveys;
|
|
•
|
Innovating products to address patient safety and cost-containment pressures facing healthcare facilities while improving clinician workflow and overall operating efficiency;
|
|
•
|
Incorporating a broad range of clinical input into our product solution development to accommodate needs ranging from those of institutional pharmacies and stand-alone community hospitals to multi-hospital entities and integrated delivery networks ("IDNs"); and
|
|
•
|
Developing new solutions to enhance our customers' existing systems and protect our customers' investments by preserving, leveraging and upgrading their existing information systems, as well as striving to provide integration of our products with the other healthcare information systems used by our customers.
|
|
•
|
Providing flexibility in our systems that can be tailored to specific customer needs through modular upgrades, thereby protecting our customers' investments.
|
We have developed or acquired numerous technologies that provide long-term solutions for our customers. Our own product development activities have brought a number of innovative and proprietary products to the market. Our most recently announced solutions include the fourth generation Omnicell G4 platform with the Unity single unified database across the automated medication dispensing system. The Unity database is designed to decrease the risk of human error and save significant pharmacy time by eliminating the need for repetitive entry of drug formularies in multiple locations. The Unity G4 platform is designed to help our customers closely manage medication and supply inventory to reduce costs, comply with increasingly stringent regulatory requirements and safeguard the patient. This platform offers a consistent user interface across all of our products.
In addition to our own development, we have acquired products that extend patient safety controls to a wider range of applications and departments in the hospital. These include products for the central pharmacy, the operating room, the catheterization lab, the nursing areas and the patient point of care. Our most recent acquisitions include the 2010 acquisition of Pandora Data Systems, an analytics solution to allow pharmacists and materials managers to more easily manage inventory flow, tracking and optimization, and to provide information that can be used to detect diversion or theft, and the 2012 acquisition of MTS Medication Technologies, which extended our product line to include solutions for Non-Acute Care customers. In December 2013, we announced our intent to acquire Surgichem Limited from Bupa Home Care PLC, which will further extend our Non-Acute Care solutions in Europe. We believe the breadth of our portfolio of automation products makes our solutions more valuable to our customers, allowing healthcare facility clinicians to automate and control more of the medication and medical and surgical supply distribution processes. Looking forward, we expect to offer products with an even greater ability to improve patient safety for our customers, both through internal development and through acquisitions.
Industry Background
The acute care market in the United States, where most of our sales occur, is comprised of approximately 6,400 hospitals and other facilities with a total capacity of approximately 947,000 acute care beds. Our customers include single location community hospitals, government hospitals and regional and national entities.
The delivery of healthcare in the United States still relies on a significant number of manual and paper-based processes. Most hospitals have deployed at least some automation solutions, but few have deployed them throughout the institution. The use of manual and paper-based systems in many hospital departments today results in highly complex and inefficient processes for tracking and delivering medications and supplies. In addition, many existing healthcare information systems are unable to support the modernization of healthcare delivery processes or address mandated patient safety initiatives. These factors have contributed to medical errors and unnecessary process costs across the healthcare sector.
Healthcare providers and facilities are also affected by significant economic pressures. Demand for healthcare services continues to increase, driving shortages in the United States labor market for healthcare professionals, particularly nurses and pharmacists. Rising costs of labor, prescription drugs and new medical technology all contribute to increased spending. Governmental pressures surrounding healthcare reform have led to increased scrutiny of the cost and efficiency with which
7
healthcare providers deliver their services. These factors, combined with the continuing consolidation in the healthcare industry, have significantly increased the need to improve the efficiency of healthcare professionals and to control costs.
Outside the United States, healthcare providers are becoming increasingly aware of the benefits of automation. Many governmental and private entities look to the progress made over the last several years in the United States and are starting to invest significantly in information technology and automation. International growth in our industry is therefore expected over the next several years.
In the United States, where approximately 80% of our non-acute business occurs, the market is comprised of approximately 6,000 institutional pharmacies servicing over 15,600 long term care facilities. According to IMS Healthcare, Inc. ("IMS"), an independent third party provider of information to the pharmaceutical and healthcare industry, pharmaceutical sales are expected to grow approximately 1% to 4% annually through 2016. IMS expects that certain sectors of the market, such as biotechnology and other specialty and generic pharmaceuticals, will grow faster than the overall market which suggests opportunities for the market in which we operate. In addition to medication control at long term care facilities, our Multi-Medication products provide packaging that simplifies the process for individuals providing self-care to track and administer medications. At this time these solutions are sold primarily outside the United States.
Key Industry Events and Reports
Reports by the Institute of Medicine ("IOM"), the Food and Drug Administration ("FDA"), and the Joint Commission for the Accreditation of Healthcare Organizations, also known as The Joint Commission, have increased public and healthcare industry awareness of the dangers caused by medication errors. Regulatory standards and industry guidelines, such as those published by the Institute for Safe Medication Practices ("ISMP"), as well as the desire of healthcare organizations to provide premium quality service and avoid liability, have driven acute care facilities to prioritize investment in capital equipment to improve patient safety. Such reports and regulatory standards include:
|
•
|
In 2012, The Joint Commission updated its medication management standards which include MM.03.01.01 requiring that medication storage is designed to assist in maintaining medication integrity, promote the availability of medications when needed, minimize the risk of medication diversion, and reduce potential dispensing errors. Law and regulation and manufacturers’ guidelines further define the hospital’s approach to medication storage. The Joint Commission audits all healthcare facilities seeking accreditation for proper medication handling control and reviews all exceptions to control procedures.
|
|
•
|
In 2010, the FDA updated its guidance that requires linear bar codes on most prescription drugs. Drug manufacturers, re-packagers, re-labelers and private label distributors are subject to the rule. The FDA had estimated that the bar code rule, once implemented, would result in a 50% reduction in medication errors, 500,000 fewer adverse drug events over the subsequent 20 years, $93 billion in cost savings and other economic benefits.
|
|
•
|
In 2008, and updated in 2009, the ISMP published guidelines for the Interdisciplinary Safe Use of Automated Dispensing Cabinets.
|
|
•
|
In June 2006, the IOM issued a report which augmented a series of reports issued between 1999 and 2005 highlighting the prevalence of medication errors and indicated that an estimated 1.5 million medication errors occur annually in the United States.
|
|
•
|
The Joint Commission first established the National Patient Safety Goals ("NPSG") in 2002. In 2010, NPSG 03.04.01, National Patient Safety Goals on Labeling Medications, specified the need for labeling all medications, medication containers (i.e. syringes, medicine cups, basins, etc.) and other solutions on and off the sterile field in perioperative and other procedural settings.
|
Top teaching hospitals are among the early adopters of our new technologies and our customers include 10 of the 18 2013-2014 Honor Roll Hospitals, as rated by
US News and World Report
.
Information published by CVS Caremark and The Health Intelligence Network has identified issues with medication adherence and the need to address both attitudinal and behavioral changes. These findings present an opportunity for pharmacists to have a significant impact on patient quality of life and overall healthcare by providing interventional support that includes adherence tools.
|
•
|
In 2011, CVS Caremark Corporation published a study in "Health Affairs" that found that patients who take medications as directed by physicians may save the healthcare system as much as $7,800 per patient annually. The study also found that these patients experienced fewer emergency room visits and inpatient hospital stays.
|
8
|
•
|
In September 2011, the second annual Medication Adherence e-survey, indicated a slight uptick in the previous 12 months in the number of programs designed to improve non-adherence as well as an increasing reliance on community or retail pharmacists to help individuals understand and adhere to their medication regimens.
|
These reports, and the general awareness of patient safety in the medical field, have created a heightened desire to implement solutions that mitigate risks and improve the quality of healthcare. Automated medication distribution systems have become the standard of care in acute care settings. Hospitals throughout the country are seeking to implement the most robust medication safety solutions available. Blister cards have become the standard of care for providing patient safety in non-acute care settings.
Healthcare Reform
In 2009, the U.S. government passed the American Reinvestment and Recovery Act ("ARRA") which provides for, among other things, the funding of incentives for healthcare organizations to implement Electronic Healthcare Records ("EHR"). ARRA establishes minimal requirements for electronic healthcare usage and provides incentives for electronic healthcare adoption through 2015 and penalties for non-adoption after 2015. In 2010, the U.S. Congress passed the Patient Protection and Affordable Care Act ("PPACA"), which prescribes broad-based measures designed to provide healthcare to a greater percentage of the population. We believe that both the ARRA and the PPACA will drive the need for increased efficiency in providing healthcare without reducing healthcare standards. Our Unity G4 platform includes an automated dispensing system that is Modular EHR stage 2 certified and works with all "hospital information system vendors," as defined by the U.S. Department of Health and Human Services Office of National Coordinator for Health Information Technology.
We believe our products assist healthcare organizations in achieving the goals of the new laws by allowing them to reduce process steps, eliminate manual tracking and waste, enable population-level performance insights, track quality levels and reduce errors that result in unnecessary cost and suffering.
Our Pandora Healthcare Data Analytics solution provides enterprise-level insights that can assist in monitoring population health, hospital performance and quality of care.
Our Unity platform's single unified database across the automated medication dispensing system decreases the risk of human error and saves significant pharmacy time by eliminating the need for repetitive entry of drug formularies in multiple locations. Our Unity platform is designed to help hospitals closely manage medication and supply inventory to reduce costs, comply with increasingly stringent regulatory pressures and safeguard the patient.
Acute Care Products and Services
Our Acute Care products are designed to enable our customers to enhance and improve the effectiveness of the medication-use process, the efficiency of the medical‑surgical supply chain, overall patient care and clinical and financial outcomes of hospital facilities, and through modular configuration and upgrades, can be tailored to specific customer needs. From the point at which a medication arrives at the hospital receiving dock until the time it is administered to the patient, our systems are capable of storing, packaging, bar coding, ordering and issuing the medication, as well as providing information and controls on its use and reorder. Our medication-use product line includes systems for medication dispensing in acute care nursing departments, central pharmacy automation, physician order management and nursing workflow automation at the bedside. Our supply product lines provide healthcare facilities with cost data that enables detailed quantification of charges for payer reimbursement, inventory management, implant monitoring and timely reorder of supplies. These products range from industrial‑grade software‑driven carousels for managing large amounts of inventory in the central pharmacy to high-security closed‑cabinet systems and software to open-shelf and combination solutions in the nursing unit, catheterization lab and operating room. Many of the products on our Unity platform utilize a single database for ease of administration. We also provide services, including customer education and training, to help customers to optimize their use of our technology.
Our analytics solution allows pharmacists and materials managers to more easily manage inventory flow, tracking and optimization, and aids in the identification of those engaged in narcotics diversion within the acute care hospital.
Medication Use Products
Our medication-use product line includes our OmniRx, SinglePointe, AnywhereRN, Anesthesia Workstation, WorkflowRx, Controlled Substance Management, OmniLinkRx, Savvy Mobile Medication System and Pandora Data Analytics products. To provide our customers with end-to-end medication control, our product line incorporates bar code technology throughout. Our solutions incorporate advanced software technology, which we believe is the most advanced on the market today, and our G4 platform integrates disparate systems onto a single database. Each of the products in our medication-use solution suite is summarized in the table below.
9
|
Product
|
Use in Hospital
|
Description
|
||
|
OmniRx
|
Any nursing area in a hospital department that administers medications
|
Secure dispensing system that automates the management and dispensing of medications at the point of use.
|
||
|
SinglePointe
|
Any nursing area in a hospital department that administers medications
|
Software product for use in conjunction with the OmniRx product that controls medications on a patient-specific basis, allowing automated control of up to 100% of the medications used in a hospital.
|
||
|
AnywhereRN
|
Any nursing area in a hospital department that administers medications
|
Software that allows nurses to remotely operate automated dispensing cabinets from virtually any workstation in the hospital.
|
||
|
Pandora Analytics
|
Hospital central pharmacy and general hospital management
|
Advanced reporting and data analytics tools.
|
||
|
Savvy Mobile System
|
Any nursing area in a hospital department that administers medications
|
Mobile wireless computer and dispensing system that provides a mobile platform for hospital information systems and a convenient and secure method for nurses to move medication and supplies.
|
||
|
OmniLinkRx
|
Hospital central pharmacy
|
Prescription routing system that allows nurses and doctors to scan handwritten prescription orders for electronic delivery to pharmacists for approval and filling.
|
||
|
WorkflowRx
|
Hospital central pharmacy
|
Automated pharmacy storage, retrieval and packaging systems.
|
||
|
Controlled Substance Management
|
Hospital central pharmacy
|
Controlled substance inventory management system.
|
||
|
Anesthesia Workstation
|
Operating room
|
Secure dispensing system for the management of anesthesia supplies and medications.
|
||
Nursing Floor Solutions
The
OmniRx
solution is the core of our medication control solutions. The OmniRx solution is a dispensing cabinet that automates the management and dispensing of medications at the point of use. The OmniRx features biometric fingerprint identification, advanced single-dose dispensing, bar code confirmation, integrated medication label printing and a wide range of drawer modules enabling the establishment of various security levels. Software features of the OmniRx include patient profiling, notification of medications due, a variety of security features, waste management, clinical pharmacology and integration with an Internet browser for clinical reference information. OmniRx has met meaningful use criteria by obtaining modular EHR certification, as defined by the Office of the National Coordinator. A highly configurable system, OmniRx contains nearly 500 potential software configurations and over 30 hardware configurations to allow the pharmacist the capability to tailor the usage of the system to specific regulatory controls and workflows.
The
SinglePointe
solution is a software extension to the OmniRx solution that allows pharmacists to automate the distribution of specially‑handled medications, enabling control of up to 100% of all medications through the automated dispensing system. The OmniRx system, which provides stock of medications at the nursing unit, typically stores the most frequently used medications. The SinglePointe solution allows for patient‑specific medications, which would not otherwise be stocked in the OmniRx, to be controlled through the OmniRx, extending the benefits of automated medication distribution. These benefits include increased patient safety, consistency in tracking and inventory control, simplification of procedures and improved monitoring of controlled substances to a broader range of the medication distribution process in the hospital.
The
AnywhereRN
solution is a software solution that allows nurses to operate the automated dispensing cabinets from virtually any remote workstation within the hospital. This software enables enhanced workflow for nurses such that they are no longer limited to being directly in front of the cabinet to perform certain medication administration functions. AnywhereRN is intended to reduce nurse distractions in the medication administration process, allowing cabinet operations to be done in private or quieter areas. AnywhereRN is also intended to eliminate congestion at the cabinet by minimizing nurse queuing to withdraw medications.
The
Pandora Analytics
solution is comprised of reports and analytical software for medication diversion detection, customizable user options, hospital inventory management controls, point‑of‑care data analytics and financial optimization. Pandora Analytics is designed to assist hospitals in their efforts to improve patient safety, regulatory compliance and reduce costs.
10
The
Savvy Mobile Medication
solution provides a mobile workstation for nurses, equipped with locking drawers for secure transportation of medications and patient supply items. Savvy allows both tracking and physical control of medications to be extended to the patient bedside. The Savvy Mobile Medication solution is designed to provide efficient workflow support, allowing nurses to remotely access the automated dispensing cabinet utilizing AnywhereRN, saving nursing time and minimizing the risk of interruptions to enhance patient safety. This same mobile solution can be used to access hospital applications, including electronic medical records and electronic medication administration records.
Central Pharmacy Solutions
The
OmniLinkRx
solution is a physician order software product that automates communication between nurses and the pharmacy. Used in the central pharmacy, the OmniLinkRx solution simplifies the communication of handwritten physician orders from remote nursing stations to the pharmacy.
The
WorkflowRx
solution is an automated storage, retrieval, inventory management and repackaging solution for the central pharmacy. It is designed to help pharmacists ensure that the right medications are stored in and retrieved from proper locations, both in the central pharmacy and in automated dispensing cabinets. The WorkflowRx solution is deployed on a storage and retrieval carousel, on a repackaging system, or on both. The system may also be deployed only using bar code scanners for hospitals that do not utilize carousels or packagers. Bar code administration through the WorkflowRx solution is designed to help ensure that medications are stocked correctly from their point of entry into the healthcare facility. Labeling medications with bar codes using a repackaging system enables bedside medication administration solutions, such as the Savvy solution, to perform bar code checking at the patient bedside.
The
Controlled Substance Management
solution provides perpetual inventory management and an automated audit trail to help the pharmacy comply with regulatory standards while increasing efficiency. The shared database between the pharmacy, the operating room and nursing cabinets tracks and monitors narcotic movement throughout the hospital, providing a true closed-loop solution. The Controlled Substance Management software, coupled with our automated dispensing technology, enables healthcare facilities to track, monitor and control the movement of controlled substances from the point of initial receipt from the wholesaler throughout internal distribution. The Controlled Substance Management solution maintains a perpetual item inventory and complete audit using integrated bar code technology with both fixed and portable scanners. Bar coded forms and labels may also be generated directly from the Controlled Substance Management system.
Operating Room Solutions
The
Anesthesia Workstation
solution is a system for the management of anesthesia supplies and medications. The system is tailored for the workflow of the clinician working in the operating room. The
Anesthesia TT
solution is a fixed‑position tabletop unit designed as a medication-only system. The Anesthesia Workstation incorporates ergonomics to enhance the particular workflows inherent to the operating room and unique software to better handle case management in the procedural areas.
Medical and Surgical Supply Products
Our medical and surgical supply products provide acute care hospitals control over consumable supplies critical to providing quality healthcare. These solutions provide inventory control software that is designed to ensure that critical supplies are always stocked in the right locations. At the same time, usage tracking helps hospital administrators to ensure that money is not wasted on excessive stores of supplies and helps optimize reimbursement by improving charge capture.
Implantable tissue and bone grafts can also be monitored and tracked for additional patient safety and regulatory compliance. The bone and tissue features are integrated with our overall medical and surgical supply chain inventory management and charge capture systems. These solutions are designed for use in the materials management department, the nursing unit and specialty areas such as the catheterization lab and the operating room. They integrate with other information management systems and utilize bar code technology extensively.
Our supply product line includes the Omnicell Supply Cabinet, Omnicell Open Supply Solution, Supply/Rx Combination Cabinet, Omnicell Tissue Center, OptiFlex SS, OptiFlex CL and OptiFlex MS. Each of these products is summarized in the table below.
11
|
Product
|
Use in Hospital
|
Description
|
||
|
Omnicell Supply Solution
|
Any nursing area in a hospital department that uses patient care supplies
|
Secure dispensing system that automates the management and dispensing of medical and surgical supplies at the point of use.
|
||
|
Omnicell Open Supply Solution
|
Areas that require the management of high volume/low dollar inventory as well as areas where space restrictions limit the ability to install closed cabinets and other areas such as offsite clinics.
|
Ability to expand inventory management capabilities by providing efficient workflow and flexibility to enable either remote inventory management from closed supply cabinets or completely open shelf inventory management from a touchscreen PC and Scanner.
|
||
|
Supply/Rx Combination Solution
|
Any nursing area in a hospital department that uses patient care supplies and administers medications
|
Secure dispensing system that manages both supplies and medications from the same cabinets, using the same user interface screens, in medical and surgical units and specialty areas.
|
||
|
Omnicell Tissue Center
|
Perioperative areas of the hospital
|
Manages the chain of custody for bone and tissue specimens from the donor to the patient in the operating room.
|
||
|
OptiFlex SS
|
Perioperative areas of the hospital
|
Specialty modules for the perioperative areas.
|
||
|
OptiFlex CL
|
Procedure areas in the hospital including the cardiac catheterization lab
|
Specialty modules for the cardiac catheterization lab and other procedure areas.
|
||
|
OptiFlex MS
|
Any nursing area in a hospital department that administers supplies
|
System for the management of medical and surgical supplies that provides the flexibility of utilizing bar code control in an open shelf environment.
|
||
The
Omnicell Supply Solution
is a secure dispensing system that dispenses and tracks medical and surgical supplies at the point of use. Specialty modules are available for a variety of solutions to manage implants and medications used across the hospital as described below.
Supply/Rx Combination Solution
is designed to manage medications and supplies in one versatile cabinet or group of cabinets. This solution allows each department to manage supplies and medications independently, while tracking transaction data, inventory, expenses and treatment costs through a single system.
Omnicell Tissue Center
allows the operating room staff to manage the chain of custody for bone and tissue specimens from the donor to the patient in the operating room. This solution enables compliance with The Joint Commission requirements and Association of Operating Room Nurses guidelines regarding the handling of tissue specimens.
OptiFlex SS
manages supplies and preference cards in the perioperative areas whether the supplies are stored on open shelves or in automated dispensing cabinets. The preference-list system creates a unique bar code for each surgical case, based on physician, procedure, and patient and provides information on the case for data analysis, reporting and charge capture. The
Suture Module
is designed to be integrated into the Omnicell Supply Solution to secure, dispense and automatically track suture usage.
OptiFlex CL
manages supplies and creates cases in the cardiac catheterization lab, interventional radiology and other procedure areas. This solution allows real-time point of use data collection and accurate supply tracking regardless of whether supplies are stored on open shelves or in automated dispensing cabinets. It also improves cost management through automated charge capture and case profiling by the physician. The
Catheter Module
is designed to be integrated into the Omnicell supply cabinet and allows hospitals to secure, dispense and electronically track accurate catheter usage. The
Implant Tracking Module
records expiration date, lot and serial number information to help enable compliance with Joint Commission and FDA requirements regarding surgical implants in the event of a recall.
OptiFlex MS
solution provides control over general medical and surgical supplies stored in open shelves or in automated dispensing cabinets.
Other Acute Care Products and Services
Omnicell Interface Software
provides interface and integration between our medication-use products or our supply products and a healthcare facility's in-house information management systems. Interface software is designed to provide
12
integration and communication of patient data, logistical data, inventory information, charge capture and billing information and other healthcare database information.
Services
include customer education and training and maintenance and support services, provided on a time-and-material basis. We also provide fixed period service contracts to our customers for post-installation technical support with phone support, on-site service, parts and access to software upgrades. On-site service is provided by our field service team.
Non-Acute Care Products and Services
We offer a complete equipment product line to assist institutional and retail pharmacies in packaging medication for patient use, from manual sealers to fully automated packaging machines and the consumable packages used in these machines. Long-term care pharmacies typically use two methods for packaging medications into adherence packages: pre-pack where blister cards are pre-packaged with a 7- to 30-day supply of a specific single medication and placed into inventory until needed to fill a specific patient order, and on demand, where individual patient medication orders are packaged and labeled by an automated robotic system. We have a packaging solution for each of these methods for any size pharmacy operation. Our systems increase pharmacy output and improve dispensing accuracy, enabling improved patient safety and economics. In addition to packaging solutions, we sell specially configured versions of our OmniRx medication dispensing machines to institutional pharmacies, which they place in long term care facilities to manage narcotics and medications needed quickly.
Blister Cards
We offer a wide variety of heat seal and cold seal punch cards. These products include the following:
|
•
|
Heat Seal Punch Cards
come in a variety of formats that will fit various packaging requirements. Our heat seal cards require a heat sealer such as the MTS Autobond. Punch cards come in a variety of configurations, from 14- to 90-day dose. Heat seal cards provide the strongest seal available, helping pharmacists assure consistency of the medication under nearly any environmental condition.
|
|
•
|
Cold Seal Cards,
also known as pressure sensitive cards, are both efficient and reliable and do not require heat sealing equipment to be sealed. They are ideal for emergency orders, for heat sensitive medications or when the use of a heat sealer is not practical. Cold seal punch cards come in a variety of configurations, from 14- to 90-day dose.
|
|
•
|
MultiMed Cards
allow the packaging of multiple drugs into a single blister cavity. These products are primarily used in community-based pharmacies to assist in organizing complex medication regimes into a simple to use solution that enhances medication adherence. Multi-Med cards are sold in a variety of formats to fit the needs of pharmacists and patients.
|
Pharmacy Sealers for Medication Packaging
Our heat-sealed blister cards require a sealer to create an impermeable barrier. By using specially designed equipment to control heat, time and pressure, the institutional pharmacy serving the long term care patients is able to create a quality seal on every package, providing a secure barrier to moisture and gases. Within this range of equipment is a sealing solution suited for almost any pharmacy, from a low volume manual punch card sealer to a high volume, all electric heat sealer with programmable computer logic for punch cards and unit dose packages.
|
•
|
The
SureSeal
is a programmable, manual sealer utilizing heat only. It is designed as a cost-effective, entry level sealer for low volume sealing of medication punch cards.
|
|
•
|
The
Autobond
is a programmable, semi-automated heat and pressure sealer operating off of electricity and compressed air. Autobond provides temperature and time controls for a consistent quality sealing.
|
|
•
|
The
AutoGen
is a programmable, semi-automated heat and pressure sealer operating off of electricity only.
|
|
•
|
The
Gemini
is a compact all electric heat and pressure sealer.
|
Automated Fillers
Our semi-automated filling equipment is designed specifically for the long-term care institutional pharmacy with enough order volume to warrant pre-packaging frequently used medications into blister packs to keep in inventory awaiting a patient order. This packaging equipment elevates pre-packaging to a higher level of efficiency, resulting in higher accuracy and increased production levels. The systems combine both automated filling and sealing capabilities into one machine.
13
|
•
|
The
MTS-350
is a tabletop machine capable of filling a wide range of medications and features an ergonomic design and easy-to-use controls. The 350 provides a semi-automated mechanism for filling blister cards and a sealer utilizing compressed air and heat.
|
|
•
|
The
MTS-400
is
ergonomically designed for high pre-pack volume for the medium to large pharmacy. The 400 provides a portable workstation with built-in compressor and storage so as not to take up valuable counter space. Fully configured, the MTS-400 allows a single operator to perform the functions of filling, inspection, sealing and labeling simultaneously.
|
|
•
|
The
MTS-500
is designed to automate pre-packaging in the pharmacy and is capable of producing up to 960 pre-packaged punch cards per hour. It includes an integrated label applicator and conveyor to optimize output.
|
Pharmacy Automation Systems
Our OnDemand automated solutions are designed to meet the broad needs of pharmacies to package individual patient medication orders accurately and efficiently. These machines interface with pharmacy information systems to obtain patient-specific prescription information which enable on demand packaging capabilities for our larger institutional pharmacy customers. Our current line of OnDemand machines includes the following products:
|
•
|
AccuFlex
uses robotic technology to accurately and efficiently fill a variety of single-dose medication dispensing systems.
|
|
•
|
OnDemand 400 for RxMap
is an automation system designed specifically for multi-med adherence packaging. It fills multiple medication prescriptions into a single punch card.
|
|
•
|
OnDemand Express II
optimizes robotic technology for very high-speed and accurate fulfillment of single-dose punch cards and reclaimable packaging.
|
Pharmacy Printing and Labeling Solutions
Pharmacy labeling is an important part of the packaging process to ensure the right medication is packaged and delivered to the right facility and, ultimately, the right patient. Drug specific, bar code scannable labels are affixed on many different types of packages prior to them being dispensed.
We provide a windows-based computer program that utilizes an extensive drug image database to produce a wide variety of medication labels on multiple printers. We also provide printers and related consumables.
Medication Management Solutions
Medication management systems are becoming an integral part of long-term care facilities to manage narcotics, emergency medications and medications that are needed in a short period of time. Currently, most facilities rely on manual systems that do not provide the level of security, accountability and efficiencies that are attainable with the use of automation. When automation is implemented, pharmacies benefit by helping their customer facilities meet regulatory requirements and improve the response time. Patients benefit by having access to medications immediately with minimized medication errors. We offer specialized versions of the OmniRx medication control solution that is utilized by institutional pharmacies to provide their customers with secure medication management of narcotics,, emergency medications, and medications that are needed in a short period of time.
Sales and Distribution
We sell our Acute Care and Non-Acute Care solutions primarily in the United States and Canada. Approximately
89%
of our product revenue for 2013 was generated in those markets. For the years ended December 31, 2013, 2012 and 2011, no single customer accounted for greater than 10% of our revenues. Our sales force is organized by geographic region in the United States and Canada where our sales are primarily made direct to end user customers with the exception of some distribution of Non-Acute Care consumables. Outside the United States and Canada, we field a direct sales force for Non-Acute Care products in the United Kingdom and Germany. For other geographies where we sell Non-Acute Care products, and for all Acute Care products sold outside the United States and Canada, we sell through distributors and resellers. Our foreign operations are discussed in Note 1, Organization and Summary of Significant Accounting Policies, of the Notes to Consolidated Financial Statements included elsewhere in this Annual Report on From 10-K under the heading "Geographic Risk." As of December 31, 2013, our combined direct, corporate and international distribution sales teams consisted of approximately 184 staff members. Nearly all of our direct sales team members have hospital capital equipment or clinical systems experience. Our sales representatives are generally organized to sell either the Acute Care or Non-Acute Care product lines. Our corporate sales team focuses on large IDNs, group purchasing organizations ("GPOs"), and the U.S. government.
14
The sales cycle for our automation systems is long and can take in excess of 24 months. This is due in part to the cost of our systems and the number of people within each healthcare facility involved in the purchasing decision. To initiate the selling process, the sales representative generally targets the director of pharmacy, the director of materials management or other decision makers and is responsible for educating each group within the healthcare facility about the benefits of our solutions relative to competing methods of managing medications or medical and surgical supplies.
We have contracts with GPOs that enable us to sell our automation systems to GPO‑member healthcare facilities. The primary advantage to customers who buy our products pursuant to a GPO agreement is that they benefit from pre-negotiated contract terms and pricing. The benefit to the GPO is the fee earned as a percentage of sales, which is paid by us. These GPO contracts are typically for multiple years with options to renew or extend for up to two years and some of which can be terminated by either party at any time. Our current GPO contracts include AmeriNet, Inc., Broadlane, Inc., Carolina Shared Services, LLC, Child Health Corporation of America, HealthTrust Purchasing Group, L.P., MedAssets Supply Chain Systems, Novation LLC, Premier Purchasing Partners, L.P., and Resources Optimization & Innovation. We have also contracted with the U.S. General Services Administration, allowing the Department of Veteran Affairs, the Department of Defense and other Federal Government customers to purchase or lease our products.
We offer multi-year, non-cancelable lease payment terms to assist healthcare organizations in purchasing our systems by reducing their cash flow requirements. We sell the majority of our multi-year lease receivables to third‑party leasing finance companies, but we also maintain a certain portion of our leases in-house.
Our field operations representatives support our sales force by providing operational and clinical expertise prior to the close of a sale and during installation of our automation systems. This group assists the customer with the technical implementation of our automation systems, including configuring our systems to address the specific needs of each individual customer. After the systems are installed, on-site support is provided by our field service team and technical support group.
We offer telephone technical support through our technical support centers in Illinois and Florida. Our support centers are staffed 24 hours a day, 365 days a year. We have found that a majority of our customers' service issues can be addressed either over the phone or by our support center personnel utilizing their on-hand remote diagnostics tools. In addition, we utilize remote dial-in software that monitors customer conditions on a daily basis. We offer a suite of remote monitoring features, which proactively monitors system status and alerts service personnel to potential problems before they lead to system failure.
In addition, our international sales team handles direct sales to non-acute healthcare facilities in the United Kingdom and Germany, and handles sales, installation and service to non-acute healthcare facilities through distribution partners in other parts of Europe, Asia, Australia, the Middle East, South Africa, and South America. Our international sales team handles sales, installation and service to all acute care customers outside the US and Canada through distribution partners. We have been involved in a growing number of new installations in international markets and expect to continue growing our business in light of the expected increase in global demand for hospital automation solutions. In 2011, we announced the introduction of a Mandarin based-product in the People's Republic of China and a comprehensive agreement with a Chinese-based company to distribute the product. Our products are also available in a variety of other languages.
We have not sold and have no future plans to sell our products either directly or indirectly to customers located in countries that are identified as state sponsors of terrorism by the U.S. Department of State, or those subject to economic sanctions and export controls.
Manufacturing and Inventory
Our manufacturing process allows us to configure hardware and software in unique combinations to meet a wide variety of individual customer requirements. Our Acute Care products manufacturing process consists primarily of the final assembly of components and of subassemblies which are assembled by third‑party single source manufacturers. We and our partners test subassemblies and perform inspections to assure the quality and reliability of our products. While many components of our systems are standardized and available from multiple sources, certain components or subsystems are fabricated by a sole supplier according to our specifications and schedule requirements. Our Non-Acute Care product manufacturing process consists of fabrication and assembly of equipment and mechanized process manufacturing of consumables.
Our arrangements with our contract manufacturers generally set forth quality, cost and delivery requirements, as well as manufacturing process terms, such as continuity of supply, inventory management, capacity flexibility, quality and cost management, oversight of manufacturing and conditions for the use of our intellectual property.
Our manufacturing organization procures components and schedules production based on the backlog of customer orders. Installation of equipment and software typically occurs between two weeks and twelve months after the initial order is received, depending upon the customer's particular needs. We deploy a key operational strategy of operating with backlog
15
levels that approximate the average installation cycle of our customers, which allows us to more efficiently manage our installation teams, improve production efficiencies, reduce inventory scrap and lower shipping costs. Shipment of consumables typically occurs between one and fourteen days after an order is received.
Competition
The medication management and supply chain solutions market is intensely competitive. We compete directly with a number of companies and are affected by evolving and new technologies, changes in industry standards and dynamic customer requirements.
Our current direct competitors in the medication management and supply chain solutions market include CareFusion Corporation (which includes Pyxis, Rowa, and PhACTs), Aesynt Inc. (through the acquisition of McKesson Hospital Automation, Inc. by Francisco Partners), AmerisourceBergen Corporation (through its acquisition of MedSelect, Inc. and Automed), Cerner Corporation, Talyst, Inc., Emerson Electronic Co. (through its acquisition of medDispense, L.P.), Swisslog Holding AG, WaveMark Inc., ParExcellence Systems, Inc., Vanas n.v., Lawson Software, Inc. and MACH4 Automatisierungstechnik GmbH. Our current direct competitors in the medication packaging solutions market include Drug Package, Inc., AutoMed Technologies, Inc. (a subsidiary of AmerisourceBergen Corporation), Manchac Technologies, LLC (through its Dosis product line) and RX Systems, Inc. in the United States, and Surgichem Ltd., Jones Packaging Ltd., Manrex Ltd, Synergy Medical Systems, and WebsterCare outside the United States.
We believe our products and services compare favorably with the offerings of our competitors, particularly with respect to proprietary technological advancements, system performance, system reliability, installation, applications training, service response time and service repair quality.
Intellectual Property and Proprietary Technology
We rely on a combination of patents, trademarks, copyright and trade secret laws, confidentiality procedures and licensing arrangements to protect our intellectual property rights.
We pursue patent protection in the United States and foreign jurisdictions for technology that we believe to be proprietary and that offers a potential competitive advantage for our products. Our issued patents relate to, among other things, the use of locking and sensing lids with pharmacy drawers and the methods of restocking these drawers, and the use of guiding lights in the open matrix, locking lid and sensing lid pharmacy drawers. These patents also apply to our unit-dose mechanism and methods, the single-dose dispensing mechanism, the methods for restocking the single-dose drawers using exchange liners, certain methods for loading and unloading mobile carts, the method of use of scanners with a mobile cart, and certain methods for using radio frequency tags with storage items. Our patents expire at various times between 2014 and 2030.
All of our product system software is copyrighted and subject to the protection of applicable copyright laws. We intend to seek additional international and U.S. patents on our technology and to seek registration of our trademarks. We have obtained registration of Omnicell, the Omnicell logo, OmniRx, OmniCenter, OmniSupplier, OmniBuyer, SafetyStock, eMTS Medication Technologies, the MTS Medication Technologies logo, Medlocker, AccuFlex, Pandora, OnDemand, RxMap,
Suremed, and OnDemand400 for RxMap. Trade secrets and other confidential information are also important to our business. We protect our trade secrets through a combination of contractual restrictions and confidentiality and licensing agreements.
Research and Development
We utilize industry‑standard operating systems and databases, but generally develop our own application and interface software in our research and development facilities. New product development projects are prioritized based on customer input. Research and development takes place in Mountain View, California; Nashville, Tennessee; and St. Petersburg, Florida. Research and development expenditures were
$29.1 million
,
$23.7 million
and
$22.0 million
in 2013, 2012 and 2011, respectively.
Employees
As of December 31, 2013, we had a total of 1,134 employees. We have rebalanced our staff as needed, at times eliminating some functional positions and at other times adding new functional‑specific positions to meet the evolving needs of our marketplace while controlling costs. To our knowledge, none of our employees is represented by a collective bargaining agreement, nor have we experienced any work stoppage. We believe that our employee relations are good.
Business Under Government Contracts
A number of our U.S. government‑owned or government-run hospital customers sign five-year leases, with payment terms that are subject to one-year government budget funding cycles. Failure of any of our U.S. government customers to
16
receive their annual funding could impair our ability to sell to these customers, or to collect payments on our existing unsold leases. For additional information regarding these leases, see the section entitled "Risk Factors" under Part I, Item 1A below.
Financing Practices Relating to Working Capital
We assist healthcare facilities in financing their cash outlay requirements for the purchase of our systems by offering multi-year, non-cancelable sales contracts. For additional information regarding these financing activities, see Note 1, Organization and Summary of Significant Accounting Policies, of the Notes to Consolidated Financial Statements included elsewhere in this Annual Report on Form 10-K.
Product Backlog
Product backlog is the dollar amount of medication and supply dispensing systems for which we have purchase orders from our customers and for which we believe we will install, bill and gain customer acceptance within one year. Due to industry practice that allows customers to change order configurations with limited advance notice prior to shipment and occasional customer changes in installation schedules, we do not believe that backlog as of any particular date is necessarily indicative of future sales. However, we do believe that backlog is an indication of a customer's willingness to install our solutions. As of December 31, 2013 and 2012, our backlog was $180 million and $155 million, respectively.
Company Information
We were incorporated in California in 1992 under the name of Omnicell Technologies, Inc. and reincorporated in Delaware in 2001 as Omnicell, Inc.
Available Information
We file reports and other information with the Securities and Exchange Commission (the "SEC") including annual reports on Form 10-K, quarterly reports on Form 10-Q, current reports on Form 8-K and proxy or information statements. Those reports and statements as well as all amendments to those documents filed or furnished pursuant to Section 13(a) or 15(d) of the Securities and Exchange Act (1) are available at the SEC's Public Reference Room at 100 F Street, N.E., Room 1580, Washington, DC 20549, (2) are available at the SEC's internet site (
www.sec.gov
), which contains reports, proxy and information statements and other information regarding issuers that file electronically with the SEC and (3) are available free of charge through our website as soon as reasonably practicable after electronic filing with, or furnishing to, the SEC. You may obtain information on the operation of the Public Reference Room by calling the SEC at 1-800-SEC-0330. Our website address is
www.omnicell.com
. Information on our website is not incorporated by reference nor otherwise included in this report.
Executive Officers of the Registrant
The following table sets forth certain information as of March 7, 2014 about our executive officers:
|
Name
|
Age
|
Position
|
||
|
Randall A. Lipps
|
56
|
President, Chief Executive Officer, and Chairman of the Board of Directors
|
||
|
J. Christopher Drew
|
48
|
Executive Vice President, Field Operations
|
||
|
Robin G. Seim
|
54
|
Executive Vice President Finance, Administration and Manufacturing, Chief Financial Officer
|
||
|
Dan S. Johnston
|
50
|
Executive Vice President and General Counsel
|
||
|
Nhat H. Ngo
|
41
|
Executive Vice President, Strategy and Business Development
|
||
|
Marga Ortigas-Wedekind
|
52
|
Executive Vice President, Global Marketing and Product Development
|
||
|
Jorge R. Taborga
|
54
|
Executive Vice President, Engineering
|
||
Randall A. Lipps
was named Chief Executive Officer and President of Omnicell in October 2002. Mr. Lipps has served as Chairman of the Board and a Director of Omnicell since founding Omnicell in September 1992. Mr. Lipps received both a B.S. in economics and a B.B.A. from Southern Methodist University.
J. Christopher Drew
joined Omnicell in April 1994 and was named Senior Vice President, Operations in January 2005. In January 2009, Mr. Drew was named Senior Vice President, Field Operations. In March 2012, Mr. Drew was named Executive Vice President, Field Operations. From April 1994 to January 2005, Mr. Drew served in various management positions with Omnicell, including Vice President of Branded Solutions and Director of Corporate Development. Mr. Drew received a B.A. in economics from Amherst College and an M.B.A. from the Stanford Graduate School of Business.
17
Robin G. Seim
joined Omnicell in February 2006 as Vice President and was named Chief Financial Officer in March 2006. In January 2009, Mr. Seim was named Chief Financial Officer and Vice President Finance, Administration and Manufacturing. In March 2012, Mr. Seim was named Executive Vice President Finance, Administration and Manufacturing and Chief Financial Officer. Prior to joining Omnicell, Mr. Seim served as Chief Financial Officer of several technology companies, including Villa Montage Systems, Inc. from 1999 to 2001, Candera, Inc. from 2001 to 2004 and Mirra, Inc., in 2005. Prior to 1999, Mr. Seim held a number of management positions with Nortel Networks, Bay Networks, and IBM. Mr. Seim received a B.S. in accounting from California State University, Sacramento.
Dan S. Johnston
joined Omnicell in November 2003 as Vice President and General Counsel. In March 2012, Mr. Johnston was named Executive Vice President and General Counsel. From April 1999 to November 2003, Mr. Johnston was Vice President and General Counsel at Be, Inc., a software company. From September 1994 to March 1999, Mr. Johnston was an attorney with the law firm Cooley LLP. Mr. Johnston received a B.S. in computer information systems from Humboldt State University and a J.D. from the Santa Clara University School of Law.
Nhat H. Ngo
joined Omnicell in November 2008 as Vice President of Strategy and Business Development. In March 2012, Mr. Ngo was named Executive Vice President, Strategy and Business Development. From January 2007 to October 2008, Mr. Ngo served as Vice President of Business Development and Licensing for a business unit of Covidien, a global healthcare products company. From June 1999 to April 2006, Mr. Ngo worked at BriteSmile, Inc., a direct-to-consumer aesthetic technology company and served in a variety of senior leadership positions in marketing, sales, operations, strategic planning and corporate development. From September 1997 to June 1999, Mr. Ngo practiced corporate law at Shaw Pittman, LLP. Mr. Ngo received a B.S. in commerce, with a concentration in finance, from the University of Virginia McIntire School of Commerce and a J.D. from the University of Virginia School of Law.
Marga Ortigas‑Wedekind
joined Omnicell in January of 2009 as Vice President, Marketing. In May 2009, she was named Vice President, Global Marketing and Product Development. In March 2012, Ms. Ortigas-Wedekind was named Executive Vice President, Global Marketing and Product Development. From February 2002 to October 2008, Ms. Ortigas‑Wedekind was the Senior Vice President Marketing, Development, and Clinical Affairs of Xoft, Inc., a medical device company. Ms. Ortigas‑Wedekind's earlier career includes several senior marketing roles, including Guidant Corporation's Vascular Intervention Division from January 1990 to February 2000, covering international and worldwide sales and marketing, and culminating in the role of Director, Market Development. Ms. Ortigas‑Wedekind received a B.A. in political economics from Wellesley College and an M.B.A. from the Stanford Graduate School of Business.
Jorge R. Taborga
joined Omnicell in July 2007 as Vice President and Chief Information Officer. In February of 2013, he was named Executive Vice President, Engineering. From January 2009 to February 2013, Mr. Taborga was Vice President of Manufacturing, Quality and Information Technology. Prior to joining Omnicell, Mr. Taborga held a number of executive positions with Bay Networks and Quantum, and ran his own management consulting company. He also held executive roles in two cloud computing companies, fusionOne and Terrasping. Mr. Taborga's earlier career includes senior roles in product development with ROLM Systems and Thomas-Conrad. Mr. Taborga received B.S. and M.S. degrees in Computer Science from Texas A&M University. He is currently pursuing a Ph.D. in Organizational Systems at Saybrook University.
18
Item 1A.
RISK FACTORS
We have identified the following risks and uncertainties that may have a material adverse effect on our business, financial condition or results of operations. Our business faces significant risks and the risks described below may not be the only risks we face. Additional risks not presently known to us or that we currently believe are immaterial may also significantly impair our business operations. If any of these risks occur, our business, results of operations or financial condition could suffer and the market price of our common stock could decline.
Unfavorable economic and market conditions, a decreased demand in the capital equipment market and uncertainty regarding the rollout of government legislation in the healthcare industry could adversely affect our operating results.
Customer demand for our products is significantly linked to the strength of the economy. If decreases in demand for capital equipment caused by weak economic conditions and decreased corporate and government spending, including any effects of fiscal budget balancing at the federal level, deferrals or delays of capital equipment projects, longer time frames for capital equipment purchasing decisions or generally reduced expenditures for capital solutions occurs, we will experience decreased revenues and lower revenue growth rates and our operating results could be materially and adversely affected.
Additionally, as the U.S. Federal government implements healthcare reform legislation, and as Congress, regulatory agencies and other state governing organizations continue to review and assess additional healthcare legislation and regulations, there may be an impact on our business. Healthcare facilities may decide to postpone or reduce spending until the implications of such healthcare enactments are more clearly understood, which may affect the demand for our products and harm our business.
The medication management and supply chain solutions market is highly competitive and we may be unable to compete successfully against new entrants and established companies with greater resources and/or existing business relationships with our current and potential customers.
The medication management and supply chain solutions market is intensely competitive. We expect continued and increased competition from current and future competitors, many of which have significantly greater financial, technical, marketing and other resources than we do. Our current direct competitors in the medication management and supply chain solutions market include CareFusion Corporation (which includes Pyxis, Rowa, and PhACTs), Aesynt Inc. (through the acquisition of McKesson Hospital Automation, Inc. by Francisco Partners), AmerisourceBergen Corporation (through its acquisition of MedSelect, Inc. and Automed), Cerner Corporation, Talyst, Inc., Emerson Electronic Co. (through its acquisition of medDispense, L.P.), Swisslog Holding AG, WaveMark Inc., ParExcellence Systems, Inc., Vanas n.v., Lawson Software, Inc. and MACH4 Automatisierungstechnik GmbH. Our current direct competitors in the medication packaging solutions market include Drug Package, Inc., AutoMed Technologies, Inc. (a subsidiary of AmerisourceBergen Corporation), Manchac Technologies, LLC (through its Dosis product line) and RX Systems, Inc. in the United States, and Surgichem Ltd., Jones Packaging Ltd., Synergy Medical Systems, Manrex Ltd, and WebsterCare outside the United States.
The competitive challenges we face in the medication management and supply chain solutions market include, but are not limited to, the following:
|
•
|
certain competitors may offer or have the ability to offer a broader range of solutions in the marketplace that we are unable to match;
|
|
•
|
certain competitors may develop alternative solutions to the customer problems our products are designed to solve that may provide a better customer outcome or a lower cost of operation;
|
|
•
|
certain competitors may develop new features or capabilities for their products not previously offered that could compete directly with our products;
|
|
•
|
competitive pressures could result in increased price competition for our products and services, fewer customer orders and reduced gross margins, any of which could harm our business;
|
|
•
|
current and potential competitors may make strategic acquisitions or establish cooperative relationships among themselves or with third parties, including larger, more established healthcare supply companies, thereby increasing their ability to develop and offer products and services to address the needs of our prospective customers;
|
19
|
•
|
our competitors may develop, license or incorporate new or emerging technologies or devote greater resources to the development, promotion and sale of their products and services than we do;
|
|
•
|
certain competitors have greater brand name recognition and a more extensive installed base of medication and supply dispensing systems or other products and services than we do, and such advantages could be used to increase their market share;
|
|
•
|
certain competitors may have existing business relationships with our current and potential customers, which may cause these customers to purchase medication and supply dispensing systems or automation solutions from these competitors;
|
|
•
|
other established or emerging companies may enter the medication management and supply chain solutions market; and
|
|
•
|
our competitors may secure products and services from suppliers on more favorable terms or secure exclusive arrangements with suppliers or buyers that may impede the sales of our products and services.
|
Any reduction in the demand for or adoption of our medication and supply systems, related services, or consumables would reduce our revenues.
Our medication and supply dispensing systems represent only one approach to managing the distribution of pharmaceuticals and supplies at acute healthcare facilities and our medication packaging systems represent only one way of managing medication distribution at non-acute care facilities. A significant portion of domestic and international healthcare facilities still use traditional approaches in some form that do not include fully automated methods of medication and supply management. As a result, we must continuously educate existing and prospective customers about the advantages of our products, which requires significant sales efforts and can cause longer sales cycles. Despite our significant efforts and extensive time commitments in sales to healthcare facilities, we cannot be assured that our efforts will result in sales to these customers.
In addition, our medication and supply dispensing systems and our more complex automated packaging systems typically represent a sizable initial capital expenditure for healthcare organizations. Changes in the budgets of these organizations and the timing of spending under these budgets can have a significant effect on the demand for our medication and supply dispensing systems and related services. These budgets are often supported by cash flows that can be negatively affected by declining investment income and influenced by limited resources, increased operational and financing costs, macroeconomic conditions such as unemployment rates and conflicting spending priorities among different departments. Any decrease in expenditures by healthcare facilities or increased financing costs could decrease demand for our medication and supply dispensing systems and related services and reduce our revenues.
Changing customer requirements could decrease the demand for our products and services and our new product solutions may not achieve market acceptance.
The medication management and supply chain solutions market is characterized by evolving technologies and industry standards, frequent new product introductions and dynamic customer requirements that may render existing products obsolete or less competitive. The medication management and supply chain solutions market could erode rapidly due to unforeseen changes in the features and functions of competing products, as well as the pricing models for such products. Our future success will depend in part upon our ability to enhance our existing products and services and to develop and introduce new products and services to meet changing customer requirements. The process of developing products and services such as those we offer is extremely complex and is expected to become increasingly more complex and expensive in the future as new technologies are introduced. If we are unable to enhance our existing products or develop new products to meet changing customer requirements, and bring such enhancements and products to market in a timely manner, demand for our products could decrease.
We cannot provide assurance that we will be successful in marketing any new products or services that we introduce, that new products or services will compete effectively with similar products or services sold by our competitors, or that the level of market acceptance of such products or services will be sufficient to generate expected revenues and synergies with our other products or services. Deployment of new products or services often requires interoperability with other Omnicell products or services as well as with healthcare facilities' existing information management systems. If these products or services fail to satisfy these demanding technological objectives, our customers may be dissatisfied and we may be unable to generate future sales.
20
The healthcare industry faces financial constraints and consolidation that could adversely affect the demand for our products and services.
The healthcare industry has faced, and will likely continue to face, significant financial constraints. US government legislation such as the American Recovery and Reinvestment Act in 2009, the Patient Protection and Affordable Care Act in 2010, the Budget Control Act of 2011, and other health reform legislation may cause customers to postpone purchases of our products while they make changes to their operations to meet the requirements of this legislation. Our automation solutions often involve a significant financial commitment from our customers and, as a result, our ability to grow our business is largely dependent on our customers' capital and operating budgets. To the extent healthcare spending declines or increases more slowly than we anticipate, demand for our products and services could decline.
Many healthcare providers have consolidated to create larger healthcare delivery organizations in order to achieve greater market power. If this consolidation continues, it would increase the size of certain target customers, which could increase the cost, effort and difficulty in selling our products to such target customers, or could cause our existing customers or potential new customers to begin utilizing our competitors' products if such customers are acquired by healthcare providers that prefer our competitors' products to ours. In addition, the resulting organizations could have greater bargaining power, which may lead to price erosion.
We may not be able to successfully integrate acquired businesses or technologies into our existing business, which could negatively impact our operating results.
As a part of our business strategy we may seek to acquire businesses, technologies or products in the future. For example, in December 2013, we entered into a share purchase agreement with Bupa Care Homes (CFG) Plc ("Bupa") to acquire Surgichem Limited, a wholly-owned subsidiary of Bupa. We cannot provide assurance that any acquisition or any future transaction we complete will result in long-term benefits to us or our stockholders, or that our management will be able to integrate or manage the acquired business effectively. Acquisitions entail numerous risks, including difficulties associated with the integration of operations, technologies, products and personnel that, if realized, could harm our operating results. Risks related to potential acquisitions include, but are not limited to:
|
•
|
difficulties in combining previously separate businesses into a single unit and the complexity of managing a more dispersed organization as sites are acquired;
|
|
•
|
the substantial costs that may be incurred and the substantial diversion of management's attention from day-to-day business when evaluating and negotiating such transactions and then integrating an acquired business;
|
|
•
|
discovery, after completion of the acquisition, of liabilities assumed from the acquired business or of assets acquired that are broader in scope and magnitude or are more difficult to manage than originally assumed;
|
|
•
|
failure to achieve anticipated benefits such as cost savings and revenue enhancements;
|
|
•
|
difficulties related to assimilating the products or key personnel of an acquired business; and
|
|
•
|
failure to understand and compete effectively in markets in which we have limited previous experience.
|
Successful integration of acquired operations, products and personnel into Omnicell may place a significant burden on the combined company's management and internal resources. We may also experience difficulty in effectively integrating the different cultures and practices of any acquired entity. The challenges of integrating acquired entities could disrupt the combined company's ongoing business, distract its management focus from other opportunities and challenges, and increase expenses and working capital requirements. The diversion of management attention and any difficulties encountered in the transition and integration process could harm our business, financial condition and operating results.
Demand for our consumable medication packages is time-sensitive and if we are not able to supply the demand from our institutional and retail pharmacy customers on schedule and with quality packaging products, they may utilize alternative means to distribute medications to their customers.
Approximately
18%
of our revenue is generated from the sale of consumable medication packages, which are produced in our St. Petersburg, Florida facilities on a continuous basis and shipped to our institutional pharmacy and retail pharmacy customers shortly before they are required by those customers.
The demands placed on institutional pharmacies and retail pharmacies by their customers represent real time requirements of those customers. Our customer agreements for the sale of consumable medication packages are typically short-term in nature and typically do not include any volume commitments on
21
the part of the customer. Although our packaging may be considered the preferred method of maintaining control of medications during the medication distribution and administration process, institutional and retail pharmacies have alternative methods of distributing medications, including bulk and alternative packaging, and medication adherence packaging may be supplied by our competitors. To the extent that we are unable to supply quality packaging to our customers in a timely manner, that demand will be met via alternative distribution methods, including consumable medication packaging sold by our competitors, and our revenue will decline. Any disruption in the production capabilities of our St. Petersburg facilities will adversely affect our ability to ship our consumable medication packages and would reduce our revenue.
Our international operations may subject us to additional risks that can adversely affect our operating results.
We currently have operations outside of the United States, including sales efforts centered in Canada, Europe, the Middle East and Asia-Pacific regions and supply chain efforts in Asia. We intend to continue to expand our international operations, particularly in certain markets that we view as strategic, including China and the Middle East. Our international operations subject us to a variety of risks, including:
|
•
|
our reliance on distributors for the sale and post-sale support of our automated dispensing systems outside the United States and Canada;
|
|
•
|
the difficulty of managing an organization operating in various countries;
|
|
•
|
political sentiment against international outsourcing of production;
|
|
•
|
reduced protection for intellectual property rights, particularly in jurisdictions that have less developed intellectual property regimes;
|
|
•
|
changes in foreign regulatory requirements;
|
|
•
|
the requirement to comply with a variety of international laws and regulations, including privacy, labor, import, export, environmental standards, tax, anti-bribery and employment laws and changes in tariff rates;
|
|
•
|
fluctuations in currency exchange rates and difficulties in repatriating funds from certain countries;
|
|
•
|
additional investment, coordination and lead-time necessary to successfully interface our automation solutions with the existing information systems of our customers or potential customers outside of the United States; and
|
|
•
|
political unrest, terrorism and the potential for other hostilities in areas in which we have facilities.
|
If we are unable to anticipate and address these risks properly, our business or operating results will be harmed.
If we experience delays in installations of our medication and supply dispensing systems or our more complex medication packaging systems, resulting in delays in our ability to recognize revenue, our competitive position, results of operations and financial condition could be harmed.
The purchase of our medication and supply dispensing systems or our more complex medication packaging systems is often part of a customer's larger initiative to re-engineer its pharmacy and their distribution and materials management systems. As a result, our sales cycles are often lengthy. The purchase of our systems often entail larger strategic purchases by customers that frequently require more complex and stringent contractual requirements and generally involve a significant commitment of management attention and resources by prospective customers. These larger and more complex transactions often require the input and approval of many decision-makers, including pharmacy directors, materials managers, nurse managers, financial managers, information systems managers, administrators, lawyers and boards of directors. For these and other reasons, the sales cycle associated with the sale of our medication and supply dispensing systems is often lengthy and subject to a number of delays over which we have little or no control. A delay in, or loss of, sales of our medication and supply dispensing systems could have an adverse effect upon our operating results and could harm our business.
In addition, and in part as a result of the complexities inherent in larger transactions, the time between the purchase and installation of our systems can range from two weeks to one year. Delays in installation can occur for reasons that are often outside of our control. We have also experienced fluctuations in our customer and transaction size mix, which makes our ability to forecast our product bookings more difficult. Because we recognize revenue for our medication and supply dispensing systems and our more complex medication packaging systems only upon installation at a customer's site, any delay in installation by our customers will also cause a delay in the recognition of the revenue for that system.
Government regulation of the healthcare industry could reduce demand for our products, or substantially increase the cost to produce our products.
The manufacture and sale of our current products are not regulated by the United States Food and Drug Administration (the "FDA"), or the Drug Enforcement Administration (the "DEA"). However, our current products, and any future products, may be regulated in the future by these or other federal agencies due to future legislative and regulatory initiatives or reforms. Direct regulation of our business and products by the FDA, DEA or other federal agencies could substantially increase the cost
22
to produce our products and increase the time required to bring those products to market, reduce the demand for our products and reduce our revenues. In addition, healthcare providers and facilities that use our equipment and dispense controlled substances are subject to regulation by the DEA. The failure of these providers and facilities to comply with DEA requirements, including the Controlled Substances Act and its implementing regulations, could reduce demand for our products and harm our competitive position, results of operations and financial condition. Pharmacies are regulated by individual state boards of pharmacy that issue rules for pharmacy licensure in their respective jurisdictions. State boards of pharmacy do not license or approve our medication and supply dispensing systems; however, pharmacies using our equipment are subject to state board approval. The failure of such pharmacies to meet differing requirements from a significant number of state boards of pharmacy could decrease demand for our products and harm our competitive position, results of operations and financial condition. Similarly, hospitals must be accredited by The Joint Commission in order to be eligible for Medicaid and Medicare funds. The Joint Commission does not approve or accredit medication and supply dispensing systems; however, disapproval of our customers' medication and supply dispensing management methods and their failure to meet The Joint Commission requirements could decrease demand for our products and harm our competitive position, results of operations and financial condition.
While we have implemented a Privacy and Use of Information Policy and adhere to established privacy principles, use of customer information guidelines and related federal and state statutes, we cannot assure you that we will be in compliance with all federal and state healthcare information privacy and security laws that we are directly or indirectly subject to, including, without limitation, the Health Insurance Portability and Accountability Act of 1996, or ("HIPAA"). Among other things, this legislation required the Secretary of Health and Human Services ("HHS") to adopt national standards governing the conduct of certain electronic health information transactions and protecting the privacy and security of personally identifiable health information maintained or transmitted by "covered entities," which include pharmacies and other healthcare providers with which we do business.
The standards adopted to date include, among others, the "Standards for Privacy of Individually Identifiable Health Information," which restrict the use and disclosure of personally identifiable health information by covered entities, and the "Security Standards," which require covered entities to implement administrative, physical and technical safeguards to protect the integrity and security of certain electronic health information. Under HIPAA, we are considered a "business associate" in relation to many of our customers that are covered entities, and as such, most of these customers have required that we enter into written agreements governing the way we handle and safeguard certain patient health information we may encounter in providing our products and services and may impose liability on us for failure to meet our contractual obligations. Further, pursuant to changes in HIPAA under the American Recovery and Reinvestment Act of 2009 ("ARRA"), we are now also covered under HIPAA similar to other covered entities and in some cases, subject to the same civil and criminal penalties as a covered entity. A number of states have also enacted privacy and security statutes and regulations that, in some cases, are more stringent than HIPAA and may also apply directly to us. If our past or present operations are found to violate any of these laws, we may be subject to fines, penalties and other sanctions.
During November 2012, an Omnicell electronic device containing medication dispensing cabinet log files from three health system customers was stolen from an Omnicell employee's locked vehicle. The files on this device contained certain protected patient health information related to medication dispensing transactions from our medication dispensing cabinets over a one to three-week period, downloaded by the employee while troubleshooting software for the hospitals. This loss resulted in a putative class action complaint being filed against us and certain of our customers in the United States District Court for the District of New Jersey in March 2013 alleging breach of state security notification laws, violations of state consumer fraud laws, fraud, negligence and conspiracy relating to the theft of an Omnicell electronic device containing medication dispensing cabinet log files, including certain patient health information, described above and subsequent notification of this unauthorized disclosure of personal health information. In December 2013, the court issued an order dismissing the plaintiff's complaint without prejudice. The plaintiff failed to file an appeal of the court's decision by the January 27, 2014 deadline. There is no guarantee that, if we are involved in any similar litigation in the future, such an outcome will result. Any similar unauthorized disclosure of personal health information could cause us to experience contractual indemnification obligations under business associate agreements with certain customers, litigation against us, reputational harm and a reduction in demand from our customers. To the extent that this disclosure is deemed to be a violation of HIPAA or other privacy or security laws, we may be subject to significant fines, penalties and other sanctions.
In addition, we cannot predict the potential impact of future HIPAA standards and other federal and state privacy and security laws that may be enacted at any time on our customers or on Omnicell. These laws could restrict the ability of our customers to obtain, use or disseminate patient information, which could reduce the demand for our products or force us to redesign our products in order to meet regulatory requirements.
Covenants in our credit agreement restrict our business and operations in many ways and if we do not effectively manage our compliance with these covenants, our financial conditions and results of operations could be adversely affected.
23
On September 25, 2013, we entered into a
$75.0 million
revolving credit facility pursuant to a Credit Agreement, by and among Omnicell, Wells Fargo Bank, National Association, as administrative agent, and the lenders from time to time party thereto (the “Credit Agreement”). The Credit Agreement contains various customary covenants that limit our ability and/or our subsidiaries’ ability to, among other things:
|
•
|
incur or assume liens or additional debt or provide guarantees in respect of obligations or other persons;
|
|
•
|
issue redeemable preferred stock;
|
|
•
|
pay dividends or distributions or redeem or repurchase capital stock;
|
|
•
|
prepay, redeem or repurchase certain debt;
|
|
•
|
make loans, investments, acquisitions (including acquisitions of exclusive licenses) and capital expenditures;
|
|
•
|
enter into agreements that restrict distributions from our subsidiaries;
|
|
•
|
sell assets and capital stock of our subsidiaries;
|
|
•
|
enter into certain transactions with affiliates; and
|
|
•
|
consolidate or merge with or into, or sell substantially all of our assets to, another person.
|
The Credit Agreement also includes, among other financial covenants, financial covenants that require us to maintain a maximum total leverage ratio and minimum fixed charge coverage ratio. Our ability to comply with these financial covenants may be affected by events beyond our control. Our failure to comply with any of the covenants could result in a default under the Credit Agreement, which could permit the administrative agent or the lenders to declare all or part of any outstanding borrowings to be immediately due and payable, or to refuse to permit additional borrowings under the revolving credit facility, which could restrict our operations, particularly our ability to respond to changes in our business or to take specified actions to take advantage of certain business opportunities that may be presented to us. In addition, if we are unable to repay those amounts, the administrative agent and the lenders under the Credit Agreement could proceed against the collateral granted to them to secure that debt, which would seriously harm our business.
If we are unable to recruit and retain skilled and motivated personnel, our competitive position, results of operations and financial condition could be harmed.
Our success is highly dependent upon the continuing contributions of our key management, sales, technical and engineering staff. We believe that our future success will depend upon our ability to attract, train and retain highly skilled and motivated personnel. As more of our products are installed in increasingly complex environments, greater technical expertise will be required. As our installed base of customers increases, we will also face additional demands on our customer service and support personnel, requiring additional resources to meet these demands. We may experience difficulty in recruiting qualified personnel. Competition for qualified technical, engineering, managerial, sales, marketing, financial reporting and other personnel can be intense and may not be successful in attracting and retaining qualified personnel. Competitors have in the past attempted, and may in the future attempt, to recruit our employees.
In addition, we have historically used stock options, restricted stock units and other forms of equity compensation as key components of our employee compensation program in order to align employees' interests with the interests of our stockholders, encourage employee retention and provide competitive compensation packages. The effect of managing share-based compensation expense and minimizing shareholder dilution from the issuance of new shares may make it less favorable for us to grant stock options, restricted stock units or other forms of equity compensation, to employees in the future. In order to continue granting equity compensation at competitive levels, we must seek stockholder approval for any increases to the number of shares reserved for issuance under our equity incentive plans, such as the share increase for which we obtained approval at our 2013 Annual Meeting of Stockholders, and we cannot assure you that we will receive such approvals in the future. Any failure to receive approval for current or future proposed increases could prevent us from granting equity compensation at competitive levels and make it more difficult to attract, retain and motivate employees. Further, to the extent that we expand our business or product lines through the acquisition of other businesses, any failure to receive any such approvals could prevent us from securing employment commitments from such newly acquired employees. Failure to attract and retain key personnel could harm our competitive position, results of operations and financial condition.
In the past, we have experienced substantial fluctuations in customer demand, and we cannot be sure that we will be able to respond proactively to future changes in customer demand.
Our ability to adjust to fluctuations in our revenue while still achieving or sustaining profitability is dependent upon our ability to manage costs and control expenses. If our revenue increases or decreases rapidly, we may not be able to manage these changes effectively. Future growth is dependent on the continued demand for our products, the volume of installations we are able to complete, our ability to continue to meet our customers' needs and provide a quality installation experience and our flexibility in manpower allocations among customers to complete installations on a timely basis.
24
Regarding our expenses, our ability to control expense is dependent on our ability to continue to develop and leverage effective and efficient human and information technology systems, our ability to gain efficiencies in our workforce through the local and worldwide labor markets and our ability to grow our outsourced vendor supply model. Our expense growth rate may equal or exceed our revenue growth rate if we are unable to streamline our operations, or fail to reduce the costs or increase the margins of our products. In addition, we may not be able to reduce our expenses to keep pace with any reduction in our revenue, which could harm our results of operations and financial position.
If we are unable to successfully interface our automation solutions with the existing information systems of our customers, they may choose not to use our products and services.
For healthcare facilities to fully benefit from our automation solutions, our systems must interface with their existing information systems. This may require substantial cooperation, incremental investment and coordination on the part of our customers and may require coordination with third-party suppliers of the existing information systems. There is little uniformity in the systems currently used by our customers, which complicates the interfacing process. If these systems are not successfully interfaced, our customers could choose not to use or to reduce their use of our automation solutions, which would harm our business. Also, these information systems are impacted by regulatory forces, such as the HITECH Act, Meaningful Use Stages, and HIPAA Omnibus Rules, and may evolve their interoperability functionality accordingly. We expect to comply with the mandatory standards and certifications that enable us to continuously interoperate with partner information system, but such symbiotic evolution in a changing regulatory environment can at times create an execution risk.
Additionally, our competitors may enter into agreements with providers of hospital information management systems that are designed to increase the interoperability of their respective products. To the extent our competitors are able to increase the interoperability of their products with those of the major hospital information systems providers, customers who utilize such information systems may choose not to use our products and services. Furthermore, we expect the importance of interoperability to increase in the next few years. Regulations such as the HITECH Act Meaningful Use Stage 3 are expected to heavily focus on evidence and outcomes. Given our role in care delivery process, the data generated by our products may be a key input for assessing and reporting on clinical outcomes. This may elevate interoperability with information systems to a relative importance to our customers creating a business opportunity and risk.
Our failure to protect our intellectual property rights could negatively affect our ability to compete.
Our success depends in part on our ability to obtain patent protection for technology and processes and our ability to preserve our trademarks, copyrights and trade secrets. We have pursued patent protection in the United States and foreign jurisdictions for technology that we believe to be proprietary and for technology that offers us a potential competitive advantage for our products. We intend to continue to pursue such protection in the future. Our issued patents relate to various features of our medication and supply dispensing systems and our packaging systems. We cannot assure you that we will file any patent applications in the future, and that any of our patent applications will result in issued patents or that, if issued, such patents will provide significant protection for our technology and processes. Furthermore, we cannot assure you that others will not develop technologies that are similar or superior to our technology or that others will not design around the patents we own. All of our system software is copyrighted and subject to the protection of applicable copyright laws. Despite our efforts to protect our proprietary rights, unauthorized parties may attempt to copy aspects of our products or obtain and use information that we regard as proprietary, which could harm our competitive position.
Our quarterly operating results may fluctuate and may cause our stock price to decline.
Our quarterly operating results may vary in the future depending on many factors that include, but are not limited to, the following:
|
•
|
our ability to successfully install our products on a timely basis and meet other contractual obligations necessary to recognize revenue;
|
|
•
|
the size, product mix and timing of orders for our medication and supply dispensing systems, and our medication packaging systems, and their installation and integration;
|
|
•
|
the overall demand for healthcare medication management and supply chain solutions;
|
|
•
|
changes in pricing policies by us or our competitors;
|
|
•
|
the number, timing and significance of product enhancements and new product announcements by us or our competitors;
|
|
•
|
the timing and significance of any acquisition or business development transactions that we may consider or negotiate and the revenues, costs and earnings that may be associated with these transactions;
|
|
•
|
the relative proportions of revenues we derive from products and services;
|
|
•
|
fluctuations in the percentage of sales attributable to our international business;
|
25
|
•
|
our customers' budget cycles;
|
|
•
|
changes in our operating expenses and our ability to stabilize expenses;
|
|
•
|
expenses incurred to remediate product quality or safety issues
|
|
•
|
our ability to generate cash from our accounts receivable on a timely basis;
|
|
•
|
the performance of our products;
|
|
•
|
changes in our business strategy;
|
|
•
|
macroeconomic and political conditions, including fluctuations in interest rates, tax increases and availability of credit markets; and
|
|
•
|
volatility in our stock price and its effect on equity-based compensation expense.
|
Due to all of these factors, our quarterly revenues and operating results are difficult to predict and may fluctuate, which in turn may cause the market price of our stock to decline.
If we are unable to maintain our relationships with group purchasing organizations or other similar organizations, we may have difficulty selling our products and services to customers represented by these organizations.
A number of group purchasing organizations, including AmeriNet, Inc., Carolina Shared Services, LLC, Child Health Corporation of America, HealthTrust Purchasing Group, L.P., MedAssets, Inc. Supply Chain Systems, Novation, LLC, Premier Purchasing Partners, L.P. and Resources Optimization & Innovation, LLC have negotiated standard contracts for our products on behalf of their member healthcare organizations. Members of these group purchasing organizations may purchase under the terms of these contracts, which obligate us to pay the group purchasing organization a fee. We have also contracted with the United States General Services Administration, allowing the Department of Veteran Affairs, the Department of Defense and other Federal Government customers to purchase our products. These contracts enable us to more readily sell our products and services to customers represented by these organizations. Some of our contracts with these organizations are terminable at the convenience of either party. The loss of any of these relationships could impact the breadth of our customer base and could impair our ability to meet our revenue targets or increase our revenues. These organizations may not renew our contracts on similar terms, if at all, and they may choose to terminate our contracts before they expire, any of which could cause our revenues to decline.
If we are unable to maintain our relationships with major institutional pharmacies, we may experience a decline in the sales of blister cards and other consumables sold to these customers.
The institutional pharmacy market consists of significant national suppliers of medications to non-acute care facilities, smaller regional suppliers, and very small local suppliers. Although none of these customers comprised more than 10% of our revenues as of December 31, 2013, they may, in some periods, comprise between 5% and 10% of our revenues. If these larger national suppliers were to purchase consumable blister card components from alternative sources, or if alternatives to blister cards were used for medication control, our revenues would decline.
Our failure to maintain effective internal control over financial reporting in accordance with Section 404 of the Sarbanes-Oxley Act of 2002 could cause our stock price to decline.
Section 404 of the Sarbanes-Oxley Act of 2002 and the related rules and regulations of the SEC require annual management assessments of the effectiveness of our internal control over financial reporting and a report by our independent registered public accounting firm attesting to the effectiveness of internal control. If we fail to maintain effective internal control over financial reporting, as such standards are modified, supplemented or amended from time to time, we may not be able to ensure that we can conclude on an ongoing basis that we have effective internal control over financial reporting.
If the market price of our common stock continues to be highly volatile, the investment value of our common stock may decline.
During the
twelve months ended December 31, 2013
, our common stock traded between
$14.68
and
$25.89
per share. The market price for shares of our common stock has been and may continue to be highly volatile. In addition, our announcements or external events may have a significant impact on the market price of our common stock. These announcements or external events may include:
|
•
|
changes in our operating results;
|
|
•
|
developments in our relationships with corporate customers;
|
|
•
|
changes in the ratings of our common stock by securities analysts;
|
|
•
|
announcements by us or our competitors of technological innovations or new products;
|
|
•
|
announcements by us or our competitors of acquisitions of businesses, products or technologies; or
|
|
•
|
general economic and market conditions.
|
26
Furthermore, the stock market as a whole from time to time has experienced extreme price and volume fluctuations, which have particularly affected the market prices for technology companies. These broad market fluctuations may cause the market price of our common stock to decline irrespective of our performance. In addition, sales of substantial amounts of our common stock in the public market could lower the market price of our common stock.
We depend on a limited number of suppliers for our products and our business may suffer if we were required to change suppliers to obtain an adequate supply of components, equipment and raw materials on a timely basis.
Although we generally use parts and components for our products with a high degree of modularity, certain components are presently available only from a single source or limited sources. We rely on a limited number of suppliers for the raw materials that are necessary in the production of our consumable medication packages. We have generally been able to obtain adequate supplies of all components and raw materials in a timely manner from existing sources, or where necessary, from alternative sources of supply. We engage multiple single source third-party manufacturers to build several of our sub-assemblies. The risk associated with changing to alternative vendors, if necessary, for any of the numerous components used to manufacture our products could limit our ability to manufacture our products and harm our business. Our reliance on a few single source partners to build our hardware sub-assemblies and on a limited number of suppliers for the raw materials that are necessary in the production of our consumable medication packages, a reduction or interruption in supply from our partners or suppliers, or a significant increase in the price of one or more components could have an adverse impact on our business, operating results and financial condition. In certain circumstances, the failure of any of our suppliers or us to perform adequately could result in quality control issues affecting end users' acceptance of our products. These impacts could damage customer relationships and could harm our business.
The conflict minerals provision of the Dodd-Frank Wall Street Reform and Consumer Protection Act could result in additional costs and liabilities.
In accordance with the Dodd-Frank Wall Street Reform and Consumer Protection Act, the SEC established new disclosure and reporting requirements for those companies that use "conflict minerals" mined from the Democratic Republic of Congo and adjoining countries, whether or not these products are manufactured by third parties. These new requirements could affect the sourcing of materials used in our products as well as the companies we use to manufacture our products. In circumstances where conflict minerals in our products are found to be sourced from the Democratic Republic of the Congo or surrounding countries, we may take actions to change materials or designs to reduce the possibility that our purchase of conflict minerals may fund armed groups in the region. These actions could add engineering and other costs to the manufacture of our products.
We expect to incur costs to design and implement a process to discover the origin of the tantalum, tin, tungsten and gold used in our products, including components we purchase from third parties, and to audit our conflict minerals disclosures. Our reputation may also suffer if we have included conflict minerals originating in the Democratic Republic of the Congo or surrounding countries in our products.
Our U.S. government lease agreements are subject to annual budget funding cycles and mandated unilateral changes, which may affect our ability to enter into such leases or to recognize revenue and sell receivables based on these leases.
U.S. government customers that lease our equipment typically sign contracts with five-year payment terms that are subject to one-year government budget funding cycles. Further, the government has in certain circumstances mandated unilateral changes in its Federal Supply Services contract that could render our lease terms with the government less attractive. In our judgment and based on our history with these accounts, we believe these receivables are collectible. However, in the future, the failure of any of our U.S. government customers to receive their annual funding, or the government mandating changes to the Federal Supply Services contract could impair our ability to sell lease equipment to these customers or to sell our U.S. government receivables to third-party leasing companies. In addition, the ability to collect payments on unsold receivables could be impaired and may result in a write-down of our unsold receivables from U.S. government customers. As of December 31, 2013, the balance of our unsold leases to U.S. government customers was
$12.8 million
.
If we fail to manage our inventory properly, our revenue, gross margin and profitability could suffer.
Managing our inventory of components and finished products is a complex task. A number of factors, including, but not limited to, the need to maintain a significant inventory of certain components that are in short supply or that must be purchased in bulk to obtain favorable pricing, the general unpredictability of demand for specific products and customer requests for quick delivery schedules, may result in us maintaining large amounts of inventory. Other factors, including changes in market demand, customer requirements and technology, may cause our inventory to become obsolete. Any excess or obsolete inventory could result in inventory write-downs, which in turn could harm our business and results of operations.
27
Intellectual property claims against us could harm our competitive position, results of operations and financial condition.
We expect that developers of medication and supply dispensing systems and medication packaging systems, will be increasingly subject to infringement claims as the number of products and competitors in our industry grows and the functionality of products in different industry segments overlaps. In the future, third parties may claim that we have infringed upon their intellectual property rights with respect to current or future products. We do not carry special insurance that covers intellectual property infringement claims; however, such claims may be covered under our traditional insurance policies. These policies contain terms, conditions and exclusions that make recovery for intellectual property infringement claims difficult to guarantee. Any infringement claims, with or without merit, could be time-consuming to defend, result in costly litigation, divert management's attention and resources, cause product shipment delays or require us to enter into royalty or licensing agreements. These royalty or licensing agreements, if required, may not be available on terms acceptable to us, or at all, which could harm our competitive position, results of operations and financial condition.
Our software products are complex and may contain defects, which could harm our reputation, results of operations and financial condition.
We market products that contain software and products that are software only. Although we perform extensive testing prior to releasing software products, these products may contain undetected errors or bugs when first released. These may not be discovered until the product has been used by customers in different application environments. Failure to discover product deficiencies or bugs could require design modifications to previously shipped products or cause delays in the installation of our products and unfavorable publicity or negatively impact system shipments, any of which could harm our business, financial condition and results of operations.
Product liability claims against us could harm our competitive position, results of operations and financial condition.
Our products provide medication management and supply chain management solutions for the healthcare industry. Despite the presence of healthcare professionals as intermediaries between our products and patients, if our products fail to provide accurate and timely information or operate as designed, customers, patients or their family members could assert claims against us for product liability. Moreover, failure of health-care facility employees to use our products for their intended purposes could result in product liability claims against us. Litigation with respect to product liability claims, regardless of any outcome, could result in substantial cost to us, divert management's attention from operations and decrease market acceptance of our products. We possess a variety of insurance policies that include coverage for general commercial liability and technology errors and omissions liability. We attempt to mitigate these risks through contractual terms negotiated with our customers. However, these policies and protective contractual terms may not be adequate against product liability claims. A successful claim brought against us, or any claim or product recall that results in negative publicity about us, could harm our competitive position, results of operations and financial condition. Also, in the event that any of our products is defective, we may be required to recall or redesign those products.
We are dependent on technologies provided by third-party vendors, the loss of which could negatively and materially affect our ability to market, sell, or distribute our products.
Some of our products incorporate technologies owned by third parties that are licensed to us for use, modification, and distribution. If we lose access to third-party technologies, or we lose the ongoing rights to modify and distribute these technologies with our products, we will either have to devote resources to independently develop, maintain and support the technologies ourselves, pay increased license costs, or transition to another vendor. Any independent development, maintenance or support of these technologies by us or the transition to alternative technologies could be costly, time consuming and could delay our product releases and upgrade schedules. These factors could negatively and materially affect our ability to market, sell or distribute our products.
Complications in connection with our ongoing business information system upgrades, including those required to adopt new accounting standards and eventually adopt changes driven by converged accounting standards for revenues, leases and other topics, may impact our results of operations, financial condition and cash flows.
We continue to upgrade our enterprise-level business information system with new capabilities and transition acquired entities onto information systems already utilized in the company. Based upon the complexity of some of the upgrades, there is risk that we will not see the expected benefit from the implementation of these upgrades in accordance with their anticipated timeline and will incur costs in addition to those we have already planned for. In addition, in future years, we may need to begin efforts to comply with final converged accounting standards to be established by the Financial Accounting Standards Board ("FASB") and the International Accounting Standards Board ("IASB") for revenues, leases and other components of our financial reporting. These new standards could require us to modify our accounting policies. We further anticipate that
28
integration of these and possibly other new standards may require a substantial amount of management's time and attention and require integration with our enterprise resource planning system. The implementation of the system and the adoption of future new standards, in isolation as well as together, could result in operating inefficiencies and financial reporting delays, and could impact our ability to record certain business transactions timely. All of these potential results could adversely impact our results of operations, financial condition and cash flows.
Outstanding employee stock options have the potential to dilute stockholder value and cause our stock price to decline.
We grant stock options to certain of our employees as incentives to join Omnicell or as an on-going reward and retention vehicle. At December 31, 2013, we had options outstanding to purchase approximately 3.1 million shares of our common stock at exercise prices ranging from $6.40 to $29.16 per share, at a weighted-average exercise price of $15.10 per share. If some or all of these shares are sold into the public market over a short time period, the price of our common stock may decline, as the market may not be able to absorb those shares at the prevailing market prices. Such sales may also make it more difficult for us to sell equity securities in the future on terms that we deem acceptable.
Changes in our tax rates, the adoption of new tax legislation or exposure to additional tax liabilities could affect our future results.
We are subject to taxes in the United States and foreign jurisdictions. Our future effective tax rates could be affected by several factors, many of which are outside of our control, including: changes in the mix of earnings with differing statutory tax rates, changes in the valuation of deferred tax assets and liabilities, or changes in tax laws or their interpretation. We regularly assess the likelihood of adverse outcomes to determine the adequacy of our provision for taxes. We are also subject to examination of our income tax returns by the Internal Revenue Service and other tax authorities. There can be no assurance that the outcomes from these examinations will not materially adversely affect our financial condition and operating results.
Catastrophic events may disrupt our business and harm our operating results.
We rely on our network infrastructure, data centers, enterprise applications, and technology systems for the development, marketing, support and sales of our products, and for the internal operation of our business. These systems are susceptible to disruption or failure in the event of a major earthquake, fire, flood, cyber-attack, terrorist attack, telecommunications failure, or other catastrophic event. Many of these systems are housed or supported in or around our corporate headquarters located in Northern California, near major earthquake faults, and where a significant portion of our research and development activities and other critical business operations take place. Other critical systems, including our manufacturing facilities for our consumable medication packages, are housed in St. Petersburg, Florida in communities that have been subject to significant tropical storms. Disruptions to or the failure of any of these systems, and the resulting loss of critical data, which is not quickly recoverable by the effective execution of disaster recovery plans designed to reduce such disruption, could cause delays in our product development, prevent us from fulfilling our customers' orders, and could severely affect our ability to conduct normal business operations, the result of which would adversely affect our operating results.
Anti-takeover provisions in our charter documents and under Delaware law, and any stockholders' rights plan we may adopt in the future, make an acquisition of us, which may be beneficial to our stockholders, more difficult.
We are incorporated in Delaware. Certain anti-takeover provisions of Delaware law and our charter documents as currently in effect may make a change in control of our company more difficult, even if a change in control would be beneficial to the stockholders. Our anti-takeover provisions include provisions in our certificate of incorporation providing that stockholders' meetings may only be called by our Board of Directors and provisions in our bylaws providing that the stockholders may not take action by written consent and requiring that stockholders that desire to nominate any person for election to our Board of Directors or to make any proposal with respect to business to be conducted at a meeting of our stockholders be submitted in appropriate form to our Secretary within a specified period of time in advance of any such meeting. Delaware law also prohibits corporations from engaging in a business combination with any holders of 15% or more of their capital stock until the holder has held the stock for three years unless, among other possibilities, our Board of Directors approves the transaction. Our Board of Directors may use these provisions to prevent changes in the management and control of our company. Also, under applicable Delaware law, our board of directors may adopt additional anti-takeover measures in the future.
The stockholder rights plan adopted by our Board of Directors in February 2003 expired by its terms in February 2013. Our Board of Directors could adopt a similar plan in the future if it determines that such action is in the best interests of our stockholders. Such a plan may have the effect of discouraging, delaying or preventing a change in control of our company that may be beneficial to our stockholders.
29
None.
Our headquarters is located in leased facilities in Mountain View, California. In addition, we maintain leased office space in California, Florida, Illinois, Tennessee, and the United Kingdom. The following is a list of our leased facilities and their primary functions.
|
Site
|
Major Activity
|
Segment
|
Approximate Square Footage
|
|
St. Petersburg, Florida
|
Administration, marketing, research and development and manufacturing
|
Non-Acute Care
|
132,500
|
|
Mountain View, California
|
Administration, marketing, and research and development
|
Acute Care
|
100,000
|
|
Milpitas, California
|
Manufacturing
|
Acute Care
|
46,000
|
|
Waukegan, Illinois
|
Technical support and training
|
Acute Care
|
38,000
|
|
Nashville, Tennessee
|
Research and development and marketing
|
Acute Care
|
25,000
|
|
Leeds, United Kingdom
|
Sales, marketing and distribution center
|
Acute Care and Non-Acute Care
|
16,500
|
We also have smaller rented offices in Strongsville, Ohio, the United Arab Emirates, the People's Republic of China and the Federal Republic of Germany.
We believe that these facilities are sufficient for our current operational needs and that suitable additional space will be available on commercially reasonable terms to accommodate expansion of our operations, if necessary.
For additional information regarding our obligations pursuant to operating leases, see Note 12, Commitments, of the Notes to Consolidated Financial Statements included in this Annual Report on Form 10-K.
The information set forth under "Legal Proceedings" in Note 13, Contingencies, of the Notes to Consolidated Financial Statements in Part II, Item 8 included in this Annual Report on Form 10-K is incorporated herein by reference.
Not applicable.
30
Market for Our Common Stock
Our common stock is traded on The NASDAQ Global Select Market under the symbol "OMCL." The following table sets forth the high and low sales prices per share of our common stock for the periods indicated.
|
Fiscal Year Ended December 31, 2013
|
High
|
Low
|
|||||
|
Fourth Quarter
|
$
|
25.89
|
|
$
|
20.88
|
|
|
|
Third Quarter
|
$
|
25.22
|
|
$
|
19.29
|
|
|
|
Second Quarter
|
$
|
20.88
|
|
$
|
17.01
|
|
|
|
First Quarter
|
$
|
20.00
|
|
$
|
14.68
|
|
|
|
Fiscal Year Ended December 31, 2012
|
High
|
Low
|
|||||
|
Fourth Quarter
|
$
|
16.13
|
|
$
|
12.61
|
|
|
|
Third Quarter
|
$
|
15.03
|
|
$
|
12.33
|
|
|
|
Second Quarter
|
$
|
15.51
|
|
$
|
12.74
|
|
|
|
First Quarter
|
$
|
17.94
|
|
$
|
14.10
|
|
|
As of
March 7, 2014
we had approximately
36,362,249
shares of common stock outstanding held by approximately
130
stockholders of record.
Dividend Policy
We have never declared or paid any cash dividends on our common stock. We currently expect to retain any future earnings for use in the operation and expansion of our business and do not anticipate paying any cash dividends on our common stock in the foreseeable future.
Performance Graph
The following graph compares total stockholder returns for Omnicell's common stock for the past five years to two indices: The NASDAQ Composite Index and the NASDAQ Health Services index. The total return for Omnicell's common stock and for each index assumes the reinvestment of all dividends, although cash dividends have never been declared on Omnicell's common stock, and is based on the returns of the component companies weighted according to their capitalization as of the end of each annual period.
The NASDAQ Composite Index tracks the aggregate price performance of equity securities traded on The NASDAQ Stock Market. The NASDAQ Health Services Index tracks the aggregate price performance of health services equity securities. Omnicell's common stock is traded on The NASDAQ Global Select Market and is a component of both indices. The stock price performance shown on the graph is not necessarily indicative of future price performance.
31
COMPARISON OF 5 YEAR CUMULATIVE TOTAL RETURN*
Among Omnicell, Inc., the NASDAQ Composite Index, and the NASDAQ Health Services Index (1)
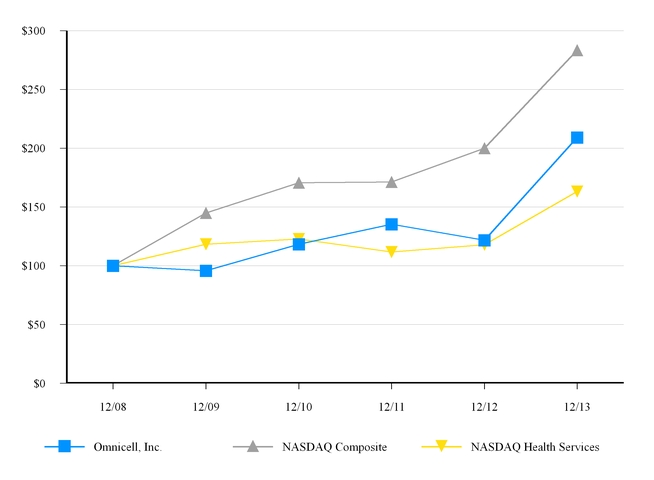
_________________________________________________
*$100 invested on 12/31/08 in stock or index, including reinvestment of dividends.
Fiscal year ending December 31.
|
12/08
|
12/09
|
12/10
|
12/11
|
12/12
|
12/13
|
|||||||||
|
Omnicell, Inc.
|
100.00
|
|
95.74
|
|
118.35
|
|
135.30
|
121.79
|
209.09
|
|||||
|
NASDAQ Composite
|
100.00
|
|
144.88
|
|
170.58
|
|
171.30
|
199.99
|
283.39
|
|||||
|
NASDAQ Health Services
|
100.00
|
|
118.31
|
|
122.82
|
|
111.62
|
117.99
|
163.12
|
|||||
_________________________________________________
|
(1)
|
This section is not deemed "soliciting material" or to be "filed" with the SEC and is not to be incorporated by reference into any filing of Omnicell, Inc. under the Securities Act of 1933, as amended, or the Securities Exchange Act of 1934, as amended, whether made before or after the date hereof and irrespective of any general incorporation language in any such filing.
|
32
Share Repurchase Programs
The following table presents a summary of our stock repurchase activity in the fourth quarter of 2013:
|
Total Number of Shares Purchased
(1)
|
Average Price Paid per Share
|
Total Number of Shares Purchased as Part of Publicly Announced Programs
(1)
|
Maximum Dollar Value of Shares That May Yet Be Purchased Under the Plans or Programs
(2)
|
||||||||||
|
October 1, 2013 to October 31, 2013
|
—
|
|
—
|
|
—
|
|
$
|
50,000,000
|
|
||||
|
November 1, 2013 to November 30, 2013
|
251,618
|
|
$
|
23.40
|
|
251,618
|
|
$
|
44,111,304
|
|
|||
|
December 1, 2013 to December 31, 2013
|
633,027
|
|
$
|
23.77
|
|
633,027
|
|
$
|
29,064,093
|
|
|||
(1)
Shares purchased under the 2012 Stock Repurchase Program
(2)
These shares reflect the available shares authorized for repurchase under the 2012 Stock Repurchase Program.
Refer to Note 15, Stockholders' Equity
,
of the Notes to Consolidated Financial Statements in this Annual Report on Form 10-K for information regarding our 2012 Stock Repurchase Program.
SELECTED CONSOLIDATED FINANCIAL DATA
|
Years Ended December 31,
|
|||||||||||||||||||
|
2013
|
2012
|
2011
|
2010
|
2009
|
|||||||||||||||
|
(in thousands, except per share amounts)
|
|||||||||||||||||||
|
Total revenues
|
$
|
380,585
|
|
$
|
314,027
|
|
$
|
245,535
|
|
$
|
222,407
|
|
$
|
213,457
|
|
||||
|
Gross profit
|
$
|
203,399
|
|
$
|
170,588
|
|
$
|
135,784
|
|
$
|
117,917
|
|
$
|
105,221
|
|
||||
|
Income from operations(1)
|
$
|
35,299
|
|
$
|
27,126
|
|
$
|
16,222
|
|
$
|
9,526
|
|
$
|
669
|
|
||||
|
Net income
|
$
|
23,979
|
|
$
|
16,178
|
|
$
|
10,389
|
|
$
|
4,892
|
|
$
|
444
|
|
||||
|
Net income per share:
|
|||||||||||||||||||
|
Basic
|
$
|
0.69
|
|
$
|
0.49
|
|
$
|
0.31
|
|
$
|
0.15
|
|
$
|
0.01
|
|
||||
|
Diluted
|
$
|
0.67
|
|
$
|
0.47
|
|
$
|
0.30
|
|
$
|
0.15
|
|
$
|
0.01
|
|
||||
|
Shares used in per shares calculations:
|
|||||||||||||||||||
|
Basic
|
34,736
|
|
33,307
|
|
33,123
|
|
32,651
|
|
31,691
|
|
|||||||||
|
Diluted
|
35,777
|
|
34,213
|
|
34,103
|
|
33,513
|
|
32,063
|
|
|||||||||
|
Cash dividends declared per share
|
$
|
—
|
|
$
|
—
|
|
$
|
—
|
|
$
|
—
|
|
$
|
—
|
|
||||
|
At December 31,
|
|||||||||||||||||||
|
2013
|
2012
|
2011
|
2010
|
2009
|
|||||||||||||||
|
(in thousands)
|
|||||||||||||||||||
|
Total assets
|
$
|
492,501
|
|
$
|
441,819
|
|
$
|
363,849
|
|
$
|
343,224
|
|
$
|
322,260
|
|
||||
|
Long-term obligations, net of current portion
|
$
|
51,100
|
|
$
|
51,192
|
|
$
|
20,305
|
|
$
|
19,846
|
|
$
|
21,405
|
|
||||
|
Total stockholders' equity
|
$
|
348,997
|
|
$
|
307,550
|
|
$
|
282,914
|
|
$
|
265,214
|
|
$
|
242,304
|
|
||||
_______________________________________________________________________________
(1) Income from operations includes the following items:
33
|
Years Ended December 31,
|
|||||||||||||||||||
|
2013
|
2012
|
2011
|
2010
|
2009
|
|||||||||||||||
|
(in thousands)
|
|||||||||||||||||||
|
Share-based compensation expense
|
$
|
11,151
|
|
$
|
9,214
|
|
$
|
9,499
|
|
$
|
9,015
|
|
$
|
9,725
|
|
||||
The amounts shown above include the operating results from the acquisition of MTS Medication Technologies, Inc. from May 21, 2012 and Pandora Data Systems, Inc. ("Pandora") from September 29, 2010.
The selected consolidated financial data above should be read in conjunction with "Management's Discussion and Analysis of Financial Condition and Results of Operations" and the audited financial statements, notes thereto and other financial information included elsewhere in this Annual Report on Form 10-K. The consolidated statements of operations data above for the years ended December 31, 2013, 2012, and 2011 and the consolidated balance sheet data at December 31, 2013 and 2012 are derived from our audited consolidated financial statements included elsewhere in this Annual Report on Form 10-K. The consolidated statement of operations data above for the year ended December 31, 2010 and 2009, and the consolidated balance sheet data at December 31, 2011, 2010 and 2009 are derived from our audited consolidated financial statements, which are not included in this Annual Report on Form 10-K. Historical results are not necessarily indicative of the results to be expected in the future.
SUPPLEMENTARY CONSOLIDATED FINANCIAL DATA
|
Quarters Ended
|
|||||||||||||||
|
December 31, 2013
|
September 30, 2013
|
June 30, 2013
|
March 31, 2013
|
||||||||||||
|
(in thousands, except per share data)
(unaudited)
|
|||||||||||||||
|
2013
|
|||||||||||||||
|
Total revenues
|
105,750
|
|
94,039
|
|
93,686
|
|
87,110
|
|
|||||||
|
Gross profit
|
56,624
|
|
52,040
|
|
49,368
|
|
45,367
|
|
|||||||
|
Income from operations
|
11,055
|
|
10,717
|
|
9,359
|
|
4,169
|
|
|||||||
|
Net income
|
$
|
6,823
|
|
$
|
7,755
|
|
$
|
6,016
|
|
$
|
3,385
|
|
|||
|
Net income per share:
|
|||||||||||||||
|
Basic(1)
|
$
|
0.19
|
|
$
|
0.22
|
|
$
|
0.17
|
|
$
|
0.10
|
|
|||
|
Diluted(1)
|
$
|
0.19
|
|
$
|
0.21
|
|
$
|
0.17
|
|
$
|
0.10
|
|
|||
|
Quarters Ended
|
|||||||||||||||
|
December 31, 2012
|
September 30, 2012
|
June 30, 2012
|
March 31, 2012
|
||||||||||||
|
(in thousands, except per share data)
(unaudited)
|
|||||||||||||||
|
2012
|
|||||||||||||||
|
Total revenues
|
90,169
|
|
84,331
|
|
75,384
|
|
64,143
|
|
|||||||
|
Gross profit
|
49,376
|
|
46,087
|
|
39,376
|
|
35,749
|
|
|||||||
|
Income from operations
|
9,834
|
|
11,226
|
|
2,431
|
|
3,635
|
|
|||||||
|
Net income
|
$
|
5,532
|
|
$
|
6,920
|
|
$
|
1,375
|
|
$
|
2,351
|
|
|||
|
Net income per share:
|
|
|
|
|
|
|
|
|
|||||||
|
Basic(1)
|
$
|
0.17
|
|
$
|
0.21
|
|
$
|
0.04
|
|
$
|
0.07
|
|
|||
|
Diluted(1)
|
$
|
0.16
|
|
$
|
0.20
|
|
$
|
0.04
|
|
$
|
0.07
|
|
|||
_______________________________________________________________________________
|
(1)
|
Quarterly net income per share figures may not total to annual net income per share, due to rounding and fluctuations in the number of options included or omitted from diluted calculations based on the stock price or option exercise prices and/or net losses recorded in quarterly periods.
|
34
The following discussion and analysis should be read in conjunction with our financial statements and related notes included elsewhere in this Annual Report on Form 10-K. This discussion may contain forward-looking statements based upon current expectations that involve risks and uncertainties. Our actual results and the timing of selected events could differ materially from those anticipated in these forward-looking statements as a result of several factors, including those set forth under Item 1A "Risk Factors" and elsewhere in this Annual Report on Form 10-K. Unless otherwise stated, references in this report to particular years or quarters refer to our fiscal year and the associated quarters of those fiscal years.
Overview
We are a leading provider of automated solutions for medication and supply management in healthcare. We believe our products improve healthcare for everyone, and it is our mission to continue improving healthcare with solutions that change the practice of healthcare in ways that improve patient and provider outcomes. Our automation and analytics solutions are designed to enable healthcare facilities to acquire, manage, dispense and administer medications and medical-surgical supplies and are intended to enhance patient safety, reduce medication errors, reduce operating costs, improve workflow and increase operational efficiency. We sell our medication control systems together with related consumables and services, and medical and surgical supply control systems. We generate approximately
89%
of our product revenue in the United States and Canada. However, we expect our revenue from international operations to increase in future periods as we continue to grow our international business
.
We have not sold in the past, and have no future plans to sell our products either directly or indirectly to customers located in countries that are identified as state sponsors of terrorism by the U.S. Department of State, and are subject to economic sanctions and export controls.
We manage our business in two segments defined by customer type: products and services sold to hospital customers are designated as our Acute Care segment, and products and services sold outside the hospital setting are designated as our Non-Acute Care segment. Our Acute Care segment has been the predominant market for our products since the founding of the company in 1992 and today comprises approximately 75% of our overall business. The Non-Acute Care segment became a significant portion of our business in May 2012, when we completed our acquisition of MedPak Holdings, Inc. ("MedPak"). MedPak is the parent company of MTS Medication Technologies, Inc. ("MTS"), a worldwide provider of medication adherence packaging systems. The acquisition aligns us with the long-term trends of the healthcare market to manage the health of patients across the continuum of care. The combination of Omnicell and MTS brought capabilities to each other that strengthened the product lines and expanded the medication management coverage of both companies. In addition to MTS medication adherence packaging systems, we now also sell other products into non-acute care customers as a result of increased access to these customers through the acquisition. Please refer to Note 2, Business Acquisitions, of the Notes to Consolidated Financial Statements included in this Annual Report on Form 10-K for more information regarding the acquisition transaction and Note 17, Segments
,
of the Notes to Consolidated Financial Statements included in this Annual Report on Form 10-K for more information regarding the results for both the Acute Care and Non-Acute Care segments.
The healthcare market we sell to is experiencing a period of substantive change. The adoption of electronic healthcare records, new regulatory constraints, and changes in the reimbursement structure have caused healthcare institutions to re-examine their operating structures, re-prioritize their investments, and seek efficiencies. We believe our customers’ evolving operating environment creates challenges for any supplier, but also affords opportunities for suppliers that are able to partner with customers to help them meet the changing demands. We have invested in strategies which we believe have generated our revenue and earnings growth by directly supporting our customers’ initiatives. These strategies include:
|
•
|
Development of differentiated products.
We invest in the development of products that we believe bring patient safety and workflow efficiency to our customers’ operations that they cannot get from other competing solutions. These differentiators may be as small as how a transaction operates or information provided on a report or as large as the entire automation of a workflow that would otherwise be completed manually. We intend to continue our focus on differentiating our products, and we carefully assess our investments regularly as we strive to assure those investments provide the solutions most valuable to our customers.
|
|
•
|
Deliver our solutions to new markets
.
Areas of healthcare where work is done manually may benefit from our existing solutions. These areas include hospitals that continue to utilize manual operations, healthcare segments of the US market outside hospitals, and markets outside the US. We weigh the cost of entering these new markets against the expected benefits and focus on the markets that we believe are most likely to adopt our products.
|
|
•
|
Expansion of our solutions through acquisitions and partnerships.
Our acquisitions have generally been focused on automation of manual workflows or data analytics, which is the enhancement of data for our customers’ decision-
|
35
making processes. We believe that expansion of our product lines through acquisition and partnerships to meet our customers changing and evolving expectations is a key aspect to our historical and future success.
Since the sales cycle for many of our products can be as long as two years, and the installation cycle can be up to another year, the results of operations in 2013 were heavily influenced by our investment decisions that were made several years ago. We believe those investments are directly attributable to our revenue growth of
21%
and our net income growth of
48%
in 2013 as compared to 2012. Our investments have been consistent with the strategies outlined above. To differentiate our solutions from others available in the market, we began shipping a refresh of our product line in 2011 which we market as G4. The G4 refresh included multiple new products and an upgrade product that allowed existing customers to augment their installations to obtain the most current technology that we provide. The G4 product refresh has been a key contributor to our growth, with
37.0%
of our acute care installed base ordering upgrades to their existing systems since the announcement of G4. In addition to enhanced capabilities, we have focused on attaining the highest quality and service measurements for G4 in the industry, while marketing the solution to new and existing customers. Our research and development efforts today are designed to bring new products to market beyond the G4 product line that we believe will meet customer needs in years to come.
Consistent with our strategy to enter new markets, we have made investments in our Sales, General, and Administrative expenses to expand our sales team and market to new customers. Our international efforts have focused primarily on three markets: China, where we made a Mandarin version of our automated dispensing systems available in 2011, the Middle Eastern countries of the Arabian Peninsula where new healthcare facility construction is taking place, and in the United Kingdom where, in the third quarter of 2012, we purchased 15% of our United Kingdom distributor’s outstanding equity for approximately $0.9 million in cash to accelerate the adoption of medication and supply automation. In connection with the investment, we have the right, under certain circumstances, to appoint a member to this company's board of directors as well as certain other voting rights and, therefore, we believe we have the ability to exert significant influence over this distributor's operations. Our proportionate equity share of the income of this distributor recognized in our financial statements for the year ended December 31, 2013 was immaterial. We have also expanded our sales efforts to non-acute care customers in the United States which has allowed us to sell our automated dispensing solutions and other products to this market.
Expansion of our solutions through acquisitions and partnerships include our acquisition of MTS in 2012 and a recently announced, but not completed, potential acquisition of Surgichem Limited from Bupa Care Homes (CFG) Plc. Surgichem is a provider of medication adherence products in the United Kingdom. If completed, the combination of Surgichem with Omnicell is expected to enable both entities to sell their lines of proven multi- and single-dose products across a broader medication adherence packaging market in the United Kingdom. We have also developed relationships with major providers of hospital information management systems with the goal of enhancing the interoperability of our products with their systems. We believe that enhanced interoperability will help reduce implementation costs, time, and maintenance for shared clients, while providing new clinical workflows designed to enhance efficiency and patient safety.
We believe that the success of our three leg strategy of differentiated products, expansion into new markets, and acquisition and partnership in future periods will be based on, among other factors:
|
•
|
Our expectation that the overall market demand for healthcare services will increase as the population grows, life expectancies continue to increase, the quality and availability of healthcare services increases;
|
|
•
|
Our expectation that the environment of increased patient safety awareness, increased regulatory control and increased need for workflow efficiency through the adoption of technology in the healthcare industry will make our solutions a priority in the capital budgets of healthcare facilities; and
|
|
•
|
Our belief that healthcare customers will continue to value a consultative customer experience from their suppliers.
|
Among other financial measures, we utilize product bookings and product backlog to assess the current success of our strategies. Product bookings consist of all firm orders, as evidenced by a contract and purchase order for equipment and software, and by a purchase order for consumables. Equipment and software bookings are installable within 12 months and generally recorded as revenue upon customer acceptance of the installation. Consumables are recorded as revenue upon shipment to a customer or receipt by the customer, depending upon contract terms. Consumable bookings are generally recorded as revenue within one month. Product bookings increased
23%
, from
$266 million
in 2012 to
$328 million
in 2013, driven in part by a full year of contribution from the acquisition of MTS and the success of our growth strategies in differentiated products and new markets. As a result of our bookings performance, our product backlog, consisting of orders accepted but not yet installed, increased
$25 million
, or
16.0%
, to
$180 million
at December 31, 2013 from
$155 million
as of December 31, 2012. The increase in backlog is primarily attributable to our Acute Care segment.
In addition to product solution sales, we provide services to our customers. Our healthcare customers expect a high degree of partnership involvement from their technology suppliers throughout their ownership of the products. We provide extensive installation planning and consulting as part of every product sale and included in the initial price of the solution. Our
36
customers' medication control systems are mission critical to their success and our customers require these systems to be functional at all times. To help assure the maximum availability of our systems, our customers typically purchase maintenance and support contracts in one, two or five year increments. As a result of the growth of our installed base of customers, our service revenues have also grown. We strive to provide the best service possible, as measured by third party rating agencies and by our own surveys, to assure our customers continue to seek service maintenance from us. Our long-term liabilities include long-term deferred service revenue of
$18 million
as of December 31, 2013, and
$20 million
as of December 31, 2012. Our deferred service revenue will be amortized to service revenue as the service contracts are executed.
In the future, we expect our strategies to evolve as the business environment of our customers evolves, but for our focus to remain on improving healthcare with solutions that help change the practice of healthcare in ways that improve patient and provider outcomes. We expect our investment in differentiated products, new markets, and acquisitions and partnerships to continue. In 2014, we also intend to manage our business to operating profit margins similar to those achieved in 2013. Our full time headcount of
1,134
on December 31, 2013, which is an increase of
45
from 2012, is dedicated to bringing our strategies to bear in all the markets we participate in.
Critical Accounting Policies and Estimates
Our discussion and analysis of our financial condition and results of operations are based on our consolidated financial statements, which have been prepared in accordance with United States generally accepted accounting principles, or GAAP. The preparation of these financial statements requires us to make certain estimates and assumptions that affect the reported amounts of assets and liabilities, disclosure of any contingent assets and liabilities at the date of the financial statements and the reported amounts of revenues and expenses during the reporting periods. We regularly review our estimates and assumptions, which are based on historical experience and various other factors that are believed to be reasonable under the circumstances, the results of which form the basis for making judgments about the carrying values of certain assets and liabilities that are not readily apparent from other sources. Actual results may differ from these estimates and assumptions. We believe the following critical accounting policies are affected by significant judgments and estimates used in the preparation of our consolidated financial statements:
Revenue recognition.
We earn revenues from sales of our medication and medical and surgical supply automation systems along with consumables and related services that are sold in the healthcare industry, our principal market. Revenues related to consumable products are reported net of discounts provided to our customers. Our customer arrangements typically include one or more of the following deliverables:
|
•
|
Products
—Software-enabled equipment that manages and regulates the storage and dispensing of pharmaceuticals, consumable blister cards and packaging equipment and other medical supplies.
|
|
•
|
Software
—Additional software applications that enable incremental functionality of our equipment.
|
|
•
|
Installation
—Installation of equipment as integrated systems at customers' sites.
|
|
•
|
Post-installation technical support
—Phone support, on-site service, parts and access to unspecified software upgrades and enhancements, if and when available.
|
|
•
|
Professional services
—Other customer services, such as training and consulting.
|
We recognize revenue when the earnings process is complete, based upon our evaluation of whether the following four criteria have been met:
|
•
|
Persuasive evidence of an arrangement exists.
We use signed customer contracts and signed customer purchase orders as evidence of an arrangement for leases and sales. For service engagements, we use a signed services agreement and a statement of work to evidence an arrangement.
|
|
•
|
Delivery has occurred.
Equipment and embedded software product delivery is deemed to occur upon successful installation and receipt of a signed and dated customer confirmation of installation letter, providing evidence that we have delivered what a customer ordered. In instances of a customer self-installation, product delivery is deemed to have occurred upon receipt of a signed and dated customer confirmation letter. If a sale does not require installation, we recognize revenue on delivery of products to the customer, including transfer of title and risk of loss, assuming all other revenue criteria are met. For existing distributors, where installation of equipment training has been previously provided and the distributor is certified to install our equipment at end user customer facility, we recognize revenue from sales of products to the distributor upon shipment assuming all other revenue criteria are met since we do not allow for rights of return or refund. For new distributors, where we have not provided installation of equipment training, revenue on the sales of products to the distributor is deferred until the distributor has completed the Distributor Training Program and has been certified to install our equipment at the
|
37
end user facility. For the sale of consumable blister cards, we recognize revenue when title and risk of loss of the products shipped have transferred to the customer, which usually occurs upon shipment from our facilities. Assuming all other revenue criteria are met, we recognize revenue for support services ratably over the related support services contract period. We recognize revenue on training and professional services as they are performed.
|
•
|
Fee is fixed or determinable.
We assess whether a fee is fixed or determinable at the outset of the arrangement based on the payment terms associated with the transaction. We have established a history of collecting under the original contract without providing concessions on payments, products or services.
|
|
•
|
Collection is probable.
We assess the probability of collecting from each customer at the outset of the arrangement based on a number of factors, including the customer's payment history and its current creditworthiness. If, in our judgment, collection of a fee is not probable, we defer the revenue until the uncertainty is removed, which generally means revenue is recognized upon our receipt of cash payment assuming all other revenue criteria are met. Our historical experience has been that collection from our customers is generally probable.
|
In arrangements with multiple deliverables, assuming all other revenue criteria are met, we recognize revenue for individual delivered items if they have value to the customer on a standalone basis.We allocate arrangement consideration at the inception of the arrangement to all deliverables using the relative selling price method. This method requires us to determine the selling price at which each deliverable could be sold if it were sold regularly on a standalone basis. When available, we use vendor-specific objective evidence ("VSOE") of the selling price. VSOE represents the price charged for a deliverable when it is sold separately, or for a deliverable not yet being sold separately, the price established by management with the relevant authority. We consider VSOE to exist when approximately 80% or more of our standalone sales of an item are priced within a reasonably narrow pricing range (plus or minus 15% of the median rates). We have established VSOE of the selling price for our post-installation technical support services and professional services. When VSOE of selling price is not available, third-party evidence ("TPE") of selling price for similar products and services is acceptable; however, our offerings and market strategy differ from those of our competitors, such that we cannot obtain sufficient comparable information about third parties' prices. If neither VSOE nor TPE are available, we use our best estimates of selling prices ("BESP"). We determine BESP considering factors such as market conditions, sales channels, internal costs and product margin objectives and pricing practices. We regularly review and update our VSOE and BESP information.
The relative selling price method allocates total arrangement consideration proportionally to each deliverable (an "Element") on the basis of its estimated selling price. In addition, the amount recognized for any delivered Elements cannot exceed that which is contingent upon delivery of any remaining Elements in the arrangement.
We also use the residual method to allocate revenue between the software products that enable incremental equipment functionality, and thus are not deemed to deliver its essential functionality, and the related post-installation technical support, as these products and services continue to be accounted for under software revenue recognition rules. Under the residual method, the amount allocated to the undelivered elements equals VSOE of fair value of these elements. Any remaining amounts are attributed to the delivered items and are recognized when those items are delivered.
A portion of our sales are made through multi-year lease agreements. Under sales-type leases, we recognize revenue for our hardware and software products net of lease execution costs such as post-installation product maintenance and technical support, at the net present value of the lease payment stream once our installation obligations have been met. We optimize cash flows by selling a majority of our non-U.S. government leases to third-party leasing finance companies on a non-recourse basis. We have no obligation to the leasing company once the lease has been sold. Some of our sales-type leases, mostly those relating to U.S. government hospitals, are retained in-house. Interest income on these leases is recognized as a component of product revenue using the interest method.
Accounts receivable and notes receivable (net investment in sales type leases).
We actively manage our accounts receivable to minimize credit risk. We typically sell our products to customers for which there is a history of successful collection. New customers are subject to a credit review process, which evaluates that customer's financial position and ability to pay. We continually monitor and evaluate the collectability of our trade receivables based on a combination of factors. We record specific allowances for doubtful accounts when we become aware of a specific customer's impaired ability to meet its financial obligation to us, such as in the case of bankruptcy filings or deterioration of financial position.
Uncollectible amounts are charged off against trade receivables and the allowance for doubtful accounts when we make a final determination that there is no reasonable expectation of recovery. Estimates are used in determining our allowances for all other customers based on factors such as current trends, the length of time the receivables are past due and historical collection experience. While we believe that our allowance for doubtful accounts receivable is adequate and that the
38
judgment applied is appropriate, such estimated amounts could differ materially from what will actually be uncollectible in the future.
The retained in-house leases discussed above are considered financing receivables. Our credit policies and evaluation of credit risk and write-off policies are applied alike to trade receivables and the net-investment in sales-type leases. For both, an account is generally past due after thirty days. The financing receivables also have customer-specific reserves for accounts identified for specific impairment and a non-specific reserve applied to the remaining population, based on factors such as current trends, the length of time the receivables are past due and historical collection experience. The retained in-house leases are not stratified by portfolio or class. Financing receivables which are reserved are generally transferred to cash-basis accounting so that revenue is recognized only as cash is received. However, the cash basis accounts continue to accrue interest.
Valuation and impairment of goodwill, other intangible assets and other long lived assets.
We account for goodwill and other intangible assets in accordance with ASC 350,
Intangibles—Goodwill and Other
("ASC 350"). For the initial recognition and measurement of Goodwill and Intangibles resulting from acquisitions, we use the guidance in ASC 805,
Business Combinations
.
Under ASC 350, goodwill and intangible assets with an indefinite life are not subject to amortization but are tested for impairment at least annually or more frequently if indicators of impairment warrant. ASC 350 defines impairment as the condition that exists when the carrying amount of goodwill exceeds its implied fair value. The provisions of ASC 350 require that an entity assign its recorded goodwill to each of its reporting units and test each reporting unit's goodwill for impairment. We have determined that we have two reporting units: the Acute Care and the Non-Acute Care segments.
In accordance with ASC 350, we have the option, in any period, to first assess qualitative factors to determine whether it is more likely than not (that is, a likelihood of more than 50%) that the fair value of a reporting unit is less than its carrying amount, including goodwill, or bypass this qualitative assessment and proceed directly to performing the two-step goodwill impairment test. The first step ("step 1") involves comparing each reporting unit's estimated fair value to its carrying value, including goodwill, to identify potential impairment. If the estimated fair value of a reporting unit exceeds its carrying value, there is no indication of impairment and no further test is required. If the carrying value exceeds estimated fair value, there is an indication of potential impairment and the second step is required to be performed to measure the amount of impairment.
In the fourth quarter of 2013, we elected to perform step 1 to determine whether it is more likely than not that the fair values of our reporting units are less than their carrying amounts. While the ultimate responsibility rests with management, we engaged the services of an independent, third-party valuation specialist to assist in determining the fair values of our reporting units. We used a combination of a discounted cash flow model (“DCF”) which utilizes the present value of cash flows to estimate fair value (also known as the income approach) and comparisons to publicly traded companies’ market multiples (also known as the market approach).
Under the DCF model, the future cash flows for our reporting units were projected based on management’s projections, at that time, of future revenues, operating income and other factors such as working capital and capital expenditures. We also took into account market factors and industry conditions affecting our business. We used significant judgment to estimate the amount and timing of future cash flows from our reporting units and the relative risk of achieving those cash flows. Forecasts of future operations require management to make assumptions and are based, in part, on operating results and our expectations as to future market conditions. The discount rate used in our DCF model was based on a weighted-average cost of capital determined from relevant market comparisons and adjusted for specific reporting unit risks (primarily the risk of achieving projected operating cash flows). A terminal value growth rate was applied to the final year of the respective cash flows for both reporting units to arrive at estimates of fair value under the income approach. The estimated fair values of our reporting units determined under the income approach exceeded their carrying values.
We used the market approach to corroborate the values estimated under the income approach. Under the market approach, we estimated the fair values of our reporting units based on financial information on companies that we deemed were comparable to our business. We made judgments about the comparability of publicly traded companies engaged in similar businesses. We based our judgments on factors such as size, growth rates, profitability, and risk. Based on publicly available information, we calculated the comparable companies’ market multiples of earnings before interest, taxes, depreciation and amortization, and stock option expense and factored in a control premium. The estimated fair values of our reporting units determined under the market approach exceeded their carrying values.
Finally, we compared the estimated fair values of our reporting units to our September 30, 2013 total public market capitalization and assessed implied control premiums. Based on the aforementioned, we concluded that the estimated fair value determined for both our reporting units was reasonable. In each case, the estimated fair values of our reporting units exceeded their respective carrying values and, as such, we concluded that goodwill assigned to our Acute Care and Non-Acute Care segments was not impaired. In addition, we did not note any indications of goodwill impairment as of December 31, 2013.
39
In 2012, we opted to perform a qualitative assessment of factors to determine if goodwill had been impaired as of December 31, 2012. For both the Acute Care and Non-Acute Care segments, we considered the following qualitative factors:
|
•
|
Macroeconomic conditions such as general economic conditions, limitations on accessing capital, fluctuations in foreign exchange rates or other developments in equity and credit markets;
|
|
•
|
Industry and market considerations such as changes in the environment in which we operate, an increased competitive environment, a decline in market-dependent multiples or metrics (consider in both absolute terms and relative to peers), a change in the market for our products or services, or a regulatory or political development;
|
|
•
|
Cost factors such as increases in raw materials, labor, or other costs that have a negative effect on earnings and cash flows;
|
|
•
|
Overall financial performance such as negative or declining cash flows or a decline in actual or planned revenue or earnings compared with actual and projected results of relevant prior periods;
|
|
•
|
Other relevant entity-specific events such as changes in management, key personnel, strategy, or customers; contemplation of bankruptcy or litigation; and
|
|
•
|
Events affecting a reporting unit such as a change in the composition or carrying amount of its net assets, a more-likely-than-not expectation of selling or disposing all, or a portion, of a reporting unit, the testing for recoverability of a significant asset group within a reporting unit or recognition of a goodwill impairment loss in the financial statements of a subsidiary that is a component of a reporting unit.
|
Upon completion of our qualitative assessment conducted in the fourth quarter of 2012, we concluded that it was more likely than not that the fair values of both the Acute Care and Non-Acute Care segments exceeded their carrying values including the respective amounts of goodwill. In addition, management did not note any other indicators of goodwill impairment as of December 31, 2012.
We continually monitor events and changes in circumstances that could indicate carrying amounts of long-lived assets may not be recoverable. We review long-lived assets and certain purchased intangibles for impairment whenever events or changes in circumstances indicate that we will not be able to recover the asset's carrying amount. Recoverability of an asset is measured by comparing its carrying amount to the expected future undiscounted cash flows expected to result from the use and eventual disposition of that asset, excluding future interest costs that would be recognized as an expense when incurred. Any impairment to be recognized is measured by the amount by which the carrying amount of the asset exceeds its fair market value. Significant management judgment is required in:
|
•
|
identifying a triggering event that arises from a change in circumstances;
|
|
•
|
forecasting future operating results; and
|
|
•
|
estimating the proceeds from the disposition of long-lived or intangible assets.
|
In future periods, material impairment charges could be necessary should different conditions prevail or different judgments be made.
Significant management judgment is also required for initial recognition and measurement of goodwill and other intangibles assets resulting from business combinations pursuant ASC 805,
Business Combinations
. Management must assess the extent to which identified other intangibles assets are properly includable (and with the appropriate fair value) or properly excludable, by applying the recognition criteria. This judgment affects not only the other intangible assets but the remainder calculation of goodwill. The assessment of useful life for each acquired intangible asset impacts future financial position and operating performance through amortization expense.
Inventory.
Inventories are stated at the lower of cost (utilizing standard costs), applying the first-in, first-out method, or market. We routinely assess our on-hand inventory for timely identification and measurement of obsolete, slow-moving or otherwise impaired inventory. We write down inventory for estimated obsolescence, excess or unmarketable quantities equal to the difference between the cost of the inventory and its estimated market value based on assumptions about future demand and market conditions. If actual future demand or market conditions are less favorable than we projected, additional inventory write-downs may be required.
Valuation of share-based awards.
We account for share-based compensation in accordance with ASC 718,
Stock Compensation
. We estimate the fair value of our employee stock awards at the date of grant using certain subjective assumptions, such as expected volatility, which is based on a combination of historical and market-based implied volatility, and the expected term of the awards, which is based on our historical experience of employee stock option exercises, including
40
forfeitures. The valuation assumptions we use in estimating the fair value of employee share-based awards may change in future periods. We recognize the fair value of awards over their vesting period or requisite service period. In addition, we calculate our pool of excess tax benefits available within additional paid-in capital in accordance with the provisions of ASC 718.
Accounting for income taxes.
We record an income tax provision for the anticipated tax consequences of the reported results of operations. In accordance with GAAP, the provision for income taxes is computed using the asset and liability method, which requires the recognition of deferred tax assets and liabilities for the expected future tax consequences of events that have been included in the financial statements. Under this method, deferred tax assets and liabilities are determined on the basis of the differences between the financial statement and tax bases of assets and liabilities, and for operating losses and tax credit carry forwards. Deferred tax assets and liabilities are measured using the enacted tax rates in effect for the periods in which those tax assets and liabilities are expected to be realized or settled. In the event that these tax rates change, we will incur a benefit or detriment on our income tax expense in the period of change. If we were to determine that all or part of the net deferred tax assets are not realizable in the future, we will record a valuation allowance that would be charged to earnings in the period such determination is made.
In accordance with ASC 740,
Income Taxes
, we recognize the tax benefit from an uncertain tax position if it is more likely than not that the tax position will be sustained on examination by the taxing authorities, based on the technical merits of the position. The tax benefits recognized in the financial statements from such positions are then measured based on the largest benefit that has a greater than 50% likelihood of being realized upon ultimate settlement. The calculation of tax liabilities involves significant judgment in estimating the impact of uncertainties in the application of GAAP and complex tax laws. Resolution of these uncertainties in a manner inconsistent with management's expectations could have a material impact on our financial condition and operating results.
Recently Adopted Accounting Standards
In February 2013, the FASB issued ASU 2013-02,
Comprehensive Income (Topic 220): Reporting of Amounts Reclassified Out of Accumulated Other Comprehensive Income ("AOCI"),
which aims to improve the reporting of reclassifications out of AOCI. This update requires an entity to report the effect of significant reclassifications out of AOCI on the respective line items in net income if the amount being reclassified is required under GAAP to be reclassified in its entirety to net income. For other amounts that are not required under GAAP to be reclassified in their entirety to net income in the same reporting period, an entity is required to cross-reference other disclosures required under GAAP that provide additional detail about those amounts. The amendments do not change the current requirements for reporting net income or other comprehensive income in financial statements. We adopted this guidance in the first quarter of 2013, without any impact to our financial position, operating results or cash flows.
Recently Issued Accounting Standards
In July 2013, the FASB issued ASU 2013-11,
Income Taxes (Topic 740): Presentation of an Unrecognized Tax Benefit When a Net Operating Loss Carryforward, a Similar Tax Loss, or a Tax Credit Carryforward Exists.
ASU 2013-11 requires an entity to present an unrecognized tax benefit, or a portion of an unrecognized tax benefit, as a reduction to a deferred tax asset for a net operating loss carryforward, a similar tax loss, or a tax credit carryforward, except as follows: to the extent a net operating loss carryforward, a similar tax loss, or a tax credit carryforward is not available at the reporting date under the tax law of the applicable jurisdiction to settle any additional income taxes that would result from the disallowance of a tax position or the tax law of the applicable jurisdiction does not require the entity to use, and the entity does not intend to use, the deferred tax asset for such purpose, the unrecognized tax benefit should be presented in the financial statements as a liability and should not be combined with deferred tax assets. We will adopt the amendments in ASU 2013-11 in the first quarter of 2014, and do not expect the adoption to have a material impact on our financial position, operating results or cash flows.
41
Results of Operations
|
Years Ended December 31,
|
||||||||||||||||||||
|
2013
|
% of Revenue
|
2012
|
% of Revenue
|
2011
|
% of Revenue
|
|||||||||||||||
|
(in thousands, except percentages)
|
||||||||||||||||||||
|
Revenues:
|
||||||||||||||||||||
|
Product revenues
|
$
|
307,189
|
|
80.7
|
%
|
$
|
247,654
|
|
78.9
|
%
|
$
|
185,864
|
|
75.7
|
%
|
|||||
|
Service and other revenues
|
73,396
|
|
19.3
|
%
|
66,373
|
|
21.1
|
%
|
59,671
|
|
24.3
|
%
|
||||||||
|
Total revenues
|
380,585
|
|
100.0
|
%
|
314,027
|
|
100.0
|
%
|
245,535
|
|
100.0
|
%
|
||||||||
|
Cost of revenues:
|
|
|
|
|
|
|||||||||||||||
|
Cost of product revenues
|
144,997
|
|
38.1
|
%
|
112,369
|
|
35.8
|
%
|
79,567
|
|
32.4
|
%
|
||||||||
|
Cost of service and other revenues
|
32,189
|
|
8.5
|
%
|
31,070
|
|
9.9
|
%
|
30,184
|
|
12.3
|
%
|
||||||||
|
Total cost of revenues
|
177,186
|
|
46.6
|
%
|
143,439
|
|
45.7
|
%
|
109,751
|
|
44.7
|
%
|
||||||||
|
Gross profit
|
203,399
|
|
53.4
|
%
|
170,588
|
|
54.3
|
%
|
135,784
|
|
55.3
|
%
|
||||||||
|
Operating expenses:
|
|
|
|
|
|
|||||||||||||||
|
Research and development
|
29,105
|
|
7.6
|
%
|
23,726
|
|
7.6
|
%
|
22,042
|
|
9.0
|
%
|
||||||||
|
Selling, general and administrative
|
138,995
|
|
36.5
|
%
|
119,736
|
|
38.1
|
%
|
97,520
|
|
39.7
|
%
|
||||||||
|
Income from operations
|
35,299
|
|
9.3
|
%
|
27,126
|
|
8.6
|
%
|
16,222
|
|
6.6
|
%
|
||||||||
|
Interest and other income (expense), net
|
(270
|
)
|
(0.1
|
)%
|
(51
|
)
|
—
|
%
|
(133
|
)
|
(0.1
|
)%
|
||||||||
|
Income before provision for income taxes
|
35,029
|
|
9.2
|
%
|
27,075
|
|
8.6
|
%
|
16,089
|
|
6.6
|
%
|
||||||||
|
Provision for income taxes
|
11,050
|
|
2.9
|
%
|
10,897
|
|
3.5
|
%
|
5,700
|
|
2.3
|
%
|
||||||||
|
Net income
|
$
|
23,979
|
|
6.3
|
%
|
$
|
16,178
|
|
5.2
|
%
|
$
|
10,389
|
|
4.2
|
%
|
|||||
The consolidated operating results presented above include the operating results of MTS since May 21, 2012, the date of acquisition, and are included as part of the Non-Acute Care segment.
Product Revenues, Cost of Product Revenues and Gross Profit
The table below shows our product revenues, cost of product revenues and gross profit
for the years ended December 31, 2013, 2012 and 2011
and the change between those years (in thousands, except percentages):
|
Years Ended December 31,
|
2013 to 2012
|
2012 to 2011
|
|||||||||||||||||||||||
|
Change in
|
Change in
|
||||||||||||||||||||||||
|
2013
|
2012
|
2011
|
$
|
%
|
$
|
%
|
|||||||||||||||||||
|
Product revenues
|
$
|
307,189
|
|
$
|
247,654
|
|
$
|
185,864
|
|
$
|
59.5
|
|
24.0
|
%
|
$
|
61.8
|
|
33.2
|
%
|
||||||
|
Cost of product revenues
|
144,997
|
|
112,369
|
|
79,567
|
|
32.6
|
|
29.0
|
%
|
32.8
|
|
41.2
|
%
|
|||||||||||
|
Gross profit
|
$
|
162,192
|
|
$
|
135,285
|
|
$
|
106,297
|
|
$
|
26.9
|
|
19.9
|
%
|
$
|
29.0
|
|
27.3
|
%
|
||||||
2013 compared to 2012
Product revenues
.
The overall increase in product revenues was primarily driven by a full twelve month contribution of MTS activities as a part of our Non-Acute Care segment, which contributed
$91.0 million
during the period. This compared
42
to
$50.3 million
in the same twelve month period in 2012 in which we owned MTS only after May 21, 2012. Our Acute Care segment contributed
$216.2 million
in product revenues in 2013 compared to
$197.4 million
in 2012. The growth in our Acute-Care segment was driven by increased customer receptivity to our products due to product differentiation and entrance into new markets.
We anticipate our revenues will continue to increase in 2014 compared to the same periods in 2013, as we fulfill our existing orders. Our ability to continue to grow revenue is dependent on our ability to continue to obtain orders from customers, our ability to produce quality consumables to fulfill customer demand, the volume of installations we are able to complete and our ability to meet customer needs by providing a quality installation experience and our flexibility in manpower allocations among customers to complete installations on a timely basis. The timing of our product revenues for equipment is primarily dependent on when our customers’ schedules allow for installations.
Cost of product revenues.
The increase in cost of product revenues was primarily a result of a full year of Non-Acute Care product costs of
$52.0 million
as compared to
$30.6 million
in the same period a year ago. Our Acute Care product cost increased by
$11.2 million
primarily driven by increased revenues and unfavorable changes in product mix.
Gross profit.
The increase in gross profit on product revenue was primarily a result of the contribution from our Non-Acute Care segment described above, as well as increased gross profits in our Acute Care segment, driven primarily by increased customer installations as a result of increased customer acceptance of our product differentiation . Gross profit as a percentage of product revenues decreased to
52.8%
in 2013 as compared to
54.6%
in 2012. The decrease in gross profit as a percentage of product revenue was primarily due to the increased mix of Non-Acute Care segment, which carries a lower gross profit as a percentage of revenue, for the entire year of 2013 versus a portion of 2012.
For 2014, we do not anticipate any significant fluctuations in our gross profit and gross profit as a percentage of revenue beyond normal fluctuations caused by changes in product mix.
2012 compared to 2011
Product revenues.
The overall increase in product revenues was driven by revenue derived from MTS subsequent to its acquisition by Omnicell during the second quarter of 2012 and by the increased installations of automation products, including customer product upgrades using our G4 platform.
Cost of product revenues.
The increase in cost of product revenues was primarily a result of Non-Acute Care product costs of $30.6 million, which included $1.7 million of acquisition-related charges primarily associated with the step-up to the estimated fair value of inventory acquired from MTS and consumed in the normal manufacturing cycle of our business. The increase in Acute Care product revenue and favorable change in product mix resulted in a modest increase of $2.2 million in costs.
Gross profit.
The increase in gross profit on product revenue was primarily a result of the contribution from our Non-Acute Care segment described above, as well as increased gross profits in our Acute Care segment, which was driven by revenue growth and by favorable product mix. In addition, gross profit as a percentage of product revenues decreased to
54.6%
in 2012 as compared to
57.2%
in 2011. The decrease in gross profit as a percentage of product revenue was due to the addition of lower Non-Acute Care segment gross profit as a percent of revenue following the acquisition of MTS, which drove the overall gross profit as a percentage of revenue down. The Non-Acute Care segment information was immaterial in the periods ended December 31, 2011 and, accordingly, has not been discussed separately.
Service and Other Revenues, Cost of Service and Other Revenues and Gross Profit
Service and other revenues include revenues from service and maintenance contracts and rentals of automation systems. The table below shows our service and other revenues, cost of service and other revenues and gross profit
for the years ended December 31, 2013, 2012 and 2011
and the change between those years (in thousands, except percentages):
|
Years Ended December 31,
|
2013 to 2012
|
2012 to 2011
|
|||||||||||||||||||||||
|
Change in
|
Change in
|
||||||||||||||||||||||||
|
2013
|
2012
|
2011
|
$
|
%
|
$
|
%
|
|||||||||||||||||||
|
Service and other revenues
|
$
|
73,396
|
|
$
|
66,373
|
|
$
|
59,671
|
|
$
|
7.0
|
|
10.6
|
%
|
$
|
6.7
|
|
11.2
|
%
|
||||||
|
Cost of service and other revenues
|
32,189
|
|
31,070
|
|
30,184
|
|
1.1
|
|
3.6
|
%
|
0.9
|
|
2.9
|
%
|
|||||||||||
|
Gross profit
|
$
|
41,207
|
|
$
|
35,303
|
|
$
|
29,487
|
|
$
|
5.9
|
|
16.7
|
%
|
$
|
5.8
|
|
19.7
|
%
|
||||||
43
2013 compared to 2012
Service and other revenues.
The increase in service and other revenues was primarily the result of an expansion in our installed base of automation systems and a resulting increase in the number of support service contracts, as well as a
$1.3 million
increase attributable to the Non-Acute segment. Our Non-Acute Care segment contributed
$4.9 million
to services and other revenues in 2013 compared to
$3.6 million
in 2012 driven by services for MTS branded products after the acquisition of MTS in 2012. Our Acute Care segment contributed
$68.5 million
in service and other revenues in 2013 compared to
$62.8 million
in 2012.
Cost of service and other revenues.
The increase in cost of service and other revenues was primarily a result of the aforementioned addition of our Non-Acute Care segment of
$2.3 million
, which increased
$1.1 million
due to twelve full months of costs. The Acute Care segment service costs stayed flat as compared to 2012.
Gross profit.
The increase in gross profit and gross margin percentage on service and other revenues was due to increased revenues from an expanded installed base attributable to our Acute Care segment with nominal growth in service costs as a result of service cost reduction efforts throughout 2013.
We expect our service and other revenues and the associated costs to continue to increase in 2014 with the continued expansion of our installed base of automation systems and service and maintenance contracts.
2012 compared to 2011
Service and other revenues.
The increase in service and other revenues was primarily the result of an expansion in our installed base of automation systems and a resulting increase in the number of support service contracts and, in addition, a $1.9 million increase attributable to the Non-Acute segment.
Cost of service and other revenues.
The increase in cost of service and other revenues were primarily a result of the aforementioned addition of our Non-Acute Care segment of $1.2 million, offset by a $0.3 million decrease in the Acute Care segment service costs due to lower costs incurred related to advance replacement of material covered under maintenance contracts.
Gross profit.
The increase in gross profit on service and other revenues was due to increased revenues from an expanded installed base attributable to our Acute Care segment with nominal growth in service costs as a result of service cost reduction efforts throughout 2012.
The Non-Acute Care segment information was immaterial in the periods ended December 31, 2011 and, accordingly, has not been discussed separately.
Operating Expenses
The table below shows our operating expenses
for the years ended December 31, 2013, 2012 and 2011
and the change between those years (in thousands, except percentages):
|
|
Years Ended December 31,
|
2013 to 2012
|
2012 to 2011
|
||||||||||||||||||||||
|
|
Change in
|
Change in
|
|||||||||||||||||||||||
|
|
2013
|
2012
|
2011
|
$
|
%
|
$
|
%
|
||||||||||||||||||
|
Research and development
|
$
|
29,105
|
|
$
|
23,726
|
|
$
|
22,042
|
|
$
|
5.4
|
|
22.7
|
%
|
$
|
1.7
|
|
7.6
|
%
|
||||||
|
Selling, general and administrative
|
138,995
|
|
119,736
|
|
97,520
|
|
19.3
|
|
16.1
|
%
|
22.2
|
|
22.8
|
%
|
|||||||||||
|
Total operating expenses
|
$
|
168,100
|
|
$
|
143,462
|
|
$
|
119,562
|
|
$
|
24.6
|
|
17.2
|
%
|
$
|
23.9
|
|
20.0
|
%
|
||||||
2013 compared to 2012
Research and development.
Research and development expenses represented
7.6%
of total revenues for both years 2013 and 2012. The overall increase in research and development expense reflects an increase of
$6.0 million
mainly attributable to the Non-Acute Care segment and includes a
$1.8 million
write-off of previously capitalized software development costs, discussed further in Note 18, "Asset Impairment" of the Notes to Consolidated Financial Statements included in this Annual Report on Form 10-K, a
$0.3 million
charge related to a management reorganization within the Non-Acute Care segment in the first quarter of 2013, and the inclusion of MTS headcount, consulting and other related activities for a full twelve months in the 2013 period as compared with the prior period. Research and development expenses attributable to the Acute Care segment were relatively flat as compared with the year-ago period.
44
We expect research and development expenses to increase in 2014 as we continue to invest in new products and services, but stay relatively flat as a percentage of revenues. The amount of research and development expenses can fluctuate based on the amount of prototype expenses for hardware and/or the amount of capitalized software development costs in any given quarter.
Selling, general and administrative.
Selling, general and administrative expenses represented
36.5%
and
38.1%
of total revenues in 2013 and 2012, respectively. The increase in selling, general and administrative expenses was primarily due to an increase in the Non-Acute Care selling, general and administrative expenses of
$14.3 million
representing the overall expenses incurred due to the inclusion of MTS activities for a full twelve months in 2013 as compared with 2012. 2013 also includes higher expenses associated with medication dispensing cabinet sales to Non-Acute Care customers. The Acute Care segment increase of
$5.0 million
was primarily due to
$5.0 million
in headcount-related expenses including higher commissions as a result of higher revenues,
$2.9 million
in facility and depreciation expenses for our new corporate headquarters and manufacturing buildings occupied in late 2012,
$1.8 million
increase in consulting and professional fees,
$0.6 million
in travel, entertainment, promotional, office and trade show related expenses,
$0.4 million
in GPO fees associated with higher collections and sales volume for GPO-affiliated customers, partially offset by a decrease of $2.3 million of costs associated with the acquisition of MTS in 2012 that did not repeat in 2013 and a decrease of
$3.7 million
in allocations due to higher corporate allocation to the Non-Acute segment noted above.
We anticipate selling, general and administrative expenses as a percent of revenues to be stable for the full year of 2014, but this estimate could be impacted by ongoing business development activities and external, macro-economic factors.
2012 compared to 2011
Research and development.
Research and development expenses represented
7.6%
and
9.0%
of total revenues in 2012 and 2011, respectively.
The overall increase in research and development expenses was due to an increase of $1.8 million attributable to the Non-Acute Care segment since the acquisition of MTS in the second quarter of 2012, partially offset by an overall decrease of $0.1 million attributable to the Acute Care segment.
Selling, general and administrative.
Selling, general and administrative expenses represented
38.1%
and
39.7%
of total revenues in 2012 and 2011, respectively.
This increase in selling, general and administrative expenses was primarily due to the addition of Non-Acute Care selling, general and administrative expenses of $13.2 million since the acquisition of MTS in the second quarter of 2012. Increases in Acute Care segment selling, general and administrative expenses were primarily due to a $7.5 million increase in costs associated with compensation and related benefits, $2.3 million in transaction and integration expenses related to the acquisition of MTS, $1.6 million in facility expenses due the relocation to our new buildings late in 2012 and an increase of $1.2 million in bad debt expense primarily related to a $0.6 million recovery in 2011 as compared to a $0.6 million expense in 2012. These increases were partially offset by a $1.4 million decrease in third party consulting expenses and a $1.0 million decrease in legal expenses primarily related to the settlement of litigation in 2011.
The Non-Acute Care segment information was immaterial in the periods ended December 31, 2011 and, accordingly, has not been discussed separately.
Interest and other income (expense), net
The table below shows our interest income and other expense
for the years ended December 31, 2013, 2012 and 2011
and the change between those years (in thousands, except percentages):
|
|
Years Ended December 31,
|
2013 to 2012
|
2012 to 2011
|
||||||||||||||||||||||
|
|
Change in
|
Change in
|
|||||||||||||||||||||||
|
|
2013
|
2012
|
2011
|
$
|
%
|
$
|
%
|
||||||||||||||||||
|
Interest income
|
$
|
30
|
|
$
|
77
|
|
$
|
266
|
|
$
|
(47.0
|
)
|
(61.0
|
)%
|
$
|
(189.0
|
)
|
(71.1
|
)%
|
||||||
|
Interest expense
|
(122
|
)
|
(29
|
)
|
(62
|
)
|
93.0
|
|
320.7
|
%
|
33.0
|
|
(53.2
|
)%
|
|||||||||||
|
Other income (expense)
|
(178
|
)
|
(99
|
)
|
(337
|
)
|
79.0
|
|
79.8
|
%
|
(238.0
|
)
|
(70.6
|
)%
|
|||||||||||
|
Interest and other income (expense), net
|
$
|
(270
|
)
|
$
|
(51
|
)
|
$
|
(133
|
)
|
$
|
219.0
|
|
429.4
|
%
|
$
|
82.0
|
|
(61.7
|
)%
|
||||||
45
2013 compared to 2012
Other income (expense) increased in 2013 primarily due to unfavorable effects of exchange rate fluctuations in 2013 between the Canadian and U.S. dollar as compared to a lesser impact in 2012.
2012 compared to 2011
Cash, cash equivalents and short-term investments decreased by $
137.6 million
during 2012, primarily due to our acquisition of MTS. This and the continued reduction in interest rates resulted in a
71.1%
decline in interest income earned compared to 2011.
Other income (expense) decreased in 2012 primarily due to unfavorable effects of exchange rate in 2011 between Indian rupees and U.S. dollars as compared to an immaterial impact in 2012.
Income Taxes
The table below shows the provision for income taxes for the years ended December 31, 2013, 2012 and 2011 and the changes between those years (in thousands, except percentages).
|
Years Ended December 31,
|
2013 to 2012
|
2012 to 2011
|
|||||||||||||||||||||||
|
|
Change in
|
Change in
|
|||||||||||||||||||||||
|
|
2013
|
2012
|
2011
|
$
|
%
|
$
|
%
|
||||||||||||||||||
|
Provision for income taxes
|
$
|
11,050
|
|
$
|
10,897
|
|
$
|
5,700
|
|
$
|
153
|
|
1.4
|
%
|
$
|
5,197
|
|
91.2
|
%
|
||||||
We recorded a provision for income taxes of approximately
$11.1 million
and an effective tax rate of
31.6%
for the year ended December 31, 2013
compared to
$10.9 million
and an effective tax rate of
40.3%
for the year ended December 31, 2012
. The
2013
annual tax rate differed from the statutory tax rate of
35%
primarily due to the favorable impact of the Section 199 domestic production activity deduction, as well as the reinstatement of the federal research credit in January 2013, retroactive to 2012. The decrease in the annual effective tax rate as compared to 2012 was primarily due to the aforementioned reinstatement of the federal research credit, a favorable mix in our domestic sales which decreased state apportionment factors in certain states, and the absence of non-deductible acquisition costs in 2013 that were incurred in 2012 as a result of the MTS acquisition.
We recorded a provision for income taxes of approximately
$10.9 million
and an effective tax rate of
40.3%
for the year ended December 31, 2012 compared to $5.7 million and an effective tax rate of 35.4% for the year ended December 31, 2011. The increase in the annual effective tax rate as compared to 2011 was primarily due to the expiration of the federal research and development credit after 2011 and non-deductible acquisition costs and equity charges, partially offset by an increase in the domestic production activity deduction.
Refer to Note 14, Income Taxes, of the Notes to Consolidated Financial Statements included in this Annual Report on Form 10-K for a discussion of factors affecting our ability to realize deferred tax assets.
Liquidity and Capital Resources
Cash Flows
The table below shows our cash flows
for the years ended December 31, 2013, 2012 and 2011
:
|
Years Ended December 31,
|
|||||||||||
|
2013
|
2012
|
2011
|
|||||||||
|
(in thousands)
|
|||||||||||
|
Net cash provided by operating activities
|
$
|
55,263
|
|
$
|
39,484
|
|
$
|
31,243
|
|
||
|
Net cash used in investing activities
|
(20,452
|
)
|
(168,711
|
)
|
(13,066
|
)
|
|||||
|
Net cash provided by (used in) financing activities
|
7,374
|
|
(232
|
)
|
(1,840
|
)
|
|||||
|
Effect of exchange rate changes on cash and cash equivalents
|
33
|
|
10
|
|
(210
|
)
|
|||||
|
Net increase (decrease) in cash and cash equivalents
|
$
|
42,218
|
|
$
|
(129,449
|
)
|
$
|
16,127
|
|
||
46
2013 compared to 2012
Net cash provided by operating activities.
Net cash provided by operating activities increased by
$15.8 million
in 2013 as compared to 2012. The major drivers increasing operating cash flow were an increase of
$7.8 million
in net income, a decrease of
$5.9 million
in sales-type leases, a decrease of
$5.7 million
in accounts receivable as a result of collection efforts, an increase of
$5.0 million
in non-cash expenses for depreciation and amortization primarily due to our new corporate headquarters and manufacturing site, and a decrease of
$4.5 million
in other assets. Partially offsetting these increases in sources of operating cash flows were an increase of
$7.9 million
in inventories, and a decrease of
$7.4 million
in deferred gross profit.
Net cash used in investing activities.
Net cash used in investing activities decreased by
$148.3 million
in 2013 as compared to 2012, primarily due to a decrease in acquisition activity in 2013.
Net cash provided by financing activities.
Net cash provided by financing activities represented an increase in cash of
$7.6 million
in 2013 as compared to 2012. The increase was primarily driven by an increase of
$15.7 million
in cash provided from shares issued under employee stock option exercises and stock purchase plans which was partially offset by an increase of
$8.6 million
cash used in stock repurchases.
2012 compared to 2011
Net cash provided by operating activities.
Net cash provided by operating activities increased by
$8.2 million
in 2012 to
$39.5 million
from
$31.2 million
in 2011. The major drivers increasing operating cash flow were
$5.8 million
higher net income and a reduction of inventory of
$12.0 million
, as well as increases in accrued compensation of
$4.7 million
, deferred gross profit of
$4.1 million
and accounts payable of
$4.0 million
, between 2012 and 2011. Partially offsetting these increases in sources of operating cash flows were a net increase of
$6.4 million
in prepaid expenses and the increase of
$5.2 million
in sales type leases.
Net cash used in investing activities.
Net cash used in investing activities increased by
$155.6 million
in 2012 to
$168.7 million
from
$13.1 million
in 2011. This increase was primarily driven by $158.3 million of cash paid to complete the 2012 acquisition of MTS in the second quarter of 2012.
Net cash used in financing activities.
Net cash used in financing activities decreased by
$1.6 million
in 2012 to
$0.2 million
net cash used compared to net cash used by financing activities of
$1.8 million
in 2011. Stock repurchases decreased by
$0.2 million
to
$12.4 million
in 2012 from
$12.6 million
in 2011. In 2012 cash generated from shares issued under stock option and employee stock purchase plans increased by
$2.2 million
to
$8.9 million
from
$6.8 million
in 2011, offset by a decrease of $0.7 million in excess tax benefits from employee stock plans to
$3.2 million
in 2012 from
$3.9 million
in 2011.
Liquidity
Our future uses of cash are expected to be primarily for working capital, capital expenditures and other contractual obligations. We also expect a continued use of cash for potential acquisition and acquisition assessment activities.
As described in Note 15, Stockholders' Equity, of the Notes to Consolidated Financial Statements included in this Annual Report on Form 10-K, on
December 31, 2013
, we had
$29.0 million
of remaining authorized funds to repurchase shares of our common stock under our stock repurchase program, which may, in the future, result in additional use of cash. We had cash and cash equivalents of
$104.5 million
at
December 31, 2013
as compared to
$62.3 million
at
December 31, 2012
. As of
December 31, 2013
and 2012, we had no short-term investments.
In September 2013, we entered into a Credit Agreement with Wells Fargo Bank, National Association, as administrative agent, and the lenders from time to time which provides for a
$75.0 million
revolving credit facility to be used for general corporate purposes, including future acquisitions. The Credit Agreement permits us to request one or more increases in the aggregate commitment provided such increases do not exceed
$25.0 million
in the aggregate. The Credit Agreement contains customary affirmative and negative covenants, and financial covenants that require us to, among other things, maintain a maximum consolidated total leverage ratio and a minimum consolidated fixed charge coverage ratio, in each case, as of the last day of each fiscal quarter. We were in full compliance with all covenants at
December 31, 2013
. For additional details, please refer to Note 17, Credit Agreement, of the Notes to Consolidated Financial Statements included in this Annual Report on Form 10-K.
Based on our current business plan and revenue backlog, we believe that our existing cash, cash equivalents, our anticipated cash flows from operations, cash generated from the exercise of employee stock options and purchases under our employee stock purchase plan, along with the availability of funds under our
$75.0 million
Credit Agreement, will be sufficient to meet our cash needs for working capital, capital expenditures, potential acquisitions, and other contractual obligations for at
47
least the next twelve months. For periods beyond the next twelve months, we also anticipate that our net operating cash flows plus existing balances of cash, and cash equivalents will suffice to fund the continued growth of our business.
Off-Balance Sheet Arrangements
As of
December 31, 2013
, we had no off-balance sheet arrangements as defined under Regulation S-K 303(a)(4) of the Securities Exchange Act of 1934, as amended, and the instructions thereto.
Contractual Obligations
As of
December 31, 2013
, we had
$49.2 million
in contractual commitments to third parties for non-cancelable operating leases, commitments to contract manufacturers and suppliers and other purchase commitments. See Note 12, "Commitments," to the Consolidated Financial Statements included in this Annual Report on Form 10-K for further information with respect to these commitments.
The following table summarizes our contractual obligations at
December 31, 2013
(in thousands):
|
Total
|
Less than
one year
|
One to
three years
|
Three to
five years
|
More than
five years
|
|||||||||||||||
|
Operating leases(1)(2)
|
$
|
41,779
|
|
$
|
5,787
|
|
$
|
10,625
|
|
$
|
8,765
|
|
$
|
16,602
|
|
||||
|
Commitments to contract manufacturers and suppliers(3)
|
7,382
|
|
7,382
|
|
—
|
|
—
|
|
—
|
|
|||||||||
|
Total(4)
|
$
|
49,161
|
|
$
|
13,169
|
|
$
|
10,625
|
|
$
|
8,765
|
|
$
|
16,602
|
|
||||
_______________________________________________________________________________
|
(1)
|
Commitments under operating leases relate primarily to leasehold property and office equipment. Rent expense was
$8.1 million
,
$5.7 million
and
$3.3 million
for the years ended December 31, 2013, 2012 and 2011
, respectively.
|
|
(2)
|
In
October 2011
, we entered into a lease agreement for approximately
100,000
square feet of office space. Pursuant to the lease agreement, the landlord has constructed a single, three-story building of rentable space in Mountain View, California which we now lease and which serves as our headquarters. The term of the lease agreement, which commenced in November 2012, is for a period of
10 years
, with a base lease commitment of approximately
$40.0 million
. We have two options to extend the term of the lease agreement at market rates. Each extension is for an additional 60 month term.
|
|
(3)
|
We purchase components from a variety of suppliers and use contract manufacturers to provide manufacturing services for our products. During the normal course of business, we issue purchase orders with estimates of our requirements several months ahead of the delivery dates.
|
|
(4)
|
At
December 31, 2013
, we have recorded
$5.0 million
for uncertain tax positions under long term liabilities, in accordance with U.S. GAAP, summarized under the section entitled "Critical Accounting Policies and Estimates" of this Annual Report on Form 10-K. As these liabilities do not reflect actual tax assessments, the timing and amount of payments we might be required to make will depend upon a number of factors. Accordingly, as the timing and amount of payment cannot be estimated, the
$5.0 million
of uncertain tax position liabilities has not been included in the contractual obligations table above.
|
48
We are only exposed to market risk from changes in interest rates to the extent our interest income might decrease.
As of
December 31, 2013
, we had
$104.5 million
of cash and cash equivalents. We invest our cash in cash investments with original or remaining maturities of three months or less and whose principal is not subject to market rate fluctuations. Accordingly, interest rate declines would adversely affect our interest income but would not affect the carrying value of our cash investments. The weighted interest rate for the fourth quarter of 2013 was less than 1.0%. Management considers this interest rate exposure to be immaterial.
The information required by this item is set forth beginning at page F-1 of this Annual Report on Form 10-K.
Not applicable.
Evaluation of Disclosure Controls and Procedures
Our management, with the participation of our principal executive officer and principal financial officer, evaluated the effectiveness of our disclosure controls and procedures (as such term is defined in Rules 13a-15(e) and 15d-15(e) under the Securities Exchange Act of 1934, as amended, or the Exchange Act) as of the end of the period covered by this Annual Report. These disclosure controls and procedures are designed to ensure that the information required to be disclosed by us in this Annual Report on Form 10-K was (i) recorded, processed, summarized and reported within the time periods specified in the SEC's rules and regulations and (ii) accumulated and communicated to our management, including our principal executive officer and principal financial officer, to allow timely decisions regarding required disclosure.
Based on such evaluation, our principal executive officer and principal financial officer have concluded that, as of
December 31, 2013
, our disclosure controls and procedures were effective at the reasonable assurance level.
Management's Report on Internal Control Over Financial Reporting
Our management is responsible for establishing and maintaining adequate internal control over financial reporting (as such term is defined in Rules 13a-15(f) and 15d-15(f) under the Exchange Act). Our internal control system is designed to provide reasonable assurance regarding the preparation and fair presentation of financial statements for external purposes in accordance with U.S. generally accepted accounting principles. All internal control systems, no matter how well designed, have inherent limitations and can provide only reasonable assurance that the objectives of the internal control system are met.
Under the supervision and with the participation of our management, including our principal executive officer and principal financial officer, we conducted an evaluation of the effectiveness of our internal control over financial reporting as of
December 31, 2013
using the criteria for effective internal control over financial reporting as described in "Internal Control—Integrated Framework," issued by the Committee of Sponsoring Organization of the Treadway Commission (1992 framework) (the COSO Criteria). Based on this assessment, management concluded that, as of
December 31, 2013
, our internal control over financial reporting was effective.
Our independent registered public accounting firm, Ernst & Young LLP, has issued its attestation report on our internal control over financial reporting. Their report follows this Item 9A in this Annual Report on Form 10-K.
Changes in Internal Control Over Financial Reporting
There have been no changes in our internal control over financial reporting (as such term is defined in Rules 13a-15(f) and 15d-15(f) under the Exchange Act) during the year ended
December 31, 2013
that have materially affected, or are reasonably likely to materially affect, our internal control over financial reporting.
Attestation Report of the Registered Public Accounting Firm
The report required by this item is set forth below:
49
REPORT OF INDEPENDENT REGISTERED PUBLIC ACCOUNTING FIRM
The Board of Directors and Stockholders of Omnicell, Inc.
We have audited Omnicell, Inc.'s internal control over financial reporting as of
December 31, 2013
, based on criteria established in Internal Control—Integrated Framework issued by the Committee of Sponsoring Organizations of the Treadway Commission (1992 framework) (the COSO Criteria). Omnicell, Inc.'s management is responsible for maintaining effective internal control over financial reporting, and for its assessment of the effectiveness of internal control over financial reporting included in the accompanying Management's Report on Internal Control Over Financial Reporting. Our responsibility is to express an opinion on the company's internal control over financial reporting based on our audit.
We conducted our audit in accordance with the standards of the Public Company Accounting Oversight Board (United States). Those standards require that we plan and perform the audit to obtain reasonable assurance about whether effective internal control over financial reporting was maintained in all material respects. Our audit included obtaining an understanding of internal control over financial reporting, assessing the risk that a material weakness exists, testing and evaluating the design and operating effectiveness of internal control based on the assessed risk, and performing such other procedures as we considered necessary in the circumstances. We believe that our audit provides a reasonable basis for our opinion.
A company's internal control over financial reporting is a process designed to provide reasonable assurance regarding the reliability of financial reporting and the preparation of financial statements for external purposes in accordance with generally accepted accounting principles. A company's internal control over financial reporting includes those policies and procedures that (1) pertain to the maintenance of records that, in reasonable detail, accurately and fairly reflect the transactions and dispositions of the assets of the company; (2) provide reasonable assurance that transactions are recorded as necessary to permit preparation of financial statements in accordance with generally accepted accounting principles, and that receipts and expenditures of the company are being made only in accordance with authorizations of management and directors of the company; and (3) provide reasonable assurance regarding prevention or timely detection of unauthorized acquisition, use or disposition of the company's assets that could have a material effect on the financial statements.
Because of its inherent limitations, internal control over financial reporting may not prevent or detect misstatements. Also, projections of any evaluation of effectiveness to future periods are subject to the risk that controls may become inadequate because of changes in conditions, or that the degree of compliance with the policies or procedures may deteriorate.
In our opinion, Omnicell Inc., maintained, in all material respects, effective internal control over financial reporting as of
December 31, 2013
, based on the COSO criteria.
We also have audited, in accordance with the standards of the Public Company Accounting Oversight Board (United States), the consolidated balance sheets of Omnicell, Inc. as of
December 31, 2013
and
2012
, and the related consolidated statements of operations, comprehensive income, stockholders' equity, and cash flows for each of the three years in the period ended
December 31, 2013
of Omnicell Inc., and our report dated
March 17, 2014
expressed an unqualified opinion thereon.
/s/ Ernst & Young LLP
San Jose, California
March 17, 2014
None.
Certain information required by Part III is omitted from this Annual Report on Form 10-K because the registrant will file with the U.S. Securities and Exchange Commission a definitive proxy statement pursuant to Regulation 14A in connection with the solicitation of proxies for the Company's Annual Meeting of Stockholders expected to be held in May 2014 (the "Proxy Statement") not later than 120 days after the end of the fiscal year covered by this Annual Report on Form 10-K, and certain information included therein is incorporated herein by reference.
50
The information required by this Item with respect to directors and executive officers may be found under the heading "Executive Officers of the Registrant" in Part I, Item 1 of this Annual Report on Form 10-K, and in the section entitled "Election of Directors" appearing in the Proxy Statement. Such information is incorporated herein by reference.
The information required by this Item with respect to our audit committee and audit committee financial expert may be found in the section entitled "Information Regarding the Board of Directors and Corporation Governance—Audit Committee" appearing in the Proxy Statement. Such information is incorporated herein by reference.
The information required by this Item with respect to compliance with Section 16(a) of the Securities Exchange Act of 1934 may be found in the sections entitled "Section 16(a) Beneficial Ownership Reporting Compliance" appearing in the Proxy Statement. Such information is incorporated herein by reference.
Our written Code of Conduct applies to all of our directors and employees, including executive officers, including without limitation our principal executive officer, principal financial officer, principal accounting officer or controller or persons performing similar functions. The Code of Conduct is available on our website at
www.omnicell.com
under the hyperlink titled "Corporate Governance." Changes to or waivers of the Code of Conduct will be disclosed on the same website. We intend to satisfy the disclosure requirement under Item 5.05 of Form 8-K regarding any amendment to, or waiver of, any provision of the Code of Conduct by disclosing such information on the same website.
The information required by this Item with respect to director and executive officer compensation is incorporated by reference to the section of our Proxy Statement under the section entitled "Executive Compensation—Compensation Discussion and Analysis."
The information required by this Item with respect to Compensation Committee interlocks and insider participation is incorporated herein by reference to the information from the Proxy Statement under the section entitled "Information Regarding the Board of Directors and Corporate Governance—Compensation Committee Interlocks and Insider Participation."
The information required by this Item with respect to our Compensation Committee's review and discussion of the Compensation Discussion and Analysis included in the Proxy Statement is incorporated herein by reference to the information from the Proxy Statement under the section entitled "Executive Compensation—Compensation Discussion and Analysis—Compensation Committee Report."
The information required by this Item with respect to security ownership of certain beneficial owners and management is incorporated herein by reference to the information from the Proxy Statement under the section entitled "Security Ownership of Certain Beneficial Owners and Management."
The information required by this Item with respect to securities authorized for issuance under our equity compensation plans is incorporated herein by reference to the information from the Proxy Statement under the section entitled "Equity Compensation Plan Information."
The information required by this Item with respect to related party transactions is incorporated herein by reference to the information from the Proxy Statement under the section entitled "Certain Relationships and Related Transactions."
The information required by this Item with respect to director independence is incorporated herein by reference to the information from the Proxy Statement under the section entitled "Information Regarding the Board of Directors and Corporate Governance—Independence of the Board of Directors."
The information required by this Item is incorporated herein by reference to the section from the Proxy Statement under the section entitled "Ratification of Selection of Independent Registered Public Accounting Firm—Principal Accountant Fees and Services."
51
(a)
The following documents are included as part of this Annual Report on Form 10-K:
(1)All financial statements.
|
Index to Financial Statements:
|
Page
|
|
The foregoing additional financial statement schedule should be considered in conjunction with our consolidated financial statements. All other schedules have been omitted because the required information is either not applicable or not sufficiently material to require submission of the schedule.
|
|
(2)
Exhibits required by Item 601 of Regulation S-K.
The information required by this item is set forth on the exhibit index which follows the signature page of this report.
52
REPORT OF INDEPENDENT REGISTERED PUBLIC ACCOUNTING FIRM
The Board of Directors and Stockholders of Omnicell, Inc.
We have audited the accompanying consolidated balance sheets of Omnicell, Inc. as of
December 31, 2013
and 2012, and the related consolidated statements of operations, comprehensive income, stockholders' equity, and cash flows for each of the three years in the period ended
December 31, 2013
. Our audits also included the financial statement schedule listed in the index at 15(a)(1). These financial statements and schedule are the responsibility of the Company's management. Our responsibility is to express an opinion on these financial statements and schedule based on our audits.
We conducted our audits in accordance with the standards of the Public Company Accounting Oversight Board (United States). Those standards require that we plan and perform the audit to obtain reasonable assurance about whether the financial statements are free of material misstatement. An audit includes examining, on a test basis, evidence supporting the amounts and disclosures in the financial statements. An audit also includes assessing the accounting principles used and significant estimates made by management, as well as evaluating the overall financial statement presentation. We believe that our audits provide a reasonable basis for our opinion.
In our opinion, the financial statements referred to above present fairly, in all material respects, the consolidated financial position of Omnicell, Inc. at
December 31, 2013
and 2012, and the consolidated results of its operations and its cash flows for each of the three years in the period ended December 31, 2013, in conformity with U.S. generally accepted accounting principles. Also, in our opinion, the related financial statement schedule, when considered in relation to the basic financial statements as a whole, presents fairly in all material respects the information set forth therein.
We also have audited, in accordance with the standards of the Public Company Accounting Oversight Board (United States), Omnicell, Inc.'s internal control over financial reporting as of
December 31, 2013
, based on criteria established in Internal Control—Integrated Framework issued by the Committee of Sponsoring Organizations of the Treadway Commission (1992 framework) (the COSO Criteria) and our report dated
March 17, 2014
expressed an unqualified opinion thereon.
/s/ Ernst & Young LLP
San Jose, California
March 17, 2014
F- 1
OMNICELL, INC.
(In thousands)
|
December 31,
2013 |
December 31,
2012 |
||||||
|
|
|||||||
|
ASSETS
|
|
|
|
|
|||
|
Current assets:
|
|
|
|
|
|||
|
Cash and cash equivalents
|
$
|
104,531
|
|
$
|
62,313
|
|
|
|
Accounts receivable, net of allowances of $490 and $722 at December 31, 2013 and December 31, 2012, respectively
|
58,597
|
|
55,116
|
|
|||
|
Inventories
|
31,457
|
|
26,903
|
|
|||
|
Prepaid expenses
|
18,883
|
|
15,392
|
|
|||
|
Deferred tax assets
|
12,635
|
|
11,860
|
|
|||
|
Other current assets
|
7,675
|
|
9,172
|
|
|||
|
Total current assets
|
233,778
|
|
180,756
|
|
|||
|
Property and equipment, net
|
35,254
|
|
34,107
|
|
|||
|
Non-current net investment in sales-type leases
|
11,485
|
|
13,228
|
|
|||
|
Goodwill
|
111,343
|
|
111,407
|
|
|||
|
Other intangible assets
|
81,602
|
|
85,550
|
|
|||
|
Non-current deferred tax assets
|
1,102
|
|
993
|
|
|||
|
Other assets
|
17,937
|
|
15,778
|
|
|||
|
Total assets
|
$
|
492,501
|
|
$
|
441,819
|
|
|
|
LIABILITIES AND STOCKHOLDERS’ EQUITY
|
|
|
|
|
|||
|
Current liabilities:
|
|
|
|
|
|||
|
Accounts payable
|
$
|
16,471
|
|
$
|
18,255
|
|
|
|
Accrued compensation
|
19,604
|
|
11,613
|
|
|||
|
Accrued liabilities
|
13,746
|
|
11,988
|
|
|||
|
Deferred service revenue
|
22,626
|
|
20,449
|
|
|||
|
Deferred gross profit
|
19,957
|
|
20,772
|
|
|||
|
Total current liabilities
|
92,404
|
|
83,077
|
|
|||
|
Non-current deferred service revenue
|
17,763
|
|
19,892
|
|
|||
|
Non-current deferred tax liabilities
|
28,162
|
|
26,491
|
|
|||
|
Other long-term liabilities
|
5,175
|
|
4,809
|
|
|||
|
Total liabilities
|
143,504
|
|
134,269
|
|
|||
|
Commitments and contingencies
|
|||||||
|
Stockholders’ equity:
|
|
|
|
|
|||
|
Preferred stock, $0.001 par value; 5,000,000 shares authorized; none issued
|
—
|
|
—
|
|
|||
|
Common Stock, $0.001 par value; 100,000,000 shares authorized; 41,840,298 and 35,003,677 shares issued and outstanding, respectively, at December 31, 2013 and 39,493,469 and 33,541,493 shares issued and outstanding, respectively, at December 31 2012
|
41
|
|
39
|
|
|||
|
Treasury stock, at cost, outstanding: 6,836,621 and 5,951,976 shares at December 31, 2013 and 2012, respectively
|
(110,962
|
)
|
(90,000
|
)
|
|||
|
Additional paid-in capital
|
421,232
|
|
382,844
|
|
|||
|
Retained earnings
|
38,515
|
|
14,536
|
|
|||
|
Accumulated other comprehensive income
|
171
|
|
131
|
|
|||
|
Total stockholders’ equity
|
348,997
|
|
307,550
|
|
|||
|
Total liabilities and stockholders’ equity
|
$
|
492,501
|
|
$
|
441,819
|
|
|
See Notes to Consolidated Financial Statements
F- 2
OMNICELL, INC.
(In thousands, except per share data)
|
|
Years Ended December 31,
|
|||||||||||
|
|
2013
|
2012
|
2011
|
|||||||||
|
Revenues:
|
|
|
|
|
|
|
||||||
|
Product revenues
|
$
|
307,189
|
|
$
|
247,654
|
|
$
|
185,864
|
|
|||
|
Services and other revenues
|
73,396
|
|
66,373
|
|
59,671
|
|
||||||
|
Total revenues
|
380,585
|
|
314,027
|
|
245,535
|
|
||||||
|
Cost of revenues:
|
|
|
|
|
|
|
||||||
|
Cost of product revenues
|
144,997
|
|
112,369
|
|
79,567
|
|
||||||
|
Cost of services and other revenues
|
32,189
|
|
31,070
|
|
30,184
|
|
||||||
|
Total cost of revenues
|
177,186
|
|
143,439
|
|
109,751
|
|
||||||
|
Gross profit
|
203,399
|
|
170,588
|
|
135,784
|
|
||||||
|
Operating expenses:
|
|
|
|
|
|
|
||||||
|
Research and development
|
29,105
|
|
23,726
|
|
22,042
|
|
||||||
|
Selling, general and administrative
|
138,995
|
|
119,736
|
|
97,520
|
|
||||||
|
Total operating expenses
|
168,100
|
|
143,462
|
|
119,562
|
|
||||||
|
Income from operations
|
35,299
|
|
27,126
|
|
16,222
|
|
||||||
|
Interest and other income (expense), net
|
(270
|
)
|
(51
|
)
|
(133
|
)
|
||||||
|
Income before provision for income taxes
|
35,029
|
|
27,075
|
|
16,089
|
|
||||||
|
Provision for income taxes
|
11,050
|
|
10,897
|
|
5,700
|
|
||||||
|
Net income
|
$
|
23,979
|
|
$
|
16,178
|
|
$
|
10,389
|
|
|||
|
Net income per share-basic
|
$
|
0.69
|
|
$
|
0.49
|
|
$
|
0.31
|
|
|||
|
Net income per share-diluted
|
$
|
0.67
|
|
$
|
0.47
|
|
$
|
0.30
|
|
|||
|
Weighted average shares outstanding:
|
|
|
|
|
|
|
||||||
|
Basic
|
34,736
|
|
33,307
|
|
33,123
|
|
||||||
|
Diluted
|
35,777
|
|
34,213
|
|
34,103
|
|
||||||
See Notes to Consolidated Financial Statements
F- 3
OMNICELL, INC.
CONSOLIDATED STATEMENTS OF COMPREHENSIVE INCOME
(In thousands)
|
|
Years Ended December 31,
|
|||||||||||
|
|
2013
|
2012
|
2011
|
|||||||||
|
Net income
|
$
|
23,979
|
|
$
|
16,178
|
|
$
|
10,389
|
|
|||
|
Other comprehensive income:
|
|
|||||||||||
|
Unrealized holding (losses) gains arising during the period
|
—
|
|
(1
|
)
|
1
|
|
||||||
|
Changes in fair value of foreign currency forward hedges
|
(65
|
)
|
65
|
|
—
|
|
||||||
|
Foreign currency translation adjustment
|
105
|
|
66
|
|
—
|
|
||||||
|
Other comprehensive income
|
40
|
|
130
|
|
1
|
|
||||||
|
Comprehensive income
|
$
|
24,019
|
|
$
|
16,308
|
|
$
|
10,390
|
|
|||
See Notes to Consolidated Financial Statements
F- 4
OMNICELL, INC.
CONSOLIDATED STATEMENTS OF STOCKHOLDERS' EQUITY
(in thousands, except share amounts)
F- 5
|
Common
|
Treasury
|
||||||||||||||||||||||||||||
|
Shares
|
Stock
Amount
|
Shares
|
Stock
Amount
|
Additional
Paid In
Capital
|
Retained Earnings (Accumulated
Deficit)
|
Accumulated
Other
Comprehensive
Income
|
Total
Stockholders'
Equity
|
||||||||||||||||||||||
|
Balance at December 31, 2010
|
37,148,706
|
|
$
|
37
|
|
(4,121,123
|
)
|
$
|
(65,064
|
)
|
$
|
342,272
|
|
$
|
(12,031
|
)
|
$
|
—
|
|
$
|
265,214
|
|
|||||||
|
Net income
|
—
|
|
—
|
|
—
|
|
—
|
|
—
|
|
10,389
|
|
—
|
|
10,389
|
|
|||||||||||||
|
Other comprehensive income
|
—
|
|
—
|
|
—
|
|
—
|
|
—
|
|
—
|
|
1
|
|
1
|
|
|||||||||||||
|
Share repurchases
|
—
|
|
—
|
|
(889,511
|
)
|
(12,573
|
)
|
—
|
|
—
|
|
—
|
|
(12,573
|
)
|
|||||||||||||
|
Share-based compensation
|
—
|
|
—
|
|
—
|
|
—
|
|
9,499
|
|
—
|
|
—
|
|
9,499
|
|
|||||||||||||
|
Common stock issued under stock option and stock award plans, net of employees' taxes paid related to restricted stock units
|
641,074
|
|
1
|
|
(43,174
|
)
|
—
|
|
2,736
|
|
—
|
|
—
|
|
2,737
|
|
|||||||||||||
|
Issuance of stock under employee stock purchase plan
|
445,965
|
|
—
|
|
—
|
|
—
|
|
4,050
|
|
—
|
|
—
|
|
4,050
|
|
|||||||||||||
|
Income tax benefits realized from employee stock plans
|
—
|
|
—
|
|
—
|
|
—
|
|
3,597
|
|
—
|
|
—
|
|
3,597
|
|
|||||||||||||
|
Balance at December 31, 2011
|
38,235,745
|
|
$
|
38
|
|
(5,053,808
|
)
|
$
|
(77,637
|
)
|
$
|
362,154
|
|
$
|
(1,642
|
)
|
$
|
1
|
|
$
|
282,914
|
|
|||||||
|
Net income
|
—
|
|
—
|
|
—
|
|
—
|
|
—
|
|
16,178
|
|
—
|
|
16,178
|
|
|||||||||||||
|
Other comprehensive income
|
—
|
|
—
|
|
—
|
|
—
|
|
—
|
|
—
|
|
130
|
|
130
|
|
|||||||||||||
|
Share repurchases
|
—
|
|
—
|
|
(898,168
|
)
|
(12,363
|
)
|
—
|
|
—
|
|
—
|
|
(12,363
|
)
|
|||||||||||||
|
Share-based compensation
|
—
|
|
—
|
|
—
|
|
—
|
|
9,214
|
|
—
|
|
—
|
|
9,214
|
|
|||||||||||||
|
Common stock issued under stock option and stock award plans, net of employees' taxes paid related to restricted stock units
|
879,875
|
|
1
|
|
—
|
|
—
|
|
4,547
|
|
—
|
|
—
|
|
4,548
|
|
|||||||||||||
|
Issuance of stock under employee stock purchase plan
|
377,849
|
|
—
|
|
—
|
|
—
|
|
4,402
|
|
—
|
|
—
|
|
4,402
|
|
|||||||||||||
|
Income tax benefits realized from employee stock plans
|
—
|
|
—
|
|
—
|
|
—
|
|
2,527
|
|
—
|
|
—
|
|
2,527
|
|
|||||||||||||
|
Balance at December 31, 2012
|
39,493,469
|
|
$
|
39
|
|
(5,951,976
|
)
|
$
|
(90,000
|
)
|
$
|
382,844
|
|
$
|
14,536
|
|
$
|
131
|
|
$
|
307,550
|
|
|||||||
|
Net income
|
—
|
|
|
—
|
|
|
—
|
|
|
—
|
|
|
|
|
|
23,979
|
|
|
—
|
|
|
23,979
|
|
||||||
|
Other comprehensive income
|
—
|
|
|
—
|
|
|
—
|
|
|
—
|
|
|
—
|
|
|
—
|
|
|
40
|
|
|
40
|
|
||||||
|
Share repurchases
|
—
|
|
|
—
|
|
|
(884,645
|
)
|
|
(20,962
|
)
|
|
—
|
|
|
—
|
|
|
—
|
|
|
(20,962
|
)
|
||||||
|
Share-based compensation
|
—
|
|
|
—
|
|
|
—
|
|
|
—
|
|
|
11,151
|
|
|
—
|
|
|
—
|
|
|
11,151
|
|
||||||
|
Common stock issued under stock option and stock award plans, net of employees' taxes paid related to restricted stock units
|
1,897,931
|
|
|
2
|
|
|
—
|
|
|
—
|
|
|
18,882
|
|
|
—
|
|
|
—
|
|
|
18,884
|
|
||||||
|
Issuance of stock under employee stock purchase plan
|
450,713
|
|
|
—
|
|
|
—
|
|
|
—
|
|
|
5,779
|
|
|
—
|
|
|
—
|
|
|
5,779
|
|
||||||
|
Income tax benefits realized from employee stock plans
|
—
|
|
|
—
|
|
|
—
|
|
|
—
|
|
|
2,576
|
|
|
—
|
|
|
—
|
|
|
2,576
|
|
||||||
|
Balance at December 31, 2013
|
41,842,113
|
|
|
$
|
41
|
|
|
(6,836,621
|
)
|
|
$
|
(110,962
|
)
|
|
$
|
421,232
|
|
|
$
|
38,515
|
|
|
$
|
171
|
|
|
$
|
348,997
|
|
See Notes to Consolidated Financial Statements
F- 6
OMNICELL, INC.
(In thousands)
|
Years Ended December 31,
|
||||||||||
|
2013
|
2012
|
2011
|
||||||||
|
Cash flows from operating activities:
|
|
|
||||||||
|
Net income
|
$
|
23,979
|
|
$
|
16,178
|
|
$
|
10,389
|
|
|
|
Adjustments to reconcile net income to net cash provided by operating activities:
|
|
|
|
|
|
|
||||
|
Depreciation and amortization
|
18,365
|
|
13,325
|
|
7,983
|
|
||||
|
Loss on disposal of fixed assets
|
345
|
|
66
|
|
—
|
|
||||
|
Asset impairment charge
|
1,759
|
|
—
|
|
—
|
|
||||
|
Provision for (recovery of) receivable allowance
|
110
|
|
582
|
|
(155
|
)
|
||||
|
Gain on sale of note receivable
|
—
|
|
—
|
|
(473
|
)
|
||||
|
Share-based compensation expense
|
11,151
|
|
9,214
|
|
9,499
|
|
||||
|
Income tax benefits from employee stock plans
|
2,576
|
|
2,527
|
|
3,597
|
|
||||
|
Excess tax benefits from employee stock plans
|
(3,673
|
)
|
(3,182
|
)
|
(3,946
|
)
|
||||
|
Provision for excess and obsolete inventories
|
856
|
|
394
|
|
1,112
|
|
||||
|
Foreign currency remeasurement loss
|
—
|
|
—
|
|
210
|
|
||||
|
Deferred income taxes
|
787
|
|
2,718
|
|
589
|
|
||||
|
Changes in operating assets and liabilities:
|
|
|
|
|
|
|
||||
|
Accounts receivable, net
|
(3,609
|
)
|
(9,311
|
)
|
5,863
|
|
||||
|
Inventories
|
(5,410
|
)
|
2,536
|
|
(9,434
|
)
|
||||
|
Prepaid expenses
|
(3,491
|
)
|
(4,897
|
)
|
1,464
|
|
||||
|
Other current assets
|
1,566
|
|
(1,114
|
)
|
(594
|
)
|
||||
|
Net investment in sales-type leases
|
1,723
|
|
(4,154
|
)
|
1,036
|
|
||||
|
Other assets
|
630
|
|
(3,831
|
)
|
339
|
|
||||
|
Accounts payable
|
(1,784
|
)
|
1,751
|
|
(2,242
|
)
|
||||
|
Accrued compensation
|
7,991
|
|
4,285
|
|
(403
|
)
|
||||
|
Accrued liabilities
|
1,758
|
|
674
|
|
(342
|
)
|
||||
|
Deferred service revenue
|
82
|
|
2,914
|
|
3,596
|
|
||||
|
Deferred gross profit
|
(815
|
)
|
6,562
|
|
2,491
|
|
||||
|
Other long-term liabilities
|
367
|
|
2,247
|
|
664
|
|
||||
|
Net cash provided by operating activities
|
55,263
|
|
39,484
|
|
31,243
|
|
||||
|
Cash flows from investing activities:
|
|
|
|
|
||||||
|
Purchases of short-term investments
|
—
|
|
—
|
|
(8,097
|
)
|
||||
|
Maturities of short-term investments
|
—
|
|
8,122
|
|
8,143
|
|
||||
|
Acquisition of intangible assets and intellectual property
|
(356
|
)
|
(373
|
)
|
(235
|
)
|
||||
|
Software development for external use
|
(7,761
|
)
|
(5,028
|
)
|
(4,192
|
)
|
||||
|
Purchases of property and equipment
|
(12,335
|
)
|
(15,120
|
)
|
(8,685
|
)
|
||||
|
Business acquisition, net of cash acquired
|
—
|
|
(156,312
|
)
|
—
|
|
||||
|
Net cash used in investing activities
|
(20,452
|
)
|
(168,711
|
)
|
(13,066
|
)
|
||||
|
Cash flows from financing activities:
|
|
|
|
|
|
|
||||
|
Proceeds from issuance of common stock under employee stock purchase and stock option plans, net of employees' taxes paid related to restricted stock units
|
24,663
|
|
8,949
|
|
6,787
|
|
||||
|
Stock repurchases
|
(20,962
|
)
|
(12,363
|
)
|
(12,573
|
)
|
||||
|
Excess tax benefits from employee stock plans
|
3,673
|
|
3,182
|
|
3,946
|
|
||||
|
Net cash provided from (used in) financing activities
|
7,374
|
|
(232
|
)
|
(1,840
|
)
|
||||
|
Effect of exchange rate changes on cash and cash equivalents
|
33
|
|
10
|
|
(210
|
)
|
||||
|
Net (decrease) increase in cash and cash equivalents
|
42,218
|
|
(129,449
|
)
|
16,127
|
|
||||
|
Cash and cash equivalents at beginning of period
|
62,313
|
|
191,762
|
|
175,635
|
|
||||
|
Cash and cash equivalents at end of period
|
$
|
104,531
|
|
$
|
62,313
|
|
$
|
191,762
|
|
|
|
Supplemental disclosure of cash flow information:
|
|
|
|
|
|
|
||||
F- 7
|
Cash paid for interest
|
$
|
122
|
|
$
|
28
|
|
$
|
62
|
|
|
|
Cash paid for taxes
|
$
|
7,062
|
|
$
|
6,676
|
|
$
|
253
|
|
|
|
Supplemental disclosure of non-cash investing and operating activities
|
||||||||||
|
Purchases of property and equipment
|
$
|
196
|
|
$
|
—
|
|
$
|
—
|
|
|
|
Satisfaction of acquired legal contingency with indemnification asset (Note 2)
|
$
|
—
|
|
$
|
—
|
|
$
|
(1,200
|
)
|
|
See Notes to Consolidated Financial Statements
F- 8
OMNICELL, INC.
NOTES TO CONSOLIDATED FINANCIAL STATEMENTS
Note 1.
Organization and Summary of Significant Accounting Policies
Description of the Company.
Omnicell, Inc. ("Omnicell," "our," "us," "we," or the "Company") was incorporated in California in 1992 under the name Omnicell Technologies, Inc. and reincorporated in Delaware in 2001 as Omnicell, Inc. Our major products are automated medication, supply control systems and medication adherence solutions which are sold in our principal market, which is the healthcare industry. Our market is primarily located in the United States and Canada.
Principles of consolidation.
The consolidated financial statements include the accounts of our wholly-owned subsidiaries. All significant inter-company accounts and transactions have been eliminated in consolidation.
Use of estimates.
The preparation of financial statements in accordance with U.S. generally accepted accounting principles ("GAAP") requires management to make estimates and assumptions that affect the amounts reported in our consolidated financial statements and accompanying notes. Management bases its estimates on historical experience and various other assumptions believed to be reasonable. Although these estimates are based on management's best knowledge of current events and actions that may impact the company in the future, actual results may be different from the estimates. Our critical accounting policies are those that affect our financial statements materially and involve difficult, subjective or complex judgments by management. Those policies are revenue recognition, share-based compensation, inventory valuation, valuation of goodwill and purchased intangibles, valuation of long-lived assets and accounting for income taxes.
Cash and cash equivalents.
We classify investments as cash equivalents if their original or remaining contractual maturity is three months or less at the date of purchase. Cash equivalents are stated at cost, which approximates fair value. Our cash and cash equivalents are maintained in demand deposit accounts with financial institutions of high credit quality and are invested in institutional money market funds, short-term bank time deposits and similar short duration instruments with fixed maturities from overnight to three months. We continuously monitor the creditworthiness of the financial institutions and institutional money market funds in which we invest our surplus funds. We have not experienced any credit losses from our cash investments.
Fair value of financial instruments.
We value our financial assets and liabilities on a recurring basis using the fair value hierarchy established in Accounting Standards Codification ("ASC") 820,
Fair Value Measurements and Disclosures
.
ASC 820 describes three levels of inputs that may be used to measure fair value, as follows:
Level 1 inputs, which include quoted prices in active markets for identical assets or liabilities;
Level 2 inputs, which include observable inputs other than Level 1 inputs, such as quoted prices for similar assets or liabilities, quoted prices for identical or similar assets or liabilities in markets that are not active; or other inputs that are observable or can be corroborated by observable market data for substantially the full term of the asset or liability; and
Level 3 inputs, which include unobservable inputs that are supported by little or no market activity and that are significant to the fair value of the underlying asset or liability. Level 3 assets and liabilities include those whose fair value measurements are determined using pricing models, discounted cash flow methodologies or similar valuation techniques, as well as significant management judgment or estimation.
At
December 31, 2013
and
December 31, 2012
, our financial assets utilizing Level 1 inputs included cash equivalents. For these items, quoted market prices are readily available and fair value approximates carrying value. We do not currently have any material financial instruments utilizing Level 2 or Level 3 inputs.
Classification of marketable securities.
Marketable securities for which we have the intent and ability to hold to maturity are classified as held-to-maturity, with carrying value at amortized cost, including accrued interest. We do not hold securities for purposes of trading. However, securities held as investments for the indefinite future, pending future spending requirements are classified as available-for-sale, with carrying value at fair value and any unrealized gain or loss recorded to other comprehensive income until realized. We held
$65.7 million
and
$38.9 million
of money market mutual funds as available-for-sale cash equivalents as of
December 31, 2013
and 2012, respectively.
Revenue recognition.
We earn revenues from sales of our medication and medical and surgical supply automation systems along with consumables and related services, which are sold in the healthcare industry, our principal market. Revenues related to consumable products are reported net of discounts provided to our customers. Our customer arrangements typically include one or more of the following deliverables:
F- 9
|
•
|
Products
—Software-enabled equipment that manages and regulates the storage and dispensing of pharmaceuticals, consumable blister cards and packaging equipment and other medical supplies.
|
|
•
|
Software
—Additional software applications that enable incremental functionality of our equipment.
|
|
•
|
Installation
—Installation of equipment as integrated systems at customers' sites.
|
|
•
|
Post-installation technical support
—Phone support, on-site service, parts and access to unspecified software upgrades and enhancements, if and when available.
|
|
•
|
Professional services
—Other customer services such as training and consulting.
|
We recognize revenue when the earnings process is complete, based upon our evaluation of whether the following four criteria have been met:
|
•
|
Persuasive evidence of an arrangement exists.
We use signed customer contracts and signed customer purchase orders as evidence of an arrangement for leases and sales. For service engagements, we use a signed services agreement and a statement of work to evidence an arrangement.
|
|
•
|
Delivery has occurred.
Equipment and embedded software product delivery is deemed to occur upon successful installation and receipt of a signed and dated customer confirmation of installation letter, providing evidence that we have delivered what a customer ordered. In instances of a customer self-installation, product delivery is deemed to have occurred upon receipt of a signed and dated customer confirmation letter. If a sale does not require installation, we recognize revenue on delivery of products to the customer, including transfer of title and risk of loss, assuming all other revenue criteria are met. For existing distributors, where installation of equipment training has been previously provided and the distributor is certified to install our equipment at end user customer facility, we recognize revenue from sales of products to the distributor upon shipment assuming all other revenue criteria are met since we do not allow for rights of return or refund. For new distributors, where we have not provided installation of equipment training, revenue on the sales of products to the distributor is deferred until the distributor has completed the Distributor Training Program and has been certified to install our equipment at the end user facility. For the sale of consumable blister cards, we recognize revenue when title and risk of loss of the products shipped have transferred to the customer, which usually occurs upon shipment from our facilities. Assuming all other revenue criteria are met, we recognize revenue for support services ratably over the related support services contract period. We recognize revenue on training and professional services as they are performed.
|
|
•
|
Fee is fixed or determinable.
We assess whether a fee is fixed or determinable at the outset of the arrangement based on the payment terms associated with the transaction. We have established a history of collecting under the original contract without providing concessions on payments, products or services.
|
|
•
|
Collection is probable.
We assess the probability of collecting from each customer at the outset of the arrangement based on a number of factors, including the customer's payment history and its current creditworthiness. If, in our judgment, collection of a fee is not probable, we defer the revenue until the uncertainty is removed, which generally means revenue is recognized upon our receipt of cash payment assuming all other revenue criteria are met. Our historical experience has been that collection from our customers is generally probable.
|
In arrangements with multiple deliverables, assuming all other revenue criteria are met, we recognize revenue for individual delivered items if they have value to the customer on a standalone basis.We allocate arrangement consideration at the inception of the arrangement to all deliverables using the relative selling price method. This method requires us to determine the selling price at which each deliverable could be sold if it were sold regularly on a standalone basis. When available, we use vendor-specific objective evidence ("VSOE") of the selling price. VSOE represents the price charged for a deliverable when it is sold separately, or for a deliverable not yet being sold separately, the price established by management with the relevant authority. We consider VSOE to exist when approximately 80% or more of our standalone sales of an item are priced within a reasonably narrow pricing range (plus or minus 15% of the median rates). We have established VSOE of the selling price for our post-installation technical support services and professional services. When VSOE of selling price is not available, third-party evidence ("TPE") of selling price for similar products and services is acceptable; however, our offerings and market strategy differ from those of our competitors, such that we cannot obtain sufficient comparable information about third parties' prices. If neither VSOE nor TPE are available, we use our best estimates of selling prices ("BESP"). We determine BESP considering factors such as market conditions, sales channels, internal costs and product margin objectives and pricing practices. We regularly review and update our VSOE and BESP information.
F- 10
The relative selling price method allocates total arrangement consideration proportionally to each deliverable on the basis of its estimated selling price. In addition, the amount recognized for any delivered items cannot exceed that which is not contingent upon delivery of any remaining items in the arrangement.
We also use the residual method to allocate revenue between the software products that enable incremental equipment functionality, and thus are not deemed to deliver its essential functionality, and the related post-installation technical support, as these products and services continue to be accounted for under software revenue recognition rules. Under the residual method, the amount allocated to the undelivered elements equals VSOE of fair value of these elements. Any remaining amounts are attributed to the delivered items and are recognized when those items are delivered.
A portion of our sales are made through multi-year lease agreements. Under sales-type leases, we recognize revenue for our hardware and software products net of lease execution costs such as post-installation product maintenance and technical support, at the net present value of the lease payment stream once our installation obligations have been met. We optimize cash flows by selling a majority of our non-U.S. government leases to third-party leasing finance companies on a non-recourse basis. We have no obligation to the leasing company once the lease has been sold. Some of our sales-type leases, mostly those relating to U.S. government hospitals, are retained in-house. Interest income in these leases is recognized in product revenue using the effective interest method.
Accounts receivable and notes receivable (net investment in sales type leases).
We actively manage our accounts receivable to minimize credit risk. We typically sell to customers for which there is a history of successful collection. New customers are subject to a credit review process, which evaluates that customer's financial position and ability to pay. We continually monitor and evaluate the collectability of our trade receivables based on a combination of factors. We record specific allowances for doubtful accounts when we become aware of a specific customer's impaired ability to meet its financial obligation to us, such as in the case of bankruptcy filings or deterioration of financial position.
Uncollectible amounts are charged off against trade receivables and the allowance for doubtful accounts when we make a final determination that there is no reasonable expectation of recovery. Estimates are used in determining our allowances for all other customers based on factors such as current trends, the length of time the receivables are past due and historical collection experience. While we believe that our allowance for doubtful accounts receivable is adequate and that the judgment applied is appropriate, such estimated amounts could differ materially from what will actually be uncollectible in the future.
The retained in-house leases discussed above are considered financing receivables. Our credit policies and evaluation of credit risk and write-off policies are applied alike to trade receivables and the net-investment in sales-type leases. For both, an account is generally past due after thirty days. The financing receivables also have customer-specific reserves for accounts identified for specific impairment and a non-specific reserve applied to the remaining population, based on factors such as current trends, the length of time the receivables are past due and historical collection experience. The retained in-house leases are not stratified by portfolio or class. Financing receivables which are reserved are generally transferred to cash-basis accounting so that revenue is recognized only as cash is received. However, the cash basis accounts continue to accrue interest.
Sales of accounts receivable.
We record the sale of our accounts receivables as "true sales" in accordance with accounting guidance for transfers and servicing of financial assets. During the
years ended 2013, 2012 and 2011
, we transferred non-recourse accounts receivable totaling
$41.3 million
,
$60.9 million
and
$46.9 million
, respectively, which approximated fair value, to leasing companies on a non-recourse basis. At
December 31, 2013
,
2012
and 2011, accounts receivable included approximately
$0.1 million
,
$0.7 million
and
$0.2 million
, respectively, due from third-party leasing companies for transferred non-recourse accounts receivable.
Concentration in revenues and in accounts receivable.
There were no customers accounting for 10% or more of revenues for the years ended December 31, 2013, 2012 or 2011. At
December 31, 2013
,
2012
and 2011, no single customer accounted for more than 10% of our accounts receivable balance.
Geographic risk.
For the
years ended December 31, 2013, 2012 and 2011
,
11.2%
,
7.5%
and
2.0%
, respectively, of our product revenue was from foreign countries.
Commissions.
Sales commissions generally are earned by and paid to our sales team upon order receipt, but are recognized in expense at the time of revenue recognition. Before they are recognized as expense they are recorded as prepaid commissions, which are a component of prepaid expenses.
Dependence on suppliers.
We have a supply agreement with one primary supplier for construction and supply of several sub-assemblies and inventory management of sub-assemblies used in our hardware products. There are no minimum purchase requirements. The contract with our supplier may be terminated by either the supplier or by us without cause and at
F- 11
any time upon delivery of two months' notice. Purchases from this supplier for the
years ended December 31, 2013, 2012 and 2011
were approximately
$29.2 million
,
$23.8 million
and
$21.1 million
, respectively.
Inventory.
Inventories are stated at the lower of cost (utilizing standard costs, applying the first-in, first-out method) or market. Cost elements included in inventory are direct labor and materials plus applied overhead. We routinely assess on-hand inventory for timely identification and measurement of obsolete, slow-moving or otherwise impaired inventory. We write down our inventory for estimated obsolescence, excess or unmarketable quantities equal to the difference between the cost of the inventory and its estimated market value based on assumptions about future demand and market conditions. If actual future demand or market conditions are less favorable than we projected, additional inventory write-downs may be required.
Property and equipment.
Property and equipment less accumulated depreciation are stated at historical cost. Our expenditures for property and equipment are for computer equipment and software used in the administration of our business, and for leasehold improvements to our leased facilities. We also develop molds and dies used in long-term manufacturing arrangements with suppliers, and for production automation equipment used in the manufacturing of consumable blister card components. Depreciation and amortization of property and equipment are provided over their estimated useful lives, using the straight-line method, as follows:
|
Computer equipment and related software
|
3 - 5 years
|
|
Leasehold and building improvements
|
Shorter of the lease term or the estimated useful life
|
|
Furniture and fixtures
|
5 years
|
|
Equipment
|
3 - 5 years
|
We capitalize costs related to computer software developed or obtained for internal use in accordance with ASC 350-40,
Internal-Use Software
. Software obtained for internal use has generally been enterprise-level business and finance software that we customize to meet our specific operational needs. Costs incurred in the application development phase are capitalized and amortized over their useful lives, which is generally five years. Costs recognized in the preliminary project phase and the post-implementation phase are expensed as incurred. At
December 31, 2013
and
December 31, 2012
, we had
$4.8 million
and
$5.4 million
, respectively, of costs related to application development of enterprise-level software included in property and equipment.
Software development costs.
We capitalize software development costs in accordance with ASC 985-20,
Costs of Software to Be Sold, Leased, or Marketed
, under which certain software development costs incurred subsequent to the establishment of technological feasibility may be capitalized and amortized over the estimated lives of the related products. We establish feasibility when we complete a working model and amortize development costs over the estimated lives of the related products ranging from three to five years. During
2013
and
2012
, we capitalized software development costs of
$7.8 million
and
$5.0 million
, respectively, which are included in other assets. For the
years ended December 31, 2013, 2012 and 2011
, we charged to cost of revenues
$3.2 million
,
$2.3 million
, and
$1.6 million
, respectively, for amortization of capitalized software development costs. All development costs prior to the completion of a working model are recognized as research and development expense.
Valuation and impairment of goodwill, other intangible assets and other long lived assets.
We account for goodwill and other intangible assets in accordance with ASC 350,
Intangibles—Goodwill and Other
("ASC 350). For the initial recognition and measurement of Goodwill and Intangibles resulting from acquisitions, we use the guidance in ASC 805,
Business Combinations
.
Under ASC 350,
Intangibles - Goodwill and Other,
goodwill and intangible assets with an indefinite life are not subject to amortization but are tested for impairment at least annually or more frequently if indicators of impairment exist. ASC 350 defines impairment as the condition that exists when the carrying amount of goodwill exceeds its implied fair value. The provisions of ASC 350 require that an entity assign its recorded goodwill to each of its reporting units and test each reporting unit's goodwill for impairment. We have determined that we have two reporting units: the Acute Care and the Non-Acute Care segments.
In accordance with ASC 350, we have the option, in any period, to first assess qualitative factors to determine whether it is more likely than not (that is, a likelihood of more than 50%) that the fair value of a reporting unit is less than its carrying amount, including goodwill, or bypass the qualitative assessment and proceed directly to performing the two-step quantitative goodwill impairment test. The first step ("step 1") involves comparing each reporting unit's estimated fair value to its carrying value, including goodwill, to identify potential impairment. If the estimated fair value of a reporting unit exceeds its carrying value, there is no indication of impairment and no further test is required. If the carrying value exceeds the estimated fair value,
F- 12
there is an indication of potential impairment and the second step is required to be performed to measure the amount of impairment.
In the fourth quarter of 2013, we elected to perform step 1 to determine whether it is more likely than not that the fair values of our reporting units are less than their carrying amounts. While the ultimate responsibility rests with management, we engaged the services of an independent, third-party valuation specialist to assist in determining the fair values of our reporting units. We used a combination of a discounted cash flow model (“DCF”) which utilizes the present value of cash flows to estimate fair value (also known as the income approach) and comparisons to publicly traded companies’ market multiples (also known as the market approach).
Under the DCF model, the future cash flows for our reporting units were projected based on management’s projections, at that time, of future revenues, operating income and other factors such as working capital and capital expenditures. We also took into account market factors and industry conditions affecting our business. We used significant judgment to estimate the amount and timing of future cash flows from our reporting units and the relative risk of achieving those cash flows. Forecasts of future operations are based, in part, on operating results and our expectations as to future market conditions. The discount rate used in our DCF model was based on a weighted-average cost of capital determined from relevant market comparisons and adjusted for specific reporting unit risks (primarily the risk of achieving projected operating cash flows). A terminal value growth rate was applied to the final year of the respective cash flows for both reporting units to arrive at an estimate of fair value under the income approach. The estimated fair values of our reporting units determined under the income approach exceeded their carrying values.
We used the market approach to corroborate the values estimated under the income approach. Under the market approach, we estimated the fair values of our reporting units based on financial information on companies that we deemed were comparable to our business. Based on publicly available information, we calculated the comparable companies’ market multiples of earnings before interest, taxes, depreciation and amortization, and stock option expense and factored in a control premium. The estimated fair values of our reporting units determined under the market approach exceeded their carrying values.
Finally, we compared the estimated fair values of our reporting units to our September 30, 2013 total public market capitalization and assessed implied control premiums. Based on the aforementioned, we concluded that the estimated fair value determined for both our reporting units was reasonable. In each case, the estimated fair values of our reporting units exceeded their respective carrying values and, as such, we concluded that goodwill assigned to our Acute Care and Non-Acute Care segments was not impaired. In addition, we did not note any indications of goodwill impairment as of December 31, 2013
In 2012, we opted to perform a qualitative assessment of factors to determine if goodwill had been impaired as of December 31, 2012. For both the Acute Care and Non-Acute Care segments, we considered the following qualitative factors:
|
•
|
Macroeconomic conditions such as general economic conditions, limitations on accessing capital, fluctuations in foreign exchange rates or other developments in equity and credit markets;
|
|
•
|
Industry and market considerations such as changes in the environment in which we operate, an increased competitive environment, a decline in market-dependent multiples or metrics (consider in both absolute terms and relative to peers), a change in the market for our products or services, or a regulatory or political development;
|
|
•
|
Cost factors such as increases in raw materials, labor, or other costs that have a negative effect on earnings and cash flows;
|
|
•
|
Overall financial performance such as negative or declining cash flows or a decline in actual or planned revenue or earnings compared with actual and projected results of relevant prior periods;
|
|
•
|
Other relevant entity-specific events such as changes in management, key personnel, strategy, or customers; contemplation of bankruptcy or litigation; and
|
|
•
|
Events affecting a reporting unit such as a change in the composition or carrying amount of its net assets, a more-likely-than-not expectation of selling or disposing all, or a portion, of a reporting unit, the testing for recoverability of a significant asset group within a reporting unit or recognition of a goodwill impairment loss in the financial statements of a subsidiary that is a component of a reporting unit.
|
Upon completion of our qualitative assessment conducted in the fourth quarter of 2012, management concluded that it was more likely than not the fair values of both the Acute and Non-Acute reporting units exceeded their carrying values including the respective amounts of goodwill. In addition, management did not note any other indicators of goodwill impairment as of December 31, 2012.
F- 13
We continually monitor events and changes in circumstances that could indicate carrying amounts of long-lived assets may not be recoverable. We review long-lived assets and certain purchased intangibles for impairment whenever events or changes in circumstances indicate that we will not be able to recover the asset's carrying amount. Recoverability of an asset is measured by comparing its carrying amount to the expected future undiscounted cash flows expected to result from the use and eventual disposition of that asset, excluding future interest costs that would be recognized as an expense when incurred. Any impairment to be recognized is measured by the amount by which the carrying amount of the asset exceeds its fair market value. Significant management judgment is required in:
|
•
|
identifying a triggering event that arises from a change in circumstances;
|
|
•
|
forecasting future operating results; and
|
|
•
|
estimating the proceeds from the disposition of long-lived or intangible assets.
|
Significant management judgment is also required for initial recognition and measurement of goodwill and other intangibles assets resulting from business combinations in accordance with ASC 805. Management must assess the extent to which identified other intangibles assets are properly includable (and with the appropriate fair value) or properly excludable, by applying the recognition criteria. This judgment affects not only the other intangible assets but the remainder calculation of goodwill. The assessment of useful life for each acquired intangible impacts future financial position and operating performance through amortization expense.
Deferred service revenue and deferred gross profit.
Deferred service revenue and deferred gross profit arise when customers are billed for products and/or services in advance of revenue recognition. Our deferred gross profit, classified as a current liability, consists primarily of unearned revenue on sale of equipment for which installation has not been completed, net of deferred cost of sales for such equipment, and the unearned revenue for software licenses. Our deferred service revenue, separated into current and long-term liabilities, consists of the unearned portion of service contracts for which revenue is recognized over their duration.
Valuation of share-based awards.
We account for share-based compensation plans in accordance to the provisions of ASC 718,
Stock Compensation
. We estimate the fair value of our employee stock awards at the date of grant using certain subjective assumptions, such as expected volatility, which is based on a combination of historical and market- based implied volatility, and the expected term of the awards which is based on our historical experience of employee stock option exercises including forfeitures. Our valuation assumptions used in estimating the fair value of share-based awards may change in future periods. We recognize the fair value of awards over their vesting period or requisite service period. In addition, we calculate our pool of excess tax benefits available within additional paid-in capital in accordance with the provisions of ASC 718.
Accounting for income taxes.
We record an income tax provision for the anticipated tax consequences of the reported results of operations. In accordance with GAAP, the provision for income taxes is computed using the asset and liability method, which requires the recognition of deferred tax assets and liabilities for the expected future tax consequences of events that have been included in the financial statements. Under this method, deferred tax assets and liabilities are determined on the basis of the differences between the financial statement and tax bases of assets and liabilities, and for operating losses and tax credit carry forwards. Deferred tax assets and liabilities are measured using the enacted tax rates in effect for the periods in which those tax assets and liabilities are expected to be realized or settled. In the event that these tax rates change, we will incur a benefit or detriment on our income tax expense in the period of change. If we were to determine that all or part of the net deferred tax assets are not realizable in the future, we will record a valuation allowance that would be charged to earnings in the period such determination is made.
In accordance with ASC 740,
Income Taxes
, we recognize the tax benefit from an uncertain tax position if it is more likely than not that the tax position will be sustained on examination by the taxing authorities, based on the technical merits of the position. The tax benefits recognized in the financial statements from such positions are then measured based on the largest benefit that has a greater than 50% likelihood of being realized upon ultimate settlement. The calculation of tax liabilities involves significant judgment in estimating the impact of uncertainties in the application of GAAP and complex tax laws. Resolution of these uncertainties in a manner inconsistent with management's expectations could have a material impact on our financial condition and operating results.
Please refer to Note 14, Income Taxes, for further information.
Shipping costs.
Outbound freight billed to customers is recorded as product revenue. The related shipping and handling costs are expensed as part of selling, general and administrative expense. Such shipping and handling expenses totaled
$6.1 million
,
$4.1 million
, and
$2.7 million
for the years ended December 31, 2013, 2012 and 2011
, respectively.
F- 14
Advertising.
Advertising costs are expensed as incurred and amounted to
$0.5 million
,
$0.5 million
, and
$0.9 million
for the years ended December 31, 2013, 2012 and 2011
, respectively.
Operating leases.
We lease our buildings under operating leases accounted for in accordance with ASC 840,
Leases
.
Sales taxes.
Sales taxes collected from customers and remitted to governmental authorities are not included in our revenue.
Foreign currency translation.
We translate the assets and liabilities of our non-U.S. dollar functional currency subsidiaries into U.S. dollars using exchange rates in effect at the end of each period. Revenue and expenses for these subsidiaries are translated using rates that approximate those in effect during the period. Gains and losses from these translations are recorded as foreign currency translation adjustments and included in accumulated other comprehensive income in stockholders’ equity.
Currency forward contracts.
From time to time we enter into foreign currency forward contracts to protect our business from the risk that exchange rates may affect the eventual cash flows resulting from intercompany transactions between Omnicell and our foreign subsidiaries. These transactions primarily arise as a result of products manufactured in the United States and sold to foreign subsidiaries in U.S. dollars rather than the subsidiaries' functional currencies. These forward contracts are considered to be financial derivative instruments and are recorded at fair value in the balance sheet. Changes in fair values of these financial derivative instruments are either recognized in other comprehensive income (a component of stockholders' equity) or net income depending on whether the derivative has been designated and qualifies as a hedging instrument. As of
December 31, 2013
and 2012, we had no foreign currency forward contracts which qualify for hedge accounting.
Total comprehensive income.
The largest components of total comprehensive income for the year ended
December 31, 2013
and 2012 were foreign currency translation adjustments and changes in fair value of foreign currency forward hedges.
Segment information.
Prior to the acquisition of MTS, we managed our business on the basis of a single operating segment, and a single reporting unit within that segment per ASC 280,
Segment Reporting
. Beginning with the acquisition of MTS, which was completed in May 2012, we have organized our business into two operating business segments: Acute Care, which primarily includes products and services sold to hospital customers and Non-Acute Care, which primarily includes products and services sold to customers outside of the hospital settings.
The Acute Care segment is organized around the design, manufacturing, selling and servicing of medication and supply dispensing systems. The Non-Acute Care segment includes primarily the manufacturing and selling of consumable medication blister cards, packaging equipment and ancillary products and services, but also includes medication dispensing systems sold to non-acute care pharmacies and facilities. We report segment information based on the management approach. The management approach designates the internal reporting used by the Chief Operating Decision Maker (the "CODM") for making decisions and assessing performance as the source of our operating segments. The CODM is our Chief Executive Officer. The CODM allocates resources to and assesses the performance of each operating segment, using information about its revenues, gross profit and income (loss) from operations.
Since 1992, Omnicell has provided automation and business information solutions to acute care hospitals. We have developed product solutions that help optimize various workflows utilized in hospitals. We have also developed sophisticated sales, installation, and service capabilities to serve the specific and special needs of the acute care environment in hospitals. As the acute care market evolves, we see opportunities to provide medication adherence solutions, which were added to our product line through the acquisition of MTS. A portion of our organization structure and management processes will continue to be structured to optimize sales and service of solutions to the acute care market.
Since 1984, MTS has provided medication adherence solutions to the non-acute care market. These solutions provide automated and semi-automated equipment to assist institutional and retail pharmacists in filling medication orders into blister cards, the primary method of medication control in non-acute care settings. Completing the product solution are the consumables used by institutional and retail pharmacists to make the medication adherence package. MTS has developed process manufacturing capabilities as well as sales capabilities to market medication adherence solutions to institutional and retail pharmacies. A portion of our organization structure and management processes will continue to be structured to optimize the product, sales, and service of solutions to the non-acute care market.
In 2012, we realigned our management reporting structure to report sales of Omnicell's dispensing systems and other related business transactions to long-term care pharmacies and facilities. Accordingly, the operations of this portion of our activities are now being reflected as a part of the Non-Acute Care segment for the year ended December 31, 2012. Non-Acute Care segment operating results were immaterial for the year ended December 31, 2011.
F- 15
Effective in the second quarter of 2013, our management changed its methodology for allocating certain expenses to our reportable segments. The impact of this change in methodology in our 2012 segment operating results was immaterial.
Substantially all of our long-lived assets are located in the United States. For the years ended December 31, 2013 and 2012, all of our total revenues and gross profits were generated by both our Acute Care and Non-Acute Care segments and no one customer accounted for greater than 10% of our revenues. For the year ended December 31, 2011, all of our total revenues and gross profits were generated by the Acute Care segment and no one customer accounted for greater than 10% of our revenues.
Recently Adopted Accounting Standards
In February 2013, the FASB issued ASU 2013-02,
Comprehensive Income (Topic 220): Reporting of Amounts Reclassified Out of Accumulated Other Comprehensive Income ("AOCI"),
which aims to improve the reporting of reclassifications out of AOCI. This update requires an entity to report the effect of significant reclassifications out of AOCI on the respective line items in net income if the amount being reclassified is required under GAAP to be reclassified in its entirety to net income. For other amounts that are not required under GAAP to be reclassified in their entirety to net income in the same reporting period, an entity is required to cross-reference other disclosures required under GAAP that provide additional detail about those amounts. The amendments do not change the current requirements for reporting net income or other comprehensive income in financial statements. We adopted this guidance in the first quarter of 2013, without any impact to our financial position, operating results or cash flows.
Recently Issued Accounting Standards
In July 2013, the FASB issued ASU 2013-11,
Income Taxes (Topic 740): Presentation of an Unrecognized Tax Benefit When a Net Operating Loss Carryforward, a Similar Tax Loss, or a Tax Credit Carryforward Exists.
ASU 2013-11 requires an entity to present an unrecognized tax benefit, or a portion of an unrecognized tax benefit, as a reduction to a deferred tax asset for a net operating loss carryforward, a similar tax loss, or a tax credit carryforward, except as follows: to the extent a net operating loss carryforward, a similar tax loss, or a tax credit carryforward is not available at the reporting date under the tax law of the applicable jurisdiction to settle any additional income taxes that would result from the disallowance of a tax position or the tax law of the applicable jurisdiction does not require the entity to use, and the entity does not intend to use, the deferred tax asset for such purpose, the unrecognized tax benefit should be presented in the financial statements as a liability and should not be combined with deferred tax assets. We will adopt the amendments in ASU 2013-11 in the first quarter of 2014, and do not expect the adoption to have a material impact on our financial position, operating results or cash flows.
MTS Medication Technologies, Inc.
On May 21, 2012, we completed our acquisition of MedPak Holdings, Inc. ("MedPak") pursuant to an Agreement and Plan of Merger (the "Merger Agreement") under which Mercury Acquisition Corp, a newly formed Omnicell subsidiary, was merged with and into MedPak, with MedPak surviving the merger as a wholly-owned subsidiary of Omnicell. MedPak is the parent company of MTS Medication Technologies, Inc. ("MTS").
The MTS acquisition primarily was to align Omnicell with the long term trends of the healthcare market to manage the health of patients across the continuum of care. We can now better serve both the acute care and non-acute care markets. Omnicell and MTS bring capabilities to each other that strengthen the product lines and expand the medication management coverage of both companies.
We accounted for the acquisition in accordance with the provisions of FASB ASC Topic 805,
Business Combinations
. Under the acquisition method, the estimated fair value of the consideration transferred to purchase the acquired company is allocated to the assets acquired and the liabilities assumed based on their fair values. We have made significant estimates and assumptions in determining the allocation of the acquisition consideration.
Pursuant to the terms of the Merger Agreement, we paid approximately
$158.3 million
in cash after adjustments provided for in the Merger Agreement, of which approximately
$13.5 million
was placed in an escrow fund, to be distributed to MedPak's stockholders (subject to claims that we may make against the escrow fund for indemnification and other claims following the closing). The revised acquisition consideration of
$158.3 million
is comprised entirely of cash at closing. In October 2012, a portion of the escrow fund set aside for the working capital adjustment was disbursed, with Omnicell receiving
$0.3 million
and MedPak's former stockholders receiving the remainder. In November of 2013, the remainder of the escrow fund was disbursed to the former MedPak stockholders.
During the first quarter of 2013, we reduced goodwill by
$0.1 million
due to an adjustment in stockholder's equity.
F- 16
The total acquisition price was approximately
$158.3 million
and was allocated as follows (in thousands):
|
|
Fair value acquired
|
|
|||
|
Cash including restricted cash
|
$
|
2,000
|
|
||
|
Accounts receivable
|
7,403
|
|
|||
|
Inventory
|
11,726
|
|
|||
|
Deferred tax assets and other current assets
|
2,894
|
|
|||
|
Total current assets
|
24,023
|
|
|||
|
Property and equipment
|
9,807
|
|
|||
|
Intangible assets
|
83,900
|
|
|||
|
Goodwill
|
82,800
|
|
|||
|
Other non-current assets
|
308
|
|
|||
|
Total assets
|
200,838
|
|
|||
|
Current liabilities
|
(7,917
|
)
|
|||
|
Non-current deferred tax liabilities
|
(33,386
|
)
|
|||
|
Other non-current liabilities
|
(1,223
|
)
|
|||
|
Net assets acquired
|
$
|
158,312
|
|
||
|
Cash consideration, fair value
|
$
|
158,312
|
|
||
Identifiable intangible assets.
Acquired technology relates to MTS’ products across all of its product lines that have reached technological feasibility, primarily the OnDemand technology. Trade name is primarily related to the MTS and OnDemand brand names. Customer relationships represent existing contracted relationships with pharmacies, institutional care facilities and others. Acquired technology, customer relationships, and trade names will be amortized on a straight-line basis over their estimated useful lives, which range from
12
to
30
years.
The estimated fair values of the acquired technology, trade names and customer relationships were primarily determined using either the relief-from-royalty or excess earnings methods. The interest rates utilized to discount net cash flows to their present values were determined after consideration of the overall enterprise rate of return and the relative risk and importance of the assets to the generation of future cash flows.
For income tax purposes, the historical tax bases of the acquired assets and assumed liabilities, along with the tax attributes of the MTS companies, will carry over. Because the transaction was a cash-for-stock transaction, there is no tax basis in the newly acquired intangible assets. Accordingly, the acquisition accounting includes the establishment of net deferred tax liabilities of
$33.4 million
, resulting from book tax basis differences related to the intangible assets acquired, as well as to the step up in the value of fixed assets and inventory to their estimated fair values at the time of acquisition.
Details of acquired intangibles are as follows (in thousands, except for years):
|
Fair value acquired
|
|
Useful Life (years)
|
First year amortization expense
|
|
|||||||
|
Trade name
|
$
|
6,800
|
|
12
|
$
|
567
|
|
||||
|
Customer relationships
|
50,500
|
|
28 to 30
|
1,707
|
|
||||||
|
Acquired technology
|
26,600
|
|
20
|
1,330
|
|
||||||
|
Intangibles acquired
|
$
|
83,900
|
|
$
|
3,604
|
|
|||||
|
Weighted average life of intangibles
|
25.14
|
||||||||||
Goodwill.
Approximately
$82.8 million
has been allocated to goodwill. Goodwill represents the excess of the fair value of the consideration transferred over the fair value of the underlying net tangible and identifiable intangible assets on the acquisition date. In accordance with ASC Topic 350,
Intangibles
-
Goodwill and Other
, goodwill will not be amortized, but instead will be tested for impairment at least annually or more frequently if certain indicators are present. We believe the MTS acquisition enhances our offerings and diversifies our revenue mix, providing a more robust product and service solution to our
F- 17
current customers while expanding Omnicell’s international presence. We consider these factors as supporting the amount of goodwill recorded.
For the year ended December 31, 2012
, we incurred approximately
$3.2 million
in acquisition-related costs in connection with the MTS acquisition. These costs are included primarily in selling, general and administrative expenses on our Consolidated Statement of Operations.
During the year ended
December 31, 2012
, the acquired MTS operations (consolidated since the May 21, 2012 acquisition date) generated revenue of approximately
$47.2 million
and net income of
$2.9 million
.
Basic net income per share is computed by dividing net income for the period by the weighted average number of shares outstanding during the period, less shares subject to repurchase. Diluted net income per share is computed by dividing net income for the period by the weighted average number of shares, less shares subject to repurchase, plus, if dilutive, potential common stock outstanding during the period. Potential common stock includes the effect of outstanding dilutive stock options, restricted stock awards and restricted stock units computed using the treasury stock method. Since their impact is anti-dilutive, the total number of shares excluded from the calculations of diluted net income per share
for the years ended December 31, 2013, 2012 and 2011
were
850,133
,
2,149,044
and
1,833,574
shares, respectively.
The calculation of basic and diluted net income per share is as follows (in thousands, except per share amounts):
|
|
Years Ended December 31
|
|||||||||||
|
|
2013
|
2012
|
2011
|
|||||||||
|
Basic:
|
|
|
|
|
|
|
||||||
|
Net income
|
$
|
23,979
|
|
$
|
16,178
|
|
$
|
10,389
|
|
|||
|
Weighted average shares outstanding — basic
|
34,736
|
|
33,307
|
|
33,123
|
|
||||||
|
Net income per share — basic
|
$
|
0.69
|
|
$
|
0.49
|
|
$
|
0.31
|
|
|||
|
Diluted:
|
|
|
|
|
|
|
||||||
|
Net income
|
$
|
23,979
|
|
$
|
16,178
|
|
$
|
10,389
|
|
|||
|
Weighted average shares outstanding — basic
|
34,736
|
|
33,307
|
|
33,123
|
|
||||||
|
Add: Dilutive effect of employee stock plans
|
1,041
|
|
906
|
|
980
|
|
||||||
|
Weighted average shares outstanding — diluted
|
35,777
|
|
34,213
|
|
34,103
|
|
||||||
|
Net income per share — diluted
|
$
|
0.67
|
|
$
|
0.47
|
|
$
|
0.30
|
|
|||
Cash and cash equivalents consist of the following significant investment asset classes, with disclosure of amortized cost, gross unrealized gains and losses, and fair value as of
December 31, 2013
and
December 31, 2012
(in thousands):
|
|
December 31, 2013
|
|
||||||||||||||||||||
|
|
Amortized
Cost
|
Unrealized
Gains
|
Unrealized
Losses
|
Fair Value
|
Cash / Cash
Equivalents
|
Security
Classification
|
||||||||||||||||
|
Cash
|
$
|
38,823
|
|
|
$
|
—
|
|
|
$
|
—
|
|
|
$
|
38,823
|
|
|
$
|
38,823
|
|
|
|
N/A
|
|
Money market funds
|
65,708
|
|
|
—
|
|
|
—
|
|
|
65,708
|
|
|
65,708
|
|
|
|
Available for sale
|
|||||
|
Total cash and cash equivalents
|
$
|
104,531
|
|
|
$
|
—
|
|
|
$
|
—
|
|
|
$
|
104,531
|
|
|
$
|
104,531
|
|
|
|
|
F- 18
|
|
December 31, 2012
|
|
||||||||||||||||||||
|
|
Amortized
Cost
|
Unrealized
Gains
|
Unrealized
Losses
|
Fair Value
|
Cash / Cash
Equivalents
|
Security
Classification
|
||||||||||||||||
|
Cash
|
$
|
23,422
|
|
$
|
—
|
|
$
|
—
|
|
$
|
23,422
|
|
$
|
23,422
|
|
N/A
|
||||||
|
Money market funds
|
38,892
|
|
—
|
|
1
|
|
38,891
|
|
38,891
|
|
Available for sale
|
|||||||||||
|
Total cash and cash equivalents
|
$
|
62,314
|
|
$
|
—
|
|
$
|
1
|
|
$
|
62,313
|
|
$
|
62,313
|
|
|
||||||
The money market fund is a daily-traded cash equivalent with a price of
$1.00
, making it a Level 1 asset class, and its carrying cost closely approximates fair value. As demand deposit (cash) balances vary with the timing of collections and payments, the money market fund can cover any surplus or deficit, and thus is considered Available-for-sale.
The following table displays the financial assets measured at fair value, on a recurring basis, with money market funds recorded within cash and cash equivalents (in thousands):
|
|
Quoted Prices in Active
Markets for Identical
Instruments
(Level 1)
|
Significant Other
Observable Inputs
(Level 2)
|
Significant
Unobservable
Inputs
(Level 3)
|
Total Fair
Value
|
|||||||||||
|
At December 31, 2013
|
$
|
—
|
|
|
|
|
|
|
|
||||||
|
Money market funds
|
$
|
65,708
|
|
$
|
—
|
|
$
|
—
|
|
$
|
65,708
|
|
|||
|
Total
|
$
|
65,708
|
|
$
|
—
|
|
$
|
—
|
|
$
|
65,708
|
|
|||
|
At December 31, 2012
|
|
|
|
|
|
|
|
|
|||||||
|
Money market funds
|
$
|
38,891
|
|
$
|
—
|
|
$
|
—
|
|
$
|
38,891
|
|
|||
|
Total
|
$
|
38,891
|
|
$
|
—
|
|
$
|
—
|
|
$
|
38,891
|
|
|||
Current assets and current liabilities are recorded at amortized cost, which approximates fair value due to the short-term maturities implied.
Inventories consist of the following (in thousands):
|
December 31,
2013 |
December 31,
2012 |
||||||
|
Raw materials
|
$
|
10,765
|
|
$
|
9,994
|
|
|
|
Work in process
|
534
|
|
385
|
|
|||
|
Finished goods
|
20,158
|
|
16,524
|
|
|||
|
Total
|
$
|
31,457
|
|
$
|
26,903
|
|
|
Property and equipment consist of the following (in thousands):
F- 19
|
|
December 31,
2013 |
December 31,
2012 |
|||||
|
Equipment
|
$
|
40,180
|
|
$
|
32,528
|
|
|
|
Furniture and fixtures
|
5,260
|
|
5,126
|
|
|||
|
Leasehold improvements
|
7,394
|
|
6,992
|
|
|||
|
Purchased software
|
20,199
|
|
19,870
|
|
|||
|
Construction in process
|
2,649
|
|
2,693
|
|
|||
|
|
75,682
|
|
67,209
|
|
|||
|
Accumulated depreciation and amortization
|
(40,428
|
)
|
(33,102
|
)
|
|||
|
Property and equipment, net
|
$
|
35,254
|
|
$
|
34,107
|
|
|
Depreciation and amortization of property and equipment was approximately
$10.9 million
,
$8.0 million
, and
$5.7 million
for the years ended December 31, 2013, 2012 and 2011
, respectively.
Our sales-type leases are for terms generally ranging up to
five years
. Sales-type lease receivables are collateralized by the underlying equipment. The components of our net investment in sales-type leases are as follows (in thousands):
|
December 31,
2013 |
December 31,
2012 |
||||||
|
Net minimum lease payments to be received
|
$
|
18,172
|
|
$
|
19,665
|
|
|
|
Less unearned interest income portion
|
1,455
|
|
1,205
|
|
|||
|
Net investment in sales-type leases
|
16,717
|
|
18,460
|
|
|||
|
Less current portion(1)
|
5,232
|
|
5,232
|
|
|||
|
Non-current net investment in sales-type leases(2)
|
$
|
11,485
|
|
$
|
13,228
|
|
|
(1)
A component of other current assets. This amount is net of allowance for doubtful accounts of
$0.1 million
as of
December 31, 2013
and
$0.5 million
as of
December 31, 2012
.
(2)
Net of allowance for doubtful accounts of
$0.1 million
as of
December 31, 2013
and
$0.1 million
as of
December 31, 2012
.
The minimum lease payments under sales-type leases as of
December 31, 2013
were as follows (in thousands):
|
2014
|
$5,851
|
||
|
2015
|
4,857
|
|
|
|
2016
|
3,618
|
|
|
|
2017
|
2,710
|
|
|
|
2018
|
1,136
|
|
|
|
Total
|
$18,172
|
||
The following table summarizes the credit losses and recorded investment in sales-type leases, excluding unearned interest, as of
December 31, 2013
and
December 31, 2012
(in thousands):
F- 20
|
|
Allowance for Credit Losses
|
Recorded Investment
in Sales-type Leases Gross
|
Recorded Investment
in Sales-type Leases Net
|
||||||||
|
Credit loss disclosure for December 31, 2013:
|
|
|
|
|
|
|
|||||
|
Accounts individually evaluated for impairment
|
$
|
—
|
|
$
|
—
|
|
$
|
—
|
|
||
|
Accounts collectively evaluated for impairment
|
167
|
|
16,884
|
|
16,717
|
|
|||||
|
Ending balances: December 31, 2013
|
$
|
167
|
|
$
|
16,884
|
|
$
|
16,717
|
|
||
|
Credit loss disclosure for December 31, 2012:
|
|
|
|
|
|
|
|||||
|
Accounts individually evaluated for impairment
|
$
|
489
|
|
$
|
489
|
|
$
|
—
|
|
||
|
Accounts collectively evaluated for impairment
|
118
|
|
18,578
|
|
18,460
|
|
|||||
|
Ending balances: December 31, 2012
|
$
|
607
|
|
$
|
19,067
|
|
$
|
18,460
|
|
||
The following table summarizes the activity for the allowance for credit losses account for the investment in sales-type leases
for the year ended December 31, 2013
(in thousands):
|
Year Ended
December 31, 2013
|
||
|
Allowance for credit losses, December 31, 2012
|
607
|
|
|
Current period provision (reversal)
|
49
|
|
|
Direct write-downs charged against the allowance
|
(413
|
)
|
|
Recoveries of amounts previously charged off
|
(76
|
)
|
|
Allowance for credit losses at December 31, 2013
|
167
|
|
Activity in goodwill by reporting units, which are the same as our operating segments,
for the year ended December 31, 2013
consists of the following (in thousands):
|
Goodwill at December 31, 2012
|
Adjustments to Goodwill
|
Goodwill at December 31, 2013
|
|||||||||
|
Reporting units:
|
|||||||||||
|
Acute Care
|
$
|
28,543
|
|
$
|
—
|
|
$
|
28,543
|
|
||
|
Non-Acute Care
|
82,864
|
|
(64
|
)
|
82,800
|
|
|||||
|
Total
|
$
|
111,407
|
|
$
|
(64
|
)
|
$
|
111,343
|
|
||
Goodwill reflects the May 2012 acquisition of MedPak by Omnicell. MedPak is the parent company of MTS, a worldwide provider of medication adherence packaging systems. The acquired goodwill was assigned to the Non-Acute Care segment, created as a result of the MTS acquisition. During the first quarter of 2013, we reduced goodwill by approximately
$0.1 million
due to the adjustment to the fair value of an acquired foreign currency forward contract previously carried in a component of stockholder's equity.
There were no indefinite-life intangibles at either
December 31, 2013
or
December 31, 2012
. Finite-life intangible assets at these dates consist of the following (in thousands):
F- 21
|
|
December 31, 2013
|
December 31, 2012
|
|
||||||||||||||||
|
|
Gross
|
|
Net
|
Gross
|
|
Net
|
|
||||||||||||
|
Carrying
Amount
|
Accumulated
Amortization
|
Carrying
Amount
|
Carrying
Amount
|
Accumulated
Amortization
|
Carrying
Amount
|
Amortization
Life
|
|||||||||||||
|
Finite-lived intangibles:
|
|
|
|
|
|
|
|
|
|
|
|
|
|
||||||
|
Customer relationships
|
54,730
|
|
5,236
|
|
49,494
|
|
54,730
|
|
3,081
|
|
51,649
|
|
5-30 years
|
||||||
|
Acquired technology
|
27,580
|
|
2,598
|
|
24,982
|
|
27,580
|
|
1,128
|
|
26,452
|
|
3-20 years
|
||||||
|
Patents
|
1,493
|
|
254
|
|
1,239
|
|
1,217
|
|
259
|
|
958
|
|
20 years
|
||||||
|
Trade name
|
6,890
|
|
1,003
|
|
5,887
|
|
6,890
|
|
414
|
|
6,476
|
|
3-12 years
|
||||||
|
Non-compete agreements
|
60
|
|
60
|
|
—
|
|
60
|
|
45
|
|
15
|
|
3 years
|
||||||
|
Total finite-lived intangibles
|
90,753
|
|
9,151
|
|
81,602
|
|
90,477
|
|
4,927
|
|
85,550
|
|
|
||||||
During 2013, 2012 and 2011, we capitalized third-party costs associated with internally-developed patents of
$0.4 million
,
$0.4 million
and
$0.2 million
, respectively.
Amortization expense of other intangible assets totaled
$4.3 million
,
$2.9 million
and
$0.7 million
for the years ended December 31, 2013, 2012 and 2011
, respectively. The amortization of acquired technology is included within product cost of sales; other acquired intangibles are usually amortized within selling, general and administrative expenses.
Estimated annual expected amortization expense of the finite-lived intangible assets at
December 31, 2013
was as follows (in thousands):
|
2014
|
4,229
|
|
|
|
2015
|
4,204
|
|
|
|
2016
|
3,854
|
|
|
|
2017
|
3,818
|
|
|
|
2018
|
3,711
|
|
|
|
Thereafter
|
61,786
|
|
|
|
Total
|
$
|
81,602
|
|
Other assets consist of the following (in thousands):
|
December 31,
|
|||||||
|
2013
|
2012
|
||||||
|
Capitalized software development costs, net of accumulated amortization of $10,547 and $7,329 in 2013 and 2012, respectively
|
$
|
13,660
|
|
$
|
11,037
|
|
|
|
Technology license
|
2,350
|
|
2,800
|
|
|||
|
Long-term deposits
|
682
|
|
694
|
|
|||
|
Other assets
|
1,245
|
|
1,247
|
|
|||
|
Total
|
$
|
17,937
|
|
$
|
15,778
|
|
|
Accrued liabilities consist of the following (in thousands):
F- 22
|
|
December 31,
2013 |
December 31,
2012 |
|||||
|
Rebates and lease buyouts
|
$
|
1,699
|
|
$
|
3,179
|
|
|
|
Advance payments from customers
|
4,971
|
|
2,829
|
|
|||
|
Accrued Group Purchasing Organization (GPO) fees
|
2,324
|
|
2,278
|
|
|||
|
Technology license purchase obligation, current portion
|
1,500
|
|
1,750
|
|
|||
|
Taxes payable
|
1,664
|
|
555
|
|
|||
|
Other
|
1,588
|
|
1,397
|
|
|||
|
Total
|
$
|
13,746
|
|
$
|
11,988
|
|
|
Deferred gross profit consists of the following (in thousands):
|
|
December 31,
2013 |
December 31,
2012 |
|||||
|
Sales of medication and supply dispensing systems and packaging equipment, which have been delivered and invoiced but not yet installed
|
$
|
29,040
|
|
$
|
30,138
|
|
|
|
Cost of revenues, excluding installation costs
|
(9,083
|
)
|
(9,366
|
)
|
|||
|
Deferred gross profit
|
$
|
19,957
|
|
$
|
20,772
|
|
|
At
December 31, 2013
, the minimum payments under our operating leases for each of the five succeeding fiscal years were as follows (in thousands):
|
2014
|
$
|
5,787
|
|
|
2015
|
5,476
|
|
|
|
2016
|
5,150
|
|
|
|
2017
|
4,468
|
|
|
|
2018
|
4,298
|
|
|
|
Thereafter
|
16,601
|
|
|
|
Total
|
$
|
41,780
|
|
Commitments under operating leases relate primarily to leasehold property and office equipment. Rent expense totaled
$8.1 million
,
$5.7 million
and
$3.3 million
for the years ended December 31, 2013, 2012 and 2011
, respectively. For 2011,we had
$0.5 million
of non-cancelable sublease income.
In
October 2011
, we entered into a lease agreement for approximately
100,000
square feet of office space. Pursuant to the lease agreement, the landlord constructed a single, three-story building of rentable space in Mountain View, California which we now lease and which serves as our headquarters. The term of the lease agreement, which commenced in November 2012, is for a period of
10 years
, with a base lease commitment of approximately
$40.0 million
. We have two options to extend the term of the lease agreement at market rates. Each extension is for an additional 60 month term.
In
March 2012
, we entered into a lease agreement for approximately
46,000
square feet of manufacturing, distribution and office space located in Milpitas, California which commenced in October, 2012. The term of the lease agreement is for a period of
60 months
, with a base lease commitment of approximately
$1.8 million
and a single 60 month extension option.
In connection with the acquisition of MTS, we assumed responsibility for its
132,500
square feet of manufacturing, warehousing and office space in St. Petersburg, Florida. The remaining term of the original
twelve
year lease agreement, which expires in September 2016 and at the time of the MTS acquisition, had a remaining base lease commitment of approximately
$3.9 million
. We have two options to extend the term of the lease agreement at market rates. Each extension is for an additional 60 month term.
F- 23
In Leeds, United Kingdom, we lease an office and distribution center of approximately
16,500
square feet. The remaining term of the original
ten
year lease agreement is through
June 8, 2021
, with
no
extension options. The base lease commitment at the time of the MTS acquisition, converted from British Pounds at the conversion rate then in effect, was approximately
$1.2 million
.
We also have smaller rented offices in Strongsville, Ohio, Nashville, Tennessee, Waukegan, Illinois, the United Arab Emirates, the People's Republic of China and the Federal Republic of Germany.
We purchase components from a variety of suppliers and use contract manufacturers to provide manufacturing services for our products. During the normal course of business, we issue purchase orders with estimates of our requirements several months ahead of the delivery dates. Our near-term commitments to our contract manufacturers and suppliers totaled
$7.4 million
as of
December 31, 2013
.
Legal Proceedings
On March 8, 2013, Bobbi Polanco (“Polanco”) filed a putative class action complaint in the United States District Court for the District of New Jersey (the "Court") against Omnicell and certain of our customers (Case No. 1:13-cv-01417-NLH-KLM) alleging breach of state security notification laws, violations of state consumer fraud laws, fraud, negligence and conspiracy relating to the theft of an Omnicell electronic device containing medication dispensing cabinet log files, including certain patient health information, and subsequent notification of this unauthorized disclosure of personal health information. Polanco is seeking an injunction against the defendants to prevent each of them from committing the acts complained of in the future and monetary damages, costs and expenses. On May 2, 2013, the Court entered an order to show cause which provided, in relevant part, that Polanco is required to show cause as to why the case should not be dismissed for lack of subject matter jurisdiction. On May 13, 2013, Polanco filed an amended complaint. On May 31, 2013, Omnicell filed a motion to dismiss the complaint on the grounds that Polanco failed to satisfy constitutional standing requirements and that she failed to state a claim against Omnicell for violating state data breach notification statutes, consumer fraud, common law fraud, negligence and conspiracy. Omnicell also joined in the arguments of the other defendants seeking dismissal. On July 1, 2013, Polanco filed an opposition to the motions to dismiss. On July 15, 2013, Omnicell filed its reply to the opposition from Polanco. In December 2013, the Court granted the defendants' motions to dismiss without prejudice. Polanco failed to file an appeal of the Court's decision by the January 27, 2014 deadline.
As required under ASC 450,
Contingencies
, we accrue for contingencies when we believe that a loss is probable and that we can reasonably estimate the amount of any such loss. We have not recorded any accrual for contingent liabilities associated with the legal proceedings described above based on our belief that any potential loss, while reasonably possible, is not probable. Further, any possible range of loss in these matters cannot be reasonably estimated at this time. We believe that we have valid defenses with respect to legal proceedings pending against us. However, litigation is inherently unpredictable, and it is possible that cash flows or results of operations could be materially affected in any particular period by the unfavorable resolution of this contingency or because of the diversion of management's attention and the creation of significant expenses.
Guarantees
As permitted under Delaware law and our certificate of incorporation and bylaws, we have agreed to indemnify our directors and officers against certain losses that they may suffer by reason of the fact that such persons are, were or become our directors or officers. The term of the indemnification period is for the director’s or officer’s lifetime and there is no limit on the potential amount of future payments that we could be required to make under these indemnification agreements. We have purchased a directors’ and officers’ liability insurance policy that may enable us to recover a portion of any future payments that we may be required to make under these indemnification agreements. Assuming the applicability of coverage and the willingness of the insurer to assume coverage and subject to certain retention, loss limits and other policy provisions, we believe it is unlikely that we will be required to pay any material amounts pursuant to these indemnification obligations. However, no assurances can be given that the insurers will not attempt to dispute the validity, applicability or amount of coverage without expensive and time-consuming litigation against the insurers.
Additionally, we undertake indemnification obligations in our ordinary course of business in connection with, among other things, the licensing of our products and the provision of our support services. In the ordinary course of our business, we have in the past and may in the future agree to indemnify another party, generally our business affiliates or customers, against certain losses suffered or incurred by the indemnified party in connection with various types of claims, which may include, without limitation, claims of intellectual property infringement, certain tax liabilities, our gross negligence or intentional acts in the performance of support services and violations of laws. The term of these indemnification obligations is generally
F- 24
perpetual. In general, we attempt to limit the maximum potential amount of future payments that we may be required to make under these indemnification obligations to the amounts paid to us by a customer, but in some cases the obligation may not be so limited. In addition, we have in the past and may in the future warrant to our customers that our products will conform to functional specifications for a limited period of time following the date of installation (generally not exceeding 30 days) or that our software media is free from material defects. Sales contracts for certain of our medication packaging systems often include limited warranties for up to six months, but the periodic activity and ending warranty balances we record have historically been immaterial.
From time to time, we may also warrant that our professional services will be performed in a good and workmanlike manner or in a professional manner consistent with industry standards. We generally seek to disclaim most warranties, including any implied or statutory warranties such as warranties of merchantability, fitness for a particular purpose, title, quality and non-infringement, as well as any liability with respect to incidental, consequential, special, exemplary, punitive or similar damages. In some states, such disclaimers may not be enforceable. If necessary, we would provide for the estimated cost of product and service warranties based on specific warranty claims and claim history. We have not been subject to any significant claims for such losses and have not incurred any material costs in defending or settling claims related to these indemnification obligations. Accordingly, we believe it is unlikely that we will be required to pay any material amounts pursuant to these indemnification obligations or potential warranty claims and, therefore, no material liabilities have been recorded for such indemnification obligations as of
December 31, 2013
or
December 31, 2012
.
The following is a geographical breakdown of income before the provision for income taxes (in thousands):
|
|
Years Ended December 31,
|
||||||||||
|
|
2013
|
2012
|
2011
|
||||||||
|
Domestic
|
$
|
34,678
|
|
$
|
25,794
|
|
$
|
16,177
|
|
||
|
Foreign
|
351
|
|
1,281
|
|
(88
|
)
|
|||||
|
Total income before provision for income taxes
|
$
|
35,029
|
|
$
|
27,075
|
|
$
|
16,089
|
|
||
The provision for income taxes consists of the following (in thousands):
|
|
Years Ended December 31,
|
||||||||||
|
|
2013
|
2012
|
2011
|
||||||||
|
Current:
|
|
|
|
||||||||
|
Federal
|
$
|
8,218
|
|
$
|
7,181
|
|
$
|
4,285
|
|
||
|
State
|
1,621
|
|
1,006
|
|
896
|
|
|||||
|
Foreign
|
447
|
|
154
|
|
(70
|
)
|
|||||
|
Total current
|
10,286
|
|
8,341
|
|
5,111
|
|
|||||
|
Deferred:
|
|
|
|
||||||||
|
Federal
|
1,287
|
|
2,169
|
|
1,116
|
|
|||||
|
State
|
(263
|
)
|
651
|
|
(527
|
)
|
|||||
|
Foreign
|
(260
|
)
|
(264
|
)
|
—
|
|
|||||
|
Total deferred
|
764
|
|
2,556
|
|
589
|
|
|||||
|
Total provision for income taxes
|
$
|
11,050
|
|
$
|
10,897
|
|
$
|
5,700
|
|
||
The provision for income taxes differs from the amount computed by applying the statutory federal tax rate as follows (in thousands):
F- 25
|
|
Years Ended December 31,
|
||||||||||
|
|
2013
|
2012
|
2011
|
||||||||
|
U.S. federal tax provision at statutory rate
|
$
|
12,260
|
|
$
|
9,476
|
|
$
|
5,631
|
|
||
|
State taxes
|
883
|
|
1,077
|
|
240
|
|
|||||
|
Non-deductible expenses
|
297
|
|
530
|
|
481
|
|
|||||
|
Acquisition costs
|
—
|
|
431
|
|
—
|
|
|||||
|
Share-based compensation expense
|
407
|
|
403
|
|
443
|
|
|||||
|
Research tax credits
|
(1,430
|
)
|
—
|
|
(755
|
)
|
|||||
|
Domestic production deduction
|
(816
|
)
|
(601
|
)
|
(271
|
)
|
|||||
|
Other
|
(551
|
)
|
(419
|
)
|
(69
|
)
|
|||||
|
Total
|
$
|
11,050
|
|
$
|
10,897
|
|
$
|
5,700
|
|
||
F- 26
Significant components of our deferred tax assets (liabilities) are as follows (in thousands):
|
|
December 31,
|
||||||
|
|
2013
|
2012
|
|||||
|
Deferred tax assets (liabilities):
|
|
|
|||||
|
Tax credit carry forwards
|
$
|
3,160
|
|
$
|
2,990
|
|
|
|
Inventory related items
|
2,947
|
|
2,900
|
|
|||
|
Deferred revenue
|
11,074
|
|
11,497
|
|
|||
|
Stock compensation
|
7,447
|
|
9,331
|
|
|||
|
Loss carry forwards
|
64
|
|
53
|
|
|||
|
Other, net
|
5
|
|
69
|
|
|||
|
Subtotal
|
24,697
|
|
26,840
|
|
|||
|
Less: valuation allowance
|
(39
|
)
|
(39
|
)
|
|||
|
Total net deferred tax assets
|
24,658
|
|
26,801
|
|
|||
|
Reserves and accruals
|
(353
|
)
|
(573
|
)
|
|||
|
Depreciation and amortization
|
(38,681
|
)
|
(39,840
|
)
|
|||
|
Total deferred tax liabilities
|
(39,034
|
)
|
(40,413
|
)
|
|||
|
|
|||||||
|
Net deferred tax liabilities
|
$
|
(14,376
|
)
|
$
|
(13,612
|
)
|
|
Deferred income tax assets (liabilities) are provided for temporary differences that will result in future tax deductions or future taxable income, as well as the future benefit of tax credit carry forwards. We recognize deferred tax assets to the extent that we believe these assets are more likely than not to be realized. In making such a determination, we consider all available positive and negative evidence, including future reversals of existing taxable temporary differences, projected future taxable income, tax-planning strategies, and results of recent operations. On the basis of this evaluation, as of
December 31, 2013
, no significant valuation allowances have been recorded in any jurisdiction.
As of
December 31, 2013
, we had state net operating loss carry forwards available for state income tax purposes of approximately
$2.2 million
. If not utilized, these carry forwards will begin to expire in 2026. In addition, as of December 31, 2013 we had federal and California research credit carry forwards of approximately
$1.5 million
and
$7.2 million
, respectively. If not utilized the federal credit carry forwards will begin to expire in 2022, while the California credits can be carried forward indefinitely. Pursuant to the requirements of ASC 718, we do not include unrealized stock option attributes as components of our deferred tax assets. The tax effected amounts of gross unrealized net operating loss and business tax credit carry forwards excluded under ASC 718
for the year ended December 31, 2013
are approximately
$2.6 million
, which will result in increases to additional paid in capital if and when realized as a reduction in income taxes otherwise paid.
In general, it is our practice and intention to reinvest the earnings of our non-U.S. subsidiaries in those operations. As of December 31, 2013, we have not made a provision for U.S. federal income and state income taxes on accumulated and current earnings of
$2.8 million
related to our U.K. and German subsidiaries because these earnings are intended to be indefinitely reinvested in operations outside the United States. If we expect to distribute those earnings in the form of dividends or otherwise, we would be subject to U.S. and state income taxes reported as a component of income tax expense, in the amount of
$1.1 million
. This amount may be reduced by any foreign tax credits available at the time of repatriation.
We file income tax returns in the U.S. and various states and foreign jurisdictions. In the normal course of business, we are subject to examination by tax authorities, including in major jurisdictions in the United States, California, UK and Germany. In 2012, we concluded audits by the Internal Revenue Service and California Franchise Tax Board for tax years 2008 and 2009. However, all of the net operating loss and research credit carry forwards that may be used in future years are subject to adjustment, if and when utilized. As such our federal and California tax years remain open from 1996 and 1992, respectively.
The aggregate changes in the balance of gross unrecognized tax benefits, which excludes interest and penalties, for the three years ended
December 31, 2013
is as follows (in thousands):
F- 27
|
Balance as of December 31, 2010
|
$
|
5,431
|
|
|
Decreases related to tax positions taken during the prior period
|
(88
|
)
|
|
|
Increases related to tax positions taken during the current period
|
453
|
|
|
|
Balance as of December 31, 2011
|
$
|
5,796
|
|
|
Increases related to tax positions taken during a prior period
|
43
|
|
|
|
Increases related to tax positions related to MTS
|
1,066
|
||
|
Increases related to tax positions taken during the current period
|
422
|
|
|
|
Decreases related to settlements
|
(33
|
)
|
|
|
Decreases related to expiration of statute of limitations
|
(379
|
)
|
|
|
Balance as of December 31, 2012
|
$
|
6,915
|
|
|
Increases related to tax positions taken during a prior period
|
406
|
||
|
Decreases related to tax positions taken during the prior period
|
(79
|
)
|
|
|
Increases related to tax positions taken during the current period
|
764
|
|
|
|
Decreases related to expiration of statute of limitations
|
(32
|
)
|
|
|
Balance as of December 31, 2013
|
$
|
7,974
|
|
As of
December 31, 2013
, the total amount of gross unrecognized tax benefits, if realized, would affect our tax expense by approximately
$7.0 million
. Our policy is to recognize interest and penalties related to unrecognized tax benefits in operating expenses. The total amount of interest and penalties recorded in 2013 was not significant. We do not expect any material changes to our unrecognized tax benefits over the next twelve months.
Treasury Stock
2008 Stock Repurchase Program
In February 2008, our Board of Directors authorized a stock repurchase program, (the "2008 Repurchase Program") for the repurchase of up to
$90.0 million
of our common stock. The timing, price and volume of the repurchases have been based on market conditions, relevant securities laws and other factors.
For the year ended December 31, 2012, we repurchased
898,168
shares at an average cost of
$13.76
per share, including commissions. For the year ended December 31, 2011, we repurchased
889,511
shares at an average cost of
$14.13
per share, including commissions. All repurchased shares were recorded as treasury stock and were accounted for under the cost method. No repurchased shares have been retired. Additionally,
for the years ended December 31, 2013, 2012 and 2011
, we withheld
103,229
shares,
79,968
shares and
43,174
shares, respectively, from employees to satisfy tax withholding obligations on the vesting of restricted stock.
From the inception of the 2008 Repurchase Program in February 2008 through
December 31, 2012
, we repurchased a total of
5,853,975
shares at an average cost of
$15.37
per share through open market purchases. As of December 31, 2012, we have completed the 2008 Repurchase Program having repurchased
$90.0 million
of our common stock.
2012 Stock Repurchase Program
On August 1, 2012, our Board of Directors established a new stock repurchase program (the "2012 Repurchase Program") authorizing share repurchases of up to
$50.0 million
of our common stock, with no termination date. The timing, price and volume of repurchases will be based on market conditions, relevant securities laws and other factors. The stock repurchases may be made from time to time on the open market, in privately negotiated transactions or pursuant to a Rule 10b-18 plan. The stock repurchase program does not obligate us to repurchase any specific number of shares, and Omnicell may terminate or suspend the repurchase program at any time
For the year ended
December 31, 2013
, and from the inception of the 2012 Repurchase Program, we have repurchased a total of
$21.0 million
, or
884,645
shares at an average cost of
$23.70
per share, including commissions. As of
December 31, 2013
, the maximum dollar value of shares that may yet be purchased under the plan is
$29.1 million
.
F- 28
Description of Share-Based Plans
Equity Incentive Plan.
On
May 19, 2009
, at our 2009 Annual Meeting of Stockholders (the "2009 Annual Meeting") our stockholders approved the Omnicell, Inc. 2009 Equity Incentive Plan (the "2009 Plan") which authorized
2,100,000
shares to be issued. The 2009 Plan provides for the issuance of incentive stock options, non-statutory stock options, stock appreciation rights, restricted stock awards, restricted stock unit awards, performance stock awards, performance cash awards and other stock awards to our employees, directors and consultants.
The 2009 Plan succeeded the 1999 Equity Incentive Plan, as amended, the 2003 Equity Incentive Plan, as amended, and the 2004 Equity Incentive Plan (collectively, the "Prior Plans"). No additional awards will be granted under any of the Prior Plans; however, all outstanding stock awards granted under the Prior Plans continue to be subject to the terms and conditions as set forth in the agreements evidencing such stock awards. For purposes of determining future common shares available for grant, for each share granted as a full-value award, including restricted stock and restricted stock units ("RSUs") performance stock awards, the shares available for grant were reduced by
1.4
shares. Equity awards granted as stock options and stock appreciation rights reduce the shares available for grant by one share.
On
December 16, 2010
, at a Special Meeting of Stockholders, our stockholders approved an amendment to increase the number of shares of common stock authorized for issuance under the 2009 Plan by
2,600,000
shares and to provide that the number of common stock shares available for issuance under the 2009 Plan be reduced by
1.8
shares for each share granted as a full-value award granted on and after
October 1, 2010
. For each share granted as a full-value award granted prior to
October 1, 2010
, future shares available for grants under the 2009 Plan were reduced by
1.4
shares. Awards granted as stock options and stock appreciation rights continue to reduce the number of shares available for issuance under the 2009 Plan on a one-for-one basis. On May 21, 2013, at our Annual Meeting of Stockholders, our stockholders approved an amendment to increase the number of shares of common stock authorized for issuance under the 2009 Plan by
2,500,000
shares.
Options granted under the 2009 Plan generally become exercisable over periods of up to
4 years
, generally with one-fourth of the shares vesting one year from the vesting commencement date with respect to initial grants, and the remaining shares vesting in
36
equal monthly installments thereafter; however our Board of Directors may impose different vesting terms at its discretion on any award. Options under the 2009 Plan generally expire
10 years
from the date of grant. We also grant both restricted stock and restricted stock units to participants under the 2009 Plan. The Board of Directors determines the award amount, the vesting provisions and the expiration period (not to exceed ten years) for each grant. Grants of restricted stock to non-employee directors are granted on the date of our annual meeting of stockholders and vest in full on the date of our next annual meeting of stockholders, provided such non-employee director remains a director on such date. The fair value of the stock on the date of issuance is amortized to expense from the date of grant to the date of vesting. RSUs granted to employees generally vest over a period of four years and are expensed ratably on a straight-line basis over the vesting period. We consider the dilutive impact of options, restricted stock and restricted stock units in our diluted net income per share calculation.
The Board of Directors shall administer the 2009 Plan unless and until the Board of Directors delegates administration to a committee. Our Board of Directors has delegated administration of the 2009 Plan to the Compensation Committee of the Board and the 2009 Plan is generally administered by such committee. The Board of Directors may suspend or terminate the 2009 Plan at any time. The Board of Directors may also amend the 2009 Plan at any time or from time to time. However, no amendment will be effective unless approved by our stockholders after its adoption by the Board of Directors to the extent stockholder approval is necessary to satisfy the applicable listing requirements of NASDAQ.
If we sell, lease or dispose of all or substantially all of our assets, or we are acquired pursuant to a merger or consolidation, then the surviving entity may assume or substitute all outstanding awards under the 2009 Plan. If the surviving entity does not assume or substitute these awards, then generally the stock awards will immediately and fully vest.
At
December 31, 2013
,
3,060,505
shares of common stock were reserved for future issuance under the 2009 Plan. At December 31, 2013,
$7.1 million
of total unrecognized compensation cost related to non-vested stock options was expected to be recognized over a weighted average period of
2.7
years.
1997 Employee Stock Purchase Plan
We have an Employee Stock Purchase Plan (the "ESPP"), under which employees can purchase shares of our common stock based on a percentage of their compensation, but not greater than
15%
of their earnings, up to a maximum of
$25,000
of fair value per year. The purchase price per share must be equal to the lower of
85%
of the fair value of the common stock at the beginning of a
24-month
offering period or the end of each six-month purchasing period.
At our 2009 Annual Meeting, the stockholders approved an amendment to the ESPP, which added
2,622,426
shares to the reserve for future issuance. As of
December 31, 2013
, there was a total of
1,097,998
shares reserved for future issuance
F- 29
under the ESPP. During the year ended
December 31, 2013
,
450,713
shares of common stock were purchased under the ESPP. As of
December 31, 2013
,
4,233,557
shares had been issued under the ESPP.
As of
December 31, 2013
, our unrecognized compensation cost related to the shares to be purchased under our ESPP was approximately
$1.2 million
and is expected to be recognized over a weighted average period of
0.6 years
.
Share-Based Compensation—Measurement and Disclosure
We account for share-based awards granted to employees and directors, including employee stock option awards, restricted stock, PSUs and RSUs issued pursuant to the 2009 Plan and employee stock purchases made under our ESPP using the estimate grant date fair value method of accounting in accordance with ASC 718,
Stock Compensation
. We value options and ESPP shares using the Black-Scholes-Merton option-pricing model. Restricted stock and time-based RSUs are valued at the grant date fair value of the underlying common shares. The PSUs are valued using the Monte Carlo simulation model.
The impact on our results for share-based compensation was as follows (in thousands):
|
|
Years Ended December 31,
|
||||||||||
|
|
2013
|
2012
|
2011
|
||||||||
|
Cost of product and service revenues
|
$
|
1,241
|
|
$
|
1,011
|
|
$
|
1,398
|
|
||
|
Research and development
|
1,359
|
|
889
|
|
1,269
|
|
|||||
|
Selling, general and administrative
|
8,551
|
|
7,314
|
|
6,832
|
|
|||||
|
Total share-based compensation expense
|
$
|
11,151
|
|
$
|
9,214
|
|
$
|
9,499
|
|
||
We did not capitalize any share-based compensation into inventory during
2013
,
2012
and
2011
as it was not material. Income tax (charges) benefits realized from share-based compensation and resulting increases (decreases) to additional paid in capital during
2013
,
2012
and
2011
were
$2.4 million
,
$2.6 million
and
$2.9 million
, respectively.
Valuation Assumptions
The fair value of each option grant is estimated on the date of grant using the Black-Scholes-Merton option-pricing model. The fair value of shares issued under the employee stock purchase plans is estimated on the date of issuance using the Black-Scholes-Merton model. The weighted average assumptions used for options granted and ESPP in
2013
,
2012
and
2011
were as follows:
|
|
Years Ended December 31,
|
|||||||
|
Stock Option Plans
|
2013
|
2012
|
2011
|
|||||
|
Risk-free interest rate(1)
|
1.2
|
%
|
0.9
|
%
|
1.6
|
%
|
||
|
Dividend yield
|
—
|
%
|
—
|
%
|
—
|
%
|
||
|
Volatility(2)
|
43.1
|
%
|
45.8
|
%
|
48.5
|
%
|
||
|
Expected life(3)
|
5.3 yrs
|
|
5.2 yrs
|
|
5.2 yrs
|
|
||
|
|
Years Ended December 31,
|
|||||||
|
Employee Stock Purchase Plan
|
2013
|
2012
|
2011
|
|||||
|
Risk-free interest rate(1)
|
0.2
|
%
|
0.2
|
%
|
0.5
|
%
|
||
|
Dividend yield
|
—
|
%
|
—
|
%
|
—
|
%
|
||
|
Volatility(2)
|
35.1
|
%
|
38.5
|
%
|
40.2
|
%
|
||
|
Expected life(3)
|
0.5 - 2 yrs
|
|
0.5 - 2 yrs
|
|
0.5 - 2 yrs
|
|
||
_______________________________________________________________________________
|
(1)
|
The risk-free interest rate for both stock options and the ESPP is based on the zero-coupon U.S. Treasury rate curve in effect at the time of the option grant or at the beginning of the ESPP offering period.
|
|
(2)
|
Expected volatility for both stock options and the ESPP reflects a combination of historical and market-based implied volatility consistent with ASC 718 and SEC Staff Accounting Bulletin 107. We determined that the combination of historical and market-based implied volatility provides a more accurate reflection of our market conditions and is more representative of future stock price trends than employing solely historical volatility.
|
F- 30
|
(3)
|
Represents the period of time that options granted are expected to be outstanding, which is derived from historical data on employee exercise and post-vesting employment termination behavior.
|
Share-Based Payment Award Activity
A summary of option activity under the 2009 Plan
for the years ended December 31, 2013, 2012 and 2011
is presented below:
|
Options:
|
Number of Shares
|
Weighted Average
Exercise Price
|
||||
|
|
(in thousands)
|
|
||||
|
Outstanding at December 31, 2010
|
4,740
|
|
$
|
12.86
|
|
|
|
Granted
|
494
|
|
$
|
14.57
|
|
|
|
Exercised
|
(413
|
)
|
$
|
8.30
|
|
|
|
Expired
|
(86
|
)
|
$
|
13.59
|
|
|
|
Forfeited
|
(42
|
)
|
$
|
20.76
|
|
|
|
Outstanding at December 31, 2011
|
4,693
|
|
$
|
13.36
|
|
|
|
Granted
|
645
|
|
$
|
14.85
|
|
|
|
Exercised
|
(669
|
)
|
$
|
8.65
|
|
|
|
Expired
|
(84
|
)
|
$
|
14.02
|
|
|
|
Forfeited
|
(115
|
)
|
$
|
21.44
|
|
|
|
Outstanding at December 31, 2012
|
4,470
|
|
$
|
14.06
|
|
|
|
Granted
|
502
|
|
$
|
20.25
|
|
|
|
Exercised
|
(1,686
|
)
|
$
|
12.53
|
|
|
|
Expired
|
(56
|
)
|
$
|
15.66
|
|
|
|
Forfeited
|
(87
|
)
|
$
|
14.68
|
|
|
|
Outstanding at December 31, 2013
|
3,143
|
|
$
|
15.82
|
|
|
|
Vested and expected to vest at December 31, 2013
|
3,114
|
|
$
|
15.79
|
|
|
|
Exercisable at December 31, 2013
|
2,078
|
|
$
|
15.11
|
|
|
Outstanding options at December 31, 2013 had a weighted-average remaining contractual life of
5.6 years
and an aggregate intrinsic value of
$30.8 million
. Vested and expected to vest options had a weighted-average remaining contractual life of
5.6 years
and an aggregate intrinsic value of
$30.6 million
. Exercisable options at December 31, 2013 had a weighted-average remaining contractual life of
4.1 years
and an aggregate intrinsic value of
$22.0 million
.
The ranges of outstanding and exercisable options for equity share-based payment awards as of
December 31, 2013
were as follows:
F- 31
|
Range of Exercise Prices
|
Number
Outstanding |
Weighted
Average Exercise Price of Outstanding Options |
Number
Exercisable
|
Weighted
Average Exercise
Price of
Exercisable
Options
|
|||||||||
|
|
(in thousands)
|
|
(in thousands)
|
|
|||||||||
|
$6.40 - $10.41
|
332
|
|
$
|
8.71
|
|
332
|
|
$
|
8.71
|
|
|||
|
$10.58 - $10.75
|
384
|
|
$
|
10.65
|
|
384
|
|
$
|
10.65
|
|
|||
|
$11.27 - $13.53
|
347
|
|
$
|
12.84
|
|
291
|
|
$
|
12.77
|
|
|||
|
$13.67 - $14.10
|
358
|
|
$
|
13.86
|
|
143
|
|
$
|
13.94
|
|
|||
|
$14.16 - $15.04
|
364
|
|
$
|
14.58
|
|
167
|
|
$
|
14.67
|
|
|||
|
$15.06 - $17.29
|
382
|
|
$
|
16.79
|
|
106
|
|
$
|
16.51
|
|
|||
|
$17.49 - $20.95
|
434
|
|
$
|
19.84
|
|
369
|
|
$
|
20.12
|
|
|||
|
$21.07 - $23.19
|
330
|
|
$
|
22.52
|
|
104
|
|
$
|
21.50
|
|
|||
|
$23.41 - $26.99
|
136
|
|
$
|
24.61
|
|
106
|
|
$
|
24.76
|
|
|||
|
$29.16 - $29.16
|
76
|
|
$
|
29.16
|
|
76
|
|
$
|
29.16
|
|
|||
|
$6.40 - $29.16
|
3,143
|
|
$
|
15.82
|
|
2,078
|
|
$
|
15.11
|
|
|||
As of
December 31, 2013
, we expect
$7.1 million
of total unrecognized compensation costs related to unvested options to be recognized over a weighted average period of
2.7
years. The weighted average fair value of options granted was
$8.09
,
$6.13
and
$6.47
during
2013
,
2012
and
2011
, respectively. The intrinsic value of options exercised during
2013
,
2012
and
2011
was
$14.0 million
,
$2.8 million
and
$2.9 million
, respectively.
Restricted Stock and Restricted Stock Units
A summary of activity of restricted stock and restricted stock units ("RSUs") granted under the 2009 Plan as of
December 31, 2013
is presented below:
|
Shares of
Restricted Stock
|
Weighted-Average Grant
Date Fair Value Per Share
|
Restricted Stock Units
|
Weighted-Average Grant
Date Fair Value
|
||||||||||
|
|
(in thousands)
|
|
(in thousands)
|
|
|||||||||
|
Nonvested at December 31, 2010
|
77
|
|
$
|
12.91
|
|
308
|
|
$
|
12.98
|
|
|||
|
Granted
|
68
|
|
$
|
14.71
|
|
145
|
|
$
|
14.39
|
|
|||
|
Vested
|
(77
|
)
|
$
|
12.91
|
|
(152
|
)
|
$
|
14.26
|
|
|||
|
Forfeited
|
—
|
|
—
|
|
(14
|
)
|
$
|
12.82
|
|
||||
|
Nonvested at December 31, 2011
|
68
|
|
$
|
14.71
|
|
287
|
|
$
|
13.03
|
|
|||
|
Granted
|
67
|
|
$
|
14.19
|
|
274
|
|
$
|
14.58
|
|
|||
|
Vested
|
(78
|
)
|
$
|
14.64
|
|
(153
|
)
|
$
|
12.90
|
|
|||
|
Forfeited
|
—
|
|
—
|
|
(19
|
)
|
$
|
14.55
|
|
||||
|
Nonvested at December 31, 2012
|
58
|
|
$
|
14.19
|
|
389
|
|
$
|
14.09
|
|
|||
|
Granted
|
$
|
55
|
|
$
|
18.20
|
|
190
|
|
19.87
|
|
|||
|
Vested
|
$
|
(61
|
)
|
$
|
14.23
|
|
(195
|
)
|
14.31
|
|
|||
|
Forfeited
|
—
|
|
—
|
|
(22
|
)
|
14.08
|
||||||
|
Nonvested at December 31, 2013
|
$
|
52
|
|
$
|
18.43
|
|
362
|
|
17.15
|
|
|||
The fair value of restricted stock is the product of the number of shares granted and the closing market price of our common stock on the grant date. The total fair value of restricted stock grants vested in
2013
,
2012
and
2011
was
$1.1 million
,
$1.1 million
and
$1.1 million
, respectively. Our unrecognized compensation cost related to nonvested restricted stock is approximately
0.4 million
and is expected to be recognized over a weighted average period of
2.0 years
.
The fair value of RSUs is the product of the number of shares granted and the closing market price of our common stock on the grant date. The total fair value of RSUs vested in
2013
,
2012
and
2011
was
$4.4 million
,
$2.3 million
and
$2.4 million
, respectively. Expected future compensation expense relating to RSUs outstanding on
December 31, 2013
is
$5.5 million
over a weighted- average period of
2.5 years
.
F- 32
Performance-Based Restricted Stock Units
In 2011, we began incorporating performance-based restricted stock units ("PSUs") as an element of our executive compensation plans. For 2011, we granted
100,000
PSUs; however, pursuant to their terms,
120,000
PSUs ultimately became eligible for vesting upon the achievement of a certain level of shareholder return for 2011 as described below. In 2012, we granted
125,000
PSUs of which
62,500
became eligible for vesting upon the achievement of a certain level of shareholder return for 2012 as described below. In 2013, we granted
125,000
PSUs to our executive officers.
Our unrecognized compensation cost related to non-vested performance-based restricted stock units at
December 31, 2013
was approximately
$1.1 million
and is expected to be recognized over a weighted-average period of
1.1 years
.
For the year ended December 31, 2012
, we recognized
$1.0 million
of compensation expense for the performance-based restricted stock units. For the year ended December 31, 2011, we recognized
$0.6 million
of compensation expense for the performance-based restricted stock units.
The accounting guidance for awards with market conditions differs from that for awards with service conditions only or service and performance conditions. Because the grant date fair value of an award containing market conditions is calculated as the expected value, averaging over all possible outcomes, the measured expense is amortized over the service period, regardless of whether the market condition is ever actually met.
The fair value of a PSU award is the average of trial-specific values of the award over each of one million Monte Carlo trials. Each trial-specific value is the market value of the award at the end of the one-year performance period discounted back to the grant date. The market value of the award for each trial at the end of the performance period is the product of (a) the per share value of Omnicell stock at the end of the performance period and (b) the number of shares that vest. The number of shares that vest at the end of the performance period depends on the percentile ranking of the total shareholder return for Omnicell stock over the performance period relative to the total shareholder return of each of the other companies in the NASDAQ Healthcare Index (the "Index") as shown in the tables below.
Vesting for the PSU awards is based on the percentile placement of our total stockholder return among the companies listed in the Index and time-based vesting. We calculate total stockholder return based on the one year annualized rates of return reflecting price appreciation plus reinvestment of dividends. For PSU awards granted on February 5, 2013 and on March 5, 2013, stock price appreciation is calculated based on the average closing prices of our common stock for the last
20 trading days
leading to March 1, 2014 compared to the average closing prices for the 20 trading days ended on the last trading day of 2012. For PSU awards granted in 2011 and 2012, stock price appreciation is calculated based on the average closing prices of the applicable company's common stock for the
20 trading days
ending on the last trading day of the year prior to the date of grant as compared to the average closing prices for the
20 trading days
ended on the last trading day of the year of grant.
The following table shows the percent of PSUs granted in 2011 and eligible for further time-based vesting based on our percentile placement:
|
Percentile Placement of Our Total Shareholder Return
|
% of PSUs Eligible for Time-
Based Vesting |
|
|
Below the 35th percentile
|
—%
|
|
|
At least the 35th percentile, but below the 50th percentile
|
50%
|
|
|
At least the 50th percentile, but below the 65th percentile
|
100%
|
|
|
At least the 65th percentile, but below the 75th percentile (1)
|
110% to 119%
|
|
|
At or above the 75th percentile
|
120%
|
|
_______________________________________________________________________________
(1)
The actual percentage of PSUs eligible for further time-based vesting is based on straight-line interpolation, where, for example, if the ranking is the 70
th
percentile, then the vesting percentage is
115%
.
On January 17, 2012, the Compensation Committee of our Board of Directors confirmed
76.3%
as the percentile rank of Omnicell’s 2011 total stockholder return. This resulted in
120%
of the 2011 PSU awards, or
120,000
shares, becoming eligible for further time-based vesting. The eligible PSU awards will vest as follows:
25%
of the eligible awards for the first year vested immediately on January 17, 2012 with the remaining eligible awards vesting in equal increments, semi-annually, over the subsequent three year period beginning on June 15th and December 15th of the year after the date of grant and each subsequent year. Vesting is contingent upon continued service. Of the
120,000
shares eligible for time-based vesting under the 2011 PSU awards,
30,000
shares vested during the year ended December 31, 2013.
F- 33
The following table shows the percent of PSUs granted in 2012 eligible for further time-based vesting based on our percentile placement:
|
Percentile Placement of Our Total Shareholder Return
|
% of PSUs Eligible for Time-
Based Vesting |
|
Below the 35th percentile
|
—%
|
|
At least the 35th percentile, but below the 50th percentile
|
50%
|
|
At least the 50th percentile
|
100%
|
On January 22, 2013, the Compensation Committee of our Board of Directors confirmed
35.3%
as the percentile rank of Omnicell's 2012 total stockholder return. This resulted in
50%
of the 2012 PSU awards, or
62,500
shares, as eligible for further time-based vesting. The eligible performance-based restricted stock unit awards will vest as follows:
25%
of the eligible shares vested immediately on January 22, 2013 with the remaining eligible awards vesting in equal increments, semi-annually, over the subsequent three year period beginning on June 15th and December 15th of the year after the date of grant and each subsequent year. Vesting is contingent upon continued service. Of the
62,500
shares eligible for time-based vesting under the 2012 PSU awards,
31,244
shares vested during the year ended December 31, 2013.
On February 5 and March 5 2013, the Compensation Committee approved PSU awards of
125,000
shares and
12,500
shares, respectively. If the minimum performance threshold is met as determined by the Compensation Committee of the Board of Directors in 2014, the eligible performance-based restricted stock unit awards will vest as follows:
25%
of the eligible shares will vest immediately, with the remaining eligible awards vesting in equal increments, semi-annually, over the subsequent three year period beginning on June 15th and December 15th of the year after the date of grant and each subsequent year. Vesting is contingent upon continued service.
A summary of activity of the PSUs for the years ended
December 31, 2013
and 2012 is presented below:
|
Performance-based Stock Units
|
Number of Units
|
Weighted-
Average
Grant Date
Fair Value Per
Unit
|
||||
|
|
(in thousands)
|
|
||||
|
Non-vested, December 31, 2011
|
100
|
|
$
|
11.15
|
|
|
|
Granted
|
135
|
|
$
|
10.94
|
|
|
|
Vested
|
(60
|
)
|
$
|
11.15
|
|
|
|
Forfeited
|
—
|
|
$
|
—
|
|
|
|
Non-vested, December 31, 2012
|
175
|
|
$
|
11.00
|
|
|
|
Granted
|
142
|
|
$
|
14.68
|
|
|
|
Vested
|
(57
|
)
|
$
|
11.15
|
|
|
|
Forfeited
|
(35
|
)
|
$
|
10.93
|
|
|
|
Non-vested, December 31, 2013
|
225
|
|
$
|
13.32
|
|
|
401(k) Plan
We have established a 401(k) tax-deferred savings plan (the "Omnicell Plan"), whereby eligible employees may contribute a percentage of their eligible compensation, but not greater than
75%
of their earnings, up to the maximum as required by law. On January 1, 2009, we began matching 401(k) contributions, up to
3%
maximum of employee contributions or
$1,000
, whichever is lower. During the fourth quarter of 2012, the MTS 401(k) tax-deferred savings plan was merged with the Omnicell Plan.
For the years ended December 31, 2013, 2012 and 2011
, our total 401(k) contributions were
$1.1 million
,
$0.8 million
and
$0.6 million
, respectively.
Beginning with the acquisition of MTS, which was completed on May 21, 2012, we have organized our business into two operating business segments: Acute Care, which primarily includes products and services sold to hospital customers and Non-Acute Care, which primarily includes products and services sold to customers outside of hospital settings.
The Acute Care segment is organized around the design, manufacturing, selling and servicing of medication and supply dispensing systems. The Non-Acute Care segment includes primarily the manufacturing and selling of consumable medication
F- 34
blister cards, packaging equipment and ancillary products and services, but also includes medication dispensing systems sold to non-acute care pharmacies and facilities. We report segment information based on the management approach. The management approach designates the internal reporting used by the Chief Operating Decision Maker (the "CODM") for making decisions and assessing performance as the source of our operating segments. The CODM is our Chief Executive Officer. The CODM allocates resources to and assesses the performance of each operating segment, using information about its revenues, gross profit and income (loss) from operations.
Since 1992, Omnicell has provided automation and business information solutions to acute care hospitals. We have developed product solutions that help optimize various workflows utilized in hospitals. We have also developed sophisticated sales, installation, and service capabilities to serve the specific and special needs of the acute care environment in hospitals. As the acute care market evolves, we see opportunities to provide medication adherence solutions, which were added to our product line through the acquisition of MTS, to the acute care market as well. A portion of our organization structure and management processes will continue to be structured to optimize sales and service of solutions to the acute care market.
Since 1984, MTS has provided medication adherence solutions to the non-acute care market. These solutions provide automated and semi-automated equipment to assist institutional and retail pharmacists in filling medication orders into blister cards, the primary method of medication control in non-acute care settings. Completing the product solution are the consumables used by institutional and retail pharmacists to make the medication adherence package. MTS has developed process manufacturing capabilities as well as sales capabilities to market medication adherence solutions to institutional and retail pharmacies. A portion of our organization structure and management processes will continue to be structured to optimize the product, sales, and service of solutions to the non-acute care market.
In
2012
, we realigned our management reporting structure to report sales of Omnicell's dispensing systems and other related business transactions into long-term care pharmacies and facilities. Accordingly, the operations of this portion of our activities are now being reflected as a part of the Non-Acute Care segment for the year ended December 31, 2012 and 2013. The impact of this reporting structure change on the year ended December 31,
2011
was immaterial to our overall reported results.
We believe that legislative changes and economic pressures to manage costs will cause healthcare organizations to manage the health of patients across the continuum of care regardless of the setting in which the care is provided. We believe we have the capabilities and market position to provide the tools needed by our customers to manage medications across the continuum of care. But we also believe that the inherent differences between medication management workflows in acute care settings and non-acute care settings will cause our product solutions and marketing strategies to be managed separately for these two customer segments.
In the second quarter of 2013, our management changed its methodology for allocating certain expenses to our reportable segments. We have reclassified segment operating results for the years ended December 31, 2012 to conform to the 2013 presentation.
For the years ended December 31, 2013, 2012 and 2011
the contributions of our segments to net revenues and income from operations, and the reconciliation to total net income, were as follows (amounts in thousands):
F- 35
|
December 31,
|
December 31,
|
December 31,
|
|||||||||||||||||||||||||||||
|
2013
|
2012
|
2011
|
|||||||||||||||||||||||||||||
|
Acute Care
|
Non-Acute Care
|
Total
|
Acute Care
|
Non-Acute Care (1)
|
Total
|
Acute Care
|
Total
|
||||||||||||||||||||||||
|
Net revenues from external customers
|
$
|
284,666
|
|
$
|
95,919
|
|
$
|
380,585
|
|
$
|
260,160
|
|
$
|
53,867
|
|
$
|
314,027
|
|
$
|
245,535
|
|
$
|
245,535
|
|
|||||||
|
Cost of revenues
|
122,816
|
|
54,370
|
|
177,186
|
|
111,599
|
|
31,840
|
|
143,439
|
|
109,751
|
|
109,751
|
|
|||||||||||||||
|
Gross profit
|
$
|
161,850
|
|
$
|
41,549
|
|
$
|
203,399
|
|
$
|
148,561
|
|
$
|
22,027
|
|
$
|
170,588
|
|
$
|
135,784
|
|
$
|
135,784
|
|
|||||||
|
Gross margin %
|
56.9
|
%
|
43.3
|
%
|
53.4
|
%
|
57.1
|
%
|
40.9
|
%
|
54.3
|
%
|
55.3
|
%
|
55.3
|
%
|
|||||||||||||||
|
|
|
||||||||||||||||||||||||||||||
|
Operating expenses
|
131,811
|
|
36,289
|
|
168,100
|
|
127,467
|
|
15,995
|
|
143,462
|
|
119,562
|
|
119,562
|
|
|||||||||||||||
|
Income from operations
|
$
|
30,039
|
|
$
|
5,260
|
|
$
|
35,299
|
|
$
|
21,094
|
|
$
|
6,032
|
|
$
|
27,126
|
|
$
|
16,222
|
|
$
|
16,222
|
|
|||||||
|
Operating margin %
|
10.6
|
%
|
5.5
|
%
|
9.3
|
%
|
8.1
|
%
|
11.2
|
%
|
8.6
|
%
|
6.6
|
%
|
6.6
|
%
|
|||||||||||||||
|
|
|
|
|||||||||||||||||||||||||||||
|
Interest and other income (expense), net
|
(270
|
)
|
(51
|
)
|
(133
|
)
|
|||||||||||||||||||||||||
|
Income before provision for income taxes
|
35,029
|
|
27,075
|
|
16,089
|
|
|||||||||||||||||||||||||
|
Provision for income taxes
|
11,050
|
|
10,897
|
|
5,700
|
|
|||||||||||||||||||||||||
|
Net income
|
$
|
23,979
|
|
$
|
16,178
|
|
$
|
10,389
|
|
||||||||||||||||||||||
|
(1) Non-Acute Care segment includes MTS results from May 21, 2012, the closing date of acquisition.
|
|||||||||||||||||||||||||||||||
At
December 31, 2013
,
2012
, and
2011
segment assets, depreciation and amortization, and capital expenditures were as follows (amounts in thousands):
|
December 31,
|
December 31,
|
December 31,
|
|||||||||||||||||||||||||||||
|
2013
|
2012
|
2011
|
|||||||||||||||||||||||||||||
|
Acute Care
|
Non-Acute Care (1)
|
Total
|
Acute Care
|
Non-Acute Care (1)
|
Total
|
Acute Care
|
Total
|
||||||||||||||||||||||||
|
Segment Assets
|
$
|
263,154
|
|
$
|
229,347
|
|
$
|
492,501
|
|
$
|
235,186
|
|
$
|
206,633
|
|
$
|
441,819
|
|
$
|
363,849
|
|
$
|
363,849
|
|
|||||||
|
Depreciation/Amortization
|
$
|
11,236
|
|
$
|
7,129
|
|
$
|
18,365
|
|
$
|
9,017
|
|
$
|
4,308
|
|
13,325
|
|
7,983
|
|
7,983
|
|
||||||||||
|
Capital Expenditures
|
$
|
4,392
|
|
$
|
7,943
|
|
$
|
12,335
|
|
$
|
13,234
|
|
$
|
1,953
|
|
$
|
15,187
|
|
$
|
8,685
|
|
$
|
8,685
|
|
|||||||
|
(1) Non-Acute Care segment includes MTS results from May 21, 2012, the date of acquisition.
|
|||||||||||||||||||||||||||||||
For the year ended December 31, 2012
, the Non-Acute Care cost of revenues included
$1.7 million
of acquisition-related charges primarily associated with the step-up to the estimated fair value of inventory acquired from MTS and consumed in the normal sales cycle of our business. The Non-Acute Care operating expenses included
$0.9 million
of acquisition-related charges
F- 36
primarily associated with severance expenses.
For the year ended December 31, 2012
, the Acute Care operating expenses included
$2.3 million
of acquisition-related charges for transaction costs, required to be expensed under ASC 805,
Business Combinations
.
As part of the continuing integration of MTS, during the first quarter of 2013, we reorganized our management team, including the software development department, within the Non-Acute Care segment. Through the end of the first quarter of 2013, the Non-Acute Care segment had capitalized approximately
$1.8 million
of software development costs associated with a software solution under development which was intended to assist pharmacies in manual packaging of prescriptions. In connection with our financial statement close process for the quarter ended March 31, 2013, our management reassessed the viability of this project and the net realizable value of capitalized costs in light of its decision to change the related product road map and redesign this product based on evolving market demands. As part of this redesign process, new functionality and capabilities will need to be added to the product before commercialization. This redesign is intended to provide a more robust global platform providing larger scalability and significant functionality not contained in our current beta version. As such, we have determined we could no longer support the technological feasibility of this project in conjunction with our software capitalization policy. Therefore, we charged these costs, in the amount of
$1.8 million
, or
$0.03
per diluted share, net of tax, to expense as a component of research and development in the accompanying consolidated statements of operations.
In September 2013, we entered into a credit agreement (the "Credit Agreement") with Wells Fargo Bank, National Association, as administrative agent, and the lenders from time to time party thereto. The Credit Agreement provides for a
$75.0 million
revolving credit facility with a
$10.0 million
letter of credit sub-limit. Loans under the Credit Agreement mature on September 25, 2018. The Credit Agreement permits us to request one or more increases in the aggregate commitments provided that such increases do not exceed
$25.0 million
in the aggregate. We expect to use the proceeds from any revolving loans under the credit facility for general corporate purposes, including future acquisitions. Our obligations under the Credit Agreement are guaranteed by certain of our domestic subsidiaries and secured by substantially all of our and the subsidiary guarantors’ assets. To date, we have not yet drawn any funds under the credit facility.
Amounts drawn under the Credit Agreement bear interest, at our election, at a Eurodollar rate plus a margin of
1.75%
per annum, or an alternate base rate equal to the highest of (a) the prime rate, (b) the federal funds rate plus
0.50%
, and (c) LIBOR for an interest period of one month plus
1.75%
. We are required to pay a commitment fee of
0.25%
per annum on the aggregate undrawn amount of the commitments under the credit facility.
The Credit Agreement contains customary affirmative and negative covenants, including, among other things, restrictions on indebtedness, liens, investments, mergers, dispositions, dividends and other distributions. The Credit Agreement contains financial covenants that require us to, among other things, maintain a maximum consolidated total leverage ratio and a minimum consolidated fixed charge coverage ratio, in each case, as of the last day of each fiscal quarter. We were in full compliance with all covenants at
December 31, 2013
.
F- 37
SCHEDULE II
VALUATION AND QUALIFYING ACCOUNTS
(in thousands)
|
Allowances deducted from assets:
|
Balance at
beginning of year |
Additions
charged to costs and expenses (2) |
Charged
(credited) to other accounts |
Describe
charged to other accounts |
Deductions
|
Describe
deductions |
Balance at
end of year |
|||||||||||||||||
|
For the year ended December 31, 2011
|
|
|
|
|
|
|
|
|||||||||||||||||
|
Accounts receivable(1)
|
$
|
497
|
|
$
|
63
|
|
$
|
(96
|
)
|
(3)
|
$
|
(21
|
)
|
(4)
|
$
|
443
|
|
|||||||
|
Investment in sales-type leases(1)
|
411
|
|
—
|
|
(22
|
)
|
(5)
|
(105
|
)
|
(4)
|
284
|
|
||||||||||||
|
Total allowances deducted from assets
|
$
|
908
|
|
$
|
63
|
|
$
|
(118
|
)
|
|
$
|
(126
|
)
|
|
$
|
727
|
|
|||||||
|
For the year ended December 31, 2012
|
|
|
|
|
|
|
|
|||||||||||||||||
|
Accounts receivable(1)
|
$
|
443
|
|
$
|
316
|
|
$
|
(57
|
)
|
(3)
|
$
|
20
|
|
(4)
|
$
|
722
|
|
|||||||
|
Investment in sales-type leases(1)
|
284
|
|
425
|
|
—
|
|
(3)
|
(102
|
)
|
(4)
|
607
|
|
||||||||||||
|
Total allowances deducted from assets
|
$
|
727
|
|
$
|
741
|
|
$
|
(57
|
)
|
$
|
(82
|
)
|
$
|
1,329
|
|
|||||||||
|
For the year ended December 31, 2013
|
||||||||||||||||||||||||
|
Accounts receivable(1)
|
$
|
722
|
|
195
|
|
(67
|
)
|
(3)
|
(360
|
)
|
(4)
|
490
|
|
|||||||||||
|
Investment in sales-type leases (1)
|
607
|
|
49
|
|
—
|
|
(489
|
)
|
(4)
|
167
|
||||||||||||||
|
Total allowances deducted from assets
|
$
|
1,329
|
|
$
|
244
|
|
$
|
(67
|
)
|
$
|
(849
|
)
|
$
|
657
|
|
|||||||||
_______________________________________________________________________________
|
(1)
|
Allowance for doubtful accounts.
|
|
(2)
|
Represents amounts charged to bad debt expense.
|
|
(3)
|
Represents amounts credited to bad debt expense.
|
|
(4)
|
Represents amounts written-off, net of recoveries.
|
|
(5)
|
Represents amounts credited to bad debt expense and lease receivable adjustment.
|
F- 38
SIGNATURES
Pursuant to the requirements of Section 13 or 15(d) of the Securities Exchange Act of 1934, the registrant has duly caused this report to be signed on its behalf by the undersigned, thereunto duly authorized.
|
March 17, 2014
|
OMNICELL, INC.
|
||
|
By:
|
/s/ ROBIN G. SEIM
|
||
|
Robin G. Seim,
Chief Financial Officer and Executive Vice President Finance, Administration and Manufacturing |
|||
POWER OF ATTORNEY
KNOW ALL PERSONS BY THESE PRESENTS, that each of the persons whose signature appears below hereby constitutes and appoints Randall A. Lipps and Robin G. Seim, each of them acting individually, as his or her attorney-in-fact, each with the full power of substitution, for him or her in any and all capacities, to sign any and all amendments to this Annual Report on Form 10-K, and to file the same, with all exhibits thereto and other documents in connection therewith, with the Securities and Exchange Commission, granting unto said attorneys-in-fact, and each of them, full power and authority to do and perform each and every act and thing requisite and necessary to be done in and about the premises as fully to all intents and purposes as he or she might or could do in person, hereby ratifying and confirming our signatures as they may be signed by our said attorney-in-fact and any and all amendments to this Annual Report on Form 10-K.
Pursuant to the requirements of the Securities Exchange Act of 1934, this report has been signed below by the following persons on behalf of the registrant and in the capacities and on the dates indicated.
S- 1
|
Signature
|
Title
|
Date
|
||
|
/s/ RANDALL A. LIPPS
|
Chief Executive Officer, President and Chairman of the Board (Principal Executive Officer)
|
March 17, 2014
|
||
|
Randall A. Lipps
|
||||
|
/s/ ROBIN G. SEIM
|
Chief Financial Officer and Executive Vice President Finance, Administration and Manufacturing (Principal Accounting and Financial Officer)
|
March 17, 2014
|
||
|
Robin G. Seim
|
||||
|
/s/ JOANNE B. BAUER
|
March 17, 2014
|
|||
|
Joanne B. Bauer
|
Director
|
|||
|
/s/ JAMES T. JUDSON
|
March 17, 2014
|
|||
|
James T. Judson
|
Director
|
|||
|
/s/ RANDY D. LINDHOLM
|
March 17, 2014
|
|||
|
Randy D. Lindholm
|
Director
|
|||
|
/s/ VANCE B. MOORE
|
March 17, 2014
|
|||
|
Vance B. Moore
|
Director
|
|||
|
/s/ MARK W. PARRISH
|
March 17, 2014
|
|||
|
Mark W. Parrish
|
Director
|
|||
|
/s/ GARY S. PETERSMEYER
|
March 17, 2014
|
|||
|
Gary S. Petersmeyer
|
Director
|
|||
|
/s/ DONALD C. WEGMILLER
|
March 17, 2014
|
|||
|
Donald C. Wegmiller
|
Director
|
|||
|
/s/ SARA J. WHITE
|
March 17, 2014
|
|||
|
Sara J. White
|
Director
|
|||
S- 2
INDEX TO EXHIBITS
|
Incorporation By Reference
|
|||||||||
|
Exhibit
Number
|
|
Exhibit Description
|
Form
|
SEC File No.
|
Exhibit
|
|
Filing Date
|
||
|
2.1
|
|
Agreement and Plan of Merger, dated as of April 26, 2012, by and among Omnicell, Inc., Mercury Acquisition Corp, MedPak Holdings, Inc., and Excellere Capital Management, LLC
|
8-K
|
000-33043
|
2.1
|
|
5/2/2012
|
||
|
2.2
|
|
Agreement for the sale and purchase of the entire issued share capital of Surgichem Limited, by and among Omnicell, Inc., BUPA Care Homes (CFG) Plc, and MTS Medication Technologies, Inc.
|
8-K
|
000-33043
|
2.1
|
|
12/9/2013
|
||
|
3.1
|
|
Amended and Restated Certificate of Incorporation of Omnicell, Inc.
|
S-1
|
333-57024
|
3.1
|
|
3/14/2001
|
||
|
3.2
|
|
Certificate of Amendment to the Amended and Restated Certificate of Incorporation of Omnicell, Inc.
|
10-Q
|
000-33043
|
3.2
|
|
8/9/2010
|
||
|
3.3
|
|
Certificate of Designation of Series A Junior Participating Preferred Stock
|
10-K
|
000-33043
|
3.2
|
|
3/28/2003
|
||
|
3.4
|
|
Bylaws of Omnicell, Inc., as amended
|
10-Q
|
000-33043
|
3.3
|
|
8/9/2007
|
||
|
4.1
|
|
Reference is made to Exhibits 3.1, 3.2 , 3.3 and 3.4
|
|||||||
|
4.2
|
|
Form of Common Stock Certificate
|
S-1
|
333-57024
|
4.1
|
|
3/14/2001
|
||
|
10.1*
|
|
2012 Executive Officer Annual Base Salaries
|
8-K
|
000-33043
|
10.1
|
|
2/13/2012
|
||
|
10.2*
|
|
2013 Executive Officer Annual Base Salaries
|
8-K
|
000-33043
|
10.1
|
|
2/7/2013
|
||
|
10.3*
|
2014 Executive Officer Annual Base Salaries
|
8-K
|
000-33043
|
10.1
|
|
2/7/2014
|
|||
|
10.4
|
|
Lease, effective July 1, 1999, between AMLI Commercial Properties Limited Partnership and Omnicell, Inc.
|
S-1
|
333-57024
|
10.2
|
|
3/14/2001
|
||
|
Incorporation By Reference
|
|||||||||
|
Exhibit
Number
|
|
Exhibit Description
|
Form
|
SEC File No.
|
Exhibit
|
|
Filing Date
|
||
|
10.5
|
|
First Amendment to Lease, dated September 30, 1999, between AMLI Commercial Properties Limited Partnership and Omnicell, Inc.
|
10-K
|
000-33043
|
10.6
|
|
3/8/2012
|
||
|
10.6
|
|
Lease, dated April 14, 2010, between Point Place II, LLC and Omnicell, Inc.
|
10-K
|
000-33043
|
10.10
|
|
3/11/2011
|
||
|
10.7
|
|
Lease Agreement, dated October 20, 2011, between Middlefield Station Associates, LLC and Omnicell, Inc.
|
10-K
|
000-33043
|
10.9
|
|
3/8/2012
|
||
|
10.8
|
|
Form of Director and Officer Indemnity Agreement
|
S-1
|
333-57024
|
10.12
|
|
3/14/2001
|
||
|
10.9*
|
|
1997 Employee Stock Purchase Plan, as amended
|
10-Q
|
000-33043
|
10.2
|
|
8/5/2009
|
||
|
10.10*
|
|
2003 Equity Incentive Plan, as amended
|
10-K
|
000-33043
|
10.14
|
|
3/23/2007
|
||
|
10.11*
|
|
2009 Equity Incentive Plan, as amended
|
10-Q
|
000-33043
|
10.2
|
|
8/9/2013
|
||
|
10.12*
|
|
Form of Option Grant Notice and Form of Option Agreement for 2009 Equity Incentive Plan, as amended
|
10-K
|
000-33043
|
10.16
|
|
3/11/2011
|
||
|
10.13*
|
|
Form of Restricted Stock Unit Grant Notice and Form of Restricted Stock Unit Award Agreement for 2009 Equity Incentive Plan, as amended
|
10-K
|
000-33043
|
10.17
|
|
3/11/2011
|
||
|
10.14*
|
|
Form of Restricted Stock Bonus Grant Notice and Form of Restricted Stock Bonus Agreement for 2009 Equity Incentive Plan, as amended
|
10-K
|
000-33043
|
10.18
|
|
3/11/2011
|
||
|
10.15*
|
|
Form of Change of Control Agreement
|
10-K
|
000-33043
|
10.26
|
|
3/16/2006
|
||
|
Incorporation By Reference
|
|||||||||
|
Exhibit
Number
|
|
Exhibit Description
|
Form
|
SEC File No.
|
Exhibit
|
|
Filing Date
|
||
|
10.16*
|
|
Addendum to Form of Change of Control Agreement dated December 30, 2010
|
10-K
|
000-33043
|
10.24
|
|
3/11/2011
|
||
|
10.17*
|
|
2010 Omnicell Quarterly Executive Bonus Plan
|
8-K
|
000-33043
|
10.1
|
|
3/17/2010
|
||
|
10.18*
|
|
Employment Agreement, dated October 31, 2003, between Omnicell and Dan S. Johnston
|
10-K
|
000-33043
|
10.26
|
|
3/8/2004
|
||
|
10.19*
|
|
Addendum to Offer Letter, dated December 30, 2010, between Omnicell and Dan S. Johnston
|
10-K
|
000-33043
|
10.14
|
|
3/11/2011
|
||
|
10.20*
|
|
Employment Agreement, dated November 28, 2005, between Omnicell and Robin G. Seim
|
8-K
|
000-33043
|
10.1
|
|
1/24/2006
|
||
|
10.21*
|
|
Addendum to Offer Letter, dated December 30, 2010, between Omnicell and Robin G. Seim
|
10-K
|
000-33043
|
10.21
|
|
3/11/2011
|
||
|
10.22*
|
|
Addendum to Change in Control Severance Letter between Omnicell and Robin G. Seim dated December 30, 2010
|
10-K
|
000-33043
|
10.22
|
|
3/11/2011
|
||
|
10.23*
|
|
Employment Agreement, dated October 17, 2008, between Omnicell and Nhat H. Ngo
|
10-K
|
000-33043
|
10.29
|
|
2/24/2009
|
||
|
10.24*
|
|
Addendum to Change in Control Severance Letter between Omnicell and Nhat H. Ngo dated December 30, 2010
|
10-K
|
000-33043
|
10.28
|
|
3/11/2011
|
||
|
10.25*
|
|
Employment Agreement, dated December 5, 2008, between Omnicell and Marga Ortigas-Wedekind
|
10-K
|
000-33043
|
10.31
|
|
2/24/2009
|
||
|
Incorporation By Reference
|
|||||||||
|
Exhibit
Number
|
|
Exhibit Description
|
Form
|
SEC File No.
|
Exhibit
|
|
Filing Date
|
||
|
10.26*
|
|
Addendum to Change in Control Severance Letter between Omnicell and Marga Ortigas-Wedekind dated December 30, 2010
|
10-K
|
000-33043
|
10.30
|
|
3/11/2011
|
||
|
10.27
|
|
Lease between Omnicell, Inc. and Sycamore Drive Holdings, LLC, dated March 16, 2012
|
8-K
|
000-33043
|
10.1
|
|
3/20/2012
|
||
|
10.28*
|
|
Omnicell, Inc. Amended and Restated Severance Benefit Plan
|
10-Q
|
000-33043
|
10.1
|
|
8/9/2012
|
||
|
10.29*
|
|
Form of Restricted Stock Unit Award Agreement for the 2009 Equity Incentive Plan, as amended
|
10-Q
|
000-33043
|
10.4
|
|
8/9/2012
|
||
|
10.30*
|
|
Form of Performance Cash Award Grant Notice and Form of Performance Cash Award Agreement for the 2009 Equity Incentive Plan, as amended
|
10-Q
|
000-33043
|
10.5
|
|
8/9/2012
|
||
|
10.31
|
|
Lease, between Medical Technologies Systems, Inc. and Gateway Business Centre, Ltd., dated March 31, 2004
|
10-Q
|
000-33043
|
10.6
|
|
8/9/2012
|
||
|
10.32
|
|
First Lease Amendment, between Medical Technologies Systems, Inc. and Gateway Business Centre, Ltd., dated July 26, 2004
|
10-Q
|
000-33043
|
10.7
|
|
8/9/2012
|
||
|
Incorporation By Reference
|
|||||||||
|
Exhibit
Number
|
|
Exhibit Description
|
Form
|
SEC File No.
|
Exhibit
|
|
Filing Date
|
||
|
10.33
|
|
Lease, between MTS Medication Technologies, Ltd. and SAL Pension Fund, Ltd., dated June 9, 2011
|
10-Q
|
000-33043
|
10.8
|
|
8/9/2012
|
||
|
10.34
|
|
Third Amendment to Lease, between PR Amhurst Lake LLC and Omnicell, Inc., dated July 1, 2013
|
10-Q
|
000-33043
|
10.1
|
|
8/9/2013
|
||
|
10.35
|
|
Credit Agreement between Omnicell, Inc., and lenders, dated September 25, 2013
|
8-K
|
000-33043
|
10.1
|
|
9/26/2013
|
||
|
21.1
+
|
|
Subsidiaries of the Registrant
|
|||||||
|
23.1
+
|
|
Consent of Independent Registered Public Accounting Firm
|
|||||||
|
24.1
+
|
|
Power of Attorney (included on the signature pages hereto)
|
|||||||
|
31.1
+
|
|
Certification of Chief Executive Officer, as required by Rule 13a-14(a) or Rule 15d-14(a)
|
|||||||
|
31.2
+
|
|
Certification of Chief Financial Officer, as required by Rule 13a-14(a) or Rule 15d-14(a)
|
|||||||
|
32.1
+
|
|
Certification of Chief Executive Officer, as required by Rule 13a-14(b) or Rule 15d-14(b) and Section 1350 of Chapter 63 of Title 18 of the United States Code (18 U.S.C. §1350)
(1)
|
|||||||
|
32.2
+
|
|
Certification of Chief Financial Officer, as required by Rule 13a-14(b) or Rule 15d-14(b) and Section 1350 of Chapter 63 of Title 18 of the United States Code (18 U.S.C. §1350)
(1)
|
|||||||
|
101.INS
+
|
|
XBRL Instance Document
(2)
|
|||||||
|
Incorporation By Reference
|
|||||||||
|
Exhibit
Number
|
|
Exhibit Description
|
Form
|
SEC File No.
|
Exhibit
|
|
Filing Date
|
||
|
101.SCH
+
|
|
XBRL Taxonomy Extension Schema Document
(2)
|
|||||||
|
101.CAL
+
|
|
XBRL Taxonomy Extension Calculation Linkbase Document
(2)
|
|||||||
|
101.DEF
+
|
|
XBRL Taxonomy Extension Definition Linkbase Document
(2)
|
|||||||
|
101.LAB
+
|
|
XBRL Taxonomy Extension Labels Linkbase Document
(2)
|
|||||||
|
101.PRE
+
|
|
XBRL Taxonomy Extension Presentation Linkbase Document
(2)
|
|||||||
|
*
|
Indicates a management contract or compensation plan or arrangement.
|
|
+
|
Filed herewith
|
|
(1)
|
This certification accompanies the Form 10-K to which it relates, is not deemed filed with the Securities and Exchange Commission and is not to be incorporated by reference into any filing of the Registrant under the Securities Act of 1933, as amended, or the Securities Exchange Act of 1934, as amended (whether made before or after the date of the Form 10-K), irrespective of any general incorporation language contained in such filing.
|
|
(2)
|
Pursuant to applicable securities laws and regulations, the Registrant is deemed to have complied with the reporting obligation relating to the submission of interactive data files in such exhibits and is not subject to liability under any anti-fraud provisions of the federal securities laws as long as the Registrant has made a good faith attempt to comply with the submission requirements and promptly amends the interactive data files after becoming aware that the interactive data files fail to comply with the submission requirements. These interactive data files are deemed not filed or part of a registration statement or prospectus for purposes of sections 11 or 12 of the Securities Act of 1933, as amended, are deemed not filed for purposes of section 18 of the Securities Exchange Act of 1934, as amended, and otherwise are not subject to liability under these sections.
|
TABLE OF CONTENTS
Part IItem 1 BusinessItem 1A. Risk FactorsItem 1B. Unresolved Staff CommentsItem 2. PropertiesItem 3. Legal ProceedingsItem 4. Mine Safety DisclosuresPart IIItem 5. Market For Registrant's Common Equity, Related Stockholder Matters and Issuer Purchases Of Equity SecuritiesItem 6. Selected Financial DataItem 7. Management's Discussion and Analysis Of Financial Condition and Results Of OperationsItem 7A. Quantitative and Qualitative Disclosures About Market RiskItem 8. Financial Statements and Supplementary DataItem 9. Changes in and Disagreements with Accountants on Accounting and Financial DisclosureItem 9A. Controls and ProceduresItem 9B. Other InformationPart IIIItem 10. Directors, Executive Officers and Corporate GovernanceItem 11. Executive CompensationItem 12. Security Ownership Of Certain Beneficial Owners and Management and Related Stockholders MattersItem 13. Certain Relationships, Related Transactions and Director IndependenceItem 14. Principal Accountant Fees and ServicesPart IVItem 15. Exhibits and Financial Statement SchedulesNote 1. Organization and Summary Of Significant Accounting PoliciesNote 2. Business AcquisitionNote 3. Net Income Per ShareNote 4. Cash and Cash Equivalents and Fair Value Of Financial InstrumentsNote 5. InventoriesNote 6. Property and EquipmentNote 7. Net Investment in Sales-type LeasesNote 8. Goodwill and Other Intangible AssetsNote 9. Other AssetsNote 10. Accrued LiabilitiesNote 11. Deferred Gross ProfitNote 12. CommitmentsNote 13. ContingenciesNote 14. Income TaxesNote 15. Stockholders EquityNote 16. Stock Option Plans, Share-based Compensation and 401(k) PlanNote 17. SegmentsNote 18. Asset ImpairmentNote 19. Credit Agreement