OMNICELL, INC
10-Ks and 10-Qs
|
|
|
|
|
|
|
|
|
|
|
|
|
|
|
|
|
|
|
|
|
|
|
|
|
|
|
|
|
|
|
|
|
|
|
|
|
|
|
|
|
|
|
|
|
|
|
|
|
|
|
|
|
|
|
|
|
|
|
|
|
|
UNITED STATES
SECURITIES AND EXCHANGE COMMISSION
Washington, D.C. 20549
____________________________________________________________________________
FORM 10-K
|
(Mark One)
|
|
|
ý
|
ANNUAL REPORT PURSUANT TO SECTION 13 OR 15(d) OF THE SECURITIES EXCHANGE ACT OF 1934
|
|
For the fiscal year ended December 31, 2017
|
|
|
OR
|
|
|
o
|
TRANSITION REPORT PURSUANT TO SECTION 13 OR 15(d) OF THE SECURITIES EXCHANGE ACT OF 1934
|
|
For the transition period from to
|
|
Commission File No. 000-33043
OMNICELL, INC.
(Exact name of Registrant as specified in its charter)
|
Delaware
(State or other jurisdiction of
incorporation or organization)
|
94-3166458
(IRS Employer
Identification No.)
|
590 East Middlefield Road
Mountain View, CA 94043
(Address of registrant's principal executive offices, including zip code)
(650) 251-6100
(Registrant's telephone number, including area code)
Securities registered pursuant to Section 12(b) of the Act:
|
Title of each class
|
Name of each exchange on which registered
|
|
|
Common Stock, $0.001 par value
|
The NASDAQ Stock Market LLC
|
|
Securities registered pursuant to Section 12(g) of the Act:
None
Indicate by check mark if the registrant is a well-known seasoned issuer, as defined in Rule 405 of the Securities Act. Yes
ý
No
o
Indicate by check mark if the registrant is not required to file reports pursuant to Section 13 or Section 15(d) of the Act. Yes
o
No
ý
Indicate by check mark whether the registrant (1) has filed all reports required to be filed by Section 13 or 15(d) of the Securities Exchange Act of 1934 during the preceding 12 months (or for such shorter period that the registrant was required to file such reports), and (2) has been subject to such filing requirements for the past 90 days. Yes
ý
No
o
Indicate by check mark whether the registrant has submitted electronically and posted on its corporate Website, if any, every Interactive Data File required to be submitted and posted pursuant to Rule 405 of Regulation S-T (§ 232.405 of this chapter) during the preceding 12 months (or for such shorter period that the registrant was required to submit and post such files). Yes
ý
No
o
Indicate by check mark if disclosure of delinquent filers pursuant to Item 405 of Regulation S-K is not contained herein, and will not be contained, to the best of registrant's knowledge, in definitive proxy or information statements incorporated by reference in Part III of this Form 10-K or any amendment to this Form 10-K.
o
Indicate by check mark whether the registrant is a large accelerated filer, an accelerated filer, a non-accelerated filer, a smaller reporting company, or emerging growth company. See the definitions of "large accelerated filer," "accelerated filer," "smaller reporting company," and “emerging growth company” in Rule 12b-2 of the Exchange Act.
|
Large accelerated filer
ý
|
Accelerated filer
o
|
Non-accelerated filer
o
(Do not check if a
smaller reporting company)
|
Smaller reporting company
o
|
Emerging growth company
o
|
|||
If an emerging growth company, indicate by check mark if the registrant has elected not to use the extended transition period for complying with any new or revised financial accounting standards provided pursuant to Section 13(a) of the Ex-change Act.
o
Indicate by check mark whether the registrant is a shell company (as defined in Rule 12b-2 of the Exchange Act). Yes
o
No
ý
The aggregate market value of the registrant's common stock, $0.001 par value, held by non-affiliates of the registrant as of
June 30, 2017
was
$1.6 billion
(based upon the closing sales price of such stock as reported on The NASDAQ Global Select Market on such date) which excludes an aggregate of
1,186,296
shares of the registrant's common stock held by officers, directors and affiliated stockholders. For purposes of determining whether a stockholder was an affiliate of the registrant at
June 30, 2017
, the registrant has assumed that a stockholder was an affiliate of the registrant at
June 30, 2017
if such stockholder (i) beneficially owned 10% or more of the registrant's common stock and/or (ii) was affiliated with an executive officer or director of the registrant at
June 30, 2017
. Exclusion of such shares should not be construed to indicate that any such person possesses the power, direct or indirect, to direct or cause the direction of the management or policies of the registrant or that such person is controlled by or under common control with the registrant.
As of
February 21, 2018
there were
38,783,241
shares of the registrant's common stock, $0.001 par value, outstanding.
DOCUMENTS INCORPORATED BY REFERENCE
Portions of the registrant's definitive Proxy Statement for the 2018 Annual Meeting of Stockholders to be filed with the Securities and Exchange Commission pursuant to Regulation 14A not later than 120 days after the end of the fiscal year covered by this Form 10-K are incorporated by reference in Part III, Items 10-14 of this Form 10-K.
OMNICELL, INC.
TABLE OF CONTENTS
|
Page No.
|
||
|
OTHER
|
||
3
FORWARD-LOOKING STATEMENTS AND FACTORS THAT MAY AFFECT FUTURE RESULTS
This annual report on Form 10-K contains forward-looking statements. The forward-looking statements are contained principally in the sections entitled “Risk Factors” and “Management's Discussion and Analysis of Financial Condition and Results of Operations.” Forward-looking statements include, but are not limited to, statements about:
|
•
|
our expectations regarding our future product bookings;
|
|
•
|
the extent and timing of future revenues, including the amounts of our current backlog;
|
|
•
|
the size or growth of our market or market share;
|
|
•
|
our ability to acquire companies, businesses, products or technologies on commercially reasonable terms and integrate such acquisitions effectively;
|
|
•
|
our continued investment in, and ability to deliver on, our key business strategies of developing differentiated solutions, increasing penetration of new markets, and expanding our solutions through acquisitions and partnerships, as well as our goals of advancing our platform with new product introductions annually and producing solutions that support fully automated central pharmacy operations;
|
|
•
|
our belief that continued investment in our key business strategies will continue to generate our revenue and earnings growth, as well as our expectations about the trends and other factors we believe will be critical to the success of our strategies;
|
|
•
|
the bookings, revenue and margin opportunity presented by new products, emerging markets and international markets;
|
|
•
|
our ability to align our cost structure and headcount with our current business expectations;
|
|
•
|
the operating margins or earnings per share goals we may set;
|
|
•
|
our ability to protect our intellectual property and operate our business without infringing upon the intellectual property rights of others;
|
|
•
|
our expected future uses of cash and the sufficiency of our sources of funding;
|
|
•
|
the expected impacts of new accounting standards or changes to existing accounting standards;
|
|
•
|
the impacts of the U.S. Tax Cuts and Jobs Act of 2017; and
|
|
•
|
our ability to generate cash from operations and our estimates regarding the sufficiency of our cash resources;
|
In some cases, you can identify forward-looking statements by terms such as "anticipates," "believes," "could," "estimates," "expects," "intends," “seeks,” "may," "plans," "potential," "predicts," "projects," "should," "will," "would" and variations of these terms and similar expressions. Forward-looking statements are based on our current expectations and assumptions, and are subject to known and unknown risks and uncertainties, which may cause our actual results, performance or achievements to be materially different from those expressed or implied in the forward-looking statements. Such risks and uncertainties include those described throughout this annual report, particularly in Part II - Section 1A. “Risk Factors” below. Given these risks and uncertainties, you should not place undue reliance on these forward-looking statements. You should carefully read this annual report and the documents that we reference in this annual report and have filed as exhibits, as well as other documents we file from time to time with the Securities and Exchange Commission, with the understanding that our actual future results may be materially different from what we expect. The forward-looking statements in this annual report represent our estimates and assumptions only as of the date of this annual report. Except as required by law, we assume no obligation to update any forward-looking statements publicly, or to update the reasons actual results could differ materially from those expressed or implied in any forward-looking statements, even if new information becomes available in the future.
All references in this report to "Omnicell," "our," "us," "we," or the "Company" collectively refer to Omnicell, Inc., a Delaware corporation, and its subsidiaries. The term "Omnicell, Inc.," refers only to Omnicell, Inc., excluding its subsidiaries.
We own various trademarks and service marks used in our business, including the following registered and unregistered marks which appear in this report: Omnicell®, the Omnicell logo, OmniRx®, OmniCenter®, SafetyStock®, SinglePointe®, SecureVault®, the MTS Medication Technologies logo, OnDemand®, SureMed® Accuflex®, Pandora®, Ateb®, Detect-Rx®, Time My Meds®, Pharmacy Line®, InPharmics®, Aesynt®, the Aesynt logo, AcuDose-Rx®, Connect-Rx®, MedCarousel®, Robot-Rx®, MACH4®, Health Robotics® and i.v.STATION
TM
, SinglePointe
TM
, Anywhere RN
TM
, Anesthesia Workstation
TM
, OmniLinkRx
TM
, WorkflowRx
TM
, PROmanager-Rx
TM
, PACMED
TM
, NarcStation
TM
, MedShelf-Rx
TM
, PROmanager-Rx
TM
, Enterprise Medication Manager
TM
, Automation Decision Support
TM
, Anesthesia-Rx
TM
, Performance Center
TM
, PakPlus-Rx
TM
and Fulfill-Rx
SM
. This report also includes the trademarks and service marks of other companies. All other trademarks and service marks used in this report are the marks of their respective holders.
4
Overview
We are a leading provider of comprehensive automation and business analytics software solutions for patient-centric medication and supply management across the entire healthcare continuum, from the acute care hospital setting to post-acute skilled nursing and long-term care facilities to the home. Our Automation and Analytics segment has more than 4,000 customers worldwide using our supply chain and analytics solutions to help enable them to increase operational efficiency, reduce errors, deliver actionable intelligence and improve patient safety. Our acquisition of Aesynt Holding, L.P., Aesynt, Ltd. and Aesynt Coöperatief U.A. (collectively, “Aesynt”) in the first quarter of 2016 and the acquisition of Dixie Drawl, LLC d/b/a InPharmics ("InPharmics") in the second quarter of 2017 contribute to our distinct product capabilities, particularly in central pharmacy and IV robotics, creating the broadest medication management product portfolio in the industry.
Our Medication Adherence segment includes solutions, among them our MTS Medication Technologies, SureMed and Patient Management Access Portal brands, and provides innovative medication adherence packaging solutions designed to improve medication regiment adherence and to help reduce costly hospital readmissions. Our acquisition of ateb Inc., and its affiliate, Ateb Canada Ltd., (collectively, "Ateb"), providers of pharmacy-based patient care solutions and medication synchronization to independent and chain pharmacies, in the fourth quarter of 2016, uniquely positions Omnicell to support pharmacists as they implement and scale their adherence programs. Collectively, our Medication Adherence solutions help enable over 32,000 institutional and retail pharmacies worldwide to maintain high accuracy and quality standards in medication dispensing and administration while optimizing productivity and controlling costs.
According to a 2016 study by the U.S. Food and Drug Administration ("FDA"), medication errors cause at least one death every day and injure approximately 1.3 million people annually in the United States. The healthcare industry has become increasingly aware that human factors inevitably create the risk of medication administration errors in the course of patient care. Acute care facilities are required to adhere to medication regulatory controls that we believe cannot be adequately supported by manual tracking systems or partially automated systems. Any nursing shortages would add an additional challenge to acute care facilities to meet regulatory controls and improve patient safety while still providing adequate patient care. Non-acute care facilities face similar safety challenges. In its 2003 "
Adherence to Long-Term Therapies-Evidence for Action
" the World Health Organization stated that across diseases, adherence is the single most important modifiable factor that compromises treatment outcome and medication adherence is viewed as a key requirement for delivering better clinical outcomes and financial results. The Centers for Medicare & Medicaid Services stated in 2012 that 11% of all hospital admissions were related to medication non-adherence. In the United States, according to the Express Scripts 2013 Drug Trend Report, avoidable healthcare costs add up to $213 billion, of which about $105 billion is due to medication non-adherence. In a 2013 report, Levine & Associates estimated that to be approximately $2,000 per patient annually.
We provide solutions to help healthcare systems and caregivers address these aforementioned needs. We believe our solutions align us with the long-term trends of the healthcare market to manage the health of patients across the continuum of care, and that our patient-centric medication and supply management solutions help improve workflow efficiencies and patient outcomes.
Operating Segments and Products
Our business is organized into two operating segments distinguished by products based on customer needs. The two operating segments are Automation and Analytics, and Medication Adherence.
Automation and Analytics
The Automation and Analytics segment is organized around the design, manufacturing, selling and servicing of medication and supply dispensing systems, pharmacy inventory management systems, and related software. Our Automation and Analytics products are designed to enable our customers to enhance and improve the effectiveness of the medication-use process, the efficiency of the medical-surgical supply chain, overall patient care and clinical and financial outcomes of medical facilities. Through modular configuration and upgrades, our systems can be tailored to specific customer needs.
Medication Adherence
The Medication Adherence segment primarily includes the development, manufacturing and selling of consumable medication blister cards, packaging equipment, medication synchronization platform, and ancillary products and services. These products are used to manage medication administration outside of the hospital setting and include medication adherence products sold under the brand names MTS, SureMed, and Omnicell. MTS products consist of proprietary medication packaging
5
systems and related products for use by institutional pharmacies servicing long-term care and correctional facilities or retail pharmacies serving patients in their local communities. Omnicell brand includes pharmacy-based patient care and medication synchronization solutions to independent and chain pharmacies acquired as part of Ateb acquisition.
Financial Information by Segment
For information regarding our revenues, cost of revenues, gross profit and income from operations by segment, see Note 14, Segment and Geographical Information, of the Notes to Consolidated Financial Statements and Item 7, Management’s Discussion and Analysis of Financial Condition and Results of Operations in this annual report.
Business Strategy
Our key business strategies include:
|
1.
|
Further penetrating existing markets through technological leadership and our differentiated platform by:
|
•
consistently innovating our product and service offerings; and
•
maintaining our customer-oriented product installation process.
|
2.
|
Increasing penetration of new markets, such as non-acute care and international markets by:
|
•
launching new products and technologies that are specific to the needs of those markets;
•
building and establishing direct sales, distribution or other capabilities when and where it is appropriate;
•
partnering with companies that have sales, distribution or other capabilities that we do not possess; and
•
increasing customer awareness of safety issues in the administration of medications.
|
3.
|
Expanding our product offering through acquisitions and partnerships.
|
Our solutions offered under the Automation and Analytics segment are designed to provide everything the customer requires for installation and maintenance of medication, medical and surgical supply control. Our solutions offered under the Medication Adherence segment allow independent and chain pharmacies to implement and scale their adherence programs. Our vision of improving healthcare for everyone has led us to take certain steps in the development of our business and our long term approach to our market, such as:
|
•
|
Providing a full service, positive experience for our customers in the solution sales process, the timing and implementation of our product installations and the responsiveness of our support services;
|
|
•
|
Delivering solutions that are designed to provide our customers with the best experience in the healthcare industry, and improve and scale the medication adherence programs, as measured by customer input and third party surveys;
|
|
•
|
Innovating products to address patient safety and cost-containment pressures facing healthcare facilities while improving clinician workflow and overall operating efficiency;
|
|
•
|
Incorporating a broad range of clinical input into our product solution development to accommodate needs ranging from those of institutional pharmacies, retail pharmacies, and stand-alone community hospitals to multi-hospital entities, national pharmacy chains health systems, integrated delivery networks ("IDNs"), and health insurance companies;
|
|
•
|
Developing new solutions to enhance our customers' existing systems and protect our customers' investments by preserving, leveraging and upgrading their existing information systems, as well as striving to provide integration of our products with the other healthcare information systems used by our customers; and
|
|
•
|
Providing flexibility in our systems that can be tailored to specific customer needs through modular upgrades, thereby protecting our customers' investments.
|
We have developed or acquired numerous technologies that provide long-term solutions for our customers. Our own product development activities have brought a number of innovative and proprietary products to the market. Our G4 hardware solutions, and recently introduced XT Series Automatic Dispensing System on the Unity platform help decrease the risk of human error and save pharmacy time by eliminating the need for repetitive entry of drug formularies in multiple systems. The Unity platform is designed to help our customers closely manage medication and supply inventory to reduce costs, comply with increasingly stringent regulatory requirements and safeguard the patient. Additionally, our recently announced XR2 Central
6
Pharmacy Automation System utilizes robotics to automate critical workflows to help maximize inventory control, improve efficiency, and increase medication safety. Our VBM 200F, an automated system designed specifically for multi-medication adherence packaging, minimizes human activity in the multi-medication packaging process, thus reducing opportunity for errors, which helps improve medication adherence and patient outcomes. The IVX Workflow, a sterile compounding workflow solution, is designed for easy placement within laminar airflow (LAF) hoods or isolators to supports best practices in aseptic technique. Our SupplyX solution (currently available in the United Kingdom) is a web based, real time stock level information dashboard and reporting suite.
Acquisitions
In addition to our own development, we have, from time to time, acquired products that extend patient safety controls to a wider range of applications and departments in and out of the hospital setting. Our acquisitions include MTS Medication Technologies Limited ("MTS") in 2012, Surgichem Limited ("Surgichem") in 2014, Mach4 Automatisierungstechnik GmbH (“Mach4”) and Avantec Healthcare Limited (“Avantec”) in 2015, Aesynt and Ateb in 2016 and InPharmics in 2017. MTS extended our product line to include solutions for Medication Adherence customers, Surgichem was a provider of medication adherence products in the United Kingdom, Mach4 develops automated medication management systems to retail and hospital pharmacy customers primarily in Europe, with additional installations in China, Africa, the Middle East and Latin America, and Avantec was our distributor of medication and supply automation configurations of our products suited to the United Kingdom marketplace.
On April 12, 2017, we completed the acquisition of InPharmics, a leading source for end-to-end medication use process cost analytics and Drug Supply Chain Security Act compliance systems specifically designed for acute care hospital pharmacies. The InPharmics solution adds clinical and compliance analytics to Omnicell’s Performance Center offering, positioning us as a leading partner for health systems seeking to drive improvement across all facets of medication management.
On January 5, 2016, we completed the acquisition of Aesynt, a leader in central pharmacy robotics and IV compounding automation. Adding these two solution sets to the Omnicell portfolio was intended to give us one of the most comprehensive medication management platform offerings in the industry. We now are able to support customers who desire a centralized cartfill or nurse server medication distribution model all the way to fully decentralized dispensing and hybrid combinations along that continuum. We are also able to offer solutions for IV preparations, including oncology drugs, which is an area where our combined customers have expressed significant interest.
On December 8, 2016, we completed the acquisition of Ateb, a leading provider of pharmacy-based patient care solutions and medication synchronization to independent and chain retail pharmacies, an area where we had no market penetration prior to the acquisition. Ateb’s Time My Meds® solution, a market leading integrated medication synchronization program, combined with Omnicell’s SureMed® medication adherence packaging and related automation solutions, uniquely positions Omnicell to support pharmacists as they implement and scale their adherence programs.
Industry Background
The delivery of healthcare in the United States still relies on a significant number of manual and paper-based processes. Most hospitals have deployed at least some automation solutions, but few have deployed them throughout the entire institution or system. The use of manual and paper-based systems in many hospital departments today results in highly complex and inefficient processes for tracking and delivering medications and supplies to patients. In addition, many existing healthcare information systems are unable to support the modernization of healthcare delivery processes or address mandated patient safety initiatives. These factors contribute to medical errors and unnecessary process costs across the healthcare sector.
Healthcare providers and facilities are affected by significant economic pressures. Rising costs of labor, prescription drugs and new medical technology all contribute to increased spending. Governmental pressures surrounding healthcare reform have led to increased scrutiny of the cost and efficiency with which healthcare providers deliver their services. These factors, combined with continuing consolidation in the healthcare industry, have increased the need for the efficient delivery of healthcare in order to control costs.
Our Automation and Analytics products are sold worldwide to a wide variety of healthcare institutions, but most of our sales are to acute care hospital customers in the United States. The U.S. acute care hospital market is comprised of approximately 6,400 hospitals and other facilities with a total capacity of more than a million acute care beds. We currently serve over 4,000 hospitals and other facilities with total capacity of more than 580,000 acute care beds. Our customers include single location community hospitals, government hospitals and regional and national hospital systems.
7
We also sell our Automation and Analytics products directly to non-acute care providers, which include all healthcare facilities that are not hospitals. We estimate there are 50,000 facilities in the United States that could use our Automation and Analytics products and few of them use our solutions at this time.
Outside the United States, healthcare providers are becoming increasingly aware of the benefits of automation. Many governmental and private entities look to the progress made over the last several years in the United States and are starting to invest significantly in information technology and automation. The 2016 BCC Research report states that worldwide inpatient pharmacy automation revenue growth in our industry between 2016 and 2021 is expected to be 7.9%. We sell our Automation and Analytics products in a variety of countries outside of the United States, but to date we have focused our international sales efforts on Canada, the United Kingdom, the Middle East, and the Northern European region. Our international customer base includes over 450 customers that utilize our automation and analytics products.
We primarily sell our Medication Adherence products to institutional and retail pharmacies. In the United States, where approximately 80% of our Medication Adherence business occurs, the market is comprised of approximately 1,200 institutional and approximately 67,000 pharmacies that service over 50,000 long-term care facilities. In addition to medication control at long-term care facilities, our multi-medication products provide packaging that simplifies the process for individuals providing self-care to track and administer medications in domestic and global markets. Our acquisition of Ateb allows us to increase our capabilities to support retail pharmacies in synchronizing prescriptions for multi-med packaging and patient engagement for better adherence.
Key Industry Events and Reports
Legislation and industry guidelines, such as those produced by the FDA, The Joint Commission, the U.S. Pharmacopial Convention (the “USP”), and the Institute for Safe Medication Practices ("ISMP"), as well as the desire of healthcare organizations to improve quality and avoid liability, have driven health system facilities to prioritize investment in capital equipment, including pharmacy automation, which is a standard of care, to improve patient safety. Such reports and regulatory standards include the following:
|
•
|
In 2016, the USP finalized a set of guidelines known as USP 800 to address hazardous drug handling in health care settings. The regulations deal with transport, storage, compounding, preparation, and administration of intravenous products. Changing work practices and administrative controls to comply with these requirements are expected to increase both staff and patient safety. In September 2017, USP announced its intent to postpone the official date that USP 800 becomes official to December 1, 2019.
|
|
•
|
ISMP’s 2016-2017 best practices for hospitals include using technology to assist in the medication verification process (e.g., barcode scanning verification of ingredients, gravimetric verification, robotics, IV workflow software) to augment manual processes. It is important that processes are in place to ensure that the technology is maintained, the software is updated and the technology is always used in a manner that maximizes the medication safety features of those systems.
|
|
•
|
A 2016 Joint Commission survey of ambulatory care organizations revealed one of the most cited standards for non-compliance is having a practice of safely storing medications. The Joint Commission's updated medication management (MM) standards became effective January 1, 2018 for all accredited ambulatory care organizations and office-based surgery practices. These facilities need to improve processes for securing, controlling, refrigerating and administering medications.
|
|
•
|
The FDA Drug Supply Chain Security Act was signed into law in 2013 (Title II of Public Law 113-54) as a way to identify and trace medications. Organizations participating in the medication supply chain were required to comply beginning in November 2017 with full traceability complete by 2023. This requires a product identifier carrying information including serial number, lot number, and expiration date. Trading partners (manufacturers, wholesalers, dispensers, repackagers) will be able to share data regarding the status and movement of medications throughout the supply chain.
|
|
•
|
In 2010, the FDA updated its guidance that requires linear bar codes on most prescription drugs. Drug manufacturers, re-packagers, re-labelers and private label distributors are subject to the rule. The FDA estimated that the bar code rule, would result in a 50% reduction in medication errors, 500,000 fewer adverse drug events over the subsequent 20 years, $93 billion in cost savings and other economic benefits.
|
|
•
|
In 2002, the Joint Commission established the National Patient Safety Goals ("NPSG") program. In 2010, NPSG 03.04.01, National Patient Safety Goal on Labeling Medications, required the labeling of all medications, medication containers (syringes, medicine cups, basins, etc.) and other solutions on and off the sterile field in perioperative and other procedural settings.
|
8
While the overall storage and security of medications in hospitals has improved, recent years show increased focus on controlled substance management. Joint Commission surveyors are seeking more documentation from hospitals demonstrating policies and procedures are adequate.
Medication non-adherence is extremely common. According to research by Osterberg and Blaschke published in the New England Journal of Medicine in 2005, more than half of the 3.2 billion prescriptions dispensed annually in the United States are not taken as prescribed, and according to numerous studies, the same non-adherence rate exists for chronic disease medications. Poor adherence results in significant morbidity, mortality and avoidable healthcare costs. With more than 38 million Americans taking five or more maintenance medications daily, pharmacists need ways to support the arduous task of keeping patients compliant. According to the World Health Organization, “although these medications are effective in combating disease, their full benefits are often not realized because approximately 50% of patients do not take their medications as prescribed". According to a study published by IMS Institute for Healthcare Informatics in 2013, the avoidable cost of poor medication adherence is estimated at more than $105 billion in the United States alone.
Medication adherence can be improved through attitudinal and behavioral changes, which pharmacists can encourage and help facilitate by providing interventional support, including adherence tools, such as blister cards, reminders, prescription synchronization, and patient engagement tools. A 2011 study by CVS Caremark published in Health Affairs concluded that the medical cost per patient with chronic vascular disease was $13,000 to $39,000, annually, and patients who take medications as directed by a physician experienced medical savings ranging from $1,900 to $8,900, annually. The study also found that these patients experienced fewer emergency room visits and inpatient hospital stays. Additionally, 28 states in the United States have passed laws or regulations to improve the medication adherence.
Healthcare Reform
In 2010, the U.S. Congress passed the Patient Protection and Affordable Care Act ("PPACA"), which prescribes broad-based measures designed to provide healthcare to a greater percentage of the population. Even though the future of PPACA is unclear under the current administration, healthcare reform has set in motion the need for increased efficiency in order to provide high-quality healthcare at the lower cost. Accordingly, in our annual tracking of pharmacy and nursing leadership mindshare, operational efficiencies in medication distribution and administration continue to be a top priority.
We believe our products assist healthcare organizations to augment their investments in electronic health record ("EHR") implementation and integration by allowing them to reduce process steps, eliminate manual tracking and waste, enable population-level performance insights, track quality levels and reduce errors that result in unnecessary cost. Our Unity platform includes an automated dispensing system that is Modular EHR stage 2 certified and integrates with all "hospital information system vendors," as defined by the U.S. Department of Health and Human Services Office of the National Coordinator for Health Information Technology. Our Omnicell Analytics solution provides enterprise-level insights that can assist in monitoring hospital performance and quality of care. In addition, the solutions provided by the Performance Center
TM
software products give the customer the power to optimize the pharmacy supply chain with tools that help manage their inventory and minimize the cost of expiring medications.
Automation and Analytics Products and Services
Our Automation and Analytics products are designed to enable our customers to enhance and improve the effectiveness of the medication-use process, the efficiency of the medical-surgical supply chain, overall patient care and clinical and financial outcomes of medical facilities. Through modular configuration and upgrades, our systems can be tailored to specific customer needs. From the point at which a medication arrives at the hospital receiving dock until the time it is administered to the patient, our systems are capable of storing, packaging, bar coding, ordering and issuing the medication, as well as providing information and controls on its use and reorder. Our medication-use product line includes systems for medication dispensing in acute care nursing departments and nursing workflow automation at the bedside, central pharmacy automation, IV solutions and analytics and performance services. These products range from industrial-grade software-driven robotic solutions for automating the management of inventory in the central pharmacy to high-security closed-cabinet systems and software to open-shelf and combination solutions in the nursing unit, catheterization lab and operating room. Our supply product lines provide healthcare facilities with cost data that enables detailed quantification of charges for payer reimbursement, inventory management, implant monitoring and the timely reordering of supplies. To provide our customers with end-to-end medication control, our product lines incorporate bar code technology throughout. Our solutions incorporate software, which we believe is the most advanced on the market today, and our Unity enterprise platform integrates disparate systems onto a single server. We also provide services, including customer education and training, to help customers to optimize their use of our technology.
9
Our enterprise analytics solutions and services allow pharmacists and materials managers to more easily manage inventory flow, tracking and optimization, and aids in the detection and identification of those engaged in narcotics diversion within the acute care facility.
Medication Dispensing Solutions
Our medication dispensing solutions include our Omnicell® XT Automated Dispensing Cabinets, SinglePointe™ Patient Medication Management Software, Anywhere RN™ Remote Medication Management Software, Omnicell Analytics, Pandora® Analytics, Anesthesia Workstation™ and advanced interoperability products. Each of the products in our medication dispensing solution suite is summarized in the table below.
|
Product
|
Use in Hospital
|
Description
|
||
|
Omnicell Automated Dispensing Cabinets (XT Series, G4, and Acudose)
|
Any nursing area in a hospital department that administers medications
|
Secure dispensing system that automates the management and dispensing of medications at the point of use.
|
||
|
SinglePointe Patient Medication Management Software
|
Any nursing area in a hospital department that administers medications
|
Software product for use in conjunction with the automated dispensing cabinet product that controls medications on a patient-specific basis.
|
||
|
Anywhere RN Remote Medication Management Software
|
Any nursing area in a hospital department that administers medications
|
Software that allows nurses to remotely queue or waste medications from the automated dispensing cabinets from virtually any workstation in the hospital.
|
||
|
Anesthesia Workstation (XT Series, G4 and Anesthesia-Rx
TM
)
|
Operating room
|
Secure dispensing system that automates the management of anesthesia supplies and medications.
|
||
|
Advanced Interoperability Products
|
Central Pharmacy / Nursing areas
|
Beyond standard interfacing, Omnicell’s advanced interoperability products include remote queuing that allows nurses to queue and waste medications from within EHR and closed loop reporting that reconciles medication administration from the EHR and dispensing data.
|
||
Omnicell XT Automated Dispensing Cabinet
is the core of our medication control solutions. The cabinet automates the management and dispensing of medications at the point of use. It features biometric fingerprint identification, advanced single-dose dispensing, bar code confirmation, integrated medication label printing and a wide range of drawer modules enabling the establishment of various security levels. Software features of the automated dispensing system include patient profiling, notification of medications due, a variety of security features, waste management, clinical pharmacology and integration with an Internet browser for clinical reference information. The system is highly configurable to allow the pharmacist the capability to tailor the usage of the system to specific regulatory controls and workflows.
SinglePointe
is a software extension to the automated dispensing cabinet that allows pharmacists to automate the distribution of patient-specific medications, enabling control of up to 100% of all medications through the automated dispensing system. Controlling patient-specific medications through the cabinet extends the benefits of automated medication distribution, including increased patient safety, consistency in tracking and inventory control, simplification of procedures and improved monitoring of controlled substances to a broader range of the medication distribution process in the hospital.
AnywhereRN
solution is a software that allows nurses to operate the automated dispensing cabinets from virtually any remote workstation within the hospital. This software enables enhanced workflow for nurses such that they are no longer limited to being directly in front of the cabinet to perform certain medication administration functions. AnywhereRN is intended to reduce nurse distractions in the medication administration process, allowing cabinet operations to be done in private or quieter areas. AnywhereRN is also intended to eliminate congestion at the cabinet by minimizing nurse queuing to withdraw medications. Omnicell has worked with leading EHR vendors including Cerner and Epic to embed Anywhere RN functionality directly into their applications for a seamless user experience. Closed-Loop Dosing Accountability automatically identifies variances between medications dispensed from the cabinet versus medications documented as administered and/or wasted. Embedding Anywhere RN functionality in the EHR helps to reduce errors and provide safer medication management processes, streamlines the medication administration process and allows nurses to spend more time on patient care.
Anesthesia Workstation
solution is a system for the management of anesthesia supplies and medications. The system is tailored for the workflow of the clinician working in the operating room. The Anesthesia Workstation incorporates ergonomics to enhance the particular workflows inherent to the operating room and unique software to better handle case management in the procedural areas.
10
Central Pharmacy Solutions
Our Central Pharmacy solutions include our XR2 Automated Central Pharmacy System, Central Pharmacy Manager and Satellite Pharmacy Manager, Controlled Substance Manager, OmniLinkRx™ Medication Order Management System, and WorkflowRx™ Inventory Management Software.
|
Product
|
Use in Hospital
|
Description
|
||
|
XR2 Central Pharmacy Automated Dispensing System
|
Hospital Central Pharmacy
|
Hospital pharmacy robotics system used to automate the drug inventory management and dispensing process for patients and automated dispensing cabinets.
|
||
|
ROBOT-Rx®
|
Hospital Central Pharmacy
|
A hospital pharmacy robotics system used to automate the drug inventory management and dispensing process for patients and automated dispensing cabinets.
|
||
|
OmniLinkRx Medication Order Management System
|
Hospital Central Pharmacy
|
Prescription routing system that allows nurses and doctors to scan handwritten prescription orders for electronic delivery to pharmacists for approval and filling.
|
||
|
WorkflowRx Inventory Management System
|
Hospital Central Pharmacy
|
Automated pharmacy storage, retrieval and packaging systems.
|
||
|
Central Pharmacy Manager and Satellite Pharmacy Manager
|
Hospital Central Pharmacy
|
Automated pharmacy storage and retrieval system for managing inventory in central and satellite pharmacy locations.
|
||
|
Controlled Substance Manager
|
Hospital Central Pharmacy
|
Controlled substance inventory management system.
|
||
|
The MedCarousel® system
|
Hospital Central Pharmacy
|
Automates the processes of automated dispensing cabinet replenishment and dispensing of patient-specific first dose and scheduled medications.
|
||
|
MedShelf-Rx™
|
Hospital Central Pharmacy
|
A software-only solution that allows hospitals to apply bar-code scanning and perpetual inventory management processes to existing inventory locations.
|
||
|
PROmanager-Rx™
|
Hospital Central Pharmacy
|
A bar-code-driven robotics system that is designed to fully automate the storing, dispensing, returning and crediting of manufacturer packaged, oral-solid unit doses.
|
||
|
PACMED™
|
Hospital Central Pharmacy
|
An automated, intelligent, high-throughput device for bar-coding, packaging and dispensing oral solid medications.
|
||
|
NarcStation™
|
Hospital Central Pharmacy
|
Controlled substance inventory management system.
|
||
|
PakPlus-Rx
TM
|
Hospital Central Pharmacy
|
A professionally managed, on-site packaging service that provides dedicated Omnicell resources, technology and consumables, along with professional management, to meet a hospital’s bar-coded, unit-dose medication requirements.
|
||
|
Fulfill-Rx
SM
|
Hospital Central Pharmacy
|
A software solution that automates inventory reordering, receipt and replenishment; minimizes medication-related expenditures; simplifies inventory reporting and valuation; and increases productivity of scarce labor.
|
||
XR2 Central Pharmacy Automation System
utilizes robotics to automate critical workflows to help maximize inventory control, improve efficiency, and increase medication safety. XR2 has a highly configurable and scalable architecture that can easily support health systems with both centralized and decentralized models. Its one-touch design reduces handling of medications by technicians and pharmacists. Advanced algorithms are designed to ensure earliest expiring medications are picked first, thereby reducing medication waste. XR2 handles slow-moving and fast-moving inventory, providing comprehensive inventory automation while enabling more accurate medication management through automating bar-code scanning so that pharmacists and technicians can support more productive clinical activities.
ROBOT-Rx®
, a hospital pharmacy robotics system, is used to automate the drug dispensing process for patients and automated dispensing cabinets. Using bar-code scanning technology, ROBOT-Rx can automate the storage, dispensing, returning, restocking and crediting of daily unit-dose medications. ROBOT-Rx helps prevent dispensing errors, manages unit dose inventory, increases productivity, and frees pharmacists and technicians to support more productive clinical activities.
OmniLinkRx
is a physician order software product that automates communication between nurses and the pharmacy. Used in the central pharmacy, the OmniLinkRx solution simplifies the communication of handwritten physician orders from remote nursing stations to the pharmacy.
11
WorkflowRx
is an automated storage, retrieval, inventory management and repackaging system for the central pharmacy. It is designed to help pharmacists ensure that the right medications are stored in and retrieved from proper locations, both in the central pharmacy and in automated dispensing cabinets.
Central Pharmacy Manager
and
Satellite Pharmacy Manager
are integrated systems that automate management and storage of pharmacy inventory. Central Pharmacy Manager automates inventory management in the central pharmacy, helping to reduce inventory costs and save staff time on ordering and receiving processes. Central Pharmacy Manager may be deployed in an open environment or used in conjunction with carousels. Satellite Pharmacy Manager gives pharmacists managing satellite locations visibility into inventory levels and costs at the remote sites within their health system. In addition to utilizing a barcode scanning system, Central Pharmacy Manager may also be deployed on a storage and retrieval carousel. Bar code administration through the solution is designed to help ensure that medications are stocked correctly from their point of entry into the healthcare facility. Labeling medications with bar codes using a repackaging system enables bedside medication administration solutions to perform bar code checking at the patient bedside.
Controlled Substance Manager
provides perpetual inventory management and an automated audit trail to help the pharmacy efficiently comply with regulatory standards for controlled substances. The Controlled Substance Manager software, coupled with our automated dispensing technology, enables healthcare facilities to track, monitor and control the movement of controlled substances from the point of initial receipt from the wholesaler throughout internal distribution. Controlled Substance Manager maintains a perpetual item inventory and complete audit using integrated bar code technology with both fixed and portable scanners. Bar coded forms and labels may also be generated directly from the Controlled Substance Manager system.
The
MedCarousel®
system enables a hospital pharmacy to consolidate and manage medication inventory in the pharmacy and throughout the hospital, while helping to increase medication filling accuracy, reducing waste, increasing inventory turns and improving workforce performance. MedCarousel automates the processes of automated dispensing cabinet replenishment and dispensing of patient-specific first dose and scheduled medications.
MedShelf-Rx™
is a software-only solution that allows hospitals to apply bar-code scanning and perpetual inventory management processes to existing inventory locations, such as pick stations and refrigerated inventories, providing increased accuracy, efficiency and patient safety. MedShelf-Rx maintains perpetual inventory levels and provides expiration date tracking, cycle counting, and order creation and receipt. MedShelf-Rx is also helpful for extending inventory management to offsite clinics and satellite pharmacies.
PROmanager-Rx™
is a bar-code-driven robotics system designed to fully automate the storing, dispensing, returning and crediting of manufacturer packaged, oral-solid unit doses. PROmanager-Rx is a compact system that stores up to 12,000 doses and uses bar-code scanning of every dose, along with sophisticated dispensing and inventory management software. PROmanager-Rx helps relieve pharmacies of the error potential, pharmacist verification requirements, and other costs associated with in-house packaging.
PACMED™
is an automated, intelligent, high-throughput device for bar-coding, packaging and dispensing oral solid medications. Scalable to the needs of any pharmacy with models equipped with 100 to 500 medication canisters, and requiring minimal operator interaction, PACMED can be interfaced to pharmacy information systems and automated dispensing cabinet systems. PACMED produces strips of bar-coded unit-dose currently, multi-dose and batch-mode packages for replenishing carts, cabinets, multiple sites and pharmacy stock.
NarcStation™
automated dispensing system provides secure storage, control and tracking of controlled medications so nurses have ready access, while pharmacy maintains oversight to help prevent narcotic diversion. Comprised of a software tracking system and optional secure narcotic vaults, NarcStation helps hospitals maintain record-keeping, reporting and transaction data for all controlled substances - from the wholesaler to the nursing unit. Automated ordering (including integration with the DEA’s Controlled Substance Ordering System), filling and reporting drives efficiencies, while the electronic capture of data supports regulatory requirements and aids compliance.
PakPlus-Rx
TM
is a professionally managed, on-site packaging service that provides dedicated company resources, technology and consumables, along with professional management, to meet a hospital’s bar-coded, unit-dose medication requirements. PakPlus-Rx help increase packaging productivity, helping hospitals to streamline inventory and deliver readable bar-coded unit dose medications that support automation and Bar-Code Medication Administration initiatives.
Fulfill-Rx
SM
software
automates inventory reordering, receipt and replenishment; minimizes medication-related expenditures; simplifies inventory reporting and valuation; and increases productivity of scarce labor. The software enables unique, two-way electronic data interchange between Omnicell pharmacy automation solutions and McKesson Health Systems distribution centers.
12
IV Solutions
|
Product
|
Use in Hospital
|
Description
|
||
|
i.v.STATION™
|
Hospital Central Pharmacy
|
A robotic solution incorporating advanced software that prepares and dispenses ready-to-administer, non-hazardous admixtures.
|
||
|
i.v.STATION™ ONCO
|
Hospital Central Pharmacy
|
A robotic solution incorporating advanced software that is specifically designed to meet the unique challenges surrounding oncology care and other hazardous, patient-specific preparations.
|
||
|
IVX Workflow
|
Hospital Central Pharmacy
|
An innovative sterile compounding workflow solution.
|
||
i.v.STATION™
prepares and dispenses ready-to-administer, non-hazardous admixtures. With this advanced technology, a user can address the highest-risk aspects of their pharmacy through an automated process that is designed to be safer and more accurate than manual compounding.
i.v.STATION™ ONCO
was specifically designed to meet the unique challenges surrounding oncology care and other hazardous, patient-specific preparations. This technology helps improve safety for the patient and the operator, and can enhance efficiency in overall pharmacy operations.
IVX Workflow
powered by IVX Cloud is
an innovative sterile compounding workflow solution that leverages integrated barcode scanning, gravimetric or volumetric verification, advanced image recognition, photo documentation and label printing as part of a compact all-in-one package designed for safe, accurate, and streamlined IV sterile compounding. The solution is designed for easy placement within laminar airflow (LAF) hoods or isolators to support best practices in aseptic technique by providing step-by-step instructions to guide technicians in preparing IV doses according to set protocols safely, accurately, and repeatedly.
Enterprise Analytics and
Solutions
|
Product
|
Use in Hospital
|
Description
|
||
|
Omnicell Analytics & Pandora Analytics
|
Hospital central pharmacy and general hospital management
|
Advanced reporting and data analytics tools.
|
||
|
Performance Center
TM
|
Hospital Central Pharmacy
|
Omnicell Performance Center is an enterprise software solution to monitor pharmacy operations and recommend opportunities for improved operational efficiency, regulatory compliance and patient outcomes.
|
||
|
Automation Decision Support™
|
Hospital Central Pharmacy
|
An analytical solution that provides important performance data essential for hospitals to make informed business decisions.
|
||
Omnicell Analytics and
Pandora Analytics
solutions are comprised of reports and analytical software for medication diversion detection, customizable user options, hospital inventory management controls, point‑of‑care data analytics and financial optimization. Omnicell Analytics is a new web-based diversion analytics tool that streamlines the process of managing potential drug diversion across the health system. Omnicell Analytics and Pandora Analytics are designed to assist hospitals in their efforts to improve patient safety and regulatory compliance and reduce costs.
Performance Center
TM
combines enterprise software solutions with expert services to monitor pharmacy operations and recommend opportunities for improved operational efficiency, regulatory compliance and patient outcomes. The Performance Center solution works to connect data from disparate systems and create actionable insights through our enterprise medication management software. In addition, a dedicated team of data analysts constantly monitors the data and recommends opportunities for effective medication management - including pharmacy supply chain, clinical, and regulatory compliance improvements.
Automation Decision Support™
provides important performance data for hospitals to make informed business decisions. Powered by Horizon Business Insight, this advanced analytics solution combines and organizes data from Aesynt solutions into powerful graphic views. Managers see a holistic view of medication inventory, helping to improve productivity and enhance monitoring of potential diversion.
13
Medical and Surgical Supply Products
Our medical and surgical supply products provide acute care hospitals control over consumable supplies critical to providing quality healthcare. These solutions provide inventory control software that is designed to ensure that critical supplies are always stocked in the right locations. At the same time, usage tracking helps hospital administrators ensure that money is not wasted on excessive stores of supplies and helps optimize reimbursement by improving charge capture.
Implantable tissue and bone grafts can also be monitored and tracked for additional patient safety and regulatory compliance. The bone and tissue features are integrated with our overall medical and surgical supply chain inventory management and charge capture systems. These solutions are designed for use in the materials management department, the nursing unit and specialty areas such as the catheterization lab and the operating room. They integrate with other information management systems and use bar code technology extensively.
Our supply product line includes the Omnicell Supply Management System, Omnicell Tissue Center, OptiFlex
TM
MS, OptiFlex
TM
SS, OptiFlex
TM
CL and our SupplyX subscription software solution. Each of these products is summarized in the table below:
|
Product
|
Use in Hospital
|
Description
|
||
|
Omnicell Supply Management System
|
Any nursing area in a hospital department that uses patient care supplies
|
An automated dispensing system that automates the management and dispensing of medical and surgical supplies at the point of use. It works with closed Omnicell cabinets and open shelving.
|
||
|
Omnicell Tissue Center
|
Perioperative areas of the hospital
|
System for the management of the chain of custody for bone and tissue specimens from the donor to the patient in the operating room.
|
||
|
OptiFlex
TM
Medical Surgical (MS)
|
Any nursing area in a hospital department that administers supplies
|
System for the management of medical and surgical supplies that provides the flexibility of using bar code control in an open shelf or closed cabinet environment.
|
||
|
OptiFlex
TM
Surgical Services (SS)
|
Perioperative areas of the hospital
|
Specialty modules for the perioperative areas.
|
||
|
OptiFlex
TM
Cath Lab (CL)
|
Procedure areas in the hospital including the cardiac catheterization lab
|
Specialty modules for the cardiac catheterization lab and other procedure areas.
|
||
Omnicell Supply Management System
is a dispensing system that runs off the OmniCenter® server. It dispenses and tracks medical and surgical supplies at the point of use, and tracks lot and serial numbers. The system can be used with either open shelves or secure automated dispensing cabinets, or a combination of both. Areas that require the management of high volume/low dollar inventory as well as areas where space restrictions limit the ability to install closed cabinets and other areas such as off-site clinics may benefit from an open shelf system that includes a touchscreen PC, scanner or mobile solution. When Omnicell cabinets are used, facilities can choose to implement a hybrid cabinet that stores both medications and supplies.
Omnicell Tissue Center
used in conjunction with the OptiFlex platform, allows the operating room staff to manage the chain of custody for bone and tissue specimens from the donor to the patient in the operating room. This solution enables compliance with The Joint Commission requirements and Association of Operating Room Nurses guidelines regarding the handling of tissue specimens.
OptiFlex
TM
Medical Surgical (MS)
provides control over general medical and surgical supplies stored in open shelves or in automated dispensing cabinets.
OptiFlex
TM
Surgical Services (SS)
manages supplies and preference cards in the perioperative areas whether the supplies are stored on open shelves or in automated dispensing cabinets. The preference-list system creates a unique bar code for each surgical case, based on physician, procedure and patient and provides information on the case for data analysis, reporting including real-time case cost and charge capture. The Catheter Module is designed to be integrated into the Omnicell supply cabinet to secure, dispense and automatically track catheter usage.
OptiFlex
TM
Cath Lab (CL)
manages supplies and creates cases in the cardiac catheterization lab, interventional radiology suite and other procedure areas. This solution allows real-time point-of-use data collection and accurate supply tracking regardless of whether supplies are stored on open shelves or in automated dispensing cabinets. It also improves cost management through automated charge capture and case profiling by the physician. Bar code scanning captures lot, serial numbers, and expiration date, providing quick access in the event of a product recall. The Catheter Module is designed to be
14
integrated into the Omnicell supply cabinet and allows hospitals to secure, dispense and electronically track accurate catheter usage.
Other Automation and Analytics Products and Services
Omnicell Interface Software
provides interface and integration between our medication-use products or our supply products and a healthcare facility's in-house information management systems. Interface software is designed to provide integration and communication of patient data, logistical data, inventory information, charge capture and billing information and other healthcare database information.
Services
include customer education and training and maintenance and support services, provided on a time-and-material basis. We also provide fixed period service contracts to our customers for post-installation technical support with phone support, on-site service, parts and access to software upgrades. On-site service is provided by our field service team.
Retail and Hospital Automation outside the United States
Mach4 Pharma Systems Medimat
is a robotic dispensing system for handling the stocking and retrieval of boxed medications. The system is configurable and may include automated stocking, high capacity storage, high retrieval speed storage, and conveyance automation. Mach4 robotic dispensing systems help eliminate the tedious tasks of handling medications, provide accurate inventory tracking, reduce patient wait time, reduce pharmacy operating costs, and increase time allotted available for a pharmacist to spend with patients.
Omnicell SupplyX
(available in the United Kingdom)
is a web based, real time stock level information dashboard and reporting suite. It links to the hospital reporting system to control and report on open and closed stores for both top-up and perpetual inventory management dispensing system that runs off the OmniCenter® server. It dispenses and tracks medical and surgical supplies at the point of use, and tracks lot and serial numbers.
RFID Solutions
Kanban and specialized cabinet based dispensing systems running on the Unity platform which utilize Radio Frequency Identification (RFID) technology to identify supply inventory.
Medication Adherence Products and Services
We offer solutions to assist patients to remain adherent to their medication regimens. These solutions are comprised of a variety of tools and aids that may be directly used by a pharmacist or a healthcare provider in their direct care for a patient, or the patient themselves. Healthcare provider systems, institutional pharmacies and retail pharmacies utilize our tools in addition to other clinical services to improve medication adherence in targeted patient populations. The tools include software based systems and medication adherence packaging.
Our software solutions primarily operate on the Patient Management Access Portal (PMAP), a subscription based software system which provides an environment for patient engagement by clinicians. Services running on PMAP include Time My Meds medication synchronization, immunization management, and a number of tools used by clinicians to manage patient engagement workflows. PMAP integrates to our packaging solutions. Our software solutions also provide integrated voice response for pharmacies, and medication adherence reminders through text, and telephone messaging. In the United Kingdom we offer electronic Medication Administration Records software for use in nursing homes.
Medication Adherence packaging is designed either for patient use in care environments where there is a caregiver present or for environments where the patient cares for him or herself.
For environments where a caregiver is present, institutional and retail pharmacies use our solutions for packaging medications into adherence packages that contain a 14 to 90 day supply of a specific single medication. The blister cards may be pre-packaged ahead of time and placed into inventory until needed to fill a specific patient order, or on-demand, where individual patient medication orders are packaged and labeled by an automated robotic system. Our solutions range from manual sealers to fully automated packaging machines, embedded software, as well as the consumable packages used in these machines. We have packaging solutions to help improve patient safety and economics for any size pharmacy operation by increasing pharmacy output and improving dispensing accuracy.
For environments where a patient cares for him or herself, retail pharmacies use our solutions for packaging medications into adherence packages that contain all of the patient's medications into one seven-day package. These products are primarily used in community-based pharmacies to assist in organizing complex medication regimens into a simple-to-use solution that enhances medication adherence. Multi-medication packages are arranged so that all the medications for a single dosing time are contained in one blister, eliminating confusion for the patient and providing the caregivers increased assurance
15
that medications are taken in the right sequence. Our solutions include automated packaging machines that package patient specific medications, the software that runs these machines and the consumable packages used in these machines.
In addition to packaging solutions, we sell specially configured versions of our automated dispensing cabinets to institutional pharmacies, which they place in long-term care facilities to manage narcotics, first doses and medications needed quickly.
Single Medication Products for Use Where A Caregiver Is Present
Pharmacy Sealers for Medication Packaging
Our heat-sealed blister cards require a sealer to create an impermeable barrier. By using specially designed equipment to control heat, time and pressure, the institutional pharmacy serving the long-term care patients is able to create a quality seal on every package, providing a secure barrier to moisture and gases. Within this range of equipment is a sealing solution suited for almost any pharmacy, from a low volume manual blister card sealer to a high volume, all-electric heat sealer with programmable computer logic.
Pharmacy Automation Systems
Our semi-automated filling equipment is designed specifically for the long-term care institutional pharmacy with enough order volume to warrant pre-packaging frequently-used medications into blister packs to keep in inventory awaiting a patient order. Our OnDemand automated solutions are designed to meet the broad needs of pharmacies to package individual patient medication orders accurately and efficiently into multiple medication adherence packaging. These machines interface with pharmacy information systems to obtain prescription information to provide patient specific adherence packaging. Our current line of OnDemand machines includes the following products:
|
•
|
The
MTS-350
TM
is a tabletop machine capable of prepacking a wide range of medications and features an ergonomic design and easy-to-use controls. The MTS-350 provides a semi-automated mechanism for filling blister cards and a sealer using compressed air and heat.
|
|
•
|
AccuFlex
uses robotic technology to accurately and efficiently fill a variety of single-dose medication blister cards on demand.
|
|
•
|
OnDemand Express II
optimizes robotic technology for high-speed, accurate fulfillment of single-dose blister cards and reclaimable packaging on demand.
|
|
•
|
Pharmacy labeling
is an important part of the packaging process to ensure the right medication is packaged and delivered to the right facility and, ultimately, the right patient. Drug specific, bar code scannable labels are affixed on many different types of packages prior to them being dispensed. We provide a Windows-based computer program that uses an extensive drug image database to produce a wide variety of medication labels on multiple printers. We also provide printers and related consumables.
|
Single Medication Blister Cards
We offer a wide variety of heat seal and cold seal blister cards in a variety of configurations, from 14 to 90 day doses. Heat seal cards provide a stronger seal than cold seal cards, helping pharmacists ensure consistency of the medication under nearly any environmental condition. Cold seal cards, also known as pressure sensitive cards, are both efficient and reliable and do not require heat sealing equipment to be sealed. They are ideal for emergency orders, for heat sensitive medications or when the use of a heat sealer is not practical.
MultiMedication Solutions for Use Where Patients Care for Themselves
Pharmacy Automation Systems
Our OnDemand and M-series automated solutions are designed to meet the broad needs of pharmacies to package individual patient medication orders accurately and efficiently into multimed adherence packaging. These machines interface with pharmacy information systems to obtain prescription information to provide patient-specific adherence packaging. Our current line of automation for multimedication includes the following products:
|
•
|
M5000
is a fully automated system designed specifically for multi-medication adherence packaging. The M5000 receives patient prescriptions; and constructs a filling map, then uses robotic technology to fill, seal and label the
|
16
package. The M5000 minimizes human activity in the multi-medication packaging process, thus reducing risk of errors.
|
•
|
VBM 200F
is an automated pharmacy solution that efficiently and accurately fills and checks Suremed® multiple medication blister cards utilizing guided light, barcode and RFID technologies to allow the filled tray to be audited throughout the entire packing process. VBM 200F can accommodate an extensive formulary with the capacity to store up to 200 different medications in the machine and has the ability to exchange cassettes while it’s running. This technology helps ensure that pharmacies have the competitive advantage to easily scale their business to help improve adherence and patient outcomes.
|
|
•
|
Guided Packing
is a software suite utilized by pharmacists to aid in the process of manually packaging multi-med blister cards. The systems creates the recipe for each patient specific multi-med card, guides the clinician in packaging the card, and produces an integrated label.
|
MultiMedication Blister Cards
We offer a wide variety of heat seal and cold seal multi-medication blister cards. Multi-medication cards allow the packaging of multiple drugs into a single blister cavity representing a specific dosing time. Multi-medication cards are sold in a variety of formats to fit the needs of pharmacists and patients, with the most common format providing four dosing times for each of seven days in one package. Multi-medication adherence packages may be assembled by pharmacists by hand, or by using our pharmacy automation systems described above.
Medication Management Solutions
Medication management systems are becoming an integral part of long-term care facilities to manage narcotics, first doses and emergency medications. Currently, most facilities rely on manual systems that do not provide the level of security, accountability and efficiencies that are attainable with the use of automation. When automation is implemented, pharmacies benefit by helping their customer facilities meet regulatory requirements and improve the response time. Patients benefit by having access to medications immediately with minimized medication errors. We offer specialized versions of the OmniRx medication control solution that is used by institutional pharmacies to provide their customers with secure medication management of narcotics, emergency medication, and first doses.
Sales and Distribution
We sell our Automation and Analytics and Medication Adherence solutions primarily in the United States. Approximately
86%
of our revenue was generated in this market for the year ended
December 31, 2017
. No single customer accounted for greater than 10% of our revenues for the years ended December 31, 2017, December 31, 2016 or December 31, 2015. Our sales force is organized by geographic region in the United States and Canada where our sales are primarily made direct to end-user customers with the exception of some distribution of Medication Adherence consumables. Outside the United States and Canada, we field a direct sales force in the United Kingdom, France, Germany and China, and for Medication Adherence products in Australia. For other geographies we generally sell through distributors and resellers. Our foreign operations are discussed in Note 14, Segment and Geographical Information, of the Notes to Consolidated Financial Statements and Item 7, Management’s Discussion and Analysis of Financial Condition and Results of Operations in this annual report. Our combined direct, corporate and international distribution sales teams consisted of approximately 276 staff members as of
December 31, 2017
. Nearly all of our direct sales team members have hospital capital equipment or clinical systems experience. Our sales representatives are generally organized to sell either the Automation and Analytics or Medication Adherence product lines. Our corporate sales team focuses on sales to large IDNs, the U.S. government, as well as partnering with group purchasing organizations ("GPOs").
The sales cycle for our automation systems, from the initial sales meeting to completion of installation, is long and can take in excess of 12 to 22 months. This is due in part to the relative cost of our systems and the number of people within each healthcare facility involved in the purchasing decision. To initiate the selling process, the sales representative generally targets the director of pharmacy, the director of nursing, the director of materials management or other decision makers and is responsible for educating each group within the healthcare facility about the economic safety and compliance benefits of our solutions relative to competing methods of managing medications or medical and surgical supplies.
We contract with GPOs, each of which functions as a purchasing agent on behalf of member hospitals and other healthcare providers, as well as with government entities and agencies. Pursuant to the terms of GPO agreements, each member contracts directly with us and can purchase our product at pre-negotiated contract terms and pricing. These GPO contracts are typically for multiple years with options to renew or extend for up to two years and some of which can be terminated by either party at any time. Our significant current GPO contracts include Intalere (f.k.a. Amerinet, Inc.), Vizient Inc, Premier Inc.,
17
HealthTrust Purchasing Group, The Resource Group and Resource Optimization & Innovation, LLC. We have also contracted with the U.S. General Services Administration, allowing the Department of Veteran Affairs, the Department of Defense and other Federal Government customers to purchase or lease our products. The account receivable balances are with individual members of the GPOs, and therefore no significant concentration of credit risk exists. During our fiscal year ended December 31, 2017 sales to members of the ten largest GPOs accounted for approximately
51%
of total consolidated revenue.
We offer multi-year, non-cancelable lease payment terms to assist healthcare organizations in purchasing our systems by reducing their cash flow requirements. We sell the majority of our multi-year lease receivables to third‑party leasing finance companies, but we also maintain a certain portion of our leases in-house.
Our field operations representatives support our sales force by providing operational and clinical expertise prior to the close of a sale and during installation of our automation systems. This group assists the customer with the technical implementation of our automation systems, including configuring our systems to address the specific needs of each individual customer. After the systems are installed, on-site support is provided by our field service team and technical support group.
We offer telephone technical support through our technical support centers in Illinois, Florida, Pennsylvania and North Carolina. Our support centers are staffed 24 hours a day, 365 days a year. We have found that a majority of our customers' service issues can be addressed either over the phone or by our support center personnel using their on-hand remote diagnostics tools. In addition, we use remote dial-in software that monitors customer conditions on a daily basis. We offer a suite of remote monitoring features, which proactively monitors system status and alerts service personnel to potential problems before they lead to system failure.
In addition, our international team handles direct sales, installation and service to healthcare facilities in the United Kingdom, France, and Germany, and to non-acute customers in Australia. Sales, installation and service to healthcare facilities is handled through distribution partners in other parts of Europe, Asia, Australia, the Middle East, South Africa, and South America. Our products are available in a variety of languages including Mandarin, French, Swedish, Dutch, Spanish, Turkish and German.
We have not sold and have no future plans to sell our products either directly or indirectly to customers located in countries that are identified as state sponsors of terrorism by the U.S. Department of State, or those subject to economic sanctions and export controls.
Centers of Excellence
In 2017, we created Centers of Excellence (“COE”) for product development, engineering and manufacturing with the Point of Use COE located at our facilities in California, the Robotics and Central Pharmacy COE located at our facilities near Pittsburgh, Pennsylvania and the Medication Adherence Consumables COE located at our facilities in St. Petersburg, Florida. As part of this initiative, we reduced our workforce by approximately 100 full-time employees, or about 4% of our total headcount. This reduction in force included the closure of our Nashville, Tennessee office and our manufacturing facility in Slovenia.
Manufacturing and Inventory
The manufacturing process for our Automation and Analytics products allows us to configure hardware and software in unique combinations to meet a wide variety of individual customer needs. The Automation and Analytics product manufacturing process primarily consists of the final assembly of components and testing of the completed product. Many of the subassemblies and components we use are provided by third-party contract manufacturers or other suppliers. We and our partners test these subassemblies and perform inspections to assure the quality and reliability of our products. While many components of our systems are standardized and available from multiple sources, certain components or subsystems are fabricated by a sole supplier according to our specifications and schedule requirements. Our Medication Adherence product manufacturing process consists of fabrication and assembly of equipment and mechanized process manufacturing of consumables.
Our arrangements with our contract manufacturers generally set forth quality, cost and delivery requirements, as well as manufacturing process terms, such as continuity of supply, inventory management, capacity flexibility, quality and cost management, oversight of manufacturing and conditions for the use of our intellectual property.
Our manufacturing organization procures components and schedules production based on the backlog of customer orders. Installation of equipment and software typically occurs between two weeks and twelve months after the initial order is received, depending upon the customer's particular needs. We deploy a key operational strategy of operating with backlog levels that approximate the average installation cycle of our customers, which allows us to more efficiently manage our
18
installation teams, improve production efficiencies, reduce inventory scrap and lower shipping costs. Shipment of consumables typically occurs between one and fourteen days after an order is received.
Competition
The medication management and supply chain solutions market is intensely competitive. We compete directly with a number of companies and are affected by evolving and new technologies, changes in industry standards and dynamic customer requirements.
Our current direct competitors in the medication management and supply chain solutions market include Becton Dickinson/CareFusion Corporation, ARxIUM (through its acquisition of MedSelect, Inc. and Automed), Cerner Corporation, Talyst Systems, LLC (which was acquired by Swisslog Healthcare), Emerson Electronic Co. (through its acquisition of medDispense, L.P.), Swisslog Holding AG (which was acquired by KUKA), WaveMark Inc., ParExcellence Systems, Inc., Vanas N.V., Infor (formally Lawson Software, Inc.), Willach Pharmacy Solutions, DIH Technologies Co., Yuyama Co., Ltd, Robopharma B.V., Apostore GmbH, KlS Steuerungstechnik GmbH and Suzhou Iron Technology (China). Our current direct competitors in the medication adherence solutions market include Drug Package, Inc., AutoMed Technologies, Inc. (a subsidiary of ARxIUM), Manchac Technologies, LLC (through its Dosis product line) and RX Systems, Inc., PillPack, Inc., TeleManager Technologies, Inc., VoicePort LLC., in the United States, and Jones Packaging Ltd., Synergy Medical Systems, Manrex Ltd, Global Factories B.V. and WebsterCare outside the United States.
We believe our products and services compare favorably with the offerings of our competitors, particularly with respect to proprietary technological advancements, system performance, system reliability, installation, applications training, service response time and service repair quality.
Intellectual Property and Proprietary Technology
We rely on a combination of patents, trademarks, copyright and trade secret laws, confidentiality procedures and licensing arrangements to protect our intellectual property rights.
We pursue patent protection in the United States and foreign jurisdictions for technology that we believe to be proprietary and that offers a potential competitive advantage for our products. Our issued patents relate to, among other things, the following:
|
•
|
the use of dispensing cabinets with locking doors;
|
|
•
|
the dispensing of patient specific items;
|
|
•
|
the remote management of dispensing devices;
|
|
•
|
automated pharmaceutical dispensing systems;
|
|
•
|
the capture and use of restocking information to generate orders;
|
|
•
|
various unit-dose mechanisms and methods;
|
|
•
|
fingerprint access to dispensing units;
|
|
•
|
certain methods for using radio frequency tags with storage items;
|
|
•
|
various aspects of mobile carts, including an adjustable user interface;
|
|
•
|
the tracking of tissue within medical facilities;
|
|
•
|
the control of refrigerated medical storage units;
|
|
•
|
the monitoring of returned medications;
|
|
•
|
cabinets with multi-colored lights;
|
|
•
|
pharmaceutical product packaging systems;
|
|
•
|
methods for depositing various solid pharmaceuticals into a variety of packages, including packages with cavities that hold multiple medications;
|
|
•
|
packaging systems with automated content readers, including those utilizing pick and place robotics;
|
|
•
|
blister packs with electrical circuits;
|
19
|
•
|
systems for removing medications from blister packs;
|
|
•
|
systems for the generation of a sterile air barrier to separate the internal chamber of a machine from the external environment for the preparation of pharmaceutical products;
|
|
•
|
methods for manipulating toxic substances;
|
|
•
|
use of a digital assistant appliance for assisting an operator in the manual preparation of a liquid pharmaceutical composition;
|
|
•
|
gripping devices for gripping a bag for the storage of pharmaceutical products;
|
|
•
|
screwing assemblies for screwing closing plugs onto syringes;
|
|
•
|
devices for the removal of needles from syringes;
|
|
•
|
methods for powdered drug reconstitution;
|
|
•
|
a fluid container and a method of analyzing, identifying and verifying fluid within the container;
|
|
•
|
a system and method for measuring dimensions of medication containers and automatically storing the measurements in a database;
|
|
•
|
an alignment meter for an automated robotic rail system;
|
|
•
|
targeted messaging in a pharmacy interactive voice response system;
|
|
•
|
dispensing measured quantities of medications in both solid and liquid form;
|
|
•
|
packaging and labeling of medication unit doses;
|
|
•
|
inventory control of medications and medication supplies, such as through RFID tag tracking;
|
|
•
|
storage and monitoring of medications and medication supplies in both stationary and mobile storage cabinets;
|
|
•
|
the distribution of medications and medication supplies within a healthcare facility by pneumatic tube, track-based carts and robotic distribution methods;
|
|
•
|
restricting access to medications during storage and distribution; and
|
|
•
|
monitoring medication consumption.
|
Our patents expire at various times between 2018 and 2035.
All of our product system software is copyrighted and subject to the protection of applicable copyright laws. We intend to seek additional international and U.S. patents on our technology and to seek registration of our trademarks. We have obtained registration of, among others, the following marks: Omnicell, the Omnicell logo, OmniRx, OmniCenter, SafetyStock, SinglePointe, SecureVault, the MTS Medication Technologies logo, OnDemand, SureMed, Accuflex, Pandora, Ateb, Detect-Rx, Time My Meds, Pharmacy Line, InPharmics, Aesynt, the Aesynt logo, AcuDose-Rx, Connect-Rx, MedCarousel, Robot-Rx, MACH4, Health Robotics and i.v.STATION. Trade secrets and other confidential information are also important to our business. We protect our trade secrets through a combination of contractual restrictions and confidentiality and licensing agreements.
Research and Development
We use industry standard operating systems and databases, but generally develop our own application and interface software in our research and development facilities. New product development projects are prioritized based on customer input. Research and development takes place in Mountain View, California, Cranberry Woods, Pennsylvania, St. Petersburg, Florida, Bochum, Germany, Beijing, China, Lancing U.K., and Trieste, Italy. Research and development expenses were
$66.0 million
,
$57.8 million
and
$35.2 million
for the years ended
December 31, 2017
, December 31,
2016
and December 31,
2015
, respectively.
Employees
We had approximately
2,350
employees as of
December 31, 2017
. We have rebalanced our staff as needed, at times eliminating some functional positions and at other times adding new functional-specific positions to meet the evolving needs of
20
the business. To our knowledge, none of our domestic employees are represented by a collective bargaining agreement, nor have we experienced any work stoppage. We believe that our employee relations are good.
Business under Government Contracts
A number of our U.S. government‑owned or government-run hospital customers sign five-year leases, with payment terms that are subject to one-year government budget funding cycles. Failure of any of our U.S. government customers to receive their annual funding could impair our ability to sell to these customers, or to collect payments on our existing unsold leases. For additional information regarding these leases, see the section entitled "Risk Factors" under Part I, Item 1A below.
Financing Practices Relating to Working Capital
We assist healthcare facilities in financing their cash outlay requirements for the purchase of our systems by offering multi-year, non-cancelable sales contracts. For additional information regarding these financing activities, see Note 1, Summary of Significant Accounting Policies, of the Notes to Consolidated Financial Statements in this annual report.
Product Backlog
Product backlog is the dollar amount of medication and supply dispensing systems for which we have purchase orders from our customers and for which we believe we generally will install, bill and gain customer acceptance within one year. Due to industry practice that allows customers to change order configurations with limited advance notice prior to shipment and occasional customer changes in installation schedules, we do not believe that backlog as of any particular date is necessarily indicative of future sales. However, we do believe that backlog is an indication of a customer's willingness to install our solutions. Our product backlog was $345 million and $301 million as of
December 31, 2017
and
December 31, 2016
, respectively.
Company Information
We were incorporated in California in 1992 under the name of Omnicell Technologies, Inc. and reincorporated in Delaware in 2001 as Omnicell, Inc.
Available Information
We file reports and other information with the Securities and Exchange Commission ("SEC") including annual reports on Form 10-K, quarterly reports on Form 10-Q, current reports on Form 8-K and proxy or information statements. Those reports and statements as well as all amendments to those documents filed or furnished pursuant to Section 13(a) or 15(d) of the Securities and Exchange Act (1) are available at the SEC's Public Reference Room at 100 F Street, N.E., Room 1580, Washington, DC 20549, (2) are available at the SEC's Internet site (www.sec.gov)and (3) are available free of charge through our website as soon as reasonably practicable after electronic filing with, or furnishing to, the SEC. You may obtain information on the operation of the Public Reference Room by calling the SEC at 1-800-SEC-0330. Our website address is www.omnicell.com. Information posted on or accessible through these websites is not incorporated by reference nor otherwise included in this report, and any references to these websites are intended to be inactive textual references only.
Executive Officers of the Registrant
The following table sets forth certain information about our executive officers as of the date of this annual report:
|
Name
|
Age
|
Position
|
||
|
Randall A. Lipps
|
60
|
President, Chief Executive Officer, and Chairman of the Board of Directors
|
||
|
J. Christopher Drew
|
52
|
President, North American Automation and Analytics
|
||
|
Robin G. Seim
|
58
|
President, Global Automation and Medication Adherence
|
||
|
Peter J. Kuipers
|
46
|
Executive Vice President and Chief Financial Officer
|
||
|
Dan S. Johnston
|
54
|
Executive Vice President and Chief Legal & Administrative Officer
|
||
|
Nhat H. Ngo
|
45
|
Executive Vice President, Marketing, Strategy and Business Development
|
||
|
Jorge R. Taborga
|
58
|
Executive Vice President, Engineering and Integration Management Office
|
||
|
Joseph B. Spears
|
58
|
Vice President, Corporate Finance and Chief Accounting Officer
|
||
Randall A. Lipps
was named Chief Executive Officer and President of Omnicell in October 2002. Mr. Lipps has served as Chairman of the Board and a Director of Omnicell since founding Omnicell in September 1992. Mr. Lipps received both a B.S. in economics and a B.B.A. from Southern Methodist University.
21
J. Christopher Drew
joined Omnicell in April 1994 and was named Senior Vice President, Operations in January 2005. In January 2009, Mr. Drew was named Senior Vice President, Field Operations. In March 2012, Mr. Drew was named Executive Vice President, Field Operations. In February 2015, Mr. Drew was named Executive Vice President, Sales and Marketing. In January 2016, Mr. Drew was named Executive Vice President, Sales and Marketing for North American Automation, responsible for sales, marketing, operations, and services of our automation and analytics segment in the North America region. In March 2016, Mr. Drew was named President, North American Automation and Analytics, responsible for North American sales, marketing, operations and service for the automation and analytics product lines. Mr. Drew received a B.A. in economics from Amherst College and an M.B.A. from the Stanford Graduate School of Business.
Robin G. Seim
joined Omnicell in February 2006 as Vice President and was named Chief Financial Officer in March 2006. In January 2009, Mr. Seim was named Chief Financial Officer and Vice President Finance, Administration and Manufacturing. In March 2012, Mr. Seim was named Chief Financial Officer and Executive Vice President Finance, Administration and Manufacturing. In February 2015, Mr. Seim was named Chief Financial Officer and Executive Vice President, Finance, International and Manufacturing. In January 2016, Mr. Seim was named Executive Vice President, Global Automation and Medication Adherence. In March 2016, Mr. Seim was named President, Global Automation and Medication Adherence. Prior to joining Omnicell, Mr. Seim served as Chief Financial Officer of several technology companies, including Villa Montage Systems, Inc. from 1999 to 2001, Candera, Inc. from 2001 to 2004 and Mirra, Inc., in 2005. Prior to 1999, Mr. Seim held a number of management positions with Nortel Networks, Bay Networks, and IBM. Mr. Seim received a B.S. in accounting from California State University, Sacramento.
Peter J. Kuipers
joined Omnicell in August 2015, as Executive Vice President and Chief Financial Officer. Prior to Omnicell, Mr. Kuipers served as Senior Vice President and Chief Financial Officer of Quantcast Corp., a global technology company that specializes in digital audience measurement and real-time advertising. From May 2013 to December 2014, Mr. Kuipers served as Executive Vice President and Chief Financial Officer of The Weather Company, a media and global technology leader operating The Weather Channel, weather.com, wunderground.com and its professional services division WSI. From September 2009 to April 2013, Mr. Kuipers served in various financial management positions at Yahoo! Inc., a global internet technology company, most recently as Vice President, Finance for the Americas region. Prior to Yahoo! Inc., Mr. Kuipers held financial leadership roles at Altera Corporation, General Electric Company, and Akzo Nobel. He started his career with Ernst & Young and worked in both the Netherlands and Seattle, Washington. Mr. Kuipers received a Master’s Degree in Economics and Business Administration from Maastricht University and is a Chartered Accountant in the Netherlands.
Dan S. Johnston
joined Omnicell in November 2003 as Vice President and General Counsel. In March 2012, Mr. Johnston was named Executive Vice President and General Counsel. In February 2015, Mr. Johnston was named Executive Vice President and Chief Legal and Administrative Officer. From April 1999 to November 2003, Mr. Johnston was Vice President and General Counsel at Be, Inc., a software company. From September 1994 to March 1999, Mr. Johnston was an attorney with the law firm Cooley LLP. Mr. Johnston received a B.S. in computer information systems from Humboldt State University and a J.D. from the Santa Clara University School of Law.
Nhat H. Ngo
joined Omnicell in November 2008 as Vice President of Strategy and Business Development. In March 2012, Mr. Ngo was named Executive Vice President, Strategy and Business Development. In January 2018, Mr. Ngo was named Executive Vice President, Marketing, Strategy and Business Development. From January 2007 to October 2008, Mr. Ngo served as Vice President of Business Development and Licensing for a business unit of Covidien, a global healthcare products company. From June 1999 to April 2006, Mr. Ngo worked at BriteSmile, Inc., a direct-to-consumer aesthetic technology company and served in a variety of senior leadership positions in marketing, sales, operations, strategic planning and corporate development. From September 1997 to June 1999, Mr. Ngo practiced corporate law at Shaw Pittman, LLP. Mr. Ngo received a B.S. in commerce, with a concentration in finance, from the University of Virginia McIntire School of Commerce and a J.D. from the University of Virginia School of Law.
Jorge R. Taborga
joined Omnicell in July 2007 as Vice President and Chief Information Officer. From January 2009 to February 2013, Mr. Taborga was Vice President of Manufacturing, Quality and Information Technology. In February 2013, Mr. Taborga was named Executive Vice President, Engineering. In January 2016, Mr. Taborga was named Executive Vice President, Engineering and Integration Management Office. Prior to joining Omnicell, Mr. Taborga held a number of executive positions with Bay Networks and Quantum, and ran his own management consulting company. He also held executive roles in two cloud computing companies, FusionOne and Terrasping. Mr. Taborga's earlier career includes senior roles in product development with ROLM Systems and Thomas-Conrad. Mr. Taborga received B.S. and M.S. degrees in Computer Science from Texas A&M University. He is currently pursuing a Ph.D. in Organizational Systems at Saybrook University.
Joseph B. Spears
joined Omnicell in May 2012 as Vice President, Corporate Finance. In April 2014, Mr. Spears was named Vice President, Corporate Finance and Corporate Controller. In October 2017, Mr. Spears was named Vice President, Corporate Finance and Chief Accounting Officer. Prior to joining Omnicell, Mr. Spears held various leadership positions in accounting and finance, including at eBay, Inc. from 2004 to 2012 as Sr. Director, Corporate Accounting. Prior to eBay, Inc.,
22
Mr. Spears held financial and accounting leadership roles at Procket Networks, Inc., Bay Networks, Inc., Nortel Networks Corporation and International Business Machines Corporation.
We have identified the following risks and uncertainties that may have a material adverse effect on our business, financial condition or results of operations. Our business faces significant risks and the risks described below may not be the only risks we face. Additional risks not presently known to us or that we currently believe are immaterial may also significantly impair our business operations. If any of these risks occur, our business, results of operations or financial condition could suffer and the market price of our common stock could decline.
In assessing these risks, you should also refer to other information contained in this annual report on Form 10-K, including the section entitled “Management’s Discussion and Analysis of Financial Condition and Results of Operations” and our Consolidated Financial Statements and related Notes.
If we fail to develop new products or enhance our existing products to react to rapid technological change and market demands in a timely and cost-effective manner, or if newly developed solutions, such as our XT Series, XR2 Automated Central Pharmacy System and IVX workflow, are not adopted in the same time frame and/or quantity as we anticipate, our business will suffer.
We must develop new products or enhance our existing products with improved technologies to meet rapidly evolving customer requirements. We are constantly engaged in the development process for next generation products, and we need to successfully design our next generation and other products for customers who continually require higher performance and functionality at lower costs. The development process for these advancements is lengthy and usually requires us to accurately anticipate technological innovations and market trends. Developing and enhancing these products can be time-consuming, costly and complex. Our ability to fund product development and enhancements partially depends on our ability to generate revenues from our existing products.
There is a risk that these developments, such as our XR2 Automated Central Pharmacy System and IVX semi-automated workflow solution, or enhancements, will be late, will have technical problems, will fail to meet customer or market specifications or will not be competitive with other products using alternative technologies that offer comparable performance and functionality. While our business strategy includes a goal of advancing our platform with new product introductions annually, we may be unable to successfully develop additional next generation products, new products or product enhancements on an annual basis or at all. Our next generation products, such as our XT Series, or any new products, such as our M5000, VBM 200/F packaging equipment for multimedication blister cards or XR2 Automated Central Pharmacy System, or product enhancements may not be accepted in new or existing markets. If we fail to continue to develop and introduce new products or product enhancements in a timely manner or on a cost-effective basis, we may be unable to achieve our goal of producing solutions that support fully automated central pharmacy operations, and our business will suffer.
We may not be able to successfully integrate acquired businesses or technologies into our existing business, including those of Aesynt, Ateb and InPharmics, which could negatively impact our operating results.
As a part of our business strategy we may seek to acquire businesses, technologies or products in the future. For example, in January 2016, we acquired Aesynt, in December 2016, we acquired Ateb and in April 2017, we acquired InPharmics. We cannot provide assurance that any acquisition or any future transaction we complete will result in long-term benefits to us or our stockholders, or that our management will be able to integrate or manage the acquired business effectively. Acquisitions entail numerous risks, including difficulties associated with the integration of operations, technologies, products and personnel that, if realized, could harm our operating results. Risks related to potential acquisitions include, but are not limited to:
|
•
|
difficulties in combining previously separate businesses into a single unit and the complexity of managing a more dispersed organization as sites are acquired;
|
|
•
|
complying with international labor laws that may restrict our ability to right-size organizations and gain synergies across acquired operations;
|
|
•
|
complying with regulatory requirements, such as those of the Food and Drug Administration, that we were not previously subject to;
|
|
•
|
the substantial costs that may be incurred and the substantial diversion of management's attention from day-to-day business when evaluating and negotiating such transactions and then integrating an acquired business;
|
23
|
•
|
discovery, after completion of the acquisition, of liabilities assumed from the acquired business or of assets acquired that are broader in scope and magnitude or are more difficult to manage than originally assumed;
|
|
•
|
failure to achieve anticipated benefits such as cost savings and revenue enhancements;
|
|
•
|
difficulties related to assimilating the products or key personnel of an acquired business;
|
|
•
|
failure to understand and compete effectively in markets in which we have limited previous experience; and
|
|
•
|
difficulties in integrating newly acquired products and solutions into a logical offering that our customers understand and embrace.
|
Successful integration of acquired operations, products and personnel into Omnicell may place a significant burden on the combined company's management and internal resources. We may also experience difficulty in effectively integrating the different cultures and practices of any acquired entity. The challenges of integrating acquired entities could disrupt the combined company's ongoing business, distract its management focus from other opportunities and challenges, and increase expenses and working capital requirements. The diversion of management attention and any difficulties encountered in the transition and integration process could harm our business, financial condition and operating results.
We may fail to realize the potential benefits of recently acquired businesses.
In 2016 we acquired Aesynt and Ateb, and in 2017 we acquired InPharmics, in an effort to realize certain potential benefits, including expansion of the combined businesses and broader market opportunities. However, our ability to realize these potential benefits depends on our successfully combining the businesses of Omnicell, Aesynt, Ateb and InPharmics. The combined company may fail to realize the potential benefits of the acquisition for a variety of reasons, including the following:
|
•
|
inability or failure to expand product bookings and sales;
|
|
•
|
inability to maintain business relationships with customers and suppliers of newly acquired companies, such as Ateb and InPharmics, due to post-acquisition disruption;
|
|
•
|
inability or failure to effectively coordinate sales and marketing efforts to communicate the capabilities of the combined company;
|
|
•
|
inability or failure to successfully integrate and harmonize financial reporting and information technology systems;
|
|
•
|
inability or failure to achieve the expected operational and cost efficiencies; and
|
|
•
|
loss of key employees.
|
The actual integration may result in additional and unforeseen expenses or delays. If we are not able to successfully integrate the acquired businesses and their operations, or if there are delays in combining the businesses, the anticipated benefits of the acquisition may not be realized fully or at all or may take longer to realize than expected.
We have incurred substantial debt, which could impair our flexibility and access to capital and adversely affect our financial position.
In connection with the Aesynt Acquisition, we entered into a $400.0 million senior secured credit facility pursuant to a credit agreement, by and among us, the lenders from time to time party thereto, Wells Fargo Securities, LLC, as sole lead arranger and Wells Fargo Bank, National Association, as administrative agent (as subsequently amended, the “Credit Agreement”). In December 2017, we entered into an amendment to the Credit Agreement with Wells Fargo Bank, National Association and certain other lenders pursuant to which the revolving credit facility was increased from $200 million to $315 million and certain other modifications were made, including amendments to certain negative covenants. The Credit Agreement also provides for a $200.0 million term loan facility. The loan balances at December 31, 2017 were
$182.5 million
of term loans and
$34.5 million
of revolving loans. Our debt may:
|
•
|
limit our ability to borrow additional funds for working capital, capital expenditures, acquisitions or other general business purposes;
|
|
•
|
limit our ability to use our cash flow or obtain additional financing for future working capital, capital expenditures, acquisitions or other general business purposes;
|
|
•
|
require us to use a substantial portion of our cash flow from operations to make debt service payments;
|
24
|
•
|
limit our flexibility to plan for, or react to, changes in our business and industry;
|
|
•
|
place us at a competitive disadvantage compared to our less leveraged competitors; and
|
|
•
|
increase our vulnerability to the impact of adverse economic and industry conditions.
|
Our ability to meet our debt service obligations will depend on our future performance, which will be subject to financial, business and other factors affecting our operations, many of which are beyond our control. If we do not have sufficient funds to meet our debt service obligations, we may be required to refinance or restructure all or part of our existing debt, sell assets, borrow more money or sell securities, none of which we can assure you that we would be able to do in a timely manner, or at all. In addition, as more fully described in the risk factor titled “Covenants in our Credit Agreement restrict our business and operations in many ways and if we do not effectively manage our compliance with these covenants, our financial conditions and results of operations could be adversely affected” below, the Credit Agreement includes customary restrictive covenants that impose operating and financial restrictions on us, including restrictions on our ability to take actions that could be in our best interests.
If goodwill or other intangible assets that we recorded in connection with the Aesynt, Ateb and InPharmics Acquisitions, or have recorded in connection with prior acquisitions, become impaired, we could be required to take significant charges against earnings.
In connection with the accounting for the Aesynt and Ateb Acquisitions in 2016 and the InPharmics acquisition in 2017, we recorded a significant amount of goodwill and other intangible assets, and we maintain significant goodwill and other intangible assets relating to prior acquisitions, such as our acquisitions of MTS, Avantec and Mach4. As of December 31, 2017, we had recorded approximately $505.9 million net, in goodwill and intangible assets in connection with past acquisitions. Under U.S. generally accepted accounting principles ("GAAP"), we must assess, at least annually and potentially more frequently, whether the value of goodwill and other indefinite-lived intangible assets has been impaired. Amortizing intangible assets will be assessed for impairment in the event of an impairment indicator. Any reduction or impairment of the value of goodwill or other intangible assets will result in a charge against earnings, which could materially adversely affect our results of operations and shareholders’ equity in future periods.
Unfavorable economic and market conditions, a decreased demand in the capital equipment market and uncertainty regarding the rollout of government legislation in the healthcare industry could adversely affect our operating results.
Customer demand for our products is significantly linked to the strength of the economy. If decreases in demand for capital equipment caused by weak economic conditions and decreased corporate and government spending, including any effects of fiscal budget balancing at the federal level, deferrals or delays of capital equipment projects, longer time frames for capital equipment purchasing decisions or generally reduced expenditures for capital solutions occurs, we will experience decreased revenues and lower revenue growth rates and our operating results could be materially and adversely affected.
Additionally, as the U.S. Federal Government implements healthcare reform legislation, and as Congress, regulatory agencies and other state governing organizations continue to review and assess additional healthcare legislation and regulations, there may be an impact on our business. Healthcare facilities may decide to postpone or reduce spending until the implications of such healthcare enactments are more clearly understood, which may affect the demand for our products and harm our business.
25
The medication management and supply chain solutions market is highly competitive and we may be unable to compete successfully against new entrants and established companies with greater resources and/or existing business relationships with our current and potential customers.
The medication management and supply chain solutions market is intensely competitive. We expect continued and increased competition from current and future competitors, many of which have significantly greater financial, technical, marketing and other resources than we do. Our current direct competitors in the medication management and supply chain solutions market include Becton Dickinson/CareFusion Corporation, ARxIUM (through its acquisition of MedSelect, Inc. and Automed), Cerner Corporation, Talyst Systems, LLC (which was acquired by Swisslog Healthcare), Emerson Electronic Co. (through its acquisition of medDispense, L.P.), Swisslog Holding AG (which was acquired by KUKA), WaveMark Inc., ParExcellence Systems, Inc., Vanas N.V., Infor (formally Lawson Software, Inc.), Willach Pharmacy Solutions, DIH Technologies Co., Yuyama Co., Ltd, Robopharma B.V., Apostore GmbH, KlS Steuerungstechnik GmbH and Suzhou Iron Technology (China). Our current direct competitors in the medication adherence solutions market include Drug Package, Inc., AutoMed Technologies, Inc. (a subsidiary of ARxIUM), Manchac Technologies, LLC (through its Dosis product line) and RX Systems, Inc., PillPack, Inc., TeleManager Technologies, Inc., VoicePort LLC, in the United States, and Jones Packaging Ltd., Synergy Medical Systems, Manrex Ltd, Global Factories B.V., and WebsterCare outside the United States.
The competitive challenges we face in the medication management and supply chain solutions market include, but are not limited to, the following:
|
•
|
certain competitors may offer or have the ability to offer a broader range of solutions in the marketplace that we are unable to match;
|
|
•
|
certain competitors may develop alternative solutions to the customer problems our products are designed to solve that may provide a better customer outcome or a lower cost of operation;
|
|
•
|
certain competitors may develop new features or capabilities for their products not previously offered that could compete directly with our products;
|
|
•
|
competitive pressures could result in increased price competition for our products and services, fewer customer orders and reduced gross margins, any of which could harm our business;
|
|
•
|
current and potential competitors may make strategic acquisitions or establish cooperative relationships among themselves or with third parties, including larger, more established healthcare supply companies, such as the acquisition of CareFusion Corporation by Becton Dickenson Corporation and the acquisition of Talyst Systems, LLC. by Swisslog Healthcare, thereby increasing their ability to develop and offer a broader suite of products and services to address the needs of our prospective customers;
|
|
•
|
our competitive environment is currently experiencing a significant degree of consolidation which could lead to competitors developing new business models that require us to adapt how we market, sell or distribute our products;
|
|
•
|
other established or emerging companies may enter the medication management and supply chain solutions market with products and services that are preferred by our current and potential customers based on factors such as features, capabilities or cost;
|
|
•
|
our competitors may develop, license or incorporate new or emerging technologies or devote greater resources to the development, promotion and sale of their products and services than we do;
|
|
•
|
certain competitors have greater brand name recognition and a more extensive installed base of medication and supply dispensing systems or other products and services than we do, and such advantages could be used to increase their market share;
|
|
•
|
certain competitors may have existing business relationships with our current and potential customers, which may cause these customers to purchase medication and supply dispensing systems or automation solutions from these competitors; and
|
|
•
|
our competitors may secure products and services from suppliers on more favorable terms or secure exclusive arrangements with suppliers or buyers that may impede the sales of our products and services.
|
Any reduction in the demand for or adoption of our medication and supply systems, related services, or consumables would reduce our revenues.
26
Our medication and supply dispensing systems represent only one approach to managing the distribution of pharmaceuticals and supplies at acute healthcare facilities and our medication packaging systems represent only one way of managing medication distribution at non-acute care facilities. While a significant portion of domestic acute care facilities have adopted some level of medication and/or supply automation, a significant portion of domestic and international healthcare facilities still use traditional approaches in some form that do not include fully automated methods of medication and supply management. As a result, we must continuously educate existing and prospective customers about the advantages of our products, which requires significant sales efforts, particularly when we are seeking to replace an incumbent supplier of medication and supply automation solutions and can cause longer sales cycles. Despite our significant efforts and extensive time commitments in sales to healthcare facilities, we cannot be assured that our efforts will result in sales to these customers.
In addition, our medication and supply dispensing systems and our more complex automated packaging systems typically represent a sizable initial capital expenditure for healthcare organizations. Changes in the budgets of these organizations and the timing of spending under these budgets can have a significant effect on the demand for our medication and supply dispensing systems and related services. These budgets are often supported by cash flows that can be negatively affected by declining investment income and influenced by limited resources, increased operational and financing costs, macroeconomic conditions such as unemployment rates and conflicting spending priorities among different departments. Any decrease in expenditures by healthcare facilities or increased financing costs could decrease demand for our medication and supply dispensing systems and related services and reduce our revenues.
Changing customer requirements could decrease the demand for our products and services and our new product solutions may not achieve market acceptance.
The medication management and supply chain solutions market is characterized by evolving technologies and industry standards, frequent new product introductions and dynamic customer requirements that may render existing products obsolete or less competitive. The medication management and supply chain solutions market could erode rapidly due to unforeseen changes in the features and functions of competing products, as well as the pricing models for such products. Our future success will depend in part upon our ability to enhance our existing products and services and to develop and introduce new products and services to meet changing customer requirements. The process of developing products and services such as those we offer is extremely complex and is expected to become increasingly more complex and expensive in the future as new technologies are introduced. If we are unable to enhance our existing products or develop new products to meet changing customer requirements, and bring such enhancements and products to market in a timely manner, demand for our products could decrease.
We cannot provide assurance that we will be successful in marketing any new products or services that we introduce, that new products or services will compete effectively with similar products or services sold by our competitors, or that the level of market acceptance of such products or services will be sufficient to generate expected revenues and synergies with our other products or services. For example, we recently announced our new XR2 Automated Central Pharmacy System and IVX workflow solutions, and we cannot guarantee that demand will meet our expectations. In addition, our XT Series, M5000 and VBM 200F automated pharmacy solutions for multi-medication blister card packaging are relatively new to the market. Deployment of new products or services often requires interoperability with other Omnicell products or services as well as with healthcare facilities' existing information management systems. If these products or services fail to satisfy these demanding technological objectives, our customers may be dissatisfied and we may be unable to generate future sales.
The healthcare industry faces changes to healthcare legislation and other healthcare reform, as well as financial constraints and consolidation, which could adversely affect the demand for our products and services.
The healthcare industry has faced, and will likely continue to face, significant financial constraints. U.S. government legislation such as the American Recovery and Reinvestment Act of 2009, the Patient Protection and Affordable Care Act of 2010 (the "PPACA"), the Budget Control Act of 2011, and other health reform legislation, or the repeal of all or a portion of any such legislation may cause customers to postpone purchases of our products due to reductions in federal healthcare program reimbursement rates and/or needed changes to their operations in order to meet the requirements of legislation. Our automation solutions often involve a significant financial commitment from our customers and, as a result, our ability to grow our business is largely dependent on our customers' capital and operating budgets. To the extent legislation promotes spending on other initiatives or healthcare providers’ spending declines or increases more slowly than we anticipate, demand for our products and services could decline.
For example, some of the provisions of the PPACA have yet to be implemented, and there have been judicial and Congressional challenges to certain aspects of the PPACA, as well as recent efforts by the Trump administration to repeal or replace certain aspects of the PPACA. Since January 2017, President Trump has signed two Executive Orders designed to delay the implementation of certain provisions of the PPACA or otherwise circumvent some of the requirements for health insurance mandated by the PPACA. Concurrently, Congress has considered legislation that would repeal or repeal and replace all or part
27
of the PPACA. While Congress has not passed comprehensive repeal legislation, two bills affecting the implementation of certain taxes under the PPACA have been enacted. The Tax Cuts and Jobs Act of 2017 includes a provision repealing, effective January 1, 2019, the tax-based shared responsibility payment imposed by the PPACA on certain individuals who fail to maintain qualifying health coverage for all or part of a year that is commonly referred to as the “individual mandate.” Additionally, on January 22, 2018, President Trump signed a continuing resolution on appropriations for fiscal year 2018 that delayed the implementation of certain fees mandated under the PPACA, including the so-called “Cadillac” tax on certain high cost employer-sponsored insurance plans, the annual fee imposed on certain health insurance providers based on market share, and the medical device excise tax on non-exempt medical devices. Congress may consider other legislation to repeal or replace other elements of the PPACA. Thus, the full impact of the PPACA, or any law replacing elements of it, on our business remains unclear. The implementation of cost containment measures or other healthcare reforms may have an effect on our revenue or profitability.
In addition, healthcare providers have consolidated to create larger healthcare delivery organizations in order to achieve greater market power. If this consolidation continues, it would increase the size of certain target customers, which could increase the cost, effort and difficulty in selling our products to such target customers, or could cause our existing customers or potential new customers to begin utilizing our competitors' products if such customers are acquired by healthcare providers that prefer our competitors' products to ours. In addition, the resulting organizations could have greater bargaining power, which may lead to price erosion.
When we experience delays in installations of our medication and supply dispensing systems or our more complex medication packaging systems, resulting in delays in our ability to recognize revenue, our competitive position, results of operations and financial condition could be harmed.
The purchase of our medication and supply dispensing systems or our more complex medication packaging systems is often part of a customer's larger initiative to re-engineer its pharmacy and their distribution and materials management systems. As a result, our sales cycles are often lengthy. The purchase of our systems often entails larger strategic purchases by customers that frequently require more complex and stringent contractual requirements and generally involve a significant commitment of management attention and resources by prospective customers. These larger and more complex transactions often require the input and approval of many decision-makers, including pharmacy directors, materials managers, nurse managers, financial managers, information systems managers, administrators, lawyers and boards of directors. In addition, new product announcements, such as that of our XT Series, can cause a delay in our customers' decision to purchase our products or convert orders from our older products to those of our newer products, such as the XT Series. For these and other reasons, the sales cycle associated with the sale of our medication and supply dispensing systems is often lengthy and subject to a number of delays over which we have little or no control. A delay in, or loss of, sales of our medication and supply dispensing systems could have an adverse effect upon our operating results and could harm our business.
In addition, and in part as a result of the complexities inherent in larger transactions, the time between the purchase and installation of our systems can range from two weeks to one year. Delays in installation can occur for reasons that are often outside of our control. We have also experienced fluctuations in our customer and transaction size mix, which makes our ability to forecast our product bookings more difficult. Because we recognize revenue for our medication and supply dispensing systems and our more complex medication packaging systems only upon installation at a customer's site, any delay in installation by our customers will also cause a delay in the recognition of the revenue for that system.
Demand for our consumable medication packages is time-sensitive and if we are not able to supply the demand from our institutional and retail pharmacy customers on schedule and with quality packaging products, they may use alternative means to distribute medications to their customers.
Approximately 11% of our revenue is generated from the sale of consumable medication packages, which are produced in our St. Petersburg, Florida facilities on a continuous basis and shipped to our institutional pharmacy and retail pharmacy customers shortly before they are required by these customers.
The demands placed on institutional pharmacies and retail pharmacies by their customers represent real time requirements of those customers. Our customer agreements for the sale of consumable medication packages are typically short-term in nature and typically do not include any volume commitments on the part of the customer. Although our packaging may be considered the preferred method of maintaining control of medications during the medication distribution and administration process, institutional and retail pharmacies have alternative methods of distributing medications, including bulk and alternative packaging, and medication adherence packaging may be supplied by our competitors. To the extent that we are unable to supply quality packaging to our customers in a timely manner, that demand will be met via alternative distribution methods, including consumable medication packaging sold by our competitors, and our revenue will decline. Any disruption in the production capabilities of our St. Petersburg facilities will adversely affect our ability to ship our consumable medication packages and would reduce our revenue.
28
Many of our newer products include software as a service or solution as a service subscriptions. If customer adoption of these products is faster than anticipated, we may experience a temporary reduction of revenues. If these products are unable to meet customer needs, customers may cancel subscriptions.
We currently offer our IV Solutions products and our Central Pharmacy products together with operators as a monthly subscription. We also sell Performance Center, Electronic Medication Administration, and SupplyX as a subscription. IVX Workflow contains a significant subscription element in its pricing structure. If adoption of IV solutions subscription products takes place faster than anticipated, the shift to subscription revenue from capital equipment sales will defer revenue recognition. If any of our subscription products do not substantially meet customer requirements, customers may cancel subscriptions, causing a decline in revenue.
Our international operations may subject us to additional risks that can adversely affect our operating results.
We currently have operations outside of the United States, including sales efforts centered in Canada, Europe, the Middle East and Asia-Pacific regions and supply chain efforts in Asia. We intend to continue to expand our international operations, particularly in certain markets that we view as strategic, including China and the Middle East. Our international operations subject us to a variety of risks, including:
|
•
|
our reliance on distributors for the sale and post-sale support of our automated dispensing systems outside the United States and Canada;
|
|
•
|
the difficulty of managing an organization operating in various countries;
|
|
•
|
political sentiment against international outsourcing of production;
|
|
•
|
reduced protection for intellectual property rights, particularly in jurisdictions that have less developed intellectual property regimes;
|
|
•
|
changes in foreign regulatory requirements;
|
|
•
|
the requirement to comply with a variety of international laws and regulations, including privacy, labor, import, export, trade, environmental standards, product compliance, tax, anti-bribery and employment laws and changes in tariff rates;
|
|
•
|
fluctuations in currency exchange rates and difficulties in repatriating funds from certain countries;
|
|
•
|
additional investment, coordination and lead-time necessary to successfully interface our automation solutions with the existing information systems of our customers or potential customers outside of the United States; and
|
|
•
|
political unrest, terrorism and the potential for other hostilities in areas in which we have facilities.
|
If we are unable to anticipate and address these risks properly, our business or operating results will be harmed.
Government regulation of the healthcare industry could reduce demand for our products, or substantially increase the cost to produce our products.
The manufacture and sale of most of our current products are not regulated by the FDA, or the Drug Enforcement Administration ("DEA"). Through our acquisition of Aesynt, we have both a Class I and a Class II, 510(k) exempt medical device which are subject to FDA regulation and require compliance with the FDA Quality System Regulation as well as medical device reporting. Additional products may be regulated in the future by the FDA, DEA or other federal agencies due to future legislative and regulatory initiatives or reforms. Direct regulation of our business and products by the FDA, DEA or other federal agencies could substantially increase the cost to produce our products and increase the time required to bring those products to market, reduce the demand for our products and reduce our revenues. In addition, healthcare providers and facilities that use our equipment and dispense controlled substances are subject to regulation by the DEA. The failure of these providers and facilities to comply with DEA requirements, including the Controlled Substances Act and its implementing regulations, could reduce demand for our products and harm our competitive position, results of operations and financial condition. Pharmacies are regulated by individual state boards of pharmacy that issue rules for pharmacy licensure in their respective jurisdictions. State boards of pharmacy do not license or approve our medication and supply dispensing systems; however, pharmacies using our equipment are subject to state board approval. The failure of such pharmacies to meet differing requirements from a significant number of state boards of pharmacy could decrease demand for our products and harm our competitive position, results of operations and financial condition. Similarly, hospitals must be accredited by The Joint Commission in order to be eligible for Medicaid and Medicare funds. The Joint Commission does not approve or accredit medication and supply dispensing systems; however, disapproval of our customers' medication and supply dispensing
29
management methods and their failure to meet The Joint Commission requirements could decrease demand for our products and harm our competitive position, results of operations and financial condition.
While we have implemented a Privacy and Use of Information Policy and adhere to established privacy principles, use of customer information guidelines and related federal and state statutes, we cannot assure you that we will be in compliance with all federal and state healthcare information privacy and security laws that we are directly or indirectly subject to, including, without limitation, the Health Insurance Portability and Accountability Act of 1996 ("HIPAA"). Among other things, this legislation required the Secretary of Health and Human Services to adopt national standards governing the conduct of certain electronic health information transactions and protecting the privacy and security of personally identifiable health information maintained or transmitted by "covered entities," which include pharmacies and other healthcare providers with which we do business.
The standards adopted to date include, among others, the "Standards for Privacy of Individually Identifiable Health Information," which restrict the use and disclosure of personally identifiable health information by covered entities, and the "Security Standards," which require covered entities to implement administrative, physical and technical safeguards to protect the integrity and security of certain electronic health information. Under HIPAA, we are considered a "business associate" in relation to many of our customers that are covered entities, and as such, most of these customers have required that we enter into written agreements governing the way we handle and safeguard certain patient health information we may encounter in providing our products and services and may impose liability on us for failure to meet our contractual obligations. Further, pursuant to changes in HIPAA under the American Recovery and Reinvestment Act of 2009, we are covered under HIPAA similar to other covered entities and in some cases, subject to the same civil and criminal penalties as a covered entity. A number of states have also enacted privacy and security statutes and regulations that, in some cases, are more stringent than HIPAA and may also apply directly to us. If our past or present operations are found to violate any of these laws, we may be subject to fines, penalties and other sanctions.
In addition, we cannot predict the potential impact of future HIPAA standards and other federal and state privacy and security laws that may be enacted at any time on our customers or on Omnicell. These laws could restrict the ability of our customers to obtain, use or disseminate patient information, which could reduce the demand for our products or force us to redesign our products in order to meet regulatory requirements.
In the past, we have experienced substantial fluctuations in customer demand, and we cannot be sure that we will be able to respond proactively to future changes in customer demand.
Our ability to adjust to fluctuations in our revenue while still achieving or sustaining profitability is dependent upon our ability to manage costs and control expenses. If our revenue increases or decreases rapidly, we may not be able to manage these changes effectively. Future growth is dependent on the continued demand for our products, the volume of installations we are able to complete, our ability to continue to meet our customers' needs and provide a quality installation experience and our flexibility in manpower allocations among customers to complete installations on a timely basis.
Regarding our expenses, our ability to control expense is dependent on our ability to continue to develop and leverage effective and efficient human and information technology systems, our ability to gain efficiencies in our workforce through the local and worldwide labor markets and our ability to grow our outsourced vendor supply model. Our expense growth rate may equal or exceed our revenue growth rate if we are unable to streamline our operations, incur significant R&D expenses prior to, or without recognizing the benefits, of those solutions under development, incur acquisition-related integration expenses greater than those we anticipate, or fail to reduce the costs or increase the margins of our products. In addition, we may not be able to reduce our expenses to keep pace with any reduction in our revenue, which could harm our results of operations and financial position.
Covenants in our Credit Agreement restrict our business and operations in many ways and if we do not effectively manage our compliance with these covenants, our financial conditions and results of operations could be adversely affected.
The Credit Agreement contains various customary covenants that limit our ability and/or our subsidiaries’ ability to, among other things:
|
•
|
incur or assume liens or additional debt or provide guarantees in respect of obligations or other persons;
|
|
•
|
issue redeemable preferred stock;
|
|
•
|
pay dividends or distributions or redeem or repurchase capital stock;
|
|
•
|
prepay, redeem or repurchase certain debt;
|
|
•
|
make loans, investments, acquisitions (including acquisitions of exclusive licenses) and capital expenditures;
|
30
|
•
|
enter into agreements that restrict distributions from our subsidiaries;
|
|
•
|
sell assets and capital stock of our subsidiaries;
|
|
•
|
enter into certain transactions with affiliates; and
|
|
•
|
consolidate or merge with or into, or sell substantially all of our assets to, another person.
|
The Credit Agreement also includes financial covenants requiring us (i) not to exceed a maximum consolidated total leverage ratio of 3.50:1 through the end of 2018, 3.25:1 through the end of the second quarter of 2019 and 3.00:1 thereafter (subject to certain exceptions) and (ii) to maintain a minimum fixed charge coverage ratio of 1.50:1. Our ability to comply with these financial covenants may be affected by events beyond our control. Our failure to comply with any of the covenants under the Credit Agreement could result in a default under the terms of the Credit Agreement, which could permit the administrative agent or the lenders to declare all or part of any outstanding borrowings to be immediately due and payable, or to refuse to permit additional borrowings under the revolving credit facility, which could restrict our operations, particularly our ability to respond to changes in our business or to take specified actions to take advantage of certain business opportunities that may be presented to us. In addition, if we are unable to repay those amounts, the administrative agent and the lenders under the Credit Agreement could proceed against the collateral granted to them to secure that debt, which would seriously harm our business.
If we are unable to recruit and retain skilled and motivated personnel, our competitive position, results of operations and financial condition could be harmed.
Our success is highly dependent upon the continuing contributions of our key management, sales, technical and engineering staff. We believe that our future success will depend upon our ability to attract, train and retain highly skilled and motivated personnel. As more of our products are installed in increasingly complex environments, greater technical expertise will be required. As our installed base of customers increases, we will also face additional demands on our customer service and support personnel, requiring additional resources to meet these demands. We may experience difficulty in recruiting qualified personnel. Competition for qualified technical, engineering, managerial, sales, marketing, financial reporting and other personnel can be intense and we may not be successful in attracting and retaining qualified personnel. Competitors have in the past attempted, and may in the future attempt, to recruit our employees.
In addition, we have historically used stock options, restricted stock units and other forms of equity compensation as key components of our employee compensation program in order to align employees' interests with the interests of our stockholders, encourage employee retention and provide competitive compensation packages. The effect of managing share-based compensation expense and minimizing shareholder dilution from the issuance of new shares may make it less favorable for us to grant stock options, restricted stock units or other forms of equity compensation, to employees in the future. In order to continue granting equity compensation at competitive levels, we must seek stockholder approval for any increases to the number of shares reserved for issuance under our equity incentive plans, such as the share increase that was approved at our 2015 Annual Meeting of Stockholders, and we cannot assure you that we will receive such approvals in the future. Any failure to receive approval for current or future proposed increases could prevent us from granting equity compensation at competitive levels and make it more difficult to attract, retain and motivate employees. Further, to the extent that we expand our business or product lines through the acquisition of other businesses, any failure to receive any such approvals could prevent us from securing employment commitments from such newly acquired employees. Failure to attract and retain key personnel could harm our competitive position, results of operations and financial condition.
If we experience a significant disruption in our information technology systems or breaches of data security, our business could be adversely affected.
We rely on information technology systems to keep financial records and corporate records, communicate with staff and external parties and operate other critical functions, including sales and manufacturing processes. Our information technology systems are potentially vulnerable to disruption due to breakdown, malicious intrusion and computer viruses or environmental impact. If we were to experience a prolonged system disruption in our information technology systems, it could negatively impact the coordination of our sales, planning and manufacturing activities, which could adversely affect our business. In addition, in order to maximize our information technology efficiency, we have physically consolidated our primary corporate data and computer operations. This concentration, however, exposes us to a greater risk of disruption to our internal information technology systems. Although we maintain offsite back-ups of our data, if operations at our facilities were disrupted, it may cause a material disruption in our business if we are not capable of restoring function on an acceptable time frame.
In addition, our information technology systems are potentially vulnerable to cyber-attacks or other data security breaches-whether by employees or others-which may expose sensitive data to unauthorized persons. Such data security breaches could lead to the loss of trade secrets or other intellectual property, or could lead to the public exposure of sensitive
31
and confidential information of our employees, customers, suppliers and others, any of which could have a material adverse effect on our business, financial condition and results of operations. Moreover, a security breach or privacy violation that leads to disclosure or modification of, or prevents access to, patient information, including personally identifiable information or protected health information, could harm our reputation, result in litigation, compel us to comply with federal and/or state breach notification laws, subject us to mandatory corrective action, require us to verify the correctness of database contents and otherwise subject us to liability under laws and regulations that protect personal data, resulting in increased costs or loss of revenue.
While we have implemented a number of protective measures, including firewalls, antivirus and malware detection tools, patches, log monitors, routine back-ups, system audits, routine password modifications and disaster recovery procedures, such measures may not be adequate or implemented properly to prevent or fully address the adverse effect of such events, and in some cases we may be unaware of an incident or its magnitude and effects. If we are unable to prevent such security breaches or privacy violations or implement satisfactory remedial measures, our operations could be disrupted, and we may suffer loss of reputation, financial loss and other regulatory penalties because of lost or misappropriated information, including sensitive patient data. In addition, these breaches and other inappropriate access can be difficult to detect, and any delay in identifying them may lead to increased harm of the type described above.
If we are unable to successfully interface our automation solutions with the existing information systems of our customers, they may choose not to use our products and services.
For healthcare facilities to fully benefit from our automation solutions, our systems must interface with their existing information systems. This may require substantial cooperation, incremental investment and coordination on the part of our customers and may require coordination with third-party suppliers of the existing information systems. There is little uniformity in the systems currently used by our customers, which complicates the interfacing process. If these systems are not successfully interfaced, our customers could choose not to use or to reduce their use of our automation solutions, which would harm our business. Also, these information systems are impacted by regulatory forces, such as the HITECH Act, Meaningful Use Stages, and HIPAA Omnibus Rules, and may evolve their interoperability functionality accordingly. We expect to comply with the mandatory standards and certifications that enable us to continuously interoperate with partner information system, but such symbiotic evolution in a changing regulatory environment can at times create an execution risk.
Additionally, our competitors may enter into agreements with providers of hospital information management systems that are designed to increase the interoperability of their respective products. To the extent our competitors are able to increase the interoperability of their products with those of the major hospital information systems providers, customers who utilize such information systems may choose not to use our products and services. In addition, hospital information systems providers may choose to develop their own solutions that could compete with ours. Furthermore, we expect the importance of interoperability to increase in the next few years. Regulations such as the HITECH Act Meaningful Use Stage 3 are expected to heavily focus on evidence and outcomes. Given our role in care delivery process, the data generated by our products may be a key input for assessing and reporting on clinical outcomes. This may elevate interoperability with information systems to a relative importance to our customers creating a business opportunity and risk.
Our failure to protect our intellectual property rights could negatively affect our ability to compete.
Our success depends in part on our ability to obtain patent protection for technology and processes and our ability to preserve our trademarks, copyrights and trade secrets. We have pursued patent protection in the United States and foreign jurisdictions for technology that we believe to be proprietary and for technology that offers us a potential competitive advantage for our products. We intend to continue to pursue such protection in the future. Our issued patents relate to various features of our medication and supply dispensing systems and our packaging systems. We cannot assure you that we will file any patent applications in the future, and that any of our patent applications will result in issued patents or that, if issued, such patents will provide significant protection for our technology and processes. As an example, in September 2014, an action was brought against us, to, among other matters, correct the inventorship of certain patents owned by us. Furthermore, we cannot assure you that others will not develop technologies that are similar or superior to our technology or that others will not design around the patents we own. All of our system software is copyrighted and subject to the protection of applicable copyright laws. Despite our efforts to protect our proprietary rights, unauthorized parties may attempt to copy aspects of our products or obtain and use information that we regard as proprietary, which could harm our competitive position.
Our quarterly operating results may fluctuate and may cause our stock price to decline.
Our quarterly operating results may vary in the future depending on many factors that include, but are not limited to, the following:
|
•
|
our ability to successfully install our products on a timely basis and meet other contractual obligations necessary to recognize revenue;
|
32
|
•
|
our ability to continue cost reduction efforts;
|
|
•
|
our ability to implement development and manufacturing Centers of Excellence;
|
|
•
|
the size, product mix and timing of orders for our medication and supply dispensing systems, and our medication packaging systems, and their installation and integration;
|
|
•
|
the overall demand for healthcare medication management and supply chain solutions;
|
|
•
|
changes in pricing policies by us or our competitors;
|
|
•
|
the number, timing and significance of product enhancements and new product announcements by us or our competitors;
|
|
•
|
the timing and significance of any acquisition or business development transactions that we may consider or negotiate and the revenues, costs and earnings that may be associated with these transactions;
|
|
•
|
the relative proportions of revenues we derive from products and services;
|
|
•
|
fluctuations in the percentage of sales attributable to our international business;
|
|
•
|
our customers' budget cycles;
|
|
•
|
changes in our operating expenses and our ability to stabilize expenses;
|
|
•
|
expenses incurred to remediate product quality or safety issues;
|
|
•
|
our ability to generate cash from our accounts receivable on a timely basis;
|
|
•
|
the performance of our products;
|
|
•
|
changes in our business strategy;
|
|
•
|
macroeconomic and political conditions, including fluctuations in interest rates, tax increases and availability of credit markets; and
|
|
•
|
volatility in our stock price and its effect on equity-based compensation expense.
|
Due to all of these factors, our quarterly revenues and operating results are difficult to predict and may fluctuate, which in turn may cause the market price of our stock to decline.
If we are unable to maintain our relationships with group purchasing organizations or other similar organizations, we may have difficulty selling our products and services to customers represented by these organizations.
A number of group purchasing organizations, including Intalere (f.k.a. Amerinet, Inc.), Vizient Inc, Premier Inc., HealthTrust Purchasing Group, The Resource Group, and Resource Optimization & Innovation, LLC have negotiated standard contracts for our products on behalf of their member healthcare organizations. Members of these group purchasing organizations may purchase under the terms of these contracts, which obligate us to pay the group purchasing organization a fee. We have also contracted with the United States General Services Administration, allowing the Department of Veteran Affairs, the Department of Defense and other Federal Government customers to purchase our products. These contracts enable us to more readily sell our products and services to customers represented by these organizations. Some of our contracts with these organizations are terminable at the convenience of either party. The loss of any of these relationships could impact the breadth of our customer base and could impair our ability to meet our revenue targets or increase our revenues. These organizations may not renew our contracts on similar terms, if at all, and they may choose to terminate our contracts before they expire, any of which could cause our revenues to decline.
If we are unable to maintain our relationships with major institutional pharmacies, we may experience a decline in the sales of blister cards and other consumables sold to these customers.
The institutional pharmacy market consists of significant national suppliers of medications to non-acute care facilities, smaller regional suppliers, and very small local suppliers. Although none of these customers comprised more than 10% of our total revenues for the year ended December 31, 2017, the three largest institutional pharmacies have comprised
16%
and
17%
of our Medication Adherence segment revenues during the years ended December 31, 2017 and 2016, respectively. If these larger national suppliers were to purchase consumable blister card components from alternative sources, or if alternatives to blister cards were used for medication control, our revenues would decline.
33
We depend on a limited number of suppliers for our products and our business may suffer if we were required to change suppliers to obtain an adequate supply of components, equipment and raw materials on a timely basis.
Although we generally use parts and components for our products with a high degree of modularity, certain components are presently available only from a single source or limited sources. We rely on a limited number of suppliers for the raw materials that are necessary in the production of our consumable medication packages. While we have generally been able to obtain adequate supplies of all components and raw materials in a timely manner from existing sources, or where necessary, from alternative sources of supply, we have entered into relationships with new suppliers in connection with the launch of our XT Series products. We engage multiple single source third-party manufacturers to build several of our sub-assemblies. The risk associated with changing to alternative vendors, if necessary, for any of the numerous components used to manufacture our products could limit our ability to manufacture our products and harm our business. Due to our reliance on a few single source partners to build our hardware sub-assemblies and on a limited number of suppliers for the raw materials that are necessary in the production of our consumable medication packages, a reduction or interruption in supply from our partners or suppliers, or a significant increase in the price of one or more components could have an adverse impact on our business, operating results and financial condition. In certain circumstances, the failure of any of our suppliers or us to perform adequately could result in quality control issues affecting end users' acceptance of our products. These impacts could damage customer relationships and could harm our business.
Our failure to maintain effective internal control over financial reporting in accordance with Section 404 of the Sarbanes-Oxley Act of 2002 could cause our stock price to decline.
Section 404 of the Sarbanes-Oxley Act of 2002 and the related rules and regulations of the SEC require annual management assessments of the effectiveness of our internal control over financial reporting and a report by our independent registered public accounting firm attesting to the effectiveness of internal control. If we fail to maintain effective internal control over financial reporting, as such standards are modified, supplemented or amended from time to time, we may not be able to ensure that we can conclude on an ongoing basis that we have effective internal control over financial reporting.
If the market price of our common stock continues to be highly volatile, the investment value of our common stock may decline.
Our common stock traded between $31.85 and $55.40 per share during the year ended December 31, 2017. The market price for shares of our common stock has been and may continue to be highly volatile. In addition, our announcements or external events may have a significant impact on the market price of our common stock. These announcements or external events may include:
|
•
|
changes in our operating results;
|
|
•
|
developments in our relationships with corporate customers;
|
|
•
|
developments with respect to recently acquired businesses;
|
|
•
|
changes in the ratings of our common stock by securities analysts;
|
|
•
|
announcements by us or our competitors of technological innovations or new products;
|
|
•
|
announcements by us or our competitors of acquisitions of businesses, products or technologies; or
|
|
•
|
general economic and market conditions.
|
Furthermore, the stock market as a whole from time to time has experienced extreme price and volume fluctuations, which have particularly affected the market prices for technology companies. These broad market fluctuations may cause the market price of our common stock to decline irrespective of our performance. In addition, sales of substantial amounts of our common stock in the public market could lower the market price of our common stock.
In addition, stockholders have initiated class action lawsuits against companies following periods of volatility in the market prices of these companies’ stock. For example, on March 19, 2015, a putative class action lawsuit was filed against Omnicell and two of our executive officers in the U.S. District Court for the Northern District of California purporting to assert claims on behalf of a class of purchasers of Omnicell stock between May 2, 2014 and March 2, 2015. The complaint alleged that defendants violated Sections 10(b) and 20(a) of the Securities Exchange Act of 1934 by purportedly making false and misleading statements regarding the existence of a “side letter” arrangement and the adequacy of internal controls that allegedly resulted in false and misleading financial statements. The Company and the individual defendants were not served with the complaint and on May 20, 2015, the plaintiff filed a notice of voluntary dismissal of the lawsuit without prejudice.
34
Circumstances may arise that could prevent the timely reporting of our financial information, which could harm our stock price and quotation on the NASDAQ Global Select Market.
On March 17, 2015, we announced that we were delaying the filing of our Annual Report on Form 10-K for the year ended December 31, 2014 (the "2014 Annual Report") beyond the automatic 15-day extension period permitted under the rules of the Securities and Exchange Commission because of the internal investigation that we commenced following receipt of a notice from an Omnicell employee on February 27, 2015 alleging, among other matters, the existence of a “side letter” arrangement with an Omnicell customer for certain discounts and Omnicell products that were to be provided at no cost, but which were not reflected in the final invoices paid by such customer.
Because we were unable to timely file the 2014 Annual Report, on March 18, 2015, we received an expected written notification (the “Notice”) from the NASDAQ OMX Group, Inc. (“Nasdaq”) indicating that Omnicell was not in compliance with Nasdaq Listing Rule 5250(c)(1) for continued listing, due to the delay in filing the 2014 Annual Report beyond the extended filing due date. Under the Nasdaq continued listing rules, we had 60 calendar days from the date of the letter to either file the 2014 Annual Report or submit a plan to regain compliance.
During the period between the date the 2014 Annual Report was due and the date of its filing, our stock price experienced some volatility. We have concluded the investigation causing the delay of the filing of the 2014 Annual Report. Even though the results of the investigation led the Company to determine that effective internal control over financial reporting was maintained in all material respects and that there were no changes required to be made to the Company’s Consolidated Financial Statements, we cannot assure you that similar circumstances will not arise in the future that will cause us to delay the filing of our periodic financial reports, which could harm our stock price and, if such delay were to continue for a period of time, impact our continued listing on the NASDAQ Global Select Market.
Our U.S. government lease agreements are subject to annual budget funding cycles and mandated unilateral changes, which may affect our ability to enter into such leases or to recognize revenue and sell receivables based on these leases.
U.S. government customers that lease our equipment typically sign contracts with five-year payment terms that are subject to one-year government budget funding cycles. Further, the government has in certain circumstances mandated unilateral changes in its Federal Supply Services contract that could render our lease terms with the government less attractive. In our judgment and based on our history with these accounts, we believe these receivables are collectible. However, in the future, the failure of any of our U.S. government customers to receive their annual funding, or the government mandating changes to the Federal Supply Services contract could impair our ability to sell lease equipment to these customers or to sell our U.S. government receivables to third-party leasing companies. In addition, the ability to collect payments on unsold receivables could be impaired and may result in a write-down of our unsold receivables from U.S. government customers. The balance of our unsold leases to U.S. government customers was $8.4 million as of December 31, 2017.
If we fail to manage our inventory properly, our revenue, gross margin and profitability could suffer.
Managing our inventory of components and finished products is a complex task. A number of factors, including, but not limited to, the need to maintain a significant inventory of certain components that are in short supply or that must be purchased in bulk to obtain favorable pricing, the general unpredictability of demand for specific products and customer requests for quick delivery schedules, may result in us maintaining large amounts of inventory. Other factors, including changes in market demand, customer requirements and technology, may cause our inventory to become obsolete. Any excess or obsolete inventory could result in inventory write-downs, which in turn could harm our business and results of operations.
Intellectual property claims against us could harm our competitive position, results of operations and financial condition.
We expect that developers of medication and supply dispensing systems and medication packaging systems, will be increasingly subject to infringement claims as the number of products and competitors in our industry grows and the functionality of products in different industry segments overlaps. In the future, third parties may claim that we have infringed upon their intellectual property rights with respect to current or future products. We do not carry special insurance that covers intellectual property infringement claims; however, such claims may be covered under our traditional insurance policies. These policies contain terms, conditions and exclusions that make recovery for intellectual property infringement claims difficult to guarantee. Any infringement claims, with or without merit, could be time-consuming to defend, result in costly litigation, divert management's attention and resources, cause product shipment delays or require us to enter into royalty or licensing agreements. These royalty or licensing agreements, if required, may not be available on terms acceptable to us, or at all, which could harm our competitive position, results of operations and financial condition.
Our software products are complex and may contain defects, which could harm our reputation, results of operations and financial condition.
35
We market products that contain software and products that are software only. Although we perform extensive testing prior to releasing software products, these products may contain undetected errors or bugs when first released. These may not be discovered until the product has been used by customers in different application environments. Failure to discover product deficiencies or bugs could require design modifications to previously shipped products or cause delays in the installation of our products and unfavorable publicity or negatively impact system shipments, any of which could harm our business, financial condition and results of operations.
Product liability claims against us could harm our competitive position, results of operations and financial condition.
Our products provide medication management and supply chain management solutions for the healthcare industry. Despite the presence of healthcare professionals as intermediaries between our products and patients, if our products fail to provide accurate and timely information or operate as designed, customers, patients or their family members could assert claims against us for product liability. Moreover, failure of health care facility employees to use our products for their intended purposes could result in product liability claims against us. Litigation with respect to product liability claims, regardless of any outcome, could result in substantial cost to us, divert management's attention from operations and decrease market acceptance of our products. We possess a variety of insurance policies that include coverage for general commercial liability and technology errors and omissions liability. We attempt to mitigate these risks through contractual terms negotiated with our customers. However, these policies and protective contractual terms may not be adequate against product liability claims. A successful claim brought against us, or any claim or product recall that results in negative publicity about us, could harm our competitive position, results of operations and financial condition. Also, in the event that any of our products is defective, we may be required to recall or redesign those products.
We are dependent on technologies provided by third-party vendors, the loss of which could negatively and materially affect our ability to market, sell, or distribute our products.
Some of our products incorporate technologies owned by third parties that are licensed to us for use, modification, and distribution. For example, the VBM 200F is manufactured by a third party and sold by us pursuant to a distribution and supplier agreement. If we lose access to third-party technologies, such as our ability to distribute the VBM 200F, or we lose the ongoing rights to modify and distribute these technologies with our products, we will have to devote resources to independently develop, maintain and support the technologies ourselves, pay increased license costs, or transition to another vendor. Any independent development, maintenance or support of these technologies by us or the transition to alternative technologies could be costly, time consuming and could delay our product releases and upgrade schedules. These factors could negatively and materially affect our ability to market, sell or distribute our products.
Complications in connection with our ongoing business information system upgrades, including those required to transition acquired entities onto information systems already utilized, and those implemented to adopt new accounting standards, may impact our results of operations, financial condition and cash flows.
We continue to upgrade our enterprise-level business information system with new capabilities and transition acquired entities onto information systems already utilized in the company. In 2015, we replaced legacy Enterprise Requirements Planning systems used in the acquired Surgichem business with systems currently in use in other parts of Omnicell. In 2016, we replaced the legacy Enterprise Requirements Planning systems used in Mach4 with systems currently in use in other parts of Omnicell, and we intend to do the same at Aesynt and Ateb. Based upon the complexity of some of the upgrades, there is risk that we will not see the expected benefit from the implementation of these upgrades in accordance with their anticipated timeline and will incur costs in addition to those we have already planned for. In addition, in future years, we will need to comply with new accounting standards established by the Financial Accounting Standards Board ("FASB") for revenues, leases and other components of our financial reporting. These new standards will require us to modify our accounting policies and financial reporting disclosure. We further anticipate that integration of these and possibly other new standards may require a substantial amount of management's time and attention and require integration with our enterprise resource planning system. The implementation of the system and the adoption of future new standards, in isolation as well as together, could result in operating inefficiencies and financial reporting delays, and could impact our ability to timely record certain business transactions. All of these potential results could adversely impact our results of operations, financial condition and cash flows.
Outstanding employee stock options have the potential to dilute stockholder value and cause our stock price to decline.
We grant stock options to certain of our employees as incentives to join Omnicell or as an on-going reward and retention vehicle. We had options outstanding to purchase approximately
3.3 million
shares of our common stock, at a weighted-average exercise price of
$32.72
per share as of December 31, 2017. If some or all of these shares are sold into the public market over a short time period, the price of our common stock may decline, as the market may not be able to absorb those shares at the prevailing market prices. Such sales may also make it more difficult for us to sell equity securities in the future on terms that we deem acceptable.
36
Raising additional capital may cause dilution to our existing stockholders, restrict our operations or harm our business, financial condition and results of operations.
We may seek additional capital through a variety of means, including through private and public equity offerings and debt financings. To the extent that we raise additional capital through the sale of equity or convertible debt securities, the ownership interest will be diluted, and the terms may include liquidation or other preferences that adversely affect the rights as a stockholder. Debt financing, if available, may involve agreements that include covenants limiting or restricting our ability to take certain actions, such as incurring additional debt, making capital expenditures, entering into licensing arrangements, or declaring dividends. If we raise additional funds from third parties, we may have to relinquish valuable rights to our technologies, or grant licenses on terms that are not favorable to us.
For example, we filed a “shelf” registration statement on Form S-3 under the Securities Act in November 2017 (the “S-3 Registration Statement”), allowing us, from time to time, to offer any combination of registered common stock, preferred stock, debt securities and warrants. Under this S-3 Registration Statement, we also entered into a distribution agreement (the “Distribution Agreement”) in November 2017 with J.P. Morgan Securities, LLC, Wells Fargo Securities, LLC and HSBC Securities (USA) Inc. (collectively, the “Sales Agents”) pursuant to which we may offer and sell from time to time through “at-the-market” offerings, up to an aggregate of $125.0 million of our common stock through the Sales Agents. As of December 31, 2017, we had an aggregate of
$110.3 million
available to be offered under the Distribution Agreement.
If we are unable to raise additional funds through equity or debt financing when needed, our ability to market, sell or distribute our products may be negatively impacted and could harm our business, financial condition and results of operations.
Changes in our tax rates, exposure to additional tax liabilities, or the adoption of new tax legislation, including the recently passed comprehensive tax reform bill, could adversely affect our business and financial condition.
We are subject to taxes in the United States and foreign jurisdictions. Our future effective tax rates could be affected by several factors, many of which are outside of our control, including: changes in the mix of earnings with differing statutory tax rates, changes in the valuation of deferred tax assets and liabilities, or changes in tax laws or their interpretation. We regularly assess the likelihood of adverse outcomes to determine the adequacy of our provision for taxes. We are also subject to examination of our income tax returns by the Internal Revenue Service and other tax authorities. There can be no assurance that the outcomes from these examinations will not materially adversely affect our financial condition and operating results.
For example, on December 22, 2017, the Tax Cuts and Jobs Act (the “Tax Act”) was signed into law. The Tax Act, among other things, changed many aspects of U.S. corporate income taxation, and included reduction of the corporate income tax rate from 35% to 21%, implementation of a territorial tax system, imposition of a tax on deemed repatriated earnings of foreign subsidiaries, changes in the treatment of offshore earnings, limitation of the tax deduction for interest expense, revision of net operating loss carryforward and utilization rules, further deduction limits on executive compensation, and modifying, repealing and creating many other business deductions and credits. While certain expected impacts of the Tax Act on our business are discussed in Item 7, Management’s Discussion and Analysis of Financial Condition and Results of Operations, as well as Note 15, Income Taxes, of the Notes to Consolidated Financial Statements, we continue to examine the impact this tax reform legislation may have on our business. Notwithstanding the reduction in the corporate income tax rate, the overall impact of the Tax Act is uncertain and our business and financial condition could be adversely affected. The impact of the Tax Act on holders of our common stock is also uncertain and could be adverse. This annual report does not discuss any such tax legislation or the manner in which it might affect us or our stockholders in the future. We urge our stockholders to consult with their legal and tax advisors with respect to such legislation.
Catastrophic events may disrupt our business and harm our operating results.
We rely on our network infrastructure, data centers, enterprise applications, and technology systems for the development, marketing, support and sales of our products, and for the internal operation of our business. These systems are susceptible to disruption or failure in the event of a major earthquake, fire, flood, cyber-attack, terrorist attack, telecommunications failure, or other catastrophic event. Many of these systems are housed or supported in or around our corporate headquarters located in Northern California, near major earthquake faults, and where a significant portion of our research and development activities and other critical business operations take place. Other critical systems, including our manufacturing facilities for our consumable medication packages, are housed in St. Petersburg, Florida, in communities that have been subject to significant tropical storms. Disruptions to or the failure of any of these systems, and the resulting loss of critical data, which is not quickly recoverable by the effective execution of disaster recovery plans designed to reduce such disruption, could cause delays in our product development, prevent us from fulfilling our customers' orders, and could severely affect our ability to conduct normal business operations, the result of which would adversely affect our operating results.
Recent developments relating to the United Kingdom’s referendum vote in favor of leaving the European Union and related actions could adversely affect us
.
37
The United Kingdom held a referendum on June 23, 2016 in which a majority voted for the United Kingdom’s (the "UK") withdrawal from the European Union (the "EU"). On March 29, 2017, the UK’s ambassador to the EU delivered a letter to the president of the European Council that gave formal notice under Article 50 of the Lisbon Treaty of Britain’s withdrawal from the EU, commonly referred to as “Brexit”. As a result, negotiations have commenced to determine the terms of the UK’s withdrawal from the EU as well as its relationship with the EU going forward, including the terms of trade between the UK and the EU. The effects of Brexit have been and are expected to continue to be far-reaching. Brexit and the perceptions as to its impact may adversely affect business activity and economic conditions in Europe and globally and could continue to contribute to instability in global financial markets. Brexit could also have the effect of disrupting the free movement of goods, services and people between the UK and the EU. However, the full effects of Brexit are uncertain and will depend on any agreements the UK may make to retain access to EU markets. Brexit could also lead to legal uncertainty and potentially divergent national laws and regulations as the UK determines which EU laws to replace or replicate. Lastly, as a result of the Brexit, other European countries may seek to conduct referenda with respect to their continuing membership with the EU. Given these possibilities and others we may not anticipate, as well as the lack of comparable precedent, the full extent to which our business, results of operations and financial condition could be adversely affected by Brexit is uncertain.
The conflict minerals provisions of the Dodd-Frank Wall Street Reform and Consumer Protection Act could result in additional costs and liabilities.
In accordance with the Dodd-Frank Wall Street Reform and Consumer Protection Act, the SEC established disclosure and reporting requirements for those companies that use "conflict minerals" mined from the Democratic Republic of Congo and adjoining countries, whether or not these products are manufactured by third parties. These new requirements could affect the sourcing of materials used in our products as well as the companies we use to manufacture our products. In circumstances where conflict minerals in our products are found to be sourced from the Democratic Republic of the Congo or surrounding countries, we may take actions to change materials or designs to reduce the possibility that our purchase of conflict minerals may fund armed groups in the region. These actions could add engineering and other costs to the manufacture of our products.
We expect to incur costs on an ongoing basis to comply with the requirements related to the discovery of the origin of the tantalum, tin, tungsten and gold used in our products, including components we purchase from third parties, and to audit our conflict minerals disclosures. Our reputation may also suffer if we have included conflict minerals originating in the Democratic Republic of the Congo or surrounding countries in our products.
Anti-takeover provisions in our charter documents and under Delaware law, and any stockholders' rights plan we may adopt in the future, make an acquisition of us, which may be beneficial to our stockholders, more difficult.
We are incorporated in Delaware. Certain anti-takeover provisions of Delaware law and our charter documents as currently in effect may make a change in control of our company more difficult, even if a change in control would be beneficial to the stockholders. Our anti-takeover provisions include provisions in our certificate of incorporation providing that stockholders' meetings may only be called by our Board of Directors and provisions in our bylaws providing that the stockholders may not take action by written consent and requiring that stockholders that desire to nominate any person for election to our Board of Directors or to make any proposal with respect to business to be conducted at a meeting of our stockholders be submitted in appropriate form to our Secretary within a specified period of time in advance of any such meeting. Delaware law also prohibits corporations from engaging in a business combination with any holders of 15% or more of their capital stock until the holder has held the stock for three years unless, among other possibilities, our Board of Directors approves the transaction. Our Board of Directors may use these provisions to prevent changes in the management and control of our company. Also, under applicable Delaware law, our board of directors may adopt additional anti-takeover measures in the future.
The stockholder rights plan adopted by our Board of Directors in February 2003 expired by its terms in February 2013. Our Board of Directors could adopt a similar plan in the future if it determines that such action is in the best interests of our stockholders. Such a plan may have the effect of discouraging, delaying or preventing a change in control of our company that may be beneficial to our stockholders.
There are currently no unresolved issues with respect to any SEC staff’s written comments.
38
Our headquarters are located in leased facilities in Mountain View, California. The following is a list of our leased facilities and their primary functions.
|
Site
|
Major Activity
|
Segment
|
Approximate Square Footage
|
|||
|
St. Petersburg, Florida
|
Administration, marketing, research and development and manufacturing
|
Medication Adherence
|
132,500
|
|||
|
Cranberry, Pennsylvania
|
Administration, marketing, and research and development
|
Automation and Analytics
|
116,300
|
|||
|
Warrendale, Pennsylvania
|
Manufacturing and Administration
|
Automation and Analytics
|
107,400
|
|||
|
Mountain View, California
|
Administration, marketing, and research and development
|
Automation and Analytics
|
99,900
|
|||
|
Irlam, United Kingdom
|
Administration, sales, marketing and distribution center
|
Medication Adherence
|
61,000
|
|||
|
Raleigh, North Carolina
|
Administration, marketing, and research and development
|
Medication Adherence
|
48,200
|
|||
|
Milpitas, California
|
Manufacturing
|
Automation and Analytics
|
46,300
|
|||
|
Waukegan, Illinois
|
Technical support, training and repair center
|
Automation and Analytics
|
38,500
|
|||
|
Bochum, Germany
|
Administration, sales, marketing, distribution and manufacturing center
|
Automation and Analytics
|
11,000
|
|||
We also have smaller rented offices in Strongsville, Ohio, Canada, the Federal Republic of Germany, France, Hong Kong, Italy, Melbourne, Australia, the People's Republic of China, the United Arab Emirates and the United Kingdom.
We closed our rented facilities in Nashville, Tennessee and Slovenia during 2017 and terminated the associated leases.
We believe that these facilities are sufficient for our current operational needs and that suitable additional space will be available on commercially reasonable terms to accommodate expansion of our operations, if necessary.
For additional information regarding our obligations pursuant to operating leases, see Note 10, Commitments and Contingencies, of the Notes to Consolidated Financial Statements in this annual report.
Refer to the information set forth under "Legal Proceedings" in Note 10, Commitments and Contingencies, of the Notes to Consolidated Financial Statements included in this annual report.
Not applicable.
39
Market for Our Common Stock
Our common stock is traded on The NASDAQ Global Select Market under the symbol "OMCL". The following table sets forth the high and low sales prices per share of our common stock for the periods indicated.
|
Year Ended December 31, 2017
|
High
|
Low
|
|||||
|
Fourth Quarter
|
$
|
55.40
|
|
$
|
44.34
|
|
|
|
Third Quarter
|
$
|
52.70
|
|
$
|
42.20
|
|
|
|
Second Quarter
|
$
|
44.60
|
|
$
|
38.00
|
|
|
|
First Quarter
|
$
|
41.15
|
|
$
|
31.85
|
|
|
|
Year Ended December 31, 2016
|
High
|
Low
|
|||||
|
Fourth Quarter
|
$
|
38.52
|
|
$
|
30.35
|
|
|
|
Third Quarter
|
$
|
40.50
|
|
$
|
33.99
|
|
|
|
Second Quarter
|
$
|
34.71
|
|
$
|
26.46
|
|
|
|
First Quarter
|
$
|
30.78
|
|
$
|
25.06
|
|
|
Stockholders
There were 100 registered stockholders of record as of
December 31, 2017
. A substantially greater number of stockholders are beneficial holders, whose shares of record are held by banks, brokers and other financial institutions.
Dividend Policy
We have never declared or paid any cash dividends on our common stock. We currently expect to retain any future earnings for use in the operation and expansion of our business and do not anticipate paying any cash dividends on our common stock in the foreseeable future.
Performance Graph
The following graph compares total stockholder returns for Omnicell's common stock for the past five years to three indexes: the NASDAQ Composite Index, the NASDAQ Health Care Index, and the NASDAQ Health Services Index. The graph assumes $100 was invested in each of the Company’s common stock, the NASDAQ Composite Index, the NASDAQ Health Care Index, and the NASDAQ Health Services Index as of the market close on December 31,
2012
. The total return for Omnicell's common stock and for each index assumes the reinvestment of all dividends, although cash dividends have never been declared on Omnicell's common stock, and is based on the returns of the component companies weighted according to their capitalization as of the end of each annual period.
The NASDAQ Composite Index tracks the aggregate price performance of equity securities traded on The NASDAQ Stock Market. The NASDAQ Health Care Index and NASDAQ Health Services Index tracks the aggregate price performance of health care and health services equity securities. Omnicell's common stock is traded on The NASDAQ Global Select Market and is a component of both indexes. The stock price performance shown on the graph is based on historical results and is not necessarily indicative of future price performance.
40
COMPARISON OF 5 YEAR CUMULATIVE TOTAL RETURN
(1)(2)
Among Omnicell, Inc., the NASDAQ Composite Index, the NASDAQ Health Care Index and
the NASDAQ Health Services Index
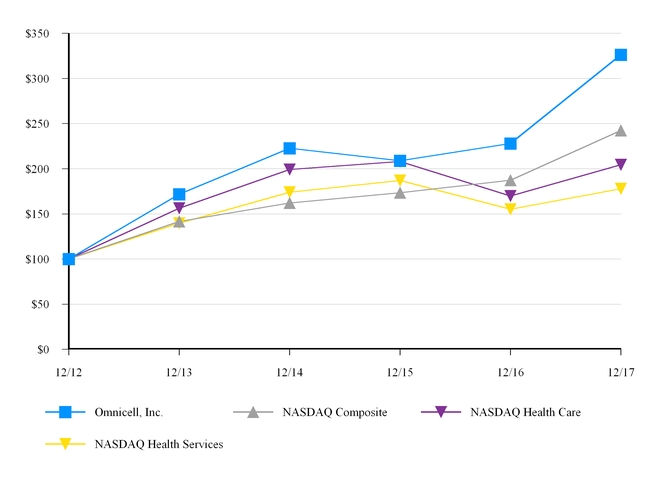
_________________________________________________
|
(1)
|
$100 invested on December 31,
2012
in stock or index, including reinvestment of dividends.
|
|
(2)
|
This section is not deemed "soliciting material" or to be "filed" with the SEC and is not to be incorporated by reference into any filing of Omnicell, Inc. under the Securities Act of 1933, as amended, or the Securities Exchange Act of 1934, as amended, whether made before or after the date hereof and irrespective of any general incorporation language in any such filing.
|
|
Year Ended December 31,
|
|||||||||||||||||
|
2012
|
2013
|
2014
|
2015
|
2016
|
2017
|
||||||||||||
|
Omnicell, Inc.
|
100.00
|
|
171.69
|
|
222.73
|
|
209.01
|
|
227.98
|
|
326.16
|
|
|||||
|
NASDAQ Composite
|
100.00
|
|
141.63
|
|
162.09
|
|
173.33
|
|
187.19
|
|
242.29
|
|
|||||
|
NASDAQ Health Care
|
100.00
|
|
156.31
|
|
199.21
|
|
207.94
|
|
169.96
|
|
204.45
|
|
|||||
|
NASDAQ Health Services
|
100.00
|
|
139.64
|
|
173.97
|
|
187.09
|
|
155.05
|
|
177.93
|
|
|||||
Stock Repurchase Programs
There were no stock repurchases during 2017. Refer to Note 12, Stock Repurchases, of the Notes to Consolidated Financial Statements in this annual report for additional information.
41
The following selected consolidated financial data is derived from our Consolidated Financial Statements. This data should be read in conjunction with our Consolidated Financial Statements and related Notes included in this annual report and with Item 7, Management’s Discussion and Analysis of Financial Condition and Results of Operations. Historical results may not be indicative of future results.
|
Year Ended December 31,
|
|||||||||||||||||||
|
2017
(1)
|
2016
(2)
|
2015
(3)
|
2014
(4)
|
2013
|
|||||||||||||||
|
(In thousands, except per share amounts)
|
|||||||||||||||||||
|
Consolidated Statements of Operations Data:
|
|||||||||||||||||||
|
Total revenue
|
$
|
716,165
|
|
$
|
692,623
|
|
$
|
484,559
|
|
$
|
440,900
|
|
$
|
380,585
|
|
||||
|
Gross profit
|
322,088
|
|
313,800
|
|
247,930
|
|
233,860
|
|
203,399
|
|
|||||||||
|
Income from operations
|
5,754
|
|
6,481
|
|
48,632
|
|
49,583
|
|
35,299
|
|
|||||||||
|
Net income
|
20,605
|
|
603
|
|
30,760
|
|
30,518
|
|
23,979
|
|
|||||||||
|
Net income per share:
|
|||||||||||||||||||
|
Basic
|
$
|
0.55
|
|
$
|
0.02
|
|
$
|
0.86
|
|
$
|
0.86
|
|
$
|
0.69
|
|
||||
|
Diluted
|
$
|
0.53
|
|
$
|
0.02
|
|
$
|
0.84
|
|
$
|
0.83
|
|
$
|
0.67
|
|
||||
|
Shares used in per shares calculations:
|
|
||||||||||||||||||
|
Basic
|
37,483
|
|
36,156
|
|
35,857
|
|
35,650
|
|
34,736
|
|
|||||||||
|
Diluted
|
38,712
|
|
36,864
|
|
36,718
|
|
36,622
|
|
35,777
|
|
|||||||||
|
December 31,
|
|||||||||||||||||||
|
2017
(1)
|
2016
(2)
|
2015
(3)
|
2014
(4)
|
2013
|
|||||||||||||||
|
(In thousands)
|
|||||||||||||||||||
|
Consolidated Balance Sheet Data:
|
|||||||||||||||||||
|
Total assets
|
$
|
980,304
|
|
$
|
935,103
|
|
$
|
578,747
|
|
$
|
560,214
|
|
$
|
492,501
|
|
||||
|
Long-term debt, net
|
194,917
|
|
245,731
|
|
—
|
|
—
|
|
—
|
|
|||||||||
|
Total liabilities
|
463,105
|
|
503,496
|
|
176,359
|
|
170,116
|
|
143,504
|
|
|||||||||
|
Total stockholders' equity
|
$
|
517,199
|
|
$
|
431,607
|
|
$
|
402,388
|
|
$
|
390,098
|
|
$
|
348,997
|
|
||||
(1)
Includes InPharmics financial results as of April 2017, the acquisition date.
(2)
Includes Aesynt and Ateb financial results as of the acquisition dates of January 2016 and December 2016, respectively.
(3)
Includes Avantec and Mach4 financial results as of April 2015, the acquisition date.
(4)
Includes Surgichem financial results as of August 2014, the acquisition date.
The following discussion and analysis should be read in conjunction with our Consolidated Financial Statements and related notes in this annual report. This discussion may contain forward-looking statements based upon current expectations that involve risks and uncertainties. Our actual results and the timing of selected events could differ materially from those anticipated in these forward-looking statements as a result of several factors, including those set forth under Item 1A "Risk Factors" and elsewhere in this annual report. Unless otherwise stated, references in this report to particular years or quarters refer to our fiscal year and the associated quarters of those fiscal years.
42
OVERVIEW
Our Business
We are a leading provider of comprehensive automation and business analytics software solutions for patient-centric medication and supply management across the entire healthcare continuum, from the acute care hospital setting to post-acute skilled nursing and long-term care facilities to the home.
We manage our business as two operating segments, Automation and Analytics and Medication Adherence.
|
•
|
Automation and Analytics.
The Automation and Analytics segment is organized around the design, manufacturing, selling and servicing of medication and supply dispensing systems, pharmacy inventory management systems, and related software. Our Automation and Analytics products are designed to enable our customers to enhance and improve the effectiveness of the medication-use process, the efficiency of the medical-surgical supply chain, overall patient care and clinical and financial outcomes of medical facilities. Through modular configuration and upgrades, our systems can be tailored to specific customer needs.
|
|
•
|
Medication Adherence.
The Medication Adherence segment primarily includes the development, manufacturing and selling of solutions to assist patients to remain adherent to their medication regimens. These solutions are comprised of a variety of tools and aids that may be directly used by a pharmacist or a healthcare provider in their direct care for a patient, or the patient themselves, and include software based systems and medication adherence packaging, packaging equipment, and ancillary products and services. These products are used to manage medication administration outside of the hospital setting and include medication adherence products sold under the brand names MTS, SureMed, Ateb, and Omnicell.
|
For further description of our operating segments, please refer to Note 14, Segment and Geographical Information, of the Notes to Consolidated Financial Statements in this annual report.
We sell our product and consumable solutions together with related service offerings. Revenue generated in the United States represented
86%
of our total revenues in 2017. We have not sold in the past, and have no future plans to sell our products either directly or indirectly, to customers located in countries that are identified as state sponsors of terrorism by the U.S. Department of State, and are subject to economic sanctions and export controls.
Strategy
The healthcare market is experiencing a period of substantive change. The adoption of electronic healthcare records, new regulatory constraints, and changes in the reimbursement structure have caused healthcare institutions to re-examine their operating structures, re-prioritize their investments, and seek efficiencies. We believe our customers’ evolving operating environment creates challenges for any supplier, but also affords opportunities for suppliers that are able to partner with customers to help them meet the changing demands. We have and intend to continue to invest in the strategies which we believe have generated and will continue to generate our revenue and earnings growth, while supporting our customers’ initiatives and needs. These strategies include:
|
•
|
Development of a differentiated platform.
We invest in the development of products that we believe bring patient safety and workflow efficiency to our customers’ operations that they cannot get from other competing solutions. These differentiators may be as small as how a transaction operates or information provided on a report or as large as the entire automation of a workflow that would otherwise be completed manually. We intend to continue our focus on differentiating our products, and we carefully assess our investments regularly as we strive to ensure those investments provide the solutions most valuable to our customers.
|
|
•
|
Deliver our solutions to new markets
.
Areas of healthcare where work is done manually may benefit from our existing solutions. These areas include hospitals that continue to employ manual operations, healthcare segments of the U.S. market outside hospitals and markets outside the United States. We weigh the cost of entering these new markets against the expected benefits and focus on the markets that we believe are most likely to adopt our products.
|
|
•
|
Expansion of our solutions through acquisitions and partnerships.
Our acquisitions have generally been focused on automation of manual workflows or data analytics, which is the enhancement of data for our customers’ decision-making processes. We believe that expansion of our product lines through acquisition and partnerships to meet our customers changing and evolving expectations is a key component to our historical and future success.
|
43
Our investments have been consistent with the strategies outlined above. To differentiate our solutions from others available in the market, in December 2016 we announced the XT Series, our new generation of medication and supply automation that is fully integrated on our Unity enterprise platform. The XT Series includes automated medication and supply dispensing cabinets, the Anesthesia Workstation, and Controlled Substance Manager. The XT Automated Medication Cabinets have been integrated with Connect-Rx® from Aesynt, so customers in the United States and Canada who use AcuDose-Rx® cabinets can take advantage of the new hardware without changing their software or server infrastructure. As part of this product introduction we developed a new hardware and electronics architecture for the XT Series. The new design enables more medications to be stocked within the same footprint-the XT cabinets offer up to 50% more capacity compared with similar units on the market. In November 2017, we introduced our new IVX Workflow Solution. This new solution powered by IVX Cloud services helps enable pharmacies to safely and efficiently compound and prepare IV treatments. In December 2017, we announced our XR2 Central Pharmacy Automated System, allowing customers to more fully automate their central pharmacies.
Consistent with our strategy to enter new markets, we have made investments in our selling, general and administrative expenses to expand our sales team and market to new customers. Our international efforts have focused primarily on two markets: Western Europe where we sell solutions through a direct sales team in the United Kingdom, France, and Germany and through resellers in other markets; and in the Middle Eastern countries of the Arabian Peninsula. We have also expanded our sales efforts to medication adherence customers in the United States which has allowed us to sell our automated dispensing solutions and other products to this market.
Expansion of our solutions through acquisitions and partnerships include our acquisition of MTS in 2012, our acquisition of Surgichem in August 2014, our acquisitions of Mach4 and Avantec in April 2015, our acquisition of Aesynt in January 2016, our acquisition of Ateb in December 2016, and most recently, our acquisition of InPharmics in April 2017. Surgichem was a provider of medication adherence products in the United Kingdom. Mach4 is a provider of automated medication management systems to retail and hospital pharmacy customers primarily in Europe, with additional installations in China, Africa, the Middle East and Latin America. Avantec develops medication and supply automation products that complement our solutions for configurations suited to the United Kingdom marketplace. Aesynt is a provider of automated medication management systems, including dispensing robots with storage solutions, medication storage and dispensing carts and cabinets, I.V. sterile preparation robotics and software, including software related to medication management. Ateb is a provider of pharmacy-based patient care solutions and medication synchronization to independent and chain retail pharmacies. InPharmics is a provider of advanced pharmacy informatics solutions to hospital pharmacies. We have also developed relationships with major providers of hospital information management systems with the goal of enhancing the interoperability of our products with their systems. We believe that enhanced interoperability will help reduce implementation costs, time, and maintenance for shared clients, while providing new clinical workflows designed to enhance efficiency and patient safety.
We believe that the success of our three-leg strategy of differentiated products, expansion into new markets and acquisition and partnership in future periods will be based on, among other factors:
|
•
|
Our expectation that the overall market demand for healthcare services will increase as the population grows, life expectancies continue to increase and the quality and availability of healthcare services increases;
|
|
•
|
Our expectation that the environment of increased patient safety awareness, increased regulatory control, increased demand for innovative products that improve the care experience and increased need for workflow efficiency through the adoption of technology in the healthcare industry will make our solutions a priority in the capital budgets of healthcare facilities; and
|
|
•
|
Our belief that healthcare customers will continue to value a consultative customer experience from their suppliers.
|
Among other financial measures, we utilize product bookings to assess the current success of our strategies. Product bookings consist of all firm orders, as evidenced generally by a non-cancellable contract and purchase order for equipment and software, and by a purchase order for consumables. Equipment and software bookings are generally installable within twelve months and, other than subscription based sales, generally recorded as revenue upon customer acceptance of the installation. Consumables are recorded as revenue upon shipment to a customer or receipt by the customer, depending upon contract terms. Consumable bookings are generally recorded as revenue within one month. Product bookings increased by 5%, from $541 million in
2016
to $568 million in
2017
, driven by the success of our growth strategies in differentiated products, new markets and, by the contributions from our acquisitions of Aesynt, Ateb, and InPharmics.
In addition to product solution sales, we provide services to our customers. We provide installation planning and consulting as part of every product sale which is included in the initial price of the solution. To help assure the maximum
44
availability of our systems, our customers typically purchase maintenance and support contracts in increments of one to five years. As a result of the growth of our installed base of customers, our service revenues have also grown.
The growth in the Medication Adherence revenue was primarily driven by further market penetration and adoption of our automated and semi-automated packaging equipment within the United States and Europe, Middle East and Africa ("EMEA"), as well as modest price increases across the product lines.
In the future, we expect our strategies to evolve as the business environment of our customers evolves, but for our focus is to remain on improving healthcare with solutions that help change the practices in ways that improve patient and provider outcomes. We expect our investment in differentiated products, new markets, and acquisitions and partnerships to continue.
In fiscal year 2017, we created Centers of Excellence (“COE”) for product development, engineering and manufacturing with the Point of Use COE located at our facilities in California, the Robotics and Central Pharmacy COE located at our facilities near Pittsburgh, Pennsylvania and the Medication Adherence Consumables COE located at our facilities in St. Petersburg, Florida. As part of this initiative, we reduced our workforce in the first half of 2017 by approximately 100 full-time employees, or about 4% of the total headcount, and closed our Nashville, Tennessee and Slovenia facilities.
Our full-time headcount of approximately
2,350
on
December 31, 2017
, a decrease of approximately
100
from
December 31, 2016
, reflects our efforts to drive profitability and optimize resources allocation.
2017 Acquisitions
On April 12, 2017, we completed the acquisition of InPharmics, a technology and services company that provides advanced pharmacy informatics solutions to hospital pharmacies. The purchase price consideration was
$5.0 million
, net of cash acquired of $0.3 million. The results of InPharmics' operations have been included in our consolidated results of operations beginning April 13, 2017, and presented as part of the Automation and Analytics segment.
2016 Acquisitions
On January 5, 2016, we completed the acquisition of all of the membership interests of Aesynt. Aesynt is a provider of automated medication management systems, including dispensing robots with storage solutions, medication storage and dispensing carts and cabinets, I.V. sterile preparation robotics and software, including software related to medication management. The purchase price consideration was
$271.5 million
net of cash acquired of
$8.2 million
. The results of Aesynt's operations have been included in our consolidated results of operations since January 6, 2016, and presented as part of the Automation and Analytics segment.
On December 8, 2016, we completed our acquisition of Ateb, Inc., and Ateb Canada Ltd. (together, “Ateb”). Ateb is a provider of pharmacy-based patient care and medication synchronization solutions to independent and chain pharmacies. The purchase price consideration was
$40.7 million
, net of cash acquired of
$0.9 million
. The results of Ateb's operations have been included in our consolidated results of operations beginning December 9, 2016, and presented as part of the Medication Adherence segment.
CRITICAL ACCOUNTING POLICIES AND ESTIMATES
Our discussion and analysis of our financial condition and results of operations are based on our Consolidated Financial Statements, which have been prepared in accordance with United States Generally Accepted Accounting Principles ("U.S. GAAP"). The preparation of these financial statements requires us to make certain estimates and assumptions that affect the reported amounts of assets and liabilities, disclosure of any contingent assets and liabilities at the date of the financial statements and the reported amounts of revenues and expenses during the reporting periods. We regularly review our estimates and assumptions, which are based on historical experience and various other factors that are believed to be reasonable under the circumstances, the results of which form the basis for making judgments about the carrying values of certain assets and liabilities that are not readily apparent from other sources. Actual results may differ from these estimates and assumptions. We believe the following critical accounting policies are affected by significant judgments and estimates used in the preparation of our Consolidated Financial Statements:
Revenue recognition
We earn revenues from sales of our medication and medical and surgical supply automation systems along with consumables and related services, which are sold in the healthcare industry, our principal market. Revenues are reported net of discounts and rebates provided to our customers. Our customer arrangements typically include one or more of the following deliverables:
Products.
Software-enabled equipment that manages and regulates the storage and dispensing of pharmaceuticals, consumable blister cards and packaging equipment and other medical supplies.
Software.
Additional software applications that enable incremental functionality of our equipment.
Installation.
Installation of equipment as integrated systems at customers' sites.
45
Post-installation technical support.
Phone support, on-site service, parts and access to unspecified software upgrades and enhancements, if and when available.
Professional services.
Other customer services, such as training and consulting.
We recognize revenue when the earnings process is complete, based upon its evaluation of whether the following four criteria have been met:
Persuasive evidence of an arrangement exists.
We use signed customer contracts and signed customer purchase orders as evidence of an arrangement for leases and sales. For service engagements, we use a signed services agreement and a statement of work to evidence an arrangement.
Delivery has occurred.
Equipment and embedded software product delivery is deemed to occur upon successful installation and receipt of a signed and dated customer confirmation of installation letter, providing evidence that we have delivered what a customer ordered. In instances of a customer self-installation, product delivery is deemed to have occurred upon receipt of a signed and dated customer confirmation letter. If a sale does not require installation, we recognize revenue on delivery of products to the customer, including transfer of title and risk of loss, assuming all other revenue criteria are met. For existing distributors, where installation of equipment training has been previously provided and the distributor is certified to install our equipment at the end-user customer facility, we recognize revenue from sales of products to the distributor upon shipment assuming all other revenue criteria are met, net of allowance for rights of return or refund. For new distributors, where we have not provided installation of equipment training, revenue on the sales of products to the distributor is deferred until the distributor has completed the Distributor Training Program and has been certified to install our equipment at the end-user facility. For the sale of consumable blister cards, we recognize revenue when title and risk of loss of the products shipped have transferred to the customer, which usually occurs upon shipment from our facilities. Assuming all other revenue criteria are met, we recognize revenue for support services ratably over the related support services contract period. We recognize revenue on training and professional services as they are performed.
Fee is fixed or determinable.
We assess whether a fee is fixed or determinable at the outset of the arrangement based on the payment terms associated with the transaction. We have established a history of collecting under the original contract without providing concessions on payments, products or services.
Collection is probable.
We assess the probability of collecting from each customer at the outset of the arrangement based on a number of factors, including the customer's payment history and its current creditworthiness. If, in our judgment, collection of a fee is not probable, we defer revenue recognition until the uncertainty is removed, which generally means revenue is recognized upon our receipt of cash payment assuming all other revenue criteria are met. Our historical experience has been that collection from our customers is generally probable.
In arrangements with multiple deliverables, assuming all other revenue criteria are met, we recognize revenue for individual delivered items if they have value to the customer on a standalone basis. We allocate arrangement consideration at the inception of the arrangement to all deliverables using the relative selling price method. This method requires us to determine the selling price at which each deliverable could be sold if it were sold regularly on a standalone basis. When available, we use vendor-specific objective evidence ("VSOE") of the selling price. VSOE represents the price charged for a deliverable when it is sold separately, or for a deliverable not yet being sold separately, the price established by management with the relevant authority. We consider VSOE to exist when approximately
80%
or more of its standalone sales of an item are priced within a reasonably narrow pricing range (plus or minus
15%
of the median rates). We have established VSOE of the selling price for our post-installation technical support services and professional services. When VSOE of selling price is not available, third-party evidence ("TPE") of selling price for similar products and services is acceptable; however, our offerings and market strategy differ from those of our competitors, such that we cannot obtain sufficient comparable information about third parties' prices. If neither VSOE nor TPE are available, we use our best estimates of selling prices ("BESP"). We determine BESP considering factors such as market conditions, sales channels, internal costs and product margin objectives and pricing practices. We regularly review and update our VSOE and BESP information.
The relative selling price method allocates total arrangement consideration proportionally to each deliverable on the basis of its estimated selling price. In addition, the amount recognized for any delivered items cannot exceed that which is not contingent upon delivery of any remaining items in the arrangement.
We also use the residual method to allocate revenue between the software products that enable incremental equipment functionality, and thus are not deemed to deliver its essential functionality, and the related post-installation technical support, as these products and services continue to be accounted for under software revenue recognition rules. Under the residual method, the amount allocated to the undelivered elements equals VSOE of fair value of these elements. Any remaining amounts are attributed to the delivered items and are recognized when those items are delivered.
46
A portion of our sales are made through multi-year lease agreements. Under sales-type leases, we recognize revenue for our hardware and software products net of lease execution costs such as post-installation product maintenance and technical support, at the net present value of the lease payment stream once our installation obligations have been met. We have no obligation to the leasing company once the lease has been sold. Some of our sales-type leases, mostly those relating to U.S. government hospitals which comprise approximately
33%
of the lease receivable balance, are retained in-house. Interest income in these leases is recognized in product revenue using the effective interest method.
Allowance for doubtful accounts and notes receivables from investment in sales-types leases
We maintain an allowance for doubtful accounts for estimated losses resulting from the inability of our customers to make required payments. We record a specific allowance based on an analysis of individual past-due balances. Additionally, based on historical write-offs and our collection experience, we record an additional allowance based on a percentage of outstanding receivables. We perform credit evaluations of our customers' financial condition. These evaluations require significant judgment and are based on a variety of factors including, but not limited to, current economic trends, payment history and a financial review of the customer. Actual collection losses may differ from management's estimates, and such differences could be material to our financial position and results of operations.
There were no customers that accounted for more than 10% of our accounts receivable balance as of December 31, 2017 and 2016.
The retained in-house leases discussed above are considered financing receivables. Our credit policies and our evaluation of credit risk and write-off policies are applied alike to trade receivables and the net investment in sales-type leases. For both, an account is generally past due after thirty days. The financing receivables also have customer-specific reserves for accounts identified for specific impairment and a non-specific reserve applied to the remaining population, based on factors such as current trends, the length of time the receivables are past due and historical collection experience. The retained in-house leases are not stratified by portfolio or class.
Inventory
Inventories are stated at the lower of cost, computed using the first-in, first-out method, and net realizable value. Inbound shipping costs are included in cost of inventory. We regularly monitor inventory quantities on hand and record write-downs for excess and obsolete inventories based on our estimate of demand for our products, potential obsolescence of technology, product life cycles, and whether pricing trends or forecasts indicate that the carrying value of inventory exceeds its estimated selling price. These factors are impacted by market and economic conditions, technology changes, and new product introductions and require estimates that may include elements that are uncertain. Actual demand may differ from forecasted demand and may have a material effect on gross margins. If inventory is written down, a new cost basis is established that cannot be increased in future periods. Shipments from suppliers or contract manufacturers before we receive them are recorded as in-transit inventory when title and the significant risks and rewards of ownership have passed to us.
Software development costs
We capitalize software development costs in accordance with ASC 985-20,
Costs of Software to Be Sold, Leased, or Marketed
, under which certain software development costs incurred subsequent to the establishment of technological feasibility may be capitalized and amortized over the estimated lives of the related products. We establish feasibility when we complete a working model and amortize development costs over the estimated lives of the related products ranging from three to five years. All development costs prior to the completion of a working model are recognized as research and development expense.
Business combinations
We use the acquisition method of accounting under the authoritative guidance on business combinations. Each acquired company’s operating results are included in our Consolidated Financial Statements starting on the date of acquisition. The purchase price is equivalent to the fair value of consideration transferred. Tangible and identifiable intangible assets acquired and liabilities assumed as of the date of acquisition are recorded at the acquisition date fair value. Goodwill is recognized for the excess of purchase price over the net fair value of assets acquired and liabilities assumed.
Amounts allocated to assets and liabilities are based upon fair values. Such valuations require management to make significant estimates and assumptions, especially with respect to the identifiable intangible assets. Management makes estimates of fair value based upon assumptions believed to be reasonable and that of a market participant. These estimates are based on historical experience and information obtained from the management of the acquired companies and the estimates are inherently uncertain. The separately identifiable intangible assets generally include customer relationships, technology, and trade names.
47
Goodwill and acquired intangible assets
Goodwill.
We review goodwill for impairment on an annual basis on the first day of the fourth quarter of each year at the reporting unit level. Our reporting units are the same as our operating segments, which are Automation and Analytics and Medication Adherence. A qualitative assessment is initially made to determine whether it is necessary to perform quantitative testing. A qualitative assessment includes, among others, consideration of: (i) past, current and projected future earnings and equity; (ii) recent trends and market conditions; and (iii) valuation metrics involving similar companies that are publicly-traded and acquisitions of similar companies, if available. If this qualitative assessment indicates that it is more likely than not that impairment exists, or if we decide to bypass this option, we proceed to the quantitative assessment. The quantitative assessment involves a comparison between the estimated fair values of our reporting units with their respective carrying amounts including goodwill. If the carrying value exceeds estimated fair value, we will record an impairment charge based on that difference. The impairment charge will be limited to the amount of goodwill allocated to that reporting unit.
To determine each reporting unit's fair value under the quantitative approach, we use a combination of income and market approaches, equally weighting the two approaches, such as estimated discounted future cash flows of that reporting unit, multiples of earnings or revenues, and analysis of recent sales or offerings of comparable entities. We also consider our market capitalization on the date of the analysis to ensure the reasonableness of the sum of its reporting units’ fair value.
We performed a quantitative impairment analysis as of October 1, 2017 for our Medication Adherence reporting unit. We determined that the fair value of this reporting unit exceeded the carrying value by more than 40%, and thus no impairment was indicated. Additionally, we performed a qualitative impairment assessment analysis as of October 1, 2017 for our Automation and Analytics reporting unit taking into consideration past, current and projected future earnings, recent trends and market conditions; and valuation metrics involving similar companies that are publicly-traded. Based on the result of this analysis, the fair value of this reporting unit exceeded the carrying value, and thus no impairment was indicated.
Intangible assets.
In connection with our acquisitions, we generally recognize assets for customer relationships, backlog, developed technology, and trade names. Intangible assets are carried at cost less accumulated amortization. Such amortization is provided on a straight-line basis or on an accelerated basis based on a pattern of economic benefit that is expected to be obtained over the estimated useful lives of the respective assets, generally from
one
to
30
years. Amortization for developed technology and backlog is recognized in cost of revenues, and amortization for customer relationships, non-compete agreements, and trade names is recognized in selling, general and administrative expenses.
We assess the impairment of identifiable intangible assets whenever events or changes in circumstances indicate that an asset's carrying amount may not be recoverable. Recoverability of an asset is measured by the comparison of the carrying amount to the sum of the undiscounted estimated future cash flows the asset is expected to generate, offset by estimated future costs to dispose of the product to which the asset relates. If an asset is considered to be impaired, the amount of such impairment would be measured as the difference between the carrying amount of the asset and its fair value. Our cash flow assumptions are based on historical and forecasted future revenue, operating costs, and other relevant factors. Assumptions and estimates about the remaining useful lives of our intangible assets are subjective and are affected by changes to our business strategies. If management’s estimates of future operating results change, or if there are changes to other assumptions, the estimate of the fair value of our assets could change significantly. Such change could result in impairment charges in future periods, which could have a significant impact on our operating results and financial condition.
Share-based compensation
We account for share-based compensation in accordance with ASC 718,
Stock Compensation
("ASC 718"). We recognize compensation expense related to stock-based compensation based on the grant date estimated fair value.
The fair value of stock options ("options") on the grant date is estimated using the Black-Scholes option pricing model, which requires the following inputs: expected life, expected volatility, risk-free interest rate, expected dividend yield rate, exercise price, and closing price of its common stock on the date of grant. The expected volatility is based on a combination of historical and market-based implied volatility, and the expected life of the awards is based on our historical experience of employee stock option exercises, including forfeitures. Expense is recognized on a straight-line basis over the requisite service period.
The fair value of Restricted Stock Units ("RSUs") is based on the stock price on the grant date. The fair value of Restricted Stock Awards (“RSAs”) is their intrinsic value, which is the difference between the fair value of the underlying stock at the measurement date and the purchase price. The RSUs and RSAs are subject to a service vesting condition and are recognized on a straight-line basis over the requisite service period.
48
The fair value of PSUs with service and market conditions is estimated using a Monte Carlo simulation model applying multiple awards approach. Expense is recognized when it is probable that the performance condition will be met using the accelerated attribution method over the requisite service period.
The valuation assumptions used in estimating the fair value of employee share-based awards may change in future periods
Accounting for income taxes
On December 22, 2017, the Tax Cuts and Jobs Act (the Act) was signed into law. The Act changed many aspects of U.S. corporate income taxation and included reduction of the corporate income tax rate from 35% to 21%, implementation of a territorial tax system and imposition of a tax on deemed repatriated earnings of foreign subsidiaries. At December 31, 2017, we had not completed our accounting for the tax effects of enactment of the Act; however, we made a reasonable estimate of the effects on our existing deferred tax balances and the one-time transition tax. We will continue to assess our provision for income taxes as future guidance is issued, but do not currently anticipate significant revisions will be necessary. Any such revisions will be treated in accordance with the measurement period guidance outlined in Staff Accounting Bulletin No. 118.
We record an income tax provision for (benefit from) the anticipated tax consequences of the reported results of operations. In accordance with ASC 740, Income Taxes ("ASC 740"), the provision for (benefit from) income taxes is computed using the asset and liability method, which requires the recognition of deferred tax assets and liabilities for the expected future tax consequences of events that have been included in the financial statements. Under this method, deferred tax assets and liabilities are determined on the basis of the differences between the financial statement and tax bases of assets and liabilities, and for operating losses and tax credit carry forwards. Deferred tax assets and liabilities are measured using the enacted tax rates in effect for the periods in which those tax assets and liabilities are expected to be realized or settled. In the event that these tax rates change, we will incur a benefit or detriment on our income tax expense in the period of change. If we were to determine that all or part of the net deferred tax assets are not realizable in the future, we will record a valuation allowance that would be charged to earnings in the period such determination is made.
In accordance with ASC 740, we recognize the tax benefit from an uncertain tax position if it is more likely than not that the tax position will be sustained on examination by the taxing authorities, based on the technical merits of the position. The tax benefits recognized in the financial statements from such positions are then measured based on the largest benefit that has a greater than 50% likelihood of being realized upon ultimate settlement. The calculation of tax liabilities involves significant judgment in estimating the impact of uncertainties in the application of ASC 740 and complex tax laws. Resolution of these uncertainties in a manner inconsistent with management’s expectations could have a material impact on our financial condition and operating results.
Recently issued authoritative guidance
Refer to Note 1, Organization and Summary of Significant Accounting Policies, of the Notes to Consolidated Financial Statements in this annual report for a description of recently issued accounting pronouncements, including the expected dates of adoption and estimated effects on our results of operations, financial position and cash flows.
RESULTS OF OPERATIONS
Total Revenues
|
Change in
|
Change in
|
||||||||||||||||||||||
|
2017
|
$
|
%
|
2016
|
$
|
%
|
2015
|
|||||||||||||||||
|
(Dollars in thousands)
|
|||||||||||||||||||||||
|
Product revenues
|
$
|
506,209
|
|
$
|
(11,735
|
)
|
(2)%
|
$
|
517,944
|
|
$
|
129,547
|
|
33%
|
$
|
388,397
|
|
||||||
|
Percentage of total revenues
|
71%
|
75%
|
80%
|
||||||||||||||||||||
|
Service and other revenues
|
209,956
|
|
35,277
|
|
20%
|
174,679
|
|
78,517
|
|
82%
|
96,162
|
|
|||||||||||
|
Percentage of total revenues
|
29%
|
25%
|
20%
|
||||||||||||||||||||
|
Total revenues
|
$
|
716,165
|
|
$
|
23,542
|
|
3%
|
$
|
692,623
|
|
$
|
208,064
|
|
43%
|
$
|
484,559
|
|
||||||
2017 compared to 2016:
49
Revenues were
$716.2 million
for the year ended
December 31, 2017
compared to
$692.6 million
for the year ended
December 31, 2016
, representing an increase of approximately
3%
. The year-over-year revenue increase was primarily attributed to an increase in service and other revenues of
$35.3 million
, offset by a decrease in product revenues of
$11.7 million
.
Product revenues represented
71%
and
75%
of total revenues for the years ended
December 31, 2017
and
2016
, respectively. Product revenues decreased by
$11.7 million
due to decreased sales in our Automation and Analytics segment of
$20.3 million
, offset by increased sales of
$8.6 million
in our Medication Adherence segment. The decrease in the Automation and Analytics segment was attributed to a slower conversion of bookings and backlog into revenue due to the introduction of the new XT series of products in the fourth quarter of 2016. While we have experienced larger deal sizes, the administrative process of converting our existing bookings of G4 products into XT series products decreased revenue recognition for the year ended December 31, 2017 compared to the year ended December 31, 2016. The increase in the Medication Adherence segment was partially attributed to Ateb, acquired in the fourth quarter of 2016, which contributed $4.2 million to the increase in the product revenue during the year ended December 31, 2017. The remainder of the increase is primarily attributed to the introduction of the VBM product series in the fourth quarter of 2016.
Service and other revenues represented
29%
and
25%
of total revenues for the years ended
December 31, 2017
and
2016
, respectively. Service and other revenues include revenues from service and maintenance contracts and rentals of automation systems. The increase in service and other revenues of
$35.3 million
was attributable to year over year increases of
$17.1 million
and
$18.2 million
in our Automation and Analytics and Medication Adherence segments, respectively. The increase in revenue growth in our Automation and Analytics segment was a result of higher service renewal fees driven mainly by an increase in installed customer base. The increase in the Medication Adherence segment was primarily attributed to Ateb, which contributed $18.7 million to the increase in the service revenue during the year ended December 31, 2017.
Our international sales represented
14%
,
15%
and
17%
of total revenues for the years ended
December 31, 2017
,
December 31, 2016
and
December 31, 2015
, respectively, and are expected to be affected by foreign currency exchange rates fluctuations. The decrease as a percentage of our total revenues in international revenues was primarily related to our recently acquired companies, Aesynt and Ateb, which have a higher market presence in United States compared to international markets. We are unable to predict the extent to which revenue in future periods will be impacted by changes in foreign currency exchange rates.
Our ability to continue to grow revenue is dependent on our ability to continue to obtain orders from customers, our ability to produce quality products and consumables to fulfill customer demand, the volume of installations we are able to complete, our ability to meet customer needs by providing a quality installation experience, and our flexibility in manpower allocations among customers to complete installations on a timely basis. The timing of our product revenues for equipment is primarily dependent on when our customers’ schedules allow for installations.
2016 compared to 2015:
Revenues were $692.6 million for the year ended December 31, 2016 compared to $484.6 million for the year ended December 31, 2015, representing an increase of approximately 43%. The year-over-year revenue increase was primarily attributed to increases in product revenues of $129.5 million and in services and other revenue of $78.5 million.
Product revenues represented 75% and 80% of total revenues for the years ended December 31, 2016 and 2015, respectively. The increase in product revenues of $129.5 million was due to the recently acquired companies, primarily Aesynt which contributed $86.9 million to the increase, and to a lesser degree, a full year of operations of Mach4 and Avantec. The remaining increase was attributed to revenue growth in our Automation and Analytics segment due to customer conversions, larger orders received from our existing customers, and higher implementations, partially offset by decreases in lease renewals. Our Medication Adherence segment contributed $3.2 million to the overall product revenue growth, primarily due to the increase in the consumable products sales of $5.2 million, partially offset by decrease in equipment sales of $2.4 million due to the timing of installations.
Service and other revenues represented 25% and 20% of total revenues for the years ended December 31, 2016 and 2015, respectively. The increase in service revenues of $78.5 million was due to the recently acquired companies, primarily Aesynt which contributed $68.9 million to the increase, and to a lesser degree, a full year of operations of Mach4 and Avantec. The remaining increase was primarily attributed to revenue growth in our Automation and Analytics segment as result of higher service renewal fees driven mainly by an increase in installed customer base. Our Medication Adherence segment contributed $1.6 million primarily due to the Ateb acquisition.
50
Financial Information by Segment
Revenues
|
Change in
|
Change in
|
||||||||||||||||||||||
|
2017
|
$
|
%
|
2016
|
$
|
%
|
2015
|
|||||||||||||||||
|
Revenues:
|
(Dollars in thousands)
|
||||||||||||||||||||||
|
Automation and Analytics
|
$
|
590,392
|
|
$
|
(3,234
|
)
|
(1)%
|
$
|
593,626
|
|
$
|
203,305
|
|
52%
|
$
|
390,321
|
|
||||||
|
Percentage of total revenues
|
82%
|
86%
|
81%
|
||||||||||||||||||||
|
Medication Adherence
|
125,773
|
|
26,776
|
|
27%
|
98,997
|
|
4,759
|
|
5%
|
94,238
|
|
|||||||||||
|
Percentage of total revenues
|
18%
|
14%
|
19%
|
||||||||||||||||||||
|
Total revenues
|
$
|
716,165
|
|
$
|
23,542
|
|
3%
|
$
|
692,623
|
|
$
|
208,064
|
|
43%
|
$
|
484,559
|
|
||||||
2017 compared to 2016:
The decrease in Automation and Analytics revenues of
$3.2 million
for the year ended
December 31, 2017
as compared to the year ended
December 31, 2016
was primarily related to a decrease in product revenues of
$20.3 million
partially offset by an increase in service revenue of
$17.1 million
. The decrease in revenues in the Automation and Analytics segment was attributed to a slower conversion of bookings and backlog into revenue due to the introduction of the new XT series of products in the fourth quarter of 2016. While we have experienced larger deal sizes, the administrative process of converting our existing bookings of G4 products into XT series products has decelerated revenue recognition for the year ended December 31, 2017 compared to the year ended December 31, 2016. Service revenue increase in the Automation and Analytics segment was primarily attributed to higher service renewal fees driven mainly by an increase in installed customer base.
The increase in Medication Adherence revenues of
$26.8 million
for the year ended
December 31, 2017
as compared to the year ended
December 31, 2016
was primarily attributed to increases in service revenues of
$18.2 million
and product revenues of
$8.6 million
. The increase in service revenues was primarily attributed to Ateb, which contributed $18.7 million to the increase during the year ended December 31, 2017. Product revenue increase was primarily attributed to Ateb, which contributed $4.2 million to the increase, as well as the introduction of the VBM product series in the fourth quarter of 2016.
2016 compared to 2015:
The increase in Automation and Analytics revenues for the year ended December 31, 2016 as compared to the year ended December 31, 2015 was primarily related to an increase in product revenues of $126.4 million and an increase in service revenue of $76.9 million. The increase in product and service revenue is attributable to the recently acquired companies, primarily Aesynt, and to a lesser degree a full year of operations for Mach4 and Avantec. Aesynt contributed $86.9 million and $68.9 million to the increase in product and service revenues, respectively. The remaining increase was attributed to customer conversions, larger orders received from our existing customers, higher implementations, and higher service renewal fees driven mainly by an increase in the installed customer base, partially offset by decreases in lease renewals.
Medication Adherence revenues increased for the year ended December 31, 2016 as compared to the year ended December 31, 2015 and was primarily attributable to an increase in product revenues of $3.2 million, mainly due to the increase in consumable product sales which increased $5.2 million compared to the year ended December 31, 2015. This increase was partially offset by a decrease in equipment sales of $2.4 million due to the timing of installations.
Cost of Revenues and Gross Profit
Cost of revenues is primarily comprised of three general categories: (i) standard product costs which accounts for the majority of the product cost of revenues that are provided to customers, and are inclusive of purchased material, labor to build the product and overhead costs associated with production; (ii) installation costs as we install our equipment at the customer site and include costs of the field installation personnel, including labor, travel expense, and other expenses; and (iii) other costs, including variances in standard costs and overhead, scrap costs, rework, warranty, provisions for excess and obsolete inventory and amortization of software development costs and intangibles.
51
|
Change in
|
Change in
|
||||||||||||||||||||||
|
2017
|
$
|
%
|
2016
|
$
|
%
|
2015
|
|||||||||||||||||
|
Cost of revenues:
|
(Dollars in thousands)
|
||||||||||||||||||||||
|
Automation and Analytics
|
$
|
308,443
|
|
$
|
(2,524
|
)
|
(1)%
|
$
|
310,967
|
|
$
|
139,024
|
|
81%
|
$
|
171,943
|
|
||||||
|
As a percentage of related revenues
|
52%
|
52%
|
44%
|
||||||||||||||||||||
|
Medication Adherence
|
85,634
|
|
17,778
|
|
26%
|
67,856
|
|
3,170
|
|
5%
|
64,686
|
|
|||||||||||
|
As a percentage of related revenues
|
68%
|
69%
|
69%
|
||||||||||||||||||||
|
Total cost of revenues
|
$
|
394,077
|
|
$
|
15,254
|
|
4%
|
$
|
378,823
|
|
$
|
142,194
|
|
60%
|
$
|
236,629
|
|
||||||
|
As a percentage of total revenues
|
55%
|
55%
|
49%
|
||||||||||||||||||||
|
Gross profit:
|
|||||||||||||||||||||||
|
Automation and Analytics
|
$
|
281,949
|
|
$
|
(710
|
)
|
—%
|
$
|
282,659
|
|
$
|
64,281
|
|
29%
|
$
|
218,378
|
|
||||||
|
Automation and Analytics gross margin
|
48%
|
48%
|
56%
|
||||||||||||||||||||
|
Medication Adherence
|
40,139
|
|
8,998
|
|
29%
|
31,141
|
|
1,589
|
|
5%
|
29,552
|
|
|||||||||||
|
Medication Adherence gross margin
|
32%
|
31%
|
31%
|
||||||||||||||||||||
|
Total gross profit
|
$
|
322,088
|
|
$
|
8,288
|
|
3%
|
$
|
313,800
|
|
$
|
65,870
|
|
27%
|
$
|
247,930
|
|
||||||
|
Total gross margin
|
45%
|
45%
|
51%
|
||||||||||||||||||||
2017 compared to 2016:
Cost of Revenues
Automation and Analytics.
Cost of revenues for the year ended December 31, 2017 decreased by
$2.5 million
compared to the year ended December 31, 2016 primarily due to a decrease in product costs of $9.1 million, partially offset by an increase in service costs of $6.5 million. The decrease in product costs is primarily due to the decrease in product revenues of
$20.3 million
partially offset by costs attributed to the XT series manufacturing ramp up, including costs related to design refinement and lower overhead absorption due to the decrease of revenues from the XT conversion. The increase in service costs is primarily due to the increase in service revenues of
$17.1 million
, which is offset by a slight decrease in costs due to efficiencies from scaling and cost saving activities.
Medication Adherence.
Cost of revenues increased by
$17.8 million
for the year ended
December 31, 2017
as compared to the year ended
December 31, 2016
primarily due to the increase in product costs and service costs of $11.5 million and $6.3 million, respectively. The increase in product costs was attributed to (i) increase in product revenues of
$8.6 million
, (ii) increase in product costs of $5.4 million related to Ateb, and (iii) product mix from higher volume of sales of lower margin products. The increase in service costs was primarily attributed to the increase in service costs of $6.3 million related to Ateb.
2016 compared to 2015:
Cost of Revenues
Automation and Analytics.
Cost of revenues
i
ncreased by $139.0 million, primarily due to an increase in product costs of $101.7 million. The increase was attributed to the acquired companies, mainly Aesynt, and to a lesser degree Mach4 and Avantec due to a full year of operations in 2016. The increase in cost of product revenues from Aesynt of $78.1 million, includes the amortization expense for developed technology of $4.9 million, amortization of backlog of $13.7 million, and inventory step-up fair value adjustment of $3.7 million resulting from the purchase accounting. The remaining difference is due to customer and product mixes and overall growth in product sales. Cost of service revenues increased by $37.3 million primarily due to costs related to the acquired companies, mainly Aesynt which contributed $33.7 million to the increase in cost of service revenue.
Medication Adherence.
Cost of revenues increased by $3.2 million compared to the year ended December 31, 2015. The change is due to product and service cost of revenues which increased $2.3 million and $0.9 million, respectively, mainly attributed to customer and product mixes and overall growth in product sales.
52
Operating Expenses and Income from Operations
|
Change in
|
Change in
|
||||||||||||||||||||||
|
2017
|
$
|
%
|
2016
|
$
|
%
|
2015
|
|||||||||||||||||
|
Operating expenses:
|
(Dollars in thousands)
|
||||||||||||||||||||||
|
Research and development
|
$
|
66,022
|
|
$
|
8,223
|
|
14%
|
$
|
57,799
|
|
$
|
22,639
|
|
64%
|
$
|
35,160
|
|
||||||
|
As a percentage of total revenues
|
9%
|
8%
|
7%
|
||||||||||||||||||||
|
Selling, general and administrative
|
250,312
|
|
792
|
|
—%
|
249,520
|
|
81,939
|
|
49%
|
167,581
|
|
|||||||||||
|
As a percentage of total revenues
|
35%
|
36%
|
35%
|
||||||||||||||||||||
|
Gain on business combination
|
—
|
|
—
|
|
—%
|
—
|
|
3,443
|
|
(100)%
|
(3,443
|
)
|
|||||||||||
|
Total operating expenses
|
$
|
316,334
|
|
$
|
9,015
|
|
3%
|
$
|
307,319
|
|
$
|
108,021
|
|
54%
|
$
|
199,298
|
|
||||||
|
As a percentage of total revenues
|
44%
|
44%
|
41%
|
||||||||||||||||||||
|
Income (loss) from operations:
|
|||||||||||||||||||||||
|
Automation and Analytics
|
$
|
88,249
|
|
$
|
4,101
|
|
5%
|
$
|
84,148
|
|
$
|
(20,146
|
)
|
(19)%
|
$
|
104,294
|
|
||||||
|
Operating margin
|
15%
|
14%
|
27%
|
||||||||||||||||||||
|
Medication Adherence
|
(1,596
|
)
|
(7,894
|
)
|
(125)%
|
6,298
|
|
1,004
|
|
19%
|
5,294
|
|
|||||||||||
|
Operating margin
|
(1)%
|
6%
|
6%
|
||||||||||||||||||||
|
Corporate expenses ("Common")
|
(80,899
|
)
|
3,066
|
|
(4)%
|
(83,965
|
)
|
(23,009
|
)
|
38%
|
(60,956
|
)
|
|||||||||||
|
Total income from operations
|
$
|
5,754
|
|
$
|
(727
|
)
|
(11)%
|
$
|
6,481
|
|
$
|
(42,151
|
)
|
(87)%
|
$
|
48,632
|
|
||||||
|
Total operating margin
|
1%
|
1%
|
10%
|
||||||||||||||||||||
2017 compared to 2016:
Research and Development.
Research and development expenses increased
$8.2 million
for the year ended
December 31, 2017
as compared to year ended
December 31, 2016
, primarily driven by increases of
$0.2 million
and
$6.8 million
in our Automation and Analytics and Medication Adherence segments, respectively. In addition, corporate-related research and development expenses increased by $1.2 million. The increase in our Medication and Adherence segment was primarily attributable to recently acquired Ateb, which contributed $5.5 million to the increase year over year. The remaining increase in the Medication Adherence segment is primarily related to continued investment in the segment. The increase in the corporate-related expenses related to new and ongoing research and development projects.
Selling, General and Administrative
. Selling, general and administrative expenses increased
$0.8 million
for the year ended
December 31, 2017
as compared to year ended
December 31, 2016
due to an increase in our Medication Adherence segment of
$10.1 million
, offset by decreases from our Automation and Analytics segment of
$5.0 million
and corporate-related expenses of
$4.3 million
. The increase from our Medication Adherence segment is primarily attributed to Ateb, which contributed $9.1 million to the increase. The remaining increase is primarily due to normal growth to support the business and attributed to higher commissions, benefits and salaries, and other investment in the business. The decrease in our Automation and Analytics segment was mainly due to (i) lower amortization expense related to intangible assets of $2.4 million, (ii) a decrease in commissions of $3.2 million due to decrease in product revenue, and (iii) a decrease in professional fees of $1.8 million related to Aesynt. The decreases are offset by normal growth of operations. The decrease in our corporate-related expenses was mainly due to lower integration and acquisition related cost as well as an overall reduction in cost as part of cost saving initiatives.
2016 compared to 2015:
Research and Development.
Research and development expenses increased $22.6 million for the year ended December 31, 2016 as compared to year ended December 31, 2015, primarily driven by an increase of $22.9 million in our Automation and Analytics segment which was partially offset by a decrease of $0.3 million in our Medication Adherence segment. The increase in our Automation and Analytics segment was primarily attributable to recently acquired companies, primarily Aesynt which contributed $19.4 million to the increase year over year. The remaining increase is mainly due to the increase in employee related expenses of $2.2 million as result of the increase in headcount and increase in consulting fees of $0.7 million related to ongoing research and development projects.
Selling, General and Administrative
. Selling, general and administrative expenses increased $81.9 million for the year ended December 31, 2016 as compared to year ended December 31, 2015 due to increases from our Automation and Analytics segment of $58.3 million, increases in corporate expenses of $22.7 million and increases from our Medication Adherence
53
segment of $0.1 million. The increase from our Automation and Analytics segment was attributed to the newly acquired companies, primarily Aesynt which accounted for $40.7 million of the increase. The remaining increase is mainly due to (i) increase of $2.3 million in commission expense and $1.2 million in GPO fees due to increased revenue and timing of expense recognition, (ii) increase of $3.2 million in consulting and professional fees related to integration of recently acquired businesses and (iii) increase of $5.1 million employee related expenses as result of headcount increases. The increase in corporate related expenses is mainly due to (i) increase of $7.0 million in employee related expenses as result of headcount increases, (ii) increase of $1.7 million in bonus expenses, (iii) increase of $0.1 million in travel related expenses, (iv) increase of $2.5 million in depreciation expense, (v) increase of $1.8 million in software related fees and (vi) increase of $5.8 million in health and dental insurance costs.
Provision for (Benefit from) Taxes
|
Change in
|
Change in
|
||||||||||||||||||||||
|
2017
|
$
|
%
|
2016
|
$
|
%
|
2015
|
|||||||||||||||||
|
(Dollars in thousands)
|
|||||||||||||||||||||||
|
Provision for (benefit from) income taxes
|
$
|
(21,484
|
)
|
$
|
(18,933
|
)
|
742%
|
$
|
(2,551
|
)
|
$
|
(18,035
|
)
|
(116)%
|
$
|
15,484
|
|
||||||
|
Effective tax rate on earnings
|
2,444%
|
131%
|
34%
|
||||||||||||||||||||
2017 compared to 2016:
We recorded a benefit from income taxes of
$21.5 million
and an effective tax rate of
2,444%
for the year ended
December 31, 2017
, compared to a tax benefit of
$2.6 million
and an effective tax rate of
131%
for the year ended
December 31, 2016
. The 2017 annual effective tax rate differed from the statutory tax rate of 35%, primarily due to a favorable impact from the U.S. tax reform legislation that resulted in the recognition of a one-time benefit of $13.4 million from the revaluation of deferred tax assets and liabilities, as well as recording of the excess tax benefit from the equity-based compensation within income tax expense effective 2017, and favorable impact of research and development credits, the domestic production activities deduction, offset by unfavorable impact of geographic mix of earnings. The increase in the annual effective tax rate as compared to 2016 was primarily due to the favorable impact from enactment of the U.S. tax reform entitled the 2017 Tax Cuts and Jobs Act (the "Act") discussed further in Note 15 to our Consolidated Financial Statements.
2016 compared to 2015:
We recorded a benefit from income taxes of $2.6 million and an effective tax rate of 131% for the year ended December 31, 2016, compared to a tax provision of $15.5 million and an effective tax rate of 34% for the year ended December 31, 2015. The 2016 annual effective tax rate differed from the statutory tax rate of 35%, primarily due to the favorable impact of the IRS settlement and release of reserves, the domestic production activities deduction, and a calculated benefit in state income taxes, offset by unfavorable items such as non-deductible transaction costs, and non-deductible equity charges under ASC 740-718. The increase in the annual effective tax rate as compared to 2015 was primarily due to a decrease in overall profitability and the benefit recorded as a result of reserve releases after the IRS' examination.
LIQUIDITY AND CAPITAL RESOURCES
We had cash and cash equivalents of
$32.4 million
at
December 31, 2017
, compared to
$54.5 million
at
December 31, 2016
. All of our cash and cash equivalents are invested in demand deposits only.
Our cash position and working capital at
December 31, 2017
and
December 31, 2016
were as follows:
|
December 31,
|
|||||||
|
2017
|
2016
|
||||||
|
(In thousands)
|
|||||||
|
Cash
|
$
|
32,424
|
|
$
|
54,488
|
|
|
|
Working Capital
|
$
|
154,585
|
|
$
|
134,496
|
|
|
Our ratio of current assets to current liabilities was
1.7
:1 at
December 31, 2017
and at
December 31, 2016
.
Sources of Cash
54
On January 5, 2016, we entered into a $400 million secured credit facility pursuant to a credit agreement, by and among us, the lenders from time to time party thereto, Wells Fargo Securities, LLC, as sole lead arranger and Wells Fargo Bank, National Association, as administrative agent (the “Credit Agreement”). The Credit Agreement provides for a $200 million term loan facility (the “Term Loan Facility”), and prior to the amendment discussed below, a $200 million revolving credit facility (the “Revolving Credit Facility” and together with the Term Loan Facility, the “Facilities”). In addition, the Credit Agreement includes a letter of credit sub-limit of up to $10 million and a swing line loan sub-limit of up to $10 million.
On December 26, 2017 and April 11, 2017, we entered into the amendments to the Credit Agreement. Under these amendments, the Revolving Credit Facility was increased from
$200 million
to
$315 million
and certain other modifications were made. Refer to Note 8, Debt, of the Notes to the Consolidated Financial Statements included in this annual report. We expect to use future loans under the Revolving Credit Facility, if any, for general corporate purposes, including acquisitions.
As of
December 31, 2017
, the outstanding balance from the Facilities was
$217 million
and we were in full compliance with all covenants.
On November 3, 2017, we entered into a Distribution Agreement (the “Distribution Agreement”) with J.P. Morgan Securities LLC, Wells Fargo Securities, LLC and HSBC Securities (USA) Inc., as our sales agents (collectively, the “Sales Agents”), pursuant to which we may offer and sell from time to time through the Sales Agents up to $125 million maximum aggregate offering price of our common stock. Sales of the common stock pursuant to the Distribution Agreement may be made in negotiated transactions or transactions that are deemed to be “at the market” offerings as defined in Rule 415 under the Securities Act, including sales made directly on the Nasdaq Stock Market, or sales made to or through a market maker other than on an exchange. We intend to use the net proceeds from the sale, if any, of common stock in the offering for general corporate purposes, which may include, without limitation, the acquisition of complementary businesses, the repayment of outstanding indebtedness, capital expenditures and working capital.
For the year ended December 31, 2017, we generated gross proceeds of
$14.7 million
from sales of our common stock under the Distribution Agreement and incurred issuance costs of
$0.8 million
on sales of approximately 294,000 shares of our common stock at an average price of approximately
$49.85
per share.
Uses of Cash
Our future uses of cash are expected to be primarily for working capital, capital expenditures, loan principal and interest payments, and other contractual obligations. We also expect a continued use of cash for potential acquisitions and acquisition assessment activities.
On April 12, 2017, we completed the acquisition of all of the membership interest of InPharmics. The total consideration for the transaction was
$5.0 million
, net of cash on hand at signing of
$0.3 million
. Approximately
$0.5 million
of the total consideration was classified as a long-term liability for potential settlement of performance obligations.
On January 5, 2016, we completed the acquisition of all of the membership interests of Aesynt. The purchase price paid by us was $271.5 million, net of cash on hand of $8.2 million. On December 8, 2016, we completed the acquisition of Ateb. The purchase price paid by us was $40.7 million, net of cash on hand of $0.9 million. These acquisitions were funded with cash-on-hand and borrowings under the Credit Agreement.
In accordance with the share purchase agreement entered into on April 30, 2015 under which we acquired Avantec, we agreed to pay our potential earn-out payments of up to
$3.0 million
payable after
December 31, 2015
and an additional
$3.0 million
payable after
December 31, 2016
, based on bookings targets. The fair value of these potential earn-out payments as of the acquisition date was
$5.6 million
. Additionally we retained
$1.8 million
of the purchase consideration to be held to settle any future indemnification claims within an
18
- month period that we may make following the closing. During the year ended
December 31, 2016
, we paid out $3.0 million in earn-out payments, $1.8 million in held back payments for future indemnifications, and recognized $0.6 million of contingent gain as certain booking targets were not met. During the year ended December 31, 2017, the Company concluded that the final payout had been earned and paid out
$2.4 million
during the third quarter of 2017.
Our stock repurchase programs have a total of $54.9 million remaining for future repurchases as of
December 31, 2017
, which may result in additional use of cash. See Note 12, Stock Repurchases, of the Notes to Consolidated Financial Statements included in this annual report. There were no stock repurchases in 2017 and 2016. In 2015, the Company repurchased approximately $50.0 million of shares.
Based on our current business plan and revenue backlog, we believe that our existing cash and cash equivalents, our anticipated cash flows from operations, cash generated from the exercise of employee stock options and purchases under our employee stock purchase plan, along with the availability of funds under the Facilities will be sufficient to meet our cash needs
55
for working capital, capital expenditures, potential acquisitions, and other contractual obligations for at least the next twelve months. For periods beyond the next twelve months, we also anticipate that our net operating cash flows plus existing balances of cash and cash equivalents will suffice to fund the continued growth of our business.
Cash Flows
The following table summarizes, for the periods indicated, selected items in our Consolidated Statements of Cash Flows (as adjusted for the adoption of ASU 2016-09):
|
Year Ended December 31,
|
|||||||||||
|
2017
|
2016
|
2015
|
|||||||||
|
(In thousands)
|
|||||||||||
|
Net cash provided by (used in):
|
|||||||||||
|
Operating activities
|
$
|
24,834
|
|
$
|
49,900
|
|
$
|
38,486
|
|
||
|
Investing activities
|
(34,987
|
)
|
(341,323
|
)
|
(45,596
|
)
|
|||||
|
Financing activities
|
(9,877
|
)
|
263,752
|
|
(36,557
|
)
|
|||||
|
Effect of exchange rate changes on cash and cash equivalents
|
(2,034
|
)
|
(58
|
)
|
(4
|
)
|
|||||
|
Net increase (decrease) in cash and cash equivalents
|
$
|
(22,064
|
)
|
$
|
(27,729
|
)
|
$
|
(43,671
|
)
|
||
Operating activities
We expect cash from our operating activities to fluctuate in future periods as a result of a number of factors, including the timing of our billings and collections, our operating results and the timing of other liability payments.
Net cash provided by operating activities was
$24.8 million
for
2017
, primarily as a result of the net income of
$20.6 million
adjusted for non-cash items and changes in assets and liabilities. The non-cash items primarily consisted of depreciation and amortization expense of
$51.5 million
, share-based compensation expense of
$21.9 million
, deferred income taxes of
$26.8 million
and
$1.6 million
of amortization of debt financing fees. The net cash outflow which was contributed to changes in assets and liabilities include (i) an increase in accounts receivable of
$39.1 million
due to the timing of billings and collections, (ii) an increase in inventories of
$26.8 million
for inventory buildup in support of forecasted sales, (iii) a decrease in deferred revenue of
$1.2 million
due to the timing of orders and revenue being recognized for installed product, (iv) an increase in other current assets of
$2.1 million
and (v) an increase in prepaid expenses of
$7.4 million
. These outflows were partially offset by an increase in accounts payable of
$19.7 million
primarily due to the increase in inventory and timing of payments, a decrease in the investment in sales-type leases of
$6.6 million
, and an increase in other accrued liabilities of
$4.4 million
.
Net cash provided by operating activities was
$49.9 million
for 2016, primarily as a result of $0.6 million in net income adjusted for non-cash items and changes in assets and liabilities. The non-cash items primarily consisted of depreciation and amortization expense of $58.4 million, share-based compensation expense of $19.5 million, and deferred income taxes of $10.9 million. The cash outflow attributed to changes in assets and liabilities includes (i) a $3.4 million increase in inventories to support sales forecast, (ii) a $6.3 million decrease in other long-term liabilities mainly due to other tax liabilities, (iii) a $5.0 million decrease in accounts payable due to timing of payments, and (iv) a $9.6 million increase in investment in sales-type leases due to additional lease transactions entered into during the year. These amounts were partially offset by an increase in the deferred revenue of $4.5 million due to timing of orders and revenue being recognized for installed product, and decrease of $8.0 million in receivables as result of higher collections in the fourth quarter of 2016.
Net cash provided by operating activities was
$38.5 million
for 2015, primarily as a result of $30.8 million in net income adjusted for non-cash items, including depreciation and amortization expense of $25.6 million and share-based compensation expense of $14.9 million, partially offset by increases of $17.9 million in receivables and $10.0 million in inventory and net outflows of $9.6 million in other asset and liability accounts.
Investing activities
Net cash used in investing activities was
$35.0 million
for
2017
, which consisted of capital expenditures of
$15.3 million
for property and equipment,
$15.0 million
for costs of software development for external use, $0.2 million for purchase of intangible assets, and
$4.4 million
attributable to the acquisition of InPharmics.
Net cash used in investing activities was $341.3 million for 2016, $312.2 million of which was attributable to the acquisitions of Aesynt and Ateb. Capital expenditures related to software development costs for external use, purchases of property and equipment and, purchases of intangibles contributed $14.3 million, $13.4 million, and $1.4 million, respectively.
56
Net cash used in investing activities was $45.6 million for 2015, $25.5 million of which was attributable to the acquisitions of Mach4 and Avantec, and capital expenditures related to purchases of property and equipment and software development of software costs for external use of $7.5 million and $12.1 million, respectively.
Financing activities
Net cash used in financing activities was
$9.9 million
for
2017
, primarily due to the repayment of
$102.5 million
of the credit facilities and
$5.9 million
in employees' taxes paid related to restricted stock unit vesting, partially offset by
$30.1 million
in proceeds from employee stock option exercises and employee stock plan purchases, and
$56.9 million
proceeds from term loan and revolving credit facilities.
Net cash provided by financing activities was $263.7 million for 2016, as a result of $287.1 million of net proceeds from debt, $17.7 million in proceeds from employee stock option exercises and employee stock plan purchases and $2.0 million in excess tax benefits from employee stock plans, partially offset by $34.5 million of repayments of debt and revolving credit facility, $3.5 million in employees taxes paid in relation to restricted stock units and $3.0 million of payment for contingent consideration.
Net cash used in financing activities was $36.6 million for 2015 as a result of $50.0 million in cash used for stock repurchases under our 2012 and 2014 Stock Repurchase Programs and $3.6 million in employees taxes paid in relation to restricted stock units, partially offset by $17.1 million in proceeds from employee stock option exercises and employee stock plan purchases and $4.7 million in excess tax benefits from employee stock plans.
Contractual Obligations
Contractual obligations as of
December 31, 2017
are as follows:
|
Payments Due by Period
|
|||||||||||||||||||
|
Total
|
2018
|
2019-2020
|
2021-2022
|
2023 and thereafter
|
|||||||||||||||
|
(In thousands)
|
|||||||||||||||||||
|
Operating leases
(1)
|
$
|
80,357
|
|
$
|
12,167
|
|
$
|
22,700
|
|
$
|
19,247
|
|
$
|
26,243
|
|
||||
|
Purchase obligations
(2)
|
58,090
|
|
53,543
|
|
2,551
|
|
1,950
|
|
46
|
|
|||||||||
|
Term loan facility
(3)
|
182,500
|
|
17,500
|
|
47,500
|
|
117,500
|
|
—
|
|
|||||||||
|
Revolving credit facility
(3)
|
34,500
|
|
—
|
|
—
|
|
34,500
|
|
—
|
|
|||||||||
|
Total
(4) (5)
|
$
|
355,447
|
|
$
|
83,210
|
|
$
|
72,751
|
|
$
|
173,197
|
|
$
|
26,289
|
|
||||
|
(1)
|
Commitments under operating leases relate primarily to leased property and office equipment. Rent expense was
$11.5 million
,
$9.8 million
and
$7.0 million
for the years ended
December 31, 2017
,
2016
and
2015
, respectively.
|
|
(2)
|
We purchase components from a variety of suppliers and use contract manufacturers to provide manufacturing services for our products. During the normal course of business, we issue purchase orders with estimates of our requirements several months ahead of the delivery dates. These amounts are associated with agreements that are enforceable and legally binding. The amounts under such contracts are included in the table above because we believe that cancellation of these contracts is unlikely and we expect to make future cash payments according to the contract terms or in similar amounts for similar materials.
|
|
(3)
|
Amounts shown for term loan and revolving credit facility are principal repayments only. Due to use of interest rate swaps, the cash interest expense is partly variable and partly fixed, and is not reflected in the above table. Refer to Note 8, Debt, of the Notes to the Consolidated Financial Statements included in this annual report.
|
|
(4)
|
We have recorded $7.1 million for uncertain tax positions under long-term liabilities as of
December 31, 2017
in accordance with the authoritative guidance summarized in the section entitled "Critical Accounting Policies and Estimates" above. As these liabilities do not reflect actual tax assessments, the timing and amount of payments we might be required to make will depend upon a number of factors. Accordingly, as the timing and amount of payment cannot be estimated, $7.1 million in uncertain tax position liabilities have not been included in the table above. See Note 15, Income Taxes, of the Notes to Consolidated Financial Statements included in this annual report.
|
|
(5)
|
See Note 10, Commitments and Contingencies, of the Notes to Consolidated Financial Statements included in this annual report.
|
57
Off-Balance Sheet Arrangements
As of
December 31, 2017
, we had no off-balance sheet arrangements as defined under Regulation S-K 303(a)(4) of the Securities Exchange Act of 1934, as amended, and the instructions thereto.
We are exposed to market risks related to fluctuations in foreign currency exchange rates and interest rates.
Foreign Currency Exchange Risk
We operate in foreign countries which expose us to market risk associated with foreign currency exchange rate fluctuations between the U.S. dollar and various foreign currencies, the most significant of which are the British Pound and Euro. In order to manage foreign currency risk, at times we enter into foreign exchange forward contracts to mitigate risks associated with changes in spot exchange rates of mainly non-functional currency denominated assets or liabilities of our foreign subsidiaries. In general, the market risk related to these contracts is offset by corresponding gains and losses on the hedged transactions. By working only with major banks and closely monitoring current market conditions, we seek to limit the risk that counterparties to these contracts may be unable to perform. We do not enter into derivative contracts for trading purposes. At
December 31, 2017
, we did not have any outstanding foreign exchange forward contracts.
Interest Rate Fluctuation Risk
We are exposed to interest rate risk through our borrowing activities. As of
December 31, 2017
, we had total debt under the Credit Agreement of
$217.0 million
. See Note 8, Debt, of the Notes to the Condensed Consolidated Financial Statements included in this annual report.
We use interest rate swap agreements to protect ourselves against adverse fluctuations in interest rates by reducing our exposure to variability in cash flows relating to interest payments on a portion of our outstanding debt. Our interest rate swaps, which are designated as cash flow hedges, involve the receipt of variable amounts from counterparties in exchange for us making fixed-rate payments over the life of the agreements. We do not hold or issue any derivative financial instruments for speculative trading purposes. During 2016, we entered into an interest rate swap agreement with a combined notional amount of
$100 million
with one counter-party that became effective beginning on June 30, 2016 and matures on April 30, 2019. At December 31, 2017, the total debt under the credit facility exposed to interest rate fluctuation risk was $117.0 million. An immediate increase of 1% in interest rate would results in $1.2 million of interest expense per year.
58
The following tables presenting our quarterly results of operations should be read in conjunction with the Consolidated Financial Statements and related disclosures included in Part IV, Item 15 of this annual report and are incorporated by reference into this Item 8. We have prepared the unaudited information on the same basis as our audited consolidated financial statements. Our operating results for any quarter are not necessarily indicative of results for any future quarters or for a full year.
SUPPLEMENTARY CONSOLIDATED FINANCIAL DATA (UNAUDITED)
|
Quarter Ended
|
|||||||||||||||
|
December 31, 2017
|
September 30, 2017
|
June 30, 2017
|
March 31, 2017
|
||||||||||||
|
(In thousands, except per share data)
(Unaudited)
|
|||||||||||||||
|
2017 Consolidated Statements of Operations Data:
|
|||||||||||||||
|
Total revenue
|
$
|
197,944
|
|
$
|
186,782
|
|
$
|
180,885
|
|
$
|
150,554
|
|
|||
|
Gross profit
|
95,068
|
|
84,853
|
|
77,975
|
|
64,192
|
|
|||||||
|
Income (loss) from operations
|
15,680
|
|
9,714
|
|
(2,404
|
)
|
(17,236
|
)
|
|||||||
|
Net income (loss)
|
$
|
24,291
|
|
$
|
6,231
|
|
$
|
837
|
|
$
|
(10,754
|
)
|
|||
|
Net income (loss) per share:
|
|||||||||||||||
|
Basic
|
$
|
0.64
|
|
$
|
0.17
|
|
$
|
0.02
|
|
$
|
(0.29
|
)
|
|||
|
Diluted
|
$
|
0.62
|
|
$
|
0.16
|
|
$
|
0.02
|
|
$
|
(0.29
|
)
|
|||
|
Quarter Ended
|
|||||||||||||||
|
December 31, 2016
|
September 30, 2016
|
June 30, 2016
|
March 31, 2016
|
||||||||||||
|
(In thousands, except per share data)
(Unaudited)
|
|||||||||||||||
|
2016 Consolidated
Statements of Operations Data:
|
|||||||||||||||
|
Total revenue
|
$
|
171,974
|
|
$
|
176,737
|
|
$
|
172,908
|
|
$
|
171,004
|
|
|||
|
Gross profit
|
74,329
|
|
81,508
|
|
78,018
|
|
79,945
|
|
|||||||
|
Income (loss) from operations
|
(181
|
)
|
4,928
|
|
(118
|
)
|
1,852
|
|
|||||||
|
Net income (loss)
|
$
|
157
|
|
$
|
1,983
|
|
$
|
(1,159
|
)
|
$
|
(378
|
)
|
|||
|
Net income per share:
|
|||||||||||||||
|
Basic
|
$
|
—
|
|
$
|
0.05
|
|
$
|
(0.03
|
)
|
$
|
(0.01
|
)
|
|||
|
Diluted
|
$
|
—
|
|
$
|
0.05
|
|
$
|
(0.03
|
)
|
$
|
(0.01
|
)
|
|||
None.
Evaluation of Disclosure Controls and Procedures
Our management, with the participation of our chief executive officer and chief financial officer, evaluated the effectiveness of our disclosure controls and procedures (as defined in Rule 13a-15(e) or 15d-15(e) under the Exchange Act) as of the end of the period covered by this Annual Report on Form 10-K. In designing and evaluating the disclosure controls and procedures, management recognized that any controls and procedures, no matter how well designed and operated, can provide only reasonable assurance of achieving the desired control objectives. In addition, the design of disclosure controls and
59
procedures must reflect the fact that there are resource constraints and that management is required to apply its judgment in evaluating the benefits of possible controls and procedures relative to their costs.
Based on that evaluation, our chief executive officer and chief financial officer concluded that our disclosure controls and procedures were effective as of
December 31, 2017
to provide reasonable assurance that information we are required to disclose in reports that we file or submit under the Exchange Act is recorded, processed, summarized and reported within the time periods specified in SEC rules and forms, and that such information is accumulated and communicated to our management, including our chief executive officer and chief financial officer, as appropriate, to allow timely decisions regarding required disclosure.
Management's Report on Internal Control over Financial Reporting
Our management is responsible for establishing and maintaining adequate internal control over financial reporting (as such term is defined in Rules 13a-15(f) and 15d-15(f) under the Exchange Act). Our internal control system is designed to provide reasonable assurance regarding the preparation and fair presentation of financial statements for external purposes in accordance with U.S. generally accepted accounting principles. All internal control systems, no matter how well designed, have inherent limitations and can provide only reasonable assurance that the objectives of the internal control system are met.
Under the supervision and with the participation of our management, including our principal executive officer and principal financial officer, we conducted an evaluation of the effectiveness of our internal control over financial reporting as of
December 31, 2017
using the criteria for effective internal control over financial reporting as described in "Internal Control—Integrated Framework," issued by the Committee of Sponsoring Organization of the Treadway Commission (2013 framework) (the COSO Criteria). Based on this assessment, management concluded that our internal control over financial reporting was effective as of
December 31, 2017
.
Deloitte & Touche LLP, an independent registered public accounting firm, has issued its attestation report on our internal control over financial reporting as of
December 31, 2017
, which is included in Part IV, Item 15 of this annual report.
Changes in Internal Control over Financial Reporting
Except as disclosed below, there have been no changes in our internal control over financial reporting (as such term is defined in Rules 13a-15(f) and 15d-15(f) under the Exchange Act) that have materially affected, or are reasonably likely to materially affect, our internal control over financial reporting during the year ended
December 31, 2017
.
We have completed the integration of the recently acquired business, Ateb, into our systems and control environment as of December 31, 2017.
None.
60
Certain information required by Part III is omitted from this annual report because the registrant will file with the U.S. Securities and Exchange Commission a definitive proxy statement pursuant to Regulation 14A in connection with the solicitation of proxies for the Company's Annual Meeting of Stockholders expected to be held in May 2018 (the "Proxy Statement") not later than 120 days after the end of the fiscal year covered by this annual report, and certain information included therein is incorporated herein by reference.
The information required by this Item with respect to directors and executive officers may be found under the heading "Executive Officers of the Registrant" in Part I, Item 1 of this annual report, and in the section entitled "Election of Directors" appearing in the Proxy Statement. Such information is incorporated herein by reference.
The information required by this Item with respect to our audit committee and audit committee financial expert may be found in the section entitled "Information Regarding the Board of Directors and Corporation Governance—Audit Committee" appearing in the Proxy Statement. Such information is incorporated herein by reference.
The information required by this Item with respect to compliance with Section 16(a) of the Securities Exchange Act of 1934 may be found in the sections entitled "Section 16(a) Beneficial Ownership Reporting Compliance" appearing in the Proxy Statement. Such information is incorporated herein by reference.
Our written Code of Conduct applies to all of our directors and employees, including executive officers, including without limitation our principal executive officer, principal financial officer, principal accounting officer or controller or persons performing similar functions. The Code of Conduct is available on our website at
www.omnicell.com
under the hyperlink titled "Corporate Governance." Changes to or waivers of the Code of Conduct will be disclosed on the same website. We intend to satisfy the disclosure requirement under Item 5.05 of Form 8-K regarding any amendment to, or waiver of, any provision of the Code of Conduct by disclosing such information on the same website.
The information required by this Item with respect to director and executive officer compensation is incorporated by reference to the section of our Proxy Statement under the section entitled "Executive Compensation."
The information required by this Item with respect to Compensation Committee interlocks and insider participation is incorporated herein by reference to the information from the Proxy Statement under the section entitled "Information Regarding the Board of Directors and Corporate Governance—Compensation Committee Interlocks and Insider Participation."
The information required by this Item with respect to our Compensation Committee's review and discussion of the Compensation Discussion and Analysis included in the Proxy Statement is incorporated herein by reference to the information from the Proxy Statement under the section entitled "Executive Compensation—Compensation Discussion and Analysis—Compensation Committee Report."
The information required by this Item with respect to security ownership of certain beneficial owners and management is incorporated herein by reference to the information from the Proxy Statement under the section entitled "Security Ownership of Certain Beneficial Owners and Management."
The information required by this Item with respect to securities authorized for issuance under our equity compensation plans is incorporated herein by reference to the information from the Proxy Statement under the section entitled "Equity Compensation Plan Information."
The information required by this Item with respect to related party transactions is incorporated herein by reference to the information from the Proxy Statement under the section entitled "Certain Relationships and Related Transactions."
61
The information required by this Item with respect to director independence is incorporated herein by reference to the information from the Proxy Statement under the section entitled "Information Regarding the Board of Directors and Corporate Governance—Independence of the Board of Directors."
The information required by this Item is incorporated herein by reference to the section from the Proxy Statement under the section entitled "Ratification of Selection of Independent Registered Public Accounting Firm—Principal Accountant Fees and Services."
62
The following documents are included as part of this annual report:
|
(1)
|
Consolidated Financial Statements:
|
|
Index to Financial Statements
|
Page Number
|
|
|
(2)
|
Exhibits: The information required by this item is set forth on the exhibit index which follows the signature page of this report.
|
63
REPORT OF INDEPENDENT REGISTERED PUBLIC ACCOUNTING FIRM
To the shareholders and the Board of Directors of Omnicell, Inc.
Opinion on the Financial Statements
We have audited the accompanying consolidated balance sheets of Omnicell, Inc. and subsidiaries (the "Company") as of December 31, 2017 and 2016, the related consolidated statements of operations, comprehensive income, stockholders' equity, and cash flows for each of the three years in the period ended December 31, 2017 and the related notes and the schedule listed in the Index at Item 15 (collectively referred to as the "financial statements"). In our opinion the financial statements present fairly, in all material respects, the financial position of the Company as of December 31, 2017 and 2016, and the results of its operations and its cash flows for each of the three years in the period ended December 31, 2017, in conformity with accounting principles generally accepted in the United States of America.
We have also audited, in accordance with the standards of the Public Company Accounting Oversight Board (United States) (PCAOB), the Company’s internal control over financial reporting as of December 31, 2017, based on criteria established in Internal Control - Integrated Framework (2013) issued by the Committee of Sponsoring Organizations of the Treadway Commission and our report dated
February 27, 2018
, expressed an unqualified opinion on the Company’s internal control over financial reporting.
Basis for Opinion
These financial statements are the responsibility of the Company’s management. Our responsibility is to express an opinion on the Company’s financial statements based on our audits. We are a public accounting firm registered with the PCAOB and are required to be independent with respect to the Company in accordance with the U.S. federal securities laws and the applicable rules and regulations of the Securities and Exchange Commission and the PCAOB.
We conducted our audits in accordance with the standards of the PCAOB. Those standards require that we plan and perform the audit to obtain reasonable assurance about whether the financial statements are free of material misstatement, whether due to error or fraud. Our audits included performing procedures to assess the risks of material misstatement of the financial statements, whether due to error or fraud, and performing procedures that respond to those risks. Such procedures included examining, on a test basis, evidence regarding the amounts and disclosures in the financial statements. Our audits also included evaluating the accounting principles used and significant estimates made by management, as well as evaluating the overall presentation of the financial statements. We believe that our audits provide a reasonable basis for our opinion.
/s/ DELOITTE & TOUCHE LLP
San Jose, California
February 27, 2018
We have served as the Company's auditor since 2014.
F-1
REPORT OF INDEPENDENT REGISTERED PUBLIC ACCOUNTING FIRM
To the shareholders and the Board of Director of Omnicell, Inc.
Opinion on Internal Control over Financial Reporting
We have audited the internal control over financial reporting of Omnicell, Inc. and subsidiaries (the "Company") as of December 31, 2017, based on criteria established in
Internal Control - Integrated Framework (2013)
issued by the Committee of Sponsoring Organizations of the Treadway Commission (COSO). In our opinion, the Company maintained, in all material respects, effective internal control over financial reporting as of December 31, 2017, based on criteria established in
Internal Control - Integrated Framework (2013)
issued by COSO.
We have also audited, in accordance with the standard of the Public Company Accounting Oversight Board (United States) (PCAOB), the consolidated financial statements as of and for the year ended December 31, 2017, of the Company and our report dated
February 27, 2018
, expressed an unqualified opinion on those financial statements and financial statement schedule.
Basis for Opinion
The Company’s management is responsible for maintaining effective internal control over financial reporting and for its assessment of the effectiveness of internal control over financial reporting, included in the accompanying Management’s Report on Internal Control Over Financial Reporting. Our responsibility is to express an opinion on the Company’s internal control over financial reporting based on our audit. We are a public accounting firm registered with the PCAOB and are required to be independent with respect to the Company in accordance with the U.S. federal securities laws and the applicable rules and regulations of the Securities and Exchange Commission and the PCAOB.
We conducted our audit in accordance with the standards of the PCAOB. Those standards require that we plan and perform the audit to obtain reasonable assurance about whether effective internal control over financial reporting was maintained in all material respects. Our audit included obtaining an understanding of internal control over financial reporting, assessing the risk that a material weakness exists, testing and evaluating the design and operating effectiveness of internal control based on the assessed risk, and performing such other procedures as we considered necessary in the circumstances. We believe that our audit provides a reasonable basis for our opinion.
Definition and Limitations of Internal Control over Financial Reporting
A company’s internal control over financial reporting is a process designed to provide reasonable assurance regarding the reliability of financial reporting and the preparation of financial statements for external purposes in accordance with generally accepted accounting principles. A company’s internal control over financial reporting includes those policies and procedures that (1) pertain to the maintenance of records that, in reasonable detail, accurately and fairly reflect the transactions and dispositions of the assets of the company; (2) provide reasonable assurance that transactions are recorded as necessary to permit preparation of financial statements in accordance with generally accepted accounting principles, and that receipts and expenditures of the company are being made only in accordance with authorizations of management and directors of the company; and (3) provide reasonable assurance regarding prevention or timely detection of unauthorized acquisition, use, or disposition of the company’s assets that could have a material effect on the financial statements.
Because of its inherent limitations, internal control over financial reporting may not prevent or detect misstatements. Also, projections of any evaluation of effectiveness to future periods are subject to the risk that controls may become inadequate because of changes in conditions, or that the degree of compliance with the policies or procedures may deteriorate.
/s/ DELOITTE & TOUCHE LLP
San Jose, California
February 27, 2018
F-2
OMNICELL, INC.
|
December 31,
|
|||||||
|
2017
|
2016
|
||||||
|
(In thousands, except par value)
|
|||||||
|
ASSETS
|
|||||||
|
Current assets:
|
|||||||
|
Cash and cash equivalents
|
$
|
32,424
|
|
$
|
54,488
|
|
|
|
Accounts receivable, net of allowances of $5,738 and $4,796, respectively
|
189,227
|
|
150,303
|
|
|||
|
Inventories
|
96,137
|
|
69,297
|
|
|||
|
Prepaid expenses
|
36,060
|
|
28,646
|
|
|||
|
Other current assets
|
13,273
|
|
12,674
|
|
|||
|
Total current assets
|
367,121
|
|
315,408
|
|
|||
|
Property and equipment, net
|
42,595
|
|
42,011
|
|
|||
|
Long-term investment in sales-type leases, net
|
15,435
|
|
20,585
|
|
|||
|
Goodwill
|
337,751
|
|
327,724
|
|
|||
|
Intangible assets, net
|
168,107
|
|
190,283
|
|
|||
|
Long-term deferred tax assets
|
9,454
|
|
4,041
|
|
|||
|
Other long-term assets
|
39,841
|
|
35,051
|
|
|||
|
Total assets
|
$
|
980,304
|
|
$
|
935,103
|
|
|
|
LIABILITIES AND STOCKHOLDERS’ EQUITY
|
|||||||
|
Current liabilities:
|
|||||||
|
Accounts payable
|
$
|
48,290
|
|
$
|
27,069
|
|
|
|
Accrued compensation
|
27,241
|
|
26,722
|
|
|||
|
Accrued liabilities
|
35,693
|
|
31,195
|
|
|||
|
Long-term debt, current portion, net
|
15,208
|
|
8,410
|
|
|||
|
Deferred revenue, net
|
86,104
|
|
87,516
|
|
|||
|
Total current liabilities
|
212,536
|
|
180,912
|
|
|||
|
Long-term deferred revenue
|
17,244
|
|
17,051
|
|
|||
|
Long-term deferred tax liabilities
|
28,579
|
|
51,592
|
|
|||
|
Other long-term liabilities
|
9,829
|
|
8,210
|
|
|||
|
Long-term debt, net
|
194,917
|
|
245,731
|
|
|||
|
Total liabilities
|
463,105
|
|
503,496
|
|
|||
|
Commitments and contingencies (Note 10)
|
|
|
|
|
|||
|
Stockholders’ equity:
|
|||||||
|
Preferred stock, $0.001 par value, 5,000 shares authorized; no shares issued
|
—
|
|
—
|
|
|||
|
Common stock, $0.001 par value, 100,000 shares authorized; 47,577 and 45,778 shares issued; 38,432 and 36,633 shares outstanding, respectively
|
48
|
|
46
|
|
|||
|
Treasury stock at cost, 9,145 shares outstanding, respectively
|
(185,074
|
)
|
(185,074
|
)
|
|||
|
Additional paid-in capital
|
585,755
|
|
525,758
|
|
|||
|
Retained earnings
|
122,583
|
|
100,396
|
|
|||
|
Accumulated other comprehensive income (loss)
|
(6,113
|
)
|
(9,519
|
)
|
|||
|
Total stockholders’ equity
|
517,199
|
|
431,607
|
|
|||
|
Total liabilities and stockholders’ equity
|
$
|
980,304
|
|
$
|
935,103
|
|
|
The accompanying notes are an integral part of these consolidated financial statements.
F-3
OMNICELL, INC.
|
Year Ended December 31,
|
|||||||||||
|
2017
|
2016
|
2015
|
|||||||||
|
(In thousands, except per share data)
|
|||||||||||
|
Revenues:
|
|||||||||||
|
Product
|
$
|
506,209
|
|
$
|
517,944
|
|
$
|
388,397
|
|
||
|
Services and other revenues
|
209,956
|
|
174,679
|
|
96,162
|
|
|||||
|
Total revenues
|
716,165
|
|
692,623
|
|
484,559
|
|
|||||
|
Cost of revenues:
|
|
|
|
|
|||||||
|
Cost of product revenues
|
304,842
|
|
302,437
|
|
198,418
|
|
|||||
|
Cost of services and other revenues
|
89,235
|
|
76,386
|
|
38,211
|
|
|||||
|
Total cost of revenues
|
394,077
|
|
378,823
|
|
236,629
|
|
|||||
|
Gross profit
|
322,088
|
|
313,800
|
|
247,930
|
|
|||||
|
Operating expenses:
|
|
|
|
|
|||||||
|
Research and development
|
66,022
|
|
57,799
|
|
35,160
|
|
|||||
|
Selling, general and administrative
|
250,312
|
|
249,520
|
|
167,581
|
|
|||||
|
Gain on business combination
|
—
|
|
—
|
|
(3,443
|
)
|
|||||
|
Total operating expenses
|
316,334
|
|
307,319
|
|
199,298
|
|
|||||
|
Income from operations
|
5,754
|
|
6,481
|
|
48,632
|
|
|||||
|
Interest and other income (expense), net
|
(6,633
|
)
|
(8,429
|
)
|
(2,388
|
)
|
|||||
|
Income (loss) before provision for income taxes
|
(879
|
)
|
(1,948
|
)
|
46,244
|
|
|||||
|
Provision for (benefit from) income taxes
|
(21,484
|
)
|
(2,551
|
)
|
15,484
|
|
|||||
|
Net income
|
$
|
20,605
|
|
$
|
603
|
|
$
|
30,760
|
|
||
|
Net income per share:
|
|||||||||||
|
Basic
|
$
|
0.55
|
|
$
|
0.02
|
|
$
|
0.86
|
|
||
|
Diluted
|
$
|
0.53
|
|
$
|
0.02
|
|
$
|
0.84
|
|
||
|
Weighted-average shares:
|
|||||||||||
|
Basic
|
37,483
|
|
36,156
|
|
35,857
|
|
|||||
|
Diluted
|
38,712
|
|
36,864
|
|
36,718
|
|
|||||
The accompanying notes are an integral part of these consolidated financial statements.
F-4
OMNICELL, INC.
CONSOLIDATED STATEMENTS OF COMPREHENSIVE INCOME (LOSS)
|
Year Ended December 31,
|
|||||||||||
|
2017
|
2016
|
2015
|
|||||||||
|
(In thousands)
|
|||||||||||
|
Net income
|
$
|
20,605
|
|
$
|
603
|
|
$
|
30,760
|
|
||
|
Other comprehensive income (loss), net of reclassification adjustments:
|
|||||||||||
|
Unrealized gain (loss) on interest rate swap contracts, net of tax
|
(404
|
)
|
1,245
|
|
—
|
|
|||||
|
Foreign currency translation adjustments
|
3,810
|
|
(8,034
|
)
|
(1,369
|
)
|
|||||
|
Other comprehensive gain (loss)
|
3,406
|
|
(6,789
|
)
|
(1,369
|
)
|
|||||
|
Comprehensive income (loss)
|
$
|
24,011
|
|
$
|
(6,186
|
)
|
$
|
29,391
|
|
||
The accompanying notes are an integral part of these consolidated financial statements.
F-5
OMNICELL, INC.
CONSOLIDATED STATEMENTS OF STOCKHOLDERS' EQUITY
|
Common Stock
|
Treasury Stock
|
Additional
Paid-In
Capital
|
Accumulated
Earnings
(Deficit)
|
Accumulated
Other
Comprehensive
Income (Loss)
|
Stockholders'
Equity
|
||||||||||||||||||||||||
|
Shares
|
Amount
|
Shares
|
Amount
|
||||||||||||||||||||||||||
|
(In thousands)
|
|||||||||||||||||||||||||||||
|
Balances as of December 31, 2014
|
43,537
|
|
$
|
43
|
|
(7,721
|
)
|
$
|
(135,053
|
)
|
$
|
457,436
|
|
$
|
69,033
|
|
$
|
(1,361
|
)
|
$
|
390,098
|
|
|||||||
|
Net income
|
|
|
—
|
|
—
|
|
—
|
|
—
|
|
30,760
|
|
—
|
|
30,760
|
|
|||||||||||||
|
Other comprehensive income (loss)
|
—
|
|
—
|
|
—
|
|
—
|
|
—
|
|
—
|
|
(1,369
|
)
|
(1,369
|
)
|
|||||||||||||
|
Stock repurchases
|
—
|
|
—
|
|
(1,424
|
)
|
(50,021
|
)
|
—
|
|
—
|
|
—
|
|
(50,021
|
)
|
|||||||||||||
|
Share-based compensation
|
—
|
|
—
|
|
—
|
|
—
|
|
14,921
|
|
—
|
|
—
|
|
14,921
|
|
|||||||||||||
|
Issuance of common stock under employee stock plans
|
1,202
|
|
2
|
|
—
|
|
—
|
|
17,089
|
|
—
|
|
—
|
|
17,091
|
|
|||||||||||||
|
Tax payments related to restricted stock units
|
—
|
|
—
|
|
—
|
|
—
|
|
(3,627
|
)
|
—
|
|
—
|
|
(3,627
|
)
|
|||||||||||||
|
Income tax benefits from employee stock plans
|
—
|
|
—
|
|
—
|
|
—
|
|
4,535
|
|
—
|
|
—
|
|
4,535
|
|
|||||||||||||
|
Balances as of December 31, 2015
|
44,739
|
|
45
|
|
(9,145
|
)
|
(185,074
|
)
|
490,354
|
|
99,793
|
|
(2,730
|
)
|
402,388
|
|
|||||||||||||
|
Net income
|
|
|
|
—
|
|
|
—
|
|
|
—
|
|
|
—
|
|
|
603
|
|
|
—
|
|
|
603
|
|
||||||
|
Other comprehensive income (loss)
|
—
|
|
|
—
|
|
|
—
|
|
|
—
|
|
|
—
|
|
|
|
|
(6,789
|
)
|
|
(6,789
|
)
|
|||||||
|
Share-based compensation
|
—
|
|
|
—
|
|
|
—
|
|
|
—
|
|
|
19,500
|
|
|
—
|
|
|
—
|
|
|
19,500
|
|
||||||
|
Issuance of common stock under employee stock plans
|
1,039
|
|
|
1
|
|
|
—
|
|
|
—
|
|
|
17,691
|
|
|
—
|
|
|
—
|
|
|
17,692
|
|
||||||
|
Tax payments related to restricted stock units
|
—
|
|
|
—
|
|
|
—
|
|
|
—
|
|
|
(3,490
|
)
|
|
—
|
|
|
—
|
|
|
(3,490
|
)
|
||||||
|
Income tax benefits from employee stock plans
|
—
|
|
|
—
|
|
|
—
|
|
|
—
|
|
|
1,703
|
|
|
—
|
|
|
—
|
|
|
1,703
|
|
||||||
|
Balances as of December 31, 2016
|
45,778
|
|
|
46
|
|
|
(9,145
|
)
|
|
(185,074
|
)
|
|
525,758
|
|
|
100,396
|
|
|
(9,519
|
)
|
|
431,607
|
|
||||||
|
Net income
|
—
|
|
—
|
|
—
|
|
—
|
|
20,605
|
|
—
|
|
20,605
|
|
|||||||||||||||
|
Other comprehensive income (loss)
|
—
|
|
—
|
|
—
|
|
—
|
|
—
|
|
—
|
|
3,406
|
|
3,406
|
|
|||||||||||||
|
At the market equity offering, net of costs
|
294
|
|
—
|
|
—
|
|
|
13,900
|
|
—
|
|
—
|
|
13,900
|
|
||||||||||||||
|
Share-based compensation
|
—
|
|
—
|
|
—
|
|
—
|
|
21,857
|
|
—
|
|
—
|
|
21,857
|
|
|||||||||||||
|
Issuance of common stock under employee stock plans
|
1,505
|
|
2
|
|
—
|
|
—
|
|
30,121
|
|
—
|
|
—
|
|
30,123
|
|
|||||||||||||
|
Tax payments related to restricted stock units
|
—
|
|
—
|
|
—
|
|
—
|
|
(5,892
|
)
|
—
|
|
—
|
|
(5,892
|
)
|
|||||||||||||
|
Cumulative effect of a change in accounting principle related to stock-based compensation
|
—
|
|
—
|
|
—
|
|
—
|
|
—
|
|
1,582
|
|
—
|
|
1,582
|
|
|||||||||||||
|
Income tax benefits from employee stock plans
|
—
|
|
—
|
|
—
|
|
—
|
|
11
|
|
—
|
|
—
|
|
11
|
|
|||||||||||||
|
Balances as of December 31, 2017
|
47,577
|
|
$
|
48
|
|
(9,145
|
)
|
$
|
(185,074
|
)
|
$
|
585,755
|
|
$
|
122,583
|
|
$
|
(6,113
|
)
|
$
|
517,199
|
|
|||||||
The accompanying notes are an integral part of these consolidated financial statements.
F-6
OMNICELL, INC.
|
Year Ended December 31,
|
|||||||||||
|
2017
|
2016
|
2015
|
|||||||||
|
Operating Activities
|
(In thousands)
|
||||||||||
|
Net income
|
$
|
20,605
|
|
$
|
603
|
|
$
|
30,760
|
|
||
|
Adjustments to reconcile net income to net cash provided by operating activities:
|
|||||||||||
|
Depreciation and amortization
|
51,511
|
|
58,362
|
|
25,639
|
|
|||||
|
Loss on disposal of fixed assets
|
512
|
|
35
|
|
238
|
|
|||||
|
Gain on business combinations
|
—
|
|
—
|
|
(3,443
|
)
|
|||||
|
Gain related to contingent liability
|
—
|
|
(600
|
)
|
—
|
|
|||||
|
Share-based compensation expense
|
21,857
|
|
19,500
|
|
14,921
|
|
|||||
|
Income tax benefits from employee stock plans
|
11
|
|
1,703
|
|
4,535
|
|
|||||
|
Deferred income taxes
|
(26,844
|
)
|
(10,882
|
)
|
(1,092
|
)
|
|||||
|
Amortization of debt financing fees
|
1,590
|
|
1,590
|
|
—
|
|
|||||
|
Changes in operating assets and liabilities, net of business acquisitions:
|
|||||||||||
|
Accounts receivable
|
(39,068
|
)
|
8,047
|
|
(17,941
|
)
|
|||||
|
Inventories
|
(26,840
|
)
|
(3,362
|
)
|
(10,032
|
)
|
|||||
|
Prepaid expenses
|
(7,414
|
)
|
(4,321
|
)
|
4,049
|
|
|||||
|
Other current assets
|
(2,074
|
)
|
(1,093
|
)
|
638
|
|
|||||
|
Investment in sales-type leases
|
6,625
|
|
(9,639
|
)
|
(4,661
|
)
|
|||||
|
Other long-term assets
|
(98
|
)
|
2,043
|
|
496
|
|
|||||
|
Accounts payable
|
19,709
|
|
(4,963
|
)
|
(2,841
|
)
|
|||||
|
Accrued compensation
|
519
|
|
(2,052
|
)
|
(2,032
|
)
|
|||||
|
Accrued liabilities
|
4,383
|
|
(3,287
|
)
|
5,456
|
|
|||||
|
Deferred revenue
|
(1,219
|
)
|
4,480
|
|
(5,521
|
)
|
|||||
|
Other long-term liabilities
|
1,069
|
|
(6,264
|
)
|
(683
|
)
|
|||||
|
Net cash provided by operating activities
|
24,834
|
|
49,900
|
|
38,486
|
|
|||||
|
Investing Activities
|
|||||||||||
|
Purchase of intangible assets, intellectual property and patents
|
(160
|
)
|
(1,372
|
)
|
(415
|
)
|
|||||
|
Software development for external use
|
(15,040
|
)
|
(14,348
|
)
|
(12,132
|
)
|
|||||
|
Purchases of property and equipment
|
(15,341
|
)
|
(13,445
|
)
|
(7,542
|
)
|
|||||
|
Business acquisitions, net of cash acquired
|
(4,446
|
)
|
(312,158
|
)
|
(25,507
|
)
|
|||||
|
Net cash used in investing activities
|
(34,987
|
)
|
(341,323
|
)
|
(45,596
|
)
|
|||||
|
Financing Activities
|
|||||||||||
|
Proceeds from debt, net
|
56,894
|
|
287,051
|
|
—
|
|
|||||
|
Repayment of debt and revolving credit facility
|
(102,500
|
)
|
(34,500
|
)
|
—
|
|
|||||
|
Payment for contingent consideration
|
(2,400
|
)
|
(3,000
|
)
|
—
|
|
|||||
|
Proceeds from issuances under stock-based compensation plans
|
30,121
|
|
17,691
|
|
17,091
|
|
|||||
|
Employees' taxes paid related to restricted stock units
|
(5,892
|
)
|
(3,490
|
)
|
(3,627
|
)
|
|||||
|
At the market offering, net of offering costs
|
13,900
|
|
—
|
|
—
|
|
|||||
|
Common stock repurchases
|
—
|
|
—
|
|
(50,021
|
)
|
|||||
|
Net cash provided by (used in) financing activities
|
(9,877
|
)
|
263,752
|
|
(36,557
|
)
|
|||||
|
Effect of exchange rate changes on cash and cash equivalents
|
(2,034
|
)
|
(58
|
)
|
(4
|
)
|
|||||
|
Net increase (decrease) in cash and cash equivalents
|
(22,064
|
)
|
(27,729
|
)
|
(43,671
|
)
|
|||||
|
Cash and cash equivalents at beginning of period
|
54,488
|
|
82,217
|
|
125,888
|
|
|||||
|
Cash and cash equivalents at end of period
|
$
|
32,424
|
|
$
|
54,488
|
|
$
|
82,217
|
|
||
|
Supplemental cash flow information
|
|||||||||||
|
Cash paid for interest
|
$
|
6,550
|
|
$
|
5,344
|
|
$
|
76
|
|
||
|
Cash paid for taxes, net of refunds
|
$
|
7,780
|
|
$
|
11,091
|
|
$
|
11,871
|
|
||
|
Supplemental disclosure of non-cash investing activities
|
|||||||||||
|
Non-cash activity business acquisition
|
$
|
3,400
|
|
$
|
—
|
|
$
|
7,386
|
|
||
|
Unpaid property and equipment purchases
|
$
|
1,691
|
|
$
|
246
|
|
$
|
1,398
|
|
||
The accompanying notes are an integral part of these consolidated financial statements.
F-7
OMNICELL, INC.
NOTES TO CONSOLIDATED FINANCIAL STATEMENTS
Business
Omnicell, Inc. was incorporated in California in 1992 under the name Omnicell Technologies, Inc. and reincorporated in Delaware in 2001 as Omnicell, Inc. The Company's major products are automated medication, supply control systems and medication adherence solutions which are sold in its principal market, which is the healthcare industry. The Company's market is primarily located in the United States and Europe. "Omnicell" or the "Company" refer to Omnicell, Inc. and its subsidiaries.
Principles of consolidation
The accompanying Consolidated Financial Statements have been prepared in accordance with U.S. GAAP and include all adjustments necessary for the fair presentation of the Company's consolidated financial position, results of operations and cash flows for the periods presented. The Consolidated Financial Statements include the Company's accounts as well as those of its wholly owned subsidiaries after the elimination of intercompany balances and transactions.
On April 12, 2017, the Company completed its acquisition of Dixie Drawl, LLC d/b/a InPharmics ("InPharmics"). On December 8, 2016, the Company completed its acquisition of Ateb, Inc. and Ateb Canada Ltd. (together, “Ateb”). On January 5, 2016, the Company completed its acquisition of Aesynt Holding Cooperatief U.A. (“Aesynt”). On April 30, 2015, the Company acquired the remaining
85%
of the issued and outstanding ordinary shares of Avantec Healthcare Limited (“Avantec”) not already held by Omnicell. On April 21, 2015, the Company completed its acquisition of Mach4 Automatisierungstechnik GmbH (“Mach4”). The consolidated financial statements include the results of operations of these recently acquired companies, commencing as of their respective acquisition dates. The significant accounting policies of the acquired businesses have been aligned to conform to the accounting policies of Omnicell.
Certain prior year amounts in the Consolidated Statement of Cash Flows have been reclassified to conform to the 2017 presentation with the adoption of Accounting Standards Update ("ASU") 2016-09,
Compensation—Stock Compensation (Topic 718): Improvements to Employee Share-Based Payment Accounting
. Additionally, see "Recently adopted authoritative guidance" section below for the effects of adoption of ASU 2016-09.
Use of estimates
The preparation of financial statements in accordance with U.S. GAAP requires management to make estimates and assumptions that affect the amounts reported in the Company's Consolidated Financial Statements and accompanying Notes. Management bases its estimates on historical experience and various other assumptions believed to be reasonable. Although these estimates are based on management's best knowledge of current events and actions that may impact the Company in the future, actual results may be different from the estimates. The Company's critical accounting policies are those that affect its financial statements materially and involve difficult, subjective or complex judgments by management. Those policies are revenue recognition, allowance for doubtful accounts and notes receivable from investment in sales-type leases, inventory valuation, capitalized software development costs, valuation and impairment of goodwill, purchased intangibles and long-lived assets, fair value of assets acquired and liabilities assumed in business combination, share-based compensation and accounting for income taxes.
Segment reporting
The Company's Chief Operating Decision Maker ("CODM") is its Chief Executive Officer. The CODM allocates resources and evaluates the performance of the Company's segments using information about its revenues, gross profit, and income from operations. Such evaluation excludes general corporate-level costs that are not specific to either of the reportable segments and are managed separately at the corporate level. Corporate-level costs include expenses related to executive management, finance and accounting, human resources, legal, training and development, and certain administrative expenses. See Note 14, Segment and Geographical Information, for additional information on segment reporting.
The operating results of the recently acquired InPharmics, Aesynt, Mach4 and Avantec businesses are included in the Company's Automation and Analytics reportable segment. The operating results of the recently acquired Ateb business is included in the Medication Adherence reportable segment.
F-8
Foreign currency translation and remeasurement
Most of the Company's foreign subsidiaries use the local currency of their respective countries as their functional currency. The Company translates the assets and liabilities of such non-U.S. dollar functional currency subsidiaries into U.S. dollars using exchange rates in effect at the end of each period. Revenue and expenses for these subsidiaries are translated using rates that approximate those in effect during the period. Gains and losses from these translations are recorded as foreign currency translation adjustments and included in accumulated other comprehensive income (loss) in stockholders’ equity.
The Company’s foreign subsidiaries that use the U.S. dollar as their functional currency remeasure monetary assets and liabilities at exchange rates in effect at the end of each period, and non-monetary assets and liabilities at historical rates. Gains and losses from such foreign currency remeasurement are recorded in interest and other income (expense).
Revenue recognition
The Company earns revenues from sales of its medication and medical and surgical supply automation systems along with consumables and related services, which are sold in the healthcare industry, its principal market. Revenues are reported net of discounts and rebates provided to its customers. The Company's customer arrangements typically include one or more of the following deliverables:
Products.
Software-enabled equipment that manages and regulates the storage and dispensing of pharmaceuticals, consumable blister cards and packaging equipment and other medical supplies.
Software.
Additional software applications that enable incremental functionality of its equipment.
Installation.
Installation of equipment as integrated systems at customers' sites.
Post-installation technical support.
Phone support, on-site service, parts and access to unspecified software upgrades and enhancements, if and when available.
Professional services.
Other customer services, such as training and consulting.
The Company recognizes revenue when the earnings process is complete, based upon its evaluation of whether the following four criteria have been met:
Persuasive evidence of an arrangement exists.
The Company uses signed customer contracts and signed customer purchase orders as evidence of an arrangement for leases and sales. For service engagements, the Company uses a signed services agreement and a statement of work to evidence an arrangement.
Delivery has occurred.
Equipment and embedded software product delivery is deemed to occur upon successful installation and receipt of a signed and dated customer confirmation of installation letter, providing evidence that the Company has delivered what a customer ordered. In instances of a customer self-installation, product delivery is deemed to have occurred upon receipt of a signed and dated customer confirmation letter. If a sale does not require installation, the Company recognizes revenue on delivery of products to the customer, including transfer of title and risk of loss, assuming all other revenue criteria are met. For existing distributors, where installation of equipment training has been previously provided and the distributor is certified to install the Company's equipment at the end-user customer facility, the Company recognizes revenue from sales of products to the distributor upon shipment assuming all other revenue criteria are met, net of allowance for rights of return or refund. For new distributors, where the Company has not provided installation of equipment training, revenue on the sales of products to the distributor is deferred until the distributor has completed the Distributor Training Program and has been certified to install the Company's equipment at the end-user facility. For the sale of consumable blister cards, the Company recognizes revenue when title and risk of loss of the products shipped have transferred to the customer, which usually occurs upon shipment from the Company's facilities. Assuming all other revenue criteria are met, the Company recognizes revenue for support services ratably over the related support services contract period. The Company recognizes revenue on training and professional services as they are performed.
Fee is fixed or determinable.
The Company assesses whether a fee is fixed or determinable at the outset of the arrangement based on the payment terms associated with the transaction. The Company has established a history of collecting under the original contract without providing concessions on payments, products or services.
Collection is probable.
The Company assesses the probability of collecting from each customer at the outset of the arrangement based on a number of factors, including the customer's payment history and its current creditworthiness. If, in the Company's judgment, collection of a fee is not probable, the Company defers revenue recognition until the uncertainty is removed, which generally means revenue is recognized upon the Company's receipt of cash payment assuming all other revenue criteria are met. The Company's historical experience has been that collection from its customers is generally probable.
F-9
In arrangements with multiple deliverables, assuming all other revenue criteria are met, the Company recognizes revenue for individual delivered items if they have value to the customer on a standalone basis. The Company allocates arrangement consideration at the inception of the arrangement to all deliverables using the relative selling price method. This method requires the Company to determine the selling price at which each deliverable could be sold if it were sold regularly on a standalone basis. When available, the Company uses vendor-specific objective evidence ("VSOE") of the selling price. VSOE represents the price charged for a deliverable when it is sold separately, or for a deliverable not yet being sold separately, the price established by management with the relevant authority. The Company considers VSOE to exist when approximately
80%
or more of its standalone sales of an item are priced within a reasonably narrow pricing range (plus or minus
15%
of the median rates). The Company has established VSOE of the selling price for its post-installation technical support services and professional services. When VSOE of selling price is not available, third-party evidence ("TPE") of selling price for similar products and services is acceptable; however, the Company's offerings and market strategy differ from those of its competitors, such that it cannot obtain sufficient comparable information about third parties' prices. If neither VSOE nor TPE are available, the Company uses its best estimates of selling prices ("BESP"). The Company determines BESP considering factors such as market conditions, sales channels, internal costs and product margin objectives and pricing practices. The Company regularly reviews and updates its VSOE and BESP information.
The relative selling price method allocates total arrangement consideration proportionally to each deliverable on the basis of its estimated selling price. In addition, the amount recognized for any delivered items cannot exceed that which is not contingent upon delivery of any remaining items in the arrangement.
The Company also uses the residual method to allocate revenue between the software products that enable incremental equipment functionality, and thus are not deemed to deliver its essential functionality, and the related post-installation technical support, as these products and services continue to be accounted for under software revenue recognition rules. Under the residual method, the amount allocated to the undelivered elements equals VSOE of fair value of these elements. Any remaining amounts are attributed to the delivered items and are recognized when those items are delivered.
A portion of the Company's sales are made through multi-year lease agreements. Under sales-type leases, the Company recognizes revenue for its hardware and software products net of lease execution costs such as post-installation product maintenance and technical support, at the net present value of the lease payment stream once its installation obligations have been met. The Company optimizes cash flows by selling a majority of its non-U.S. government leases to third-party leasing finance companies on a non-recourse basis. The Company has no obligation to the leasing company once the lease has been sold. Some of the Company's sales-type leases, mostly those relating to U.S. government hospitals which comprise approximately
33%
of the lease receivable balance, are retained in-house. Interest income in these leases is recognized in product revenue using the effective interest method.
The Company will adopt the ASU 2014-09,
Revenue from Contracts with Customers,
effective January 1, 2018. Please refer to “Recently issued authoritative guidance” which is included in Note 1 of this report.
Financial Instruments
For assets and liabilities measured at fair value, the amounts are based on an expected exit price representing the amount that would be received from the sale of an asset or paid to transfer a liability in a transaction between market participants. The fair value may be based on assumptions that market participants would use in pricing an asset or liability. The authoritative guidance on fair value measurements establishes a consistent framework for measuring fair value on either a recurring or nonrecurring basis whereby inputs used in valuation techniques are assigned a hierarchical level. The following methods were used to estimate the fair value of each class of financial instruments for which it is practical to estimate that value:
Cash and Cash Equivalents and Fair Value of Financial Instruments.
The Company classifies investments as cash equivalents if their original or remaining contractual maturity is three months or less at the date of purchase. Cash equivalents are carried at amounts that approximate fair value due to the short period of time to maturity. The Company's cash balances are maintained in demand deposit accounts with financial institutions of high credit quality. The Company continuously monitors the credit worthiness of the financial institutions in which it invests. The Company has not experienced any credit losses from its cash investments.
Foreign currency forward contracts.
The Company enters into foreign currency forward contracts to protect its business from the risk that exchange rates may affect the eventual cash flows resulting from intercompany transactions between Omnicell and its foreign subsidiaries. These transactions primarily arise as a result of products manufactured in the United States ("U.S") and sold to foreign subsidiaries in U.S. dollars rather than the subsidiaries' functional currencies. These forward contracts are considered to be financial derivative instruments and are recorded at fair value. Changes in fair values of these
F-10
financial derivative instruments are either recognized in other comprehensive income or net income depending on whether the derivative has been designated and qualifies as a hedging instrument.
Interest rate swap agreements.
During 2016, the Company entered into an interest rate swap agreement. The interest rate swap agreement, at its inception, qualified for and were designated as cash flow hedging instrument. In accordance with the Derivatives and Hedging Topic of the Accounting Standards Codification, the Company records its interest rate swaps on its consolidated balance sheet at fair value. The effective portion of changes in fair value are recorded in accumulated other comprehensive loss and are subsequently reclassified into earnings in the period that the hedged forecasted transaction affects earnings. Any ineffective portion is recognized in earnings. Both at inception and on a quarterly basis, the Company performs an effectiveness test. For further information regarding these interest rate swap agreements, please refer to Note 4,
Cash and Cash Equivalents and Fair Value of Financial Instruments
.
Debt.
The Company has entered into a Credit Agreement which provides for (a) a
five
-year revolving credit facility and (b) a
five
-year term loan facility (Facilities). The amount borrowed under these facilities is recorded at its carrying value at
December 31, 2017
. The fair value at
December 31, 2017
approximates the carrying value.
Allowance for doubtful accounts and notes receivables from investment in sales-types leases
The Company maintains an allowance for doubtful accounts for estimated losses resulting from the inability of its customers to make required payments. The Company records a specific allowance based on an analysis of individual past-due balances. Additionally, based on historical write-offs and the Company's collection experience, the Company records an additional allowance based on a percentage of outstanding receivables. The Company performs credit evaluations of its customers' financial condition. These evaluations require significant judgment and are based on a variety of factors including, but not limited to, current economic trends, payment history and a financial review of the customer. Actual collection losses may differ from management's estimates, and such differences could be material to the Company's financial position and results of operations.
There were no customers that accounted for more than 10% of the Company’s accounts receivable balance as of
December 31, 2017
and
December 31, 2016
.
The retained in-house leases discussed above are considered financing receivables. The Company's credit policies and its evaluation of credit risk and write-off policies are applied alike to trade receivables and the net investment in sales-type leases. For both, an account is generally past due after thirty days. The financing receivables also have customer-specific reserves for accounts identified for specific impairment and a non-specific reserve applied to the remaining population, based on factors such as current trends, the length of time the receivables are past due and historical collection experience. The retained in-house leases are not stratified by portfolio or class.
Sales of accounts receivable
The Company records the sale of its accounts receivables as in accordance with accounting guidance for transfers and servicing of financial assets. The Company transferred non-recourse accounts receivable totaling
$40.0 million
,
$28.7 million
and
$38.6 million
during fiscal year
2017
,
2016
, and
2015
, respectively, which approximated fair value, to leasing companies on a non-recourse basis. Accounts receivable balance included approximately
$0.1 million
,
$0.2 million
and
$0.8 million
due from third-party leasing companies for transferred non-recourse accounts receivable as of
December 31, 2017
,
December 31, 2016
and
December 31, 2015
, respectively.
Inventory
Inventories are stated at the lower of cost, computed using the first-in, first-out method, and net realizable value. Inbound shipping costs are included in cost of inventory. The Company regularly monitors inventory quantities on hand and records write-downs for excess and obsolete inventories based on the Company's estimate of demand for its products, potential obsolescence of technology, product life cycles, and whether pricing trends or forecasts indicate that the carrying value of inventory exceeds its estimated selling price. These factors are impacted by market and economic conditions, technology changes, and new product introductions and require estimates that may include elements that are uncertain. Actual demand may differ from forecasted demand and may have a material effect on gross margins. If inventory is written down, a new cost basis is established that cannot be increased in future periods. Shipments from suppliers or contract manufacturers before the Company receives them are recorded as in-transit inventory when title and the significant risks and rewards of ownership have passed to the Company.
The Company has a supply agreement with one primary supplier for construction and supply of several sub-assemblies and inventory management of sub-assemblies used in our hardware products. There are
no
minimum purchase requirements. The contract with the Company's supplier may be terminated by either the supplier or by the Company without cause and at any
F-11
time upon delivery of
two
months' notice. Purchases from this supplier were
$64.5 million
,
$47.9 million
and
$41.7 million
for the years ended
December 31, 2017
,
December 31, 2016
and
December 31, 2015
, respectively.
Property and equipment
Property and equipment less accumulated depreciation are stated at historical cost. The Company's expenditures for property and equipment are primarily for computer equipment and software used in the administration of its business, and for leasehold improvements to its leased facilities. The Company also develops molds and dies used in long-term manufacturing arrangements with suppliers and for production automation equipment used in the manufacturing of consumable blister card components. Depreciation and amortization is computed by use of the straight-line method over the estimated useful lives of the assets as stated below:
|
Computer equipment and related software
|
3 - 5 years
|
|
Leasehold and building improvements
|
Shorter of the lease term or the estimated useful life
|
|
Furniture and fixtures
|
5 - 7 years
|
|
Equipment
|
3 - 12 years
|
Depreciation and amortization of property and equipment was
$16.2 million
,
$15.0 million
and
$12.8 million
for the years ended
December 31, 2017
,
December 31, 2016
and
December 31, 2015
, respectively.
The Company capitalizes costs related to computer software developed or obtained for internal use in accordance with ASC 350-40,
Internal-Use Software
. Software obtained for internal use has generally been enterprise-level business and finance software that the Company customizes to meet its specific operational needs. Costs incurred in the application development phase are capitalized and amortized over their useful lives, which is generally
five
years. Costs recognized in the preliminary project phase and the post-implementation phase are expensed as incurred. The Company capitalized
$0.4 million
and
$2.2 million
of costs related to the application development of enterprise-level software that was included in property and equipment during the years ended
December 31, 2017
and
December 31, 2016
, respectively.
Software development costs
The Company capitalizes software development costs in accordance with ASC 985-20,
Costs of Software to Be Sold, Leased, or Marketed
, under which certain software development costs incurred subsequent to the establishment of technological feasibility may be capitalized and amortized over the estimated lives of the related products. The Company establishes feasibility when it completes a working model and amortizes development costs over the estimated lives of the related products ranging from three to five years. The Company capitalized software development costs of
$15.0 million
and
$14.3 million
which are included in other assets as of
December 31, 2017
and
December 31, 2016
, respectively. The Company recorded
$9.7 million
,
$7.1 million
and
$5.8 million
to cost of revenues for amortization of capitalized software development costs for the years ended
December 31, 2017
,
December 31, 2016
and
December 31, 2015
, respectively. All development costs prior to the completion of a working model are recognized as research and development expense.
Deferred revenue
Deferred revenue arise when customers have been billed and/or have received products and/or services in advance of revenue recognition. The Company's deferred revenue, net, presented as short term consists of (i) unearned revenue on sale of equipment for which installation has not been completed, net of deferred cost of sales for such equipment, and (ii) the current portion of unearned service contracts for which revenue is recognized over their duration. Long-term deferred revenue includes long term portion of unearned service contracts.
Business combinations
The Company uses the acquisition method of accounting under the authoritative guidance on business combinations. Each acquired company’s operating results are included in the Company's Consolidated Financial Statements starting on the date of acquisition. The purchase price is equivalent to the fair value of consideration transferred. Tangible and identifiable intangible assets acquired and liabilities assumed as of the date of acquisition are recorded at the acquisition date fair value. Goodwill is recognized for the excess of purchase price over the net fair value of assets acquired and liabilities assumed.
Amounts allocated to assets and liabilities are based upon fair values. Such valuations require management to make significant estimates and assumptions, especially with respect to the identifiable intangible assets. Management makes estimates of fair value based upon assumptions believed to be reasonable and that of a market participant. These estimates are based on historical experience and information obtained from the management of the acquired companies and the estimates are
F-12
inherently uncertain. The separately identifiable intangible assets generally include customer relationships, technology, and trade names.
Goodwill and acquired intangible assets
Goodwill.
The Company reviews goodwill for impairment on an annual basis on the first day of the fourth quarter of each year at the reporting unit level. The Company's reporting units are the same as its operating segments, which are Automation and Analytics and Medication Adherence. A qualitative assessment is initially made to determine whether it is necessary to perform quantitative testing. A qualitative assessment includes, among others, consideration of: (i) past, current and projected future earnings and equity; (ii) recent trends and market conditions; and (iii) valuation metrics involving similar companies that are publicly-traded and acquisitions of similar companies, if available. If this qualitative assessment indicates that it is more likely than not that impairment exists, or if the Company decides to bypass this option, it proceeds to the quantitative assessment. The quantitative assessment involves a comparison between the estimated fair values of the Company's reporting units with their respective carrying amounts including goodwill. If the carrying value exceeds estimated fair value, the Company will record an impairment charge based on that difference. The impairment charge will be limited to the amount of goodwill allocated to that reporting unit.
To determine each reporting unit's fair value under the quantitative approach, the Company uses a combination of income and market approaches, equally weighting the two approaches, such as estimated discounted future cash flows of that reporting unit, multiples of earnings or revenues, and analysis of recent sales or offerings of comparable entities. The Company also considers its market capitalization on the date of the analysis to ensure the reasonableness of the sum of its reporting units’ fair value.
The Company performed a quantitative impairment analysis as of October 1, 2017 for its Medication Adherence reporting unit. The Company determined that the fair value of this reporting unit exceeded the carrying value by more than 40%, and thus no impairment was indicated. Additionally, the Company performed a qualitative impairment assessment analysis as of October 1, 2017 for its Automation and Analytics reporting unit taking into consideration past, current and projected future earnings, recent trends and market conditions; and valuation metrics involving similar companies that are publicly-traded. Based on the result of this analysis an impairment does not exist as of December 31, 2017.
Intangible assets.
In connection with the Company's acquisitions, it generally recognizes assets for customer relationships, backlog, developed technology, and trade names. Intangible assets are carried at cost less accumulated amortization. Such amortization is provided on a straight-line basis or on an accelerated basis based on a pattern of economic benefit that is expected to be obtained over the estimated useful lives of the respective assets, generally from
one
to
30
years. Amortization for developed technology and backlog is recognized in cost of revenues, and amortization for customer relationships, non-compete agreements, and trade names is recognized in selling, general and administrative expenses.
The Company assesses the impairment of identifiable intangible assets whenever events or changes in circumstances indicate that an asset's carrying amount may not be recoverable. Recoverability of an asset is measured by the comparison of the carrying amount to the sum of the undiscounted estimated future cash flows the asset is expected to generate, offset by estimated future costs to dispose of the product to which the asset relates. If an asset is considered to be impaired, the amount of such impairment would be measured as the difference between the carrying amount of the asset and its fair value. The Company's cash flow assumptions are based on historical and forecasted future revenue, operating costs, and other relevant factors. Assumptions and estimates about the remaining useful lives of the Company's intangible assets are subjective and are affected by changes to its business strategies. If management’s estimates of future operating results change, or if there are changes to other assumptions, the estimate of the fair value of the Company's assets could change significantly. Such change could result in impairment charges in future periods, which could have a significant impact on the Company's operating results and financial condition. For the years ended December 31, 2017 and December 31, 2016, there were no events or changes in circumstances to indicate that intangible assets carrying amounts may not be recoverable.
Valuation of share-based awards
The Company accounts for share-based compensation in accordance with ASC 718,
Stock Compensation
("ASC 718"). The Company recognizes compensation expense related to stock-based compensation based on the grant date estimated fair value.
The fair value of stock options ("options") on the grant date is estimated using the Black-Scholes option pricing model, which requires the following inputs: expected life, expected volatility, risk-free interest rate, expected dividend yield rate, exercise price, and closing price of its common stock on the date of grant. The expected volatility is based on a combination of historical and market-based implied volatility, and the expected life of the awards is based on the Company's historical experience of employee stock option exercises, including forfeitures. Expense is recognized on a straight-line basis over the requisite service period.
F-13
The fair value of Restricted Stock Units ("RSUs") is based on the stock price on the grant date. The fair value of Restricted Stock Awards (“RSAs”) is their intrinsic value, which is the difference between the fair value of the underlying stock at the measurement date and the purchase price. The RSUs and RSAs are subject to a service vesting condition and are recognized on a straight-line basis over the requisite service period.
The fair value of PSUs with service and market conditions is estimated using a Monte Carlo simulation model applying multiple awards approach. Expense is recognized when it is probable that the performance condition will be met using the accelerated attribution method over the requisite service period.
The valuation assumptions used in estimating the fair value of employee share-based awards may change in future periods.
Accounting for income taxes
The Company records an income tax provision for (benefit from) the anticipated tax consequences of the reported results of operations. In accordance with U.S. GAAP, the provision for (benefit from) income taxes is computed using the asset and liability method, which requires the recognition of deferred tax assets and liabilities for the expected future tax consequences of events that have been included in the financial statements. Under this method, deferred tax assets and liabilities are determined on the basis of the differences between the financial statement and tax bases of assets and liabilities and for operating losses and tax credit carry forwards. Deferred tax assets and liabilities are measured using the enacted tax rates in effect for the periods in which those tax assets and liabilities are expected to be realized or settled. In the event that these tax rates change, the Company will incur a benefit or detriment on its income tax expense in the period of change. If the Company were to determine that all or part of the net deferred tax assets are not realizable in the future, it will record a valuation allowance that would be charged to earnings in the period such determination is made.
In accordance with ASC 740, Income Taxes, the Company recognizes the tax benefit from an uncertain tax position if it is more likely than not that the tax position will be sustained on examination by the taxing authorities, based on the technical merits of the position. The tax benefits recognized in the financial statements from such positions are then measured based on the largest benefit that has a greater than 50% likelihood of being realized upon ultimate settlement. The calculation of tax liabilities involves significant judgment in estimating the impact of uncertainties in the application of U.S. GAAP and complex tax laws. Resolution of these uncertainties in a manner inconsistent with management’s expectations could have a material impact on the Company's financial condition and operating results.
Commissions
Sales commissions are incremental and directly related to customer sales contracts in which revenue is deferred. These commission costs are accrued and recorded in prepaid expenses upon execution of a non-cancelable customer contract and subsequently expensed in the period of revenue recognition. Commission expense was
$19.4 million
,
$22.0 million
and
$13.7 million
for the years ended
December 31, 2017
,
December 31, 2016
and
December 31, 2015
, respectively.
Group Purchasing Organizations
The Company contracts with Group Purchasing Organizations (“GPOs”), each of which functions as a purchasing agent on behalf of member hospitals and other healthcare providers, as well as with government entities and agencies. Pursuant to the terms of GPO agreements, each member contracts directly with Omnicell and can purchase Company’s product at pre-negotiated contract terms and pricing. The account receivable balances are with individual members of the GPOs, and therefore no significant concentration of credit risk exists. During our fiscal year ended December 31, 2017 sales to members of the ten largest GPOs accounted for approximately
51%
of total consolidated revenue.
The fees related to GPOs for services provided are recognized as part of Sales, General and Administrative expenses. The Company expensed
$7.4 million
,
$8.4 million
and
$5.9 million
of GPO administrative fees for the years ended
December 31, 2017
,
December 31, 2016
and
December 31, 2015
, respectively,
Shipping costs
Outbound freight billed to customers is recorded as product revenue. The related shipping and handling costs are expensed as part of selling, general and administrative expense. Shipping and handling expenses were
$13.6 million
,
$12.1 million
and
$8.5 million
for the years ended
December 31, 2017
,
December 31, 2016
and
December 31, 2015
, respectively.
Recently adopted accounting standards
In March 2016, the Financial Accounting Standards Board ("FASB") issued ASU No. 2016-09,
Compensation-Stock Compensation (Topic 718)
.
This
ASU simplifies several aspects of the accounting for share-based payment transactions,
F-14
including the income tax consequences, classification of awards as either equity or liabilities, and classification on the statement of cash flows. The provision of ASU No. 2016-09 is effective for annual periods beginning after December 15, 2016, and interim periods within those annual periods. The Company adopted the standard effective January 1, 2017. The impact of adoption was the recording of excess tax benefits within income tax expense, rather than in Additional Paid in Capital of
$6.6 million
for the year ended December 31, 2017.
Additionally, in the first quarter of 2017, the Company recognized the previously unrecognized excess tax benefits using the modified retrospective transition method, which resulted in a cumulative-effect adjustment of
$1.6 million
to retained earnings.
In January 2017, the FASB issued ASU 2017-04,
Intangibles-Goodwill and Other (Topic 350): Simplifying the Test for Goodwill Impairment
, which simplifies the accounting for goodwill impairment for all entities by requiring impairment charges to be based on the first step in today’s two-step impairment test under ASC 350, “Intangibles-Goodwill and Other.” Under the new guidance, if a reporting unit’s carrying amount exceeds its fair value, an entity will record an impairment charge based on that difference. The impairment charge will be limited to the amount of goodwill allocated to that reporting unit. ASU 2017-04 is effective for annual and interim impairment tests performed in periods beginning after December 15, 2019. Early adoption is permitted for annual and interim goodwill impairment testing dates after January 1, 2017. The Company adopted ASU 2017-04 effective January 1, 2017. The adoption of this authoritative guidance did not have impact on the Company's Consolidated Financial Statements or related disclosures for the periods presented.
In January 2017, the FASB issued ASU 2017-01,
Business Combinations
, which clarifies the definition of a business and provides a screen to determine when a set of assets and activities is not a business. The screen requires that when substantially all of the fair value of the gross assets acquired (or disposed of) is concentrated in a single identifiable asset or a group of similar identifiable assets, the set is not a business. ASU 2017-01 is effective for fiscal years beginning after December 15, 2017, with early adoption permitted. The Company adopted ASU 2017-01 effective January 1, 2017. The adoption of this authoritative guidance did not have impact on the Company's Consolidated Financial Statements or related disclosures for the periods presented.
In August 2017, the FASB issued ASU 2017-12,
Derivatives and Hedging (Topic 815)
, which simplifies the application of the hedge accounting guidance and improves the financial reporting, specifically simplifies designation and measurement for qualifying hedging relationships and the presentation of hedge results. ASU 2017-12 is effective for annual periods beginning after December 15, 2018 and interim periods within those annual periods with early adoption permitted. The Company adopted ASU 2017-12 effective August 1, 2017. The adoption of this authoritative guidance did not have impact on the Company's Consolidated Financial Statements or related disclosures for the periods presented.
Recently issued authoritative guidance
In May 2014, the FASB issued ASU No. 2014-09,
Revenue from Contracts with Customers
("ASU 2014-09") related to revenue recognition. Under the standard, revenue is recognized when a customer obtains control of promised goods or services in an amount that reflects the consideration the entity expects to receive in exchange for those goods or services. In addition, the standard requires disclosure of the nature, amount, timing, and uncertainty of revenue and cash flows arising from contracts with customers. The standard will be effective for the Company beginning January 1, 2018.
The guidance permits two methods of adoption: retrospectively to each prior reporting period presented (full retrospective method), or retrospectively with the cumulative effect of initially applying the guidance recognized at the date of initial application (modified retrospective method). The Company will adopt the standard using the full retrospective method to adjust each prior reporting period presented in the footnote disclosures to the Consolidated Financial Statements.
In preparation for adoption of the standard, the Company has implemented functionality changes in the revenue system and internal controls related to new standard adoption to enable the preparation, and reporting and disclosures of the financial information in accordance with the new standard upon the adoption and in future periods.
The most significant impact of the standard relates to accounting for direct incremental contract acquisition costs, such as commission expense, term software license revenue and accounting for contingent revenue.
The Company currently records the full commission expense in the consolidated statements of operations when commissions are both earned and revenue is recorded. The new revenue standard requires the Company to recognize incremental costs incurred to obtain a contract on a systematic basis that is consistent with the transfer to the customer of the product and services to which the cost relates, including an estimate of the period of service renewals for the transaction. The allocation of the costs between product and service and the estimation of a customer’s services period are management estimates and are based on the Company's historical experience. The Company will allocate commission costs between product and service revenue elements and recognize those when product revenue is recognized and over the estimated service period of
10
years, respectively. The
F-15
Company expects that the impact of capitalized commissions will be approximately
$19 million
to
$20 million
as of December 31, 2017 will be recognized in sales and marketing expense in future periods.
The Company expects to recognize the majority of revenue on term software licenses upon installation of the license rather than ratably over the life of the term license. The adoption of the standard will result in an increase in revenue of less than
$2 million
in 2016 and 2017 and a decrease in deferred revenue of less than
$3 million
as of December 31, 2017.
The new standard no longer requires deferral of contingent revenue in transactions where the amount charged to the customer for a particular performance obligation is less than the allocation of standalone selling price which will result in earlier recognition of revenue. The Company is finalizing the impact on revenue, unbilled accounts receivable and deferred revenue of this adoption adjustment.
The Company is currently finalizing the impact on tax expense and deferred taxes of these adoption adjustments.
In February 2016, the FASB issued ASU No. 2016-02,
Leases (Topic 842)
. The FASB amended lease accounting requirements to begin recording assets and liabilities arising from most leases on the balance sheet. The new guidance will also require significant additional disclosures about the amount and timing of cash flows from leases. This new guidance will be effective for us beginning on January 1, 2019 using a modified retrospective approach. The modified retrospective approach includes a number of optional practical expedients that entities may elect to apply. The Company is currently evaluating the impact ASU 2016-02 will have on its consolidated financial statements.
In October 2016, the FASB issued ASU No. 2016-16
, Income Taxes (Topic 740): Intra-Entity Transfers of Assets Other Than Inventory,
which reduces the complexity in the accounting standards by allowing the recognition of current and deferred income taxes for an intra-entity asset transfer, other than inventory, when the transfer occurs. Historically, recognition of the income tax consequence was not recognized until the asset was sold to an outside party. This amendment should be applied on a modified retrospective basis through a cumulative-effect adjustment directly to retained earnings as of the beginning of the period of adoption. ASU 2016-16 is effective for annual periods beginning after December 15, 2017, including interim reporting periods within those annual reporting periods. The Company does not expect application of the amended guidance to have a material effect on its consolidated financial statements.
There was no other recently issued and effective authoritative guidance that is expected to have a material impact on the Company's Consolidated Financial Statements through the reporting date.
F-16
2017 Acquisitions
On April 12, 2017, the Company completed the acquisition of all of the membership interest of Dixie Drawl, LLC d/b/a InPharmics ("InPharmics"). InPharmics is a technology and services company that provides advanced pharmacy informatics solutions to hospital pharmacies. The total consideration for the transaction was
$5.0 million
, net of cash acquired of
$0.3 million
. Approximately
$0.5 million
of the total consideration was classified as a long-term liability for potential settlement of performance obligations. The Company accounted for the acquisition of InPharmics in accordance with the authoritative guidance on business combinations; therefore, the tangible and intangible assets acquired and liabilities assumed were recorded at fair value on the acquisition date. The purchase price was preliminary allocated to intangible assets in the amount of
$1.9 million
, which included developed technology and customer contracts, with the remainder allocated to goodwill. The results of the InPharmics' operations have been included in our consolidated results of operations, and presented as part of the Automation and Analytics segment.
2016 Acquisition Activity
On January 5, 2016, the Company completed the acquisition of all of the membership interests of Aesynt. Aesynt is a provider of automated medication management systems, including dispensing robots with storage solutions, medication storage and dispensing carts and cabinets, I.V. sterile preparation robotics and software, including software related to medication management. The total consideration was
$271.5 million
, net of cash acquired of
$8.2 million
. The results of Aesynt's operations have been included in our consolidated results of operations as of the time of the acquisition, and presented as part of the Automation and Analytics segment.
On December 8, 2016, the Company completed its acquisition of ateb, Inc., and Ateb Canada Ltd. (together, “Ateb”) for
$40.7 million
of cash consideration, net of
$0.9 million
cash on hand. The cash consideration, included the repayment of Ateb indebtedness and other adjustments provided for in the Ateb's Securities Purchase Agreement. Ateb is a provider of pharmacy-based patient care and medication synchronization solutions to independent and chain pharmacies. The results of Ateb's operations have been included in our consolidated results of operations as of the time of the acquisition, and presented as part of the Medication Adherence segment.
The Company accounted for the acquisitions of Aesynt and Ateb in accordance with the authoritative guidance on business combinations; therefore, the tangible and intangible assets acquired and liabilities assumed were recorded at fair value on the acquisition dates, respectively. The following table represents the allocation of the purchase price to the assets acquired and the liabilities assumed by the Company during each acquisition, respectively, reconciled to the purchase price transferred included in the Company's Consolidated Balance Sheet:
F-17
|
Aesynt
|
Ateb
|
Total
|
|||||||||
|
(In thousands)
|
|||||||||||
|
Cash
|
$
|
8,164
|
|
$
|
902
|
|
$
|
9,066
|
|
||
|
Accounts receivable
|
43,312
|
|
7,761
|
|
51,073
|
|
|||||
|
Inventory
|
19,021
|
|
225
|
|
19,246
|
|
|||||
|
Other current assets
|
3,787
|
|
1,239
|
|
5,026
|
|
|||||
|
Total current assets
|
74,284
|
|
10,127
|
|
84,411
|
|
|||||
|
Property and equipment
|
10,389
|
|
2,447
|
|
12,836
|
|
|||||
|
Intangible assets
|
123,700
|
|
12,500
|
|
136,200
|
|
|||||
|
Goodwill
|
163,599
|
|
24,232
|
|
187,831
|
|
|||||
|
Other non-current assets
|
968
|
|
334
|
|
1,302
|
|
|||||
|
Total assets
|
372,940
|
|
49,640
|
|
422,580
|
|
|||||
|
Current liabilities
|
26,753
|
|
4,895
|
|
31,648
|
|
|||||
|
Deferred revenue, net
|
25,512
|
|
2,776
|
|
28,288
|
|
|||||
|
Non-current deferred tax liabilities
|
38,622
|
|
—
|
|
38,622
|
|
|||||
|
Other non-current liabilities
|
2,431
|
|
367
|
|
2,798
|
|
|||||
|
Total liabilities
|
93,318
|
|
8,038
|
|
101,356
|
|
|||||
|
Total purchase price
|
279,622
|
|
41,602
|
|
321,224
|
|
|||||
|
Total purchase price, net of cash received
|
$
|
271,458
|
|
$
|
40,700
|
|
$
|
312,158
|
|
||
The
$163.6 million
of goodwill arising from the Aesynt acquisition is primarily attributed to sales of future products and services and Aesynt's assembled workforce. The goodwill has been assigned to the Automation and Analytics segment and is not deductible for tax purposes. Since the acquisition, the Company adjusted the preliminary value assigned to goodwill by
$1.2 million
to reflect measurement period adjustments related to accounts receivable, inventory, and other assets and liabilities (inclusive of deferred taxes) of
$1.6 million
,
$1.1 million
and
($3.9) million
, respectively.
The
$24.2 million
of goodwill arising from the Ateb acquisition is primarily attributed to sales of future products and services and Ateb's assembled workforce. Since the acquisition, the Company adjusted the preliminary value assigned to goodwill by
$3.4 million
to reflect adjustments related to accounts receivable, other non-current assets and other accrued liabilities of
$0.1 million
,
$0.7 million
and
$2.6 million
, respectively.
Intangible assets eligible for recognition separate from goodwill were those that satisfied either the contractual/legal criterion or the separability criterion in the accounting guidance. The identifiable intangible assets acquired and their estimated useful lives for amortization are as follows:
|
Aesynt
|
Ateb
|
||||||||||
|
Fair value
|
Weighted
average useful life |
Fair value
|
Weighted
average useful life |
||||||||
|
(In thousands)
|
(In years)
|
(In thousands)
|
(In years)
|
||||||||
|
Customer relationships
|
$
|
58,200
|
|
14-16
|
$
|
8,900
|
|
12
|
|||
|
Developed technology
|
38,800
|
|
8
|
3,400
|
|
5
|
|||||
|
Backlog
|
20,200
|
|
1-3
|
—
|
|
-
|
|||||
|
In-process research and development ("IPR&D")
(1)
|
3,900
|
|
-
|
—
|
|
-
|
|||||
|
Non-compete
|
1,800
|
|
3
|
100
|
|
1
|
|||||
|
Trade names
|
800
|
|
1
|
100
|
|
1
|
|||||
|
Total purchased intangible assets
|
$
|
123,700
|
|
$
|
12,500
|
|
|||||
(1)
The amortization of the in-process R&D assets begins when the in-process R&D projects are complete.
Aesynt Acquisition
Customer relationships represent the fair value of the underlying relationships and agreements with Aesynt’s customers, acquired developed technology represents the fair value of Aesynt products that have reached technological
F-18
feasibility and were part of Aesynt’s product offerings at the date of acquisition, backlog represents the fair value of sales order product backlog at the date of acquisition, non-compete intangible asset represents the fair value of non-compete agreements with former key members of Aesynt's management, and trade name represents the fair value of brand and name recognition associated with the marketing of Aesynt’s products and services. In-process research and development ("IPR&D") represents the fair value of incomplete Aesynt research and development projects that had not reached technological feasibility as of the date of acquisition. Incremental costs incurred for those projects are expensed as incurred in research and development.
The fair value of Aesynt trade names, acquired developed technology, and acquired IPR&D was determined based on an income approach using the relief-from-royalty method at the royalty rates of
0.5%
,
4%
to
8%
and
12.5%
, respectively. The fair value of customer relationships, backlog, and non-compete intangible assets were determined based on an income approach using the discounted cash flow method, at the discounted rates of
13%
,
10%
and
13%
, respectively. The intangible assets, except customer relationship and IPR&D, are being amortized over their estimated useful lives using the straight line method of amortization. The customer relationship intangible asset is being amortized using a double-declining method of amortization as such method better represents the economic benefits to be obtained. In accordance with authoritative guidance, the IPR&D is accounted for as an indefinite-lived intangible asset until completion or abandonment of the associated research and development efforts. IPR&D is tested for impairment during the period it is considered an indefinite lived asset. IPR&D related projects are expected to be completed in
two
to
three
years. As of
December 31, 2017
, none of the IPR&D projects have been completed, and they have progressed as previously estimated.
Ateb Acquisition
Customer relationships represent the fair value of the underlying relationships and agreements with Ateb’s customers expected to result in future sales, acquired developed technology represents the fair value of Ateb intellectual property incorporated in their products, non-compete intangible asset represents the fair value of non-compete agreements with former key members of Ateb's management, and trade name represents the fair value of brand and name recognition associated with the marketing of Ateb’s products and services.
The fair value of Ateb trade names and acquired developed technology was determined based on an income approach using the relief-from-royalty method at the royalty rates of
0.5%
and
5%
to
6%
, respectively. The fair value of customer relationships, and non-compete intangible assets were determined based on an income approach using the discounted cash flow method, both using a
15%
discount rate. The intangible assets for non-compete agreements and trade name are being amortized over their estimated useful lives using the straight line method of amortization. The intangible assets for customer relationship and developed technology are being amortized using a double-declining method of amortization as such method better represents the economic benefits to be obtained.
The Company incurred approximately
$9.3 million
in acquisition-related costs related to the Aesynt acquisition of which
$6.4 million
and
$2.9 million
were recognized in the years ended
December 31, 2016
and
2015
, respectively. These costs are included in selling, general and administrative expenses in the Company's Consolidated Statement of Operations. During the year ended
December 31, 2016
, the Company incurred and expensed approximately
$1.7 million
of acquisition-related costs for Ateb.
Pro forma financial information
The following table presents certain unaudited pro forma information for illustrative purposes only, for the years ended
December 31, 2017
,
December 31, 2016
and
December 31, 2015
as if these acquisitions had been acquired on January 1, 2015. The pro forma information is not indicative of what would have occurred had the acquisitions taken place on January 1, 2015. The unaudited pro forma information combines the historical results of the acquisitions with the Company's consolidated historical results and includes certain adjustments reflecting the estimated impact of fair value adjustments for the respective periods. The pro forma adjustments include the impact of fair value adjustment related to deferred revenue, inventory fair value adjustment, amortization of intangible assets, stock-based compensation expense, interest expense and amortization of deferred issuance cost, and certain classification to conform to the Company's accounting policies.
|
Twelve months ended December 31,
|
|||||||||||
|
2017
|
2016
|
2015
|
|||||||||
|
(in thousands, except per share data)
|
|||||||||||
|
Pro forma net revenues
|
$
|
716,723
|
|
$
|
719,799
|
|
$
|
523,241
|
|
||
|
Pro forma net income (loss)
|
$
|
20,770
|
|
$
|
(1,044
|
)
|
$
|
2,245
|
|
||
|
Pro forma net income (loss) per share
|
$
|
0.54
|
|
$
|
(0.03
|
)
|
$
|
0.06
|
|
||
|
Weighted average number of shares
|
38,712
|
|
36,156
|
|
36,699
|
|
|||||
F-19
Basic net income per share is computed by dividing net income for the period by the weighted-average number of shares outstanding during the period. Diluted net income per share is computed by dividing net income for the period by the weighted-average number of shares, less shares repurchased, plus, if dilutive, potential common stock outstanding during the period. Potential common stock includes the effect of outstanding dilutive stock options, restricted stock awards and restricted stock units computed using the treasury stock method. The anti-dilutive weighted-average dilutive shares related to stock award plans are excluded from the computation of the diluted net income per share.
The calculation of basic and diluted net income per share is as follows:
|
Year Ended December 31,
|
|||||||||||
|
2017
|
2016
|
2015
|
|||||||||
|
(In thousands, except per share data)
|
|||||||||||
|
Net income
|
$
|
20,605
|
|
$
|
603
|
|
$
|
30,760
|
|
||
|
Weighted-average shares outstanding — basic
|
37,483
|
|
36,156
|
|
35,857
|
|
|||||
|
Add: Dilutive effect of employee stock plans
|
1,229
|
|
708
|
|
861
|
|
|||||
|
Weighted-average shares outstanding — diluted
|
38,712
|
|
36,864
|
|
36,718
|
|
|||||
|
Net income per share — basic
|
$
|
0.55
|
|
$
|
0.02
|
|
$
|
0.86
|
|
||
|
Net income per share — diluted
|
$
|
0.53
|
|
$
|
0.02
|
|
$
|
0.84
|
|
||
|
Anti-dilutive weighted-average shares related to stock award plans
|
501
|
|
1,345
|
|
555
|
|
|||||
Cash and cash equivalents of
$32.4 million
and
$54.5 million
as of
December 31, 2017
and
December 31, 2016
, respectively, consisted of demand deposits only.
Fair value hierarchy
The Company measures its financial instruments at fair value. The Company’s cash equivalents are classified within Level 1 of the fair value hierarchy as they are valued primarily using quoted market prices utilizing market observable inputs. The Company's interest rate swap contracts and foreign currency contracts are classified within Level 2 as the valuation inputs are based on quoted prices and market observable data of similar instruments. The Company's contingent consideration liability related to the Avantec acquisition and was classified as Level 3 as valuation inputs were unobservable in the market and significant to the instrument’s valuation. The Company determined the final payout amount for the remaining contingent consideration and reduced the liability from
$3.0 million
to
$2.4 million
. The reduction of the contingent liability resulted in a gain of
$0.6 million
which is recorded in the "Interest and other income (expense), net" line in the Consolidated Statement of Operations for the year ended December 31, 2016. During the year ended December 31, 2017, the Company concluded that the final payout had been earned and paid out
$2.4 million
during the third quarter of 2017.
The following table represents the fair value hierarchy of the Company’s financial assets measured at fair value as of
December 31, 2017
:
|
Level 1
|
Level 2
|
Level 3
|
Total
|
||||||||||||
|
(In thousands)
|
|||||||||||||||
|
Interest rate swap contracts
|
$
|
—
|
|
$
|
1,378
|
|
$
|
—
|
|
$
|
1,378
|
|
|||
|
Total financial assets
|
$
|
—
|
|
$
|
1,378
|
|
$
|
—
|
|
$
|
1,378
|
|
|||
The following table represents the fair value hierarchy of the Company’s financial assets measured at fair value as of
December 31, 2016
:
F-20
|
Level 1
|
Level 2
|
Level 3
|
Total
|
||||||||||||
|
(In thousands)
|
|||||||||||||||
|
Interest rate swap contracts
|
$
|
—
|
|
$
|
1,245
|
|
$
|
—
|
|
$
|
1,245
|
|
|||
|
Total financial assets
|
$
|
—
|
|
$
|
1,245
|
|
$
|
—
|
|
$
|
1,245
|
|
|||
|
Contingent consideration liability
|
—
|
|
—
|
|
2,400
|
|
2,400
|
|
|||||||
|
Total financial liabilities
|
$
|
—
|
|
$
|
—
|
|
$
|
2,400
|
|
$
|
2,400
|
|
|||
There have been no transfers between fair value measurement levels during the years ended
December 31, 2017
and
December 31, 2016
.
Foreign Currency Risk Management
The Company operates in foreign countries, which expose it to market risk associated with foreign currency exchange rate fluctuations between the U.S. dollar and various foreign currencies, the most significant of which is the British Pound and the Euro. In order to manage foreign currency risk, at times the Company enters into foreign exchange forward contracts to mitigate risks associated with changes in spot exchange rates of mainly non-functional currency denominated assets or liabilities of the Company's foreign subsidiaries. In general, the market risk related to these contracts is offset by corresponding gains and losses on the hedged transactions. By working only with major banks and closely monitoring current market conditions, the Company seeks to limit the risk that counterparties to these contracts may be unable to perform. The foreign exchange forward contracts are measured at fair value and reported as other current assets or accrued liabilities on the Consolidated Balance Sheets. The derivative instruments the Company uses to hedge this exposure are not designated as hedges. Any gains or losses on the foreign exchange forward contracts are recognized in earnings as Other Income/Expense in the period incurred in the Consolidated Statements of Operations. The Company does not enter into derivative contracts for trading purposes.
At
December 31, 2017
and
December 31, 2016
, the Company had
no
outstanding foreign exchange forward contracts.
Interest Rate Swap Contracts
The Company uses interest rate swap agreements to protect the Company against adverse fluctuations in interest rates by reducing its exposure to variability in cash flows relating to interest payments on a portion of its outstanding debt. The Company's interest rate swaps, which are designated as cash flow hedges, involve the receipt of variable amounts from counterparties in exchange for the Company making fixed-rate payments over the life of the agreements. The Company does not hold or issue any derivative financial instruments for speculative trading purposes.
During 2016, the Company entered into an interest rate swap agreement with a combined notional amount of
$100.0 million
with one counter-party that is effective beginning on June 30, 2016 and maturing on April 30, 2019. The swap agreement requires the Company to pay a fixed rate of
0.8%
and provides that the Company will receive a variable rate based on the one month LIBOR rate subject to LIBOR floor of
0.0%
. Amounts payable by or due to the Company will be net settled with the respective counter-party on the last business day of each month, commencing July 31, 2016.
The fair value of the interest rate swap agreements at
December 31, 2017
and
December 31, 2016
was
$1.4 million
and
$1.2 million
, respectively. There were
no
amounts reclassified into current earnings due to ineffectiveness during the periods presented.
Balance sheet details as of
December 31, 2017
and
December 31, 2016
are presented in the tables below:
F-21
|
December 31,
|
|||||||
|
2017
|
2016
|
||||||
|
(In thousands)
|
|||||||
|
Inventories:
|
|||||||
|
Raw materials
|
$
|
22,750
|
|
$
|
14,322
|
|
|
|
Work in process
|
9,818
|
|
7,800
|
|
|||
|
Finished goods
|
63,569
|
|
47,175
|
|
|||
|
Total inventories
|
$
|
96,137
|
|
$
|
69,297
|
|
|
|
Prepaid expenses
|
|||||||
|
Prepaid commissions
|
$
|
15,671
|
|
$
|
13,176
|
|
|
|
Other prepaid expenses
|
20,389
|
|
15,470
|
|
|||
|
Total prepaid expense
|
$
|
36,060
|
|
$
|
28,646
|
|
|
|
Property and equipment:
|
|||||||
|
Equipment
|
$
|
69,550
|
|
$
|
64,384
|
|
|
|
Furniture and fixtures
|
6,534
|
|
6,517
|
|
|||
|
Leasehold improvements
|
10,976
|
|
9,778
|
|
|||
|
Software
|
37,168
|
|
35,607
|
|
|||
|
Construction in progress
|
9,813
|
|
7,211
|
|
|||
|
Property and equipment, gross
|
134,041
|
|
123,497
|
|
|||
|
Accumulated depreciation and amortization
|
(91,446
|
)
|
(81,486
|
)
|
|||
|
Total property and equipment, net
|
$
|
42,595
|
|
$
|
42,011
|
|
|
|
Other long term assets:
|
|||||||
|
Capitalized software, net
|
$
|
38,599
|
|
$
|
33,233
|
|
|
|
Other assets
|
1,242
|
|
1,818
|
|
|||
|
Total other long term assets, net
|
$
|
39,841
|
|
$
|
35,051
|
|
|
|
Accrued liabilities:
|
|||||||
|
Advance payments from customers
|
$
|
7,779
|
|
$
|
7,030
|
|
|
|
Rebates and lease buyouts
|
5,428
|
|
4,025
|
|
|||
|
Group purchasing organization fees
|
3,449
|
|
3,737
|
|
|||
|
Taxes payable
|
9,183
|
|
4,003
|
|
|||
|
Other accrued liabilities
|
9,854
|
|
12,400
|
|
|||
|
Total accrued liabilities
|
$
|
35,693
|
|
$
|
31,195
|
|
|
F-22
The following table summarizes the changes in accumulated balances of other comprehensive income (loss) for the years ended
December 31, 2017
and
December 31, 2016
:
|
Foreign currency translation adjustments
|
Unrealized gain (loss) on interest rate swap hedges
|
Total
|
|||||||||
|
(In thousands)
|
|||||||||||
|
Balance as of December 31, 2015
|
$
|
(2,730
|
)
|
$
|
—
|
|
$
|
(2,730
|
)
|
||
|
Other comprehensive income (loss) before reclassifications
|
(8,034
|
)
|
1,385
|
|
(6,649
|
)
|
|||||
|
Amounts reclassified from other comprehensive income (loss)
|
—
|
|
(140
|
)
|
(140
|
)
|
|||||
|
Net current-period other comprehensive income (loss), net of tax
|
(8,034
|
)
|
1,245
|
|
(6,789
|
)
|
|||||
|
Balance as of December 31, 2016
|
(10,764
|
)
|
1,245
|
|
(9,519
|
)
|
|||||
|
Other comprehensive income (loss) before reclassifications
|
3,810
|
|
409
|
|
4,219
|
|
|||||
|
Amounts reclassified from other comprehensive income (loss), net of tax
|
—
|
|
(813
|
)
|
(813
|
)
|
|||||
|
Net current-period other comprehensive income (loss), net of tax
|
3,810
|
|
(404
|
)
|
3,406
|
|
|||||
|
Balance as of December 31, 2017
|
$
|
(6,954
|
)
|
$
|
841
|
|
$
|
(6,113
|
)
|
||
On a recurring basis, the Company enters into sales-type lease transactions which vary in length from
one
to
five years
. The receivables as a result of these types of transactions are collateralized by the underlying equipment leased and consist of the following components at
December 31, 2017
and
December 31, 2016
:
|
December 31,
|
|||||||
|
2017
|
2016
|
||||||
|
(In thousands)
|
|||||||
|
Net minimum lease payments to be received
|
$
|
25,899
|
|
$
|
33,591
|
|
|
|
Less: unearned interest income portion
|
(1,695
|
)
|
(2,763
|
)
|
|||
|
Net investment in sales-type leases
|
24,204
|
|
30,828
|
|
|||
|
Less: short-term portion
(1)
|
(8,769
|
)
|
(10,243
|
)
|
|||
|
Long-term net investment in sales-type leases
|
$
|
15,435
|
|
$
|
20,585
|
|
|
(1) The short-term portion of the net investments in sales-type leases is included in the other current assets on the Consolidated Balance Sheets.
The Company evaluates its sales-type leases individually and collectively for impairment. The allowance for credit losses were
$0.2 million
and
$0.3 million
as of
December 31, 2017
and
December 31, 2016
, respectively.
At
December 31, 2017
, the future minimum lease payments to be received under sales-type leases are as follows:
|
Year ended December 31,
|
(In thousands)
|
||
|
2018
|
$
|
8,769
|
|
|
2019
|
6,708
|
|
|
|
2020
|
4,772
|
|
|
|
2021
|
2,992
|
|
|
|
2022
|
2,265
|
|
|
|
Thereafter
|
393
|
|
|
|
Total
|
$
|
25,899
|
|
F-23
Goodwill
The changes in the carrying amount of goodwill are as follows:
|
Automation and
Analytics
|
Medication
Adherence
|
Total
|
|||||||||
|
(In thousands)
|
|||||||||||
|
Net balance as of December 31, 2015
|
$
|
54,316
|
|
$
|
93,590
|
|
$
|
147,906
|
|
||
|
Additions
(1)
|
163,599
|
|
20,832
|
|
184,431
|
|
|||||
|
Adjustments
(2)
|
(2,833
|
)
|
(1,780
|
)
|
(4,613
|
)
|
|||||
|
Net balance as of December 31, 2016
|
215,082
|
|
112,642
|
|
327,724
|
|
|||||
|
Additions
(3)
|
3,113
|
|
3,400
|
|
6,513
|
|
|||||
|
Adjustments
(2)
|
2,656
|
|
858
|
|
3,514
|
|
|||||
|
Net balance as of December 31, 2017
|
$
|
220,851
|
|
$
|
116,900
|
|
$
|
337,751
|
|
||
(1) Additions to goodwill as a result of the Aesynt acquisition in January 2016 and Ateb acquisition in December 2016.
(2)
Adjustments reflect foreign currency exchange rate fluctuations.
(3) Additions to goodwill in Automation and Analytics segment was a result of the InPharmics acquisition in April 2017. Additions to goodwill in Medication Adherence segment represent adjustments to the preliminary value assigned to goodwill in connection with Ateb acquisition to reflect measurement period adjustments related to accounts receivable, other non-current assets and other liabilities of
$0.1 million
,
$0.7 million
and
$2.6 million
, respectively.
Intangible assets, net
The carrying amounts of intangible assets and useful lives as of
December 31, 2017
were as follows:
|
December 31, 2017
|
|||||||||||||||||
|
Gross
carrying
amount
|
Accumulated
amortization
|
Foreign currency exchange rate fluctuations
|
Net
carrying
amount
|
Useful life
(years)
|
|||||||||||||
|
(In thousands, except for years)
|
|||||||||||||||||
|
Customer relationships
|
$
|
133,913
|
|
$
|
(33,526
|
)
|
$
|
65
|
|
$
|
100,452
|
|
1 - 30
|
||||
|
Acquired technology
|
74,593
|
|
(21,523
|
)
|
34
|
|
53,104
|
|
3 - 20
|
||||||||
|
Backlog
|
21,712
|
|
(17,544
|
)
|
—
|
|
4,168
|
|
1 - 4
|
||||||||
|
Trade names
|
8,716
|
|
(4,719
|
)
|
6
|
|
4,003
|
|
1 - 12
|
||||||||
|
Patents
|
3,296
|
|
(1,418
|
)
|
2
|
|
1,880
|
|
2 - 20
|
||||||||
|
Non-compete agreements
|
1,900
|
|
(1,300
|
)
|
—
|
|
600
|
|
3
|
||||||||
|
In process technology
|
3,900
|
|
—
|
|
—
|
|
3,900
|
|
-
|
||||||||
|
Total intangibles assets, net
|
$
|
248,030
|
|
$
|
(80,030
|
)
|
$
|
107
|
|
$
|
168,107
|
|
|||||
The carrying amounts of intangible assets and useful lives as of
December 31, 2016
were as follows:
F-24
|
December 31, 2016
|
|||||||||||||||||
|
Gross carrying
amount
|
Accumulated
amortization
|
Foreign currency exchange rate fluctuations
|
Net
carrying
amount
|
Useful life
(years)
|
|||||||||||||
|
(In thousands, except for years)
|
|||||||||||||||||
|
Customer relationships
|
$
|
133,358
|
|
$
|
(20,930
|
)
|
$
|
(596
|
)
|
$
|
111,832
|
|
1 - 30
|
||||
|
Acquired technology
|
73,599
|
|
(13,287
|
)
|
(159
|
)
|
60,153
|
|
3 - 20
|
||||||||
|
Backlog
|
20,550
|
|
(14,083
|
)
|
—
|
|
6,467
|
|
1 - 3
|
||||||||
|
Trade names
|
8,667
|
|
(3,887
|
)
|
(31
|
)
|
4,749
|
|
1 - 12
|
||||||||
|
Patents
|
3,154
|
|
(1,264
|
)
|
—
|
|
1,890
|
|
2 - 20
|
||||||||
|
Non-compete agreements
|
1,900
|
|
(608
|
)
|
—
|
|
1,292
|
|
3
|
||||||||
|
In-process technology
|
3,900
|
|
—
|
|
—
|
|
3,900
|
|
-
|
||||||||
|
Total intangibles assets, net
|
$
|
245,128
|
|
$
|
(54,059
|
)
|
$
|
(786
|
)
|
$
|
190,283
|
|
|||||
Amortization expense of intangible assets was
$25.6 million
,
$36.1 million
and
$6.9 million
for the years ended
December 31, 2017
,
December 31, 2016
and
December 31, 2015
, respectively.
The estimated future amortization expenses for intangible assets are as follows:
|
For the year ended December 31,
|
(In thousands)
|
||
|
2018
|
$
|
23,433
|
|
|
2019
|
17,953
|
|
|
|
2020
|
16,739
|
|
|
|
2021
|
15,439
|
|
|
|
2022
|
13,973
|
|
|
|
Thereafter (excluding in-process technology)
|
76,670
|
|
|
|
Total
|
$
|
164,207
|
|
2016 Senior Secured Credit Facility
On January 5, 2016, the Company entered into a
$400 million
senior secured credit facility pursuant to a credit agreement, by and among the Company, the lenders from time to time party thereto, Wells Fargo Securities, LLC, as Sole Lead Arranger and Wells Fargo Bank, National Association, as administrative agent (the “Credit Agreement”). The Credit Agreement provides for (a) a
five
-year revolving credit facility of
$200 million
, which was subsequently increased pursuant to an amendment discussed below (the “Revolving Credit Facility”) and (b) a
five
-year
$200 million
term loan facility (the “Term Loan Facility” and together with the Revolving Credit Facility, the “Facilities”). In addition, the Credit Agreement includes a letter of credit sub-limit of up to
$10 million
and a swing line loan sub-limit of up to
$10 million
. The Credit Agreement expires on January 5, 2021, upon which date all remaining outstanding borrowings are due and payable.
Loans under the Facilities bear interest, at the Company’s option, at a rate equal to either (a) the LIBOR Rate, plus an applicable margin ranging from
1.50%
to
2.25%
per annum based on the Company’s consolidated total net leverage ratio (as defined in the Credit Agreement), or (b) an alternate base rate equal to the highest of (i) the prime rate, (ii) the federal funds rate plus
0.50%
, and (iii) LIBOR for an interest period of one month, plus an applicable margin ranging from
0.50%
to
1.25%
per annum based on the Company’s consolidated total net leverage ratio (as defined in the 2016 Credit Agreement). Undrawn commitments under the Revolving Credit Facility will be subject to a commitment fee ranging from
0.20%
to
0.35%
per annum based on the Company’s consolidated total net leverage ratio on the average daily unused portion of the Revolving Credit Facility. A letter of credit participation fee ranging from
1.50%
to
2.25%
per annum based on the Company’s consolidated total net leverage ratio will accrue on the average daily amount of letter of credit exposure.
The Company is permitted to make voluntary prepayments at any time without payment of a premium or penalty, except for any amounts relating to the LIBOR breakage indemnity as described in the Credit Agreement. The Company is required to make mandatory prepayments under the Term Loan Facility with (a) net cash proceeds from any issuances of debt (other than certain permitted debt) and (b) net cash proceeds from certain asset dispositions (other than certain asset
F-25
dispositions) and insurance and condemnation events (subject to reinvestment rights and certain other exceptions). Loans under the Term Loan Facility will amortize in quarterly installments, equal to
5%
per annum of the original principal amount thereof during the first two years, which shall increase to
10%
per annum during the third and fourth years, and
15%
per annum during the fifth year, with the remaining balance payable on January 5, 2021. The Company is required to make mandatory prepayments under the Revolving Credit Facility if at any time the aggregate outstanding principal amount of loans together with the total amount of outstanding letters of credit exceeds the aggregate commitments, with such mandatory prepayment to be equal to the amount of such excess.
The Credit Agreement contains customary representations and warranties and customary affirmative and negative covenants applicable to the Company and its subsidiaries, including, among other things, restrictions on indebtedness, liens, investments, mergers, dispositions, dividends and other distributions. The Credit Agreement contains financial covenants that require the Company and its subsidiaries to not exceed a maximum consolidated total leverage ratio and maintain a minimum fixed charge coverage ratio. The Company’s obligations under the Credit Agreement and any swap obligations and banking services obligations owing to a lender (or an affiliate of a lender) are guaranteed by certain of its domestic subsidiaries and secured by substantially all of its and the subsidiary guarantors’ assets. In connection with entering into the Credit Agreement, and as a condition precedent to borrowing loans thereunder, the Company and certain of the Company’s other direct and indirect subsidiaries have entered into certain ancillary agreements, including, but not limited to, a collateral agreement and subsidiary guaranty agreement. The Company was in full compliance with all covenants as of
December 31, 2017
.
On January 5, 2016, the Company borrowed the full
$200 million
under the Term Loan Facility and
$55 million
under the Revolving Credit Facility to complete the Aesynt acquisition and pay related fees and expenses. On December 2, 2016, the Company borrowed an additional
$40 million
under the Revolver Credit Facility to complete the Ateb acquisition and pay related fees and expenses. During the year ended December 31, 2017, the Company borrowed
$59.0 million
under the Revolving Credit Facility to pay for the InPharmics acquisition and fund its operations. As of
December 31, 2017
the Company has repaid
$137.0 million
borrowed under these Facilities which includes
$102.5 million
repaid during the year ended
December 31, 2017
.
On April 11, 2017, the parties entered into the First Amendment to Credit Agreement and Collateral Agreement (the "Amended Credit Agreement"). Under this amendment, (i) the maximum capital expenditures limit in any fiscal year for property, plant and equipment and software development increased from
$35.0 million
to
$45.0 million
, and (ii) the maximum limit for non-permitted investments increased from
$10.0 million
to
$20.0 million
.
On December 26, 2017, the parties entered into another amendment (the "Amendment") to the Amended Credit Agreement. Pursuant to the Amendment, the Revolving Credit Facility provided for under the Amended Credit Agreement, was increased from
$200.0 million
to
$315.0 million
and certain other modifications to the Amended Credit Agreement were made, including amendments to certain negative covenants.
In connection with these Facilities, the Company incurred
$10.1 million
of debt issuance costs which included an additional
$2.1 million
of incurred costs in connection with the Amendment signed in December 2017. The debt issuance costs were capitalized and presented as a direct deduction from the carrying amount of that debt liability. The debt issuance costs are being amortized to interest expense using the straight line method from issuance date through 2021. Interest expense (exclusive of fees and issuance cost amortization) was approximately
$6.3 million
,
$5.3 million
and
zero
for the years ended
December 31, 2017
,
December 31, 2016
and
December 31, 2015
, respectively.
F-26
The components of the Company’s debt obligations as of
December 31, 2017
and
December 31, 2016
are as follows:
|
December 31, 2016
|
Additions/Borrowings
|
Repayment / Amortization
|
December 31, 2017
|
|||||||||
|
(In thousands)
|
||||||||||||
|
Term loan facility
|
$
|
192,500
|
|
$
|
—
|
|
$
|
(10,000
|
)
|
$
|
182,500
|
|
|
Revolving credit facility
|
68,000
|
|
59,000
|
|
(92,500
|
)
|
34,500
|
|
||||
|
Total debt under the facilities
|
260,500
|
|
59,000
|
|
(102,500
|
)
|
217,000
|
|
||||
|
Less: Deferred issuance cost
|
(6,359
|
)
|
(2,106
|
)
|
1,590
|
|
(6,875
|
)
|
||||
|
Total Debt, net of deferred issuance cost
|
$
|
254,141
|
|
$
|
56,894
|
|
$
|
(100,910
|
)
|
$
|
210,125
|
|
|
Long term debt, current portion, net of deferred issuance cost
|
8,410
|
|
15,208
|
|
||||||||
|
Long term debt, net of deferred issuance cost
|
$
|
245,731
|
|
$
|
194,917
|
|
||||||
As of
December 31, 2017
, the carrying amount of debt of
$217.0 million
approximates the comparable fair value of
$220.9 million
. The Company's debt facilities are classified as a Level 3 in the fair value hierarchy. The calculation of the fair value is based on a discounted cash flow model using observable market inputs and taking into consideration variables such as interest rate changes, comparable instruments, and long-term credit ratings.
2013 Credit Agreement
In September 2013, the Company entered into a credit agreement (the "2013 Credit Agreement") with Wells Fargo Bank, National Association, as administrative agent, and the lenders from time to time party thereto. On January 5, 2016, this 2013 Credit Agreement was replaced by the credit facilities discussed above.
Short-term deferred revenue of
$86.1 million
and
$87.5 million
includes deferred revenue from product sales and service contracts, net of deferred cost of sales of
$16.9 million
and
$14.2 million
as of
December 31, 2017
and
December 31, 2016
, respectively. The short-term deferred revenues from product sales relate to the delivered and invoiced products, pending installation and acceptance, expected to occur within the next twelve months.
Long-term deferred revenue includes deferred revenue from the service contracts of $
17.2 million
and $
17.1 million
, as of
December 31, 2017
and
December 31, 2016
, respectively.
Lease commitments
The Company leases office space and office equipment under operating leases. Commitments under operating leases primarily relate to leasehold property and office equipment. Rent expense was
$11.5 million
,
$9.8 million
and
$7.0 million
for the years ended
December 31, 2017
,
December 31, 2016
and
December 31, 2015
, respectively.
The minimum future payments on non-cancelable operating leases are as follows:
|
For the year ended December 31,
|
(In thousands)
|
||
|
2018
|
$
|
12,167
|
|
|
2019
|
11,945
|
|
|
|
2020
|
10,755
|
|
|
|
2021
|
10,471
|
|
|
|
2022
|
8,776
|
|
|
|
Thereafter
|
26,243
|
|
|
|
Total minimum future lease payments
|
$
|
80,357
|
|
Purchase obligations
F-27
In the ordinary course of business, we issue purchase orders based on our current manufacturing needs. As of
December 31, 2017
, the Company had non-cancelable purchase commitments of $
58.1 million
, which are expected to be paid within the next twelve months.
Legal proceedings
The Company is currently involved in various legal proceedings. As required under ASC 450,
Contingencies
, the Company accrues for contingencies when it believes that a loss is probable and that it can reasonably estimate the amount of any such loss. The Company has not recorded any accrual for contingent liabilities associated with the legal proceedings described below based on its belief that any potential loss, while reasonably possible, is not probable. Further, any possible range of loss in these matters cannot be reasonably estimated at this time. The Company believes that it has valid defenses with respect to legal proceedings pending against it. However, litigation is inherently unpredictable, and it is possible that cash flows or results of operations could be materially affected in any particular period by the unfavorable resolution of this contingency or because of the diversion of management's attention and the creation of significant expenses.
On January 10, 2018, a lawsuit was filed against a number of individuals, governmental agencies and corporate entities, including the Company and one of its subsidiaries, Aesynt Incorporated (“Aesynt”), in the Circuit Court for the City of Richmond, Virginia, captioned Ruth Ann Warner, as Guardian of Jonathan James Brewster Warner v. Centra Health, Inc.,
et al.
(Case No. CL18-152-1). The complaint seeks monetary recovery of compensatory and punitive damages in addition to certain declaratory relief based upon, as against the individuals, governmental agencies and corporate entities other than the Company and Aesynt, allegations of the use of excessive force, unlawful detention, false imprisonment, battery, simple and gross negligence and negligent hiring, detention and training and, as against the Company and Aesynt, claims of product liability, negligence and breach of implied warranties. The Company and Aesynt have not yet been served with the complaint. The Company intends to defend the lawsuit vigorously.
Guarantees
As permitted under Delaware law and the Company's certificate of incorporation and bylaws, the Company has agreed to indemnify its directors and officers against certain losses that they may suffer by reason of the fact that such persons are, were or become its directors or officers. The term of the indemnification period is for the director’s or officer’s lifetime and there is no limit on the potential amount of future payments that the Company could be required to make under these indemnification agreements. The Company has purchased a directors’ and officers’ liability insurance policy that may enable it to recover a portion of any future payments that it may be required to make under these indemnification agreements. Assuming the applicability of coverage and the willingness of the insurer to assume coverage and subject to certain retention, loss limits and other policy provisions, the Company believes it is unlikely that the Company will be required to pay any material amounts pursuant to these indemnification obligations. However, no assurances can be given that the insurers will not attempt to dispute the validity, applicability or amount of coverage without expensive and time-consuming litigation against the insurers.
Additionally, the Company undertakes indemnification obligations in its ordinary course of business in connection with, among other things, the licensing of its products and the provision of its support services. In the ordinary course of the Company's business, the Company has in the past and may in the future agree to indemnify another party, generally its business affiliates or customers, against certain losses suffered or incurred by the indemnified party in connection with various types of claims, which may include, without limitation, claims of intellectual property infringement, certain tax liabilities, its gross negligence or intentional acts in the performance of support services and violations of laws. The term of these indemnification obligations is generally perpetual. In general, the Company attempts to limit the maximum potential amount of future payments that it may be required to make under these indemnification obligations to the amounts paid to it by a customer, but in some cases the obligation may not be so limited. In addition, the Company has in the past and may in the future warrant to its customers that its products will conform to functional specifications for a limited period of time following the date of installation (generally not exceeding
30
days) or that its software media is free from material defects. Sales contracts for certain of the Company's medication packaging systems often include limited warranties for up to
six
months, but the periodic activity and ending warranty balances the Company records have historically been immaterial.
From time to time, the Company may also warrant that its professional services will be performed in a good and workmanlike manner or in a professional manner consistent with industry standards. The Company generally seeks to disclaim most warranties, including any implied or statutory warranties such as warranties of merchantability, fitness for a particular purpose, title, quality and non-infringement, as well as any liability with respect to incidental, consequential, special, exemplary, punitive or similar damages. In some states, such disclaimers may not be enforceable. If necessary, the Company would provide for the estimated cost of product and service warranties based on specific warranty claims and claim history. The Company has not been subject to any significant claims for such losses and has not incurred any material costs in defending or settling claims related to these indemnification obligations. Accordingly, the Company believes it is unlikely that the Company will be required to pay any material amounts pursuant to these indemnification obligations or potential warranty claims and,
F-28
therefore, no material liabilities have been recorded for such indemnification obligations as of
December 31, 2017
and
December 31, 2016
.
Stock purchase plan
1997 Employee Stock Purchase Plan
The Company has an Employee Stock Purchase Plan ("ESPP"), under which employees can purchase shares of its common stock based on a percentage of their compensation, but not greater than
15%
of their earnings; provided, however, an eligible employee's right to purchase shares of the Company's common stock may not accrue at a rate which exceeds
$25,000
of the fair market value of such shares for each calendar year in which such rights are outstanding. The purchase price per share must be equal to the lower of
85%
of the fair value of the common stock at the beginning of a
24
-month offering period or the end of each
six
-month purchasing period.
There was a total of
2.4 million
shares reserved for future issuance under the ESPP as of
December 31, 2017
.
Stock award plans
2009 Equity Incentive Plan
The 2009 Equity Incentive Plan (“2009 Plan”), as amended, provides for the issuance of incentive stock options, restricted stock awards ("RSAs"), restricted stock unit awards ("RSUs"), performance stock unit awards ("PSUs"), and other stock awards to the Company's employees, directors and consultants. There were
5.5 million
shares of common stock reserved for future issuance under the 2009 Plan as of
December 31, 2017
.
Options granted under the 2009 Plan become exercisable over periods of up to
four years
, with one-fourth of the shares vesting
one year
from the vesting commencement date with respect to initial grants, and the remaining shares vesting in
36
equal monthly installments thereafter. The exercise prices of the options is the fair market value of common stock on the date of grant. RSUs generally vest over periods of up to
four years
, with one-fourth of the shares vesting
one year
from the vesting commencement date with respect to initial grants, and the remaining shares vesting in
12
equal quarterly installments thereafter. Awards of restricted stock to non-employee directors are granted on the date of the annual meeting of stockholders and vest in full on the date of the next annual meeting of stockholders, provided such non-employee director remains a director on such date. The fair value of the awards on the date of issuance is amortized to expense from the date of grant to the date of vesting and are expensed ratably on a straight-line basis over the vesting period. PSUs granted to the Company’s executives might include performance and market conditions. PSUs become eligible for vesting when certain market or performance conditions are met.
Share-based compensation expense
The following table sets forth the total share-based compensation expense recognized in the Company's Consolidated Statements of Operations:
|
Year Ended December 31,
|
|||||||||||
|
2017
|
2016
|
2015
|
|||||||||
|
(In thousands)
|
|||||||||||
|
Cost of product and service revenues
|
$
|
3,478
|
|
$
|
2,596
|
|
$
|
2,111
|
|
||
|
Research and development
|
3,590
|
|
3,128
|
|
2,060
|
|
|||||
|
Selling, general and administrative
|
14,789
|
|
13,776
|
|
10,750
|
|
|||||
|
Total share-based compensation expense
|
$
|
21,857
|
|
$
|
19,500
|
|
$
|
14,921
|
|
||
The Company did not capitalize any share-based compensation as inventory as such amounts were not material for the years ended
December 31, 2017
,
December 31, 2016
and
December 31, 2015
. Income tax benefits realized from share-based compensation were
$8.2 million
,
$5.4 million
and
$5.0 million
, for the years ended
December 31, 2017
,
December 31, 2016
and
December 31, 2015
, respectively.
F-29
Stock Options and ESPP Shares
The following assumptions were used to value share options and ESPP shares granted pursuant to our equity incentive
plans:
|
Year Ended December 31,
|
||||||||
|
2017
|
2016
|
2015
|
||||||
|
Stock Option Plans
|
||||||||
|
Risk-free interest rate
|
1.9
|
%
|
1.5
|
%
|
1.7
|
%
|
||
|
Dividend yield
|
—
|
%
|
—
|
%
|
—
|
%
|
||
|
Expected volatility
|
29.6
|
%
|
30.6
|
%
|
32.0
|
%
|
||
|
Expected life (in years)
|
4.7 years
|
|
4.9 years
|
|
5.0 years
|
|
||
|
Year Ended December 31,
|
||||||||
|
2017
|
2016
|
2015
|
||||||
|
Employee Stock Purchase Plan
|
||||||||
|
Risk-free interest rate
|
0.52% - 1.39%
|
|
0.34% - 0.79%
|
|
0.03% - 0.79%
|
|
||
|
Dividend yield
|
—
|
%
|
—
|
%
|
—
|
%
|
||
|
Expected volatility
|
25.8% - 32.8%
|
|
25.8% - 34.8%
|
|
25.7% - 37.5%
|
|
||
|
Expected life (in years)
|
0.5 - 2.0
|
|
0.5 - 2.0
|
|
0.5 - 2.0
|
|
||
Stock options activity
A summary of the stock option activity under the 2009 Plan is presented below:
|
Number of
Shares
|
Weighted-Average
Exercise Price
|
Weighted-Average
Remaining Years
|
Aggregate
Intrinsic Value
|
|||||||||
|
(In thousands, except per share data)
|
||||||||||||
|
Outstanding at December 31, 2016
|
3,214
|
|
$
|
26.06
|
|
7.3
|
$
|
26,331
|
|
|||
|
Granted (Awarded)
|
1,045
|
|
$
|
45.13
|
|
|||||||
|
Exercised (Released)
|
(813
|
)
|
$
|
22.28
|
|
|||||||
|
Expired
|
(6
|
)
|
$
|
27.54
|
|
|||||||
|
Forfeited
|
(117
|
)
|
$
|
33.39
|
|
|||||||
|
Outstanding at December 31, 2017
|
3,323
|
|
32.72
|
|
7.6
|
$
|
53,953
|
|
||||
|
Exercisable at December 31, 2017
|
1,350
|
|
23.87
|
|
5.8
|
33,293
|
|
|||||
|
Vested and expected to vest at December 31, 2017 and thereafter
|
3,323
|
|
32.72
|
|
7.6
|
$
|
53,953
|
|
||||
The weighted-average fair value per share of options granted during
2017
,
2016
and
2015
was
$13.25
,
$9.33
and
$9.67
, respectively. The intrinsic value of options exercised during
2017
,
2016
and
2015
was
$18.2 million
,
$5.6 million
and
$11.3 million
, respectively.
As of
December 31, 2017
, total unrecognized compensation cost related to unvested stock options was
$18.9 million
, which is expected to be recognized over a weighted-average vesting period of
2.9 years
. As of
December 31, 2016
, total unrecognized compensation cost related to unvested stock options was
$13.3 million
, which is expected to be recognized over a weighted-average vesting period of
3.0 years
.
Employee Stock Purchase Plan activity
For the year ended
December 31, 2017
, employees purchased
0.5 million
shares of common stock under the ESPP and an aggregate of
6.0 million
shares were issued under the ESPP as of
December 31, 2017
.
F-30
The unrecognized compensation cost related to the shares to be purchased under the ESPP was approximately
$0.9 million
, and is expected to be recognized over a weighted-average period of
1.3 years
as of
December 31, 2017
.
Restricted Stock Units and Restricted Stock Awards
Summaries of the restricted stock activity under the 2009 Plan are presented below:
|
Number of
Shares
|
Weighted-Average
Grant Date Fair Value
|
Weighted-Average
Remaining Years
|
Aggregate
Intrinsic Value
|
|||||||||
|
(In thousands, except per share data)
|
||||||||||||
|
Restricted Stock Units
|
||||||||||||
|
Non-vested at December 31, 2016
|
505
|
|
$
|
31.42
|
|
1.6
|
$
|
17,135
|
|
|||
|
Granted (Awarded)
|
245
|
|
45.97
|
|
||||||||
|
Vested (Released)
|
(215
|
)
|
30.41
|
|
||||||||
|
Forfeited
|
(34
|
)
|
32.39
|
|
||||||||
|
Non-vested at December 31, 2017
|
501
|
|
38.90
|
|
1.5
|
$
|
24,293
|
|
||||
The weighted-average grant date fair value per share of RSUs granted during
2017
,
2016
and
2015
was
$45.97
,
$32.58
and
$31.44
, respectively. The total fair value of RSUs that vested in
2017
,
2016
and
2015
was
$6.5 million
,
$4.8 million
and
$4.7 million
, respectively.
As of
December 31, 2017
, total unrecognized compensation cost related to RSUs was
$16.1 million
, which is expected to be recognized over the remaining weighted-average vesting period of
2.7 years
. As of
December 31, 2016
, total unrecognized compensation cost related to RSUs was
$12.8 million
, which is expected to be recognized over the remaining weighted-average vesting period of
2.9
years.
|
Number of
Shares
|
Weighted-Average
Grant Date Fair Value
|
|||||
|
(In thousands, except per share data)
|
||||||
|
Restricted Stock Awards
|
||||||
|
Non-vested at December 31, 2016
|
30
|
|
$
|
31.57
|
|
|
|
Granted (Awarded)
|
23
|
|
41.10
|
|
||
|
Vested (Released)
|
(30
|
)
|
31.58
|
|
||
|
Non-vested at December 31, 2017
|
23
|
|
$
|
41.07
|
|
|
The weighted-average grant date fair value per share of RSAs granted during
2017
,
2016
and
2015
was
$41.10
,
$31.59
and
$36.05
, respectively. The total fair value of RSAs that vested in
2017
,
2016
and
2015
was
$1.0 million
,
$1.2 million
and
$1.1 million
, respectively.
As of
December 31, 2017
, total unrecognized compensation cost related to RSAs was
$0.3 million
, which is expected to be recognized over the remaining weighted-average vesting period of
0.4
years. As of
December 31, 2016
, total unrecognized compensation cost related to RSAs was
$0.4 million
, which was expected to be recognized over the remaining weighted-average vesting period of
0.4 years
.
Performance-based Restricted Stock Units
In 2011, the Company began incorporating performance-based restricted stock units ("PSUs") as an element of its executive compensation plans. In 2016, the Company granted
122,740
PSUs to its executive officers, all of which became eligible for vesting upon the achievement of a certain level of shareholder return. In 2017, the Company granted
147,830
PSUs to its executive officers, all, none or a portion of which may become eligible for vesting depending on the level of shareholder return for the period from March 1, 2017 through March 1, 2018.
The fair value of a PSU award is determined using a Monte Carlo simulation model. The number of shares that vest at the end of the performance period depends on the percentile ranking of the total shareholder return for Omnicell stock over the performance period relative to the total shareholder return of each of the other companies in the NASDAQ Healthcare Index (the "Index").
F-31
For PSUs granted on February 8, 2017, stock price appreciation is calculated based on the trailing
20
-day average stock price just prior to the first trading day of March 2017, compared to the trailing
20
-day average stock price just prior to the first trading day of March 2018. For PSUs granted on February 4, 2016, stock price appreciation is calculated based on the trailing
20
-day average stock price just prior to the first trading day of March 2016, compared to the trailing
20
-day average stock price just prior to the first trading day of March 2017.
On March 7, 2016, the Compensation Committee confirmed
66.0%
as the percentile rank of the Company's 2016 total stockholder return. This resulted in
100%
of the 2015 PSUs, or
60,000
shares, as eligible for further time-based vesting. The eligible PSUs will vest as follows:
25%
of the eligible shares vested immediately on March 7, 2016 with the remaining eligible awards vesting in equal increments, semi-annually, over the subsequent
three
-year period beginning on June 15th and December 15th of the year after the date of grant and each subsequent year. Vesting is contingent upon continued service. Of the
60,000
shares eligible for time-based vesting under the 2015 PSUs,
45,000
shares have vested as of
December 31, 2017
.
On March 7, 2017, the Compensation Committee confirmed
71.5%
as the percentile rank of the Company's 2017 total stockholder return. This resulted in
100%
of the 2016 PSUs, or
122,740
shares, as eligible for further time-based vesting. The eligible PSUs will vest as follows:
25%
of the shares vested immediately on March 7, 2017 with the remaining shares vesting on a semi-annual basis period of
36
months commencing on June 15, 2017. Vesting is contingent upon continued service. Of the
122,740
shares eligible for time-based vesting under the 2016 PSUs,
61,375
shares have vested as of
December 31, 2017
.
A summary of the performance-based restricted stock activity under the 2009 Plan is presented below:
|
Number of
Shares
|
Weighted-Average
Grant Date Fair Value Per Unit
|
|||||
|
(In thousands, except per share data)
|
||||||
|
Non-vested at December 31, 2016
|
184
|
|
$
|
24.89
|
|
|
|
Granted (Awarded)
|
148
|
|
34.05
|
|
||
|
Vested (Released)
|
(107
|
)
|
24.36
|
|
||
|
Non-vested at December 31, 2017
|
225
|
|
$
|
31.18
|
|
|
The weighted-average grant date fair value per share of PSUs granted during
2017
,
2016
and
2015
was
$34.05
,
$24.66
and
$29.56
, respectively. The total fair value of PSUs that vested in
2017
,
2016
and
2015
was
$2.6 million
,
$2.0 million
and
$1.9 million
, respectively.
As of
December 31, 2017
, total unrecognized compensation cost related to PSUs was approximately
$2.7 million
, which is expected to be recognized over the remaining weighted-average period of
1.2
years. As of
December 31, 2016
, total unrecognized compensation cost related to PSUs was approximately
$1.6 million
, which was expected to be recognized over the remaining weighted-average period of
1.2
years.
Summary of Shares Reserved for Future Issuance under Equity Incentive Plans
The Company had the following ordinary shares reserved for future issuance under its equity incentive plans as of
December 31, 2017
:
|
Number of Shares
|
|||
|
(In thousands)
|
|||
|
Share options outstanding
|
3,323
|
|
|
|
Non-vested restricted stock awards
|
749
|
|
|
|
Shares authorized for future issuance
|
1,398
|
|
|
|
ESPP shares available for future issuance
|
2,365
|
|
|
|
Total shares reserved for future issuance
|
7,835
|
|
|
401(k) Plan
The Company has established a pre-tax savings plan under Section 401(k) of the Internal Revenue Code. The 401(k) Plan allows eligible employees in the United States to voluntarily contribute a portion of their pre-tax salary, subject to a maximum limit specified in the Internal Revenue Code. The Company matches
50%
of employee contributions up to
$2,500
,
F-32
annually. The Company's contributions under this plan were
$3.8 million
,
$1.9 million
and
$1.8 million
in
2017
,
2016
and
2015
, respectively.
On August 2, 2016, the Board of Directors (the "Board") of the Company authorized a stock repurchase program providing for the repurchase of up to
$50.0 million
of the Company’s common stock (the “2016 Repurchase Program”). The 2016 Repurchase Program is in addition to the stock repurchase program approved by the Board on November 4, 2014 (the “2014 Repurchase Program”). As of December 31, 2017, the maximum dollar value of shares that may yet be purchased under the two repurchase programs was
$54.9 million
.
The timing, price and volume of repurchases are to be based on market conditions, relevant securities laws and other factors. The stock repurchases may be made from time to time on the open market, in privately negotiated transactions or pursuant to a Rule 10b-18 plan, subject to the terms and conditions of that certain Amendment of the Amended Credit Agreement, dated as of December 26, 2017, among the Company, the Lenders party thereto, and Wells Fargo Bank, National Association, as administrative agent. The stock repurchase program does not obligate the Company to repurchase any specific number of shares, and the Company may terminate or suspend the repurchase program at any time. During the years ended
December 31, 2017
and
2016
, respectively, the Company made
no
repurchases of its outstanding common stock. During the year ended December 31, 2015, the Company repurchased approximately
$50.0 million
of shares.
On November 3, 2017, the Company entered into a Distribution Agreement (the “Distribution Agreement”) with J.P. Morgan Securities LLC, Wells Fargo Securities, LLC and HSBC Securities (USA) Inc., as its sales agents, pursuant to which the Company may offer and sell from time to time through the sales agents up to
$125 million
maximum aggregate offering price of the Company’s common stock. Sales of the common stock pursuant to the Distribution Agreement may be made in negotiated transactions or transactions that are deemed to be “at the market” offerings as defined in Rule 415 under the Securities Act, including sales made directly on the Nasdaq Stock Market, or sales made to or through a market maker other than on an exchange.
For the year ended December 31, 2017, the Company received gross proceeds of
$14.7 million
from sales of its common stock under the Distribution Agreement and incurred issuance costs of
$0.8 million
on sales of approximately
294,000
shares of its common stock at an average price of approximately
$49.85
per share.
Segment Information
The Company's Chief Operating Decision Maker ("CODM") is its Chief Executive Officer. The CODM allocates resources and evaluates the performance of the Company's segments using information about its revenues, gross profit, and income from operations. Such evaluation excludes general corporate-level costs that are not specific to either of the reportable segments and are managed separately at the corporate level. Corporate-level costs include expenses related to executive management, finance and accounting, human resources, legal, training and development, and certain administrative expenses. The
two
operating segments, which are the same as the Company's two reportable segments, are as follows:
Automation and Analytics
The Automation and Analytics segment is organized around the design, manufacturing, selling and servicing of medication and supply dispensing systems, pharmacy inventory management systems, and related software. The Automation and Analytics products are designed to enable the Company's customers to enhance and improve the effectiveness of the medication-use process, the efficiency of the medical-surgical supply chain, overall patient care and clinical and financial outcomes of medical facilities. Through modular configuration and upgrades, the Company's systems can be tailored to specific customer needs. The financial results of InPharmics acquired in the second quarter of 2017 and Aesynt acquired in the first quarter of 2016 are included in the Automation and Analytics segment.
Medication Adherence
The Medication Adherence segment includes solutions to assist patients to remain adherent to their medication regimens. These solutions are comprised of a variety of tools and aids that may be directly used by a pharmacist or a healthcare provider in their direct care for a patient, or the patient themselves, and include software based systems and medication adherence packaging. Software solutions primarily operate on the Patient Management Access Portal (PMAP), a subscription based software system which provides an environment for patient engagement by clinicians. Services running on PMAP include Time My Meds medication synchronization, immunization management, and a number of tools used by clinicians to manage patient engagement workflows. Medication Adherence packaging is designed either for patient use in care environments where there is a caregiver
F-33
present or for environments where the patient cares for him or herself and includes the manufacturing and selling of consumable medication blister cards, packaging equipment and ancillary products and services. The financial results of Ateb acquired in the fourth quarter of 2016 are included in the Medication Adherence segment.
The following table summarizes the financial performance of the Company's reporting segments:
_________________________________________________
|
Year Ended December 31,
|
|||||||||||||||||||||||||||||||||||
|
2017
|
2016
|
2015
|
|||||||||||||||||||||||||||||||||
|
Automation and
Analytics
|
Medication
Adherence |
Total
|
Automation and
Analytics
|
Medication
Adherence
|
Total
|
Automation and
Analytics
|
Medication
Adherence
|
Total
|
|||||||||||||||||||||||||||
|
(In thousands)
|
|||||||||||||||||||||||||||||||||||
|
Revenues
|
$
|
590,392
|
|
$
|
125,773
|
|
$
|
716,165
|
|
$
|
593,626
|
|
$
|
98,997
|
|
$
|
692,623
|
|
$
|
390,321
|
|
$
|
94,238
|
|
$
|
484,559
|
|
||||||||
|
Cost of revenues
|
308,443
|
|
85,634
|
|
394,077
|
|
310,967
|
|
67,856
|
|
378,823
|
|
171,943
|
|
64,686
|
|
236,629
|
|
|||||||||||||||||
|
Gross profit
|
281,949
|
|
40,139
|
|
322,088
|
|
282,659
|
|
31,141
|
|
313,800
|
|
218,378
|
|
29,552
|
|
247,930
|
|
|||||||||||||||||
|
Operating expenses
|
193,700
|
|
41,735
|
|
235,435
|
|
198,511
|
|
24,843
|
|
223,354
|
|
114,084
|
|
24,258
|
|
138,342
|
|
|||||||||||||||||
|
Income from operations
|
$
|
88,249
|
|
$
|
(1,596
|
)
|
86,653
|
|
$
|
84,148
|
|
$
|
6,298
|
|
90,446
|
|
$
|
104,294
|
|
$
|
5,294
|
|
109,588
|
|
|||||||||||
|
Corporate costs
|
80,899
|
|
83,965
|
|
60,956
|
|
|||||||||||||||||||||||||||||
|
Income from operations
|
$
|
5,754
|
|
$
|
6,481
|
|
$
|
48,632
|
|
||||||||||||||||||||||||||
Significant customers
The Company contracts with Group Purchasing Organizations (“GPOs”), each of which functions as a purchasing agent on behalf of member hospitals and other healthcare providers, as well as with government entities and agencies. Pursuant to the terms of GPO agreements, each member contracts directly with Omnicell and can purchase Company’s product at pre-negotiated contract terms and pricing. The account receivable balances are with individual members of the GPOs, and therefore no significant concentration of credit risk exists. During our fiscal year ended December 31, 2017, December 31, 2016 and December 31, 2015 sales to members of the ten largest GPOs accounted for approximately
51.2%
,
51.2%
and
65.2%
of total consolidated revenue, respectively. There were
no
customers that accounted for more than 10% of the Company's total revenues or accounts receivable balance at and for the years ended December 31, 2017, December 31, 2016 and December 31, 2015.
Geographical Information
Revenues
|
Year Ended December 31,
|
|||||||||||
|
2017
|
2016
|
2015
|
|||||||||
|
(In thousands)
|
|||||||||||
|
United States
|
$
|
617,268
|
|
$
|
591,566
|
|
$
|
403,375
|
|
||
|
Rest of world
(1)
|
98,897
|
|
101,057
|
|
81,184
|
|
|||||
|
Total revenues
|
$
|
716,165
|
|
$
|
692,623
|
|
$
|
484,559
|
|
||
(1)
No individual country represented more than 10% of the respective totals.
Property and equipment, net
Property and equipment, net is attributed to the geographic location in which it is located.
F-34
|
Year Ended December 31,
|
|||||||||||
|
2017
|
2016
|
2015
|
|||||||||
|
(In thousands)
|
|||||||||||
|
United States
|
$
|
34,899
|
|
$
|
36,497
|
|
$
|
29,506
|
|
||
|
Rest of world
(1)
|
7,696
|
|
5,514
|
|
2,803
|
|
|||||
|
Total property and equipment, net
|
$
|
42,595
|
|
$
|
42,011
|
|
$
|
32,309
|
|
||
(1)
No individual country represented more than 10% of the respective totals.
The following is a geographical breakdown of income (loss) before the provision for (benefit from) income taxes:
|
Year Ended December 31,
|
|||||||||||
|
2017
|
2016
|
2015
|
|||||||||
|
(In thousands)
|
|||||||||||
|
Domestic
|
$
|
19,889
|
|
$
|
1,471
|
|
$
|
51,089
|
|
||
|
Foreign
|
(20,768
|
)
|
(3,419
|
)
|
(4,845
|
)
|
|||||
|
Income (loss) before provision for (benefit from) income taxes
|
$
|
(879
|
)
|
$
|
(1,948
|
)
|
$
|
46,244
|
|
||
The provision for (benefit from) income taxes consists of the following:
|
Year Ended December 31,
|
|||||||||||
|
2017
|
2016
|
2015
|
|||||||||
|
(In thousands)
|
|||||||||||
|
Current:
|
|||||||||||
|
Federal
|
$
|
2,430
|
|
$
|
6,724
|
|
$
|
13,840
|
|
||
|
State
|
1,852
|
|
1,323
|
|
2,475
|
|
|||||
|
Foreign
|
745
|
|
46
|
|
203
|
|
|||||
|
Total current income taxes
|
5,027
|
|
8,093
|
|
16,518
|
|
|||||
|
Deferred:
|
|||||||||||
|
Federal
|
(16,118
|
)
|
(3,378
|
)
|
846
|
|
|||||
|
State
|
(2,612
|
)
|
(1,802
|
)
|
(379
|
)
|
|||||
|
Foreign
|
(7,781
|
)
|
(5,464
|
)
|
(1,501
|
)
|
|||||
|
Total deferred income taxes
|
(26,511
|
)
|
(10,644
|
)
|
(1,034
|
)
|
|||||
|
Total provision for (benefit from) income taxes
|
$
|
(21,484
|
)
|
$
|
(2,551
|
)
|
$
|
15,484
|
|
||
F-35
The provision for (benefit from) income taxes differs from the amount computed by applying the statutory federal tax rate as follows:
|
Year Ended December 31,
|
|||||||||||
|
2017
|
2016
|
2015
|
|||||||||
|
(In thousands)
|
|||||||||||
|
U.S. federal tax provision at statutory rate
|
$
|
(308
|
)
|
$
|
(682
|
)
|
$
|
16,181
|
|
||
|
State taxes
|
19
|
|
(311
|
)
|
1,365
|
|
|||||
|
Non-deductible expenses
|
1,373
|
|
1,212
|
|
551
|
|
|||||
|
Acquisition costs
|
—
|
|
845
|
|
239
|
|
|||||
|
Share-based compensation expense
|
39
|
|
1,941
|
|
748
|
|
|||||
|
Research tax credits
|
(3,233
|
)
|
(2,075
|
)
|
(1,324
|
)
|
|||||
|
Domestic production deduction
|
(621
|
)
|
(890
|
)
|
(1,133
|
)
|
|||||
|
Gain on investment
|
—
|
|
—
|
|
(1,205
|
)
|
|||||
|
Tax audit settlement
|
—
|
|
(2,499
|
)
|
—
|
|
|||||
|
Foreign rate differential
|
938
|
|
(154
|
)
|
123
|
|
|||||
|
Stock option tax benefit
|
(5,926
|
)
|
—
|
|
—
|
|
|||||
|
One-time Impact of the Tax Act
|
(13,391
|
)
|
—
|
|
—
|
|
|||||
|
Other
|
(374
|
)
|
62
|
|
(61
|
)
|
|||||
|
Total provision for (benefit from) income taxes
|
$
|
(21,484
|
)
|
$
|
(2,551
|
)
|
$
|
15,484
|
|
||
Significant components of the Company's deferred tax assets (liabilities) are as follows:
|
December 31,
2017 |
December 31,
2016 |
||||||
|
(In thousands)
|
|||||||
|
Deferred tax assets (liabilities):
|
|||||||
|
Deferred revenue
|
$
|
6,345
|
|
$
|
5,857
|
|
|
|
Stock compensation
|
4,460
|
|
6,451
|
|
|||
|
Inventory related items
|
2,441
|
|
2,915
|
|
|||
|
Tax credit carry forwards
|
9,349
|
|
4,871
|
|
|||
|
Reserves and accruals
|
3,960
|
|
4,675
|
|
|||
|
Loss carry forwards
|
8,643
|
|
8,077
|
|
|||
|
Other, net
|
1,307
|
|
847
|
|
|||
|
Total net deferred tax assets
|
36,505
|
|
33,693
|
|
|||
|
Intangibles
|
(36,780
|
)
|
(57,427
|
)
|
|||
|
Depreciation and amortization
|
(14,338
|
)
|
(20,071
|
)
|
|||
|
Prepaid expenses
|
(4,512
|
)
|
(3,746
|
)
|
|||
|
Total deferred tax liabilities
|
(55,630
|
)
|
(81,244
|
)
|
|||
|
|
|||||||
|
Net deferred tax liabilities
|
$
|
(19,125
|
)
|
$
|
(47,551
|
)
|
|
Deferred income tax assets (liabilities) are provided for temporary differences that will result in future tax deductions or future taxable income, as well as the future benefit of tax credit carry forwards. The Company recognizes deferred tax assets to the extent that it believes these assets are more likely than not to be realized. In making such a determination, the Company considers all available positive and negative evidence, including future reversals of existing temporary differences, projected future taxable income, tax planning strategies, and results of recent operations. On the basis of this evaluation, as of
December 31, 2017
,
no
valuation allowances have been recorded in any jurisdiction.
F-36
On December 22, 2017, the U.S. government enacted comprehensive tax legislation commonly referred to as the Tax Cuts and Jobs Act (the “Tax Act”). The Tax Act significantly impacts the future ongoing U.S. corporate income tax by, among things, lowering the U.S. corporate income tax rates and implementing a territorial tax system. At December 31, 2017, the Company has not completed the accounting for the tax effects of enactment of the Tax Act; however, the Company made a reasonable estimate of the effects on the existing deferred tax balances and the one-time transition tax. The reduction of the U.S. corporate tax rate required the Company to revalue the U.S. deferred tax assets and liabilities to the newly enacted federal rate of 21%. This resulted in a one-time benefit of
$13.4 million
in the fourth quarter of 2017. As part of the transition to the new territorial tax system, the Tax Act imposes a one-time tax on a deemed repatriation of historical earnings of foreign subsidiaries. Based on the current evaluation of the Company’s operations, no repatriation tax charge is anticipated as the Company is in an earnings deficit position for foreign subsidiaries. The Company will continue to assess the provision for income taxes as future guidance is issued, but does not currently anticipate significant revisions will be necessary. Any such revisions will be treated in accordance with the measurement period guidance outlined in Staff Accounting Bulletin No. 118.
As of
December 31, 2017
, the Company has
$6.6 million
of federal net operating loss carryforwards expiring 2038 and
$6.1 million
of state net operating loss carryforwards expiring at various dates beginning 2023. For income tax purposes, the Company has federal and California research tax credits carryforwards of
$2.4 million
and
$8.8 million
, respectively. Federal research tax credit carry forwards from prior years will begin to expire in 2035. California credits are available indefinitely to reduce cash taxes otherwise payable.
It is the Company's practice and intention to reinvest the earnings of its non-U.S. subsidiaries in those operations. As of
December 31, 2017
, the Company has not made a provision for U.S. federal income, withholding, and state income taxes on the outside basis difference related to certain foreign subsidiaries because earnings are intended to be indefinitely reinvested in operations outside the U.S. At December 31, 2017, the Company has not completed the accounting for the tax effects resulting from the enactment of the Act; however, the Company made a reasonable estimate of the effects. The Company is continuing to evaluate its plans for reinvestment under the Act, including its plans for reinvestment or repatriation of unremitted foreign earnings. Any revisions will be treated in accordance with the measurement period guidance outlined in Staff Accounting Bulletin No. 118.
The Company files income tax returns in the United States and various states and foreign jurisdictions. In the normal course of business, the Company is subject to examination by taxing authorities, including major jurisdictions such as the United States, Germany, Italy, Netherlands and the United Kingdom. With few exceptions, as of December 31, 2017, the Company was no longer subject to U.S., state, and foreign examination for years before 2014, 2013, and 2014, respectively.
F-37
The aggregate change in the balance of gross unrecognized tax benefits, which excludes interest and penalties, for the three years ended
December 31, 2017
is as follows:
|
(In thousands)
|
|||
|
Year Ended December 31, 2014
|
$
|
8,485
|
|
|
Increases related to tax positions taken during a prior period
|
37
|
|
|
|
Decreases related to tax positions taken during the prior period
|
(895
|
)
|
|
|
Increases related to tax positions taken during the current period
|
1,807
|
|
|
|
Decreases related to settlements
|
—
|
|
|
|
Decreases related to expiration of statute of limitations
|
(284
|
)
|
|
|
Year Ended December 31, 2015
|
9,150
|
|
|
|
Increases related to tax positions taken during a prior period
|
244
|
|
|
|
Decreases related to tax positions taken during the prior period
|
(1,980
|
)
|
|
|
Increases related to tax positions taken during the current period
|
6,724
|
|
|
|
Decreases related to settlements
|
(2,178
|
)
|
|
|
Decreases related to expiration of statute of limitations
|
(344
|
)
|
|
|
Year Ended December 31, 2016
|
11,616
|
|
|
|
Increases related to tax positions taken during a prior period
|
503
|
|
|
|
Decreases related to tax positions taken during the prior period
|
(1,782
|
)
|
|
|
Increases related to tax positions taken during the current period
|
805
|
|
|
|
Decreases related to settlements
|
—
|
|
|
|
Decreases related to expiration of statute of limitations
|
(401
|
)
|
|
|
Year Ended December 31, 2017
|
$
|
10,741
|
|
As of
December 31, 2017
the total amount of gross unrecognized tax benefits, if realized, would decrease the Company's tax expense by approximately
$10.7 million
. The Company recognizes interest and/or penalties related to uncertain tax positions in operating expenses accruing
$0.3 million
,
$0.5 million
, and
$0.1 million
for fiscal years 2017, 2016, and 2015 respectively. Accrued interest and penalties are included within other long-term liabilities on the consolidated balance sheets. The combined amount of cumulative accrued interest and penalties was approximately
$1.4 million
,
$1.1 million
, and
$0.6 million
as of fiscal years 2017, 2016, and 2015 respectively. The Company does not believe there will be any significant changes in its unrecognized tax positions over the next twelve months.
F-38
On February 15, 2017, the Company announced its plan to reduce its workforce by approximately
100
full-time employees and close the Company’s Nashville, Tennessee and Slovenia facilities, which was concluded in fiscal year 2017. The total cost for the plan was
$4.2 million
, which includes employee severance cost of approximately
$3.7 million
, and facility-related costs of approximately
$0.6 million
. At December 31, 2017 the unpaid balance under this plan is
$0.4 million
related to facilities-related expenses.
In the second quarter of 2016, the Company integrated its sales and field organizations in North America to better serve its customers which resulted in a reduction in headcount of
36
employees. Accordingly, the Company incurred approximately
$1.7 million
of restructuring expenses in the year ended
December 31, 2016
, based on agreements with terminated employees covering salary and benefit continuation. For the year ended
December 31, 2016
, the Company made payments of
$1.7 million
and the restructuring program was concluded.
F-39
SCHEDULE II
VALUATION AND QUALIFYING ACCOUNTS
|
Additions
|
|||||||||||||||||||||||
|
|
Balance at
Beginning of Period (1) |
Charged to
Costs and Expenses (2) |
Debited (credited) to
Other Accounts
(3)
|
Amount
Written Off
(4)
|
Acquisition and translation adjustments
(5)
|
Balance at
End of Period (1) |
|||||||||||||||||
|
(In thousands)
|
|||||||||||||||||||||||
|
Year ended December 31, 2015
|
|||||||||||||||||||||||
|
Accounts receivable
|
$
|
1,206
|
|
$
|
453
|
|
$
|
28
|
|
$
|
(447
|
)
|
$
|
—
|
|
$
|
1,240
|
|
|||||
|
Investment in sales-type leases
|
162
|
|
(99
|
)
|
106
|
|
—
|
|
—
|
|
169
|
|
|||||||||||
|
Total allowances deducted from assets
|
$
|
1,368
|
|
$
|
354
|
|
$
|
134
|
|
$
|
(447
|
)
|
$
|
—
|
|
$
|
1,409
|
|
|||||
|
Year ended December 31, 2016
|
|||||||||||||||||||||||
|
Accounts receivable
|
$
|
1,240
|
|
$
|
727
|
|
$
|
77
|
|
$
|
(369
|
)
|
$
|
3,121
|
|
$
|
4,796
|
|
|||||
|
Investment in sales-type leases
|
169
|
|
85
|
|
—
|
|
—
|
|
—
|
|
254
|
|
|||||||||||
|
Total allowances deducted from assets
|
$
|
1,409
|
|
$
|
812
|
|
$
|
77
|
|
$
|
(369
|
)
|
$
|
3,121
|
|
$
|
5,050
|
|
|||||
|
Year ended December 31, 2017
|
|||||||||||||||||||||||
|
Accounts receivable
|
$
|
4,796
|
|
$
|
1,008
|
|
$
|
3
|
|
$
|
(402
|
)
|
$
|
333
|
|
$
|
5,738
|
|
|||||
|
Investment in sales-type leases
|
254
|
|
(62
|
)
|
—
|
|
—
|
|
—
|
|
192
|
|
|||||||||||
|
Total allowances deducted from assets
|
$
|
5,050
|
|
$
|
946
|
|
$
|
3
|
|
$
|
(402
|
)
|
$
|
333
|
|
$
|
5,930
|
|
|||||
|
(1)
|
Allowance for doubtful accounts.
|
|
(2)
|
Represents amounts charged to bad debt expense, increasing the allowance.
|
|
(3)
|
Represents amounts debited to trade accounts receivable as recoveries, increasing the allowance.
|
|
(4)
|
Represents amounts written-off from the allowance and trade accounts receivable.
|
|
(5)
|
Represents primarily purchase price adjustments and minor foreign currency translation adjustments.
|
F-40
SIGNATURES
Pursuant to the requirements of Section 13 or 15(d) of the Securities Exchange Act of 1934, the registrant has duly caused this report to be signed on its behalf by the undersigned, thereunto duly authorized on the 27
th
day of February 2018.
|
OMNICELL, INC.
|
|||
|
By:
|
/s/ Peter J. Kuipers
|
||
|
Peter J. Kuipers,
Executive Vice President & Chief Financial Officer |
|||
POWER OF ATTORNEY
KNOW ALL PERSONS BY THESE PRESENTS, that each of the persons whose signature appears below hereby constitutes and appoints Randall A. Lipps and Peter J. Kuipers, each of them acting individually, as his or her attorney-in-fact, each with the full power of substitution, for him or her in any and all capacities, to sign any and all amendments to this Annual Report on Form 10-K, and to file the same, with all exhibits thereto and other documents in connection therewith, with the Securities and Exchange Commission, granting unto said attorneys-in-fact, and each of them, full power and authority to do and perform each and every act and thing requisite and necessary to be done in and about the premises as fully to all intents and purposes as he or she might or could do in person, hereby ratifying and confirming our signatures as they may be signed by our said attorney-in-fact and any and all amendments to this Annual Report on Form 10-K.
Pursuant to the requirements of the Securities Exchange Act of 1934, this report has been signed below by the following persons on behalf of the registrant and in the capacities and on the dates indicated.
|
Signature
|
Title
|
Date
|
||
|
/s/ RANDALL A. LIPPS
|
Chief Executive Officer, President and Chairman of the Board (Principal Executive Officer)
|
February 27, 2018
|
||
|
Randall A. Lipps
|
||||
|
/s/ PETER J. KUIPERS
|
Executive Vice President & Chief Financial Officer
(Principal Financial Officer)
|
February 27, 2018
|
||
|
Peter J. Kuipers
|
||||
|
/s/ JOSEPH B. SPEARS
|
Vice President, Corporate Finance and Chief Accounting Officer (Principal Accounting Officer)
|
February 27, 2018
|
||
|
Joseph B. Spears
|
||||
|
/s/ JOANNE B. BAUER
|
February 27, 2018
|
|||
|
Joanne B. Bauer
|
Director
|
|||
|
/s/ JAMES T. JUDSON
|
February 27, 2018
|
|||
|
James T. Judson
|
Director
|
|||
|
/s/ VANCE B. MOORE
|
February 27, 2018
|
|||
|
Vance B. Moore
|
Director
|
|||
|
/s/ MARK W. PARRISH
|
February 27, 2018
|
|||
|
Mark W. Parrish
|
Director
|
|||
|
/s/ GARY S. PETERSMEYER
|
February 27, 2018
|
|||
|
Gary S. Petersmeyer
|
Director
|
|||
|
/s/ BRUCE D. SMITH
|
February 27, 2018
|
|||
|
Bruce D. Smith
|
Director
|
|||
|
/s/ SARA J. WHITE
|
February 27, 2018
|
|||
|
Sara J. White
|
Director
|
|||
S- 1
INDEX TO EXHIBITS
|
Incorporated By Reference
|
||||||||||
|
Exhibit Number
|
Exhibit Description
|
Form
|
File No.
|
Exhibit
|
Filing Date
|
|||||
|
2.1
|
8-K
|
000-33043
|
2.1
|
10/29/2015
|
||||||
|
2.2
|
8-K
|
000-33043
|
2.1
|
11/29/2016
|
||||||
|
3.1
|
10-Q
|
000-33043
|
3.1
|
9/20/2001
|
||||||
|
3.2
|
10-Q
|
000-33043
|
3.2
|
8/9/2010
|
||||||
|
3.3
|
10-K
|
000-33043
|
3.2
|
3/28/2003
|
||||||
|
3.4
|
10-Q
|
000-33043
|
3.3
|
8/9/2007
|
||||||
|
4.1
|
Reference is made to Exhibits 3.1, 3.2, 3.3 and 3.4
|
|||||||||
|
4.2
|
S-1/A
|
333-57024
|
4.1
|
7/24/2001
|
||||||
|
4.3
|
S-3ASR
|
333-221332
|
4.5
|
11/3/2017
|
||||||
|
4.4
|
S-3ASR
|
333-221332
|
4.7
|
11/3/2017
|
||||||
|
4.5
|
S-3ASR
|
333-221332
|
4.8
|
11/3/2017
|
||||||
|
4.6
|
S-3ASR
|
333-221332
|
4.9
|
11/3/2017
|
||||||
|
10.1*
|
8-K
|
000-33043
|
10.1
|
2/10/2016
|
||||||
|
10.2*
|
8-K
|
000-33043
|
10.1
|
7/25/2017
|
||||||
|
10.3
|
S-1
|
333-57024
|
10.2
|
3/14/2001
|
||||||
|
10.4
|
10-K
|
000-33043
|
10.6
|
3/8/2012
|
||||||
|
10.5
|
10-K
|
000-33043
|
10.9
|
3/8/2012
|
||||||
|
10.6
|
S-1
|
333-57024
|
10.12
|
3/14/2001
|
||||||
|
10.7*
|
S-8
|
000-33043
|
99.2
|
7/2/2015
|
||||||
|
10.8*
|
10-K
|
000-33043
|
10.14
|
3/23/2007
|
||||||
|
10.9*
|
S-8
|
000-33043
|
99.1
|
7/2/2015
|
||||||
|
10.10*
|
10-K
|
000-33043
|
10.16
|
3/11/2011
|
||||||
|
10.11*
|
10-K
|
000-33043
|
10.17
|
3/11/2011
|
||||||
|
10.12*
|
10-K
|
000-33043
|
10.18
|
3/11/2011
|
||||||
|
Incorporated By Reference
|
||||||||||
|
Exhibit Number
|
Exhibit Description
|
Form
|
File No.
|
Exhibit
|
Filing Date
|
|||||
|
10.13*
|
8-K
|
000-33043
|
10.1
|
3/17/2010
|
||||||
|
10.14*
|
10-K
|
000-33043
|
10.26
|
3/8/2004
|
||||||
|
10.15*
|
10-K
|
000-33043
|
10.14
|
3/11/2011
|
||||||
|
10.16*
|
8-K
|
000-33043
|
10.1
|
1/24/2006
|
||||||
|
10.17*
|
10-K
|
000-33043
|
10.21
|
3/11/2011
|
||||||
|
10.18*
|
10-K
|
000-33043
|
10.29
|
2/24/2009
|
||||||
|
10.19
|
8-K
|
000-33043
|
10.1
|
3/20/2012
|
||||||
|
10.20*
|
10-K
|
000-33043
|
10.27
|
3/30/2015
|
||||||
|
10.21*
|
10-Q
|
000-33043
|
10.4
|
8/9/2012
|
||||||
|
10.22*
|
10-Q
|
000-33043
|
10.5
|
8/9/2012
|
||||||
|
10.23
|
10-Q
|
000-33043
|
10.6
|
8/9/2012
|
||||||
|
10.24
|
10-Q
|
000-33043
|
10.7
|
8/9/2012
|
||||||
|
10.25
|
10-Q
|
000-33043
|
10.8
|
8/9/2012
|
||||||
|
10.26
|
10-Q
|
000-33043
|
10.1
|
8/9/2013
|
||||||
|
10.27
|
10-K
|
000-33043
|
10.37
|
3/30/2015
|
||||||
|
10.28*
|
10-Q
|
000-33043
|
10.3
|
11/6/2015
|
||||||
|
10.29*
|
10-Q
|
000-33043
|
10.4
|
11/6/2015
|
||||||
|
10.3
|
8-K
|
000-33043
|
10.1
|
1/6/2016
|
||||||
|
10.31
|
10-Q
|
000-33043
|
10.2
|
5/6/2016
|
||||||
|
10.32
|
10-Q
|
000-33043
|
10.3
|
5/6/2016
|
||||||
|
Incorporated By Reference
|
||||||||||
|
Exhibit Number
|
Exhibit Description
|
Form
|
File No.
|
Exhibit
|
Filing Date
|
|||||
|
10.33
|
10-Q
|
000-33043
|
10.4
|
5/6/2016
|
||||||
|
10.34
|
10-K
|
000-33043
|
10.36
|
2/28/17
|
||||||
|
10.35
|
10-Q
|
000-33043
|
10.2
|
5/5/17
|
||||||
|
10.36
|
10-Q
|
000-33043
|
10.3
|
5/5/17
|
||||||
|
10.37
|
10-Q
|
000-33043
|
10.3
|
8/4/17
|
||||||
|
10.38*
|
10-Q
|
000-33043
|
10.5
|
8/4/17
|
||||||
|
10.39
|
8-K
|
000-33043
|
10.1
|
12/26/2017
|
||||||
|
10.40
|
10-Q
|
000-33043
|
10.1
|
5/5/2017
|
||||||
|
10.41
|
8-K
|
000-33043
|
1.1
|
11/3/2017
|
||||||
|
21.1
+
|
||||||||||
|
23.1
+
|
||||||||||
|
24.1
+
|
||||||||||
|
31.1
+
|
||||||||||
|
31.2
+
|
||||||||||
|
32.1
+
|
||||||||||
|
101.INS
+
|
XBRL Instance Document
(2)
|
|||||||||
|
101.SCH
+
|
XBRL Taxonomy Extension Schema Document
(2)
|
|||||||||
|
101.CAL
+
|
XBRL Taxonomy Extension Calculation Linkbase Document
(2)
|
|||||||||
|
101.DEF
+
|
XBRL Taxonomy Extension Definition Linkbase Document
(2)
|
|||||||||
|
101.LAB
+
|
XBRL Taxonomy Extension Labels Linkbase Document
(2)
|
|||||||||
|
101.PRE
+
|
XBRL Taxonomy Extension Presentation Linkbase Document
(2)
|
|||||||||
_________________________________________________
|
*
|
Indicates a management contract, compensation plan or arrangement.
|
|
+
|
Filed herewith.
|
|
(1)
|
This certification accompanies the Form 10-K to which it relates, is not deemed filed with the Securities and Exchange Commission and is not to be incorporated by reference into any filing of the Registrant under the Securities Act of 1933, as amended, or the Securities Exchange Act of 1934, as amended (whether made before or after the date of the Form 10-K), irrespective of any general incorporation language contained in such filing.
|
|
(2)
|
Pursuant to applicable securities laws and regulations, the Registrant is deemed to have complied with the reporting obligation relating to the submission of interactive data files in such exhibits and is not subject to liability under any anti-fraud provisions of the federal securities laws as long as the Registrant has made a good faith attempt to comply with the submission requirements and promptly amends the interactive data files after becoming aware that the interactive data files fail to comply with the submission requirements. These interactive data files are deemed not filed or part of a registration statement or prospectus for purposes of sections 11 or 12 of the Securities Act of 1933, as amended, are deemed not filed for purposes of section 18 of the Securities Exchange Act of 1934, as amended, and otherwise are not subject to liability under these sections.
|
TABLE OF CONTENTS
Part IItem 1. BusinessItem 1A. Risk FactorsItem 1B. Unresolved Staff CommentsItem 2. PropertiesItem 3. Legal ProceedingsItem 4. Mine Safety DisclosuresPart IIItem 5. Market For Registrant's Common Equity, Related Stockholder Matters and Issuer Purchases Of Equity SecuritiesItem 6. Selected Financial DataItem 7. Management's Discussion and Analysis Of Financial Condition and Results Of OperationsItem 7A. Quantitative and Qualitative Disclosures About Market RiskItem 8. Financial Statements and Supplementary DataItem 9. Changes in and Disagreements with Accountants on Accounting and Financial DisclosureItem 9A. Controls and ProceduresItem 9B. Other InformationPart IIIItem 10. Directors, Executive Officers and Corporate GovernanceItem 11. Executive CompensationItem 12. Security Ownership Of Certain Beneficial Owners and Management and Related Stockholders MattersItem 13. Certain Relationships, Related Transactions and Director IndependenceItem 14. Principal Accountant Fees and ServicesPart IVItem 15. Exhibits and Financial Statement ScheduleNote 1. Organization and Summary Of Significant Accounting PoliciesNote 2. Business CombinationsNote 3. Net Income Per ShareNote 4. Cash and Cash Equivalents and Fair Value Of Financial InstrumentsNote 5. Balance Sheet ComponentsNote 6. Net Investment in Sales-type LeasesNote 7. Goodwill and Intangible AssetsNote 8. Debt and Credit AgreementsNote 9. Deferred RevenueNote 10. Commitments and ContingenciesNote 11. Employee Benefits and Share-based CompensationNote 12. Stock RepurchasesNote 13. Equity OfferingsNote 14. Segment and Geographical InformationNote 15. Income TaxesNote 16. Restructuring Expenses