ONEMAIN HOLDINGS, INC.
10-Ks and 10-Qs
|
|
|
|
|
|
|
|
|
|
|
|
|
|
|
|
|
|
|
|
|
|
|
|
|
|
|
|
|
|
|
|
|
|
|
|
|
|
|
|
|
|
|
|
UNITED STATES
SECURITIES AND EXCHANGE COMMISSION
Washington, D.C. 20549
FORM 10-K
(Mark One)
þ
ANNUAL REPORT PURSUANT TO SECTION 13 OR 15(d) OF THE SECURITIES EXCHANGE ACT
OF 1934
For the fiscal year ended
December 31, 2017
OR
o
TRANSITION REPORT PURSUANT TO SECTION 13 OR 15(d) OF THE SECURITIES EXCHANGE
ACT OF 1934
For the transition period from
to
Commission file number 001-36129
ONEMAIN HOLDINGS, INC.
(Exact name of registrant as specified in its charter)
|
Delaware
|
27-3379612
|
|
(State of incorporation)
|
(I.R.S. Employer Identification No.)
|
|
601 N.W. Second Street, Evansville, IN
|
47708
|
|
(Address of principal executive offices)
|
(Zip Code)
|
(812) 424-8031
(Registrant’s telephone number, including area code)
Securities registered pursuant to Section 12(b) of the Act:
|
Title of each class
|
Name of each exchange on which registered
|
|
|
Common Stock, par value $0.01 per share
|
New York Stock Exchange
|
|
Securities registered pursuant to Section 12(g) of the Act:
None
Indicate by check mark if the registrant is a well-known seasoned issuer, as defined in Rule 405 of the Securities Act. Yes
þ
No
o
Indicate by check mark if the registrant is not required to file reports pursuant to Section 13 or 15(d) of the Act. Yes
o
No
þ
Indicate by check mark whether the registrant: (1) has filed all reports required to be filed by Section 13 or 15(d) of the Securities Exchange Act of 1934 during the preceding 12 months (or for such shorter period that the registrant was required to file such reports), and (2) has been subject to such filing requirements for the past 90 days. Yes
þ
No
o
Indicate by check mark whether the registrant has submitted electronically and posted on its corporate Web site, if any, every Interactive Data File required to be submitted and posted pursuant to Rule 405 of Regulation S-T during the preceding 12 months (or for such shorter period that the registrant was required to submit and post such files). Yes
þ
No
o
Indicate by check mark if disclosure of delinquent filers pursuant to Item 405 of Regulation S-K (§229.405 of this chapter) is not contained herein, and will not be contained, to the best of registrant’s knowledge, in definitive proxy or information statements incorporated by reference in Part III of this Form 10-K or any amendment to this Form 10-K.
þ
Indicate by check mark whether the registrant is a large accelerated filer, an accelerated filer, a non-accelerated filer, smaller reporting company, or an emerging growth company. See the definitions of “large accelerated filer,” “accelerated filer,” “smaller reporting company,” and “emerging growth company” in Rule 12b-2 of the Exchange Act.
|
Large accelerated filer
þ
|
Accelerated filer
o
|
Non-accelerated filer
o
|
Smaller reporting company
o
|
Emerging growth company
o
|
|
(Do not check if a smaller reporting company)
|
||||
If an emerging growth company, indicate by check mark if the registrant has elected not to use the extended transition period for complying with any new or revised financial accounting standards provided pursuant to Section 13(a) of the Exchange Act.
o
Indicate by check mark whether the registrant is a shell company (as defined in Rule 12b-2 of the Exchange Act). Yes
o
No
þ
The aggregate market value of the voting and non-voting common equity of OneMain Holdings, Inc. held by non-affiliates as of the close of business on June 30,
2017
was $
1,406,406,312
.
At
February 14, 2018
, there were
135,604,229
shares of the registrant’s common stock, $.01 par value, outstanding.
DOCUMENTS INCORPORATED BY REFERENCE
The information required by Part III (Items 10, 11, 12, 13, and 14) is incorporated by reference from the registrant’s Definitive Proxy Statement for its 2018 Annual Meeting to be filed with the Securities and Exchange Commission pursuant to Regulation 14A.
TABLE OF CONTENTS
2
GLOSSARY
Terms and abbreviations used in this report are defined below.
|
Term or Abbreviation
|
Definition
|
|
|
2013 Omnibus Incentive Plan
|
incentive plan under which equity-based awards are granted to selected management employees, non-employee directors, independent contractors, and consultants
|
|
|
2014-1 Notes
|
asset-backed notes issued in April 2014 by OneMain Financial Issuance Trust 2014-1
|
|
|
2014-A Notes
|
asset-backed notes issued in March 2014 by the Springleaf Funding Trust 2014-A
|
|
|
2016 Annual Report on Form
10-K
|
Annual Report on Form 10-K for the fiscal year ended December 31, 2016
|
|
|
2019 OMFH Notes
|
$700 million aggregate principal amount of 6.75% Senior Notes due 2019
|
|
|
2022 SFC Notes
|
$500 million of 6.125% Senior Notes due 2022 issued by SFC on May 15, 2017 and guaranteed by OMH
|
|
|
30-89 Delinquency ratio
|
net finance receivables 30-89 days past due as a percentage of net finance receivables
|
|
|
401(k) Plan
|
Springleaf Financial Services 401(k) Plan
|
|
|
5.25% SFC Notes
|
$700 million of 5.25% Senior Notes due 2019 issued by SFC on December 3, 2014 and guaranteed by OMH
|
|
|
5.625% SFC Notes
|
$875 million of 5.625% Senior Notes due 2023 issued by SFC on December 8, 2017 and guaranteed by OMH
|
|
|
6.125% SFC Notes
|
collectively, the 2022 SFC Notes and the Additional SFC Notes
|
|
|
8.25% SFC Notes
|
$1.0 billion of 8.25% Senior Notes due 2020 issued by SFC on April 11, 2016 and guaranteed by OMH
|
|
|
ABO
|
accumulated benefit obligation
|
|
|
ABS
|
asset-backed securities
|
|
|
Accretable yield
|
the excess of the cash flows expected to be collected on the purchased credit impaired finance receivables over the discounted cash flows
|
|
|
Additional SFC Notes
|
$500 million of 6.125% Senior Notes due 2022 issued by SFC on May 30, 2017 and guaranteed by OMH
|
|
|
Adjusted pretax income (loss)
|
a non-GAAP financial measure; income (loss) before income tax expense (benefit) on a Segment Accounting Basis, excluding acquisition-related transaction and integration expenses, net gain (loss) on sales of personal and real estate loans, net gain on sale of SpringCastle interests, SpringCastle transaction costs, losses resulting from repurchases and repayments of debt, debt refinance costs, net loss on liquidation of our United Kingdom subsidiary, and income attributable to non-controlling interests
|
|
|
AHL
|
American Health and Life Insurance Company
|
|
|
Apollo
|
Apollo Global Management, LLC and its consolidated subsidiaries
|
|
|
Apollo-Värde Transaction
|
the proposed purchase by the Apollo-Värde Group of 54,937,500 shares of OMH common stock from the Initial Stockholder pursuant to the Share Purchase Agreement entered into among OMH, the Initial Stockholder and the Apollo-Värde Group on January 3, 2018
|
|
|
Apollo-Värde Group
|
an investor group led by funds managed by Apollo and Värde
|
|
|
ASC
|
Accounting Standards Codification
|
|
|
ASU
|
Accounting Standards Update
|
|
|
August 2016 Real Estate Loan Sale
|
SFC and certain of its subsidiaries sold a portfolio of second lien mortgage loans for aggregate cash proceeds of $246 million on August 3, 2016
|
|
|
Average debt
|
average of debt for each day in the period
|
|
|
Average net receivables
|
average of monthly average net finance receivables (net finance receivables at the beginning and end of each month divided by two) in the period
|
|
|
BP
|
basis point
|
|
|
Blackstone
|
collectively, BTO Willow Holdings II, L.P. and Blackstone Family Tactical Opportunities Investment Partnership—NQ—ESC L.P.
|
|
|
CDO
|
collateralized debt obligations
|
|
|
CFPB
|
Consumer Financial Protection Bureau
|
|
|
Citigroup
|
CitiFinancial Credit Company
|
|
|
CMBS
|
commercial mortgage-backed securities
|
|
|
CRA
|
Congressional Review Act
|
|
3
|
Term or Abbreviation
|
Definition
|
|
|
December OMFH Securitization
|
OMFH completed an offering of approximately $605 million of asset-backed notes in a private offering on December 11, 2017
|
|
|
December 2016 Real Estate Loan Sale
|
SFC and certain of its subsidiaries sold a portfolio of first and second lien mortgage loans for aggregate cash proceeds of $58 million on December 19, 2016
|
|
|
Dodd-Frank Act
|
the Dodd-Frank Wall Street Reform and Consumer Protection Act
|
|
|
DOJ
|
U.S. Department of Justice
|
|
|
ERISA
|
Employee Retirement Income Security Act of 1974
|
|
|
Exchange Act
|
Securities Exchange Act of 1934, as amended
|
|
|
Excess Retirement Income Plan
|
Springleaf Financial Services Excess Retirement Income Plan
|
|
|
FA Loans
|
purchased credit impaired finance receivables related to the Fortress Acquisition
|
|
|
FASB
|
Financial Accounting Standards Board
|
|
|
FHLB
|
Federal Home Loan Bank
|
|
|
FICO score
|
a credit score created by Fair Isaac Corporation
|
|
|
Fitch
|
Fitch, Inc.
|
|
|
Fixed charge ratio
|
earnings less income taxes, interest expense, extraordinary items, goodwill impairment, and any amounts related to discontinued operations, divided by the sum of interest expense and any preferred dividends
|
|
|
Fortress
|
Fortress Investment Group LLC
|
|
|
Fortress Acquisition
|
transaction by which FCFI Acquisition LLC, an affiliate of Fortress, acquired an 80% economic interest of the sole stockholder of SFC for a cash purchase price of $119 million, effective November 30, 2010
|
|
|
Fourth Avenue Auto Funding LSA
|
Loan and Security Agreement, dated September 29, 2017, among Fourth Avenue Auto Funding, LLC, certain third party lenders and other third parties pursuant to which Fourth Avenue Auto Funding, LLC may borrow up to $250 million
|
|
|
HAMP
|
Home Affordable Modification Program
|
|
|
GAAP
|
generally accepted accounting principles in the United States of America
|
|
|
GAP
|
guaranteed asset protection
|
|
|
Gross charge-off ratio
|
annualized gross charge-offs as a percentage of average net receivables
|
|
|
Indenture
|
the SFC Base Indenture, together with all subsequent Supplemental Indentures
|
|
|
Independence
|
Independence Holdings, LLC
|
|
|
Indiana DOI
|
Indiana Department of Insurance
|
|
|
Initial Stockholder
|
Springleaf Financial Holdings, LLC
|
|
|
Investment Company Act
|
Investment Company Act of 1940
|
|
|
IRS
|
Internal Revenue Service
|
|
|
Junior Subordinated Debenture
|
$350 million aggregate principal amount of 60-year junior subordinated debt issued by SFC under an indenture dated January 22, 2007, by and between SFC and Deutsche Bank Trust Company, as trustee, and guaranteed by OMH
|
|
|
Lendmark Sale
|
the sale of 127 Springleaf branches to Lendmark Financial Service, LLC, effective April 30, 2016
|
|
|
LIBOR
|
London Interbank Offered Rate
|
|
|
Logan Circle
|
Logan Circle Partners, L.P.
|
|
|
Loss ratio
|
annualized net charge-offs, net writedowns on real estate owned, net gain (loss) on sales or real estate owned, and operating expenses related to real estate owned as a percentage of average real estate loans
|
|
|
Merit
|
Merit Life Insurance Co.
|
|
|
MetLife
|
MetLife, Inc.
|
|
|
Military Lending Act
|
governs certain consumer lending to active-duty service members and covered dependents and limits, among other things, the interest rate that may be charged
|
|
|
Moody’s
|
Moody’s Investors Service, Inc.
|
|
|
Mystic River Funding LSA
|
Loan and Security Agreement, dated September 28, 2017, among Mystic River Funding, LLC, certain third party lenders and other third parties pursuant to which Mystic River Funding, LLC may borrow up to $850 million
|
|
|
Nationstar
|
Nationstar Mortgage LLC, dba “Mr. Cooper”
|
|
4
|
Term or Abbreviation
|
Definition
|
|
|
Net charge-off ratio
|
annualized net charge-offs as a percentage of average net receivables
|
|
|
Net interest income
|
interest income less interest expense
|
|
|
NRZ
|
New Residential Investment Corp.
|
|
|
ODART
|
OneMain Direct Auto Receivables Trust
|
|
|
OM Loans
|
purchased credit impaired personal loans acquired in the OneMain Acquisition
|
|
|
OMFG
|
OneMain Financial Group, LLC
|
|
|
OMFH
|
OneMain Financial Holdings, LLC
|
|
|
OMFH Indenture
|
Indenture entered into on December 11, 2014, as amended or supplemented from time to time, by OMFH and certain of its subsidiaries in connection with the issuance of the OMFH Notes
|
|
|
OMFH Notes
|
collectively, $700 million aggregate principal amount of 6.75% Senior Notes due 2019 and $800 million in aggregate principal amount of 7.25% Senior Notes due 2021
|
|
|
OMFH Second Supplemental Indenture
|
Second Supplemental Indenture dated as of November 8, 2016, to the OMFH Indenture
|
|
|
OMFIT
|
OneMain Financial Issuance Trust
|
|
|
OMH
|
OneMain Holdings, Inc.
|
|
|
OneMain
|
OMFH, collectively with its subsidiaries
|
|
|
OneMain Acquisition
|
Acquisition of OneMain from CitiFinancial Credit Company, effective November 1, 2015
|
|
|
OneMain Financial Auto I LSA
|
Loan and Security Agreement, dated November 8, 2017, among OneMain Financial Auto I, LLC, certain third party lenders and other third parties pursuant to which OneMain Financial Auto I, LLC may borrow up to $750 million
|
|
|
OneMain Financial Funding VII LSA
|
|
Loan and Security Agreement, dated April 13, 2017, among OneMain Financial Funding VII, LLC, certain third party lenders and other third parties pursuant to which OneMain Financial Funding VII, LLC may borrow up to $650 million
|
|
OneMain Financial Funding IX LSA
|
Loan and Security Agreement, dated July 14, 2017, among OneMain Financial Funding IX, LLC, certain third party lenders and other third parties pursuant to which OneMain Financial Funding IX, LLC may borrow up to $600 million
|
|
|
Other SFC Notes
|
collectively, approximately $5.2 billion aggregate principal amount of senior notes, on a senior unsecured basis, and the Junior Subordinated Debenture, on a junior subordinated basis, issued by SFC and guaranteed by OMH
|
|
|
PBO
|
projected benefit obligation
|
|
|
PRSUs
|
performance-based RSUs
|
|
|
PVFP
|
present value of future profits
|
|
|
Recovery ratio
|
annualized recoveries on net charge-offs as a percentage of average net receivables
|
|
|
Retail sales finance
|
collectively, retail sales contracts and revolving retail accounts
|
|
|
Retirement Plan
|
Springleaf Financial Services Retirement Plan
|
|
|
RMBS
|
residential mortgage-backed securities
|
|
|
Rocky River Funding LSA
|
Loan and Security Agreement, dated September 8, 2017, among Rocky River Funding, LLC, certain third party lenders and other third parties pursuant to which Rocky River Funding, LLC may borrow up to $250 million
|
|
|
RSAs
|
restricted stock awards
|
|
|
RSUs
|
restricted stock units
|
|
|
SCP Loans
|
purchased credit impaired loans acquired through the SpringCastle Joint Venture
|
|
|
SEC
|
U.S. Securities and Exchange Commission
|
|
|
Securities Act
|
Securities Act of 1933
|
|
|
Segment Accounting Basis
|
a basis used to report the operating results of our segments, which reflects our allocation methodologies for certain costs and excludes the impact of applying purchase accounting
|
|
|
SERP
|
Supplemental Executive Retirement Plan
|
|
|
Settlement Agreement
|
a Settlement Agreement with the U.S. Department of Justice entered into by OMH and certain of its subsidiaries on November 13, 2015, in connection with the OneMain Acquisition
|
|
|
SFC
|
Springleaf Finance Corporation
|
|
5
|
Term or Abbreviation
|
Definition
|
|
|
SFC Base Indenture
|
Indenture dated as of December 3, 2014
|
|
|
SFC First Supplemental Indenture
|
First Supplemental Indenture dated as of December 3, 2014, to the SFC Base Indenture
|
|
|
SFC Fourth Supplemental Indenture
|
Fourth Supplemental Indenture dated as of December 8, 2017, to the SFC Base Indenture
|
|
|
SFC Guaranty Agreements
|
agreements entered into on December 30, 2013 by OMH whereby it agreed to fully and unconditionally guarantee the payments of principal, premium (if any) and interest on the Other SFC Notes
|
|
|
SFC Second Supplemental Indenture
|
Second Supplemental Indenture dated as of April 11, 2016, to the SFC Base Indenture
|
|
|
SFC Third Supplemental Indenture
|
Third Supplemental Indenture dated as of May 15, 2017, to the SFC Base Indenture
|
|
|
SFC Trust Guaranty Agreement
|
agreement entered into on December 30, 2013 by OMH whereby it agreed to fully and unconditionally guarantee the related payment obligations under the trust preferred securities in connection with the Junior Subordinated Debenture
|
|
|
SFI
|
Springleaf Finance, Inc.
|
|
|
Share Purchase Agreement
|
Share Purchase Agreement entered into on January 3, 2018, among the Apollo-Värde Group, the Initial Stockholder and the Company to acquire from the Initial Stockholder 54,937,500 shares of our common stock that was issued and outstanding as of such date, representing the entire holdings of our stock beneficially owned by Fortress
|
|
|
SLFT
|
Springleaf Funding Trust
|
|
|
SoftBank
|
SoftBank Group Corporation
|
|
|
SpringCastle Interests Sale
|
the March 31, 2016 sale by SpringCastle Holdings, LLC and Springleaf Acquisition Corporation of the equity interest in the SpringCastle Joint Venture
|
|
|
SpringCastle Joint Venture
|
joint venture among SpringCastle America, LLC, SpringCastle Credit, LLC, SpringCastle Finance, LLC, and SpringCastle Acquisition LLC in which SpringCastle Holdings, LLC previously owned a 47% equity interest in each of SpringCastle America, LLC, SpringCastle Credit, LLC and SpringCastle Finance, LLC and Springleaf Acquisition Corporation previously owned a 47% equity interest in SpringCastle Acquisition LLC
|
|
|
SpringCastle Portfolio
|
loans acquired through the SpringCastle Joint Venture
|
|
|
Springleaf
|
OMH and its subsidiaries (other than OneMain)
|
|
|
S&P
|
Standard & Poor’s Rating Services
|
|
|
Tangible equity
|
total equity less accumulated other comprehensive income or loss
|
|
|
Tangible managed assets
|
total assets less goodwill and other intangible assets
|
|
|
Tax Act
|
Public Law 115-97 amending the Internal Revenue Code of 1986
|
|
|
TDR finance receivables
|
troubled debt restructured finance receivables
|
|
|
Texas DOI
|
Texas Department of Insurance
|
|
|
Thur River Funding LSA
|
Loan and Security Agreement, dated June 29, 2017, among Thur River Funding, LLC, certain third party lenders and other third parties pursuant to which Thur River Funding, LLC may borrow up to $350 million
|
|
|
Triton
|
Triton Insurance Company
|
|
|
Trust preferred securities
|
capital securities classified as debt for accounting purposes but due to their terms are afforded, at least in part, equity capital treatment in the calculation of effective leverage by rating agencies
|
|
|
TILA
|
Truth-In-Lending Act
|
|
|
UPB
|
unpaid principal balance
|
|
|
Värde
|
Värde Partners, Inc.
|
|
|
VOBA
|
value of business acquired
|
|
|
VFN
|
variable funding notes
|
|
|
VIEs
|
variable interest entities
|
|
|
Weighted average interest rate
|
annualized interest expense as a percentage of average debt
|
|
|
Wilmington
|
Wilmington Trust, National Association
|
|
6
|
Term or Abbreviation
|
Definition
|
|
|
Yield
|
annualized finance charges as a percentage of average net receivables
|
|
|
Yosemite
|
Yosemite Insurance Company
|
|
7
Forward-Looking Statements
This report contains “forward-looking statements” within the meaning of the Private Securities Litigation Reform Act of 1995. Forward-looking statements are not statements of historical fact but instead represent only management’s current beliefs regarding future events. By their nature, forward-looking statements involve inherent risks, uncertainties and other important factors that may cause actual results, performance or achievements to differ materially from those expressed in or implied by such forward-looking statements. We caution you not to place undue reliance on these forward-looking statements that speak only as of the date they were made. We do not undertake any obligation to publicly release any revisions to these forward-looking statements to reflect events or circumstances after the date of this report or to reflect the occurrence of unanticipated events or the non-occurrence of anticipated events. Forward-looking statements include, without limitation, statements concerning future plans, objectives, goals, projections, strategies, events or performance, and underlying assumptions and other statements related thereto. Statements preceded by, followed by or that otherwise include the words “anticipates,” “appears,” “are likely,” “believes,” “estimates,” “expects,” “foresees,” “intends,” “plans,” “projects” and similar expressions or future or conditional verbs such as “would,” “should,” “could,” “may,” or “will,” are intended to identify forward-looking statements. Important factors that could cause actual results, performance or achievements to differ materially from those expressed in or implied by forward-looking statements include, without limitation, the following:
|
•
|
the inability to obtain, or delays in obtaining, cost savings and synergies from the OneMain Acquisition and risks and other uncertainties associated with the integration of the companies;
|
|
•
|
any litigation, fines or penalties that could arise relating to the OneMain Acquisition or Apollo-Värde Transaction;
|
|
•
|
the impact of the Apollo-Värde Transaction on our relationships with employees and third parties;
|
|
•
|
various risks relating to continued compliance with the Settlement Agreement;
|
|
•
|
changes in general economic conditions, including the interest rate environment in which we conduct business and the financial markets through which we can access capital and also invest cash flows from our Consumer and Insurance segment;
|
|
•
|
levels of unemployment and personal bankruptcies;
|
|
•
|
natural or accidental events such as earthquakes, hurricanes, tornadoes, fires, or floods affecting our customers, collateral, or branches or other operating facilities;
|
|
•
|
war, acts of terrorism, riots, civil disruption, pandemics, disruptions in the operation of our information systems, cyber-attacks or other security breaches, or other events disrupting business or commerce;
|
|
•
|
changes in the rate at which we can collect or potentially sell our finance receivables portfolio;
|
|
•
|
the effectiveness of our credit risk scoring models in assessing the risk of customer unwillingness or lack of capacity to repay;
|
|
•
|
changes in our ability to attract and retain employees or key executives to support our businesses;
|
|
•
|
changes in the competitive environment in which we operate, including the demand for our products, customer responsiveness to our distribution channels, our ability to make technological improvements, and the strength and ability of our competitors to operate independently or to enter into business combinations that result in a more attractive range of customer products or provide greater financial resources;
|
|
•
|
risks related to the acquisition or sale of assets or businesses or the formation, termination or operation of joint ventures or other strategic alliances or arrangements, including loan delinquencies or net charge-offs, integration or migration issues, increased costs of servicing, incomplete records, and retention of customers;
|
|
•
|
risks associated with our insurance operations, including insurance claims that exceed our expectations or insurance losses that exceed our reserves;
|
8
|
•
|
the inability to successfully implement our growth strategy for our consumer lending business as well as various risks associated with successfully acquiring portfolios of consumer loans, pursuing acquisitions, and/or establishing joint ventures;
|
|
•
|
declines in collateral values or increases in actual or projected delinquencies or net charge-offs;
|
|
•
|
changes in federal, state or local laws, regulations, or regulatory policies and practices, including the Dodd-Frank Act (which, among other things, established the CFPB, which has broad authority to regulate and examine financial institutions, including us), that affect our ability to conduct business or the manner in which we conduct business, such as licensing requirements, pricing limitations or restrictions on the method of offering products, as well as changes that may result from increased regulatory scrutiny of the sub-prime lending industry, our use of third-party vendors and real estate loan servicing, or changes in corporate or individual income tax laws or regulations, including effects of the enactment of Public Law 115-97 amending the Internal Revenue Code of 1986;
|
|
•
|
potential liability relating to real estate and personal loans which we have sold or may sell in the future, or relating to securitized loans, if it is determined that there was a non-curable breach of a representation or warranty made in connection with such transactions;
|
|
•
|
the costs and effects of any actual or alleged violations of any federal, state or local laws, rules or regulations, including any litigation associated therewith, any impact to our business operations, reputation, financial position, results of operations or cash flows arising therefrom, any impact to our relationships with lenders, investors or other third parties attributable thereto, and the costs and effects of any breach of any representation, warranty or covenant under any of our contractual arrangements, including indentures or other financing arrangements or contracts, as a result of any such violation;
|
|
•
|
the costs and effects of any fines, penalties, judgments, decrees, orders, inquiries, investigations, subpoenas, or enforcement or other proceedings of any governmental or quasi-governmental agency or authority and any litigation associated therewith;
|
|
•
|
our continued ability to access the capital markets or the sufficiency of our current sources of funds to satisfy our cash flow requirements;
|
|
•
|
our ability to comply with our debt covenants;
|
|
•
|
our ability to generate sufficient cash to service all of our indebtedness;
|
|
•
|
any material impairment or write-down of the value of our assets;
|
|
•
|
the effects of any downgrade of our debt ratings by credit rating agencies, which could have a negative impact on our cost of and/or access to capital;
|
|
•
|
our substantial indebtedness, which could prevent us from meeting our obligations under our debt instruments and limit our ability to react to changes in the economy or our industry, or our ability to incur additional borrowings;
|
|
•
|
the impacts of our securitizations and borrowings;
|
|
•
|
our ability to maintain sufficient capital levels in our regulated and unregulated subsidiaries;
|
|
•
|
changes in accounting standards or tax policies and practices and the application of such new standards, policies and practices;
|
|
•
|
changes in accounting principles and policies or changes in accounting estimates;
|
|
•
|
effects of the acquisition of Fortress by an affiliate of SoftBank Group Corp.;
|
|
•
|
effects, if any, of the contemplated acquisition by an investor group of shares of our common stock beneficially owned by Fortress and its affiliates;
|
9
|
•
|
any failure or inability to achieve the SpringCastle Portfolio performance requirements set forth in the SpringCastle Interests Sale purchase agreement; and
|
|
•
|
the effect of future sales of our remaining portfolio of real estate loans and the transfer of servicing of these loans, including the environmental liability and costs for damage caused by hazardous waste if a real estate loan goes into default.
|
We also direct readers to the other risks and uncertainties discussed in “Risk Factors” in Part I - Item 1A of this report and in other documents filed with the SEC.
If one or more of these or other risks or uncertainties materialize, or if our underlying assumptions prove to be incorrect, our actual results may vary materially from what we may have expressed or implied by these forward-looking statements. We caution that you should not place undue reliance on any of our forward-looking statements. You should specifically consider the factors identified in this report that could cause actual results to differ before making an investment decision to purchase our common stock. Furthermore, new risks and uncertainties arise from time to time, and it is impossible for us to predict those events or how they may affect us.
10
BUSINESS OVERVIEW
OneMain Holdings, Inc. is referred to in this report as “OMH” or, collectively with its subsidiaries, whether directly or indirectly owned, “the Company,” “we,” “us,” or “our.”
As one of the nation’s largest consumer finance companies, we:
|
•
|
provide responsible personal loan products;
|
|
•
|
offer credit and non-credit insurance;
|
|
•
|
service loans owned by us and service or subservice loans owned by third-parties;
|
|
•
|
pursue strategic acquisitions and dispositions of assets and businesses, including loan portfolios or other financial assets; and
|
|
•
|
may establish joint ventures or enter into other strategic alliances or arrangements from time to time.
|
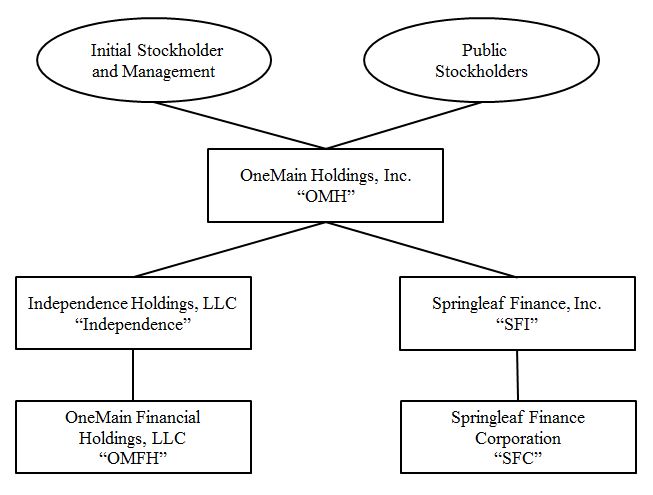
As part of our acquisition strategy, on November 15, 2015, OMH, through its wholly owned subsidiary, Independence, completed the acquisition of OMFH from Citigroup for $4.5 billion in cash (the “OneMain Acquisition”). OMFH, collectively with its subsidiaries, is referred to in this report as OneMain. OMH and its subsidiaries (other than OneMain) is referred to in this report as Springleaf.
The OneMain Acquisition brought together two branch-based consumer finance companies with complementary strategies and locations. Together, we provide origination, underwriting and servicing of personal loans, primarily to non-prime customers. We believe we are well positioned for future growth, with an experienced management team, proven access to the capital markets, and strong demand for consumer credit. At
December 31, 2017
, we had
$14.8 billion
of personal loans due from over
2.3 million
customer accounts across
44
states.
Our combined network of over
1,600
branches as of
December 31, 2017
and expert personnel is complemented by our online consumer loan origination business and centralized operations, which allows us to reach customers located outside our branch footprint. Our digital platform provides our current and prospective customers the option of obtaining a personal loan via our website,
www.onemainfinancial.com
.
In connection with our personal loan business, our insurance subsidiaries offer our customers credit and non-credit insurance, which are described below.
We also pursue strategic acquisitions and dispositions of assets and businesses, including loan portfolios and other financial assets, as well as fee-based opportunities in servicing loans for others in connection with potential strategic portfolio acquisitions through our centralized operations. See “Centralized Operations” below for further information on our centralized servicing centers. We service the loans acquired through a joint venture in which we previously owned a 47% equity interest in the SpringCastle Portfolio. On March 31, 2016, the SpringCastle Portfolio was sold in connection with the SpringCastle Interests Sale.
The Company’s predecessor, Springleaf Holdings, LLC was formed as a Delaware limited liability company in August 2013. In connection with our initial public offering of common stock, we executed a reorganization in October 2013 and converted Springleaf Holdings, LLC into Springleaf Holdings, Inc., a Delaware corporation. In November 2015, Springleaf Holdings, Inc. changed its name to OneMain Holdings, Inc. in connection with the closing of the OneMain Acquisition.
At
December 31, 2017
, the Initial Stockholder owned approximately
44%
of OMH’s common stock. The Initial Stockholder is owned primarily by a private equity fund managed by an affiliate of Fortress. On December 27, 2017, SoftBank acquired Fortress and Fortress now operates within SoftBank as an independent business headquartered in New York.
On January 3, 2018, an investor group led by funds managed by affiliates of Apollo Global Management, LLC (together with its consolidated subsidiaries, “Apollo”) and Värde Partners, Inc. (“Värde” and together with Apollo, collectively, the “Apollo-Värde Group”) entered into a definitive agreement with the Initial Stockholder and the Company to acquire from the Initial Stockholder 54,937,500 shares of our common stock (representing approximately 40.6% of the outstanding shares of our common stock as of such date), representing the entire holdings of our stock beneficially owned by Fortress (the “Apollo-Värde Transaction”). The Apollo-Värde Transaction is expected to close in the second quarter of 2018 and is subject to regulatory
11
approvals and other customary closing conditions.
Upon closing of the Apollo-Värde Transaction, we expect to enter into an Amended and Restated Stockholders’ Agreement, the expected terms of which were previously disclosed in our Current Report on Form 8-K filed with the SEC on January 4, 2018. Such Current Report on Form 8-K, including the Share Purchase Agreement filed as Exhibit 10.1 thereto, is incorporated by reference herein in its entirety.
The following chart summarizes our organization structure as a result of the OneMain Acquisition. The chart is provided for illustrative purposes only and does not represent all of OMH’s subsidiaries or obligations.
INDUSTRY AND MARKET OVERVIEW
We operate in the consumer finance industry serving non-prime customers, a large and growing population of consumers who have limited access to credit from banks, credit card companies and other lenders. According to Experian, as of June 2017, non-prime borrowers in the U.S had approximately $1.4 trillion of outstanding borrowings in the form of personal loans, vehicle loans and leases, and credit cards.
Our industry’s traditional lenders have undergone fundamental changes, forcing many to retrench and in some cases to exit the market altogether. In addition, we believe that the current regulatory environment creates a disincentive for these lenders to resume or support lending to non-prime borrowers. As a result, while the number of non-prime consumers in the United States has grown in recent years, the supply of consumer credit to this demographic has contracted. We believe this large and growing number of potential customers in our target market, combined with the decline in available consumer credit, provides an attractive market opportunity for our business model. See also “Competition” included in this report.
We are one of the few remaining national participants in the consumer installment lending industry still serving this large and growing population of non-prime customers. Our centralized operations, combined with the capabilities resident in our national branch system, provide an effective nationwide platform to efficiently and responsibly address this growing market of consumers. We believe we are well-positioned to capitalize on the significant growth and expansion opportunity within our industry.
SEGMENTS
Our segments coincide with how our businesses are managed. At
December 31, 2017
, our
two
segments include:
|
•
|
Consumer and Insurance; and
|
|
•
|
Acquisitions and Servicing.
|
Beginning in 2017, we include Real Estate, which was previously presented as a distinct reporting segment, in “Other.” See Note
22
of the Notes to Consolidated Financial Statements included in this report for further information on this change in our
12
segment alignment and for more information about our segments. To conform to the new alignment of our new segments, we have revised our prior period segment disclosures.
Consumer and Insurance
We originate and service secured and unsecured personal loans and offer voluntary credit and non-credit insurance and related products through our combined branch network, our digital platform, and our centralized operations. Personal loan origination and servicing, along with our insurance products, forms the core of our operations. As a result of the OneMain Acquisition, our combined branch operations included over
1,600
branch offices in
44
states as of
December 31, 2017
. In addition, our centralized support operations provide underwriting and servicing support to branch operations.
Our insurance business is conducted through Springleaf insurance subsidiaries, Merit and Yosemite, which are both wholly owned subsidiaries of SFC, and OneMain’s insurance subsidiaries, AHL and Triton. Merit and AHL are life and health insurance companies licensed to write credit life, credit disability, and non-credit insurance. Merit is licensed in
46
states, the District of Columbia, and the U.S. Virgin Islands, and AHL is licensed in
49
states, the District of Columbia, and Canada. Yosemite and Triton are property and casualty insurance companies licensed to write credit involuntary unemployment and collateral protection insurance. Yosemite is licensed in
46
states, and Triton is licensed in
50
states, the District of Columbia, and Canada.
Products and Services.
Our personal loan portfolio is comprised of assets that have performed well through both strong and weak market conditions. Our personal loans are non-revolving, fixed rate, fixed term of three to six years, and secured by consumer goods, automobiles, or other personal property, or unsecured. Our loans have no pre-payment penalties.
Since mid-2014, our direct auto loan program has further expanded our lending options by offering a customized personal loan solution for our current and prospective customers. Direct auto lending is similar in nature to our traditional secured personal loans, but direct auto loans are typically larger in size based on the collateral of newer cars with higher values. Proceeds are typically used to pay-off an existing auto loan with another lender, make home improvements, or finance the purchase of a new or used vehicle. Our direct auto loans are reported in our personal loans, which are included in our Consumer and Insurance segment. At
December 31, 2017
, we had over
$2.3 billion
of direct auto loans.
We offer the following optional credit insurance products to our customers:
|
•
|
Credit life insurance
— Insures the life of the borrower in an amount typically equal to the unpaid balance of the finance receivable and provides for payment to the lender of the finance receivable in the event of the borrower’s death.
|
|
•
|
Credit disability insurance
— Provides scheduled monthly loan payments to the lender during borrower’s disability due to illness or injury.
|
|
•
|
Credit involuntary unemployment insurance
— Provides scheduled monthly loan payments to the lender during borrower’s involuntary unemployment.
|
We offer optional, non-credit insurance policies, which are primarily traditional level-term life policies with very limited underwriting.
We offer optional membership plans for home and auto from an unaffiliated company. We have no risk of loss on these membership plans, and these plans are not considered insurance products. We recognize income from this product in other revenues
— other. The unaffiliated company providing these membership plans is responsible for any required reimbursement to the customer.
We also offer a Guaranteed Asset Protection (GAP) waiver product. GAP waiver is a non-insurance product offered by auto lenders to cover, in the event of a total loss to the auto, all or part of the difference between what the customer owes on their auto loan and the payment amount made by the customer’s primary auto insurance.
Should a customer fail to maintain required insurance on property pledged as collateral for the finance receivable, we obtain collateral protection insurance, at the customer’s expense, that protects the value of that collateral.
Customer Development.
We staff each of our branch offices with local, well-trained personnel who have significant experience in the industry. Our business model revolves around an origination, underwriting, and servicing process that
13
leverages each branch office’s local community presence, and helps us develop personal relationships with our customers. Our customers often develop a relationship with their local office representatives, which we believe not only improves the credit performance of our personal loans but also leads to additional lending opportunities.
We solicit prospective customers, as well as current and former customers, through a variety of direct mail offers, targeted online advertising, and local marketing. We use proprietary modeling and targeting, along with data purchased from credit bureaus, alternative data providers, and our existing data/experience to acquire and develop new and profitable customer relationships.
Our digital platform allows current and prospective customers the ability to apply for a personal loan online, at
onemainfinancial.com
. Many of our new customer applications are sourced online, delivered via targeted marketing, search engine tools, banner advertisements, e-mail, internet loan aggregators, and affiliates. Most online applications are closed in a branch, however we do close a small portion of our loans remotely outside the branch.
Our iLoan brand is a separate offering which is tailored toward customers who prefer an end-to-end online and centrally serviced product. iLoan is a stand-alone platform which leverages our expertise in analytics, marketing and technology to create an efficient online borrowing experience. We use learnings from the development of iLoan across the OneMain enterprise to enhance our digital capabilities.
Credit Risk.
Credit quality is driven by our long-standing underwriting philosophy, which takes into account each prospective customer’s household budget, and his or her willingness and capacity to repay the loan. We use credit risk scoring models at the time of the credit application to assess the applicant’s expected willingness and capacity to repay. We develop these models using numerous factors, including past customer credit repayment experience and application data, and periodically revalidate these models based on recent portfolio performance. Our underwriting process in the branches and for loan applications received through our website that are not automatically approved also includes the development of a budget (net of taxes and monthly expenses) for the applicant. We may obtain a security interest in either titled personal property or consumer household goods.
Our customers are primarily considered non-prime and require significantly higher levels of servicing than prime or near-prime customers. As a result, we tend to charge these customers higher interest rates to compensate us for the related credit risks and servicing.
Account Servicing.
The account servicing and collection processing for personal loans are generally handled at the branch office where the personal loans were originated, or in our centralized service centers. All servicing and collection activity is conducted and documented on proprietary systems which log and maintain, within our centralized information systems, a permanent record of all transactions and notations made with respect to the servicing and/or collection of a personal loan and are also used to assess a personal loan application. The proprietary systems permit all levels of branch office management to review on a daily basis the individual and collective performance of all branch offices for which they are responsible.
Acquisitions and Servicing
We service the SpringCastle Portfolio that was acquired through a joint venture in which we previously owned a 47% equity interest. On March 31, 2016, we sold our interest in the SpringCastle Portfolio in connection with the SpringCastle Interests Sale. These loans consisted of unsecured loans and loans secured by subordinate residential real estate mortgages and included both closed-end accounts and open-end lines of credit. These loans were in a liquidating status and varied in substance and form from our originated loans. Unless we are terminated, we will continue to provide the servicing for these loans pursuant to a servicing agreement, which we service as unsecured loans due to the fact that the liens are subordinated to superior ranking security interests.
Other
“Other” consists of our non-originating legacy operations, which include our liquidating real estate loan portfolio as discussed below and our liquidating retail sale finance portfolio (including retail sales finance accounts from our legacy auto finance operation).
Beginning in 2017, management no longer views or manages our liquidating real estate assets as a separate operating segment. Therefore, we are now including Real Estate, which was previously presented as a distinct reporting segment, in “Other.”
14
During 2016, we sold
$308 million
real estate loans held for sale. At
December 31, 2017
, our real estate loans held for investment totaled
$128 million
and comprised less than 1% of our net finance receivables. Real estate loans held for sale totaled
$132 million
at
December 31, 2017
.
CENTRALIZED OPERATIONS
We continually seek to identify functions that could be more effective if centralized to achieve reduced costs or free our lending specialists to service our customers and market our products. Our centralized operational functions support the following:
|
•
|
mail and telephone solicitations;
|
|
•
|
payment processing;
|
|
•
|
originating “out of footprint” loans;
|
|
•
|
servicing of delinquent real estate loans and certain personal loans;
|
|
•
|
bankruptcy process for Chapter 7, 11, 12 and 13 loans;
|
|
•
|
litigation requests for wage garnishments and other actions against borrowers;
|
|
•
|
collateral protection insurance tracking;
|
|
•
|
repossessing and re-marketing of titled collateral; and
|
|
•
|
charge-off recovery operations.
|
We currently have servicing facilities in Mendota Heights, Minnesota; Tempe, Arizona; London, Kentucky; Evansville, Indiana; and Fort Mill, South Carolina. We believe these facilities position us for additional portfolio purchases or fee-based servicing, as well as additional flexibility in the servicing of our lending products.
OPERATIONAL CONTROLS
We control and monitor our businesses through a variety of methods including the following:
|
•
|
Our operational policies and procedures standardize various aspects of lending and collections.
|
|
•
|
Our branch finance receivable systems control amounts, rates, terms, and fees of our customers’ accounts; create loan documents specific to the state in which the branch office operates or to the customer’s location if the loan is made electronically through our centralized operations; and control cash receipts and disbursements.
|
|
•
|
Our accounting personnel reconcile bank accounts, investigate discrepancies, and resolve differences.
|
|
•
|
Our credit risk management system reports allow us to track individual branch office performance and to monitor lending and collection activities.
|
|
•
|
Our executive information system is available to headquarters and field operations management to review the status of activity through the close of business of the prior day.
|
|
•
|
Our branch field operations management structure, Regional Quality Coordinators and Compliance Field Examination team are designed to control a large, decentralized organization with succeeding levels of supervision staffed with more experienced personnel.
|
|
•
|
Our field operations compensation plan aligns our operating activities and goals with corporate strategies by basing the incentive portion of field personnel compensation on profitability and credit quality.
|
|
•
|
Our compliance department assesses our compliance with federal and state laws and regulations, as well as our compliance with our internal policies and procedures; oversees compliance training to ensure team members have a sufficient level of understanding of the laws and regulations that impact their job responsibilities; and manages our regulatory examination process.
|
|
•
|
Our executive office of customer care maintains our consumer complaint resolution and reporting process.
|
|
•
|
Our internal audit department audits our business for adherence to operational policy and procedure and compliance with federal and state laws and regulations.
|
REGULATION
Federal Laws
Various federal laws and regulations govern loan origination, servicing and collections, including:
|
•
|
the Dodd-Frank Act;
|
|
•
|
the Equal Credit Opportunity Act (prohibits discrimination against creditworthy applicants) and the CFPB’s Regulation B, which implements this statute;
|
|
•
|
the Fair Credit Reporting Act (which, among other things, governs the accuracy and use of credit bureau reports);
|
15
|
•
|
the Truth in Lending Act (which, among other things, governs disclosure of applicable charges and other finance receivable terms) and the CFPB’s Regulation Z, which implements this statute;
|
|
•
|
the Fair Debt Collection Practices Act;
|
|
•
|
the Gramm-Leach-Bliley Act (which governs the handling of personal financial information) and the CFPB’s Regulation P, which implements this statute;
|
|
•
|
the Military Lending Act (which governs certain consumer lending to active-duty servicemembers and covered dependents and limits, among other things, the interest rate that may be charged);
|
|
•
|
the Servicemembers Civil Relief Act, which can impose limitations on the servicer’s ability to collect on a loan originated with an obligor who is on active duty status and up to nine months thereafter;
|
|
•
|
the Real Estate Settlement Procedures Act and the CFPB’s Regulation X (both of which regulate the making and servicing of closed end residential mortgage loans);
|
|
•
|
the Federal Trade Commission’s Consumer Claims and Defenses Rule, also known as the “Holder in Due Course” Rule; and
|
|
•
|
the Federal Trade Commission Act.
|
The Dodd-Frank Act and the regulations promulgated thereunder have affected and are likely in the future to affect our operations in terms of increased oversight of financial services products by the CFPB and the imposition of restrictions on the terms of certain loans. Among regulations the CFPB has promulgated are mortgage servicing regulations that became effective January 10, 2014 and are applicable to the remaining real estate loan portfolio serviced by or for Springleaf. Amendments to some sections of these mortgage servicing regulations became effective on October 19, 2017 some become effective on April 19, 2018. The CFPB has significant authority to implement and enforce federal consumer finance laws, including the new protections established in the Dodd-Frank Act, as well as the authority to identify and prohibit unfair, deceptive, and abusive acts and practices. In addition, under the Dodd-Frank Act, securitizations of loan portfolios are subject to certain restrictions and additional requirements, including requirements that the originator retain a portion of the credit risk of the securities sold and the reporting of buyback requests from investors. We also utilize third-party debt collectors and will continue to be responsible for oversight of their procedures and controls.
The CFPB has supervisory, examination and enforcement authority with respect to various federal consumer protection laws for some providers of consumer financial products and services, such as any nonbank that it has reasonable cause to determine has engaged or is engaging in conduct that poses risks to consumers with regard to consumer financial products or services. In addition to the authority to bring nonbanks under the CFPB’s supervisory authority based on risk determinations, the CFPB also has authority under the Dodd-Frank Act to supervise nonbanks, regardless of size, in certain specific markets, such as mortgage companies (including mortgage originators, brokers and servicers) and payday lenders. Currently, the CFPB has supervisory authority over us with respect to mortgage servicing and mortgage origination, which allows the CFPB to conduct an examination of our mortgage servicing practices and our prior mortgage origination practices.
The Dodd-Frank Act also gives the CFPB supervisory authority over entities that are designated as “larger participants” in certain financial services markets, including the auto financing market and the consumer installment lending market. On June 30, 2015, the CFPB published its final rule for designating “larger participants” in the auto financing market. With the adoption of this regulation, we are a larger participant in the auto financing market and are subject to supervision and examination by the CFPB for our auto loan business, including loans that are secured by autos and refinances of loans secured by autos that were for the purchase of autos. In its Fall 2016 rulemaking agenda, the CFPB advised that its “next” larger-participant rulemaking would focus on the markets for “consumer installment loans and vehicle title loans.” We expect to eventually be designated a “larger participant” for this market and to become subject to supervision and examination by the CFPB for our consumer loan business although the acting director appointed by President Trump, Mick Mulvaney, has announced a 30 day freeze on all new regulations.
On October 5, 2017, the CFPB issued its final rule for Payday, Vehicle Title, and Certain High-Cost Installment Loans (the “small-dollar rule”). The final small-dollar rule does not apply to any loan made by the Company because our loans have a term of 46+ days, no balloon payment, and an APR limit of 36%. The proposed rule, published in 2016, had covered a relatively small segment of our loans because it calculated the 36% high-cost coverage threshold as an “all-in” APR, a term that included the cost of insurance and other ancillary products purchased within 3 days of the loan closing date. The final rule calculates the 36% figure under the traditional method prescribed by the Truth-In-Lending Act (TILA). Because the final rule replaced the proposed rule’s “all-in” APR calculation with a TILA APR calculation - a change that the Company advocated in the public comment letter it submitted to the CFPB - the final rule covers no loan made by the Company, even if the loan is both sold with insurance and secured by a vehicle or recurring ACH authorization.
The CFPB also has enforcement authority and is authorized to conduct investigations to determine whether any person is engaging in, or has engaged in, conduct that violates federal consumer financial protection laws, and to initiate enforcement
16
actions for such violations, regardless of its direct supervisory authority. Investigations may be conducted jointly with other regulators. In furtherance of its regulatory and supervisory powers, the CFPB has the authority to impose monetary penalties for violations of applicable federal consumer financial laws, require remediation of practices and pursue administrative proceedings or litigation for violations of applicable federal consumer financial laws (including the CFPB’s own rules). The CFPB has the authority to obtain cease and desist orders (which can include orders for restitution or rescission of contracts, as well as other kinds of affirmative relief) and monetary penalties ranging from $5,000 per day for ordinary violations of federal consumer financial laws to $25,000 per day for reckless violations and $1 million per day for knowing violations. In addition, the CFPB can assess civil penalties for Tier 1, 2, and 3 penalties set forth in Section 1055 of the Dodd-Frank Act ranging from over $5,000 to over $1 million per violation.
Also, where a company has violated Title X of the Dodd-Frank Act or CFPB regulations implemented thereunder, the Dodd-Frank Act empowers state attorneys general and state regulators to bring civil actions to remedy violations of state law. If the CFPB or one or more states attorneys general or state regulators believe that we have violated any of the applicable laws or regulations, they could exercise their enforcement powers in ways that could have a material adverse effect on us or our business. The CFPB has actively utilized this enforcement authority against financial institutions and financial service providers by imposing significant monetary penalties; and ordering (i) restitution, (ii) mandatory changes to compliance policies and procedures, (iii) enhanced oversight and control over affiliate and third-party vendor agreements and services and (iv) mandatory review of business practices, policies and procedures by third-party auditors and consultants. If, as a result of an examination, the CFPB were to conclude that our loan origination or servicing activities violate applicable law or regulations, we could be subject to a formal or informal enforcement action. Formal enforcement actions are generally made public, which carries reputational risk. We have not been notified of any planned examinations or enforcement actions by the CFPB.
The Dodd-Frank Act also may adversely affect the securitization market because it requires, among other things, that a securitizer generally retain not less than 5% of the credit risk for certain types of securitized assets that are created, transferred, sold, or conveyed through issuance of asset-backed securities with an exception for securitizations that are wholly composed of “qualified residential mortgages.” The final rules implementing the risk retention requirements of Section 941 of the Dodd-Frank Act became effective on February 23, 2015. Compliance with the rule with respect to asset-backed securities collateralized by residential mortgages was required beginning on December 24, 2015. Compliance with the rule with regard to all other classes of asset-backed securities was required beginning on December 24, 2016. The risk retention requirement may limit our ability to securitize loans and impose on us additional compliance requirements to meet origination and servicing criteria for qualified residential mortgages. The impact of the risk retention rule on the asset-backed securities market remains uncertain. Furthermore, the Securities and Exchange Commission (the SEC) adopted significant revisions to Regulation AB, imposing new requirements for asset-level disclosures for asset-backed securities backed by real estate related assets, auto related assets, or backed by debt securities. This could result in sweeping changes to the commercial and residential mortgage loan securitization markets, as well as to the market for the re-securitization of mortgage-backed securities.
State Laws
Various state laws and regulations also govern personal loans and real estate secured loans. Many states have laws and regulations that are similar to the federal laws referred to above, but the degree and nature of such laws and regulations vary from state to state. While federal law preempts state law in the event of certain conflicts, compliance with state laws and regulations is still required in the absence of conflicts.
In general, these additional state laws and regulations, under which we conduct a substantial amount of our lending business:
|
•
|
provide for state licensing and periodic examination of lenders and loan originators, including state laws adopted or amended to comply with licensing requirements of the federal Secure and Fair Enforcement for Mortgage Licensing Act of 2008 (which, in some states, requires licensing of individuals who perform real estate loan modifications);
|
|
•
|
require the filing of reports with regulators and compliance with state regulatory capital requirements;
|
|
•
|
impose maximum term, amount, interest rate, and other charge limitations;
|
|
•
|
regulate whether and under what circumstances we may offer insurance and other ancillary products in connection with a lending transaction; and
|
|
•
|
provide for additional consumer protections.
|
There is a clear trend of increased state regulation on loan origination, servicing and collection, as well as more detailed reporting, more detailed examinations, and coordination of examinations among the states.
State authorities also regulate and supervise our insurance business. The extent of such regulation varies by product and by state, but relates primarily to the following:
17
|
•
|
licensing;
|
|
•
|
conduct of business, including marketing and sales practices;
|
|
•
|
periodic financial and market conduct examination of the affairs of insurers;
|
|
•
|
form and content of required financial reports;
|
|
•
|
standards of solvency;
|
|
•
|
limitations on the payment of dividends and other affiliate transactions;
|
|
•
|
types of products offered;
|
|
•
|
approval of policy forms and premium rates;
|
|
•
|
formulas used to calculate any unearned premium refund due to an insured customer;
|
|
•
|
permissible investments;
|
|
•
|
reserve requirements for unearned premiums, losses, and other purposes; and
|
|
•
|
claims processing.
|
The Canadian federal and provincial insurance regulators regulate and supervise the insurance made available to borrowers through a third party Canadian lender. Its regulation and supervision relates primarily to the following:
|
•
|
licensing;
|
|
•
|
conduct of business, including marketing and sales practices;
|
|
•
|
periodic financial and market conduct examination of the affairs of insurers;
|
|
•
|
form and content of required financial reports;
|
|
•
|
standards of solvency;
|
|
•
|
limitations on the payment of dividends and other affiliate transactions;
|
|
•
|
types of products offered; and
|
|
•
|
reserve requirements for unearned premiums, losses, and other purposes.
|
COMPETITION
We operate primarily in the consumer installment lending industry, focusing on the non-prime customer. As of
December 31, 2017
, OMH maintained a national footprint (defined as 500 or more branches and receivables over $2 billion) of brick and mortar branches. At December 31, 2017, we had over
2.3 million
customer accounts and over
1,600
branch offices.
There are a large number of local, regional and internet competitors in the consumer installment lending industry serving the large population of non-prime customers. We also compete with a large number of other types of financial institutions within our geographic footprint and over the Internet, including community banks and credit unions, that offer similar products and services. We believe that competition between consumer installment lenders occurs primarily on the basis of price, speed of service, flexibility of loan terms offered, and the quality of customer service provided.
We believe that we possess several competitive strengths that position us to capitalize on the significant growth and expansion opportunity created by the large supply-demand imbalance within our industry, and to compete effectively with other lenders in our industry. The capabilities resident in our national branch system provide us with a proven distribution channel for our personal loan and insurance products, allowing us to provide same-day fulfillment to approved customers and giving us a distinct competitive advantage over many industry participants who do not have—and cannot replicate without significant investment—a similar footprint. Our digital platform and our centralized operations also enhance our nationwide footprint by allowing us to serve customers who reside outside of our branch footprint. We believe our deep understanding of local markets and customers, together with our proprietary underwriting process, data analytics, and decisioning tools allow us to price, manage and monitor risk effectively through changing economic conditions. In addition, our high-touch relationship-based servicing model is a major contributor to our superior loan performance, and distinguishes us from our competitors.
SEASONALITY
See “Management’s Discussion and Analysis of Financial Condition and Results of Operations—Seasonality” included in this report for discussion of our seasonal trends.
EMPLOYEES
As of
December 31, 2017
, we had over
10,100
employees.
18
AVAILABLE INFORMATION
OMH files annual, quarterly, and current reports, proxy statements, and other information with the SEC. The SEC’s website,
www.sec.gov
, contains these reports and other information that registrants (including OMH) file electronically with the SEC. Readers may also read and copy any document that OMH files at the SEC’s Public Reference Room located at 100 F Street, N.E., Washington, D.C. 20549, U.S.A. Please call the SEC at 1-800-SEC-0330 for further information on the Public Reference Room.
These reports are also available free of charge through our website,
www.onemainfinancial.com
under “Investor Relations,” as soon as reasonably practicable after we file them with, or furnish them to, the SEC.
In addition, our Code of Business Conduct and Ethics (the “Code of Ethics”), our Code of Ethics for Principal Executive and Senior Financial Officers (the “Financial Officers’ Code of Ethics”), our Corporate Governance Guidelines and the charters of the committees of our Board of Directors are posted on our website at
www.onemainfinancial.com
under “Investor Relations”
and printed copies are available upon request
.
We intend to disclose any material amendments to or waivers of our Code of Ethics and Financial Officers’ Code of Ethics requiring disclosure under applicable SEC or NYSE rules on our website within four business days of the date of any such amendment or waiver in lieu of filing a Form 8-K pursuant to Item 5.05 thereof.
The information on our website is not incorporated by reference into this report. The website addresses listed above are provided for the information of the reader and are not intended to be active links.
19
We face a variety of risks that are inherent in our business. Accordingly, you should carefully consider the following discussion of risks in addition to the other information regarding our business provided in this report and in other documents we file with the SEC. These risks are subject to contingencies which may or may not occur, and we are not able to express a view on the likelihood of any such contingency occurring. New risks may emerge at any time, and we cannot predict those risks or estimate the extent to which they may affect our business or financial performance.
RISKS RELATED TO OUR BUSINESS
Our consolidated results of operations and financial condition and our borrowers’ ability to make payments on their loans have been, and may in the future be, adversely affected by economic conditions and other factors that we cannot control.
Uncertainty and negative trends in general economic conditions in the United States and abroad, including significant tightening of credit markets and a general decline in the value of real property, historically have created a difficult operating environment for our businesses and other companies in our industries. Many factors, including factors that are beyond our control, may impact our consolidated results of operations or financial condition and/or affect our borrowers’ willingness or capacity to make payments on their loans. These factors include: unemployment levels, housing markets, energy costs and interest rates; events such as natural disasters, acts of war, terrorism, catastrophes, major medical expenses, divorce or death that affect our borrowers; and the quality of the collateral underlying our receivables. If we experience an economic downturn or if the U.S. economy is unable to continue or sustain its recovery from the most recent economic downturn, or if we become affected by other events beyond our control, we may experience a significant reduction in revenues, earnings and cash flows, difficulties accessing capital and a deterioration in the value of our investments. We may also become exposed to increased credit risk from our customers and third parties who have obligations to us.
Moreover, our customers are primarily non-prime borrowers. Accordingly, such borrowers have historically been, and may in the future become, more likely to be affected, or more severely affected, by adverse macroeconomic conditions. If our borrowers default under a finance receivable held directly by us, we will bear a risk of loss of principal to the extent of any deficiency between the value of the collateral, if any, and the outstanding principal and accrued but unpaid interest of the finance receivable, which could adversely affect our cash flow from operations. In addition, foreclosure of a real estate loan (part of our legacy real estate loan portfolio) is an expensive and lengthy process that can negatively affect our anticipated return on the foreclosed loan. The cost to service our loans may also increase without a corresponding increase in our finance charge income.
Also, certain geographic concentrations of our loan portfolio may occur or increase as we adjust our risk and loss tolerance and strategy to achieve our profitability goals. Any geographic concentration may expose us to an increased risk of loss if that geographic region experiences higher unemployment rates than average, natural disasters, weak economic conditions, or other adverse economic factors that disproportionately affect that region. See Note
5
of the Notes to Consolidated Financial Statements included in this report for quantification of our largest concentrations of net finance receivables.
If aspects of our business, including the quality of our finance receivables portfolio or our borrowers, are significantly affected by economic changes or any other conditions in the future, we cannot be certain that our policies and procedures for underwriting, processing and servicing loans will adequately adapt to such changes. If we fail to adapt to changing economic conditions or other factors, or if such changes affect our borrowers’ willingness or capacity to repay their loans, our results of operations, financial condition and liquidity would be materially adversely affected.
There are risks associated with the acquisition or sale of assets or businesses or the formation, termination or operation of joint ventures or other strategic alliances or arrangements, including the possibility of increased delinquencies and losses, difficulties with integrating loans into our servicing platform and disruption to our ongoing business, which could have a material adverse effect on our results of operations, financial condition and liquidity.
We have previously acquired, and in the future may acquire, assets or businesses, including large portfolios of finance receivables, either through the direct purchase of such assets or the purchase of the equity of a company with such a portfolio. Since we will not have originated or serviced the loans we acquire, we may not be aware of legal or other deficiencies related to origination or servicing, and our review of the portfolio prior to purchase may not uncover those deficiencies. Further, we may have limited recourse against the seller of the portfolio.
The ability to integrate and successfully service newly acquired loan portfolios will depend in large part on the success of our development and integration of expanded servicing capabilities, including additional personnel. We may fail to realize some or
20
all of the anticipated benefits of the transaction if the integration process takes longer, or is more costly, than expected. Our failure to meet the challenges involved in successfully integrating the acquired portfolios with our current business or otherwise to realize any of the anticipated benefits of the transaction could impair our operations. In addition, the integration of future large portfolio or other asset or business acquisitions and the formation, termination or operation of joint ventures or other strategic alliances or arrangements are complex, time-consuming and expensive processes that, without proper planning and effective and timely implementation, could significantly disrupt our business.
Potential difficulties we may encounter in connection with these transactions and arrangements include, but are not limited to, the following:
|
•
|
the integration of the assets or business into our information technology platforms and servicing systems;
|
|
•
|
the quality of servicing during any interim servicing period after we purchase a portfolio but before we assume servicing obligations from the seller or its agents;
|
|
•
|
the disruption to our ongoing businesses and distraction of our management teams from ongoing business concerns;
|
|
•
|
incomplete or inaccurate files and records;
|
|
•
|
the retention of existing customers;
|
|
•
|
the creation of uniform standards, controls, procedures, policies and information systems;
|
|
•
|
the occurrence of unanticipated expenses; and
|
|
•
|
potential unknown liabilities associated with the transactions, including legal liability related to origination and servicing prior to the acquisition.
|
For example, in some cases loan files and other information (including servicing records) may be incomplete or inaccurate. If our employees are unable to access customer information easily, or if we are unable to produce originals or copies of documents or accurate information about the loans, collections could be affected significantly, and we may not be able to enforce our right to collect in some cases. Similarly, collections could be affected by any changes to our collection practices, the restructuring of any key servicing functions, transfer of files and other changes that would result from our assumption of the servicing of the acquired portfolios.
The anticipated benefits and synergies of our future acquisitions will assume a successful integration, and will be based on projections, which are inherently uncertain, as well as other assumptions. Even if integration is successful, anticipated benefits and synergies may not be achieved.
Our recent underwriting changes and strategy of increasing the proportion of secured loan originations within our loan portfolio may lead to declines in, or slower growth than anticipated of, our personal loan net finance receivables and yield, which could have a material adverse effect on our business, results of operations and growth prospects.
Secured loans typically carry lower yields relative to unsecured personal loans. If we are unable to successfully convert lower credit tier customers to our secured loan products or otherwise increase new originations of secured personal loans, this will adversely affect our ability to grow personal loan net finance receivables. In addition, as secured loans continue to represent a larger proportion of our loan portfolio, our yields may be lower than our historical yields in prior periods.
If our estimates of allowance for finance receivable losses are not adequate to absorb actual losses, our provision for finance receivable losses would increase, which would adversely affect our results of operations.
We maintain an allowance for finance receivable losses. To estimate the appropriate level of allowance for finance receivable losses, we consider known and relevant internal and external factors that affect finance receivable collectability, including the total amount of finance receivables outstanding, historical finance receivable charge-offs, our current collection patterns, and economic trends. Our methodology for establishing our allowance for finance receivable losses is based on the guidance in Accounting Standards Codification (“ASC”) 450, Contingencies, and, in part, on our historic loss experience. If customer behavior changes as a result of economic conditions and if we are unable to predict how the unemployment rate, housing foreclosures, and general economic uncertainty may affect our allowance for finance receivable losses, our allowance for finance receivable losses may be inadequate. Our allowance for finance receivable losses is an estimate, and if actual finance
21
receivable losses are materially greater than our allowance for finance receivable losses, our results of operations could be adversely affected. Neither state regulators nor federal regulators regulate our allowance for finance receivable losses.
In June of 2016, the Financial Accounting Standards Board issued Accounting Standard Update ASU 2016-13,
Financial Instruments-Credit Losses (Topic 326): Measurement of Credit Losses on Financial Instruments.
This ASU significantly changes the way that entities will be required to measure credit losses. The new standard requires that the estimated credit loss be based upon an “expected credit loss” approach rather than the “incurred loss” approach currently required. The new approach will require entities to measure all expected credit losses for financial assets based on historical experience, current conditions, and reasonable forecasts of collectability. It is anticipated that the expected credit loss model may require earlier recognition of credit losses than the incurred loss approach. This ASU will become effective for the Company for fiscal years beginning January 1, 2020. Early adoption is permitted for fiscal years beginning January 1, 2019. We believe the adoption of this ASU will have a material effect on our consolidated financial statements. See Note
4
of the Notes to Consolidated Financial Statements included in this report for more information on this new accounting standard.
Our risk management efforts may not be effective.
We could incur substantial losses and our business operations could be disrupted if we are unable to effectively identify, manage, monitor, and mitigate financial risks, such as credit risk, interest rate risk, prepayment risk, liquidity risk, and other market-related risks, as well as operational risks related to our business, assets and liabilities. To the extent our models used to assess the creditworthiness of potential borrowers do not adequately identify potential risks, the valuations produced would not adequately represent the risk profile of the borrower and could result in a riskier finance receivable profile than originally identified. Our risk management policies, procedures, and techniques, including our scoring technology, may not be sufficient to identify all of the risks we are exposed to, mitigate the risks we have identified or identify concentrations of risk or additional risks to which we may become subject in the future.
Our branch loan approval process is decentralized, which may result in variability of loan structures, and could adversely affect our results of operations, financial condition and liquidity.
Our branch finance receivable origination process is decentralized. We train our employees individually on-site in the branch to make loans that conform to our underwriting standards. Such training includes critical aspects of state and federal regulatory compliance, cash handling, account management and customer relations. In certain circumstances, subject to approval by district managers and/or directors of operations in certain cases, our branch officers have some authority to approve and structure loans within broadly written underwriting guidelines rather than having all loan terms approved centrally. As a result, there may be variability in finance receivable structure (e.g., whether or not collateral is taken for the loan) and loan portfolios among branch offices or regions, even when underwriting policies are followed. Moreover, we cannot be certain that every loan is made in accordance with our underwriting standards and rules, and we have in the past experienced some instances of loans extended that varied from our underwriting standards. The nature of our approval process could adversely affect our operating results and variances in underwriting standards and lack of supervision could expose us to greater delinquencies and charge-offs than we have historically experienced, which could adversely affect our results of operations, financial condition and liquidity.
Changes in market conditions, including rising interest rates, could adversely affect the rate at which our borrowers prepay their loans and the value of our finance receivables portfolio, as well as increase our financing cost, which could negatively affect our results of operations, financial condition and liquidity.
Changing market conditions, including but not limited to, changes in interest rates, the availability of credit, the relative economic vitality of the area in which our borrowers and their assets are located, changes in tax laws, other opportunities for investment available to our customers, homeowner mobility, and other economic, social, geographic, demographic, and legal factors beyond our control, may affect the rates at which our borrowers prepay their loans. Generally, in situations where prepayment rates have slowed, the weighted-average life of our finance receivables has increased. Any increase in interest rates may further slow the rate of prepayment for our finance receivables, which could adversely affect our liquidity by reducing the cash flows from, and the value of, the finance receivables we hold for sale or utilize as collateral in our secured funding transactions.
Moreover, the vast majority of our finance receivables are fixed-rate finance receivables, which generally decline in value if interest rates increase. As such, if changing market conditions cause interest rates to increase substantially, the value of our fixed-rate finance receivables could decline. Recent increases in market interest rates could negatively impact our net interest income and further increases in market interest rates could continue to negatively impact such net interest income, as well as our cash flow from operations and results of operations. Our consumer loans generally bear interest at a fixed rate and,
22
accordingly, we are generally unable to increase the interest rate on such loans to offset any increases in our cost of funds as market interest rates increase. Additionally, because we are subject to applicable legal and regulatory restrictions in certain jurisdictions that limit the maximum interest rate that we may charge on certain of our consumer loans, our yield, as well as our cash flows from operations and results of operations, could be materially and adversely affected if we are unable to increase the interest rates charged on newly originated loans to offset any increases in our cost of funds as market interest rates increase. Accordingly, any increase in interest rates could negatively affect our results of operations, financial condition and liquidity.
We may be required to indemnify, or repurchase finance receivables from, purchasers of finance receivables that we have sold or securitized, or which we will sell or securitize in the future, if our finance receivables fail to meet certain criteria or characteristics or under other circumstances, which could adversely affect our results of operations, financial condition and liquidity.
In 2016, we sold our interests in the SpringCastle Portfolio as a result of the SpringCastle Interests Sale, $602 million of personal loans in connection with the Lendmark Sale, and
$308 million
of our legacy real estate loan portfolio. We securitized
$9.8 billion
of our consumer loan portfolio as of December 31, 2017. In addition, we sold $6.4 billion of our legacy real estate loan portfolio in 2014. The documents governing our finance receivable sales and securitizations contain provisions that require us to indemnify the purchasers of securitized finance receivables, or to repurchase the affected finance receivables, under certain circumstances. While our sale and securitization documents vary, they generally contain customary provisions that may require us to repurchase finance receivables if:
|
•
|
our representations and warranties concerning the quality and characteristics of the finance receivable are inaccurate;
|
|
•
|
there is borrower fraud; or
|
|
•
|
we fail to comply, at the individual finance receivable level or otherwise, with regulatory requirements in connection with the origination and servicing of the finance receivables.
|
As a result of the current market environment, we believe that many purchasers of real estate loans (including through securitizations) are particularly aware of the conditions under which originators must indemnify purchasers or repurchase finance receivables, and would benefit from enforcing any repurchase remedies that they may have. At its extreme, our exposure to repurchases or our indemnification obligations under our representations and warranties could include the current unpaid balance of all finance receivables that we have sold or securitized and which are not subject to settlement agreements with purchasers.
The risk of loss on the finance receivables that we have securitized is recognized in our allowance for finance receivable losses since all of our consumer loan securitizations are recorded on-balance sheet. If we are required to indemnify purchasers or repurchase finance receivables that we sell that result in losses that exceed our reserve for sales recourse, or recognize losses on securitized finance receivables that exceed our recorded allowance for finance receivable losses associated with our securitizations, this could adversely affect our results of operations, financial condition and liquidity.
Our insurance operations are subject to a number of risks and uncertainties, including claims, catastrophic events, underwriting risks and dependence on a primary distribution channel.
Insurance claims and policyholder liabilities are difficult to predict and may exceed the related reserves set aside for claims (losses) and associated expenses for claims adjudication (loss adjustment expenses). Additionally, events such as hurricanes, tornados, earthquakes, pandemic disease, cyber security breaches and other types of catastrophes, and prolonged economic downturns, could adversely affect our financial condition or results of operations. Other risks relating to our insurance operations include changes to laws and regulations applicable to us, as well as changes to the regulatory environment. Examples include changes to laws or regulations affecting capital and reserve requirements; frequency and type of regulatory monitoring and reporting; consumer privacy, use of customer data and data security; benefits or loss ratio requirements; insurance producer licensing or appointment requirements; required disclosures to consumers; and collateral protection insurance (i.e., insurance some of our lender companies purchase, at the customer’s expense, on that customer’s loan collateral for the periods of time the customer fails to adequately, as required by his loan, insure his collateral). Because our customers do not affirmatively consent to collateral protection insurance at the time it is purchased, and hence do not directly agree to the amount charged for it, regulators may in the future prohibit our insurance companies from providing this insurance to our lending operations. Moreover, our insurance companies are predominately dependent on our lending operations as the primary source of business and product distribution. If our lending operations discontinue offering insurance products, including as a result of regulatory requirements, our insurance operations would need to find an alternate distribution partner for their products.
23
We are a party to various lawsuits and proceedings and may become a party to various lawsuits and proceedings in the future which, if resolved in a manner adverse to us, could materially adversely affect our results of operations, financial condition and liquidity.
In the normal course of business, from time to time, we have been named and may be named in the future as a defendant in various legal actions, including governmental investigations, examinations or other proceedings, arbitrations, class actions and other litigation, arising in connection with our business activities. Certain of the legal actions include claims for substantial compensatory and/or punitive damages, or claims for indeterminate amounts of damages. Some of these proceedings are pending in jurisdictions that permit damage awards disproportionate to the actual economic damages alleged to have been incurred. The continued occurrences of large damage awards in general in the United States, including large punitive damage awards in certain jurisdictions that bear little or no relation to actual economic damages incurred by plaintiffs, create the potential for an unpredictable result in any given proceeding. A large judgment that is adverse to us could cause our reputation to suffer, encourage additional lawsuits against us and have a material adverse effect on our results of operations, financial condition and liquidity. For additional information regarding pending legal proceedings and other contingencies, see Note
19
of the Notes to Consolidated Financial Statements included in this report.
If we lose the services of any of our key management personnel, our business could suffer.
Our future success significantly depends on the continued service and performance of our key management personnel. Competition for these employees is intense and we may not be able to attract and retain key personnel. We do not maintain any “key man” or other related insurance. The loss of the service of members of our senior management or key team members, or the inability to attract additional qualified personnel as needed, could materially harm our business.
Employee misconduct could harm us by subjecting us to monetary loss, significant legal liability, regulatory scrutiny and reputational harm.
Our reputation is critical to maintaining and developing relationships with our existing and potential customers and third parties with whom we do business. There is a risk that our employees could engage in misconduct that adversely affects our business. For example, if an employee were to engage—or be accused of engaging—in illegal or suspicious activities including fraud or theft, we could suffer direct losses from the activity, and in addition we could be subject to regulatory sanctions and suffer serious harm to our reputation, financial condition, customer relationships, and ability to attract future customers or employees. Employee misconduct could prompt regulators to allege or to determine based upon such misconduct that we have not established adequate supervisory systems and procedures to inform employees of applicable rules or to detect and deter violations of such rules. It is not always possible to deter employee misconduct, and the precautions we take to detect and prevent misconduct may not be effective in all cases. Misconduct by our employees, or even unsubstantiated allegations of misconduct, could result in a material adverse effect on our reputation and our business.
Current and proposed regulations relating to consumer privacy, data protection and information security could increase our costs.
We are subject to a number of federal and state consumer privacy, data protection, and information security laws and regulations. For example, we are subject to the federal Gramm-Leach-Bliley Act, which governs the use of personal financial information by financial institutions. Moreover, various federal and state regulatory agencies require us to notify customers in the event of a security breach. Federal and state legislators and regulators are increasingly pursuing new guidance, laws, and regulation. Compliance with current or future customer privacy, data protection, and information security laws and regulations could result in higher compliance, technology or other operating costs. Any violations of these laws and regulations may require us to change our business practices or operational structure, and could subject us to legal claims, monetary penalties, sanctions, and the obligation to indemnify and/or notify customers or take other remedial actions.
Significant disruptions in the operation of our information systems could have a material adverse effect on our business.
Our business relies heavily on information systems to deliver products and services to our customers, and to manage our ongoing operations. These systems may encounter service disruptions due to system, network or software failure, security breaches, computer viruses, natural disasters or other reasons. There can be no assurance that our policies and procedures addressing these issues will adequately address the disruption. A disruption could impair our ability to offer and process consumer loans, provide customer service, perform collections activities or perform other necessary business activities, which could result in a loss of customer business, subject us to additional regulatory scrutiny, or expose us to civil litigation and possible financial liability.
24
Security breaches in our information systems, in the information systems of third parties or in our branches, central servicing facilities, or our internet lending platform or our proprietary company data held by third parties could adversely affect our reputation and could subject us to significant costs and regulatory penalties.
Our operations rely heavily on the secure processing, storage and transmission of confidential customer and other information in our computer systems and networks. Our branch offices and centralized servicing centers, as well as our administrative and executive offices, are part of an electronic information network that is designed to permit us to originate and track finance receivables and collections, and perform several other tasks that are part of our everyday operations. Our computer systems, software, and networks may be vulnerable to breaches, unauthorized access, misuse, computer viruses, or other malicious code that could result in disruption to our business, or the loss or theft of confidential information, including customer information. Any failure, interruption, or breach in our cyber security, including through employee misconduct or any failure of our back-up systems or failure to maintain adequate security surrounding customer information, could result in reputational harm, disruption in the management of our customer relationships, or the inability to originate, process and service our finance receivable products. Further, any of these cyber security and operational risks could result in a loss of customer business, subject us to additional regulatory scrutiny, or expose us to lawsuits by customers for identity theft or other damages resulting from the misuse of their personal information and possible financial liability, any of which could have a material adverse effect on our results of operations, financial condition and liquidity. In addition, regulators may impose penalties or require remedial action if they identify weaknesses in our security systems, and we may be required to incur significant costs to increase our cyber security to address any vulnerabilities that may be discovered or to remediate the harm caused by any security breaches. As part of our business, we may share confidential customer information and proprietary information with clients, vendors, service providers, and business partners. The information systems of these third parties may be vulnerable to security breaches and we may not be able to ensure that these third parties have appropriate security controls in place to protect the information we share with them. If our confidential information is intercepted, stolen, misused, or mishandled while in possession of a third party, it could result in reputational harm to us, loss of customer business, and additional regulatory scrutiny, and it could expose us to civil litigation and possible financial liability, any of which could have a material adverse effect on our results of operations, financial condition and liquidity. Although we have insurance that is intended to cover certain losses from such events, there can be no assurance that such insurance will be adequate or available.
Our branch offices and centralized servicing centers have physical customer records necessary for day-to-day operations that contain extensive confidential information about our customers, including financial and personally identifiable information. We also retain physical records in various storage locations outside of these locations. The loss or theft of customer information and data from our branch offices, central servicing facilities, or other storage locations could subject us to additional regulatory scrutiny and penalties, and could expose us to civil litigation and possible financial liability, which could have a material adverse effect on our results of operations, financial condition and liquidity. In addition, if we cannot locate original documents (or copies, in some cases), we may not be able to collect on the finance receivables for which we do not have documents.
We may not be able to make technological improvements as quickly as some of our competitors, which could harm our ability to compete with our competitors and adversely affect our results of operations, financial condition and liquidity.
The financial services industry is undergoing rapid technological changes, with frequent introductions of new technology-driven products and services. The effective use of technology increases efficiency and enables financial and lending institutions to better serve customers and reduce costs. Our future success and, in particular, the success of our centralized operations, will depend, in part, upon our ability to address the needs of our customers by using technology to provide products and services that will satisfy customer demands for convenience, as well as to create additional efficiencies in our operations. We may not be able to effectively implement new technology-driven products and services as quickly as some of our competitors or be successful in marketing these products and services to our customers. Failure to successfully keep pace with technological change affecting the financial services industry could harm our ability to compete with our competitors and adversely affect our results of operations, financial condition and liquidity.
We could face environmental liability and costs for damage caused by hazardous waste (including the cost of cleaning up contaminated property) if we foreclose upon or otherwise take title to real estate pledged as collateral.
If a real estate loan goes into default, we may start foreclosure proceedings in appropriate circumstances, which could result in our taking title to the mortgaged real estate. We also consider alternatives to foreclosure, such as “short sales,” where we do not take title to mortgaged real estate. There is a risk that toxic or hazardous substances could be found on property after we take title. In addition, we own certain properties through which we operate our business, such as the buildings at our headquarters and certain servicing facilities. As the owner of any property where hazardous waste is present, we could be held liable for clean-up and remediation costs, as well as damages for any personal injuries or property damage caused by the condition of the property. We may also be responsible for these costs if we are in the chain of title for the property, even if we were not
25
responsible for the contamination and even if the contamination is not discovered until after we have sold the property. Costs related to these activities and damages could be substantial. Although we have policies and procedures in place to investigate properties for potential hazardous substances before taking title to properties, these reviews may not always uncover potential environmental hazards.
If goodwill and other intangible assets that we recorded in connection with the OneMain Acquisition becomes impaired, it could have a negative impact on our profitability.
Goodwill represents the amount of acquisition cost over the fair value of net assets we acquired in connection with the OneMain Acquisition. If the carrying amount of goodwill and other intangible assets exceeds the fair value, an impairment loss is recognized in an amount equal to that excess. Any such adjustments are reflected in our results of operations in the periods in which the impairments become known. At December 31,
2017
, our goodwill and other intangible assets totaled
$1.4 billion
and
$440 million
, respectively. While we have recorded no impairment charges on our goodwill and other intangible assets during
2017
and
2016
, there can be no assurance that our future evaluations of goodwill and other intangible assets will not result in findings of impairments and related write-downs, which may have a material adverse effect on our financial condition and results of operations.
We ceased real estate lending and the purchase of retail finance contracts in 2012 and are in the process of liquidating these portfolios, which subjects us to certain risks which could adversely affect our results of operations, financial condition and liquidity if we do not effectively manage such risks.
In connection with our plan for strategic growth and new focus on consumer lending, we have engaged in a number of restructuring initiatives, including, but not limited to, ceasing real estate lending, ceasing purchasing retail sales contracts and revolving retail accounts from the sale of consumer goods and services by retail merchants, closing certain of our branches and reducing our workforce.
In 2014, we entered into a series of transactions relating to the sales of our beneficial interests in our real estate loans, the related servicing of these loans, and the sales of certain performing and non-performing real estate loans, which substantially completed our plan to liquidate our real estate loans. Consequently, as of
December 31, 2017
, our real estate loans held for investment and held for sale totaled
$128 million
and
$132 million
, respectively.
Moreover, if we fail to realize the anticipated benefits of the restructuring of our business and associated liquidation of our legacy portfolios or are subjected to litigation or claims for indemnification for breaches of representations or warranties made in connection with our previous real estate loan sales, we may experience an adverse effect on our results of operations, financial condition and liquidity.
As part of our growth strategy, we have committed to building our consumer lending business. If we are unable to successfully implement our growth strategy, our results of operations, financial condition and liquidity may be materially adversely affected.
We believe that our future success depends on our ability to implement our growth strategy, the key feature of which has been to shift our primary focus to originating consumer loans as well as acquiring portfolios of consumer loans, pursuing acquisitions of companies, and/or establishing joint ventures or other strategic alliances or arrangements. We have also expanded into internet lending through our centralized operations.
We may not be able to implement our new strategy successfully, and our success depends on a number of factors, including, but not limited to, our ability to:
|
•
|
address the risks associated with our focus on personal loans (including direct auto loans), including, but not limited to consumer demand for finance receivables, and changes in economic conditions and interest rates;
|
|
•
|
address the risks associated with the new centralized method of originating and servicing our internet loans through our centralized operations, which represents a departure from our traditional high-touch branch-based servicing function and includes the potential for higher default and delinquency rates;
|
|
•
|
integrate, and develop the expertise required to capitalize on, our centralized operations;
|
|
•
|
obtain regulatory approval in connection with the acquisition of consumer loan portfolios and/or companies in the business of selling consumer loans or related products;
|
26
|
•
|
comply with regulations in connection with doing business and offering loan products over the Internet, including various state and federal e-signature rules mandating that certain disclosures be made and certain steps be followed in order to obtain and authenticate e-signatures, with which we have limited experience;
|
|
•
|
finance future growth; and
|
|
•
|
successfully source, underwrite and integrate new acquisitions of loan portfolios and other businesses.
|
In order for us to realize the benefits associated with our new focus on originating and servicing consumer loans and growing our business, we must implement our strategic objectives in a timely and cost-effective manner as well as anticipate and address any risks to which we may become subject. In any event, we may not realize these benefits for many years, or our competitors may introduce more compelling products, services or enhancements. If we are not able to realize the benefits, or if we do not do so in a timely manner, our results of operations, financial condition and liquidity could be negatively affected which would have a material adverse effect on business.
RISKS RELATED TO OUR INDUSTRY AND REGULATION
We operate in a highly competitive market, and we cannot ensure that the competitive pressures we face will not have a material adverse effect on our results of operations, financial condition and liquidity.
The consumer finance industry is highly competitive. Our profitability depends, in large part, on our ability to originate finance receivables. We compete with other consumer finance companies as well as other types of financial institutions that offer similar products and services in originating finance receivables. Some of these competitors may have greater financial, technical and marketing resources than we possess. Some competitors may also have a lower cost of funds and access to funding sources that may not be available to us. While banks and credit card companies have decreased their lending to non-prime customers in recent years, there is no assurance that such lenders will not resume those lending activities. Further, because of increased regulatory pressure on payday lenders, many of those lenders are starting to make more traditional installment consumer loans in order to reduce regulatory scrutiny of their practices, which could increase competition in markets in which we operate. In addition, in July 2013, the Dodd-Frank Act’s three-year moratorium on banks affiliated with non-financial businesses expired. When the Dodd-Frank Act was enacted in 2010, a moratorium was imposed that prohibited the Federal Deposit Insurance Corporation from approving deposit insurance for certain banks controlled by non-financial commercial enterprises. The expiration of the moratorium could result in an increase of traditionally non-financial enterprises entering the banking space, which could increase the number of our competitors. There can be no assurance that the competitive pressures we face will not have a material adverse effect on our results of operations, financial condition and liquidity.
Our businesses are subject to regulation in the jurisdictions in which we conduct our business.
Our businesses are subject to numerous federal, state and local laws and regulations, and various state authorities regulate and supervise our insurance operations. The laws under which a substantial amount of our consumer and real estate businesses are conducted generally: provide for state licensing of lenders and, in some cases, licensing of employees involved in real estate loan modifications; impose limits on the term of a finance receivable, amounts, interest rates and charges on the finance receivables; regulate whether and under what circumstances insurance and other ancillary products may be offered to consumers in connection with a lending transaction; regulate the manner in which we use personal data; and provide for other consumer protections. We are also subject to extensive servicing regulations which we must comply with when servicing our legacy real estate loans and the SpringCastle Portfolio, and which we will have to comply with if we acquire loan portfolios in the future and assume the servicing obligations for the acquired loans or other financial assets. The extent of state regulation of our insurance business varies by product and by jurisdiction, but relates primarily to the following: licensing; conduct of business; periodic examination of the affairs of insurers; form and content of required financial reports; standards of solvency; limitations on dividend payments and other related party transactions; types of products offered; approval of policy forms and premium rates; permissible investments; deposits of securities for the benefit of policyholders; reserve requirements for unearned premiums, losses and other purposes; and claims processing.
All of our operations are subject to regular examination by state and federal regulators, and as a whole, our entities are subject to several hundred regulatory examinations in a given year. These examinations may result in requirements to change our policies or practices, and in some cases, we are required to pay monetary fines or make reimbursements to customers. Many state regulators and some federal regulators have indicated an intention to pool their resources in order to conduct examinations of licensed entities, including us, at the same time (referred to as a “multi-state” examination). This could result in more in-depth examinations, which could be more costly and lead to more significant enforcement actions.
27
The CFPB has outlined several proposals under consideration for the purpose of requiring lenders to take steps to ensure consumers have the financial ability to repay their loans. The proposals under consideration would require lenders to determine at the outset of each loan whether a consumer can afford to borrow from the lender and would require that lenders comply with various restrictions designed to ensure that consumers can affordably repay their debt to the lender. To date, the proposals under consideration by the CFPB have not been adopted. If adopted, the proposals outlined by the CFPB may require the Company to make significant changes to its lending practices to develop compliant procedures.
We are also subject to potential enforcement, supervisions and other actions that may be brought by state attorneys general or other state enforcement authorities and other governmental agencies. Any such actions could subject us to civil money penalties, customer remediation and increased compliance costs, as well as damage our reputation and brand and could limit or prohibit our ability to offer certain products and services or engage in certain business practices.
State attorneys general have stated their intention to fill any void left by diminished CFPB enforcement and have a variety of tools at their disposal to enforce state and federal consumer financial laws. First, Section 1042 of the Dodd-Frank Act grants state attorneys general the ability to enforce the Dodd-Frank Act and regulations promulgated under the Dodd-Frank Act’s authority and to secure remedies provided in the Dodd-Frank Act against entities within their jurisdiction. Even if an overhaul of the Dodd-Frank Act eliminates Section 1042, state attorneys general will retain their enforcement authority under state law with respect to unfair or deceptive practices. Under these statutes, state attorneys general may generally conduct investigations, bring actions, and recover civil penalties or obtain injunctive relief against entities engaging in unfair, deceptive, or fraudulent acts. Attorneys general may also coordinate among themselves to enter into multi-state actions or settlements. Finally, several consumer financial laws like the Truth in Lending Act and Fair Credit Reporting Act grant enforcement or litigation authority to state attorneys general. Should the CFPB decrease its enforcement activity under the Trump administration, we expect to see an increase in actions brought by state attorneys general.
The Department of Defense has made changes to the regulations that have been promulgated as a result of the Military Lending Act. Effective October 3, 2016, we are subject to the limitations of the Military Lending Act, which places a 36% limitation on all fees, charges, interest rate and credit and non-credit insurance premiums for loans made to members of the military or their dependents. We are also no longer able to make non-purchase money loans secured by motor vehicles to service members and their dependents.
We are also subject to potential changes in state law, which could lower the interest-rate limit that non-depository financial institutions may charge for consumer loans or could expand the definition of interest under state law to include the cost of ancillary products, such as insurance.
We believe that we maintain all material licenses and permits required for our current operations and are in substantial compliance with all applicable federal, state and local regulations, but we may not be able to maintain all requisite licenses and permits, and the failure to satisfy those and other regulatory requirements could have a material adverse effect on our operations. In addition, changes in laws or regulations applicable to us could subject us to additional licensing, registration and other regulatory requirements in the future or could adversely affect our ability to operate or the manner in which we conduct business.
A material failure to comply with applicable laws and regulations could result in regulatory actions, including substantial fines or penalties, lawsuits and damage to our reputation, which could have a material adverse effect on our results of operations, financial condition and liquidity.
The Apollo-Värde Transaction may be deemed a change of control for purposes of certain of our state lending and insurance licenses pursuant to which we operate our lending and insurance businesses. Accordingly, we may be required to obtain approvals for the change of control from some state lending or insurance regulators.
For more information with respect to the regulatory framework affecting our businesses, see “Business—Regulation” included in this report.
The enactment of the Dodd-Frank Act and the creation of the CFPB significantly increases our regulatory costs and burdens.
The Dodd-Frank Act was adopted in 2010. This law and the related regulations affect our operations in terms of increased oversight of financial services products by the CFPB, and the imposition of restrictions on the allowable terms for certain consumer credit transactions. The CFPB has significant authority to implement and enforce federal consumer finance laws, including the Truth in Lending Act, the Equal Credit Opportunity Act, the Fair Credit Billing Act and new requirements for
28
financial services products provided for in the Dodd-Frank Act, as well as the authority to identify and prohibit unfair, deceptive, or abusive acts and practices. In addition, the Dodd-Frank Act provides the CFPB with broad supervisory, examination and enforcement authority over various consumer financial products and services, including the ability to require reimbursements and other payments to customers for alleged legal violations, and to impose significant penalties, as well as injunctive relief that prohibits lenders from engaging in allegedly unlawful practices. Further, state attorneys general and state regulators are authorized to bring civil actions to enforce certain consumer protection provisions of the Dodd-Frank Act. The Dodd-Frank Act and accompanying regulations are being phased in over time, and while some regulations have been promulgated, many others have not yet been proposed or finalized. We cannot predict the terms of all of the final regulations, their intended consequences or how such regulations will affect us or our industry.
The CFPB currently has supervisory authority over our real estate servicing activities, and likely will have supervisory authority over our consumer lending business. It also has the authority to bring enforcement actions for violations of laws over which it has jurisdiction regardless of whether it has supervisory authority for a given product or service. Effective in January 2014, the CFPB finalized mortgage servicing regulations, which makes it more difficult and expensive to service mortgages. The Dodd-Frank Act also gives the CFPB supervisory authority over entities that are designated as “larger participants” in certain financial services markets, including consumer installment loans and related products. The CFPB has not yet promulgated regulations that designate “larger participants” for consumer finance companies. If we are designated as a “larger participant” for this market, we also will be subject to supervision and examination by the CFPB with respect to our consumer loan business. The CFPB has published regulations for “larger participants” in the market of auto finance, and we have been designated as a larger participant in this market. The CFPB’s broad supervisory and enforcement powers could affect our business and operations significantly in terms of increased operating and regulatory compliance costs, and limits on the types of products we offer and the manner in which they are offered, among other things. See “Business—Regulation” included in this report for further information on the CFPB.
The CFPB and certain state regulators have taken action against select lenders regarding the marketing of products offered by the lenders in connection with their loans. The products included debt cancellation/suspension products written by the lenders which forgave a borrower’s debt or monthly minimum payment upon the occurrence of certain events in the life of the borrower (e.g., death, disability, marriage, divorce, birth of a child, etc.). We sell insurance and non-insurance products in connection with our loans. While insurance products are actively regulated by state insurance departments, sales of insurance and non-insurance products could be challenged in a similar manner by the CFPB or state consumer lending regulators.
Our use of third-party vendors is subject to increasing regulatory attention.
Recently, the CFPB and other regulators have issued regulatory guidance that has focused on the need for financial institutions to perform increased due diligence and ongoing monitoring of third-party vendor relationships, thus increasing the scope of management involvement and decreasing the benefit that we receive from using third-party vendors. Moreover, if our regulators conclude that we have not met the heightened standards for oversight of our third-party vendors, we could be subject to enforcement actions, civil monetary penalties, supervisory orders to cease and desist or other remedial actions, which could have an adverse effect on our business, financial condition and operating results.
Changes in federal, state or local tax laws could have a material adverse impact on our financial position, results of operations and cash flows.
On December 22, 2017, the President signed Public Law 115-97 (the “Tax Act”) into law. The Tax Act contains substantial changes to the U.S. federal income tax code effective January 1, 2018, including a reduction in the federal corporate rate from 35% to 21%. In the long-term, we anticipate that we will have an overall benefit from the reduction in the tax rate slightly offset by potential deductions disallowed under the current law. However, we recognized an $81 million tax charge in 2017. This charge is primarily the result of the lower corporate tax rate, which required us to remeasure our net deferred tax asset to reflect the lower corporate tax rate. Although we are not aware of any provision in the Tax Act or any other pending tax legislation that would have a material adverse impact on our financial performance, the ultimate impact of the Tax Act may differ from our current assessment due to changes in interpretations and assumptions made by us as well as the issuance of any further regulations or guidance that may alter the operation of the U.S. federal income tax code. At this time, it is unclear how many U.S. states will incorporate these federal law changes, or portions thereof, into their tax codes. Further, the long-term impact of the Tax Act on the overall economy and our customers cannot be predicted so soon after the implementation of the Tax Act. Our customers are likely to experience varying effects from the provisions of the Tax Act both positive and negative. Consequently, there can be no assurance that the Tax Act will not negatively impact our operating results, financial condition, and future business operations.
29
We purchase and sell finance receivables, including charged off receivables and receivables where the borrower is in default. This practice could subject us to heightened regulatory scrutiny, which may expose us to legal action, cause us to incur losses and/or limit or impede our collection activity.
As part of our business model, we purchase and sell finance receivables. Although the borrowers for some of these finance receivables are current on their payments, other borrowers may be in default (including in bankruptcy) or the debt may have been charged off as uncollectible. The CFPB and other regulators have recently significantly increased their scrutiny of the purchase and sale of debt, and collections practices undertaken by purchasers of debt, especially delinquent and charged off debt. The CFPB has scrutinized sellers of debt for not maintaining sufficient documentation to support and verify the validity or amount of the debt. It has also scrutinized debt collectors for, among other things, their collection tactics, attempting to collect debts that no longer are valid, misrepresenting the amount of the debt and not having sufficient documentation to verify the validity or amount of the debt. Our purchases or sales of receivables could expose us to lawsuits or fines by regulators if we do not have sufficient documentation to support and verify the validity and amount of the finance receivables underlying these transactions, or if we or purchasers of our finance receivables use collection methods that are viewed as unfair or abusive. In addition, our collections could suffer and we may incur additional expenses if we are required to change collection practices or stop collecting on certain debts as a result of a lawsuit or action on the part of regulators.
The Dodd-Frank Act also may adversely affect the securitization market because it requires, among other things, that a securitizer must retain at least a 5% economic interest in the credit risk of the securitized assets. Furthermore, sponsors are prohibited from diluting the required risk retention by dividing the economic interest among multiple parties, or hedging or transferring the credit risk the sponsor is required to maintain. Moreover, the SEC’s significant changes to Regulation AB could result in sweeping changes to the commercial and residential mortgage loan securitization markets, as well as to the market for the re-securitization of mortgage-backed securities.
Rules relating to securitizations rated by nationally-recognized statistical rating agencies require that the findings of any third-party due diligence service providers be made publicly available at least five (5) business days prior to the first sale of securities, which has led and will continue to lead us to incur additional costs in connection with each securitization.
A certain amount of the rule-making under the Dodd-Frank Act remains to be done. As a result, the complete impact of the Dodd-Frank Act remains uncertain. It is not clear what form some of these remaining regulations will ultimately take, or how our business will be affected. No assurance can be given that the Dodd-Frank Act and related regulations or any other new legislative changes enacted will not have a significant impact on our business.
For more information with respect to the regulatory framework affecting our businesses, see “Business—Regulation” included in this report.
Investment Company Act considerations could affect our method of doing business.
We intend to continue conducting our business operations so that neither we nor any of our subsidiaries are required to register as an investment company under the Investment Company Act of 1940 (the “Investment Company Act”). We are a holding company that conducts its businesses primarily through wholly owned subsidiaries and are not an investment company because our subsidiaries are primarily engaged in the non-investment company business of consumer finance. Certain of our subsidiaries rely on exemptions from registration as an investment company, including pursuant to Sections 3(c)(4) and 3(c)(5) of the Investment Company Act. We rely on guidance published by the SEC staff or on our analyses of such guidance to determine our subsidiaries’ qualification under these and other exemptions. To the extent that the SEC staff publishes new or different guidance with respect to these matters, we may be required to adjust our business operations accordingly. Any additional guidance from the SEC staff could provide additional flexibility to us, or it could inhibit our ability to conduct our business operations. There can be no assurance that the laws and regulations governing the Investment Company Act status of real estate or real estate related assets or SEC guidance regarding Investment Company Act exemptions for real estate assets will not change in a manner that adversely affects our operations. If we fail to qualify for an exemption or exception from the Investment Company Act in the future, we could be required to restructure our activities or the activities of our subsidiaries, which could negatively affect us. In addition, if we or one or more of our subsidiaries fail to maintain compliance with the applicable exemptions or exceptions and we do not have another basis available to us on which we may avoid registration, and we were therefore required to register as an investment company under the Investment Company Act, we would become subject to substantial regulation with respect to our capital structure, management, operations, transactions with affiliated persons, holdings, and other matters, which could have an adverse effect on us.
30
Real estate loan servicing and loan modifications have come under increased scrutiny from government officials and others, which could make servicing our legacy real estate loan portfolio more costly and difficult.
Real estate loan servicers are under increased scrutiny. In addition, some states and municipalities have passed laws that impose additional duties on foreclosing lenders and real estate loan servicers, such as mandatory mediation or extensive requirements for maintenance of vacant properties, which, in some cases, begin even before a lender has taken title to property. These additional requirements can delay foreclosures, make it uneconomical to foreclose on mortgaged real estate or result in significant additional costs, which could materially adversely affect the value of our portfolio. The CFPB finalized mortgage servicing regulations that became effective in January 2014, which makes it more difficult and expensive to service real estate loans.
The U.S. Government implemented a number of federal programs to assist homeowners, including the Home Affordable Modification Program (HAMP), which expired on
December 31, 2017
. Loans subserviced for us by Nationstar Mortgage LLC and Select Portfolio Servicing, Inc. were subject to HAMP and were eligible for modification pursuant to HAMP guidelines. We have also implemented proprietary real estate loan modification programs in order to help real estate secured customers remain current on their loans. HAMP, our proprietary loan modification programs and other existing or future legislative or regulatory actions which result in the modification of outstanding real estate loans, may adversely affect the value of, and the returns on, our existing portfolio.
RISKS RELATED TO THE APOLLO-VÄRDE TRANSACTION
Failure to complete the Apollo-Värde Transaction could negatively affect our share price, future business and financial results.
Completion of the Apollo-Värde Transaction is not assured and is subject to risks, including the risks that necessary regulatory approvals and clearances will not be obtained or that other closing conditions will not be satisfied. If the Apollo-Värde Transaction is not completed, our ongoing business and financial results may be adversely affected and we will be subject to several risks, including:
• our share price may decline to the extent that the current market prices reflect an assumption by the market that the Apollo-Värde Transaction will be completed; and
• we may be subject to litigation related to any failure to complete the Apollo-Värde Transaction.
We will be subject to various uncertainties and contractual restrictions while the Apollo-Värde Transaction is pending that could adversely affect our financial results.
Uncertainty about the effect of the Apollo-Värde Transaction on counterparties to contracts, employees and other parties may have an adverse effect on us. These uncertainties could cause contract counterparties and others who deal with us to seek to change existing business relationships with us, and may impair our ability to attract, retain and motivate key personnel until the Apollo-Värde Transaction is completed and for a period of time thereafter. Employee retention and recruitment may be particularly challenging prior to completion of the Apollo-Värde Transaction, as our employees and prospective employees may experience uncertainty about their future roles with us following the Apollo-Värde Transaction.
The pursuit of the Apollo-Värde Transaction and the preparation involved may place a significant burden on management and internal resources. Any significant diversion of management attention away from ongoing business and any difficulties encountered in the transition and integration process could affect our financial results prior to and/or following the completion of the Apollo-Värde Transaction and could limit us from pursuing attractive business opportunities and making other changes to our business prior to completion of the Apollo-Värde Transaction.
In addition, the Share Purchase Agreement entered into in connection with the Apollo-Värde Transaction imposes certain restrictions on us. Without the consent of the Apollo-Värde Group, we are restricted from making certain acquisitions and divestitures, entering into certain contracts, incurring certain indebtedness and expenditures, paying certain dividends, repurchasing or issuing securities outside of existing share repurchase and equity award programs, and taking other specified actions until the earlier of the completion of the Apollo-Värde Transaction or the termination of the Share Purchase Agreement. These restrictions may prevent or delay pursuit of strategic corporate or business opportunities that may arise prior to the consummation of the Apollo-Värde Transaction. Adverse effects arising during the pendency of the Apollo-Värde Transaction could be exacerbated by any delays in consummation of the Apollo-Värde Transaction or termination of the related Share Purchase Agreement.
31
RISKS RELATED TO OUR INDEBTEDNESS
An inability to access adequate sources of liquidity may adversely affect our ability to fund operational requirements and satisfy financial obligations.
Our ability to access capital and credit may be significantly affected by disruption in the U.S. credit markets and the associated credit rating downgrades on our debt. In addition, the risk of volatility surrounding the global economic system and uncertainty surrounding regulatory reforms, such as the Dodd-Frank Act, continue to create uncertainty around access to the capital markets. Historically, we funded our operations and repaid our debt and other obligations using funds collected from our finance receivable portfolio and new debt issuances. Although market conditions have improved since the financial crisis, our traditional borrowing sources, including our ability to cost-effectively issue large amounts of unsecured debt in the capital markets, particularly issuances of commercial paper, have generally not been available to us. We have primarily raised capital through securitization transactions and, although there can be no assurances that we will be able to complete additional securitizations, we currently expect our near-term sources of capital markets funding to continue to derive from securitization transactions and unsecured debt offerings.
If we are unable to complete additional securitization transactions on a timely basis or upon terms acceptable to us or otherwise access adequate sources of liquidity, our ability to fund our own operational requirements and satisfy financial obligations may be adversely affected.
Our indebtedness is significant, which could affect our ability to meet our obligations under our debt instruments and could materially and adversely affect our business and ability to react to changes in the economy or our industry.
We currently have a significant amount of indebtedness. As of
December 31, 2017
, we had
$15.1 billion
of indebtedness outstanding. Interest expense on our indebtedness totaled
$816 million
in
2017
.
The amount of indebtedness could have important consequences, including the following:
|
•
|
it may require us to dedicate a significant portion of our cash flow from operations to the payment of the principal of, and interest on, our indebtedness, which reduces the funds available for other purposes, including finance receivable originations;
|
|
•
|
it could limit our ability to withstand competitive pressures and reduce our flexibility in responding to changing regulatory, business and economic conditions;
|
|
•
|
it may limit our ability to incur additional borrowings or securitizations for working capital, capital expenditures, business development, debt service requirements, acquisitions or general corporate or other purposes, or to refinance our indebtedness;
|
|
•
|
it may require us to seek to change the maturity, interest rate and other terms of our existing debt;
|
|
•
|
it may place us at a competitive disadvantage to competitors that are proportionately not as highly leveraged;
|
|
•
|
it may cause a downgrade of our debt and long-term corporate ratings; and
|
|
•
|
it may cause us to be more vulnerable to periods of negative or slow growth in the general economy or in our business.
|
In addition, meeting our anticipated liquidity requirements is contingent upon our continued compliance with our existing debt agreements. An event of default or declaration of acceleration under one of our existing debt agreements could also result in an event of default and declaration of acceleration under certain of our other existing debt agreements. Such an acceleration of our debt would have a material adverse effect on our liquidity and our ability to continue as a going concern. If our debt obligations increase, whether due to the increased cost of existing indebtedness or the incurrence of additional indebtedness, the consequences described above could be magnified.
There can be no assurance that we will be able to repay or refinance our debt in the future.
32
Certain of our outstanding notes contain covenants that restrict our operations and may inhibit our ability to grow our business and increase revenues.
SFC’s indenture and certain of SFC’s notes contain a covenant that limits SFC’s and its subsidiaries’ ability to create or incur liens. The restrictions may interfere with our ability to obtain new or additional financing or may affect the manner in which we structure such new or additional financing or engage in other business activities, which may significantly limit or harm our results of operations, financial condition and liquidity. A default and resulting acceleration of obligations could also result in an event of default and declaration of acceleration under certain of our other existing debt agreements. Such an acceleration of our debt would have a material adverse effect on our liquidity and our ability to continue as a going concern. A default could also significantly limit our alternatives to refinance both the debt under which the default occurred and other indebtedness. This limitation may significantly restrict our financing options during times of either market distress or our financial distress, which are precisely the times when having financing options is most important.
The indenture governing OneMain’s unsecured debt (the OMFH Indenture) contains a number of restrictive covenants that impose significant operating and financial restrictions on OneMain and may limit our ability to integrate OneMain’s operations, including, but not limited to, restrictions on OMFH’s and its restricted subsidiaries’ ability to:
|
•
|
incur or guarantee additional indebtedness or issue certain preferred stock;
|
|
•
|
make dividend payments or distributions on or purchases of OMFH’s equity interests;
|
|
•
|
make other restricted payments or investments;
|
|
•
|
create or permit to exist certain liens;
|
|
•
|
make certain dispositions of assets;
|
|
•
|
engage in certain transactions with affiliates;
|
|
•
|
sell certain securities of our subsidiaries;
|
|
•
|
in the case of such restricted subsidiaries, incur limitations on the ability to pay dividends or make other payments; and
|
|
•
|
merge, consolidate or sell all or substantially all of OneMain’s properties and assets.
|
In addition, the OMFH Indenture includes a change of control repurchase provision which could require us to offer to repurchase all of the outstanding existing notes of OMFH issued thereunder if a change of control occurs and a corporate rating of OMFH is downgraded by both S&P and Moody’s as a result of such change of control.
The assessment of our liquidity is based upon significant judgments and estimates that could prove to be materially incorrect.
In assessing our current financial position and developing operating plans for the future, management has made significant judgments and estimates with respect to our liquidity, including but not limited to:
|
•
|
our ability to generate sufficient cash to service all of our outstanding debt;
|
|
•
|
our continued ability to access debt and securitization markets and other sources of funding on favorable terms;
|
|
•
|
our ability to complete on favorable terms, as needed, additional borrowings, securitizations, finance receivable portfolio sales, or other transactions to support liquidity, and the costs associated with these funding sources, including sales at less than carrying value and limits on the types of assets that can be securitized or sold, which would affect profitability;
|
|
•
|
the potential for downgrade of our debt by rating agencies, which would have a negative impact on our cost of, and access to, capital;
|
|
•
|
our ability to comply with our debt covenants;
|
33
|
•
|
the amount of cash expected to be received from our finance receivable portfolio through collections (including prepayments) and receipt of finance charges, which could be materially different than our estimates;
|
|
•
|
the potential for declining financial flexibility and reduced income should we use more of our assets for securitizations and finance receivable portfolio sales; and
|
|
•
|
the potential for reduced income due to the possible deterioration of the credit quality of our finance receivable portfolios.
|
Additionally, there are numerous risks to our financial results, liquidity, and capital raising and debt refinancing plans that are not quantified in our current liquidity forecasts. These risks include, but are not limited, to the following:
|
•
|
our inability to grow our personal loan portfolio with adequate profitability to fund operations, loan losses, and other expenses;
|
|
•
|
our inability to monetize assets including, but not limited to, our access to debt and securitization markets;
|
|
•
|
our inability to obtain the additional necessary funding to finance our operations;
|
|
•
|
the effect of federal, state and local laws, regulations, or regulatory policies and practices, including the Dodd-Frank Act (which, among other things, established the CFPB with broad authority to regulate and examine financial institutions), on our ability to conduct business or the manner in which we conduct business, such as licensing requirements, pricing limitations or restrictions on the method of offering products, as well as changes that may result from increased regulatory scrutiny of the sub-prime lending industry;
|
|
•
|
potential liability relating to real estate and personal loans which we have sold or may sell in the future, or relating to securitized loans, if it is determined that there was a non-curable breach of a warranty made in connection with the transaction;
|
|
•
|
the potential for increasing costs and difficulty in servicing our loan portfolio as a result of heightened nationwide regulatory scrutiny of loan servicing and foreclosure practices in the industry generally, and related costs that could be passed on to us in connection with the subservicing of our real estate loans that were originated or acquired centrally;
|
|
•
|
reduced cash receipts as a result of the liquidation of our real estate loan portfolio;
|
|
•
|
the potential for additional unforeseen cash demands or accelerations of obligations;
|
|
•
|
reduced income due to loan modifications where the borrower’s interest rate is reduced, principal payments are deferred, or other concessions are made;
|
|
•
|
the potential for declines or volatility in bond and equity markets; and
|
|
•
|
the potential effect on us if the capital levels of our regulated and unregulated subsidiaries prove inadequate to support current business plans.
|
We intend to repay indebtedness with one or more of the following activities, among others: finance receivable collections, cash on hand, additional debt financings (particularly new securitizations and possible new issuances and/or debt refinancing transactions), finance receivable portfolio sales, or a combination of the foregoing. There can be no assurance that we will be successful in undertaking any of these activities to support our operations and repay our obligations.
The actual outcome of one or more of our plans could be materially different than expected or one or more of our significant judgments or estimates about the potential effects of these risks and uncertainties could prove to be materially incorrect. In the event of such an occurrence, if third-party financing is not available, our liquidity could be substantially and materially affected, and as a result, substantial doubt could exist about our ability to continue as a going concern.
34
Current ratings could adversely affect our ability to raise capital in the debt markets at attractive rates, which could negatively affect our results of operations, financial condition and liquidity.
Each of S&P, Moody’s, and Fitch rates SFC’s and OMFH’s debt. Ratings reflect the rating agencies’ opinions of a company’s financial strength, operating performance, strategic position and ability to meet our obligations. Agency ratings are not a recommendation to buy, sell or hold any security, and may be revised or withdrawn at any time by the issuing organization. Each agency’s rating should be evaluated independently of any other agency’s rating.
The table below outlines SFC’s and OMFH’s long-term corporate debt ratings and outlook by rating agencies:
|
As of December 31, 2017
|
Rating
|
Outlook
|
||
|
SFC:
|
||||
|
S&P
|
B
|
Stable
|
||
|
Moody’s
|
B2
|
Positive
|
||
|
Fitch
|
B
|
Positive
|
||
|
OMFH:
|
||||
|
S&P
|
B
|
Stable
|
||
|
Moody’s
|
B1
|
Positive
|
||
|
Fitch
|
B+
|
Positive
|
||
Currently, no other OneMain or Springleaf entity has a corporate debt rating, though they may be rated in the future.
If SFC’s or OMFH’s current ratings continue in effect or our ratings are downgraded, it will likely increase the interest rate that we would have to pay to raise money in the capital markets, making it more expensive for us to borrow money and adversely impacting our access to capital. As a result, our ratings could negatively impact our results of operations, financial condition and liquidity.
Our securitizations may expose us to financing and other risks, and there can be no assurance that we will be able to access the securitization market in the future, which may require us to seek more costly financing.
We have securitized, and may in the future securitize, certain of our finance receivables to generate cash to originate or purchase new finance receivables or pay our outstanding indebtedness. In such transactions, we typically convey a pool of finance receivables to a special purpose entity, which, in turn, conveys the finance receivables to a trust (the issuing entity). Concurrently, the trust typically issues non-recourse notes or certificates pursuant to the terms of an indenture or pooling and servicing agreement, which then are transferred to the special purpose entity in exchange for the finance receivables. The securities issued by the trust are secured by the pool of finance receivables. In exchange for the transfer of finance receivables to the issuing entity, we typically receive the cash proceeds from the sale of the trust securities, all residual interests, if any, in the cash flows from the finance receivables after payment of the trust securities, and a 100% beneficial interest in the issuing entity.
Although we have successfully completed a number of securitizations since 2012, we can give no assurances that we will be able to complete additional securitizations if the securitization markets become constrained. In addition, the value of any subordinated securities that we may retain in our securitizations might be reduced or, in some cases, eliminated as a result of an adverse change in economic conditions.
SFC, OMFG, and OMFH currently act as the servicers with respect to the consumer loan securitization trusts and related series of asset-backed securities. If SFC, OMFG, or OMFH defaults in its servicing obligations, an early amortization event could occur with respect to the relevant asset-backed securities and SFC, OMFG, or OMFH, as applicable, could be replaced as servicer. Servicer defaults include, for example, the failure of the servicer to make any payment, transfer or deposit in accordance with the securitization documents, a breach of representations, warranties or agreements made by the servicer under the securitization documents and the occurrence of certain insolvency events with respect to the servicer. Such an early amortization event could have materially adverse consequences on our liquidity and cost of funds.
Rating agencies may also affect our ability to execute a securitization transaction, or increase the costs we expect to incur from executing securitization transactions, not only by deciding not to issue ratings for our securitization transactions, but also by
35
altering the criteria and process they follow in issuing ratings. Rating agencies could alter their ratings processes or criteria after we have accumulated finance receivables for securitization in a manner that effectively reduces the value of those finance receivables by increasing our financing costs or otherwise requiring that we incur additional costs to comply with those processes and criteria. We have no ability to control or predict what actions the rating agencies may take.
Further, other matters, such as (i) accounting standards applicable to securitization transactions and (ii) capital and leverage requirements applicable to banks and other regulated financial institutions holding residential mortgage-backed securities or other asset-backed securities, could result in decreased investor demand for securities issued through our securitization transactions, or increased competition from other institutions that undertake securitization transactions. In addition, compliance with certain regulatory requirements, including the Dodd-Frank Act and the Investment Company Act, may affect the type of securitizations that we are able to complete.
If it is not possible or economical for us to securitize our finance receivables in the future, we would need to seek alternative financing to support our operations and to meet our existing debt obligations, which may be less efficient and more expensive than raising capital via securitizations and may have a material adverse effect on our results of operations, financial condition and liquidity.
RISKS RELATED TO OUR ORGANIZATION AND STRUCTURE
If the ownership of our common stock continues to be highly concentrated, it may prevent minority stockholders from influencing significant corporate decisions and may result in conflicts of interest.
The Initial Stockholder, which is primarily owned by a private equity fund managed by an affiliate of Fortress, owned approximately
44%
of our outstanding common stock as of December 31, 2017. As a result, the Initial Stockholder may have a significant influence on all matters requiring a stockholder vote, including: the election of directors; mergers, consolidations and acquisitions; the sale of all or substantially all of our assets and other decisions affecting our capital structure; the amendment of our restated certificate of incorporation and our amended and restated bylaws; and our winding up and dissolution. This concentration of ownership may delay, deter or prevent acts that would be favored by our other stockholders. The interests of the Initial Stockholder may not always coincide with our interests or the interests of our other stockholders. This concentration of ownership may also have the effect of delaying, preventing or deterring a change in control of us. Also, the Initial Stockholder may seek to cause us to take courses of action that, in its judgment, could enhance its investment in us, but which might involve risks to our other stockholders or adversely affect us or our other stockholders. As a result, the market price of our common stock could decline or stockholders might not receive a premium over the then-current market price of our common stock upon a change in control. In addition, this concentration of share ownership may adversely affect the trading price of our common stock because investors may perceive disadvantages in owning shares in a company with significant stockholders. On December 27, 2017, SoftBank acquired Fortress. There are no assurances that the acquisition of Fortress by SoftBank will not have an impact on us.
On January 3, 2018, the Apollo-Värde Group entered into a Share Purchase Agreement with the Initial Stockholder and the Company to acquire from the Initial Stockholder 54,937,500 shares of our common stock that was issued and outstanding as of such date, representing the entire holdings of our stock beneficially owned by Fortress. See additional information under “Business Overview” in Item 1 of this report.
The Share Purchase Agreement is filed as Exhibit 10.1 to our Current Report on Form 8-K filed with the SEC on January 4, 2018, and such Current Report on Form 8-K, including Exhibit 10.1 thereto, is incorporated by reference herein in its entirety. Upon closing of the Apollo-Värde Transaction, we expect to enter into an Amended and Restated Stockholders’ Agreement, the expected terms of which are described in such Current Report on Form 8-K.
We are a holding company with no operations and rely on our operating subsidiaries to provide us with funds necessary to meet our financial obligations and to pay dividends.
We are a holding company with no material direct operations. Our principal assets are the equity interests we directly or indirectly hold in our operating subsidiaries, which own our operating assets. As a result, we are dependent on loans, dividends and other payments from our subsidiaries to generate the funds necessary to meet our financial obligations and to pay dividends on our common stock. Our subsidiaries are legally distinct from us and certain of our subsidiaries are prohibited or restricted from paying dividends or otherwise making funds available to us under certain conditions. For example, our insurance subsidiaries are subject to regulations that limit their ability to pay dividends or make loans or advances to us, principally to protect policyholders, and certain of our debt agreements limit the ability of certain of our subsidiaries to pay dividends. In addition, OMFH’s debt covenants restrict its ability to pay dividends. If we are unable to obtain funds from our subsidiaries, we may be unable to, or our board may exercise its discretion not to, pay dividends.
36
We do not anticipate paying any dividends on our common stock until leverage targets are met.
We have no plans to pay regular dividends on our common stock, and we anticipate that a significant amount of any free cash flow generated from our operations will be utilized to redeem or prepay outstanding indebtedness, and accordingly would not be available for dividends. See our “Dividend Policy” in Part II - Item 5 of this report for further information.
Certain provisions of a stockholders agreement with our Initial Stockholder (the “Stockholders Agreement”), our restated certificate of incorporation and our amended and restated bylaws could hinder, delay or prevent a change in control of us, which could adversely affect the price of our common stock.
Certain provisions of the Stockholders Agreement, our restated certificate of incorporation and our amended and restated bylaws contain provisions that could make it more difficult for a third party to acquire us without the consent of our board of directors or Fortress. These provisions provide for:
|
•
|
a classified board of directors with staggered three-year terms;
|
|
•
|
removal of directors only for cause and only with the affirmative vote of at least 80% of the voting interest of stockholders entitled to vote (provided, however, that for so long as Fortress and certain of its affiliates and permitted transferees beneficially own, directly or indirectly, at least 30% of our issued and outstanding common stock (including Fortress’ proportionate interest in shares of our common stock held by the Initial Stockholder), directors may be removed with or without cause with the affirmative vote of a majority of the then issued and outstanding voting interest of stockholders entitled to vote);
|
|
•
|
provisions in our restated certificate of incorporation and amended and restated bylaws prevent stockholders from calling special meetings of our stockholders (provided, however, that for so long as Fortress and certain of its affiliates and permitted transferees beneficially own, directly or indirectly, at least 20% of our issued and outstanding common stock (including Fortress’s proportionate interest in shares of our common stock held by the Initial Stockholder), any stockholders that collectively beneficially own at least 20% of our issued and outstanding common stock may call special meetings of our stockholders);
|
|
•
|
advance notice requirements by stockholders with respect to director nominations and actions to be taken at annual meetings;
|
|
•
|
certain rights to Fortress and certain of its affiliates and permitted transferees with respect to the designation of directors for nomination and election to our board of directors, including the ability to appoint a majority of the members of our board of directors, plus one director, for so long as Fortress and certain of its affiliates and permitted transferees continue to beneficially own, directly or indirectly at least 30% of our issued and outstanding common stock (including Fortress’s proportionate interest in shares of our common stock held by the Initial Stockholder);
|
|
•
|
no provision in our restated certificate of incorporation or amended and restated bylaws permits cumulative voting in the election of directors, which means that the holders of a majority of the outstanding shares of our common stock can elect all the directors standing for election;
|
|
•
|
our restated certificate of incorporation and our amended and restated bylaws only permit action by our stockholders outside a meeting by unanimous written consent, provided, however, that for so long as Fortress and certain of its affiliates and permitted transferees beneficially own, directly or indirectly, at least 20% of our issued and outstanding common stock (including Fortress’s proportionate interest in shares of our common stock held by the Initial Stockholder), our stockholders may act without a meeting by written consent of a majority of our stockholders; and
|
|
•
|
under our restated certificate of incorporation, our board of directors has authority to cause the issuance of preferred stock from time to time in one or more series and to establish the terms, preferences and rights of any such series of preferred stock, all without approval of our stockholders. Nothing in our restated certificate of incorporation precludes future issuances without stockholder approval of the authorized but unissued shares of our common stock.
|
In addition, these provisions may make it difficult and expensive for a third party to pursue a tender offer, change in control or takeover attempt that is opposed by Fortress, our management or our board of directors. Public stockholders who might desire to participate in these types of transactions may not have an opportunity to do so, even if the transaction is favorable to
37
stockholders. These anti-takeover provisions could substantially impede the ability of public stockholders to benefit from a change in control or change our management and board of directors and, as a result, may adversely affect the market price of our common stock and the ability of public stockholders to realize any potential change of control premium.
Upon closing of the Apollo-Värde Transaction, we expect to enter into an Amended and Restated Stockholders’ Agreement. See additional information under “Business Overview” in Item 1 of this report. The expected terms of the Amended and Restated Stockholders’ Agreement are described in our Current Report on Form 8-K filed with the SEC on January 4, 2018, and such Current Report on Form 8-K is incorporated by reference herein in its entirety.
Certain of our stockholders have the right to engage or invest in the same or similar businesses as us.
Fortress and its affiliates, including the Initial Stockholder, engage in other investments and business activities in addition to their ownership of us. Under our restated certificate of incorporation, Fortress and its affiliates, including the Initial Stockholder, have the right, and have no duty to abstain from exercising such right, to engage or invest in the same or similar businesses as us, do business with any of our clients, customers or vendors or employ or otherwise engage any of our officers, directors or employees. If Fortress and its affiliates, including the Initial Stockholder, or any of their officers, directors or employees acquire knowledge of a potential transaction that could be a corporate opportunity, they have no duty, to the fullest extent permitted by law, to offer such corporate opportunity to us, our stockholders or our affiliates.
In the event that any of our directors and officers who is also a director, officer or employee of any of Fortress or its affiliates, including the Initial Stockholder, acquires knowledge of a corporate opportunity or is offered a corporate opportunity, provided that this knowledge was not acquired solely in such person’s capacity as our director or officer and such person acts in good faith, then even if Fortress or its affiliates, including the Initial Stockholder, pursues or acquires the corporate opportunity or if Fortress or its affiliates, including the Initial Stockholder, do not present the corporate opportunity to us such person is deemed to have fully satisfied such person’s fiduciary duties owed to us and is not liable to us.
Licensing and insurance laws and regulations may delay or impede purchases of our common stock.
Certain of the states in which we are licensed to originate loans and the states in which Springleaf and OneMain insurance subsidiaries are domiciled (Indiana and Texas) have laws or regulations which require regulatory approval for the acquisition of “control” of regulated entities. In addition, these Indiana and Texas insurance laws and regulations generally provide that no person may acquire control, directly or indirectly, of a domiciled insurer, unless the person has provided the required information to, and the acquisition is subsequently approved or not disapproved by, the Indiana Department of Insurance and also by the Texas Department of Insurance. Under state insurance laws or regulations, there exists a presumption of “control” when an acquiring party acquires as little as 10% of the voting securities of a regulated entity or of a company which itself controls (directly or indirectly) a regulated entity (the threshold is 10% under the insurance statutes of Indiana and Texas). Therefore, any person acquiring 10% or more of our common stock may need the prior approval of these two state insurance and/or licensing regulators, or a determination from such regulators that “control” has not been acquired, which could significantly delay or otherwise impede their ability to complete such purchase. The Apollo-Värde Transaction may be deemed a change of control for purposes of certain of our state lending and insurance licenses pursuant to which we operate our lending and insurance businesses. Accordingly, we may be required to obtain approvals for the change of control from some state lending or insurance regulators.
RISKS RELATED TO OUR COMMON STOCK
The market price and trading volume of our common stock may be volatile, which could result in rapid and substantial losses for our stockholders.
The market price of our common stock has been and may continue to be highly volatile and could be subject to wide fluctuations. In addition, the trading volume in our common stock may fluctuate and cause significant price variations to occur. If the market price of our common stock declines significantly, public stockholders may be unable to resell their shares at or above their purchase price, if at all. The market price of our common stock may fluctuate or decline significantly in the future. Some of the factors that could negatively affect our share price or result in fluctuations in the price or trading volume of our common stock include:
|
•
|
variations in our quarterly or annual operating results;
|
|
•
|
changes in our earnings estimates (if provided) or differences between our actual financial and operating results and those expected by investors and analysts;
|
38
|
•
|
the contents of published research reports about us or our industry or the failure of securities analysts to cover our common stock in the future;
|
|
•
|
additions to, or departures of, key management personnel;
|
|
•
|
any increased indebtedness we may incur in the future;
|
|
•
|
announcements by us or others and developments affecting us;
|
|
•
|
actions by institutional stockholders or our Initial Stockholder or Fortress;
|
|
•
|
litigation and governmental investigations;
|
|
•
|
changes in market valuations of similar companies;
|
|
•
|
speculation or reports by the press or investment community with respect to us or our industry in general;
|
|
•
|
increases in market interest rates that may lead purchasers of our shares to demand a higher yield;
|
|
•
|
announcements by us or our competitors of significant contracts, acquisitions, dispositions, strategic relationships, joint ventures or capital commitments; and
|
|
•
|
general market, political and economic conditions, including any such conditions and local conditions in the markets in which our borrowers are located.
|
These broad company, market and industry factors may decrease the market price of our common stock, regardless of our actual operating performance. The stock market in general has from time to time experienced extreme price and volume fluctuations, including in recent months. In addition, in the past, following periods of volatility in the overall market and the market price of a company’s securities, securities class action litigation has often been instituted against these companies. This litigation, if instituted against us, could result in substantial costs and a diversion of our management’s attention and resources.
Future offerings of debt or equity securities by us may adversely affect the market price of our common stock.
In the future, we may attempt to obtain financing or to further increase our capital resources by issuing additional shares of our common stock or offering debt or other equity securities, including commercial paper, medium-term notes, senior or subordinated notes, debt securities convertible into equity or shares of preferred stock. In particular, we intend to continue to seek opportunities to acquire consumer finance portfolios and/or businesses that engage in consumer finance loan servicing and/or consumer finance loan originations. Future acquisitions could require substantial additional capital in excess of cash from operations. We would expect to finance the capital required for acquisitions through a combination of additional issuances of equity, corporate indebtedness, asset-backed acquisition financing and/or cash from operations.
Issuing additional shares of our common stock or other equity securities or securities convertible into equity may dilute the economic and voting rights of our stockholders at the time of such issuance or reduce the market price of our common stock or both. Upon liquidation, holders of debt securities and preferred shares, if issued, and lenders with respect to other borrowings would receive a distribution of our available assets prior to the holders of our common stock. Debt securities convertible into equity could be subject to adjustments in the conversion ratio pursuant to which certain events may increase the number of equity securities issuable upon conversion. Preferred shares, if issued, could have a preference with respect to liquidating distributions or a preference with respect to dividend payments that could limit our ability to pay dividends to the holders of our common stock. Our decision to issue securities in any future offering will depend on market conditions and other factors beyond our control, which may adversely affect the amount, timing or nature of our future offerings. Thus, holders of our common stock bear the risk that our future offerings may reduce the market price of our common stock and dilute their stockholdings in us.
39
The market price of our common stock could be negatively affected by sales of substantial amounts of our common stock in the public markets or the failure to close the Apollo-Värde Transaction.
As of December 31, 2017, approximately
44%
of our outstanding common stock was held by the Initial Stockholder and, subject to the rights of the Apollo-Värde Group, can be resold into the public markets in the future in accordance with the requirements of the Securities Act of 1933, as amended (the Securities Act). A decline in the price of our common stock, whether as a result of sale of stock by the Initial Stockholder, the failure to close the Apollo-Värde Transaction or otherwise, might impede our ability to raise capital through the issuance of additional common stock or other equity securities.
The future issuance of additional common stock in connection with our incentive plans, acquisitions or otherwise will dilute all other stockholdings.
We have an aggregate of
1,864,395,771
shares of common stock authorized but unissued as of February 14, 2018. We may issue all of these shares of common stock without any action or approval by our stockholders, subject to certain exceptions. We also intend to continue to evaluate acquisition opportunities and may issue common stock in connection with these acquisitions. Any common stock issued in connection with our incentive plans, acquisitions, the exercise of outstanding stock options or otherwise would dilute the percentage ownership held by our existing shareholders.
Failure to maintain effective internal control over financial reporting in accordance with Section 404 of the Sarbanes-Oxley Act could have a material adverse effect on our business and stock price.
Our internal control over financial reporting is designed to provide reasonable assurance regarding the reliability of the financial reporting and the preparation of financial statements for external purposes in accordance with GAAP. Effective internal control over financial reporting is necessary for us to provide reliable reports and prevent fraud.
We believe that a control system, no matter how well designed and managed, can provide only reasonable, not absolute, assurance that the objectives of the control system are met. Because of the inherent limitations in all control systems, no evaluation of controls can provide absolute assurance that all control issues and instances of fraud, if any, within a company have been detected. We may not be able to identify all significant deficiencies and/or material weaknesses in our internal control in the future, and our failure to maintain effective internal control over financial reporting in accordance with Section 404 of the Sarbanes-Oxley Act could have a material adverse effect on our business, financial condition, results of operations and prospects.
None
We generally conduct branch office operations, which consisted of over 1,600 branch offices at December 31, 2017, branch office administration, and centralized operations, including our servicing facilities in Mendota Heights, Minnesota; Tempe, Arizona; Fort Mill, South Carolina and Fort Worth, Texas, in leased premises. Our lease terms generally range from three to five years.
We lease administrative offices in Chicago, Illinois and Wilmington, Delaware, which have seven year leases that expire in 2021 and 2022, respectively, an administrative office in Irving, Texas under an eight year lease that expires in 2025, and an administrative office in Baltimore, Maryland, under an 11 year lease that expires in 2026, half of which has been sublet. We lease office space in Stamford, Connecticut, which has a six year lease that expires in 2022. We have a vacant office in Old Greenwich, Connecticut, that has a seven year lease that expires in 2021, the majority of which we have sublet. We also have a vacant office in Wilmington, Delaware, under a seven year lease that expires in 2020, the majority of which was terminated in 2016, and the remaining portion expires in 2018 under an early termination agreement.
Our investment in real estate and tangible property is not significant in relation to our total assets due to the nature of our business. At
December 31, 2017
, our subsidiaries owned a loan servicing facility in London, Kentucky, and six buildings in Evansville, Indiana. The Evansville buildings house our administrative offices and our centralized operations for our Consumer and Insurance, and Acquisitions and Servicing segments.
40
See Note
19
of the Notes to Consolidated Financial Statements included in this report.
None.
41
MARKET INFORMATION AND STOCKHOLDERS
OMH’s common stock has been listed for trading on the New York Stock Exchange (“NYSE”) since October 16, 2013. On November 27, 2015, we changed the symbol from “LEAF” to “OMF” as a result of the OneMain Acquisition. Our initial public offering was priced at $17.00 per share on October 15, 2013.
High and low sales prices of our common stock for each quarterly period during the past two years were as follows:
|
High
|
Low
|
|||||||
|
2017
|
||||||||
|
First Quarter
|
$
|
28.69
|
|
$
|
21.56
|
|
||
|
Second Quarter
|
25.46
|
|
22.04
|
|
||||
|
Third Quarter
|
29.34
|
|
24.37
|
|
||||
|
Fourth Quarter
|
33.39
|
|
23.68
|
|
||||
|
2016
|
||||||||
|
First Quarter
|
$
|
41.25
|
|
$
|
18.55
|
|
||
|
Second Quarter
|
33.31
|
|
20.97
|
|
||||
|
Third Quarter
|
32.28
|
|
20.32
|
|
||||
|
Fourth Quarter
|
31.84
|
|
16.03
|
|
||||
On
February 14, 2018
, there were seven registered holders of our common stock. This figure does not reflect the beneficial ownership of shares held in nominee name. On
February 14, 2018
, the closing price for our common stock, as reported on the NYSE, was $32.31.
DIVIDEND POLICY
We did not pay any dividends in 2017 or 2016, and we have not paid any dividends since our initial public offering in 2013. However, we plan to evaluate the potential for capital distributions in 2018 based on the achievement of our liquidity and target leverage objectives, among other factors. Any capital distribution, including any declaration and payment of future dividends to holders of our common stock will be at the discretion of our board of directors and will depend on many factors, including our financial condition, earnings, cash flows, capital requirements, level of indebtedness, statutory and contractual restrictions applicable to the payment of dividends, and other considerations that our board of directors deems relevant. There can be no assurances that we will make any capital distributions in 2018 or at any time thereafter and, even if we make capital distributions in 2018, there can be no assurances that we will continue to do so in the future. Until such time that we pay a dividend, our investors must rely on sales of their common stock after price appreciation, which may never occur, as the only way to realize any future gains on their investment.
Because we are a holding company and have no direct operations, we will only be able to pay dividends from our available cash on hand and any funds we receive from our subsidiaries. Our insurance subsidiaries are subject to regulations that limit their ability to pay dividends or make loans or advances to us, principally to protect policyholders, and certain of our debt agreements limit the ability of certain of our subsidiaries to pay dividends. See Note
14
of the Notes to Consolidated Financial Statements included in this report for further information on insurance subsidiary dividends and Note
12
of the Notes to Consolidated Financial Statements included in this report for more information about our debt agreements. Under Delaware law, dividends may be payable only out of surplus, which is calculated as our net assets less our liabilities and our capital, or, if we have no surplus, out of our net profits for the fiscal year in which the dividend is declared and/or the preceding fiscal year.
The OMFH Indenture contains various covenants that restrict OMFH’s ability to engage in various activities, including, but not limited to, paying dividends or distributions on or purchases of OMFH’s equity interests or in the case of such restricted subsidiaries, incur limitations on the ability to pay dividends or make other payments.
42
STOCK PERFORMANCE
The following data and graph show a comparison of the cumulative total shareholder return for our common stock, the NYSE Financial Sector (Total Return) Index, and the NYSE Composite (Total Return) Index from October 16, 2013 (the date our common stock began trading on the NYSE) through
December 31, 2017
. This data assume simultaneous investments of $100 on October 16, 2013 and reinvestment of any dividends.
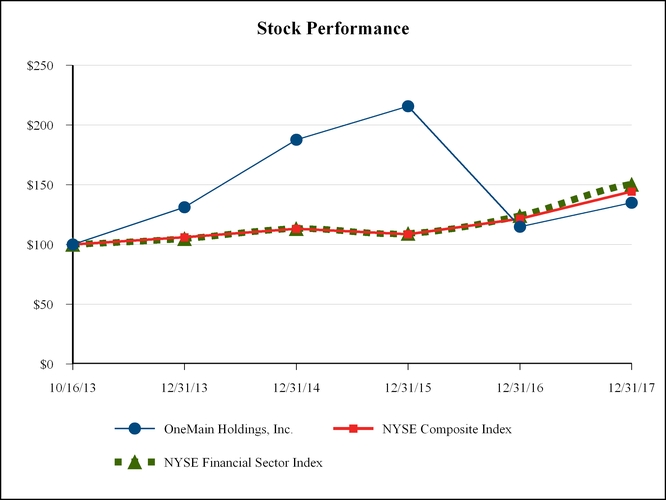
|
10/16/2013
|
12/31/2013
|
12/31/2014
|
12/31/2015
|
12/31/2016
|
12/31/2017
|
|||||||||||||
|
OneMain Holdings, Inc.
|
$
|
100.00
|
|
$
|
131.26
|
|
$
|
187.80
|
|
$
|
215.68
|
|
$
|
114.95
|
|
$
|
134.94
|
|
|
NYSE Composite Index
|
100.00
|
|
106.12
|
|
113.28
|
|
108.65
|
|
121.61
|
|
144.39
|
|
||||||
|
NYSE Financial Sector Index
|
100.00
|
|
104.89
|
|
113.28
|
|
109.21
|
|
124.08
|
|
150.42
|
|
||||||
43
The following table presents our selected historical consolidated financial data and other operating data. The consolidated statement of operations data for the years ended
December 31, 2017
,
2016
, and
2015
and the consolidated balance sheet data as of
December 31, 2017
and
2016
have been derived from our audited consolidated financial statements included elsewhere herein. The statement of operations data for the years ended December 31,
2014
and
2013
and the consolidated balance sheet data as of December 31,
2015
,
2014
and
2013
have been derived from our consolidated financial statements not included elsewhere herein.
The following selected financial data should be read in conjunction with “
Management’s Discussion and Analysis of Financial Condition and Results of Operations
” included in this report and our audited consolidated financial statements and related notes included in this report.
|
(dollars in millions, except per share amounts)
|
At or for the Years Ended December 31,
|
|||||||||||||||||||
|
2017
|
2016
|
2015 (a)
|
2014
|
2013
|
||||||||||||||||
|
Consolidated Statements of Operations Data:
|
||||||||||||||||||||
|
Interest income
|
$
|
3,196
|
|
$
|
3,110
|
|
$
|
1,930
|
|
$
|
1,973
|
|
$
|
2,141
|
|
|||||
|
Interest expense
|
816
|
|
856
|
|
715
|
|
734
|
|
920
|
|
||||||||||
|
Provision for finance receivable losses
|
955
|
|
932
|
|
716
|
|
423
|
|
435
|
|
||||||||||
|
Other revenues
|
560
|
|
773
|
|
262
|
|
746
|
|
153
|
|
||||||||||
|
Other expenses
|
1,554
|
|
1,739
|
|
987
|
|
701
|
|
782
|
|
||||||||||
|
Income (loss) before income tax expense (benefit)
|
431
|
|
356
|
|
(226
|
)
|
861
|
|
157
|
|
||||||||||
|
Net income (loss)
|
183
|
|
243
|
|
(93
|
)
|
589
|
|
157
|
|
||||||||||
|
Net income attributable to non-controlling interests
|
—
|
|
28
|
|
127
|
|
126
|
|
149
|
|
||||||||||
|
Net income (loss) attributable to OneMain Holdings, Inc.
|
183
|
|
215
|
|
(220
|
)
|
463
|
|
8
|
|
||||||||||
|
Earnings (loss) per share:
|
||||||||||||||||||||
|
Basic
|
$
|
1.35
|
|
$
|
1.60
|
|
$
|
(1.72
|
)
|
$
|
4.03
|
|
$
|
0.07
|
|
|||||
|
Diluted
|
1.35
|
|
1.59
|
|
(1.72
|
)
|
4.02
|
|
0.07
|
|
||||||||||
|
Consolidated Balance Sheet Data:
|
||||||||||||||||||||
|
Net finance receivables, less unearned insurance premium and claim reserves and allowance for finance receivable losses
|
$
|
13,670
|
|
$
|
12,457
|
|
$
|
14,305
|
|
$
|
6,210
|
|
$
|
13,413
|
|
|||||
|
Total assets
|
19,433
|
|
18,123
|
|
21,190
|
|
10,929
|
|
15,336
|
|
||||||||||
|
Long-term debt
|
15,050
|
|
13,959
|
|
17,300
|
|
8,356
|
|
12,714
|
|
||||||||||
|
Total liabilities
|
16,155
|
|
15,057
|
|
18,460
|
|
8,997
|
|
13,335
|
|
||||||||||
|
OneMain Holdings, Inc. shareholders’ equity
|
3,278
|
|
3,066
|
|
2,809
|
|
2,061
|
|
1,618
|
|
||||||||||
|
Non-controlling interests
|
—
|
|
—
|
|
(79
|
)
|
(129
|
)
|
383
|
|
||||||||||
|
Total shareholders’ equity
|
3,278
|
|
3,066
|
|
2,730
|
|
1,932
|
|
|
2,001
|
|
|||||||||
|
Other Operating Data:
|
||||||||||||||||||||
|
Ratio of earnings to fixed charges
|
1.51
|
|
1.40
|
|
(b)
|
|
2.16
|
|
1.17
|
|
||||||||||
|
(a)
|
Selected financial data for 2015 includes OneMain’s results effective from November 1, 2015, pursuant to our contractual agreements with Citigroup.
|
|
(b)
|
Earnings did not cover total fixed charges by
$226 million
in
2015
.
|
44
The following discussion and analysis of our financial condition and results of operations should be read together with the audited consolidated financial statements and related notes included in this report. This discussion and analysis contains forward-looking statements that involve risk, uncertainties, and assumptions. See “
Forward-Looking Statements
” included in this report for more information. Our actual results could differ materially from those anticipated in the forward-looking statements as a result of many factors, including those discussed in “
Risk Factors
” included in this report.
An index to our management’s discussion and analysis follows:
Overview
We are a leading provider of responsible personal loan products, primarily to non-prime customers. Our network of over
1,600
branch offices in
44
states as of
December 31, 2017
, is staffed with highly trained personnel and is complemented by our online personal loan origination capabilities and centralized operations, which allows us to reach customers located outside our branch footprint. Our digital platform provides current and prospective customers the option of obtaining an unsecured personal loan via our website,
www.onemainfinancial.com.
(The information on our website is not incorporated by reference into this report.) In connection with our personal loan business, we offer our customers credit and non-credit insurance.
In addition, we service loans owned by third-parties; pursue strategic acquisitions and dispositions of assets and businesses, including loan portfolios or other financial assets; and may establish joint ventures or enter into other strategic alliances or arrangements from time to time.
OUR PRODUCTS
Our product offerings include:
|
•
|
Personal Loans —
We offer personal loans through our branch network and over the Internet through our centralized operations to customers who generally need timely access to cash. Our personal loans are typically non-revolving with a fixed-rate and a fixed, original term of
three
to
six years
and are secured by consumer goods, automobiles, or other personal property or are unsecured. At
December 31, 2017
, we had nearly
2.4 million
personal loans representing
$14.8 billion
of net finance receivables, compared to 2.2 million personal loans totaling $13.6 billion at
December 31, 2016
.
|
|
•
|
Insurance Products —
We offer our customers credit insurance (life insurance, disability insurance, and involuntary unemployment insurance) and non-credit insurance through both our branch network and our centralized operations. Credit insurance and non-credit insurance products are provided by our affiliated insurance companies, Merit, Yosemite, AHL and Triton. We also offer auto membership plans of an unaffiliated company.
|
45
Our non-originating legacy products include:
|
•
|
Real Estate Loans —
In 2012, we ceased originating real estate loans and the portfolio is in a liquidating status. During 2016, we sold $308 million real estate loans held for sale. At
December 31, 2017
, we had
$128 million
of real estate loans held for investment, of which
91%
were secured by first mortgages, compared to $144 million at December 31, 2016, of which 93% were secured by first mortgages. Real estate loans held for sale totaled
$132 million
and $153 million at
December 31, 2017
and 2016, respectively.
|
|
•
|
Retail Sales Finance —
We ceased purchasing retail sales contracts and revolving retail accounts in January of 2013. We continue to service the liquidating retail sales contracts and will provide revolving retail sales financing services on our revolving retail accounts.
|
OUR SEGMENTS
At
December 31, 2017
, we had
two
operating segments:
|
•
|
Consumer and Insurance; and
|
|
•
|
Acquisitions and Servicing.
|
Beginning in 2017, we include Real Estate, which was previously presented as a distinct reporting segment, in “Other.” See Note
22
of the Notes to Consolidated Financial Statements included in this report for further information on this change in our segment alignment and for more information about our segments. To conform to the new alignment of our segments, we have revised our prior period segment disclosures.
HOW WE ASSESS OUR BUSINESS PERFORMANCE
We closely monitor the primary drivers of pretax operating income, which consist of the following:
Net Interest Income
We track the spread between the interest income earned on our finance receivables and the interest expense incurred on our debt, and continually monitor the components of our yield and our cost of funds.
Net Credit Losses
The credit quality of our loans is driven by our long-standing underwriting philosophy, which takes into account the prospective customer’s household budget, and his or her willingness and capacity to repay the proposed loan. We closely analyze credit performance because the profitability of our loan portfolio is directly connected to net credit losses. We define net credit losses as gross charge-offs minus recoveries in the portfolio. Additionally, because delinquencies are an early indicator of future net credit losses, we analyze delinquency trends, adjusting for seasonality, to determine whether or not our loans are performing in line with our original estimates. We also monitor recovery rates because of their contribution to the reduction in the severity of our charge-offs.
Operating Expenses
We assess our operational efficiency using various metrics and conduct extensive analysis to determine whether fluctuations in cost and expense levels indicate operational trends that need to be addressed. Our operating expense analysis also includes a review of origination and servicing costs to assist us in managing overall profitability.
Because loan volume and portfolio size determine the magnitude of the impact of each of the above factors on our earnings, we also closely monitor origination volume and annual percentage rate.
46
Recent Developments and Outlook
INITIAL STOCKHOLDER SHARE SALES
On November 7, 2017, we entered into an Underwriting Agreement among the Company, the Initial Stockholder and Morgan Stanley & Co. LLC (the “Underwriter”), for the sale by the Initial Stockholder of 10,000,000 shares of the Company’s Common Stock, par value $0.01 per share (the “Common Stock”), plus an option for the Underwriter to purchase up to an additional 1,500,000 shares of Common Stock within 30 days after the date of the Underwriting Agreement. The shares sold by the Initial Stockholder were beneficially owned by Fortress. The Company did not receive any proceeds from the sale of the shares by the Initial Stockholder. The transaction closed on November 10, 2017 and the underwriter purchased 1,000,000 shares under its over-allotment option on December 7, 2017.
On December 13, 2017, we entered into an Underwriting Agreement among the Company, the Initial Stockholder and the Underwriter, for the sale by the Initial Stockholder of 7,500,000 additional shares of the Company’s Common Stock, par value $0.01 per share. The shares sold by the Initial Stockholder were beneficially owned by Fortress. The Company did not receive any proceeds from the sale of the shares by the Initial Stockholder. The transaction closed on December 18, 2017.
At
December 31, 2017
, the Initial Stockholder owned approximately
44%
of OMH’s common stock. The Initial Stockholder is owned primarily by a private equity fund managed by an affiliate of Fortress. On December 27, 2017, SoftBank acquired Fortress and Fortress now operates within SoftBank as an independent business headquartered in New York. There can be no assurance that the Initial Stockholder will not offer or sell in the future any of its remaining shares beneficially owned by American International Group and its affiliates.
Apollo-Värde Transaction
On January 3, 2018, the Apollo-Värde Group entered into a Share Purchase Agreement with the Initial Stockholder and the Company to acquire from the Initial Stockholder 54,937,500 shares (representing approximately 40.6% of the outstanding shares of our common stock as of such date), representing the entire holdings of our stock beneficially owned by Fortress. The Apollo-Värde Transaction is expected to close in the second quarter of 2018 and is subject to regulatory approvals and other customary closing conditions.
The Share Purchase Agreement is filed as Exhibit 10.1 to our Current Report on Form 8-K filed with the SEC on January 4, 2018, and such Current Report on Form 8-K, including Exhibit 10.1 thereto, is incorporated by reference herein in its entirety. Upon closing of the Apollo-Värde Transaction, we expect to enter into an Amended and Restated Stockholders’ Agreement, the expected terms of which are described in such Current Report on Form 8-K. Further, upon closing of the Apollo-Värde Transaction, we expect to recognize non-cash incentive compensation expense of approximately $108 million along with a capital contribution offset such that the overall impact to our shareholders’ equity will be neutral. See Note
24
of the Notes to Consolidated Financial Statements included in this report for further information.
SFC’s MEDIUM-TERM NOTE ISSUANCES
6.125% SFC Notes
On May 15, 2017, SFC issued
$500 million
aggregate principal amount of
6.125%
Senior Notes due 2022 (the “2022 SFC Notes”) under an Indenture dated as of December 3, 2014 (the “SFC Base Indenture”), as supplemented by a Third Supplemental Indenture, dated as of May 15, 2017 (the “SFC Third Supplemental Indenture” ), pursuant to which OMH provided a guarantee of the 2022 SFC Notes on an unsecured basis.
On May 30, 2017, SFC issued and sold
$500 million
aggregate principal amount of additional 2022 SFC Notes (the “Additional SFC Notes”) in an add-on offering. The initial 2022 SFC Notes and the Additional SFC Notes (collectively, the “6.125% SFC Notes”), are treated as a single class of debt securities and have the same terms, other than the issue date and the issue price.
SFC used a portion of these net proceeds to repurchase approximately
$466 million
aggregate principal amount of its existing
6.90%
Senior Notes due 2017 at a premium to par. SFC used the remaining net proceeds for general corporate purposes.
47
5.625% SFC Notes
On December 8, 2017, SFC issued
$875 million
aggregate principal amount of
5.625%
Senior Notes due 2023 (the ‘‘5.625% SFC Notes’’) under the SFC Base Indenture as supplemented by a Fourth Supplemental Indenture dated as of December 8, 2017 (the “SFC Fourth Supplemental Indenture”), pursuant to which OMH provided a guarantee of the 5.625% SFC Notes on an unsecured basis. SFC used a portion of these net proceeds to repay at maturity approximately
$557 million
aggregate principal amount of its existing
6.90%
Medium-Term Notes. SFC intends to use the remaining net proceeds for general corporate purposes, which may include additional debt repurchases and repayments.
See Note
2
and
12
of the Notes to Consolidated Financial Statements included in this report for further information on the SFC Offerings.
OMFH SECURITIZATION OFFERING
On December 11, 2017, OMFH, as sponsor, completed an offering of approximately $605 million of asset-backed notes in a private offering (the ‘‘December OMFH Securitization’’). The December OMFH Securitization included one class of senior asset-backed notes and four classes of subordinate asset-backed notes. The assets that were pledged consist of a pool of non-revolving, fixed-rate loans secured by automobiles, light-duty trucks and other vehicles. At least 5% of the initial note principal balance of each class of notes and the residual interest in the issuing entity were retained in satisfaction of the risk retention requirements of Section 941 of the Dodd-Frank Act.
See Note
13
of the Notes to Consolidated Financial Statements included in this report for further information on the December OMFH Securitization.
MATURITY OF SFC’S 6.90% MEDIUM-TERM NOTES
On December 15, 2017, the $557 million outstanding principal amount of SFC’s 6.90% Medium-Term Notes, Series J became due and payable.
See Note
12
of the Notes to Consolidated Financial Statements included in this report for further information on the maturity of SFC’s 6.90% medium-term notes.
REDEMPTION OF THE OMFH 2019 NOTES
On December 8, 2017, OMFH issued a notice of redemption to redeem all $700 million outstanding principal amount of its 6.75% Senior Notes due 2019 at a redemption price equal to 103.375%, plus accrued and unpaid interest to the redemption date. The notes were redeemed on January 8, 2018.
See Notes 12 and 24 of the Notes to Consolidated Financial Statements included in this report for further information on the Redemption of the OMFH Notes.
THE TAX ACT
On December 22, 2017, the President signed into law the Tax Act, which contains substantial changes to the Internal Revenue Code effective January 1, 2018, including a reduction in the federal corporate tax rate from 35% to 21%. In the long-term, we anticipate that we will have an overall benefit from the reduction in the tax rate slightly offset by potential deductions disallowed under the current law. However, we recognized an $81 million tax charge in 2017. This charge is primarily the result of the lower corporate tax rate, which required us to remeasure our net deferred tax asset to reflect the lower corporate tax rate. For further information see Note
18
of the Notes to Consolidated Financial Statements included in this report.
IMPACT OF HURRICANES HARVEY, IRMA AND MARIA
In August and September of 2017, our customers in certain areas of the United States and Puerto Rico were impacted by hurricanes Harvey, Irma and Maria. The estimated total hurricane-related impact recorded during 2017 was approximately $25 million, consisting primarily of increases in our loan loss reserve and borrower-related assistance programs. See additional discussion under “Results of Operations” and “Segment Results” below.
48
COST SYNERGIES
As of
December 31, 2017
, we had incurred approximately
$239 million
of acquisition-related transaction and integration expenses (
$69 million
incurred during
2017
) from the OneMain Acquisition.
We achieved our estimated cost synergies from the OneMain Acquisition, including approximately $200 million in lower operating expenses, which were fully realized by the end of the fourth quarter of 2017. Furthermore, our transition services agreement with Citigroup terminated on May 1, 2017 in accordance with its terms, and we are no longer required to make any further payments under the agreement.
OUTLOOK
With our experienced management team, long track record of successfully accessing the capital markets, and strong demand for consumer credit, we believe we are well positioned to execute on our strategic priorities to strengthen our capital base through the following key initiatives:
|
•
|
Continuing the growth in receivables through enhanced marketing strategies and customer product options;
|
|
•
|
Growing secured lending originations with a goal of enhancing credit performance;
|
|
•
|
Leveraging our scale and cost discipline across the Company to deliver improved operating leverage;
|
|
•
|
Increasing tangible equity and reducing leverage; and
|
|
•
|
Maintaining a strong liquidity level with diversified funding sources.
|
We continue to execute our strategy to increase the proportion of our loan originations secured by titled collateral (which typically have lower yields and credit losses relative to unsecured personal loans), particularly within the former OneMain branches where secured loan originations have historically represented a smaller proportion of total originations than those of the former Springleaf branches. As we continue to increase secured loans as a proportion of our total loan portfolio, our yields may be lower in future periods relative to our historical yields; however, we also expect a proportional improvement in net credit losses over time as our portfolio matures and as secured loans become a greater proportion of our total loan portfolio.
Assuming the U.S. economy continues to experience slow to moderate growth, we expect to continue our long history of strong credit performance and believe the strong credit quality of our loan portfolio will continue as the result of our disciplined underwriting practices and ongoing collection efforts. We have continued to see some migration of customer activity away from traditional channels, such as direct mail, to online channels (primarily serviced through our branch network), where we believe we are well suited to capture volume due to our scale, technology, and deployment of advanced analytics.
49
Results of Operations
CONSOLIDATED RESULTS
On November 15, 2015, we completed the OneMain Acquisition. The results of OneMain are included in our consolidated operating results and selected financial statistics from November 1, 2015 in the table below. A further discussion of our operating results for each of our operating segments is provided under “Segment Results” below.
|
(dollars in millions, except per share amounts)
|
||||||||||||
|
Years Ended December 31,
|
2017
|
2016
|
2015
|
|||||||||
|
Interest income
|
$
|
3,196
|
|
$
|
3,110
|
|
$
|
1,930
|
|
|||
|
Interest expense
|
816
|
|
856
|
|
715
|
|
||||||
|
Provision for finance receivable losses
|
955
|
|
932
|
|
716
|
|
||||||
|
Net interest income after provision for finance receivable losses
|
1,425
|
|
1,322
|
|
499
|
|
||||||
|
Net gain on sale of SpringCastle interests
|
—
|
|
167
|
|
—
|
|
||||||
|
Other revenues
|
560
|
|
606
|
|
262
|
|
||||||
|
Acquisition-related transaction and integration expenses
|
69
|
|
108
|
|
62
|
|
||||||
|
Other expenses
|
1,485
|
|
1,631
|
|
925
|
|
||||||
|
Income (loss) before income tax expense (benefit)
|
431
|
|
356
|
|
(226
|
)
|
||||||
|
Income tax expense (benefit)
|
248
|
|
113
|
|
(133
|
)
|
||||||
|
Net income (loss)
|
183
|
|
243
|
|
(93
|
)
|
||||||
|
Net income attributable to non-controlling interests
|
—
|
|
28
|
|
127
|
|
||||||
|
Net income (loss) attributable to OMH
|
$
|
183
|
|
$
|
215
|
|
$
|
(220
|
)
|
|||
|
Share Data:
|
||||||||||||
|
Weighted average number of shares outstanding:
|
||||||||||||
|
Basic
|
135,249,314
|
|
134,718,588
|
|
127,910,680
|
|
||||||
|
Diluted
|
135,678,991
|
|
135,135,860
|
|
127,910,680
|
|
||||||
|
Earnings (loss) per share:
|
||||||||||||
|
Basic
|
$
|
1.35
|
|
$
|
1.60
|
|
$
|
(1.72
|
)
|
|||
|
Diluted
|
$
|
1.35
|
|
$
|
1.59
|
|
$
|
(1.72
|
)
|
|||
|
Selected Financial Statistics (a)
|
||||||||||||
|
Finance receivables held for investment:
|
||||||||||||
|
Net finance receivables
|
$
|
14,957
|
|
$
|
13,732
|
|
$
|
15,559
|
|
|||
|
Number of accounts
|
2,360,604
|
|
2,208,894
|
|
2,465,857
|
|
||||||
|
Finance receivables held for sale:
|
||||||||||||
|
Net finance receivables
|
$
|
132
|
|
$
|
153
|
|
$
|
793
|
|
|||
|
Number of accounts
|
2,460
|
|
2,800
|
|
148,932
|
|
||||||
|
Finance receivables held for investment and held for sale: (b)
|
||||||||||||
|
Average net receivables
|
$
|
14,057
|
|
$
|
14,463
|
|
$
|
8,305
|
|
|||
|
Yield
|
22.64
|
%
|
21.37
|
%
|
23.04
|
%
|
||||||
|
Gross charge-off ratio
|
7.50
|
%
|
6.05
|
%
|
4.36
|
%
|
||||||
|
Recovery ratio
|
(0.76
|
)%
|
(0.51
|
)%
|
(0.67
|
)%
|
||||||
|
Net charge-off ratio
|
6.74
|
%
|
5.54
|
%
|
3.69
|
%
|
||||||
|
30-89 Delinquency ratio
|
2.49
|
%
|
2.31
|
%
|
2.57
|
%
|
||||||
|
Origination volume
|
$
|
10,537
|
|
$
|
9,475
|
|
$
|
5,803
|
|
|||
|
Number of accounts originated
|
1,442,895
|
|
1,326,574
|
|
991,051
|
|
||||||
|
(a)
|
See “Glossary” at the beginning of this report for formulas and definitions of our key performance ratios.
|
|
(b)
|
Includes personal loans held for sale, but excludes real estate loans held for sale in order to be comparable with our segment statistics disclosed in “Segment Results.”
|
50
Comparison of Consolidated Results for
2017
and
2016
Interest income
increased
$86 million
in
2017
when compared to
2016
due to the net of the following:
|
•
|
Finance charges
increased
$147 million
primarily due to the net of the following:
|
|
•
|
Yield on finance receivables held for investment
increased
primarily due to lower amortization of purchase premium on non-credit impaired finance receivables. This increase was partially offset by the continued shift of the portfolio towards secured personal loans and direct auto customers who tend to have loans with lower yields and lower charge-offs relative to our unsecured personal loans.
|
|
•
|
Average net receivables held for investment
decreased
primarily due to (i) the SpringCastle Interests Sale and (ii) our liquidating real estate loan portfolio, including transfers of $307 million of real estate loans to finance receivables held for sale during 2016. This decrease was partially offset by the continued growth in our personal loan portfolio.
|
|
•
|
Interest income on finance receivables held for sale
decreased
$61 million
primarily due to (i) personal loans sold in the Lendmark Sale in May 2016, and (ii) the real estate loans in finance receivables held for sale during 2016 period, which were sold in the fourth quarter of 2016.
|
Interest expense
decreased
$40 million
in
2017
when compared to
2016
due to the net of the following:
|
•
|
Average debt
decreased primarily due to debt elimination associated with the SpringCastle Interests Sale and net debt issuance and repayment activity in 2017. This decrease was partially offset by net debt issuances during the past 12 months relating to SFC’s offerings of the 6.125% SFC Notes in May of 2017 and our securitization transactions. See Notes
12
and
13
of the Notes to Consolidated Financial Statements included in this report for further information on our long-term debt, securitization transactions and our conduit facilities.
|
|
•
|
Weighted average interest rate on our debt
increased
primarily due to (i) SFC’s offering of the 8.25% SFC Notes in April of 2016, (ii) the debt elimination associated with the SpringCastle Interests Sale, and (iii) the pay down of securitizations, which had a lower interest rate relative to our other indebtedness. This increase was partially offset by the repurchase of $600 million of unsecured notes, which had a higher interest rate relative to our other indebtedness.
|
Provision for finance receivable losses
increased
$23 million
in
2017
when compared to
2016
primarily due to (i) the growth in our personal loan portfolio during the past 12 months, (ii) continued alignment and enhancement of our collection practices which resulted in higher provision from an increase in the loans now classified as TDR, (iii) a greater proportion of charge-offs from our purchased credit impaired finance receivables in 2016, which were not recorded as charge-offs through the allowance for finance receivable losses and (iv) the estimated impacts of hurricanes Harvey, Irma and Maria. Based on information currently available, we estimate the impact to net charge-offs attributable to these hurricanes to be $17 million and have increased our provision for finance receivable losses accordingly. This increase was partially offset by $
22 million
reduction in the impairment in the purchased credit impaired loans due to the increase in expected cash flows in that portfolio.
Net gain on sale of SpringCastle interests
of $167 million in 2016 reflected the net gain associated with the sale of our equity interests in the SpringCastle Joint Venture on March 31, 2016.
Other revenues
decreased
$46 million
in
2017
when compared to
2016
primarily due to (i) a decrease in insurance revenues of $
29 million
during 2017 primarily due to lower volume of loans with insurance products sold and a decrease in revenues from runoff business, (ii) a decrease of $
18 million
in 2017 due to net gain on sales of personal and real estate loans in 2016, (iii) a decrease in investment revenue of $
13 million
primarily due to lower realized gains on securities sold in the 2017 period, and (iv) a decrease of $
12 million
driven by higher net loss on repurchases and repayments of debt in 2017. This decrease was partially offset by (i) a $13 million increase in fee revenues from auto and home membership plans sold in the 2017 period, (ii) a $9 million lower market adjustment on finance receivables held for sale in 2017 compared to 2016 and (iii) an increase of $5 million of servicing fee income for the full year 2017 versus partial year 2016 related to the SpringCastle Portfolio.
Acquisition-related transaction and integration costs
decreased
$39 million
in
2017
when compared to
2016
primarily due to (i) $32 million of lower compensation costs associated with severance and stock compensation costs in 2017, (ii) a $13 million claim reserve adjustment for pre-acquisition non-credit insurance policies, and (iii) $9 million of lower system conversions and project management servicing fees. These decreases were partially offset by $17 million in expenses associated with branch
51
and administrative office consolidations. See “Non-GAAP Financial Measures” below for further information regarding these costs.
Other expenses
decreased
$146 million
in
2017
when compared to
2016
due to the following:
|
•
|
Other operating expenses
decreased
$132 million
primarily due to (i) a decrease in Citigroup transition expenses of $55 million, (ii) lower professional and audit expenses of $33 million during the 2017 period, (iii) an increase in the deferral of origination costs of $22 million due to the increase in the number of loans originated in the 2017 period compared to prior year, and (iv) a decrease in amortization of other intangible assets of $18 million during the 2017 period.
|
|
•
|
Salaries and benefits
decreased
$31 million
primarily due to a decrease in average staffing as a result of our integration of the two legacy companies.
|
|
•
|
Insurance policy benefits and claims
increased
$17 million
primarily due to the prior year favorable variances of $12 million in credit claim and benefit reserves and a $5 million increase in reserve for non-credit insurance products due to higher growth in sales.
|
Income taxes
totaled
$248 million
for
2017
compared to
$113 million
for
2016
. The increase is primarily due to the impact of the Tax Act and higher pretax earnings in
2017
. The effective tax rate for
2017
was
57.5%
compared to
31.8%
for
2016
. The effective tax rate for
2017
differed from the federal statutory rate primarily due to the recognition of the impact of the Tax Act and the effects of state income taxes. As a result of the Tax Act we recognized an $81 million tax charge in 2017. This charge is primarily the result of the lower corporate tax rate, which required us to remeasure our net deferred tax asset to reflect the lower corporate tax rate. The effective tax rate for 2016 differed from the federal statutory rate primarily due to the effects of the non-controlling interest in the previously owned SpringCastle Portfolio and the effects of state income taxes. See Note
18
of the Notes to Consolidated Financial Statements included in this report for further information on the effective tax rates.
Comparison of Consolidated Results for 2016 and 2015
Interest income
increased $1.2 billion in 2016 when compared to 2015 due to the net of the following:
|
•
|
Finance charges
increased
$1.2 billion
primarily due to the net of the following:
|
|
•
|
Average net receivables held for investment
increased primarily due to (i) loans acquired in the OneMain Acquisition and (ii) the continued growth of our loan portfolio (primarily of our secured personal loans). This increase was partially offset by (i) the SpringCastle Interests Sale, (ii) the transfer of $608 million of our personal loans to finance receivables held for sale on September 30, 2015, and (iii) our liquidating real estate loan portfolio, including the transfers of $257 million and $50 million of real estate loans to finance receivables held for sale on June 30, 2016 and November 30, 2016, respectively.
|
|
•
|
Yield
on finance receivables held for investment
decreased primarily due to (i) the continued growth of secured personal loans, which generally have lower yields relative to our unsecured personal loans, and (ii) the effects of purchase accounting adjustments relating to the OneMain Acquisition.
|
|
•
|
Interest income on finance receivables held for sale
increased
$14 million
primarily due to (i) the transfer of $608 million of our personal loans to held for sale on September 30, 2015, which were sold in the Lendmark Sale on May 2, 2016, and (ii) the transfers of $307 million of real estate loans to finance receivables held for sale during 2016, which were sold in the August 2016 Real Estate Loan Sale and December 2016 Real Estate Loan Sale.
|
Interest expense
increased
$141 million
in 2016 when compared to 2015 due to the net of the following:
|
•
|
Average debt
increased primarily due to (i) debt acquired in the OneMain Acquisition and (ii) net unsecured debt issued during the 2016 period. This increase was partially offset by (i) the elimination of the debt associated with the SpringCastle Interests Sale and (ii) net repayments under our conduit facilities. See Notes
12
and
13
of the Notes to Consolidated Financial Statements included in this report for further information on our long-term debt, consumer loan securitization transactions, and our conduit facilities.
|
|
•
|
Weighted average interest rate on our debt
decreased primarily due to (i) debt acquired from the OneMain Acquisition, which generally has a lower weighted average interest rate relative to SFC's weighted average interest
|
52
rate, and (ii) the repurchase of $600 million unsecured notes, which had a higher interest rate relative to our other indebtedness, in connection with SFC’s offering of the 8.25% SFC Notes, as defined in “Liquidity and Capital Resources” included in this report. The decrease was partially offset by (i) SFC’s offering of the 8.25% SFC Notes in April of 2016 and (ii) the elimination of debt associated with the SpringCastle Interests Sale, which generally had a lower interest rate relative to our other indebtedness.
Provision for finance receivable losses
increased $216 million in 2016 when compared to 2015 primarily due to (i) provision for finance receivable losses of $229 million resulting from the OneMain Acquisition, which reflected net charge-offs of $477 million, partially offset by the re-establishment of the allowance for finance receivable losses of $248 million in 2015 and (ii) higher net charge-offs on Springleaf personal loans reflecting growth during the past 12 months. This increase was partially offset by (i) lower net charge-offs on the previously owned SpringCastle Portfolio reflecting the SpringCastle Interests Sale and the improved central servicing performance as the acquired portfolio matured under our ownership and (ii) the continued refinement of our estimates of allowance for finance receivable losses and their related assumptions based on ongoing integration and alignment of collection and charge-off practices.
Net gain on sale of SpringCastle interests
of $167 million in 2016 reflected the net gain associated with the sale of our equity interest in the SpringCastle Joint Venture on March 31, 2016. See Note
2
of the Notes to Consolidated Financial Statements included in this report for further information on this sale.
Other revenues
increased $344 million in 2016 when compared to 2015 primarily due to (i) other revenues of $319 million resulting from the OneMain Acquisition, which consisted of insurance revenues of $236 million, investment revenues of $54 million, and remaining other revenues of $29 million, including $25 million of revenues from our ancillary products, (ii) servicing charge income for the SpringCastle Portfolio of $33 million in 2016, (iii) net gain on sales of personal and real estate loans of $18 million in 2016, (iv) servicing charge income for the receivables related to the Lendmark Sale of $6 million in 2016, and (v) foreign currency translation adjustment gain of $4 million in 2016 resulting from the liquidation of our United Kingdom subsidiary. This increase was partially offset by (i) a decrease in Springleaf investment revenues of $20 million during 2016 primarily due to a decrease in invested assets and lower realized gains on the sale of investment securities and (ii) net loss on repurchases and repayments of debt of $17 million in 2016.
Acquisition-related transaction and integration costs
of $108 million and $62 million in 2016 and 2015, respectively, reflected increased costs relating to the OneMain Acquisition and the Lendmark Sale, including branch and system conversions, information technology costs, certain compensation and benefit related costs, and other costs and fees that would not have been incurred in the ordinary course of business. See “Non-GAAP Financial Measures” below for further information regarding these costs.
Other expenses
increased $706 million in 2016 when compared to 2015 due to the following:
|
•
|
Salaries and benefits
increased $303 million primarily due to salaries and benefits of $317 million resulting from the OneMain Acquisition. This increase was partially offset by non-cash incentive compensation expense of $15 million recorded in 2015 relating to the rights of certain executives to receive a portion of the cash proceeds from the sale of OMH’s common stock by the Initial Stockholder.
|
|
•
|
Other operating expenses
increased $332 million primarily due to (i) other operating expenses of $306 million resulting from the OneMain Acquisition, which consisted primarily of advertising expenses of $74 million, occupancy costs of $66 million, amortization on other intangible assets of $57 million, and information technology expenses of $53 million, (ii) a decrease in Springleaf deferred origination costs of $12 million during 2016, and (iii) an increase in Springleaf information technology expenses of $12 million during 2016.
|
|
•
|
Insurance policy benefits and claims
increased $71 million due to insurance policy benefits and claims of $88 million resulting from the OneMain Acquisition. This increase was partially offset by a $17 million decrease in Springleaf insurance policy benefits and claims during 2016 primarily due to favorable variances in benefit reserves, which partially resulted from a $9 million write-down of benefit reserves recorded during 2016.
|
Income taxes
totaled $113 million for 2016 compared to benefit from income taxes of $133 million for 2015. The effective tax rate for 2016 was 31.8% compared to 59.0% for 2015. The effective tax rate for 2016 and 2015 differed from the federal statutory rate primarily due to the effect of the non-controlling interest in the previously owned SpringCastle Portfolio, partially offset by the effect of state income taxes. On March 31, 2016, the Company sold its equity interest in the SpringCastle Portfolio. See Note
18
of the Notes to Consolidated Financial Statements included in this report for further information on the effective rates.
53
NON-GAAP FINANCIAL MEASURES
Adjusted Pretax Income (Loss)
Management uses
adjusted pretax income (loss), a non-GAAP financial measure, as a key performance measure of our segments. Adjusted pretax income (loss) represents income (loss) before income taxes on a Segment Accounting Basis and excludes acquisition-related transaction and integration expenses, net gain (loss) on sales of personal and real estate loans, net gain on sale of SpringCastle interests, SpringCastle transaction costs, losses resulting from repurchases and repayments of debt, debt refinance costs, net loss on liquidation of our United Kingdom subsidiary, and income attributable to non-controlling interests. Management believes adjusted pretax income (loss) is useful in assessing the profitability of our segments and uses adjusted pretax income (loss) in evaluating our operating performance and as a performance goal under the company’s executive compensation programs. Adjusted pretax income (loss) is
a non-GAAP financial measure and should be considered supplemental to, but not as a substitute for or superior to, income (loss) before income taxes, net income, or other measures of financial performance prepared in accordance with GAAP.
The reconciliations of income (loss) before income taxes attributable to OMH on a Segment Accounting Basis to adjusted pretax income (loss) attributable to OMH (non-GAAP) by segment were as follows:
|
(dollars in millions)
|
||||||||||||
|
Years Ended December 31,
|
2017
|
2016
|
2015
|
|||||||||
|
Consumer and Insurance
|
||||||||||||
|
Income before income taxes - Segment Accounting Basis
|
$
|
676
|
|
$
|
688
|
|
$
|
345
|
|
|||
|
Adjustments:
|
||||||||||||
|
Acquisition-related transaction and integration expenses
|
66
|
|
100
|
|
16
|
|
||||||
|
Net gain on sale of personal loans
|
—
|
|
(22
|
)
|
—
|
|
||||||
|
Net loss on repurchases and repayments of debt
|
18
|
|
14
|
|
—
|
|
||||||
|
Debt refinance costs
|
—
|
|
4
|
|
—
|
|
||||||
|
Adjusted pretax income (non-GAAP)
|
$
|
760
|
|
$
|
784
|
|
$
|
361
|
|
|||
|
Acquisitions and Servicing
|
||||||||||||
|
Income before income taxes - Segment Accounting Basis
|
$
|
1
|
|
$
|
225
|
|
$
|
254
|
|
|||
|
Adjustments:
|
||||||||||||
|
Net gain on sale of SpringCastle interests
|
—
|
|
(167
|
)
|
—
|
|
||||||
|
Acquisition-related transaction and integration expenses
|
—
|
|
1
|
|
1
|
|
||||||
|
SpringCastle transaction costs
|
—
|
|
1
|
|
—
|
|
||||||
|
Income attributable to non-controlling interests
|
—
|
|
(28
|
)
|
(127
|
)
|
||||||
|
Adjusted pretax income (non-GAAP)
|
$
|
1
|
|
$
|
32
|
|
$
|
128
|
|
|||
|
Other
|
||||||||||||
|
Loss before income taxes - Segment Accounting Basis
|
$
|
(41
|
)
|
$
|
(90
|
)
|
$
|
(284
|
)
|
|||
|
Adjustments:
|
||||||||||||
|
Acquisition-related transaction and integration expenses
|
6
|
|
27
|
|
48
|
|
||||||
|
Net loss on sale of real estate loans
|
—
|
|
12
|
|
—
|
|
||||||
|
Net loss on liquidation of United Kingdom subsidiary
|
—
|
|
6
|
|
—
|
|
||||||
|
Net loss on repurchases and repayments of debt
|
—
|
|
1
|
|
—
|
|
||||||
|
Debt refinance costs
|
—
|
|
1
|
|
—
|
|
||||||
|
Adjusted pretax loss (non-GAAP)
|
$
|
(35
|
)
|
$
|
(43
|
)
|
$
|
(236
|
)
|
|||
Acquisition-related transaction and integration expenses incurred as a result of the OneMain Acquisition and the Lendmark Sale include (i) compensation and employee benefit costs, such as retention awards and severance costs, (ii) accelerated amortization of acquired software assets, (iii) rebranding to the OneMain brand, (iv) branch infrastructure and other fixed asset integration costs, (v) information technology costs, such as internal platform development, software upgrades and licenses, and technology termination costs, (vi) legal fees and project management costs, (vii) system conversions, including human capital management, marketing, risk, and finance functions, and (viii) other costs and fees directly related to the OneMain Acquisition and integration.
54
Segment Results
See Note
22
of the Notes to Consolidated Financial Statements included in this report for (i) a description of our segments, (ii) reconciliations of segment totals to consolidated financial statement amounts, (iii) methodologies used to allocate revenues and expenses to each segment, and (iv) further discussion of the differences in our Segment Accounting Basis and GAAP.
CONSUMER AND INSURANCE
Adjusted pretax income and selected financial statistics for Consumer and Insurance (which are reported on an adjusted Segment Accounting Basis) were as follows:
|
(dollars in millions)
|
||||||||||||
|
At or for the Years Ended December 31,
|
2017
|
2016
|
2015
|
|||||||||
|
Interest income
|
$
|
3,305
|
|
$
|
3,328
|
|
$
|
1,482
|
|
|||
|
Interest expense
|
765
|
|
738
|
|
242
|
|
||||||
|
Provision for finance receivable losses
|
963
|
|
911
|
|
351
|
|
||||||
|
Net interest income after provision for finance receivable losses
|
1,577
|
|
1,679
|
|
889
|
|
||||||
|
Other revenues
|
565
|
|
604
|
|
276
|
|
||||||
|
Other expenses
|
1,382
|
|
1,499
|
|
804
|
|
||||||
|
Adjusted pretax income (non-GAAP)
|
$
|
760
|
|
$
|
784
|
|
$
|
361
|
|
|||
|
Selected Financial Statistics (a)
|
||||||||||||
|
Finance receivables held for investment:
|
||||||||||||
|
Net finance receivables
|
$
|
14,820
|
|
$
|
13,455
|
|
$
|
12,954
|
|
|||
|
Number of accounts
|
2,355,682
|
|
2,200,584
|
|
2,202,091
|
|
||||||
|
Finance receivables held for sale:
|
|
|
|
|
|
|
|
|
|
|||
|
Net finance receivables
|
|
$
|
—
|
|
|
$
|
—
|
|
|
$
|
617
|
|
|
Number of accounts
|
|
—
|
|
|
—
|
|
|
145,736
|
|
|||
|
Finance receivables held for investment and held for sale: (b)
|
||||||||||||
|
Average net receivables
|
$
|
13,860
|
|
$
|
13,445
|
|
$
|
5,734
|
|
|||
|
Yield
|
23.84
|
%
|
24.75
|
%
|
25.85
|
%
|
||||||
|
Gross charge-off ratio (c)
|
7.94
|
%
|
7.82
|
%
|
7.52
|
%
|
||||||
|
Recovery ratio
|
(0.93
|
)%
|
(0.77
|
)%
|
(0.80
|
)%
|
||||||
|
Net charge-off ratio (c)
|
7.01
|
%
|
7.05
|
%
|
6.72
|
%
|
||||||
|
30-89 Delinquency ratio
|
2.44
|
%
|
2.26
|
%
|
2.23
|
%
|
||||||
|
Origination volume
|
$
|
10,537
|
|
$
|
9,455
|
|
$
|
5,715
|
|
|||
|
Number of accounts originated
|
1,442,895
|
|
1,326,574
|
|
991,051
|
|
||||||
|
(a)
|
See “Glossary” at the beginning of this report for formulas and definitions of our key performance ratios.
|
|
(b)
|
Includes personal loans held for sale for the 2016 and 2015 periods in connection with the Lendmark Sale.
|
|
(c)
|
The gross charge-off ratio and net charge-off ratio in 2015 reflect $62 million of additional charge-offs recorded in December of 2015 (on a Segment Accounting Basis) related to alignment in charge-off policy for personal loans in connection with the OneMain integration. Excluding these additional charge-offs, our gross charge-off ratio and net charge-off ratio would have been 6.43% and 5.62%, respectively.
|
55
Comparison of Adjusted Pretax Income for
2017
and
2016
Interest income
decreased
$23 million
in
2017
when compared to
2016
due to the net of the following:
|
•
|
Interest income on finance receivables held for sale
decreased
$56 million
in 2017 due to the transfer of our personal loans to finance receivables held for sale in the 2015 period that were sold in the Lendmark Sale in May of 2016.
|
|
•
|
Finance charges
increased
$33 million
primarily due to the net of the following:
|
|
•
|
Average net receivables held for investment
increased primarily due to the continued growth in our personal loan portfolio.
|
|
•
|
Yield on finance receivables held for investment
decreased primarily due to the continued shift of the portfolio towards secured personal loans and direct auto customers who tend to have loans with lower yields and lower charge offs relative to our unsecured personal loans.
|
Interest expense
increased
$27 million
in 2017 when compared to 2016 primarily due to an increase in the utilization of financing from unsecured notes which generally have higher interest rates relative to our other indebtedness.
Provision for finance receivable losses
increased
$52 million
in
2017
when compared to
2016
primarily due to (i) the growth in our personal loan portfolio during the past 12 months, (ii) continued alignment and enhancement of our collection practices which resulted in an increase in the loans now classified as TDR and (iii) the estimated impacts of hurricanes Harvey and Irma. Based on information currently available, we estimate the impact to net charge-offs attributable to these hurricanes to be $12 million and have increased our provision for finance receivable losses accordingly.
Other revenues
decreased
$39 million
in
2017
when compared to
2016
primarily due to (i) a
decrease
in insurance revenues of
$29 million
during 2017 primarily due to lower volume of loans with insurance products sold and a decrease in revenue from runoff business and (ii) a
decrease
in investment revenue of $
20 million
primarily due to lower realized gains on securities sold and reinvestments into lower yielding assets. This decrease was offset by an increase in fee revenues of $10 million from auto and home membership plans sold in 2017.
Other expenses
decreased
$117 million
in
2017
when compared to
2016
due to the net of the following:
|
•
|
Other operating expenses
decreased
$120 million
primarily due to (i) a decrease in Citigroup transition expense of $55 million during the 2017 period, (ii) lower professional, travel, and audit expenses of $41 million during the 2017 period, and (iii) an increase in deferral of origination costs of $22 million related to higher loan originations.
|
|
•
|
Salaries and benefits
decreased
$20 million
primarily due to a decrease in average staffing as a result of our
|
integration of the two legacy companies.
|
•
|
Insurance policy benefits and claims
increased
$23 million
primarily due to the unfavorable variances of $18 million in credit claim and benefit reserves compared to the prior year and a $5 million increase in reserves for non-credit insurance products due to higher growth in sales.
|
56
Comparison of Adjusted Pretax Income for
2016
and
2015
Interest income
increased
$1.8 billion
in
2016
when compared to
2015
due to the following:
|
•
|
Finance charges
increased
$1.8 billion
primarily due to the net of the following:
|
|
•
|
Average net receivables
increased primarily due to (i) loans acquired in the OneMain Acquisition and (ii) the continued growth of our loan portfolio (primarily of our secured personal loans). This increase was partially offset by the transfer of $608 million of our personal loans to finance receivables held for sale on September 30, 2015.
|
|
•
|
Yield
decreased primarily due to the continued growth of secured personal loans, which generally have lower yields relative to our unsecured personal loans.
|
|
•
|
Interest income on finance receivables held for sale
of
$56 million
and
$43 million
in
2016
and
2015
, respectively, resulted from the transfer of personal loans to finance receivables held for sale on September 30, 2015 and sold in the Lendmark Sale on May 2, 2016.
|
Interest expense
increased
$496 million
in
2016
when compared to
2015
primarily due to (i) interest expense of $284 million resulting from the OneMain Acquisition and (ii) a change in the methodology of allocating interest expense. See Note
22
of the Notes to Consolidated Financial Statements included in this report for the allocation methodologies.
Provision for finance receivable losses
increased $560 million in
2016
when compared to
2015
primarily due to (i) provision for finance receivable losses of $512 million resulting from the OneMain Acquisition and (ii) higher net charge-offs on Springleaf personal loans reflecting growth during 2016. This increase was partially offset by the continued refinement of our estimates of allowance for finance receivable losses and their related assumptions based on ongoing integration and alignment of collection and charge-off practices.
Other revenues
increased $328 million in
2016
when compared to
2015
primarily due to other revenues of $336 million resulting from the OneMain Acquisition, which consisted of insurance revenues of $236 million, investment revenues of $71 million, and remaining other revenues of $29 million, partially offset by a decrease in Springleaf investment revenues of $12 million during
2016
resulting from a decrease in invested assets and lower realized gains on the sale of investment securities.
Other expenses
increased $695 million in
2016
when compared to
2015
due to the following:
|
•
|
Salaries and benefits
increased $324 million primarily due to (i) salaries and benefits of $316 million resulting from the OneMain Acquisition and (ii) an increase in Springleaf average staffing during 2016 prior to the Lendmark Sale.
|
|
•
|
Other operating expenses
increased $301 million primarily due to (i) other operating expenses of $266 million resulting from the OneMain Acquisition, which consisted primarily of advertising expenses of $74 million, occupancy costs of $66 million, and information technology expenses of $49 million, (ii) a decrease in Springleaf deferred origination costs of $13 million during 2016, (iii) an increase in Springleaf information technology expenses of $12 million during 2016, (iv) an increase in Springleaf advertising expenses of $6 million during 2016, and (v) an increase in Springleaf credit and collection related costs of $6 million during 2016 reflecting growth in our loan portfolio.
|
|
•
|
Insurance policy benefits and claims
increased $70 million primarily due to insurance policy benefits and claims of $87 million resulting from the OneMain Acquisition. This increase was partially offset by a $17 million decrease in Springleaf insurance policy benefits and claims during
2016
primarily due to favorable variances in benefit reserves, which partially resulted from a $9 million write-down of benefit reserves recorded during
2016
.
|
57
ACQUISITIONS AND SERVICING
Adjusted pretax income attributable to OMH and selected financial statistics for Acquisitions and Servicing (which are reported on an adjusted Segment Accounting Basis) were as follows:
|
(dollars in millions)
|
||||||||||||
|
At or for the Years Ended December 31,
|
2017
|
2016
|
2015
|
|||||||||
|
Interest income
|
$
|
—
|
|
$
|
102
|
|
$
|
463
|
|
|||
|
Interest expense
|
—
|
|
20
|
|
87
|
|
||||||
|
Provision for finance receivable losses
|
—
|
|
14
|
|
68
|
|
||||||
|
Net interest income after provision for finance receivable losses
|
—
|
|
68
|
|
308
|
|
||||||
|
Other revenues
|
42
|
|
49
|
|
58
|
|
||||||
|
Other expenses
|
41
|
|
57
|
|
111
|
|
||||||
|
Adjusted pretax income (non-GAAP)
|
1
|
|
60
|
|
255
|
|
||||||
|
Pretax earnings attributable to non-controlling interests
|
—
|
|
28
|
|
127
|
|
||||||
|
Adjusted pretax income attributable to OMH (non-GAAP)
|
$
|
1
|
|
$
|
32
|
|
$
|
128
|
|
|||
|
Selected Financial Statistics *
|
||||||||||||
|
Finance receivables held for investment:
|
||||||||||||
|
Net finance receivables
|
$
|
—
|
|
$
|
—
|
|
$
|
1,703
|
|
|||
|
Number of accounts
|
—
|
|
—
|
|
232,383
|
|
||||||
|
Average net receivables
|
$
|
—
|
|
$
|
414
|
|
$
|
1,887
|
|
|||
|
Yield
|
—
|
%
|
24.56
|
%
|
24.54
|
%
|
||||||
|
Net charge-off ratio
|
—
|
%
|
3.48
|
%
|
3.49
|
%
|
||||||
|
30-89 Delinquency ratio
|
—
|
%
|
—
|
%
|
4.40
|
%
|
||||||
|
*
|
See “Glossary” at the beginning of this report for formulas and definitions of our key performance ratios.
|
On March 31, 2016, we sold our equity interest in the SpringCastle Joint Venture, the primary component of our Acquisitions
and Servicing segment.
OTHER
“Other” consist of our non-originating legacy operations, which include (i) our liquidating real estate loan portfolio as discussed below and (ii) our liquidating retail sales finance portfolio (including retail sales finance accounts from our legacy auto finance operation).
Beginning in 2017, management no longer views or manages our real estate assets as a separate operating segment. Therefore, we are now including Real Estate, which was previously presented as a distinct reporting segment, in “Other.” To conform to this new alignment of our segments, we have revised our prior period segment disclosures.
Adjusted pretax loss of the Other components (which are reported on an adjusted Segment Accounting Basis) were as follows:
|
(dollars in millions)
|
||||||||||||
|
Years Ended December 31,
|
2017
|
2016
|
2015
|
|||||||||
|
Interest income
|
$
|
23
|
|
$
|
51
|
|
$
|
76
|
|
|||
|
Interest expense (a)
|
21
|
|
43
|
|
268
|
|
||||||
|
Provision for finance receivable losses (b)
|
7
|
|
6
|
|
(1
|
)
|
||||||
|
Net interest income (loss) after provision for finance receivable losses
|
(5
|
)
|
2
|
|
(191
|
)
|
||||||
|
Other revenues (c)
|
3
|
|
(19
|
)
|
3
|
|
||||||
|
Other expenses (d)
|
33
|
|
26
|
|
48
|
|
||||||
|
Adjusted pretax loss (non-GAAP)
|
$
|
(35
|
)
|
$
|
(43
|
)
|
$
|
(236
|
)
|
|||
58
|
(a)
|
Interest expense
for 2016 when compared to 2015 reflected a change in the methodology of allocating interest expense. See Note
22
of the Notes to Consolidated Financial Statements included in this report for the allocation methodologies table.
|
(b)
Provision for finance receivable losses
for
2017
includes a $5 million increase due to estimated net charge-offs attributable to the impact of hurricanes Harvey and Maria.
(c)
Other revenues
for purposes of our segment reporting presentation in Note
22
of the Notes to Consolidated Financial Statements included in this report, we have combined the lower of cost or fair value adjustments recorded on the date the real estate loans were transferred to finance receivables held for sale with the final gain (loss) on the sales of these loans.
|
(d)
|
Other expenses
for 2015 reflected non-cash incentive compensation relating to the rights of certain executives to receive a portion of the cash proceeds received by the Initial Stockholder.
|
Net finance receivables held for investment of the Other components (which are reported on a Segment Accounting Basis) were as follows:
|
(dollars in millions)
|
||||||||||||
|
December 31,
|
2017
|
2016
|
2015
|
|||||||||
|
Net finance receivables:
|
||||||||||||
|
Personal loans
|
$
|
—
|
|
$
|
11
|
|
$
|
17
|
|
|||
|
Real estate loans
|
136
|
|
153
|
|
565
|
|
||||||
|
Retail sales finance
|
6
|
|
12
|
|
24
|
|
||||||
|
Total
|
$
|
142
|
|
$
|
176
|
|
$
|
606
|
|
|||
Credit Quality
FINANCE RECEIVABLE COMPOSITION
The following table presents the composition of our finance receivables held for investment for each of the Company’s segments on a Segment Accounting Basis, as well as reconciliations to our total net finance receivables on a GAAP basis:
|
(dollars in millions)
|
Consumer
and
Insurance
|
Other
|
Segment to
GAAP
Adjustment
|
Consolidated
Total
|
||||||||||||
|
December 31, 2017
|
||||||||||||||||
|
Personal loans
|
$
|
14,820
|
|
$
|
—
|
|
$
|
3
|
|
$
|
14,823
|
|
||||
|
Real estate loans
|
—
|
|
136
|
|
(8
|
)
|
128
|
|
||||||||
|
Retail sales finance
|
—
|
|
6
|
|
—
|
|
6
|
|
||||||||
|
Total
|
$
|
14,820
|
|
$
|
142
|
|
$
|
(5
|
)
|
$
|
14,957
|
|
||||
|
December 31, 2016
|
||||||||||||||||
|
Personal loans
|
$
|
13,455
|
|
$
|
11
|
|
$
|
111
|
|
$
|
13,577
|
|
||||
|
Real estate loans
|
—
|
|
153
|
|
(9
|
)
|
144
|
|
||||||||
|
Retail sales finance
|
—
|
|
12
|
|
(1
|
)
|
11
|
|
||||||||
|
Total
|
$
|
13,455
|
|
$
|
176
|
|
$
|
101
|
|
$
|
13,732
|
|
||||
The largest component of our finance receivables and primary source of our interest income is our personal loan portfolio. Our personal loans are typically non-revolving with a fixed-rate and a fixed, original term of
three
to
six years
and are secured by consumer goods, automobiles, or other personal property or are unsecured. At
December 31, 2017
, 43% of our personal loans were secured by titled collateral, compared to 36% at
December 31, 2016
.
59
Distribution of Finance Receivables by FICO Score
There are many different categorizations used in the consumer lending industry to describe the creditworthiness of a borrower, including prime, non-prime, and sub-prime. We track and analyze the performance of our finance receivable portfolio using many different parameters, including FICO scores, which is widely recognized in the consumer lending industry.
We group FICO scores into the following credit strength categories:
|
•
|
Prime: FICO score of 660 or higher
|
|
•
|
Non-prime: FICO score of 620-659
|
|
•
|
Sub-prime: FICO score of 619 or below
|
Our customers are described as prime at one end of the credit spectrum and sub-prime at the other. Our customers’ demographics are in many respects near the national median, but may vary from national norms in terms of credit and repayment histories. Many of our customers have experienced some level of prior financial difficulty or have limited credit experience and require higher levels of servicing and support from our branch network.
Our net finance receivables grouped into the following categories based solely on borrower FICO credit scores at the purchase, origination, renewal, or most recently refreshed date were as follows:
|
(dollars in millions)
|
Personal
Loans
|
Real Estate
Loans
|
Retail Sales Finance
|
Total
|
||||||||||||
|
December 31, 2017 *
|
||||||||||||||||
|
FICO scores
|
||||||||||||||||
|
660 or higher
|
$
|
3,950
|
|
$
|
42
|
|
$
|
3
|
|
$
|
3,995
|
|
||||
|
620-659
|
3,919
|
|
21
|
|
1
|
|
3,941
|
|
||||||||
|
619 or below
|
6,954
|
|
65
|
|
2
|
|
7,021
|
|
||||||||
|
Total
|
$
|
14,823
|
|
$
|
128
|
|
$
|
6
|
|
$
|
14,957
|
|
||||
|
December 31, 2016
|
||||||||||||||||
|
FICO scores
|
||||||||||||||||
|
660 or higher
|
$
|
3,424
|
|
$
|
41
|
|
$
|
5
|
|
$
|
3,470
|
|
||||
|
620-659
|
3,383
|
|
23
|
|
2
|
|
3,408
|
|
||||||||
|
619 or below
|
6,747
|
|
77
|
|
4
|
|
6,828
|
|
||||||||
|
Unavailable
|
23
|
|
3
|
|
—
|
|
26
|
|
||||||||
|
Total
|
$
|
13,577
|
|
$
|
144
|
|
$
|
11
|
|
$
|
13,732
|
|
||||
|
*
|
The shift in FICO distribution includes the alignment in FICO versions across OMH. Effective March 31, 2017, the legacy Springleaf FICO scores were refreshed to FICO 08 version, which is comparable with the legacy OneMain FICO version.
|
DELINQUENCY
We consider the delinquency status of our finance receivables as the primary indicator of credit quality. We monitor delinquency trends to evaluate the risk of future credit losses and employ advanced analytical tools to manage our exposure and appetite. Our branch team members work with customers through occasional periods of financial difficulty and offer a variety of borrower assistance programs to help customers continue to make payments. Team members also actively engage in collection activities throughout the early stages of delinquency. We closely track and report the percentage of receivables that are contractually 30-89 days past due as a benchmark of portfolio quality, collections effectiveness, and as a strong indicator of losses in coming quarters.
When finance receivables are contractually 60 days past due, we consider them delinquent and transfer collections management of these accounts to our centralized operations, as these accounts are considered to be at increased risk for loss. Use of our centralized operations teams for managing late stage delinquency allows us to apply more advanced collections technologies/tools and drives operating efficiencies in servicing. At 90 days past due, we consider our finance receivables to be nonperforming.
60
The following table presents (i) delinquency information of the Company’s segments on a Segment Accounting Basis, (ii) reconciliations to our total net finance receivables on a GAAP basis, by number of days delinquent, and (iii) delinquency ratios as a percentage of net finance receivables:
|
(dollars in millions)
|
Consumer
and
Insurance
|
Other
|
Segment to
GAAP
Adjustment
|
Consolidated
Total
|
||||||||||||
|
December 31, 2017
|
||||||||||||||||
|
Current
|
$
|
14,119
|
|
$
|
109
|
|
$
|
—
|
|
$
|
14,228
|
|
||||
|
30-59 days past due
|
205
|
|
9
|
|
(2
|
)
|
212
|
|
||||||||
|
Delinquent (60-89 days past due)
|
157
|
|
4
|
|
(1
|
)
|
160
|
|
||||||||
|
Performing
|
14,481
|
|
122
|
|
(3
|
)
|
14,600
|
|
||||||||
|
Nonperforming (90+ days past due)
|
339
|
|
20
|
|
(2
|
)
|
357
|
|
||||||||
|
Total net finance receivables
|
$
|
14,820
|
|
$
|
142
|
|
$
|
(5
|
)
|
$
|
14,957
|
|
||||
|
Delinquency ratio
|
||||||||||||||||
|
30-89 days past due
|
2.44
|
%
|
8.60
|
%
|
*
|
|
2.49
|
%
|
||||||||
|
30+ days past due
|
4.73
|
%
|
22.75
|
%
|
*
|
|
4.88
|
%
|
||||||||
|
60+ days past due
|
3.35
|
%
|
16.66
|
%
|
*
|
|
3.46
|
%
|
||||||||
|
90+ days past due
|
2.29
|
%
|
14.15
|
%
|
*
|
|
2.39
|
%
|
||||||||
|
December 31, 2016
|
||||||||||||||||
|
Current
|
$
|
12,799
|
|
$
|
131
|
|
$
|
103
|
|
$
|
13,033
|
|
||||
|
30-59 days past due
|
174
|
|
10
|
|
(1
|
)
|
183
|
|
||||||||
|
Delinquent (60-89 days past due)
|
130
|
|
4
|
|
—
|
|
134
|
|
||||||||
|
Performing
|
13,103
|
|
145
|
|
102
|
|
13,350
|
|
||||||||
|
Nonperforming (90+ days past due)
|
352
|
|
31
|
|
(1
|
)
|
382
|
|
||||||||
|
Total net finance receivables
|
$
|
13,455
|
|
$
|
176
|
|
$
|
101
|
|
$
|
13,732
|
|
||||
|
Delinquency ratio
|
||||||||||||||||
|
30-89 days past due
|
2.26
|
%
|
8.32
|
%
|
*
|
|
2.31
|
%
|
||||||||
|
30+ days past due
|
4.88
|
%
|
25.88
|
%
|
*
|
|
5.09
|
%
|
||||||||
|
60+ days past due
|
3.59
|
%
|
20.16
|
%
|
*
|
|
3.76
|
%
|
||||||||
|
90+ days past due
|
2.62
|
%
|
17.56
|
%
|
*
|
|
2.78
|
%
|
||||||||
|
*
|
Not applicable.
|
61
ALLOWANCE FOR FINANCE RECEIVABLE LOSSES
We record an allowance for finance receivable losses to cover estimated incurred losses on our finance receivables. Our allowance for finance receivable losses may fluctuate based upon our continual review of the credit quality of the finance receivable portfolios and changes in economic conditions.
Changes in the allowance for finance receivable losses for each of the Company’s segments on a Segment Accounting Basis, as well as reconciliations to our total allowance for finance receivable losses on a GAAP basis, were as follows:
|
(dollars in millions)
|
Consumer
and
Insurance
|
Acquisitions
and
Servicing
|
Other
|
Segment to
GAAP
Adjustment
|
Consolidated
Total
|
|||||||||||||||
|
Year Ended December 31, 2017
|
||||||||||||||||||||
|
Balance at beginning of period
|
$
|
732
|
|
$
|
—
|
|
$
|
31
|
|
$
|
(74
|
)
|
$
|
689
|
|
|||||
|
Provision for finance receivable losses
|
963
|
|
—
|
|
7
|
|
(15
|
)
|
955
|
|
||||||||||
|
Charge-offs
|
(1,100
|
)
|
—
|
|
(7
|
)
|
53
|
|
(1,054
|
)
|
||||||||||
|
Recoveries
|
129
|
|
—
|
|
4
|
|
(26
|
)
|
107
|
|
||||||||||
|
Balance at end of period
|
$
|
724
|
|
$
|
—
|
|
$
|
35
|
|
$
|
(62
|
)
|
$
|
697
|
|
|||||
|
Allowance ratio
|
4.88
|
%
|
—
|
%
|
24.28
|
%
|
(a)
|
|
4.66
|
%
|
||||||||||
|
Year Ended December 31, 2016
|
||||||||||||||||||||
|
Balance at beginning of period
|
$
|
769
|
|
$
|
4
|
|
$
|
70
|
|
$
|
(251
|
)
|
$
|
592
|
|
|||||
|
Provision for finance receivable losses
|
911
|
|
14
|
|
6
|
|
1
|
|
932
|
|
||||||||||
|
Charge-offs
|
(1,050
|
)
|
(17
|
)
|
(18
|
)
|
210
|
|
(875
|
)
|
||||||||||
|
Recoveries
|
102
|
|
3
|
|
8
|
|
(39
|
)
|
74
|
|
||||||||||
|
Other (b)
|
—
|
|
(4
|
)
|
(35
|
)
|
5
|
|
(34
|
)
|
||||||||||
|
Balance at end of period
|
$
|
732
|
|
$
|
—
|
|
$
|
31
|
|
$
|
(74
|
)
|
$
|
689
|
|
|||||
|
Allowance ratio
|
5.44
|
%
|
—
|
%
|
17.51
|
%
|
(a)
|
|
5.01
|
%
|
||||||||||
|
Year Ended December 31, 2015
|
||||||||||||||||||||
|
Balance at beginning of period
|
$
|
134
|
|
$
|
3
|
|
$
|
91
|
|
$
|
(46
|
)
|
$
|
182
|
|
|||||
|
Provision for finance receivable losses
|
351
|
|
68
|
|
(1
|
)
|
298
|
|
716
|
|
||||||||||
|
Charge-offs
|
(427
|
)
|
(79
|
)
|
(28
|
)
|
174
|
|
(360
|
)
|
||||||||||
|
Recoveries
|
46
|
|
12
|
|
8
|
|
(11
|
)
|
55
|
|
||||||||||
|
Other (c)
|
665
|
|
—
|
|
—
|
|
(666
|
)
|
(1
|
)
|
||||||||||
|
Balance at end of period
|
$
|
769
|
|
$
|
4
|
|
$
|
70
|
|
$
|
(251
|
)
|
$
|
592
|
|
|||||
|
Allowance ratio
|
5.94
|
%
|
0.25
|
%
|
11.57
|
%
|
(a)
|
|
3.81
|
%
|
||||||||||
|
(a)
|
Not applicable.
|
|
(b)
|
Other consists of:
|
|
•
|
the elimination of allowance for finance receivable losses due to the sale of the SpringCastle Portfolio on March 31, 2016, in connection with the sale of our equity interest in the SpringCastle Joint Venture. See Note
2
of the Notes to Consolidated Financial Statements included in this report for more information about the sale; and
|
|
•
|
the elimination of allowance for finance receivable losses due to the transfers of real estate loans held for investment to finance receivable held for sale during 2016.
|
62
|
(c)
|
Other consists of:
|
|
•
|
the addition to allowance for finance receivable losses of $666 million due to the personal loans acquired in connection with the OneMain Acquisition and the offsetting Segment to GAAP adjustment; and
|
|
•
|
the elimination of allowance for finance receivable losses of $1 million due to the transfer of personal loans held for investment to finance receivable held for sale during 2015.
|
The current delinquency status of our finance receivable portfolio, inclusive of recent borrower performance, along with the volume of our TDR activity, are the primary drivers that can cause fluctuations in our allowance for finance receivable losses from period to period. We monitor the allowance ratio to ensure we have a sufficient level of allowance for finance receivable losses to cover estimated incurred losses in our finance receivable portfolio. The level of allowance for finance receivables losses as a percentage of net finance receivables has decreased from 2016 due to the change in portfolio mix to more secured personal loans, improvement in the effectiveness of our collections, and the completion of our integration.
In aggregate, our Consumer and Insurance allowance for finance receivable losses decreased by $8 million during 2017, inclusive of $12 million related to estimates of impacts to charge-offs resulting from hurricanes Harvey and Irma.
See Notes
4
and
6
of the Notes to Consolidated Financial Statements included in this report for more information about changes in the allowance for finance receivable losses.
TDR FINANCE RECEIVABLES
We make modifications to our finance receivables to assist borrowers during times of financial difficulties. When we modify a loan’s contractual terms for economic or other reasons related to the borrower’s financial difficulties and grant a concession that we would not otherwise consider, we classify that loan as a TDR finance receivable.
Information regarding TDR finance receivables held for investment for each of the Company’s segments on a Segment Accounting Basis, as well as reconciliations to information regarding our total TDR finance receivables held for investment on a GAAP basis, were as follows:
|
(dollars in millions)
|
Consumer
and Insurance |
Other
|
Segment to
GAAP Adjustment |
Consolidated
Total |
||||||||||||
|
December 31, 2017
|
||||||||||||||||
|
TDR net finance receivables
|
$
|
481
|
|
$
|
74
|
|
$
|
(188
|
)
|
$
|
367
|
|
||||
|
Allowance for TDR finance receivable losses
|
191
|
|
26
|
|
(70
|
)
|
147
|
|
||||||||
|
December 31, 2016
|
||||||||||||||||
|
TDR net finance receivables
|
$
|
421
|
|
$
|
71
|
|
$
|
(296
|
)
|
$
|
196
|
|
||||
|
Allowance for TDR finance receivable losses
|
154
|
|
23
|
|
(97
|
)
|
80
|
|
||||||||
Upon the completion of our branch integration in the first quarter of 2017, we continued the alignment and enhancement of our collection processes, which in the second quarter of 2017 resulted in an increase in the loans now classified as TDRs, and accordingly, we reclassified the associated allowance for finance receivable losses. This resulted in a reduction to the allowance for non-TDR finance receivables and an increase to the allowance for TDR finance receivable losses. The allowance for non-TDR finance receivable losses continues to reflect our historical loss coverage.
Liquidity and Capital Resources
SOURCES OF FUNDS
We finance the majority of our operating liquidity and capital needs through a combination of cash flows from operations, securitization debt, borrowings from conduit facilities, unsecured debt and equity, and may also utilize other corporate debt facilities in the future. As a holding company, all of the funds generated from our operations are earned by our operating subsidiaries.
63
SFC Issuance of 5.625% Senior Notes Due 2023
On December 8, 2017, SFC issued
$875 million
aggregate principal amount of the 5.625% SFC Notes under the SFC Fourth Supplemental Indenture, pursuant to which OMH provided a guarantee of the 5.625% SFC Notes on an unsecured basis. SFC used a portion of the net proceeds from the sale of the
5.625%
SFC Notes to repay at maturity approximately
$557 million
aggregate principal amount of SFC’s existing 6.90% Medium-Term Notes and for general corporate purposes. See Note
12
of the Notes to Consolidated Financial Statements included in this report for further information on the issuance.
SFC Issuance of 6.125% Senior Notes Due 2022
On May 15, 2017, SFC issued
$500 million
aggregate principal amount of the 6.125% SFC Notes under the SFC Third Supplemental Indenture, pursuant to which OMH provided a guarantee of the 6.125% SFC Notes on an unsecured basis. On May 30, 2017, SFC issued and sold
$500 million
aggregate principal amount of the Additional SFC Notes in an add-on offering. SFC used a portion of the net proceeds from the sale of the Additional SFC Notes to repurchase approximately $466 million aggregate principal amount of its existing 6.90% Senior Notes due 2017 at a premium to par. SFC used the remaining net proceeds from the sale of the
6.125%
SFC Notes for general corporate purposes. See Note
12
of the Notes to Consolidated Financial Statements included in this report for further information on the issuance.
Securitizations and Borrowings from Revolving Conduit Facilities
During
2017
, we (i) completed two consumer loan securitizations and two auto securitization, and (ii) exercised our right to redeem the 2014-A Notes and the 2014-1 Notes. At December 31, 2017, we had $9.8 billion in UPB of finance receivables pledged as collateral for our securitization transactions.
During
2017
, we (i) terminated eight revolving conduit agreements and (ii) entered into seven new conduit facilities. At
December 31, 2017
, we had access to 10 conduit facilities with a total borrowing capacity of
$5.1 billion
. At
December 31, 2017
,
no
amounts were drawn under these facilities.
See Notes
12
and
13
of the Notes to Consolidated Financial Statements included in this report for further information on our long-term debt, loan securitization transactions and conduit facilities.
Subsequent to
December 31, 2017
, we completed the following transactions:
|
•
|
On January 8, 2018, we redeemed $700 million in aggregate principal amount of OMFH’s 6.75% Senior Notes due 2019. See Note
24
of the Notes to Consolidated Financial Statements included in this report for further information regarding this redemption.
|
|
•
|
On February 2, 2018, OneMain Financial B6 Warehouse Trust voluntarily terminated its note purchase agreement. Concurrently, we entered into the OneMain Financial Funding VIII LSA with the same third party lenders who were party to the terminated note purchase agreement with the OneMain Financial B6 Warehouse Trust. Under the OneMain Financial Funding VIII LSA, we may borrow up to a maximum principal balance of $450 million. See Note
24
of the Notes to Consolidated Financial Statements included in this report for further information.
|
|
•
|
We have drawn a net amount of $475 million under our various revolving conduit facilities.
|
USES OF FUNDS
Our operating subsidiaries’ primary cash needs relate to funding our lending activities, our debt service obligations, our operating expenses (including acquisition-related transaction and integration expenses), payment of insurance claims and, to a lesser extent, expenditures relating to upgrading and monitoring our technology platform, risk systems, and branch locations.
At
December 31, 2017
, we had
$987 million
of cash and cash equivalents, which included $242 million of cash and cash equivalents held at our regulated insurance subsidiaries or for other operating activities that is unavailable for general corporate purposes. During
2017
, we generated net income attributable to OMH of
$183 million
. Our net cash outflow from operating and investing activities totaled
$637 million
in
2017
. At
December 31, 2017
, our scheduled principal and interest payments for
2018
on our existing debt (excluding securitizations) totaled
$1.1 billion
. As of
December 31, 2017
, we had
$5.0 billion
UPB of unencumbered personal loans and
$328 million
UPB of unencumbered real estate loans (including
$193 million
held for sale). Based on our estimates and taking into account the risks and uncertainties of our plans, we believe that we will have adequate liquidity to finance and operate our businesses and repay our obligations as they become due for at least the next 12 months.
64
See Notes
12
and
13
of the Notes to Consolidated Financial Statements included in this report for further information on our long-term debt, loan securitization transactions and conduit facilities.
We have previously purchased portions of our unsecured indebtedness, and we may elect to purchase additional portions of our unsecured indebtedness in the future. Future purchases may be made through the open market, privately negotiated transactions with third parties, or pursuant to one or more tender or exchange offers, all of which are subject to terms, prices, and consideration we may determine.
We have not paid dividends since our initial public offering in 2013. However, we plan to evaluate the potential for capital distributions in 2018 based on the achievement of our liquidity and target leverage objectives, among other factors. Any capital distribution, including any declaration and payment of future dividends to holders of our common stock, will be at the discretion of our board of directors and will depend on many factors, including our financial condition, earnings, cash flows, capital requirements, level of indebtedness, statutory and contractual restrictions applicable to the payment of dividends, and other considerations that our board of directors deems relevant. There can be no assurances that we will make any capital distributions in 2018 or at any time thereafter and, even if we make capital distributions in 2018, there can be no assurances that we will continue to do so in the future. See “Dividend Policy” in Part II - Item 5 of this report for further information.
LIQUIDITY
Operating Activities
Net cash provided by operations of
$1.6 billion
for
2017
reflected net income of
$183 million
, the impact of non-cash items, and a favorable change in working capital of
$17 million
. Net cash provided by operations of
$1.3 billion
for
2016
reflected a net income of
$243 million
, the impact of non-cash items, and an unfavorable change in working capital of
$119 million
. Net cash provided by operations of
$741 million
for
2015
reflected a net loss of
$93 million
, the impact of non-cash items, and a favorable change in working capital of
$103 million
.
Investing Activities
Net cash used for investing activities of
$2.2 billion
for
2017
was primarily due to net principal originations of finance receivables held for investment and held for sale, partially offset by net sales, calls, and maturities of available-for-sale securities. Net cash used for investing activities of
$106 million
for
2016
was primarily due to net principal collections and originations of finance receivables held for investment and held for sale, partially offset by the SpringCastle Interests Sale, the Lendmark Sale, the August 2016 Real Estate Loan Sale, and the December 2016 Real Estate Loan Sale. Net cash used for investing activities of
$2.2 billion
for
2015
was primarily due to the OneMain Acquisition.
Financing Activities
Net cash provided by financing activities of
$975 million
for
2017
was primarily due to net issuances of long-term debt, including SFC’s offerings of the 6.125% SFC Notes in May of 2017 and the 5.625% SFC Notes in December 2017; offset primarily by the repayment at maturity of existing 6.90% Medium-Term Notes and the repurchase of existing 6.90% Medium-Term Notes. Net cash used for financing activities of
$1.7 billion
for
2016
was primarily due to net repayments of long term debt. Net cash provided by financing activities of
$2.0 billion
for
2015
reflected the debt issuances associated with the 2015-A and 2015-B securitizations.
Liquidity Risks and Strategies
SFC’s and OMFH’s credit ratings are non-investment grade, which have a significant impact on our cost of, and access to, capital. This, in turn, can negatively affect our ability to manage our liquidity and our ability or cost to refinance our indebtedness.
There are numerous risks to our financial results, liquidity, capital raising, and debt refinancing plans, some of which may not be quantified in our current liquidity forecasts. These risks include, but are not limited, to the following:
|
•
|
our inability to grow or maintain our personal loan portfolio with adequate profitability;
|
|
•
|
any inability to repay or default in the repayment of intercompany indebtedness owed to us by our affiliates or owed by us to our affiliates;
|
|
•
|
the effect of federal, state and local laws, regulations, or regulatory policies and practices;
|
65
|
•
|
potential liability relating to real estate and personal loans which we have sold or may sell in the future, or relating to securitized loans; and
|
|
•
|
the potential for disruptions in the debt and equity markets.
|
The principal factors that could decrease our liquidity are customer delinquencies and defaults, a decline in customer prepayments, and a prolonged inability to adequately access capital market funding. We intend to support our liquidity position by utilizing some or all the following strategies:
|
•
|
maintaining disciplined underwriting standards and pricing for loans we originate or purchase and managing purchases of finance receivables;
|
|
•
|
pursuing additional debt financings (including new securitizations and new unsecured debt issuances, debt refinancing transactions and revolving conduit facilities), or a combination of the foregoing;
|
|
•
|
purchasing portions of our outstanding indebtedness through open market or privately negotiated transactions with third parties or pursuant to one or more tender or exchange offers or otherwise, upon such terms and at such prices, as well as with such consideration, as we may determine; and
|
|
•
|
obtaining new and extending existing secured revolving facilities to provide committed liquidity in case of prolonged market fluctuations.
|
However, it is possible that the actual outcome of one or more of our plans could be materially different than expected or that one or more of our significant judgments or estimates could prove to be materially incorrect.
OUR INSURANCE SUBSIDIARIES
Our insurance subsidiaries are subject to state regulations that limit their ability to pay dividends. See Note
14
of the Notes to Consolidated Financial Statements included in this report for further information on these restrictions and the dividends paid by our insurance subsidiaries during
2015
through
2017
.
OUR DEBT AGREEMENTS
The debt agreements to which SFC, OMFH, and their subsidiaries are a party include customary terms and conditions, including covenants and representations and warranties. See Note
12
of the Notes to Consolidated Financial Statements included in this report for further information on the restrictive covenants under SFC’s and OMFH’s debt agreements, as well as the guarantees of SFC’s and OMFH’s long-term debt.
Contractual Obligations
At
December 31, 2017
, our material contractual obligations were as follows:
|
(dollars in millions)
|
2018 (a)
|
2019-2020
|
2021-2022
|
2023+
|
Securitizations
|
Total
|
||||||||||||||||||
|
Principal maturities on long-term debt:
|
||||||||||||||||||||||||
|
Securitization debt (b)
|
$
|
—
|
|
$
|
—
|
|
$
|
—
|
|
$
|
—
|
|
$
|
8,711
|
|
$
|
8,711
|
|
||||||
|
Medium-term notes
|
700
|
|
1,995
|
|
2,446
|
|
1,175
|
|
—
|
|
6,316
|
|
||||||||||||
|
Junior subordinated debt
|
—
|
|
—
|
|
—
|
|
350
|
|
—
|
|
350
|
|
||||||||||||
|
Total principal maturities
|
700
|
|
1,995
|
|
2,446
|
|
1,525
|
|
8,711
|
|
15,377
|
|
||||||||||||
|
Interest payments on debt (c)
|
385
|
|
740
|
|
372
|
|
580
|
|
587
|
|
2,664
|
|
||||||||||||
|
Operating leases (d)
|
55
|
|
77
|
|
34
|
|
14
|
|
—
|
|
180
|
|
||||||||||||
|
Total
|
$
|
1,140
|
|
$
|
2,812
|
|
$
|
2,852
|
|
$
|
2,119
|
|
$
|
9,298
|
|
$
|
18,221
|
|
||||||
|
(a)
|
On January 8, 2018, the Company redeemed all $700 million outstanding principal amount of OMFH’s 6.75% Senior Notes due 2019. See Note
24
for further information regarding this redemption.
|
|
(b)
|
On-balance sheet securitizations and borrowings under revolving conduit facilities are not included in maturities by period due to their variable monthly payments. At
December 31, 2017
, there were
no
amounts drawn under our revolving conduit facilities.
|
|
(c)
|
Future interest payments on floating-rate debt are estimated based upon floating rates in effect at
December 31, 2017
.
|
66
|
(d)
|
Operating leases include annual rental commitments for leased office space, automobiles, and information technology and related equipment.
|
Off-Balance Sheet Arrangements
We have no material off-balance sheet arrangements as defined by SEC rules. We had no off-balance sheet exposure to losses associated with unconsolidated variable interest entities at
December 31, 2017
or
2016
, other than certain representations and warranties associated with the sales of the mortgage-backed retained certificates during 2014. As of
December 31, 2017
, we had no repurchase activity related to these sales.
Critical Accounting Policies and Estimates
We consider the following policies to be our most critical accounting policies because they involve critical accounting estimates and a significant degree of management judgment:
ALLOWANCE FOR FINANCE RECEIVABLE LOSSES
We estimate the allowance for finance receivable losses primarily on historical loss experience using a roll rate-based model applied to our finance receivable portfolios. In our roll rate-based model, our finance receivable types are stratified by contractual delinquency stages (i.e., current, 1-29 days past due, 30-59 days past due, etc.) and projected forward in one-month increments using historical roll rates. In each month of the simulation, losses on our finance receivable types are captured, and the ending delinquency stratification serves as the beginning point of the next iteration. No new volume is assumed. This process is repeated until the number of iterations equals the loss emergence period (the interval of time between the event which causes a borrower to default on a finance receivable and our recording of the charge-off) for our finance receivable types. As delinquency is a primary input into our roll rate-based model, we inherently consider nonaccrual loans in our estimate of the allowance for finance receivable losses.
Management exercises its judgment, based on quantitative analyses, qualitative factors, such as recent delinquency and other credit trends, and experience in the consumer finance industry, when determining the amount of the allowance for finance receivable losses. We adjust the amounts determined by the roll rate-based model for management’s estimate of the effects of model imprecision which include but are not limited to, any changes to underwriting criteria, portfolio seasoning, and current economic conditions, including levels of unemployment and personal bankruptcies.
PURCHASED CREDIT IMPAIRED FINANCE RECEIVABLES
As part of each of our acquisitions, we identify a population of finance receivables for which it is determined that it is probable that we will be unable to collect all contractually required payments. We accrete the excess of the cash flows expected to be collected on the purchased credit impaired finance receivables over the discounted cash flows (the “accretable yield”) into interest income at a level rate of return over the expected lives of the underlying pools of the purchased credit impaired finance receivables. We update our estimates for cash flows on a quarterly basis incorporating current assumptions regarding default rates, loss severities, the amounts and timing of prepayments and other factors that are reflective of current market conditions. If expected cash flows increase significantly, we adjust the yield prospectively; conversely, if expected cash flows decrease, we record an impairment.
TDR FINANCE RECEIVABLES
When we modify a loan’s contractual terms for economic or other reasons related to the borrower’s financial difficulties and grant a concession that we would not otherwise consider, we classify that loan as a TDR finance receivable. When we modify an account we primarily use a combination of the following to reduce the borrower’s monthly payment: reduce interest rate, extend the term, capitalize or forgive past due interest or forgive principal. Account modifications that are deemed to be a TDR finance receivable are measured for impairment in accordance with the authoritative guidance for the accounting for impaired loans.
The allowance for finance receivable losses related to our TDR finance receivables represents loan-specific reserves based on an analysis of the present value of expected future cash flows. We establish our allowance for finance receivable losses related to our TDR finance receivables by calculating the present value (discounted at the loan’s effective interest rate prior to modification) of all expected cash flows less the recorded investment in the aggregated pool. We use certain assumptions to estimate the expected cash flows from our TDR finance receivables. The primary assumptions for our model are prepayment speeds, default rates, and severity rates.
67
FAIR VALUE MEASUREMENTS
Management is responsible for the determination of the fair value of our financial assets and financial liabilities and the supporting methodologies and assumptions. We employ widely used financial techniques or utilize third-party valuation service providers to gather, analyze, and interpret market information and derive fair values based upon relevant methodologies and assumptions for individual instruments or pools of finance receivables. When our valuation service providers are unable to obtain sufficient market observable information upon which to estimate the fair value for a particular security, we determine fair value either by requesting brokers who are knowledgeable about these securities to provide a quote, which is generally non-binding, or by employing widely used financial techniques.
GOODWILL AND OTHER INTANGIBLE ASSETS
For goodwill and indefinite lived intangible assets, we first complete a qualitative assessment to determine whether it is necessary to perform a quantitative impairment test annually as of October 1 of each year. For goodwill, if the qualitative assessment indicates that it is more likely than not that the reporting unit’s fair value is less than its carrying amount, we proceed with the two-step impairment test. When necessary, the fair value of the reporting unit is calculated utilizing the income approach, which uses prospective financial information of the reporting unit discounted at a rate that we estimate a market participant would use. For indefinite lived intangible assets, if the qualitative assessment indicates that the assets are more likely than not to have been impaired, we proceed with the fair value calculation of the assets.
For those net intangible assets with a finite useful life, we review such intangibles for impairment at least annually and whenever events or changes in circumstances indicate that their carrying amounts may not be recoverable.
Recent Accounting Pronouncements
See Note
4
of the Notes to Consolidated Financial Statements included in this report for discussion of recently issued accounting pronouncements.
Seasonality
Our personal loan volume is generally highest during the second and fourth quarters of the year, primarily due to marketing efforts, seasonality of demand, and increased traffic in branches after the winter months. Demand for our personal loans is usually lower in January and February after the holiday season and as a result of tax refunds. Delinquencies on our personal loans are generally lowest in the first quarter and tend to rise throughout the remainder of the year. These seasonal trends contribute to fluctuations in our operating results and cash needs throughout the year.
The fair values of certain of our assets and liabilities are sensitive to changes in market interest rates. The impact of changes in interest rates would be reduced by the fact that increases (decreases) in fair values of assets would be partially offset by corresponding changes in fair values of liabilities. In aggregate, the estimated impact of an immediate and sustained 100 bp increase or decrease in interest rates on the fair values of our interest rate-sensitive financial instruments would not be material to our financial position.
The estimated increases (decreases) in fair values of interest rate-sensitive financial instruments were as follows:
|
December 31,
|
2017
|
2016
|
||||||||||||||
|
(dollars in millions)
|
+100 bp
|
-100 bp
|
+100 bp
|
-100 bp
|
||||||||||||
|
Assets
|
||||||||||||||||
|
Net finance receivables, less allowance for finance receivable losses
|
$
|
(217
|
)
|
$
|
223
|
|
$
|
(182
|
)
|
$
|
187
|
|
||||
|
Finance receivables held for sale
|
(10
|
)
|
12
|
|
(11
|
)
|
13
|
|
||||||||
|
Fixed-maturity investment securities
|
(62
|
)
|
68
|
|
(69
|
)
|
71
|
|
||||||||
|
Liabilities
|
||||||||||||||||
|
Long-term debt
|
$
|
(375
|
)
|
$
|
236
|
|
$
|
(327
|
)
|
$
|
193
|
|
||||
68
We derived the changes in fair values by modeling estimated cash flows of certain of our assets and liabilities. We adjusted the cash flows to reflect changes in prepayments and calls, but did not consider loan originations, debt issuances, or new investment purchases.
We did not enter into interest rate-sensitive financial instruments for trading or speculative purposes.
Readers should exercise care in drawing conclusions based on the above analysis. While these changes in fair values provide a measure of interest rate sensitivity, they do not represent our expectations about the impact of interest rate changes on our financial results. This analysis is also based on our exposure at a particular point in time and incorporates numerous assumptions and estimates. It also assumes an immediate change in interest rates, without regard to the impact of certain business decisions or initiatives that we would likely undertake to mitigate or eliminate some or all of the adverse effects of the modeled scenarios.
69
An index to our financial statements and supplementary data follows:
|
Topic
|
Page
|
||
70
Report of Independent Registered Public Accounting Firm
To the
Board of Directors and Shareholders of OneMain Holdings, Inc.
Opinions on the Financial Statements and Internal Control over Financial Reporting
We have audited the accompanying consolidated balance sheets of OneMain Holdings, Inc. and its subsidiaries as of December 31, 2017 and 2016, and the related consolidated statements of operations, comprehensive income (loss), shareholders’ equity and cash flows for each of the three years in the period ended December 31, 2017, including the related notes and financial statement schedule listed in the accompanying index (collectively referred to as the “consolidated financial statements”). We also have audited the Company's internal control over financial reporting as of December 31, 2017, based on criteria established in
Internal Control - Integrated Framework
(2013) issued by the Committee of Sponsoring Organizations of the Treadway Commission (COSO).
In our opinion, the consolidated
financial statements referred to above present fairly, in all material respects, the financial position of the Company as of December 31, 2017 and 2016
,
and the results of their operations and their cash flows for each of the three years in the period ended December 31, 2017 in conformity with accounting principles generally accepted in the United States of America. Also in our opinion, the Company maintained, in all material respects, effective internal control over financial reporting as of December 31, 2017, based on criteria established in
Internal Control - Integrated Framework
(2013) issued by the COSO.
Basis for Opinions
The Company's management is responsible for these consolidated financial statements, for maintaining effective internal control over financial reporting, and for its assessment of the effectiveness of internal control over financial reporting, included in Management's Report on Internal Control over Financial Reporting appearing under Item 9A. Our responsibility is to express opinions on the Company’s consolidated
financial statements and on the Company's internal control over financial reporting based on our audits. We are a public accounting firm registered with the Public Company Accounting Oversight Board (United States) ("PCAOB") and are required to be independent with respect to the Company in accordance with the U.S. federal securities laws and the applicable rules and regulations of the Securities and Exchange Commission and the PCAOB.
We conducted our audits in accordance with the standards of the PCAOB. Those standards require that we plan and perform the audits to obtain reasonable assurance about whether the consolidated
financial statements are free of material misstatement, whether due to error or fraud, and whether effective internal control over financial reporting was maintained in all material respects.
Our audits of the consolidated
financial statements included performing procedures to assess the risks of material misstatement of the consolidated
financial statements, whether due to error or fraud, and performing procedures that respond to those risks. Such procedures included examining, on a test basis, evidence regarding the amounts and disclosures in the consolidated
financial statements. Our audits also included evaluating the accounting principles used and significant estimates made by management, as well as evaluating the overall presentation of the consolidated
financial statements. Our audit of internal control over financial reporting included obtaining an understanding of internal control over financial reporting, assessing the risk that a material weakness exists, and testing and evaluating the design and operating effectiveness of internal control based on the assessed risk. Our audits also included performing such other procedures as we considered necessary in the circumstances. We believe that our audits provide a reasonable basis for our opinions.
71
Definition and Limitations of Internal Control over Financial Reporting
A company’s internal control over financial reporting is a process designed to provide reasonable assurance regarding the reliability of financial reporting and the preparation of financial statements for external purposes in accordance with generally accepted accounting principles. A company’s internal control over financial reporting includes those policies and procedures that (i) pertain to the maintenance of records that, in reasonable detail, accurately and fairly reflect the transactions and dispositions of the assets of the company; (ii) provide reasonable assurance that transactions are recorded as necessary to permit preparation of financial statements in accordance with generally accepted accounting principles, and that receipts and expenditures of the company are being made only in accordance with authorizations of management and directors of the company; and (iii) provide reasonable assurance regarding prevention or timely detection of unauthorized acquisition, use, or disposition of the company’s assets that could have a material effect on the financial statements.
Because of its inherent limitations, internal control over financial reporting may not prevent or detect misstatements. Also, projections of any evaluation of effectiveness to future periods are subject to the risk that controls may become inadequate because of changes in conditions, or that the degree of compliance with the policies or procedures may deteriorate.
/s/ PricewaterhouseCoopers LLP
Dallas, Texas
February 21, 2018
We have served as the Company’s auditor since 2002.
72
ONEMAIN HOLDINGS, INC. AND SUBSIDIARIES
|
(dollars in millions, except par value amount)
|
||||||||
|
December 31,
|
2017
|
2016
|
||||||
|
Assets
|
||||||||
|
Cash and cash equivalents
|
$
|
987
|
|
$
|
579
|
|
||
|
Investment securities
|
1,697
|
|
1,764
|
|
||||
|
Net finance receivables:
|
||||||||
|
Personal loans (includes loans of consolidated VIEs of $9.8 billion in 2017 and $9.5 billion in 2016)
|
14,823
|
|
13,577
|
|
||||
|
Real estate loans
|
128
|
|
144
|
|
||||
|
Retail sales finance
|
6
|
|
11
|
|
||||
|
Net finance receivables
|
14,957
|
|
13,732
|
|
||||
|
Unearned insurance premium and claim reserves
|
(590
|
)
|
(586
|
)
|
||||
|
Allowance for finance receivable losses (includes allowance of consolidated VIEs of $465 million in 2017 and $501 million in 2016)
|
(697
|
)
|
(689
|
)
|
||||
|
Net finance receivables, less unearned insurance premium and claim reserves and allowance for finance receivable losses
|
13,670
|
|
12,457
|
|
||||
|
Finance receivables held for sale
|
132
|
|
153
|
|
||||
|
Restricted cash and restricted cash equivalents (includes restricted cash and restricted cash equivalents of consolidated VIEs of $482 million in 2017 and $552 million in 2016)
|
498
|
|
568
|
|
||||
|
Goodwill
|
1,422
|
|
1,422
|
|
||||
|
Other intangible assets
|
440
|
|
492
|
|
||||
|
Other assets
|
587
|
|
688
|
|
||||
|
Total assets
|
$
|
19,433
|
|
$
|
18,123
|
|
||
|
Liabilities and Shareholders’ Equity
|
||||||||
|
Long-term debt (includes debt of consolidated VIEs of $8.7 billion in 2017 and $8.2 billion in 2016)
|
$
|
15,050
|
|
$
|
13,959
|
|
||
|
Insurance claims and policyholder liabilities
|
737
|
|
757
|
|
||||
|
Deferred and accrued taxes
|
45
|
|
9
|
|
||||
|
Other liabilities (includes other liabilities of consolidated VIEs of $14 million in 2017 and $12 million in 2016)
|
323
|
|
332
|
|
||||
|
Total liabilities
|
16,155
|
|
15,057
|
|
||||
|
Commitments and contingent liabilities (Note 19)
|
|
|
|
|
||||
|
Shareholders’ equity:
|
||||||||
|
Common stock, par value $.01 per share; 2,000,000,000 shares authorized, 135,349,638 and 134,867,868 shares issued and outstanding at December 31, 2017 and 2016, respectively
|
1
|
|
1
|
|
||||
|
Additional paid-in capital
|
1,560
|
|
1,548
|
|
||||
|
Accumulated other comprehensive income (loss)
|
11
|
|
(6
|
)
|
||||
|
Retained earnings
|
1,706
|
|
1,523
|
|
||||
|
Total shareholders’ equity
|
3,278
|
|
3,066
|
|
||||
|
Total liabilities and shareholders’ equity
|
$
|
19,433
|
|
$
|
18,123
|
|
||
See Notes to Consolidated Financial Statements.
73
ONEMAIN HOLDINGS, INC. AND SUBSIDIARIES
|
(dollars in millions, except per share amounts)
|
||||||||||||
|
Years Ended December 31,
|
2017
|
2016
|
2015
|
|||||||||
|
|
||||||||||||
|
Interest income:
|
||||||||||||
|
Finance charges
|
$
|
3,183
|
|
$
|
3,036
|
|
$
|
1,870
|
|
|||
|
Finance receivables held for sale originated as held for investment
|
13
|
|
74
|
|
60
|
|
||||||
|
Total interest income
|
3,196
|
|
3,110
|
|
1,930
|
|
||||||
|
Interest expense
|
816
|
|
856
|
|
715
|
|
||||||
|
Net interest income
|
2,380
|
|
2,254
|
|
1,215
|
|
||||||
|
Provision for finance receivable losses
|
955
|
|
932
|
|
716
|
|
||||||
|
Net interest income after provision for finance receivable losses
|
1,425
|
|
1,322
|
|
499
|
|
||||||
|
Other revenues:
|
||||||||||||
|
Insurance
|
420
|
|
449
|
|
211
|
|
||||||
|
Investment
|
73
|
|
86
|
|
52
|
|
||||||
|
Net loss on repurchases and repayments of debt
|
(29
|
)
|
(17
|
)
|
—
|
|
||||||
|
Net gain on sale of SpringCastle interests
|
—
|
|
167
|
|
—
|
|
||||||
|
Net gain on sales of personal and real estate loans and related trust assets
|
—
|
|
18
|
|
—
|
|
||||||
|
Other
|
96
|
|
70
|
|
(1
|
)
|
||||||
|
Total other revenues
|
560
|
|
773
|
|
262
|
|
||||||
|
Other expenses:
|
||||||||||||
|
Operating expenses:
|
||||||||||||
|
Salaries and benefits
|
757
|
|
788
|
|
485
|
|
||||||
|
Acquisition-related transaction and integration expenses
|
69
|
|
108
|
|
62
|
|
||||||
|
Other operating expenses
|
544
|
|
676
|
|
344
|
|
||||||
|
Insurance policy benefits and claims
|
184
|
|
167
|
|
96
|
|
||||||
|
Total other expenses
|
1,554
|
|
1,739
|
|
987
|
|
||||||
|
Income (loss) before income tax expense (benefit)
|
431
|
|
356
|
|
(226
|
)
|
||||||
|
Income tax expense (benefit)
|
248
|
|
113
|
|
(133
|
)
|
||||||
|
Net income (loss)
|
183
|
|
243
|
|
(93
|
)
|
||||||
|
Net income attributable to non-controlling interests
|
—
|
|
28
|
|
127
|
|
||||||
|
Net income (loss) attributable to OneMain Holdings, Inc.
|
$
|
183
|
|
$
|
215
|
|
$
|
(220
|
)
|
|||
|
Share Data:
|
||||||||||||
|
Weighted average number of shares outstanding:
|
||||||||||||
|
Basic
|
135,249,314
|
|
134,718,588
|
|
127,910,680
|
|
||||||
|
Diluted
|
135,678,991
|
|
135,135,860
|
|
127,910,680
|
|
||||||
|
Earnings (loss) per share:
|
||||||||||||
|
Basic
|
$
|
1.35
|
|
$
|
1.60
|
|
$
|
(1.72
|
)
|
|||
|
Diluted
|
$
|
1.35
|
|
$
|
1.59
|
|
$
|
(1.72
|
)
|
|||
See Notes to Consolidated Financial Statements.
74
ONEMAIN HOLDINGS, INC. AND SUBSIDIARIES
Consolidated Statements of Comprehensive Income (Loss)
|
(dollars in millions)
|
||||||||||||
|
Years Ended December 31,
|
2017
|
2016
|
2015
|
|||||||||
|
Net income (loss)
|
$
|
183
|
|
$
|
243
|
|
$
|
(93
|
)
|
|||
|
Other comprehensive income (loss):
|
||||||||||||
|
Net change in unrealized gains (losses) on non-credit impaired available-for-sale securities
|
21
|
|
36
|
|
(28
|
)
|
||||||
|
Retirement plan liabilities adjustments
|
12
|
|
22
|
|
(9
|
)
|
||||||
|
Foreign currency translation adjustments
|
6
|
|
4
|
|
(6
|
)
|
||||||
|
Income tax effect:
|
||||||||||||
|
Net unrealized (gains) losses on non-credit impaired available-for-sale securities
|
(7
|
)
|
(13
|
)
|
10
|
|
||||||
|
Retirement plan liabilities adjustments
|
(3
|
)
|
(7
|
)
|
3
|
|
||||||
|
Foreign currency translation adjustments
|
(2
|
)
|
(1
|
)
|
2
|
|
||||||
|
Other comprehensive income (loss), net of tax, before reclassification adjustments
|
27
|
|
41
|
|
(28
|
)
|
||||||
|
Reclassification adjustments included in net income (loss):
|
||||||||||||
|
Net realized gains on available-for-sale securities
|
(14
|
)
|
(15
|
)
|
(12
|
)
|
||||||
|
Net realized gains on retirement plan liabilities
|
(2
|
)
|
—
|
|
—
|
|
||||||
|
Net realized gain on foreign currency translation adjustments
|
—
|
|
(4
|
)
|
—
|
|
||||||
|
Income tax effect:
|
||||||||||||
|
Net realized gains on available-for-sale securities
|
5
|
|
5
|
|
4
|
|
||||||
|
Net realized gains on retirement plan liabilities
|
1
|
|
—
|
|
—
|
|
||||||
|
Reclassification adjustments included in net income (loss), net of tax
|
(10
|
)
|
(14
|
)
|
(8
|
)
|
||||||
|
Other comprehensive income (loss), net of tax
|
17
|
|
27
|
|
(36
|
)
|
||||||
|
Comprehensive income (loss)
|
200
|
|
270
|
|
(129
|
)
|
||||||
|
Comprehensive income attributable to non-controlling interests
|
—
|
|
28
|
|
127
|
|
||||||
|
Comprehensive income (loss) attributable to OneMain Holdings, Inc.
|
$
|
200
|
|
$
|
242
|
|
$
|
(256
|
)
|
|||
See Notes to Consolidated Financial Statements.
75
ONEMAIN HOLDINGS, INC. AND SUBSIDIARIES
Consolidated Statements of Shareholders’ Equity
|
OneMain Holdings, Inc. Shareholders’ Equity
|
||||||||||||||||||||||||||||
|
(dollars in millions)
|
Common Stock
|
Additional Paid-in Capital
|
Accumulated Other Comprehensive Income (Loss)
|
Retained Earnings
|
OneMain Holdings, Inc. Shareholders’ Equity
|
Non-controlling Interests
|
Total Shareholders’ Equity
|
|||||||||||||||||||||
|
Balance, January 1, 2017
|
$
|
1
|
|
$
|
1,548
|
|
$
|
(6
|
)
|
$
|
1,523
|
|
$
|
3,066
|
|
$
|
—
|
|
$
|
3,066
|
|
|||||||
|
Share-based compensation expense, net of forfeitures
|
—
|
|
17
|
|
—
|
|
—
|
|
17
|
|
—
|
|
17
|
|
||||||||||||||
|
Withholding tax on share-based compensation
|
—
|
|
(5
|
)
|
—
|
|
—
|
|
(5
|
)
|
—
|
|
(5
|
)
|
||||||||||||||
|
Other comprehensive income
|
—
|
|
—
|
|
17
|
|
—
|
|
17
|
|
—
|
|
17
|
|
||||||||||||||
|
Net income
|
—
|
|
—
|
|
—
|
|
183
|
|
183
|
|
—
|
|
183
|
|
||||||||||||||
|
Balance, December 31, 2017
|
$
|
1
|
|
$
|
1,560
|
|
$
|
11
|
|
$
|
1,706
|
|
$
|
3,278
|
|
$
|
—
|
|
$
|
3,278
|
|
|||||||
|
Balance, January 1, 2016
|
$
|
1
|
|
$
|
1,533
|
|
$
|
(33
|
)
|
$
|
1,308
|
|
$
|
2,809
|
|
$
|
(79
|
)
|
$
|
2,730
|
|
|||||||
|
Share-based compensation expense, net of forfeitures
|
—
|
|
22
|
|
—
|
|
—
|
|
22
|
|
—
|
|
22
|
|
||||||||||||||
|
Withholding tax on share-based compensation
|
—
|
|
(7
|
)
|
—
|
|
—
|
|
(7
|
)
|
—
|
|
(7
|
)
|
||||||||||||||
|
Change in non-controlling interests:
|
|
|
|
|
||||||||||||||||||||||||
|
Distributions declared to joint venture partners
|
—
|
|
—
|
|
—
|
|
—
|
|
—
|
|
(18
|
)
|
(18
|
)
|
||||||||||||||
|
Sale of equity interests in SpringCastle joint venture
|
—
|
|
—
|
|
—
|
|
—
|
|
—
|
|
69
|
|
69
|
|
||||||||||||||
|
Other comprehensive income
|
—
|
|
—
|
|
27
|
|
—
|
|
27
|
|
—
|
|
27
|
|
||||||||||||||
|
Net income
|
—
|
|
—
|
|
—
|
|
215
|
|
215
|
|
28
|
|
243
|
|
||||||||||||||
|
Balance, December 31, 2016
|
$
|
1
|
|
$
|
1,548
|
|
$
|
(6
|
)
|
$
|
1,523
|
|
$
|
3,066
|
|
$
|
—
|
|
$
|
3,066
|
|
|||||||
|
Balance, January 1, 2015
|
$
|
1
|
|
$
|
529
|
|
$
|
3
|
|
$
|
1,528
|
|
$
|
2,061
|
|
$
|
(129
|
)
|
$
|
1,932
|
|
|||||||
|
Sale of common stock, net of offering costs
|
—
|
|
976
|
|
—
|
|
—
|
|
976
|
|
—
|
|
976
|
|
||||||||||||||
|
Non-cash incentive compensation from Initial Stockholder
|
—
|
|
15
|
|
—
|
|
—
|
|
15
|
|
—
|
|
15
|
|
||||||||||||||
|
Share-based compensation expense, net of forfeitures
|
—
|
|
15
|
|
—
|
|
—
|
|
15
|
|
—
|
|
15
|
|
||||||||||||||
|
Excess tax benefit from share-based compensation
|
—
|
|
3
|
|
—
|
|
—
|
|
3
|
|
—
|
|
3
|
|
||||||||||||||
|
Withholding tax on vested RSUs
|
—
|
|
(5
|
)
|
—
|
|
—
|
|
(5
|
)
|
—
|
|
(5
|
)
|
||||||||||||||
|
Change in non-controlling interests:
|
|
|
|
|
|
|
|
|
|
|
|
|
|
|
||||||||||||||
|
Distributions declared to joint venture partners
|
—
|
|
—
|
|
—
|
|
—
|
|
—
|
|
(77
|
)
|
(77
|
)
|
||||||||||||||
|
Other comprehensive loss
|
—
|
|
—
|
|
(36
|
)
|
—
|
|
(36
|
)
|
—
|
|
(36
|
)
|
||||||||||||||
|
Net income (loss)
|
—
|
|
—
|
|
—
|
|
(220
|
)
|
(220
|
)
|
127
|
|
(93
|
)
|
||||||||||||||
|
Balance, December 31, 2015
|
$
|
1
|
|
$
|
1,533
|
|
$
|
(33
|
)
|
$
|
1,308
|
|
$
|
2,809
|
|
$
|
(79
|
)
|
$
|
2,730
|
|
|||||||
See Notes to Consolidated Financial Statements.
76
ONEMAIN HOLDINGS, INC. AND SUBSIDIARIES
|
(dollars in millions)
|
||||||||||||
|
Years Ended December 31,
|
2017
|
2016
|
2015
|
|||||||||
|
Cash flows from operating activities
|
||||||||||||
|
Net income (loss)
|
$
|
183
|
|
$
|
243
|
|
$
|
(93
|
)
|
|||
|
Reconciling adjustments:
|
||||||||||||
|
Provision for finance receivable losses
|
955
|
|
932
|
|
716
|
|
||||||
|
Depreciation and amortization
|
328
|
|
521
|
|
198
|
|
||||||
|
Deferred income tax charge (benefit)
|
30
|
|
(97
|
)
|
(209
|
)
|
||||||
|
Non-cash incentive compensation from Initial Stockholder
|
—
|
|
—
|
|
15
|
|
||||||
|
Net gain on liquidation of United Kingdom subsidiary
|
—
|
|
(4
|
)
|
—
|
|
||||||
|
Net gain on sales of personal and real estate loans and related trust assets
|
—
|
|
(18
|
)
|
—
|
|
||||||
|
Net loss on repurchases and repayments of debt
|
29
|
|
17
|
|
—
|
|
||||||
|
Share-based compensation expense, net of forfeitures
|
17
|
|
22
|
|
15
|
|
||||||
|
Net gain on sale of SpringCastle interests
|
—
|
|
(167
|
)
|
—
|
|
||||||
|
Other
|
(4
|
)
|
(8
|
)
|
(4
|
)
|
||||||
|
Cash flows due to changes in:
|
||||||||||||
|
Other assets and other liabilities
|
13
|
|
(10
|
)
|
(24
|
)
|
||||||
|
Insurance claims and policyholder liabilities
|
(22
|
)
|
(64
|
)
|
27
|
|
||||||
|
Taxes receivable and payable
|
63
|
|
(47
|
)
|
113
|
|
||||||
|
Accrued interest and finance charges
|
(37
|
)
|
—
|
|
(14
|
)
|
||||||
|
Other, net
|
—
|
|
2
|
|
1
|
|
||||||
|
Net cash provided by operating activities
|
1,555
|
|
1,322
|
|
741
|
|
||||||
|
Cash flows from investing activities
|
||||||||||||
|
Net principal originations of finance receivables held for investment and
held for sale |
(2,275
|
)
|
(1,203
|
)
|
(1,037
|
)
|
||||||
|
Proceeds on sales of finance receivables held for sale originated as held for investment
|
—
|
|
930
|
|
78
|
|
||||||
|
Purchase of OneMain Financial Holdings, LLC, net of cash and restricted cash acquired
|
—
|
|
—
|
|
(3,520
|
)
|
||||||
|
Proceeds from sale of SpringCastle interests, net of restricted cash released
|
—
|
|
26
|
|
—
|
|
||||||
|
Cash received from CitiFinancial Credit Company
|
—
|
|
23
|
|
—
|
|
||||||
|
Available-for-sale securities purchased
|
(671
|
)
|
(746
|
)
|
(525
|
)
|
||||||
|
Trading and other securities purchased
|
—
|
|
(17
|
)
|
(1,482
|
)
|
||||||
|
Available-for-sale securities called, sold, and matured
|
739
|
|
837
|
|
525
|
|
||||||
|
Trading and other securities called, sold, and matured
|
18
|
|
63
|
|
3,797
|
|
||||||
|
Proceeds from sale of real estate owned
|
4
|
|
8
|
|
14
|
|
||||||
|
Other, net
|
(7
|
)
|
(27
|
)
|
(36
|
)
|
||||||
|
Net cash used for investing activities
|
(2,192
|
)
|
(106
|
)
|
(2,186
|
)
|
||||||
|
Cash flows from financing activities
|
||||||||||||
|
Proceeds from issuance of long-term debt, net of commissions
|
5,427
|
|
6,660
|
|
3,027
|
|
||||||
|
Proceeds from issuance of common stock, net of offering costs
|
—
|
|
—
|
|
976
|
|
||||||
|
Repayments of long-term debt
|
(4,447
|
)
|
(8,320
|
)
|
(1,960
|
)
|
||||||
|
Distributions to joint venture partners
|
—
|
|
(18
|
)
|
(77
|
)
|
||||||
|
Excess tax benefit from share-based compensation
|
—
|
|
—
|
|
3
|
|
||||||
|
Withholding tax on vested RSUs and PRSUs
|
(5
|
)
|
(7
|
)
|
(5
|
)
|
||||||
|
Net cash provided by (used for) financing activities
|
975
|
|
(1,685
|
)
|
1,964
|
|
||||||
77
Consolidated Statements of Cash Flows (Continued)
|
(dollars in millions)
|
||||||||||||
|
Years Ended December 31,
|
2017
|
2016
|
2015
|
|||||||||
|
Effect of exchange rate changes on cash and cash equivalents
|
—
|
|
1
|
|
(1
|
)
|
||||||
|
Net change in cash and cash equivalents and restricted cash and restricted cash equivalents
|
338
|
|
(468
|
)
|
518
|
|
||||||
|
Cash and cash equivalents and restricted cash and restricted cash equivalents at beginning of period
|
1,147
|
|
1,615
|
|
1,097
|
|
||||||
|
Cash and cash equivalents and restricted cash and restricted cash equivalents at end of period
|
$
|
1,485
|
|
$
|
1,147
|
|
$
|
1,615
|
|
|||
|
Supplemental cash flow information
|
||||||||||||
|
Cash and cash equivalents
|
$
|
987
|
|
$
|
579
|
|
$
|
939
|
|
|||
|
Restricted cash and restricted cash equivalents
|
498
|
|
568
|
|
676
|
|
||||||
|
Total cash and cash equivalents and restricted cash and restricted cash equivalents
|
$
|
1,485
|
|
$
|
1,147
|
|
$
|
1,615
|
|
|||
|
Interest paid
|
(746
|
)
|
$
|
(765
|
)
|
$
|
(594
|
)
|
||||
|
Income taxes received (paid)
|
(156
|
)
|
(249
|
)
|
38
|
|
||||||
|
Supplemental non-cash activities
|
||||||||||||
|
Transfer of finance receivables held for investment to finance receivables held for sale (prior to deducting allowance for finance receivable losses)
|
$
|
—
|
|
$
|
1,945
|
|
$
|
617
|
|
|||
|
Transfer of finance receivables to real estate owned
|
9
|
|
8
|
|
11
|
|
||||||
|
Net unsettled investment security purchases
|
1
|
|
1
|
|
—
|
|
||||||
Restricted cash and restricted cash equivalents primarily represent funds required to be used for future debt payments relating to our securitization transactions and escrow deposits.
See Notes to Consolidated Financial Statements.
78
ONEMAIN HOLDINGS, INC. AND SUBSIDIARIES
Notes to Consolidated Financial Statements
December 31, 2017
1
.
Nature of Operations
OneMain Holdings, Inc. is referred to in this report as “OMH” or, collectively with its subsidiaries, whether directly or indirectly owned, the “Company,” “we,” “us,” or “our.” OMH is a Delaware corporation.
OMH is a financial services holding company whose principal subsidiaries are SFI and Independence. SFI’s principal subsidiary is SFC, and Independence’s principal subsidiary is OMFH. SFC and OMFH are financial services holding companies with subsidiaries engaged in the consumer finance and insurance businesses.
At
December 31, 2017
, the Initial Stockholder owned approximately
44%
of OMH’s common stock. The Initial Stockholder is owned primarily by a private equity fund managed by an affiliate of Fortress. On December 27, 2017, SoftBank acquired Fortress and Fortress now operates within SoftBank as an independent business headquartered in New York.
See Note 24 regarding a definitive agreement entered into on January 3, 2018, among OMH, an investor group led by funds managed by affiliates of Apollo Global Management, LLC (together with its consolidated subsidiaries, “Apollo”) and Värde Partners, Inc. (“Värde” and together with Apollo, collectively, the “Apollo-Värde Group”) and the Initial Stockholder.
2
.
Significant Transactions
ONEMAIN ACQUISITION
On November 15, 2015, OMH completed its acquisition of OneMain from Citigroup for approximately
$4.5 billion
in cash (the OneMain Acquisition). OneMain is a leading consumer finance company in the United States, providing personal loans to primarily middle income households through a national, community based network. The results of OneMain are included in our consolidated results from November 1, 2015, pursuant to our contractual agreements with Citigroup.
We allocated the purchase price to the net tangible and intangible assets acquired and liabilities assumed, based on their respective estimated fair values as of October 31, 2015. Given the timing of this transaction and complexity of the purchase accounting, our estimate of the fair value adjustment specific to the acquired loans and intangible assets was preliminary, and our determination of the final tax positions with Citigroup was also preliminary. During 2016, we finalized the accounting for these matters as shown in the table below.
The excess of the purchase price over the fair values, which we recorded as goodwill, was determined as follows:
|
(dollars in millions)
|
As
Reported |
Adjustments *
|
As
Adjusted |
|||||||||
|
Cash consideration
|
$
|
4,478
|
|
$
|
(23
|
)
|
(a)
|
$
|
4,455
|
|
||
|
Fair value of assets acquired:
|
||||||||||||
|
Cash and cash equivalents
|
958
|
|
—
|
|
958
|
|
||||||
|
Investment securities
|
1,294
|
|
—
|
|
1,294
|
|
||||||
|
Personal loans
|
8,801
|
|
(6
|
)
|
(b)
|
8,795
|
|
|||||
|
Intangibles
|
555
|
|
3
|
|
(c)
|
558
|
|
|||||
|
Other assets
|
247
|
|
(3
|
)
|
(d)
|
244
|
|
|||||
|
Fair value of liabilities assumed:
|
||||||||||||
|
Long-term debt
|
(7,725
|
)
|
—
|
|
(7,725
|
)
|
||||||
|
Unearned premium, insurance policy and claims reserves
|
(936
|
)
|
—
|
|
(936
|
)
|
||||||
|
Other liabilities
|
(156
|
)
|
1
|
|
(e)
|
(155
|
)
|
|||||
|
Goodwill
|
$
|
1,440
|
|
$
|
1,422
|
|
||||||
79
|
*
|
During 2016, we recorded the following adjustments to the assets acquired and liabilities assumed with the corresponding offset to goodwill as new information, which existed as of the acquisition date, became available:
|
|
(a)
|
Represents a subsequent cash payment from Citigroup as a result of reaching final agreement on certain purchase accounting adjustments.
|
|
(b)
|
Represents the net impact of an increase to the discount of purchased credit impaired finance receivables of
$64 million
and an increase to the premium on finance receivables purchased as performing receivables of
$58 million
as a result of revisions to the receivables valuation during the measurement period.
|
|
(c)
|
Represents an increase in acquired intangibles related to customer loan applications in process at the acquisition date.
|
|
(d)
|
Represents a decrease in valuation of acquired software asset.
|
|
(e)
|
Represents the settlement of a payable to Citigroup during the measurement period.
|
Of the adjusted
$8.8 billion
of acquired personal loans included in the table above,
$8.1 billion
relates to finance receivables determined not to be credit impaired at acquisition. Contractually required principal and interest of these non-credit impaired personal loans was
$11.6 billion
at the date of acquisition, of which
$2.2 billion
is not expected to be collected, primarily due to forgone interest as a result of prepayments and defaults.
The goodwill recognized from the OneMain Acquisition is reported in our Consumer and Insurance segment. We did not record any impairments to goodwill during
2017
and
2016
. See Note 9 for the reconciliations of the carrying amounts of goodwill at the beginning and end of
2017
and
2016
.
As of
December 31, 2017
, we had incurred approximately
$239 million
of acquisition-related transaction and integration expenses (
$69 million
incurred during
2017
) in connection with the OneMain Acquisition and the Lendmark Sale, which we report as a component of operating expenses. These expenses primarily include transaction costs, technology termination and certain compensation and benefit related costs.
In connection with the closing of the OneMain Acquisition, on November 13, 2015, OMH and certain of its subsidiaries entered into an Asset Preservation Stipulation and Order and agreed to a Proposed Final Judgment (collectively, the “Settlement Agreement”) with the U.S. Department of Justice (the “DOJ”), as well as the state attorneys general for Colorado, Idaho, Pennsylvania, Texas, Virginia, Washington and West Virginia. The Settlement Agreement resolved the inquiries of the DOJ and such attorneys general with respect to the OneMain Acquisition and allowed OMH to proceed with the closing. Pursuant to the Settlement Agreement, OMH agreed to divest
127
branches of SFC subsidiaries across
11
states as a condition for approval of the OneMain Acquisition. The Settlement Agreement required certain of OMH’s subsidiaries (the “Branch Sellers”) to operate these
127
branches as an ongoing, economically viable and competitive business until sold to the divestiture purchaser. The court overseeing the settlement appointed a third-party monitor to oversee management of the divestiture branches and ensure the Company’s compliance with the terms of the Settlement Agreement. The sale contemplated under the terms of the Settlement Agreement was consummated through the Lendmark Sale described below.
LENDMARK SALE
On November 12, 2015, OMH and the Branch Sellers entered into a purchase and sale agreement with Lendmark Financial Services, LLC (“Lendmark”) to sell
127
Springleaf branches and, subject to certain exclusions, the associated personal loans issued to customers of such branches, fixed non-information technology assets and certain other tangible personal property located in such branches to Lendmark (the “Lendmark Sale”) for a purchase price equal to the sum of (i) the aggregate unpaid balance as of closing of the purchased loans multiplied by
103%
, plus (ii) for each interest-bearing purchased loan, an amount equal to all unpaid interest that had accrued on the unpaid balance at the applicable note rate from the most recent interest payment date through the closing, plus (iii) the sum of all prepaid charges and fees and security deposits of the Branch Sellers to the extent arising under the purchased contracts as reflected on the books and records of the Branch Sellers as of closing, subject to certain limitations if the purchase price would exceed
$695 million
and Lendmark would be unable to obtain financing on certain specified terms. In anticipation of the sale of these branches, SFC transferred
$608 million
of personal loans from held for investment to held for sale on September 30, 2015.
Pursuant to the Settlement Agreement, we were required to dispose of the branches to be sold in connection with the Lendmark Sale within
120 days
following November 13, 2015, subject to such extensions as the DOJ may approve. As we did not believe
80
we would be able to consummate the Lendmark Sale prior to April 1, 2016, we requested
two
extensions of the closing deadline set forth in the Settlement Agreement. The DOJ granted our requests through May 13, 2016.
On May 2, 2016, we completed the Lendmark Sale for an aggregate cash purchase price of
$624 million
. Such sale was effective as of April 30, 2016, and included the sale to Lendmark of personal loans with an unpaid principal balance (“UPB”) as of March 31, 2016 of
$600 million
. We entered into a transition services agreement with Lendmark dated as of May 2, 2016 (the “Transition Services Agreement”), and our activities remained subject to the oversight of the Monitoring Trustee appointed by the court pursuant to the Settlement Agreement until the expiration of the Transition Services Agreement. The Transition Services Agreement expired on May 1, 2017.
SPRINGCASTLE INTERESTS SALE
On March 31, 2016, SFI, SpringCastle Holdings, LLC (“SpringCastle Holdings”) and Springleaf Acquisition Corporation (“Springleaf Acquisition” and, together with SpringCastle Holdings, the “SpringCastle Sellers”), wholly owned subsidiaries of OMH, entered into a purchase agreement with certain subsidiaries of New Residential Investment Corp. (“NRZ” and such subsidiaries, the “NRZ Buyers”) and BTO Willow Holdings II, L.P. and Blackstone Family Tactical Opportunities Investment Partnership—NQ—ESC L.P. (collectively, the “Blackstone Buyers” and together with the NRZ Buyers, the “SpringCastle Buyers”). Pursuant to the purchase agreement, on March 31, 2016, SpringCastle Holdings sold its
47%
limited liability company interest in each of SpringCastle America, LLC, SpringCastle Credit, LLC and SpringCastle Finance, LLC, and Springleaf Acquisition sold its
47%
limited liability company interest in SpringCastle Acquisition LLC, to the SpringCastle Buyers for an aggregate purchase price of approximately
$112 million
(the “SpringCastle Interests Sale”). SpringCastle America, LLC, SpringCastle Credit, LLC, SpringCastle Finance, LLC and SpringCastle Acquisition LLC are collectively referred to herein as the “SpringCastle Joint Venture.”
In connection with the SpringCastle Interests Sale, the SpringCastle Buyers paid
$101 million
of the aggregate purchase price to the SpringCastle Sellers on March 31, 2016, with the remaining
$11 million
paid into an escrow account on July 29, 2016. Such escrowed funds are expected to be held in escrow for a period of up to
five years
following March 31, 2016, and, subject to the terms of the purchase agreement and assuming certain portfolio performance requirements are satisfied, paid to the SpringCastle Sellers at the end of such
five
-year period. In connection with the SpringCastle Interests Sale, we recorded a net gain in other revenues at the time of sale of $
167 million
.
As a result of this sale, SpringCastle Acquisition and SpringCastle Holdings no longer hold any ownership interests of the SpringCastle Joint Venture. However, unless we are terminated, we will remain as servicer of the SpringCastle Portfolio under the servicing agreement for the SpringCastle Funding Trust. In addition, we deconsolidated the underlying loans of the SpringCastle Portfolio and previously issued securitized interests, which were reported in long-term debt, as we no longer were considered the primary beneficiary.
Prior to the SpringCastle Interests Sale, affiliates of the NRZ Buyers owned a
30%
limited liability company interest in the SpringCastle Joint Venture, and affiliates of the Blackstone Buyers owned a
23%
limited liability company interest in the SpringCastle Joint Venture (together, the “Other Members”). The Other Members are parties to the purchase agreement for purposes of certain limited indemnification obligations and post-closing expense reimbursement obligations of the SpringCastle Joint Venture to the SpringCastle Sellers.
The NRZ Buyers are subsidiaries of NRZ, which is externally managed by an affiliate of Fortress. The Initial Stockholder, which owned approximately
58%
of OMH’s common stock as of March 31, 2016, the date of sale, was owned primarily by a private equity fund managed by an affiliate of Fortress. Wesley Edens, Chairman of the Board of Directors of OMH, also serves as Chairman of the Board of Directors of NRZ. Mr. Edens is also a principal of Fortress and serves as Co-Chairman of the Board of Directors of Fortress. Douglas Jacobs, a member of the Board of Directors of OMH, also serves as a member of NRZ’s Board of Directors and Fortress’ Board of Directors.
The purchase agreement included customary representations, warranties, covenants and indemnities. We did not record a sales recourse obligation related to the SpringCastle Interests Sale.
81
REAL ESTATE LOAN SALES
August 2016 Real Estate Loan Sale
On August 3, 2016, SFC and certain of its subsidiaries sold a portfolio of second lien mortgage loans for aggregate cash proceeds of
$246 million
(the “August 2016 Real Estate Loan Sale”). In connection with this sale, we recorded a net loss in other revenues at the time of sale of
$4 million
. Unless we are terminated or we resign as servicer, we will continue to service the loans included in this sale pursuant to a servicing agreement. The purchase and sale agreement and the servicing agreement include customary representations and warranties and indemnification provisions.
December 2016 Real Estate Loan Sale
On December 19, 2016, SFC and certain of its subsidiaries sold a portfolio of first and second lien mortgage loans for aggregate cash proceeds of $
58 million
(the “December 2016 Real Estate Loan Sale”). In connection with this sale, we recorded a net loss in other revenues at the time of sale of less than $
1 million
.
SFC’s MEDIUM-TERM NOTE ISSUANCES
8.25%
Senior Notes Due 2020
On April 11, 2016, SFC issued
$1.0 billion
aggregate principal amount of
8.25%
Senior Notes due 2020 (the “8.25% SFC Notes”) under an Indenture dated as of December 3, 2014 (the “SFC Base Indenture”), as supplemented by a First Supplemental Indenture, dated as of December 3, 2014 (the “SFC First Supplemental Indenture”) and a Second Supplemental Indenture, dated as of April 11, 2016 (the “SFC Second Supplemental Indenture”), pursuant to which OMH provided a guarantee of the notes on an unsecured basis.
6.125%
Senior Notes Due 2022
On May 15, 2017, SFC issued
$500 million
aggregate principal amount of
6.125%
Senior Notes due 2022 (the “2022 SFC Notes”) under the SFC Base Indenture, as supplemented by a Third Supplemental Indenture, dated as of May 15, 2017 (the “SFC Third Supplemental Indenture”), pursuant to which OMH provided a guarantee of the 2022 SFC Notes on an unsecured basis.
On May 30, 2017, SFC issued and sold
$500 million
aggregate principal amount of additional 2022 SFC Notes (the “Additional SFC Notes”) in an add-on offering. The initial 2022 SFC Notes and the Additional SFC Notes (collectively, the “
6.125%
SFC Notes”), are treated as a single class of debt securities and have the same terms, other than the issue date and the issue price.
5.625%
Senior Notes Due 2023
On December 8, 2017, SFC issued
$875 million
aggregate principal amount of
5.625%
Senior Notes due 2023 (the ‘‘
5.625%
SFC Notes’’) under the SFC Base Indenture, as supplemented by a Fourth Supplemental Indenture dated as of December 8, 2017 (the “SFC Fourth Supplemental Indenture” and, collectively with the SFC Base Indenture, the SFC First Supplemental Indenture, the SFC Second Supplemental Indenture, and the SFC Third Supplemental Indenture, the “Indenture”), pursuant to which OMH provided a guarantee of the
5.625%
SFC Notes on an unsecured basis.
See Note 12 for further information regarding our debt issuances.
INITIAL STOCKHOLDER SHARE SALES
On November 7, 2017, we entered into an Underwriting Agreement among the Company, the Initial Stockholder and Morgan Stanley & Co. LLC (the “Underwriter”), for the sale by the Initial Stockholder of
10,000,000
shares of the Company’s Common Stock, par value
$0.01
per share (the “Common Stock”), plus an option for the Underwriter to purchase up to an additional
1,500,000
shares of Common Stock within
30
days after the date of the Underwriting Agreement. The shares sold by the Initial Stockholder were beneficially owned by Fortress. The transaction closed on November 10, 2017 and the underwriter purchased
1,000,000
shares under its over-allotment option on December 7, 2017. The Company did
no
t receive any proceeds from the sale of the shares by the Initial Stockholder.
82
On December 13, 2017, we entered into an Underwriting Agreement, among the Company, the Initial Stockholder and the Underwriter, for the sale by the Initial Stockholder of
7,500,000
additional shares of the Company’s Common Stock, par value
$0.01
per share. The shares sold by the Initial Stockholder were beneficially owned by Fortress. The transaction closed on December 18, 2017. The Company did
no
t receive any proceeds from the sale of the shares by the Initial Stockholder. After closing of the transaction, the Initial Stockholder owned approximately
44%
of OMH’s common stock.
3
.
Summary of Significant Accounting Policies
BASIS OF PRESENTATION
We prepared our consolidated financial statements using GAAP . The statements include the accounts of OMH, its subsidiaries (all of which are wholly owned, except for certain indirect subsidiaries associated with a joint venture in which we owned a
47%
equity interest prior to March 31, 2016), and VIEs in which we hold a controlling financial interest and for which we are considered to be the primary beneficiary as of the financial statement date.
We eliminated all material intercompany accounts and transactions. We made judgments, estimates, and assumptions that affect amounts reported in our consolidated financial statements and disclosures of contingent assets and liabilities. In management’s opinion, the consolidated financial statements include the normal, recurring adjustments necessary for a fair statement of results. Ultimate results could differ from our estimates. We evaluated the effects of and the need to disclose events that occurred subsequent to the balance sheet date. To conform to the
2017
presentation, we reclassified certain items in prior periods of our consolidated financial statements. Also, to conform to the new alignment of our segments, as further discussed in Note 22, we have revised our prior period segment disclosures.
ACCOUNTING POLICIES
Operating Segments
Our segments coincide with how our businesses are managed. At
December 31, 2017
, our
two
segments include:
|
•
|
Consumer and Insurance; and
|
|
•
|
Acquisitions and Servicing.
|
In connection with the OneMain Acquisition, we include OneMain’s operations in our Consumer and Insurance segment.
The remaining components (which we refer to as “Other”) consist of our non-originating legacy operations, which include: (i) our liquidating real estate portfolio; (ii) our liquidating retail sales finance portfolio (including retail sales finance accounts from our legacy auto finance operation); (iii) our lending operations in Puerto Rico and the U.S. Virgin Islands; and (iv) the operations of the Springleaf United Kingdom subsidiary, prior to its liquidation on August 16, 2016.
Beginning in 2017, management no longer views or manages our real estate assets as a separate operating segment. Therefore, we are now including Real Estate, which was previously presented as a distinct reporting segment, in “Other.” To conform to this new alignment of our segments, we have revised our prior period segment disclosures.
Finance Receivables
Generally, we classify finance receivables as held for investment based on management’s intent at the time of origination. We determine classification on a loan-by-loan basis. We classify finance receivables as held for investment due to our ability and intent to hold them until their contractual maturities. We carry finance receivables at amortized cost which includes accrued finance charges, net unamortized deferred origination costs and unamortized points and fees, unamortized net premiums and discounts on purchased finance receivables, and unamortized finance charges on precomputed receivables.
We include the cash flows from finance receivables held for investment in the consolidated statements of cash flows as investing activities, except for collections of interest, which we include as cash flows from operating activities. We may finance certain insurance products offered to our customers as part of finance receivables. In such cases, the insurance premium is included as an operating cash inflow and the financing of the insurance premium is included as part of the finance receivable as an investing cash flow in the consolidated statements of cash flows.
83
Finance Receivable Revenue Recognition
We recognize finance charges as revenue on the accrual basis using the interest method, which we report in interest income. We amortize premiums or accrete discounts on finance receivables as an adjustment to finance charge income using the interest method and contractual cash flows. We defer the costs to originate certain finance receivables and the revenue from nonrefundable points and fees on loans and amortize them as an adjustment to finance charge income using the interest method.
We stop accruing finance charges when four contractual payments become past due for personal loans and retail sales contracts and when the
sixth
contractual payment becomes past due for revolving retail accounts. For finance receivables serviced externally, including real estate loans, we stop accruing finance charges when the
third
or
fourth
contractual payment becomes past due depending on the type of receivable and respective third party servicer. We reverse finance charge amounts previously accrued upon suspension of accrual of finance charges.
For certain finance receivables that had a carrying value that included a purchase premium or discount, we stop accreting the premium or discount at the time we stop accruing finance charges. We do not reverse accretion of premium or discount that was previously recognized.
We recognize the contractual interest portion of payments received on nonaccrual finance receivables as finance charges at the time of receipt. We resume the accrual of interest on a nonaccrual finance receivable when the past due status on the individual finance receivable improves to the point that the finance receivable no longer meets our policy for nonaccrual. At that time we also resume accretion of any unamortized premium or discount resulting from a previous purchase premium or discount.
We accrete the amount required to adjust the initial fair value of our finance receivables to their contractual amounts over the life of the related finance receivable for non-credit impaired finance receivables and over the life of a pool of finance receivables for purchased credit impaired finance receivables as described in our policy for purchase credit impaired finance receivables.
Purchased Credit Impaired Finance Receivables
As part of each of our acquisitions, we identify a population of finance receivables for which it is determined that it is probable that we will be unable to collect all contractually required payments. The population of accounts identified generally consists of those finance receivables that are (i)
60 days
or more past due at acquisition, (ii) which had been classified as TDR finance receivables as of the acquisition date, (iii) may have been previously modified, or (iv) had other indications of credit deterioration as of the acquisition date.
We accrete the excess of the cash flows expected to be collected on the purchased credit impaired finance receivables over the discounted cash flows (the “accretable yield”) into interest income at a level rate of return over the expected lives of the underlying pools of the purchased credit impaired finance receivables. The underlying pools are based on finance receivables with common risk characteristics. We have established policies and procedures to update on a quarterly basis the amount of cash flows we expect to collect, which incorporates assumptions regarding default rates, loss severities, the amounts and timing of prepayments and other factors that are reflective of then current market conditions. Probable decreases in expected finance receivable cash flows result in the recognition of impairment, which is recognized through the provision for finance receivable losses. Probable significant increases in expected cash flows to be collected would first reverse any previously recorded allowance for finance receivable losses; any remaining increases are recognized prospectively as adjustments to the respective pool’s yield.
Our purchased credit impaired finance receivables remain in our purchased credit impaired pools until liquidation or write-off. We do not reclassify modified purchased credit impaired finance receivables as TDR finance receivables.
We have additionally established policies and procedures related to maintaining the integrity of these pools. A finance receivable will not be removed from a pool unless we sell, foreclose, or otherwise receive assets in satisfaction of a particular finance receivable or a finance receivable is written-off. If a finance receivable is renewed and additional funds are lent and terms are adjusted to current market conditions, we consider this a new finance receivable and the previous finance receivable is removed from the pool. If the facts and circumstances indicate that a finance receivable should be removed from a pool, that finance receivable will be removed at its allocated carrying amount, and such removal will not affect the yield used to recognize accretable yield of the pool.
84
Troubled Debt Restructured Finance Receivables
We make modifications to our personal loans to assist borrowers who are experiencing financial difficulty, are in bankruptcy or are participating in a consumer credit counseling arrangement. We make modifications to our real estate loans to assist borrowers in avoiding foreclosure. When we modify a loan’s contractual terms for economic or other reasons related to the borrower’s financial difficulties and grant a concession that we would not otherwise consider, we classify that loan as a TDR finance receivable. We restructure finance receivables only if we believe the customer has the ability to pay under the restructured terms for the foreseeable future. We establish reserves on our TDR finance receivables by discounting the estimated cash flows associated with the respective receivables at the interest rate prior to the modification to the account and record any difference between the discounted cash flows and the carrying value as an allowance adjustment.
We may modify the terms of existing accounts in certain circumstances, such as certain bankruptcy or other catastrophic situations or for economic or other reasons related to a borrower’s financial difficulties that justify modification. When we modify an account, we primarily use a combination of the following to reduce the borrower’s monthly payment: reduce interest rate, extend the term, capitalize past due interest or forgive principal or interest. Additionally, as part of the modification, we may require trial payments. If the account is delinquent at the time of modification, the account is brought current for delinquency reporting. Account modifications that are deemed to be a TDR finance receivable are measured for impairment. Account modifications that are not classified as a TDR finance receivable are measured for impairment in accordance with our policy for allowance for finance receivable losses.
Finance charges for TDR finance receivables require the application of judgment. We recognize the contractual interest portion of payments received on nonaccrual finance receivables as finance charges at the time of receipt. TDR finance receivables that are placed on nonaccrual status remain on nonaccrual status until the past due status on the individual finance receivable improves to the point that the finance receivable no longer meets our policy for nonaccrual.
Allowance for Finance Receivable Losses
We establish the allowance for finance receivable losses through the provision for finance receivable losses. We evaluate our finance receivable portfolio by finance receivable type. Our finance receivable types (personal loans, real estate loans, and retail sales finance) consist of a large number of relatively small, homogeneous accounts. We evaluate our finance receivable types for impairment as pools. None of our accounts are large enough to warrant individual evaluation for impairment.
Management considers numerous internal and external factors in estimating probable incurred losses in our finance receivable portfolio, including the following:
|
•
|
prior finance receivable loss and delinquency experience;
|
|
•
|
the composition of our finance receivable portfolio; and
|
|
•
|
current economic conditions, including the levels of unemployment and personal bankruptcies.
|
We base the allowance for finance receivable losses primarily on historical loss experience using a roll rate-based model applied to our finance receivable portfolios. In our roll rate-based model, our finance receivable types are stratified by contractual delinquency stages (i.e., current, 1-29 days past due, 30-59 days past due, etc.) and projected forward in one-month increments using historical roll rates. In each month of the simulation, losses on our finance receivable types are captured, and the ending delinquency stratification serves as the beginning point of the next iteration. No new volume is assumed. This process is repeated until the number of iterations equals the loss emergence period (the interval of time between the event which causes a borrower to default on a finance receivable and our recording of the charge-off) for our finance receivable types. As delinquency is a primary input into our roll rate-based model, we inherently consider nonaccrual loans in our estimate of the allowance for finance receivable losses.
Management exercises its judgment, based on quantitative analyses, qualitative factors, such as recent delinquency and other credit trends, and experience in the consumer finance industry, when determining the amount of the allowance for finance receivable losses. We adjust the amounts determined by the roll rate-based model for management’s estimate of the effects of model imprecision, any changes to underwriting criteria, portfolio seasoning, and current economic conditions, including levels of unemployment and personal bankruptcies. We charge or credit this adjustment to expense through the provision for finance receivable losses.
We generally charge off to the allowance for finance receivable losses personal loans that are beyond
180 days
past due.
85
To avoid unnecessary real estate loan foreclosures, we may refer borrowers to counseling services, as well as consider a cure agreement, loan modification, voluntary sale (including a short sale), or deed in lieu of foreclosure. When
two
payments are past due on a collateral dependent real estate loan and it appears that foreclosure may be necessary, we inspect the property as part of assessing the costs, risks, and benefits associated with foreclosure. Generally, we start foreclosure proceedings on real estate loans when
four
monthly installments are past due. When foreclosure is completed and we have obtained title to the property, we obtain a third-party’s valuation of the property, which is either a full appraisal or a real estate broker’s or appraiser’s estimate of the property sale value without the benefit of a full interior and exterior appraisal and lacking sales comparisons. Such appraisals or real estate brokers’ or appraisers’ estimate of value are one factor considered in establishing an appropriate valuation; however, we are ultimately responsible for the valuation established. We reduce finance receivables by the amount of the real estate loan, establish a real estate owned asset, and charge off any loan amount in excess of that value to the allowance for finance receivable losses.
We infrequently extend the charge-off period for individual personal and real estate loan accounts when, in our opinion, such treatment is warranted and consistent with our credit risk policies.
We may renew a delinquent account if the customer meets current underwriting criteria and it does not appear that the cause of past delinquency will affect the customer’s ability to repay the new loan. We subject all renewals to the same credit risk underwriting process as we would a new application for credit.
For our personal loans and retail sales finance receivables, we may offer those customers whose accounts are in good standing the opportunity of a deferment, which extends the term of an account. We may extend this offer to customers when they are experiencing higher than normal personal expenses. Generally, this offer is not extended to customers who are delinquent. However, we may offer a deferment to a delinquent customer who is experiencing a temporary financial problem. The account is considered current upon granting the deferment. To evaluate whether a borrower’s financial difficulties are temporary or other than temporary we review the terms of each deferment to ensure that the borrower has the financial ability to repay the outstanding principal and associated interest in full following the deferment and after the customer is brought current. If, following this analysis, we believe a borrower’s financial difficulties are other than temporary, we will not grant deferment, and the loans may continue to age until they are charged off. We generally limit a customer to
two
deferments in a rolling
twelve
month period unless we determine that an exception is warranted and is consistent with our credit risk policies.
For our real estate loans, we may offer a deferment to a delinquent customer who is experiencing a temporary financial problem, which extends the term of an account. Prior to granting the deferment, we may require a partial payment. We forebear the remaining past due interest when the deferment is granted for real estate loans that were originated or acquired centrally. The account is considered current upon granting the deferment. We generally limit a customer to
two
deferments in a rolling
twelve
month period for real estate loans that were originated at our branch offices (
one
deferment for real estate loans that were originated or acquired centrally) unless we determine that an exception is warranted and is consistent with our credit risk policies.
Accounts that are granted a deferment are not classified as troubled debt restructurings. We do not consider deferments granted as a troubled debt restructuring because the customer is not experiencing an other than temporary financial difficulty, and we are not granting a concession to the customer or the concession granted is immaterial to the contractual cash flows. We pool accounts that have been granted a deferment together with accounts that have not been granted a deferment for measuring impairment in accordance with the authoritative guidance for the accounting for contingencies.
The allowance for finance receivable losses related to our purchased credit impaired finance receivables is calculated using updated cash flows expected to be collected, incorporating assumptions regarding default rates, loss severities, the amounts and timing of prepayments and other factors that are reflective of current market conditions. Probable decreases in expected finance receivable cash flows result in the recognition of impairment. Probable and significant increases in expected cash flows to be collected would first reverse any previously recorded allowance for finance receivable losses.
We also establish reserves for TDR finance receivables, which are included in our allowance for finance receivable losses. The allowance for finance receivable losses related to our TDR finance receivables represents loan-specific reserves based on an analysis of the present value of expected future cash flows. We establish our allowance for finance receivable losses related to our TDR finance receivables by calculating the present value (discounted at the loan’s effective interest rate prior to modification) of all expected cash flows less the recorded investment in the aggregated pool. We use certain assumptions to estimate the expected cash flows from our TDR finance receivables. The primary assumptions for our model are prepayment speeds, default rates, and severity rates.
86
Finance Receivables Held for Sale
Depending on market conditions or certain of management’s capital sourcing strategies, which may impact our ability and/or intent to hold our finance receivables until maturity or for the foreseeable future, we may decide to sell finance receivables originally intended for investment. Our ability to hold finance receivables for the foreseeable future is subject to a number of factors, including economic and liquidity conditions, and therefore may change. As of each reporting period, management determines our ability to hold finance receivables for the foreseeable future based on assumptions for liquidity requirements or other strategic goals. When it is probable that management’s intent or ability is to no longer hold finance receivables for the foreseeable future and we subsequently decide to sell specifically identified finance receivables that were originally classified as held for investment, the net finance receivables, less allowance for finance receivable losses, are reclassified as finance receivables held for sale and are carried at the lower of cost or fair value. Any amount by which cost exceeds fair value is accounted for as a valuation allowance and is recognized in other revenues in the consolidated statements of operations. We base the fair value estimates on negotiations with prospective purchasers (if any) or by using a discounted cash flows approach. We base cash flows on contractual payment terms adjusted for estimates of prepayments and credit related losses. Cash flows resulting from the sale of the finance receivables that were originally classified as held for investment are recorded as an investing activity in the consolidated statements of cash flows. When sold, we record the sales price we receive less our carrying value of these finance receivables held for sale in other revenues.
When it is determined that management no longer intends to sell finance receivables which had previously been classified as finance receivables held for sale and we have the ability to hold the finance receivables for the foreseeable future, we reclassify the finance receivables to finance receivables held for investment at the lower of cost or fair value and we accrete any fair value adjustment over the remaining life of the related finance receivables.
Reserve for Sales Recourse Obligations
When we sell finance receivables, we may establish a reserve for sales recourse in other liabilities, which represents our estimate of losses to be: (a) incurred by us on the repurchase of certain finance receivables that we previously sold; and (b) incurred by us for the indemnification of losses incurred by purchasers. Certain sale contracts include provisions requiring us to repurchase a finance receivable or indemnify the purchaser for losses it sustains with respect to a finance receivable if a borrower fails to make initial loan payments to the purchaser or if the accompanying mortgage loan breaches certain customary representations and warranties. These representations and warranties are made to the purchaser with respect to various characteristics of the finance receivable, such as the manner of origination, the nature and extent of underwriting standards applied, the types of documentation being provided, and, in limited instances, reaching certain defined delinquency limits. Although the representations and warranties are typically in place for the life of the finance receivable, we believe that most repurchase requests occur within the first
five years
of the sale of a finance receivable. In addition, an investor may request that we refund a portion of the premium paid on the sale of mortgage loans if a loan is prepaid within a certain amount of time from the date of sale. At the time of the sale of each finance receivable (exclusive of finance receivables included in our on-balance sheet securitizations), we record a provision for recourse obligations for estimated repurchases, loss indemnification and premium recapture on finance receivables sold, which is charged to other revenues. Any subsequent adjustments resulting from changes in estimated recourse exposure are recorded in other revenues.
Goodwill
Goodwill represents the amount of purchase price over the fair value of net assets we acquired in connection with the OneMain Acquisition. We test goodwill for potential impairment annually as of October 1 of each year and between annual tests if an event occurs or circumstances change that would more likely than not reduce the fair value of our reporting unit below its carrying amount.
We first complete a qualitative assessment to determine whether it is necessary to perform a quantitative impairment test. If the qualitative assessment indicates that it is more likely than not that the reporting unit’s fair value is less than its carrying amount, we proceed with the two-step impairment test. When necessary, the fair value of the reporting unit is calculated using the income approach based upon prospective financial information of the reporting unit discounted at a rate we estimate a market participant would use.
87
Intangible Assets other than Goodwill
At the time we initially recognize intangible assets, a determination is made with regard to each asset as it relates to its useful life. We have determined that each of our intangible assets has a finite useful life with the exception of the OneMain trade name, insurance licenses, lending licenses and certain domain names, which we have determined to have indefinite lives.
For intangible assets with a finite useful life, we review for impairment at least annually and whenever events or changes in circumstances indicate that their carrying amounts may not be recoverable. Impairment is indicated if the sum of undiscounted estimated future cash flows is less than the carrying value of the respective asset. Impairment is permanently recognized by writing down the asset to the extent that the carrying value exceeds the estimated fair value. The VOBA is the PVFP of purchased insurance contracts. The PVFP is dynamically amortized over the lifetime of the block of business and is subject to premium deficiency testing in accordance with Accounting Standards Codification (“ASC”) Topic 944,
Financial Services
—
Insurance
.
For indefinite lived intangible assets, we first complete an annual qualitative assessment to determine whether it is necessary to perform a quantitative impairment test. If the qualitative assessment indicates that the assets are more likely than not to have been impaired, we proceed with the fair value calculation of the assets. The fair value is determined in accordance with our fair value measurement policy. If the fair value is less than the carrying value, an impairment loss will be recognized in an amount equal to the difference and the indefinite life classification will be evaluated to determine whether such classification remains appropriate.
Insurance Premiums
We recognize revenue for short-duration contracts over the related contract period. Short-duration contracts primarily include credit life, credit disability, credit involuntary unemployment insurance, and collateral protection policies. We defer single premium credit insurance premiums from affiliates in unearned premium reserves which we include as a reduction to net finance receivables. We recognize unearned premiums on credit life, credit disability, credit involuntary unemployment insurance and collateral protection insurance as revenue using the sum-of-the-digits, straight-line or other appropriate methods over the terms of the policies. Premiums from reinsurance assumed are earned over the related contract period.
We recognize revenue on long-duration contracts when due from policyholders. Long-duration contracts include term life, accidental death and dismemberment, and disability income protection. For single premium long-duration contracts a liability is accrued, that represents the present value of estimated future policy benefits to be paid to or on behalf of policyholders and related expenses, when premium revenue is recognized. The effects of changes in such estimated future policy benefit reserves are classified in insurance policy benefits and claims in the consolidated statements of operations.
We recognize commissions on ancillary products as other revenue when earned.
We may finance certain insurance products offered to our customers as part of finance receivables. In such cases, unearned premiums and certain unpaid claim liabilities related to our borrowers are netted and classified as contra-assets in the net finance receivables in the consolidated balance sheets, and the insurance premium is included as an operating cash inflow and the financing of the insurance premium is included as part of the finance receivable as an investing cash flow in the consolidated statements of cash flows.
Policy and Claim Reserves
Policy reserves for credit life, credit disability, credit involuntary unemployment, and collateral protection insurance equal related unearned premiums. Reserves for losses and loss adjustment expenses are based on claims experience, actual claims reported, and estimates of claims incurred but not reported. Assumptions utilized in determining appropriate reserves are based on historical experience, adjusted to provide for possible adverse deviation. These estimates are periodically reviewed and compared with actual experience and industry standards, and revised if it is determined that future experience will differ substantially from that previously assumed. Since reserves are based on estimates, the ultimate liability may be more or less than such reserves. The effects of changes in such estimated reserves are classified in insurance policy benefits and claims in the consolidated statements of operations in the period in which the estimates are changed.
We accrue liabilities for future life insurance policy benefits associated with non-credit life contracts and base the amounts on assumptions as to investment yields, mortality, and surrenders. We base annuity reserves on assumptions as to investment yields
88
and mortality. Ceded insurance reserves are included in other assets and include estimates of the amounts expected to be recovered from reinsurers on insurance claims and policyholder liabilities.
Insurance Policy Acquisition Costs
We defer insurance policy acquisition costs (primarily commissions, reinsurance fees, and premium taxes). We include deferred policy acquisition costs in other assets and amortize these costs over the terms of the related policies, whether directly written or reinsured.
Investment Securities
We generally classify our investment securities as available-for-sale or trading and other, depending on management’s intent. Our investment securities classified as available-for-sale are recorded at fair value. We adjust related balance sheet accounts to reflect the current fair value of investment securities and record the adjustment, net of tax, in accumulated other comprehensive income or loss in shareholders’ equity. We record interest receivable on investment securities in other assets.
Under the fair value option, we may elect to measure at fair value, financial assets that are not otherwise required to be carried at fair value. We elect the fair value option for available-for-sale securities that are deemed to incorporate an embedded derivative and for which it is impracticable for us to isolate and/or value the derivative. We recognize any changes in fair value in investment revenues.
We classify our investment securities in the fair value hierarchy framework based on the observability of inputs. Inputs to the valuation techniques are described as being either observable (Level 1 or 2) or unobservable (Level 3) assumptions (as further described in “Fair Value Measurements” below) that market participants would use in pricing an asset or liability.
Impairments on Investment Securities
Available-for-sale.
We evaluate our available-for-sale securities on an individual basis to identify any instances where the fair value of the investment security is below its amortized cost. For these securities, we then evaluate whether an other-than-temporary impairment exists if any of the following conditions are present:
|
•
|
we intend to sell the security;
|
|
•
|
it is more likely than not that we will be required to sell the security before recovery of its amortized cost basis; or
|
|
•
|
we do not expect to recover the security’s entire amortized cost basis (even if we do not intend to sell the security).
|
If we intend to sell an impaired investment security or we will likely be required to sell the security before recovery of its amortized cost basis less any current period credit loss, we recognize an other-than-temporary impairment in investment revenues equal to the difference between the investment security’s amortized cost and its fair value at the balance sheet date.
In determining whether a credit loss exists, we compare our best estimate of the present value of the cash flows expected to be collected from the security to the amortized cost basis of the security. Any shortfall in this comparison represents a credit loss. The cash flows expected to be collected are determined by assessing all available information, including length and severity of unrealized loss, issuer default rate, ratings changes and adverse conditions related to the industry sector, financial condition of issuer, credit enhancements, collateral default rates, and other relevant criteria. Management considers factors such as our investment strategy, liquidity requirements, overall business plans, and recovery periods for securities in previous periods of broad market declines.
If a credit loss exists with respect to an investment in a security (i.e., we do not expect to recover the entire amortized cost basis of the security), we would be unable to assert that we will recover our amortized cost basis even if we do not intend to sell the security. Therefore, in these situations, an other-than-temporary impairment is considered to have occurred.
If a credit loss exists, but we do not intend to sell the security and we will likely not be required to sell the security before recovery of its amortized cost basis less any current period credit loss, the impairment is classified as: (i) the estimated amount relating to credit loss; and (ii) the amount relating to all other factors. We recognize the estimated credit loss in investment revenues, and the non-credit loss amount in accumulated other comprehensive income or loss.
89
Once a credit loss is recognized, we adjust the investment security to a new amortized cost basis equal to the previous amortized cost basis less the credit losses recognized in investment revenues. For investment securities for which other-than-temporary impairments were recognized in investment revenues, the difference between the new amortized cost basis and the cash flows expected to be collected is accreted to investment income.
We recognize subsequent increases and decreases in the fair value of our available-for-sale securities in accumulated other comprehensive income or loss, unless the decrease is considered other than temporary.
Investment Revenue Recognition
We recognize interest on interest bearing fixed-maturity investment securities as revenue on the accrual basis. We amortize any premiums or accrete any discounts as a revenue adjustment using the interest method. We stop accruing interest revenue when the collection of interest becomes uncertain. We record dividends on equity securities as revenue on ex-dividend dates. We recognize income on mortgage-backed and asset-backed securities as revenue using an effective yield based on estimated prepayments of the underlying collateral. If actual prepayments differ from estimated prepayments, we calculate a new effective yield and adjust the net investment in the security accordingly. We record the adjustment, along with all investment securities revenue, in investment revenues. We specifically identify realized gains and losses on investment securities and include them in investment revenues.
Acquisition-related Transaction and Integration Expenses
In connection with the OneMain Acquisition, we incur acquisition-related transaction and integration costs, including (i) compensation and employee benefit costs, such as retention awards and severance costs, (ii) accelerated amortization of acquired software assets, (iii) rebranding to the OneMain brand, (iv) branch infrastructure and other fixed asset integration costs, (v) information technology costs, such as internal platform development, software upgrades and licenses, and technology termination costs, (vi) legal fees and project management costs, (vii) system conversions, including human capital management, marketing, risk, and finance functions, and (viii) other costs and fees directly related to the OneMain Acquisition and integration.
Variable Interest Entities
An entity is a VIE if the entity does not have sufficient equity at risk for the entity to finance its activities without additional financial support or has equity investors who lack the characteristics of a controlling financial interest. A VIE is consolidated into the financial statements of its primary beneficiary. When we have a variable interest in a VIE, we qualitatively assess whether we have a controlling financial interest in the entity and, if so, whether we are the primary beneficiary. In applying the qualitative assessment to identify the primary beneficiary of a VIE, we are determined to have a controlling financial interest if we have (i) the power to direct the activities that most significantly impact the economic performance of the VIE, and (ii) the obligation to absorb losses or the right to receive benefits that could potentially be significant to the VIE. We consider the VIE’s purpose and design, including the risks that the entity was designed to create and pass through to its variable interest holders. We continually reassess the VIE’s primary beneficiary and whether we have acquired or divested the power to direct the activities of the VIE through changes in governing documents or other circumstances.
Other Invested Assets
Commercial mortgage loans and insurance policy loans are part of our investment portfolio and we include them in other assets at amortized cost. We recognize interest on commercial mortgage loans and insurance policy loans as revenue on the accrual basis using the interest method. We stop accruing revenue when collection of interest becomes uncertain. We include other invested asset revenue in investment revenues. We record accrued other invested asset revenue receivable in other assets.
Cash and Cash Equivalents
We consider unrestricted cash on hand and short-term investments having maturity dates within three months of their date of acquisition to be cash and cash equivalents.
We typically maintain cash in financial institutions in excess of the Federal Deposit Insurance Corporation’s insurance limits. We evaluate the creditworthiness of these financial institutions in determining the risk associated with these cash balances. We
90
do not believe that the Company is exposed to any significant credit risk on these accounts and have not experienced any losses in such accounts.
Restricted Cash and Cash Equivalents
We include funds to be used for future debt payments relating to our securitization transactions and escrow deposits in restricted cash and cash equivalents.
We generally report our long-term debt issuances at the face value of the debt instrument, which we adjust for any unaccreted discount, unamortized premium, or unamortized debt issuance costs associated with the debt. Other than securitized products, we generally accrete discounts, premiums, and debt issuance costs over the contractual life of the security using contractual payment terms. With respect to securitized products, we have elected to amortize deferred costs over the contractual life of the security. Accretion of discounts and premiums are recorded to interest expense.
Income Taxes
We recognize income taxes using the asset and liability method. We establish deferred tax assets and liabilities for temporary differences between the financial reporting basis and the tax basis of assets and liabilities, using the tax rates expected to be in effect when the temporary differences reverse. Deferred tax assets are also recognized for tax attributes such as net operating loss carryforwards.
Realization of our gross deferred tax asset depends on our ability to generate sufficient taxable income of the appropriate character within the carryforward periods of the jurisdictions in which the net operating and capital losses, deductible temporary differences and credits were generated. When we assess our ability to realize deferred tax assets, we consider all available evidence and we record valuation allowances to reduce deferred tax assets to the amounts that management conclude are more-likely-than-not to be realized.
We recognize income tax benefits associated with uncertain tax positions, when, in our judgment, it is more likely than not that the position will be sustained upon examination by a taxing authority. For a tax position that meets the more likely than not recognition threshold, we initially and subsequently measure the tax benefit as the largest amount that we judge to have a greater than 50% likelihood of being realized upon ultimate settlement with the taxing authority.
The Tax Act was enacted on December 22, 2017 and we must reflect the changes associated with its provisions in 2017. The law is complex and has extensive implications for our federal and state current and deferred taxes and income tax expense. We recorded and reported the effects of the Tax Act in our financial statements in 2017. For further information, see Note 18 of the Notes to Consolidated Financial Statements included in this report.
Benefit Plans
We have funded and unfunded noncontributory defined pension plans. We recognize the net pension asset or liability, also referred to herein as the funded status of the benefit plans, in other assets or other liabilities, depending on the funded status at the end of each reporting period. We recognize the net actuarial gains or losses and prior service cost or credit that arise during the period in other comprehensive income or loss.
Many of our employees are participants in our 401(k) plan. Our contributions to the plan are charged to salaries and benefits within operating expenses.
91
Share-based Compensation Plans
We measure compensation cost for service-based and performance-based awards at estimated fair value and recognize compensation expense over the requisite service period for awards expected to vest. The estimation of awards that will ultimately vest requires judgment, and to the extent actual results or updated estimates differ from current estimates, such amounts will be recorded as a cumulative adjustment to salaries and benefits in the period estimates are revised. For service-based awards subject to graded vesting, expense is recognized under the straight-line method. Expense for performance-based awards with graded vesting is recognized under the accelerated method, whereby each vesting is treated as a separate award with expense for each vesting recognized ratably over the requisite service period.
Fair Value Measurements
Management is responsible for the determination of the fair value of our financial assets and financial liabilities and the supporting methodologies and assumptions. We employ widely accepted internal valuation models or utilize third-party valuation service providers to gather, analyze, and interpret market information and derive fair values based upon relevant methodologies and assumptions for individual instruments or pools of finance receivables. When our valuation service providers are unable to obtain sufficient market observable information upon which to estimate the fair value for a particular security, we determine fair value either by requesting brokers who are knowledgeable about these securities to provide a quote, which is generally non-binding, or by employing widely accepted internal valuation models.
Our valuation process typically requires obtaining data about market transactions and other key valuation model inputs from internal or external sources and, through the use of widely accepted valuation models, provides a single fair value measurement for individual securities or pools of finance receivables. The inputs used in this process include, but are not limited to, market prices from recently completed transactions and transactions of comparable securities, interest rate yield curves, credit spreads, bid-ask spreads, currency rates, and other market-observable information as of the measurement date as well as the specific attributes of the security being valued, including its term, interest rate, credit rating, industry sector, and other issue or issuer-specific information. When market transactions or other market observable data is limited, the extent to which judgment is applied in determining fair value is greatly increased. We assess the reasonableness of individual security values received from our valuation service providers through various analytical techniques. As part of our internal price reviews, assets that fall outside a price change tolerance are sent to our third-party investment manager for further review. In addition, we may validate the reasonableness of fair values by comparing information obtained from our valuation service providers to other third-party valuation sources for selected securities.
We measure and classify assets and liabilities in the consolidated balance sheets in a hierarchy for disclosure purposes consisting of three “Levels” based on the observability of inputs available in the market place used to measure the fair values. In general, we determine the fair value measurements classified as Level 1 based on inputs utilizing quoted prices in active markets for identical assets or liabilities that we have the ability to access. We generally obtain market price data from exchange or dealer markets. We do not adjust the quoted price for such instruments.
We determine the fair value measurements classified as Level 2 based on inputs utilizing other than quoted prices included in Level 1 that are observable for the asset or liability, either directly or indirectly. Level 2 inputs include quoted prices for similar assets and liabilities in active markets, and inputs other than quoted prices that are observable for the asset or liability, such as interest rates and yield curves that are observable at commonly quoted intervals.
Level 3 inputs are unobservable inputs for the asset or liability, and include situations where there is little, if any, market activity for the asset or liability. The use of observable and unobservable inputs is further discussed in Note
23
.
In certain cases, the inputs we use to measure the fair value of an asset may fall into different levels of the fair value hierarchy. In such cases, we determine the level in the fair value hierarchy within which the fair value measurement in its entirety falls based on the lowest level input that is significant to the fair value measurement in its entirety. Our assessment of the significance of a particular input to the fair value measurement in its entirety requires judgment and considers factors specific to the asset or liability.
We recognize transfers into and out of each level of the fair value hierarchy as of the end of the reporting period. Our fair value processes include controls that are designed to ensure that fair values are appropriate. Such controls include model validation, review of key model inputs, analysis of period-over-period fluctuations, and reviews by senior management.
92
Earnings Per Share
Basic earnings per share is computed by dividing net income or loss by the weighted-average number of shares outstanding during each period. Diluted earnings per share is computed based on the weighted-average number of common shares plus the effect of dilutive potential common shares outstanding during the period using the treasury stock method. Dilutive potential common shares represent outstanding unvested restricted stock units and awards.
Foreign Currency Translation
Assets and liabilities of foreign operations are translated from their functional currencies into U.S. dollars for reporting purposes using the period end spot foreign exchange rate. Revenues and expenses of foreign operations are translated monthly from their respective functional currencies into U.S. dollars at amounts that approximate weighted average exchange rates. The effects of those translation adjustments are classified in Accumulated other comprehensive income (loss) on the Consolidated Balance Sheets.
PRIOR PERIOD REVISIONS
During the second quarter of 2015, we discovered that we had not charged-off certain bankrupt accounts in our SpringCastle Portfolio and we identified an error in the calculation of the allowance for our TDR personal loans. As a result of these findings, we recorded an out-of-period adjustment in the second quarter of 2015 related to prior periods, which increased provision for finance receivable losses by
$8 million
, decreased provision for income taxes by
$3 million
, and decreased basic and diluted earnings per share each by $0.03 for the three and six months ended June 30, 2015. The adjustment was not material to our results of operations for 2015.
4
.
Recent Accounting Pronouncements
ACCOUNTING PRONOUNCEMENTS RECENTLY ADOPTED
Investments
In March of 2016, the FASB issued ASU 2016-07,
Simplifying the Transition to the Equity Method of Accounting,
which eliminates the requirement that, when an investment qualifies for use of the equity method of accounting as a result of an increase in the level of ownership interest or degree of influence, an investor must adjust the investment, results of operations, and retained earnings retroactively on a step-by-step basis as if the equity method of accounting had been in effect during all previous periods that the investment had been held. The ASU requires that an entity that has available-for-sale securities recognize, through earnings, the unrealized holding gain or loss in accumulated other comprehensive income at the date the investment becomes qualified for use of the equity method of accounting. The amendment in this ASU became effective prospectively for the Company for fiscal periods beginning January 1, 2017. We have adopted this ASU as of January 1, 2017 and concluded that it does not have an impact on our consolidated financial statements.
Statement of Cash Flows
In November of 2016, the FASB issued ASU 2016-18,
Statement of Cash Flows
, which simplifies the presentation of restricted cash on the statement of cash flows by requiring entities to include restricted cash and restricted cash equivalents in the reconciliation of cash and cash equivalents. The amendments in this ASU become effective for the Company for fiscal years beginning January 1, 2018. We elected to early adopt this ASU as of January 1, 2017 and presented this change on a retrospective basis for all periods presented. We concluded that this ASU does not have a material impact on our consolidated financial statements.
Technical Corrections and Improvements
In January of 2017, the FASB issued ASU 2017-03,
Accounting Changes and Error Corrections
, to enhance the footnote disclosure guidelines for ASUs 2014-09, 2016-02, and 2016-13. The amendments to this transition guidance became effective for the Company for fiscal years beginning January 1, 2017. We have adopted this ASU as of January 1, 2017 on a prospective basis. We concluded that this ASU does not have a material impact on our consolidated financial statements.
93
Business Combinations
In January of 2017, the FASB issued ASU 2017-01,
Business Combinations
, to clarify the definition of a business, which establishes a process to determine when an integrated set of assets and activities can be deemed a business combination. The amendments in this ASU became effective for the Company for annual periods beginning January 1, 2018. We elected to early adopt this ASU as of April 1, 2017 on a prospective basis. We concluded that the adoption of this ASU does not have a material impact on our consolidated financial statements.
ACCOUNTING PRONOUNCEMENTS TO BE ADOPTED
Revenue Recognition
In May of 2014, the FASB issued ASU 2014-09,
Revenue from Contracts with Customers
, which provides a consistent revenue accounting model across industries. Management has reviewed this update and other ASU’s that were subsequently issued to further clarify the implementation guidance outlined in ASU 2014-09. The Company will adopt this ASU effective January 1, 2018. The Company’s implementation efforts included the identification of revenue streams that are within the scope of the new guidance and the review of related contracts with customers to determine their effect on certain non-interest income items presented in our consolidated statements of operations and the additional presentation disclosures required. We concluded that substantially all of the Company’s revenues are generated from activities that are outside the scope of this ASU, and the adoption will not have a material impact on our consolidated financial statements.
Financial Instruments
In January of 2016, the FASB issued ASU 2016-01,
Recognition and Measurement of Financial Assets and Financial Liabilities
, which simplifies the impairment assessment of equity investments. The update requires equity investments to be measured at fair value with changes recognized in net income. This ASU eliminates the requirement to disclose the methods and assumptions to estimate fair value for financial instruments, requires the use of the exit price for disclosure purposes, requires the change in liability due to a change in credit risk to be presented in other comprehensive income, requires separate presentation of financial assets and liabilities by measurement category and form of asset (securities and loans), and clarifies the need for a valuation allowance on a deferred tax asset related to available-for-sale securities. The amendments in this ASU become effective for fiscal periods beginning January 1, 2018 using a cumulative-effect adjustment to the balance sheet. The amendments related to equity securities without readily determinable fair values (including disclosure requirements) shall be applied prospectively to equity investments that exist as of the date of adoption of this update. We concluded the adoption of this ASU will not have a material impact on our consolidated financial statements.
In March of 2017, the FASB issued ASU 2017-08,
Receivables - Nonrefundable Fees and Other Costs
, which amends the amortization period for certain purchased callable debt securities held at a premium. This ASU shortens the amortization period for the premium from the adjustment of yield over the contractual life of the instrument to the earliest call date. The amendments in this ASU become effective for the Company for fiscal years beginning January 1, 2019. We believe the adoption of this ASU will not have a material impact on our consolidated financial statements.
Leases
In February of 2016, the FASB issued ASU 2016-02,
Leases,
which
requires lessees to recognize a right-of-use asset and a liability for the obligation to make payments on leases with terms greater than 12 months and to disclose information related to the amount, timing and uncertainty of cash flows arising from leases, including various qualitative and quantitative requirements. The amendments in this ASU become effective for the Company for fiscal periods beginning January 1, 2019. The Company’s cross-functional implementation team has developed a project plan to ensure we comply with all updates from this ASU at the time of adoption. We are currently in the process of importing all identified leases into a new leasing system that will allow us to better account for the leases in accordance with the new guidance. We are assessing new system updates to ensure both qualitative and quantitative data requirements will be met at the time of adoption. The Company’s leases primarily consist of leased office space, automobiles and information technology equipment. At December 31, 2017, the Company had
$180 million
of minimum lease commitments from these operating leases (refer to Note 19). We believe the adoption of this ASU will have a material effect on our consolidated financial statements, and we are in the process of quantifying the expected impact.
94
Allowance for Finance Receivables Losses
In June of 2016, the FASB issued ASU 2016-13,
Financial Instruments-Credit Losses: Measurement of Credit Losses on Financial Instruments,
which significantly changes the way that entities will be required to measure credit losses. The new standard requires that the estimated credit loss be based upon an “expected credit loss” approach rather than the “incurred loss” approach currently required. The new approach will require entities to measure all expected credit losses for financial assets based on historical experience, current conditions, and reasonable forecasts of collectability. It is anticipated that the expected credit loss model will require earlier recognition of credit losses than the incurred loss approach.
The ASU requires that credit losses for purchased financial assets with a more-than-insignificant amount of credit deterioration since origination that are measured at amortized cost basis be
determined in a similar manner to other financial assets measured at amortized cost basis; however, the initial allowance for credit losses is added to the purchase price of the financial asset rather than being reported as a credit loss expense. Subsequent changes in the allowance for credit losses are recorded in earnings. Interest income should be recognized based on the effective rate, excluding the discount embedded in the purchase price attributable to expected credit losses at acquisition.
The ASU also requires companies to record allowances for held-to-maturity and available-for-sale debt securities rather than write-downs of such assets.
In addition, the ASU requires qualitative and quantitative disclosures that provide information about the allowance and the significant factors that influenced management’s estimate of the allowance.
The ASU will become effective for the Company for fiscal years beginning January 1, 2020. Early adoption is permitted for fiscal years beginning January 1, 2019. The Company’s cross-functional implementation team has developed a project plan to ensure we comply with all updates from this ASU at the time of adoption. We continue to make progress in developing an acceptable model to estimate the expected credit losses. After the model has been reviewed and validated in accordance with our governance policies, the Company will provide further disclosure regarding the estimated impact on our allowance for finance receivables losses. In addition to the development of the model, we are assessing the additional disclosure requirements from this update. We believe the adoption of this ASU will have a material effect on our consolidated financial statements, and we are in the process of quantifying the expected impacts.
Statement of Cash Flows
In August of 2016, the FASB issued ASU 2016-15,
Statement of Cash Flows: Classification of Certain Cash Receipts and Cash Payments
, which clarifies how certain cash receipts and cash payments are presented and classified in the statement of cash flows. The amendments in this ASU will become effective for the Company for fiscal years beginning January 1, 2018. We concluded the adoption of this ASU will not have a material impact on our consolidated financial statements.
Income Taxes
In October of 2016, the FASB issued ASU 2016-16,
Income Taxes: Intra-Entity Transfers of Assets Other Than Inventory
, which requires entities to recognize the income tax consequences of an intra-entity transfer of an asset other than inventory when the transfer occurs. The amendments in this ASU will become effective for the Company for annual reporting periods beginning January 1, 2018. We concluded the adoption of this ASU will not have a material impact on our consolidated financial statements.
Goodwill Impairment
In January of 2017, the FASB issued ASU 2017-04,
Intangibles-Goodwill and Other: Simplifying the Test for Goodwill Impairment
, which simplifies the test for goodwill impairment by eliminating Step 2 of the impairment testing process. The amendments in this ASU will become effective for the Company for fiscal years beginning January 1, 2020. We believe the adoption of this ASU will not have a material impact on our consolidated financial statements.
Compensation and Benefits
In March of 2017, the FASB issued ASU 2017-07,
Compensation-Retirement Benefits: Improving the Presentation of Net Periodic Pension Cost and Net Periodic Postretirement Benefit Cost
, to improve the presentation of the net periodic pension
95
cost and net periodic postretirement benefit costs. It requires that a company present the service cost component separately from other components of net benefit cost on the income statement. The amendments in this ASU become effective for the Company for fiscal periods beginning January 1, 2018. We concluded the adoption of this ASU will not have a material impact on our consolidated financial statements.
In May of 2017, the FASB issued ASU 2017-09,
Compensation-Stock Compensation: Scope of Modification Accounting
, which provides guidance on which changes to the terms or conditions of a share-based payment award requires an entity to apply modification accounting. The amendments in this ASU become effective for the Company for annual periods beginning January 1, 2018. We concluded the adoption of this ASU will not have a material impact on our consolidated financial statements.
We do not believe that any other accounting pronouncements issued during 2017, but not yet effective, would have a material impact on our consolidated financial statements or disclosures, if adopted.
96
5
.
Finance Receivables
Our finance receivable types include personal loans, real estate loans, and retail sales finance as defined below:
|
•
|
Personal loans —
are secured by consumer goods, automobiles, or other personal property or are unsecured, typically non-revolving with a fixed-rate and a fixed, original term of
three
to
six years
. At
December 31, 2017
, we had over
2.4 million
personal loans representing
$14.8 billion
of net finance receivables, compared to
2.2 million
personal loans totaling
$13.6 billion
at
December 31, 2016
.
|
|
•
|
Real estate loans —
are secured by first or second mortgages on residential real estate, generally have maximum original terms of
360 months
, and are considered non-conforming. Real estate loans may be closed-end accounts or open-end home equity lines of credit and are primarily fixed-rate products. In 2012, we ceased originating real estate loans and the portfolio is in a liquidating status.
|
|
•
|
Retail sales finance —
include retail sales contracts and revolving retail accounts. Retail sales contracts are closed-end accounts that represent a single purchase transaction, are secured by the personal property designated in the contract and generally have maximum original terms of
60 months
. Revolving retail accounts are open-end accounts that can be used for financing repeated purchases from the same merchant, are secured by the goods purchased and generally require minimum monthly payments based on the amount financed calculated after the most recent purchase or outstanding balances. Our retail sales finance portfolio is in a liquidating status.
|
Components of net finance receivables held for investment by type were as follows:
|
(dollars in millions)
|
Personal
Loans
|
Real Estate
Loans
|
Retail
Sales Finance
|
Total
|
||||||||||||
|
December 31, 2017
|
||||||||||||||||
|
Gross receivables *
|
$
|
16,221
|
|
$
|
127
|
|
$
|
7
|
|
$
|
16,355
|
|
||||
|
Unearned finance charges and points and fees
|
(1,725
|
)
|
—
|
|
(1
|
)
|
(1,726
|
)
|
||||||||
|
Accrued finance charges
|
210
|
|
1
|
|
—
|
|
211
|
|
||||||||
|
Deferred origination costs
|
117
|
|
—
|
|
—
|
|
117
|
|
||||||||
|
Total
|
$
|
14,823
|
|
$
|
128
|
|
$
|
6
|
|
$
|
14,957
|
|
||||
|
December 31, 2016
|
||||||||||||||||
|
Gross receivables *
|
$
|
15,405
|
|
$
|
142
|
|
$
|
12
|
|
$
|
15,559
|
|
||||
|
Unearned finance charges and points and fees
|
(2,062
|
)
|
1
|
|
(1
|
)
|
(2,062
|
)
|
||||||||
|
Accrued finance charges
|
151
|
|
1
|
|
—
|
|
152
|
|
||||||||
|
Deferred origination costs
|
83
|
|
—
|
|
—
|
|
83
|
|
||||||||
|
Total
|
$
|
13,577
|
|
$
|
144
|
|
$
|
11
|
|
$
|
13,732
|
|
||||
|
*
|
Gross receivables are defined as follows:
|
|
•
|
Finance receivables purchased as a performing receivable
— gross finance receivables equal the UPB for interest bearing accounts and the gross remaining contractual payments for precompute accounts. Additionally, the remaining unearned premium, net of discount established at the time of purchase, is included in both interest bearing and precompute accounts to reflect the finance receivable balance at its initial fair value;
|
|
•
|
Finance receivables originated subsequent to the OneMain Acquisition and the Fortress Acquisition
— gross finance receivables equal the UPB for interest bearing accounts and the gross remaining contractual payments for precompute accounts;
|
|
•
|
Purchased credit impaired finance receivables
— gross finance receivables equal the remaining estimated cash flows less the current balance of accretable yield on the purchased credit impaired accounts; and
|
|
•
|
TDR finance receivables
—gross finance receivables equal the UPB for interest bearing accounts and the gross remaining contractual payments for precompute accounts. Additionally, the remaining unearned premium, net of discount established at the time of purchase, is included in both interest bearing and precompute accounts previously purchased as a performing receivable.
|
97
At
December 31, 2017
and
2016
, unused lines of credit extended to customers by the Company were immaterial.
GEOGRAPHIC DIVERSIFICATION
Geographic diversification of finance receivables reduces the concentration of credit risk associated with economic stresses in any one region. The largest concentrations of net finance receivables were as follows:
|
December 31,
|
2017
|
2016 *
|
||||||||||||
|
(dollars in millions)
|
Amount
|
Percent
|
Amount
|
Percent
|
||||||||||
|
Texas
|
$
|
1,302
|
|
9
|
%
|
$
|
1,196
|
|
9
|
%
|
||||
|
North Carolina
|
1,155
|
|
8
|
|
1,112
|
|
8
|
|
||||||
|
Pennsylvania
|
883
|
|
6
|
|
825
|
|
6
|
|
||||||
|
California
|
883
|
|
6
|
|
813
|
|
6
|
|
||||||
|
Ohio
|
726
|
|
5
|
|
660
|
|
5
|
|
||||||
|
Florida
|
678
|
|
5
|
|
579
|
|
4
|
|
||||||
|
Illinois
|
668
|
|
4
|
|
599
|
|
4
|
|
||||||
|
Virginia
|
641
|
|
4
|
|
623
|
|
5
|
|
||||||
|
Georgia
|
618
|
|
4
|
|
586
|
|
4
|
|
||||||
|
Indiana
|
608
|
|
4
|
|
539
|
|
4
|
|
||||||
|
Tennessee
|
520
|
|
3
|
|
465
|
|
3
|
|
||||||
|
Other
|
6,275
|
|
42
|
|
5,735
|
|
42
|
|
||||||
|
Total
|
$
|
14,957
|
|
100
|
%
|
$
|
13,732
|
|
100
|
%
|
||||
|
*
|
December 31, 2016
concentrations of net finance receivables are presented in the order of
December 31, 2017
state concentrations.
|
CREDIT QUALITY INDICATOR
We consider the delinquency status of our finance receivables as our primary credit quality indicator. We monitor delinquency trends to manage our exposure to credit risk. When finance receivables are contractually
60 days
past due, we consider them delinquent and transfer collection of these accounts to our centralized operations, as these accounts are considered to be at increased risk for loss. At
90 days
or more past due, we consider our finance receivables to be nonperforming.
98
The following is a summary of net finance receivables held for investment by type and by number of days delinquent:
|
(dollars in millions)
|
Personal
Loans
|
Real Estate
Loans
|
Retail
Sales Finance
|
Total
|
||||||||||||
|
December 31, 2017
|
||||||||||||||||
|
Performing:
|
||||||||||||||||
|
Current
|
$
|
14,124
|
|
$
|
98
|
|
$
|
6
|
|
$
|
14,228
|
|
||||
|
30-59 days past due
|
204
|
|
8
|
|
—
|
|
212
|
|
||||||||
|
60-89 days past due
|
157
|
|
3
|
|
—
|
|
160
|
|
||||||||
|
Total performing
|
14,485
|
|
109
|
|
6
|
|
14,600
|
|
||||||||
|
Nonperforming:
|
||||||||||||||||
|
90-179 days past due
|
332
|
|
4
|
|
—
|
|
336
|
|
||||||||
|
180 days or more past due
|
6
|
|
15
|
|
—
|
|
21
|
|
||||||||
|
Total nonperforming
|
338
|
|
19
|
|
—
|
|
357
|
|
||||||||
|
Total
|
$
|
14,823
|
|
$
|
128
|
|
$
|
6
|
|
$
|
14,957
|
|
||||
|
December 31, 2016
|
||||||||||||||||
|
Performing:
|
||||||||||||||||
|
Current
|
$
|
12,920
|
|
$
|
102
|
|
$
|
11
|
|
$
|
13,033
|
|
||||
|
30-59 days past due
|
174
|
|
9
|
|
—
|
|
183
|
|
||||||||
|
60-89 days past due
|
130
|
|
4
|
|
—
|
|
134
|
|
||||||||
|
Total performing
|
13,224
|
|
115
|
|
11
|
|
13,350
|
|
||||||||
|
Nonperforming:
|
||||||||||||||||
|
90-179 days past due
|
349
|
|
8
|
|
—
|
|
357
|
|
||||||||
|
180 days or more past due
|
4
|
|
21
|
|
—
|
|
25
|
|
||||||||
|
Total nonperforming
|
353
|
|
29
|
|
—
|
|
382
|
|
||||||||
|
Total
|
$
|
13,577
|
|
$
|
144
|
|
$
|
11
|
|
$
|
13,732
|
|
||||
We accrue finance charges on revolving retail finance receivables up to the date of charge-off at
180 days
past due. Our revolving retail finance receivables that were more than
90 days
past due and still accruing finance charges at
December 31, 2017
and at
December 31, 2016
were immaterial.
PURCHASED CREDIT IMPAIRED FINANCE RECEIVABLES
Our purchased credit impaired finance receivables consist of receivables purchased in connection with the OneMain Acquisition and the Fortress Acquisition.
Prior to March 31, 2016, our purchased credit impaired finance receivables also included the SpringCastle Portfolio, which was purchased in connection with the joint venture acquisition of the SpringCastle Portfolio. On March 31, 2016, we sold our interest in the SpringCastle Portfolio in connection with the SpringCastle Interests Sale.
We report the carrying amount (which initially was the fair value) of our purchased credit impaired finance receivables in net finance receivables, less allowance for finance receivable losses or in finance receivables held for sale as discussed below.
At
December 31, 2017
and
2016
, finance receivables held for sale totaled
$132 million
and
$153 million
, respectively, which include purchased credit impaired finance receivables, as well as TDR finance receivables. Therefore, we are presenting the financial information for our purchased credit impaired finance receivables and TDR finance receivables combined for finance receivables held for investment and finance receivables held for sale in the tables below. See Note
7
for further information on our finance receivables held for sale.
99
Information regarding our purchased credit impaired finance receivables held for investment and held for sale were as follows:
|
(dollars in millions)
|
OM Loans
|
FA Loans (a)
|
Total
|
|||||||||
|
December 31, 2017
|
||||||||||||
|
Carrying amount, net of allowance
|
$
|
176
|
|
$
|
57
|
|
$
|
233
|
|
|||
|
Outstanding balance (b)
|
243
|
|
94
|
|
337
|
|
||||||
|
Allowance for purchased credit impaired finance receivable losses
|
6
|
|
9
|
|
15
|
|
||||||
|
December 31, 2016
|
||||||||||||
|
Carrying amount, net of allowance
|
$
|
324
|
|
$
|
70
|
|
$
|
394
|
|
|||
|
Outstanding balance (b)
|
444
|
|
107
|
|
551
|
|
||||||
|
Allowance for purchased credit impaired finance receivable losses
|
29
|
|
8
|
|
37
|
|
||||||
|
(a)
|
Purchased credit impaired FA Loans held for sale included in the table above were as follows:
|
|
(dollars in millions)
|
||||||||
|
December 31,
|
2017
|
2016
|
||||||
|
Carrying amount
|
$
|
44
|
|
$
|
54
|
|
||
|
Outstanding balance
|
72
|
|
83
|
|
||||
|
(b)
|
Outstanding balance is defined as UPB of the loans with a net carrying amount.
|
The allowance for purchased credit impaired finance receivable losses at
December 31, 2017
and
2016
, reflected the carrying value of the purchased credit impaired loans held for investment being higher than the present value of the expected cash flows.
100
Changes in accretable yield for purchased credit impaired finance receivables held for investment and held for sale were as follows:
|
(dollars in millions)
|
OM Loans
|
SCP Loans
|
FA Loans
|
Total
|
||||||||||||
|
Year Ended December 31, 2017
|
||||||||||||||||
|
Balance at beginning of period
|
$
|
59
|
|
$
|
—
|
|
$
|
60
|
|
$
|
119
|
|
||||
|
Accretion (a)
|
(34
|
)
|
—
|
|
(5
|
)
|
(39
|
)
|
||||||||
|
Reclassifications from (to) nonaccretable difference (b)
|
22
|
|
—
|
|
(2
|
)
|
20
|
|
||||||||
|
Balance at end of period
|
$
|
47
|
|
$
|
—
|
|
$
|
53
|
|
$
|
100
|
|
||||
|
Year Ended December 31, 2016
|
||||||||||||||||
|
Balance at beginning of period
|
$
|
151
|
|
$
|
375
|
|
$
|
66
|
|
$
|
592
|
|
||||
|
Accretion (a)
|
(69
|
)
|
(16
|
)
|
(7
|
)
|
(92
|
)
|
||||||||
|
Other (c)
|
(23
|
)
|
—
|
|
—
|
|
(23
|
)
|
||||||||
|
Reclassifications from nonaccretable difference (b)
|
—
|
|
—
|
|
12
|
|
12
|
|
||||||||
|
Transfers due to finance receivables sold
|
—
|
|
(359
|
)
|
(11
|
)
|
(370
|
)
|
||||||||
|
Balance at end of period
|
$
|
59
|
|
$
|
—
|
|
$
|
60
|
|
$
|
119
|
|
||||
|
Year Ended December 31, 2015
|
||||||||||||||||
|
Balance at beginning of period
|
$
|
—
|
|
$
|
452
|
|
$
|
54
|
|
$
|
506
|
|
||||
|
Additions from OneMain Acquisition
|
166
|
|
—
|
|
—
|
|
166
|
|
||||||||
|
Accretion (a)
|
(15
|
)
|
(77
|
)
|
(8
|
)
|
(100
|
)
|
||||||||
|
Reclassifications from nonaccretable difference (b)
|
—
|
|
—
|
|
20
|
|
20
|
|
||||||||
|
Balance at end of period
|
$
|
151
|
|
$
|
375
|
|
$
|
66
|
|
$
|
592
|
|
||||
|
(a)
|
Accretion on our purchased credit impaired FA Loans held for sale included in the table above were as follows:
|
|
(dollars in millions)
|
||||||||||||
|
Years Ended December 31,
|
2017
|
2016
|
2015
|
|||||||||
|
Accretion
|
$
|
4
|
|
$
|
5
|
|
$
|
6
|
|
|||
|
(b)
|
Reclassifications from (to) nonaccretable difference represents the increases (decreases) in accretable yield resulting from higher (lower) estimated undiscounted cash flows.
|
|
(c)
|
Other reflects a measurement period adjustment in the first quarter of 2016 based on a change in the expected cash flows in the purchase credit impaired portfolio related to the OneMain Acquisition. The measurement period adjustment created a decrease of
$23 million
to the beginning balance of the OM Loans accretable yield.
|
101
TROUBLED DEBT RESTRUCTURED FINANCE RECEIVABLES
Information regarding TDR finance receivables held for investment and held for sale were as follows:
|
(dollars in millions)
|
Personal
Loans
|
Real Estate
Loans (a) |
|
Total
|
||||||||
|
December 31, 2017
|
||||||||||||
|
TDR gross finance receivables (b)
|
$
|
318
|
|
$
|
139
|
|
$
|
457
|
|
|||
|
TDR net finance receivables
|
318
|
|
140
|
|
458
|
|
||||||
|
Allowance for TDR finance receivable losses
|
135
|
|
12
|
|
147
|
|
||||||
|
December 31, 2016
|
||||||||||||
|
TDR gross finance receivables
|
$
|
151
|
|
$
|
133
|
|
$
|
284
|
|
|||
|
TDR net finance receivables
|
152
|
|
134
|
|
286
|
|
||||||
|
Allowance for TDR finance receivable losses
|
69
|
|
11
|
|
80
|
|
||||||
(a) TDR real estate loans held for sale included in the table above were as follows:
|
(dollars in millions)
|
||||||||
|
December 31,
|
2017
|
2016
|
||||||
|
TDR gross finance receivables
|
$
|
90
|
|
$
|
89
|
|
||
|
TDR net finance receivables
|
91
|
|
90
|
|
||||
(b) As defined earlier in this Note.
As of
December 31, 2017
, we had
no
commitments to lend additional funds on our TDR finance receivables.
TDR average net receivables held for investment and held for sale and finance charges recognized on TDR finance receivables held for investment and held for sale were as follows:
|
(dollars in millions)
|
Personal
Loans (a)
|
SpringCastle
Portfolio
|
Real Estate
Loans (b) |
Total
|
||||||||||||
|
Year Ended December 31, 2017
|
||||||||||||||||
|
TDR average net receivables
|
$
|
231
|
|
$
|
—
|
|
$
|
140
|
|
$
|
371
|
|
||||
|
TDR finance charges recognized
|
33
|
|
—
|
|
9
|
|
42
|
|
||||||||
|
Year Ended December 31, 2016
|
||||||||||||||||
|
TDR average net receivables
|
$
|
95
|
|
$
|
—
|
|
$
|
175
|
|
$
|
270
|
|
||||
|
TDR finance charges recognized
|
12
|
|
—
|
|
11
|
|
23
|
|
||||||||
|
Year Ended December 31, 2015
|
||||||||||||||||
|
TDR average net receivables (c)
|
$
|
35
|
|
$
|
12
|
|
$
|
198
|
|
$
|
245
|
|
||||
|
TDR finance charges recognized
|
3
|
|
1
|
|
11
|
|
15
|
|
||||||||
102
|
(a)
|
TDR personal loans held for sale included in the table above were immaterial.
|
|
(b)
|
TDR real estate loans held for sale included in the table above were as follows:
|
|
(dollars in millions)
|
Real Estate
Loans |
|||
|
|
|
|||
|
Year Ended December 31, 2017
|
|
|
||
|
TDR average net receivables
|
$
|
91
|
|
|
|
TDR finance charges recognized
|
6
|
|
||
|
Year Ended December 31, 2016
|
||||
|
TDR average net receivables
|
$
|
102
|
|
|
|
TDR finance charges recognized
|
6
|
|
||
|
Year Ended December 31, 2015
|
||||
|
TDR average net receivables
|
$
|
91
|
|
|
|
TDR finance charges recognized
|
5
|
|
||
|
(c)
|
TDR personal loan average net receivables for 2015 reflect a two-month average for OneMain’s TDR average net receivables.
|
Information regarding the new volume of the TDR finance receivables held for investment and held for sale were as follows:
|
(dollars in millions)
|
Personal
Loans (a)
|
SpringCastle
Portfolio |
Real Estate
Loans (b) |
Total
|
||||||||||||
|
Year Ended December 31, 2017
|
||||||||||||||||
|
Pre-modification TDR net finance receivables
|
$
|
327
|
|
$
|
—
|
|
$
|
16
|
|
$
|
343
|
|
||||
|
Post-modification TDR net finance receivables:
|
|
|
||||||||||||||
|
Rate reduction
|
$
|
251
|
|
$
|
—
|
|
$
|
16
|
|
$
|
267
|
|
||||
|
Other (c)
|
75
|
|
—
|
|
—
|
|
75
|
|
||||||||
|
Total post-modification TDR net finance receivables
|
$
|
326
|
|
$
|
—
|
|
$
|
16
|
|
$
|
342
|
|
||||
|
Number of TDR accounts
|
45,560
|
|
—
|
|
510
|
|
46,070
|
|
||||||||
|
Year Ended December 31, 2016
|
||||||||||||||||
|
Pre-modification TDR net finance receivables
|
$
|
211
|
|
$
|
1
|
|
$
|
16
|
|
$
|
228
|
|
||||
|
Post-modification TDR net finance receivables:
|
|
|
||||||||||||||
|
Rate reduction
|
$
|
194
|
|
$
|
1
|
|
$
|
16
|
|
$
|
211
|
|
||||
|
Other (c)
|
12
|
|
—
|
|
1
|
|
13
|
|
||||||||
|
Total post-modification TDR net finance receivables
|
$
|
206
|
|
$
|
1
|
|
$
|
17
|
|
$
|
224
|
|
||||
|
Number of TDR accounts
|
29,435
|
|
157
|
|
364
|
|
29,956
|
|
||||||||
|
Year Ended December 31, 2015
|
||||||||||||||||
|
Pre-modification TDR net finance receivables
|
$
|
48
|
|
$
|
7
|
|
$
|
21
|
|
$
|
76
|
|
||||
|
Post-modification TDR net finance receivables:
|
|
|
||||||||||||||
|
Rate reduction
|
$
|
31
|
|
$
|
6
|
|
$
|
17
|
|
$
|
54
|
|
||||
|
Other (c)
|
12
|
|
—
|
|
5
|
|
17
|
|
||||||||
|
Total post-modification TDR net finance receivables
|
$
|
43
|
|
$
|
6
|
|
$
|
22
|
|
$
|
71
|
|
||||
|
Number of TDR accounts
|
8,425
|
|
721
|
|
385
|
|
9,531
|
|
||||||||
103
|
(a)
|
TDR personal loans held for sale included in the table above were immaterial.
|
|
(b)
|
TDR real estate loans held for sale included in the table above were as follows:
|
|
(dollars in millions)
|
Real Estate
Loans
|
|||||
|
Year Ended December 31, 2017
|
|
|
||||
|
Pre-modification TDR net finance receivables
|
$
|
6
|
|
|||
|
Post-modification TDR net finance receivables
|
$
|
7
|
|
|||
|
Number of TDR accounts
|
232
|
|
||||
|
Year Ended December 31, 2016
|
||||||
|
Pre-modification TDR net finance receivables
|
$
|
5
|
|
|||
|
Post-modification TDR net finance receivables
|
$
|
5
|
|
|||
|
Number of TDR accounts
|
122
|
|
||||
|
Year Ended December 31, 2015
|
||||||
|
Pre-modification TDR net finance receivables
|
$
|
6
|
|
|||
|
Post-modification TDR net finance receivables
|
$
|
7
|
|
|||
|
Number of TDR accounts
|
113
|
|
||||
|
(c)
|
“Other” modifications primarily include forgiveness of principal or interest.
|
Net finance receivables held for investment and held for sale that were modified as TDR finance receivables within the previous
12 months
and for which there was a default during the period to cause the TDR finance receivables to be considered nonperforming (
90 days
or more past due) were as follows:
|
(dollars in millions)
|
Personal
Loans
|
SpringCastle
Portfolio
|
Real Estate
Loans (a) |
Total
|
||||||||||||
|
Year Ended December 31, 2017
|
||||||||||||||||
|
TDR net finance receivables (b)
|
$
|
89
|
|
$
|
—
|
|
$
|
4
|
|
$
|
93
|
|
||||
|
Number of TDR accounts
|
15,035
|
|
—
|
|
101
|
|
15,136
|
|
||||||||
|
Year Ended December 31, 2016
|
||||||||||||||||
|
TDR net finance receivables (b) (c)
|
$
|
24
|
|
$
|
—
|
|
$
|
3
|
|
$
|
27
|
|
||||
|
Number of TDR accounts
|
3,693
|
|
19
|
|
61
|
|
3,773
|
|
||||||||
|
Year Ended December 31, 2015
|
||||||||||||||||
|
TDR net finance receivables (b)
|
$
|
8
|
|
$
|
2
|
|
$
|
3
|
|
$
|
13
|
|
||||
|
Number of TDR accounts
|
1,655
|
|
147
|
|
46
|
|
1,848
|
|
||||||||
104
|
(a)
|
TDR finance receivables held for sale included in the table above were as follows:
|
|
(dollars in millions)
|
Real Estate
Loans |
|||
|
Year Ended December 31, 2017
|
||||
|
TDR net finance receivables
|
$
|
2
|
|
|
|
Number of TDR accounts
|
53
|
|
||
|
Year Ended December 31, 2016
|
||||
|
TDR net finance receivables
|
$
|
2
|
|
|
|
Number of TDR accounts
|
30
|
|
||
|
Year Ended December 31, 2015
|
||||
|
TDR net finance receivables
|
$
|
1
|
|
|
|
Number of TDR accounts
|
17
|
|
||
|
(b)
|
Represents the corresponding balance of TDR net finance receivables at the end of the month in which they defaulted.
|
|
(c)
|
TDR SpringCastle Portfolio loans for the year ended December 31, 2016 that defaulted during the previous 12-month period were less than $
1 million
and, therefore, are not quantified in the combined table above.
|
6
.
Allowance for Finance Receivable Losses
Changes in the allowance for finance receivable losses by finance receivable type were as follows:
|
(dollars in millions)
|
Personal
Loans
|
SpringCastle
Portfolio
|
Real Estate
Loans
|
Retail
Sales Finance
|
Consolidated
Total
|
|||||||||||||||
|
Year Ended December 31, 2017
|
||||||||||||||||||||
|
Balance at beginning of period
|
$
|
669
|
|
$
|
—
|
|
$
|
19
|
|
$
|
1
|
|
$
|
689
|
|
|||||
|
Provision for finance receivable losses
|
949
|
|
—
|
|
6
|
|
—
|
|
955
|
|
||||||||||
|
Charge-offs
|
(1,048
|
)
|
—
|
|
(5
|
)
|
(1
|
)
|
(1,054
|
)
|
||||||||||
|
Recoveries
|
103
|
|
—
|
|
3
|
|
1
|
|
107
|
|
||||||||||
|
Balance at end of period
|
$
|
673
|
|
$
|
—
|
|
$
|
23
|
|
$
|
1
|
|
$
|
697
|
|
|||||
|
Year Ended December 31, 2016
|
||||||||||||||||||||
|
Balance at beginning of period
|
$
|
541
|
|
$
|
4
|
|
$
|
46
|
|
$
|
1
|
|
$
|
592
|
|
|||||
|
Provision for finance receivable losses
|
909
|
|
14
|
|
9
|
|
—
|
|
932
|
|
||||||||||
|
Charge-offs
|
(846
|
)
|
(17
|
)
|
(11
|
)
|
(1
|
)
|
(875
|
)
|
||||||||||
|
Recoveries
|
65
|
|
3
|
|
5
|
|
1
|
|
74
|
|
||||||||||
|
Other (a)
|
—
|
|
(4
|
)
|
(30
|
)
|
—
|
|
(34
|
)
|
||||||||||
|
Balance at end of period
|
$
|
669
|
|
$
|
—
|
|
$
|
19
|
|
$
|
1
|
|
$
|
689
|
|
|||||
|
Year Ended December 31, 2015
|
||||||||||||||||||||
|
Balance at beginning of period
|
$
|
132
|
|
$
|
3
|
|
$
|
46
|
|
$
|
1
|
|
$
|
182
|
|
|||||
|
Provision for finance receivable losses
|
634
|
|
67
|
|
13
|
|
2
|
|
716
|
|
||||||||||
|
Charge-offs
|
(261
|
)
|
(78
|
)
|
(18
|
)
|
(3
|
)
|
(360
|
)
|
||||||||||
|
Recoveries
|
37
|
|
12
|
|
5
|
|
1
|
|
55
|
|
||||||||||
|
Other (b)
|
(1
|
)
|
—
|
|
—
|
|
—
|
|
(1
|
)
|
||||||||||
|
Balance at end of period
|
$
|
541
|
|
$
|
4
|
|
$
|
46
|
|
$
|
1
|
|
$
|
592
|
|
|||||
|
(a)
|
Other consists of:
|
105
|
•
|
the elimination of allowance for finance receivable losses due to the sale of the SpringCastle Portfolio on March 31, 2016, in connection with the sale of our equity interest in the SpringCastle Joint Venture; and
|
|
•
|
the elimination of allowance for finance receivable losses due to the transfers of real estate loans held for investment to finance receivable held for sale during 2016.
|
|
(b)
|
Other consists of the elimination of allowance for finance receivable losses due to the transfer of personal loans held for investment to finance receivable held for sale during 2015.
|
The allowance for finance receivable losses and net finance receivables by type and by impairment method were as follows:
|
(dollars in millions)
|
Personal
Loans
|
Real Estate
Loans
|
Retail
Sales Finance
|
Total
|
||||||||||||
|
December 31, 2017
|
||||||||||||||||
|
Allowance for finance receivable losses:
|
||||||||||||||||
|
Collectively evaluated for impairment
|
$
|
532
|
|
$
|
2
|
|
$
|
1
|
|
$
|
535
|
|
||||
|
Purchased credit impaired finance receivables
|
6
|
|
9
|
|
—
|
|
15
|
|
||||||||
|
TDR finance receivables
|
135
|
|
12
|
|
—
|
|
147
|
|
||||||||
|
Total
|
$
|
673
|
|
$
|
23
|
|
$
|
1
|
|
$
|
697
|
|
||||
|
Finance receivables:
|
||||||||||||||||
|
Collectively evaluated for impairment
|
$
|
14,323
|
|
$
|
57
|
|
$
|
6
|
|
$
|
14,386
|
|
||||
|
Purchased credit impaired finance receivables
|
182
|
|
22
|
|
—
|
|
204
|
|
||||||||
|
TDR finance receivables
|
318
|
|
49
|
|
—
|
|
367
|
|
||||||||
|
Total
|
$
|
14,823
|
|
$
|
128
|
|
$
|
6
|
|
$
|
14,957
|
|
||||
|
Allowance for finance receivable losses as a percentage of finance receivables
|
4.53
|
%
|
18.66
|
%
|
9.91
|
%
|
4.66
|
%
|
||||||||
|
December 31, 2016
|
||||||||||||||||
|
Allowance for finance receivable losses:
|
||||||||||||||||
|
Collectively evaluated for impairment
|
$
|
571
|
|
$
|
—
|
|
$
|
1
|
|
$
|
572
|
|
||||
|
Purchased credit impaired finance receivables
|
29
|
|
8
|
|
—
|
|
37
|
|
||||||||
|
TDR finance receivables
|
69
|
|
11
|
|
—
|
|
80
|
|
||||||||
|
Total
|
$
|
669
|
|
$
|
19
|
|
$
|
1
|
|
$
|
689
|
|
||||
|
Finance receivables:
|
||||||||||||||||
|
Collectively evaluated for impairment
|
$
|
13,072
|
|
$
|
76
|
|
$
|
11
|
|
$
|
13,159
|
|
||||
|
Purchased credit impaired finance receivables
|
353
|
|
24
|
|
—
|
|
377
|
|
||||||||
|
TDR finance receivables
|
152
|
|
44
|
|
—
|
|
196
|
|
||||||||
|
Total
|
$
|
13,577
|
|
$
|
144
|
|
$
|
11
|
|
$
|
13,732
|
|
||||
|
Allowance for finance receivable losses as a percentage of finance receivables
|
4.93
|
%
|
13.31
|
%
|
4.42
|
%
|
5.01
|
%
|
||||||||
See Note
3
for additional information on the determination of the allowance for finance receivable losses.
106
7
.
Finance Receivables Held for Sale
We report finance receivables held for sale of
$132 million
at
December 31, 2017
and
$153 million
at
December 31, 2016
, which are carried at the lower of cost or fair value and consist entirely of real estate loans. At
December 31, 2017
and
2016
, the fair value of our finance receivables held for sale exceeded the cost. We used the aggregate basis to determine the lower of cost or fair value of finance receivables held for sale.
See Note 3 for more information regarding our accounting policy for finance receivables held for sale.
SPRINGCASTLE PORTFOLIO
During March of 2016, we transferred $
1.6 billion
of loans of the SpringCastle Portfolio from held for investment to held for sale and simultaneously sold our interests in these finance receivables held for sale on March 31, 2016 in the SpringCastle Interests Sale and recorded a net gain in other revenues at the time of sale of $
167 million
.
PERSONAL LOANS
During 2015, we transferred $
608 million
of personal loans from held for investment to held for sale. On May 2, 2016, we sold personal loans held for sale with a carrying value of
$602 million
and recorded a net gain in other revenues at the time of sale of
$22 million
.
REAL ESTATE LOANS
On November 30, 2016, we transferred
$50 million
of real estate loans from held for investment to held for sale. In connection with the December 2016 Real Estate Loan Sale, we sold a portfolio of first and second lien mortgage loans with a carrying value of
$58 million
and recorded a net loss in other revenues of less than
$1 million
.
On June 30, 2016, we transferred
$257 million
of real estate loans from held for investment to held for sale. In connection with the August 2016 Real Estate Loan Sale, we sold a portfolio of second lien mortgage loans with a carrying value of
$250 million
and recorded a net loss in other revenues of
$4 million
.
We did not have any other material transfer activity to or from finance receivables held for sale during
2017
,
2016
or 2015.
107
8
.
Investment Securities
AVAILABLE-FOR-SALE SECURITIES
Cost/amortized cost, unrealized gains and losses, and fair value of available-for-sale securities by type were as follows:
|
(dollars in millions)
|
Cost/
Amortized Cost
|
Unrealized
Gains
|
Unrealized
Losses
|
Fair
Value
|
||||||||||||
|
December 31, 2017
|
||||||||||||||||
|
Fixed maturity available-for-sale securities:
|
||||||||||||||||
|
Bonds
|
||||||||||||||||
|
U.S. government and government sponsored entities
|
$
|
28
|
|
$
|
—
|
|
$
|
—
|
|
$
|
28
|
|
||||
|
Obligations of states, municipalities, and political subdivisions
|
135
|
|
—
|
|
—
|
|
135
|
|
||||||||
|
Certificates of deposit and commercial paper
|
60
|
|
—
|
|
—
|
|
60
|
|
||||||||
|
Non-U.S. government and government sponsored entities
|
126
|
|
—
|
|
(1
|
)
|
125
|
|
||||||||
|
Corporate debt
|
941
|
|
12
|
|
(5
|
)
|
948
|
|
||||||||
|
Mortgage-backed, asset-backed, and collateralized:
|
||||||||||||||||
|
RMBS
|
100
|
|
—
|
|
(1
|
)
|
99
|
|
||||||||
|
CMBS
|
88
|
|
—
|
|
(1
|
)
|
87
|
|
||||||||
|
CDO/ABS
|
96
|
|
—
|
|
—
|
|
96
|
|
||||||||
|
Total bonds
|
1,574
|
|
12
|
|
(8
|
)
|
1,578
|
|
||||||||
|
Preferred stock (a)
|
15
|
|
—
|
|
(1
|
)
|
14
|
|
||||||||
|
Common stock (a)
|
21
|
|
2
|
|
—
|
|
23
|
|
||||||||
|
Other long-term investments
|
1
|
|
—
|
|
—
|
|
1
|
|
||||||||
|
Total (b)
|
$
|
1,611
|
|
$
|
14
|
|
$
|
(9
|
)
|
$
|
1,616
|
|
||||
|
December 31, 2016
|
||||||||||||||||
|
Fixed maturity available-for-sale securities:
|
||||||||||||||||
|
Bonds
|
||||||||||||||||
|
U.S. government and government sponsored entities
|
$
|
31
|
|
$
|
—
|
|
$
|
—
|
|
$
|
31
|
|
||||
|
Obligations of states, municipalities, and political subdivisions
|
145
|
|
1
|
|
(1
|
)
|
145
|
|
||||||||
|
Non-U.S. government and government sponsored entities
|
119
|
|
—
|
|
(1
|
)
|
118
|
|
||||||||
|
Corporate debt
|
1,024
|
|
8
|
|
(7
|
)
|
1,025
|
|
||||||||
|
Mortgage-backed, asset-backed, and collateralized:
|
||||||||||||||||
|
RMBS
|
101
|
|
—
|
|
(1
|
)
|
100
|
|
||||||||
|
CMBS
|
109
|
|
—
|
|
(1
|
)
|
108
|
|
||||||||
|
CDO/ABS
|
102
|
|
—
|
|
—
|
|
102
|
|
||||||||
|
Total bonds
|
1,631
|
|
9
|
|
(11
|
)
|
1,629
|
|
||||||||
|
Preferred stock (a)
|
17
|
|
—
|
|
(1
|
)
|
16
|
|
||||||||
|
Common stock (a)
|
16
|
|
1
|
|
—
|
|
17
|
|
||||||||
|
Other long-term investments
|
2
|
|
—
|
|
—
|
|
2
|
|
||||||||
|
Total (b)
|
$
|
1,666
|
|
$
|
10
|
|
$
|
(12
|
)
|
$
|
1,664
|
|
||||
|
(a)
|
The Company employs an income equity strategy targeting investments in stocks with strong current dividend yields. Stocks included have a history of stable or increasing dividend payments.
|
|
(b)
|
Excludes an immaterial interest in a limited partnership that we account for using the equity method and FHLB common stock of
$1 million
at
December 31, 2017
and
2016
, which is classified as a restricted investment and carried at cost.
|
108
Fair value and unrealized losses on available-for-sale securities by type and length of time in a continuous unrealized loss position were as follows:
|
Less Than 12 Months
|
12 Months or Longer
|
Total
|
||||||||||||||||||||||
|
(dollars in millions)
|
Fair
Value
|
Unrealized
Losses *
|
Fair
Value
|
Unrealized
Losses *
|
Fair
Value
|
Unrealized
Losses
|
||||||||||||||||||
|
December 31, 2017
|
||||||||||||||||||||||||
|
Bonds:
|
||||||||||||||||||||||||
|
U.S. government and government sponsored entities
|
$
|
21
|
|
$
|
—
|
|
$
|
3
|
|
$
|
—
|
|
$
|
24
|
|
$
|
—
|
|
||||||
|
Obligations of states, municipalities, and political subdivisions
|
65
|
|
—
|
|
20
|
|
—
|
|
85
|
|
—
|
|
||||||||||||
|
Non-U.S. government and government sponsored entities
|
89
|
|
(1
|
)
|
13
|
|
—
|
|
102
|
|
(1
|
)
|
||||||||||||
|
Corporate debt
|
387
|
|
(3
|
)
|
93
|
|
(2
|
)
|
480
|
|
(5
|
)
|
||||||||||||
|
RMBS
|
40
|
|
—
|
|
25
|
|
(1
|
)
|
65
|
|
(1
|
)
|
||||||||||||
|
CMBS
|
40
|
|
—
|
|
38
|
|
(1
|
)
|
78
|
|
(1
|
)
|
||||||||||||
|
CDO/ABS
|
48
|
|
—
|
|
26
|
|
—
|
|
74
|
|
—
|
|
||||||||||||
|
Total bonds
|
690
|
|
(4
|
)
|
218
|
|
(4
|
)
|
908
|
|
(8
|
)
|
||||||||||||
|
Preferred stock
|
3
|
|
—
|
|
7
|
|
(1
|
)
|
10
|
|
(1
|
)
|
||||||||||||
|
Common stock
|
3
|
|
—
|
|
—
|
|
—
|
|
3
|
|
—
|
|
||||||||||||
|
Other long-term investments
|
1
|
|
—
|
|
—
|
|
—
|
|
1
|
|
—
|
|
||||||||||||
|
Total
|
$
|
697
|
|
$
|
(4
|
)
|
$
|
225
|
|
$
|
(5
|
)
|
$
|
922
|
|
$
|
(9
|
)
|
||||||
|
December 31, 2016
|
||||||||||||||||||||||||
|
Bonds:
|
||||||||||||||||||||||||
|
U.S. government and government sponsored entities
|
$
|
18
|
|
$
|
—
|
|
$
|
—
|
|
$
|
—
|
|
$
|
18
|
|
$
|
—
|
|
||||||
|
Obligations of states, municipalities, and political subdivisions
|
99
|
|
(1
|
)
|
2
|
|
—
|
|
101
|
|
(1
|
)
|
||||||||||||
|
Non-U.S. government and government sponsored entities
|
55
|
|
(1
|
)
|
1
|
|
—
|
|
56
|
|
(1
|
)
|
||||||||||||
|
Corporate debt
|
416
|
|
(6
|
)
|
8
|
|
(1
|
)
|
424
|
|
(7
|
)
|
||||||||||||
|
RMBS
|
74
|
|
(1
|
)
|
1
|
|
—
|
|
75
|
|
(1
|
)
|
||||||||||||
|
CMBS
|
66
|
|
(1
|
)
|
5
|
|
—
|
|
71
|
|
(1
|
)
|
||||||||||||
|
CDO/ABS
|
64
|
|
—
|
|
3
|
|
—
|
|
67
|
|
—
|
|
||||||||||||
|
Total bonds
|
792
|
|
(10
|
)
|
20
|
|
(1
|
)
|
812
|
|
(11
|
)
|
||||||||||||
|
Preferred stock
|
6
|
|
—
|
|
8
|
|
(1
|
)
|
14
|
|
(1
|
)
|
||||||||||||
|
Common stock
|
2
|
|
—
|
|
1
|
|
—
|
|
3
|
|
—
|
|
||||||||||||
|
Total
|
$
|
800
|
|
$
|
(10
|
)
|
$
|
29
|
|
$
|
(2
|
)
|
$
|
829
|
|
$
|
(12
|
)
|
||||||
|
*
|
Unrealized losses on certain available-for-sale securities were less than
$1 million
and, therefore, are not quantified in the table above.
|
On a lot basis, we had
1,369
and
1,331
investment securities in an unrealized loss position at
December 31, 2017
and
2016
, respectively. We do not consider the unrealized losses to be credit-related, as these unrealized losses primarily relate to changes in interest rates and market spreads subsequent to purchase. Additionally, at
December 31, 2017
, we had no plans to sell any investment securities with unrealized losses, and we believe it is more likely than not that we would not be required to sell such investment securities before recovery of their amortized cost.
We continue to monitor unrealized loss positions for potential impairments. During
2017
, we did
no
t recognize any other-than-temporary impairment credit losses on available-for-sale securities in investment revenues. During each of the
2016
and
2015
periods, other-than-temporary impairment credit losses were immaterial.
109
There were no material additions or reductions in the cumulative amount of credit losses (recognized in earnings) on other-than-temporarily impaired available-for-sale securities for the
2017
,
2016
and
2015
periods.
The proceeds of available-for-sale securities sold or redeemed and the resulting net realized gains were as follows:
|
(dollars in millions)
|
||||||||||||
|
Years Ended December 31,
|
2017
|
2016
|
2015
|
|||||||||
|
Proceeds from sales and redemptions
|
$
|
508
|
|
$
|
518
|
|
$
|
431
|
|
|||
|
Realized gains
|
$
|
15
|
|
$
|
16
|
|
$
|
15
|
|
|||
|
Realized losses
|
(1
|
)
|
(1
|
)
|
(1
|
)
|
||||||
|
Net realized gains
|
$
|
14
|
|
$
|
15
|
|
$
|
14
|
|
|||
Contractual maturities of fixed-maturity available-for-sale securities at
December 31, 2017
were as follows:
|
(dollars in millions)
|
Fair
Value
|
Amortized
Cost
|
||||||
|
Fixed maturities, excluding mortgage-backed, asset-backed, and collateralized securities:
|
||||||||
|
Due in 1 year or less
|
$
|
224
|
|
$
|
225
|
|
||
|
Due after 1 year through 5 years
|
530
|
|
531
|
|
||||
|
Due after 5 years through 10 years
|
335
|
|
334
|
|
||||
|
Due after 10 years
|
207
|
|
200
|
|
||||
|
Mortgage-backed, asset-backed, and collateralized securities
|
282
|
|
284
|
|
||||
|
Total
|
$
|
1,578
|
|
$
|
1,574
|
|
||
Actual maturities may differ from contractual maturities since issuers and borrowers may have the right to call or prepay obligations. We may sell investment securities before maturity for general corporate and working capital purposes and to achieve certain investment strategies.
The fair value of securities on deposit with third parties totaled
$537 million
and
$465 million
at
December 31, 2017
and
2016
, respectively.
TRADING AND OTHER SECURITIES
The fair value of other securities by type was as follows:
|
(dollars in millions)
|
||||||||
|
December 31,
|
2017
|
2016
|
||||||
|
Fixed maturity other securities:
|
||||||||
|
Bonds
|
||||||||
|
Non-U.S. government and government sponsored entities
|
$
|
1
|
|
$
|
1
|
|
||
|
Corporate debt
|
68
|
|
85
|
|
||||
|
Mortgage-backed, asset-backed, and collateralized:
|
||||||||
|
RMBS
|
1
|
|
1
|
|
||||
|
CMBS
|
—
|
|
1
|
|
||||
|
CDO/ABS
|
4
|
|
5
|
|
||||
|
Total bonds
|
74
|
|
93
|
|
||||
|
Preferred stock
|
6
|
|
6
|
|
||||
|
Total
|
$
|
80
|
|
$
|
99
|
|
||
110
The mark-to-market and net realized gains (losses) on our trading and other securities, which we report in investment revenues, were as follows:
|
(dollars in millions)
|
||||||||||||
|
Years Ended December 31,
|
2017
|
2016
|
2015
|
|||||||||
|
Mark-to-market gains (losses) on trading and other securities held at year end
|
$
|
(1
|
)
|
$
|
1
|
|
$
|
—
|
|
|||
|
Net realized gains (losses) on trading and other securities sold or redeemed during the year
|
—
|
|
7
|
|
(3
|
)
|
||||||
|
Total
|
$
|
(1
|
)
|
$
|
8
|
|
$
|
(3
|
)
|
|||
Other securities are those securities for which the fair value option was elected. Our remaining trading securities were sold in the first quarter of 2016.
9
.
Goodwill and Other Intangible Assets
GOODWILL
Changes in the carrying amount of goodwill, all of which is reported in our Consumer and Insurance segment, were as follows:
|
(dollars in millions)
|
||||||||
|
Years Ended December 31,
|
2017
|
2016
|
||||||
|
Balance at beginning of period
|
$
|
1,422
|
|
$
|
1,440
|
|
||
|
Adjustments to purchase price allocation*
|
—
|
|
(18
|
)
|
||||
|
Balance at end of period
|
$
|
1,422
|
|
$
|
1,422
|
|
||
|
*
|
See Note 2 for details regarding this transaction.
|
Goodwill was recorded at the OMFH subsidiary level. We did not record any impairments to goodwill during
2017
and
2016
.
111
OTHER INTANGIBLE ASSETS
The gross carrying amount and accumulated amortization, in total and by major intangible asset class were as follows:
|
(dollars in millions)
|
Gross Carrying Amount
|
Accumulated Amortization
|
Net Other Intangible Assets
|
|||||||||
|
December 31, 2017
|
||||||||||||
|
Customer relationships
|
$
|
223
|
|
$
|
(92
|
)
|
$
|
131
|
|
|||
|
Trade names
|
220
|
|
—
|
|
220
|
|
||||||
|
VOBA
|
141
|
|
(90
|
)
|
51
|
|
||||||
|
Licenses
|
37
|
|
—
|
|
37
|
|
||||||
|
Other
|
13
|
|
(12
|
)
|
1
|
|
||||||
|
Total
|
$
|
634
|
|
$
|
(194
|
)
|
$
|
440
|
|
|||
|
December 31, 2016
|
||||||||||||
|
Customer relationships
|
$
|
223
|
|
$
|
(58
|
)
|
$
|
165
|
|
|||
|
Trade names
|
220
|
|
—
|
|
220
|
|
||||||
|
VOBA
|
141
|
|
(74
|
)
|
67
|
|
||||||
|
Licenses
|
37
|
|
—
|
|
37
|
|
||||||
|
Other
|
13
|
|
(10
|
)
|
3
|
|
||||||
|
Total
|
$
|
634
|
|
$
|
(142
|
)
|
$
|
492
|
|
|||
Amortization expense totaled
$52 million
in
2017
,
$70 million
in
2016
, and
$16 million
in
2015
. The estimated aggregate amortization of other intangible assets for each of the next five years is reflected in the table below.
|
(dollars in millions)
|
Estimated Aggregate Amortization Expense
|
|||
|
2018
|
$
|
42
|
|
|
|
2019
|
39
|
|
||
|
2020
|
38
|
|
||
|
2021
|
32
|
|
||
|
2022
|
3
|
|
||
112
10
.
Other Assets
Components of other assets were as follows:
|
(dollars in millions)
|
||||||||
|
December 31,
|
2017
|
2016
|
||||||
|
Deferred tax assets
|
$
|
146
|
|
$
|
180
|
|
||
|
Fixed assets, net *
|
144
|
|
167
|
|
||||
|
Prepaid expenses and deferred charges
|
109
|
|
97
|
|
||||
|
Ceded insurance reserves
|
95
|
|
102
|
|
||||
|
Other investments
|
29
|
|
52
|
|
||||
|
Current tax receivable
|
15
|
|
43
|
|
||||
|
Cost basis investments
|
11
|
|
11
|
|
||||
|
Other
|
38
|
|
36
|
|
||||
|
Total
|
$
|
587
|
|
$
|
688
|
|
||
|
*
|
Fixed assets were net of accumulated depreciation of
$202 million
at
December 31, 2017
and
$268 million
at
December 31, 2016
.
|
11
.
Transactions with Affiliates
SUBSERVICING AGREEMENT
Nationstar subservices the real estate loans of certain of our indirect subsidiaries. Investment funds managed by affiliates of Fortress indirectly own a majority interest in Nationstar. The subservicing fees paid to Nationstar were immaterial in
2017
,
2016
, and
2015
.
INVESTMENT MANAGEMENT AGREEMENT
Logan Circle provides investment management services for Springleaf investments. Logan Circle was a wholly owned subsidiary of Fortress. On September 15, 2017, Fortress sold its interest in Logan Circle to MetLife and Logan Circle is no longer an affiliate of Fortress. Costs and fees incurred for these investment management services were immaterial in
2017
,
2016
, and
2015
.
SALE OF EQUITY INTEREST IN SPRINGCASTLE JOINT VENTURE
On March 31, 2016, we sold our
47%
equity interest in the SpringCastle Joint Venture, which owns the SpringCastle Portfolio, to certain subsidiaries of NRZ and Blackstone. NRZ is managed by an affiliate of Fortress.
Unless we are terminated, we will continue to act as the servicer of the SpringCastle Portfolio for the SpringCastle Funding Trust pursuant to a servicing agreement. Servicing fees revenue totaled
$37 million
in
2017
and
$32 million
in 2016. At
December 31, 2017
and 2016, servicing fees receivable from the SpringCastle Funding Trust totaled
$3 million
.
See Note 2 for more information regarding this transaction.
113
12
.
Long-term Debt
Carrying value and fair value of long-term debt by type were as follows:
|
December 31, 2017
|
December 31, 2016
|
|||||||||||||||
|
(dollars in millions)
|
Carrying
Value
|
Fair
Value
|
Carrying
Value
|
Fair
Value
|
||||||||||||
|
Senior debt
|
$
|
14,878
|
|
$
|
15,436
|
|
$
|
13,787
|
|
$
|
14,340
|
|
||||
|
Junior subordinated debt
|
172
|
|
189
|
|
172
|
|
158
|
|
||||||||
|
Total
|
$
|
15,050
|
|
$
|
15,625
|
|
$
|
13,959
|
|
$
|
14,498
|
|
||||
Weighted average effective interest rates on long-term debt by type were as follows:
|
Years Ended December 31,
|
At December 31,
|
||||||||||||||
|
2017
|
2016
|
2015
|
2017
|
2016
|
|||||||||||
|
Senior debt
|
5.73
|
%
|
5.60
|
%
|
6.56
|
%
|
5.56
|
%
|
5.80
|
%
|
|||||
|
Junior subordinated debt
|
6.41
|
|
12.26
|
|
12.26
|
|
6.37
|
|
12.26
|
|
|||||
|
Total
|
5.74
|
|
5.67
|
|
6.65
|
|
5.57
|
|
5.88
|
|
|||||
Principal maturities of long-term debt (excluding projected repayments on securitizations and revolving conduit facilities by period) by type of debt at
December 31, 2017
were as follows:
|
Senior Debt
|
||||||||||||||||
|
(dollars in millions)
|
Securitizations
|
Medium
Term
Notes
|
Junior
Subordinated
Debt
|
Total
|
||||||||||||
|
Interest rates (a)
|
2.04% - 6.94%
|
|
5.25% - 8.25%
|
|
3.11%
|
|
||||||||||
|
2018
|
—
|
|
700
|
|
—
|
|
700
|
|
||||||||
|
2019
|
—
|
|
696
|
|
—
|
|
696
|
|
||||||||
|
2020
|
—
|
|
1,299
|
|
—
|
|
1,299
|
|
||||||||
|
2021
|
—
|
|
1,446
|
|
—
|
|
1,446
|
|
||||||||
|
2022
|
—
|
|
1,000
|
|
—
|
|
1,000
|
|
||||||||
|
2023-2067
|
—
|
|
1,175
|
|
350
|
|
1,525
|
|
||||||||
|
Securitizations (b)
|
8,711
|
|
—
|
|
—
|
|
8,711
|
|
||||||||
|
Total principal maturities
|
$
|
8,711
|
|
$
|
6,316
|
|
$
|
350
|
|
$
|
15,377
|
|
||||
|
Total carrying amount
|
$
|
8,688
|
|
$
|
6,190
|
|
$
|
172
|
|
$
|
15,050
|
|
||||
|
Debt issuance costs (c)
|
$
|
(24
|
)
|
$
|
(30
|
)
|
$
|
—
|
|
$
|
(54
|
)
|
||||
|
(a)
|
The interest rates shown are the range of contractual rates in effect at
December 31, 2017
. Effective January 16, 2017, the interest rate on the UPB of the Junior Subordinated Debenture became a variable floating rate (determined quarterly) equal to 3-month LIBOR plus
1.75%
, or
3.11%
as of
December 31, 2017
. Prior to January 16, 2017, the interest rate on the UPB of the Junior Subordinated Debenture was a fixed rate of
6.00%
.
|
|
(b)
|
Securitizations have a stated maturity date but are not included in the above maturities by period due to their variable monthly repayments, which may result in pay-off prior to the stated maturity date. At
December 31, 2017
, there were
no
amounts drawn under our revolving conduit facilities. See Note
13
for further information on our long-term debt associated with securitizations and revolving conduit facilities.
|
|
(c)
|
Debt issuance costs are reported as a direct deduction from long-term debt, with the exception of debt issuance costs associated with our revolving conduit facilities, which totaled
$20 million
at
December 31, 2017
and are reported in other assets.
|
114
SFC’s Medium-Term Note Issuances
5.625%
Senior Notes Due 2023
On December 8, 2017, SFC issued
$875 million
aggregate principal amount of
5.625%
Senior Notes due 2023 (the “
5.625%
SFC Notes”) under an Indenture dated as of December 3, 2014 (the “SFC Base Indenture”), as supplemented by a Fourth Supplemental Indenture dated as of December 8, 2017 (the “SFC Fourth Supplemental Indenture”), pursuant to which OMH provided a guarantee of the
5.625%
SFC Notes on an unsecured basis.
SFC used a portion of the net proceeds from the sale of the
5.625%
SFC Notes to repay at maturity approximately
$557 million
aggregate principal amount of its existing
6.90%
Medium-Term Notes. SFC intends to use the remaining net proceeds from the sale of the
5.625%
SFC Notes for general corporate purposes, which may include additional debt repurchases and repayments.
6.125%
Senior Notes Due 2022
On May 15, 2017, SFC issued
$500 million
aggregate principal amount of
6.125%
Senior Notes due 2022 (the “2022 SFC Notes”) under the SFC Base Indenture, as supplemented by a Third Supplemental Indenture, dated as of May 15, 2017 (the “SFC Third Supplemental Indenture”), pursuant to which OMH provided a guarantee of the 2022 SFC Notes on an unsecured basis.
On May 30, 2017, SFC issued and sold
$500 million
aggregate principal amount of additional 2022 SFC Notes (the “Additional SFC Notes”) in an add-on offering. The initial 2022 SFC Notes and the Additional SFC Notes (collectively, the “
6.125%
SFC Notes”), are treated as a single class of debt securities and have the same terms, other than the issue date and the issue price.
SFC used a portion of the net proceeds from the sale of the Additional SFC Notes to repurchase approximately
$466 million
aggregate principal amount of its existing
6.90%
Senior Notes due 2017 at a premium to par. SFC used the remaining net proceeds from the sale of the
6.125%
SFC Notes for general corporate purposes.
8.25%
Senior Notes Due 2020
On April 11, 2016, SFC issued
$1.0 billion
aggregate principal amount of
8.25%
Senior Notes due 2020 (the “
8.25%
SFC Notes”) under the SFC Base Indenture, as supplemented by a Second Supplemental Indenture, dated as of April 11, 2016 (the “SFC Second Supplemental Indenture” and, collectively with the SFC Base Indenture and the SFC First Supplemental Indenture, the SFC Third Supplemental Indenture, and the SFC Fourth Supplemental Indenture thereto, the “Indenture”), pursuant to which OMH provided a guarantee of the
8.25%
SFC notes on an unsecured basis.
SFC used a portion of the proceeds from the sale of the
8.25%
SFC Notes to repurchase approximately
$600 million
aggregate principal amount of its existing senior notes that were scheduled to mature in 2017, at a premium to principal amount from certain beneficial owners, and certain of those beneficial owners purchased new
8.25%
SFC Notes in the offering. SFC used the remaining net proceeds for general corporate purposes.
The
5.625%
SFC Notes,
6.125%
SFC Notes and
8.25%
SFC Notes are SFC’s senior unsecured obligations and rank equally in right of payment to all of SFC’s other existing and future unsubordinated indebtedness from time to time outstanding. The notes are effectively subordinated to all of SFC’s secured obligations to the extent of the value of the assets securing such obligations and structurally subordinated to any existing and future obligations of SFC’s subsidiaries with respect to claims against the assets of such subsidiaries.
The notes may be redeemed at any time and from time to time, at the option of SFC, in whole or in part at a “make-whole” redemption price specified in the Indenture. The notes will not have the benefit of any sinking fund.
The Indenture contain covenants that, among other things, (i) limit SFC’s ability to create liens on assets and (ii) restrict SFC’s ability to consolidate, merge or sell its assets. The Indenture also provides for events of default which, if any of them were to occur, would permit or require the principal of and accrued interest on the SFC Notes to become, or to be declared, due and payable.
115
GUARANTY AGREEMENTS
5.625%
SFC Notes
On December 8, 2017, OMH entered into the SFC Fourth Supplemental Indenture, pursuant to which it agreed to fully and unconditionally guarantee, on a senior unsecured basis, the payments of principal, premium (if any) and interest on the
5.625%
SFC Notes. As of
December 31, 2017
,
$875 million
aggregate principal amount of the
5.625%
SFC Notes were outstanding.
6.125%
SFC Notes
On May 15, 2017, OMH entered into the SFC Third Supplemental Indenture, pursuant to which it agreed to fully and unconditionally guarantee, on a senior unsecured basis, the payments of principal, premium (if any) and interest on the
6.125%
SFC Notes. As of
December 31, 2017
,
$1.0 billion
aggregate principal amount of the
6.125%
SFC Notes were outstanding.
8.25%
SFC Notes
On April 11, 2016, OMH entered into the SFC Second Supplemental Indenture, pursuant to which it agreed to fully and unconditionally guarantee, on a senior unsecured basis, the payments of principal, premium (if any) and interest on the
8.25%
SFC Notes. As of
December 31, 2017
,
$1.0 billion
aggregate principal amount of the
8.25%
SFC Notes were outstanding.
5.25%
SFC Notes
On December 3, 2014, OMH entered into the SFC Base Indenture and the SFC First Supplemental Indenture, pursuant to which it agreed to fully and unconditionally guarantee, on a senior unsecured basis, the payments of principal, premium (if any) and interest on the
5.25%
SFC Notes. As of
December 31, 2017
,
$700 million
aggregate principal amount of the
5.25%
SFC Notes were outstanding.
Other SFC Notes
On December 30, 2013, OMH entered into SFC Guaranty Agreements whereby it agreed to fully and unconditionally guarantee the payments of principal, premium (if any) and interest on the Other SFC Notes. The Other SFC Notes consist of the following:
|
•
|
8.25%
Senior Notes due 2023;
|
|
•
|
7.75%
Senior Notes due 2021;
|
|
•
|
6.00%
Senior Notes due 2020; and
|
|
•
|
the Junior Subordinated Debenture
|
The Junior Subordinated Debenture underlies the trust preferred securities sold by a trust sponsored by SFC. On December 30, 2013, OMH entered into the SFC Trust Guaranty Agreement whereby it agreed to fully and unconditionally guarantee the related payment obligations under the trust preferred securities. As of
December 31, 2017
, approximately
$1.6 billion
aggregate principal amount of the Other SFC Notes were outstanding.
The OMH guarantees of SFC’s long-term debt discussed above are subject to customary release provisions.
OMFH
6.75%
Notes and
7.25%
Notes Indenture
On December 11, 2014, OMFH and certain of its subsidiaries entered into the OMFH Indenture, among OMFH, the guarantors listed therein and The Bank of New York Mellon, as trustee, in connection with OMFH’s issuance of the OMFH Notes. The OMFH Notes are OMFH’s unsecured senior obligations, guaranteed on a senior unsecured basis by each of its wholly owned domestic subsidiaries, other than certain subsidiaries, including its insurance subsidiaries and securitization subsidiaries. As of
December 31, 2017
,
$1.5 billion
aggregate principal amount of the OMFH Notes were outstanding.
On November 8, 2016, OMH entered into the OMFH Second Supplemental Indenture, pursuant to which OMH agreed to fully, unconditionally and irrevocably guarantee the outstanding OMFH Notes in accordance with and subject to the terms of the OMFH Indenture. Further, as permitted by the terms of the OMFH Indenture, OMFH intends to satisfy its reporting obligations
116
under the OMFH Indenture with respect to providing OMFH financial information to the holders of the OMFH Notes by furnishing financial information relating to the Company.
On December 8, 2017 OMFH provided notice to note holders to redeem all
$700 million
outstanding principal amount of the 2019 OMFH Notes on January 8, 2018, at a redemption price equal to
103.375%
, plus accrued and unpaid interest to the redemption date. See Note 24 for more detail on this redemption.
The OMH guarantees of OMFH’s long-term debt discussed above are subject to customary release provisions.
DEBT COVENANTS
SFC Debt Agreements
The debt agreements to which SFC and its subsidiaries are a party include customary terms and conditions, including covenants and representations and warranties. Some or all of these agreements also contain certain restrictions, including (i) restrictions on the ability to create senior liens on property and assets in connection with any new debt financings and (ii) SFC’s ability to sell or convey all or substantially all of its assets, unless the transferee assumes SFC’s obligations under the applicable debt agreement. In addition, the OMH guarantees of SFC’s long-term debt discussed above are subject to customary release provisions.
With the exception of SFC’s junior subordinated debenture,
none
of our debt agreements require SFC or any of its subsidiaries to meet or maintain any specific financial targets or ratios. However, certain events, including non-payment of principal or interest, bankruptcy or insolvency, or a breach of a covenant or a representation or warranty, may constitute an event of default and trigger an acceleration of payments. In some cases, an event of default or acceleration of payments under one debt agreement may constitute a cross-default under other debt agreements resulting in an acceleration of payments under the other agreements.
As of
December 31, 2017
, SFC was in compliance with all of the covenants under its debt agreements.
Junior Subordinated Debenture
In January of 2007, SFC issued the Junior Subordinated Debenture, consisting of
$350 million
aggregate principal amount of
60
-year junior subordinated debt. The Junior Subordinated Debenture underlies the trust preferred securities sold by a trust sponsored by SFC. SFC can redeem the Junior Subordinated Debenture at par beginning in January of 2017. Effective January 16, 2017, the interest rate on the UPB of the Junior Subordinated Debenture became a variable floating rate (determined quarterly) equal to 3-month LIBOR plus
1.75%
, or
3.11%
as of
December 31, 2017
. Prior to January 16, 2017, the interest rate on the UPB of the Junior Subordinated Debenture was a fixed rate of
6.00%
.
Pursuant to the terms of the Junior Subordinated Debenture, SFC, upon the occurrence of a mandatory trigger event, is required to defer interest payments to the holders of the Junior Subordinated Debenture (and not make dividend payments to SFI) unless SFC obtains non-debt capital funding in an amount equal to all accrued and unpaid interest on the Junior Subordinated Debenture otherwise payable on the next interest payment date and pays such amount to the holders of the Junior Subordinated Debenture. A mandatory trigger event occurs if SFC’s (i) tangible equity to tangible managed assets is less than
5.5%
or (ii) average fixed charge ratio is not more than
1.10
x for the trailing four quarters.
Based upon SFC’s financial results for the 12 months ended December 31, 2017, a mandatory trigger event did not occur with respect to the interest payment due in January of 2018, as SFC was in compliance with both required ratios discussed above.
117
OMFH Debt Agreements
None of OMFH’s debt agreements require OMFH or any of its subsidiaries to meet or maintain any specific financial targets or ratios. However, the OMFH Indenture does contain a number of covenants that limit, among other things, OMFH’s ability and the ability of most of its subsidiaries to incur additional debt; create liens securing certain debt; pay dividends on or make distributions in respect of its capital stock or make investments or other restricted payments; create restrictions on the ability of its restricted subsidiaries to pay dividends to OMFH or make certain other intercompany transfers; sell certain assets; consolidate, merge, sell or otherwise dispose of all or substantially all of its assets; and enter into certain transactions with affiliates. The OMFH Indenture also contains customary events of default which would permit the trustee or the holders of the OMFH Notes to declare the OMFH Notes to be immediately due and payable if not cured within applicable grace periods, including the nonpayment of principal, interest or premium, if any, when due; violation of covenants and other agreements contained in the OMFH Indenture; payment default after final maturity or cross acceleration of certain material debt; certain bankruptcy and insolvency events; material judgment defaults; and the failure of any guarantee of the notes, other than in accordance with the terms of the OMFH Indenture or such guarantee. On November 8, 2016, OMH agreed to fully, unconditionally, and irrevocably guarantee the OMFH Notes.
As of
December 31, 2017
, OMFH was in compliance with all of the covenants under its debt agreements.
13
.
Variable Interest Entities
CONSOLIDATED VIES
As part of our overall funding strategy and as part of our efforts to support our liquidity from sources other than our traditional capital market sources, we have transferred certain finance receivables to VIEs for asset-backed financing transactions, including securitization and conduit transactions. We have determined that SFC or OMFH is the primary beneficiary of these VIEs and, as a result, we include each VIE’s assets, including any finance receivables securing the VIE’s debt obligations, and related liabilities in our consolidated financial statements and each VIE’s asset-backed debt obligations are accounted for as secured borrowings. SFC or OMFH is deemed to be the primary beneficiary of each VIE because SFC or OMFH, as applicable, has the ability to direct the activities of the VIE that most significantly impact its economic performance, including the losses it absorbs and its right to receive economic benefits that are potentially significant. Such ability arises from SFC’s or OMFH’s and their affiliates’ contractual right to service the finance receivables securing the VIEs’ debt obligations. To the extent we retain any debt obligation or residual interest in an asset-backed financing facility, we are exposed to potentially significant losses and potentially significant returns.
The asset-backed debt obligations issued by the VIEs are supported by the expected cash flows from the underlying finance receivables securing such debt obligations. Cash inflows from these finance receivables are distributed to repay the debt obligations and related service providers in accordance with each transaction’s contractual priority of payments, referred to as the “waterfall.” The holders of the asset-backed debt obligations have no recourse to the Company if the cash flows from the underlying finance receivables securing such debt obligations are not sufficient to pay all principal and interest on the asset-backed debt obligations. With respect to any asset-backed financing transaction that has multiple classes of debt obligations, substantially all cash inflows will be directed to the senior debt obligations until fully repaid and, thereafter, to the subordinate debt obligations on a sequential basis. We retain an interest and credit risk in these financing transactions through our ownership of the residual interest in each VIE and, in some cases, the most subordinate class of debt obligations issued by the VIE, which are the first to absorb credit losses on the finance receivables securing the debt obligations. In addition, with respect to each financing transaction that is subject to the risk retention requirements of Section 941 of the Dodd-Frank Act, we retain at least
5%
of the balance of each class of debt obligations and at least
5%
of the residual interest in each VIE which, collectively, represents
5%
of the economic interest in the credit risk of the securitized assets in satisfaction of the risk retention requirements. We expect that any credit losses in the pools of finance receivables securing the asset-backed debt obligations will likely be limited to our retained interests described above. We have no obligation to repurchase or replace qualified finance receivables that subsequently become delinquent or are otherwise in default.
118
We parenthetically disclose on our consolidated balance sheets the VIE’s assets that can only be used to settle the VIE’s obligations and liabilities if its creditors have no recourse against the primary beneficiary’s general credit. The carrying amounts of consolidated VIE assets and liabilities associated with our securitization trusts were as follows:
|
(dollars in millions)
|
||||||||
|
December 31,
|
2017
|
2016
|
||||||
|
Assets
|
||||||||
|
Cash and cash equivalents
|
$
|
4
|
|
$
|
3
|
|
||
|
Finance receivables:
|
||||||||
|
Personal loans
|
9,769
|
|
9,509
|
|
||||
|
Allowance for finance receivable losses
|
465
|
|
501
|
|
||||
|
Restricted cash and restricted cash equivalents
|
482
|
|
552
|
|
||||
|
Other assets
|
20
|
|
14
|
|
||||
|
Liabilities
|
||||||||
|
Long-term debt
|
$
|
8,688
|
|
$
|
8,240
|
|
||
|
Other liabilities
|
15
|
|
16
|
|
||||
SECURITIZED BORROWINGS
Each of our securitizations contains a revolving period ranging from
one
to
five
years during which no principal payments are required to be made on the related asset-backed notes, except for the ODART 2016-1 securitization which has no revolving period. The indentures governing our securitization borrowings contain early amortization events and events of default, that, if triggered, may result in the acceleration of the obligation to pay principal and interest on the related asset-backed notes.
Our securitized borrowings at
December 31, 2017
consisted of the following:
|
(dollars in millions)
|
Issue Amount *
|
Current
Note Amounts Outstanding * |
Current
Weighted Average
Interest Rate
|
Original
Revolving
Period
|
Issue Date
|
Maturity Date
|
||||||||||||
|
Consumer Securitizations:
|
||||||||||||||||||
|
SLFT 2015-A
|
$
|
1,163
|
|
$
|
1,163
|
|
3.47
|
%
|
3 years
|
|
02/26/2015
|
11/2024
|
||||||
|
SLFT 2015-B
|
314
|
|
314
|
|
3.78
|
%
|
5 years
|
|
04/07/2015
|
05/2028
|
||||||||
|
SLFT 2016-A (a)
|
532
|
|
500
|
|
3.10
|
%
|
2 years
|
|
12/14/2016
|
11/2029
|
||||||||
|
SLFT 2017-A (b)
|
652
|
|
619
|
|
2.98
|
%
|
3 years
|
|
06/28/2017
|
07/2030
|
||||||||
|
OMFIT 2014-2
|
1,185
|
|
320
|
|
4.16
|
%
|
2 years
|
|
07/30/2014
|
09/2024
|
||||||||
|
OMFIT 2015-1
|
1,229
|
|
1,229
|
|
3.74
|
%
|
3 years
|
|
02/05/2015
|
03/2026
|
||||||||
|
OMFIT 2015-2
|
1,250
|
|
750
|
|
3.40
|
%
|
2 years
|
|
05/21/2015
|
07/2025
|
||||||||
|
OMFIT 2015-3
|
293
|
|
293
|
|
4.21
|
%
|
5 years
|
|
09/29/2015
|
11/2028
|
||||||||
|
OMFIT 2016-1 (c)
|
500
|
|
459
|
|
4.01
|
%
|
3 years
|
|
02/10/2016
|
02/2029
|
||||||||
|
OMFIT 2016-2 (d)
|
890
|
|
816
|
|
4.50
|
%
|
2 years
|
|
03/23/2016
|
03/2028
|
||||||||
|
OMFIT 2016-3 (e)
|
350
|
|
317
|
|
4.33
|
%
|
5 years
|
|
06/07/2016
|
06/2031
|
||||||||
|
OMFIT 2017-1 (f)
|
947
|
|
900
|
|
2.66
|
%
|
2 years
|
|
09/06/2017
|
09/2032
|
||||||||
|
Total consumer securitizations
|
7,680
|
|
||||||||||||||||
|
Auto Securitization:
|
||||||||||||||||||
|
ODART 2016-1 (g)
|
754
|
|
188
|
|
2.91
|
%
|
—
|
|
07/19/2016
|
Various
|
||||||||
|
ODART 2017-1 (h)
|
300
|
|
268
|
|
2.61
|
%
|
1 year
|
|
02/01/2017
|
Various
|
||||||||
|
ODART 2017-2 (i)
|
605
|
|
575
|
|
2.63
|
%
|
1 year
|
|
12/11/2017
|
Various
|
||||||||
|
Total auto securitizations
|
1,031
|
|
||||||||||||||||
|
Total secured structured financings
|
$
|
8,711
|
|
|||||||||||||||
119
|
*
|
Issue Amount includes the retained interest amounts as detailed below while the Current Note Amounts Outstanding balances include pay-downs subsequent to note issuance and exclude retained interest amounts.
|
|
(a)
|
SLFT 2016-A Securitization.
We initially retained
$32 million
of the asset-backed notes.
|
|
(b)
|
SLFT 2017-A Securitization.
We initially retained
$26 million
of the Class A notes,
$2 million
of the Class B notes,
$2 million
of the Class C notes and
$3 million
of the Class D notes.
|
|
(c)
|
OMFIT 2016-1 Securitization.
We initially retained
$86 million
of the Class C and Class D notes. On May 17, 2016,
$45 million
of the notes represented by Class C were sold.
|
|
(d)
|
OMFIT 2016-2 Securitization.
We initially retained
$157 million
of the Class C and Class D notes. On July 25, 2016,
$83 million
of the notes represented by Class C were sold.
|
|
(e)
|
OMFIT 2016-3 Securitization.
We initially retained
$33 million
of the Class D notes.
|
|
(f)
|
OMFIT 2017-1 Securitization.
We initially retained
$30 million
of the Class A-1 notes,
$6 million
of the Class A-2 notes,
$3 million
of the Class B notes,
$3 million
of the Class C notes and
$5 million
of the Class D notes.
|
|
(g)
|
ODART 2016-1 Securitization.
The maturity dates of the notes occur in January 2021 for the Class A notes, May 2021 for the Class B notes, September 2021 for the Class C notes and February 2023 for the Class D notes. We initially retained
$54 million
of the Class D notes.
|
|
(h)
|
ODART 2017-1 Securitization.
The maturity dates of the notes occur in October 2020 for the Class A notes, June 2021 for the Class B notes, August 2021 for the Class C notes, December 2021 for the Class D notes, and January 2025 for the Class E notes. We initially retained
$11 million
of the Class A notes,
$1 million
of each of the Class B, Class C, and Class D notes, and the entire
$18 million
of the Class E notes.
|
|
(i)
|
ODART 2017-2 Securitization.
The maturity dates of the notes occur in December 2021 for the Class A notes, November 2023 for the Class B notes, July 2024 for the Class C notes, October 2024 for the Class D notes, and November 2025 for the Class E notes. We initially retained
$19 million
of the Class A notes,
$4 million
of the Class B notes,
$3 million
of the Class C notes,
$2 million
of the Class D notes and
$2 million
of the Class E notes.
|
Call of 2014-A Notes.
On February 15, 2017, we exercised our right to redeem the 2014-A Notes for a redemption price of
$188 million
, which excluded
$33 million
for the Class D Notes owned by Twenty First Street, a wholly owned subsidiary of SFC, on February 15, 2017, the date of the optional redemption. The outstanding principal balance of the asset-backed notes was
$221 million
on the date of the optional redemption.
Call of 2014-1 Notes.
On November 20, 2017, we exercised our right to redeem the 2014-1 Notes for a redemption price of $
81 million
. The outstanding principal balance of the asset-backed notes was $
81 million
on the date of the optional redemption.
REVOLVING CONDUIT FACILITIES
As of
December 31, 2017
, our borrowings under conduit facilities consisted of the following:
|
(dollar in millions)
|
Note Maximum
Balance |
Amount
Drawn
|
Revolving
Period End
|
Backed by Loans Acquired from Subsidiaries of
|
Due and Payable (a)
|
|||||||||
|
First Avenue Funding, LLC
|
$
|
250
|
|
$
|
—
|
|
June 2018
|
SFC - auto loans
|
(b)
|
|||||
|
Seine River Funding, LLC
|
500
|
|
—
|
|
December 2019
|
SFC - personal loans
|
December 2022
|
|||||||
|
OneMain Financial B6 Warehouse Trust
|
600
|
|
—
|
|
February 2019
|
OMFH - personal loans
|
February 2021
|
|||||||
|
Rocky River Funding, LLC
|
250
|
|
—
|
|
September 2019
|
OMFH - personal loans
|
October 2020
|
|||||||
|
OneMain Financial Funding VII, LLC
|
650
|
|
—
|
|
October 2019
|
OMFH - personal loans
|
November 2021
|
|||||||
|
Thur River Funding, LLC
|
350
|
|
—
|
|
June 2020
|
SFC - personal loans
|
February 2027
|
|||||||
|
OneMain Financial Funding IX, LLC
|
600
|
|
—
|
|
June 2020
|
OMFH - personal loans
|
July 2021
|
|||||||
|
Mystic River Funding, LLC
|
850
|
|
—
|
|
September 2020
|
SFC - personal loans
|
October 2023
|
|||||||
|
Fourth Avenue Auto Funding, LLC
|
250
|
|
—
|
|
September 2020
|
SFC - auto loans
|
October 2021
|
|||||||
|
OneMain Financial Auto Funding I, LLC
|
750
|
|
—
|
|
October 2020
|
OMFH - auto loans
|
November 2027
|
|||||||
|
Total
|
$
|
5,050
|
|
$
|
—
|
|
||||||||
|
(a)
|
The date following the revolving period that the principal balance of the outstanding loans, if any, will be reduced as cash payments are received on the underlying loans and will be due and payable in full.
|
120
|
(b)
|
For First Avenue Funding, LLC, principal amount of the notes, if any, will be reduced as cash payments are received on the underlying direct auto loans and will be due and payable in full 12 months following the maturity of the last direct auto loan held by First Avenue Funding, LLC.
|
During the 2017 period, we voluntarily terminated the following conduit facilities concurrently with the execution of certain conduit facilities set forth in the table above:
|
Termination Date
|
||
|
Midbrook 2013-VFN1 Trust
|
04/13/2017
|
|
|
OneMain Financial B5 Warehouse Trust
|
04/13/2017
|
|
|
Sumner Brook 2013-VFN1 Trust
|
06/29/2017
|
|
|
Whitford Brook 2014-VFN1 Trust
|
07/14/2017
|
|
|
OneMain Financial B3 Warehouse Trust
|
07/14/2017
|
|
|
Springleaf 2013-VFN1 Trust
|
09/28/2017
|
|
|
Second Avenue Funding LLC
|
09/29/2017
|
|
|
OneMain Financial B4 Warehouse Trust
|
11/08/2017
|
|
VIE INTEREST EXPENSE
Other than our retained interest in certain debt obligations issued by VIEs and residual interests in the remaining consolidated VIEs, we are under no obligation, either contractually or implicitly, to provide financial support to these entities. Consolidated interest expense related to our VIEs totaled
$323 million
in
2017
,
$341 million
in
2016
, and
$216 million
in
2015
.
DECONSOLIDATED VIES
As a result of the SpringCastle Interests Sale on March 31, 2016, we deconsolidated the securitization trust holding the underlying loans of the SpringCastle Portfolio and previously issued securitized interests, which were reported in long-term debt.
121
14
.
Insurance
INSURANCE RESERVES
Components of unearned insurance premium reserves, claim reserves and benefit reserves were as follows:
|
(dollars in millions)
|
||||||||
|
December 31,
|
2017
|
2016
|
||||||
|
Finance receivable related:
|
||||||||
|
Payable to OMH:
|
||||||||
|
Unearned premium reserves
|
$
|
515
|
|
$
|
508
|
|
||
|
Claim reserves
|
75
|
|
78
|
|
||||
|
Subtotal (a)
|
590
|
|
586
|
|
||||
|
Payable to third-party beneficiaries:
|
||||||||
|
Unearned premium reserves
|
99
|
|
98
|
|
||||
|
Benefit reserves
|
103
|
|
105
|
|
||||
|
Claim reserves
|
18
|
|
20
|
|
||||
|
Subtotal (b)
|
220
|
|
223
|
|
||||
|
Non-finance receivable related:
|
||||||||
|
Unearned premium reserves
|
81
|
|
86
|
|
||||
|
Benefit reserves
|
375
|
|
388
|
|
||||
|
Claim reserves
|
61
|
|
60
|
|
||||
|
Subtotal (b)
|
517
|
|
534
|
|
||||
|
Total
|
$
|
1,327
|
|
$
|
1,343
|
|
||
|
(a)
|
Reported as a contra-asset to net finance receivables.
|
|
(b)
|
Reported in insurance claims and policyholder liabilities.
|
Our insurance subsidiaries enter into reinsurance agreements with other insurers. Reserves related to unearned premiums, claims and benefits assumed from non-affiliated insurance companies totaled
$325 million
and
$333 million
at
December 31, 2017
and
2016
, respectively.
Reserves related to unearned premiums, claims and benefits ceded to non-affiliated insurance companies totaled
$95 million
and
$102 million
at
December 31, 2017
and
2016
, respectively.
122
Changes in the reserve for unpaid claims and loss adjustment expenses (not considering reinsurance recoverable):
|
(dollars in millions)
|
||||||||||||
|
At or for the Years Ended December 31,
|
2017
|
2016
|
2015
|
|||||||||
|
Balance at beginning of period
|
$
|
158
|
|
$
|
177
|
|
$
|
70
|
|
|||
|
Less reinsurance recoverables
|
(26
|
)
|
(26
|
)
|
(22
|
)
|
||||||
|
Net balance at beginning of period
|
132
|
|
151
|
|
48
|
|
||||||
|
Reserve for unpaid claims and loss adjustment expenses assumed in connection with the OneMain Acquisition
|
—
|
|
—
|
|
104
|
|
||||||
|
Additions for losses and loss adjustment expenses incurred to:
|
||||||||||||
|
Current year
|
188
|
|
203
|
|
83
|
|
||||||
|
Prior years *
|
5
|
|
(20
|
)
|
5
|
|
||||||
|
Total
|
193
|
|
183
|
|
88
|
|
||||||
|
Reductions for losses and loss adjustment expenses paid related to:
|
||||||||||||
|
Current year
|
(115
|
)
|
(124
|
)
|
(63
|
)
|
||||||
|
Prior years
|
(78
|
)
|
(78
|
)
|
(26
|
)
|
||||||
|
Total
|
(193
|
)
|
(202
|
)
|
(89
|
)
|
||||||
|
Foreign currency translation adjustment
|
(1
|
)
|
—
|
|
—
|
|
||||||
|
Net balance at end of period
|
131
|
|
132
|
|
151
|
|
||||||
|
Plus reinsurance recoverables
|
23
|
|
26
|
|
26
|
|
||||||
|
Balance at end of period
|
$
|
154
|
|
$
|
158
|
|
$
|
177
|
|
|||
|
*
|
Reflects (i) a shortfall in the prior years’ net reserves of
$5 million
at
December 31, 2017
, primarily due to an unfavorable development on previously disclosed property and casualty policies and an unfavorable development on certain assumed credit disability policies (ii) a redundancy in the prior years’ net reserves of
$20 million
at
December 31, 2016
primarily due to credit disability and credit involuntary unemployment insurance claims developing more favorably than anticipated, and (iii) a shortfall in the prior years’ net reserves of
$5 million
at
December 31, 2015
primarily resulting from increased estimates for claims incurred in prior years as claims have developed.
|
Incurred claims and allocated claim adjustment expenses, net of reinsurance, as of
December 31, 2017
, were as follows:
|
Years Ended December 31,
|
At December 31, 2017
|
|||||||||||||||||||||||||||||
|
(dollars in millions)
|
2013 (a)
|
2014 (a)
|
2015 (a)
|
2016 (a)
|
2017
|
Incurred-but-
not-reported Liabilities (b)
|
Cumulative Number of Reported Claims
|
Cumulative
Frequency (c)
|
||||||||||||||||||||||
|
Credit Insurance
|
||||||||||||||||||||||||||||||
|
Accident Year
|
||||||||||||||||||||||||||||||
|
2013
|
$
|
140
|
|
$
|
127
|
|
$
|
125
|
|
$
|
124
|
|
$
|
124
|
|
$
|
—
|
|
50,295
|
|
2.7
|
%
|
||||||||
|
2014
|
—
|
|
145
|
|
132
|
|
130
|
|
131
|
|
3
|
|
51,776
|
|
2.7
|
%
|
||||||||||||||
|
2015
|
—
|
|
—
|
|
138
|
|
129
|
|
129
|
|
8
|
|
52,505
|
|
2.8
|
%
|
||||||||||||||
|
2016
|
—
|
|
—
|
|
—
|
|
138
|
|
135
|
|
20
|
|
51,558
|
|
2.8
|
%
|
||||||||||||||
|
2017
|
—
|
|
—
|
|
—
|
|
—
|
|
136
|
|
59
|
|
39,329
|
|
2.2
|
%
|
||||||||||||||
|
Total
|
|
$
|
655
|
|
||||||||||||||||||||||||||
|
(a)
|
Unaudited.
|
|
(b)
|
Includes expected development on reported claims.
|
|
(c)
|
Frequency for each accident year is calculated as the ratio of all reported claims incurred to the total exposures in force.
|
123
Cumulative paid claims and allocated claim adjustment expenses, net of reinsurance, as of
December 31, 2017
, were as follows:
|
Years Ended December 31,
|
||||||||||||||||||||
|
(dollars in millions)
|
2013 *
|
2014 *
|
2015 *
|
2016 *
|
2017
|
|||||||||||||||
|
Credit Insurance
|
||||||||||||||||||||
|
Accident Year
|
||||||||||||||||||||
|
2013
|
$
|
68
|
|
$
|
105
|
|
$
|
115
|
|
$
|
121
|
|
$
|
124
|
|
|||||
|
2014
|
—
|
|
71
|
|
110
|
|
121
|
|
128
|
|
||||||||||
|
2015
|
—
|
|
—
|
|
71
|
|
109
|
|
121
|
|
||||||||||
|
2016
|
—
|
|
—
|
|
—
|
|
75
|
|
115
|
|
||||||||||
|
2017
|
—
|
|
—
|
|
—
|
|
—
|
|
77
|
|
||||||||||
|
Total
|
|
$
|
565
|
|
||||||||||||||||
|
All outstanding liabilities before 2013, net of reinsurance
|
—
|
|
||||||||||||||||||
|
Liabilities for claims and claim adjustment expenses, net of reinsurance
|
$
|
90
|
|
|||||||||||||||||
|
*
|
Unaudited.
|
The reconciliations of the net incurred and paid claims development to the liability for claims and claim adjustment expenses were as follows:
|
(dollars in millions)
|
||||||||||||
|
December 31,
|
2017
|
2016 *
|
2015 *
|
|||||||||
|
Liabilities for unpaid claims and claim adjustment expenses, net of reinsurance:
|
||||||||||||
|
Credit insurance
|
$
|
90
|
|
$
|
96
|
|
$
|
105
|
|
|||
|
Other short-duration insurance lines
|
22
|
|
20
|
|
25
|
|
||||||
|
Total
|
112
|
|
116
|
|
130
|
|
||||||
|
Reinsurance recoverable on unpaid claims:
|
||||||||||||
|
Other short-duration insurance lines
|
20
|
|
22
|
|
22
|
|
||||||
|
Insurance lines other than short-duration
|
22
|
|
20
|
|
25
|
|
||||||
|
Total gross liability for unpaid claims and claim adjustment expense
|
$
|
154
|
|
$
|
158
|
|
$
|
177
|
|
|||
|
*
|
Unaudited.
|
We use completion factors to estimate the unpaid claim liability for credit insurance and most other short-duration products. For some products, the unpaid claim liability is estimated as a percent of exposure. For the long-tailed Excess & Surplus products, which have a longer period of time before claims are paid, unpaid claim liabilities are estimated by a third party and reviewed by our appointed actuary using statistical analyses, including analysis of trends in loss severity and frequency.
There have been no significant changes in methodologies or assumptions during
2017
.
Our average annual percentage payout of incurred claims by age, net of reinsurance, as of
December 31, 2017
, were as follows:
|
Years
|
1
|
2
|
3
|
4
|
5
|
||||||||||
|
Credit insurance
|
55.4
|
%
|
29.4
|
%
|
8.9
|
%
|
4.8
|
%
|
2.5
|
%
|
|||||
124
STATUTORY ACCOUNTING
Springleaf and OneMain insurance subsidiaries file financial statements prepared using statutory accounting practices prescribed or permitted by the Indiana DOI and the Texas DOI, respectively, which is a comprehensive basis of accounting other than GAAP. The primary differences between statutory accounting practices and GAAP are that under statutory accounting, policy acquisition costs are expensed as incurred, policyholder liabilities are generally valued using prescribed actuarial assumptions, and certain investment securities are reported at amortized cost. We are not required and did not apply purchase accounting to the insurance subsidiaries on a statutory basis.
Statutory net income (loss) for our insurance companies by type of insurance was as follows:
|
(dollars in millions)
|
||||||||||||
|
Years Ended December 31,
|
2017
|
2016
|
2015
|
|||||||||
|
Property and casualty:
|
||||||||||||
|
Yosemite
|
$
|
19
|
|
$
|
11
|
|
$
|
15
|
|
|||
|
Triton
|
31
|
|
14
|
|
3
|
|
||||||
|
Life and health:
|
||||||||||||
|
Merit
|
$
|
37
|
|
$
|
20
|
|
$
|
(1
|
)
|
|||
|
AHL
|
34
|
|
71
|
|
11
|
|
||||||
Statutory capital and surplus for our insurance companies by type of insurance were as follows:
|
(dollars in millions)
|
||||||||
|
December 31,
|
2017
|
2016
|
||||||
|
Property and casualty:
|
||||||||
|
Yosemite
|
$
|
42
|
|
$
|
63
|
|
||
|
Triton
|
170
|
|
139
|
|
||||
|
Life and health:
|
||||||||
|
Merit
|
$
|
79
|
|
$
|
133
|
|
||
|
AHL
|
130
|
|
215
|
|
||||
Springleaf and OneMain insurance companies are also subject to risk-based capital requirements adopted by the Indiana DOI and the Texas DOI, respectively. Minimum statutory capital and surplus is the risk-based capital level that would trigger regulatory action. At
December 31, 2017
and
2016
, our insurance subsidiaries’ statutory capital and surplus exceeded the risk-based capital minimum required levels.
DIVIDEND RESTRICTIONS
Our insurance subsidiaries are subject to state regulations that limit their ability to pay dividends. State law restricts the amounts that Merit and Yosemite may pay as dividends without prior notice to the Indiana DOI and the amounts that AHL and Triton may pay as dividends without prior notice to the Texas DOI. The maximum amount of dividends, referred to as “ordinary dividends,” for an Indiana or Texas domiciled life insurance company that can be paid without prior approval in a
12
month period (measured retrospectively from the date of payment) is the greater of: (i)
10%
of policyholders’ surplus as of the prior year-end or (ii) the statutory net gain from operations as of the prior year-end. Any amount greater must be approved by the Indiana DOI or Texas DOI prior to its payment. The maximum ordinary dividends for an Indiana or Texas domiciled property and casualty insurance company that can be paid without prior approval in a
12
month period (measured retrospectively from the date of payment) is the greater of: (i)
10%
of policyholders’ surplus as of the prior year-end or (ii) the statutory net income. Any amount greater must be approved by the Indiana DOI or Texas DOI prior to its payment. These approved dividends are called “extraordinary dividends.” AHL and Triton paid extraordinary dividends to OMFH totaling
$111 million
in
2017
,
$105
125
million
during
2016
and
$68 million
of ordinary dividends subsequent to the effective closing of the OneMain Acquisition in 2015. Merit and Yosemite paid extraordinary dividends to SFC totaling
$125 million
,
$63 million
, and
$100 million
during
2017
,
2016
, and
2015
, respectively.
15
.
Other Liabilities
Components of other liabilities were as follows:
|
(dollars in millions)
|
||||||||
|
December 31,
|
2017
|
2016
|
||||||
|
Accrued expenses and other liabilities
|
$
|
119
|
|
$
|
98
|
|
||
|
Salary and benefit liabilities
|
79
|
|
69
|
|
||||
|
Accrued interest on debt
|
58
|
|
61
|
|
||||
|
Retirement plans
|
13
|
|
31
|
|
||||
|
Insurance liabilities
|
12
|
|
14
|
|
||||
|
Loan principal warranty reserve
|
8
|
|
13
|
|
||||
|
Other
|
34
|
|
46
|
|
||||
|
Total
|
$
|
323
|
|
$
|
332
|
|
||
16
.
Capital Stock and Earnings (Loss) Per Share
CAPITAL STOCK
OMH has
two
classes of authorized capital stock: preferred stock and common stock. OMH may issue preferred stock in series. The OMH board of directors determines the dividend, liquidation, redemption, conversion, voting and other rights prior to issuance.
Par value and shares authorized at
December 31, 2017
were as follows:
|
Preferred Stock *
|
Common Stock
|
|||||||
|
Par value
|
$
|
0.01
|
|
$
|
0.01
|
|
||
|
Shares authorized
|
300,000,000
|
|
2,000,000,000
|
|
||||
|
*
|
No
shares of preferred stock were issued and outstanding at
December 31, 2017
or
2016
.
|
Changes in shares of common stock issued and outstanding were as follows:
|
At or for the Years Ended December 31,
|
2017
|
2016
|
2015
|
||||||
|
Balance at beginning of period
|
134,867,868
|
|
134,494,172
|
|
114,832,895
|
|
|||
|
Common shares issued
|
481,770
|
|
373,696
|
|
19,661,277
|
|
|||
|
Balance at end of period
|
135,349,638
|
|
134,867,868
|
|
134,494,172
|
|
|||
Equity Offering
On May 4, 2015, we completed an offering of
27,864,525
shares of common stock, consisting of
19,417,476
shares of common stock offered by us and
8,447,049
shares of common stock offered by the Initial Stockholder.
126
The net proceeds from this sale to the Company were approximately
$976 million
, after deducting the underwriting discounts and commissions and additional offering-related expenses totaling
$24 million
. The net proceeds of the offering were contributed to Independence to finance a portion of the OneMain Acquisition.
EARNINGS (LOSS) PER SHARE
The computation of earnings (loss) per share was as follows:
|
(dollars in millions, except per share data)
|
||||||||||||
|
Years Ended December 31,
|
|
2017
|
|
2016
|
|
2015
|
||||||
|
|
|
|||||||||||
|
Numerator (basic and diluted):
|
|
|||||||||||
|
Net income (loss) attributable to OneMain Holdings, Inc.
|
|
$
|
183
|
|
$
|
215
|
|
$
|
(220
|
)
|
||
|
Denominator:
|
|
|||||||||||
|
Weighted average number of shares outstanding (basic)
|
|
135,249,314
|
|
134,718,588
|
|
127,910,680
|
|
|||||
|
Effect of dilutive securities *
|
|
429,677
|
|
417,272
|
|
—
|
|
|||||
|
Weighted average number of shares outstanding (diluted)
|
|
135,678,991
|
|
135,135,860
|
|
127,910,680
|
|
|||||
|
Earnings (loss) per share:
|
|
|||||||||||
|
Basic
|
|
$
|
1.35
|
|
$
|
1.60
|
|
$
|
(1.72
|
)
|
||
|
Diluted
|
|
$
|
1.35
|
|
$
|
1.59
|
|
$
|
(1.72
|
)
|
||
|
*
|
We have excluded the following shares in the diluted earnings (loss) per share calculation for
2017
,
2016
, and
2015
because these shares would be anti-dilutive, which could impact the earnings (loss) per share calculation in the future:
|
•
2017
:
59,863
performance-based shares and
674,472
service-based shares;
•
2016
:
508,340
performance-based shares and
778,121
service-based shares; and
•
2015
:
591,606
performance-based shares and
489,653
service-based shares
Basic earnings (loss) per share is computed by dividing net income or loss by the weighted-average number of shares outstanding during each period. Diluted earnings (loss) per share is computed based on the weighted-average number of common shares plus the effect of dilutive potential common shares outstanding during the period using the treasury stock method. Dilutive potential common shares represent outstanding unvested RSUs and RSAs.
127
17
.
Accumulated Other Comprehensive Income (Loss)
Changes, net of tax, in accumulated other comprehensive income (loss) were as follows:
|
(dollars in millions)
|
Unrealized Gains (Losses) Available-for-Sale Securities
|
Retirement Plan Liabilities Adjustments
|
Foreign Currency Translation Adjustments
|
Total Accumulated Other Comprehensive Income (Loss)
|
||||||||||||
|
Year Ended December 31, 2017
|
||||||||||||||||
|
Balance at beginning of period
|
$
|
(1
|
)
|
$
|
(4
|
)
|
$
|
(1
|
)
|
$
|
(6
|
)
|
||||
|
Other comprehensive income before reclassifications
|
14
|
|
9
|
|
4
|
|
27
|
|
||||||||
|
Reclassification adjustments from accumulated other comprehensive loss
|
(9
|
)
|
(1
|
)
|
—
|
|
(10
|
)
|
||||||||
|
Balance at end of period
|
$
|
4
|
|
$
|
4
|
|
$
|
3
|
|
$
|
11
|
|
||||
|
Year Ended December 31, 2016
|
||||||||||||||||
|
Balance at beginning of period
|
$
|
(14
|
)
|
$
|
(19
|
)
|
$
|
—
|
|
$
|
(33
|
)
|
||||
|
Other comprehensive income before reclassifications
|
23
|
|
15
|
|
3
|
|
41
|
|
||||||||
|
Reclassification adjustments from accumulated other comprehensive loss
|
(10
|
)
|
—
|
|
(4
|
)
|
(14
|
)
|
||||||||
|
Balance at end of period
|
$
|
(1
|
)
|
$
|
(4
|
)
|
$
|
(1
|
)
|
$
|
(6
|
)
|
||||
|
Year Ended December 31, 2015
|
||||||||||||||||
|
Balance at beginning of period
|
$
|
12
|
|
$
|
(13
|
)
|
$
|
4
|
|
$
|
3
|
|
||||
|
Other comprehensive loss before reclassifications
|
(18
|
)
|
(6
|
)
|
(4
|
)
|
(28
|
)
|
||||||||
|
Reclassification adjustments from accumulated other comprehensive loss
|
(8
|
)
|
—
|
|
—
|
|
(8
|
)
|
||||||||
|
Balance at end of period
|
$
|
(14
|
)
|
$
|
(19
|
)
|
$
|
—
|
|
$
|
(33
|
)
|
||||
Reclassification adjustments from accumulated other comprehensive income (loss) to the applicable line item on our consolidated statements of operations were as follows:
|
(dollars in millions)
|
||||||||||||
|
Years Ended December 31,
|
2017
|
2016
|
2015
|
|||||||||
|
Unrealized gains on investment securities:
|
||||||||||||
|
Reclassification from accumulated other comprehensive income (loss) to investment revenues, before taxes
|
$
|
14
|
|
$
|
15
|
|
$
|
12
|
|
|||
|
Income tax effect
|
(5
|
)
|
(5
|
)
|
(4
|
)
|
||||||
|
Reclassification from accumulated other comprehensive income (loss) to investment revenues, net of taxes
|
9
|
|
10
|
|
8
|
|
||||||
|
Unrealized gains (losses) on retirement plan liabilities:
|
||||||||||||
|
Reclassification from accumulated other comprehensive income (loss) to retirement plan liabilities adjustments, before taxes
|
$
|
2
|
|
$
|
—
|
|
$
|
—
|
|
|||
|
Income tax effect
|
(1
|
)
|
—
|
|
—
|
|
||||||
|
Reclassification from accumulated other comprehensive income (loss) to retirement plan liabilities adjustments, net of taxes
|
1
|
|
—
|
|
—
|
|
||||||
|
Unrealized gains on foreign currency translation adjustments:
|
||||||||||||
|
Reclassification from accumulated other comprehensive income (loss) to other revenues
|
—
|
|
4
|
|
—
|
|
||||||
|
Total
|
$
|
10
|
|
$
|
14
|
|
$
|
8
|
|
|||
128
18
.
Income Taxes
OMH and all of its eligible domestic U.S. subsidiaries file a consolidated life/non-life federal tax return with the IRS. AHL, an insurance subsidiary of OneMain, is not an eligible company under Internal Revenue Code Section 1504 and therefore, files separate federal life insurance tax returns. Income taxes from the consolidated federal and state tax returns are allocated to our eligible subsidiaries under a tax sharing agreement with OMH.
The Company’s foreign subsidiaries/branches file tax returns in Canada, Puerto Rico, and the U.S. Virgin Islands. The Company recognizes a deferred tax liability for the undistributed earnings of its foreign operations, if any, as we do not consider the amounts to be permanently reinvested. As of
December 31, 2017
, the Company had
no
undistributed foreign earnings.
Components of income (loss) before income tax expense (benefit) were as follows:
|
(dollars in millions)
|
|
|
|
|||||||||
|
Years Ended December 31,
|
2017
|
2016
|
2015
|
|||||||||
|
|
|
|||||||||||
|
Income (loss) before income tax expense (benefit) - U.S. operations
|
$
|
416
|
|
$
|
338
|
|
$
|
(238
|
)
|
|||
|
Income before income tax expense - foreign operations
|
15
|
|
18
|
|
12
|
|
||||||
|
Total
|
$
|
431
|
|
$
|
356
|
|
$
|
(226
|
)
|
|||
Components of income tax expense (benefit) were as follows:
|
(dollars in millions)
|
||||||||||||
|
Years Ended December 31,
|
2017
|
2016
|
2015
|
|||||||||
|
Current:
|
||||||||||||
|
Federal
|
$
|
208
|
|
$
|
185
|
|
$
|
68
|
|
|||
|
Foreign
|
2
|
|
1
|
|
1
|
|
||||||
|
State
|
8
|
|
24
|
|
7
|
|
||||||
|
Total current
|
218
|
|
210
|
|
76
|
|
||||||
|
Deferred:
|
||||||||||||
|
Federal
|
18
|
|
(81
|
)
|
(178
|
)
|
||||||
|
Foreign *
|
—
|
|
3
|
|
—
|
|
||||||
|
State
|
12
|
|
(19
|
)
|
(31
|
)
|
||||||
|
Total deferred
|
30
|
|
(97
|
)
|
(209
|
)
|
||||||
|
Total
|
$
|
248
|
|
$
|
113
|
|
$
|
(133
|
)
|
|||
|
*
|
Deferred foreign income taxes were less than $
1 million
during the 2017 and 2015 periods and, therefore, are not quantified in the table above.
|
Expense from foreign income taxes includes foreign subsidiaries/branches that operate in Canada, Puerto Rico, and the U.S. Virgin Islands. During the 2016 and 2015 periods, expense from foreign income taxes also included United Kingdom operations.
129
Reconciliations of the statutory federal income tax rate to the effective income tax rate were as follows:
|
Years Ended December 31,
|
2017
|
2016
|
2015
|
||||||
|
Statutory federal income tax rate
|
35.00
|
%
|
35.00
|
%
|
35.00
|
%
|
|||
|
Impact of Tax Act
|
18.65
|
|
—
|
|
—
|
|
|||
|
State income taxes, net of federal
|
2.86
|
|
1.05
|
|
7.06
|
|
|||
|
Excess tax benefit on share-based compensation
|
0.41
|
|
(0.49
|
)
|
—
|
|
|||
|
Tax impact of United Kingdom subsidiary liquidation
|
—
|
|
(0.60
|
)
|
—
|
|
|||
|
Non-controlling interests
|
—
|
|
(2.77
|
)
|
19.77
|
|
|||
|
Nondeductible compensation
|
—
|
|
—
|
|
(2.40
|
)
|
|||
|
Other, net
|
0.55
|
|
(0.42
|
)
|
(0.41
|
)
|
|||
|
Effective income tax rate
|
57.47
|
%
|
31.77
|
%
|
59.02
|
%
|
|||
The effective income tax rate for
2017
,
2016
, and
2015
differed from the statutory federal income tax rate primarily due to the recognition of the impact of the Tax Act, effects of the non-controlling interest in the previously owned SpringCastle Portfolio, state income taxes, and discrete expense from the 2016 tax year return-to-provision adjustment. The effective income tax rate is based on income (loss) before taxes, which includes income (loss) attributable to non-controlling interests. The income (loss) attributable to the non-controlling interest is not included in the taxable income in OMH, resulting in variances from the statutory federal income tax rate of
(2.77)%
and
19.77%
in
2016
and
2015
, respectively.
The difference in the effective income tax rate in
2017
as compared to
2016
is primarily due to the recognition of the impact of the Tax Act which increased our
2017
effective income tax rate by
18.65%
as compared to
2016
. As a result of the Tax Act we recognized an
$81 million
tax charge in 2017. This charge is primarily the result of the lower corporate tax rate, which required us to remeasure our net deferred tax asset to reflect the lower corporate tax rate. The difference in the impact on the effective income tax rate due to non-controlling interest in
2016
as compared to
2015
is due to the fact that the net income attributable to non-controlling interest was a smaller percentage of the total income (loss) in
2016
as compared to
2015
.
A reconciliation of the beginning and ending balances of the total amounts of gross unrecognized tax benefits (all of which would affect the effective income tax rate if recognized) is as follows:
|
(dollars in millions)
|
||||||||||||
|
Years Ended December 31,
|
2017
|
2016
|
2015
|
|||||||||
|
Balance at beginning of year
|
$
|
16
|
|
$
|
15
|
|
$
|
4
|
|
|||
|
Increases in tax positions for current years
|
1
|
|
2
|
|
10
|
|
||||||
|
Increases in tax positions for prior years
|
—
|
|
—
|
|
4
|
|
||||||
|
Lapse in statute of limitations
|
(2
|
)
|
(1
|
)
|
—
|
|
||||||
|
Settlements with tax authorities
|
—
|
|
—
|
|
(1
|
)
|
||||||
|
Decreases in tax positions for prior years
|
—
|
|
—
|
|
(2
|
)
|
||||||
|
Balance at end of year
|
$
|
15
|
|
$
|
16
|
|
$
|
15
|
|
|||
Our gross unrecognized tax benefits include related interest and penalties. We accrue interest related to uncertain tax positions in income tax expense. The amount of any change in the balance of uncertain tax liabilities over the next 12 months is not expected to be material to our consolidated financial statements.
We are currently under examination of our U.S. federal tax return for the years 2011 to 2013 by the IRS. We are also under examination of various states for the years 2011 to 2016. Management believes it has adequately provided for taxes for such years.
130
Components of deferred tax assets and liabilities were as follows:
|
(dollars in millions)
|
||||||||
|
December 31,
|
2017
|
2016
|
||||||
|
Deferred tax assets:
|
||||||||
|
Allowance for loan losses
|
$
|
149
|
|
$
|
246
|
|
||
|
State taxes, net of federal
|
66
|
|
56
|
|
||||
|
Mark-to-market
|
53
|
|
51
|
|
||||
|
Pension/employee benefits
|
10
|
|
29
|
|
||||
|
Acquisition costs
|
6
|
|
9
|
|
||||
|
Federal and foreign net operating losses and tax attributes
|
5
|
|
4
|
|
||||
|
Insurance reserves
|
3
|
|
—
|
|
||||
|
Legal and warranty reserve
|
2
|
|
6
|
|
||||
|
Other intangibles
|
2
|
|
1
|
|
||||
|
Other
|
8
|
|
5
|
|
||||
|
Total
|
304
|
|
407
|
|
||||
|
Deferred tax liabilities:
|
||||||||
|
Debt fair value adjustment
|
46
|
|
90
|
|
||||
|
Goodwill
|
41
|
|
37
|
|
||||
|
Deferred loan fees
|
14
|
|
12
|
|
||||
|
Discount - debt exchange
|
11
|
|
16
|
|
||||
|
Fixed assets
|
3
|
|
6
|
|
||||
|
Deferred insurance commissions
|
2
|
|
1
|
|
||||
|
Impact of tax accounting method change
|
—
|
|
38
|
|
||||
|
Insurance reserves
|
—
|
|
2
|
|
||||
|
Total
|
117
|
|
202
|
|
||||
|
Net deferred tax assets before valuation allowance
|
187
|
|
205
|
|
||||
|
Valuation allowance
|
(44
|
)
|
(29
|
)
|
||||
|
Net deferred tax assets
|
$
|
143
|
|
$
|
176
|
|
||
The gross deferred tax liabilities are expected to reverse in time, and projected taxable income is expected to be sufficient to create positive taxable income, which will allow for the realization of all of our gross federal deferred tax assets and a portion of the state deferred tax assets. The decrease of our net deferred tax asset is mainly attributable to recording of an adjustment as of December 31, 2017 to reflect the reduction in the U.S. statutory tax rate from 35% to 21% resulting from the Tax Act.
During 2016 we liquidated our United Kingdom operations. As such, there are no net operating loss carryforwards (and no offsetting valuation allowances) related to our United Kingdom operations at December 31, 2016.
At
December 31, 2017
we had state net operating loss carryforwards of
$730 million
, compared to
$791 million
at
December 31, 2016
. The state net operating loss carryforwards expire between 2018 and 2037. We had a valuation allowance on our gross state deferred tax assets, net of deferred federal tax benefit of
$40 million
and
$26 million
at
December 31, 2017
and
2016
, respectively. The total valuation allowance was established based on management’s determination that the deferred tax assets are more likely than not to not be realized.
131
19
.
Lease Commitments, Rent Expense, and Contingent Liabilities
LEASE COMMITMENTS AND RENT EXPENSE
Annual rental commitments for leased office space, automobiles and information technology equipment accounted for as operating leases, excluding leases on a month-to-month basis, were as follows:
|
(dollars in millions)
|
Lease Commitments
|
|||
|
2018
|
$
|
55
|
|
|
|
2019
|
44
|
|
||
|
2020
|
33
|
|
||
|
2021
|
22
|
|
||
|
2022
|
12
|
|
||
|
2023+
|
14
|
|
||
|
Total
|
$
|
180
|
|
|
In addition to rent, we pay taxes, insurance, and maintenance expenses under certain leases. In the normal course of business, we will renew leases that expire or replace them with leases on other properties. Rental expense totaled
$79 million
in
2017
,
$84 million
in
2016
, and
$39 million
in
2015
.
LEGAL CONTINGENCIES
In the normal course of business, we have been named, from time to time, as defendants in various legal actions, including arbitrations, class actions and other litigation arising in connection with our activities. Some of the actual or threatened legal actions include claims for substantial compensatory and/or punitive damages or claims for indeterminate amounts of damages. While we will continue to evaluate legal actions to determine whether a loss is reasonably possible or probable and is reasonably estimable, there can be no assurance that material losses will not be incurred from pending, threatened or future litigation, investigations, examinations, or other claims.
We contest liability and/or the amount of damages, as appropriate, in each pending matter. Where available information indicates that it is probable that a liability had been incurred at the date of the consolidated financial statements and we can reasonably estimate the amount of that loss, we accrue the estimated loss by a charge to income. In many actions, however, it is inherently difficult to determine whether any loss is probable or even reasonably possible or to estimate the amount of any loss. In addition, even where loss is reasonably possible or an exposure to loss exists in excess of the liability already accrued with respect to a previously recognized loss contingency, it is not always possible to reasonably estimate the size of the possible loss or range of loss.
For certain legal actions, we cannot reasonably estimate such losses, particularly for actions that are in their early stages of development or where plaintiffs seek substantial or indeterminate damages. Numerous issues may need to be resolved, including through potentially lengthy discovery and determination of important factual matters, and by addressing novel or unsettled legal questions relevant to the actions in question, before a loss or additional loss or range of loss or additional loss can be reasonably estimated for any given action.
For certain other legal actions, we can estimate reasonably possible losses, additional losses, ranges of loss or ranges of additional loss in excess of amounts accrued, but do not believe, based on current knowledge and after consultation with counsel, that such losses will have a material adverse effect on our consolidated financial statements as a whole.
Federal Securities Class Actions
On February 10, 2017, a putative class action lawsuit,
Galestan v. OneMain Holdings, Inc., et al.
, was filed in the U.S. District Court for the Southern District of New York, naming as defendants the Company and two of its officers. The lawsuit alleges violations of the Exchange Act for allegedly making materially misleading statements and/or omitting material information concerning alleged integration issues after the acquisition of OMFH in November 2015, and was filed on behalf of a putative class of persons who purchased or otherwise acquired the Company’s common stock between February 25, 2016 and November
132
7, 2016. The complaint seeks an award of unspecified compensatory damages, an award of interest, reasonable attorney’s fees, expert fees and other costs, and equitable relief as the court may deem just and proper. On March 23, 2017, the court appointed a lead plaintiff for the putative class and approved the lead plaintiff’s selection of counsel. The plaintiff filed an amended complaint on June 13, 2017 challenging statements regarding the Company’s projections of future financial performance and certain statements regarding integration after the OneMain Acquisition. On September 29, 2017, pursuant to the Court’s Individual Rules and Practices, we sought permission to file a motion to dismiss the amended complaint. The Company believes that the allegations specified in the amended complaint are without merit, and intends to vigorously defend against the claims. As the lawsuit is in the preliminary stages, the Company is unable to estimate a reasonably possible range of loss, if any, that may result from the lawsuit.
SALES RECOURSE OBLIGATIONS
At
December 31, 2017
, our reserve for sales recourse obligations totaled
$8 million
, which primarily related to our real estate loan sales in 2014, with a minimal portion of the reserve related to net charge-off sales of our finance receivables. We did not establish an additional reserve for sales recourse obligations associated with the personal loans sold in the Lendmark Sale or our real estate loan sales in 2016 based on the credit quality of the loans sold and the terms of each transaction.
The activity in our reserve for sales recourse obligations was as follows:
|
(dollars in millions)
|
||||||||||||
|
At or for the Years Ended December 31,
|
2017
|
2016
|
2015
|
|||||||||
|
Balance at beginning of period
|
$
|
13
|
|
$
|
15
|
|
$
|
24
|
|
|||
|
Recourse losses
|
(1
|
)
|
—
|
|
(2
|
)
|
||||||
|
Provision for recourse obligations, net of recoveries *
|
(4
|
)
|
(2
|
)
|
(7
|
)
|
||||||
|
Balance at end of period
|
$
|
8
|
|
$
|
13
|
|
$
|
15
|
|
|||
|
*
|
Reflects the elimination of the reserve associated with other prior sales of finance receivables.
|
At
December 31, 2017
, there were
no
material recourse requests with loss exposure that management believed would not be covered by the reserve. However, we will continue to monitor any repurchase activity in the future and will adjust the reserve accordingly. When recourse losses are reasonably possible or exposure to such losses exists in excess of the liability already accrued, it is not always possible to reasonably estimate the size of the possible recourse losses or range of losses.
133
20
.
Benefit Plans
PENSION PLANS
Retirement Plan
The Springleaf Financial Services Retirement Plan (the “Retirement Plan”) is a noncontributory defined benefit plan which is subject to the provisions of ERISA. Effective December 31, 2012, the Retirement Plan was frozen. U.S. salaried employees who were employed by a participating company, had attained age
21
, and completed
twelve months
of continuous service were eligible to participate in the plan. Employees generally vested after
5
years of service. Prior to January 1, 2013, unreduced benefits were paid to retirees at normal retirement (age
65
) and were based upon a percentage of final average compensation multiplied by years of credited service, up to
44
years. Our current and former employees will not lose any vested benefits in the Retirement Plan that accrued prior to January 1, 2013.
CommoLoCo Retirement Plan
The CommoLoCo Retirement Plan is a noncontributory defined benefit plan which is subject to the provisions of the Puerto Rico tax code. Effective December 31, 2012, the CommoLoCo Retirement Plan was frozen. Puerto Rican residents employed by CommoLoCo, Inc., our Puerto Rican subsidiary, who had attained age
21
and completed
one year
of service were eligible to participate in the plan. Our current and former employees in Puerto Rico will not lose any vested benefits in the CommoLoCo Retirement Plan that accrued prior to January 1, 2013.
Unfunded Defined Benefit Plans
We sponsor unfunded defined benefit plans for certain employees, including key executives, designed to supplement pension benefits provided by our other retirement plans. These include: (i) Springleaf Financial Services Excess Retirement Income Plan (the “Excess Retirement Income Plan”), which provides a benefit equal to the reduction in benefits payable to certain employees under our qualified retirement plan as a result of federal tax limitations on compensation and benefits payable; and (ii) the Supplemental Executive Retirement Plan (“SERP”), which provides additional retirement benefits to designated executives. Benefits under the Excess Retirement Income Plan were frozen as of December 31, 2012, and benefits under the SERP were frozen at the end of August 2004.
401(K) PLANS
We sponsor voluntary savings plans for our employees.
Springleaf Financial Services 401(k) Plan
The Springleaf Financial Services 401(k) Plan (the “401(k) Plan”) for
2017
,
2016
, and
2015
provided for a
100%
Company matching on the first
4%
of the salary reduction contributions of the employees. We do not anticipate any changes to the Company’s matching contributions for
2018
.
In addition, the Company may make a discretionary profit sharing contribution to the 401(k) Plan. The Company has full discretion to determine whether to make such a contribution, and the amount of such contribution. In no event, however, will the discretionary profit sharing contribution exceed
4%
of annual pay. In order to share in the retirement contribution, employees must have satisfied the 401(k) Plan’s eligibility requirements and be employed on the last day of the year. The employees are not required to contribute any money to the 401(k) Plan in order to qualify for the Company profit sharing contribution. The discretionary profit sharing contribution will be divided among participants eligible to share in the contribution for the year in the same proportion that the participant’s pay bears to the total pay of all participants. This means the amount allocated to each eligible participant’s account will, as a percentage of pay, be the same.
The OneMain employees were eligible to participate in the 401(k) Plan beginning on November 15, 2015. The salaries and benefit expense associated with this plan was
$16 million
in
2017
,
$21 million
in
2016
, and
$20 million
in
2015
.
134
CommoLoCo Thrift Plan
The CommoLoCo Thrift Plan provided salary reduction contributions by employees and
100%
matching contributions by the Company of up to
3%
of annual salary and
50%
matching contributions by the Company of the next
3%
of annual salary depending on the respective employee’s years of service. The CommoLoCo Thrift Plan was terminated in 2016. There was no salaries and benefit expense associated with this plan for
2017
and
2016
, and this expense was immaterial in
2015
.
OBLIGATIONS AND FUNDED STATUS
The following table presents the funded status of the defined benefit pension plans. The funded status of the plans is measured as the difference between the plan assets at fair value and the projected benefit obligation.
|
(dollars in millions)
|
Pension *
|
|||||||||||
|
At or for the Years Ended December 31,
|
2017
|
2016
|
2015
|
|||||||||
|
Projected benefit obligation, beginning of period
|
$
|
385
|
|
$
|
388
|
|
$
|
409
|
|
|||
|
Interest cost
|
13
|
|
16
|
|
15
|
|
||||||
|
Actuarial loss (gain)
|
17
|
|
(6
|
)
|
(24
|
)
|
||||||
|
Benefits paid:
|
||||||||||||
|
Plan assets
|
(14
|
)
|
(13
|
)
|
(12
|
)
|
||||||
|
Settlement
|
(47
|
)
|
—
|
|
—
|
|
||||||
|
Projected benefit obligation, end of period
|
354
|
|
385
|
|
388
|
|
||||||
|
Fair value of plan assets, beginning of period
|
354
|
|
333
|
|
359
|
|
||||||
|
Actual return on plan assets, net of expenses
|
47
|
|
33
|
|
(15
|
)
|
||||||
|
Company contributions
|
1
|
|
1
|
|
1
|
|
||||||
|
Benefits paid:
|
||||||||||||
|
Plan assets
|
(14
|
)
|
(13
|
)
|
(12
|
)
|
||||||
|
Settlement
|
(47
|
)
|
—
|
|
—
|
|
||||||
|
Fair value of plan assets, end of period
|
341
|
|
354
|
|
333
|
|
||||||
|
Funded status, end of period
|
$
|
(13
|
)
|
$
|
(31
|
)
|
$
|
(55
|
)
|
|||
|
Other liabilities recognized in the consolidated balance sheet
|
$
|
(13
|
)
|
$
|
(31
|
)
|
$
|
(55
|
)
|
|||
|
Pretax net gain (loss) recognized in accumulated other comprehensive income or loss
|
$
|
4
|
|
$
|
(7
|
)
|
$
|
(29
|
)
|
|||
|
*
|
Includes non-qualified unfunded plans, for which the aggregate projected benefit obligation was
$10 million
at
December 31, 2017
,
2016
, and
2015
.
|
The accumulated benefit obligation for U.S. pension benefit plans was
$354 million
at
December 31, 2017
and
$385 million
at
December 31, 2016
.
135
Defined benefit pension plan obligations in which the PBO was in excess of the related plan assets and the ABO was in excess of the related plan assets were as follows:
|
(dollars in millions)
|
PBO and ABO Exceeds
Fair Value of Plan Assets |
|||||||
|
December 31,
|
2017
|
2016
|
||||||
|
Projected benefit obligation
|
$
|
354
|
|
$
|
385
|
|
||
|
Accumulated benefit obligation
|
354
|
|
385
|
|
||||
|
Fair value of plan assets
|
341
|
|
354
|
|
||||
The following table presents the components of net periodic benefit cost recognized in income and other amounts recognized in accumulated other comprehensive income or loss with respect to the defined benefit pension plans:
|
(dollars in millions)
|
Pension
|
|||||||||||
|
Years Ended December 31,
|
2017
|
2016
|
2015
|
|||||||||
|
Components of net periodic benefit cost:
|
||||||||||||
|
Interest cost
|
$
|
13
|
|
$
|
16
|
|
$
|
15
|
|
|||
|
Expected return on assets
|
(18
|
)
|
(17
|
)
|
(19
|
)
|
||||||
|
Settlement gain
|
(2
|
)
|
—
|
|
—
|
|
||||||
|
Net periodic benefit cost
|
(7
|
)
|
(1
|
)
|
(4
|
)
|
||||||
|
Other changes in plan assets and projected benefit obligation recognized in other comprehensive income or loss:
|
||||||||||||
|
Net actuarial loss (gain)
|
(12
|
)
|
(22
|
)
|
9
|
|
||||||
|
Amortization of net actuarial gain (loss)
|
2
|
|
—
|
|
—
|
|
||||||
|
Total recognized in other comprehensive income or loss
|
(10
|
)
|
(22
|
)
|
9
|
|
||||||
|
Total recognized in net periodic benefit cost and other comprehensive income or loss
|
$
|
(17
|
)
|
$
|
(23
|
)
|
$
|
5
|
|
|||
We have made the following estimates relating to our combined defined benefit pension plans:
|
•
|
the estimated net loss that will be amortized from accumulated other comprehensive income or loss into net periodic benefit cost over the next fiscal year will be less than
$1 million
for our combined defined benefit pension plans; and
|
|
•
|
the estimated prior service credit that will be amortized from accumulated other comprehensive income or loss into net periodic benefit cost over the next fiscal year will be
zero
for our combined defined benefit pension plans.
|
136
Assumptions
The following table summarizes the weighted average assumptions used to determine the projected benefit obligations and the net periodic benefit costs:
|
Pension
|
||||||
|
December 31,
|
2017
|
2016
|
||||
|
Projected benefit obligation:
|
||||||
|
Discount rate
|
3.49
|
%
|
4.04
|
%
|
||
|
Rate of compensation increase
|
—
|
|
—
|
|
||
|
Net periodic benefit costs:
|
||||||
|
Discount rate
|
4.04
|
%
|
4.26
|
%
|
||
|
Expected long-term rate of return on plan assets
|
5.28
|
%
|
5.27
|
%
|
||
|
Rate of compensation increase (average)
|
—
|
|
—
|
|
||
Discount Rate Methodology
The projected benefit cash flows were discounted using the spot rates derived from the unadjusted Citigroup Pension Discount Curve at
December 31, 2017
and an equivalent weighted average discount rate was derived that resulted in the same liability.
Investment Strategy
The investment strategy with respect to assets relating to our pension plans is designed to achieve investment returns that will (i) provide for the benefit obligations of the plans over the long term; (ii) limit the risk of short-term funding shortfalls; and (iii) maintain liquidity sufficient to address cash needs. Accordingly, the asset allocation strategy is designed to maximize the investment rate of return while managing various risk factors, including but not limited to, volatility relative to the benefit obligations, diversification and concentration, and the risk and rewards profile indigenous to each asset class.
Allocation of Plan Assets
The long-term strategic asset allocation is reviewed and revised annually. The plans’ assets are monitored by our Retirement Plans Committee and the investment managers, which can entail allocating the plans assets among approved asset classes within pre-approved ranges permitted by the strategic allocation.
At
December 31, 2017
, the actual asset allocation for the primary asset classes was
85%
in fixed income securities,
14%
in equity securities, and
1%
in cash and cash equivalents. The
2018
target asset allocation for the primary asset classes is
84%
in fixed income securities and
16%
in equity securities. The actual allocation may differ from the target allocation at any particular point in time.
The expected long-term rate of return for the plans was
5.3%
for the Retirement Plan and
5.8%
for the CommoLoCo Retirement Plan for
2017
. The expected rate of return is an aggregation of expected returns within each asset class category. The expected asset return and any contributions made by the Company together are expected to maintain the plans’ ability to meet all required benefit obligations. The expected asset return with respect to each asset class was developed based on a building block approach that considers historical returns, current market conditions, asset volatility and the expectations for future market returns. While the assessment of the expected rate of return is long-term and thus not expected to change annually, significant changes in investment strategy or economic conditions may warrant such a change.
Expected Cash Flows
Funding for the U.S. pension plan ranges from the minimum amount required by ERISA to the maximum amount that would be deductible for U.S. tax purposes. This range is generally not determined until the fourth quarter. Contributed amounts in excess of the minimum amounts are deemed voluntary. Amounts in excess of the maximum amount would be subject to an excise tax
137
and may not be deductible under the IRC. Supplemental and excess plans’ payments and postretirement plan payments are deductible when paid.
The expected future benefit payments, net of participants’ contributions, of our defined benefit pension plans at
December 31, 2017
are as follows:
|
(dollars in millions)
|
Pension
|
|||
|
2018
|
$
|
15
|
|
|
|
2019
|
15
|
|
||
|
2020
|
15
|
|
||
|
2021
|
16
|
|
||
|
2022
|
16
|
|
||
|
2023-2027
|
85
|
|
||
FAIR VALUE MEASUREMENTS — PLAN ASSETS
The inputs and methodology used in determining the fair value of the plan assets are consistent with those used to measure our assets.
The following table presents information about our plan assets measured at fair value and indicates the fair value hierarchy based on the levels of inputs we utilized to determine such fair value:
|
(dollars in millions)
|
Level 1
|
Level 2
|
Level 3
|
Total
|
||||||||||||
|
December 31, 2017
|
||||||||||||||||
|
Assets:
|
||||||||||||||||
|
Cash and cash equivalents
|
$
|
2
|
|
$
|
—
|
|
$
|
—
|
|
$
|
2
|
|
||||
|
Equity securities:
|
||||||||||||||||
|
U.S. (a)
|
—
|
|
23
|
|
—
|
|
23
|
|
||||||||
|
International (b)
|
—
|
|
24
|
|
—
|
|
24
|
|
||||||||
|
Fixed income securities:
|
||||||||||||||||
|
U.S. investment grade (c)
|
—
|
|
281
|
|
—
|
|
281
|
|
||||||||
|
U.S. high yield (d)
|
—
|
|
11
|
|
—
|
|
11
|
|
||||||||
|
Total
|
$
|
2
|
|
$
|
339
|
|
$
|
—
|
|
$
|
341
|
|
||||
|
December 31, 2016
|
||||||||||||||||
|
Assets:
|
||||||||||||||||
|
Cash and cash equivalents
|
$
|
3
|
|
$
|
—
|
|
$
|
—
|
|
$
|
3
|
|
||||
|
Equity securities:
|
||||||||||||||||
|
U.S. (a)
|
—
|
|
17
|
|
—
|
|
17
|
|
||||||||
|
International (b)
|
—
|
|
15
|
|
—
|
|
15
|
|
||||||||
|
Fixed income securities:
|
||||||||||||||||
|
U.S. investment grade (c)
|
—
|
|
310
|
|
—
|
|
310
|
|
||||||||
|
U.S. high yield (d)
|
—
|
|
9
|
|
—
|
|
9
|
|
||||||||
|
Total
|
$
|
3
|
|
$
|
351
|
|
$
|
—
|
|
$
|
354
|
|
||||
|
(a)
|
Includes index mutual funds that primarily track several indices including S&P 500 and S&P 600 in addition to other actively managed accounts, comprised of investments in large cap companies.
|
|
(b)
|
Includes investment mutual funds in companies in emerging and developed markets.
|
138
|
(c)
|
Includes investment mutual funds in U.S. and non-U.S. government issued bonds, U.S. government agency or sponsored agency bonds, and investment grade corporate bonds.
|
|
(d)
|
Includes investment mutual funds in securities or debt obligations that have a rating below investment grade.
|
The inputs or methodologies used for valuing securities are not necessarily an indication of the risk associated with investing in these securities. Based on our investment strategy, we have no significant concentrations of risks.
21
.
Share-Based Compensation
OMNIBUS INCENTIVE PLAN
In 2013, OMH adopted the 2013 Omnibus Incentive Plan, which was amended and restated effective as of May 25, 2016, under which equity-based awards are granted to selected management employees, non-employee directors, independent contractors, and consultants. The amendment and restatement of the Omnibus Plan (i) extended the term of the Omnibus Plan from October 2023 to May 2026 and (ii) limited the number of cash and equity-based awards under the Omnibus Plan valued at more than
$500,000
to non-employee directors during the calendar year.
As of
December 31, 2017
,
13,199,096
shares of common stock were reserved for issuance under the Omnibus Plan, including
1,411,236
shares subject to outstanding equity awards. The amount of shares reserved is adjusted annually at the beginning of the year by a number of shares equal to the excess of
10%
of the number of outstanding shares on the last day of the previous fiscal year over the number of shares reserved and available for issuance as of the last day of the previous fiscal year. The Omnibus Plan allows for issuance of stock options, RSUs and RSAs, stock appreciation rights, and other stock-based awards and cash awards.
Service-based Awards
In connection with the initial public offering on October 16, 2013 and subsequent to the offering, we have granted service-based RSUs and RSAs to certain of our executives and employees. The RSUs are subject to a graded vesting period of
4.2
years or less and do not provide the holders with any rights as shareholders, including the right to earn dividends during the vesting period. The RSAs are subject to a graded vesting period of
three years
or less and provide the holders the right to vote and to earn dividends during the vesting period. The fair value for restricted units and awards is generally the closing market price of OMH’s common stock on the date of the award. For awards granted in connection with the initial public offering, the fair value is the offering price. Expense is amortized on a straight line basis over the vesting period, based on the number of awards that are ultimately expected to vest. The weighted-average grant date fair value of service-based awards issued in
2017
,
2016
, and
2015
was
$27.85
,
$26.14
, and
$47.44
, respectively. The total fair value of service-based awards that vested during
2017
,
2016
, and
2015
was
$18 million
,
$10 million
, and
$7 million
, respectively.
The following table summarizes the service-based stock activity and related information for the Omnibus Plan for
2017
:
|
Number of
Shares
|
Weighted
Average
Grant Date Fair Value
|
Weighted
Average
Remaining
Term (in Years)
|
|||||||
|
Unvested as of January 1, 2017
|
1,382,920
|
|
$
|
35.86
|
|
||||
|
Granted
|
407,184
|
|
27.85
|
|
|||||
|
Vested
|
(575,322
|
)
|
31.86
|
|
|||||
|
Forfeited
|
(73,172
|
)
|
38.10
|
|
|||||
|
Unvested at December 31, 2017
|
1,141,610
|
|
34.87
|
|
1.91
|
||||
139
Performance-based Awards
During
2017
,
2016
and
2015
, OMH awarded PRSUs that may be earned based on the financial performance of OMH. Certain PRSUs are subject to the achievement of performance goals during the period between the grant date and
December 31, 2017
. These awards are also subject to a graded vesting period of
two
years after the attainment of the performance goal or
December 31, 2017
, whichever occurs earlier. The remaining PRSUs are subject to separate and independent performance goals for 2017, 2018, and 2019; therefore, a separate requisite service period exists for each year that begins on January 1 of the respective performance year. Vesting for these awards will occur on the filing date of this Annual Report on Form 10-K that occurs after the performance year or the date the actual performance outcome is determined, whichever is later. All of the PRSUs allow for partial vesting if a minimum level of performance is attained. The PRSUs do not provide the holders with any rights as shareholders, including the right to earn dividends during the vesting period. The fair value for PRSUs is based on the closing market price of our stock on the date of the award.
Expense for performance-based shares is recognized over the requisite service period when it is probable that the performance goals will be achieved and is based on the total number of units expected to vest. Expense for awards with graded vesting is recognized under the accelerated method, whereby each vesting is treated as a separate award with expense for each vesting recognized ratably over the requisite service period. If minimum targets are not achieved by the end of the respective performance periods, all unvested shares related to those targets will be forfeited and canceled, and all expense recognized to that date is reversed.
Prior to the OneMain Acquisition, none of the performance targets related to certain PRSUs issued in 2014 were deemed probable of occurring. Subsequent to the OneMain Acquisition, the targets were re-evaluated and the
100%
performance targets were deemed probable of occurring. Accordingly in 2015, we recorded a cumulative catch-up expense of
$6 million
, which is included in acquisition-related transaction and integration expenses. During the fourth quarter of 2016, the Compensation Committee determined that the PRSU performance targets were
100%
achieved. Accordingly, a portion of the PRSU awards vested immediately, with the remaining shares subject to vesting upon meeting stated service requirements.
The weighted average grant date fair value of performance-based awards issued in
2017
and
2015
was
$24.98
and
$34.45
, respectively.
No
performance shares were granted during 2016. The total fair value of performance-based awards that vested during 2017 and 2016 was
$2 million
and
$4 million
, respectively.
No
performance-based awards vested in
2015
.
The following table summarizes the performance-based stock activity and related information for the Omnibus Plan for
2017
:
|
Number of
Shares
|
Weighted
Average
Grant Date Fair Value
|
Weighted
Average
Remaining
Term (in Years)
|
|||||||
|
Unvested as of January 1, 2017
|
407,948
|
|
$
|
25.94
|
|
||||
|
Granted
|
90,072
|
|
24.98
|
|
|||||
|
Vested
|
(92,000
|
)
|
24.78
|
|
|||||
|
Forfeited
|
(136,394
|
)
|
25.70
|
|
|||||
|
Unvested at December 31, 2017
|
269,626
|
|
26.14
|
|
3.78
|
||||
Total share-based compensation expense, net of forfeitures, for all stock-based awards totaled
$17 million
,
$22 million
, and
$15 million
, respectively, during
2017
,
2016
, and
2015
. The total income tax benefit recognized for stock-based compensation was
$6 million
in
2017
,
$8 million
in
2016
, and
$6 million
in
2015
. As of
December 31, 2017
, there was total unrecognized compensation expense of
$23 million
related to nonvested restricted stock that is expected to be recognized over a weighted average period of
1.9
years.
Incentive Units
In the fourth quarter of 2015, certain executives of the Company surrendered a portion of their incentive units in the Initial Stockholder and certain additional executives of the Company received a grant of incentive units in the Initial Stockholder. These incentive units are intended to encourage the executives to create sustainable, long-term value for the Company by providing them with interests that are subject to their continued employment with the Company and that only provide benefits (in the form of distributions) if the Initial Stockholder makes distributions to one or more of its common members that exceed
140
specified amounts. The incentive units are entitled to vote together with the holders of common units in the Initial Stockholder as a single class on all matters. The incentive units may not be sold or otherwise transferred and the executives are entitled to receive these distributions only while they are employed with the Company, unless the executive’s termination of employment results from the executive’s death, in which case the executive’s beneficiaries will be entitled to receive any future distributions. Because the incentive units only provide economic benefits in the form of distributions while the holders are employed, and the holder generally does not have the ability to monetize the incentive units due to the transfer restrictions, the substance of the arrangement is that of a profit sharing agreement. These incentive units provide benefits (in the form of distributions) in the event the Initial Stockholder makes distributions to one or more of its members that exceed certain specified amounts. In connection with the sale of our common stock by the Initial Stockholder in 2015, certain of the specified thresholds were satisfied. In accordance with ASC Topic 710, Compensation-General, we recorded non-cash incentive compensation expense of
$15 million
in 2015 related to the incentive units with a capital contribution offset such that the impact to overall shareholders’ equity was neutral.
No
expense was recognized for these awards during 2017 or 2016.
141
22
.
Segment Information
Our segments coincide with how our businesses are managed. At
December 31, 2017
, our
two
segments included:
|
•
|
Consumer and Insurance
— We originate and service personal loans and offer credit insurance (life insurance, disability insurance, involuntary unemployment insurance, and collateral protection insurance) and non-credit insurance through our branch network and our centralized operations. We also offer auto membership plans of an unaffiliated company. Our branch network conducts business in
44
states. Our centralized operations underwrite and process certain loan applications that we receive from our branch network or through an internet portal. If the applicant is located near an existing branch, our centralized operations make the credit decision regarding the application and then request, but do not require, the customer to visit a nearby branch for closing, funding and servicing. If the applicant is not located near a branch, our centralized operations originate the loan.
|
|
•
|
Acquisitions and Servicing
— We service the SpringCastle Portfolio. These loans consist of unsecured loans and loans secured by subordinate residential real estate mortgages and include both closed-end accounts and open-end lines of credit. Unless we are terminated, we will continue to provide the servicing for these loans pursuant to a servicing agreement, which we service as unsecured loans because the liens are subordinated to superior ranking security interests. See Note 2 for information regarding the SpringCastle Interest Sale and the acquisition and disposition of the SpringCastle Portfolio.
|
The remaining components (which we refer to as “Other”) consist of our non-originating legacy operations, which include (i)
our liquidating real estate loan portfolio as discussed below;(ii) our liquidating retail sales finance portfolio (including retail sales finance accounts from our legacy auto finance operation); (iii) our lending operations in Puerto Rico and the U.S. Virgin Islands; and (iv) the operations of the United Kingdom subsidiary, prior to its liquidation on August 16, 2016.
Beginning in 2017, management no longer views or manages our real estate assets as a separate operating segment. Therefore, we are now including Real Estate, which was previously presented as a distinct reporting segment, in “Other.” To conform to this new alignment of our segments, we have revised our prior period segment disclosures.
The accounting policies of the segments are the same as those disclosed in Note
3
, except as described below.
Due to the nature of the OneMain Acquisition and the Fortress Acquisition, we applied purchase accounting. However, we
report the operating results of Consumer and Insurance, Acquisitions and Servicing, and Other using the Segment Accounting
Basis, which (i) reflects our allocation methodologies for certain costs, primarily interest expense, loan loss reserves, and
acquisition costs, to reflect the manner in which we assess our business results and (ii) excludes the impact of applying
purchase accounting (eliminates premiums/discounts on our finance receivables and long-term debt at acquisition, as well as the
amortization/accretion in future periods).
142
We allocate revenues and expenses (on a Segment Accounting Basis) to each segment using the following methodologies:
|
Interest income
|
Directly correlated with a specific segment.
|
|
Interest expense
|
Acquisitions and Servicing
- This segment includes interest expense specifically identified to the SpringCastle Portfolio.
|
|
Consumer and Insurance and Other
- The Company has securitization debt and unsecured debt. The Company first allocates interest expense to its segments based on actual expense for securitizations and secured term debt and using a weighted average for unsecured debt allocated to the segments. Interest expense for unsecured debt is recorded to each of the segments using a weighted average interest rate applied to allocated average unsecured debt. Average unsecured debt allocations for the periods presented are as follows:
|
|
|
Subsequent to the OneMain Acquisition
|
|
|
Total average unsecured debt is allocated as follows:
|
|
|
•
Other
- at 100% of asset base. (Asset base represents the average net finance receivables including finance receivables held for sale); and
|
|
|
•
Consumer and Insurance
- receives remainder of unallocated average debt.
|
|
|
The net effect of the change in debt allocation and asset base methodologies for 2015, had it been in place as of the beginning of the year, would be an increase in interest expense of $208 million for Consumer and Insurance and a decrease in interest expense of $208 million for Other.
|
|
|
For the period first quarter 2015 to the OneMain Acquisition
|
|
|
Total average unsecured debt was allocated to Consumer and Insurance and Other, such that the total debt allocated across each segment equaled 83% of the Consumer and Insurance asset base and 100% of the Other asset base. Any excess was allocated to Consumer and Insurance.
|
|
|
Average unsecured debt was allocated after average securitized debt to achieve the calculated average segment debt.
|
|
|
Asset base represented the following:
|
|
|
l
Consumer and Insurance
- average net finance receivables, including average net finance receivables held for sale; and
|
|
|
l
Other
- average net finance receivables, including average net finance receivables held for sale, investments including proceeds from Real Estate sales, cash and cash equivalents, less proceeds from equity issuance in 2015, operating cash reserve and cash included in other segments.
|
|
|
Provision for finance receivable losses
|
Directly correlated with specific segment, except for allocations related to personal loans and retail in Other, which are based on the remaining delinquent accounts as a percentage of total delinquent accounts.
|
|
Other revenues
|
Directly correlated with a specific segment, except for:
|
|
l
Net gain (loss) on repurchases and repayments of debt -
Allocated to each of the segments based on the interest expense allocation of debt.
|
|
|
l
Gains and losses on foreign currency exchange -
Allocated to each of the segments based on the interest expense allocation of debt.
|
|
|
Acquisition-related transaction and integration expenses
|
Consists of: (i) acquisition-related transaction and integration costs related to the OneMain Acquisition, including legal and other professional fees, which we primarily report in Other, as these are costs related to acquiring the business as opposed to operating the business; (ii) software termination costs, which are allocated to Consumer and Insurance; and (iii) incentive compensation incurred above and beyond expected cost from acquiring and retaining talent in relation to the OneMain Acquisition, which are allocated to each of the segments based on services provided.
|
|
Other expenses
|
Salaries and benefits -
Directly correlated with a specific segment. Other salaries and benefits not directly correlated with a specific segment are allocated to each of the segments based on services provided.
|
|
Other operating expenses
- Directly correlated with a specific segment. Other operating expenses not directly correlated with a specific segment are allocated to each of the segments based on services provided.
|
|
|
Insurance policy benefits and claims
- Directly correlated with a specific segment.
|
|
143
The “Segment to GAAP Adjustment” column in the following tables primarily consists of:
|
•
|
Interest income
- reverses the impact of premiums/discounts on purchased finance receivables and the interest income recognition under guidance in ASC 310-20,
Nonrefundable Fees and Other Costs
, and ASC 310-30,
Loans and Debt Securities Acquired with Deteriorated Credit Quality
, and reestablishes interest income recognition on a historical cost basis;
|
|
•
|
Interest expense
- reverses the impact of premiums/discounts on acquired long-term debt and reestablishes interest expense recognition on a historical cost basis;
|
|
•
|
Provision for finance receivable losses
- reverses the impact of providing an allowance for finance receivable losses upon acquisition and reestablishes the allowance on a historical cost basis and reverses the impact of recognition of net charge-offs on purchased credit impaired finance receivables and reestablishes the net charge-offs on a historical cost basis;
|
|
•
|
Other revenues
- reestablishes the historical cost basis of mark-to-market adjustments on finance receivables held for sale and on realized gains/losses associated with our investment portfolio;
|
|
•
|
Acquisition-related transaction and integration expenses
- reestablishes the amortization of purchased software assets on a historical cost basis;
|
|
•
|
Other expenses
- reestablishes expenses on a historical cost basis by reversing the impact of amortization from acquired intangible assets and including amortization of other historical deferred costs; and
|
|
•
|
Assets
- revalues assets based on their fair values at the effective date of the OneMain Acquisition and the Fortress Acquisition.
|
The following tables present information about the Company’s segments, as well as reconciliations to the consolidated financial statement amounts.
|
(dollars in millions)
|
Consumer
and
Insurance
|
Acquisitions
and
Servicing
|
Other *
|
Eliminations
|
Segment to
GAAP Adjustment |
Consolidated
Total
|
||||||||||||||||||
|
At or for the Year Ended December 31, 2017
|
||||||||||||||||||||||||
|
Interest income
|
$
|
3,305
|
|
$
|
—
|
|
$
|
23
|
|
$
|
—
|
|
$
|
(132
|
)
|
$
|
3,196
|
|
||||||
|
Interest expense
|
765
|
|
—
|
|
21
|
|
—
|
|
30
|
|
816
|
|
||||||||||||
|
Provision for finance receivable losses
|
963
|
|
—
|
|
7
|
|
—
|
|
(15
|
)
|
955
|
|
||||||||||||
|
Net interest income (loss) after provision for finance receivable losses
|
1,577
|
|
—
|
|
(5
|
)
|
—
|
|
(147
|
)
|
1,425
|
|
||||||||||||
|
Other revenues
|
547
|
|
42
|
|
3
|
|
—
|
|
(32
|
)
|
560
|
|
||||||||||||
|
Acquisition-related transaction and integration expenses
|
66
|
|
—
|
|
6
|
|
—
|
|
(3
|
)
|
69
|
|
||||||||||||
|
Other expenses
|
1,382
|
|
41
|
|
33
|
|
—
|
|
29
|
|
1,485
|
|
||||||||||||
|
Income (loss) before income tax expense (benefit)
|
$
|
676
|
|
$
|
1
|
|
$
|
(41
|
)
|
$
|
—
|
|
$
|
(205
|
)
|
$
|
431
|
|
||||||
|
Assets
|
$
|
16,955
|
|
$
|
4
|
|
$
|
289
|
|
$
|
—
|
|
$
|
2,185
|
|
$
|
19,433
|
|
||||||
144
|
(dollars in millions)
|
Consumer
and
Insurance
|
Acquisitions
and
Servicing
|
Other *
|
Eliminations
|
Segment to
GAAP Adjustment |
Consolidated
Total
|
||||||||||||||||||
|
At or for the Year Ended December 31, 2016
|
||||||||||||||||||||||||
|
Interest income
|
$
|
3,328
|
|
$
|
102
|
|
$
|
51
|
|
$
|
—
|
|
$
|
(371
|
)
|
$
|
3,110
|
|
||||||
|
Interest expense
|
738
|
|
20
|
|
43
|
|
—
|
|
55
|
|
856
|
|
||||||||||||
|
Provision for finance receivable losses
|
911
|
|
14
|
|
6
|
|
—
|
|
1
|
|
932
|
|
||||||||||||
|
Net interest income (loss) after provision for finance receivable losses
|
1,679
|
|
68
|
|
2
|
|
—
|
|
(427
|
)
|
1,322
|
|
||||||||||||
|
Net gain on sale of SpringCastle interests
|
—
|
|
167
|
|
—
|
|
—
|
|
—
|
|
167
|
|
||||||||||||
|
Other revenues
|
612
|
|
49
|
|
(38
|
)
|
(11
|
)
|
(6
|
)
|
606
|
|
||||||||||||
|
Acquisition-related transaction and integration expenses
|
100
|
|
1
|
|
27
|
|
—
|
|
(20
|
)
|
108
|
|
||||||||||||
|
Other expenses
|
1,503
|
|
58
|
|
27
|
|
(11
|
)
|
54
|
|
1,631
|
|
||||||||||||
|
Income (loss) before income taxes expense (benefit)
|
688
|
|
225
|
|
(90
|
)
|
—
|
|
(467
|
)
|
356
|
|
||||||||||||
|
Income before income taxes attributable to non-controlling interests
|
—
|
|
28
|
|
—
|
|
—
|
|
—
|
|
28
|
|
||||||||||||
|
Income (loss) before income tax expense (benefit) attributable to OneMain Holdings, Inc.
|
$
|
688
|
|
$
|
197
|
|
$
|
(90
|
)
|
$
|
—
|
|
$
|
(467
|
)
|
$
|
328
|
|
||||||
|
Assets
|
$
|
15,539
|
|
$
|
5
|
|
$
|
596
|
|
$
|
—
|
|
$
|
1,983
|
|
$
|
18,123
|
|
||||||
|
At or for the Year Ended December 31, 2015
|
||||||||||||||||||||||||
|
Interest income
|
$
|
1,482
|
|
$
|
463
|
|
$
|
76
|
|
$
|
—
|
|
$
|
(91
|
)
|
$
|
1,930
|
|
||||||
|
Interest expense
|
242
|
|
87
|
|
268
|
|
(5
|
)
|
123
|
|
715
|
|
||||||||||||
|
Provision for finance receivable losses
|
351
|
|
68
|
|
(1
|
)
|
—
|
|
298
|
|
716
|
|
||||||||||||
|
Net interest income (loss) after provision for finance receivable losses
|
889
|
|
308
|
|
(191
|
)
|
5
|
|
(512
|
)
|
499
|
|
||||||||||||
|
Other revenues
|
276
|
|
58
|
|
3
|
|
(57
|
)
|
(18
|
)
|
262
|
|
||||||||||||
|
Acquisition-related transaction and integration expenses
|
16
|
|
1
|
|
48
|
|
—
|
|
(3
|
)
|
62
|
|
||||||||||||
|
Other expenses
|
804
|
|
111
|
|
48
|
|
(52
|
)
|
14
|
|
925
|
|
||||||||||||
|
Income (loss) before income tax expense (benefit)
|
345
|
|
254
|
|
(284
|
)
|
—
|
|
(541
|
)
|
(226
|
)
|
||||||||||||
|
Income before income taxes attributable to non-controlling interests
|
—
|
|
127
|
|
—
|
|
—
|
|
—
|
|
127
|
|
||||||||||||
|
Income (loss) before income tax expense (benefit) attributable to OneMain Holdings, Inc.
|
$
|
345
|
|
$
|
127
|
|
$
|
(284
|
)
|
$
|
—
|
|
$
|
(541
|
)
|
$
|
(353
|
)
|
||||||
|
Assets
|
$
|
16,023
|
|
$
|
1,789
|
|
$
|
1,073
|
|
$
|
—
|
|
$
|
2,305
|
|
$
|
21,190
|
|
||||||
|
*
|
Real Estate segment has been combined with “Other” for the prior period.
|
23
.
Fair Value Measurements
The fair value of a financial instrument is the amount that would be expected to be received if an asset were to be sold or the amount that would be paid to transfer a liability in an orderly transaction between market participants at the measurement date. The degree of judgment used in measuring the fair value of financial instruments generally correlates with the level of pricing observability. Financial instruments with quoted prices in active markets generally have more pricing observability and less judgment is used in measuring fair value. Conversely, financial instruments traded in other-than-active markets or that do not have quoted prices have less observability and are measured at fair value using valuation models or other pricing techniques that require more judgment. An other-than-active market is one in which there are few transactions, the prices are not current, price quotations vary substantially either over time or among market makers, or little information is released publicly for the asset or liability being valued. Pricing observability is affected by a number of factors, including the type of financial instrument, whether the financial instrument is listed on an exchange or traded over-the-counter or is new to the market and not yet established, the characteristics specific to the transaction, and general market conditions. See Note
3
for a discussion of the accounting policies related to fair value measurements, which includes the valuation process and the inputs used to develop our fair value measurements.
145
The following table presents the carrying amounts and estimated fair values of our financial instruments and indicates the level in the fair value hierarchy of the estimated fair value measurement based on the observability of the inputs used:
|
Fair Value Measurements Using
|
Total
Fair
Value
|
Total
Carrying
Value
|
||||||||||||||||||
|
(dollars in millions)
|
Level 1
|
Level 2
|
Level 3
|
|||||||||||||||||
|
December 31, 2017
|
||||||||||||||||||||
|
Assets
|
||||||||||||||||||||
|
Cash and cash equivalents
|
$
|
933
|
|
$
|
54
|
|
$
|
—
|
|
$
|
987
|
|
$
|
987
|
|
|||||
|
Investment securities
|
36
|
|
1,654
|
|
7
|
|
1,697
|
|
1,697
|
|
||||||||||
|
Net finance receivables, less allowance for finance receivable losses
|
—
|
|
—
|
|
15,656
|
|
15,656
|
|
14,260
|
|
||||||||||
|
Finance receivables held for sale
|
—
|
|
—
|
|
139
|
|
139
|
|
132
|
|
||||||||||
|
Restricted cash and restricted cash equivalents
|
498
|
|
—
|
|
—
|
|
498
|
|
498
|
|
||||||||||
|
Other assets *
|
—
|
|
—
|
|
12
|
|
12
|
|
12
|
|
||||||||||
|
Liabilities
|
||||||||||||||||||||
|
Long-term debt
|
$
|
—
|
|
$
|
15,625
|
|
$
|
—
|
|
$
|
15,625
|
|
$
|
15,050
|
|
|||||
|
December 31, 2016
|
||||||||||||||||||||
|
Assets
|
||||||||||||||||||||
|
Cash and cash equivalents
|
$
|
506
|
|
$
|
73
|
|
$
|
—
|
|
$
|
579
|
|
$
|
579
|
|
|||||
|
Investment securities
|
31
|
|
1,724
|
|
9
|
|
1,764
|
|
1,764
|
|
||||||||||
|
Net finance receivables, less allowance for finance receivable losses
|
—
|
|
—
|
|
13,891
|
|
13,891
|
|
13,043
|
|
||||||||||
|
Finance receivables held for sale
|
—
|
|
—
|
|
159
|
|
159
|
|
153
|
|
||||||||||
|
Restricted cash and restricted cash equivalents
|
568
|
|
—
|
|
—
|
|
568
|
|
568
|
|
||||||||||
|
Other assets *
|
—
|
|
1
|
|
34
|
|
35
|
|
37
|
|
||||||||||
|
Liabilities
|
||||||||||||||||||||
|
Long-term debt
|
$
|
—
|
|
$
|
14,498
|
|
$
|
—
|
|
$
|
14,498
|
|
$
|
13,959
|
|
|||||
|
*
|
Other assets includes commercial mortgage loans and escrow advance receivables at December 31, 2017 and commercial mortgage loans, escrow advance receivables, and receivables related to sales of real estate loans and related trust assets at December 31, 2016.
|
146
FAIR VALUE MEASUREMENTS — RECURRING BASIS
The following tables present information about our assets measured at fair value on a recurring basis and indicates the fair value hierarchy based on the levels of inputs we utilized to determine such fair value:
|
Fair Value Measurements Using
|
Total Carried At Fair Value
|
|||||||||||||||
|
(dollars in millions)
|
Level 1
|
Level 2
|
Level 3 (a)
|
|||||||||||||
|
December 31, 2017
|
||||||||||||||||
|
Assets
|
||||||||||||||||
|
Cash equivalents in mutual funds
|
$
|
709
|
|
$
|
—
|
|
$
|
—
|
|
$
|
709
|
|
||||
|
Cash equivalents in securities
|
—
|
|
54
|
|
—
|
|
54
|
|
||||||||
|
Investment securities:
|
||||||||||||||||
|
Available-for-sale securities
|
||||||||||||||||
|
Bonds:
|
||||||||||||||||
|
U.S. government and government sponsored entities
|
—
|
|
28
|
|
—
|
|
28
|
|
||||||||
|
Obligations of states, municipalities, and political subdivisions
|
—
|
|
135
|
|
—
|
|
135
|
|
||||||||
|
Certificates of deposit and commercial paper
|
—
|
|
60
|
|
—
|
|
60
|
|
||||||||
|
Non-U.S. government and government sponsored entities
|
—
|
|
125
|
|
—
|
|
125
|
|
||||||||
|
Corporate debt
|
—
|
|
946
|
|
2
|
|
948
|
|
||||||||
|
RMBS
|
—
|
|
99
|
|
—
|
|
99
|
|
||||||||
|
CMBS
|
—
|
|
87
|
|
—
|
|
87
|
|
||||||||
|
CDO/ABS
|
—
|
|
95
|
|
1
|
|
96
|
|
||||||||
|
Total bonds
|
—
|
|
1,575
|
|
3
|
|
1,578
|
|
||||||||
|
Preferred stock
|
7
|
|
7
|
|
—
|
|
14
|
|
||||||||
|
Common stock
|
23
|
|
—
|
|
—
|
|
23
|
|
||||||||
|
Other long-term investments
|
—
|
|
—
|
|
1
|
|
1
|
|
||||||||
|
Total available-for-sale securities (b)
|
30
|
|
1,582
|
|
4
|
|
1,616
|
|
||||||||
|
Other securities
|
||||||||||||||||
|
Bonds:
|
||||||||||||||||
|
Non-U.S. government and government sponsored entities
|
—
|
|
1
|
|
—
|
|
1
|
|
||||||||
|
Corporate debt
|
—
|
|
66
|
|
2
|
|
68
|
|
||||||||
|
RMBS
|
—
|
|
1
|
|
—
|
|
1
|
|
||||||||
|
CMBS
|
—
|
|
—
|
|
—
|
|
—
|
|
||||||||
|
CDO/ABS
|
—
|
|
4
|
|
—
|
|
4
|
|
||||||||
|
Total bonds
|
—
|
|
72
|
|
2
|
|
74
|
|
||||||||
|
Preferred stock
|
6
|
|
—
|
|
—
|
|
6
|
|
||||||||
|
Total other securities
|
6
|
|
72
|
|
2
|
|
80
|
|
||||||||
|
Total investment securities
|
36
|
|
1,654
|
|
6
|
|
1,696
|
|
||||||||
|
Restricted cash in mutual funds
|
484
|
|
—
|
|
—
|
|
484
|
|
||||||||
|
Total
|
$
|
1,229
|
|
$
|
1,708
|
|
$
|
6
|
|
$
|
2,943
|
|
||||
|
(a)
|
Due to the insignificant activity within the Level 3 assets during
2017
, we have omitted the additional disclosures relating to the changes in Level 3 assets measured at fair value on a recurring basis and the quantitative information about Level 3 unobservable inputs.
|
|
(b)
|
Excludes an immaterial interest in a limited partnership that we account for using the equity method and FHLB common stock of
$1 million
at
December 31, 2017
, which is carried at cost.
|
147
|
Fair Value Measurements Using
|
Total Carried At Fair Value
|
|||||||||||||||
|
(dollars in millions)
|
Level 1
|
Level 2
|
Level 3 (a)
|
|||||||||||||
|
December 31, 2016
|
||||||||||||||||
|
Assets
|
||||||||||||||||
|
Cash equivalents in mutual funds
|
$
|
307
|
|
$
|
—
|
|
$
|
—
|
|
$
|
307
|
|
||||
|
Cash equivalents in securities
|
—
|
|
73
|
|
—
|
|
73
|
|
||||||||
|
Investment securities:
|
||||||||||||||||
|
Available-for-sale securities
|
||||||||||||||||
|
Bonds:
|
||||||||||||||||
|
U.S. government and government sponsored entities
|
—
|
|
31
|
|
—
|
|
31
|
|
||||||||
|
Obligations of states, municipalities, and political subdivisions
|
—
|
|
145
|
|
—
|
|
145
|
|
||||||||
|
Non-U.S. government and government sponsored entities
|
—
|
|
118
|
|
—
|
|
118
|
|
||||||||
|
Corporate debt
|
—
|
|
1,025
|
|
—
|
|
1,025
|
|
||||||||
|
RMBS
|
—
|
|
100
|
|
—
|
|
100
|
|
||||||||
|
CMBS
|
—
|
|
108
|
|
—
|
|
108
|
|
||||||||
|
CDO/ABS
|
—
|
|
98
|
|
4
|
|
102
|
|
||||||||
|
Total bonds
|
—
|
|
1,625
|
|
4
|
|
1,629
|
|
||||||||
|
Preferred stock
|
8
|
|
8
|
|
—
|
|
16
|
|
||||||||
|
Common stock
|
17
|
|
—
|
|
—
|
|
17
|
|
||||||||
|
Other long-term investments
|
—
|
|
—
|
|
2
|
|
2
|
|
||||||||
|
Total available-for-sale securities (b)
|
25
|
|
1,633
|
|
6
|
|
1,664
|
|
||||||||
|
Other securities
|
||||||||||||||||
|
Bonds:
|
||||||||||||||||
|
Non-U.S. government and government sponsored entities
|
—
|
|
1
|
|
—
|
|
1
|
|
||||||||
|
Corporate debt
|
—
|
|
83
|
|
2
|
|
85
|
|
||||||||
|
RMBS
|
—
|
|
1
|
|
—
|
|
1
|
|
||||||||
|
CMBS
|
—
|
|
1
|
|
—
|
|
1
|
|
||||||||
|
CDO/ABS
|
—
|
|
5
|
|
—
|
|
5
|
|
||||||||
|
Total bonds
|
—
|
|
91
|
|
2
|
|
93
|
|
||||||||
|
Preferred stock
|
6
|
|
—
|
|
—
|
|
6
|
|
||||||||
|
Total other securities
|
6
|
|
91
|
|
2
|
|
99
|
|
||||||||
|
Total investment securities
|
31
|
|
1,724
|
|
8
|
|
1,763
|
|
||||||||
|
Restricted cash in mutual funds
|
553
|
|
—
|
|
—
|
|
553
|
|
||||||||
|
Total
|
$
|
891
|
|
$
|
1,797
|
|
$
|
8
|
|
$
|
2,696
|
|
||||
|
(a)
|
Due to the insignificant activity within the Level 3 assets during
2016
, we have omitted the additional disclosures relating to the changes in Level 3 assets measured at fair value on a recurring basis and the quantitative information about Level 3 unobservable inputs.
|
|
(b)
|
Excludes an immaterial interest in a limited partnership that we account for using the equity method and FHLB common stock of
$1 million
at
December 31, 2016
, which is carried at cost.
|
We had
no
transfers between Level 1 and Level 2 during
2017
and
2016
.
148
FAIR VALUE MEASUREMENTS — NON-RECURRING BASIS
We measure the fair value of certain assets on a non-recurring basis when events or changes in circumstances indicate that the carrying amount of the asset may not be recoverable.
Assets measured at fair value on a non-recurring basis on which we recorded impairment charges were as follows:
|
Fair Value Measurements Using *
|
Impairment Charges
|
|||||||||||||||||||
|
(dollars in millions)
|
Level 1
|
Level 2
|
Level 3
|
Total
|
||||||||||||||||
|
At or for the Year Ended December 31, 2017
|
||||||||||||||||||||
|
Assets
|
||||||||||||||||||||
|
Real estate owned
|
$
|
—
|
|
$
|
—
|
|
$
|
6
|
|
$
|
6
|
|
$
|
3
|
|
|||||
|
At or for the Year Ended December 31, 2016
|
||||||||||||||||||||
|
Assets
|
||||||||||||||||||||
|
Finance receivables held for sale
|
$
|
—
|
|
$
|
—
|
|
$
|
159
|
|
$
|
159
|
|
$
|
4
|
|
|||||
|
Real estate owned
|
—
|
|
—
|
|
5
|
|
5
|
|
2
|
|
||||||||||
|
Total
|
$
|
—
|
|
$
|
—
|
|
$
|
164
|
|
$
|
164
|
|
$
|
6
|
|
|||||
|
*
|
The fair value information presented in the table is as of the date the fair value adjustment was recorded.
|
We wrote down certain finance receivables held for sale reported in our Other segment to their fair value during the second quarter of 2016 and recorded the writedowns in other revenues.
We wrote down certain real estate owned reported in our Other segment to their fair value less cost to sell during 2017 and 2016 and recorded the writedowns in other revenues. The fair values of real estate owned disclosed in the table above are unadjusted for transaction costs as required by the authoritative guidance for fair value measurements. The amounts of real estate owned recorded in other assets are net of transaction costs as required by the authoritative guidance for accounting for the impairment of long-lived assets.
The inputs and quantitative data used in our Level 3 valuations for our real estate owned are unobservable primarily due to the unique nature of specific real estate assets. Therefore, we used independent third-party providers, familiar with local markets, to determine the values used for fair value disclosures without adjustment.
Quantitative information about Level 3 inputs for our assets measured at fair value on a non-recurring basis at
December 31, 2017
and
2016
was as follows:
|
Range (Weighted Average)
|
||||
|
Valuation Technique(s)
|
Unobservable Input
|
December 31, 2017
|
December 31, 2016
|
|
|
Finance receivables held for sale
|
Income approach
|
Market value for similar type loan transactions to obtain a price point
|
*
|
*
|
|
Real estate owned
|
Market approach
|
Third-party valuation
|
*
|
*
|
|
*
|
We applied the third-party exception which allows us to omit certain quantitative disclosures about unobservable inputs for the assets measured at fair value on a non-recurring basis included in the table above. As a result, the weighted average ranges of the inputs for these assets are not applicable.
|
FAIR VALUE MEASUREMENTS — VALUATION METHODOLOGIES AND ASSUMPTIONS
We use the following methods and assumptions to estimate fair value.
Cash and Cash Equivalents
The carrying amount of cash and cash equivalents, including cash and certain cash equivalents, approximates fair value.
149
Mutual Funds
The fair value of mutual funds is based on quoted market prices of the underlying shares held in the mutual funds.
Investment Securities
We utilize third-party valuation service providers to measure the fair value of our investment securities, which are classified as available-for-sale or as trading and other and consist primarily of bonds. Whenever available, we obtain quoted prices in active markets for identical assets at the balance sheet date to measure investment securities at fair value. We generally obtain market price data from exchange or dealer markets.
We estimate the fair value of fixed maturity investment securities not traded in active markets by referring to traded securities with similar attributes, using dealer quotations and a matrix pricing methodology, or discounted cash flow analyses. This methodology considers such factors as the issuer’s industry, the security’s rating and tenor, its coupon rate, its position in the capital structure of the issuer, yield curves, credit curves, composite ratings, bid-ask spreads, prepayment rates and other relevant factors. For fixed maturity investment securities that are not traded in active markets or that are subject to transfer restrictions, we adjust the valuations to reflect illiquidity and/or non-transferability. Such adjustments are generally based on available market evidence. In the absence of such evidence, management’s best estimate is used.
We elect the fair value option for investment securities that are deemed to incorporate an embedded derivative and for which it is impracticable for us to isolate and/or value the derivative.
The fair value of certain investment securities is based on the amortized cost, which is assumed to approximate fair value.
Finance Receivables
The fair value of net finance receivables, less allowance for finance receivable losses, for both non-impaired and purchased credit impaired finance receivables, is determined using discounted cash flow methodologies. The application of these methodologies requires us to make certain judgments and estimates based on our perception of market participant views related to the economic and competitive environment, the characteristics of our finance receivables, and other similar factors. The most significant judgments and estimates made relate to prepayment speeds, default rates, loss severity, and discount rates. The degree of judgment and estimation applied is significant in light of the current capital markets and, more broadly, economic environments. Therefore, the fair value of our finance receivables could not be determined with precision and may not be realized in an actual sale. Additionally, there may be inherent limitations in the valuation methodologies we employed, and changes in the underlying assumptions used could significantly affect the results of current or future values.
Finance Receivables Held for Sale
We determined the fair value of finance receivables held for sale that were originated as held for investment based on negotiations with prospective purchasers (if any) or by using projected cash flows discounted at the weighted-average interest rates offered by us in the market for similar finance receivables. We based cash flows on contractual payment terms adjusted for estimates of prepayments and credit related losses.
Restricted Cash and Restricted Cash Equivalents
The carrying amount of restricted cash and restricted cash equivalents approximates fair value.
Commercial Mortgage Loans
Given the short remaining average life of the portfolio, the carrying amount of commercial mortgage loans approximates fair value. The carrying amount includes an estimate for credit related losses, which is based on independent third-party valuations.
Real Estate Owned
We initially base our estimate of the fair value on independent third-party valuations at the time we take title to real estate owned. Subsequent changes in fair value are based upon independent third-party valuations obtained periodically to estimate a price that would be received in a then current transaction to sell the asset.
150
Escrow Advance Receivable
The carrying amount of escrow advance receivable approximates fair value.
Receivables Related to Sales of Real Estate Loans and Related Trust Assets
The carrying amount of receivables related to sales of real estate loans and related trust assets less estimated forfeitures, which are reflected in other liabilities, approximates fair value.
Long-term Debt
We either receive fair value measurements of our long-term debt from market participants and pricing services or we estimate the fair values of long-term debt using projected cash flows discounted at each balance sheet date’s market-observable implicit-credit spread rates for our long-term debt.
We record at fair value long-term debt issuances that are deemed to incorporate an embedded derivative and for which it is impracticable for us to isolate and/or value the derivative. At
December 31, 2017
, we had
no
debt carried at fair value under the fair value option.
We estimate the fair values associated with variable rate revolving lines of credit to be equal to par.
24
.
Subsequent Events
Redemption of OMFH 2019 Notes
On December 8, 2017, the Company issued a notice of redemption to redeem all
$700 million
outstanding principal amount of OMFH’s
6.75%
Senior Notes due 2019 at a redemption price equal to
103.375%
, plus accrued and unpaid interest to the redemption date. The notes were redeemed on January 8, 2018. In connection with the redemption, we will recognize
$1.2 million
of net loss on repurchases and repayments of debt for the three months ended March 31, 2018.
Apollo-Värde Transaction
On January 3, 2018, the Apollo-Värde Group entered into a Share Purchase Agreement with the Initial Stockholder and the Company to acquire from the Initial Stockholder
54,937,500
shares of OMH common stock (representing approximately
40.6%
of the outstanding shares of our common stock as of such date), representing the entire holdings of our stock beneficially owned by Fortress. This transaction is expected to close in the second quarter of 2018 and is subject to regulatory approvals and other customary closing conditions.
151
25
.
Selected Quarterly Financial Data (Unaudited)
Our selected quarterly financial data for
2017
was as follows:
|
(dollars in millions, except per share amounts)
|
Fourth
Quarter
|
Third
Quarter
|
Second
Quarter
|
First
Quarter
|
||||||||||||
|
Interest income
|
$
|
857
|
|
$
|
808
|
|
$
|
772
|
|
$
|
759
|
|
||||
|
Interest expense
|
204
|
|
207
|
|
203
|
|
202
|
|
||||||||
|
Provision for finance receivable losses
|
231
|
|
243
|
|
236
|
|
245
|
|
||||||||
|
Other revenues
|
146
|
|
152
|
|
121
|
|
141
|
|
||||||||
|
Other expenses
|
381
|
|
389
|
|
388
|
|
396
|
|
||||||||
|
Income before income taxes
|
187
|
|
121
|
|
66
|
|
57
|
|
||||||||
|
Income taxes
|
148
|
|
52
|
|
24
|
|
24
|
|
||||||||
|
Net income
|
$
|
39
|
|
$
|
69
|
|
$
|
42
|
|
$
|
33
|
|
||||
|
Earnings per share:
|
||||||||||||||||
|
Basic
|
$
|
0.29
|
|
$
|
0.52
|
|
$
|
0.31
|
|
$
|
0.25
|
|
||||
|
Diluted
|
0.29
|
|
0.51
|
|
0.30
|
|
0.25
|
|
||||||||
Our selected quarterly financial data for
2016
was as follows:
|
(dollars in millions, except per share amounts)
|
Fourth
Quarter
|
Third
Quarter
|
Second
Quarter
|
First
Quarter
|
||||||||||||
|
Interest income
|
$
|
768
|
|
$
|
770
|
|
$
|
741
|
|
$
|
831
|
|
||||
|
Interest expense
|
201
|
|
215
|
|
214
|
|
226
|
|
||||||||
|
Provision for finance receivable losses
|
258
|
|
263
|
|
214
|
|
197
|
|
||||||||
|
Other revenues
|
147
|
|
158
|
|
165
|
|
303
|
|
||||||||
|
Other expenses
|
427
|
|
417
|
|
436
|
|
459
|
|
||||||||
|
Income before income taxes
|
29
|
|
33
|
|
42
|
|
252
|
|
||||||||
|
Income taxes
|
2
|
|
8
|
|
16
|
|
87
|
|
||||||||
|
Net income
|
27
|
|
25
|
|
26
|
|
165
|
|
||||||||
|
Net income attributable to non-controlling interests
|
—
|
|
—
|
|
—
|
|
28
|
|
||||||||
|
Net income attributable to OneMain Holdings, Inc.
|
$
|
27
|
|
$
|
25
|
|
$
|
26
|
|
$
|
137
|
|
||||
|
Earnings per share:
|
||||||||||||||||
|
Basic
|
$
|
0.20
|
|
$
|
0.19
|
|
$
|
0.19
|
|
$
|
1.02
|
|
||||
|
Diluted
|
0.20
|
|
0.19
|
|
0.19
|
|
1.01
|
|
||||||||
152
None.
Evaluation of Disclosure Controls and Procedures
Disclosure controls and procedures are designed to provide reasonable assurance that information we are required to disclose in reports that we file or submit under the Exchange Act is recorded, processed, summarized and reported within the time periods specified in the SEC’s rules and forms, and that such information is accumulated and communicated to our management, including our Chief Executive Officer and Chief Financial Officer, as appropriate, to allow timely decisions regarding required disclosure.
As of December 31, 2017, we carried out an evaluation of the effectiveness of our disclosure controls and procedures, as such term is defined in Rules 13a-15(e) and 15d-15(e) under the Exchange Act. This evaluation was conducted under the supervision of, and with the participation of our management, including our Chief Executive Officer and our Chief Financial Officer. Based on our evaluation, our Chief Executive Officer and our Chief Financial Officer concluded that our disclosure controls and procedures were effective as of December 31, 2017, to provide the reasonable assurance described above.
Management’s Report on Internal Control over Financial Reporting
Our management is responsible for establishing and maintaining adequate internal control over financial reporting, as such term is defined in Rules 13a-15(f) and 15d-15(f) under the Exchange Act, and has conducted an evaluation of the effectiveness of our internal control over financial reporting as of December 31, 2017, based on the framework set forth by the Committee of Sponsoring Organizations of the Treadway Commission in “Internal Control - Integrated Framework” (2013). Internal control over financial reporting is a process designed to provide reasonable assurance regarding the reliability of financial reporting and the preparation of financial statements for external purposes in accordance with GAAP. Based on this evaluation, our management concluded that our internal control over financial reporting was effective as of December 31, 2017.
PricewaterhouseCoopers LLP, the independent registered public accounting firm that audited the 2017 financial statements included in this Annual Report on Form 10-K, has also audited the effectiveness of our internal control over financial reporting as of December 31, 2017. This report can be found included in this report.
Changes in Internal Control over Financial Reporting
There were no changes in our internal control over financial reporting during the fourth quarter of 2017, that have materially affected, or are reasonably likely to materially affect, our internal control over financial reporting.
None.
153
The information required by Item 10 with respect to executive officers is incorporated by reference to the information presented in the section captioned “Executive Officers” in the Company’s definitive proxy statement for the 2018 Annual Meeting of Shareholders, which will be filed with the SEC pursuant to Regulation 14A within 120 days of the Company’s fiscal year-end (the “Proxy Statement”).
Information required by Item 10 for matters other than executive officers is incorporated by reference to the information presented in the sections captioned “Board of Directors,” “Proposal 1: Election of Directors,” “Corporate Governance” and “Security Ownership of Certain Beneficial Owners and Management - Section 16(a) Beneficial Ownership Reporting Compliance” in the Proxy Statement.
The information required by Item 11 is incorporated by reference to the information presented in the sections captioned “Board of Directors - Committees of the Board of Directors” and “Executive Compensation” in the Proxy Statement.
The information required by Item 12 is incorporated by reference to the information presented in the sections captioned “Security Ownership of Certain Beneficial Owners and Management” and “Executive Compensation - Equity Compensation Plan Information” in the Proxy Statement.
The information required by Item 13 is incorporated by reference to the information presented in the sections captioned “Certain Relationships and Related Party Transactions” and “Board of Directors” in the Proxy Statement.
The information required by Item 14 is incorporated by reference to the information presented in the section captioned “Audit Function” in the Proxy Statement.
154
|
(a)
|
(1) The following consolidated financial statements of OneMain Holdings, Inc. and its subsidiaries are included in Part II - Item 8:
|
|
Consolidated Balance Sheets, December 31, 2017 and 2016
|
|
|
|
Consolidated Statements of Operations, years ended December 31, 2017, 2016, and 2015
|
|
|
|
Consolidated Statements of Comprehensive Income (Loss), years ended December 31, 2017, 2016, and 2015
|
|
|
|
Consolidated Statements of Shareholders’ Equity, years ended December 31, 2017, 2016, and 2015
|
|
|
|
Consolidated Statements of Cash Flows, years ended December 31, 2017, 2016, and 2015
|
|
|
|
Notes to Consolidated Financial Statements
|
(2) Financial Statement Schedules:
Schedule I - Condensed Financial Information of Registrant is included in Part IV - Item 15(c).
All other schedules have been omitted because they are either not required or inapplicable.
(3) Exhibits:
Exhibits are listed in the Exhibit Index below.
|
(b)
|
Exhibits
|
The exhibits required to be included in this portion of Part IV - Item 15(b) are listed in the Exhibit Index to this report.
|
(c)
|
Schedule I - Condensed Financial Information of Registrant
|
155
Schedule I — Condensed Financial Information of Registrant
ONEMAIN HOLDINGS, INC.
Condensed Balance Sheets
|
(dollars in millions)
|
||||||||
|
December 31,
|
2017
|
2016
|
||||||
|
Assets
|
||||||||
|
Cash and cash equivalents
|
$
|
1
|
|
$
|
1
|
|
||
|
Investment in subsidiaries
|
3,147
|
|
2,941
|
|
||||
|
Note receivable from affiliate
|
150
|
|
142
|
|
||||
|
Total assets
|
$
|
3,298
|
|
$
|
3,084
|
|
||
|
Liabilities and Shareholders’ Equity
|
||||||||
|
Long-term debt
|
$
|
1
|
|
$
|
—
|
|
||
|
Payable to affiliates
|
16
|
|
15
|
|
||||
|
Deferred and accrued taxes
|
3
|
|
3
|
|
||||
|
Total liabilities
|
20
|
|
18
|
|
||||
|
Shareholders’ equity
|
3,278
|
|
3,066
|
|
||||
|
Total liabilities and shareholders’ equity
|
$
|
3,298
|
|
$
|
3,084
|
|
||
See Notes to Condensed Financial Statements.
156
ONEMAIN HOLDINGS, INC.
Condensed Statements of Operations and Comprehensive Income (Loss)
|
(dollars in millions)
|
||||||||||||
|
Years Ended December 31,
|
2017
|
2016
|
2015
|
|||||||||
|
Interest income from affiliate
|
$
|
9
|
|
$
|
8
|
|
$
|
13
|
|
|||
|
Investment income
|
—
|
|
—
|
|
1
|
|
||||||
|
Operating expenses
|
3
|
|
—
|
|
—
|
|
||||||
|
Income before provision for income taxes
|
6
|
|
8
|
|
14
|
|
||||||
|
Provision for income taxes
|
1
|
|
3
|
|
5
|
|
||||||
|
Equity in undistributed net income (loss) from subsidiaries
|
178
|
|
210
|
|
(229
|
)
|
||||||
|
Net income (loss)
|
183
|
|
215
|
|
(220
|
)
|
||||||
|
Other comprehensive income (loss), net of tax
|
17
|
|
27
|
|
(36
|
)
|
||||||
|
Comprehensive income (loss)
|
$
|
200
|
|
$
|
242
|
|
$
|
(256
|
)
|
|||
See Notes to Condensed Financial Statements.
157
ONEMAIN HOLDINGS, INC.
Condensed Statements of Cash Flows
|
(dollars in millions)
|
||||||||||||
|
Years Ended December 31,
|
2017
|
2016
|
2015
|
|||||||||
|
Net cash provided by operating activities
|
$
|
—
|
|
$
|
—
|
|
$
|
23
|
|
|||
|
Cash flows from investing activities
|
||||||||||||
|
Capital contributions to subsidiaries
|
—
|
|
—
|
|
(1,100
|
)
|
||||||
|
Principal collections on note receivable from affiliate
|
—
|
|
—
|
|
96
|
|
||||||
|
Net cash used for investing activities
|
—
|
|
—
|
|
(1,004
|
)
|
||||||
|
Cash flows from financing activities
|
||||||||||||
|
Proceeds from issuance of common stock, net of offering costs paid
|
—
|
|
—
|
|
976
|
|
||||||
|
Net cash provided by financing activities
|
—
|
|
—
|
|
976
|
|
||||||
|
Net change in cash and cash equivalents
|
—
|
|
—
|
|
(5
|
)
|
||||||
|
Cash and cash equivalents at beginning of period
|
1
|
|
1
|
|
6
|
|
||||||
|
Cash and cash equivalents at end of period
|
$
|
1
|
|
$
|
1
|
|
$
|
1
|
|
|||
|
Supplemental non-cash financing activities
|
||||||||||||
|
Increase in payable to affiliate for stock offering costs
|
$
|
—
|
|
$
|
—
|
|
$
|
2
|
|
|||
See Notes to Condensed Financial Statements.
158
ONEMAIN HOLDINGS, INC.
Notes to Condensed Financial Statements
1. Organization and Purpose
OneMain Holdings, Inc. (formerly Springleaf Holdings, Inc.) is referred to in this schedule as “OMH.” OMH is a Delaware corporation.
Springleaf Holdings, LLC, a subsidiary of AGF Holding Inc., was incorporated on August 5, 2013. In connection with its formation, Springleaf Holdings, LLC issued
100
common interests to AGF Holding Inc., its sole member. Springleaf Holdings, LLC was formed solely to acquire, through a series of restructuring transactions, all of the common stock of Springleaf Finance, Inc. (“SFI”), an Indiana corporation. Springleaf Holdings, LLC did not engage in any significant activities from the date of its formation on August 5, 2013 to October 9, 2013 other than those incidental to its formation, including the issuance of common interests in the amount of
$1,000
on August 9, 2013.
On November 15, 2015, OMH completed its acquisition of OneMain Financial Holdings, LLC (“OMFH”) from CitiFinancial Credit Company for
$4.5 billion
in cash (the “OneMain Acquisition”). In connection with the OneMain Acquisition, Springleaf Holdings, Inc. changed its name to OneMain Holdings, Inc. (previously defined above as “OMH”). As a result of the OneMain Acquisition, OMFH became a wholly owned, indirect subsidiary of OMH.
2. Accounting Policies
OMH records its investments in subsidiaries at cost plus the equity in undistributed net income (loss) from subsidiaries since the date of incorporation or, if purchased, the date of the acquisition. The condensed financial statements of the registrant should be read in conjunction with OMH’s consolidated financial statements.
3. Note Receivable from Affiliate
Note receivable from affiliate reflects a master note with SFI. The interest rate on the unpaid principal balance is the lender’s cost of funds rate, which was
5.87%
at
December 31, 2017
. Interest income on the master note totaled
$9 million
,
$8 million
and
$13 million
in
2017
,
2016
, and
2015
, respectively.
4. Payable to Affiliates
Payable to affiliates primarily reflects offering costs incurred in conjunction with the public offerings in 2013 and 2015 and tax liabilities that were paid by affiliates on behalf of OMH. No interest was charged for these transactions.
5. Subsidiary Debt Guarantee
5.625% SFC Notes
On December 8, 2017, OMH entered into the SFC Fourth Supplemental Indenture, pursuant to which it agreed to fully and unconditionally guarantee, on a senior unsecured basis, the payments of principal, premium (if any) and interest on the
5.625%
SFC Notes. As of
December 31, 2017
,
$875 million
aggregate principal amount of the
5.625%
SFC Notes were outstanding.
6.125% SFC Notes
On May 15, 2017, OMH entered into the SFC Third Supplemental Indenture, pursuant to which it agreed to fully and unconditionally guarantee, on a senior unsecured basis, the payments of principal, premium (if any) and interest on the
6.125%
SFC Notes. As of
December 31, 2017
,
$1.0 billion
aggregate principal amount of the
6.125%
SFC Notes were outstanding.
8.25% SFC Notes
On April 11, 2016, OMH entered into the SFC Second Supplemental Indenture, pursuant to which it agreed to fully and unconditionally guarantee, on a senior unsecured basis, the payments of principal, premium (if any) and interest on the
8.25%
SFC Notes. As of
December 31, 2017
,
$1.0 billion
aggregate principal amount of the
8.25%
SFC Notes were outstanding.
159
5.25% SFC Notes
On December 3, 2014, OMH entered into the SFC Base Indenture and the SFC First Supplemental Indenture, pursuant to which it agreed to fully and unconditionally guarantee, on a senior unsecured basis, the payments of principal, premium (if any) and interest on the
5.25%
SFC Notes. As of
December 31, 2017
,
$700 million
aggregate principal amount of the
5.25%
SFC Notes were outstanding.
Other SFC Notes
On December 30, 2013, OMH entered into SFC Guaranty Agreements whereby it agreed to fully and unconditionally guarantee the payments of principal, premium (if any) and interest on the Other SFC Notes. The Other SFC Notes consist of the following:
|
•
|
8.25%
Senior Notes due 2023;
|
|
•
|
7.75%
Senior Notes due 2021;
|
|
•
|
6.00%
Senior Notes due 2020; and
|
|
•
|
the Junior Subordinated Debenture
|
The Junior Subordinated Debenture underlies the trust preferred securities sold by a trust sponsored by SFC. On December 30, 2013, OMH entered into the SFC Trust Guaranty Agreement whereby it agreed to fully and unconditionally guarantee the related payment obligations under the trust preferred securities. As of
December 31, 2017
, approximately
$1.6 billion
aggregate principal amount of the Other SFC Notes were outstanding.
The OMH guarantees of SFC’s long-term debt discussed above are subject to customary release provisions.
OMFH Notes
On December 11, 2014, OMFH and certain of its subsidiaries entered into the OMFH Indenture, among OMFH, the guarantors listed therein and The Bank of New York Mellon, as trustee, in connection with OMFH’s issuance of the OMFH Notes. The OMFH Notes are OMFH’s unsecured senior obligations, guaranteed on a senior unsecured basis by each of its wholly owned domestic subsidiaries, other than certain subsidiaries, including its insurance subsidiaries and securitization subsidiaries. As of
December 31, 2017
,
$1.5 billion
aggregate principal amount of the OMFH Notes were outstanding.
On November 8, 2016, OMH entered into a second supplemental indenture to the OMFH Indenture (the “OMFH Second Supplemental Indenture”), pursuant to which OMH agreed to fully, unconditionally and irrevocably guarantee the outstanding OMFH Notes in accordance with and subject to the terms of the OMFH Indenture. Further, as permitted by the terms of the OMFH Indenture, OMFH intends to satisfy its reporting obligations under the OMFH Indenture with respect to providing OMFH financial information to the holders of the OMFH Notes by furnishing financial information relating to the Company.
On December 8, 2017 OMFH provided notice to note holders to redeem all
$700 million
outstanding principal amount of the 2019 OMFH Notes on January 8, 2018, at a redemption price equal to
103.375%
, plus accrued and unpaid interest to the redemption date. See Note 24 for more detail on this redemption.
The OMH guarantees of OMFH’s long-term debt discussed above are subject to customary release provisions.
None.
160
Exhibit Index
|
Exhibit
|
||
|
|
|
|
|
|
|
|
|
Certain instruments defining the rights of holders of long-term debt securities of the Company are omitted pursuant to Item 601(b)(4)(iii) of Regulation S-K. The Company hereby undertakes to furnish to the SEC, upon request, copies of any such instruments.
|
||
|
|
|
|
161
|
Exhibit
|
||
162
|
Exhibit
|
||
163
|
Exhibit
|
||
|
101
|
Interactive data files pursuant to Rule 405 of Regulation S-T: (i) Consolidated Balance Sheets, (ii) Consolidated Statements of Operations, (iii) Consolidated Statements of Comprehensive Income (Loss), (iv) Consolidated Statements of Shareholders’ Equity, (v) Consolidated Statements of Cash Flows, and (vi) Notes to Consolidated Financial Statements.
|
|
|
*
|
Schedules and exhibits have been omitted pursuant to Item 601(b)(2) of Regulation S-K. The Company agrees to furnish supplementally a copy of any omitted exhibit or schedule to the SEC upon request.
|
|
**
|
Management contract or compensatory plan or arrangement.
|
164
Signatures
Pursuant to the requirements of Section 13 or 15(d) of the Securities Exchange Act of 1934, the registrant has duly caused this report to be signed on its behalf by the undersigned, thereunto duly authorized, on
February 21, 2018
.
|
ONEMAIN HOLDINGS, INC.
|
|||
|
By:
|
/s/
|
Scott T. Parker
|
|
|
Scott T. Parker
|
|||
|
(Executive Vice President and Chief Financial Officer)
|
|||
Pursuant to the requirements of the Securities Exchange Act of 1934, this report has been signed below by the following persons on behalf of the registrant and in the capacities indicated on
February 21, 2018
.
|
/s/
|
Jay N. Levine
|
/s/
|
Douglas L. Jacobs
|
|
|
Jay N. Levine
|
Douglas L. Jacobs
|
|||
|
(President, Chief Executive Officer, and Director —
Principal Executive Officer)
|
(Director)
|
|||
|
/s/
|
Scott T. Parker
|
/s/
|
Anahaita N. Kotval
|
|
|
Scott T. Parker
|
Anahaita N. Kotval
|
|||
|
(Executive Vice President and Chief Financial Officer — Principal Financial Officer)
|
(Director)
|
|||
|
/s/
|
Michael A. Hedlund
|
/s/
|
Ronald M. Lott
|
|
|
Michael A. Hedlund
|
Ronald M. Lott
|
|||
|
(Senior Vice President and Group Controller
— Principal Accounting Officer)
|
(Director)
|
|||
|
/s/
|
Wesley R. Edens
|
|||
|
Wesley R. Edens
|
||||
|
(Chairman of the Board and Director)
|
||||
|
/s/
|
Roy A. Guthrie
|
|||
|
Roy A. Guthrie
|
||||
|
(Director)
|
||||
165
TABLE OF CONTENTS
Part IItem 1. BusinessItem 1A. Risk FactorsItem 1B. Unresolved Staff CommentsItem 2. PropertiesItem 3. Legal ProceedingsItem 4. Mine Safety DisclosuresPart IIItem 5. Market For Registrant S Common Equity, Related Stockholder Matters and Issuer Purchases Of Equity SecuritiesItem 6. Selected Financial DataItem 7. Management S Discussion and Analysis Of Financial Condition and Results Of OperationsItem 7A. Quantitative and Qualitative Disclosures About Market RiskItem 8. Financial Statements and Supplementary DataItem 9. Changes in and Disagreements with Accountants on Accounting and Financial DisclosureItem 9A. Controls and ProceduresItem 9B. Other InformationPart IIIItem 10. Directors, Executive Officers and Corporate GovernanceItem 11. Executive CompensationItem 12. Security Ownership Of Certain Beneficial Owners and Management and Related Stockholder MattersItem 13. Certain Relationships and Related Transactions, and Director IndependenceItem 14. Principal Accounting Fees and ServicesPart IVItem 15. Exhibits and Financial Statement SchedulesItem 16. Form 10-k Summary